Annual Report 2015/16 - Lower Murray Water
108
Annual Report 2015/16
Transcript of Annual Report 2015/16 - Lower Murray Water
Annual Report 2015/16
Lower Murray Water Annual Report 2015/16 1
About Us.......................................................................................................................................... 2 Establishment, Statement of Obligations, Mission, Vision, Values, Region, Nature of Services Provided,
By-Laws, Water Plan, Functions and Duties, Strategic Drivers and Goals
Chair and Managing Director’s Report ............................................................................ 6
Key Achievement and Highlights of 2015/16 and Future Initiatives .............. 8 The Lower Murray Water Team, Serving our Customers, Committing to the Environment and Region,
Governance and Obligations
The Lower Murray Water Team ............................................................................................ 9 Organisational Structure, Board Structure, Board Membership, Directors’ Attendance at Board Meetings,
Our Staff, Workforce Philosophy, Workplace Merit and Equity, Staff Development and Training,
Occupational Health and Safety (OH&S)
Serving Our Customers .......................................................................................................... 15 Our Bulk Water Entitlements (Urban and Irrigation), Engaging with our Customers. Communicating with our
Customers, Our Urban Customers, Urban and Wastewater Statistics 2015/16, Per Capita Daily
Residential Drinking Water Consumption, Our Rural Customers, Major Water Users, Customer Satisfaction
Survey, Resolving Customer Complaints, Energy and Water Ombudsman Case Handling Statistics
Committing to the Environment and Region ................................................................. 20 Collaborating with Stakeholders/the Community, Environmental Sustainability, Sustainable Water Use,
Sustainable/Resilient Water Services Systems, Other Statutory Obligations, Greenhouse Gas Emissions and
Net Energy Consumption, Social Sustainability
Governance and Obligations ................................................................................................. 26 Governance Committee, Compliance with the Building Act 1993, Declaring of Pecuniary Interests,
Freedom of Information (FOI) Act 1982, Information and Communication Technology Expenditure, Major External
Reviews, National Competition Policy, Other Reportable Information, Privacy and Data Protection Act 2014,
Protected Disclosures Act 2012, Risk Management Framework and Processes, Audit and Risk Committee,
Statement of Availability of Other Information, Subsequent Events, Victorian Industry Participation Policy
Performance Report .................................................................................................................. 29 Financial Performance Indicators, Water and Sewerage Service Performance Indicators, Water (Rural) Service
Performance Indicators, Environmental Performance Indicators, Customer Responsiveness Performance
Indicators, Certification of Performance Report, VAGO certification
2015/16 Financial Summary ................................................................................................. 37 Financial Review, Summary of Financial Results, Summary of Financial Performance, Loan Liability
as at 30th June 2016, Major Contracts, Consultancies
2015/16 Financial Report ...................................................................................................... 40
Appendices ..................................................................................................................................... 102 Disclosure Index
Contents

Lower Murray Water Annual Report 2015/16 2
Establishment Lower Murray Water Urban and Rural Water Authority
was created under the provisions of the Water Act 1989
via order in Council effective 1st July 2004. It assumed
the whole of the property, rights, liabilities, obligations,
powers and functions under the Water Act 1989 of the
Lower Murray Region Water Authority and Sunraysia
Rural Water Authority. The Water Governance Act varied
the form and title of Lower Murray Water and
established new governance arrangements effective
from 1st July 2007. By statute under the Water Act
1989 Lower Murray Urban and Rural Water Authority
became Lower Murray Urban and Rural Water
Corporation. On 19th August 2008 Minister for Water The Hon. Tim
Holding issued a determination for Lower Murray Water
to take over the whole of the functions, powers and
duties of the First Mildura Irrigation Trust (FMIT).
During the reporting period our relevant Minister was
the Hon Lisa Neville MP, Minister for Environment,
Climate Change and Water for the period 1st July 2015
to 22nd May 2016; and the Hon Lisa Neville MP, Minister
for Water for the period 23rd May to 30th June 2016.
Statement of Obligations Effective 16th September 2012, the Statement of
Obligations issued under the Water Industry Act 1994
details our obligations regarding performance and
functions; including Environmental Management.
Mission Our mission is to:
• To provide water services in a sustainable, reliable
and timely manner
• To maintain positive and transparent relationships
with our customers and other stakeholders
• To contribute to the economic, social and cultural
development of our region.
Vision Our vision is to support our region with water for life,
irrigation, growth and the environment.
Values We value honesty, integrity, teamwork and commitment.
We are passionate about our business and the services
we provide for our customers. We are committed to
making decisions based on sound judgments and
intelligent use of knowledge. We value:
• Our urban customers, who receive reliable and
affordable potable water and treated wastewater
services
• Our rural customers, who need to receive reliable
commercial services at the minimum sustainable cost
• Investment and development of our people to enable
us to be a thinking, efficient organisation
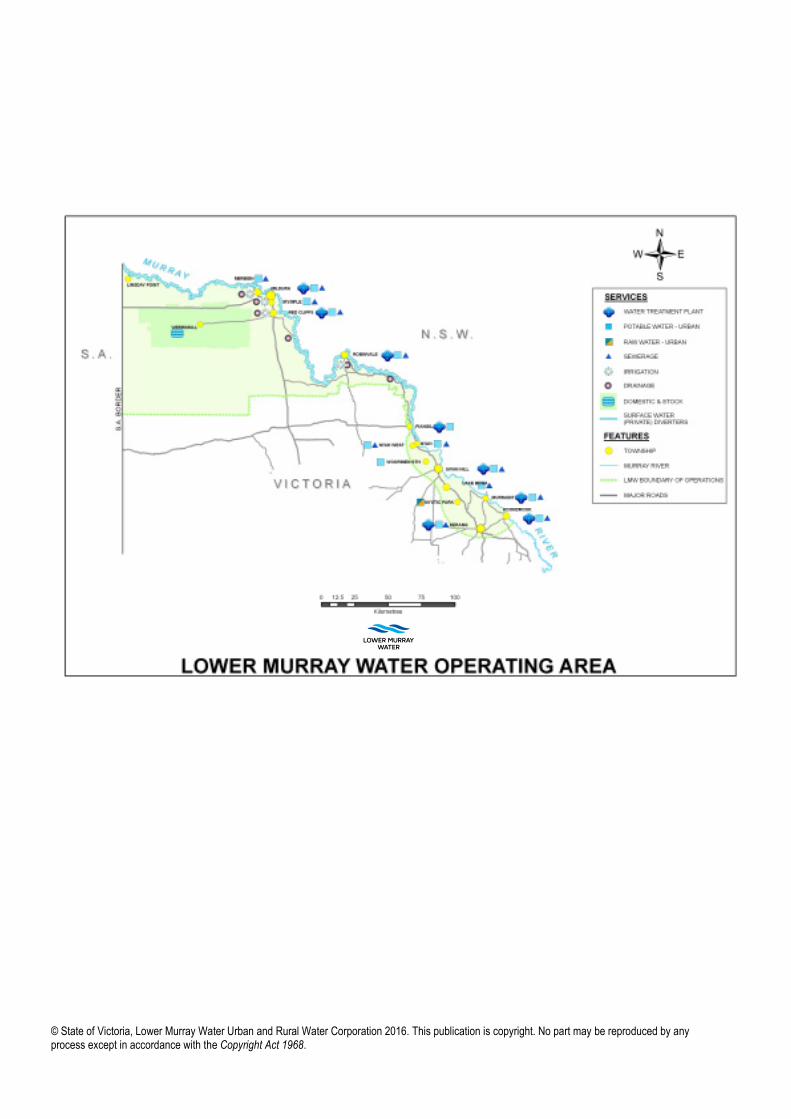
Region Our area of operation extends from Kerang to the South
Australian border taking in the municipalities of Mildura,
Swan Hill and Gannawarra. We provide the region with
urban water and wastewater services, treatment and
effluent disposal services, river quality water to stock
and irrigation customers, along with the collection and
disposal of subsurface irrigation drainage water.
We recognise that our overall well-being and livelihood is
directly linked to the agricultural, tourism and support
industries which form our economic backbone.
How we manage our water resources recognises the
intrinsic inter-relationship between this resource and the
social and economic fabric of our region.
Nature of services provided
We provide:
• urban water services to 14 townships via nine
treatment plants to approximately 74,000 customers
along the Murray River in Victoria from Kerang to
Mildura;
• wastewater collection, treatment and effluent re-use
and disposal services to 11 towns via 10 treatment
plants;
• river quality water services to 4,964 customers in the
four pumped irrigation districts of Merbein, Red Cliffs,
Robinvale and Mildura, the Millewa rural district and
some areas of the waterworks district of Yelta;
• the collection and disposal of subsurface drainage
water from the four pumped irrigation districts, and
Nangiloc, Robinvale and Boundary Bend private
diverters;
• ensuring irrigation and drainage designs in new
agricultural developments conforms with salinity
management plan development guidelines;
• management of the private diversion licences of 1,161
water users along the Murray River in Victoria
between Nyah and the South Australian border;
• the assessment and approval of water share and
allocation trade applications; and
• reclaimed water for third party use.
In addition to security of supply, public health, water
quality and environmental responsibilities, we recognise
the crucial economic role of water from a regional and
state context.
About Us
Lower Murray Water Annual Report 2015/16 3
Strategic Drivers and Goals
The basis for our strategic drivers and goals is
creating value—for our customers and for the
organisation. These goals are aimed at meeting the
challenges of our customers and the business and
delivery sustainable business success.
Corporate strategies to create customer value
Our Corporate Goals to address customer challenges and
deliver our strategy and creating customer value are:
• Increasing the resilience of services to changing and
extreme weather
• Be more customer focused—right service, right time
• Maintain compliant performance while improving cost
-effectiveness of operations and assets
• Increase use of the modernised irrigation
infrastructure in the four districts.
Governance strategies to create organisational
value
Good governance underpins good performance. Our
governance goals to create organisational value are:
• Manage the Corporation in accordance with expected
standards of corporate behavior
• Manage our assets and finances responsibly and
sustainably
• Provide an engaged and skilled workforce to deliver
our vision and mission
• Provide our services equitably and with
consideration.
By-Laws The Corporation currently has one By-Law: By-Law No 2
Urban Water Restrictions. This By-Law was created using
a Model Water Restriction By-Law issued by the Minister
for Water on 27th November 2011. It contains the
restrictions and prohibitions on the use of water that
may be imposed in our Urban water supply districts.
The Corporation has also a Permanent Water Saving Plan
which sets out permanent water restrictions and
prohibitions within our service district. During the
2014/15 year two By-Laws were replaced with
regulations. By-Law No 1 Water Supply and Sewerage
Administrative By-Law was replaced by Water
(Estimation, Supply and Sewerage) Regulations 2014; and
By-Law No 4 Trade Waste By-Law was replaced by Water
(Trade Waste) Regulations 2014.
Drought Response We were not required to invoke our drought response
plan during 2015/16.
Water Plan The Essential Services Commission (ESC) is the economic
regulator of the Victorian water sector. The sector is
comprised of 19 water businesses providing bulk and
retail water and waste water services to all of Victoria’s
urban and rural irrigation customers. The ESC’s role
encompasses regulation of prices as well as
monitoring of service standards and market conduct,
acting as the Australian Competition & Consumer
Commission’s (ACCC) accredited agent for rural pricing.
Our Water Plan was endorsed by the ESC in June 2013
setting prices for the period 1st July 2013 to 30th June
2018 in the urban business of the Corporation. In the
rural business, revenue caps were set for the same time
frame.
About Us


Lower Murray Water Annual Report 2015/16 5
About Us
Functions and Duties
Function / Duty Respondent to Objective / Action
*Continued to encourage reclaimed water projects to reduce extractions from the Murray
River
*Partner in the delivery of a project to reduce potential environmental impacts from pump
infrastructure on the river
*Continued to assist with the plannning and delivery of Environmental Flows, including
Cardross Basin, Koorlong Basin and Woorlong Wetlands
* Continued with our waste management program
* Continued to encourage schemes that promote the sustainable reuse of treated water
* Continued reduction of office based electricity consumption
*Continued our development of various renewal energy projects and energy efficient
program towards long-term abatement of emissions
*Continued to assist in the implementation of the Mallee Regional Catchment Management
Strategy 2013-19
*Partnered in the delivery of the works program for the Mallee Regional Waterway
Strategy 2014-22
*Continued our involvement with the Environmental Protection Authority (EPA) Water
Industry Reference Group
* Continued with policy development with other River Murray stakeholders (Barmah Choke)
* Managed a number of sites under the Victorian Biodiversity Strategy
*Continued to assist with the delivery of environmental watering, utilising our irrigation
and drainage assets
*Continued to manage threatened species (Hooded Scaly-foot lizard and Murray Hardyhead
fish)
* Continued the functions of our Governance Committee
*Continued the functions of our Audit and Risk Committee, while continually improving the
risk management framework
*Entered into a shared services agreement with Yarra Valley Water (YVW) for culture and
structure
*Conducted our business affairs within the requirements and obligations of relevant Acts
and Government policies
* Met the requirements of the Financial Management Compliance Framework
* Continued Director training as required
* Continued implementation of improvements to SCADA program
*Continued annual inspection program of over 150 worksites as part of the hazard removal
program
* Continued the progress of the improved disaster recovery work site
*
Meet requirement of
Department of Health and
Human Services
Other
Obligations*
Completed our external regulatory audit in June 2016, successfully complying with the
obligations under the Safe Drinking Water Act 2003
To Manage the
Corporation in accordance
with expected standards
of corporate behaviour
Governance
Statement
To manage the
Corporation's assets and
finances responsibly and
substainability
Governance
Statement
Committing to the Environment and Region
Governance and Obligations
To maintain positive and
transparent relationships
with our customers and
other stakeholders
Corporate
Mission
To protect and care for
our environment
Other
obligations
Governance
Statement
To manage the
Corporation's assets and
finances responsibly and
substainability

Lower Murray Water Annual Report 2015/16 6
Chair and Managing Director’s Report
Chair’s Report
I am pleased to present this overview for our 2015/16 Annual Report.
There have been a number of highlights throughout the year, the most notable being the Sunraysia Modernisation
Project (SMP). Practical completion of SMP was achieved in July 2016.
With channel replacement works being completed in Mildura, Red Cliffs and Merbein it means our customers will have a
new robust irrigation system that is capable of providing water throughout the majority of the year. The Sunraysia
Modernisation Project has been a hugely successful one for the region and gives security to the district’s economy and
long term viability for our growers. Year round water supply will give our customers and potential investors
opportunities not previously available in the area including crop diversification, improved water quality and security of
supply.
During this year we have commenced a partnership arrangement with Yarra Valley Water for the provision of Human
Resources services to our organization. This has been very successful and has meant we can commence our
organizational cultural change project.
I would like to thank the SMP Project Control Group under the Chairmanship of Dane Huxley for their professionalism in
guiding the project towards completion on time and under budget.
Water demand for our irrigation and urban businesses was strong throughout the year. We saw some pleasing rural
returns for a majority of our irrigation customers in the table grape, citrus, almond, dried fruit and vegetable sectors
however wine grape growers were still receiving less than optimal prices for their produce. We hope that the future
will see continued strengthening in agricultural returns for all rural customers.
While being in a position to fund a significant proportion of our statutory depreciation of $28.4M (based on assets
valued at $900M) our consolidated result was a pre-tax accounting loss of $12.7M with the urban business division
showing a pre-tax surplus of $2.4M. The revaluation of assets and the write off of existing irrigation assets of $4.1M
being replaced through the SMP is a significant factor to this year’s operating result.
The Minister for Water released the dra� “Water for Victoria” policy document for consultation. We have been involved
in providing feedback and support to this process and look forward to the release of the document in the coming year.
A key policy initiative that has been highlighted by the State Government this year has been the subject of Diversity.
Our Board fully supports the initiative especially in a region that has a very diverse population. We look forward to
progressing this in the coming years within our organisation.
We welcomed four new Directors to our Board during 2015/16 being Directors Sharyon Peart, Liza McDonald, Jason
Kambovski and Guy Kingwill. All have significant management and industry experience and add to the diverse range of
skills around the Board table. I would like to formally acknowledge and thank the three outgoing directors, Malcolm
Bennett, Graham Robertson and Barry Bishop for their valuable contributions to our Board.
The Board appreciates the productive relationship it has with our Strategic Advisory Committee and our urban and
rural Customer Committees. These have worked well throughout the last year in ensuring relevant and timely advice on
rural matters has been passed through to Board. We look forward to another year of positive customer interaction with
our committees.
In closing I would like to thank my fellow Directors for their contribution and support, the management team under the
leadership of our Managing Director Phil Endley for delivering on our corporate objectives and the staff for their
commitment, dedication and loyalty to the Corporation.
John Tesoriero
Chair
7th September 2016

Lower Murray Water Annual Report 2015/16 7
Managing Director’s Report
This past year has been a very busy and productive one for Lower Murray Water.
Following on from the benchmarking report last year we have continued to review our business internally and put in
place change strategies to enable us to meet the objectives of our customers and stakeholders. We are now embarking
on a restructuring of the business and a culture change program for leadership and staff. Our objective is to raise
productivity and performance through the business, both through this and through better use of our investments in
information technology.
Key to being able to deliver these changes is our developing relationship with Yarra Valley Water, which is one of the
three water retailers for Melbourne. We have developed a shared services program with our colleagues in Yarra Valley
that provides access their organisation’s key executive and managerial staff on a contractual basis to assist in the
culture and change projects.
Of course, the biggest single event for us during this financial year has been the continued progress with the
Sunraysia Modernisation Project, such that when the project reaches physical completion at the end of August we will
have delivered almost twice the expected scope of works.
We have participated strongly in the recruitment of the new project director of the Sunraysia Rejuvenation Project and
now seek to be a key partner of his work to increase investment following completion of the Modernisation Project. We
have a small internal project team which has been working to improve our response to rural customers wishing to
modify or increase their businesses. This work is being piloted with customers at the moment and further work over
the next year will enable us to roll out improving services across the three districts of Mildura, Red Cliffs and Merbein.
In the coming year, we will be developing our next five year investment plan and as part of this we will be talking to
you, our customers, to understand your needs and aspirations. We will offer more opportunities to meet with us.
I would like to highlight a major river water quality issue in the past 12 months. We had a Blue Green Algae bloom
which lasted for three months in the Murray River. This affected the water quality for a lot of our rural customers and
caused extra treatment costs for our urban drinking water operations. I would like to thank the community and also the
agencies involved in dealing with this naturally occurring emergency. As an organisation we had to continually
investigate, analyse, act and communicate results on a daily basis for this lengthy outbreak.
Overall, we have had a year of preparing for the future and now we look forward to working with our staff, our
communities and stakeholders to deliver change.
Philip Endley
Managing Director
7th September 2016
Chair and Managing Director’s Report


Lower Murray Water Annual Report 2015/16 9
Organisational Structure
~ Directors Kambovski, Kingwill, McDonald and Peart were appointed to the Board effective 1st October 2015
The Lower Murray Water Team
Board of Directors John Tesoriero (Chair), Tony Mathews
(Deputy Chair), Jason Kambovski~,
Guy Kingwill~, Kay Martin, Liza McDonald~,
Sharyon Peart~, Cheryl Rix and Philip Endley
(Managing Director)
Audit Committee Cheryl Rix (Chair), Jason Kambovski~,
Tony Mathews, Liza McDonald~ and Glen Hornsby
(external appointment)
Governance Committee Kay Martin (Chair), Guy Kingwill~, Sharyon Peart~
and Philip Endley
Managing Director Philip Endley
• Provide Strategic Direction
• Deliver Corporation Objectives
• Manage Stakeholder Relationships
• Human Resources and Occupational Health and Safety
• Ensure efficient deployment of the necessary resources
General Manager
Technical Services Kevin Murphy
• Engineering Services
• Water/Wastewater
Treatment
• Asset /Maintenance
Management
• Capital Works
• Environmental
Services
• Planning /
Subdivision / Property
Services
• Trade Waste
General Manager
Business Services Loris Davis
• Business Planning,
Compliance and
Reporting
• Treasury and Finance
• Customer Accounts
• Information
Technology
• Stores
• Corporate Services
• Records
General Manager
Customer Services Owen Russell
• Customer Services
• Private Diversions
• Water Trading
• Catchment
Management
• Public Relations
• Corporate
Communications
• Risk Management
• Water Restrictions
and Compliance
• Customer Committees
Manager
Southern Region (Piangil to Koondrook)
David Girdwood
• Works and Services
• Operations and
Property Services
• Capital Works
• Water/Wastewater
Treatment
• Asset/Maintenance
Management

Lower Murray Water Annual Report 2015/16 10
Our Board
The Lower Murray Urban and Rural Water Corporation
Board of Directors is comprised of seven Directors as
appointed by the Minister for Water.
During the 2015/16 year changes to our Board comprised:
• Jason Kambovski, Guy Kingwill, Liza McDonald and
Sharyon Peart were appointed to the Board effective
1st October 2015
• Malcolm Bennett, Barry Bishop and Graham Robertson
concluded their service with the Board effective 30th
September 2015.
The Board of Directors is appointed to ensure the
strategic direction of the Corporation complies with
Government objectives for the provision of reliable and
secure water, wastewater and drainage services.
Our Directors come from diverse backgrounds and bring a
mix of skills and experience to the Board that ensures
the Board’s focus is on Lower Murray Water achieving
optimal environmental, operational and financial
corporate governance. The Board generally meets
monthly. The effectiveness of the Board and its
performance is reviewed annually. Logistical and financial
provisions are afforded to Directors for their ongoing
skills development.
Board Membership
John Tesoriero is currently Chair of the Board of
Directors, of Lower Murray Water and previously project
managed the development of a business case for the
Sunraysia Irrigation Modernisation Project for the
Mildura Development Corporation. John has extensive
experience in the water industry including General
Manager, Water Supply for Southern Rural Water, Chief
Executive Officer of the First Mildura Irrigation Trust and
General Manager Western Murray Irrigation. John is a
former Chairperson of the Murray Valley Citrus Board and
was previously the Chief Executive Officer of that
organisation. John is also a member of the Mildura Base
Hospital Community Advisory Board. He has a Graduate
Diploma of Business (Administration) and is a member of
the Australian Institute of Company Directors.
Tony Mathews has in excess of forty years’ experience in
the aviation industry including extensive work in regional
aviation as a chief pilot and general manager. His roles
included Chief Pilot (1982 - 1986) and General Manager
(1986 - 2002) Qantas Regional Airlines. Mr Mathews is the
Chair Mildura Private Hospital Advisory Board (2003 -
current), member of Airservices Australia (2012 - current),
Mildura District Health Fund (2012 - present) and RCP
Finance (2011 – current). Mr Mathews has qualifications
as an airline transport pilot and commercial pilot and is
a graduate of the Australian Institute of Company
Directors.
Philip Endley, our Managing Director, has extensive
experience with contractors, water utilities and
engineering organisations in Australia and overseas. He
has previously worked for Thames Water in the United
Kingdom, United Utilities and Osmoflo Pty Ltd in
Australia. Most recently he was the Director of Katalyst21
a specialised water utility consultant.
Jason Kambovski is currently working at Westpac within
their Institutional Bank as Head of Public Sector, where
he is responsible for managing the Bank’s engagement
with the Victorian and Tasmanian Governments. He has
over 20 years’ experience in the financial services sector,
having worked for Deloitte, Perpetual Trustees, and the
Commonwealth Bank in various senior roles including
Head of Government, National Executive Manager and as a
Business Development Manager. Mr Kambovski has
completed both a Bachelor of Law and a Bachelor of
Commerce (majoring in Accounting and Finance,
Commercial Law and European History).
Guy Kingwill is an experienced company director having
been Managing Director/CEO of Tandou Ltd, an ASX listed
company, for nine years. Prior to joining Tandou he
enjoyed a successful executive career with Lanxess
Corporation and Bayer Chemicals in the United
States. Mr Kingwill has a Bachelor of Commerce, is a
member of Chartered Accountants Australia and New
Zealand and a Fellow of the Australian Institute of
Company Directors.
Liza McDonald is currently the Principal – Stakeholder
and Community of Bastion Strategic and Global
Outcomes. Previously she was a Director for Industry
Reform and Implementation at the Taxi Services
Commission and also General Manager – Service Delivery
- Bus and Regional Services at the Department of
Transport. She has held previously ministerial advisory
positions in her career. She has completed the Australian
Institute of Company Directors course.
Kay Martin is a lawyer with the legal firm Martin, Irwin
and Richards and an irrigator in the Merbein Pumped
Irrigation District. Kay has both a Bachelor of Law and a
Bachelor of Economics and has worked in the legal
profession since 1977. She has for many years been a
member of the Legal Aid Child Representative Panel and
was a former President of the Board of the Mildura Base
Hospital and Deputy Chair of the former Sunraysia Rural
Water Authority. Kay is currently Chair of Chaffey Aged
Care and is a member of the Sunraysia Institute of TAFE
board. Kay is Chair of our Governance Committee.
The Lower Murray Water Team

Lower Murray Water Annual Report 2015/16 11
Sharyon Peart is currently a Director of All About Me providing a consulting service and retail business. She is a Chair
at both Interdepartmental Stakeholder Reference Group for the Victorian Floodplain Management Strategy and Mallee
Catchment Management Authority. She is currently the Deputy Mayor of Mildura Rural City Council. Ms Peart has
experience in corporate governance, floodplain management issues, financial management, environmental management,
agricultural water use and associated impacts on the environment, strategic planning, community engagement and
relationship building.
Cheryl Rix, Deputy Chair of our Board of Directors, is a director in a wine and dried fruit grapes and citrus irrigation
farm. She is the Corporate Services Officer and Chief Risk Officer at Mildura Health having previously been the Program
Manager for Northern Mallee Leaders and the former General Manager Western Murray Irrigation Ltd. She has
previously worked as a business consultant and was the Chair of the Lower Murray Darling Catchment Management
Authority (New South Wales). Cheryl is a past member of the National Community Bank Strategic Advisory Board for
Bendigo and Adelaide Bank’s Community Bank Network and is also a past board member of Wentworth District Capital
Limited and Mildura Development Corporation. She holds a Bachelor of Commerce and has completed the Australian
Institute of Company Directors Course and the Mastering the Boardroom program. Cheryl is a Chartered Accountant and
a fellow of the Australian Rural Leadership Foundation.
Directors’ Attendance at Board Meetings
# Directors Bennett, Bishop and Robertson concluded their terms effective 30th September 2015
~ Directors Kambovski, Kingwill, McDonald and Peart commenced their terms effective 1st October 2015
The Lower Murray Water Team
Eligible to
attend
Attended
Malcolm Bennett# 3 3
Barry Bishop# 3 3
Philip Endley 11 11
Jason Kambovski~ 8 8
Guy Kingwill~ 8 7
Kay Martin 11 11
Liza McDonald~ 8 8
Tony Mathews 11 10
Sharyon Peart~ 8 8
Cheryl Rix 11 10
Graham Robertson# 3 3
John Tesoriero 11 9
Board Meetings
Directors

Lower Murray Water Annual Report 2015/16 12
Our Staff
The staff turnover rate for 2015/16 was 7.3%
The Lower Murray Water Team
Head
countFTE
Head
countFTE
Head
countFTE
Head
countFTE
Head
countFTE
Head
countFTE
Executive 4 4 1 1 5 5 4 4 1 1 5 5
Administration 18 18 32 29.9 50 47.9 18 17.84 30 28.1 48 45.96
Operations 76 76 1 1 77 77 70 70 5 5 75 75
Engineering/Technical 33 32.9 3 2.5 36 35.4 35 34.85 2 2 37 36.85
Sub-total 131 130.9 37 34.4 168 165.3 127 126.7 38 36.1 165 162.8
Vacancies 4 4 4 4
Totals 172 169.3 169 166.8
Area
2014/15 2015/16
Male Female Total Male Female Total
Head
countFTE
Head
countFTE
Head
countFTE
15-24 yrs 4 4 0 0 4 4
25-34 yrs 16 16 2 1.83 18 17.83
35-44 yrs 27 26.84 9 8.49 36 35.33
45-54 yrs 35 35 16 14.85 51 49.85
55-64 yrs 41 41 10 9.95 51 50.95
65-65+ yrs 4 3.85 1 1 5 4.85
Total 127 126.69 38 36.12 165 162.81
Male Female Total
Age group
Total
Full
Time
Part
Time
Full
Time
Part
Time
Head
count
15-24 yrs 4 0 0 4
25-34 yrs 16 2 0 18
35-44 yrs 26 1 4 5 36
45-54 yrs 35 14 2 51
55-64 yrs 41 10 0 51
65-65+ yrs 3 1 1 0 5
Total 125 2 31 7 165
Male Female
Age group
Classification
LevelA B C D E Total
Band 1 0 0 1 18 13 32
Band 2 10 4 6 36 56
Band 3 2 3 17 22
Band 4 2 6 12 20
Band 5 1 0 13 14
Band 6 1 0 2 3
Band 7 0 1 0 1
Contract Staff 17
Total 165

Lower Murray Water Annual Report 2015/16 13
Workforce Philosophy We strive to deliver exceptional human resource services and programs that provide the foundation for a constructive
working environment with highly capable and satisfied employees, contributing to the achievement of our long term
vision and goals. The business continues to improve efficiency and effectiveness through regular review and
automation of our human resource systems and processes.
A shared services partnership between Yarra Valley Water (YVW) and ourselves aimed at strengthening workplace
culture in the water sector was established during 2015/2016. The shared services collaboration will see YVW provide
strategic human resources services and support to us over a three year period. The collaboration will deliver new
efficiencies and enhance knowledge sharing to deliver better outcomes for the community. This arrangement allows us
to leverage a decade of YVW’s renowned culture development knowledge and experience, with a flow on effect for our
staff, customers and stakeholders.
Following the launch of our People and Culture Strategy 2016-2018, we conducted a functional review to ensure our
structure was a match for our strategy and in particular, enabled exceptional service efficiency to customers and
stakeholders, both internally and externally. We undertook a culture survey across the business with 92% participation
from staff. The results of the survey were discussed with staff across the business, in interactive sessions that
focussed on building awareness of behavioural impacts and determining key improvement actions.
We aim to have a workforce representing our community’s ethnic, gender and age demographics and we are currently
developing a diversity and inclusion strategy to meet our stakeholder and community requirements and contribute to
the targets of the Victorian Water Industry Diversity Strategy. This includes a commitment to offer flexible working
arrangements.
Workplace Merit and Equity We are committed to ensure a workplace free from any unlawful discrimination, bullying, harassment, victimisation,
racial and religious vilification practices within the organisation, and to create and promote equality of opportunity for
our staff.
Staff Contact Officers have been trained by the Victorian Equal Opportunity and Human Rights Commission. Matters
such as the Code of Conduct, Charter of Human Rights, and other Merit and Equity items including internal policies,
appear on our internal Intranet and are also dealt with at new staff inductions and annual information refresher
sessions for all staff.
Staff Development and Training We aim to maintain a quality, skilled and committed workforce by providing opportunities for all staff to develop and
improve their capacity and skillset to contribute to our overall business performance and objectives. All employees
have attended Privacy, OHS, Human Resources (Bullying, Harassment and Equal Opportunity), Environment, Complaints
Management and Social Media awareness sessions during 2015/16. Ongoing regulatory training has continued to be a
high priority for the Corporation. Employees are encouraged to undertake tertiary studies and we have policies that
provide employees with paid study leave and reimbursement of fees for relevant approved courses. We have had
employees successfully achieve their Certificate III in Water Operations and a range of Certificates, Diplomas and
Master’s Degree across a range of fields including Electrical, Business/Management, Marketing and Information
Technology.
It was pleasing to see the skills and dedication of a staff member being recognised by her industry during the 2015/16
year. Makayla Harrison, Apprentice Electrician, was awarded The EPIC Industry Training Board’s Electrical Development
Association of Victoria Scholarship Award which recognises the achievements and contributions made by Victorian
students within the Electrical Electronic Industry and provides them with an opportunity to further their career.
Makayla was nominated for the 2015 Sunraysia Murray Group Training (SMGT) Apprentice of the Year. Joshua Fuller,
one of our engineering scholarship holders, was awarded the University of South Australia (School of Engineering) PW
Stephens Engineering Prize in June 2016. The prize is awarded annually to the full time student who obtains the
highest grade point average upon completion of the first year of the Bachelor of Engineering (Mechanical or
specialisation) program.
The Lower Murray Water Team

Lower Murray Water Annual Report 2015/16 14
Statistics 2013/14 2014/15 2015/16
Days Lost - Workcover
- per FTE
61
0.36
39
0.23
99
0.59
Number of Lost Time Injuries 5 2 3
Lost Time Injury Frequency Rate (LTIFR) * 18.36 6.5 9.9
Percentage of annual Workplace Inspections completed 100% 100% 100%
Occupational Health and Safety (OHS) Caring for the Health and Safety of our staff, customers, contractors and visitors is critically important to us. Not only
do we have a Duty of Care to these stakeholders under the Occupational Health and Safety Act 2004 we also have a
moral obligation to go beyond just compliance and aspire to achieve the best outcome. We recognise that OHS is not
only important but it is integral to all business activities. As a Corporation we accept and understand our
responsibilities under Commonwealth and State legislation, Regulations and Codes of Practice. We have proactive
Northern and Southern OHS Committees that are well supported by management and these Committees have a direct
influence on OHS outcomes. The Committees assist in developing Standard Operating Procedures, Policies, identifying
hazards in the workplace, promoting the OHS culture to their different workgroups and participating in incident
investigations and reviews. The Committees meet regularly to discuss OHS matters, share knowledge and practices and
suggest where improvements can be made within the organisation. As part of our determination to protect our
workforce and ensure we are productive, we have a Health and Wellbeing Committee, and have re-commenced our Health
and Wellbeing Program which is co-funded by the Corporation and participants.
In May 2016 we released our Occupational Health and Safety Strategy 2016-2018. The strategy’s mission is to embed
“positive, safe and healthy behaviours’ as a Corporate value; to ensure our staff are accountable to each other to effect
a safe and healthy workplace; to educate and empower all levels within the organisation to engage in open, honest and
respectful conversations about safety; and to find a way to complete every task safely.
The Strategy has two focus areas—Behavioural and Management System. The Behavioural focus area seeks to identify
and provide training opportunities and support programs, working closely with managers, supervisors and the Executive
Group, in order to educate and empower all employees on their accountabilities and responsibilities in accordance with
legal and corporate requirements; to establish a culture that values employee safety and wellbeing through business
practices; to support safety-conscious behaviour through active leadership and consultation and; to encourage
employees to be responsible for their own safety. The Management System seeks to develop and review easily
comprehensible policies and procedures to meet legal and organisational requirements, enabling a sustainable process
for continual improvement; to report, evaluate and provide feedback for safety performance and; to set key safety
objectives and targets.
* Number of Injuries x 1,000,000 / total hours worked
The Lower Murray Water Team

Lower Murray Water Annual Report 2015/16 15
On the 28th March 2015, the Minister for Environment,
Climate Change and Water, the Hon Lisa Neville MP,
approved Lower Murray Water's application for a minor
amendment to its Bulk Entitlement (River Murray – Lower
Murray Urban & Rural Water—Irrigation) Conversion Order
1999 under section 45 of the Water Act 1989.
The amendments were made to reduce the loss allowance
for Lower Murray Water's irrigation districts to account
for water shares issued to the Commonwealth
Environmental Water Holder, from savings achieved
through the modernisation works under the SMP. This is
required to meet Victoria's obligations under the Funding
Deed with the Commonwealth Government for the SMP.
No new irrigation district off-take points were agreed to,
or used, in the past season. No new installation of pipe or
channels was made to return water into the River Murray.
We are implementing a meter replacement program across
the irrigation Merbein, Mildura and Red Cliffs districts as
a part of the implementation of the SMP.
Our Bulk Water Entitlements
On the 1st of July 2007 the delegate of the Minister, Mr
Phillip Reed, endorsed the new Bulk Water Entitlement
(River Murray – Lower Murray Urban and Rural Water –
Irrigation) & Bulk Water Entitlement (River Murray – Lower
Murray Urban and Rural Water – Urban) Conversion Orders
1999, as amended. These new orders provided a listing of
updated entitlements which we administer on behalf of
urban and rural customers and our organisation.
On the 20th August 2008 the bulk entitlement of the First
Mildura Irrigation Trust came under the overall listing of
entitlements of Lower Murray Water. In 2009 our three
Bulk Entitlements were modified and amended by the
Minister for Water. The amendment was necessary as a
consequence of the decommissioning of Lake Mokoan and
the new operational arrangements for the Victorian Mid
Murray Storages.
In 2010 the Environmental Entitlement (River Murray—
Environmental Water Reserve) 2010 was enacted. In 2011
we received a notice of amendment to Bulk Water
Entitlements and Environmental entitlements for the
commencement of the Victorian Environmental Water
Holder 2011 by the Minister for Water. On the 1st of July
2013 an amendment of the Lower Murray Water Murray
Irrigation Bulk Entitlement and Victorian Environmental
Water Holders Flora and Fauna Bulk Entitlement was
approved by the Minister for Water, the Hon Peter Walsh
MLA.
In January 2014, LMW applied to the Minister for Water
Peter Walsh to amend our Bulk Entitlement (River Murray
– Lower Murray Urban & Rural Water - Irrigation)
Conversion Order 1999 and repeal the Bulk Entitlement
(River Murray – First Mildura Irrigation Trust) Conversion
Order 1999. The Minister approved these items in March
2014.
On the 24th March 2014 the Minister for Water approved
the application by LMW to:
• amalgamate the provisions to supply Lower Murray
Water's irrigation districts into one bulk entitlement
Order, in order to internalise the management of the
loss allowance between the irrigation districts and
simplify administration of the bulk entitlements
• reduce the distribution loss allowance for Lower Murray
Water's irrigation districts from 18,550 ML to 15,392 ML
to offset the transfer of the first instalment of water
savings to the Commonwealth Government from the
Sunraysia Modernisation Project (SMP)
• make other related changes and minor corrections to the
Bulk Entitlement.
Serving our Customers
Lower Murray Water Annual Report 2015/16 16
Serving our Customers
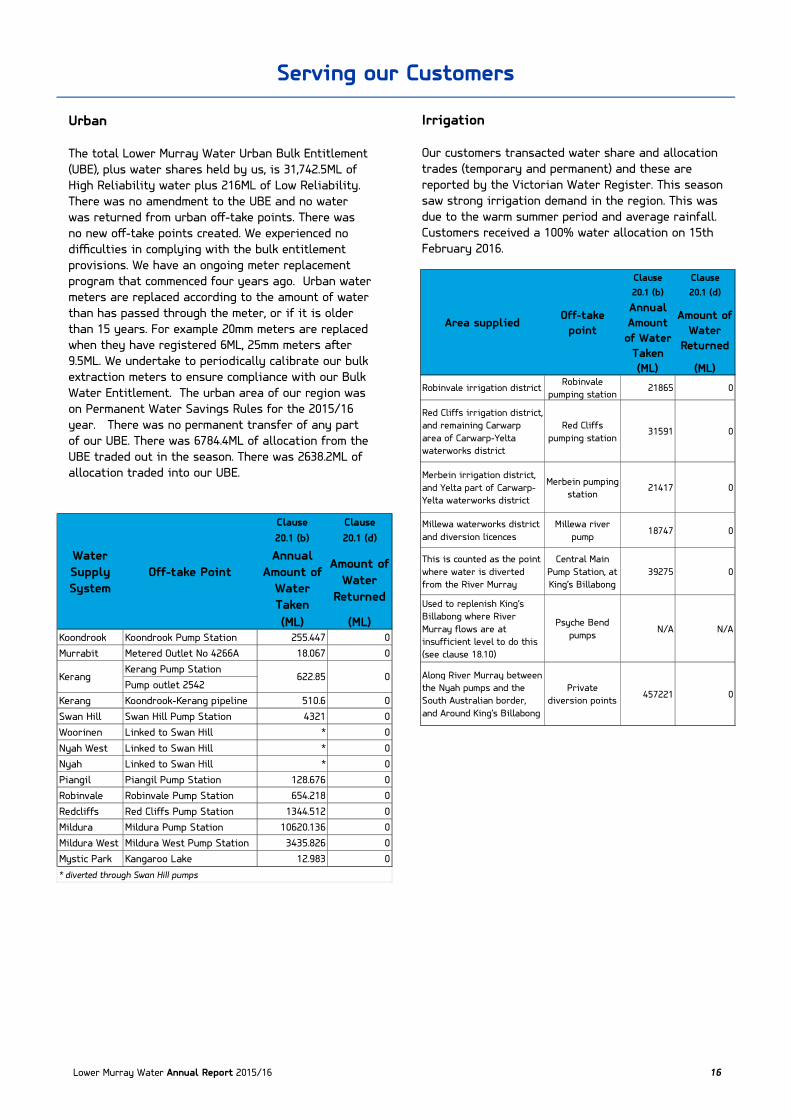
Urban
The total Lower Murray Water Urban Bulk Entitlement
(UBE), plus water shares held by us, is 31,742.5ML of
High Reliability water plus 216ML of Low Reliability.
There was no amendment to the UBE and no water
was returned from urban off-take points. There was
no new off-take points created. We experienced no
difficulties in complying with the bulk entitlement
provisions. We have an ongoing meter replacement
program that commenced four years ago. Urban water
meters are replaced according to the amount of water
than has passed through the meter, or if it is older
than 15 years. For example 20mm meters are replaced
when they have registered 6ML, 25mm meters a�er
9.5ML. We undertake to periodically calibrate our bulk
extraction meters to ensure compliance with our Bulk
Water Entitlement. The urban area of our region was
on Permanent Water Savings Rules for the 2015/16
year. There was no permanent transfer of any part
of our UBE. There was 6784.4ML of allocation from the
UBE traded out in the season. There was 2638.2ML of
allocation traded into our UBE.
Irrigation
Our customers transacted water share and allocation
trades (temporary and permanent) and these are
reported by the Victorian Water Register. This season
saw strong irrigation demand in the region. This was
due to the warm summer period and average rainfall.
Customers received a 100% water allocation on 15th
February 2016.
Clause Clause
20.1 (b) 20.1 (d)
Annual
Amount of
Water
Taken
Amount of
Water
Returned
(ML) (ML)Koondrook Koondrook Pump Station 255.447 0
Murrabit Metered Outlet No 4266A 18.067 0
Kerang Pump Station
Pump outlet 2542
Kerang Koondrook-Kerang pipeline 510.6 0
Swan Hill Swan Hill Pump Station 4321 0
Woorinen Linked to Swan Hill * 0
Nyah West Linked to Swan Hill * 0
Nyah Linked to Swan Hill * 0
Piangil Piangil Pump Station 128.676 0
Robinvale Robinvale Pump Station 654.218 0
Redcliffs Red Cliffs Pump Station 1344.512 0
Mildura Mildura Pump Station 10620.136 0
Mildura West Mildura West Pump Station 3435.826 0
Mystic Park Kangaroo Lake 12.983 0
* diverted through Swan Hill pumps
Water
Supply
System
Off-take Point
Kerang 622.85 0
Clause Clause
20.1 (b) 20.1 (d)
Annual
Amount
of Water
Taken
Amount of
Water
Returned
(ML) (ML)
Robinvale irrigation districtRobinvale
pumping station21865 0
Red Cliffs irrigation district,
and remaining Carwarp
area of Carwarp-Yelta
waterworks district
Red Cliffs
pumping station31591 0
Merbein irrigation district,
and Yelta part of Carwarp-
Yelta waterworks district
Merbein pumping
station21417 0
Millewa waterworks district
and diversion licences
Millewa river
pump18747 0
This is counted as the point
where water is diverted
from the River Murray
Central Main
Pump Station, at
King’s Billabong
39275 0
Used to replenish King’s
Billabong where River
Murray flows are at
insufficient level to do this
(see clause 18.10)
Psyche Bend
pumpsN/A N/A
Along River Murray between
the Nyah pumps and the
South Australian border,
and Around King’s Billabong
Private
diversion points457221 0
Area suppliedOff-take
point
Lower Murray Water Annual Report 2015/16 17
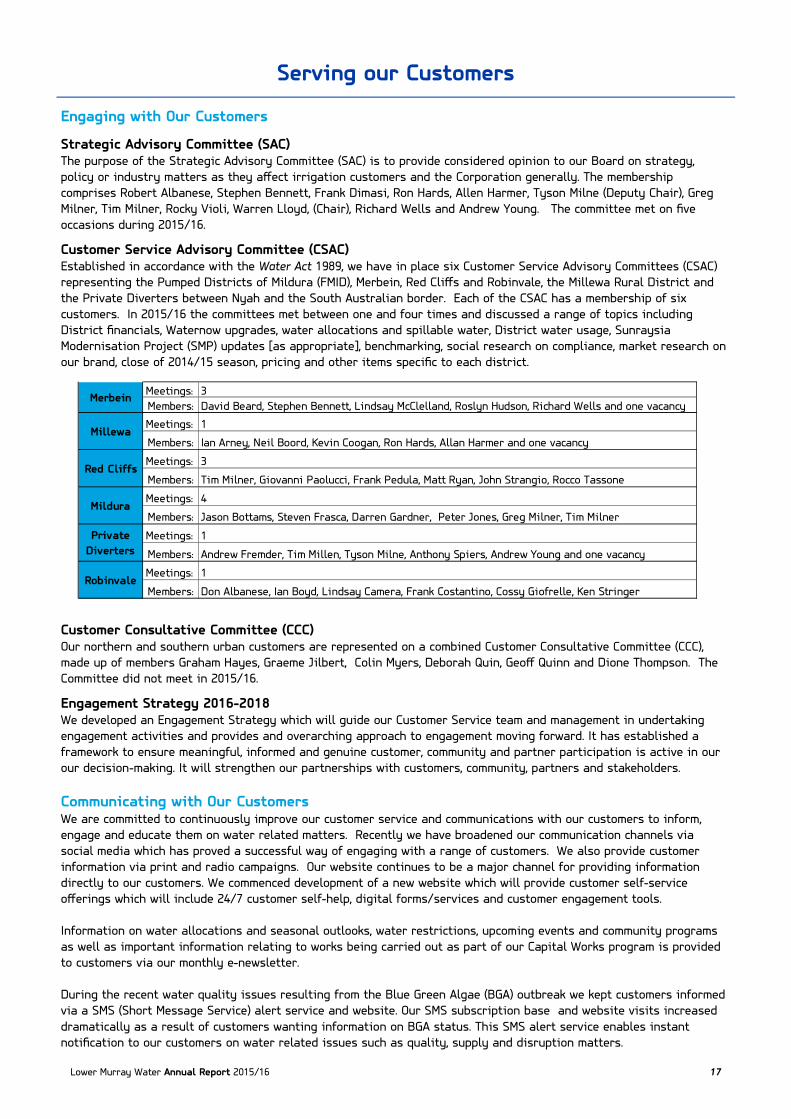
Engaging with Our Customers Strategic Advisory Committee (SAC) The purpose of the Strategic Advisory Committee (SAC) is to provide considered opinion to our Board on strategy,
policy or industry matters as they affect irrigation customers and the Corporation generally. The membership
comprises Robert Albanese, Stephen Bennett, Frank Dimasi, Ron Hards, Allen Harmer, Tyson Milne (Deputy Chair), Greg
Milner, Tim Milner, Rocky Violi, Warren Lloyd, (Chair), Richard Wells and Andrew Young. The committee met on five
occasions during 2015/16. Customer Service Advisory Committee (CSAC) Established in accordance with the Water Act 1989, we have in place six Customer Service Advisory Committees (CSAC)
representing the Pumped Districts of Mildura (FMID), Merbein, Red Cliffs and Robinvale, the Millewa Rural District and
the Private Diverters between Nyah and the South Australian border. Each of the CSAC has a membership of six
customers. In 2015/16 the committees met between one and four times and discussed a range of topics including
District financials, Waternow upgrades, water allocations and spillable water, District water usage, Sunraysia
Modernisation Project (SMP) updates [as appropriate], benchmarking, social research on compliance, market research on
our brand, close of 2014/15 season, pricing and other items specific to each district.
Customer Consultative Committee (CCC) Our northern and southern urban customers are represented on a combined Customer Consultative Committee (CCC),
made up of members Graham Hayes, Graeme Jilbert, Colin Myers, Deborah Quin, Geoff Quinn and Dione Thompson. The
Committee did not meet in 2015/16. Engagement Strategy 2016-2018 We developed an Engagement Strategy which will guide our Customer Service team and management in undertaking
engagement activities and provides and overarching approach to engagement moving forward. It has established a
framework to ensure meaningful, informed and genuine customer, community and partner participation is active in our
our decision-making. It will strengthen our partnerships with customers, community, partners and stakeholders.
Communicating with Our Customers We are committed to continuously improve our customer service and communications with our customers to inform,
engage and educate them on water related matters. Recently we have broadened our communication channels via
social media which has proved a successful way of engaging with a range of customers. We also provide customer
information via print and radio campaigns. Our website continues to be a major channel for providing information
directly to our customers. We commenced development of a new website which will provide customer self-service
offerings which will include 24/7 customer self-help, digital forms/services and customer engagement tools.
Information on water allocations and seasonal outlooks, water restrictions, upcoming events and community programs
as well as important information relating to works being carried out as part of our Capital Works program is provided
to customers via our monthly e-newsletter.
During the recent water quality issues resulting from the Blue Green Algae (BGA) outbreak we kept customers informed
via a SMS (Short Message Service) alert service and website. Our SMS subscription base and website visits increased
dramatically as a result of customers wanting information on BGA status. This SMS alert service enables instant
notification to our customers on water related issues such as quality, supply and disruption matters.
Serving our Customers
Meetings:
Members:
Meetings:
Members:
Meetings:
Members:
Meetings:
Members:
Meetings:
Members:
Meetings:
Members:
Red Cliffs
Mildura
Private
Diverters
1
Don Albanese, Ian Boyd, Lindsay Camera, Frank Costantino, Cossy Giofrelle, Ken StringerRobinvale
3
David Beard, Stephen Bennett, Lindsay McClelland, Roslyn Hudson, Richard Wells and one vacancy
1
Ian Arney, Neil Boord, Kevin Coogan, Ron Hards, Allan Harmer and one vacancy
3
Tim Milner, Giovanni Paolucci, Frank Pedula, Matt Ryan, John Strangio, Rocco Tassone
4
Jason Bottams, Steven Frasca, Darren Gardner, Peter Jones, Greg Milner, Tim Milner
1
Andrew Fremder, Tim Millen, Tyson Milne, Anthony Spiers, Andrew Young and one vacancy
Merbein
Millewa
Lower Murray Water Annual Report 2015/16 18
Serving our Customers
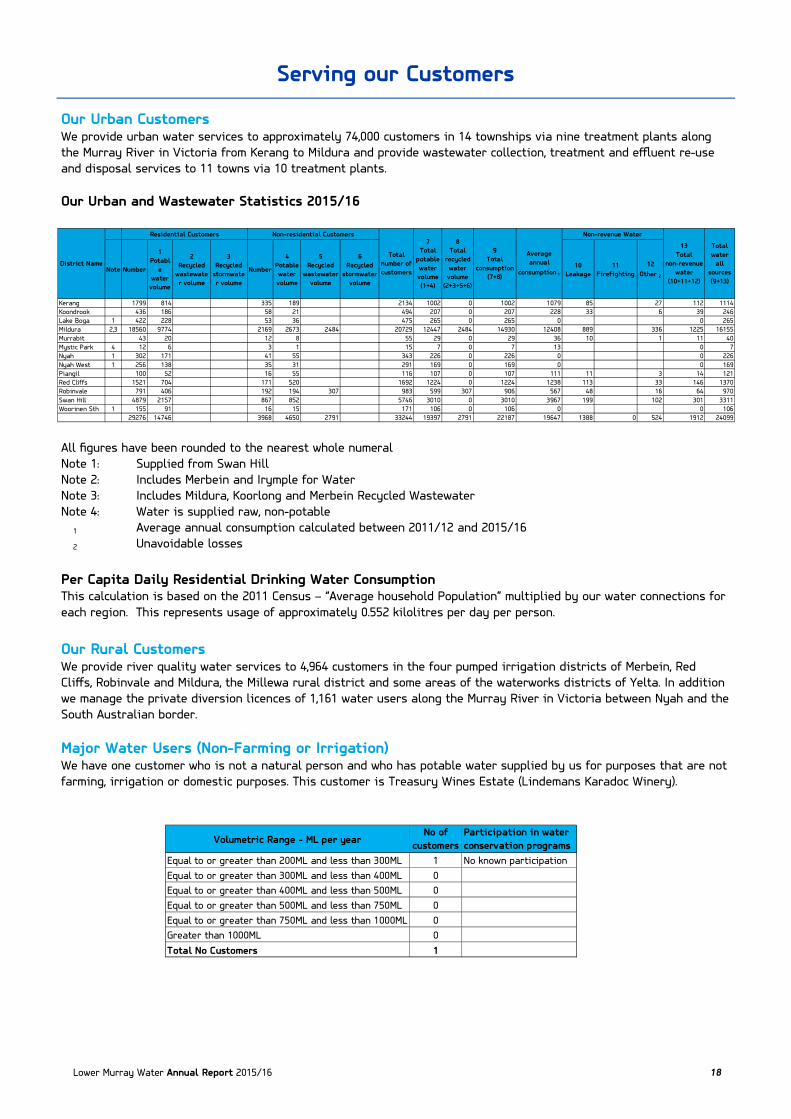
Our Urban Customers We provide urban water services to approximately 74,000 customers in 14 townships via nine treatment plants along
the Murray River in Victoria from Kerang to Mildura and provide wastewater collection, treatment and effluent re-use
and disposal services to 11 towns via 10 treatment plants.
Our Urban and Wastewater Statistics 2015/16
All figures have been rounded to the nearest whole numeral
Note 1: Supplied from Swan Hill
Note 2: Includes Merbein and Irymple for Water
Note 3: Includes Mildura, Koorlong and Merbein Recycled Wastewater
Note 4: Water is supplied raw, non-potable
1 Average annual consumption calculated between 2011/12 and 2015/16
2 Unavoidable losses
Per Capita Daily Residential Drinking Water Consumption This calculation is based on the 2011 Census – “Average household Population” multiplied by our water connections for
each region. This represents usage of approximately 0.552 kilolitres per day per person.
Our Rural Customers We provide river quality water services to 4,964 customers in the four pumped irrigation districts of Merbein, Red
Cliffs, Robinvale and Mildura, the Millewa rural district and some areas of the waterworks districts of Yelta. In addition
we manage the private diversion licences of 1,161 water users along the Murray River in Victoria between Nyah and the
South Australian border.
Major Water Users (Non-Farming or Irrigation) We have one customer who is not a natural person and who has potable water supplied by us for purposes that are not
farming, irrigation or domestic purposes. This customer is Treasury Wines Estate (Lindemans Karadoc Winery).
Volumetric Range - ML per yearNo of
customers
Participation in water
conservation programs
Equal to or greater than 200ML and less than 300ML 1 No known participation
Equal to or greater than 300ML and less than 400ML 0
Equal to or greater than 400ML and less than 500ML 0
Equal to or greater than 500ML and less than 750ML 0
Equal to or greater than 750ML and less than 1000ML 0
Greater than 1000ML 0
Total No Customers 1
Note Number
1
Potabl
e
water
volume
2
Recycled
wastewate
r volume
3
Recycled
stormwate
r volume
Number
4
Potable
water
volume
5
Recycled
wastewater
volume
6
Recycled
stormwater
volume
10
Leakage
11
Firefighting
12
Other 2
Kerang 1799 814 335 189 2134 1002 0 1002 1079 85 27 112 1114
Koondrook 436 186 58 21 494 207 0 207 228 33 6 39 246
Lake Boga 1 422 228 53 36 475 265 0 265 0 0 265
Mildura 2,3 18560 9774 2169 2673 2484 20729 12447 2484 14930 12408 889 336 1225 16155
Murrabit 43 20 12 8 55 29 0 29 36 10 1 11 40
Mystic Park 4 12 6 3 1 15 7 0 7 13 0 7
Nyah 1 302 171 41 55 343 226 0 226 0 0 226
Nyah West 1 256 138 35 31 291 169 0 169 0 0 169
Piangil 100 52 16 55 116 107 0 107 111 11 3 14 121
Red Cliffs 1521 704 171 520 1692 1224 0 1224 1238 113 33 146 1370
Robinvale 791 406 192 194 307 983 599 307 906 567 48 16 64 970
Swan Hill 4879 2157 867 852 5746 3010 0 3010 3967 199 102 301 3311
Woorinen Sth 1 155 91 16 15 171 106 0 106 0 0 106
29276 14746 3968 4650 2791 33244 19397 2791 22187 19647 1388 0 524 1912 24099
7
Total
potable
water
volume
(1+4)
8
Total
recycled
water
volume
(2+3+5+6)
9
Total
consumption
(7+8)
Average
annual
consumption 1
Non-revenue Water
13
Total
non-revenue
water
(10+11+12)
Total
water
all
sources
(9+13)
Residential Customers
District Name
Non-residential Customers
Total
number of
customers
Lower Murray Water Annual Report 2015/16 19
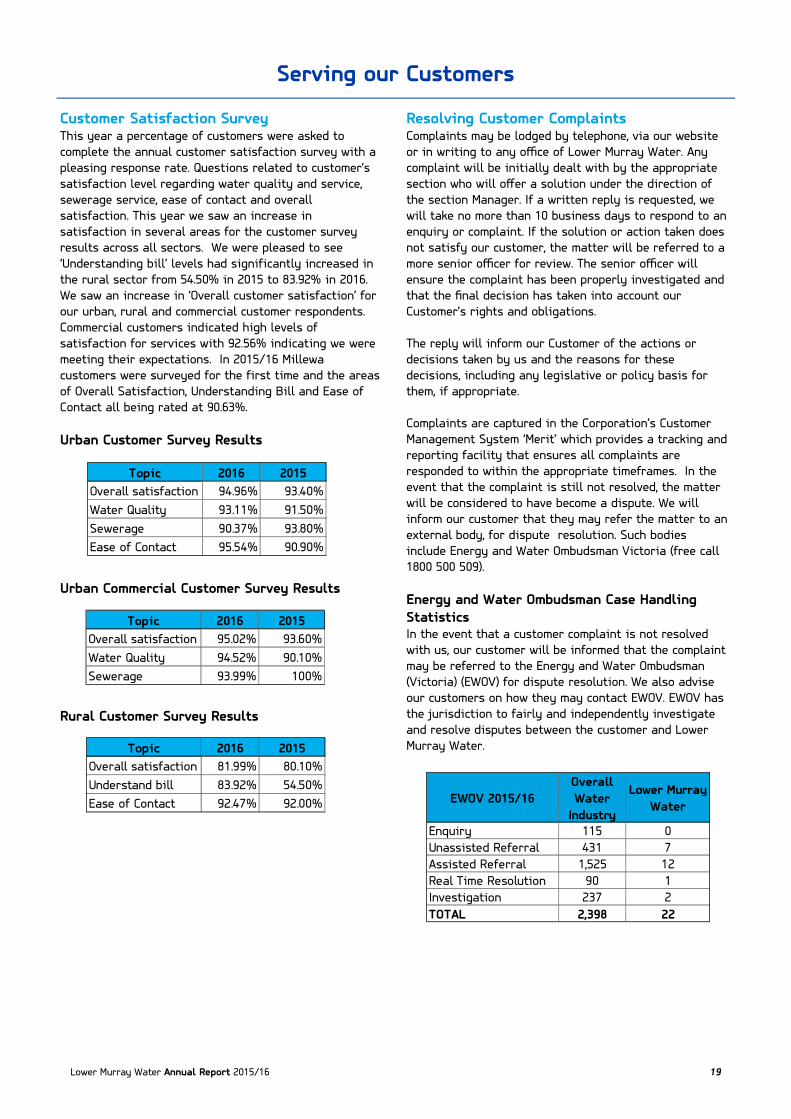
Customer Satisfaction Survey This year a percentage of customers were asked to
complete the annual customer satisfaction survey with a
pleasing response rate. Questions related to customer’s
satisfaction level regarding water quality and service,
sewerage service, ease of contact and overall
satisfaction. This year we saw an increase in
satisfaction in several areas for the customer survey
results across all sectors. We were pleased to see
‘Understanding bill’ levels had significantly increased in
the rural sector from 54.50% in 2015 to 83.92% in 2016.
We saw an increase in ‘Overall customer satisfaction’ for
our urban, rural and commercial customer respondents.
Commercial customers indicated high levels of
satisfaction for services with 92.56% indicating we were
meeting their expectations. In 2015/16 Millewa
customers were surveyed for the first time and the areas
of Overall Satisfaction, Understanding Bill and Ease of
Contact all being rated at 90.63%.
Urban Customer Survey Results
Urban Commercial Customer Survey Results
Rural Customer Survey Results
Resolving Customer Complaints Complaints may be lodged by telephone, via our website
or in writing to any office of Lower Murray Water. Any
complaint will be initially dealt with by the appropriate
section who will offer a solution under the direction of
the section Manager. If a written reply is requested, we
will take no more than 10 business days to respond to an
enquiry or complaint. If the solution or action taken does
not satisfy our customer, the matter will be referred to a
more senior officer for review. The senior officer will
ensure the complaint has been properly investigated and
that the final decision has taken into account our
Customer’s rights and obligations.
The reply will inform our Customer of the actions or
decisions taken by us and the reasons for these
decisions, including any legislative or policy basis for
them, if appropriate.
Complaints are captured in the Corporation’s Customer
Management System ‘Merit’ which provides a tracking and
reporting facility that ensures all complaints are
responded to within the appropriate timeframes. In the
event that the complaint is still not resolved, the matter
will be considered to have become a dispute. We will
inform our customer that they may refer the matter to an
external body, for dispute resolution. Such bodies
include Energy and Water Ombudsman Victoria (free call
1800 500 509).
Energy and Water Ombudsman Case Handling
Statistics In the event that a customer complaint is not resolved
with us, our customer will be informed that the complaint
may be referred to the Energy and Water Ombudsman
(Victoria) (EWOV) for dispute resolution. We also advise
our customers on how they may contact EWOV. EWOV has
the jurisdiction to fairly and independently investigate
and resolve disputes between the customer and Lower
Murray Water.
Serving our Customers
Topic 2016 2015
Overall satisfaction 94.96% 93.40%
Water Quality 93.11% 91.50%
Sewerage 90.37% 93.80%
Ease of Contact 95.54% 90.90%
Topic 2016 2015
Overall satisfaction 81.99% 80.10%
Understand bill 83.92% 54.50%
Ease of Contact 92.47% 92.00%
Topic 2016 2015
Overall satisfaction 95.02% 93.60%
Water Quality 94.52% 90.10%
Sewerage 93.99% 100%
EWOV 2015/16
Overall
Water
Industry
Lower Murray
Water
Enquiry 115 0
Unassisted Referral 431 7
Assisted Referral 1,525 12
Real Time Resolution 90 1
Investigation 237 2
TOTAL 2,398 22
Lower Murray Water Annual Report 2015/16 20
Collaboration with Stakeholders/Community As a commitment to our region, we are regularly involved
in a number of stakeholder groups to share information
on customer relations, communications, care of the River
Murray and environs, community and school education
opportunities. We are pleased to be involved with other
groups as required for specific event collaboration.
Communications Group We meet monthly with representatives from Mildura Rural
City Council (MRCC), Mallee Catchment Management
Authority (MCMA), Sunraysia Institute of TAFE and
LaTrobe University to share information on
communication and customer service issues.
Environmental Education Task Group (EETG) We attend bi-monthly EETG meetings to discuss education
opportunities with representatives from MRCC, Loddon
Mallee Waste Recovery Group and TAFE.
Environmental Protection Agency (EPA) Water
Industry Reference Group As a member of this group, we continue to contribute to
actions and plans designed to reduce impacts on the
environment.
Industry Water Association—Special Interest
Group Our Coordinator Customer Relations is a member of the
Communications Special Interest Group, which meets on a
quarterly basis to discuss topical issues relating to
communications and customer service.
Lake Hawthorn Management Plan Lake Hawthorn, a few kilometres northwest of the Mildura
CBD is an important local water body. The Lake receives
its water principally from MRCC’s stormwater system and
our irrigation drainage system. The Lake also plays a
role in the salinity inception scheme managed by
Goulburn Murray Water (GMW). In addition to these
important functions, the Lake has ecological and social
amenity values. In recent years, declining inflows to the
Lake have caused a decline of these ecological and
amenity values, especially as water levels began to
decline. To address these issues we partnered with MRCC,
MCMA and GMW to develop a management plan for Lake
Hawthorn. Development of the plan involved extensive
community consultation including meetings and forums
with local residents and a wide range of submissions
from other interested parties.
Sunraysia Regional Algal Coordination Committee We are a Victorian convening agency within the region
for Blue Green Algae (BGA) monitoring and reporting. The
monitoring of the Murray River is undertaken by our staff
and the NSW Department of Environment and Water and
is reported back through the Sunraysia Regional Algal
Coordination Committee (SRACC). Our General Manager
Customer Services is currently the Chairman of the
SRACC. Between March and June 2016 red alerts were in
place along the River Murray in our service area. A large
amount of resources went into keeping customers and the
general public informed about the outbreak/alert levels
and answering the many queries received. The outbreak
resulted in additional costs for urban water treatment.
Sunraysia Rejuvenation Project (SRP) We are one of the founding agencies of the SRP, a
multi-agency project designed to ensure the
improvements delivered by the Sunraysia Modernisation
Project (SMP) become tangible benefits for growers and
investors in the Merbein, Mildura and Red Cliffs irrigation
districts. The agencies involved in the SRP include the
MCMA, MRCC, Regional Development Victoria (RDV),
Mildura Development Corporation (MDC) and the
Department of Environment, Land, Water and Planning
(DELWP). Funding has been provided by DELWP and RDV.
Sunraysia River Watch Inc We are proud to continue our association with Sunraysia
River Watch Inc (SRW). SRW is a community program that
aims to assist in the protection of the river and its
environment. SRW is dedicated to increasing the
appreciation of the river and the surrounding
environment and ensuring its preservation for the benefit
of current and future generations. In 2015/16 we
continued our ongoing sponsorship and membership of
SRW, joining other agencies and local businesses in
demonstrating ongoing commitment to this important
community service.
Committing to the Environment and Region

Lower Murray Water Annual Report 2015/16 21
Environmental Sustainability Lower Murray Water plans and manages our operations
in an environmentally responsible and sustainable
manner, while contributing to the economic, social and
cultural development of the region.
Sustainable Water Use
Water Recycling We continue to encourage schemes that promote the
sustainable reuse of treated water. Such schemes have
the positive environmental impact of lowering the
impact on the Murray River by reducing the volume of
water extracted. Under the various schemes, water is
initially treated according to the relevant EPA
Guidelines and then supplied for a variety of beneficial
uses. These include:
• Koorlong Wastewater Treatment Plant—wastewater
from Red Cliffs, Irymple and parts of Mildura is
treated at the plant to Class C standards then
supplied to a primary producer for use in horticulture
• Mildura Wastewater Treatment Plant—this plant
treats wastewater from the remaining part of Mildura
to Class C standards then used onsite for the
production of pastures, fodder and for irrigating
treelots
• Robinvale Wastewater Treatment Plant—wastewater
from the Robinvale area is treated at the plant to
Class C standards and then used for the production
of high grade fodder
• Mildura Water Treatment Plant—raw river water is
treated to Class A standards (potable) and supplied
to parts of Mildura. Water used in the backwashing
and treatment operations is diverted and supplied to
Mildura Rural City Council for irrigation of the
Aerodrome Ovals sporting complex
• West Mildura Water Treatment Plant—reclaimed
water from the backwashing and treatment
operations is supplied to Mildura Golf Club for the
irrigation of its fairways and greens
• Irrigation drainage—water collected by our irrigation
drainage system is utilised by a number of
individuals for various purposes, ranging from
pasture and crop production through to amenity
supply.
Environmental Flows We work with the Mallee Catchment Management
Authority (MCMA) to provide environmental water
delivery under the Victorian Environmental Water
Holder (VEWH) Seasonal Watering Plans. Under the
direction of MCMA we use our irrigation and drainage
assets to provide water to various regional wetlands
and floodplains in order to maintain and improve their
environmental health. During the 2015/16 period, we
delivered 953.6 ML to Cardross Basins and 506.8ML to
Lake Hawthorn. In addition, 18ML of outfall water was
supplied to Lake Koorlong.
Environmental water is used to achieve environmental
outcomes, including the protection of the Murray
Hardyhead fish and assisting the restoration of salt
affected wetlands. We work closely with MCMA to ensure
environmental water is provided in accordance with the
Environmental Water Delivery Plans. At the same time
we balance the needs of irrigators to ensure that their
access to water is not compromised.
The Efficiency of Irrigation Systems
The Sunraysia Modernisation Project (SMP) is an
irrigation renewal project which has modernised the
irrigation systems in the Mildura, Red Cliffs and
Merbein irrigation districts; allowing water to be
delivered 365 days per year to irrigators in more than
two thirds of the Sunraysia District. During
construction, it created an estimated 180 jobs in the
local area. Works have included upgrading of pump
stations, replacing sections of channels with pipelines,
installing modern metering systems and upgrading
regulators. The SMP funding consisted of $120 million,
with the Commonwealth Government providing $103
million with $17 million coming from our funded capital
works budget.
Construction began in early 2014 and was completed by
September 2016. Metering modernisation has improved
the operation of the irrigation system and made real-
time metering information available for irrigation
customers. A total of 2,460 Domestic and Stock meters
and 2,140 irrigation meters were upgraded and/or
installed as part of the project. Seven gigalitres (7GL)
of water per year has been saved as a result of the
metering upgrades and channel replacements.
The SMP Project has been able to more than double the
scope of channel replaced by pipeline within the
original budget:
• Merbein—Original scope of 5.3km of channel to
pipeline, extended to 7.2km of channel to
pipeline (100% of the Merbein District will be
365 days per year supply)
• Mildura— Extended scope of 5.4 km of channel to
pipeline (50% of the Mildura District will be 365
days per year supply)
• Red Cliffs— Original Scope of 3 km of channel to
pipeline, extending to 7 km of channel to pipeline
(90% of the Red Cliffs District will be 365 days
per year supply).
Water Supply Demand Strategy (WSDS) The WSDS was endorsed by our Board in March 2012.
The key focus of this strategy is the purchasing of
water entitlements to cover urban water usage in the
future.
Committing to the Environment and Region

Lower Murray Water Annual Report 2015/16 22
Sustainable/Resilient Water Services
Systems
Community Education and Water Awareness
Campaigns
“Flush Facts” Campaign In October 2015 we launched an educational campaign to
assist in the combatting of the large amount of incorrect
items, particularly ‘flushable’ wipes, being flushed. The
campaign included a six week print advertising
component, website content, social media clips and
signage on a shipping container at a prominent road
intersection, along with provision of posters and flyers
to schools and doctor’s surgeries.
Giveaway and Exchange Programs Through community water efficient product exchanges,
we aim to raise awareness of water issues and promote
the wise use of potable water. We have ongoing
exchange programs which operate throughout the year,
including trigger nozzles and showerheads.
“Prepare for Dry” Campaign
In conjunction with Goulburn-Murray Water and the
State Government, we promoted the “Prepare for Dry”
campaign, encouraging rural water users to prepare for
the then-expected average to dry 2016/17 season. The
campaign included print media March to April 2016,
social media and website information updates.
Rehydrate With Cool, Clean Tap Water Campaign Since 2013 we have assisted 46 sporting clubs through
the provision of 2,825 water bottles promoting the drink
tap water message.
Rural Water Awards Following the success of the awards in 2014 we have
partnered with Southern Rural Water, Grampians
Wimmera Mallee, Coliban Water, Vic Water, Victorian
Farmers Federation (VFF) and the Department of
Environment, Land, Water and Planning (DELWP) to hold
the 2016 Rural Water Awards. The awards seek to
recognise and reward Victorian Rural Water users who
are demonstrating new and innovative methods or use of
technology, water volume savings or increased
productivity and return on investment. Nominations are
open in the following categories:
1. Irrigation district water users
2. Groundwater users
3. Surface water users
4. Community and education groups
Nominations will close on 29th August 2016 and finalists
and category winners will be recognised at a gala
luncheon to be held in Melbourne in early December.
School Education Programs In addition to responding to individual teacher
requests for classroom presentations, visits to our
water treatment plant or provision of classroom
resources to suit particular curriculum activities, we
have participated in a range of educational events; and
continue to provide our “Dripster” program to schools.
Dripster’s Super Water Saver Education
Program Launched in September 2011, this education program
has been very popular. The program has four sections:
Wonders of Water, The Water Cycle, How Water Works
From Raw to Ready and back again (the wastewater
process). In response to feedback from teachers the
program is updated and refreshed as required. Sections
of the full program are available as modules, with two
modules each available for the year groups of Prep,
Years 1-2, Years 3-4 and Years 5-6. In addition, a table
top version of the popular “Dripster Super Water
Saving Game” is available for schools to borrow. In
2015/16 we updated the program to include components
of our “Flush Facts” community educational program,
giving students (and teachers) an insight into how the
sewer system works and what should not be flushed
down the toilet or enter drains.
Interactive Environmental Primary School
Activity In conjunction with MRCC, Riverwatch, Waterwatch,
Landcare, EnviroEdu, Loddon Mallee Waste and Resource
Recovery Group, Mallee Catchment Management
Authority (MCMA), Murray-Darling Freshwater Research
Centre, Local Land Services Western and NSW Maritime,
we held an interactive event on the student free entry
day of the Mildura Show (Thursday 15th October 2015).
During the event, 422 students ranging from Prep to
Grade 6 participated in multiple activities. At the
conclusion of their hour, each child collected a show
bag of items relating to the activities and agencies
involved in the day. We were the coordinating agency
for the event and in addition we ran our interactive life
-size board game “Water Wisdom with Dripster”.
National Water Week Poster Competition As part of the celebrations of National Water Week
2015, we encouraged all primary schools in our service
region to take part in the national poster competition.
As an added incentive, 12 local artworks were chosen to
develop a calendar which was then distributed to
schools early in the 2016 school year. In the 2015
competition we received over 450 entries from seven
schools in our service area. We were delighted the
Grade 5-6 poster we submitted to State judging
received the State runner up prize.
Committing to the Environment and Region

Lower Murray Water Annual Report 2015/16 23
Welcome to Preps 2016 Our program to educate the new generation of school
students who commenced Prep in 2016 began in
November 2015 with 90% of schools in our service
region responding to our offer of a cooler bag and
450ml drink bottle set for each enrolled Prep child.
This resulted in us providing 1,156 bag/bottle sets, in
most cases in time for the school’s Prep orientation
days. A swing tag was attached to each of the sets
combining the messages of rehydration, healthy eating
and waste minimisation. We plan to offer this program
again in late 2016 for the 2017 Prep intake.
World Environment Day On Friday 3rd June we took part in an event to mark
World Environment Day. Arranged by Mildura Rural
City Council (MRCC), Lower Murray Water, along with
Loddon Mallee Waste Resource Recovery Group and
EnviroEdu, each conducted an activity for
approximately 160 primary school students; in six
sessions of 20 minutes. Our activity was our life-size
Dripster game, with the questions relating to our
“Flush Facts” campaign. With one set of questions, the
students were asked if a statement was true or false;
and a correct answer meant they could li� the lid on
our display toilet and select a ‘stress shape’ frog. The
reaction to both the game and the ‘lucky dip toilet’ was
terrific.
Seniors’ Festival Event Following the very successful a�ernoon tea event in
2014, in conjunction with MRCC’s annual Seniors’
Festival in October 2015, we held a free event for 50
seniors which included presentations by guest
speakers and tours of our water wise gardens. All
attendees were provided with a ‘goody bag’ containing
water wise products, information and vouchers from
local businesses. The event was well received and is
now on our annual calendar, to be next held again on
Thursday 6th October 2016.
Sponsorship and Donation Program We continue to support our region through our
Sponsorship and Donation Program. Not for profit
groups and businesses conducting events for
charitable fundraising purposes are able to apply for
support for their activities or events. In the 2015/16
year we supported 57 organisations through a
combination of cash sponsorships, staff attendance, in-
kind support and the provision of merchandise.
Other Statutory Obligations
Regional Catchment Strategy The Mallee Regional Catchment Strategy (RCS) 2013-19
is the key regional planning instrument. It provides
guidance on works and developments impacting land
and water values across the Mallee. We will continue to
assist in the implementation of the Mallee RCS, working
with the Mallee Catchment Management Authority on
approvals for new irrigation developments, salinity
management and environmental projects, and
participating in committees that provide technical
support and monitor the projects emanating from the
Regional Catchment Strategy.
Victorian Biodiversity Strategy We manage a number of sites that are located in areas
having high conservation values. These sites are
subject to ongoing works aimed at controlling the
abundance of pest plants and animals to ensure their
native species populations remain viable and resilient.
Sites under our management include:
• Benetook Offset Site – Located near Lake Koorlong
this 25 hectare site has been subject to intensive
conservation over the last decade. All major pest
animal and weed species have been removed allowing
native species to re-establish. The site remains
under ongoing management to ensure its
conservation values are retained
• Koorlong Wastewater Treatment Plant - a 21 hectare
section of old-growth mallee located within the
grounds of the Koorlong Wastewater Treatment Plant
and secured under the Bushbroker scheme is
managed by us to ensure it remains free of weeds
and animal pest species
• West Mildura Water Treatment Plant – a 15 hectare
area to the south of the plant facilities is home to a
population of legless lizards (Pygopus schraderi), one
of only six locations in Victoria where they are
known to exist. In addition to ongoing weed control
at the site we conduct feral animal control to reduce
predatory pressure on the lizards
• Fosters Swamp, Kerang – we assisted various local
and state agencies with the conversion of Fosters
Swamp to a State Game Reserve.
Victorian Waterway Management Strategy
(VWMS) We strive to achieve healthy rivers, streams and
floodplains through our own works and by supporting
our partner agencies. The VWMS provides an integrated
framework for management and policy direction for
waterway health across the state. The VWMS has
informed the development of the Mallee Regional
Waterway Strategy 2014-22, of which we are a partner
in the delivery of the works program.
Committing to the Environment and Region
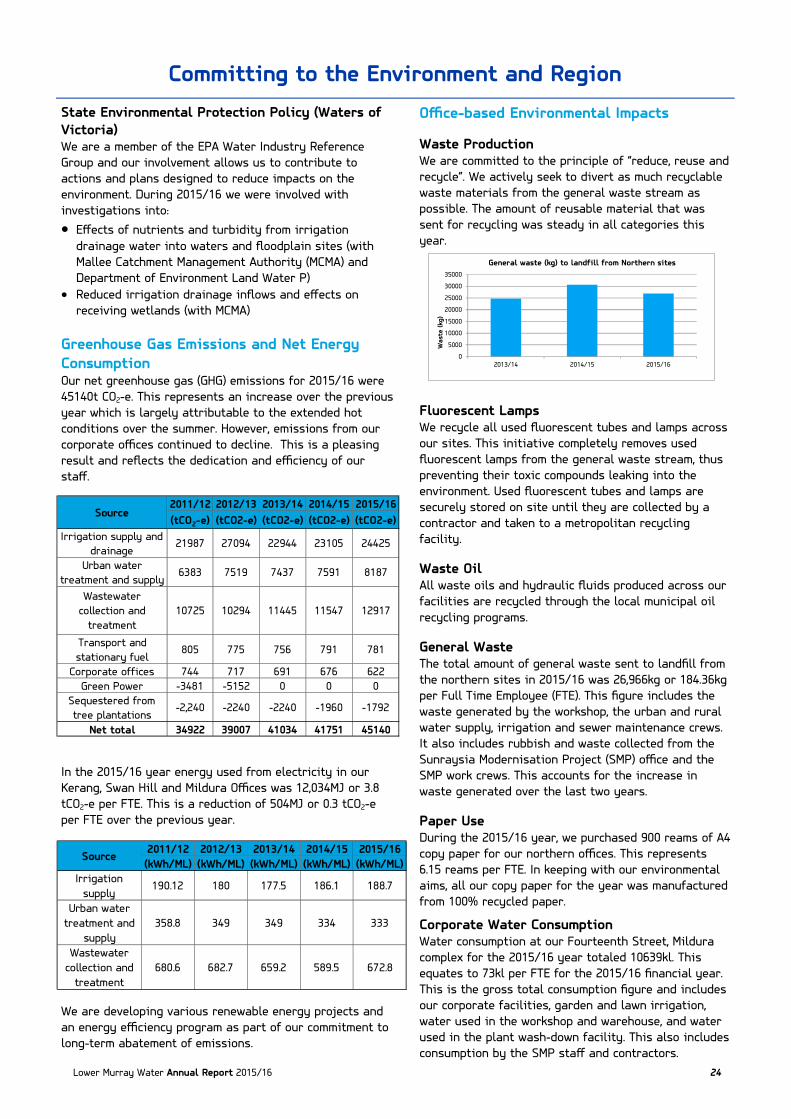
Lower Murray Water Annual Report 2015/16 24
Committing to the Environment and Region
State Environmental Protection Policy (Waters of
Victoria) We are a member of the EPA Water Industry Reference
Group and our involvement allows us to contribute to
actions and plans designed to reduce impacts on the
environment. During 2015/16 we were involved with
investigations into:
• Effects of nutrients and turbidity from irrigation
drainage water into waters and floodplain sites (with
Mallee Catchment Management Authority (MCMA) and
Department of Environment Land Water P)
• Reduced irrigation drainage inflows and effects on
receiving wetlands (with MCMA)
Greenhouse Gas Emissions and Net Energy
Consumption Our net greenhouse gas (GHG) emissions for 2015/16 were
45140t CO2-e. This represents an increase over the previous
year which is largely attributable to the extended hot
conditions over the summer. However, emissions from our
corporate offices continued to decline. This is a pleasing
result and reflects the dedication and efficiency of our
staff.
In the 2015/16 year energy used from electricity in our
Kerang, Swan Hill and Mildura Offices was 12,034MJ or 3.8
tCO2-e per FTE. This is a reduction of 504MJ or 0.3 tCO2-e
per FTE over the previous year.
We are developing various renewable energy projects and
an energy efficiency program as part of our commitment to
long-term abatement of emissions.
Office-based Environmental Impacts
Waste Production We are committed to the principle of “reduce, reuse and
recycle”. We actively seek to divert as much recyclable
waste materials from the general waste stream as
possible. The amount of reusable material that was
sent for recycling was steady in all categories this
year.
Fluorescent Lamps We recycle all used fluorescent tubes and lamps across
our sites. This initiative completely removes used
fluorescent lamps from the general waste stream, thus
preventing their toxic compounds leaking into the
environment. Used fluorescent tubes and lamps are
securely stored on site until they are collected by a
contractor and taken to a metropolitan recycling
facility.
Waste Oil All waste oils and hydraulic fluids produced across our
facilities are recycled through the local municipal oil
recycling programs.
General Waste The total amount of general waste sent to landfill from
the northern sites in 2015/16 was 26,966kg or 184.36kg
per Full Time Employee (FTE). This figure includes the
waste generated by the workshop, the urban and rural
water supply, irrigation and sewer maintenance crews.
It also includes rubbish and waste collected from the
Sunraysia Modernisation Project (SMP) office and the
SMP work crews. This accounts for the increase in
waste generated over the last two years.
Paper Use During the 2015/16 year, we purchased 900 reams of A4
copy paper for our northern offices. This represents
6.15 reams per FTE. In keeping with our environmental
aims, all our copy paper for the year was manufactured
from 100% recycled paper.
Corporate Water Consumption Water consumption at our Fourteenth Street, Mildura
complex for the 2015/16 year totaled 10639kl. This
equates to 73kl per FTE for the 2015/16 financial year.
This is the gross total consumption figure and includes
our corporate facilities, garden and lawn irrigation,
water used in the workshop and warehouse, and water
used in the plant wash-down facility. This also includes
consumption by the SMP staff and contractors.
2011/12 2012/13 2013/14 2014/15 2015/16
(tCO2-e) (tCO2-e) (tCO2-e) (tCO2-e) (tCO2-e)
Irrigation supply and
drainage21987 27094 22944 23105 24425
Urban water
treatment and supply6383 7519 7437 7591 8187
Transport and
stationary fuel805 775 756 791 781
Corporate offices 744 717 691 676 622
Green Power -3481 -5152 0 0 0
Sequestered from
tree plantations-2,240 -2240 -2240 -1960 -1792
Net total 34922 39007 41034 41751 45140
1291711547
Source
Wastewater
collection and
treatment
10725 10294 11445
0
5000
10000
15000
20000
25000
30000
35000
2013/14 2014/15 2015/16
Wast
e (kg
)
General waste (kg) to landfill from Northern sites
2011/12 2012/13 2013/14 2014/15 2015/16
(kWh/ML) (kWh/ML) (kWh/ML) (kWh/ML) (kWh/ML)
Irrigation
supply190.12 180 177.5 186.1 188.7
Urban water
treatment and
supply
358.8 349 349 334 333
Wastewater
collection and
treatment
680.6 682.7 659.2 589.5 672.8
Source

Lower Murray Water Annual Report 2015/16 25
Recyclables We continued our emphasis on recycling during
2015/16. Our goal is to divert as much recyclable
waste from the general waste stream as possible. Our
waste procedure is continuously monitored and new
opportunities for recycling are adopted as and when
they arise.
At our Fourteenth Street office in Mildura, 6455kg of
waste was sent for recycling. This figure represents
the combined total of the commingle waste as well as
paper and cardboard. It does not include any other
recycled wastes. The amount of waste recycled
represents 19% of the total amount of waste
generated.
We are a participant in the drumMUSTER program. This
important volunteer initiative seeks to divert chemical
drums from the general waste stream. Empty drums
are appropriately cleaned, rinsed and stockpiled for
collection by drumMUSTER. Drums are then reused by
industry. During 2015/16, 32 drums were delivered to
drumMUSTER.
Volume of recycled waste produced at the
Fourteenth street complex
Batteries and scrap metal produced as part of water
supply operations
*Fluorescent lamps are still awaiting collection. Final
figures have not yet been determined
Transportation The total kilometres traveled by our vehicle fleet
during 2015/16 was 1,533,719 km. Based on the fuel
usage, the energy consumption for the diesel fleet was
8309GJ and 2401GJ for the unleaded fleet, equivalent
to 405tCO2-e total (0.26tCO2-e per 1000km). We
continue to encourage alternatives to private vehicle
use for commuting to and from work, although options
are limited due to limited availability of public
transport. We encourage our staff to cycle to work if
possible and we provide support for cyclists with a
dedicated bicycle facility. Cyclists have access to a
secure bike storage area and a basic workshop to
carry out minor repairs.
Committing to the Environment and Region
Value of Community
Service Obligation
provided
2014/15 2015/16
Concessions to Pensioners 2,067,491.64 2,154,823.03
Rebates paid to not-for-
profit organisations under
the water and sewerage
rebate scheme
161,345.34 159,027.71
Utility Relief Grants Scheme 13,226.34 12,376.12
Haemodialysis Life Support
Machine Water Concessions
356.51 1,060.42
Hardship Relief Grant
Scheme for Sewerage
Connections
# #
TOTAL 2,242,419.83 2,327,287.28
Procurement Our Procurement Policy provides all staff members with
clear direction in relation to purchasing and procurement
of goods and services across the Corporation.
The policy aims to:
• Ensure purchases are made in an open, fair and
transparent manner
• Deliver best value
• Ensure open and effective competition
• Support environmental procurement and sustainability
• Appropriately manage risk
• Promote efficient purchasing practices and their
continuous improvement
• Encourage local suppliers and manufacturers
Water Cycle We promote the water cycle to school children as a part of
our community education in schools program.
Social Sustainability
Meeting our Community Service Obligations
# figures are not available to Lower Murray Water (payments go
directly to plumber if customer is successful)
Recycled Waste 2011/12 2012/13 2013/14 2014/15 2015/16
Commingled (kg) 1084 1384 1793 1709 1657
Paper (kg) 7073 4157 8492 4301 4798
Printer Cart. (kg) 34.1 68.72 60.32 70.12 66.68
Batteries (kg) 2470 1845 2002 3867 3380
Scrap Metal (kg) 71340 12120 38373 58973 35560
Styrofoam (m3) 9 12 13 14.25 7.5
Fluorescent Lamps (kg) - 54 ~60* ~120* ~180*
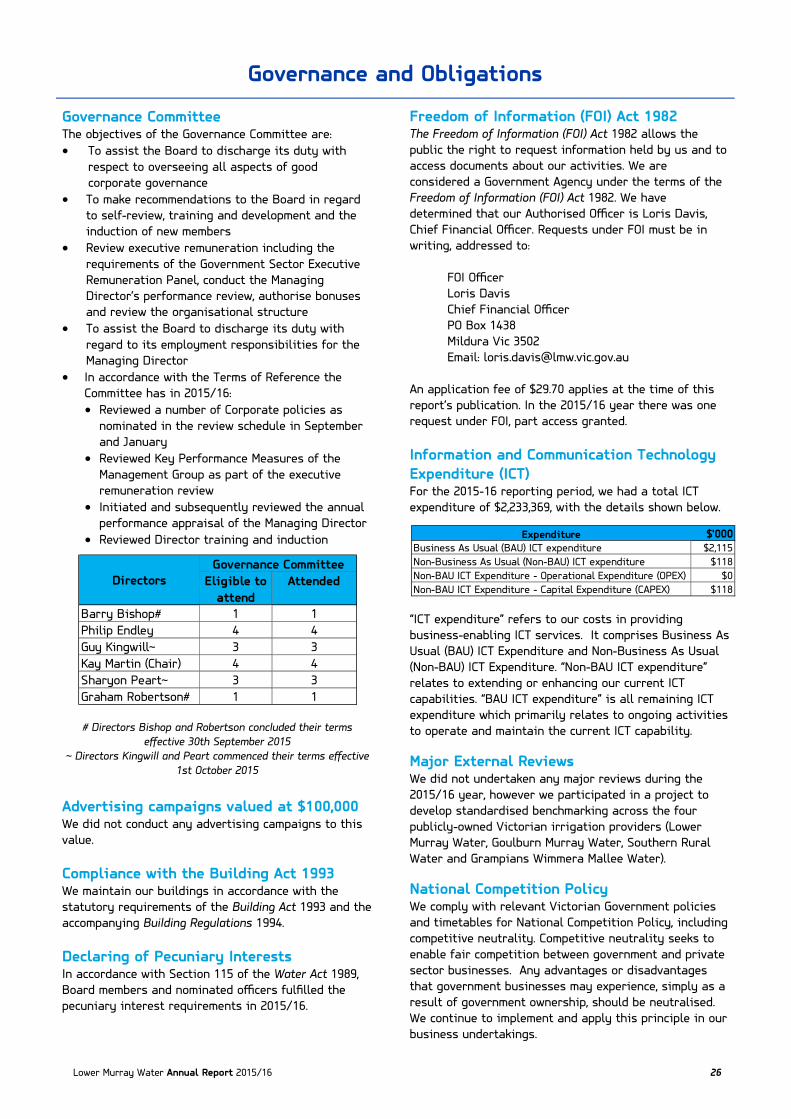
Lower Murray Water Annual Report 2015/16 26
Governance and Obligations
Governance Committee The objectives of the Governance Committee are:
• To assist the Board to discharge its duty with
respect to overseeing all aspects of good
corporate governance
• To make recommendations to the Board in regard
to self-review, training and development and the
induction of new members
• Review executive remuneration including the
requirements of the Government Sector Executive
Remuneration Panel, conduct the Managing
Director’s performance review, authorise bonuses
and review the organisational structure
• To assist the Board to discharge its duty with
regard to its employment responsibilities for the
Managing Director
• In accordance with the Terms of Reference the
Committee has in 2015/16:
• Reviewed a number of Corporate policies as
nominated in the review schedule in September
and January
• Reviewed Key Performance Measures of the
Management Group as part of the executive
remuneration review
• Initiated and subsequently reviewed the annual
performance appraisal of the Managing Director
• Reviewed Director training and induction
# Directors Bishop and Robertson concluded their terms
effective 30th September 2015
~ Directors Kingwill and Peart commenced their terms effective
1st October 2015
Advertising campaigns valued at $100,000 We did not conduct any advertising campaigns to this
value.
Compliance with the Building Act 1993 We maintain our buildings in accordance with the
statutory requirements of the Building Act 1993 and the
accompanying Building Regulations 1994.
Declaring of Pecuniary Interests In accordance with Section 115 of the Water Act 1989,
Board members and nominated officers fulfilled the
pecuniary interest requirements in 2015/16.
Freedom of Information (FOI) Act 1982 The Freedom of Information (FOI) Act 1982 allows the
public the right to request information held by us and to
access documents about our activities. We are
considered a Government Agency under the terms of the
Freedom of Information (FOI) Act 1982. We have
determined that our Authorised Officer is Loris Davis,
Chief Financial Officer. Requests under FOI must be in
writing, addressed to:
FOI Officer
Loris Davis
Chief Financial Officer
PO Box 1438
Mildura Vic 3502
Email: [email protected]
An application fee of $29.70 applies at the time of this
report’s publication. In the 2015/16 year there was one
request under FOI, part access granted.
Information and Communication Technology
Expenditure (ICT) For the 2015-16 reporting period, we had a total ICT
expenditure of $2,233,369, with the details shown below.
“ICT expenditure” refers to our costs in providing
business-enabling ICT services. It comprises Business As
Usual (BAU) ICT Expenditure and Non-Business As Usual
(Non-BAU) ICT Expenditure. “Non-BAU ICT expenditure”
relates to extending or enhancing our current ICT
capabilities. “BAU ICT expenditure” is all remaining ICT
expenditure which primarily relates to ongoing activities
to operate and maintain the current ICT capability.
Major External Reviews We did not undertaken any major reviews during the
2015/16 year, however we participated in a project to
develop standardised benchmarking across the four
publicly-owned Victorian irrigation providers (Lower
Murray Water, Goulburn Murray Water, Southern Rural
Water and Grampians Wimmera Mallee Water).
National Competition Policy We comply with relevant Victorian Government policies
and timetables for National Competition Policy, including
competitive neutrality. Competitive neutrality seeks to
enable fair competition between government and private
sector businesses. Any advantages or disadvantages
that government businesses may experience, simply as a
result of government ownership, should be neutralised.
We continue to implement and apply this principle in our
business undertakings.
Expenditure $'000Business As Usual (BAU) ICT expenditure $2,115
Non-Business As Usual (Non-BAU) ICT expenditure $118
Non-BAU ICT Expenditure - Operational Expenditure (OPEX) $0
Non-BAU ICT Expenditure - Capital Expenditure (CAPEX) $118Eligible to
attend
Attended
Barry Bishop# 1 1
Philip Endley 4 4
Guy Kingwill~ 3 3
Kay Martin (Chair) 4 4
Sharyon Peart~ 3 3
Graham Robertson# 1 1
Governance Committee
Directors
Lower Murray Water Annual Report 2015/16 27
Risk Management Framework and Processes I, John Tesoriero, certify that Lower Murray Urban and
Rural Water Corporation has partially complied with the
Ministerial Standing Direction 4.5.5 – Risk Management
Framework and Processes. The Lower Murray Urban and
Rural Water Corporation Audit and Risk Committee
verifies this.
We have a risk management framework in place
consistent with the national standard AS/NZS ISO
31000:2009 Risk Management – Principles and Guidelines.
The framework is to be continuously improved in
2016-18 so that higher levels of risk maturity are
achieved. The improvements include:
• the way the framework is documented and
communicated
• the quality of risk assessments and risk treatments
• better understanding of our risk profile and
development of risk appetite
• integration of risk management into our normal
business processes
• risk monitoring and reporting.
We have considered inter-agency and State significant
risks but is not yet self-assessing that it has achieved
full compliance. Based on agency risks identified, we
have commenced developing plans to address inter-
agency and State significant risks, including consulting
other agencies and DELWP. It is understood the DELWP
is consulting with the Department of Treasury and
Finance.
We believe that it will require coordinated assistance
across water corporations and government to achieve
full compliance to define these two new risk areas. In
respect to inter-agency and State significant risks, we
intend to work with other water corporations and with
DELWP to progressively identify these risks.
John Tesoriero
Chair
7th September 2016
Governance and Obligations
Other Reportable Information Subject to the provisions of the Freedom of Information
Act 1982 and Privacy and Data Protection Act 2014, all
relevant information required under the Financial
Management Act 1994 is available upon request.
Privacy and Data Protection Act 2014 Protection of privacy and personal and health
information is an important aspect of our operations.
We are bound to comply with the Privacy and Data
Protection Act 2014, the Health Records Act 2001 and
the Charter of Human Rights & Responsibilities Act 2006.
Our privacy and data protection policy and privacy
charter are available at www.lmw.vic.gov.au and upon
request. The website home page can be accessed, and
this site browsed, without disclosing personal
information. The site does not use cookies.
Protected Disclosures Act 2012 We are committed to the aims and objectives of the
Protected Disclosures Act 2012 which is designed to
protect people who disclose information about serious
wrongdoings with the Victorian Public Sector and
provides a framework for the investigation of these
matters. We are not a public organisation under the
Act to receive a protected disclosure, so disclosures
about us, our employees, officers or members must be
made directly to the Independent Broad-based
Anti-corruption Commission (IBAC):
Address: GPO Box 24234, Melbourne Vic 3001
Website: www.ibac.vic.gov.au
Phone: 1300 735 135
Although we are not able to receive disclosures, we
have in place a procedure, as required under Section 58
of the Act, setting out how we will protect people
against detrimental action that might be taken against
them in reprisal for making a protected disclosure or
cooperating in an investigation into a protected
disclosure complaint. You can access our procedure at
www.lmw.vic.gov.au There were no disclosures under
the Act in 2015/16.

Lower Murray Water Annual Report 2015/16 28
Audit and Risk Committee Our Audit and Risk Committee assists the Board in
fulfilling our corporate governance responsibilities by
reviewing matters relating to financial management and
operational control practices, financial reporting and
auditing functions. This committee also reviews compliance
with relevant legislation and regulation, including our risk
management systems.
Through our rolling three year internal audit program, the
Audit and Risk Committee is able to review and evaluate
the effectiveness of controls and practices. At 30th June
2016, the Committee comprised Cheryl Rix (Chair), Jason
Kambovski, Liza McDonald, Tony Mathews and Glen Hornsby,
an external appointment to the Committee. The Committee
met on five occasions in 2015/16. All committee minutes
are included in the next Board of Directors’ monthly
meeting agenda. The Committee meets the requirements of
the Financial Management Compliance Framework.
# Director Bennett concluded his term effective
30th September 2015
~ Directors Kambovski and McDonald commenced their terms
effective 1st October 2015
Statement of Availability of Other Information Subject to the Freedom of Information Act 1982, the
following information, if not already disclosed within this
report, is available on request:
• details of:
• shares held by a senior officer as nominee or held
beneficially in a statutory Corporation/authority or
subsidiary
• publications produced by ourselves about Lower
Murray Water, and how these can be obtained;
• changes in prices, fees, charges, rates and levies
charged by us
• overseas visits undertaken including a summary of the
objectives and outcomes of each visit
• major promotional, public relations and marketing
activities undertaken by us to develop community
awareness of Lower Murray Water and our services
• assessments and measures undertaken to improve the
occupational health and safety of employees
Statement of availability of other
information (continued) • a general statement on industrial relations within
Lower Murray Water and details of time lost
through industrial accidents and disputes
• a statement that declarations of pecuniary
interests have been duly completed by all relevant
officers
• a list of major committees sponsored by us, the
purposes of each committee and the extent to
which the purposes have been achieved
• details of major research and development
activities undertaken by the entity
Subsequent Events No event or transaction has occurred subsequent to
year end which may have a significant effect on the
operation of the Corporation, and which has not
already been disclosed elsewhere in this report.
Victorian Industry Participation Policy
The Victoria Industry Participation Policy Act 2003
requires public bodies and departments to report on
the implementations of the Victorian Industry
Participation Policy (VIPP).
Contracts commenced to which VIPP applied: 2
Contracts completed to which VIPP applied: 2
Eligible to
attend
Attended
Malcolm Bennett# 1 1
Jason Kambovski~ 4 3
Tony Mathews 5 4
Liza McDonald~ 4 4
Cheryl Rix (Chair) 5 5
Directors
Audit and Risk Committee
Governance and Obligations

Lower Murray Water Annual Report 2015/16 29
Performance Report
Financial Performance Indicators
Notes:
1a. Income from metered charges was $1.5M above the previous year due to increase in usage as the year was dry
and hot. GST received from the ATO has increased by approximately $1.7M due to our increase in capital
expenditure (mostly attributed to Sunraysia Modernisation Project (SMP).
1b. Income from metered charges was $2M above forecast as the year was dry and hot. GST received from the ATO
was greater than forecast.
2a. Total assets have increased due to our capital works program (attributable to SMP) and the revaluation of land,
buildings and infrastructure assets in a greater proportion to total debt.
2b. The revaluation of land, buildings and infrastructure assets in a greater than forecast. Cash is greater than
forecast by $18M as the SMP project has come under budget. SMP has been extended to utilise all of the funds
which was not forecast.
3a. LMW’s capital expenditure is much greater than the previous year mostly attributable to SMP as seen by the
increase in “Payments for Infrastructure, Property, Plant & Equipment” from $44.3M to $67.7M in the Cash Flow
Statement. Capital expenditure for SMP is substantially funded from Government contributions which are excluded
from “Net operating cash flow less dividends” as the contributions are included in financing activities, so the
relationship between capital expenditure and net operating cash flows skews the ratio result. Once SMP is
completed LMW expects this ratio to result in a lesser size
of variance ongoing.
3b. The better than targeted internal financing ratio is due to the improved actual cash flows than target, GST
received from the ATO was greater than forecast, as well as an increase in metered charges which was $2M above
forecast.
2014-15
Result
2015-16
Result
2015-16
Target
Variance
to Prior
Year
Notes
Variance
to
Target
Notes
7.29 8.79 5.5 20.6% 1a 59.8% 1b
6.88% 5.74% 7.2% -16.6% 2a -20.3% 2b
40.95% 32.18% 26.0% -21.4% 3a 23.8% 3b
2.79 2.02 1.27 -27.6% 4a 59.1% 4b
-0.65% -1.10% -0.6% 69.2% 5a 83.3% 5b
-0.87% -1.18% -0.9% 35.6% 6a 31.1% 6b
30.02% 26.98% 32.2% -10.1% 7a -16.2% 7b
KPI
NumberKey Performance Indicator
F1 Cash Interest CoverNet operating cash flows before net
interest and tax / net interest
payments (times)
F2 Gearing RatioTotal debt (including finance leases) /
total assets x 100
F3 Internal Financing RatioNet operating cash flow less
dividends / net capital expenditure x
100
F4 Current RatioCurrent assets / current liabilities
(excluding long-term employee
provisions and revenue in advance)
F5 Return on AssetsEarnings before net interest and tax
/ average assets x 100
F6 Return on EquityNet profit after tax / average total
equity
x 100
F7 EBITDA MarginEarnings before interest, tax,
depreciation and amortisation / total
revenue x 100
Lower Murray Water Annual Report 2015/16 30
Financial Performance Indicators
Performance Report
Notes continued:
4a. The current ratio is mainly affected by the cash holdings between 2014/15 to 2015/16. LMW received SMP
funding payments of $17M in 2015/16 while $47M in 2014/15 of which $14M remains in the bank for SMP contract
payments. Much of the SMP project was carried out in 2015/16 which is why the cash investment has decreased
significantly.
4b. The current ratio is mainly affected by the cash holdings as at 30 June 2016. Cash is greater than forecast by
$18M as the SMP project has come under budget. SMP has been extended to utilise all of the funds which was not
forecast. Capital works planned for 2015/16 have been pushed into 2016/17 for varying reasons.
5a. The net earnings before interest and tax for 2015/16 is -$12.5M where as in 2014/15 the net earnings was -$5.5M.
The main difference is due to the operating result before tax in 2015/16 being a loss of $12.5M compared to
2014/15 loss of $8.4M. This difference is mainly due to the writing off of $4.3M in assets replaced by SMP for
2015/16 compared to writing off of $3.8M in assets replaced by SMP 2014/15. Going forward LMW expect the
return on assets indicator result to improve as the SMP project is completed. Other differences include the fair
value decrement for buildings of $1.5M in 2015/16.
5b. The net earnings before interest and tax for 2015/16 is -$12.5M whereas the forecast was -$5.4M The main
difference is due to the operating result before tax in 2015/16 being a loss of $12.5M compared to a forecast loss
of $8.8M. This difference is mainly due to the writing off of $4.3M in assets replaced by SMP for 2015/16 and the
fair value decrement for buildings of $1.5M which was not forecast.
6a. The loss a�er tax is greater in 2015/16 than 2014/15, -$9M compared to -$5.8M. This difference is mainly due to
the decrement in fair value of buildings of $1.5M, increased depreciation as the SMP project assets come into use
and the write off of assets replaced by SMP in 2015/16 of $4.3M compared to $3.8M in 2014/15. Looking forward
LMW expect the return on equity indicator result to improve as the SMP project is completed.
6b. The loss a�er tax is greater in 2015/16 than forecast, this is due to the fair value decrement of buildings of
$1.5M and LMW's writing off of assets replaced by SMP. Going forward LMW expect the return on assets indicator
result to improve as the SMP project is completed.
7a. Earnings before Tax, Depreciation and Amortisation is less in 2015/16 than 2014/15, $15M compared to $20.3M
mainly due to SMP asset write offs and the fair value decrement for buildings of $1.5M, while total revenue is
greater in 2015/16 than 2014/15, $68.5M compared to $67.7M. Going forward LMW expect the EBITDA Margin
indicator result to improve as the SMP project is completed.
7b. This difference is mainly due to the writing off of $4.3M in assets replaced by SMP and the fair value decrement
for buildings of $1.5M. Going forward LMW expect the EBITDA Margin indicator result to improve as the SMP
project is completed. Total revenue is greater in 2015/16 than our corporate plan target, $68.5M compared to
$63.4M. Total revenue exceeded the corporate plan mainly due to volumetric revenue with consumption of water
being greater than forecast as it was a dry year and other revenue due to various reasons - other revenue
includes many miscellaneous charges that are difficult to forecast with accuracy.
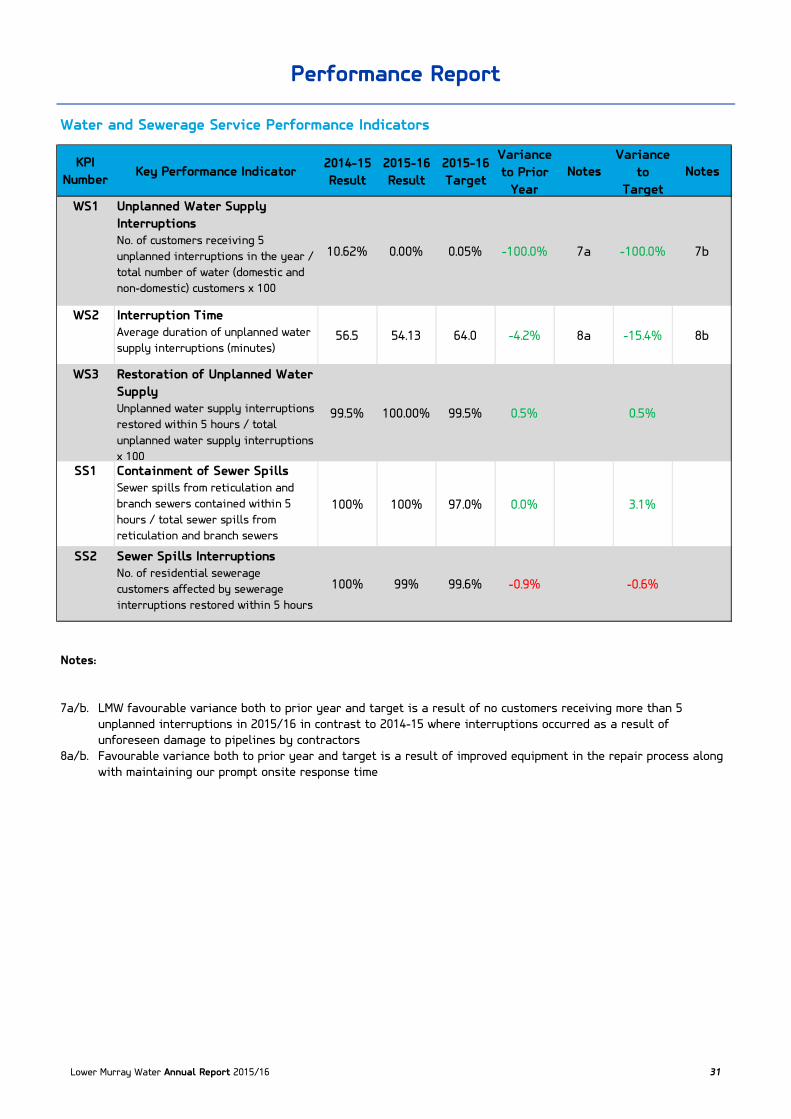
Lower Murray Water Annual Report 2015/16 31
Water and Sewerage Service Performance Indicators
Notes:
7a/b. LMW favourable variance both to prior year and target is a result of no customers receiving more than 5
unplanned interruptions in 2015/16 in contrast to 2014-15 where interruptions occurred as a result of
unforeseen damage to pipelines by contractors
8a/b. Favourable variance both to prior year and target is a result of improved equipment in the repair process along
with maintaining our prompt onsite response time
Performance Report
2014-15
Result
2015-16
Result
2015-16
Target
Variance
to Prior
Year
Notes
Variance
to
Target
Notes
10.62% 0.00% 0.05% -100.0% 7a -100.0% 7b
56.5 54.13 64.0 -4.2% 8a -15.4% 8b
99.5% 100.00% 99.5% 0.5% 0.5%
100% 100% 97.0% 0.0% 3.1%
100% 99% 99.6% -0.9% -0.6%
WS3 Restoration of Unplanned Water
SupplyUnplanned water supply interruptions
restored within 5 hours / total
unplanned water supply interruptions
x 100SS1 Containment of Sewer Spills
Sewer spills from reticulation and
branch sewers contained within 5
hours / total sewer spills from
reticulation and branch sewers
SS2 Sewer Spills InterruptionsNo. of residential sewerage
customers affected by sewerage
interruptions restored within 5 hours
KPI
NumberKey Performance Indicator
WS1 Unplanned Water Supply
InterruptionsNo. of customers receiving 5
unplanned interruptions in the year /
total number of water (domestic and
non-domestic) customers x 100
WS2 Interruption TimeAverage duration of unplanned water
supply interruptions (minutes)

Lower Murray Water Annual Report 2015/16 32
Water (Rural) Service Performance Indicators
Environmental Performance Indicators
Notes:
15a. The previous reported 2014-15 actual result has been restated from 80.7% to 50.5% as a result of LMW
previously reporting the recycled percentage calculation based on the total influent of those waste water
treatment plants that have recycled schemes only. The requirement to report on aggregated totals has meant
that the reuse percentage is now calculated based on the total recycled volume from all the waste water
treatment plants in relation to the total influent treated.
15b. Unfavourable variance to target is the result of six (6) waste water treatment plants not having recycling
schemes, this treated waste water constitutes 32.4% of the total waste water treated at the plants and is
disposed through evaporation. The 18.7% of unused waste water accounts for evaporation losses from the
reactors, balance ponds, recycling ponds, and sludge lagoons and includes the solids component of the
disposed sludge.
16a. Unfavourable variance to prior year is a result of an unseasonal hot and dry summer that saw an increase to
customers demand of irrigation and treated water, wastewater volumes are also higher than expected which in
turn escalated our electricity consumption for the year.
16b. Unfavourable variance to target result is due to the forecast emission target not allowing for unexpected hot
and dry climate conditions
Performance Report
Notes:
9b. Favourable variance to target is a result of the Sunraysia Modernisation Project, our target was lower than
normal due to major works planned and consideration of possible interruptions to ordered deliveries
10a/b. LMW does not process transfers from groundwater supplies
2014-15
Result
2015-16
Result
2015-16
Target
Variance
to Prior
Year
Notes
Variance
to
Target
Notes
50.50% 48.90% 100.0% -3.2% 15a -51.1% 15b
41,751 45,140 36,850 8.1% 16a 22.5% 16b
KPI
NumberKey Performance Indicator
E1 Effluent Re-Use Volume (End
Use)
E2 Total Net CO2 Emissions
Net tonnes CO2 equivalent
2014-15
Result
2015-16
Result
2015-16
Target
Variance
to Prior
Year
Notes
Variance
to
Target
Notes
99.89% 99.85% 95.0% 0.0% 5.1% 9b
0.0% 0.0% 0.0% 0.0% 0.0%
0.0% 0.0% 0.0% N/A 10a N/A 10b
WSR3 Groundwater Supply
Number of transfers processed within
target period / total number of
transfers processed x 100
KPI
NumberKey Performance Indicator
WSR1 Rural Water Supply Deliveries
Number of orders delivered / total
number of orders x 100
WSR2 Unavailability of Domestic and
Stock Supply
Duration that domestic and stock
service is unavailable in excess of
on-property storage

Lower Murray Water Annual Report 2015/16 33
Customer Responsiveness Performance Indicators
Notes:
11a. Unfavourable variance to prior year is a result of an increase of eight (8) complaints from 2014-15. LMW
undertook customer home visits to investigate complaints and found that the water quality had returned to
normal on most occasions. Mains flushing was undertaken as a precaution and further investigations revealed
no faults within the network. Two (2) customers had hot water system faults causing discolouration.
11b. The favourable variance to target result was less based on the average of water quality complaints over the
past five (5) years. The average still includes the 2011 Black Water Event and Scouring in 2012 which resulted in
an increase at that time. It is expected that our average target will become relative to normal climate
conditions in the future.
12a. Unfavourable variance to prior year is a result of unplanned root and fat blockages in the Southern Region. Our
maintenance crews routinely undertake sewer foaming and jetting programs to reduce blockages within the
system to maintain network performance.
12b. Unfavourable forecast target is indicative of our historical trend of generally no more than 2 complaints per
year. LMW continues to improve its sewer network by undertaking an annual mains replacement programs and
CCTV monitoring.
13a. "Unfavourable variance to prior year is a result of an unusual increase in sewer odours complaints this year
seventeen (17) compared with eight (8) last year. Southern Region customers reported four (4) complaints
regarding a sewer pump station, that resulted in an investigation which warranted no further action as the
odours were unrelated. An additional three (3) complaints related to separate sites which were resolved by
undertaking minor maintenance works such as installing filters and adjusting inflows into a manhole. Northern
Region customers reported four (4) complaints that were directly related to a wet weather storage lagoon which
upon investigation was sludge related and treated by aeration and chemical treatment. Three (3) were
attributed to odours blowing from an unrelated drying bed (Lake Hawthorn) and two (2) other individual
complaints were rectified by a filter change on a vent and redirecting flows.
13b. LMW's unfavourable variance to target can be attributed to the seven (7) complaints that were unrelated to our
systems, this has otherwise overstated the actual results to target.
14a. The unfavourable variance to prior year result saw a slight increase of two (2) billing complaints to nine (9) up
from the previous year number of seven (7) no significant events can be attributed to this.
14b. Favourable variance to target still includes the high number of complaints received during the 2011 floods and
2012 dry weather conditions , this still distorts the average as the last couple of years have seen a reduction in
billing complaints.
Performance Report
2014-15
Result
2015-16
Result
2015-16
Target
Variance
to Prior
Year
Notes
Variance
to
Target
Notes
0.063 0.087 0.134 38.1% 11a -35.1% 11b
0.007 0.024 0.007 242.9% 12a 242.9% 12b
0.028 0.059 0.012 110.7% 13a 391.7% 13b
0.021 0.027 0.223 28.6% 14a -87.9% 14b
KPI
NumberKey Performance Indicator
CR1 Water Quality ComplaintsNo. of complaints per 100 customers
CR2 Sewerage Service Quality
ComplaintsNo. of complaints per 100 customers
CR3 Sewer Odour Complaints
No. of complaints per 100
customersCR4 Billing ComplaintsNo. of complaints per 100 customers
Lower Murray Water Annual Report 2015/16 34
Performance Report
Certification of Performance Report for 2015/16
We certify that the accompanying Performance Report of Lower Murray Urban and Rural Water Corporation
in respect of the 2015/16 financial year is presented fairly in accordance with the Financial Management
Act 1994.
The Performance Report outlines the relevant performance indicators for the financial year as determined
by the responsible Minister and as set out in the 2015/16 Corporate Plan, the actual and comparative
results achieved for the financial year against predetermined performance targets and these indicators,
and an explanation of any significant variance between the actual results and performance targets and/or
between the actual results in the current year and the previous year.
As at the date of signing, we are not aware of any circumstances which would render any particulars in the
Performance Report to be misleading or inaccurate.
John Tesoriero
Chair
Phillip Endley
Managing Director
Loris Davis
General Manager – Business Services
(Chief Finance and Accounting Officer)
Dated this seventh day of September 2016
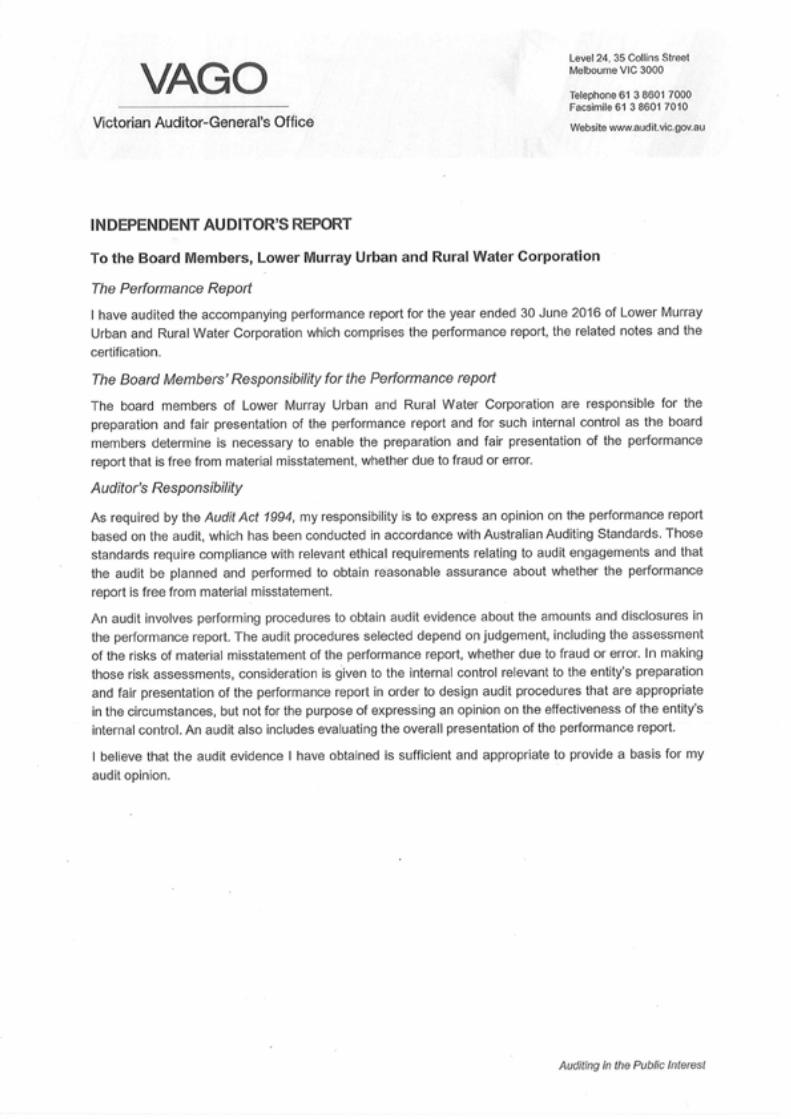

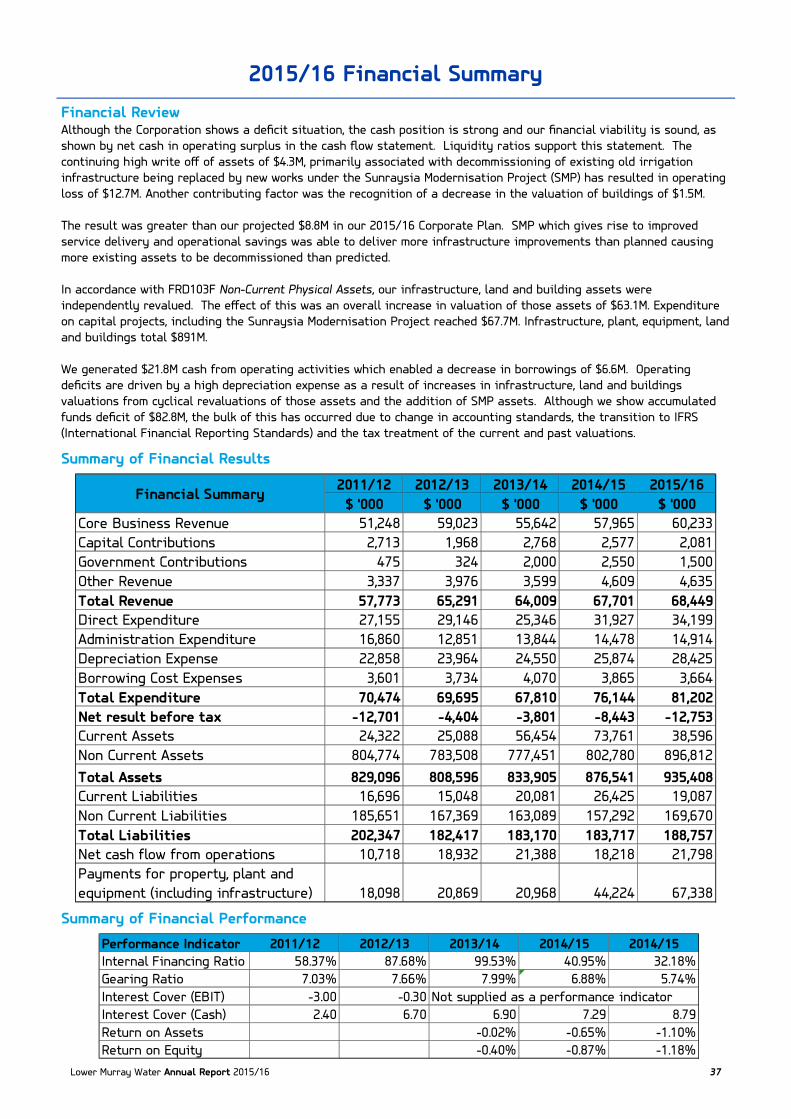
Lower Murray Water Annual Report 2015/16 37
Financial Review Although the Corporation shows a deficit situation, the cash position is strong and our financial viability is sound, as
shown by net cash in operating surplus in the cash flow statement. Liquidity ratios support this statement. The
continuing high write off of assets of $4.3M, primarily associated with decommissioning of existing old irrigation
infrastructure being replaced by new works under the Sunraysia Modernisation Project (SMP) has resulted in operating
loss of $12.7M. Another contributing factor was the recognition of a decrease in the valuation of buildings of $1.5M.
The result was greater than our projected $8.8M in our 2015/16 Corporate Plan. SMP which gives rise to improved
service delivery and operational savings was able to deliver more infrastructure improvements than planned causing
more existing assets to be decommissioned than predicted.
In accordance with FRD103F Non-Current Physical Assets, our infrastructure, land and building assets were
independently revalued. The effect of this was an overall increase in valuation of those assets of $63.1M. Expenditure
on capital projects, including the Sunraysia Modernisation Project reached $67.7M. Infrastructure, plant, equipment, land
and buildings total $891M.
We generated $21.8M cash from operating activities which enabled a decrease in borrowings of $6.6M. Operating
deficits are driven by a high depreciation expense as a result of increases in infrastructure, land and buildings
valuations from cyclical revaluations of those assets and the addition of SMP assets. Although we show accumulated
funds deficit of $82.8M, the bulk of this has occurred due to change in accounting standards, the transition to IFRS
(International Financial Reporting Standards) and the tax treatment of the current and past valuations.
Summary of Financial Results
Summary of Financial Performance
2015/16 Financial Summary
2011/12 2012/13 2013/14 2014/15 2015/16
$ '000 $ '000 $ '000 $ '000 $ '000
Core Business Revenue 51,248 59,023 55,642 57,965 60,233
Capital Contributions 2,713 1,968 2,768 2,577 2,081
Government Contributions 475 324 2,000 2,550 1,500
Other Revenue 3,337 3,976 3,599 4,609 4,635
Total Revenue 57,773 65,291 64,009 67,701 68,449
Direct Expenditure 27,155 29,146 25,346 31,927 34,199
Administration Expenditure 16,860 12,851 13,844 14,478 14,914
Depreciation Expense 22,858 23,964 24,550 25,874 28,425
Borrowing Cost Expenses 3,601 3,734 4,070 3,865 3,664
Total Expenditure 70,474 69,695 67,810 76,144 81,202
Net result before tax -12,701 -4,404 -3,801 -8,443 -12,753
Current Assets 24,322 25,088 56,454 73,761 38,596
Non Current Assets 804,774 783,508 777,451 802,780 896,812
Total Assets 829,096 808,596 833,905 876,541 935,408
Current Liabilities 16,696 15,048 20,081 26,425 19,087
Non Current Liabilities 185,651 167,369 163,089 157,292 169,670
Total Liabilities 202,347 182,417 183,170 183,717 188,757
Net cash flow from operations 10,718 18,932 21,388 18,218 21,798
Payments for property, plant and
equipment (including infrastructure) 18,098 20,869 20,968 44,224 67,338
Financial Summary
Performance Indicator 2011/12 2012/13 2013/14 2014/15 2014/15
Internal Financing Ratio 58.37% 87.68% 99.53% 40.95% 32.18%
Gearing Ratio 7.03% 7.66% 7.99% 6.88% 5.74%
Interest Cover (EBIT) -3.00 -0.30 Not supplied as a performance indicator
Interest Cover (Cash) 2.40 6.70 6.90 7.29 8.79
Return on Assets -0.02% -0.65% -1.10%
Return on Equity -0.40% -0.87% -1.18%

Lower Murray Water Annual Report 2015/16 38
Loan Liability as at 30th June 2016
2015/16 Financial Summary
LOAN NO. PURPOSE PERIOD AMOUNT RAISED INT. RATE REDEEMED LIABILITY
SEWERAGE DISTRICT
TCV1 11 - 41 20,000,000.00 5.835 1,657,993.52 18,342,006.48
TCV6300 11 - 16 1,000,000.00 5.350 1,000,000.00 0.00
TCV6301 11 - 17 1,000,000.00 5.450 0.00 1,000,000.00
TCV6302 11 - 18 1,000,000.00 5.545 0.00 1,000,000.00
TCV6303 11 - 19 1,000,000.00 5.590 0.00 1,000,000.00
TCV6304 11 - 19 1,000,000.00 5.640 0.00 1,000,000.00
TCV6305 11 - 20 1,000,000.00 5.740 0.00 1,000,000.00
TCV6306 11 - 21 1,000,000.00 5.790 0.00 1,000,000.00
TOTAL SEWERAGE DISTRICT 27,000,000.00 2,657,993.52 24,342,006.48
TOTAL LOAN LIABILITY - SEWERAGE DISTRICT 27,000,000.00 2,657,993.52 24,342,006.48
FIRST MILDURA IRRIGATION DISTRICT
TCV15656 12 - 22 1,000,000.00 4.755 0.00 1,000,000.00
TCV17908 12 - 16 1,000,000.00 3.450 1,000,000.00 0.00
TCV29877 13 - 21 1,000,000.00 4.260 0.00 1,000,000.00
TCV29878 13 - 23 1,000,000.00 4.545 0.00 1,000,000.00
TCV29879 13 - 23 2,000,000.00 4.600 0.00 2,000,000.00
TOTAL MILDURA IRRIGATION 6,000,000.00 1,000,000.00 5,000,000.00
RED CLIFFS IRRIGATION DISTRICT
TCV29874 13 - 16 1,000,000.00 3.215 1,000,000.00 0.00
TCV29875 13 - 17 1,000,000.00 3.475 0.00 1,000,000.00
TOTAL RED CLIFFS IRRIGATION 2,000,000.00 1,000,000.00 1,000,000.00
ROBINVALE IRRIGATION DISTRICT
TCV1 11 - 41 20,000,000.00 5.835 1,657,993.54 18,342,006.46
TCV17909 12 - 18 1,000,000.00 3.760 0.00 1,000,000.00
TCV17915 12 - 20 1,000,000.00 4.010 0.00 1,000,000.00
TCV17921 12 - 22 1,000,000.00 4.220 0.00 1,000,000.00
TCV29876 13 - 18 2,000,000.00 3.705 0.00 2,000,000.00
TOTAL ROBINVALE IRRIGATION 25,000,000.00 21.53 1,657,993.54 23,342,006.46
TOTAL LOAN LIABILITY - IRRIGATION 33,000,000.00 3,657,993.54 29,342,006.46
UNALLOCATED LOANS
TCV 3,000,000.00 0.000 3,000,000.00 0.00
TOTAL UNALLOCATED LOANS 3,000,000.00 3,000,000.00 0.00
TOTAL LOAN LIABILITY - UNALLOCATED LOANS 3,000,000.00 3,000,000.00 0.00
TOTAL LOAN LIABILITY - CORPORATION 53,684,012.94
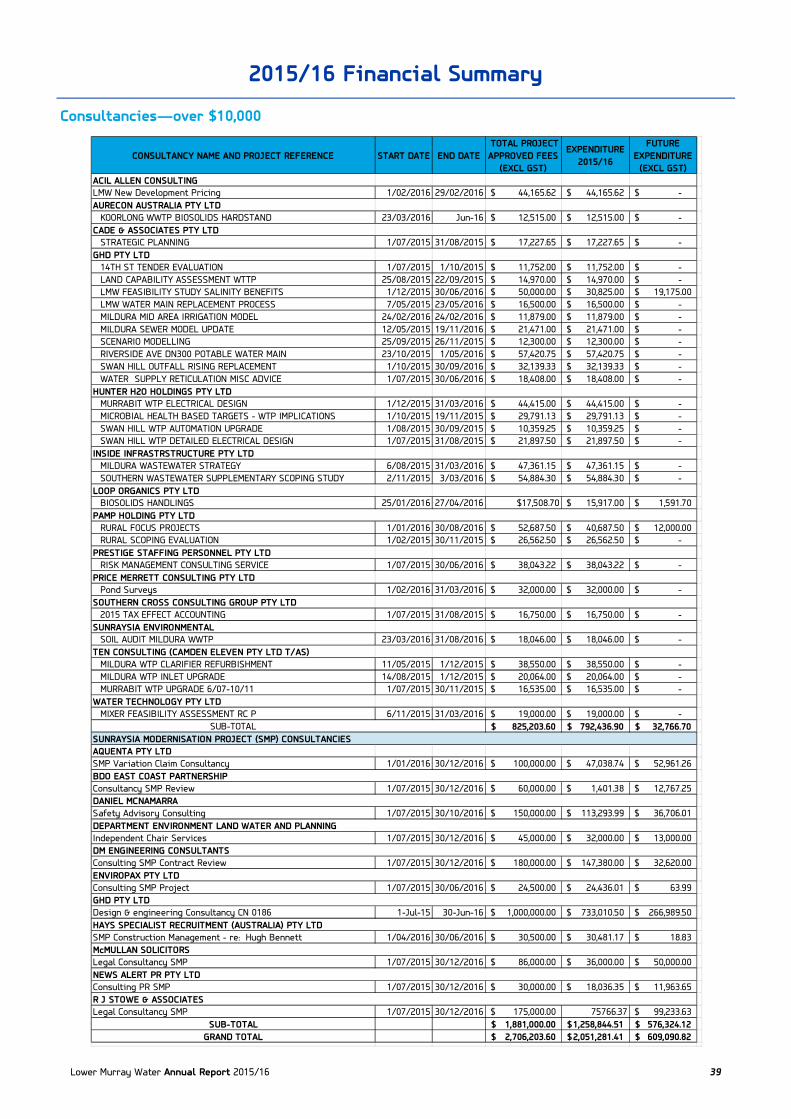
Lower Murray Water Annual Report 2015/16 39
Consultancies—over $10,000
2015/16 Financial Summary
CONSULTANCY NAME AND PROJECT REFERENCE START DATE END DATE
TOTAL PROJECT
APPROVED FEES
(EXCL GST)
EXPENDITURE
2015/16
FUTURE
EXPENDITURE
(EXCL GST)
ACIL ALLEN CONSULTING
LMW New Development Pricing 1/02/2016 29/02/2016 44,165.62$ 44,165.62$ -$
AURECON AUSTRALIA PTY LTD
KOORLONG WWTP BIOSOLIDS HARDSTAND 23/03/2016 Jun-16 12,515.00$ 12,515.00$ -$
CADE & ASSOCIATES PTY LTD
STRATEGIC PLANNING 1/07/2015 31/08/2015 17,227.65$ 17,227.65$ -$
GHD PTY LTD
14TH ST TENDER EVALUATION 1/07/2015 1/10/2015 11,752.00$ 11,752.00$ -$
LAND CAPABILITY ASSESSMENT WTTP 25/08/2015 22/09/2015 14,970.00$ 14,970.00$ -$
LMW FEASIBILITY STUDY SALINITY BENEFITS 1/12/2015 30/06/2016 50,000.00$ 30,825.00$ 19,175.00$
LMW WATER MAIN REPLACEMENT PROCESS 7/05/2015 23/05/2016 16,500.00$ 16,500.00$ -$
MILDURA MID AREA IRRIGATION MODEL 24/02/2016 24/02/2016 11,879.00$ 11,879.00$ -$
MILDURA SEWER MODEL UPDATE 12/05/2015 19/11/2016 21,471.00$ 21,471.00$ -$
SCENARIO MODELLING 25/09/2015 26/11/2015 12,300.00$ 12,300.00$ -$
RIVERSIDE AVE DN300 POTABLE WATER MAIN 23/10/2015 1/05/2016 57,420.75$ 57,420.75$ -$
SWAN HILL OUTFALL RISING REPLACEMENT 1/10/2015 30/09/2016 32,139.33$ 32,139.33$ -$
WATER SUPPLY RETICULATION MISC ADVICE 1/07/2015 30/06/2016 18,408.00$ 18,408.00$ -$
HUNTER H2O HOLDINGS PTY LTD
MURRABIT WTP ELECTRICAL DESIGN 1/12/2015 31/03/2016 44,415.00$ 44,415.00$ -$
MICROBIAL HEALTH BASED TARGETS - WTP IMPLICATIONS 1/10/2015 19/11/2015 29,791.13$ 29,791.13$ -$
SWAN HILL WTP AUTOMATION UPGRADE 1/08/2015 30/09/2015 10,359.25$ 10,359.25$ -$
SWAN HILL WTP DETAILED ELECTRICAL DESIGN 1/07/2015 31/08/2015 21,897.50$ 21,897.50$ -$
INSIDE INFRASTRSTRUCTURE PTY LTD
MILDURA WASTEWATER STRATEGY 6/08/2015 31/03/2016 47,361.15$ 47,361.15$ -$
SOUTHERN WASTEWATER SUPPLEMENTARY SCOPING STUDY 2/11/2015 3/03/2016 54,884.30$ 54,884.30$ -$
LOOP ORGANICS PTY LTD
BIOSOLIDS HANDLINGS 25/01/2016 27/04/2016 $17,508.70 15,917.00$ 1,591.70$
PAMP HOLDING PTY LTD
RURAL FOCUS PROJECTS 1/01/2016 30/08/2016 52,687.50$ 40,687.50$ 12,000.00$
RURAL SCOPING EVALUATION 1/02/2015 30/11/2015 26,562.50$ 26,562.50$ -$
PRESTIGE STAFFING PERSONNEL PTY LTD
RISK MANAGEMENT CONSULTING SERVICE 1/07/2015 30/06/2016 38,043.22$ 38,043.22$ -$
PRICE MERRETT CONSULTING PTY LTD
Pond Surveys 1/02/2016 31/03/2016 32,000.00$ 32,000.00$ -$
SOUTHERN CROSS CONSULTING GROUP PTY LTD
2015 TAX EFFECT ACCOUNTING 1/07/2015 31/08/2015 16,750.00$ 16,750.00$ -$
SUNRAYSIA ENVIRONMENTAL
SOIL AUDIT MILDURA WWTP 23/03/2016 31/08/2016 18,046.00$ 18,046.00$ -$
TEN CONSULTING (CAMDEN ELEVEN PTY LTD T/AS)
MILDURA WTP CLARIFIER REFURBISHMENT 11/05/2015 1/12/2015 38,550.00$ 38,550.00$ -$
MILDURA WTP INLET UPGRADE 14/08/2015 1/12/2015 20,064.00$ 20,064.00$ -$
MURRABIT WTP UPGRADE 6/07-10/11 1/07/2015 30/11/2015 16,535.00$ 16,535.00$ -$
WATER TECHNOLOGY PTY LTD
MIXER FEASIBILITY ASSESSMENT RC P 6/11/2015 31/03/2016 19,000.00$ 19,000.00$ -$
SUB-TOTAL 825,203.60$ 792,436.90$ 32,766.70$
SUNRAYSIA MODERNISATION PROJECT (SMP) CONSULTANCIES
AQUENTA PTY LTD
SMP Variation Claim Consultancy 1/01/2016 30/12/2016 100,000.00$ 47,038.74$ 52,961.26$
BDO EAST COAST PARTNERSHIP
Consultancy SMP Review 1/07/2015 30/12/2016 60,000.00$ 1,401.38$ 12,767.25$
DANIEL MCNAMARRA
Safety Advisory Consulting 1/07/2015 30/10/2016 150,000.00$ 113,293.99$ 36,706.01$
DEPARTMENT ENVIRONMENT LAND WATER AND PLANNING
Independent Chair Services 1/07/2015 30/12/2016 45,000.00$ 32,000.00$ 13,000.00$
DM ENGINEERING CONSULTANTS
Consulting SMP Contract Review 1/07/2015 30/12/2016 180,000.00$ 147,380.00$ 32,620.00$
ENVIROPAX PTY LTD
Consulting SMP Project 1/07/2015 30/06/2016 24,500.00$ 24,436.01$ 63.99$
GHD PTY LTD
Design & engineering Consultancy CN 0186 1-Jul-15 30-Jun-16 1,000,000.00$ 733,010.50$ 266,989.50$
HAYS SPECIALIST RECRUITMENT (AUSTRALIA) PTY LTD
SMP Construction Management - re: Hugh Bennett 1/04/2016 30/06/2016 30,500.00$ 30,481.17$ 18.83$
McMULLAN SOLICITORS
Legal Consultancy SMP 1/07/2015 30/12/2016 86,000.00$ 36,000.00$ 50,000.00$
NEWS ALERT PR PTY LTD
Consulting PR SMP 1/07/2015 30/12/2016 30,000.00$ 18,036.35$ 11,963.65$
R J STOWE & ASSOCIATES
Legal Consultancy SMP 1/07/2015 30/12/2016 175,000.00$ 75766.37 99,233.63$
SUB-TOTAL 1,881,000.00$ 1,258,844.51$ 576,324.12$
GRAND TOTAL 2,706,203.60$ 2,051,281.41$ 609,090.82$

Lower Murray Water Annual Report 2015/16 40
2015/16 Financial Report
Notes Contents Page
Accountable officer's and and chief finance and accounting officer's declaration 41
Auditor General's Report 42
Comprehensive Operating Statement 44
Balance Sheet 45
Statement of Changes in Equity 46
Cash Flow Statement 47
NOTES ACCOMPANYING THE FINANCIAL STATEMENTS
1 Statement of Significant Accounting Policies 48
2 Financial Risk Management Objectives and Policies 64
3 Revenue 69
4 Expenditure 70
5 Depreciation & Amortisation 71
6 Income Tax Expense 72
7 Cash and Cash Equivalent Assets 73
8 Receivables 73
9 Inventories 75
10 Assets Held for Sale 75
11 Infrastructure Property, Plant and Equipment 77
12 Biological Assets 89
13 Intangible Assets 89
14 Payables 90
15 Interest Bearing Liabilities 90
16 Employee Benefits 91
17 Superannuation 93
18 Deferred Taxes 95
19 Contributed Capital 96
20 Asset Revaluation Reserve 96
21 Accumulated Deficit 97
22 Equity 97
23Reconciliation of Net Result for the period after related income tax to net cash flows from
operating activities 97
24 Commitments 98
25 Responsible Persons Disclosure 99
26 Auditor Remuneration 101
27 Ex-Gratia Expenses 101
28 Events occurring after balance date 101
29 Contingent Assets and Contingent Liabilities 101
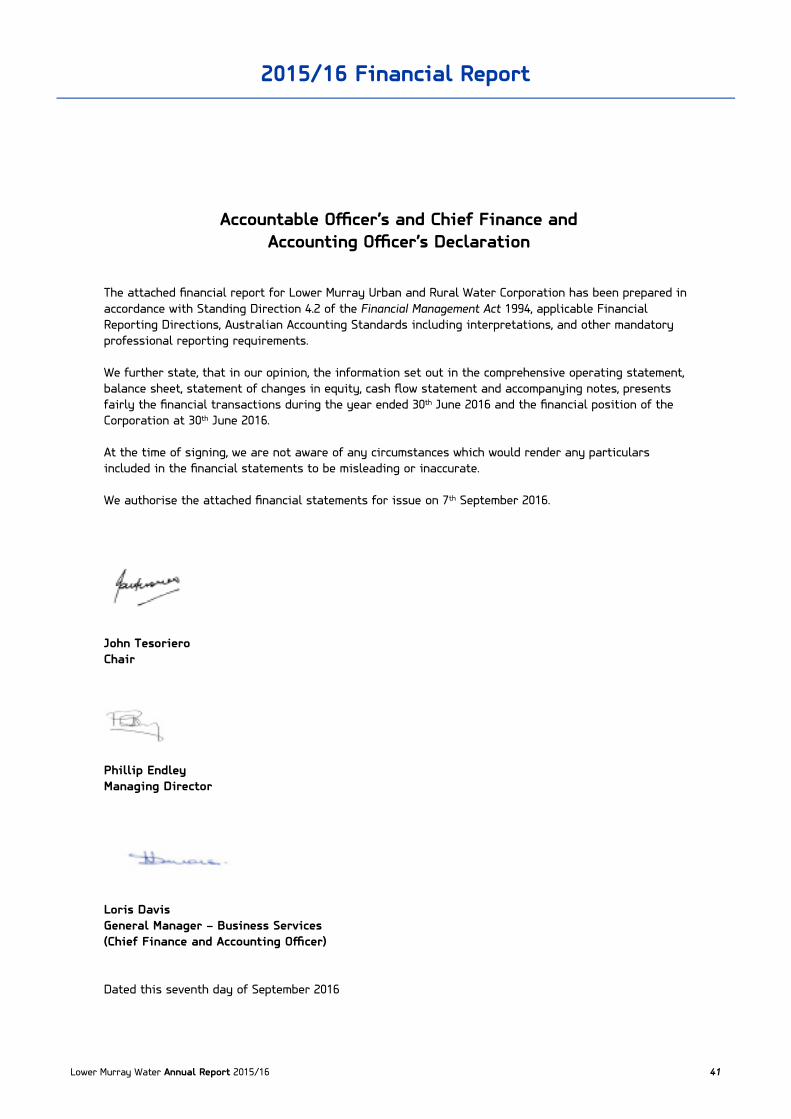
Lower Murray Water Annual Report 2015/16 41
2015/16 Financial Report
Accountable Officer’s and Chief Finance and
Accounting Officer’s Declaration
The attached financial report for Lower Murray Urban and Rural Water Corporation has been prepared in
accordance with Standing Direction 4.2 of the Financial Management Act 1994, applicable Financial
Reporting Directions, Australian Accounting Standards including interpretations, and other mandatory
professional reporting requirements.
We further state, that in our opinion, the information set out in the comprehensive operating statement,
balance sheet, statement of changes in equity, cash flow statement and accompanying notes, presents
fairly the financial transactions during the year ended 30th June 2016 and the financial position of the
Corporation at 30th June 2016.
At the time of signing, we are not aware of any circumstances which would render any particulars
included in the financial statements to be misleading or inaccurate.
We authorise the attached financial statements for issue on 7th September 2016.
John Tesoriero
Chair
Phillip Endley
Managing Director
Loris Davis
General Manager – Business Services
(Chief Finance and Accounting Officer)
Dated this seventh day of September 2016
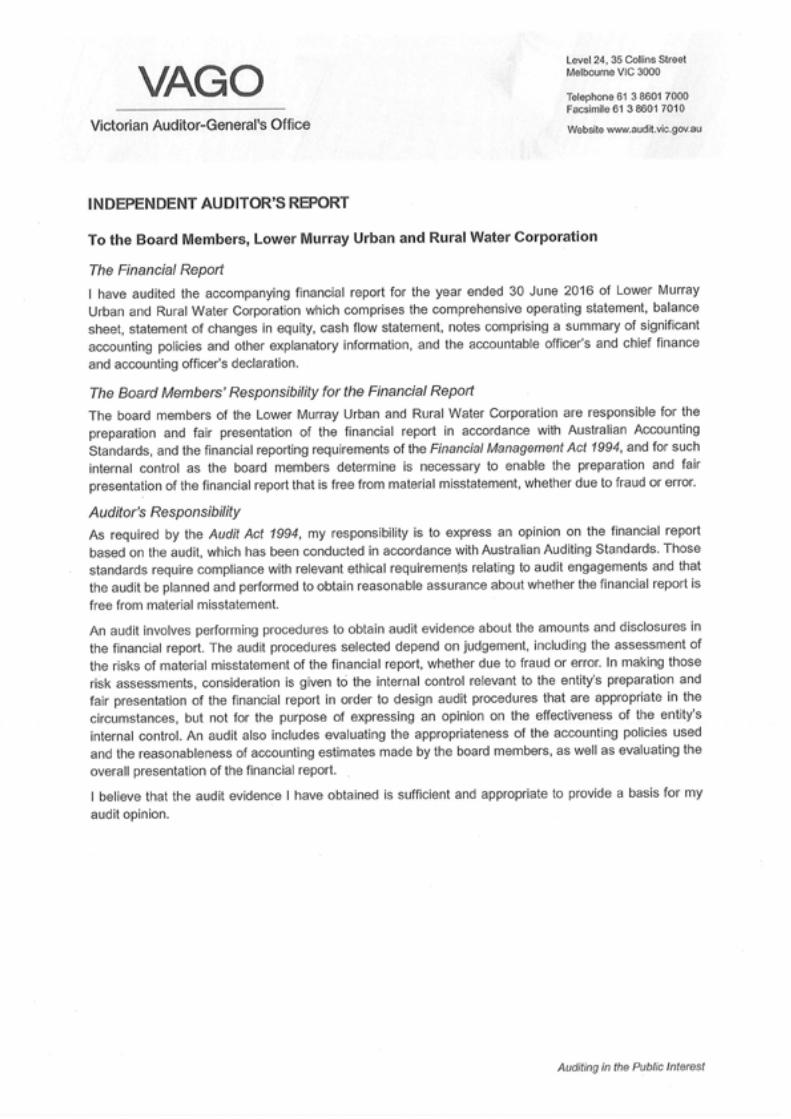

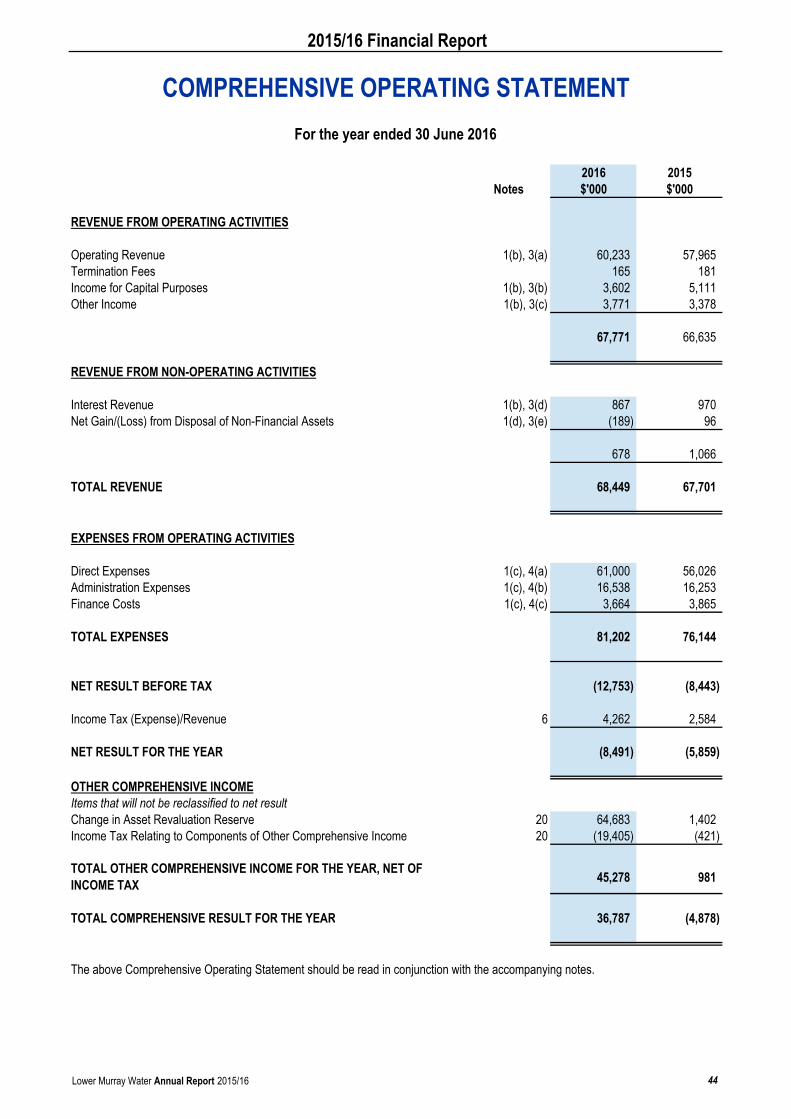
2015/16 Financial Report
2016 2015Notes $'000 $'000
REVENUE FROM OPERATING ACTIVITIES
Operating Revenue 1(b), 3(a) 60,233 57,965Termination Fees 165 181Income for Capital Purposes 1(b), 3(b) 3,602 5,111Other Income 1(b), 3(c) 3,771 3,378
67,771 66,635
REVENUE FROM NON-OPERATING ACTIVITIES
Interest Revenue 1(b), 3(d) 867 970Net Gain/(Loss) from Disposal of Non-Financial Assets 1(d), 3(e) (189) 96
678 1,066
TOTAL REVENUE 68,449 67,701
EXPENSES FROM OPERATING ACTIVITIES
Direct Expenses 1(c), 4(a) 61,000 56,026Administration Expenses 1(c), 4(b) 16,538 16,253Finance Costs 1(c), 4(c) 3,664 3,865
TOTAL EXPENSES 81,202 76,144
NET RESULT BEFORE TAX (12,753) (8,443)
Income Tax (Expense)/Revenue 6 4,262 2,584
NET RESULT FOR THE YEAR (8,491) (5,859)
OTHER COMPREHENSIVE INCOMEItems that will not be reclassified to net resultChange in Asset Revaluation Reserve 20 64,683 1,402Income Tax Relating to Components of Other Comprehensive Income 20 (19,405) (421)
TOTAL OTHER COMPREHENSIVE INCOME FOR THE YEAR, NET OF INCOME TAX 45,278 981
TOTAL COMPREHENSIVE RESULT FOR THE YEAR 36,787 (4,878)
The above Comprehensive Operating Statement should be read in conjunction with the accompanying notes.
COMPREHENSIVE OPERATING STATEMENTFor the year ended 30 June 2016
Lower Murray Water Annual Report 2015/16 44
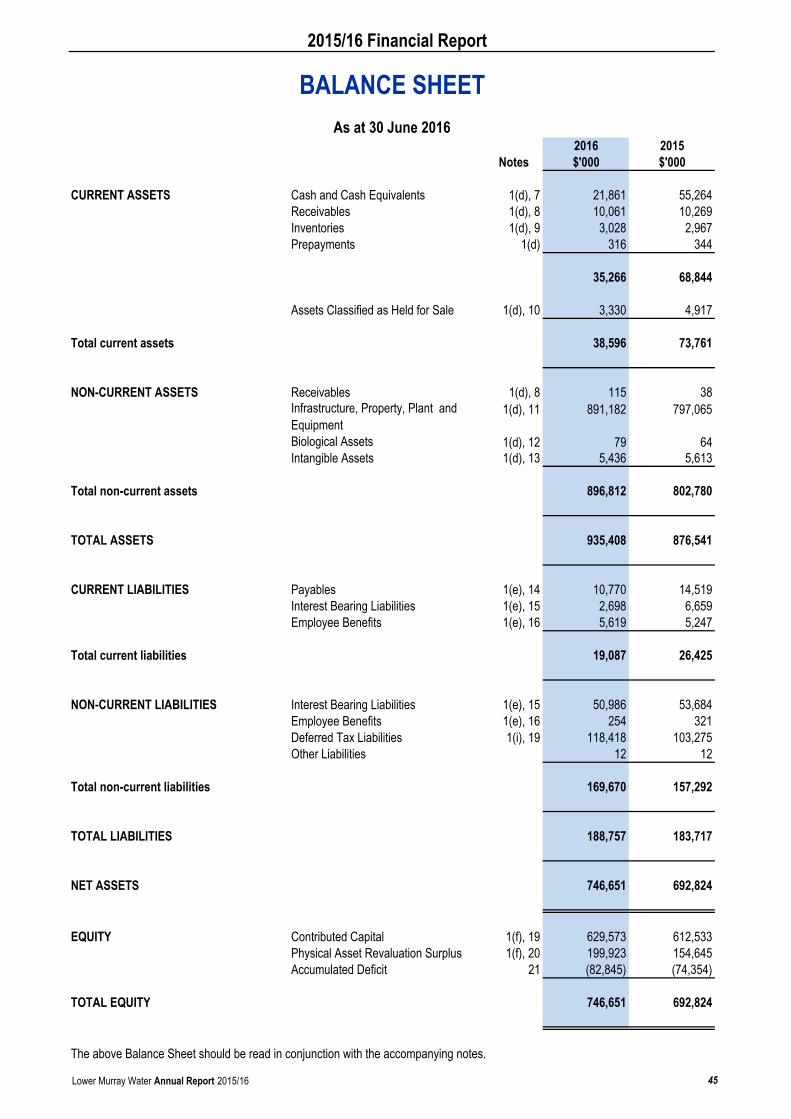
2015/16 Financial Report
2016 2015Notes $'000 $'000
CURRENT ASSETS Cash and Cash Equivalents 1(d), 7 21,861 55,264Receivables 1(d), 8 10,061 10,269Inventories 1(d), 9 3,028 2,967Prepayments 1(d) 316 344
35,266 68,844
Assets Classified as Held for Sale 1(d), 10 3,330 4,917
Total current assets 38,596 73,761
NON-CURRENT ASSETS Receivables 1(d), 8 115 38Infrastructure, Property, Plant and Equipment
1(d), 11 891,182 797,065
Biological Assets 1(d), 12 79 64Intangible Assets 1(d), 13 5,436 5,613
Total non-current assets 896,812 802,780
TOTAL ASSETS 935,408 876,541
CURRENT LIABILITIES Payables 1(e), 14 10,770 14,519Interest Bearing Liabilities 1(e), 15 2,698 6,659Employee Benefits 1(e), 16 5,619 5,247
Total current liabilities 19,087 26,425
NON-CURRENT LIABILITIES Interest Bearing Liabilities 1(e), 15 50,986 53,684Employee Benefits 1(e), 16 254 321Deferred Tax Liabilities 1(i), 19 118,418 103,275Other Liabilities 12 12
Total non-current liabilities 169,670 157,292
TOTAL LIABILITIES 188,757 183,717
NET ASSETS 746,651 692,824
EQUITY Contributed Capital 1(f), 19 629,573 612,533Physical Asset Revaluation Surplus 1(f), 20 199,923 154,645Accumulated Deficit 21 (82,845) (74,354)
TOTAL EQUITY 746,651 692,824
The above Balance Sheet should be read in conjunction with the accompanying notes.
BALANCE SHEETAs at 30 June 2016
Lower Murray Water Annual Report 2015/16 45

2015/16 Financial Report
Contributed Capital
Asset Revaluation
Reserve
Accumulated Deficit Total
Notes $'000 $'000 $'000 $'000
BALANCE AT 1 JULY 2014 19,20,21 565,566 153,664 (68,495) 650,735
TOTAL COMPREHENSIVE RESULT FOR THE YEAR - 981 (5,859) (4,878)
TRANSACTIONS WITH THE STATE IN ITS CAPACITY AS OWNER:Contributed Capital 19 46,967 - - 46,967
TOTAL TRANSACTIONS WITH THE STATE IN ITS CAPACITY AS OWNER 46,967 - - 46,967
BALANCE AS AT 30 JUNE 2015 19,20,21 612,533 154,645 (74,354) 692,824
TOTAL COMPREHENSIVE RESULT FOR THE YEAR - 45,278 (8,491) 36,787
TRANSACTIONS WITH THE STATE IN ITS CAPACITY AS OWNER:Contributed Capital 19 17,040 - - 17,040
TOTAL TRANSACTIONS WITH THE STATE IN ITS CAPACITY AS OWNER 17,040 - - 17,040
BALANCE AS AT 30 JUNE 2016 19,20,21 629,573 199,923 (82,845) 746,651
The above Statement of Changes in Equity should be read in conjunction with the accompanying notes.
STATEMENT OF CHANGES IN EQUITYFor the year ended 30 June 2016
Lower Murray Water Annual Report 2015/16 46
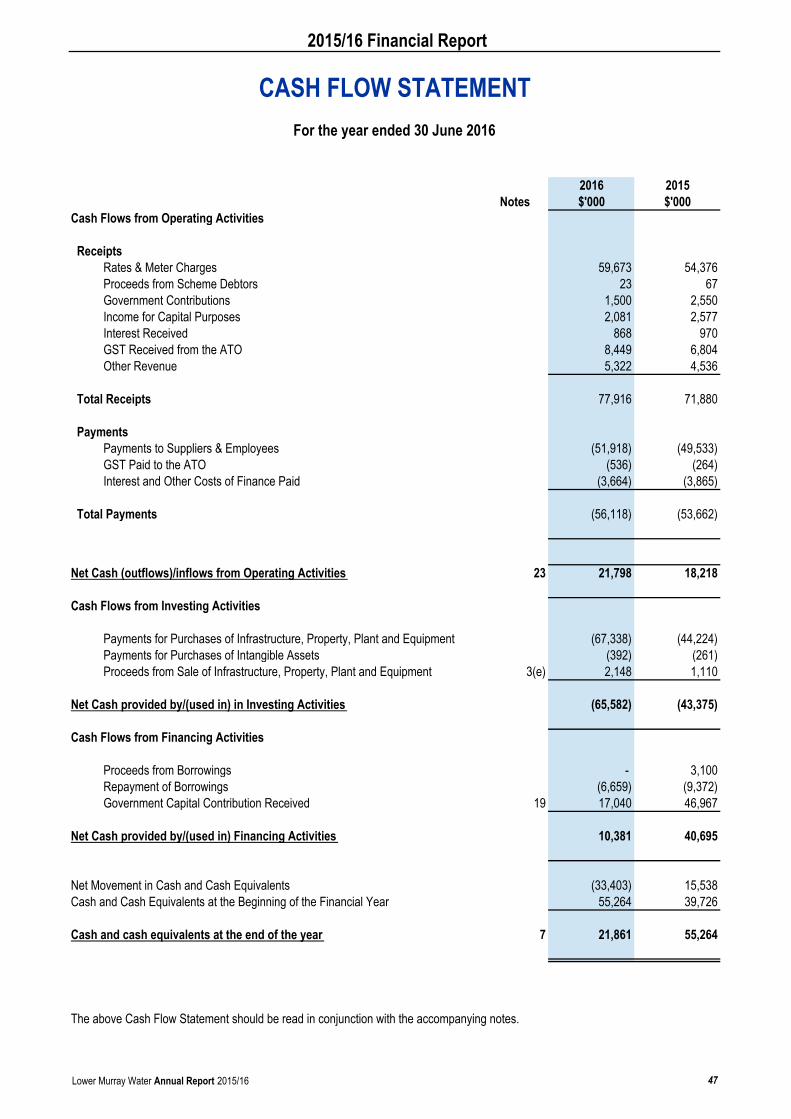
2015/16 Financial Report
CASH FLOW STATEMENT
2016 2015Notes $'000 $'000
Cash Flows from Operating Activities
ReceiptsRates & Meter Charges 59,673 54,376Proceeds from Scheme Debtors 23 67Government Contributions 1,500 2,550Income for Capital Purposes 2,081 2,577Interest Received 868 970GST Received from the ATO 8,449 6,804Other Revenue 5,322 4,536
Total Receipts 77,916 71,880
PaymentsPayments to Suppliers & Employees (51,918) (49,533)GST Paid to the ATO (536) (264)Interest and Other Costs of Finance Paid (3,664) (3,865)
Total Payments (56,118) (53,662)
Net Cash (outflows)/inflows from Operating Activities 23 21,798 18,218
Cash Flows from Investing Activities
Payments for Purchases of Infrastructure, Property, Plant and Equipment (67,338) (44,224)Payments for Purchases of Intangible Assets (392) (261)Proceeds from Sale of Infrastructure, Property, Plant and Equipment 3(e) 2,148 1,110
Net Cash provided by/(used in) in Investing Activities (65,582) (43,375)
Cash Flows from Financing Activities
Proceeds from Borrowings - 3,100Repayment of Borrowings (6,659) (9,372)Government Capital Contribution Received 19 17,040 46,967
Net Cash provided by/(used in) Financing Activities 10,381 40,695
Net Movement in Cash and Cash Equivalents (33,403) 15,538Cash and Cash Equivalents at the Beginning of the Financial Year 55,264 39,726
Cash and cash equivalents at the end of the year 7 21,861 55,264
The above Cash Flow Statement should be read in conjunction with the accompanying notes.
For the year ended 30 June 2016
Lower Murray Water Annual Report 2015/16 47
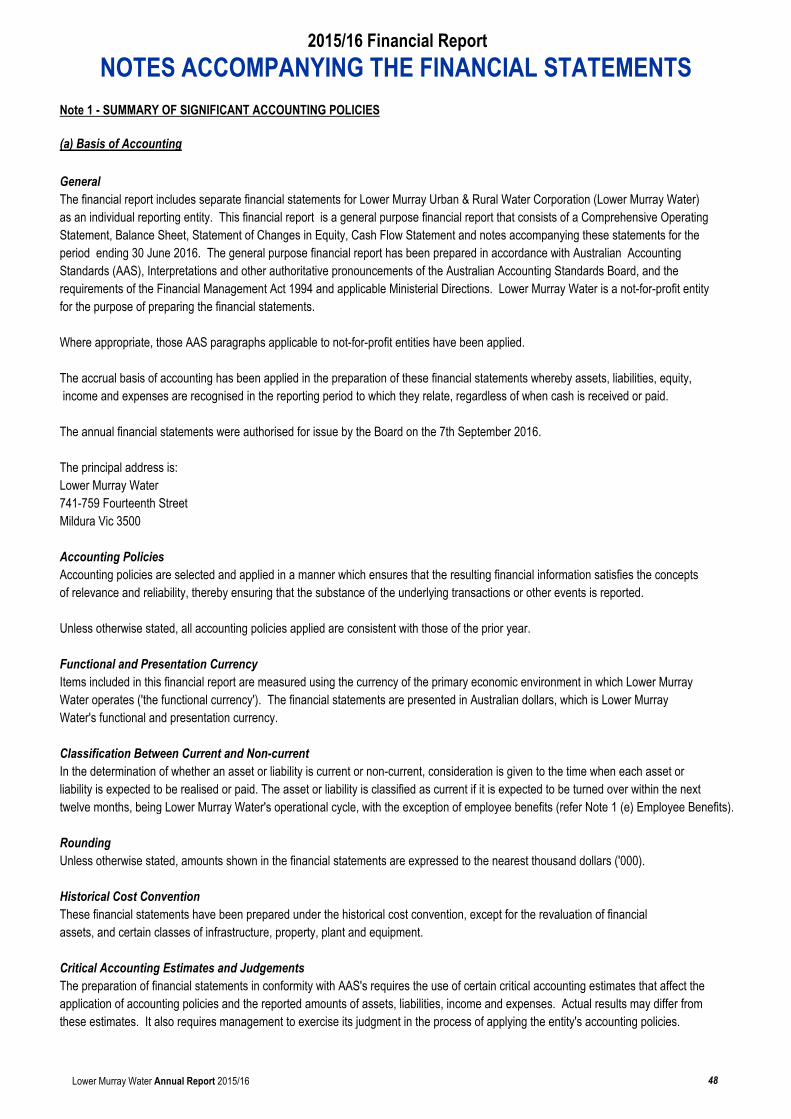
2015/16 Financial Report
Note 1 - SUMMARY OF SIGNIFICANT ACCOUNTING POLICIES
(a) Basis of Accounting
GeneralThe financial report includes separate financial statements for Lower Murray Urban & Rural Water Corporation (Lower Murray Water) as an individual reporting entity. This financial report is a general purpose financial report that consists of a Comprehensive Operating Statement, Balance Sheet, Statement of Changes in Equity, Cash Flow Statement and notes accompanying these statements for the period ending 30 June 2016. The general purpose financial report has been prepared in accordance with Australian Accounting Standards (AAS), Interpretations and other authoritative pronouncements of the Australian Accounting Standards Board, and the requirements of the Financial Management Act 1994 and applicable Ministerial Directions. Lower Murray Water is a not-for-profit entityfor the purpose of preparing the financial statements.
Where appropriate, those AAS paragraphs applicable to not-for-profit entities have been applied.
The accrual basis of accounting has been applied in the preparation of these financial statements whereby assets, liabilities, equity, income and expenses are recognised in the reporting period to which they relate, regardless of when cash is received or paid.
The annual financial statements were authorised for issue by the Board on the 7th September 2016.
The principal address is:Lower Murray Water741-759 Fourteenth StreetMildura Vic 3500
Accounting PoliciesAccounting policies are selected and applied in a manner which ensures that the resulting financial information satisfies the conceptsof relevance and reliability, thereby ensuring that the substance of the underlying transactions or other events is reported.
Unless otherwise stated, all accounting policies applied are consistent with those of the prior year.
Functional and Presentation CurrencyItems included in this financial report are measured using the currency of the primary economic environment in which Lower MurrayWater operates ('the functional currency'). The financial statements are presented in Australian dollars, which is Lower Murray Water's functional and presentation currency.
Classification Between Current and Non-currentIn the determination of whether an asset or liability is current or non-current, consideration is given to the time when each asset orliability is expected to be realised or paid. The asset or liability is classified as current if it is expected to be turned over within the nexttwelve months, being Lower Murray Water's operational cycle, with the exception of employee benefits (refer Note 1 (e) Employee Benefits).
RoundingUnless otherwise stated, amounts shown in the financial statements are expressed to the nearest thousand dollars ('000).
Historical Cost ConventionThese financial statements have been prepared under the historical cost convention, except for the revaluation of financialassets, and certain classes of infrastructure, property, plant and equipment.
Critical Accounting Estimates and JudgementsThe preparation of financial statements in conformity with AAS's requires the use of certain critical accounting estimates that affect theapplication of accounting policies and the reported amounts of assets, liabilities, income and expenses. Actual results may differ fromthese estimates. It also requires management to exercise its judgment in the process of applying the entity's accounting policies.
NOTES ACCOMPANYING THE FINANCIAL STATEMENTS
Lower Murray Water Annual Report 2015/16 48

2015/16 Financial ReportNOTES ACCOMPANYING THE FINANCIAL STATEMENTS
Estimates and judgements are continually evaluated and are based on historical experience and other factors, including expectationsof future events that may have a financial impact on the entity and that are believed to be reasonable under the circumstances.
The entity makes estimates and assumptions concerning the future. The resulting accounting estimates will, by definition, seldom equalthe related actual results.
Management judgement and estimates include:• Valuation of Land and Buildings where the valuation requires judgement on the current condition of the assets.• Valuation of infrastructure where the valuation requires judgement on the current condition of the assets and the application of the unit costs and estimated useful lives.• Intangible assets (bulk water entitlements) where management is required to test whether the carrying value reflects the recoverable amount of the Intangible Assets.• Depreciation on non-current physical assets where there is assessment of the estimated useful lives.• Employee benefits provision where assumptions are required for wage growth and CPI movements. An estimate is made on the likelihood of employees reaching unconditional service.
• Accruals where for each category of accrual, management must ensure either: - service has been received - there is an obligation to pay and the balance can be reliably measured.• Entity operates as a going concern where Lower Murray Water is required to make an assessment of the entity's ability to continue as a going concern when preparing the financial report. In assessing whether the going concern assumption is appropriate, management takes into account all available information regarding the future, which is at least, but is not limited to, twelve months from the date of signing the financial report.• Valuation and disclosure of financial instruments where complex measurements and disclosures are made based on management's intentions in relation to the financial instruments, perception of the current market conditions and anticipation of future market movements.• Impairment provisions where management are required to assess all receivables including debtors, for indicators of impairment.• Impairment of assets where management are required to assess whether there are any indicators of impairment to property, plant and equipment and intangible assets.
(b) Revenue
Service and Usage ChargesRevenue is brought to account when services have been provided or when a tariff/charge is levied or determined.
All Water and Wastewater tariffs/charges are recognised as revenue when the services are provided. Urban meter readings areundertaken on a quarterly basis. The last meter read for the year occurs in June with the income being accrued. Irrigation meterreadings are cyclical.
Trade waste charges are recognised as revenue at the end of the service delivery period. Volume meters are read and appropriate charges levied as per the trade waste agreements. The meters are read on a cyclical basis with accounts sent on a quarterly basis.
Interest IncomeInterest income is recognised using the effective interest rate method, in the period in which it is incurred.
Fair Value of Resources Received Free of ChargeThe value of all goods and services received free of charge or for nominal consideration are recognised as revenue when LowerMurray Water gains control of them, irrespective of whether restrictions or conditions are imposed over the use of the contributions.The benefits derived from these goods and services are recorded at their fair values in the financial statements.
Lower Murray Water Annual Report 2015/16 49

2015/16 Financial ReportNOTES ACCOMPANYING THE FINANCIAL STATEMENTS
Developer ContributionsFees paid by developers to connect new developments to Lower Murray Water's existing water supply and wastewater systems or for newcapital works are recognised as revenue when they are received. Non-current assets acquired from developers are recognised asrevenue when Lower Murray Water gains control of them at the fair value of those assets.
Government Grants and ContributionsGovernment grants and contributions are recognised as operating revenue on receipt or when the entity obtains control of the contribution and meets certain other criteria as outlined by AASB 1004, whichever is the sooner, and disclosed in the ComprehensiveOperating Statement under "Income for Capital Purposes".
However, grants and contributions received from the Victorian State Government, which were originally appropriated by theParliament as additions to net assets or where the Minister for Finance and the Minister for Water have indicated are in the nature ofowners' contributions, are accounted for as Equity - Contributions by Owners in accordance with FRD 119A Transfers throughContributed Capital .
Government Grants for ServicesPrograms such as salinity management and the construction of associated drainage schemes are performed under an agreement with the Mallee Catchment Management Authority. The reimbursement of the costs of these services is included as governmentcontributions in the Comprehensive Operating Statement under Income for Capital Purposes. The cost of provision of these servicesis included in the direct expenses or as capital expenditures.
Rent/Lease IncomeIncome from operating leases, (ie rentals) is recognised in income on a straight line basis over the term of the lease.
All income is stated net of the amount of Goods and Services Tax (GST).
(c) Expenses
Finance CostsFinance costs are recognised as expenses in the period in which they are incurred. Finance costs include interest on bank overdraftsand short-term and long-term borrowings incurred in connection with the arrangement of borrowings.
When Lower Murray Water carries borrowings in excess of $5 Million it is obligated to pay to the Victorian government a FinancialAccommodation Levy (FAL). The amount of the levy is based on the credit risk of Lower Murray Water relative to the State of Victoria asassessed by an independent rating agency. On the basis of the Lower Murray Water credit rating, a FAL of 106 basis points is applied to all new financial accommodation in 2015/16(2014/15 - 130 basis points) assessed from Treasury Corporation of Victoria TCV). FAL incurred by Lower Murray Water is accounted for as a borrowing cost for the purpose of presentation in the general purposefinancial statements.
Depreciation and Amortisation of Non-current AssetsAll non-current physical assets that have a limited useful life are depreciated. Where assets have separate identifiable components thathave distinct useful lives and/or residual values, a separate depreciation rate is determined for each component.
The depreciable amount of all non-current physical assets including buildings and capitalised lease assets, but excluding freeholdland, is depreciated on a straight line basis over their useful lives to Lower Murray Water commencing from the time the asset is held ready for use. The assets residual values and useful lives are reviewed, and adjusted if appropriate, at each balance sheet date.
Intangible assets with finite useful lives are amortised as an expense on a systematic basis (typically straight-line), commencing fromthe time the asset is available for use. The amortisation periods are reviewed and adjusted if appropriate at each balance date. Intangibleassets with indefinite useful lives are not amortised. However, all intangible assets are assessed for impairment annually as outlinedin Note 1(d infrastructure, property, plant and equipment (iii)).
Lower Murray Water Annual Report 2015/16 50

2015/16 Financial ReportNOTES ACCOMPANYING THE FINANCIAL STATEMENTS
The depreciation rates applied to asset classes (2016 and 2015) are:2016
Useful LifeWATER (Years)Storage Tanks 60 - 100Pumping Stations 25 - 80Reticulated Networks 50 - 110Water Treatment 10 - 80Water Meters 8Buildings 60 - 75Plant and Machinery 6 - 25
WASTEWATERSewers 45 - 100Trunk Sewer Main 50 - 100Pumping Stations 10 - 80Treatment and Disposal 10 - 100Buildings 40 - 75Plant and Machinery 6 - 25
IRRIGATION & DRAINAGEStorages 50 - 350Pumping Stations 40 - 120Channels 80 - 100Rural Water Pipelines 50 - 110Water Meters 10 - 25Buildings 40 - 75Plant and Machinery 6 - 25
ADMINISTRATIONComputer Equipment 3Office Furniture and Equipment 6Motor Vehicles 10Buildings 40 - 60Plant 6Machinery 6Communication Equipment 5
Employee BenefitsThese expenses include all costs related to employment including wages and salaries, fringe benefits tax, leave entitlements,redundancy payments and WorkCover premiums.
SuperannuationThe amount charged to the Comprehensive Operating Statement in respect of superannuation represents contributions made or due byLower Murray Water to the relevant superannuation plans in respect to the services of Lower Murray Water's staff (both past andpresent). Superannuation contributions are made to the plans based on the relevant rules of each plan and any relevant compulsorysuperannuation requirements that Lower Murray Water is required to comply with.
Lower Murray Water makes employer superannuation contributions in respect of most employees to Vision Super.Refer to Note 17 for more details of funding.
Lower Murray Water also makes employer superannuation contributions in respect of its employees to Emergency Services and StateSuper. The Victorian Government holds the responsibility for any unfunded liability for the Emergency Services and State Superschemes and is therefore responsible for reporting that liability.
The Department of Treasury and Finance (DTF) in their Annual Financial Statements, disclose on behalf of the State as the sponsoringemployer, the net defined benefit cost related to the members of these plans as an administered liability. Refer to DTF's AnnualFinancial Statements for more detailed disclosures in relation to these plans.
Lower Murray Water Annual Report 2015/16 51
2015/16 Financial ReportNOTES ACCOMPANYING THE FINANCIAL STATEMENTS
Repairs and Maintenance Routine maintenance, repair costs and minor renewal costs are expensed as incurred. Where the repair relates to the replacementof a component of an asset and the cost exceeds the capitalisation threshold, the cost is capitalised and depreciated.
Environmental Contribution The purpose of the environmental contribution is set out in the Water Industry (Environmental Contributions) Act 2004, and the fundingmay be used for the purpose of funding initiatives that seek to promote the sustainable management of water or address water-relatedinitiatives. The contribution period expired on 30 June 2016. However, on 27 April 2016, the Victorian Budget 2016/17 confirmed the continuation of the Environmental Contribution for another four years from July 2016.
Lower Murray Water has a statutory authority to pay an environmental contribution to the Department of Environment, Water, Land andPlanning. This contribution is recognised as an expense during the reporting period as incurred.
Other ExpensesSupplies and services costs are recognised as an expense in the reporting period in which they are incurred. The carryingamounts of any inventories held for distribution are expensed when distributed.
(d) Assets
Cash and Cash Equivalent AssetsCash and cash equivalents include cash on hand, deposits held at call with financial institutions, other short-term, highly liquidinvestments with original maturities of three months or less that are readily convertible to known amounts of cash and which are subjectto an insignificant risk of change in value, and bank overdrafts.
ReceivablesReceivables consist of:• contractual receivables, such as debtors in relation to goods and services, loans to third parties, accrued investment income, and finance lease receivables; and• statutory receivables, such as amounts owing from the Victorian Government and Goods and Services Tax (GST) input tax credits recoverable.
Contractual receivables are classified as financial instruments and categorised as loans and receivables.
Statutory receivables, are recognised and measured similarly to contractual receivables (except for impairment), but are not classified asfinancial instruments because they do not arise from a contract.
Receivables are recognised initially at fair value and subsequently measured at amortised cost, less allowance for doubtful debts.Receivables are due for settlement no more than 28 days from date of recognition for tariff and charges debtors, and no more than30 days for other debtors.
Collectability of receivables is reviewed on an ongoing basis. Debts which are known to be uncollectable are written off. A provisionfor impaired receivables is established when there is objective evidence that Lower Murray Water will not be able to collect all amountsdue according to the original terms of receivables. The amount is the difference between the asset's carrying amount and the presentvalue of estimated future cash flows, discounted at the effective interest rate. The amounts credited to the allowance arerecognised as an expense in the Comprehensive Operating Statement.
Irrigation receivables past due attract penalty interest, which the Essential Service Commission is the regulator for setting the rateto apply annually. The penalty interest rate that applied during 2016 was 6.3% (2015:7.6%).
Lower Murray Water Annual Report 2015/16 52
2015/16 Financial ReportNOTES ACCOMPANYING THE FINANCIAL STATEMENTS
InventoriesInventories comprise stores and materials used in the construction of new works and for the repair and maintenance of existing assets.All inventories are measured at the lower of cost and net realisable value. Costs are assigned to inventories on hand at balance dateby using the weighted average cost (WAC) method.
Inventories also include goods held for distribution at no or nominal cost. Inventories held for distribution are measured at cost, adjusted for any loss of service potential. Bases used in assessing loss of service potential for inventories held for distribution include current replacement cost and technical or functional obsolescence. Technical obsolescence occurs when an item still functions for some or all of the tasks it was originally acquired to do, but no longer matches existing technologies. Functional obsolescence occurs when an item no longer functions the way it did when it was first acquired.
PrepaymentsPrepayments represent payments in advance of receipt of goods or services or that part of expenditure made in one accountingperiod covering a term extending beyond that period.
Infrastructure, Property, Plant and EquipmentRecognition of Non-Current Physical AssetsInfrastructure, property, plant and equipment represent non-current physical assets comprising land, buildings, water, sewerage anddrainage infrastructure, plant, equipment and motor vehicles, used by Lower Murray Water in its operations. Items with a cost or valuein excess of $1000 (2015: $1000) and useful life of more than one year are recognised as an asset. All other assets acquired areexpensed.
Each class of infrastructure, property, plant and equipment are carried at either fair value, or at independent valuation, less,where applicable, any accumulated depreciation or amortisation.
The cost of non-current physical assets constructed within Lower Murray Water includes the cost of contract payments, materials anddirect labour.
Assets acquired at no cost or for nominal consideration by Lower Murray Water are recognised at fair value at the date of acquisition.
Gains and losses on disposals are determined by comparing proceeds with carrying amount. These are included in theComprehensive Operating Statement.
(i) Measurement of Infrastructure, Property, Plant and Equipment (non-current physical assets)All non-current physical assets are recognised initially at cost and subsequently revalued at fair value less accumulateddepreciation and impairment in accordance with the requirements of Financial Reporting Direction (FRD) 103F Non-CurrentPhysical Assets.
Revaluations are conducted in accordance with FRD 103F. Scheduled revaluation is undertaken every five years with an annualassessment of fair value to determine if it is materially different to the carrying value. If the difference to carrying value is greater than10 per cent, a management revaluation is undertaken while a movement greater than 40 per cent will normally involve an ApprovedValuer (usually the Valuer General of Victoria) to perform detailed assessment of the fair value. If the movement in fair value sincelast revaluation is less than or equal to 10 per cent, then no change is made to the carrying amounts.
Plant, equipment, infrastructure and motor vehicles are measured at fair value.
For the plant, equipment and vehicles asset class, where Lower Murray Water is able to demonstrate that there is no evidence that areliable market-based fair value (or other fair value indicators) exist for these assets, depreciated replacement cost is used torepresent a reasonable approximation of fair value.
Water infrastructure assets, are measured at fair value less accumulated depreciation and impairment in accordance with FRD 103F.These assets comprise substructures or underlying systems held to facilitate harvesting, storage, treatment and transfer of water tomeet customer needs. They also include infrastructure assets that underlie sewage and drainage systems.
Lower Murray Water Annual Report 2015/16 53

2015/16 Financial ReportNOTES ACCOMPANYING THE FINANCIAL STATEMENTS
The fair value assessment for water infrastructure occurred as at 30 June 2016 and was undertaken with involvement fromValuer General of Victoria (VGV) and under the instructions of Department of Treasury and Finance (DTF). The assessment wasperformed on a portfolio basis for various categories of water infrastructures. Further details of the exercise is provided in Note 11.
(ii) Revaluation of Non-Current Physical AssetsRevaluation increments are credited directly to equity in the physical asset revaluation surplus, except that, to the extent that anincrement reverses a revaluation decrement in respect of that class of asset previously recognised as an expense in determining thethe net result, the increment is recognised as revenue in determining the net result.
Revaluation decrements are recognised immediately as an expense in the net result, except that, to the extent that a credit balanceexists in the physical asset revaluation surplus in respect of the same class of assets, they are debited to the revaluation reserve.
Revaluation increases and revaluation decreases relating to individual assets within a class of infrastructure, property, plant andequipment are offset against one another within that class but are not offset in respect of assets in different classes.
Revaluation reserves are not transferred to accumulated funds on derecognition of the relevant asset.
(iii) Impairment of AssetsIntangible assets with indefinite useful lives are tested annually as to whether their carrying value exceeds their recoverable amount.All other assets are assessed annually for indicators of impairment, except for: - inventories; - deferred tax assets; - financial instrument assets; - non-current assets held for sale.
If there is indication of impairment, the assets concerned are tested as to whether their carrying value exceeds their recoverableamount. Where an asset's carrying amount exceeds its recoverable, the difference is written-off by a charge to the ComprehensiveOperating Statement except to the extent that the write-down can be debited to a physical asset revaluation surplus amountapplicable to that class of asset.
The recoverable amount for most assets is measured at the higher of depreciated replacement cost and fair value less costs to sell.Recoverable amount for assets held primarily to generate net cash inflows is measured at the higher of the present value of futurecash flows expected to be obtained from the asset and fair value less costs to sell. It is deemed that, in the event of the loss of anasset, the future economic benefits arising from the use of the asset will be replaced unless a specific decision to the contrary hasbeen made.
An impairment loss on a revalued asset is recognised directly against any physical asset revaluation surplus in respect of the sameclass of asset to the extent that an impairment loss does not exceed the amount in the physical asset revaluation surplus of that sameclass of asset.
A reversal of an impairment loss on a revalued asset is credited directly to equity under the heading physical asset revaluationsurplus. However, to the extent that an impairment loss on the same class of asset was previously recognised in profit or loss, areversal of that impairment loss is also recognised in the Comprehensive Operating Statement.
(iv) Assets Held for SaleA disposal group is a group of assets to be disposed of, by sale or otherwise, together as a group in a single transaction. Assets(or disposal groups) classified as held for sale are stated at the lower of their carrying amount and fair value less costs to sell,if their carrying amount will be recovered principally through a sale transaction, rather than through continuing use. This conditionis regarded as met only when the sale is highly probable. The asset (or disposal group) is available for immediate sale in its presentcondition and the sale is expected to be completed within 12 months from the date of classification.
Lower Murray Water Annual Report 2015/16 54

2015/16 Financial ReportNOTES ACCOMPANYING THE FINANCIAL STATEMENTS
Assets (including those that are part of a disposal group) classified as held for sale are not depreciated or amortised while they areclassified as held for sale. Interest and other expenses attributable to the liabilities of a disposal group classified as held for salecontinue to be recognised.
Assets classified as held for sale and the assets of a disposal group classified as held for sale are presented separately from the otherassets in the Balance Sheet.
Biological AssetsFor livestock, fair value is based on the amount that could be expected to be received from the disposal of livestock with similarattributes. An increase or decrease in the fair value of these biological assets is recognised in the consolidated ComprehensiveOperating Statement.
Intangible AssetsIntangible assets represent identifiable non-monetary assets without physical substance. Intangible assets are initially recognised atcost. Subsequently, intangible assets with finite useful lives are carried at cost less accumulated amortisation and accumulatedimpairment losses. Costs incurred subsequent to initial acquisition are capitalised when it is expected that additional future economicbenefits will flow to Lower Murray Water.
A summary of the policies applied to Lower Murray Water’s intangible assets is as follows:
Permanent Water EntitlementsPermanent water entitlements purchased after 1 July 2004 are treated as an intangible asset on the Balance Sheet at cost (in accordance with AASB 138 Intangible Assets and FRD 109 Intangible Assets ), and will not be subject to amortisation, as thepermanent water entitlements have an indefinite useful life. Permanent entitlements purchased after 1 July 2004 will be tested annuallyfor impairment. Bulk permanent water entitlements prior to 1 July 2004 are not recorded on the Balance Sheet as an intangibleasset, as they cannot be reliably measured.
Operating LeasesLeases in which a significant portion of the risks and rewards of ownership are retained by the lessor are classified asoperating leases. Payments made under operating leases (net of any incentives received from the lessor) are chargedto the Comprehensive Operating Statement on a straight-line basis over the period of the lease, in the periods in whichthey are incurred, as this represents the pattern of benefits derived from the leased assets.
Impairment test / Recoverable amount testing
Tested annually and where an indicator of impairment exists
Amortisation method reviewed at each financial year-end; Reviewed annually for indicators of impairment
Amortisation method reviewed at each financial year-end; Reviewed annually for indicators of impairment
Water ShareEntitlements Development Costs Software
Useful lives Indefinite Finite FiniteAmortisation method used Not amortised or
revalued3 years – straight line 3 years – straight line
Internally generated / acquired Acquired Internally generated Acquired
Lower Murray Water Annual Report 2015/16 55
2015/16 Financial ReportNOTES ACCOMPANYING THE FINANCIAL STATEMENTS
(e) Liabilities
PayablesPayables conists of:• contractual payables, such as accounts payable, and unearned income including deferred income from concession notes. Accounts payable represent liabilities for goods and services provided to Lower Murray Water prior to the end of the financial year that are unpaid, and arise when Lower Murray Water becomes obliged to make future payments in respect of the purchase of those goods and services; and• statutory payables, such as goods and services tax and fringe benefits tax payables.
Payables are initially recognised at fair value, being the cost of goods and services, and subsequently measured at amortised cost.
Interest Bearing LiabilitiesInterest bearing liabilities are initially recognised at fair value, net of transaction costs incurred. Interest bearing liabilities aresubsequently measured at amortised cost. Any difference between the initial amount recognised (net of transaction costs) and theredemption amount is recognised in the Comprehensive Operating Statement over the period of the borrowings, using the effective interest method.
Interest bearing liabilities are classified as current liabilities unless Lower Murray Water has an unconditional right to defer the settlement of the liability for at least 12 months after the balance sheet date.
Lower Murray Water has classified borrowings which mature within 12 months as non-current liabilities on the basis that the entity will and has discretion to refinance or rollover these loans with the Treasury Corporation of Victoria, pursuant to section 8 of the Borrowings and Investment Powers Act 1987. Lower Murray Water does not have any borrowings which mature within 12 months as non-currentliabilities at 30 June 2016. Borrowings known as 11am debt are classified as current borrowings.
Employee BenefitsProvision is made for benefits accruing to employees in respect of wages and salaries, annual leave, long service leave, bonuses andaccumulating sick leave when it is probable that settlement will be required and they are capable of being measured reliably.
(i) Wages and salaries, annual leave and sick leaveProvisions made in respect of employee benefits expected to be settled wholly within 12 months after the end of the reporting period,are measured at their nominal values, using the remuneration rate expected to apply at the time of settlement.
Provisions made in respect of employee benefits which are not expected to be wholly settled within 12 months after the end of thereporting period, are measured at their present value of the estimated future cash flows to be made by Lower Murray Water, in respect ofservices provided by employees up to the reporting date.
Liabilities for wages and salaries, annual leave and sick leave are all recognised in the provision for employee benefits as 'currentliabilities', because Lower Murray Water does not have the unconditional right to defer settlements of these liabilities.
(ii) Long Service Leave (LSL)Current Liability – unconditional LSL (representing 7* or more years of continuous service) is disclosed as a current liability evenwhere Lower Murray Water does not expect to settle the liability within 12 months because it does not have the unconditional right to deferthe settlement of the entitlement should an employee take leave within 12 months.
The components of this current LSL liability are measured at: • present value – component that Lower Murray Water does not expect to wholly settle within 12 months; and • undiscounted value – component that Lower Murray Water expects to wholly settle within 12 months.
Lower Murray Water Annual Report 2015/16 56

2015/16 Financial ReportNOTES ACCOMPANYING THE FINANCIAL STATEMENTS
Non-Current Liability – conditional LSL (representing less than 7* years of continuous service) is disclosed as a non-current liability.There is an unconditional right to defer the settlement of the entitlement until the employee has completed the requisite years of service. Conditional LSL is required to be measured at present value.
In calculating present value, consideration is given to expected future wage and salary levels, experience of employee departuresand periods of service. Expected future payments are discounted using market yields at the reporting date on national governmentbonds with terms to maturity and currency that match, as closely as possible, the estimated future cash outflows.
* In accordance with the Lower Murray Urban and Rural Water Corporation Enterprise Agreement 2015 made pursuant to Part 2-4 of the Fair Work Australia Act 2009.
(iii) SuperannuationThe amount charged to the Comprehensive Operating Statement in respect of superannuation represents the contributions made by Lower Murray Water to the relevant superannuation plans in respect to the services of Corporation's staff (both past and present).Superannuation contributions are made to the plans based on the relevant rules of each plan and any relevant compulsorysuperannuation requirements that Lower Murray Water is required to comply with.
(iv) Employee Benefit OncostsEmployee benefit oncosts, including payroll tax and worker's compensation, are recognised and disclosed separately in Note 16.
(v) Performance PaymentsPerformance payments for Lower Murray Water's contracted officers are based on a percentage of the annual salary package providedunder their contracts of employment. A liability is recognised and is measured as the aggregate of the amounts accrued under theterms of the contracts to balance date.
Four Executive Officers (2015:4 ) have annual bonus payments (fixed amounts) within their individual employment contracts. Thesepayments are payable within the currency of each financial year.
There are no performance payments accruing to the end of the employment contract period which are to be recognised asnon-current liabilities.
ProvisionsProvisions are recognised when Lower Murray Water, as a result of a past event, has a present legal or constructive obligation that canbe estimated reliably, and it is probable that an outflow of economic benefit will be required to settle the obligation.
The amount recognised as a provision is the best estimate of the consideration required to settle the present obligation at the end ofthe reporting period, taking into account the risks and uncertainties surrounding the obligation.
(f) Equity
Contributed CapitalAdditions to net assets which have been designated as contributions by owners are recognised as contributed capital. Other transfersthat are in the nature of contributions or distributions have also been designated as contributions by owners. Transfers of net assetsarising from administrative restructurings are treated as distributions to or contributions by owners.
Grants and contributions received from the Victorian State Government, which were originally appropriated by the Parliament asadditions to net assets or where the Minister for Finance and the Minister for Water have indicated are in the nature of owners’contributions, are accounted for as Equity – Contributions by Owners in accordance with FRD 119A Transfers throughContributed Capital .
Lower Murray Water Annual Report 2015/16 57

2015/16 Financial ReportNOTES ACCOMPANYING THE FINANCIAL STATEMENTS
Asset Revaluation ReserveThe asset revaluation reserve is used to record asset revaluation increments and decrements in the value of non-currentphysical assets.
(g) Financial InstrumentsRecognitionInitial measurement of financial instruments is at fair value plus transaction costs where the instrument is not classified as at fair valuethrough profit and loss. Transaction cost related to instruments classified as at fair value through profit and loss are expensed tothe Comprehensive Operating Statement immediately. Financial instruments are classified and measured as set out below.
(i) Classification and MeasurementFinancial assets at fair value through profit or lossFinancial assets at fair value through profit or loss are financial assets held for trading. A financial asset is classified in this categoryif acquired principally for the purpose of selling in the short term. Assets in this category are classified as current assets. Gains andlosses arising from changes in fair value are recognised in the Comprehensive Operating Statement.
Loans and ReceivablesLoans and receivables are non-derivative financial assets with fixed or determinable payments that are not quoted in an activemarket. They are included in current assets, except for those with maturities greater than 12 months after the reporting date whichare classified as non-current assets. Loans and receivables are included in receivables in the balance sheet. Loans and receivables are recorded at amortised cost less impairment.
Impairment of financial assetsAt each reporting date, Lower Murray Water assesses whether there is objective evidence that a financial instrument has been impaired. Impairment losses are recognised in the Comprehensive Operating Statement.
Financial LiabilitiesInterest bearing liabilities are initially recognised at fair value, net of transaction costs incurred, and are subsequently measured atamortised cost using the effective interest rate method.
Payables are recognised when Lower Murray Water becomes obliged to make future payments resulting from the purchase ofgoods and services.
(ii) Fair ValueThe carrying value less impairment provision of receivables and payables is a reasonable approximation of their fair values due tothe short-term nature of receivables. The fair value of financial liabilities for disclosure purposes is estimated by discounting the futurecontractual cash flows at the current market interest rate that is available to Lower Murray Water for similar financial assets.
The carrying amounts and aggregate net fair values of financial assets and financial liabilities at balance date have been providedin Note 2 (d).
Consistent with AASB 7 Financial Instruments: Disclosures which requires disclosure of fair value measurements by level of fairvalue measurement hierarchy, Lower Murray Water has provided the required disclosure in Note 2 (d).
(iii) DerecognitionFinancial assets are derecognised where the contractual rights to receipt of cash flows expires or the asset is transferred to anotherparty whereby the entity no longer has any significant continuing involvement in the risks and benefits associated with the asset.Financial liabilities are derecognised where the related obligations are either discharged, cancelled or expire. The difference between the carrying value of the financial liability extinguished or transferred to another party and the fair value of consideration paid, includingthe transfer of non-cash assets or liabilities assumed, is recognised in the Comprehensive Operating Statement.
Lower Murray Water Annual Report 2015/16 58

2015/16 Financial ReportNOTES ACCOMPANYING THE FINANCIAL STATEMENTS
(h) Fair Value
Consistent with AASB 13 Fair Value Measurement , Lower Murray Water determines the policies and procedures for both recurring fairvalue measurements such as infrastructure, property, plant and equipment and financial instruments and for non recurring fair valuemeasurements such as assets held for sale, in accordance with the requirements of AASB 13 and relevant Financial ReportingDirections.
All assets and liabilities for which fair value is measured or disclosed in the financial statements are categorised within the fair valuehierarchy, described as follows, based on the lowest level input that is significant to the fair value measurement as a whole:
Level 1 - Quoted (unadjusted) market prices in active markets for identical assets or liabilitiesLevel 2 - Valuation techniques for which the lowest level input that is significant to the fair value measurement is directly or indirectly observable; andLevel 3 - Valuation techniques for which the lowest level input that is significant to the fair value measurement is unobservable
For the purpose of fair value disclosures, Lower Murray Water has determined classes of assets and liabilities on the basis of the nature,characteristics and risks of the asset or liability and the level of fair value hierarchy as explained above.
In addition, Lower Murray Water determines whether transfers have occurred between levels in the hierarchy by reassessingcategorisation, based on the lowest level input that is significant to the fair value measurement as a whole, at the end of each reportingperiod.
The Valuer General Victoria (VGV) is Lower Murray Water's independent valuation agency in relation to valuation of property, plant andequipment and infrastructure. On occasion, Lower Murray Water also uses the services of Elders Limited for sheep stock fair value valuations and local valuers for land and building fair value valuations.
Lower Murray Water, in conjunction with VGV, and other external valuers, monitors changes in the fair value of each asset andliability through relevant data sources to determine whether revaluation is required.
(i) Taxation
Lower Murray Water was notified by the Treasurer, of the Government's decision to direct Regional Urban Water and Rural WaterAuthorities to become subject to the National Tax Equivalent Regime (NTER) from 1 July 2002. The NTER is administered by the Australian Taxation Office.
The income tax expense or revenue for the period is the expected tax payable or receivable on the current period's taxable income based on the national income tax rate of 30% adjusted by changes in deferred tax assets and liabilities attributable totemporary differences between the tax bases of assets and liabilities and their carrying amounts in the financial statements, and tounused tax losses.
Deferred tax assets and liabilities are recognised for temporary differences at the tax rates expected to apply when the assets arerecovered or liabilities are settled, based on those tax rates which are enacted or substantially enacted. The relevant tax rates areapplied to the cumulative amounts of deductible and taxable temporary differences to measure the deferred tax asset and liability.No deferred tax asset or liability is recognised in relation to these temporary differences if they arose in a transaction, that at the time of the transaction did not affect either accounting profit or taxable profit or loss. Deferred taxassets are recognised for deductible temporary differences and unused tax losses only if it is probable that future taxable amountswill be available to utilise those temporary differences and losses.
The deferred tax assets and deferred tax liabilities are disclosed on the net basis in the balance sheet.
Lower Murray Water Annual Report 2015/16 59

2015/16 Financial ReportNOTES ACCOMPANYING THE FINANCIAL STATEMENTS
(j) Commitments
Commitments for future expenditure include operating and capital commitments arising from contracts. These commitments are disclosedby way of a note (refer to Note 24) at their nominal value and inclusive of the goods and services tax (GST) payable. In addition,where it is considered appropriate and provides additional relevant information to users, the net present values of significantindividual projects are stated. These future expenditures cease to be disclosed as commitments once the related liabilities arerecognised in the balance sheet.
(k) Contingent Assets and Contingent Liabilities
Contingent assets and contingent liabilities are not recognised in the Balance Sheet, but are disclosed by way of a note (refer to Note 29)and, if quantifiable, are measured at nominal value. Contingent assets and liabilities are presented inclusive of GST receivable orpayable respectively.
(l) Dividend Policy
Lower Murray Water is required to pay a dividend in accordance with a determination of the Treasurer of Victoria under the PublicAuthorities (Dividend) Act 1983, based on a prescribed percentage of the previous year's adjusted net profit.
An obligation to pay a dividend only arises after consultation with the portfolio Minister and the Treasurer and a formal determinationis made by the Treasurer.
The board expects the final determination of dividend for 2015-16 to be $0 (2014-15: $0).
(m) Goods and Services tax
Revenues, expenses and assets are recognised net of goods and services tax (GST), except where the amount of GST incurred isnot recoverable from the Australian Taxation Office (ATO). In these circumstances, the GST is recognised as part of the cost ofacquisition of the asset or as part of an item of expense.
Receivables and payables are stated inclusive of GST. The net amount of GST recoverable from, or payable to, the ATO is includedas a current asset or liability in the Balance Sheet. Cash flows arising from operating activities are disclosed in in the Cash FlowStatement on a gross basis – i.e. inclusive of GST. The GST component of cash flows arising from investing and financing activitieswhich is recoverable or payable to the taxation authority is classified as operating cash flows.
(n) Reporting Lines of Business
The financial information has been prepared based on Lower Murray Water's main functions, of delivery of potable water, the disposalof wastewater, supply of river water for irrigation and collection and disposal of drainage water.
Lower Murray Water has no wholesale function.
Lower Murray Water Annual Report 2015/16 60

2015/16 Financial ReportNOTES ACCOMPANYING THE FINANCIAL STATEMENTS
(o) New Accounting Standards and Interpretations issued that are not effective
Certain new accounting standards and interpretations have been published that are not mandatory for the 30 June 2016 reportingperiod. As at 30 June 2016, the following standards and interpretations had been issued but were not mandatory for financial yearending 30 June 2016. Lower Murray Water has not and does not intend to adopt these standards early.
Summary Effective Date
Effective date for the
entity1 January
20181 July 2018
1 January 2018
1 July 2018
1 January 2019
1 July 2019
1 January 2018
1 July 2018
AASB 16 Leases The Key changes introduced by AASB 16 include the recognition of most operating leases (which are currently not recognised) in the balance sheet.
Currently Lower Murray Water does not have any operating leases. Therefore the change in the standard will have no effect on Lower Murray Water currently.
AASB 2010-7 Amendments to Australian Accounting Standards arising from AASB 9 (December 2010) AASB 1,2,3,4,5,7,101,102,108,112,118,120,121,127,128,131,132,136,137,139,1023 & 1038 and interpretations 2,5,10,12,19 & 127
The requirements for classifying and measuring financial liabilities were added to AASB 9. The existing requirements for the classification of financial liabilities and the ability to use the fair value option have been retained. However, where the fair value option is used for financial liabilities the change in fair value is accounted for as follows: -the change in fair value attributable to changes in credit risk is presented in other comprehensive income (OCI); and - other fair value changes are presented in profit or loss. If this approach creates or enlarges an accounting mismatch in the profit or loss, the effect of the changes in credit risk are also presented in profit or loss.
The assessment has identified that the amendments may result in earlier recognition of impairment losses and at more regular intervals. Lower Murray Water is yet to asess the full impact of the amendments.
AASB 9 Financial Instruments The key changes include the simplified requirements for the classification and measurement of financial assets, a new hedging accounting model and a revised impairment loss model to recognise impairment losses earlier, as opposed to the current approach that recognises impairment only when incurred.
The preliminary assessment is Lower Murray Water does not hold financial available for sale (AFS) assets and therefore the change in the standard will have no effect on the Corporation currently.
AASB 15 Revenue from Contracts with Customers
The core principle of AASB 15 requires an entity to recognise revenue when the entity satisfies a performance obligation by transferring a promised good or service to a customer.
The changes in revenue recognition requirements in AASB 15 may result in changes to the timing and amount of revenue recorded in the financial statements. The Standard will also require additional disclosures on service revenue and contract modifications.Lower Murray Water is yet to assess the full impact of this standard.
Standard / Interpretation Impact on financial statements
Lower Murray Water Annual Report 2015/16 61
2015/16 Financial ReportNOTES ACCOMPANYING THE FINANCIAL STATEMENTS
1 January 2019
1 July 2019
1 January 2016
1 July 2016
1 January 2017, except
ammend-ments to AASB 9
(December 2009) and AASB 9
(December 2010) apply to January
2018
1 July 2017
1 January 2018
1 July 2018
AASB 2014-5 Amendments to Australian Accounting Standards arising from AASB 15
Amends the measurement of trade receivables and the recognition of dividends.
The assessment has indicated that there will be no significant impact for Lower Murray Water.
AASB 2014-7 Amendments to Australian Accounting Standards arising from AASB 9
Amends the various AAS's to incorporate the consequentuial amendments arising from the issuance of AASB 9.
The assessment has indicated that there will be no significant impact for Lower Murray Water.
AASB 2014-1 Amendments to Australian Accounting Standards [Part E Financial Instruments]
Amends various AAS's to reflect the AASB's decision to defer the mandatory application date of AASB 9 to annual reporting periods beginning on or after 1 January 2018 as a consequence of Chapter 6; and to amend reduced disclosure requirements.
This amending standard will defer the application period of AASB 9 to the 2018-19 reporting period in accordance with the transition requirements.The Corporation is yet to assess the full impact of this standard.
AASB 2014-4 Amendments to Australian Accounting Standards Clarification of Acdceptable Methods of Depreciation and Amortisation AASB 116 & AASB 138)
AASB 2014-4 amends AASB 116 and AASB 138 to: -establish the principle for the basis of depreciation and amortisation as being the expected pattern of consumption of the future economic benefit of an asset; -clarifiy that the use of revenue-based methods to calculate the depreciation of an asset is not appropriate because revenue generated by an activity that includes the use of an asset generally reflects factors other than the consumption of the economic benefits embodied in the asset; and -clarifiy that revenue is generally presumed to be an inappropriate basis for measuring the consumption of the economic benefits embodied in an intangible asset. This presumption, however, can be rebutted in certain limited circumstances.
The amendment of this Australian Accounting Standard will not impact on the Corpoation as the revenue-based method is not used for depreciation and amortisation.
Lower Murray Water Annual Report 2015/16 62

2015/16 Financial ReportNOTES ACCOMPANYING THE FINANCIAL STATEMENTS
1 January 2016
1 July 2016
1 January 2016
1 July 2016
In addition to the new standards and amendments above, the AASB has issued a list of amending standards that are not effective for the2015-16 reporting period (as listed below). In general, these amending standards include editorial and references changes that areexpected to have insignificant impacts on Lower Murray Water's reporting.
AASB 1057 Application of Australian Accounting StandardsAASB 2014-3 Amendments to Australilan Accounting Standards - Accounting for Acquisitions of Interests in Joint Operations AASB 1 & AASB 11)AASB 2014-6 Amendments to Australian Accounting Standards - Agriculture Bearer Plants (AASB 101, AASB 116, AASB 117,AASB 123, AASB 136, AASB 140 & AASB 141)AASB 2015-9 Amendments to Australia Accounting Standards - Scope and Application Paragraphs (AASB 8, AASB 133 & AASB 1057).AASB 2015-10 Amendments to Australian Accounting Standards - Effective Date of Amendments to AASB 10 and AASB 128.
AASB 2015-1 Amendments to Australian Accounting Standards - Annual Improvements to Australian Accounting Standards 2012-2014 Cycle (AASB , AASB 2, AASB 3, AASB 5, AASB 7, AASB 11, AASB 110, AASB 119. AASB 121, AASB 133, AASB 134, AASB 137 and AASB 140)
Amends the methods of disposal in AASB 5 Non-current assets held for sale and discontinued operaitons. Amends AASB 7 Financial instruments by including further guidance on servicing contracts.
The assessment has indicated that when an asset (or disposal group) is reclassified from ‘held to sale’ to ‘held for distribution’, or vice versa, the asset does not have to be reinstated in the financial statements.
AASB 2015-6 Amendments to Australian Accounting Standards - Extending Related Party Disclosures to Not-for-Profit Public Sector Entities(AASB 10, AASB 124 & AASB 1049)
AASB 2015-6 extends the scope of AASB 124 Related Party Disclosures to not-for-profit sector entities. Guidance has been included to assist the application of the Standard by not-for-profit public sector entities.
The amending standard will result in extended disclosures on the entity's key management personnel (KMP) and the related party transactions.
Lower Murray Water Annual Report 2015/16 63

2015/16 Financial ReportNOTES ACCOMPANYING THE FINANCIAL STATEMENTS
Note 2 - FINANCIAL RISK MANAGEMENT OBJECTIVES AND POLICIES
Lower Murray Water's activities expose it to a variety of financial risks: market risk, credit risk and liquidity risk. Lower Murray Water'soverall risk management program focuses on the unpredictability of financial markets and seeks to minimise potential adverse effects on thefinancial performance of Lower Murray Water. Lower Murray Water uses different methods to measure different types of risk to which it isexposed. The methods include sensitivity analysis in the case of interest rate and ageing analysis for credit risk.
Lower Murray Water's principal financial instruments are loans sourced from the Treasury Corporation of Victoria. The loans include atcall floating borrowings and fixed rate loans which are used to fund the capital expenditure program.
Lower Murray Water has other financial assets and liabilities such as receivables and payables which arise directly from its operatingactivities.
Risk management is carried out by the management group in conjunction with the Audit and Risk Committee under policies approved bythe Board of Directors. The finance department identifies and evaluates financial risks in close co-operation with Lower Murray Water'soperating units. The Board reviews and endorses policies and processes for managing these risks and they are summarised below.
(a) Market Risk
Market risk is the risk that changes in market prices will affect the fair value or future cash flows of Lower Murray Water's financialinstruments. Market risk comprises of foreign exchange risk, interest rate risk and other price risk. Lower Murray Water’s exposure tomarket risk is primarily through interest rate risk; there is no exposure to foreign exchange risk and insignificant exposure to other price risks.
(i) Interest Rate Risk
Lower Murray Water’s exposure to market interest rates relates primarily to Lower Murray Water’s long term borrowings and funds investedon the money market.
The interest rate on Lower Murray Water’s long term borrowings is fixed. Lower Murray Water occasionally uses short term floating interestrate borrowings by way of the Treasury Corporation of Victoria's 11am facility. The short term nature of the floating facility and the fixedlong term borrowings therefore do not expose Lower Murray Water to any material interest rate risk.
Lower Murray Water has minimal exposure to interest rate risk through its holding of cash assets and other financial assets. LowerMurray Water manages its interest rate risk by maintaining a diversified mix of at call floating and fixed rate investment products.
Where Lower Murray Water engages in longer term borrowing to finance long term infrastructure assets it may seek to extend the term ofborrowing beyond the debt portfolio range set out in its Treasury Management Policy so as to reduce the interest rate risk that couldoccur when refinancing of longer date borrowings are reset.
Lower Murray Water Annual Report 2015/16 64
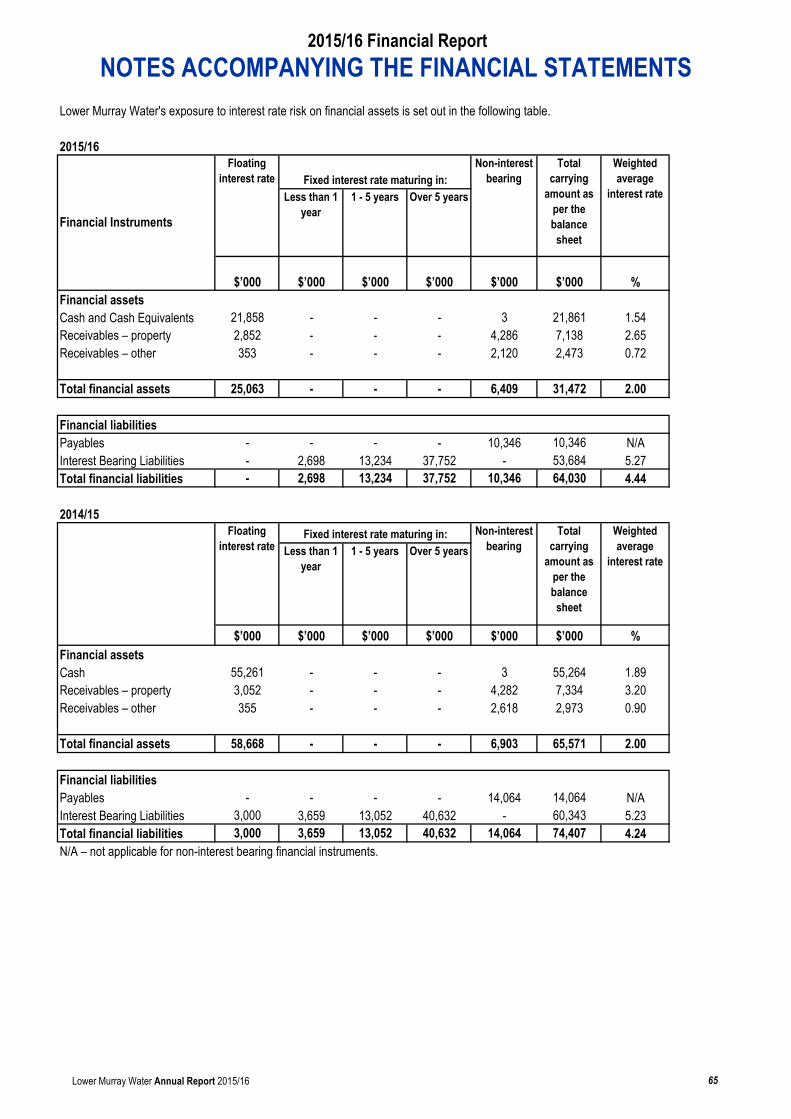
2015/16 Financial ReportNOTES ACCOMPANYING THE FINANCIAL STATEMENTS
Lower Murray Water's exposure to interest rate risk on financial assets is set out in the following table.
2015/16
$’000 $’000 $’000 $’000 $’000 $’000 %Financial assetsCash and Cash Equivalents 21,858 - - - 3 21,861 1.54Receivables – property 2,852 - - - 4,286 7,138 2.65Receivables – other 353 - - - 2,120 2,473 0.72
Total financial assets 25,063 - - - 6,409 31,472 2.00
Financial liabilities- - - - 10,346 10,346 N/A
Interest Bearing Liabilities - 2,698 13,234 37,752 - 53,684 5.27Total financial liabilities - 2,698 13,234 37,752 10,346 64,030 4.44
2014/15
$’000 $’000 $’000 $’000 $’000 $’000 %Financial assets
55,261 - - - 3 55,264 1.89Receivables – property 3,052 - - - 4,282 7,334 3.20Receivables – other 355 - - - 2,618 2,973 0.90
Total financial assets 58,668 - - - 6,903 65,571 2.00
Financial liabilities- - - - 14,064 14,064 N/A
Interest Bearing Liabilities 3,000 3,659 13,052 40,632 - 60,343 5.23Total financial liabilities 3,000 3,659 13,052 40,632 14,064 74,407 4.24N/A – not applicable for non-interest bearing financial instruments.
Cash
Payables
Less than 1 year
1 - 5 years Over 5 yearsTotal
carrying amount as
per the balance sheet
Weighted average
interest rate
Payables
Floating interest rate
Fixed interest rate maturing in: Non-interest bearing
Less than 1 year
1 - 5 years Over 5 years
Financial Instruments
Floating interest rate Fixed interest rate maturing in:
Non-interest bearing
Total carrying
amount as per the balance sheet
Weighted average
interest rate
Lower Murray Water Annual Report 2015/16 65

2015/16 Financial ReportNOTES ACCOMPANYING THE FINANCIAL STATEMENTS
(ii) Foreign Exchange Risk
Lower Murray Water has no exposure to changes in the foreign exchange rate.
(iii) Other Price Risk
Lower Murray Water has no significant exposure to other price risk.
Market Risk Sensitivity Analysis
Taking into account past performance, future expectations, economic forecasts and management's knowledge and experience of thefinancial markets, Lower Murray Water believes that a movement of 0.5% in interest rates is reasonably possible over the next 12 months.The impacts on Lower Murray Water's net result and equity is disclosed in the following table.
CarryingAmount Result Equity Result Equity
$'000 $'000 $'000 $'000 $'000Financial assetsCash and Cash Equivalents 21,861 (109) (109) 109 109
10,176 (16) (16) 16 16Financial LiabilitiesInterest Bearing Liabilities 53,684 - - - - Total increase/(decrease) (125) (125) 125 125
Not all receivables have a floating interest rate applicable to it. Some amounts are subject to fixed rates, or no interest is applicable.Interest bearing liabilities include borrowings on an 11am account which is subject to a floating interest rate.
CarryingAmount Result Equity Result Equity
$'000 $'000 $'000 $'000 $'000Financial assetsCash and Cash Equivalents 55,264 (276) (276) 276 276
10,307 (17) (17) 17 17Financial LiabilitiesInterest Bearing Liabilities 60,343 15 15 (15) (15)Total increase/(decrease) (278) (278) 278 278
Receivables
30 June 2015
Interest Rate Risk-0.5% +0.5%
Receivables
30 June 2016
Interest Rate Risk-0.5% +0.5%
Lower Murray Water Annual Report 2015/16 66

2015/16 Financial ReportNOTES ACCOMPANYING THE FINANCIAL STATEMENTS
(b) Credit Risk
Credit risk is the risk of financial loss to Lower Murray Water as a result of a customer or counterparty to a financial instrument failing to meet its contractual obligations. Credit risk arises principally from Lower Murray Water's receivables.
Lower Murray Water’s exposure to credit risk is influenced by the individual characteristics of each customer. The receivable balanceconsists of a large number of residential and business customers which are spread across a diverse range of industries. Receivablebalances are monitored on an on-going basis to ensure that exposure to bad debts is not significant. Lower Murray Water has in placea policy and procedure for the collection of overdue receivables.
An analysis of the ageing of Lower Murray Water’s past due but not impaired receivables at reporting date has been provided inNote 8 (b).
At 30 June 2016, Lower Murray Water had no credit risk arising from investments. Exposure to credit risk from other financial assets isrepresented in the carrying amount of these assets in the Balance Sheet.
(c) Liquidity Risk
Liquidity Risk is the risk that Lower Murray Water will not be able to meet its financial obligations as they fall due. Lower Murray Water’spolicy is to settle financial obligations within 30 days and in the event of dispute make payments within 30 days from the date of resolution.
Lower Murray Water manages liquidity risk by maintaining adequate reserves, banking facilities and reserve borrowing facilities bycontinuously monitoring forecasts and actual cash flows and matching the maturity profiles of financial assets and financial liabilities.
Lower Murray Water’s financial liability maturities are disclosed in the following table.
2015/16
$’000 $’000 $’000 $’000 $’000 $’000 $’00010,346 10,346 - - - - -
Interest Bearing Liabilities 53,684 344 2,354 4,740 2,784 5,710 37,752Total financial liabilities 64,030 10,690 2,354 4,740 2,784 5,710 37,752
2014/15
$’000 $’000 $’000 $’000 $’000 $’000 $’00014,064 14,064 - - - - -
Interest Bearing Liabilities 60,343 4,325 2,334 2,698 4,740 5,614 40,632Total financial liabilities 74,407 18,389 2,334 2,698 4,740 5,614 40,632
The Receivables and payables exclude statutory amounts.
More than 5 years
Payables
Over 3 years to 5 years
More than 5 years
Payables
Financial Instruments
Carrying Amount
6 months or less
Over 6 months to 1
year
Over 1 year to 2 years
Over 2 years to 3 years
Over 3 years to 5 years
Financial Instruments
Carrying Amount
6 months or less
Over 6 months to 1
year
Over 1 year to 2 years
Over 2 years to 3 years
Lower Murray Water Annual Report 2015/16 67

2015/16 Financial ReportNOTES ACCOMPANYING THE FINANCIAL STATEMENTS
(d) Fair Value Measurements
The carrying value of payables and receivables less impairment provision is a reasonable approximation of their fair values due to theshort-term nature of payables and receivables. The fair value of financial liabilities for disclosure purposes is estimated by discounting thefuture contractual cash flows at the current market interest rate that is offered by the Treasury Corporation of Victoria to Lower MurrayWater.
The carrying amounts and aggregate net fair values of financial assets and financial liabilities at balance date have been providedin the following table.
Net Fair Value of Financial Assets and Liabilities2016 2016 2015 2015
CarryingAmount
Net FairValue
CarryingAmount
Net FairValue
$'000 $'000 $'000 $'000Financial AssetsCash and Cash Equivalents 21,861 21,861 55,264 55,264Receivables 10,176 10,176 10,307 10,307Total Financial Assets 32,037 32,037 65,571 65,571
Financial LiabilitiesPayables 10,346 10,346 14,064 14,064Interest Bearing Liabilities 53,684 69,181 60,343 70,108Total Financial Liabilities 64,030 79,527 74,407 84,172
Net market values of financial instruments are determined on the following basis:• Cash, receivables, payables are valued at their carrying amounts as this approximates net market value.• Interest Bearing Liabilities are valued by discounting the expected future cash flows at yields offered by the Treasury Corporation of Victoria at balance date.
Fair Value Measurement HierarchyThe following table presents Lower Murray Water's financial liabilities measured and recognised at fair value by level of the fair valuemeasurement hierarchy:
Level 1 - quoted prices (unadjusted) in active markets for identical assets or liabilitiesLevel 2 - inputs other than quoted prices included within level 1 that are observable for the asset or liability, either directly (as prices) of indirectly (derived from prices), andLevel 3 - inputs for the asset or liability that are not based on observable market data (unobservable inputs).
Level 1 Level 2 Level 3 Total$'000 $'000 $'000 $'000
30 June 2016Financial LiabilitiesInterest Bearing Liabilities - 69,181 - 69,181
Total Financial Liabilities - 69,181 - 69,181`
30 June 2015Financial LiabilitiesInterest Bearing Liabilities - 70,108 - 70,108
Total Financial Liabilities - 70,108 - 70,108
Lower Murray Water Annual Report 2015/16 68

2015/16 Financial ReportNOTES ACCOMPANYING THE FINANCIAL STATEMENTS
Note 3 - REVENUE
(a) Operating Revenue comprises:TOTAL
WATER & WASTEWATER
IRRIGATION & DRAINAGE
2016 2015 2016 2015 2016 2015$'000 $'000 $'000 $'000 $'000 $'000
General Tariff Charges 37,939 37,235 19,108 18,544 18,831 18,691Government Pensioner Rate Reimbursement 2,134 2,068 2,083 2,024 51 44Metered Charges 19,233 17,770 13,468 12,503 5,765 5,267Trade Waste Charges 768 731 768 731 - -Customer Service Obligations 159 161 159 161 - -
60,233 57,965 35,586 33,963 24,647 24,002
(b) Income For Capital Purposes:TOTAL
WATER & WASTEWATER
IRRIGATION & DRAINAGE
2016 2015 2016 2015 2016 2015$'000 $'000 $'000 $'000 $'000 $'000
Developer/Capital Contributions 2,081 2,577 1,868 2,307 213 270Government Contributions 1,500 2,500 - - 1,500 2,500Scheme Contributions 21 34 21 11 - 23
3,602 5,111 1,889 2,318 1,713 2,793
Income for developer/capital purposes are once off payments which may not occur in future periods.
(c) Other Revenue:TOTAL
WATER & WASTEWATER
IRRIGATION & DRAINAGE
2016 2015 2016 2015 2016 2015$'000 $'000 $'000 $'000 $'000 $'000
Income from Fees 1,413 1,389 949 941 464 448Rent/Lease/Annual Water Trade Income 1,680 1,068 1,362 1,022 318 46Government Contributions (Non Capital) - 50 - - - 50Sundry Income 678 871 372 441 306 430
3,771 3,378 2,683 2,404 1,088 974
(d) Interest Revenue comprises:TOTAL
WATER & WASTEWATER
IRRIGATION & DRAINAGE
2016 2015 2016 2015 2016 2015$'000 $'000 $'000 $'000 $'000 $'000
Interest from cash and cash equivalents 694 796 60 62 634 734Interest on Charges 140 145 - - 140 145Interest on Private Schemes 33 29 33 29 - -
867 970 93 91 774 879
Lower Murray Water Annual Report 2015/16 69
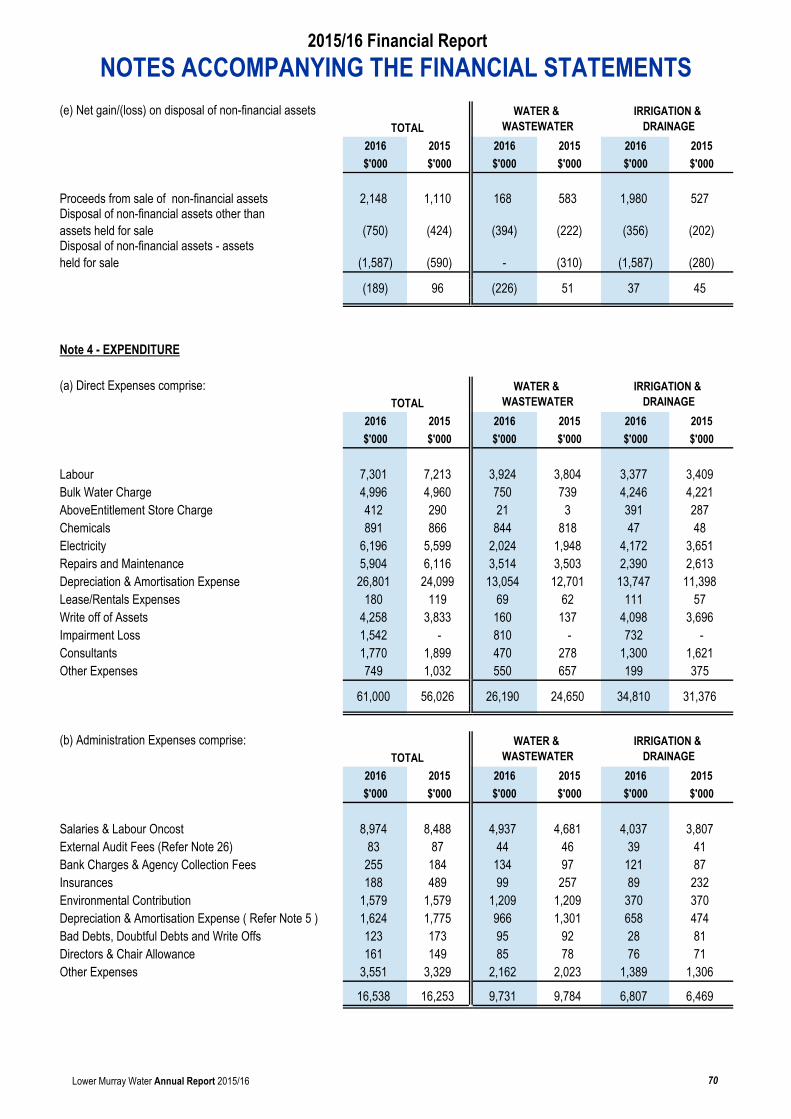
2015/16 Financial ReportNOTES ACCOMPANYING THE FINANCIAL STATEMENTS
(e) Net gain/(loss) on disposal of non-financial assetsTOTAL
WATER & WASTEWATER
IRRIGATION & DRAINAGE
2016 2015 2016 2015 2016 2015$'000 $'000 $'000 $'000 $'000 $'000
Proceeds from sale of non-financial assets 2,148 1,110 168 583 1,980 527
(750) (424) (394) (222) (356) (202)
(1,587) (590) - (310) (1,587) (280)
(189) 96 (226) 51 37 45
Note 4 - EXPENDITURE
(a) Direct Expenses comprise:TOTAL
WATER & WASTEWATER
IRRIGATION & DRAINAGE
2016 2015 2016 2015 2016 2015$'000 $'000 $'000 $'000 $'000 $'000
Labour 7,301 7,213 3,924 3,804 3,377 3,409Bulk Water Charge 4,996 4,960 750 739 4,246 4,221AboveEntitlement Store Charge 412 290 21 3 391 287Chemicals 891 866 844 818 47 48Electricity 6,196 5,599 2,024 1,948 4,172 3,651Repairs and Maintenance 5,904 6,116 3,514 3,503 2,390 2,613
26,801 24,099 13,054 12,701 13,747 11,398Lease/Rentals Expenses 180 119 69 62 111 57Write off of Assets 4,258 3,833 160 137 4,098 3,696Impairment Loss 1,542 - 810 - 732 -Consultants 1,770 1,899 470 278 1,300 1,621Other Expenses 749 1,032 550 657 199 375
61,000 56,026 26,190 24,650 34,810 31,376
(b) Administration Expenses comprise:TOTAL
WATER & WASTEWATER
IRRIGATION & DRAINAGE
2016 2015 2016 2015 2016 2015$'000 $'000 $'000 $'000 $'000 $'000
Salaries & Labour Oncost 8,974 8,488 4,937 4,681 4,037 3,807External Audit Fees (Refer Note 26) 83 87 44 46 39 41Bank Charges & Agency Collection Fees 255 184 134 97 121 87Insurances 188 489 99 257 89 232Environmental Contribution 1,579 1,579 1,209 1,209 370 370Depreciation & Amortisation Expense ( Refer Note 5 ) 1,624 1,775 966 1,301 658 474Bad Debts, Doubtful Debts and Write Offs 123 173 95 92 28 81Directors & Chair Allowance 161 149 85 78 76 71Other Expenses 3,551 3,329 2,162 2,023 1,389 1,306
16,538 16,253 9,731 9,784 6,807 6,469
Disposal of non-financial assets other than assets held for saleDisposal of non-financial assets - assets held for sale
Depreciation & Amortisation Expense
Lower Murray Water Annual Report 2015/16 70

2015/16 Financial ReportNOTES ACCOMPANYING THE FINANCIAL STATEMENTS
(c) Finance Costs:TOTAL
WATER & WASTEWATER
IRRIGATION & DRAINAGE
2016 2015 2016 2015 2016 2015$'000 $'000 $'000 $'000 $'000 $'000
Interest on Loans 3,050 3,213 1,460 1,505 1,590 1,708Financial Accommodation Levy 614 652 278 289 336 363
3,664 3,865 1,738 1,794 1,926 2,071
Note 5 - DEPRECIATION & AMORTISATION
Depreciation & Amortisation expense for the year:2016 2015
Depreciation $'000 $'000
Infrastructure 26,330 23,536Buildings 471 563Plant, Equipment and Vehicles 1,055 1,133
27,856 25,232
Software Amortisation 569 642
28,425 25,874
Allocated to direct expenses (Refer Note 4a) 26,801 24,099Allocated to administration expenses (Refer Note 4b) 1,624 1,775
28,425 25,874
Lower Murray Water Annual Report 2015/16 71

2015/16 Financial ReportNOTES ACCOMPANYING THE FINANCIAL STATEMENTS
Note 6 - INCOME TAX EXPENSE
The income tax expense for the financial year differs from the amount calculated on the net result before taxThe differences are reconciled as follows:
2016 2015$'000 $'000
a. Components of tax expense:
Current Tax Payable - -Deferred tax relating to temporary differences 4,262 2,584Adjustments for current tax on prior periods - -
4,262 2,584
Deferred income tax expense included in income tax expense comprises:Decrease/(Increase) in Deferred Tax Asset (Note 18) 988 (1,589)(Decrease)/Increase in Deferred Tax Liability (Note 18) 14,155 (574)Decrease/(Increase) in Equity (Note 19) (19,405) (421)
(4,262) (2,584)
b. The prima facie tax on net result from ordinary activities before income tax is reconciled to the income tax as follows:
Net result from ordinary activities before income tax (12,753) (8,443)
Prima facie tax payable on net result from ordinary activities before income tax at 30% (2015: 30%) (3,826) (2,533)
Add tax effect of:Other non allowable items 28 45Recoupment of losses - -
(3,798) (2,488)Tax effect of:Other items of income and expenditure (464) (96)Correction to prior year tax expense - -
Income Tax Expense/(Revenue) recognised in the Comprehensive Operating Statement (4,262) (2,584)
Lower Murray Water Annual Report 2015/16 72
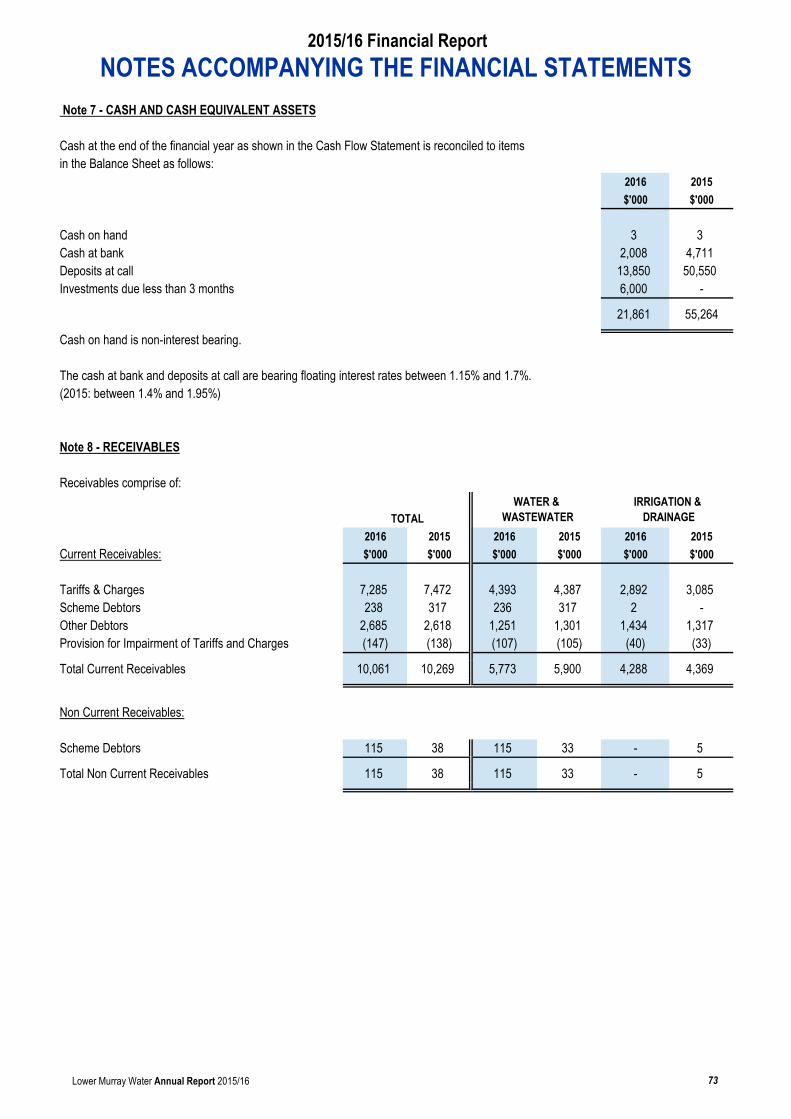
2015/16 Financial ReportNOTES ACCOMPANYING THE FINANCIAL STATEMENTS
Note 7 - CASH AND CASH EQUIVALENT ASSETS
Cash at the end of the financial year as shown in the Cash Flow Statement is reconciled to itemsin the Balance Sheet as follows:
2016 2015$'000 $'000
Cash on hand 3 3Cash at bank 2,008 4,711Deposits at call 13,850 50,550Investments due less than 3 months 6,000 -
21,861 55,264
Cash on hand is non-interest bearing.
The cash at bank and deposits at call are bearing floating interest rates between 1.15% and 1.7%.(2015: between 1.4% and 1.95%)
Note 8 - RECEIVABLES
Receivables comprise of:
TOTALWATER &
WASTEWATERIRRIGATION &
DRAINAGE2016 2015 2016 2015 2016 2015
Current Receivables: $'000 $'000 $'000 $'000 $'000 $'000
Tariffs & Charges 7,285 7,472 4,393 4,387 2,892 3,085Scheme Debtors 238 317 236 317 2 -Other Debtors 2,685 2,618 1,251 1,301 1,434 1,317Provision for Impairment of Tariffs and Charges (147) (138) (107) (105) (40) (33)
Total Current Receivables 10,061 10,269 5,773 5,900 4,288 4,369
Non Current Receivables:
Scheme Debtors 115 38 115 33 - 5
Total Non Current Receivables 115 38 115 33 - 5
Lower Murray Water Annual Report 2015/16 73
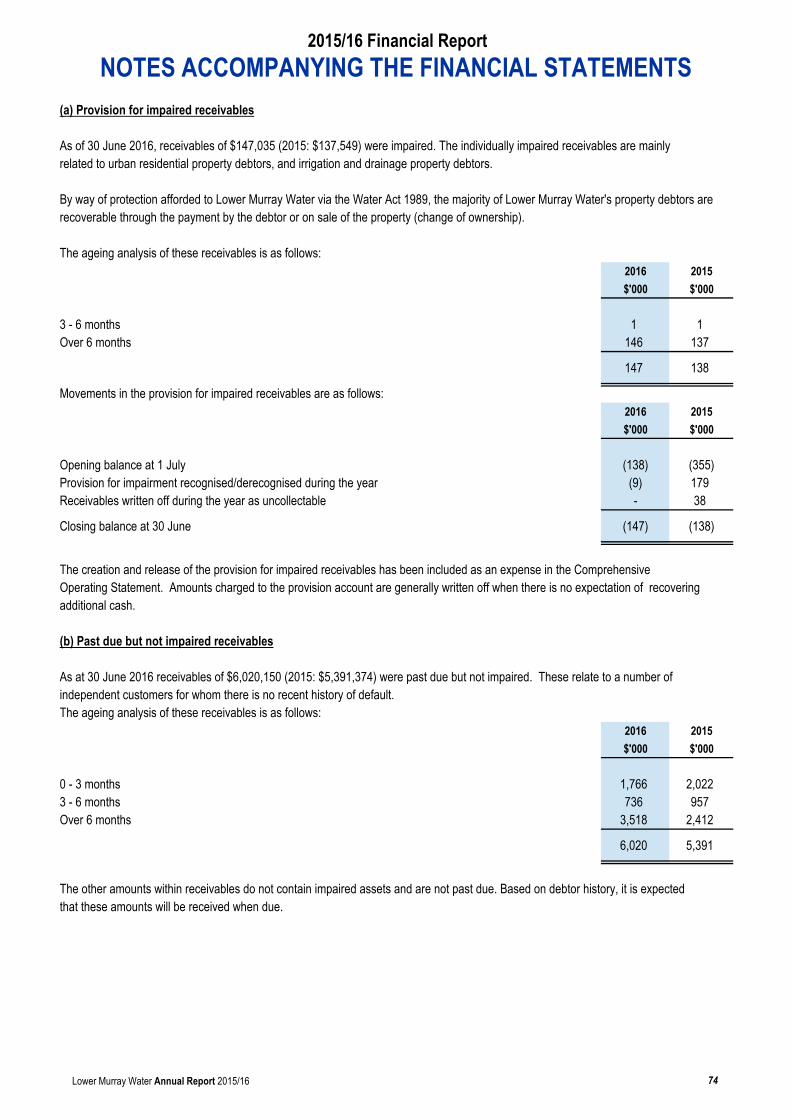
2015/16 Financial ReportNOTES ACCOMPANYING THE FINANCIAL STATEMENTS
(a) Provision for impaired receivables
As of 30 June 2016, receivables of $147,035 (2015: $137,549) were impaired. The individually impaired receivables are mainlyrelated to urban residential property debtors, and irrigation and drainage property debtors.
By way of protection afforded to Lower Murray Water via the Water Act 1989, the majority of Lower Murray Water's property debtors arerecoverable through the payment by the debtor or on sale of the property (change of ownership).
The ageing analysis of these receivables is as follows:2016 2015$'000 $'000
3 - 6 months 1 1Over 6 months 146 137
147 138
Movements in the provision for impaired receivables are as follows:2016 2015$'000 $'000
Opening balance at 1 July (138) (355)Provision for impairment recognised/derecognised during the year (9) 179Receivables written off during the year as uncollectable - 38
Closing balance at 30 June (147) (138)
The creation and release of the provision for impaired receivables has been included as an expense in the ComprehensiveOperating Statement. Amounts charged to the provision account are generally written off when there is no expectation of recoveringadditional cash.
(b) Past due but not impaired receivables
As at 30 June 2016 receivables of $6,020,150 (2015: $5,391,374) were past due but not impaired. These relate to a number ofindependent customers for whom there is no recent history of default. The ageing analysis of these receivables is as follows:
2016 2015$'000 $'000
0 - 3 months 1,766 2,0223 - 6 months 736 957Over 6 months 3,518 2,412
6,020 5,391
The other amounts within receivables do not contain impaired assets and are not past due. Based on debtor history, it is expectedthat these amounts will be received when due.
Lower Murray Water Annual Report 2015/16 74

2015/16 Financial ReportNOTES ACCOMPANYING THE FINANCIAL STATEMENTS
(c) Fair value
Due to the short-term nature of the current receivables, their carrying value is assumed to approximate their fair value.
Assessment of the non-current receivables reveals their carrying value also approximates to fair value.
2016 2016 2015 2015Carrying Amount
Net Fair Value
Carrying Amount
Net Fair Value
$'000 $'000 $'000 $'000
Scheme Debtors 115 115 38 38
The maximum exposure to credit risk at the reporting date is the higher of the carrying value and fair value of Scheme Debtors. TheCorporation does not hold any collateral as security. Refer to Note 2 for more information of the risk management policy of the Corporation.
Note 9 - INVENTORIES
Values as at 30 June, were:2016 2015$'000 $'000
Stores and Consumables - at cost 3,028 2,967
Total Inventories 3,028 2,967
Note 10 - ASSETS HELD FOR SALE
(a) Movements during the reporting period 2016 2015$'000 $'000
Balance 1 July - Land held for Sale 4,917 5,937Revaluation increment/(decrement) (Note 20) - (430)Sales (1,587) (590)
Total Assets Held for Sale 3,330 4,917
Land held for sale is where the board has determined to sell excess land held by Lower Murray Water and sale is highly probable.
Lower Murray Water Annual Report 2015/16 75
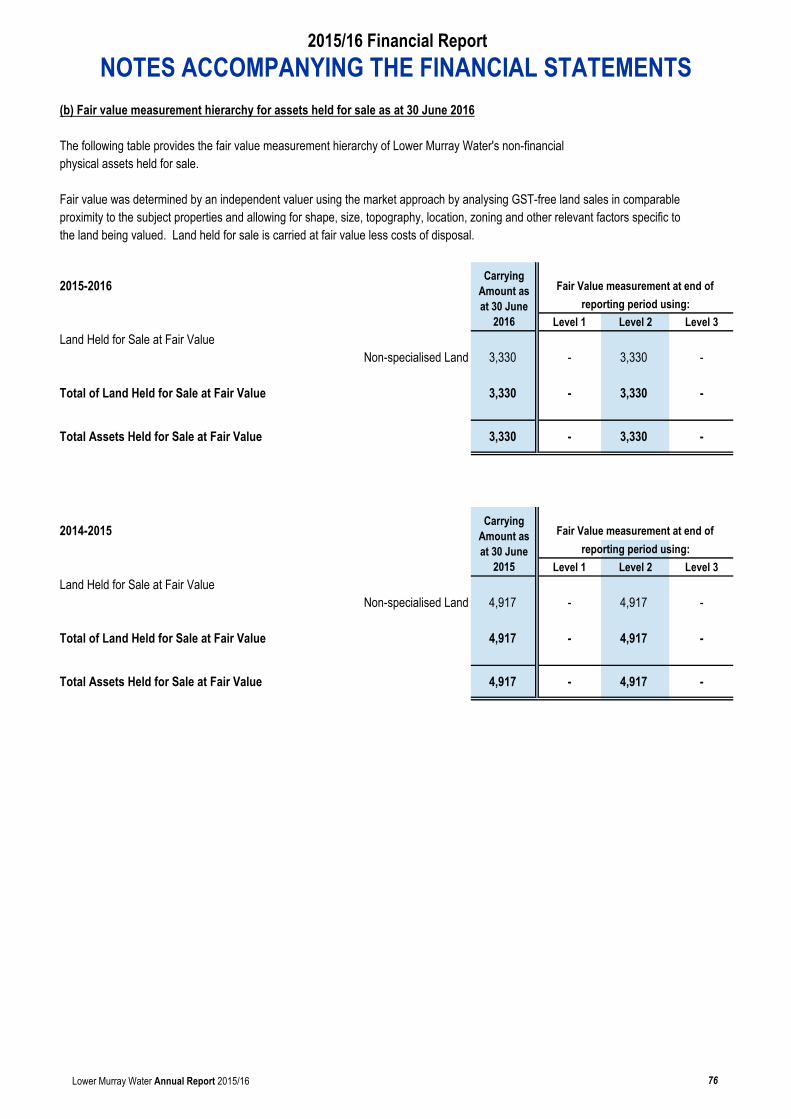
2015/16 Financial ReportNOTES ACCOMPANYING THE FINANCIAL STATEMENTS
(b) Fair value measurement hierarchy for assets held for sale as at 30 June 2016
The following table provides the fair value measurement hierarchy of Lower Murray Water's non-financialphysical assets held for sale.
Fair value was determined by an independent valuer using the market approach by analysing GST-free land sales in comparableproximity to the subject properties and allowing for shape, size, topography, location, zoning and other relevant factors specific tothe land being valued. Land held for sale is carried at fair value less costs of disposal.
2015-2016reporting period using:
Level 1 Level 2 Level 3Land Held for Sale at Fair Value
Non-specialised Land 3,330 - 3,330 -
Total of Land Held for Sale at Fair Value 3,330 - 3,330 -
Total Assets Held for Sale at Fair Value 3,330 - 3,330 -
2014-2015reporting period using:
Level 1 Level 2 Level 3Land Held for Sale at Fair Value
Non-specialised Land 4,917 - 4,917 -
Total of Land Held for Sale at Fair Value 4,917 - 4,917 -
Total Assets Held for Sale at Fair Value 4,917 - 4,917 -
CarryingAmount asat 30 June
2016
Fair Value measurement at end of
CarryingAmount asat 30 June
2015
Fair Value measurement at end of
Lower Murray Water Annual Report 2015/16 76
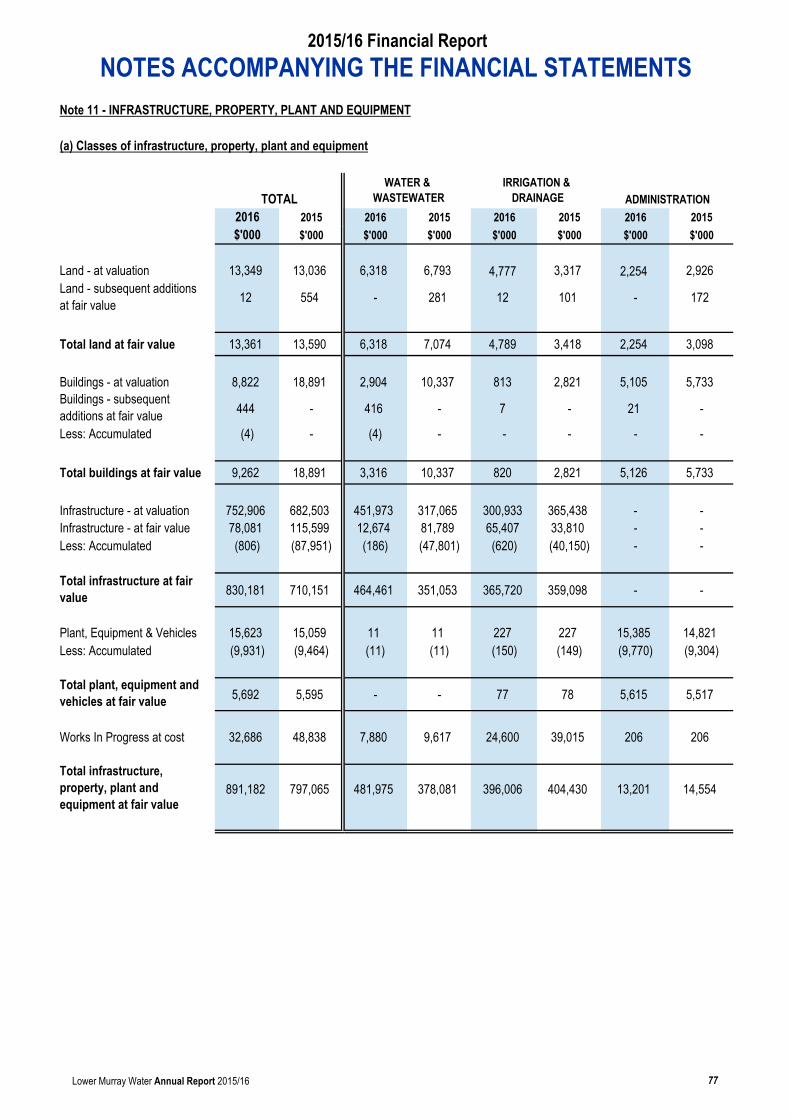
2015/16 Financial ReportNOTES ACCOMPANYING THE FINANCIAL STATEMENTS
Note 11 - INFRASTRUCTURE, PROPERTY, PLANT AND EQUIPMENT
(a) Classes of infrastructure, property, plant and equipment
TOTALWATER &
WASTEWATERIRRIGATION &
DRAINAGE ADMINISTRATION2016 2015 2016 2015 2016 2015 2016 2015$'000 $'000 $'000 $'000 $'000 $'000 $'000 $'000
13,349 13,036 6,318 6,793 4,777 3,317 2,254 2,926
12 554 - 281 12 101 - 172
Total land at fair value 13,361 13,590 6,318 7,074 4,789 3,418 2,254 3,098
8,822 18,891 2,904 10,337 813 2,821 5,105 5,733
444 - 416 - 7 - 21 -
(4) - (4) - - - - -
Total buildings at fair value 9,262 18,891 3,316 10,337 820 2,821 5,126 5,733
752,906 682,503 451,973 317,065 300,933 365,438 - -78,081 115,599 12,674 81,789 65,407 33,810 - -(806) (87,951) (186) (47,801) (620) (40,150) - -
830,181 710,151 464,461 351,053 365,720 359,098 - -
15,623 15,059 11 11 227 227 15,385 14,821(9,931) (9,464) (11) (11) (150) (149) (9,770) (9,304)
5,692 5,595 - - 77 78 5,615 5,517
Works In Progress at cost 32,686 48,838 7,880 9,617 24,600 39,015 206 206
891,182 797,065 481,975 378,081 396,006 404,430 13,201 14,554Total infrastructure, property, plant and equipment at fair value
Infrastructure - at fair valueLess: Accumulated
Total infrastructure at fair value
Plant, Equipment & VehiclesLess: Accumulated
Total plant, equipment and vehicles at fair value
Land - at valuationLand - subsequent additionsat fair value
Buildings - at valuationBuildings - subsequent additions at fair valueLess: Accumulated
Infrastructure - at valuation
Lower Murray Water Annual Report 2015/16 77

2015/16 Financial ReportNOTES ACCOMPANYING THE FINANCIAL STATEMENTS
Freehold land and buildings carried at fair value
An independent valuation of Lower Murray Water's land and buildings was performed by Egan National Valuers (Vic) to determine the fairvalue of the land and buildings, with the effective date of 30 June 2016.
Fair value was determined by analysing GST-free land sales in comparable proximity to the subject properties and allowing for shape,size, topography, location, zoning and other relevant factors specific to the land being valued. From the sales analysed, an appropriate$-rate per square metre has been applied to the subject land. An allowance for Community Service Obligation for the risk associatedwith the removal of the public use restrictions was applied to various sites.
The methodology employed to value the buildings was a mixture of market based direct comparison approach whereby the subject buildings are compared to recent comparable sales and the depreciated replacement cost method. The depreciated replacement cost method is used where the approach on market evidence is not suitable as the property is rarely sold except as part of a continuing business, or alternatively, the improvements are of a specialised nature and the market buying price would differ materially to themarket selling price. The depreciated replacement cost is the cost of the asset considering the useful life of the asset and then making a deduction based on the condition of the asset and the used economic life of that asset.
Infrastructure carried at fair value
An independent valuation of Lower Murray Water's infrastructure was performed by the Valuer-General Victoria who engaged Jacobs todetermine the fair value of the infrastructure. The valuation, which conforms to Australian Valuation Standards, determined fair valueusing the depreciated replacement cost method, with the current replacement costs based on the modern equivalent inaccordance with the relevant legislation, industry standards and guidelines. The Board assessed all valuation methodologies inin determining the the depreciated replacement cost method. Where Lower Murray Water provided a reasonable condition assessment to Jacob, the remaining useful life of assets have been based on this condition assessment. Where no conditioninformation is available, remaining useful life is estimated by subtracting the assets actual age (based on construction date) from itstheoretical useful life. The effective date of the valuation is 30 June 2016.
Plant, Equipment & Vehicles carried at fair value
For plant, equipment and vehicles, existing depreciated replacement cost is generally a reasonable proxy for depreciated replacementcost because of the short lives of the assets concerned.
Lower Murray Water Annual Report 2015/16 78
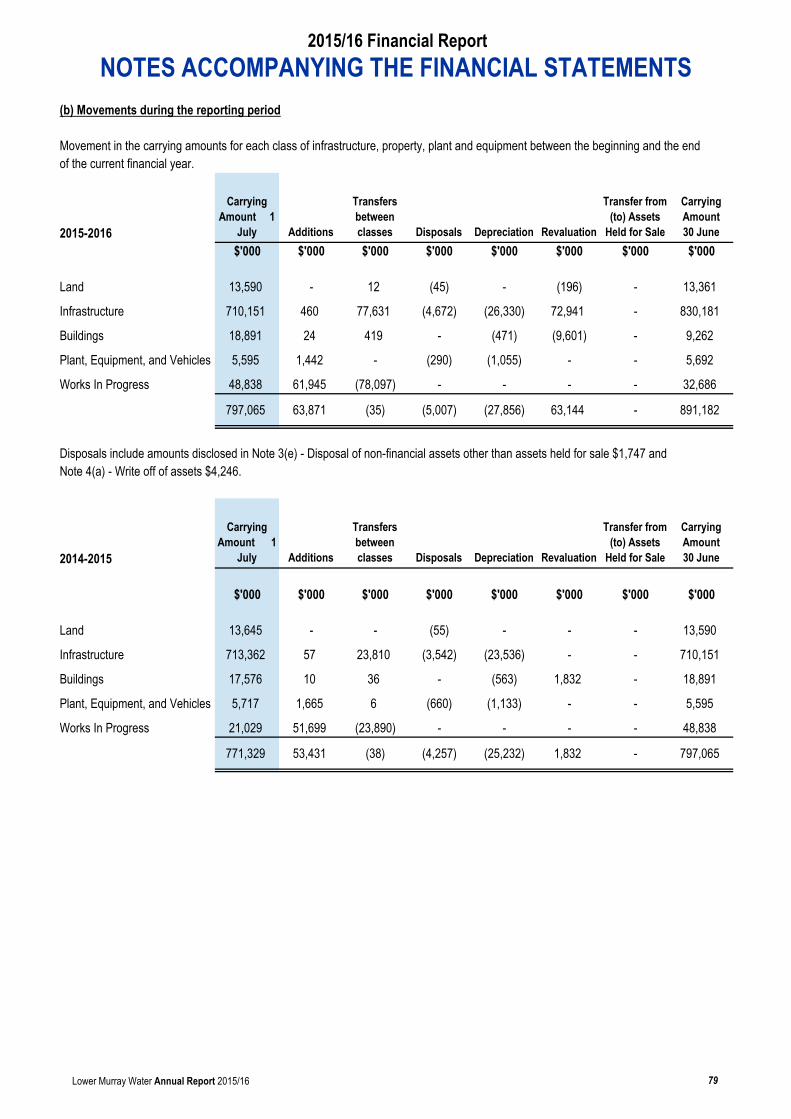
2015/16 Financial ReportNOTES ACCOMPANYING THE FINANCIAL STATEMENTS
(b) Movements during the reporting period
Movement in the carrying amounts for each class of infrastructure, property, plant and equipment between the beginning and the endof the current financial year.
2015-2016
Carrying Amount 1
July Additions
Transfers between classes Disposals Depreciation Revaluation
Transfer from (to) Assets
Held for Sale
Carrying Amount 30 June
$'000 $'000 $'000 $'000 $'000 $'000 $'000 $'000
Land 13,590 - 12 (45) - (196) - 13,361
Infrastructure 710,151 460 77,631 (4,672) (26,330) 72,941 - 830,181
Buildings 18,891 24 419 - (471) (9,601) - 9,262
5,595 1,442 - (290) (1,055) - - 5,692
Works In Progress 48,838 61,945 (78,097) - - - - 32,686
797,065 63,871 (35) (5,007) (27,856) 63,144 - 891,182
Disposals include amounts disclosed in Note 3(e) - Disposal of non-financial assets other than assets held for sale $1,747 andNote 4(a) - Write off of assets $4,246.
2014-2015
Carrying Amount 1
July Additions
Transfers between classes Disposals Depreciation Revaluation
Transfer from (to) Assets
Held for Sale
Carrying Amount 30 June
$'000 $'000 $'000 $'000 $'000 $'000 $'000 $'000
Land 13,645 - - (55) - - - 13,590
Infrastructure 713,362 57 23,810 (3,542) (23,536) - - 710,151
Buildings 17,576 10 36 - (563) 1,832 - 18,891
5,717 1,665 6 (660) (1,133) - - 5,595
Works In Progress 21,029 51,699 (23,890) - - - - 48,838
771,329 53,431 (38) (4,257) (25,232) 1,832 - 797,065
Plant, Equipment, and Vehicles
Plant, Equipment, and Vehicles
Lower Murray Water Annual Report 2015/16 79

2015/16 Financial ReportNOTES ACCOMPANYING THE FINANCIAL STATEMENTS
(c) Fair value measurement hierarchy for assets as at 30 June 2016
Refer Note 1 for the accounting policy relating to disclosure of the fair value measurement hierarchy.
The fair value measurement hierarchy for assets as at 30 June 2016 is presented below. Please note this does not reconcile to the tables presented above as this only includes those assets measured at fair value.
2015-2016reporting period using:
Level 1 Level 2 Level 3$'000 $'000 $'000 $'000
Land at Fair ValueNon-specialised Land 10,922 - 10,922 -Specialised Land 2,439 - - 2,439
Total of Land at Fair Value 13,361 - 10,922 2,439
Buildings at Fair ValueNon-specialised Buildings 5,703 - - 5,703Specialised Buildings 3,559 - - 3,559
Total Buildings at Fair Value 9,262 - - 9,262
Plant, Equipment and Vehicles at Fair ValueVehicles 3,797 - - 3,797Plant and Equipment 1,895 - - 1,895
Total of Plant, Equipment and Vehicles as Fair Value 5,692 - - 5,692
Infrastructure at Fair Value `Water Storage 13,967 - - 13,967Water Pumping Stations 20,015 - - 20,015Sewer Pumping Stations 20,525 - - 20,525Irrigation Pumping Stations 49,046 - - 49,046Water Treatment Plants 80,939 - - 80,939Waste Water Treatment Plants 36,104 - - 36,104Water Pipeline Infrastructure 143,914 - - 143,914Sewer Pipeline Infrastructure 148,997 - - 148,997Irrigation Pipeline Infrastructure 297,997 - - 297,997Other Structures 18,677 - - 18,677
Total Infrastructure at Fair Value 830,181 - - 830,181
Total Infrastructure, Property, Plant and Equipment at Fair Value 858,496 - 10,922 847,574
CarryingAmount as at 30 June
2016
Fair Value measurement at end of
Lower Murray Water Annual Report 2015/16 80

2015/16 Financial ReportNOTES ACCOMPANYING THE FINANCIAL STATEMENTS
2014-2015reporting period using:
Level 1 Level 2 Level 3$'000 $'000 $'000 $'000
Land at Fair ValueNon-specialised Land 11,389 - 11,389 -Specialised Land 2,201 - - 2,201
Total of Land at Fair Value 13,590 - 11,389 2,201
Buildings at Fair ValueNon-specialised Buildings 5,749 - 5,749 -Specialised Buildings 13,142 - - 13,142
Total Buildings at Fair Value 18,891 - 5,749 13,142
Plant, Equipment and Vehicles at Fair ValueVehicles 3,736 - - 3,736Plant and Equipment 1,859 - - 1,859
Total of Plant, Equipment and Vehicles as Fair Value 5,595 - - 5,595
Infrastructure at Fair Value `Water Storage 12,629 - - 12,629Water Pumping Stations 8,487 - - 8,487Sewer Pumping Stations 14,272 - - 14,272Irrigation Pumping Stations 33,878 - - 33,878Water Treatment Plants 56,216 - - 56,216Waste Water Treatment Plants 51,795 - - 51,795Water Pipeline Infrastructure 103,239 - - 103,239Sewer Pipeline Infrastructure 104,415 - - 104,415Irrigation Pipeline Infrastructure 310,776 - - 310,776Other Structures 14,444 - - 14,444
Total Infrastructure at Fair Value 710,151 - - 710,151
Total Infrastructure, Property, Plant and Equipment at Fair Value 748,227 - 17,138 731,089
CarryingAmount as at 30 June
2015
Fair Value measurement at end of
Lower Murray Water Annual Report 2015/16 81

2015/16 Financial ReportNOTES ACCOMPANYING THE FINANCIAL STATEMENTS
There were no changes in valuation techniques throughout the period to June 2016.
For all assets measured at fair value, the current use is considered the highest and best use.
Non-specialised Land and BuildingsTo the extent that non-specialised land and buildings do not contain significant, unobservable adjustments, these assets are classifiedas Level 2 under the market approach. (refer to Note 11(a) for valuation technique)
Specialised Land and BuildingsThe market approach is also used for specialised land, although is adjusted for the community service obligation (CSO) to reflect thespecialised nature of the land being valued.
The CSO adjustment is a reflection of the valuer's assessment of the impact of restrictions associated with an asset to the extent that isalso equally applicable to market participants. This approach is in light of the highest and best use consideration required for fairvalue measurement, and takes into account the use of the asset that is physically possible, legally permissible, and financially feasible.As adjustments of CSO are considered as significant unobservable inputs, specialised land would be classified as Level 3 assets.
For Lower Murray Water's majority of specialised buildings, the depreciated replacement cost method is used, adjusting for the associateddepreciations. As depreciation adjustments are considered as significant, unobservable inputs in nature, specialised buildings areclassified as Level 3 fair value measurements.
Plant and EquipmentPlant and equipment is held at fair value. When plant and equipment is specialised in use, such that it is rarely sold other than as partof a going concern, fair value is determined using the depreciated replacement cost method. As depreciation adjustments are consideredas significant, unobservable inputs in nature, plant and equipment are classified as Level 3 fair value measurements.
VehiclesVehicles use the depreciated replacement cost in estimating the fair value. Lower Murray Water acquires new vehicles and at timesdisposes of them before the end of their economic life. The process of acquisition, use and disposal in the market is managed byexperienced fleet managers in Lower Murray Water in which relevant depreciation rates are set during use to reflect the utilisation of thevehicles. As depreciation adjustments are considered as significant, unobservable inputs in nature, vehicles are classified as Level 3 fairvalue measurements.
InfrastructureInfrastructure assets are valued using the depreciated replacement cost method as described in Note 11 (a). As depreciation adjustmentsare based on asset age, theoretical asset remaining useful life and asset condition assessment ratings are all considered as significantunobservable inputs in nature, all the classes within the Infrastructure category are classified as Level 3 fair value measurements.
Lower Murray Water Annual Report 2015/16 82

2015/16 Financial ReportNOTES ACCOMPANYING THE FINANCIAL STATEMENTS
(d) Reconciliation of Level 3 fair value measurement hierarchy
2015-2016
Carrying Amount 1 July
AdditionsTransfers in
(out) of Level 3
Disposals Depreciation Impairment RevaluationTransfer from
(to) Assets Held for Sale
Carrying Amount 30 June
$'000 $'000 $'000 $'000 $'000 $'000 $'000 $'000 $'000
LandSpecialised Land 2,201 - - (45) - - 283 - 2,439
BuildingsNon Specialised Buildings
- 3 5,749 - (204) - 155 - 5,703
Specialised Buildings 13,142 440 - - (267) - (9,756) - 3,559
Plant, Equipment, and VehiclesVehicles 3,736 856 - (648) (147) - - 3,797Plant and Equipment 1,859 586 - (231) (319) - - - 1,895
Infrastructure Water Storage Tanks 12,629 315 - - (684) - 1,707 - 13,967Water Pumping Stations
8,487 296 - (31) (683) - 11,946 - 20,015
Sewer Pumping Stations
14,272 404 - (101) (689) - 6,639 - 20,525
Irrigation Pumping Stations
33,878 15,184 - (2,626) (1,575) - 4,184 - 49,046
Water Treatment Plants
56,216 7,287 - (154) (3,899) - 21,489 - 80,939
Waste Water Treatment Plants
51,795 1,218 - - (2,274) - (14,635) - 36,104
Water Pipeline Infrastructure 103,239 1,629 - (12) (2,287) - 41,345 - 143,914SewerPipeline Infrastructure
104,415 1,523 - - (2,235) - 45,294 - 148,997
Irrigation Pipeline Infrastructure
310,776 50,048 - (3,796) (10,586) - (48,445) - 297,997
Other Structures 14,444 86 - - (167) - 4,314 - 18,677
731,089 79,875 5,749 (7,644) (26,016) - 64,520 - 847,574
Lower Murray Water Annual Report 2015/16 83
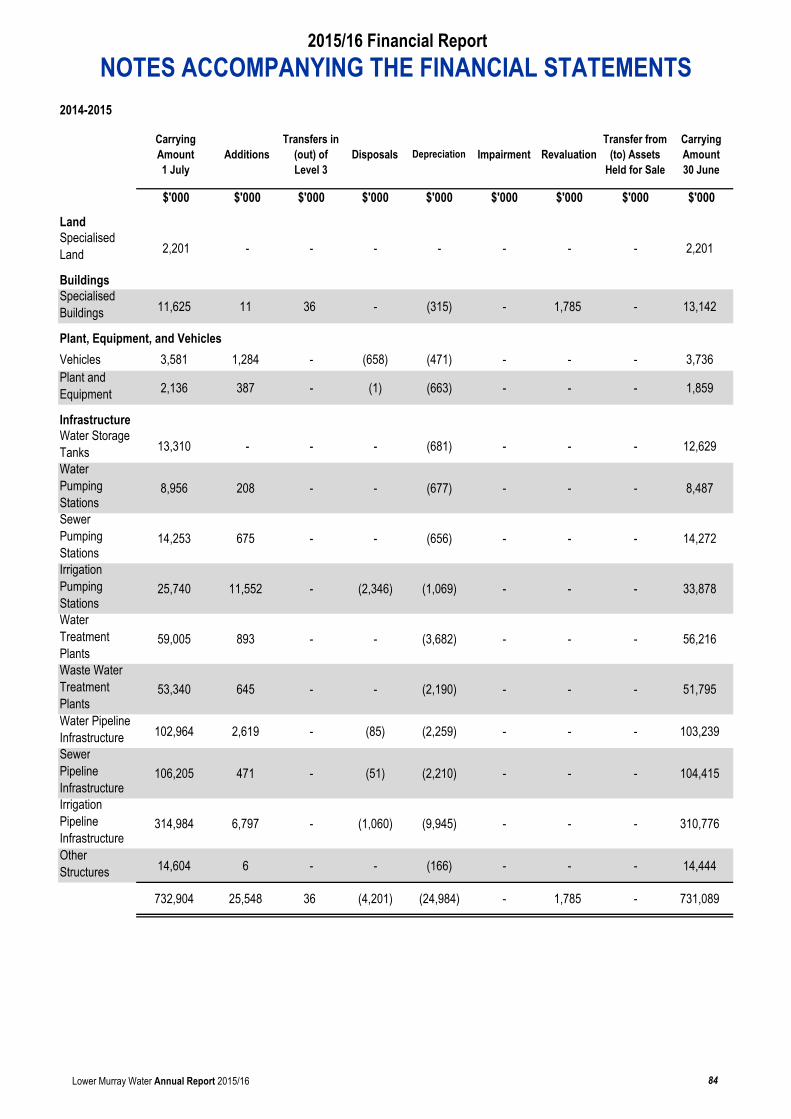
2015/16 Financial ReportNOTES ACCOMPANYING THE FINANCIAL STATEMENTS
2014-2015
Carrying Amount 1 July
AdditionsTransfers in
(out) of Level 3
Disposals Depreciation Impairment RevaluationTransfer from
(to) Assets Held for Sale
Carrying Amount 30 June
$'000 $'000 $'000 $'000 $'000 $'000 $'000 $'000 $'000
LandSpecialised Land 2,201 - - - - - - - 2,201
BuildingsSpecialised Buildings 11,625 11 36 - (315) - 1,785 - 13,142
Plant, Equipment, and VehiclesVehicles 3,581 1,284 - (658) (471) - - - 3,736Plant and Equipment 2,136 387 - (1) (663) - - - 1,859
Infrastructure Water Storage Tanks 13,310 - - - (681) - - - 12,629Water Pumping Stations
8,956 208 - - (677) - - - 8,487
Sewer Pumping Stations
14,253 675 - - (656) - - - 14,272
Irrigation Pumping Stations
25,740 11,552 - (2,346) (1,069) - - - 33,878
Water Treatment Plants
59,005 893 - - (3,682) - - - 56,216
Waste Water Treatment Plants
53,340 645 - - (2,190) - - - 51,795
Water Pipeline Infrastructure 102,964 2,619 - (85) (2,259) - - - 103,239SewerPipeline Infrastructure
106,205 471 - (51) (2,210) - - - 104,415
Irrigation Pipeline Infrastructure
314,984 6,797 - (1,060) (9,945) - - - 310,776
Other Structures 14,604 6 - - (166) - - - 14,444
732,904 25,548 36 (4,201) (24,984) - 1,785 - 731,089
Lower Murray Water Annual Report 2015/16 84

2015/16 Financial ReportNOTES ACCOMPANYING THE FINANCIAL STATEMENTS
(e) Description of significant unobservable inputs to Level 3 valuations 2015-2016
Specialised Land2,439 Community Service
Obligation (CSO)adjustment VGVprovided to EganNational Valuers (Vic)
Specialised Buildings3,559
Useful life of specialised buildings
Vehicles3,797
Useful life of vehicles
Plant and Equipment1,895
Useful life of plant & equipment
Water Storage Tanks13,967
Useful life of water storage tanks
Water Pumping Stations20,015
Useful life of water pumping stations
Sewer Pumping Stations20,525
Useful life of sewer pumping stations
Irrigation Pumping Stations49,046
Useful life ofirrigation pumpingstations
Depreciated replacementcost
Cost per Unit
Depreciated replacementcost
Cost per Unit
Depreciated replacementcost
Cost per Unit
Depreciated replacementcost
Cost per Unit
Depreciated replacementcost
Cost per unit
Depreciated replacementcost
Cost per unit
Fair Value at 30 June 2016 $'000
Valuation Technique Significant unobservable inputs
Market Approach
Depreciated replacementcost
Direct cost per sqm
Lower Murray Water Annual Report 2015/16 85

2015/16 Financial ReportNOTES ACCOMPANYING THE FINANCIAL STATEMENTS
Water Treatment Plants80,939
Useful life of water treatment plants
Wastewater Treatment Plants36,104
Useful life of wastewater treatment plants
Water Pipeline Infrastructure143,914
Useful life of water pipeline infrastructure
Sewer Pipeline Infrastructure148,997
Useful life of sewer pipeline infrastructure
Irrigation Pipeline Infrastructure297,997
Useful life of irrigation pipeline infrastructure
Other Structures18,677 Cost per Unit
Useful life of other structures
Depreciated replacementcost
Depreciated replacementcost
Cost per Metre
Depreciated replacementcost
Cost per Metre
Depreciated replacementcost
Cost per Metre
Depreciated replacementcost
Cost per Unit
Depreciated replacementcost
Cost per Unit
Lower Murray Water Annual Report 2015/16 86

2015/16 Financial ReportNOTES ACCOMPANYING THE FINANCIAL STATEMENTS
(e) Description of significant unobservable inputs to Level 3 valuations 2014-2015
Specialised Land2,201 Community Service
Obligation (CSO)adjustment VGVprovided to EganNational Valuers (Vic)
Specialised Buildings13,142
Useful life of specialised buildings
Vehicles3,736
Useful life of vehicles
Plant and Equipment1,859
Useful life of plant & equipment
Water Storage Tanks12,629
Useful life of water storage tanks
Water Pumping Stations8,487
Useful life of water pumping stations
Sewer Pumping Stations14,272
Useful life of sewer pumping stations
Irrigation Pumping Stations33,878
Depreciated replacementcost
Cost per Unit
Depreciated replacementcost
Cost per Unit
Depreciated replacementcost
Cost per Unit
Depreciated replacementcost
Cost per Unit
Depreciated replacementcost
Cost per unit
Depreciated replacementcost
Cost per unit
Sensitivity of Fair Value Measurement to changes in significant unobservable inputs
Fair Value at 30 June 2015 $'000
Valuation Technique
Market Approach
Depreciated replacementcost
Direct cost per sqm
Lower Murray Water Annual Report 2015/16 87

2015/16 Financial ReportNOTES ACCOMPANYING THE FINANCIAL STATEMENTS
Water Treatment Plants56,216
Useful life of water treatment plants
Wastewater Treatment Plants51,795
Useful life of wastewater treatment plants
Water Pipeline Infrastructure103,239
Useful life of water pipeline infrastructure
Sewer Pipeline Infrastructure104,415
Useful life of sewer pipeline infrastructure
Irrigation Pipeline Infrastructure310,776
Useful life of irrigation pipeline infrastructure
Other Structures14,444 Cost per Unit
Useful life of other structures
Depreciated replacementcost
Depreciated replacementcost
Cost per Metre
Depreciated replacementcost
Cost per Metre
Depreciated replacementcost
Cost per Metre
Depreciated replacementcost
Cost per Unit
Depreciated replacementcost
Cost per Unit
Lower Murray Water Annual Report 2015/16 88
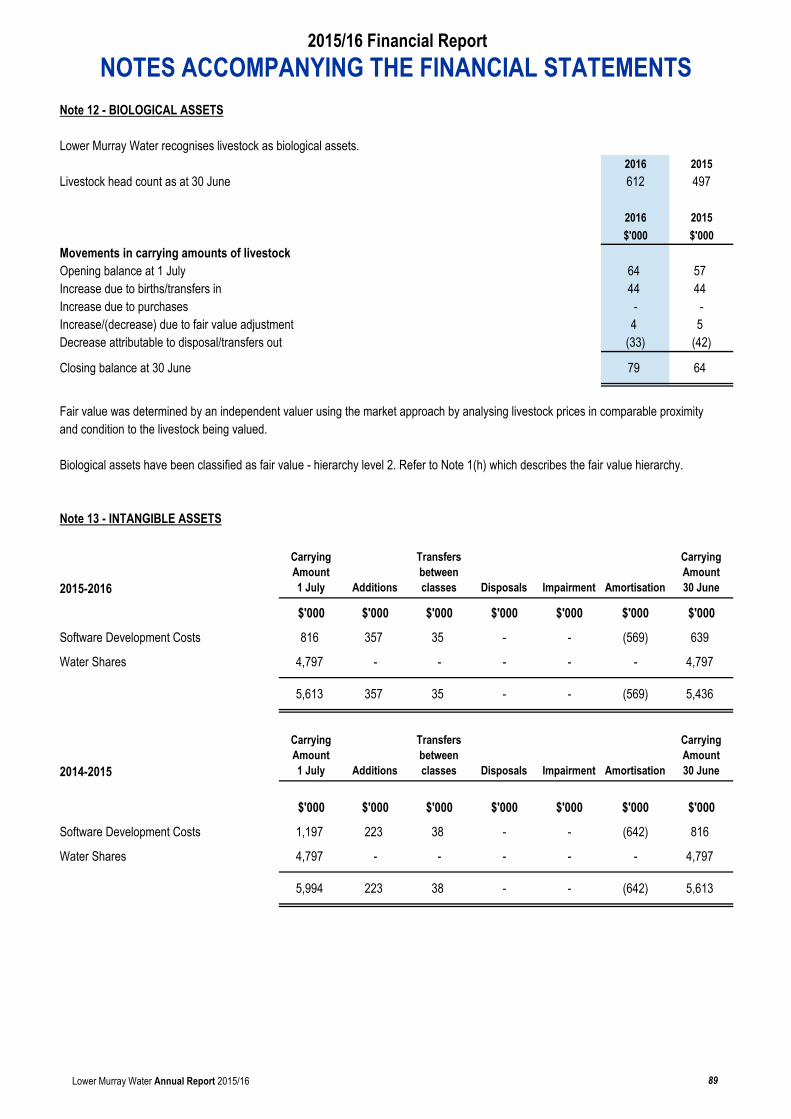
2015/16 Financial ReportNOTES ACCOMPANYING THE FINANCIAL STATEMENTS
Note 12 - BIOLOGICAL ASSETS
Lower Murray Water recognises livestock as biological assets.2016 2015
Livestock head count as at 30 June 612 497
2016 2015$'000 $'000
Movements in carrying amounts of livestockOpening balance at 1 July 64 57Increase due to births/transfers in 44 44Increase due to purchases - -Increase/(decrease) due to fair value adjustment 4 5Decrease attributable to disposal/transfers out (33) (42)
Closing balance at 30 June 79 64
Fair value was determined by an independent valuer using the market approach by analysing livestock prices in comparable proximityand condition to the livestock being valued.
Biological assets have been classified as fair value - hierarchy level 2. Refer to Note 1(h) which describes the fair value hierarchy.
Note 13 - INTANGIBLE ASSETS
2015-2016
Carrying Amount 1 July Additions
Transfers between classes Disposals Impairment Amortisation
Carrying Amount 30 June
$'000 $'000 $'000 $'000 $'000 $'000 $'000
Software Development Costs 816 357 35 - - (569) 639
Water Shares 4,797 - - - - - 4,797
5,613 357 35 - - (569) 5,436
2014-2015
Carrying Amount 1 July Additions
Transfers between classes Disposals Impairment Amortisation
Carrying Amount 30 June
$'000 $'000 $'000 $'000 $'000 $'000 $'000
Software Development Costs 1,197 223 38 - - (642) 816-Water Shares 4,797 - - - - - 4,797
5,994 223 38 - - (642) 5,613
Lower Murray Water Annual Report 2015/16 89

2015/16 Financial ReportNOTES ACCOMPANYING THE FINANCIAL STATEMENTS
Note 14 - PAYABLES
TOTALWATER &
WASTEWATERIRRIGATION &
DRAINAGE
2016 2015 2016 2015 2016 2015$'000 $'000 $'000 $'000 $'000 $'000
Trade and Accrued Creditors 8,398 12,673 2,255 5,982 6,143 6,691
Deposits 619 573 587 537 32 36
Advances for Works Program 414 480 - - 414 480
Other 1,339 793 1,321 793 18 -
10,770 14,519 4,163 7,312 6,607 7,207
(a) Fair Value
Due to the short-term nature of the current payables, their carrying value is assumed to approximate their fair value.
Note 15 - INTEREST BEARING LIABILITIES
(a) Bank Loans expected to be settled within 12 monthsand after 12 months and more
Secured:
2016 2015 2016 2015 2016 2015 2016 2015$'000 $'000 $'000 $'000 $'000 $'000 $'000 $'000
Loans 53,684 60,343 2,698 6,659 13,234 13,052 37,752 40,632
53,684 60,343 2,698 6,659 13,234 13,052 37,752 40,632
Loans and Bank Overdraft are secured by the future revenue of Lower Murray Water and a guarantee from the Treasurer of Victoriaunder the Borrowings and Investment Powers Act 1987.
For an analysis of the sensitivity of interest bearing liabilities to interest rate risk and foreign exchange risk refer to Note 2.
TOTALCURRENT
(12 MONTHS)NON-CURRENT
(2-5 YEARS)NON-CURRENT
(OVER 5 YEARS)
Lower Murray Water Annual Report 2015/16 90

2015/16 Financial ReportNOTES ACCOMPANYING THE FINANCIAL STATEMENTS
(b) Credit Standby Arrangement with Banks
2016 2015$'000 $'000
Credit Facility 250 250
Amount Utilised - -
Unused Credit Facility 250 250
(c) Fair value
The carrying amounts and fair values of interest bearing liabilities at balance date are:
2016 2016 2015 2015Carrying Amount
Net Fair Value
Carrying Amount
Net Fair Value
$'000 $'000 $'000 $'000
Loans 53,684 69,181 60,343 70,108
Interest Bearing Liabilities are valued by discounting the expected future cash flows at yields offered by the Treasury Corporation ofVictoria at balance date.
Note 16 - EMPLOYEE BENEFITS
TOTAL CURRENT NON-CURRENT
2016 2015 2016 2015 2016 2015$'000 $'000 $'000 $'000 $'000 $'000
Annual Leave 1,916 1,849 1,916 1,849 - -
Accumulated Sick Leave 36 32 36 32 - -
Long Service Leave 3,758 3,532 3,504 3,211 254 321
Accrued Bonus 163 155 163 155 - -
Aggregate Carrying Amount of Employee Benefits 5,873 5,568 5,619 5,247 254 321
Employee numbers at end of financial year 2016: 174 (2015: 173)Accrued bonuses pertain to 16 employees for the financial year 2016 (2015: 17)
Employee Benefit and related On-CostsTOTAL CURRENT NON-CURRENT
2016 2015 2016 2015 2016 2015$'000 $'000 $'000 $'000 $'000 $'000
Annual Leave On-Costs 264 232 264 232 - -
Long Service Leave On-Costs 535 497 500 453 35 44
Total On-Costs 799 729 764 685 35 44
Lower Murray Water Annual Report 2015/16 91

2015/16 Financial ReportNOTES ACCOMPANYING THE FINANCIAL STATEMENTS
Annual Leave2016 2015$'000 $'000
Current: Short term benefits, expected to be settled wholly within 12 months after the end of the period measured at nominal value 205 - Long term benefits, not expected to be settled wholly within 12 months after the end of the period measured at present value 1,711 1,849
1,916 1,849
The following assumptions were adopted in measuring the present valueof annual leave entitlements:
Calculated average hours of leave taken by staff annually 110 107Discount rate for annual leave not settled wholly within 12 mths 1.585% 1.930%
Long Service Leave
Lower Murray Water's legal liability to Long Service Leave attributable to its employees at 30 June 2016was $3,757,767 which has been fully funded.
2016 2015$'000 $'000
Current: Short term benefits, unconditional and expected to settle wholly within 12 months of the period measured at nominal value - - Long term benefits, unconditional and expected to settle wholly after 12 months after the end of the period measured at present value 3,504 3,211
3,504 3,211
Non Current Long Service Leave being less than 7 years of continuous service 254 321 measured at present value
3,758 3,532
Lower Murray Water Annual Report 2015/16 92

2015/16 Financial ReportNOTES ACCOMPANYING THE FINANCIAL STATEMENTS
Note 17 - SUPERANNUATION
Lower Murray Water makes the majority of its employer superannuation contributions in respect of its employees to the Local AuthoritiesSuperannuation Fund (the Fund). This Fund has two categories of membership, accumulation and defined benefit, each of which isfunded differently. Obligations for contributions to the Fund are recognised as an expense in the Comprehensive Operating Statement when they are made or due.
AccumulationThe Fund's accumulation categories, Vision MySuper/Vision Super Saver, receives both employer and employee contributions ona progressive basis. Employer contributions are normally based on a fixed percentage of employee earnings (for the year ended30 June 2016, this was 9.5% required under Superannuation Guarantee legislation (for 2014/15, this was 9.5%)).
Defined Benefit Lower Murray Water does not use defined benefit accounting for its defined benefit obligations under the Fund's Defined Benefit category. This is because the Fund's Defined Benefit category is a pooled multi-employer sponsored plan.
There is no proportional spilt of the defined benefit liabilities, assets or costs between the participating employers as the definedbenefit obligation is a floating obligation between the participating employers and the only time that the aggregate obligation is allocatedto specific employers is when a call is made. As a result, the level of participation of Lower Murray Water in the Fund cannot be as a percentage compared with other participating employers. Therefore, the Actuary is unable to allocate benefit liabilities, assets and costs between employers for the purposes of AASB 119 because of the pooled nature of the Fund's defined benefit category.
Funding ArrangementsLower Murray Water makes employer contributions to the defined benefit category of the Fund at rates determined by the Trustee onthe advice of the Fund's Actuary.
The Fund’s latest actuarial investigation was held as at 30 June 2014 and it was determined that the Vested Benefit Indexed (VBI) of the defined benefit category of which Lower Murray Water is a contributing employer was 103.4%.To determine the VBI, the fund Actuary used the following long-term assumptions:
Net investment returns 7.0%paSalary information 4.25% paPrice inflation (CPI) 2.5% pa.
Vision Super has advised that the estimated VBI at 30 June quarter 2016 was 102.0%..The VBI is to be used as the primary funding indicator. Because the VBI was above 100%, the actuarial investigation determined the defined benefit category was in a satisfactory financial position and that no change was necessary to the defined benefit category’s funding arrangements from prior years.
Employer ContributionsRegular ContributionsOn the basis of the results of the 2015 interim actuarial investigation conducted by the Fund Actuary, Lower Murray Water makes employer contributions to the Fund's Defined Benefit category at rates determined by the Fund's Trustee. For the year ended30 June 2016, this rate was 9.5% of members' salaries (9.5% in 2014/2015). This rate will increase in line with any increaseto the SG contribution rate.
In addition, Lower Murray Water reimburses the Fund to cover the excess of the benefits paid as a consequence of retrenchment above the funded resignation or retirement benefit.
Lower Murray Water Annual Report 2015/16 93

2015/16 Financial ReportNOTES ACCOMPANYING THE FINANCIAL STATEMENTS
Funding CallsIf the defined benefit category is in an unsatisfactory financial position at an actuarial investigation or the defined benefit's category'sVBI is below its shortfall limit at any time other than at the date of the actuarial investigation, the defined benefit category has a shortfallfor the purposes of SPS 160 and the fund is required to put a plan in place so that the shortfall is fully funded within three years of theshortfall occurring. The Fund monitors its VBI on a quarterly basis and the Fund has set its shortfall limit at 97%.In the event that the Fund Actuary determines that there is a shortfall based on the above requirement, the Fund’s participatingemployers (including Lower Murray Water) are required to make an employer contribution to cover the shortfall.
Using the agreed methodology, the shortfall amount is apportioned between the participating employers based on the Pre-1 July 1993and post-30 June 1993 service liabilities of the Fund’s defined benefit category, together with the employer’s payroll at 30 June 1993and at the date the shortfall has been calculated.
Due to the nature of the contractual obligations between the participating employers and the Fund, and that the Fund includes lifetimepensioners and their reversionary beneficiaries, it is unlikely that the Fund will be wound up.
If there is a surplus in the Fund, the surplus cannot be returned to the participating employers.
In the event that a participating employer is wound-up, the defined benefit obligations of that employer will be transferred to thatemployer’s successor.
Latest Actuarial Investigation Surplus AmountsThe Fund’s latest actuarial investigation as at 30 June 2015 identified the following in the defined benefit category of which Lower Murray Water is a contributing employer:
- A VBI surplus of $130.8 million; and - A total service liability surplus of $239 million.
The VBI surplus means that the market value of the fund’s assets supporting the defined benefit obligations exceed the vested benefitsthat the defined benefit members would have been entitled to if they had all exited on 30 June 2015.
The total service liability surplus means that the current value of the assets in the Fund’s defined benefit category plus expected futurecontributions exceeds the value of expected future benefits and expenses.
Lower Murray Water was notified of the 30 June 2015 VBI during August 2015.
Lower Murray Water makes employer superannuation contributions in respect of its employees to Emergency Services and State Super,which are classed as defined benefit schemes.
As per FRD 112C, the Victorian Government holds the responsibility for any unfunded liability for the Emergency Services and StateSuper schemes and is therefore responsible for reporting that liability.
Contributions by Lower Murray Water (excluding any unfunded liability payments) to the above superannuation plans for the financialyear ended 30 June 2016 are detailed below:
2016 2015 2016 2015
SchemeType of Scheme
Employee Numbers Rate Rate $'000 $'000
State Superannuation Board Revised Scheme Defined Benefit 1 17.30% 17.30% 15 36State Superannuation Board New Scheme Defined Benefit 3 9.50% 9.50% 20 30Vision Super Defined Benefit 24 9.50% 9.50% 200 227Vision Super Saver Accumulation 106 9.50% 9.50% 663 639Others Various 77 9.50% 9.50% 416 215
Total Contributions to all funds 1,314 1,147
Lower Murray Water Annual Report 2015/16 94

2015/16 Financial ReportNOTES ACCOMPANYING THE FINANCIAL STATEMENTS
There were no contributions outstanding and no loans issued from or to the above schemes as at 30 June 2016. The expectedcontributions to be paid to the defined benefit category of Vision Super for the year ending 30 June 2017 is $231,576 (2016: $229,000).
Note 18 - DEFERRED TAXES
Deferred Tax Assets2016 2015$'000 $'000
The balance comprises temporary differences attributable to:
Amounts recognised in Comprehensive Operating StatementEmployee benefits 1,762 1,670Other 171 160Tax losses 23,820 24,911
25,753 26,741
MovementsOpening balance at 1 July 26,741 25,152Credited/(charged) to the Comprehensive Operating Statement (988) 1,589Under/(Over) Provision - -
Closing balance at 30 June 25,753 26,741
Deferred Tax Liabilities2016 2015$'000 $'000
Deferred tax liability comprises:Tax allowances relating to property, plant, and equipment 144,147 129,993Other 24 23Current Tax Liability - -
Deferred Tax Liability 144,171 130,016
MovementsOpening Balance 1 July 130,016 130,590Charged/(credited) to the Comprehensive Operating Statement (5,250) (995)Under/Over Provision - -Current Tax Liability - -Charged/(credited) to equity 19,405 421
Closing balance 30 June 144,171 130,016
Net Deferred Assets/(Liabilities) (118,418) (103,275)
Lower Murray Water Annual Report 2015/16 95

2015/16 Financial ReportNOTES ACCOMPANYING THE FINANCIAL STATEMENTS
Note 19 - CONTRIBUTED CAPITAL2016 2015$'000 $'000
Opening balance 1 July 612,533 565,566Capital transactions with the State in its capacity as owner arising from: - Capital Contributions (funding for the Sunraysia Modernisation Project) 17,040 46,967
Closing balance 30 June 629,573 612,533
Note 20 - ASSET REVALUTION RESERVE2016 2015
Movements in Asset Revaluation Reserve $'000 $'000
Balance 1 July 154,645 153,664Revaluation increment/(decrement) 64,683 1,402Tax effect of revaluation increment/(decrement) (19,405) (421)
Balance 30 June 199,923 154,645
2016 2015Movements by class $'000 $'000
LandBalance 1 July 2,116 2,417Revaluation increment/(decrement) (196) (430)Tax effect of revaluation increment/(decrement) 59 129
Balance 30 June 1,979 2,116
BuildingsBalance 1 July 5,643 4,361Revaluation increment/(decrement) (8,061) 1,832Tax effect of revaluation increment/(decrement) 2,418 (550)
Balance 30 June 0 5,643
InfrastructureBalance 1 July 146,886 146,886Revaluation increment/(decrement) 72,940 -Tax effect of revaluation increment/(decrement) (21,882) -
Balance 30 June 197,944 146,886
Lower Murray Water Annual Report 2015/16 96

2015/16 Financial ReportNOTES ACCOMPANYING THE FINANCIAL STATEMENTS
Note 21 - ACCUMULATED DEFICIT2016 2015$'000 $'000
Accumulated Deficit at 1 July (74,354) (68,495)
Net Surplus/(Deficit) for the year after Income Tax Expense (8,491) (5,859)
Accumulated Deficit at 30 June (82,845) (74,354)
Note 22 - EQUITY2016 2015$'000 $'000
Total Equity at 1 July 692,824 650,735
Total Other Changes in Equity Recognised in the Statement of Changes in Equity 53,827 42,089
Total Equity at 30 June 746,651 692,824
2016 2015$'000 $'000
Net result for the year after income tax (8,491) (5,859)
Add/(less) Non Cash Flows in Net result
Depreciation/Amortisation 28,425 25,874Impairment Loss 1,542 -Income Tax Expense/(Revenue) (4,262) (2,584)Assets Written off 4,258 3,833Loss/(Gain) on Disposal of Non-Current Physical Assets 189 (96)
21,661 21,168Changes in Assets & Liabilities:
Decrease/(Increase) in Receivables 130 (2,792)
Decrease/(Increase) in Inventories (76) 91
Decrease/(Increase) in Prepayments 29 (63)
Increase/(Decrease) in Payables & Provisions (252) (368)
Increase/(Decrease) in Employee Benefits 306 182
Net Cash provided by/(used in) Operating Activities 21,798 18,218
2016 2015$'000 $'000
Non-cash investing activities
Accrued payments for purchases of Infrastructure, Property, Plant and Equipment (3,498) 9,169
Note 23 - RECONCILIATION OF NET RESULT FOR THE PERIOD AFTER RELATED INCOME TAX TO NET CASH FLOWS FROM OPERATING ACTIVITIES
Lower Murray Water Annual Report 2015/16 97

2015/16 Financial ReportNOTES ACCOMPANYING THE FINANCIAL STATEMENTS
Note 24 - COMMITMENTS
Commitments are disclosed at their nominal value and inclusive of the goods and services tax (GST) payable.
Capital Commitments for Incomplete Contracts 2016 2015$'000 $'000
Payment due within one year 9,221 63,511Payments due between one to three years - 491
9,221 64,002
Included in the Capital commitments is the commitment of the Funding agreement between Lower Murray Water and the Commonwealthand State Governments for the Sunraysia Modernisation Project (SMP). The funding agreement is for $119M of capital works to becompleted with $103M being funded by the Commonwealth Government. The SMP is to be concluded in the 2016/17 financial year.
Operating Lease Commitments 2016 2015$'000 $'000
Payment due within one year 41 35Payments due between one to three years - -
41 35
Environmental Contribution Commitments 2016 2015$'000 $'000
Payment due within one year 1,579 1,639Payments due between two to three years 2,278 -
3,857 1,639
Capital Receivables 2016 2015$'000 $'000
Receivables due between two to three years - 3,475
- 3,475
Capital Receivables are in-line with milestone payments to be made by the Commonwealth Government in connection with theSunraysia Modernisation Project (SMP).
Lower Murray Water Annual Report 2015/16 98

2015/16 Financial ReportNOTES ACCOMPANYING THE FINANCIAL STATEMENTS
Note 25 - RESPONSIBLE PERSONS DISCLOSURE
In accordance with the Ministerial Directions issued by the Minister for Finance under the Financial Management Act 1994, the followingdisclosures are made regarding responsible persons for the reporting period.
(i) Names of Persons who were responsible persons at any time during the financial year ended 30 June,2016: Ministers The Hon Lisa Neville MP Minister for Environment, Climate Change and Water (1 July 2015 to 22 May 2016)
The Hon Lisa Neville MP Minister for Water (23 May 2016 to 30 June 2016)
MembersMr. P Endley (Managing Director) (01/07/2015 - 30/06/2016)Mr J Tesoriero (Chairperson) (01/07/2015 - 30/06/2016)Ms C Rix (Deputy Chairperson) (01/07/2015 - 30/06/2016)Mr Tony Mathews (01/07/2015 - 30/06/2016)Ms Kay Martin (01/07/2015 - 30/06/2016)Mr Jason Kambovski (01/10/2015 - 30/06/2016Mr Guy Kingwill (01/10/2015 - 30/06/2016)Ms Liza McDonald (01/10/2015 - 30/06/2016)Ms Sharyon Peart (01/10/2015 - 30/06/2016)Mr M Bennett (01/07/2015 - 30/09/2015)Mr G Robertson (01/07/2015 - 30/09/2015)Mr B Bishop (01/07/2015 - 30/09/2015)
Remuneration paid to Ministers is reported in the Annual Report of the Department of Premier and Cabinet. Other relevant interestsare declared in the Register of Members' Interests which each member of the Parliament completes.
During the year the following person(s) acted as Managing Director in the Managing Director's absence.
Mr D Girdwood 8 Days
(ii) Total Remuneration received or due and receivable by responsible persons totalled $425,653 (2015: $365,712).
The number of responsible persons whose remuneration from Lower Murray Water was within the specified bands were as follows:
2016 2015
$1 - $10,000 3 -$10,001 - $20,000 6 4$20,001 - $30,000 1 2$40,001 - $50,000 1 1$200,001 - $210,000 1$260,001 - $270,000 1 -
Total Numbers 12 8
During the 2016 financial year 3 responsible persons, Mr M Bennett, Mr B Bishop and Mr G Robertson reached the end of theirappointed term and 4 new responsible persons were appointed being Mr G Kingwill, Ms Liza McDonald, Ms S Peart and Mr J Kambovski.
(iii) Annual remuneration of Managing Director has been disclosed above.
Lower Murray Water Annual Report 2015/16 99
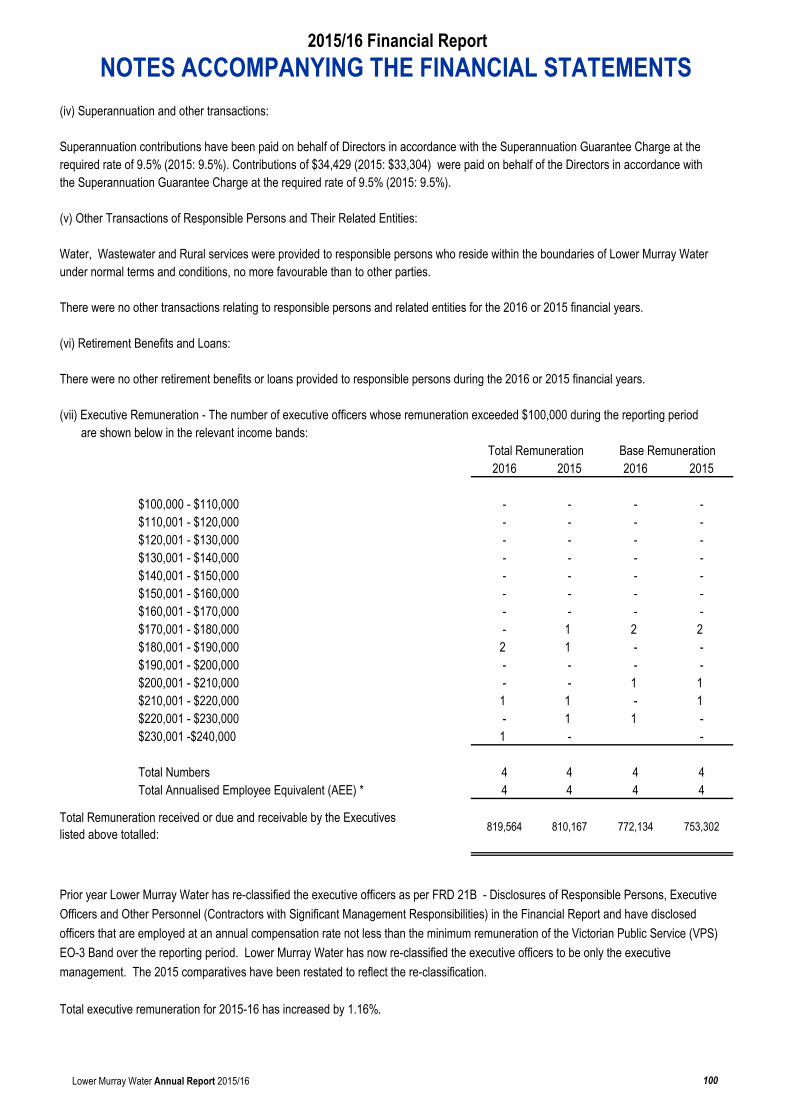
2015/16 Financial ReportNOTES ACCOMPANYING THE FINANCIAL STATEMENTS
(iv) Superannuation and other transactions:
Superannuation contributions have been paid on behalf of Directors in accordance with the Superannuation Guarantee Charge at therequired rate of 9.5% (2015: 9.5%). Contributions of $34,429 (2015: $33,304) were paid on behalf of the Directors in accordance withthe Superannuation Guarantee Charge at the required rate of 9.5% (2015: 9.5%).
(v) Other Transactions of Responsible Persons and Their Related Entities:
Water, Wastewater and Rural services were provided to responsible persons who reside within the boundaries of Lower Murray Waterunder normal terms and conditions, no more favourable than to other parties.
There were no other transactions relating to responsible persons and related entities for the 2016 or 2015 financial years.
(vi) Retirement Benefits and Loans:
There were no other retirement benefits or loans provided to responsible persons during the 2016 or 2015 financial years.
(vii) Executive Remuneration - The number of executive officers whose remuneration exceeded $100,000 during the reporting period are shown below in the relevant income bands:
2016 2015 2016 2015
$100,000 - $110,000 - - - -$110,001 - $120,000 - - - -$120,001 - $130,000 - - - -$130,001 - $140,000 - - - -$140,001 - $150,000 - - - -$150,001 - $160,000 - - - -$160,001 - $170,000 - - - -$170,001 - $180,000 - 1 2 2$180,001 - $190,000 2 1 - -$190,001 - $200,000 - - - -$200,001 - $210,000 - - 1 1$210,001 - $220,000 1 1 - 1$220,001 - $230,000 - 1 1 -$230,001 -$240,000 1 - -
Total Numbers 4 4 4 4Total Annualised Employee Equivalent (AEE) * 4 4 4 4
819,564 810,167 772,134 753,302
Prior year Lower Murray Water has re-classified the executive officers as per FRD 21B - Disclosures of Responsible Persons, Executive Officers and Other Personnel (Contractors with Significant Management Responsibilities) in the Financial Report and have disclosed officers that are employed at an annual compensation rate not less than the minimum remuneration of the Victorian Public Service (VPS) EO-3 Band over the reporting period. Lower Murray Water has now re-classified the executive officers to be only the executivemanagement. The 2015 comparatives have been restated to reflect the re-classification.
Total executive remuneration for 2015-16 has increased by 1.16%.
Total Remuneration Base Remuneration
Total Remuneration received or due and receivable by the Executives listed above totalled:
Lower Murray Water Annual Report 2015/16 100

2015/16 Financial ReportNOTES ACCOMPANYING THE FINANCIAL STATEMENTS
* Annualised employee equivalent (AEE) is calculated by dividing the total number of ordinary hours that an employee worked overthe reporting period by the total number of full-time working hours per annum (this is generally 38 hours per week for 52 weeks per year).
(viii) Payments to other Personnel (i.e. contractors with significant management responsibilities)
Payments have been made to one contractor who was responsible for the planning, directing and managing a majorCapital Works Project.
2016 2015$300,000- $320,000 1 -$390,000- $399,999 - 1
Note 26- AUDITOR REMUNERATION 2016 2015
Remuneration of Auditors $'000 $'000
Victorian Auditor General's Office - Audit Services 83 87
83 87
Note 27 - EX-GRATIA EXPENSES2016 2015
Ex-gratia expenses include individual items that are greater than or equal to $5,000. $'000 $'000
Waiver of debt (i) (ii) - 43
Total Ex-gratia Expenses - 43
Notes:(i) Waiver of over usage water excess penalty charge from 2010 irrigation season. The ex-gratia expense is also presented in Note 4 (b) - Expenditure - Bad Debts, Doubtful Debts and Write Offs. (ii) Waiver of penalty interest charge which has compounded on outstanding scheme debt on change of property ownership which was overlooked by acting solicitor. The ex-gratia expense is also presented in Note 4 (b) - Expenditure - Bad Debts, Doubtful Debts and Write Offs.
Note 28 - EVENTS OCCURRING AFTER BALANCE DATE
No matters at this stage.
Note 29 - CONTINGENT ASSETS AND CONTINGENT LIABILITIES
The Board is aware of the following potential contingent liabilities:
Lower Murray Water has received notice of intended legal action to recover fees and charges disputed by a customer.At present the probability of the outcome cannot be reasonably determined.
A US Bankruptcy Court has served court proceeding documents against Australian Noteholders, LMW being one thereof, to recover investments funds that were paid out to LMW. These funds relate to investments made by a precursor Authority. LMW has filed to have the case dismissed. No details on the quantum nor when the legal action will take place are known.
Total expenses (exclusive of GST)
Lower Murray Water Annual Report 2015/16 101
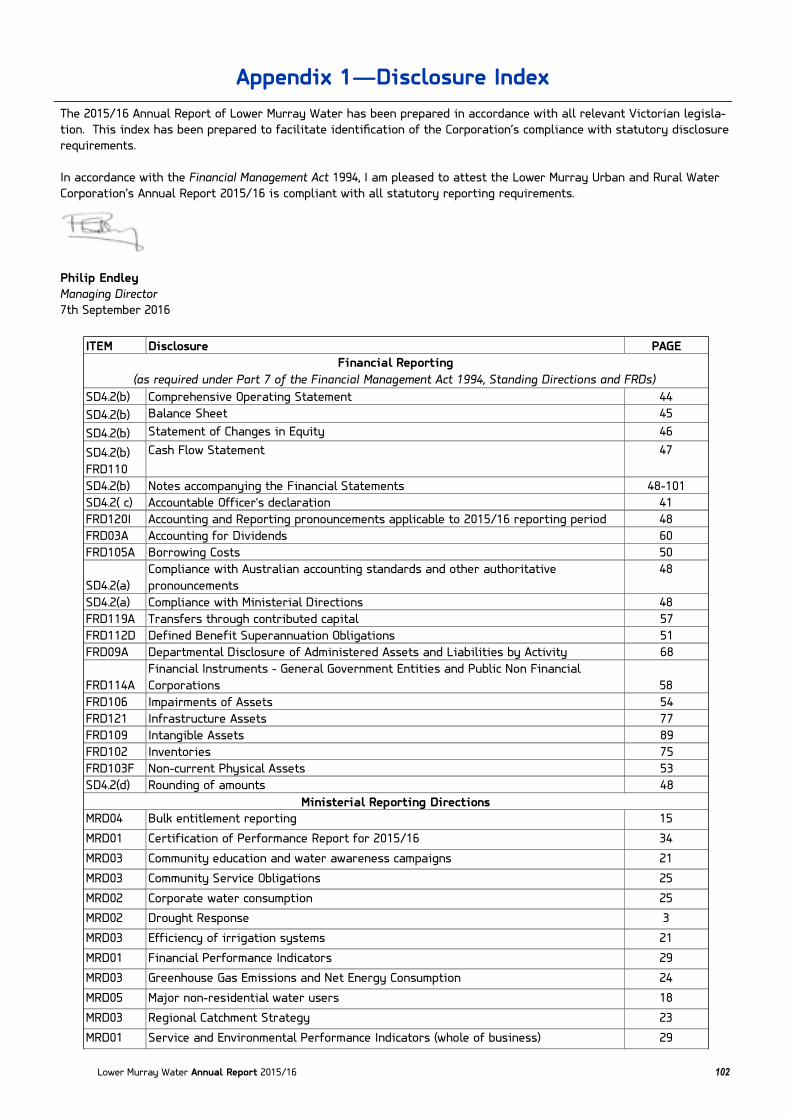
Lower Murray Water Annual Report 2015/16
The 2015/16 Annual Report of Lower Murray Water has been prepared in accordance with all relevant Victorian legisla-
tion. This index has been prepared to facilitate identification of the Corporation’s compliance with statutory disclosure
requirements.
In accordance with the Financial Management Act 1994, I am pleased to attest the Lower Murray Urban and Rural Water
Corporation’s Annual Report 2015/16 is compliant with all statutory reporting requirements.
Philip Endley
Managing Director
7th September 2016
Appendix 1—Disclosure Index
ITEM Disclosure PAGE
SD4.2(b) Comprehensive Operating Statement 44
SD4.2(b) Balance Sheet 45
SD4.2(b) Statement of Changes in Equity 46
SD4.2(b)
FRD110
Cash Flow Statement 47
SD4.2(b) Notes accompanying the Financial Statements 48-101
SD4.2( c) Accountable Officer's declaration 41
FRD120I Accounting and Reporting pronouncements applicable to 2015/16 reporting period 48
FRD03A Accounting for Dividends 60
FRD105A Borrowing Costs 50
SD4.2(a)
Compliance with Australian accounting standards and other authoritative
pronouncements
48
SD4.2(a) Compliance with Ministerial Directions 48
FRD119A Transfers through contributed capital 57
FRD112D Defined Benefit Superannuation Obligations 51
FRD09A Departmental Disclosure of Administered Assets and Liabilities by Activity 68
FRD114A
Financial Instruments - General Government Entities and Public Non Financial
Corporations 58
FRD106 Impairments of Assets 54
FRD121 Infrastructure Assets 77
FRD109 Intangible Assets 89
FRD102 Inventories 75
FRD103F Non-current Physical Assets 53
SD4.2(d) Rounding of amounts 48
MRD04 Bulk entitlement reporting 15
MRD01 Certification of Performance Report for 2015/16 34
MRD03 Community education and water awareness campaigns 21
MRD03 Community Service Obligations 25
MRD02 Corporate water consumption 25
MRD02 Drought Response 3
MRD03 Efficiency of irrigation systems 21
MRD01 Financial Performance Indicators 29
MRD03 Greenhouse Gas Emissions and Net Energy Consumption 24
MRD05 Major non-residential water users 18
MRD03 Regional Catchment Strategy 23
MRD01 Service and Environmental Performance Indicators (whole of business) 29
Ministerial Reporting Directions
Financial Reporting
(as required under Part 7 of the Financial Management Act 1994, Standing Directions and FRDs)

Lower Murray Water Annual Report 2015/16 103
Appendix 1—Disclosure Index
ITEM Disclosure PAGE
MRD03 State Environment Property Policy (Waters of Victoria) 23
MRD01 Victorian Auditor-General’s Report – Performance Statement 35
MRD03 Victorian Biodiversity Strategy 23
MRD03 Victorian Waterway Management Strategy 23
MRD02 Water consumption report 18
MRD03 Water recycling 20
FRD22G Application and operation of Freedom of Information Act 1982 26
FRD22G Application and operation of Protected Disclosures Act 2012 27
FRD22G Board Member profiles, major committees 11
FRD22G Compliance with building and maintenance provisions of the Building Act 1993 26
FRD22G Details of consultancies <$10,000 38
FRD22G Details of consultancies >$10,000 39
FRD10 Disclosure Index Appendix 1
FRD12A Disclosure of Major Contracts 38
FRD22G Information and Communication Technology (ICT) Expenditure 26
FRD24C Environmental Performance 32
FRD22G Government Advertising Expenditure 25
FRD22G Manner of establishment and the relevant Ministers 2
FRD22G Merit and Equity 13
FRD22G Nature and range of services provided 2
FRD22G Objectives and performance against objectives 4
FRD22G Objectives, functions, powers and duties 2
FRD22G Occupational Health and Safety 14
FRD22G Organisational structure 10
SD 4.5.5 Risk Management Framework & Processes attestation 27
FRD22G Significant changes in financial position during the year 37
FRD30B Standard requirements for the design and print of annual reports Whole report
FRD22G Statement of availability of other information 28
FRD22G Statement of Workforce data 13
FRD22G Statement on National Competition Policy 26
FRD22G Subsequent events which will affect operations in future years 28
FRD22G Summary of the Financial Results 37
FRD25B Victorian Industry Participation Policy disclosures 28
Building Act 1993 (accompanying Building Regulations 1994) 26
Charter of Human Rights & Responsibilities Act 2006 27
Financial Management Act 1994 27
Freedom of Information Act 1982 26
Health Records Act 2001 27
Occupational Health and Safety Act 2004 14
Privacy and Data Protection Act 2014 27
Protected Disclosures Act 2012 27
Safe Drinking Water Act 2003 5
Victorian Industry Participation Policy Act 2003 28
Water Act 1989 2
Ministerial Reporting Directions (cont'd)
Legislation
Report of Operations

Lower Murray Water Annual Report 2015/16 104
NOTES
Printed by Sunnyland Press,
3 Scott Crescent, Mildura VIC 3500
Phone 03 5023 4199
Printed on 100% Recycled Paper
ISSN: 1325-1139

Mildura (Head Office)
741-759 Fourteenth Street
PO Box 1438
Mildura 3502
Telephone 03 50513400
Facsimile 03 50513480
Kerang (Area Office)
56 Wellington Street
PO Box 547
Kerang 3579
Telephone 03 5450 3960
Facsimile 03 5450 3967
Swan Hill (Area Office)
73 Beveridge Street
PO Box 1447
Swan Hill 3585
Telephone 03 50365 2150
Facsimile 03 5036 2180
Email: [email protected]
www.lmw.vic.gov.au
@lowmurwater
/lowermurraywater