ANNUAL REPORT 2015 - Sligro Food Group · As part of the G4 guidelines from the GRI, ... corporate...
168
2015
Transcript of ANNUAL REPORT 2015 - Sligro Food Group · As part of the G4 guidelines from the GRI, ... corporate...

2015
AN
NU
AL R
EP
OR
T 2015

2015

2 | Sligro Food Group 2015
MARKET SHAREMARKET SHARE
23.1%23.1%SHARE IN NET SALESSHARE IN NET SALES
7.8%7.8%
2.7BILLION
81MILLION
NET SALESNET SALES PROFITPROFITNETNET
1.20
DIVIDENDPER SHARE
FOODSERVICE
NEW EMTÉ 3.0 FORMAT
SPECIALIST INPROFESSIONAL KITCHENS
Sligro Almereand Utrecht
OPENING
PARTNERSHIPSLIGRO AND KNVB
10,15310,153NUMBER OFEMPLOYEESNUMBER OFEMPLOYEES
5,7405,740NUMBER OF FTEsNUMBER OF FTEs
KEYFIGURES
SLIGRO ACQUIRES

3
CONTENTS
Annual review 2015
Key Figures
Profile
Important dates
Sligro shares
Directors and management
Executive Board Report
Strategy in outline
Commercial developments
Food Retail developments
Foodservice developments
Organisation and employees
Corporate Social Responsibility
Risk and risk management
Corporate Governance
Capital expenditure
Results
Financing in outline
Taxes
Outlook
Directors’ statement of responsibilities
Corporate Governance statement
Report of the Supervisory Board
4
8
9
11
12
16
19
19
21
27
39
47
57
73
78
81
82
86
88
91
93
93
95
103
104
105
106
107
108
109
110
117
146
147
148
152
152
157
158
158
160
162
163
Financial Statements
ConsolidatedConsolidated profit and loss account for 2015
Consolidated statement of recognised income and
expense for 2015
Consolidated cash flow statement for 2015
Consolidated balance sheet as at 2 January 2016
Consolidated statement of changes in equity for 2015
Notes to the consolidated financial statements
Accounting policies
Notes
CompanyCompany profit and loss account for 2015
Company balance sheet as at 2 January 2016
Notes to the company financial statements
Other information
Independent auditor's report
Proposed profit appropriation
Other information not forming part of the financial statements
Ten-year review
Global Reporting Initiative (GRI) table
Eerlijk & heerlijk certification marks
Managers and officers

4 | Sligro Food Group 2015
ANNUAL REVIEW 2015
This annual review is a summary of the main topics of this report.
EconomyThe Dutch economy continued to recover in 2015, albeit at a
modest pace. Consumer confidence improved, as did employ-
ment, and these are significant predictors of developments
in the Foodservice market although this correlation appears
to have been weaker in recent years than in the past. While
the housing market has picked up and consumers have again
been spending more on durable goods, spending on food and
beverages has only increased to a relatively limited extent.
We have spoken in the past about a new climate rather than
a crisis, that is to say it is not a temporary dip but more of
long-term trend in consumer behaviour. This is not altogether
bad, provided that we and our customers respond properly:
the adjustment to the new reality has not, for example, been
sufficiently implemented in the café segment. But it is our job
not only to identify this but also to support our customers in
making the change. Our inspiration lab, ZiN, which will be
ready at the end of 2016, will be focused entirely on this.
We expect a further improvement in the economy in the next
few years and this will encourage a gradual recovery in our
markets.
MarketAfter years of contraction, 2015 saw growth in the foodser-
vice market. There are still major differences in the ways the
different segments are developing. The traditional hospitality
sector grew faster than the market average but the beverages
and, certainly, the care sectors are lagging behind the market
and are even contracting. The underlying reason for this in
the care sector is the far-reaching government measures.
Government decisions are also weighing heavily on the café
segment. The foodservice market as a whole is expected to
gradually recover and grow in 2016.
The supermarket channel grew in 2015 and, for the first time
in years, volumes also picked up. It was a relatively calm
year if we look at prices, despite campaigns and promotions
continuing to play a major role in the fight for customers.
We are seeing more and more players entering the market
with on-line initiatives and traditionally non-food retailers
attempting to claim part of the food market. Nevertheless
it is remarkable that the amount of supermarket space is
continuing to rise. Local authorities do not seem to realise
that it is far from logical to add a serious amount of space and
even less to develop new shopping centres in a market which
is not growing.
FoodserviceFoodservice again outperformed the market and, including
sales from acquisitions, our market share grew by 0.5% to
23.1%. We have noticed that our Sligro 3.0 approach is bearing
fruit in both delivery and cash-and-carry and is contributing to
growth in sales. The superlative change in customer focus
that is central to this continues to be one of Sligro’s long-term
distinctive strengths. This year we put a lot of energy into
integrating Sligro 3.0 into our online platform that we will be
launching in 2016. We have also made considerable progress
on our Kicking Costs programme that has improved the profit-
ability of delivery services in particular.
BouterIn June, we acquired Bouter (CaterTech) bringing in a special-
ist in consultancy and designing, supplying, installing and
maintaining professional kitchens, equipment and chilling and
freezing technology. As a result, we will in future be able to
meet this definite need of our customers, the food profes-
sionals. Immediately following the acquisition we made a
start on linking the sales staff of Bouter and Sligro and straight
away this created an improvement in sales at Bouter. Bouter
will continue to operate relatively autonomously towards the
customers in close cooperation with Sligro and Van Hoeckel
but behind the scenes integrated where possible into our
central back-office.

5
BelgiumIn May 2015, we announced our decision that Sligro would
enter the Belgian foodservice market. We see considerable
opportunities to create a second market in Belgium, initially
in Flanders, and want to take a top-three position in due
course. This market will increase our ‘fishpond’ by 50%
as foodservice is a relatively large domain in Belgium. The
preparations are well under way in the sales department and
the back-office and we expect to open our first Sligro outlet
in Antwerp in 2017. As far as possible we will be making use
of the Dutch infrastructure but fully realise that in many areas
we will have to adapt to local customer requirements and the
Belgian food culture.
Food RetailFor Food Retail, 2015 was the final year of the medium-term
plan which we used when working on strengthening our
basics and creating growth. The process improvements that
we have implemented in operations and the back-office in
recent years were clearly reflected in profitability in the past
year and we have met the financial targets we set three
years ago. Significant interim steps have been taken to create
growth but we have not yet seen this adequately reflected
in sales and we were unable to keep up with the market.
To this end, therefore, the first EMTÉ 3.0 was launched in
the fourth quarter and this will lead us away from the grey
mid-field of the market. The Fijnproevers (‘Gourmets’) loyalty
programme is growing steadily and customers’ ranking of
EMTÉ continues at a high level (based on GfK reports). As a
result, we are confident about building on EMTÉ 3.0 in a new
format generation.
EMTÉ 3.0We have recently been working on a new brand strategy for
EMTÉ. The process was similar to that of Sligro 3.0 and so
we have called it EMTÉ 3.0. We will be positioning EMTÉ as
‘Simply the tastiest supermarket’ so that our customers can
enjoy more good and tasty food. We are, therefore, seeking
clearer synergies within Sligro Food Group while remaining
close to the wishes and needs of EMTÉ’s customers.
The focus is mainly on delicious and authentic daily
products characterised by terms such as tasty, healthy and
sustainable. This is not mainly about raising our customers’
culinary aspirations, but more on a good, tasty meal each
day. We want to create more of an experience that surprises
customers and challenges them to try something different.
Following the opening of the first new-generation store in
November, there will be three further stores in this style in
early 2016. After making the improvements in a few areas
that will certainly be highlighted by an evaluation of these
stores, we will roll out in other locations from mid-2016.
We will also make further developments online in order to
continue meeting the changing demand from our customers.

6 | Sligro Food Group 2015
Corporate social responsibility Our corporate social responsibility (CSR) policy focuses
on three main themes; people, the environment and our
product range. As part of the G4 guidelines from the GRI,
we have listed ten significant subjects under these themes
and described the management approach to them in the
corporate social responsibility section of this report.
Clear benchmarks and objectives have been set for these
themes. Sustainable operations are now fully integrated in our
business activities and, given that background, increasingly
incorporated in our management report. In that sense, the
new reporting in line with the G4 guidelines comes at a
natural moment for us. In 2010, we drew up our targets for
2020 and now, roughly halfway, we see that we are well on
our way to achieving them.
All in all, our CSR policy is developing well, something which
as a listed family business we are very proud of, since, for a
company such as ours, care for our surroundings is a simply a
question of doing business fairly. We have been doing that for
80 years and our CSR path is a good way of making this real
and measurable, following the choices and developments
even more efficiently.
Risk managementWe have taken steps in recent years towards a more
formal approach to risk management. We believe it is very
important that we find the right balance with the informal
entrepreneurial spirit within the business so that we continue
to see opportunities as well as the risks. It involves being
in control - and not just on paper. We see our culture as a
significant ‘soft control’ that protects us from within against
many risks and types of fraud. Nevertheless, we recognise
the need to formalise this more as the organisation grows
and in 2015 we began developing processes starting at the
strategic level. In the next few years, we will develop this
further and communicate it at all levels of the organisation.
ResultsFoodservice again outperformed the market with growth in
sales of 2.8% (excluding week 53). Like-for-like growth was
1.5% with sales from acquisitions coming on top of this.
EMTÉ’s like-for-like growth of 0.2% in 2015 could not match
the market (which grew by 2.3%). Including acquisitions
and week 53, group sales were up 3.8% to a record level of
€2,670 million.
Operating profit before amortisation rose by €16 million to
€122 million. The underlying improvement was even better
since EBITA included a net incidental gain of €3 million in
2014.
Both Foodservice and Food Retail saw marked improvements
in results and this meant that we achieved our medium-term
plan goals for Food Retail.
Net profit was up €12 million to €81 million, exceeding the
record profit made in 2011. We are proud that we were able
to exceed the net profit figure of €80 million for the first time
in the year we celebrated our 80th anniversary.
DividendBased on the result for 2015 and our continuing strong financial
position, we propose increasing the dividend by €0.10 to
€1.20 per share. In accordance with our dividend policy, this
will be made up of a regular dividend of €0.90 (2014: €0.80)
and a variable dividend of €0.30 (2014: €0.30). An amount
of €0.40 has already been paid as interim dividend. The final
dividend for 2015 therefore amounts to €0.80.

7
2016We expect that the economy will continue to recover
gradually and that this will translate into growth in both our
markets in 2016. During the past year we have ‘upped our
game’ on many fronts with the further roll-out of Sligro 3.0,
the introduction of EMTÉ 3.0, our plans for Belgium, our
Kicking Costs programme and many other improvements in
the sales department and the back-office. We have already
benefited from this in 2015 and, above all, solid foundations
have been laid for 2016. It is wonderful to see how our people
right across the organisation have made a contribution to this.
Our theme in 2016 is ‘Building the Future’. We will be doing
this with a further roll-out of Sligro 3.0 and EMTÉ 3.0, the
launch of Sligro online 3.0 and the preparatory work for
Belgium. We are also building ZiN, our inspiration lab, and
modernising part of our central distribution centre. But there
is much more than physical construction. In a market where
customers’ wishes are changing ever faster, you have to build
an organisation that can respond quickly and flexibly to those
needs: ever more customer focused and ever more personal.
And so we are also building the organisation, processes,
systems and data that will form the springboard for the
future. We are bursting with energy to grasp the coming year
with both hands. In other words, building the future. And as
far as we are concerned it is a great future!
Koen Slippens
CEO

8 | Sligro Food Group 2015
KEY FIGURES
(x € million)
2015 2014Result
Net sales 2,670 2,572
EBITDA 160 149
EBITA 122 106
EBIT 103 89
Profit for the year 81 69
Net cash flow from operating activities 140 147
Free cash flow 78 78
Proposed dividend 52 48
Equity and liabilities
Shareholders’ equity 606 570
Net interest-bearing debt 26 48
Total equity and liabilities 1,071 1,012
Employees
Year average (full-time equivalents) 5,740 5,834
Salaries, social security charges and pension costs 253 239
Ratios
Year-on-year increase in sales % 3.8 2.9
Year-on-year increase in profit % 17.4 1.5
As percentage of sales:
Gross margin 23.2 23.2
Gross operating profit 6.0 5.8
EBITA 4.6 4.1
EBIT 3.8 3.5
Profit for the year 3.0 2.7
Return as % of average shareholders’ equity 13.7 12.0
Operating profit as % of average net capital employed 15.7 13.8
Net interest-bearing debt/EBITDA as % 16.2 31.8
Shareholders’ equity as % of total equity and liabilities 56.6 56.3
Figures per €0.06 shareNumber of shares outstanding at year-end (x 1,000) 43,790 43,685
(x €1)Shareholders’ equity 13.84 13.05
Earnings 1.84 1.58
Proposed dividend 1.20 1.10
Year-end share price 33.30 31.25

9
SLIGRO FOOD GROUP N.V. ENCOMPASSES FOOD
RETAIL AND FOODSERVICE COMPANIES THAT
SELL DIRECTLY AND INDIRECTLY TO THE ENTIRE
DUTCH FOOD AND BEVERAGES MARKET, PROVID-
ING A COMPREHENSIVE PACKAGE OF FOOD AND
FOOD-RELATED NON-FOOD PRODUCTS AND
SERVICES. THE GROUP IS ACTIVE IN FOODSERVICE
AS A WHOLESALER AND IN FOOD RETAIL AS A
WHOLESALER AND RETAILER.
Food RetailThe Food Retail activities comprise around 130 full-service
EMTÉ supermarkets, of which 30 are operated by inde pen-
dent retailers.
FoodserviceSligro Food Group is the Dutch foodservice market leader,
with a nationwide network of cash-and-carry and delivery
service outlets serving large and small-scale hospitality
establishments, leisure facilities, volume users, company
and other caterers, forecourt retailers, small and medium-
sized enterprises, small retail businesses and the institutional
market. The cash-and-carry operation has 49 Sligro wholesale
outlets and the delivery operation has eight delivery centres.
In the institutional market, we trade under the Van Hoeckel
name. Van Hoeckel has its own commercial organisation
specialising in the care market and uses the same delivery
network as Sligro for its operations.
We also operate our own in-house production facilities for
specialist convenience products, fish and patisserie and
home caterer products, as well as a butchery centre focusing
on the retail market. Bouter is our in-house specialist in
installing and maintaining professional kitchen equipment and
chilling and freezing technology. For meat, game and poultry,
fruit and vegetables and bread and bakery products, we have
participating interests in our Fresh Partners.
Our customers have the choice of around 75,000 food and
food-related non-food items.
We also offer a range of services, some on a franchise basis.
CIV Superunie B.A., a leading purchasing cooperative with
a share of almost 30% of the Dutch supermarket sector,
handles Sligro Food Group’s Food Retail purchases. As market
leader in the sector, the Group handles its own purchases of
foodservice products.
Sligro Food Group companies actively seek to share expertise
and utilise the substantial scope for synergy and economies
of scale.
Activities that are primarily customer-related are carried out
by the business units, with behind-the-scenes management
taking place at the Group level. We strive to increase our
gross margins through joint purchasing, in combination with
direct and detailed margin management.
Operating expenses are reduced by means of constant,
strict cost control and an integrated logistics strategy. Group
synergy is further enhanced by joint ICT systems, an integrated
approach to the supply chain, centralised management of
property and Group management development.
Sligro Food Group strives to be a high-quality company
achieving steady, managed growth for all its stakeholders.
Sales in 2015 totalled €2.7 billion, generating a net profit of
€81 million. The average number of employees on a full-time
basis was over 5,700. Sligro Food Group shares are listed on
Euronext Amsterdam.
PROFILE
Sligro Food Group corporate film.

10 | Sligro Food Group 2015

11
Financial calendar 1)
Final 2015 sales 6 January 2016
Final 2015 figures 21 January 2016
Press conference (11.00 a.m.) 21 January 2016
Analysts’ meeting (1.30 p.m.) 21 January 2016
Publication of annual report 5 February 2016
Record date 17 February 2016
2015 Annual General Meeting at the
company’s offices,
Corridor 11, Veghel (10.30 a.m.) 23 March 2016
Ex-dividend date final dividend 2015 29 March 2016
Record date final dividend 2015 30 March 2016
Final dividend 2015 available for payment 6 April 2016
Trading update 21 April 2016
2016 half-year figures 21 July 2016
Press conference (11.00 a.m.) 21 July 2016
Analysts’ meeting (1.30 p.m.) 21 July 2016
Trading update 20 October 2016
Final 2016 sales 4 January 2017
Final 2016 figures 26 January 2017
Press conference (11.00 a.m.) 26 January 2017
Analysts’ meeting (1.30 p.m.) 26 January 2017
Publication of annual report 3 February 2017
2016 Annual General Meeting (10.30 a.m.) 22 March 2017
1) Press releases will be published at 7.30 a.m.
The company is based in Veghel and registered in the
commercial register of the Chamber of Commerce and Indus-
try for East Brabant in Eindhoven under number 160.45.002.
Corridor 11, P.O. Box 47, 5460 AA Veghel
Telephone +31 413 34 35 00/Fax +31 413 36 30 10
www.sligrofoodgroup.nl
ImportantDATES

12 | Sligro Food Group 2015
SLIGRO SHARES
There were 43,790,015 shares in issue at year-end 2015,
an increase of 105,000 on year-end 2014. The increase is
attributable to the sale of shares that had been repurchased
for the option plan. Earnings per share are calculated on the
basis of the average number of shares in issue, as explained
on page 135.
Sligro Food Group seeks to pay a cash dividend of approximately
50% of the profit after tax (excluding extraordinary items) on
a regular basis. A proposal may be made to declare a variable
dividend, depending on the capital ratio and liquidity position.
The dividend is paid in two instalments, an interim dividend in
the second half of the year and a final dividend after the Annual
General Meeting.
The dividend proposed for 2015 is €0.90 per share, which
equates to a pay-out ratio of 49%. In addition, it is proposed
to pay a variable dividend of €0.30 per share, thus bringing
the total dividend for the year to €1.20 per share. An interim
dividend of €0.40 per share was paid on 1 October 2015 and
so the final dividend will be €0.80.
In cash terms, a dividend totalling €1.10 per share was paid in
2015, made up of the final dividend for 2014 of €0.70 and the
interim dividend for 2015 of €0.40.
Sligro Food Group’s website (www.sligrofoodgroup.nl)
includes information on the Group, its shares, financial
position, press releases, Articles of Association, remuneration,
directors’ shareholdings and share transactions and corporate
governance. This information is available in both Dutch and
English. Visitors can download annual reports from this site
and also subscribe to press releases.
Included in the average number of shares outstanding as from the date concerned.
Movements in shares (x 1,000)
2015 2014 2013 2012 2011
Issued shares as at start of year 44,255 44,255 44,255 44,255 44,255
Shares repurchased (cumulative)1) (465) (570) (555) (433) (296)
Shares outstanding as at year-end 43,790 43,685 43,700 43,822 43,959
Average shares outstanding 43,867 43,689 43,730 43,856 43,996
SLIGRO FOOD GROUP’S SHARES ARE TRADED ON THE EURONEXT AMSTERDAM N.V. STOCK EXCHANGE.
SLIGRO FOOD GROUP IS INCLUDED IN THE AMX INDEX.

13
Disclosure must be made when a shareholding exceeds or falls below certain legally stipulated percentages. Since this can result in double counting, the disclosures do not always provide a true picture of the number of free float shares. Corrections are consequently made for double counting. In the holdings of Sligro Food Group employees, 105,104 shares are held by members of the Executive Board. These are itemised on page 124.
These figures are based on information from Euronext Amsterdam. The month with the highest volume of shares traded in 2015 was December (0.6 million shares). The lowest volume was 0.2 million shares in November.
Transaction information
2015 2014 2013 2012 2011
Total value of shares traded (x € million) 156 104 117 125 227
Volume traded (x 1,000) 4,519 3,482 4,459 5,900 9,463
Number of transactions (single counting) 40,140 22,016 24,700 31,677 40,337
Key figures per share (x €1)
2015 2014 2013 2012 2011
High 39.25 32.65 30.50 24.85 26.10
Low 30.95 26.85 20.67 18.50 19.65
Year-end 33.30 31.25 28.21 21.75 20.75
Earnings per share 1.84 1.58 1.55 1.56 1.78
Dividend 1.20 1.10 1.05 1.05 1.05
Market capitalisation as at year-end (x € million) 1,458 1,365 1,248 963 918
%
%
%
%
%
%
%
%
33.95
6.12
5.70
5.10
5.06
5.03
5.01
3.94
Stichting Administratiekantoor Slippens
Darlin N.V.
NN Groep N.V.
APG Asset Management N.V.
Stichting Administratiekantoor Arkelhave B.V.
Boron Investments B.V.
Beleggings- en Exploitatiemaatschappij De Engh B.V.
Stichting Werknemersaandelen Sligro Food Group
KEY FIGURESper share
TRANSACTION information
DISCLOSURE of major shareholdings
14 | Sligro Food Group 2015
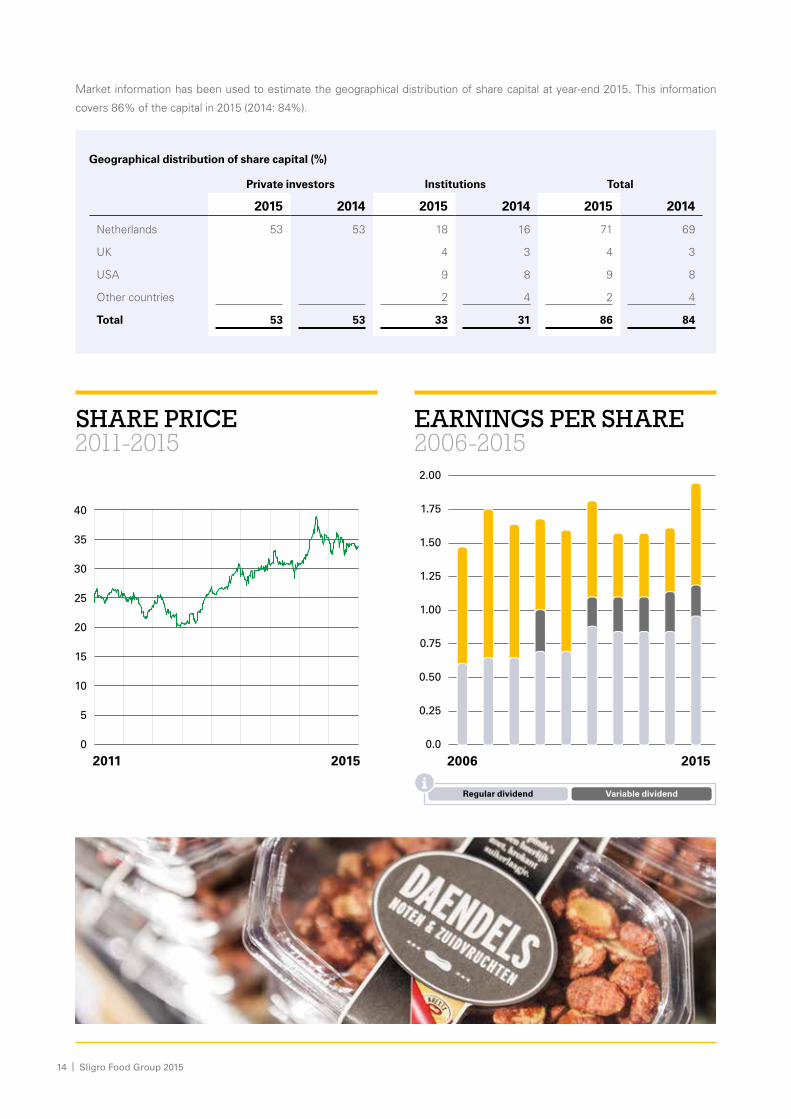
Market information has been used to estimate the geographical distribution of share capital at year-end 2015. This information
covers 86% of the capital in 2015 (2014: 84%).
SHARE PRICE2011-2015
EARNINGS PER SHARE2006-2015
Geographical distribution of share capital (%)
Private investors Institutions Total
2015 2014 2015 2014 2015 2014
Netherlands 53 53 18 16 71 69
UK 4 3 4 3
USA 9 8 9 8
Other countries 2 4 2 4
Total 53 53 33 31 86 84
2006 2015
2.00
1.75
1.50
1.25
1.00
0.75
0.50
0.25
0.0
Regular dividend Variable dividend
2011 2015
40
35
30
25
20
15
10
5
0
15

Supervisory Board
A. Nühn, chairman (62)
Th.A.J. Burmanje (61) 1)
B.E. Karis (57)
R.R. Latenstein van Voorst (51) 1)
J.H. Kamps (56)
Group Executive Board
K.M. Slippens, CEO (48)
R.W.A.J. van der Sluijs, CFO (39)
W.J.P. Strijbosch, Foodservice (47)
1) Retiring at the AGM on 23 March 2016.
Company Secretary
G.J.C.M. van der Veeken (54)
Executive Board of Sligro Food Group Nederland B.V.
Group Executive Board, together with
J.W.G. van den Berg, Logistics (46)
P.A. van Berkel, Production and Van Hoeckel (51)
A.E. Bögels, Purchasing and Product Range (43)
J.G.M. de Bree, Human Resources (58)
J.H.A. van Heerebeek, Food Retail Sales (49)
D.J. van Iperen, Foodservice Delivery (41)
K. Kiestra, Food Retail Operations (47)
C.A. Mulders, Foodservice Cash-and-Carry (43)
M.M.P.H.L. van Veghel, ICT (43)
Works Council
R. Heijberg, voorzitter
T. Bouman, secretaris
Y. El Adel
E. Beernink
D. van der Does
D. de Fijter
E. Goedhart-Joosten
T. Hendriks
M. Jans
D. Kleijer
F. van der Lelij
R. Lobker
T. van de Meerakker
G. Noord
J. Pennings
G. Rozema
F. Schalken
W. van Schijndel
S. Sillen-van der Velden
R. Stockmann
C. Thijssen
H. Verbraak
R. van Vliet
H. Waninge
J. van Zon
DIRECTORSAnd management

17

Sligro Food Group strives to be a quality company achieving CONSISTENT and controlled GROWTH for all its stakeholders.

19
Sligro Food Group sells directly and indirectly to the entire
Dutch food and beverages market, providing a comprehensive
package of food and food-related non-food products and
services. Our business units focus primarily on our customers
and each has its own clear profile in the market. They are
managed at Group level and supported by a professional,
efficient and fully-integrated back-office organisation. The
various operations work very closely together to maximise the
benefits from internal synergy.
The organisation is driven by our culture, our ‘Green Blood’,
which has its key focus on customers and our shared passion
for tasty, good and honest food. Safeguarding and promoting
this particular culture, therefore, has our specific attention in a
steadily growing organisation.
The Group operates in a competitive environment where there
is limited scope to translate cost increases into higher selling
prices. We believe we can absorb the impact of cost increases
by constantly increasing the efficiency of our operations, for
example by ensuring that our distribution, communication and
information systems are as effective as possible.
To be sure of wielding sufficient purchasing power in the
market, our food retail purchases are handled by cooperative
purchasing organisation Superunie, which has a share of
approximately 30% of the supermarket sector. We handle
much of our own purchasing for our foodservice business,
which is the market leader in the foodservice sector.
We aim for average annual growth in like-for-like sales over
an economic cycle of around 3%, assuming annual inflation
of approximately 1.5%. We also intend, and expect, to grow
through acquisitions, although such growth is, by its very
nature, less gradual than organic growth. Given the level of
fragmentation that still exists in the Dutch food market, we
think it is likely that acquisitions can also be made in the coming
years. We are also seeking opportunities in the foodservice
markets in neighbouring countries. We aim for profit growth
that, on average, equals or outstrips our growth in sales. We
can furthermore offer shareholders attractive returns over
the longer term by controlled exploitation of the assets at our
disposal. We aim to operate in a socially responsible manner
and we report our performance in this area. For a listed family
business such as ours, economic and social gains go hand in
hand.
One of the ways in which we seek to be an attractive partner
for our customers is by providing a high level of service at
competitive prices. Our growth strategy provides our staff
with opportunities for personal development while giving
our suppliers the chance to increase their product sales and
introduce new product lines. Society as a whole benefits from
increasing levels of employment and the resultant rise in tax
revenues. As a supplier of food products, we are fully aware
of the importance of food safety. It goes without saying that
we comply with all external quality standards.
Achieving our objectives will strengthen Sligro Food Group’s
independent position in the market, a position we intend to
retain in the longer term.
STRATEGYIn outline
20 | Sligro Food Group 2015
21
Goals – Increase like-for-like sales by an average of 3% per
annum, with growth through acquisitions on top of this.
– Take the market share in Foodservice to 30% in the
Netherlands.
– A distinctive position for EMTÉ in the Dutch supermarket
landscape.
– In due course achieve a top-3 position in Belgium as a
second home market for Foodservice.
– Maximise the potential for internal synergy and exchange
of know-how between Group activities.
– Achieve competitive and permanent margin management.
– Provide high-quality service, always with a view to
maximising customer loyalty.
Strategic implementation – Continually renew and improve our commercial concepts,
formats and distribution channels, including e-commerce
and an omni-channel approach.
– Ensure efficient and effective operational management of
our retail and foodservice outlets.
– Optimise synergy behind the scenes while presenting
distinct identities front of house.
– Focus on the big picture to avoid unnecessary complexity.
– Expand and upgrade our network and optimise and
enlarge existing outlets.
– Establish a more differentiated positioning in respect of
our regional customers by combining the professionalism
that we can offer through our critical mass with the
character of a local partner: ‘growth by staying small’.
– Strengthen customer relationships through loyalty
programmes, events, private labels and our range of fresh
produce and unique products from our own production
kitchens.
– Further expand the package of physical and online
services aimed at B2B customers in both Foodservice
and Food Retail in order to support them in their day-to-
day commercial and operational struggle.
– Further increase our expertise, customer focus and
entrepreneurial culture through ongoing employee
training programmes.
– Continually champion the typical Sligro Food Group
‘Green Blood’ culture in a growing organisation.
– Make the best possible use of that distinctive element
of the corporate culture of our company, namely our
employees: their expertise, their passion and their
unmatched commitment to our customers.
– Capitalise on acquisition opportunities satisfying our
criteria.
The food marketSligro Food Group is active in all main segments of the Dutch
food market, i.e. the market for food and beverages. This
market comprises both the ‘out of home’ or foodservice
channel and the ‘at home’ or food retail channel. We are directly
or indirectly primarily dependent on consumer spending on
food. Economic indicators such as consumer confidence and
unemployment figures are, therefore, significant predictors of
developments in our markets although this correlation seems
to be weaker than it used to be.
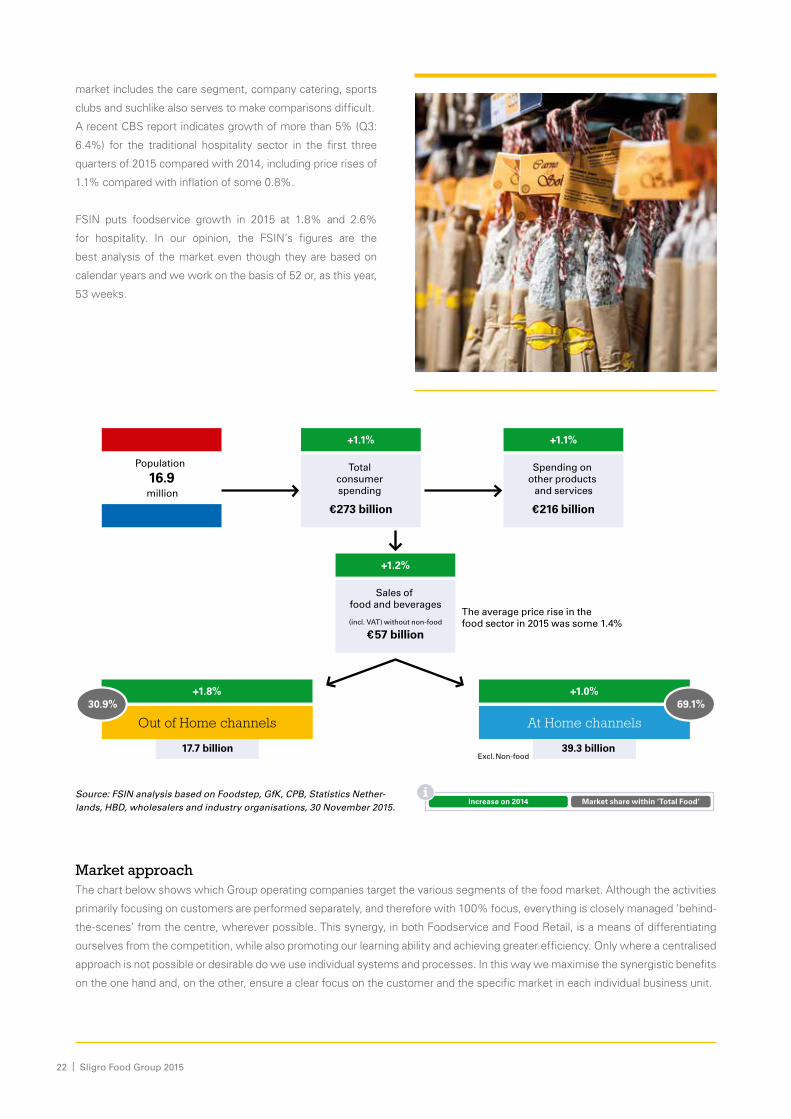
An analysis of total consumer spending on food and beverages
is presented in the diagrams on page 22. These diagrams
have been taken from the Foodservice Beleidsmonitor report,
compiled on behalf of the Dutch Foodservice Institute (FSIN).
This report provides an overview of the Dutch foodservice
sector and developments in this market, also in relation to
the food retail market. As the foodservice market is far less
homogeneous than the supermarket sector, figures for the
former are much less consistent and reliable than those
available for the food retail sector. This is evident, for example,
in the structural differences between the market projections
by FSIN and Statistics Netherlands (CBS), the latter in our view
(and that of many other players in the segments of outlets,
suppliers and wholesalers) having long overstated growth in
the hospitality market by a considerable margin. The fact that
in addition to the hospitality sector, the overall Foodservice
COMMERCIALDevelopments
22 | Sligro Food Group 2015
market includes the care segment, company catering, sports
clubs and suchlike also serves to make comparisons difficult.
A recent CBS report indicates growth of more than 5% (Q3:
6.4%) for the traditional hospitality sector in the first three
quarters of 2015 compared with 2014, including price rises of
1.1% compared with inflation of some 0.8%.
FSIN puts foodservice growth in 2015 at 1.8% and 2.6%
for hospitality. In our opinion, the FSIN’s figures are the
best analysis of the market even though they are based on
calendar years and we work on the basis of 52 or, as this year,
53 weeks.
Market approach The chart below shows which Group operating companies target the various segments of the food market. Although the activities
primarily focusing on customers are performed separately, and therefore with 100% focus, everything is closely managed ‘behind-
the-scenes’ from the centre, wherever possible. This synergy, in both Foodservice and Food Retail, is a means of differentiating
ourselves from the competition, while also promoting our learning ability and achieving greater efficiency. Only where a centralised
approach is not possible or desirable do we use individual systems and processes. In this way we maximise the synergistic benefits
on the one hand and, on the other, ensure a clear focus on the customer and the specific market in each individual business unit.
+1.0%+1.8%
The average price rise in the food sector in 2015 was some 1.4%
Excl. Non-food
Sales of food and beverages
€57 billion(incl. VAT) without non-food
At Home channels
17.7 billion
Out of Home channels30.9% 69.1%
39.3 billion
16.9million
Total consumer spending
€273 billion
+1.1%
+1.2%
Spending on other products
and services
€216 billion
+1.1%
Population
Increase on 2014 Market share within ‘Total Food’Source: FSIN analysis based on Foodstep, GfK, CPB, Statistics Nether-lands, HBD, wholesalers and industry organisations, 30 November 2015.
23
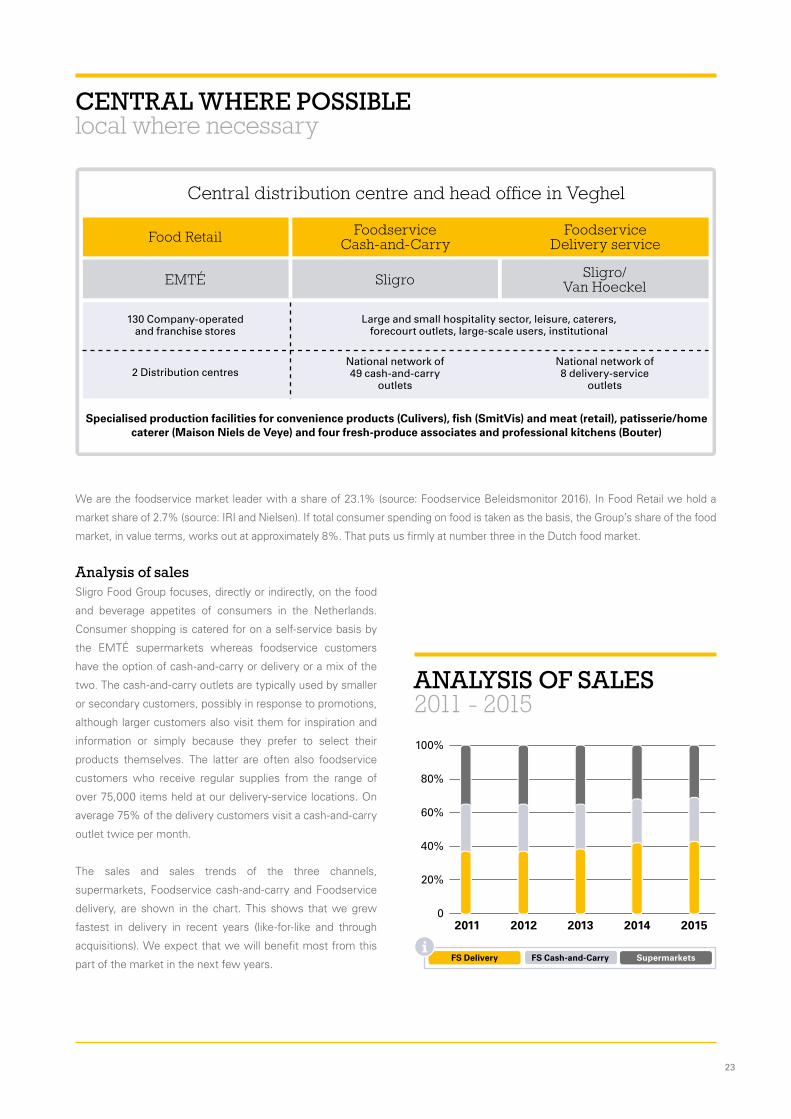
We are the foodservice market leader with a share of 23.1% (source: Foodservice Beleidsmonitor 2016). In Food Retail we hold a
market share of 2.7% (source: IRI and Nielsen). If total consumer spending on food is taken as the basis, the Group’s share of the food
market, in value terms, works out at approximately 8%. That puts us firmly at number three in the Dutch food market.
Analysis of sales Sligro Food Group focuses, directly or indirectly, on the food
and beverage appetites of consumers in the Netherlands.
Consumer shopping is catered for on a self-service basis by
the EMTÉ supermarkets whereas foodservice customers
have the option of cash-and-carry or delivery or a mix of the
two. The cash-and-carry outlets are typically used by smaller
or secondary customers, possibly in response to promotions,
although larger customers also visit them for inspiration and
information or simply because they prefer to select their
products themselves. The latter are often also foodservice
customers who receive regular supplies from the range of
over 75,000 items held at our delivery-service locations. On
average 75% of the delivery customers visit a cash-and-carry
outlet twice per month.
The sales and sales trends of the three channels,
supermarkets, Foodservice cash-and-carry and Foodservice
delivery, are shown in the chart. This shows that we grew
fastest in delivery in recent years (like-for-like and through
acquisitions). We expect that we will benefit most from this
part of the market in the next few years.
CENTRAL WHERE POSSIBLElocal where necessary
Central distribution centre and head of�ce in Veghel
Specialised production facilities for convenience products (Culivers), �sh (SmitVis) and meat (retail), patisserie/home caterer (Maison Niels de Veye) and four fresh-produce associates and professional kitchens (Bouter)
130 Company-operated and franchise stores
2 Distribution centresNational network of 49 cash-and-carry
outlets
National network of 8 delivery-service
outlets
Food Retail FoodserviceDelivery service
FoodserviceCash-and-Carry
Large and small hospitality sector, leisure, caterers, forecourt outlets, large-scale users, institutional
EMTÉ Sligro Sligro/Van Hoeckel
ANALYSIS OF SALES 2011 - 2015
2011 2012 2013 2014 2015
100%
80%
60%
40%
20%
0
FS Delivery FS Cash-and-Carry Supermarkets
24 | Sligro Food Group 2015
Our central distribution centre plays a key role in the efficiency
and effectiveness of the logistics in the Group and assists
us to convert the critical mass that we create with different
routes to the market into cost benefits. The same applies for
the central structure and systems such that the departments
and processes are structured so that they operate as a whole
for the group. In addition, this means that the best use is
made of shared knowledge and synergies. The integrated
back-office and related systems are a good example of how
Foodservice and Food Retail can use each other’s knowledge
to strengthen insight and management.
Our membership of Superunie ensures that we can operate in
a competitive retail market but it also offers us benefits in part
of the Foodservice product range. Combined with our own
purchasing department in Sligro Food Group, we are thus
creating a strong purchasing block in the market. As a result,
with our own production facilities and Fresh Partners, we are
able to offer distinctive products to all our customers. We
definitely view this as a strength and not as power since, after
all, we are creating value and not diminishing or destroying it.
We will be focusing in the coming years on more and faster
innovation so that we can continue to inspire our customers.
Our inspiration lab, ZiN, which is unique in the Netherlands
and which we will be opening above our new cash-and-
carry wholesale outlet in Veghel in the second half of 2016,
is a good example of this. This will create an environment
where, working with many partners, our intention is that
our foodservice customers will be able to perform better in
their own businesses, get training and inspiration, help with
starting up and innovating. We are looking forward to this!
The strength of our unique corporate culture is a key
distinction in both the foodservice and the food retail markets.
The passion for food and beverages and customer focus are in
our genes and not learnt. This makes them ‘real’ and difficult
to copy. And it is appreciated by our customers. We are proud
of this and we are succeeding in explaining it better outside
the organisation. The award given to EMTÉ as the best
supermarket for listening to its customers is a good example
of this and the subject is of course receiving a great deal of
attention in our preparations for entering the Belgian market.
Our commercial systems and data can be used in all channels,
although we serve customers’ requirements in markedly
different ways in the different segments. We can, however,
still make many improvements and learn from each other in
the various segments. The supporting technology and data
management are now highly centralised and we will continue
to make major investments here in the next few years as we
expect that leadership in data management will be a crucial
competitive factor in the future. Building the Future!
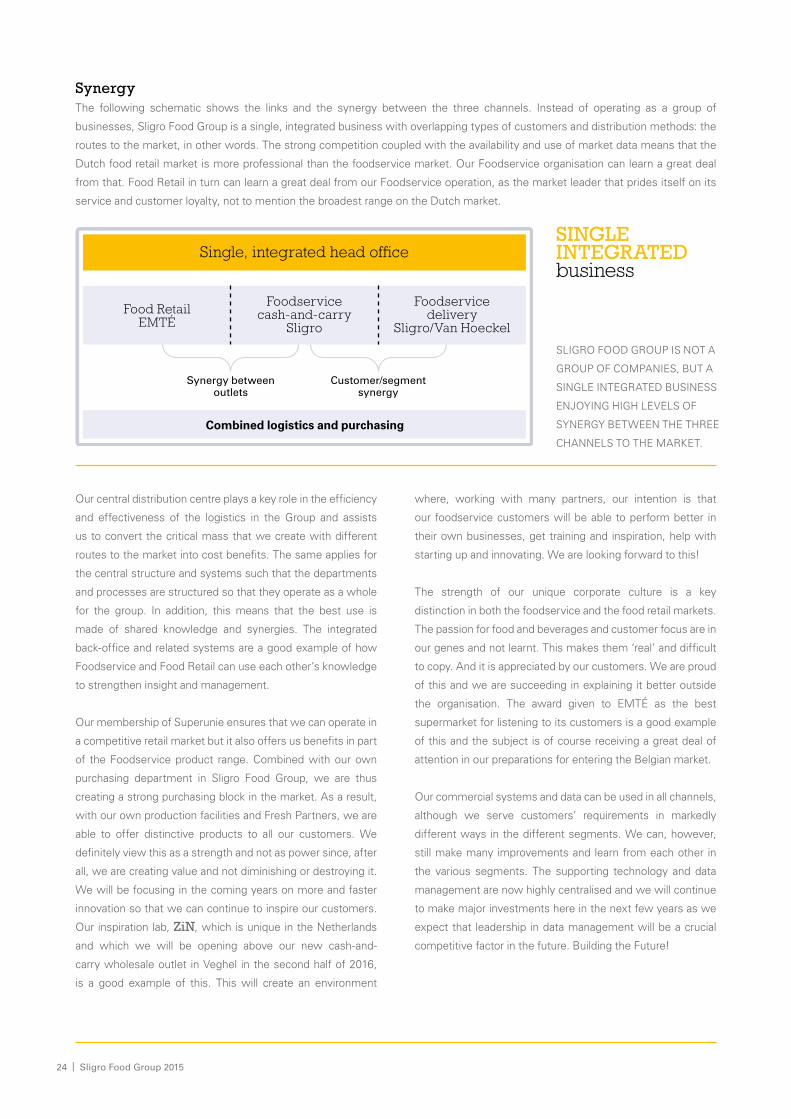
Single, integrated head of�ce
Combined logistics and purchasing
Food RetailEMTÉ
Foodservice cash-and-carry
Sligro
Foodservice delivery
Sligro/Van Hoeckel
Customer/segmentsynergy
Synergy between outlets
SynergyThe following schematic shows the links and the synergy between the three channels. Instead of operating as a group of
businesses, Sligro Food Group is a single, integrated business with overlapping types of customers and distribution methods: the
routes to the market, in other words. The strong competition coupled with the availability and use of market data means that the
Dutch food retail market is more professional than the foodservice market. Our Foodservice organisation can learn a great deal
from that. Food Retail in turn can learn a great deal from our Foodservice operation, as the market leader that prides itself on its
service and customer loyalty, not to mention the broadest range on the Dutch market.
SINGLE INTEGRATEDbusiness
SLIGRO FOOD GROUP IS NOT A
GROUP OF COMPANIES, BUT A
SINGLE INTEGRATED BUSINESS
ENJOYING HIGH LEVELS OF
SYNERGY BETWEEN THE THREE
CHANNELS TO THE MARKET.

25

26 | Sligro Food Group 2015
Dendi optatur sunt quis ut apit molupta tiumqui id qui derovid maio molorent, molupic ipsapit omnia que.quat apel expliquam quae volupit landisquiate velestiae.
OVERZICHT2015 SligroFood Group
27
FOOD RETAILDevelopments
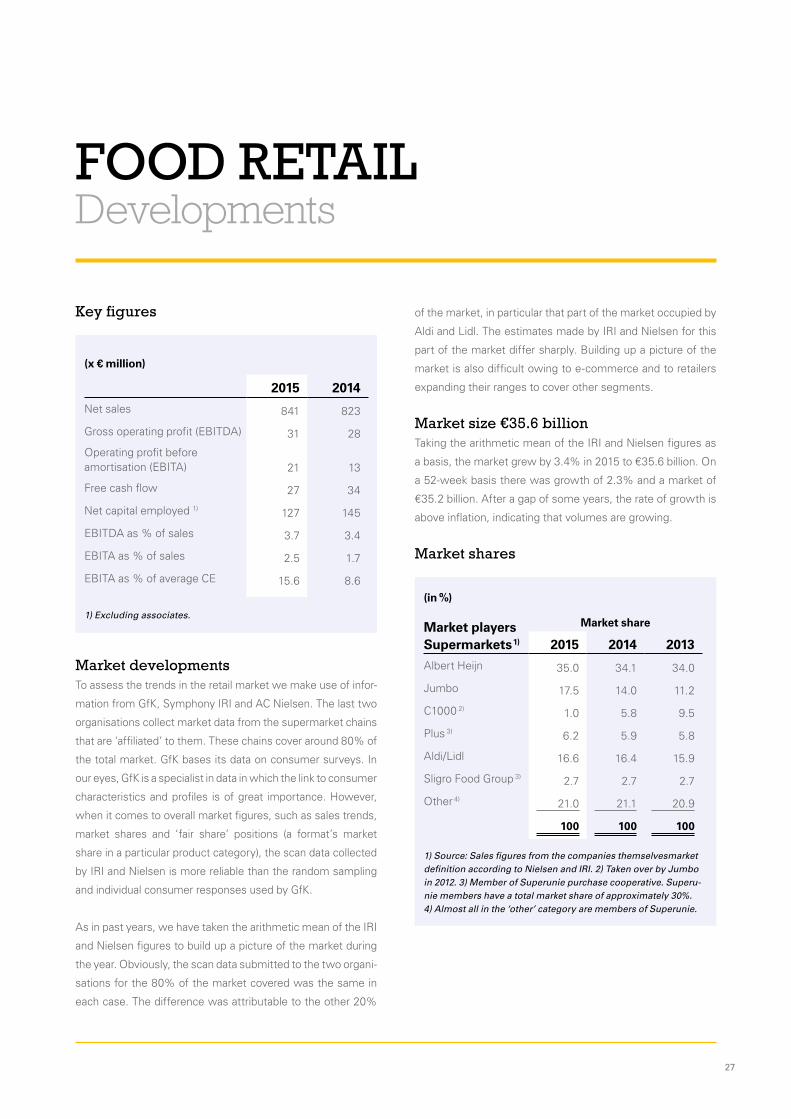
Key figures
Market developmentsTo assess the trends in the retail market we make use of infor-
mation from GfK, Symphony IRI and AC Nielsen. The last two
organisations collect market data from the supermarket chains
that are ‘affiliated’ to them. These chains cover around 80% of
the total market. GfK bases its data on consumer surveys. In
our eyes, GfK is a specialist in data in which the link to con sumer
characteristics and profiles is of great importance. However,
when it comes to overall market figures, such as sales trends,
market shares and ‘fair share’ positions (a format’s market
share in a particular product category), the scan data collected
by IRI and Nielsen is more reliable than the random sampling
and individual consumer responses used by GfK.
As in past years, we have taken the arithmetic mean of the IRI
and Nielsen figures to build up a picture of the market during
the year. Obviously, the scan data submitted to the two orga ni-
sations for the 80% of the market covered was the same in
each case. The difference was attributable to the other 20%
of the market, in particular that part of the market occupied by
Aldi and Lidl. The estimates made by IRI and Nielsen for this
part of the market differ sharply. Building up a picture of the
market is also difficult owing to e-commerce and to retailers
expanding their ranges to cover other segments.
Market size €35.6 billionTaking the arithmetic mean of the IRI and Nielsen figures as
a basis, the market grew by 3.4% in 2015 to €35.6 billion. On
a 52-week basis there was growth of 2.3% and a market of
€35.2 billion. After a gap of some years, the rate of growth is
above inflation, indicating that volumes are growing.
Market shares
(x € million)
2015 2014
Net sales 841 823
Gross operating profit (EBITDA) 31 28
Operating profit before amortisation (EBITA) 21 13
Free cash flow 27 34
Net capital employed 1) 127 145
EBITDA as % of sales 3.7 3.4
EBITA as % of sales 2.5 1.7
EBITA as % of average CE 15.6 8.6
1) Excluding associates.
(in %)
Market players Supermarkets 1)
Market share
2015 2014 2013
Albert Heijn 35.0 34.1 34.0
Jumbo 17.5 14.0 11.2
C1000 2) 1.0 5.8 9.5
Plus 3) 6.2 5.9 5.8
Aldi/Lidl 16.6 16.4 15.9
Sligro Food Group 3) 2.7 2.7 2.7
Other 4) 21.0 21.1 20.9
100 100 100
1) Source: Sales figures from the companies themselvesmarket definition according to Nielsen and IRI. 2) Taken over by Jumbo in 2012. 3) Member of Superunie purchase cooperative. Superu-nie members have a total market share of approximately 30%. 4) Almost all in the ‘other’ category are members of Superunie.

28 | Sligro Food Group 2015
The food retail market continues to be challenging. There is
still only limited growth in the market while new and existing
players are joining the market with online initiatives and we
are seeing traditionally non-food retailers attempting to move
into food. It is, therefore, remarkable that supermarkets’ floor
area is continuing to increase despite these developments.
We are also increasingly seeing relocations of supermarkets
to sites outside existing retail areas, where non-food retailing
is already suffering, reinforcing their decline. Although local
authorities are aware of this, they are taking only limited
action.
In 2012, Jumbo took over C1000 and it has converted most of
those stores to the Jumbo format. Albert Heijn and Coop both
acquired some C1000 stores and have converted them to their
own format. As a result, the last C1000 store and the brand
left the market during 2015. The results of the conversions
were, therefore, apparent in market shares in recent years.
Procurement marketThe Dutch market is supplied by five purchasing organisations.
These are Aldi and Lidl, which are, of course, supplied from
outside the country to a very great extent, and Ahold, Jumbo
and the Superunie purchasing cooperative, which represents
the relatively small players who are, however, regionally very
strong.
In 2015, the shares of the procurement market represented
by the latter three once again showed very little change, with
Ahold at around 35%, Superunie about 30% and Jumbo some
20%. Superunie and its thirteen members provide the Dutch
consumer with a wide choice of supermarket formats, in
contrast to the rest of Western Europe, where in each country
around five large retailers dominate the market.
Locations
Food Retail• EMTÉ • Veghel head of�ce/CDC
• Distribution centres Putten and Kapelle
• Production facility: butchery

29
Store networkWe ourselves have around 130 EMTÉ supermarkets, of which 33 were operated by independent retailers at the end of 2015. Our
market share represented by these supermarkets is 2.7%. As the map shows, our stores are not spread evenly throughout the
country and so our regional market shares are much higher.
An overview of our supermarkets is given in the table below:
This year, the increase of 0.2% in like-for-like sales lagged behind growth in the market and we still experienced relatively volatile
quarterly sales figures. A major reason for this was the relatively old branch network in a market where very many sites have been
updated in recent years following format changes. Dependence on campaigns and successful promotions also makes sales growth
volatile.
Total Food Retail sales increased by 2.3% compared with the previous year partly as a result of the 53-week year, which added €16
million in sales. Three franchised supermarkets joined our network in 2015.
Number at year-end
x 1,000 m2 retail space at year-end
Consumer sales1)
x € millionIndex of
like-for-like sales
2015 2014 2015 2014 2015 2014 2015 2014130 127 139 136 975 946 100 99
1) Including changes in the store portfolio during the year and VAT.
Total Food Retail sales comprise EMTÉ’s consumer sales (excluding VAT) and the wholesale value of sales to franchisees and
to the leisure group Center Parcs. Sales (excluding VAT) can be broken down as follows:
(x € million)
Net sales Share of sales as %
2015 2014 2015 2014Company-operated supermarkets 666 659 79 80
Independent retailers 175 164 21 20
Total 841 823 100 100

30 | Sligro Food Group 2015
External ratingEMTÉ’s butchery department came first in its category for
the sixth time in the GfK vote for Beste Vers Supermarkt
(‘Best Fresh Produce Supermarket’). In 2015, we also won
awards for the best cheese department and best processed
meat department, each for the second consecutive year.
Overall we again came third in the GfK fresh produce report,
so we have now held a solid top-3 place for some time. We
were also named as the supermarket that listens best to its
customers.
The most important reports in our sector are the Zomer- en
Kerstrapport (‘Summer and Christmas Reports’) published
by GfK. There were changes in their structure in 2014 and
the weightings were revised further in 2015. This makes
comparisons with earlier years more difficult although the
Summer and Christmas Reports for 2015 are comparable.
In the Christmas report, EMTÉ held its excellent number-3
position for customer rating, which it also achieved in the
Summer report. On the performance axis (determined in part
by factors such as acquisitions), EMTÉ improved slightly from
13th to 12th position over the six months. Overall, therefore,
we were in 4th place in the Christmas report (Summer 2015:
5th place). We believe that the success of our format has
to be based on customer rating and so we are very pleased
with the high scores on that axis. In due course this will be
reflected in the performance score.
We frequently measure customer satisfaction ourselves,
using the Net Promoter Score (calculated as promoters less
detractors). The 2015 survey showed that EMTÉ’s customers
were 40% Promoters, 5% Detractors and 55% Passive. This
gives us an NPS of +35 (2014: +45).
Rating
Relatively high
Rating
Relatively low
Performance
Relatively low
Performance
Relatively high
Nettorama
Jan Linders
Lidl
Boni
Deka
Dirk
VomarSpar
Coop
Aldi
Poiesz
MCD
Plus
Jumbo
Deen
Hoogvliet
Albert Heijn
EMTÉ’s NET PROMOTER SCORE: 35
CHRISTMAS REPORT2015
Detractors PromotersPassive
5% 55% 40%
Source: GfK December 2015

31
Creatinggrowth
Loyalty Unique product range
Building the brand
Strengthening the basics
Back-of�ce in order
Category management
Operational excellence
BUILDING BLOCKS for growth
Medium-term planIn early 2013 we presented a medium-term plan for 2013-2015 with six building blocks that focus on strengthening the basics of
the business and creating growth. The most important financial targets we set out were EBITA as a percentage of sales of 2.5%
to 3.0% and EBITA as a percentage of capital employed above 15%. We are of course very pleased to have achieved both of these
targets.
As the medium-term plan has now reached its end, we will use the first few months of 2016 to evaluate it extensively, looking at all
the quantitative and qualitative results against the targets. We will report on this externally later in the year. The main developments
in the past year are set out below.

32 | Sligro Food Group 2015
Creating growthThe Fijnproevers (‘Gourmets’) loyalty programme introduced
last year has established itself among our regular customers
at EMTÉ. Many of them have registered and are saving and
exchanging points and use the website and other social
media. Both the number of transactions and the average
spend by Fijnproevers customers rose in the past year. Since
our customers are no longer anonymous to us, we can also
make them tailored offers and we started doing this in the
summer of 2015. These personalised offers are proving to
be successful and add value to both our customers and our
suppliers. We will continue to develop the CRM programme
we set up for this in the next few years. What is clear,
however, is that Fijnproevers is not yet sufficiently attractive
to secondary and tertiary customers and that was one of the
objectives. Recruitment and activation along with rolling out
the CRM programme further will help extend its attraction.
In recent years we have made clearer decisions on our
product range and using the strength of Sligro Food Group
and its wide product range, production facilities and Fresh
Partners. We can and must go much further, however, and
we will do this in the next few years as part of our new
format generation. The ‘sweetshop’ is now open for EMTÉ’s
category management to choose from, adding unique items
from the Sligro product range to the ‘tastiest supermarket in
the Netherlands’.
We have also been busy building the brand, with new
campaigns and a new presence on TV, focusing more on
inspiration and simply tastier food. We saw that good savings
campaigns always boosted market share and our 360 degree
approach, in which we address the same themes at every
customer contact, is increasingly contributing to this. Price
campaigns alone are not sufficient to create sales growth.
We proved very vulnerable in the weeks when we did not
run a campaign. The revision of EMTÉ’s brand strategy is,
however, the main pillar for growth and so we worked hard
on it during 2015. The initial results are on show to customers
now our first pilot store has opened in Dieren. The programme
goes much further, however, than just the physical renovation
of the stores as we explain below.
Despite these efforts, we have not been able to structurally
outgrow the market in the recent past. In our opinion, setting
out the new brand strategy and translating it into new format
generation, including an up-to-date branch network, are
particularly important preconditions for creating that growth
over the next few years.

33
Strengthening the basicsWe have improved many of the processes in the back-office
and this gave us better insight and control over operations.
The quality and availability of the stocks in the stores have
improved hugely now that our ordering systems have been
rolled out widely and include almost every product group. As a
result, shrinkage has also been reduced. We are now working
with a clear agenda for improvement and see opportunities
for the future, including for our franchisees.
Many improvements have been made to the category
management process. Duties and roles have been reallocated
and specified but recruiting the right staff proved to be
difficult in the past year. As a result we have faced delays
in developing our plans in this area. In the second half of
2015, we built a department with a new manager of category
management that can undertake these plans in 2016. The link
between processes and available product range and category
management has been coordinated at Sligro.
We have made considerable progress on operational
excellence. Tackling wage costs, using the modular
organisation chart with normative staff levels, made a
particularly significant contribution to improving the results in
2015. A lot of attention went into staff training. A ‘training
house’ has been developed covering and updating the
full range of training from the introduction programme to
management development. On conversion to the EMTÉ 3.0
format generation, the entire store team will be coached and
trained intensively. Logistics costs were reduced once again
in the past year but we see further opportunities for cutting
costs in the coming years from better aligning operations and
supply chain.
We have clearly strengthened our basics in recent years and
using improved insights and process management have also
refocused the agenda for the next few years. It is good to see
the measures taken in 2014 and 2015 reflected in improved
results in 2015.
Financial targetsWith EBITA of 2.5% and EBITA as a percentage of capital
employed of 15.6% for the full year 2015, we have met the
targets we set ourselves. Although we are content with the
results achieved to date, our ambition for underlying sales
growth goes much further. Growth in sales per square metre
is the basis for future improvements in profitability which
currently come from cost savings and process improvements.
We realise very well, however, that setting a new brand
strategy and a new format generation takes time. We,
therefore, expect that the basis we have set for this in recent
years will gradually lead to a positive turn-around in sales
trends from 2016.

34 | Sligro Food Group 2015
New EMTÉ 3.0 format generation
Why changeFollowing Sligro, in the past year, we developed a new brand
strategy for EMTÉ. It was needed because we believed our
format was not sufficiently distinctive in the very competitive
mid-market and as a result it was increasingly difficult to keep
up with growth in the market.
Our competitors are investing strongly in their formats, new
players are entering the market and traditionally non-food
players are expanding into food. In addition, after more than
seven years in the current format our supermarkets are out
of date and need to be refreshed. As the Super de Boer
and C1000 brands have disappeared in recent years, about
800 surrounding stores have taken on a new appearance,
irrespective of the brand. This has only made our stores look
even older.
The needs of our customers are also changing. They are opting
more for convenience, shopping more often during the week
and in smaller quantities and expecting more inspiration and
service from their supermarket. Sustainable and responsible
shopping is on the rise and good, healthy food is important.
Customers have also become more aware of prices and the
price-quality relationship in recent years. While all chains have
regularly been shouting about the latter point, distinctiveness
with respect to quality, inspiration and innovation has actually
declined in the recent past and so there is more pressure in
the mid-market.
The key question we are asking ourselves, therefore, is:
how can EMTÉ continue to create growth in this challenging
market?
Our visionGood (healthy, high-quality and sustainable) and tasty food is
becoming more important. This is a real challenge for many
families every day.
Our missionWe have challenged ourselves to become ‘Simply the tastiest
supermarket in the Netherlands’. Every day and for special
occasions.

35
VISION & MISSION EMTE 3.0OUR VISION: GOOD (HEALTHY, HIGH-QUALITY AND
SUSTAINABLE) AND TASTY FOOD IS BECOMING MORE
IMPORTANT. THIS IS A REAL CHALLENGE FOR MANY
FAMILIES EVERY DAY.
OUR MISSION: WE HAVE CHALLENGED OURSELVES
TO BECOME ‘SIMPLY THE TASTIEST SUPERMARKET IN
THE NETHERLANDS’. EVERY DAY AND FOR SPECIAL
OCCASIONS.
Our roleIn a changing landscape, we see it as EMTÉ’s role to let our
customers enjoy good, tasty food. We are using the synergies
within Sligro Food Group more clearly than in the past
while remaining close to the needs and wishes of EMTÉ’s
customers. The focus is mainly on delicious and authentic
everyday products including concepts such as tasty, healthy
and sustainable. The average supermarket customer only
considers seven recipes for evening meals and so we have
set ourselves the target of expanding their ‘taste vocabulary’.
This is not mainly about increasing their culinary aspirations
but about having a good, tasty meal every day. For special
occasions, but also during the week. We want to create more
experiences that surprise our customers and challenge them
to try something new.
Our strengths and opportunitiesWe know that EMTÉ has a strong fan-base among its primary
customers, for example, from the ratings in the GfK Summer
and Christmas Reports. For many years, we have had the
best butchery, processed meats and cheese departments
and a good bakery and they have won awards. We can use
this to pave the way to being the tastiest supermarket in the
Netherlands. Our supermarket is accessible, our staff are
friendly and EMTÉ is recognised for its strong promotions.
The synergy within Sligro Food Group and the purchasing
power of Superunie and Sligro Food Group offer a major basis
to being a player in the competitive supermarket environment.
Our weaknesses and challengesDespite the loyal base, our customer group is too small,
including in comparison with other supermarkets. This is
reflected in a shortfall in sales per square metre that must
be reversed. EMTÉ’s store image is old-fashioned while the
pressure in the market is increasing as competitors invest in
modernisation. As a result, the strong elements of our format
are unknown beyond our regular customer base and as a
format we are insufficiently unique. We score less well on
price perception, in particular among secondary and tertiary
customers, who think we are more expensive than we
actually are. We are strong in fresh produce but not yet in fruit
and vegetables. Given our results in other fresh produce we
are sure we can alter that image in the future.
From A to BTo move from the existing situation to the picture outlined
above, we have a specific, comprehensive long-term plan,
part of which builds on what we started under the medium-
term plan. The EMTÉ brand stands for growth with the aim, as
‘simply the tastiest supermarket’, of significantly outgrowing
the market. Many more links with Sligro without going too far
up the culinary ladder. Known internally as: EMTÉ 3.0.

36 | Sligro Food Group 2015
CustomersWe focus on the widest possible public, remembering the
differences between our customers, concentrating in the
new generation primarily on customers who are looking for
convenience (including what will I eat this evening?, simple
inspiration, one-stop shopping) and above all who can and
want to enjoy everyday tasty food. Not enough of these
customers have come to us in the past; while they specifically
have a greater than average interest in tasty food and like to
try new things. Despite the excellent fresh produce on offer,
they thought too many items were missing from our range
and they wanted inspiration.
Our current customer base is more traditional in nature,
particularly appreciates fresh produce quality and is more
price conscious. Naturally, we want to keep as many of them
as possible but we know that our true Sligro Food Group
strength is elsewhere and, in addition, this group is declining
nationally.
In short, keep as many of today’s loyal shoppers as possible
but work hard to attract the new group in the mid-market.
Research has shown that, with some exceptions, this group
of customers is present in sufficient numbers in the towns
where EMTÉ has branches. This is logical as we face several
national competitors in many places and so the entire range
is actually represented.
PeopleThe importance of culture at Sligro Food Group is well
known and we have translated it into our DNA under the
name ‘Green Blood’. We will be doing this more strongly
at EMTÉ with a clear programme that expresses our values
and embeds them at every level. We are aiming to achieve
a customer-focused culture at EMTÉ similar to that at the
Sligro cash-and-carry wholesale outlets. Employees will have
plenty of freedom to assist customers and that will be
associated with a high degree of responsibility. A properly
organised central back-office will help the store employees
so that they can concentrate on customer satisfaction.
ProductsTo be distinctive, we will have to make choices. We are
investing in fresh produce and complementary products so
that our customers can prepare healthy and tasty meals. To
make space for these products, we are looking critically at the
items in non-cooking related product groups.
The pyramid above shows our product range. Our product
range strategy is to thin out the basic product range to make
shelf-space available for the ‘delicious’ products and items
that can inspire our customers.
Part of our distinctive strength is in our private label and
exclusive brands, where we make best use of the purchasing
power and know-how of Sligro Food Group and Superunie and
cooperation with our production facilities and fresh partners
to differentiate ourselves in terms of quality and innovation.
In some individual areas, the modularity may differ from the
basis.
PricesWe do not claim to be the cheapest supermarket in the
Netherlands. That is not our strength but we will continue to
emphasise that EMTÉ is a competitive format, not least on
price, with attractive special offers. We will revise the regular
pricing of our product range. The main reference items will
be cheaper and in line with the competitors where price is
dominant in their positioning. For other items, we will follow
our own strategy, which is not as dependent on price changes
made by our competitors.
We have also defined new roles for promotions so that our
promotion strategy is structured differently. This will ensure a
balance in which we can positively influence our price image
but also inspire our customers with good, tasty food.
The quality of the specialist at supermarket prices!
MODULAR product range structure
Based on the product range pyramid
Love
Prefer
Trust Basic
Delicious
Inspiration
Non-food

37
Visual identityAs is clear from the above, a new look and feel in the stores
is not the essence of the new format generation but in the
short term it will be the most obvious to our customers. The
visual identity reflects what the EMTÉ brand stands for. Our
new supermarkets will, therefore, revolve around a strong
food experience, authenticity and a fresh, modern retail
image. We want to emphasise that EMTÉ is the specialist
in good, tasty food. This is reflected in the way in which we
present our product range, the concepts we add and how we
communicate with our customers in the stores. We assist our
customers to make choices and gain inspiration and we also
tell them about our products.
Central managementThe changes we want to make will only succeed if we have
strong central management of our new brand strategy. This
has developed in recent years as part of the medium-term
plan. Setting frameworks centrally, and strongly enforcing
them, while offering the stores freedom to do business is
a powerful model. It ensures that we constantly and consis-
tently maintain our course and do not stray.
Roll-out and evaluationOn 11 November 2015 we opened our first store in the new
format generation in Dieren and there will be another three
in early 2016: two, in Uden and Nieuwegein, are conversions
and there is an entirely new site in Berlicum (North Brabant).
After a few months, we will take time to analyse and evaluate
the results of these pilot locations. This will show which parts
of the new concept are working well and what needs to be
adjusted or refined, and lead to a refocused concept that we
will then roll out across the rest of the stores, but we will
of course develop it continuously. The stores will be closed
for about two weeks for conversion. We expect that about
15 will have been converted by the end of 2016 and we will
convert about 20 in each of the following years.
EMTÉ OnlineAlthough still small in food, there is no doubt that online is taking
a major place in our market and this will only increase in the
next few years. Online is, therefore, expressly on our agenda
although up to now we have given priority to developing our
new brand strategy and new format generation. This does not
mean however that we have done nothing with online since
our alliance with Superdirect. The introduction of our new
website in combination with Fijnproevers and an ever-more
dominant presence on social media are examples of this. But,
of course, we are looking forward and certainly see a future
for a shopping site for EMTÉ. We are creating the conditions
for this since, when we purchased our new Online platform
for Sligro Online 3.0, we selected a platform which is also
suitable for Retail and the programme to improve our data
quality will meet a further condition. In 2016 we will develop
plans to combine a physical store with an online environment
for EMTÉ.
SPAROur associate, Spar, in which we have a 45% interest,
worked further on its medium-term plan in 2015. The market,
especially in the specific segment where Spar operates, is
stagnating and suffering from falling volumes. On the other
hand, demographic changes and a thinning out of stores in
villages offers opportunities for the future. Spar is now taking
the steps required to benefit from this and become the best
small-scale local format in the Netherlands.
In 2014, SPAR bore the charge for the closure of one of its
distribution centres in 2016 along with some non-recurring
charges for measures that in due course will return it to health.
The non-recurring charges were much smaller in 2015 and so
Spar achieved a considerably better result than in 2014.
As a shareholder we support the path that Spar is taking
and are confident that it will find the right balance between
customer, business and shareholder returns.


39
FOODSERVICEDevelopments
Key figures
(x € million)
2015 2014
Net sales 1,829 1,749
Gross operating profit (EBITDA) 129 121
Operating profit before amortisation (EBITA) 101 93
Free cash flow 51 44
Net capital employed 1) 486 458
EBITDA as % of sales % 7.0 6.9
EBITA as % of sales % 5.5 5.3
EBITA as % of average CE % 21.3 21.0
1) Excluding associates.
Market developmentsWe use information from the Dutch Foodservice Institute
(FSIN) on developments in the foodservice market. FSIN
makes its market assessments using consumer spending and
expresses the market in terms of wholesale prices based on
this. The difference between consumer spending and wholesale
prices represents VAT and the added value of the wholesale
customers. The growth in sales in consumer spending and the
wholesale value do not by definition have to run exactly parallel
as there are different quantities. The added value included
in consumer spending differs strongly by segment (care
institutions, restaurants, company catering, sports clubs) within
the foodservice market.
We are seeing growth once again in classical hospitality, which
increased by 2.6% compared with the previous year. Restaurants
in particular are seeing a clear recovery, but the beverages and
fast-food sectors are still lagging behind. In catering we see a flat
picture mainly because of the ongoing decline in the care sector,
which has suffered from austerity measures for some years and
this is clear in its spending on food. The pressure on the care
market is expected to continue in the coming years. FSIN reports
that the influx of refugees to the Netherlands is currently making
up for some of the underlying decline in the sector.
Market size at wholesale prices €6.5 billionFSIN estimated that the foodservice market at consumer
prices rose by 1.8% in 2015 compared with the previous year,
measured on a calendar year basis. The consumer spending
market was, therefore, some €17.7 billion; about €6.5 billion at
wholesale prices. As we work in periods of 52 or, as this year,
53 weeks, it is not simple to compare these market figures and
ours. We and FSIN estimate that we have beaten the market
like-for-like and this, along with acquisition sales, has seen our
market share rise again.
17,737 million
Out of Home channels30.9%
9,038 million
15.9%
Classical hospitality
+2.6%
3,161 million
5.4%
Catering
-0.0%
5,538 million
9.7%
Convenience
+1.6%
+1.8%
Market share of ‘Total Food’
Increase compared with 2014
Reduction compared with 2014
Source: FSIN analysis based on Foodstep, GfK, CPB, Statistics Netherlands, HBD, wholesalers and industry organisations, 30 November 2015.

40 | Sligro Food Group 2015
Market shares
(as %)
Market players Foodservice 1)
Market share
2015 2014 2) 2013Sligro Food Group 23.1 22.6 21.2
Lekkerland 12.7 12.7 12.4
Deli-XL 10.9 11.0 11.1
Hanos/ISPC 7.2 7.1 7.0
Makro (Metro) 6.3 6.7 6.8
Total other beverage wholesalers 3) 12.4 12.6 12.7
Other Maxxam (VHC, Horesca, Topclass Groep) 3) 6.2 6.2 6.5
Supertrade (Digross, Interkring, De Kweker, Huuskes) 3) 5.1 5.1 5.1
Other 3) 16.1 16.0 17.2
100 100 100
1) Source: Foodservice Beleidsmonitor 2016. 2) 2014 restated. 3) New category.
The market shares are based purely on food sales to foodservice
customers. FSIN makes its own estimates of the share of
non-food and sales to non-foodservice market customers (by its
definition) in cash-and-carry (for example, SMEs). This explains
the difference between the market share figures presented by
FSIN and the Foodservice sales reported by Sligro Food Group.
In 2015, FSIN revised the classification of the wholesalers
and added a number of new clusters. Sligro Food Group’s
market share for 2014 as reported last year has been adjusted
downwards (from 22.9% to 22.6%). The 22.9% was an estimate
by FSIN in May 2014 and was revised in 2015. Although this
affects the interpretation of individual years, we believe that
the long-term trend, where we are winning market share, is a
correct picture. This trend continued this year.
Drachten
Groningen
Assen
Emmen
Zwolle
Almelo
EnschedeApeldoorn Deventer
AmersfoortHilversum
Gilze
Arnhem
TielNijmegen
Gorinchem
LeidenZoetermeer
Amsterdam
Gouda
Alkmaar
Almere
Utrecht
Haarlem
Den Haag
RotterdamBerkel en Rodenrijs
Den Bosch
VenrayHelmond
VenloWeert
SittardHeerlen
Maastricht
Eindhoven
TilburgBreda
Bergen op Zoom
Terneuzen
Vlissingen
Sluis
GoesRoosendaal
Nieuwegein Doetinchem
Texel
Leeuwarden
Roermond
Veghel(hoofdkantoor)
Foodservice• Sligro cash-and-carry • Sligro delivery service
• Sligro cash-and-carry/ delivery service
• Van Hoeckel
• Production facilities
• Bouter
• Veghel head of�ce/ central distribution centre
CASH-AND-CARRY and delivery serviceLocations

41
Outlet networkWe expanded our nationwide network to 49 locations with
the opening of our new cash-and-carry outlets in Almere
and Utrecht in 2015. In addition, we set up eight distribution
centres for deliveries to foodservice customers. Three of the
49 cash-and-carry locations now also offer delivery (the Open
Delivery Service) and that is mainly to do with specific regional
and seasonal peaks. The strength of the network is mutual
cooperation. 75% of our delivery customers visit the cash-and-
carry wholesale outlets once every two weeks on average for
inspiration, advice and items they have forgotten. The cash-and-
carry wholesale outlets are perfect showrooms and collection
centres for smaller foodservice customers who, as they grow,
can if they wish transfer seamlessly to delivery services. And
so, although we separate the operations with a view to the
needs of our customers and efficiency, commercial cooperation
is strongly embedded.
NET SALESFoodservice
External ratingSligro wants to position itself as a partner for food professionals. We do this every time we come into contact with our customers.
For some years, we have had an in-house on-line knowledge and inspiration platform for hospitality businesses: Foodbrigade.
This has not gone unnoticed and is appreciated, as shown once again this year when Foodbrigade won Silver at the International
Content Marketing Awards and the Dutch PR Award in the B2B category.
We try to put the emphasis in the Foodservice strategy on a superlative form of customer leadership. In the end it is the customer
who decides how successful we are in this. We, therefore, have a structured approach to frequent measurement of Sligro’s Net
Promoter Score (calculated as promoters less detractors). We not only examine our own performance but also benchmark the
result against our competitors.
Outlets year-end
x 1,000 m2 floor space year-end
2015 2014 2015 20142.0 style
Type 1 13 14 51 56
Type 3 27 27 191 191
Type 4 2 3 25 36
Total 42 44 267 283
3.0 style
Type 3 4 1 30 6
Type 4 3 2 37 26
Total 7 3 67 32
Total Cash-and-Carry 49 47 334 315
2011 2012 2013 2014
100%
80%
60%
40%
20%
0
FS Delivery service FS Cash-and-Carry
2015
Type 1: excluding fresh produce. Type 3/4: including fresh produce.
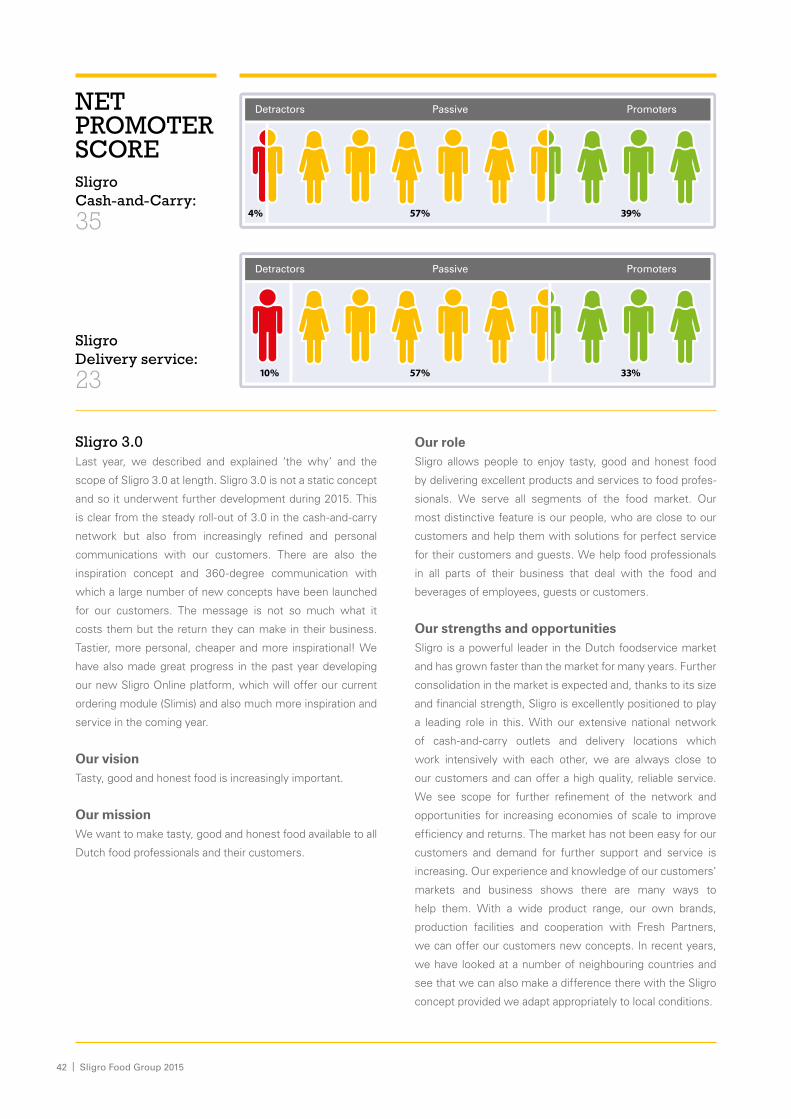
42 | Sligro Food Group 2015
Sligro 3.0Last year, we described and explained ‘the why’ and the
scope of Sligro 3.0 at length. Sligro 3.0 is not a static concept
and so it underwent further development during 2015. This
is clear from the steady roll-out of 3.0 in the cash-and-carry
network but also from increasingly refined and personal
communications with our customers. There are also the
inspiration concept and 360-degree communication with
which a large number of new concepts have been launched
for our customers. The message is not so much what it
costs them but the return they can make in their business.
Tastier, more personal, cheaper and more inspirational! We
have also made great progress in the past year developing
our new Sligro Online platform, which will offer our current
ordering module (Slimis) and also much more inspiration and
service in the coming year.
Our visionTasty, good and honest food is increasingly important.
Our missionWe want to make tasty, good and honest food available to all
Dutch food professionals and their customers.
Our roleSligro allows people to enjoy tasty, good and honest food
by delivering excellent products and services to food profes-
sionals. We serve all segments of the food market. Our
most distinctive feature is our people, who are close to our
customers and help them with solutions for perfect service
for their customers and guests. We help food professionals
in all parts of their business that deal with the food and
beverages of employees, guests or customers.
Our strengths and opportunitiesSligro is a powerful leader in the Dutch foodservice market
and has grown faster than the market for many years. Further
consolidation in the market is expected and, thanks to its size
and financial strength, Sligro is excellently positioned to play
a leading role in this. With our extensive national network
of cash-and-carry outlets and delivery locations which
work intensively with each other, we are always close to
our customers and can offer a high quality, reliable service.
We see scope for further refinement of the network and
opportunities for increasing economies of scale to improve
efficiency and returns. The market has not been easy for our
customers and demand for further support and service is
increasing. Our experience and knowledge of our customers’
markets and business shows there are many ways to
help them. With a wide product range, our own brands,
production facilities and cooperation with Fresh Partners,
we can offer our customers new concepts. In recent years,
we have looked at a number of neighbouring countries and
see that we can also make a difference there with the Sligro
concept provided we adapt appropriately to local conditions.
NET PROMOTER SCORE
Sligro Delivery service:
23
Detractors PromotersPassive
10% 57% 33%
Detractors PromotersPassive
4% 57% 39%
Sligro Cash-and-Carry:
35

43
Our weaknesses and challengesMarket conditions have only improved slightly in recent
years. We think this is a permanent change and it is the
new climate we have to work in. Although we have a strong
position, we will have to adapt continuously to the changing
market.
Different customers demand different service levels and
Sligro’s delivery service is still not responding adequately to
this. Over the next few years, we will be working on a more
differentiated range of services and this will also be reflected
in our pricing.
Although we have a strong purchasing organisation, our own
production facilities and many Fresh Partners who ensure
innovation in the product range, we believe that the speed
and number of innovations must increase. Our customers
are demanding different solutions and concepts and we have
to respond to this.
Prices and price perceptions in cash-and-carry are important
points for attention. Sligro sometimes seems more expen-
sive than it is and so we have to communicate and monitor
prices better.
We cannot allow ourselves to become complacent. We are
currently the market leader but we also see that the market
is changing around us. There are new players (and players
from the retail sector) who want to enter the foodservice
market. Larger customers are looking increasingly to the
best possible structure for purchasing and logistics and are
challenging us to think and move with them.
Sligro Online 3.0For some years, our Foodservice delivery customers have
been using Slimis, our online ordering application. It is a
fast, clear ordering module that is rated very highly by our
customers and over €1 billion was processed online in 2015.
We realise, however, that what is good today will not be
good enough tomorrow, and so we want to put the Sligro 3.0
concept online.
We aim to create a personalised platform which will still
offer the simplicity and efficiency of the current ordering
application and, if the customer so desires, add a lot of
inspiration and service such as menu suggestions, wine
lists, menu calculations, allergen solutions. At a later stage,
services could also be added to take work off our customers’
hands. Thus we are specifically involving our customers
when developing concepts and ideas. We want to get closer
to customers, deliver greater added value and so forge
stronger links.
The first step, however, is a seamless transition from the old
to the new environment in 2016 without immediately adding
a lot of new services. We will then gradually expand our
online offer and develop it in consultation with our customers
to increase its value and their satisfaction.
Cash-and-CarryThe conversion to 3.0 is progressing well and in addition we
opened our 48th and 49th outlets in Almere and Utrecht in
2015. As well as the conversion programme, cash-and-carry
wholesaling and marketing organised a range of activities
for existing and potential customers. The combination of an
inspiring environment and activities that add a lot of value
for our customers ensures a growing customer base and
higher spending. The modernised 3.0 outlets are ahead in
growth in sales and as a result we have actually been able to
increase sales and margins in the cash-and-carry wholesale
outlets and, as a spin-off, also support delivery services in
the region.
Delivery serviceWe estimate that 60% of the foodservice market consists
of delivery and 40% of cash-and-carry. The delivery market
is growing faster and, furthermore, we have relatively more
market share to gain than in cash-and-carry. We expect that
our ambition of growing from a market share of 23% to 30%
will, therefore, come mainly from growth in delivery services.
With this in mind, as well as addressing growth in delivery
services, we are looking for an improvement in the relative
returns. The projects we have launched in recent years to
VISION & MISSION Sligro 3.0OUR VISION: TASTY, GOOD AND HONEST FOOD IS
INCREASINGLY IMPORTANT.
OUR MISSION: WE WANT TO MAKE TASTY, GOOD
AND HONEST FOOD AVAILABLE TO ALL DUTCH FOOD
PROFESSIONALS AND THEIR CUSTOMERS.

44 | Sligro Food Group 2015
optimise the infrastructure have contributed to this but as
part of Kicking Costs we have paid considerable attention to
reducing variable costs in the delivery process in 2015. This
had a clear effect on delivery margins in 2015. In the coming
year, we will move further ahead on this and introduce a
differentiated service offer and associated pricing. We call
this ‘the logistics menu’. We will be able to offer a tailored
service to our customers and create and measure added
value where possible. We are also working with a number of
our large customers to find opportunities to cut the distances
we drive for deliveries not only from the cost viewpoint but
also certainly with the aim of cutting CO2 emissions. This
latter point is very important to both Sligro and many of our
customers.
Van HoeckelVan Hoeckel focuses primarily on the institutional market,
which has been under severe pressure for some years
as a result of spending cuts brought about by government
measures. As a result, Van Hoeckel has been able to offset
the general market trend which has also clearly affected
its existing customers. In recent years Van Hoeckel has
developed its own vision for the market and, anticipating
Sligro 3.0, has repositioned itself. It is now benefiting from
this. This is also a must in a market that is continuously
changing. Van Hoeckel is further extending its services and
adding new concepts. With the successful launch of the
online ‘At the table’ platform in early 2015, Van Hoeckel
introduced a comprehensive solution for meal deliveries to
small-scale care homes. At the end of 2015, Van Hoeckel
introduced the ‘Experience’ concept with a successful
pilot at the Groene Hart hospital in Gouda. ‘Experience’ is
a full-service concept for hospitals centred more than ever
on the patient. The patient decides what, when and where
to eat. The hospital maintains full control over the nutritional
process but is fully supported and relieved of work by Van
Hoeckel.
BelgiumIn 2015, we made a final decision that Sligro should enter
the still fragmented Belgian foodservice market and we think
that we can add something with our Sligro 3.0 concept. We
will initially be focusing on Flanders. Research we have done
and are still doing among existing and potential customers
in Belgium shows that there is a place for a player like
Sligro. We are fully aware that food culture differs between
countries and even regions and so we will adapt to local
customer requirements as we do in the different regions
of the Netherlands. 2016 will be spent preparing for the
opening of our first site in Belgium. Given the time required
for licences and construction, we expect to open our first
site with delivery facilities in Antwerp in early 2017. In the
run-up to this, we will be busy with various matters preparing
for operations in Belgium. We will adapt the Belgian
organisation as far as possible to our existing ICT platform
and structure the Supply Chain from the existing network in
the Netherlands. We will supplement and adjust our product
ranges for the Belgian market partly with our Fresh Partners
who will also be supporting us in Belgium.
In the meantime, we will of course also be building our
profile in Belgium by approaching individual customers,
participating in fairs and offering trips to inspire potential
customers. Where necessary we will be reinforcing our
central organisation in both the Netherlands and Belgium to
be ready for the opening in 2017.

45
Acquisitions In addition to organic growth, we want also Foodservice to
grow through acquisitions. We still see scope for further
consolidation in the Netherlands and are well positioned to
play a prominent role in this but we cannot set the pace on
our own. Only a very few candidates appeared on the market
in recent years, and they have to meet our criteria:
– first and foremost an appropriate customer base/mix that,
when combined with our business, creates synergy;
– a culture that does not present an obstacle;
– a particular size or specialisation;
– strengthen our presence at a regional or national level;
– acceptable in terms of market position and competition.
The acquisition of Bouter in 2015 met these criteria.
BouterIn June, we acquired CaterTech and since then it has conti-
nued under the Bouter name by which it is best known in
the market. Bouter specialises in consultancy and designing,
supplying, installing and maintaining professional kitchen
equipment and chilling and freezing technology. Bouter has
a specialised range of own-brand products and exclusive
licences and focuses on hotels, company restaurants,
healthcare, education and shipping. Bouter’s products
and services complement those of Sligro and they will
reinforce each other in many customer segments. Bouter
generated sales of €22 million in 2014 and has some 106
employees on a full-time basis. Cooperation between the
sales representatives of Sligro and Bouter was enhanced
immediately following the acquisition and this led to an
increase of over 20% in Bouter’s sales in 2015. Bouter will
continue to operate relatively autonomously, but where
possible we have integrated the back-office activities. We
will further optimise the organisation and infrastructure in
2016 so that profitability and sales can improve further.

Dendi optatur sunt quis ut apit molupta tiumqui id qui derovid maio molorent, molupic ipsapit omnia que.quat apel expliquam quae volupit landisquiate velestiae.
OVERZICHT2015 SligroFood Group

47
ORGANISATION And employees
Goals – Establish long-term employment relationships, consistent
with our status as a reliable and professional employer.
– Encourage relatively long-lasting service with the compa-
ny in order to maximise the payback from investments in
training, corporate culture and commitment.
– Maintain employees’ pride in Sligro Food Group through
intensive communication and enabling them to share in
the Group’s success.
– Create a safe and pleasant working environment in which
employees from different backgrounds can all feel at
home. Consequently, we look carefully at the diversity in
our workforce.
– Encourage cooperation and partnership as a means of
achieving targeted synergistic benefits for the Group.
– Ensure we protect and promote important elements of
our culture, our ‘Green Blood’: Strength in unity, Passion-
ate pride, Cost awareness, Healthy belief in ourselves
and Consciously direct.
– Create a leadership style reflecting our culture.
– Remain committed to an informal organisation, where
short lines of communication and reporting help to
achieve intelligent and rapid solutions in day-to-day
activities.
– Continue promoting customer-oriented and custom-
er-friendly practices as the norm for all our employees.
– Anticipate the challenges in the marketplace and our
ambitions for the future through a group-wide quality
drive in the organisation.
– Consistently strive to improve employees’ performance
by providing structured and challenging opportunities for
training and management development.
Corporate cultureOur distinctive culture and the standards and values
embedded in it are key drivers of our way of doing business.
Although culture is a relatively abstract term, it is at the same
time very real when you experience it. In addition, a culture
cannot be ‘arranged’ but is much more the logical corollary to
the way in which we work together and manage over time.
Our natural inclination is to keep things informal: we are
averse to status, have short, direct communication lines
and build on trust. In a society which is becoming more and
more formalised, it is a challenge to find a balance between
properly organising formal matters and holding on to our
informal culture. Things are not automatically better just
because they are put down on paper. A ‘healthy belief in
ourselves’ means in this context choosing between formality
where it is needed and informality where possible.
Of course, we structure our entrepreneurialism in a socially
responsible way. As a listed family business, this comes
naturally to us. We fully appreciate that we are part of the
wider community and so are happy to account for our way of
doing business. We do not see that as an obligation, however,
but are happy to explain what we do and how we do it.
Recognition of individual performance is very important.
People are encouraged if their own contribution is noticed and
appreciated. This means that the entire team or organisation
can become better and we call this ‘Strength in unity’.
In recent years, a number of employees have been taken on
at the strategic management level. They first learn a lot about
the ‘not-very corporate’ nature of our organisation. It is very
important for success to discover and understand what that
means for operations and management at Sligro Food Group.
We need to raise our game even more at another more tactical
level of our organisation. Partly to properly interpret the
ambitious strategic plans, partly from the need to speed up.
The world we want to do business in is changing ever faster.
New techniques and new insights demand rapid adaptation.
That not only demands a good ICT base; employees will also
have to anticipate our customers’ changing requirements
more quickly.
We aim for a open communication culture. Addressing good
and bad behaviour immediately, but with respect for the
individual, is ‘Consciously direct’. Sometimes newcomers
take a while to get used to the culture and if it does not suit
them they often quickly leave. Our culture is dominant and
48 | Sligro Food Group 2015
definitely not optional. Part of the selection of new employees
looks specifically at whether candidates have the necessary
competences.
This directness, which makes absolutely clear what is and is
not acceptable, is in general valued at all levels and certainly
at the operative level it is nice to know exactly where you
stand.
You have to have passion if you are dealing, directly or
indirectly, with tasty food and beverages every day. We
encourage this passion for food in many ways, one of which
is our cookery club. Every quarter, a group of employees cook
to a high level under the guidance of professional chefs. As
well as encouraging pleasant informal gatherings, it is a good
way to feed this passion. Our new and renovated cash-and-
carry wholesale outlets are the visible expression of our
3.0 ideas, as is the renovated and entirely new-style EMTÉ
opened in Dieren. It is natural to be proud of this. ‘Passionate
pride’ in fact.
Investing in the right places and at the same time implementing
a challenging Kicking Costs programme, is what we call ‘Cost
Awareness’. Being responsible for managing our resources
carefully contributes to stable growth and investing in the
future.
In a nutshell the Sligro culture is summarised in these five terms:
– Strength in unity
– Passionate pride
– Cost awareness
– Healthy belief in ourselves
– Consciously direct
People make the differenceOrganisations are of course extremely dependent on
smart ICT applications, a good and inspiring product range,
a promotion policy tailored to customers’ wishes and a
surprising environment where they can shop. These elements
are, however, relatively easy to copy and so by definition
not permanently distinctive. In the end, there is one single
moment when the difference is made and that is the genuine
personal contact between our employees and customers.
This is not a trick that you can teach people but is a natural
outcome of our culture. Attention to employees leads to the
employees’ attention to the customers. It helps that many
employees have a background in catering and, in particular, in
the hospitality industry.
We deliberately pay a lot of attention to our employees, for
example when we celebrate our long-serving staff at a party
each year. In 2015, there were over 350 of them. Or when
we took over the Efteling theme park one Sunday for our
employees and their families to mark our 80th anniversary.
Or sometimes a little gift for a personal milestone such as a
marriage or the birth of a child.
If an employee has a personal issue where we can help out,
we try to do that. In the Netherlands we have formalised
many of these points as entitlement to emergency and care
leave. We are pleased that in our case, with good relationships
based on trust, this is a question of just going ahead and
making good arrangements.
This year we started leadership courses for a number of
groups. We expect this will translate our leadership principles
into practice at all levels.
Our monthly staff magazine ‘sliM’ is keenly anticipated in the
organisation. We have updated its form and content within
the 3.0 idea and the layout and content have undergone a
complete transformation without abandoning the principles.
It is created entirely in-house and prepared in our own studio.
We are proud of our magazine, which concentrates on the
employees.

49
Labour marketIt is very doubtful whether the stimulus measures intended
to stimulate the employment market have actually had
any effect. Companies do not create work where it is not
necessary. Growth comes from working hard and intelligently
and that creates more jobs.
The Work and Security Act (Wwz) brought much upheaval
to the labour market. Reform of redundancy laws was
long overdue but the new rules are still based on out-of-
date assumptions. The ideal of a permanent contract of
employment is outmoded and not realistic. We are convinced
that facilitating flexibility and mobility is more in line with the
wishes of today’s employees and employers.
The operation of the transition payment still has to be proven
in practice. Paying a transition payment if someone becomes
completely occupationally disabled is mystifying. The
employer bears all the costs of continuing to pay the salary
in the event of illness as well as the costs of assistance. To
add a transition payment to the employer’s burden, which in
these cases will not be used for a real transition, is, therefore,
inexplicable.
It is noticeable that the labour market is picking up but we
can still find the right employees. Starting in 2015 we now
work with a new vacancies site. Each year, about 30,000
candidates apply for 3,000 vacancies. A proper support
system is needed to keep this process manageable and to
pay the right attention to the labour market. The way in which
candidates approach the labour market is changing and so
the way in which companies have to search is also changing.
We are more often looking for specialists, preferably with
some experience. Finding them is also increasingly a job for
specialists. We are also making more use of digital methods
such as chatting, video calls and online assessments to
support the selection process. As well as being efficient, this
also further rationalises the process.
FlexibilityWe like to organise our labour force ourselves. We believe
that our culture is a strong pillar of our success and so it is
not appropriate to work with large numbers of temporary
staff or flexible labour. We have a small number of flexible
workers so that we can deal with seasonal peaks and to offer
employees a job within the organisation when there is an
acquisition. Almost all employees kept their jobs at their own
site following the acquisition of Bouter as we are continuing
this activity autonomously. We relocated one or two natural
back-office activities to Veghel where they were included in
the regular work.
We arrange part of our flexible labour force through the
Hobij employment agency, which specialises in supplying
workers from eastern Europe. In the past we worked with
several parties but this did not deliver cost or quality benefits.
Furthermore, we need to professionalise the partnership
further. That needs investment and this can be done better
with a single party. We believe it is important to deal with
a reliable party aware of the social aspects of working in a
different country, such as accommodation, healthcare and
insurance. In this respect, Hobij delivers the quality we need.
We are using more students in our delivery operation. The
amount of work goes up and down through the weeks and
months and this addition to our regular workforce means the
fluctuations can be properly handled. Working with more
part-timers does, however, require more from supervisors.
Staff turnover is greater and the degree of engagement is
generally lower.
Organisational changesThere are always reasons to adapt the organisation and in fact
this is an ongoing process. More is being demanded and just
working harder is not the solution. You have to be smarter. We
do this in part through automation and process innovation,
but also by developing our employees and attracting the right
talent.
In 2015, we cut 30 office staff from our delivery operations
without compulsory redundancies. We also harmonised the
employment contracts, positions and related employment
terms and conditions at our production facilities.
We were able to fall back on the social plan agreed with the
Works Council for both of these organisational changes.
Naturally our starting point is handling the interests of the
individual employees carefully. A social plan means this is
transparent and verifiable. In the end, the way such processes
are implemented determines the result.
Much disquiet is avoided by being clear and transparent
and explaining the consequences of a decision quickly
to employees. Furthermore, we do not take short-term
measures on employment conditions and people have time
to adapt slowly to the new situation.

50 | Sligro Food Group 2015
AbsencesIn the Netherlands, all the risk of absence is effectively
borne by the employers. The tools for managing that risk are,
however, very limited and technocratic regulations do not
help. The UWV, the official body implementing employee
insurance schemes, monitors compliance but entirely from
its own ivory tower protected by a digital moat. Privacy
legislation also brings a lack of clarity and incomplete infor-
mation. Strictly speaking, an employer is not allowed to know
that someone has broken a leg, even less that there is a more
complex situation.
Financial problems, housing difficulties, complex upbringing
situations are all reasons that may lead to absences. This
means that as an employer you sometimes have to go further
into a person’s private life than you might wish. To support
our employees we deploy social workers and psychological
support but also offer personal and budget coaching. This is
of course all done while respecting the employee’s private
domain.
We are certainly not satisfied with our absenteeism rate
of 4.2% and medium-term absences in particular are not
properly under control. The inflow into actual occupational
disability is, however, low. In 2016 we will be reinforcing
our approach further in part by a ‘happy at work’ campaign.
Attention to well-being and prevention will play a major role
in this. Supervisors will be given more training in maintaining
interaction with sick employees.
WORKFORCE MAKE-UPand diversity
FTEs2014
Staff numbers2014
FTEs2015
Staff numbers2015
4375%
3,41234%6,097
61%
4334%
3,67136%6,049
60%
3897%
2,86950%2,482
43%
3957%
2,77047%2,669
46%
Head of�ce Food Retail Foodservice

51
We have divided our workforce into three categories:
We have analysed our employees by type of contract, gender
and age.
Our supermarket staff include many part-timers, including
many women who combine this work with caring for the
family. There are also many young people on part-time
contracts.
Given the nature of the work, we mainly employ full-timers in
Foodservice. Logistics work is usually performed by men and
so we see a different composition of the workforce. In the
supermarkets, the work is manual and service oriented. Our
cash-and-carry outlets require more qualified staff to advise
professional customers. This means we have put together a
more extensive training package for Foodservice employees.
These differences do not, however, say anything about the
engagement or satisfaction of the employees. At most, in
some cases it involves a different approach and different
attention from supervisors.
It is clear that the number of support functions at the head
office is declining and the number of highly qualified positions
is increasing. Many administrative support functions are
disappearing as a result of automation. The development and
management of processes demands a higher level of training.
The remaining clerical work is often too complex to automate.
The type of work performed at head-office level is not really
gender-specific but the nature of the industry we are in
means that men are over-represented. This is also the case
with us. We are pleased that over time the number of women
in management positions has increased. Processes started in
the past mean that two of the five new members of our core
team are women.
The membership of the Executive Board is still three men as
Rob van der Sluijs took over as CFO from Huub van Rozendaal.
There was a deliberate decision to choose internal experience
and this was built in to the succession seven years ago.
The Supervisory Board consists of four men and one woman.
The terms of office of two of the supervisory directors,
including the female one, are expiring. The proposed
appointments maintain the composition.
Diversity is a matter for pragmatic and open discussion at our
organisation. It is not an artificial process driven by targets.
We attach much more importance to the right competences
and culture match when selecting candidates. We subscribe
fully to the general opinion on this subject and believe it is
important to achieve this balance gradually. Intrinsic reasons
work better here than quotas.
FS FR HK SFG
100%
80%
60%
40%
20%
0% STAFFby contract
2-12 hours p/w
12-36 hours p/w
≥36 hours p/w
FS FR HK SFG
100%
80%
60%
40%
20%
0% STAFFby gender
Female
Male
STAFFby ageFS FR HK SFG
100%
80%
60%
40%
20%
0%
10-20
20-30
30-40
40-50
50-60
>=60
FS: FoodserviceFR: Food Retail
HK: Head of�ceSFG: Sligro Food Group

52 | Sligro Food Group 2015
Participation ActAs expected, the introduction of the Participation Act has
brought much uncertainty. Official bodies are confused,
legislation is unclear, target groups are not well defined
and responsibility for the ‘label’ that someone is given is
not properly arranged. The law created a lot of work, but
not for the intended target group. This has not prevented
us from undertaking several initiatives in this area. We
and other businesses in Veghel have tried to set up a local
service centre for activities such as a laundry and ironing
service or local transport. We have created the position of
service employee in a number of supermarkets offering
simple services to customers such as helping find items or
packing the shopping. We are organising a logistics course in
cooperation with a sheltered workshop.
These types of initiative are part of our tradition of deliberately
taking local responsibility as an employer. Anyone who ‘can’
or ‘wants to’ can take part. Legislation and regulations should
help but regularly only make things very complex. Better
dialogue between policymakers and practitioners would help.
SafetyWe have instituted a Health, Safety, Welfare and Environment
steering group with representatives from all parts of the
business. This is partly to emphasise its importance but also
to take decisions appropriate to the nature of the business
and the type of work we do. The work is not by nature unsafe
and continuous attention will help keep it so.
We recorded 113 accidents at work (2014: 120). In 60 cases
(2014: 43) treatment was required and in 5 cases (2014: 4)
the injury was serious enough to result in hospital admission.
Obviously we have procedures in place for immediate
investigation and accidents are reported as necessary to the
Inspectorate of the Ministry of Social Affairs and Employment.
The training of company first-aiders was revised and is now
partly offered digitally whereas in the past all these courses
were organised in Veghel. With 1,273 first-aiders, this makes
a huge difference to the burden on the organisation while still
ensuring quality.
There were two robberies in 2015 and these were a horrible
experience for the victims, in this case our employees. We
immediately deployed professional help so that our people could
talk through the situation and if necessary get follow-up help.
Learning and developmentMany of our courses have been digitalised further: sometimes
to make it easier to update the content and sometimes to offer
e-learning. This is an excellent way for our supermarket staff
to follow a quick, short course or to learn something. This
way of learning is part of the everyday lives of our assistants,
many of whom are school and college students. It is less of
a burden for employees on part-time contracts to study at
home at a time that suits them.
Increasingly, other courses are being offered in mixed
form and the combination of digital and traditional learning
enhances effectiveness.
This digital approach anticipates the purchase of our new
employee portal which includes a ‘learning’ module. Courses
will in future be offered more frequently and in smaller
modules making them more accessible and less of a burden
so that they fit in with life-long learning.
There is a familiarisation programme for everyone who starts
with us. A new approach has been developed for managers
and supervisors. These groups promote our culture and, as
this is special and not optional, we believe more and specific
attention to this is very important for these newcomers.
The Jan Hoenselaar Award, named after the former head of
training at Sligro Food Group, was presented for the first time
in 2015. The award is for a dissertation or work placement
report by a child of an employee. The winner receives €5,000
to support their further education. Two young people won
the award thanks to their original approach, creativity, specific
applicability and powerful presentation. The awards were
made at a special ceremony attended by a large number of
guests from the education world.

53
Works councilWe have only one works council on which all business units are
represented. This is fully in line with our organisational structure:
we are, after all, a single business with three different routes to
the market and one integrated back-office. The works council
has organised its work by subject, in the form of committees.
Representative consultations in the form of a works council make
matters transparent and ensure accountability for decisions. We
are required to have a Works Council by law but we see this
‘necessity’ as a blessing. This is partly because institutionalised
negotiations offer a way to properly organise matters formally
and partly because of the way the talks take place: critical, open
and informed and so with understanding for all interests, working
together on the quality and continuity of the organisation. The
members of the Works Council are all involved in practical
operations and that is a major benefit for the negotiations.
The Works Council met seven times. One meeting was used
to evaluate its own functioning, one was an extra meeting in
connection with the acquisition of Bouter and the other five were
regular consultative meetings with management. The meetings
are held with the CEO and the HR director.
The consultative meetings are used to exchange information,
from management on the business situation and specific staff
matters and from the members of the works council on the view
from the workfloor in the different business units. This regularly
provides subjects for discussion at later meetings. These
exchanges are regarded by both sides as very special given their
openness and spontaneity.
We want to highlight some notable subjects to illustrate the
breadth of the consultations:
– The personnel scheme (referred to elsewhere as the
Social Plan).
– Changes in redundancy law.
– Employment terms and conditions such as the kilometre
allowance, pay negotiations, pension fund and profit
sharing scheme.
– Appraisal interviews, progress following employees’
satisfaction survey and the health and safety policy.
– Plans for Sligro Food Group in Belgium and their
consequences for representative consultations.
– An extra meeting was held in connection with the
proposed acquisition of Bouter to explain why this
acquisition met the organisation’s objectives, possible
effects on the staff and how we would deal with them.
The Works Council is of course not responsible for decisions
that are taken after being submitted for advice or agreement,
but it does have a role in getting insight into the consequences
for employees and has to base its advice or agreement on this.
These are often complex matters and by discussing some of
them in depth in committee, the various members develop a
degree of specialisation. By holding open discussions respecting
the other person's position, we always reach as suitable solution.
Employee engagement expressed as membership of the works
council deserves particular respect and we would like to thank
the members for their constructive, critical and courteous
attitude.
YOU HAVE TO HAVE PASSION IF YOU
ARE DEALING, DIRECTLY OR INDIRECTLY,
WITH TASTY FOOD AND BEVERAGES
EVERY DAY.
SLIGRO Passion for the work
54 | Sligro Food Group 2015
Development of HRM in the organisationWorking with 10,000 employees brings many obligations.
Some to keep matters manageable and some to perform the
role of employer properly. This is a huge administrative task,
certainly given these numbers including a large number of
temporary assistants.
As a result, it was decided some years ago to go digital and
major steps have been taken. Standard personnel processes
are started up by managers who receive a request or who
take the initiative and then processed largely automatically.
In addition to this Management Self-Service, the system also
supports the management duties. For example, formats for
interviews help prepare for the discussion with an employee.
In 2015 we selected the platform that we will use to introduce
Employee Self-service from 2016. As well as allowing
employees to arrange routine matters (changing address, civil
status, expense claims) themselves, this platform is mainly
intended to be a collaborative communications channel.
As the platform is available on all devices and is location
independent, we also have a solution for staying in contact
with all employees. As a large majority of employees do not
have a workplace computer or the ability to log in elsewhere
to our systems, we still have to do a lot of traditional
communication. Purchasing this system allows us to change
that and adapt to today’s world in which everyone is now
used to easily-accessible digital information at anytime and
anywhere so that they can arrange things at home or on the
road.
Being able to arrange matters yourself is of course easy
and up-to-date; the platform is mainly intended to be a
communications channel for information on Sligro Food
Group, your business unit, matters relevant to your work
and everything we all can or want to be proud of and want
to share. The platform is, therefore, certainly not just for HR
but will change a lot in terms of cooperation, information,
management and supervision and so people from several
departments will be involved in its implementation.
HR matters for Belgium were identified during 2015. Many
personnel matters are arranged differently in Belgium
and processes will have to be adapted accordingly. As a
newcomer to the Belgian labour market, we are not familiar
with it. A recruitment and selection approach has been drawn
up and a training and familiarisation programme prepared for
a wide range of positions so that we newcomers will soon
find our way in the culture, systems, working methods and
conduct.
Employment terms and conditionsOur supermarket staff are covered by the Collective Labour
Agreement for Large Food Retailers and almost all other Sligro
Food Group employees are covered by the Collective Labour
Agreement for the Food Wholesale Sector. In recent years,
negotiations on both CLAs have been extremely difficult but
agreement was eventually reached in 2015. The FNV trade
union organisation withdrew from the negotiations on both
CLAs. The fact that the CLAs were not in force for some time
did not lead to concern among our employees. In line with
a joint agreement in the industry, we awarded unilateral pay
increases and of course we complied with the arrangements
in the CLAs, even though they had expired.
The CLA for the Food Wholesale Sector runs to 1 June 2016
and covers over 4,000 employees (about 40% of the total
workforce). The CLA for the Large Food Retailers runs to 1
April 2017 and covers over 6,000 employees (about 60% of
the total workforce). The group of employees in the EMTÉ
butchery department (less than 1% of the workforce) are
covered by the butchery CLA.
Our approach is to minimise the number of CLAs we have to
work with. The Bouter employees were covered by various
regimes and were transferred to the CLA for the Food
Wholesale Sector on 1 January 2016. Employment conditions
we can set ourselves are the same for all employees.
Pensions and pension fundSligro Food Group has its own company pension fund that
includes most of the employees covered by the wholesale
sector CLA. The scheme we have offered our employees
since 1 January 2015 is a collective defined contribution
scheme. The employer’s contributions paid by the Group are
equal to the charge shown in the profit and loss account and
the contribution rate is fixed for both employer and employee
for five years. Our aim is that after a lifetime of work our
employees should be able to support themselves in their
retirement.
The pension landscape underwent considerable change
in 2015 and while the impact was not so large for Sligro
Food Group, it was all the greater for the company pension
fund. The tax benefits for building up pensions were further
restricted under the 2015 Witteveen framework and the new
Financial Assessment Framework (nFTK) was introduced
so that financial shocks could be better absorbed. There
was a new Pension Communications Act and the regulator
(DNB) spoke out frequently in the form of numerous themed
reviews of pension funds.

55
Continuing low interest rates and volatile financial markets
are putting pressure on the fund’s investment results. The
funding ratio at year-end 2015 was 117 and so the pension
fund had a funding shortfall. A recovery plan will be drawn
up and submitted to the Nederlandsche Bank within the
permitted time limit.
Employee share ownershipWe have been encouraging share ownership by employees
ever since the flotation of our company in 1989. We believe
in the added value it offers and are proud that we have a
scheme for all employees. Over the years, this has led to
almost 4% of the shares being owned by the employees. The
original scheme, based on the employee savings scheme,
was revised in line with new tax legislation but it eventually
became too expensive. The costs to the organisation were
becoming more and more skewed in proportion to the income
for the employees. In 2015, we introduced a new scheme
which is a combination of a grant of shares and ‘Green Blood
Certificates’, which are a type of option.
This new scheme is also under pressure. Legislation in recent
years has introduced various measures to end excessive
enrichment from bonuses, options and shares. Unfortunately,
this legislation has also hit our employee share ownership
scheme at Sligro Food Group despite it being specifically
designed for employees with a gross income up to €50,000
per year. The result of this is that the payments of a few
hundred euros a year to these employees are taxed very
heavily. This has made the cost of the scheme disproportionate
when compared with the benefit to our employees. As we
attach great significance to employee share ownership, we
are continuing the scheme in 2016 and will hold talks with
politicians in an attempt to reverse this side-effect of the law,
which we regard as unjustified.
EMPLOYEESHARE OWNERSHIPSligro Food GroupWE HAVE BEEN ENCOURAGING SHARE OWNERSHIP BY
EMPLOYEES EVER SINCE THE FLOTATION OF OUR COMPA-
NY IN 1989. WE BELIEVE IN THE ADDED VALUE IT OFFERS
AND ARE PROUD THAT WE HAVE A SCHEME FOR ALL
EMPLOYEES. OVER THE YEARS, THIS HAS LED TO ALMOST
4% OF THE SHARES BEING OWNED BY THE EMPLOYEES.
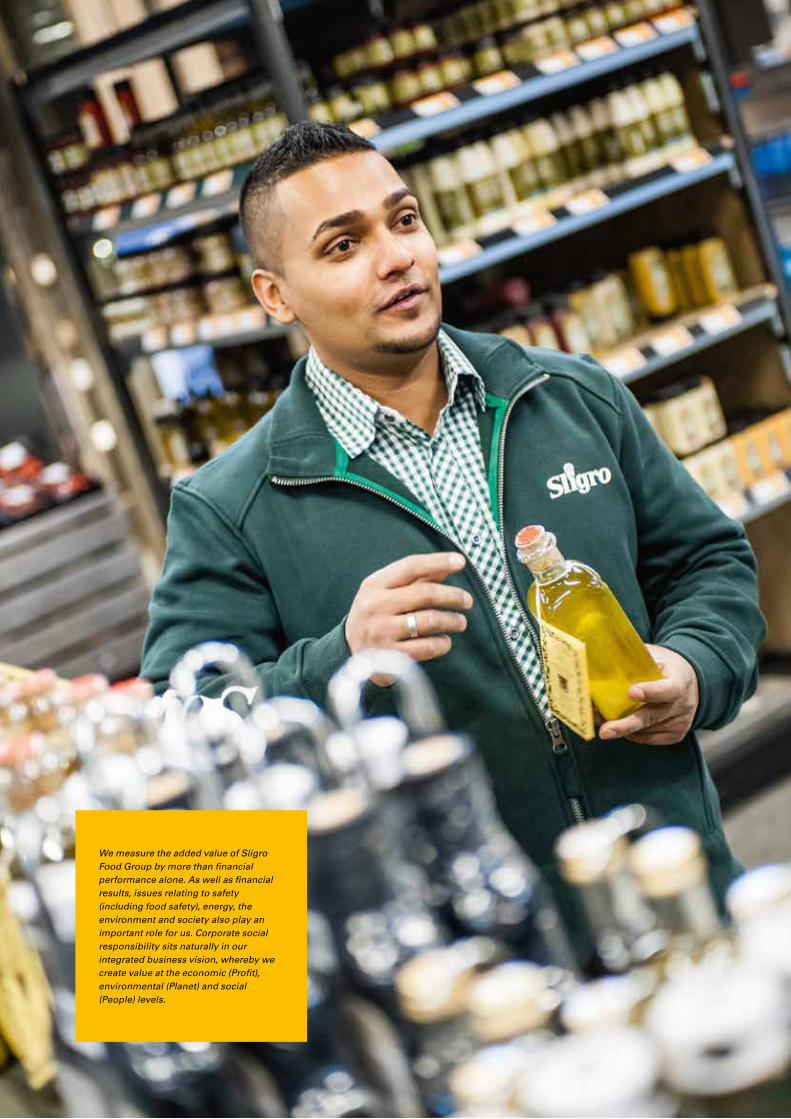
56 | Sligro Food Group 2015
We measure the added value of Sligro Food Group by more than financial performance alone. As well as financial results, issues relating to safety (including food safety), energy, the environment and society also play an important role for us. Corporate social responsibility sits naturally in our integrated business vision, whereby we create value at the economic (Profit), environmental (Planet) and social (People) levels.

57
CORPORATESocial Responsibility
Our vision of CSR; how we operateAt Sligro Food Group, corporate social responsibility and
commercial returns go hand in hand. For us, corporate social
responsibility is simply a key element of professional and
sustainable business practice. That comes from the heart of
our family business, with its stock market listing. As a family
business you simply want to do the right thing by the people
who work for you and for the wider world, now and with a
view to the future. It is part of our ‘Green Blood’ as it were.
One business, one policyAs a centrally managed organisation we pursue a single
sustainability policy for the Group. The core themes,
ambitions and targets accordingly apply to the Group as a
whole. In the scope and extent of our reporting, however, we
do distinguish between our Foodservice and our Food Retail
activities.
In foodservice, Sligro is market leader in the Netherlands
(over 23% market share), demanding that:
– We encourage innovation
– We are open to experiment
– We assume the role of value chain orchestrator
– We seize upon sustainability initiatives as a matter of
course.
In food retail, EMTÉ is a small player (2.7% market share).
A somewhat more modest role is therefore appropriate:
– We tend to follow rather than initiate, except with respect
to EMTÉ’s trump card: fresh produce.
We have a presence in quite a few links of the food supply chain,
as can be seen in the diagram below. Our production company
SmitVis processes primary products; Culivers, Maison Niels
de Veye and EMTÉ Vleescentrale all produce on behalf of the
Group, both Sligro and EMTÉ have wholesale operations and,
with our EMTÉ supermarkets, we serve the end consumer.
That makes the scope of our sustainability activities both wide
and complex, but no less fascinating for that.
Genetics and breeding
Primary products
Sligro C&C and DS wholesale activities
EMTÉwholesale activities
Foodservice outlets
EMTÉsupermarkets
Consumer
Processersof primary products
and waste
Branded and own label products;
Sligro Food Group production companies
Sligro Food Group IN THE FOOD SUPPLY CHAIN

58 | Sligro Food Group 2015
About this reportIt is our practice to cover both our financial results and our
sustainability performance together in our annual report. In
this section we report on the results achieved and the most
significant developments in the field of corporate social
responsibility (CSR) in 2015. The figures concerning staff are
as usual given in the 'Organisation and employees' section of
this report. Specific sections are also devoted to information
and key figures relating to the Group's organisation. A change
compared with our reporting on previous years is that this time
we have included topics explicitly relating to our Foodservice
or Food Retail businesses in the relevant sections of the
report. This makes more sense in an integrated report. The
GRI table in this report contains references to the sections
and pages concerned.
The report has been compiled in accordance with the Global
Reporting Initiative (GRI) G4 Guidelines Core level. The GRI
table can be found on page 160 of this report. In addition
to a quantified presentation of the developments according
to our core themes in relation to our 2020 targets we also
provide a narrative report on current topics identified by
the CSR Steering Group experts. The content of the report
is also informed by current public concerns in general and
questions, responses and feedback from stakeholders
such as consumers, employees, NGOs and shareholders
as well as developments in the sector, such as legislation
and standards. The report’s main target groups are our
employees, customers, shareholders, suppliers and potential
employees.
The report and the related GRI table can also be found on our
corporate website. http://www.sligrofoodgroup.nl/mvo.htm.
Please address any questions, comments or suggestions to:
Implementation in the organisationThe Group makes use of a CSR Steering Group. The
composition of this Steering Group has been matched to the
CSR core themes which we have formulated for Sligro Food
Group and for which the members bear ultimate responsibility
for their respective areas within Sligro Food Group. The CSR
Steering Group as a whole makes policy decisions and the
individual members implement them at operational level
within their respective areas. The CSR Steering Group is
chaired by the chairman of Sligro Food Group's Executive
Board. The CSR Steering Group met on six occasions in 2015.
Progress towards our sustainability targets was a regular
item on the agendas of the meetings of the Works Council,
Executive Board and Supervisory Board in 2015 and regular
presentations on that subject were given at those meetings.
Stakeholder dialogueHelping our customers to choose sustainable products on
ethical grounds is a responsibility that is not ours alone.
Our stakeholders also have an important part to play in this
regard. By creating a sense of involvement and by listening
we are able to gain an insight into the expectations and needs
of our stakeholders. Not only do our stakeholders help us to
identify our material sustainability themes but they also play a
big part in developing our strategy.
As in preceding years, we engaged with various stakeholders
in 2015. It is noticeable that our transparent and clear-cut
choices provide an incentive and an invitation to enter into
dialogue. As far as many NGOs are concerned, the agenda
remains relatively one-dimensional and of necessity focused
on the issue which they are pursuing. Their particular
concerns are the quality, the safety and the origin of the food
we sell, along with animal welfare. Other stakeholders have
a broader approach to sustainability and engage with us on
ways of improving the balance between financial and social
returns. This dialogue covers energy, alternative fuels for
our vehicle fleet, new forms of distribution in our towns and
cities and ethical attitudes to taxation. We are open to such
dialogue and seek very much to engage in it.
PartnershipWith KNVB
‘KEEPING ACTIVE!’

59
Affiliations and administrative involvementIn addition to being a member of sector-specific organisations,
as a major player in the food market, we also have a duty
to help with administrative functions and to demonstrate an
active involvement in these organisations. In 2015 we were a
member of and actively involved in:
– CIV Superunie
– CBL (Centraal Bureau Levensmiddelenhandel)
– VGL (Vereniging Grootwinkelbedrijven Levensmiddelen)
– GIL (Groothandel in Levensmiddelen)
– BZW (Brabants Zeeuwse Werkgeversvereniging)
– CVO (Contactgroep Veghelse Ondernemingen)
– Werkbedrijf Noord Oost Brabant
– Locus
– NeVIR (Nederlandse Vereniging voor Investor Relations)
– VEUO (Vereniging Effecten Uitgevende Ondernemingen)
– FSIN (Foodservice Instituut Nederland)
– FSN (Foodservice Network)
– Foodpolicy NL
– Food Squad
– AgriFood Capital
– GrowCampus
– FoodserviceXS
– Green Deal Verduurzamen Voedselconsumptie
– BSCI (Business Social Compliance Initiative)
– Stuurgroep Duurzame Handel
– Stichting DoSocial
– Verwenzorg
– Dutch Cuisine
– VLM (Vereniging Logistiek Management)
– Stichting Versfust
CSR certificationDespite our reservations and previously expressed doubts as
to the true added value of CSR certificates, we made a start, in
November 2014, with preparations for FIRA certification. The
stakeholder dialogue with our major foodservice customers
had revealed a need for a qualification model. The process
for obtaining our FIRA ‘bronze registration’ was completed
in March 2015.
Transparency Benchmark Our annual report is also measured against the Transparency
Benchmark of the Ministry of Economic Affairs, Agriculture
and Innovation. This is an annual survey of the content
and quality of social reporting by Dutch companies. The
benchmark gives us an idea of how our transparency
in relation to sustainability compares with that of other
companies. A total of 461 companies are officially included in
the Transparency Benchmark but, in 2015, 216 companies did
not appear in the rankings because of a 'zero score' or failing
to publish information.
Last year we stated that we were not expecting any substantial
improvement in 2015 as the new criteria for the Transparency
Benchmark did not match our method of reporting. With a
score of 112 points out of a possible 200 we finished in 112th
place out of the 245 companies that were assessed. That
puts us in the 'peloton' of the overall benchmark. If we zoom
in on Food Retail, however, we rank in third place and, as
regards Foodservice (wholesale), we rank second.
2015 2014 2013 2012Score: 112/200 120/200 138/200 99/200
Overall ranking: 112/245 100/244 97/500 124/500
Challenges Food truths and food confidenceWe are constantly bombarded with reports on studies of
the food we eat, each asserting specific findings, whether
with a sound scientific basis or otherwise, frequently
highly subjective and coming to a not entirely disinterested
conclusion. Often the messages are even contradictory. What
today was perfectly healthy is bad for our health tomorrow
and vice versa. No wonder consumers are confused. Who or
what should they believe? Scientific researchers, consumer
programmes on the TV, NGOs, connoisseur foodwatchers
(including self-appointed experts), celebrities, politicians?
Never before in our history has the quality and reliability of
our food in the Netherlands been as high and confidence in
the food chain so low.
ACM cartel rules frustrating corporate social responsibilityThe Authority for Consumers & Markets (ACM) alleges in
some cases that initiatives are tantamount to cartels, forcing
us to scrap agreements on sustainability and the ethical
conduct of our business. An example is the 'Kip van Morgen'
(‘Tomorrow’s Chicken’) Initiative. As far as we are concerned,

60 | Sligro Food Group 2015
this puts a spoke in the wheel of an important sustainability
initiative with which the sector was simply trying to address
urgent social problems surrounding animal welfare and the
environment. Improving minimum animal welfare standards,
in this case, of chickens has nothing to do with the formation
of cartels. Moreover, suggesting that it does puts a brake
on future sustainability initiatives and causes uncertainty
regarding many existing, successful initiatives such as those
connected with sustainable palm oil, improving ingredients
that go into products and the procurement of timber from
sustainably managed forests.
As a consequence, businesses have become reluctant to act
in a sustainable manner or pursue the principles of corporate
social responsibility. The diktats of the ACM are a barrier,
for example, to agreements on child labour and low wages
in the production of clothing, or the further development of
the circular economy. We would like to see the government
remove the obstacles in European and national competition law
and its implementation. After all, partnerships between one
company and another and between the business community
and civil society organisations to promote sustainability are
vitally important in the transition to a sustainable economy.
Although the ACM ruling does not detract in the slightest
from our ambition to become a sustainable business, it is a
serious impediment to ongoing processes.
Materiality analysisThere are three core themes to our CSR policy, covering the
areas in which our major opportunities and challenges lie and for
which we bear the greatest and most obvious responsibilities
for reporting in the chain: people, the environment and our
product range. These themes derive from a core theme project
conducted by the CSR Steering Group in a process involving
external consultants. Talks with our stakeholders formed part
of this process. We have formulated qualitative and quantitative
ambitions for each of these themes.
Our core themes
Our employees
Our customers
Our community
CO2
Energy
Packaging
Waste
Sustainable
Health
Food waste
PEOPLE THE ENVIRONMENT PRODUCT RANGE
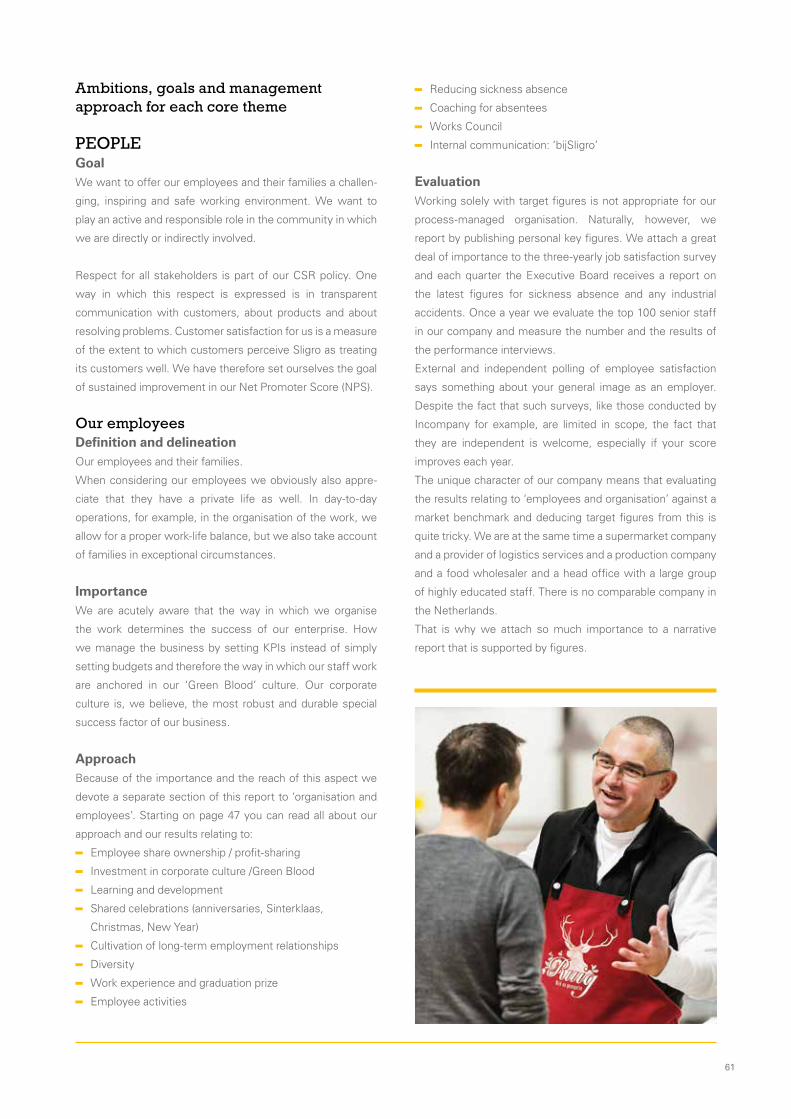
61
Ambitions, goals and management approach for each core theme
PEOPLEGoalWe want to offer our employees and their families a challen-
ging, inspiring and safe working environment. We want to
play an active and responsible role in the community in which
we are directly or indirectly involved.
Respect for all stakeholders is part of our CSR policy. One
way in which this respect is expressed is in transparent
communication with customers, about products and about
resolving problems. Customer satisfaction for us is a measure
of the extent to which customers perceive Sligro as treating
its customers well. We have therefore set ourselves the goal
of sustained improvement in our Net Promoter Score (NPS).
Our employees Definition and delineationOur employees and their families.
When considering our employees we obviously also appre-
ciate that they have a private life as well. In day-to-day
operations, for example, in the organisation of the work, we
allow for a proper work-life balance, but we also take account
of families in exceptional circumstances.
ImportanceWe are acutely aware that the way in which we organise
the work determines the success of our enterprise. How
we manage the business by setting KPIs instead of simply
setting budgets and therefore the way in which our staff work
are anchored in our ‘Green Blood’ culture. Our corporate
culture is, we believe, the most robust and durable special
success factor of our business.
ApproachBecause of the importance and the reach of this aspect we
devote a separate section of this report to ‘organisation and
employees’. Starting on page 47 you can read all about our
approach and our results relating to:
– Employee share ownership / profit-sharing
– Investment in corporate culture /Green Blood
– Learning and development
– Shared celebrations (anniversaries, Sinterklaas,
Christmas, New Year)
– Cultivation of long-term employment relationships
– Diversity
– Work experience and graduation prize
– Employee activities
– Reducing sickness absence
– Coaching for absentees
– Works Council
– Internal communication: ‘bijSligro’
EvaluationWorking solely with target figures is not appropriate for our
process-managed organisation. Naturally, however, we
report by publishing personal key figures. We attach a great
deal of importance to the three-yearly job satisfaction survey
and each quarter the Executive Board receives a report on
the latest figures for sickness absence and any industrial
accidents. Once a year we evaluate the top 100 senior staff
in our company and measure the number and the results of
the performance interviews.
External and independent polling of employee satisfaction
says something about your general image as an employer.
Despite the fact that such surveys, like those conducted by
Incompany for example, are limited in scope, the fact that
they are independent is welcome, especially if your score
improves each year.
The unique character of our company means that evaluating
the results relating to ‘employees and organisation’ against a
market benchmark and deducing target figures from this is
quite tricky. We are at the same time a supermarket company
and a provider of logistics services and a production company
and a food wholesaler and a head office with a large group
of highly educated staff. There is no comparable company in
the Netherlands.
That is why we attach so much importance to a narrative
report that is supported by figures.

62 | Sligro Food Group 2015
Our customersDefinition, importance and evaluationExcellent customer satisfaction lies at the heart of our
marketing approach, in both food retail and foodservice. This
is covered in detail in the sections dealing specifically with
‘Food Retail’ and ‘Foodservice’, commencing on page 27. To
measure and evaluate customer satisfaction we use what is
known as the Net Promoter Score (NPS). The NPS for Food
Retail and Foodservice can be found on pages 30 and 42.
Our community Definition and delineationIn the present context, our community comprises the people
forming a particular social grouping who in that sense live,
work, follow their leisure pursuits and reside in the towns and
villages where Sligro Food Group is active.
ImportanceOur presence in a local, regional or national community
automatically means that we form part of that community
and therefore not only have a functional role, for example as
employer, but also bear a responsibility for the surroundings
in which people live and the way in which activities can
contribute to the quality of the community as a whole. Our
supermarkets are not merely a distribution point for our daily
bread but also fulfil an important social function.
ApproachWe have made a conscious decision to lend our long-term
support to a number of specific social/societal, people-
orienta ted activities or good causes, in order to prevent the
resources earmarked for this purpose from being diluted across
a whole range and variety of projects. Those resources may
take the form of money, goods, services or a combination of
these things.
Sponsorship involves being deliberately selective. Our support
comes with strings attached, and has to make a meaningful
contribution to our business, marketing and sustainability
strategies. In all our sponsorship projects, therefore, we seek
close cooperation with the beneficiaries or the organisers of
an event based on mutual equality. The projects we choose
to support have national coverage as far as possible. Local
customs and traditions can, however, be so strong that our
presence or involvement is desirable. In such cases we make
a conscious decision to depart from our national policy.
Our detailed sponsorship policy can be found on our corporate
website.
EvaluationWe start by examining whether there is a logical link between
what we are sponsoring and Sligro Food Group as a whole or
a particular part of the business. Sponsorship must provide
relevant added value for both parties on the principle of ‘you
scratch my back and I’ll scratch yours’. Since the sponsorship
takes a specific form in most cases, it is easy to measure in
retrospect whether both sides of the agreement have been
honoured. On top of that, ‘society’ has its own dynamics and
that requires us to act as part of society when it comes to the
policy we adopt and the choices we make.
We currently have a long-term partnership with Liliane
Fonds, Nationaal Ouderenfonds, Villa Pardoes, Verwen- zorg,
DoSocial and Voedselbank.
Sponsorship of‘EET met je hart’'EET met je hart' organises social activities for vulnerable
elderly people in collaboration with local people, the
hospitality sector, the business community, welfare and other
bodies, charities and service organisations in the locality in
which 'EET met je hart' is active. The organisation focuses
mainly on old people who, because of social impoverishment,
are no longer able to get out of the house easily. Working in
partnership with participating restaurants and it’s ‘guests’,
'EET met je hart' aims to combat loneliness among old
people. Eating out means enjoyment, pleasure, spending
time with friends and family and sharing happy moments, all
in a warm, social context. We believe that 'EET met je hart'
has a marvellous way of sharing this feeling with the elderly
who might otherwise go through life in loneliness and we are
more than glad to support the organisation. On the occasion
of the opening of our new outlet in Utrecht 'EET met je hart'
was presented with a cheque for €10,000 to expand this
project in the city.
Food bankSligro Food Group has been working with Voedselbank, the
Dutch food bank initiative, for many years. In our logistics
model, all products that cannot be sold from all outlets are
returned to the central distribution centre in Veghel. Here
they are sorted into 'usable' and 'no longer usable' and
the products which can be used by the local food banks
in Veghel-Uden and 's-Hertogenbosch are collected on a
weekly basis. Although this means that all these products
serve a particularly good purpose we feel that supplying only
food banks in Veghel-Uden and 's-Hertogenbosch does not
properly reflect our national coverage. In 2015 we entered
into talks with the executive committee of Voedselbanken

63
Nederland, the nationwide food bank umbrella organisation,
to explore ways of supplying other food banks across the
country with products as well, without upsetting our logistics
model.
Partnering KNVB'Lekker Bezig!' (‘Keeping Active!’) is the name of the joint
project launched in conjunction with the Royal Dutch Football
Association (KNVB) in 2015. Despite the fact that there is
a substantial sponsorship component to this project, it has
been covered under the heading of ‘health’. You can read
more about our approach on page 69 of this report.
Sligro and Liliane Fonds in Sri LankaThe charity Liliane Fonds has been supported by Sligro Food
Group, by Sligro Food Group employees and by customers of
Sligro for many years. Our contribution provides small-scale,
personalised aid and we also adopted a major, long-term
project. On completion of our project in Benin we started
looking round for a new challenge that would allow us to
help disabled children. In fact we set ourselves a greater
challenge by seeing if we could involve one of our suppliers in
a developing country in a project, and we have found just the
project in Sri Lanka.
Sri Lanka is a country where both Sligro and Liliane Fonds are
active. Amongst other products, our Alex Meijer tea comes
from Sri Lanka and Liliane Fonds operates an extensive aid
programme in the country. Initial talks took place with our tea
supplier, Bogawantalawa, in 2013. The approach was aimed
at seeking a partnership that, with aid from Sligro, would
enable disabled young people to be trained for a job with
Bogawantalawa.
It was found that there were more than a hundred children
with disabilities on the plantations receiving hardly any
attention at all. Many are left at home alone all day because
their parents have to work at the plantation. Or they get
no schooling because they have special needs because
parents assume that education is pointless for their child.
Some children do not receive the necessary medical support
because parents do not know what help they need or how to
go about getting it. Many disabled children are not involved
in activities in and around the house by their parents simply
because they don’t know how. What we have, therefore, is
a ‘forgotten’ group. Agreements have been reached with
Liliane Fonds and Bogawantalawa on ways of helping these
children. The plan which has been drawn up is aimed at the
longer term, it is sustainable and the idea is that it should
ultimately serve as a model for the entire plantation sector.
ENVIRONMENTWe aim to play a pioneering role, in which our respect for
the environment drives us constantly to undertake bold but
sensible innovation, keeping social and economic returns
in balance while remaining aware of our stewardship
responsibilities.
As a measure of the success of our efforts, we calculate our
CO2 emissions. To relate our CO2 emissions to the growth
of our business in the coming years, we express them as a
percentage of sales.
GOALWe aim to cut our CO2 emissions per sales euro by 20%
between 2010 and 2020, which is why we refer to it as our
'20-20 target'
CO2
Definition and delineationThe scope of our efforts concerns emissions of CO2 from
using gas and electricity and from the distance travelled in
connection with movement of goods by road to and from all
wholesale outlets, stores, corporate customers, distribution
centres and production sites. The CO2 emissions are related
to the fixed conversion parameters with a 2010 baseline,
enabling us to effectively monitor the annual reduction in CO2
emissions that we achieve relative to 2010.
ImportanceThis is an important issue within the company because we
have promised our stakeholders to do all we can to reduce
our CO2 emissions – our carbon footprint – by 20% per sales
euro relative to 2010 by 2020.
ApproachA CO2 report is produced and discussed every six months.
Wherever the results are not in line with the achievement
of our 20-20 target, the matter is taken up with the relevant
person responsible for electricity and gas consumption or
transport usage. A check is performed to see whether the
expected results have been achieved, depending on the
actions mentioned under the heading ‘Energy’. The same
is done for the actions undertaken in relation to transport
(logistics).
EvaluationThe six-monthly CO2 emissions reports are evaluated by the
person with responsibility for CO2 emissions and are then
discussed with the Executive Board. An annual progress
report is published as part of the directors’ report, including
an explanation of the figures.
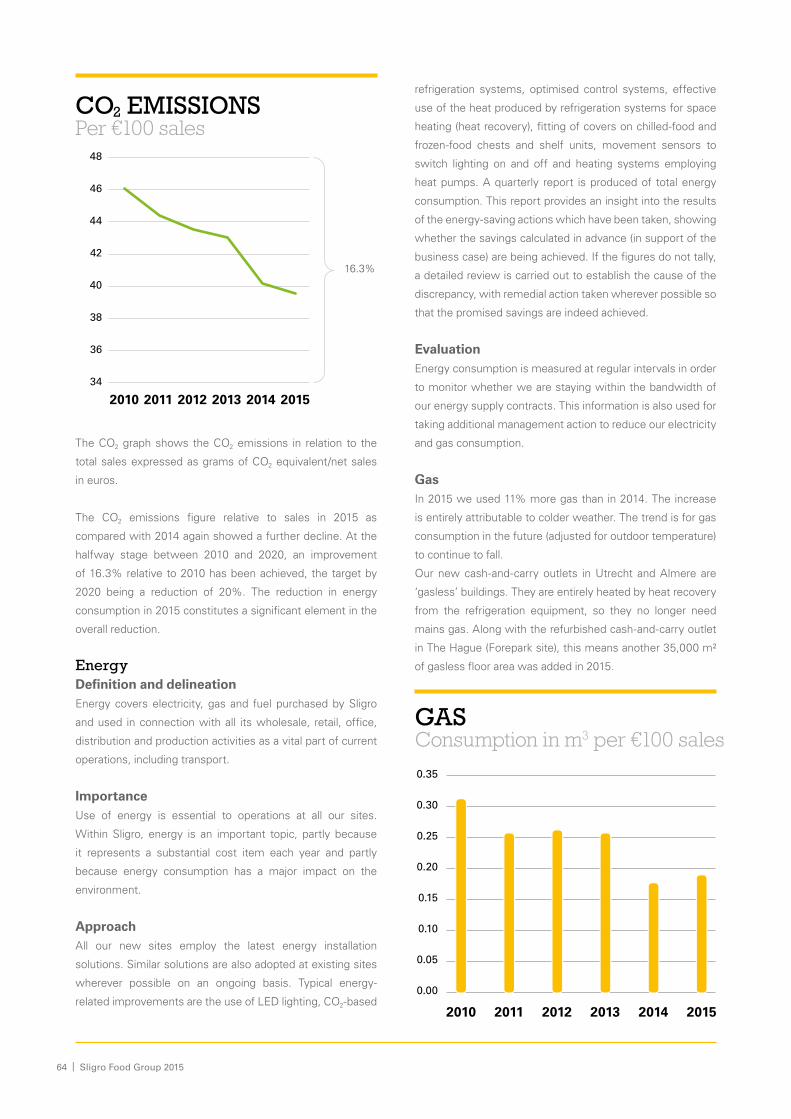
64 | Sligro Food Group 2015
The CO2 graph shows the CO2 emissions in relation to the
total sales expressed as grams of CO2 equivalent/net sales
in euros.
The CO2 emissions figure relative to sales in 2015 as
compared with 2014 again showed a further decline. At the
halfway stage between 2010 and 2020, an improvement
of 16.3% relative to 2010 has been achieved, the target by
2020 being a reduction of 20%. The reduction in energy
consumption in 2015 constitutes a significant element in the
overall reduction.
EnergyDefinition and delineationEnergy covers electricity, gas and fuel purchased by Sligro
and used in connection with all its wholesale, retail, office,
distribution and production activities as a vital part of current
operations, including transport.
ImportanceUse of energy is essential to operations at all our sites.
Within Sligro, energy is an important topic, partly because
it represents a substantial cost item each year and partly
because energy consumption has a major impact on the
environment.
ApproachAll our new sites employ the latest energy installation
solutions. Similar solutions are also adopted at existing sites
wherever possible on an ongoing basis. Typical energy-
related improvements are the use of LED lighting, CO2-based
refrigeration systems, optimised control systems, effective
use of the heat produced by refrigeration systems for space
heating (heat recovery), fitting of covers on chilled-food and
frozen-food chests and shelf units, movement sensors to
switch lighting on and off and heating systems employing
heat pumps. A quarterly report is produced of total energy
consumption. This report provides an insight into the results
of the energy-saving actions which have been taken, showing
whether the savings calculated in advance (in support of the
business case) are being achieved. If the figures do not tally,
a detailed review is carried out to establish the cause of the
discrepancy, with remedial action taken wherever possible so
that the promised savings are indeed achieved.
EvaluationEnergy consumption is measured at regular intervals in order
to monitor whether we are staying within the bandwidth of
our energy supply contracts. This information is also used for
taking additional management action to reduce our electricity
and gas consumption.
GasIn 2015 we used 11% more gas than in 2014. The increase
is entirely attributable to colder weather. The trend is for gas
consumption in the future (adjusted for outdoor temperature)
to continue to fall.
Our new cash-and-carry outlets in Utrecht and Almere are
‘gasless’ buildings. They are entirely heated by heat recovery
from the refrigeration equipment, so they no longer need
mains gas. Along with the refurbished cash-and-carry outlet
in The Hague (Forepark site), this means another 35,000 m²
of gasless floor area was added in 2015.
GASConsumption in m3 per €100 sales
0.35
0.30
0.25
0.20
0.15
0.10
0.05
0.00
20112010 2012 2013 2014 2015
CO2 EMISSIONSPer €100 sales
16.3%
2010 2011 2012 2013 2014 2015
48
46
44
42
40
38
36
34

65
ElectricityIt was discovered in 2014 that an important electricity meter
measuring our electricity usage was not working properly
and was reading low. In the period under review, the amount
by which it had been under-reading was reconstructed and
agreed with all the suppliers concerned. It was found that
the error had been present in the installation since 2011.
The understated electricity consumption has been adjusted
retroactively in the graph for the period 2011-2014.
TrendThere was another reduction in energy consumption
compared with the preceding year. A substantial reduction
was achieved by the conversion of our wholesale outlets
in Eindhoven and The Hague (Forepark) to the new 3.0
format. At both sites, the latest energy-efficient refrigeration
equipment has been installed, using sustainable, natural
refrigerants. In addition to all the chilled-food and frozen-
food islands, the refrigerated shelf units have now also been
fitted with daytime closures. LED lighting has been used as
well. Other factors contributing to the energy-saving have
been the rollout of daytime closures on the refrigerated/
freezer units at the wholesale sites and the conclusion of the
supermarket energy covenant.
ELECTRICITYConsumption in kWh per €100 sales
7.0
6.8
6.6
6.4
6.2
6.0
5.8
5.6
5.4
5.2
20112010 2012 2013 2014 2015
LogisticsDevelopments in the field of alternative fuels, modern
engines and more efficient refrigeration units on trucks may
be important but they make only a limited contribution to the
reduction of CO2 emissions. The lower fuel consumption
per €100 of sales in 2015 was therefore brought about
only partially by having a more modern vehicle fleet. The
more significant factors were increased sales and reduced
distance travelled, the latter resulting from, among other
things, setting up the CBL depot, the increased density of
the distribution network and making better utilisation of the
transport volume. Greater use was also made of chartered
transport so that journeys were only from A to B and not
from A to B and back again to A. There is still considerable
scope for improvement in our delivery service operations, by
making larger drops and having fewer stops. This will make
a huge contribution to fuel savings and reductions in CO2
emissions. However, ‘it takes two to tango’ and so we want
to engage with some of our customers to discuss launching
a specific project aimed at reducing the number of deliveries.
This will benefit the environment as well as help to cut costs.
FUELConsumption in litres per €100 sales
2010 2011 2012 2013 2014 2015
0.350
0.345
0.340
0.335
0.330
0.325
0.320
0.315
Sustainable distribution in urban areasIn an urban environment, a throbbing engine powering a
refrigeration unit is polluting and is not pleasant for business
owners, people living in the vicinity or passers-by. Sligro and
Ploeger Logistics are the first in the Netherlands to use hybrid
refrigeration units. The differences between a conventional
truck refrigeration unit and the TRS TWIN-COOL unit used
are enormous. Conventional refrigeration units are driven by
a separate diesel engine whereas this hybrid unit is powered
from the truck’s own, fuel-efficient Euro 6 engine. Even when
the truck is stopped, to unload for example, the refrigeration
unit continues to operate on its integrated battery pack.
This combination results in reduced noise nuisance and
emissions that are a whopping 60 times less than those of

66 | Sligro Food Group 2015
a conventional refrigeration unit! The hybrid refrigeration unit
is being used for delivering to bars, restaurants and hotels in
downtown ’s-Hertogenbosch.
QR-code: Hybrid refrigeration unit used in
downtown ’s-Hertogenbosch.
In Veere and Zoutelande, a different system is being tried.
When our trucks stop, they are connected to mains power
points provided by the municipal authority. Continued
refrigeration of the truck interior is assured and there are
zero emissions. Our transport partner 2W Logistiek, based
in Kapelle, bought special new refrigeration units for this
system that can also be electrically driven.
Packaging and waste Definition and delineationAll waste streams within Sligro Food Group categorised as
either cardboard, spoiled food, C3 waste, vegetable kitchen
and food waste, glass, mixed waste paper and cardboard,
film and waist deep-fryer oil.
ImportanceWaste segregation and recycling is better for the
environment: waste that does not have to go to incineration
can in many cases be recycled as raw materials. This
has benefits for CO2 emissions. The second important
point concerns the scarcity of raw materials. As the world
population grows, demand for finite natural resources
increases. That is why separating waste and recycling is so
important. It enables waste to be turned into valuable raw
materials. Sending residual waste to landfill or incineration
does not do businesses, the environment or society any
favours in the long term.
ApproachBy reducing waste and separating waste streams for
recycling we can minimise the environmental impact of our
waste. The waste streams we nevertheless generate we
endeavour to give a second life as far as possible by using
them as raw material for something else or converting them
into green energy. In that sense, waste is not a valueless
residual product but rather a resource or product at the start
of a new cycle. Waste can thus have a second life and be
used for new raw materials or to generate green energy.
The CO2 emissions from our waste stream are entirely
dependent on the way in which our waste is processed
by third parties. We can control the volume of waste and
oversee proper waste separation. Beyond that, waste
processors determine what the CO2 emissions from our
waste will be, depending on what route they choose for
processing it. For that reason, we publish the CO2 reduction
we achieve by offering our separated waste for processing
instead of the figures for un-separated and residual waste.
– The entire stream of waste paper and cardboard,
Styrofoam/EPS, glass and film for recycling is returned to
the processing industry.
– All products beyond their sell-by date, from both
wholesale and retail channels, go for anaerobic digestion.
– Outdated and waste food from our production kitchens
also goes for anaerobic digestion.
– All fats and oils are collected for the biodiesel industry.
– All meat, fish, poultry and game waste and products
beyond use-by date/BBD are always collected as
Category 3 ABP waste so it can be used for the animal
feeds industry.
EvaluationThe reduction in CO2 emissions is calculated on the basis
of the 2014 conversion factors for each waste stream as
used by Van Gansewinkel. The CO2 factors used have been
calculated under the responsibility of the TNO Research
Institute, in accordance with ISO 14040/14044 procedures
and guidelines. This approach is supported by the LCA (Life
Cycle Assessment) platform of the European Commission
and other organisations.
The stated CO2 reduction is the reduction for the entire
chain. This is because some materials can be reused after
waste separation, which means a significant reduction in CO2
emissions when they are made into new products. This is
because recovering such secondary raw materials uses less
energy than incinerating them and extracting and processing
primary raw materials. This CO2 saving in the chain is not part
of our 2020 target for our 'in house’ CO2 emissions (transport
plus gas and electricity consumption).
Our CO2 reduction in the chain due to waste separation
(in tonnes):
2015 2014 2013 2012 2011 20105,288 5,214 3,668 3,700 3,395 3,133

67
OUR PRODUCT RANGEOur product range and where we source our products lie
at the heart of our business. It is our responsibility to assist
and motivate our customers to make sustainable and healthy
choices. We accordingly believe it is important for us to
be able to offer our customers quality products produced
with due regard for people, the environment and healthy
eating. The standards we set ourselves are contained in our
Suppliers Handbook. This covers such things as product
and food safety, BSCI certification, product traceability,
packaging, the quality management system, incident
management & recalls, audits and our ethical choice label
eerlijk & heerlijk (honest & delicious). With our unique eerlijk
& heerlijk concept we have been putting our sustainably
sourced product range firmly on the map since 2010.
GoalWe aim to be achieving at least 10% of sales with our
sustainable product range by 2020.
SustainableDefinition and delineationWe believe in tasty, good and honest food that has been
prepared with respect for nature, animals and people.
We see it as our responsibility to help customers to make
informed choices of their own. We do this by offering them a
no-nonsense range of products with our eerlijk & heerlijk label
and, by our participation in the Business Social Compliance
Initiative (BSCI), we guarantee the improvement of working
conditions in the countries of origin of our products.
Eerlijk & heerlijk In order to enable customers to see the wood for the trees in
the forest of labels that is out there, when we launched eerlijk
& heerlijk in 2010, we identified four pillars that would form
the basis of our sustainable product range:
– Organic
– Sustainable
– Fair trade
– Local
For each of these pillars, there is a whole palette of carefully
selected quality labels providing assurances that the product
concerned genuinely makes a sustainable contribution to
the aspect described by that particular pillar. Since 2014,
the Eerlijk & range has been extended to include sustainably
produced non-food items, too. In the appendix at the end of
this report there is a list of the certification marks qualifying
for inclusion in the eerlijk & heerlijk range.
ImportanceIn 2015, the rapid pace at which the Dutch foodservice and
food retail industry is evolving was maintained. In this world of
continual change we are seeing a steadily increasing demand
for sustainable products on the part of our customers.
Inherent in our vision is for Sligro Food Group to strive to be a
quality company achieving steady, controlled growth in all its
activities and for all its stakeholders. As a family business we
are determined to pursue this vision in a responsible manner.
On a global level, the world faces huge social and ecological
problems, including climate change, the loss of biodiversity,
poor working conditions and animal welfare. In this context,
the food industry is still regularly seen as part of the problem
instead of part of the solution. As a major player in the Dutch
food industry with a highly complex network of around 1,750
suppliers, we are aware that our activity has an impact on the
natural world, domestic animals and people. We therefore
recognise that we have a duty to minimise any adverse effects
and we see this as an opportunity to help our customers to
make informed choices in favour of sustainable products.
ApproachCustomersFor us, the customer comes first. We ask our customers
what they think of our cash-and-carry outlets and
supermarkets, the product range and the standard of service
we provide. We specifically ask about what customers want
in terms of sustainability. We receive relevant feedback
from independent market research bureaus and consumer
panels, as well as from direct customer contacts and online.
Customer satisfaction for us is a measure of the extent to
which customers perceive Sligro as treating its customers
well and responding to their needs.
EmployeesHaving a committed workforce is the key to the success of
eerlijk & heerlijk . Internal communication in the context of
staff and management meetings and by giving presentations
on the shop floor provides for the sharing of knowledge
regarding eerlijk & heerlijk and engenders support among
staff.
SuppliersWe depend on our suppliers to supply top-quality products
satisfying our customer’s requirements (including
sustainability). We engage with suppliers, producers and
farmers on matters such as food safety and sustainable
packaging.

68 | Sligro Food Group 2015
NGOsThe complex sustainability issues we encounter cannot
be solved by us alone and demand a more holistic, often
industry-wide approach. We accordingly engage in a dialogue
with NGOs by taking part in NGO meetings or in one-to-one
discussions.
EvaluationIn recent years, an analysis has been conducted of the
product range carried by Foodservice’s Food and Fresh
Produce Department. This has included such things as the
number of eerlijk & heerlijk alternatives available in each
product group and for each pillar of the ethical choice label.
The analysis has also covered the sustainable product ranges
of our competitors.
In order to be able to offer customers a wide range of
sustainably produced products, a quantified focus on
growing the range has been adopted in recent years. Over
the period 2010–2014 we have easily achieved our target of
a 10% expansion of the range year-on-year.
The sharp increase in 2014 leading to 5,350 products under
the eerlijk & heerlijk banner automatically meant an ambitious
target of at least 5,885 separate products in 2015. We have
in fact grown the range by 7.7% so that we did not quite
achieve this target. The range nevertheless now includes
5,795 products, marking yet another step towards an even
more sustainable product range. Relative to the first year
in 2010, growth in the number of sustainable products has
been a huge 479%.
The setting of quantified targets for the number of eerlijk &
heerlijk products ended in 2015. Looking at the way things
have developed we have made extrapolations going forward
to 2020. Now that we have an adequate basis in terms of
number of products, we are able to set targets in terms of
sales value. Our new target is to be achieving 10% of sales
from the eerlijk & heerlijk range by 2020.
Eerlijk & heerlijk salesSales of eerlijk & heerlijk products developed excellently in
2015, coming in at €209 million, which equates to 7.8% of
sales by value.
NatuurvleesEMTÉ began life as a butcher and we project a profile
and position ourselves as ‘the tastiest supermarket in
the Netherlands’, focusing on the quality and taste of
fresh produce. In this we have been successful, having
now been voted six times as having the ‘best butchery
department in the Netherlands’! Even for customers who
put animal welfare first we have plenty of choice. The very
best quality meat is sold under the Natuurvlees label and
comes from Dutch beef cattle that have enjoyed a very
high degree of animal welfare, grazing in Dutch nature
reserves. More information on Natuurvlees can be found on
www. natuurvlees-nederland.nl.
We launched a pilot scheme with Natuurvlees in 20 EMTÉ
stores at the end of 2014 and, in early 2015, Natuurvlees
EERLIJK & HEERLIJKNo. of products
6,000
5,000
4,000
3,000
2,000
1t000
0
2010 20122011 2013 2014 2015
Actual Target
69
beef was included in the product range at all EMTÉ
supermarkets. The label is now showing impressive growth,
in both number of products and share of sales. Natuurvlees
is something new and is leading the field in terms of animal
welfare. The Dutch Society for the Protection of Animals
does not yet have any set scheme for the certification of beef
cattle grazing in nature reserves. As far as animal welfare is
concerned, however, Natuurvlees is in our view the best
Dutch beef that there is. The Natuurvlees cooperative is
currently engaged in drawing up a scheme for animals put
out to graze in nature reserves in conjunction with the Dutch
Society for the Protection of Animals. As soon as we can
we shall be adding the appropriate number of stars to the
packaging (hopefully 3 stars).
A new existence for Dutch cock chickensEvery year, some 45 million male chicks are either gassed
or macerated straight after hatching. Poultry farmer Ruud
Zanders from Meijel in Limburg is bringing these ‘unwanted
little brothers’ of laying hens back into the shed and putting
them back on the menu. We think this is a fine initiative and
capons produced in this way have been on sale at many
EMTÉ supermarkets and Sligro outlets since mid-November.
In the shed where they are kept, the birds have plenty to do.
There is ample litter on the floor so that they can scratch in
search of grains to eat and take a dust bath. Perches are also
provided for the birds to rest on and roost at night and there
are also bales of straw or lupins. The birds are not debeaked
and no antibiotics are used. The breed is slow-growing and
the birds are fattened to at least the same age as organic
chickens.
The food for these chicks is important for their health. It
contains plenty of fresh maize, wheat and other grains. The
wheat used in the feed comes exclusively from Limburg,
minimising the food-miles involved. The other ingredients in the
feed come from elsewhere in Europe. Soybeans are not used.
BSCIWe believe it is important to know where our products
come from so that we can be sure that what we are selling
has been produced in a safe manner without giving rise to
harmful working conditions. As a major player in the Dutch
food industry with around 1,750 suppliers and producers
in the chain, both nationally and internationally, this is a
complex task. Sligro Food Group has been a member of the
Business Social Compliance Initiative (BSCI), an initiative of
the Foreign Trade Association (FTA), since 2010. The BSCI
is a business-driven platform which encourages members
and their supply chain partners to make concerted efforts to
improve working conditions.
Each of Sligro Food Group’s suppliers, of both food and
non-food products, has committed itself to adhere to BSCI
standards. These standards have been made an explicit
part of our suppliers’ handbook and our terms of business
for procurement. Audits of suppliers are also carried out
in high-risk countries to ensure that acceptable working
conditions are maintained.
In 2015, the BSCI introduced a revised approach: BSCI 2.0.
which covers the entire supply chain and is based on two
principles, namely due diligence (to flag up risks at an early
stage and take preventive action) and the ‘cascading effect’
(to create support among supply chain partners extending
from top to bottom of the chain).
The new approach and code of conduct requires a new
commitment on the part of our suppliers. With effect from
the beginning of 2016, we are asking all our suppliers to
commit themselves to accepting the BSCI 2.0 guidelines.
The progress made by suppliers is being measured on the
basis of audits, audit reports and improvement plans. There
will be working condition audits of suppliers in high-risk
countries. For suppliers scoring well in these audits (A–C,
where A = Outstanding, B = Good and C = Acceptable), the
audit will be valid for two years. In the case of a poor score
(D = Insufficient and E = Unacceptable) we will be asking the
supplier to come up with an improvement plan based on the
audit report within 60 days. A follow-up audit will be carried
out within 12 months.
HealthDefinition and delineationUnfortunately there is no unequivocal and comprehensive
definition of ‘health’. There are various things which together
make for good health but sometimes they also conflict with
each other.
We do not see it as our duty to add a new interpretation or
dimension with regard to health but focus instead on the
food-related aspects of health and helping our customers to
make healthy choices. On the other hand, we do have a duty,
along with others, to display clear information on product
properties and to offer real choice.
The various principles of healthy eating are generally under-
pinned by World Health Organisation (WHO) guidelines.
These guidelines have a scientific basis and are free of
interpretations. The WHO guidelines serve as a guide for
compiling the product range for each customer segment.

70 | Sligro Food Group 2015
WHO guidelines• Energy intake versus energy consumption
• Limit fat intake:
o Less saturated fat, more unsaturated fat
o Less trans fats
• Limit intake of free sugars
• Limit salt intake
ImportanceIt is our responsibility to assist and motivate our customers
to make sustainable and healthy choices.
ApproachTo define our position on the subject of health we have made
five promises:
1 Persuade customers to vary their diets
2 Give customers choice
3 Persuade customers to go for fresh, unprocessed and
seasonal products more often
4 Encourage customers to choose in favour of the following
product groups1):
a. Fruit and vegetables
b. Nuts and seeds
c. Wholegrain cereals and pulses
d. Fish
e. Water
5 Our vision will influence suppliers to adapt their product mix.
1) WHO and Health Council of the Netherlands recommendations.
EvaluationOur evaluation has not yet been completed.
Break Point; the healthy school canteenWe are supporting our customers with a scheme to
encourage the sale of healthy products in schools. Using the
tagline ‘Breakpoint, de gezonde schoolkantine’ ('Breakpoint;
the healthy school canteen' ) we are helping schools and
caterers to reverse the trend towards unhealthy lifestyles
among young people and encouraging a healthy lifestyle
instead. There are currently 52 school canteens in the
Breakpoint initiative.
Sligro and KNVB working on healthy school canteensUnder the slogan 'Lekker Bezig' (‘Keeping Active’), an
ongoing programme has been developed specifically for
football associations and sportspeople. In conjunction with
Sligro and the Royal Dutch Football Association (KNVB),
associations are making an effort to do their bit to promote
a healthy lifestyle for all footballers in the Netherlands.
A healthy sporting environment should obviously also have a
canteen offering healthy food, where those actively engaged
in sports and visitors alike can choose from healthy snacks,
fruit juices and sandwiches made with brown bread. Lekker
Bezig provides inspiration and information throughout the
season on various product groups and themes. At the start
of the 2015–2016 football season for instance, various
'Lekker Bezig Inspirational Markets’ were held, with practical
workshops and advice from experts. More information is
available on www.samenlekkerbezig.nl
Food Consumption Sustainability Green DealConsumers are increasingly making informed choices with
regard to healthy eating – choices which consider people,
animals and the environment. A similar trend is visible in
gastronomic circles. Leading chefs are busy producing tasty
dishes that are suited to a healthy lifestyle, creatively and
innovatively conceived, using sustainable ingredients. Fifteen
food-chain players, including Sligro Food Group, have joined
forces In Food Consumption Sustainability Green Deal. The
partnership aims to remove barriers in order to accelerate the
introduction of sustainability in food consumption.
Food wastage Definition and delineationEvery year, a great deal of food is thrown away by the
supermarkets because it can no longer be sold. This can be
because of breakage (broken packaging), products that are no
longer up to our quality standards (e.g. fruit and vegetables
that do not look attractive) and products that are out of date
(best before/use by dates).
All items entering the waste stream as unsold are recorded
before they are collected. A comprehensive audit is made of
each store once a year (more frequently in exceptional cases)
to ensure that the stores are recording all wastage . This
audit covers more than only the unsold goods connected
with breakage and shelf life incidentally.
71
ImportanceApart from the associated costs, it is socially irresponsible
to waste food. The item of ‘spoilage’, under which unsalable
products which have to be written off are accounted for,
is accordingly one of the more important KPIs used for
management purposes.
ApproachOur aim is to have a totally closed supply chain, giving us
complete control of the delivery and sales of our products.
An important tool in this regard is our automated stock
replenishment system, which calculates the timings and
volumes of restocking orders, based on such things as rate
of sales, existing stock levels and shelf life of the products.
Product range management is also matched as closely as
possible to the sales potential of the individual outlets. This
involves dividing the product range into specific modules so
that the stores with the highest sales volumes get allocated
the most extensive product range. Stores with lower sales
volumes in a certain category therefore have fewer products
available, the aim being to optimise stock rotation for each
product and thus reduce spoilage (wastage).
Finally, awareness of wastage is an important management
concern and, to increase the focus on this aspect, spoilage
has been included as a KPI in the incentive performance
bonus scheme for supermarket managers.
EvaluationThe recorded spoilage is reported on a weekly basis. A
monthly report is also received from all supermarkets which
have had a full spoilage audit. Spoilage targets are tightened
up each year. The reporting system allows us to monitor
progress towards the achievement of the target.
If it looks as if targets are not going to be met, action is taken
at category level, varying from changes to product modules
(allocation of stores to product modules or products included
in modules), reducing the display space, discontinuing slow-
selling lines, tightening up store processes and procedures
and shortening the supply chain to changing the packaging
(to increase shelf life).
Processing of bread returnsOur EMTÉ supermarkets sell freshly baked bread every day.
In the Netherlands, fresh bread has a sell-by date of the day
when it is baked. Despite the order systems that we have,
it is difficult to get the expected sales volume right every
time. The weather, seasonal sales and so on all effect buying
patterns. There is generally bread remaining at the end of the
day, sometimes a lot , sometimes a little.
The loaves and buns that are left over are collected for return
by the supplier the next morning. This bread is ground up and
pressed into small pellets for use as animal feed, given to
EMTÉ’s ‘Better Life’ pigs, for example. The processors of this
waste stream have GMP+ certification. This is a requirement
for the waste to be used as animal feed.
Recalls in 2015There were 118 product recalls in 2015, analysed as follows:
49 concerning exclusive brands (own brand,
house brand, private label);
50 concerning 'A' brands
19 concerning Superunie brands.
Ik kies bewustThe ‘Ik Kies Bewust’ (IKB) (literally: ‘I Make Informed Choices’)
approval label is widely accepted across the sector to indicate
healthier products.
Our growth in the number of different IKB products is as
follows:
2015 2014 2013 20121,291 1) 1,103 885 813
1) 1,138 A-brands and 153 own brands.
Following the introduction of more stringent IKB criteria we
are expecting a drop in the number of IKB products in the
year ahead. The food industry has until 31 December 2016
to change products in order to continue qualifying or remove
the distinctive ‘Tick’ mark from the packaging. Products
which have their contents changed will be reassessed
against the new criteria.
Dendi optatur sunt quis ut apit molupta tiumqui id qui derovid maio molorent, molupic ipsapit omnia que.quat apel expliquam quae volupit landisquiate velestiae.
OVERZICHT2015 SligroFood Group

73
RISKAnd risk management
In note 25 to the financial statements on page 137,
consideration is given to a number of specific risks to which
the Group is exposed. Information is provided on, for example,
the Group's credit, liquidity and market risks, together with a
sensitivity analysis of these factors. It should be noted that
we do not consider these risks to be exceptional in terms
of either their nature or magnitude. In the notes we also
discuss the effect that the economy and competition have on
the Group's activities. Where relevant, the Group is insured
against a number of the customary risks so that the financial
consequences of calamities are covered as far as possible.
The process of identifying the risks affecting our operations
was put on a more professional footing in 2015. In a structured
process, the more significant risks with a potential impact on
the achievement of our objectives are assessed at Executive
Board level. We consider the following to be the most critical
risks in our activities:
AcquisitionsDespite all precautions and due diligence, acquisitions usually
involve greater risk than organic growth, as is borne out by the
numerous mergers and acquisitions in the market that do not
live up to expectations. Considerable value can be destroyed
by cultural differences and by employees pursuing different
agendas, but also by ICT integration exercises for example.
We see acquisitions as an essential part of our strategy, not
least for growth. We mitigate the risks inherent in acquisitions
as far as possible by always following a careful takeover
process, including preliminary exploration, and devoting
careful attention to the post-acquisition phase. Many risks
along with their financial and other impacts can be reduced
in this way.
Every acquisition is different but we always apply the
same high standards to the takeover process. The aim of
that process is to identify the risks and opportunities at an
early stage. A due diligence investigation, in which we are
supported by outside consultants, always forms part of the
preliminary exploration in order to avoid the risk of unpleasant
surprises later on. We will therefore then only proceed with
acquisitions if we can fulfil the duty of care that we have set
ourselves.
Rather than bringing in people from outside, Sligro Food Group
has a policy of immediately setting up a multidisciplinary
integration team comprising people from its own ranks and
from the business that has been taken over. In this part of
the process, consideration is given to all stakeholders. A key
element of the integration is to inculcate into the acquired
business the cultural values of Sligro Food Group. Basically,
we transfer the back-office of the company we have taken
over to the central organisation and back-office systems of
the Group as far as possible.
ICT systems and data quality Effective ICT systems combined with quality data are the
lifeblood of our business. Managing the risks in these systems
involves far more than simply safeguarding the continuity of
data processing. It also means protecting the integrity of data
and software and the associated decision-making process.
The numbers of customers, products, sites and suppliers and
the way in which they interrelate make this a complex system
but it is systems of this kind which at the same time give us
a clear competitive edge.
Systems failing to work or not operating well can threaten
the continuity of the whole business within a relatively
short period of time. We therefore take extensive measures
to minimise the risk of such failures. Data and data quality
are of major importance for smooth operations and for the
information we exchange with our customers and suppliers.

74 | Sligro Food Group 2015
On top of that, there are strict legal requirements relating to
data and data privacy, so that data protection also receives a
great deal of attention.
We invest considerable time and money every year in the
further optimisation and security of the central, integrated
ICT back-office, with the focus on continuity, stability and
the ability flexibly to upscale operations. This applies to
both standard applications that we use and customised
applications developed in-house. Ongoing themes in this
context are security from outside in and security from inside
out in a world which is becoming increasingly digitalised. That
provides our systems and data with reasonable protection
against the many forms of cybercrime which manifest
themselves. In the year under review we were working on a
comprehensive security and authorisation programme which
will continue to demand considerable effort in the year ahead
as well.
In emergencies, either of our data centres can take over all
the activities needed to guarantee continuity. We also test
such scenarios on a regular basis by actually shutting down
one of the data centres. We have a national firewall structure,
providing a high standard of protection against external attack.
We are working on the future enterprise architecture, which
will combine ICT, data and business architecture and further
refine the continuity of data processing and data security.
AuthoritiesPublic authorities on occasion take drastic action, which can
have a major impact on operations and results. Such actions
can become a threat to a particular part of the business over
a relatively short time horizon. Environmental measures and
opportunistic spending cuts in particular can have a serious
effect. Intervention by regulators can also have a serious
impact on operating processes.
We have limited control over such developments and,
although we try and obtain a picture of what new legislation
and that in the pipeline will mean at an early stage, we
generally have little option but to accept the implications.
Political decisions are sometimes scarcely predictable, too.
The latest healthcare system changes are going to have
a long-term effect on the care market which Foodservice
supplies, changing what was a sector that was relatively
unaffected by economic woes into a shrinking market.
Customers, partners and suppliersAlthough the economy is recovering, it is evident that
consumers and businesses have not yet got over the financial
knocks of recent years. With access to credit still tight for
many businesses, both customers and suppliers are still
facing continuity risks.
These risks are inherent in our business activities. The
preventative and repressive measures we take are aimed at
avoiding the risks or at least identifying them early in order to
minimise possible financial losses or other harm.
The risk of bad debts among our customers is increased
to some extent by the threat of businesses going under.
The considerable diversity within our customer portfolio,
however, means that the risk remains manageable. Moreover,
we watch the payment performance of our customers very
closely in order to be in a position to address any departures
from agreed terms of business at an early stage.
The combination of the state of the economy and the
growing interdependence between us and business partners
(including Fresh Partners) and suppliers are giving rise to
increased continuity risks in this context, too. Incidentally, as
from this year, along with our purchase combine Superunie,
we are offering the possibility of optimising terms of business
between supplier and customer by means of a Supply Chain
Finance programme.
Food safetySince the Group is primarily engaged in the food supply and
processing chain, food safety is crucial. The food safety
precautions we take are mainly aimed at preventing risks
for our customers and our employees. We accordingly
observe strict food safety practices as regards both food
processing and the products themselves throughout the
various links in the organisation. With a well-equipped quality
assurance department we are rigorous in our quality checks.
Our procurement department also insists on the same
high quality standards and quality assurance procedures
among our suppliers and we monitor compliance with these
standards both directly and indirectly, through specialist
institutions. Additionally, our staff training programme
devotes considerable attention to food safety and proper
handling of food.

75
Ageing workforce The average age of our workforce is increasing and the
retirement age for our staff is being steadily raised. This
situation makes the ageing of our workforce an increasingly
important consideration for us, especially against the
background of the demanding physical work that goes on in
large parts of our organisation.
We already invest in the fitness and health of our staff and
in making the people who work for us more aware of the
risks, but more targeted action will be needed to address
all the implications of this ageing trend. In the years ahead,
therefore, we shall be intensifying our efforts in this area by
providing lots of programmes aimed at keeping the physical
fitness and mental capacities of our staff in good shape so
that we can carry on responsibly employing people who are
capable of doing their jobs and pulling their weight for longer.
Risk management and control systemsWe are convinced that risk management has to be part of
the mindset and working methods of all the staff in our
company on a day-to-day basis, not compulsorily but because
it automatically seems to be the right approach. Actually
being in control is therefore what matters to us and being in
control on paper is not what it is all about. There are plenty of
examples of companies where all the right measures were in
place but which still lost control in practice.
In a growing organisation like ours, however, we recognise the
need for a more formalised approach but that makes it even
more important that we maintain the right balance between
formalised systems and the informal entrepreneurial spirit
that exists within the company.
After all, we want our people to continue thinking for
themselves and not blindly following checklists and
procedures; we want them to continue to see both risks
and opportunities. Fortunately, that is an inherent part of our
corporate culture and it is that culture that we accordingly
view as our most important ‘soft control’, protecting us from
within from numerous risks and forms of fraud. In a steadily
expanding organisation with ambitions of international growth
as well we accordingly devote a great deal of attention to
preserving the culture of our organisation.
We began a programme of further formalisation of the risk
identification and risk management process in 2015. On the
one hand we are organising risk management increasingly
at strategic level, with subsequent translation of the
strategic requirements to processes, people and systems
at operational level. On the other hand, we are documenting
the existing, operational, risk management measures along
structured lines, coupling them to the strategic risks and
enhancing the controls where useful. During the year, with
the assistance of external specialists, a workshop was held
at Executive Board level in which we identified the main
risks we face and our specific risk appetite, with an eye to
our strategic goals. The outcomes of this exercise have been
discussed in the Audit Committee and by the Supervisory
Board and form the starting point for a reappraisal of our
existing control measures. In the years ahead, we shall be
making this process a permanent part of the regular planning
cycle.
There has been substantial progress in recent years on
documenting business processes in connection with efforts
to improve them as part of the project named Regie op
Processen ('Direction of Processes’). We are making similar
progress with the documentation by the administrative
organisation of essentially financial processes in the Finance
Department, and also at the three main branches of the
business, Food Retail, Foodservice Cash-and-Carry and
Foodservice Delivery.
In 2015 we further formalised the process and designed the
structure of an internal control framework suitable for our
purposes, the details of which have already been completed
for some of our activities. In the years ahead we shall be
completing the picture for all activities, clearly establishing
the relationship to the identified risks in each case.
RISKMANAGEMENTWE ARE CONVINCED THAT RISK MANAGEMENT HAS TO BE
PART OF THE MINDSET AND WORKING METHODS OF ALL
THE STAFF IN OUR COMPANY ON A DAY-TO-DAY BASIS, NOT
COMPULSORILY BUT BECAUSE IT AUTOMATICALLY SEEMS
TO BE THE RIGHT APPROACH. ACTUALLY BEING IN CONTROL
IS THEREFORE WHAT MATTERS TO US AND BEING IN
CONTROL ON PAPER IS NOT WHAT IT IS ALL ABOUT.
76 | Sligro Food Group 2015
We have a special department focusing solely on our
administrative organisation and internal control, alongside the
departments that remain responsible for these processes. 'To
measure is to know' is a key principle of risk management.
If you know what is happening, you can adjust your policies
accordingly. Our central data warehouse, where practically
all our operating and financial data are recorded, is of great
benefit to us in this respect. Using advanced analysis tools,
this department detects exceptional patterns or numbers/
trends. All our business units have been integrated into the
Group's central information and control system.
As the Group operates at many different sites, we make
intensive use of internal benchmarking. In this way our
management information supports our internal controls and
vice versa. Overall controls identify possible gaps in internal
controls associated with the informal and entrepreneurial
nature of the business culture that has contributed over the
years to the Group’s commercial success.
We also took additional steps in 2015 connected with fraud
risk management, bringing together the existing separate
areas of attention of physical fraud (theft), cybercrime and
misuse of personal information. A working group is looking
at fraud on a broad front and addressing the management
of fraud risks in a manner appropriate to our business. Also
covered are changes in the law regarding data protection and
data leaks.
We have in place a long-term general back-office plan,
deliberately integrating the business and the back-office
agendas in an effort to ensure that business plans are
practicable in terms of processes, systems and staffing and
that proper consideration is given to the related necessary
controls. This plan is updated quarterly and discussed with the
management team. This approach results in fewer weak links,
better internal coordination and, ultimately, more efficient and
effective processes with reduced risks. An ongoing challenge
for us is to continue investing in the organisation and systems
in addition to making bold choices in order to accommodate
the ever-growing pace of change. The ability to respond
appropriately to change is partly determined by having an
accurate understanding of the business processes, data and
applications. We are therefore working on a future enterprise
architecture embodying ICT, data and business architecture
combined in order to enhance our capacity to adapt.
As a result of the centralised approach and very close
management and monitoring of business activities by the
Executive Board and central staff departments, Sligro Food
Group is rarely faced with accounting 'surprises' relating to its
activities that use the central information systems. Regular
reporting has been shown to provide reliable information on
business performance. There is no need for any significant
changes. We regard improving the reliability of our
management information and, more importantly, ensuring
that it becomes increasingly specific and targeted, as an
ongoing process.
Since 2015, a clear distinction has been made within the
Finance Department between financial control and business
control. It has been found that our organisation requires
greater business control backup to provide financial and
other support for business decisions. As well as our own
internal checks, the external auditors also examine parts of
the accounting and internal control organisation in connection
with their audit of the financial statements.
The Audit Committee, too, looks at both the figures and the
administrative organisation and there is moreover closer
contact with the external auditors. The findings contained in
the management letter are discussed by the auditors with the
Audit Committee and with the Supervisory Board (without
the Executive Board present).
Based on the above summary, we believe that our internal
risk management and control systems provide a reasonable
degree of certainty that the financial statements do not
contain any material misstatements and that these systems
functioned properly during the year under review. We also
refer to the directors' statement of responsibilities on page
93. We have no indications to suggest that these systems
will not function properly during the current financial year.

77

78 | Sligro Food Group 2015
GIVING EQUAL WEIGHT TO ALL THE GROUP’S
STAKEHOLDERS, AS REQUIRED BY THE LAWS OF THE
NETHERLANDS AND BY THE DUTCH CORPORATE
GOVERNANCE CODE, HAS ALWAYS FORMED AN IMPORTANT
BASIS FOR OUR CORPORATE POLICY. SLIGRO FOOD GROUP
EMBRACES THE ONE SHARE/ONE VOTE PRINCIPLE AND
DOES NOT HAVE ANY ANTI-TAKEOVER MECHANISMS OR
CHANGE OF CONTROL PROTECTIONS IN PLACE.
Although we subscribe to the Corporate Governance Code
and the other rules relating to business, we note that the
playing field on which we are competing is sometimes
anything but level when compared with some family
businesses or private-equity-owned companies. The problem
is not primarily one of a lack of regulation, but rather one of
compliance with existing regulations and the absence of
effective sanctions in the event of non-compliance. This puts
us at a competitive disadvantage, particularly when it comes
to potential acquisitions.
There were no transactions with executive or supervisory
directors in 2015 that involved a possible material conflict of
interest, nor was any transaction conducted with shareholders
owning more than 10% of the shares.
Main points of corporate governance structureSligro Food Group is a dual-board company, with an Executive
Board and an independent Supervisory Board ('two-tier
management structure'). The main points of the current
structure are set out below.
Executive BoardThe Executive Board is responsible for managing the
company, for its strategy and for its use of human and other
resources. The Executive Board keeps the Supervisory
Board informed of progress, consults the Supervisory Board
on all significant matters and submits important decisions
to the Supervisory Board and/or the general meeting of
shareholders for approval.
The Supervisory Board notifies the general meeting of
proposed appointments to the Executive Board.
The Supervisory Board appoints the Executive Board and
may suspend or dismiss an Executive Board member at any
time. The remuneration and other terms and conditions of
appointment of each Executive Board member are set by
the Supervisory Board, based on the policy adopted by the
general meeting. Decisions on material matters are always
made jointly, and all members have shared responsibility.
CORPORATEGovernance

79
Supervisory BoardThe Supervisory Board supervises the policy of the Executive
Board and the general affairs of the company. It supports the
Executive Board with advice. In the performance of their
duties, the Supervisory Board members are guided by the
company's interests.
The Executive Board provides the Supervisory Board prompt-
ly with the information it needs to perform its duties.
The members of the Supervisory Board are appointed by the
general meeting of shareholders, their candidature having
been proposed by the Supervisory Board. Supervisory Board
members retire at the latest at the close of the first general
meeting following the day marking the fourth anniversary of
their most recent appointment and may be reappointed once.
The remuneration of each member of the Supervisory Board
is set by the general meeting. The Supervisory Board appoints
a chairman and a deputy chairman from its members. It also
appoints a secretary who may, but need not, be one of its
members.
The Supervisory Board has appointed an Audit Committee,
made up of two Supervisory Board members. Audit Commit-
tee meetings are also attended by the CFO, the Accounting &
Reporting Manager and the external auditors.
The Supervisory Board has appointed a Remuneration and
Appointments Committee, made up of two Supervisory
Board members.
General Meeting of ShareholdersThe annual general meeting is held within four months of the
end of each financial year. Extraordinary general meetings
may be called as necessary by the Supervisory Board, the
Executive Board or one or more shareholders jointly repre-
senting at least 10% of the issued share capital.
The agenda of the annual general meeting covers the items
stipulated by the Articles of Association and other resolutions
proposed by the Supervisory Board, the Executive Board or
shareholders jointly representing at least 1% of the issued
share capital.
The principal powers of the general meeting are the rights to:
– Appoint supervisory directors and determine their
remuneration;
– Adopt the financial statements and ratify the actions of
the Executive Board in respect of its management and
the Supervisory Board in respect of its supervision during
the previous year;
– Resolve to amend the company's Articles of Association
or wind up the company;
– Issue shares and restrict or exclude shareholders'
pre-emptive rights (with the approval of the Supervisory
Board, the Executive Board has been granted powers
until 18 September 2016 to issue shares as yet unissued);
– Repurchase and cancel shares (the Executive Board
has been granted powers until 18 September 2016 to
purchase fully paid shares either on the stock exchange
or privately up to a maximum of 10% of the issued share
capital, as stipulated in the Articles of Association, for a
price no more than 10% above the market price at the
time of the transaction);
– Approve decisions by the Executive Board on any
substantial change to the identity or character of the
company or the business.
Departures from the corporate governance codeThe departures from the Dutch Corporate Governance Code
were approved by the shareholders' meeting on 30 March
2005. Sligro Food Group consequently complies fully with
the Code. Details of departures that are still relevant can be
found on the website and relate to the following:
– The appointment of members of the Executive Board for
unspecified periods rather than for periods of four years.
The main reason for this departure is our aim to appoint
people to executive positions from within the Group and
to remunerate managers who are on the same level in
the same manner.
– No agreements have been reached on the level of any
severance pay. Legislation limiting severance pay to a
maximum of one year's salary came into force on 1 July
2015.
– Sligro Food Group maintains contacts with investors by
means of one-on-one meetings and group presentations.
These one-on-one meetings are an important way for
Sligro Food Group to attract and retain the attention of
institutional investors and thus help to ensure its shares
are priced correctly.

80 | Sligro Food Group 2015

81
Goals – Maintain the Group’s average net capital expenditure at
about 2.5% of sales.
– Increase the number of Sligro and EMTÉ outlets by one
or two a year, excluding acquisitions.
– Invest continuously in developing our commercial formats
over a roughly 7-year cycle.
– Invest continuously in automation and efficiency gains in
order to maintain our position as a cost leader.
We have adjusted our average net capital expenditure target.
In the past, we aimed for a level of 2.0% of group sales but
we have now raised it to a long-term average of 2.5%. This
increase is associated with our investment in the outlets
in the Netherlands and Belgium in the next few years. The
investment in the conversion to the following generations
of our Sligro cash-and-carry wholesale outlets and EMTÉ
supermarkets in the coming years will partly coincide,
whereas in the past there was more of a spread across the
different business units.
In 2015, we invested €60 million in intangible assets and
property, plant and equipment including:
– €10 million in upgrading cash-and-carry outlets, including
Forepark The Hague and Enschede, to Sligro 3.0.
– €20 million in two completely new Sligro 3.0 cash-and-
carry wholesale outlets in Almere and Utrecht, including
the land for both sites and the existing building in Almere.
– €12 million in ICT software and hardware, including our
Sligro 3.0 Online programme.
The table below analyses net capital expenditure together with
the related amortisation and depreciation.
CAPITALExpenditure
(x € million)
Foodservice Food Retail Total
2015 2014 2015 2014 2015 2014Intangible assets (software) 7 5 0 0 7 5
Property, plant and equipment 45 51 6 7 51 58
Investment property 2 2
Disposals of assets held for sale (0) (3) (0) (0) (0) (3)
Net capital expenditure 52 53 8 7 60 60
Depreciation and impairments (28) (29) (10) (14) (38) (43)
Amortisation of software (5) (4) (0) (0) (5) (4)
Subtotal (33) (33) (10) (14) (43) (47)
Net movement 19 20 (2) (7) 17 13
Segmentation of net capital expenditure, amortisation and depreciation.
In 2016, we will be investing mainly in upgrading the
cash-and-carry outlets to the Sligro 3.0 format and converting
supermarkets to the new EMTÉ 3.0 format generation. In
Veghel, in addition to the completely modernised Sligro
cash-and-carry outlet, we will be investing in the inspiration lab
(ZiN) for Foodservice customers and improving and expanding
our central distribution centre.
Furthermore, in 2016 we will start construction of our first Open
Delivery Service in Antwerp, which will offer a combination of
delivery and cash-and-carry. The programme of ICT hardware
and software investment will continue and involve a similar
level of capital expenditure to previous years.

82 | Sligro Food Group 2015
RESULTSGoals – Increase sales organically by 3% a year and take
advantage of acquisition opportunities as they present
themselves.
– Ensure that the increase in net profit matches or exceeds
sales growth.
– Distribute about 50% of the year’s profit as a regular
dividend and pay a variable dividend on top of that,
reflecting the financial position.
Financial policySligro Food Group has a very high degree of back-office
integration. We believe in the strength of the Group as a whole
and in seeking to achieve group synergy. We consequently
focus primarily on overall results rather than on the results
of the underlying parts of the business. We encourage our
employees to think on a group-wide basis and strive to ensure
that we do not frustrate this by imposing complicated internal
administrative procedures.
The Group Executive Board is actively involved in setting and
implementing policies throughout the business. Our head
office houses many management and administrative functions
for the overall business activities. We have established a
method of allocating their costs and revenues, but are aware
that there will be a cost to be borne by the group results.
We do not operate a traditional budgeting cycle because
there is no delegation of authority or spending powers in
the conventional sense. Instead, we use a series of detailed
management reports that show the actual developments
and trends in our activities from various perspectives. These
reports in turn serve as the basis for any adjustments and
amendments needed in our forecasts. Most of this work is
performed by central management support departments.
Using management by results, the individual business units
have a constant incentive to get the best out of the activities
by reference to key performance indicators combined with
internal benchmarking. Indirectly, therefore, everyone is
working to optimise the overall group result. Once each year
the correlation between the KPIs and the financial results is
examined. This detailed management information provides
us with the basis for investment decisions. We attach greater
value to this information than we do to classical investment
calculations. We believe that this approach is far more suited
to our entrepreneurial business culture. As a family business
with a stock-market listing we strive to maintain a balance
between achieving results in the short term and achieving
results in the medium to longer-term future. We regard
pressure to achieve good results in the short term as useful
and challenging but do not allow it to divert our attention from
decisions where the value and benefits only become visible
at a later stage.
NET SALESSligro Food Group
2014 2015ACQUISITIONS LIKE-FOR-LIKE WEEK 53
FR: € 823
FS: € 1,749
FS: € 22 FR: € 2
FR: € 16FS: € 28
FR: € 841
FS: € 1,829
FS: € 30(x € million)
SFG FS FRNet sales + 3.8% + 4.5% + 2.3%
Like-for-like + 1.2% + 1.5% + 0.3%

83
The profit and loss account can be summarised as follows:
(x € million) As % of sales
2015 2014 2015 2014Net sales 2,670 2,572 100.0 100.0
Cost of sales (2,050) (1,976) (76.8) (76.8)
Gross margin 620 596 23.2 23.2
Other operating income 2 5 0.1 0.2
Total operating expenses excluding depreciation, amortisation and impairments (462) (453) (17.3) (17.6)
Gross operating profit (EBITDA) 160 149 6.0 5.8
Depreciation and impairments (38) (43) (1.4) (1.7)
Operating profit before amortisation (EBITA) 122 106 4.6 4.1
Amortisation of intangible assets (19) (17) (0.8) (0.6)
Operating profit (EBIT) 103 89 3.8 3.5
Net finance income and expense 2 (3) 0.1 (0.1)
Profit before tax 105 86 3.9 3.4
Income taxes (24) (17) (0.9) (0.7)
Profit for the year 81 69 3.0 2.7
In 2015, our financial year included a 53rd week which
generated €46 million of additional sales for the Group. The
Group’s net sales also increased by €22 million as a result
of acquisitions. In the first half of the year, this involved the
full-year effect of the acquisitions of Horeca Totaal Sluis and
Rooswinkel. In the second half, it involved Bouter’s sales.
Like-for-like growth for the Group (excluding the effects of
week 53 and acquisitions) was 1.2%. Foodservice growth
was 1.6% and the figure for Food Retail was 0.2%. Like-for-
like consumer sales at EMTÉ were up 0.2%. The gross
margin as a proportion of sales was unchanged from the
previous year at 23.2%.
Expenses (including depreciation and amortisation) as a
proportion of sales fell by 0.4% to 19.5%. They were affected
to some extent by week 53 but the main cause was the
Kicking Costs programme.
EBITA
2005 2015
6.0 %
5.5 %
5.0 %
4.5 %
4.0 %
3.5 %
3.0 %
2.5 %
2.0 %
1.5 %
1.0 %
0.5 %
0.0 %
130
120
110
100
90
80
70
60
50
40
30
20
10
0
EBITA
€ x million As a % of sales

84 | Sligro Food Group 2015
(x € million)
Foodservice Food Retail Total
2015 2014 2015 2014 2015 2014Net sales 1,829 1,749 841 823 2,670 2,572
Other operating income 1 4 1 1 2 5
Gross operating profit (EBITDA) 129 121 31 28 160 149
Operating profit before amortisation (EBITA) 101 93 21 13 122 106
Operating profit (EBIT) 89 83 14 6 103 89
Net capital employed at year-end 1) 486 458 127 145 613 603
EBITDA as % of sales 7.0 6.9 3.7 3.4 6.0 5.8
EBITA as % of sales 5.5 5.3 2.5 1.7 4.6 4.1
EBIT as % of sales 4.9 4.7 1.6 0.7 3.8 3.5
EBITA as % of average net capital employed 21.3 21.0 15.6 8.6 20.0 17.8
EBIT as % of average net capital employed 18.9 18.8 10.1 3.8 16.9 14.9
1) Excluding associates.
Gross operating profit (EBITDA) improved by €11 million to
€160 million. We believe that the EBITA figure is the best
indicator of the result (on operations) and the €16 million
increase to €122 million represents an improvement of 0.4 of
a percentage point to 4.6% of sales.
On balance, there was net financial income compared with a
net expense last year. The main explanation is that the results
of associates returned to a normal level in 2015. In 2014, the
share in results of associates was depressed by the incidental
expenses taken by Spar and the impairment we recognised
on Superdirect. Interest expense was the same as in 2014.
The tax burden was higher than in 2014, mainly as a result
of the prior-year charge. See ‘Taxes’ on page 88 for further
details.
The overall effect of the above was that the net profit for 2015
was €81 million, an increase of €12 million or 17.4%. Earnings
per share, calculated on the average number of shares
outstanding, was €1.84 compared with €1.58 in 2014. Based
on the result for 2015 and our continuing strong financial
position, we propose increasing the dividend by €0.10 to
€1.20 per share. In accordance with our dividend policy, this
will be made up of a regular dividend of €0.90 (2014: €0.80)
and a variable dividend of €0.30 (2014: €0.30). An amount
of €0.40 has already been paid as interim dividend. The final
dividend for 2015 therefore amounts to €0.80.
The segment analysis of results below shows that both
Foodservice and Food Retail increased their operating profit
before amortisation (EBITA) by €8 million.

85
NET EARNINGS2006-2015
EARNINGS PER SHARE2006-2015
90
80
70
60
50
40
30
20
10
0
2006 2015
4.0 %
3.5 %
3.0 %
2.5 %
2.0 %
1.5 %
1.0 %
0.5 %
0.0 %
NETTOWINST
€ x million As a % of sales
2006 2015
2.00
1.75
1.50
1.25
1.00
0.75
0.50
0.25
0.0
Regular dividend Variable dividend
Incidental gains and losses played quite a significant part in the make-up of the segment information in 2014 when there was a net
incidental gain of €3 million at EBITA level for the Group as a whole. There were almost no incidental gains or losses in 2015. To
assist comparison, the table below summarises these effects.
The table shows that the underlying improvement in Foodservice
was greater than the reported €8 million as there had been incidental
gains of €6 million in 2014. There was the opposite effect at Food
Retail where €3 million of the total improvement can be attributed to
the incidental charge recognised in 2014. Adjusted for these effects,
the underlying improvements were €14 million at Foodservice and €5
million at Food Retail.
1) Difference between actual employer’s contribution and benefit expense for accounting purposes. This gain appears as a negative amount in the statement of recognised income and expense.
(x € million)
Foodservice Food Retail Total
2015 2014 2015 2014 2015 2014Book profits 0 4 0 (2) 0 2
Gains on pensions 1) 4 0 4
Impairments (2) (0) (1) (0) (3)
Net included in EBITA 0 6 (0) (3) 0 3
86 | Sligro Food Group 2015
Goals – Ensure that sufficient finance is available under credit
facilities and that the company comfortably meets the
stipulated ratios.
– Limit working capital to 10 days’ sales.
– Issue shares only for major acquisitions that immediately
contribute to earnings per share.
We prefer to call on the capital markets rather than the
banking market for our financing. Consequently, we
investigate the different types of financing that the market
can offer us. Currently, our long-term financing is through US
private placements. The two tranches had a value of €138
million on the reporting date and a swap value of €18 million is
recognised against this in other financial fixed assets. These
loans have maturities of two and five years. We do not expect
any problems attracting financing if the opportunity of an
acquisition should arise.
At year-end 2015, we had short-term financing in the form
of overdraft facilities of €113 million, of which €43 million is
committed. We are not currently drawing on these facilities.
The Group continues to have a strong free cash flow, as
shown in the abridged statement below. The 2015 financial
year had 53 weeks and ran to Saturday, 2 January, leading to
certain effects that give the appearance of increased working
capital. During a 53-week financial year, we remit payroll
taxes and excise duties of some €10 million thirteen times
rather than twelve. The net amount of other working-capital
items is also about €10 million higher as a result of payment
dates after Christmas which, in particular, reduce liabilities to
suppliers.
As well as the effects of the 53rd week, in 2015 we also
faced an effect on working capital that was the opposite of
what we saw at year-end 2014 when the timing of Christmas
in the financial year appeared to reduce working capital by
€20 million.
FINANCINGIn outline

87
Together, these effects give the appearance of an increase in
working capital of €40 million in 2015.
Nevertheless, total working capital decreased and a
clear underlying improvement was achieved in 2015. The
programmes for structurally improving the working capital
position are, therefore, succeeding. We expect to achieve a
further reduction in working capital during the next few years
with the introduction of our Supply Chain Finance programme
in November 2015. As explained on page 81 the level of
capital expenditure is increasing with the ongoing roll-out of
Sligro 3.0, conversion to the new format generation at EMTÉ
and our move into Belgium. We invested €62 million or 2.3%
of sales during the past year.
(x € million)
2015 2014 2013 2012 2011Net cash flow from operating activities 140 147 133 129 124
Net cash flow from investing activities excluding the net effect of acquisitions and the investment in Superunie (62) (69) (32) (33) (48)
Free cash flow 78 78 101 96 76
For comparison purposes: net profit 81 69 68 69 78
Cash conversion in % 96 113 148 140 98
The free cash flow was used to fund:
Net acquisitions/Superunie (11) (22) (19) (1) 0
Payment of dividend and repurchase of own shares (47) (64) (49) (50) (34)
Net change in debt and cash (20) 8 (33) (45) (42)
(78) (78) (101) (96) (76)
(x € million)
2015 2014 2013 2012 2011Current assets, excluding cash and cash equivalents 377 376 345 335 324
Current liabilities, excluding interest-bearing items (298) (287) (231) (204) (178)
79 89 114 131 146
In days’ sales revenue 11 13 17 19 22
ABRIDGEDcash flow statement
EVOLUTION OFworking capital

88 | Sligro Food Group 2015
WE BELIEVE THAT PAYING OUR WAY IN SOCIETY IN THE
FORM OF TAXES ACCORDING TO THE AGREED RULES IS
IMPORTANT AND PART OF DOING BUSINESS FAIRLY.
Nearly all our activities are carried on within the Netherlands
and this means that we pay Dutch corporation tax on the
entire taxable profit in the Netherlands. We take advantage
of tax facilities and allowances but without attempting to
test the limits. Where appropriate, we approach the relevant
authorities proactively and for some years we have formalised
this on the basis of a tax agreement, referred to as Horizontal
Supervision, with the Tax and Customs Administration. This
‘covenant’ involves reciprocal agreements on the way in
which the company and the tax authorities deal with each
other in a transparent manner. Unfortunately, our expectations
that formalising our discussions under Horizontal Supervision
would lead to even better coordination and assurance have
not been met.
Although the Horizontal Supervision concept does not exist
in Belgium, we are currently seeking negotiations with the
appropriate authorities there with the aim of avoiding possible
tax exposures before we start our operations. We also hope
to built a similar relationship with the tax authorities that is
analogous with the situation in the Netherlands.
Despite the discussions and transparency in our returns, we
had to pay an additional €2.5 million in tax for earlier years.
Legislation in recent years has included various measures
to prevent excessive enrichment from bonuses, options and
shares. Neither we nor the tax authorities realised that this
legislation would also affect the Sligro Food Group’s employee
share ownership scheme despite it being specifically designed
for employees with a gross income up to €50,000 per year.
The result of this is that the payments of a few hundred
euros a year to these employees are taxed very heavily.
This has made the cost of the scheme disproportionately
high compared with the benefit to our employees. As we
attach great significance to employee share ownership, we
are continuing the scheme in 2016 and will hold talks with
politicians in an attempt to reverse this side-effect of the law,
which we regard as unjustified.
As we have almost no debt, we pay substantial amounts of
Dutch corporation tax. We do not use constructions involving
low-tax jurisdictions. In addition to corporate income tax,
Sligro Food Group pays large amounts of payroll tax and social
security contributions, VAT and excise duties. The table below
shows how much tax we have paid in recent years.
TAXES
(x € million)
2015 2014 2013Corporate income tax 22 23 22
VAT and excise duties 90 78 76
Payroll tax and social security contributions 84 77 76

89
Innovation box Since 2010 we have been using the innovation box for the paperless ordering system we have developed. It has been agreed that
we can use this facility for this innovation until 2016.
(x € million)
2015 2014 2013Reported profit before tax 105 86 87
Corporate income tax at 25% 26 21 22
Innovation box (3) (2) (1)
Energy capital allowance (etc.) (1) (1) (1)
Net other deductions and disallowed items 0 0 0
Settlement prior years 2 (1) (1)
Reported corporate income tax24 17 19
As % of reported profit before tax 23% 20% 22%
The table below shows the facilities and environmental allowances that Sligro Food Group uses and how they affect the reported
corporate income tax.
THE SLIGRO SPICE MARKET
HAS THE RIGHT HERBS
AND SPCICES FOR EVERY
CUISINE: ASIAN, FRENCH,
MEXICAN: THE SEASONINGS
ARE READY FOR USE. OVER
125 DIFFERENT TYPES.
SLIGRO SPICE MARKET,
EXCLUSIVE TO SLIGRO.
SLIGROSpice market

90 | Sligro Food Group 2015

91
OUTLOOKThe Dutch economy is expected to recover gradually, leading
to an improvement in consumer confidence and employment
and eventually to an increase in consumer spending. Against
this background, we expect that the overall food service
market will grow again at the rate we saw in the past year but
still with large differences between the various segments.
We also expect growth in the food retail market in line with
the past year.
We expect Foodservice once again to outperform the market,
as has been the case for many years now. The acquisition of
Bouter in 2015 will add sales of some €10 million in the first
half of the year but we will not have the 53rd week, which
added €30 million at Foodservice in 2015. The market is
competitive and price is still a key criterion. As market leader,
we determine this to some extent within Foodservice and
keen prices are part of our offer to customers. The continuing
roll-out of our successful Sligro 3.0 approach, Belgium and
Online will be key areas for attention for 2016.
In Food Retail, we want to close the gap between us and
the market as a whole in the next few years and then grow
faster than the market. The conversion of sites to the new
format generation will encourage growth but, except for the
pilot stores, this will not happen until the second half of the
year. The effect on sales for the full year 2016 will be modest
especially since the stores will be closed for a few weeks
while they are being converted. The conversion is part of the
regular upgrade programme and we will take the opportunity
to apply the full new EMTE 3.0 format immediately. At Food
Retail, too, we will not have the 53rd week, which added €16
million in 2015. Promotions and campaigns remain important
to consumers. In the past year, however, we did not see
further price pressure increase significantly. It is not clear
how this will develop in Food Retail during the coming year
and as a price-follower we have to move with the trends in
the market.
We made great progress in our Kicking Costs programme
in the past year and this was largely reflected in the 2015
results. We will continue the programme during 2016. Also
in 2016 we will be making preparations for the opening of
our first outlet in Antwerp in early 2017. The start-up costs
for those preparations will affect the result for 2016 while the
gains will not be seen until the following year.
We are positive about our prospects for 2016 and expect the
gradual recovery we have seen in recent years to continue.
We will be ‘building the future’ by steady progress on
converting Sligro 3.0 cash-and-carry outlets, construction of
the first outlet in Belgium and conversion of EMTÉ stores as
‘Simply the tastiest supermarket’ in the Netherlands. We will
also be building our organisation, processes, systems and
data so that in future we will still be able to respond quickly
and flexibly to the wishes of our customers. The launch of our
new Sligro Online 3.0 programme in 2016 is a good example
of this.
We have a solid financial and commercial base for building the
future. That and a clear vision and a wide range of interesting
opportunities for investment are what make our industry and
our company so great!
As usual we refrain from making any definite forecasts.

92 | Sligro Food Group 2015

93
As required by the relevant statutory provisions, the directors
state that, to the best of their knowledge:
1. The financial statements, as shown on pages 104-150
of this report, give a true and fair view of the assets,
liabilities, financial position and profit for the financial year
of Sligro Food Group N.V. and the enterprises included in
the consolidated financial statements.
2. The directors’ report, as shown on pages 19-91 of this
report, gives a true and fair view of the position of Sligro
Food Group N.V. and its consolidated enterprises on the
reporting date and of the course of their affairs during the
financial year. The directors’ report describes the material
risks to which Sligro Food Group N.V. is exposed.
Veghel, 29 January 2016
K.M. Slippens, CEO
R.W.A.J. van der Sluijs, CFO
W.J.P. Strijbosch, Foodservice director
This statement is included pursuant to Section 2a of the
Decree on Additional Requirements for Annual Reports
(Vaststellingsbesluit nadere voorschriften inhoud jaarverslag)
of 20 March 2009 (the ‘Decree’) and is also publicly available
in digital form in the corporate governance section of www.
sligrofoodgroup.nl. The information that is to be included
in this statement pursuant to Sections 3, 3a and 3b of the
Decree can be found in the following sections of the 2015
annual report and is deemed to be included and repeated here:
– information on compliance with the principles and
best-practice provisions of the Code (page 78 ‘Corporate
Governance’);
– information on the principal features of the management
and control system in connection with the Group’s
financial reporting process (page 73 ‘Risk management
and control systems’);
– information on the functioning of the annual general
meeting of shareholders and its principal powers, and
on the rights of shareholders and how these can be
exercised (page 79 ‘General meeting of shareholders’);
– information on the composition and functioning of the
Executive Board (page 16 ‘Directors and management’,
page 78 ‘Executive Board’ and page 98 ‘Executive Board
conditions of employment’);
– information on the composition and functioning of the
Supervisory Board (page 16 ‘Directors and management’
and page 79 ‘Report of the Supervisory Board’);
– information on the rules for appointing and replacing
members of the Executive Board and Supervisory Board
(page 78 ‘Executive Board’ and page 79 ‘Supervisory
Board’);
– information on the rules for amending the company’s
Articles of Association (page 79 ‘General meeting of
shareholders’);
– information on the powers of the Executive Board to issue
and repurchase shares (page 79 ‘General meeting
of shareholders’);
– Information on the ‘change of control’ provisions in
important contracts: a ‘change of control’ provision applies
in the case of the US dollar loans referred to on page 136;
– information on transactions with related parties (page
78 ‘Corporate governance’ and page 144 ‘Related-party
disclosures’).
DIRECTORS’Statement of responsibilities
CORPORATE GOVERNANCEStatement

95
The economic recovery in the Netherlands continued in 2015
albeit at a gradual rate. This is expected to continue in both
our markets in the coming year although it is unlikely that it
will speed up.
The recovery was most obvious in the food retail market. The
foodservice market also recovered and started to grow again
but there are clearly major differences between its different
segments.
Sligro Food Group outpaced the market once again with its
Foodservice activities and accordingly market share increased
by 0.5% to 23.1%. The Sligro 3.0 programme is clearly
bearing fruit and contributing to this and will be continued
online in the coming year. Market share remained at 2.7%,
partly thanks to the opening of three new EMTÉ stores. The
new EMTÉ 3.0 format generation is being built up and the
first store in the new format opened in November 2015.
The plan to enter the Belgian foodservice market was
finalised during the year. The decision to implement this plan
was taken in May and work is progressing well. It is expected
that the first Sligro outlet will open in Antwerp in early 2017.
The Group’s net profit grew by €12 million in 2015 to
€81 million partly thanks to an increase in sales and this
was boosted by the 53rd week. Progress on the Kicking
Costs programme made a substantial contribution to the
improvement in results. At group level there were almost
no net incidental items in 2015 or 2014, although this was
not the case at business unit level in 2014. Please see the
analysis in the Results section for further information. The net
profit figure of €80 million was passed for the first time in the
year when Sligro Food Group marked 80 years of existence.
The result was better than expected and free cash flow was
also strong at €78 million.
These figures are presented in the 2015 financial statements
prepared by the Executive Board, with which we are in
agreement. For 2015, it is proposed to pay a regular dividend
of €0.90 per share (2014: €0.80), representing a pay-out ratio
of 49%. In addition, it is proposed to pay a variable dividend
of €0.30 per share (2014: €0.30), making the total dividend for
the year €1.20 (2014: €1.10).
Supervision In 2015, the Supervisory Board met in formal session on five
occasions. The Audit Committee held four formal meetings
in 2015. The Remuneration and Appointments Committee
also held four meetings, largely devoted to setting up and
implementing the process for recruiting two new supervisory
directors. Mr Kamps joined the Supervisory Board and Audit
Committee on his appointment during the General Meeting
of Shareholders on 18 March 2015 and so participated in four
meetings of the Supervisory Board and three meetings of the
Audit Committee.
First meeting The first meeting of the year examined and discussed at
length the 2014 results, annual report, proposed dividend
and results press release. The auditor also reported on the
audit findings at this meeting and we were pleased to note
that there were no material audit misstatements to report
or any other comments of an important nature requiring
immediate follow-up on the part of the Executive Board and/
or Supervisory Board.
The chairman of the Audit Committee then reported on
its first meeting. The Audit Committee had examined and
discussed the 2014 results and report, mainly looking at
technical matters. The draft auditors' report and long-form
report were also examined and discussed.
REPORT OF THE Supervisory Board

96 | Sligro Food Group 2015
The meeting also fixed the amount of the variable
remuneration for the Executive Board members, based on
the criteria and approved remuneration policy adopted a
year earlier. Also on the agenda were the preparations for
the general meeting of shareholders. Finally, the chairman
addressed Mr van Rozendaal as this would be the last meeting
of the Supervisory Board he would attend. On behalf of all the
supervisory directors, the chairman expressed appreciation
of Mr van Rozendaal’s work and excellent cooperation.
Second meeting The director of Sligro cash-and-carry presented the initial
results of Sligro 3.0 during the second meeting of the
year. These gave confidence for the further roll-out of the
programme. In addition, as part of the strategy update,
the country director for Belgium set out the business case
for Belgium with an extensive evaluation. There is a very
thorough plan and broad support for proceeding with the
execution stage. The theme of investor relations was also
on the agenda and there was feedback from the financial
markets. Finally, the meeting discussed and adopted the rules
of procedure of the Supervisory Board, Audit Committee and
Remuneration and Appointments Committee.
Third meeting The third meeting was devoted to the 2015 half-year results
and the associated press release. The proposal for the interim
dividend was also discussed and adopted. The chairman of
the Audit Committee then reported on its second meeting
which had seen and discussed the half-year results. Progress
on the follow-up to the action points in the 2014 management
letter was presented. A specific point was the action plan to
formalise risk management further at Sligro Food Group. The
auditors had also explained the audit plan for 2015. Other
themes discussed were investor relations and pensions.
The HR director then addressed the regular evaluation of the
Sligro Food Group management teams. This established that
there was a healthy balance of stable staffing and new talent
that could be developed. An update was given on the EMTÉ
Fijnproevers programme and the development and further
planning for EMTÉ 3.0 by the Food Retail commercial and
operational directors. Finally the structure and approach of the
Remuneration and Appointment Committee was explained.
The members of the Board continued the meeting alone to
discuss the approach to the succession to Ms Burmanje and
Mr Latenstein, since they would reach the end of their period
of office in 2016.
Fourth meeting Sligro’s director of Marketing, director of ICT and programme
manager for Sligro Online 3.0 gave progress reports on Sligro
Online 3.0 during the fourth meeting. The ambition for the
Online strategy is attractive and a phased approach was
selected.
The chairman of the Audit Committee then reported on
its third meeting, which had received and discussed the
audit plan, giving specific attention to the ICT components.
This meeting also discussed and considered progress on
formalising Risk Management and the structure of an Internal
Control Framework.
The CFO also commented on the capital expenditure
pro gramme for the next few years, confirming its higher
level in connection with the roll-out in Belgium. The secretary
of the CSR committee reported on progress on the CSR
programme.
Fifth meeting The board started its fifth and final meeting of the year
alone to assess the functioning of the Executive Board and
its own functioning using evaluation forms. We concluded
that there was a good working relationship both within the
Executive Board and the Supervisory Board and between
the two bodies. There were no indications of inadequate
performance, structural disagreement or conflicts of interest.
Also in the absence of the Executive Board, the auditors
explained the management letter to the Board and referred
in particular to the on-going improvement of the ICT
environment, which also has the permanent attention of
the Executive Board. The auditors also commented on the
complexity of the price and contractual condition systems and
possible additional control measures that could be applied.
ICT security and management of authorisations were other
themes requiring attention.
The meeting continued with the Executive Board in
attendance. The first report was feedback from the risk
workshop held by the Executive Board and the fraud risk
workshop and related fraud report. We support the initiatives
to further formalise and manage these matters at Sligro Food
Group and the specific search for a proper balance between
retaining our culture and formality.
The chairman of the Audit Committee then reported on its
fourth and final meeting, which had briefly discussed the
forecast and budget, in particular the technical aspects and

97
the preparation process. The 2015 management letter had
also been discussed along with an evaluation of the follow up
of the 2014 points. It was concluded that significant progress
had been made on all points. The Group’s tax position, the
financing facilities and Supply Chain Finance and, finally, the
impact of legislation on data security which will come into
force in 2016 were discussed.
The chairman of the Remuneration and Appointment
Com mit tee then reported on progress on recruiting two new
supervisory directors.
The 2016 budget was explained at length to the Board which
then approved it. Finally, we discussed and approved the
new whistleblower’s scheme and the new regulations on
ownership and transactions in Sligro Food Group shares.
First meeting in 2016 The first meeting of 2016 examined and discussed the 2015
results. The chairman of the Audit Committee then reported
on its first meeting, which was also about the 2015 results.
The auditors again reported that there were no material audit
issues relating the 2015 financial year requiring follow-up on
the part of the Executive Board and/or Supervisory Board.
We concur with the conclusions of the Executive Board on
risk management and control systems as set out on page 76.
The chairman of the Remuneration and Appointment
Committee reported on its first meeting, which had
discussed the appointment of Ms van Leeuwen and Mr Rijna
as new supervisory directors and the reappointment of Mr
Karis. The same meeting also fixed the amount of the variable
remuneration for the Executive Board members, based on
the criteria and approved remuneration policy adopted a year
earlier. The remuneration policy and proposed changes to it
were discussed.
The preparations for the general meeting of shareholders
were also on the agenda.
In addition to the scheduled meetings, the chairman of the
Supervisory Board holds regular talks with the Executive
Board and/or Supervisory Directors. In addition to the five
meetings mentioned above, the Supervisory Board met alone
on three occasions. The Supervisory Directors also held
individual meetings in consultation with the Executive Board
with key company staff.
In 2015, a member of the Supervisory Board was present as
observer at a consultative meeting with the Works Council.
As usual in the case of the Group, we are pleased to report
that the Executive Board and Works Council conduct their
meetings in a frank and constructive atmosphere.

98 | Sligro Food Group 2015
Executive Board conditions of employment The policy on Executive Board remuneration is published on
the company’s website. There were no changes in this policy
during the year. The Executive Board’s remuneration is set
out each year in the financial statements.
Its main points are that:
– the remuneration policy is drawn up by the Supervisory
Board and adopted by the general meeting of shareholders;
– the policy must make it possible to attract qualified
people as members of the Executive Board;
– the remuneration policy is performance-related, but must
also be reasonably in line with that applying to other
managers.
The remuneration package consists of:
– a fixed annual salary;
– a short-term bonus plan;
– a long-term bonus plan, which has to be converted into
shares;
– a long-term share-option plan, which also has to be partly
converted into shares;
– defined-contribution pension scheme;
– various other fringe benefits.
Once every three years, the remuneration package is
benchmarked against a reference group comprising around
20 companies.
Both the short-term and long-term bonus plans pay out
amounts equal to 30% of fixed salary if targets are met.
In 2015, achievement of the forecast profit counted 50%
towards the bonus, the remaining 50% depending on
implementation of the 2015 Kicking Costs programme, the
introduction of Supply Chain Finance, the next phase of CSR
and the introduction van the EMTÉ new format generation.
The ratio of total bonus to fixed salary represents an
appropriate level of incentive. The remuneration policy is
based on the principle that the variable component of an
individual’s salary should not be disproportionate to the fixed
component or the total remuneration. As bonuses under the
long-term bonus plan and the option plan have to be taken in
shares that are subject to transfer restrictions, the variable
element of the remuneration package also focuses on the
creation of long-term value.
In 2015, the variable remuneration was 110% (2014: 38%)
of the ‘at target’ level. The main reason that the ‘at target’
level was exceeded was the achievement of the profit and
meeting the targets for the Kicking Costs programme for
2015. The Supply Chain Finance programme was introduced
during the autumn of 2015 and the first pilot store in the
new EMTÉ format opened in Dieren in November 2015. The
agreed progress was made on the CSR agenda. Details of
Executive Board remuneration are contained in note 6 of the
financial statements on page 123.
Departures from the corporate governance codeThe members of Sligro Food Group’s Executive Board have
contracts for indefinite periods of time, in contravention of
the Dutch Corporate Governance Code. This departure from
the Code, which has been approved by the general meeting
of shareholders, is consistent with our aim of offering
comparable members of management similar remuneration
packages and, wherever possible, facilitating recruitment
from within the organisation. The period of notice which
Executive Board members are required to give is three
months. By law, the minimum notice which the company
can give is six months. The conditions of employment for
Executive Board members do not contain any severance pay
clauses. This has to do with the longer period of notice for
the company. A change in the law has limited termination
payments to a maximum of one year’s salary with effect from
1 July 2015. The general meeting of shareholders has also
approved this departure from the Code.
Board changesMs Burmanje and Mr Latenstein van Voorst will be retiring
from the company’s Supervisory Board at the General
Meeting of Shareholders, having served the maximum term
of office of eight years pursuant to the Articles of Association.
We owe them an enormous debt of gratitude for the
contributions they have made to the further development of
Sligro Food Group over the past eight years.
In view of the retirement of Ms Burmanje and Mr Latenstein
van Voorst, it is proposed to appoint Ms Marianne Van
Leeuwen and Mr Freek Rijna to our Supervisory Board.
Ms Van Leeuwen was CEO at Reed Business Nederland
until 2011. She currently chairs the Supervisory Board of AEB
Amsterdam and is a member of the Supervisory Board of
Sonepar Nederland and of ANP Holding.

99
Mr Rijna worked for FrieslandCampina from 1994 to 2015,
latterly as member of the Executive Board. Mr Rijna currently
sits on the Supervisory Board at Frisian Flag Indonesia and at
FrieslandCampina Vietnam.
Ms Van Leeuwen and Mr Rijna both have a track record that
makes them good successors to the departing members of
our Board. More comprehensive CVs will be appended to the
agenda for the General Meeting of Shareholders, which is
due to be published on 10 February.
It is also proposed to reappoint Mr Karis as member of the
Supervisory Board for a second and final term of office. During
his first term of office, Mr Karis drew on his background in
retail and showed an expert appreciation of the corporate
policy and the management of the business.
Financial statements The 2015 financial statements have been prepared by the
Executive Board. The financial statements were discussed
at a meeting attended by the auditors, who provided further
information on them. The financial statements have been
audited by Deloitte, whose unqualified audit report can be
found in ‘Other Information’ on page 152.
We invite you to:
– adopt the 2015 financial statements;
– adopt the proposed profit distribution;
– ratify the Executive Board’s conduct of the company’s
affairs;
– ratify the supervision exercised by our Board.
In 2015, the Executive Board ‘upped the game’. The CSR,
Kicking Costs and Supply Chain Finance targets were all
achieved and major progress was made in rolling our Sligro
3.0 and Sligro Online 3.0, the start of the new format
generation at EMTÉ and the development of Sligro Belgium.
This has set the foundations for Building the Future in 2016.
We are indebted to the Executive Board and the workforce
for the huge effort that was required for this in the past year.
Veghel, 29 January 2016
A. Nühn, chairman
Th.A.J. Burmanje
B.E. Karis
R.R. Latenstein van Voorst
J.H. Kamps
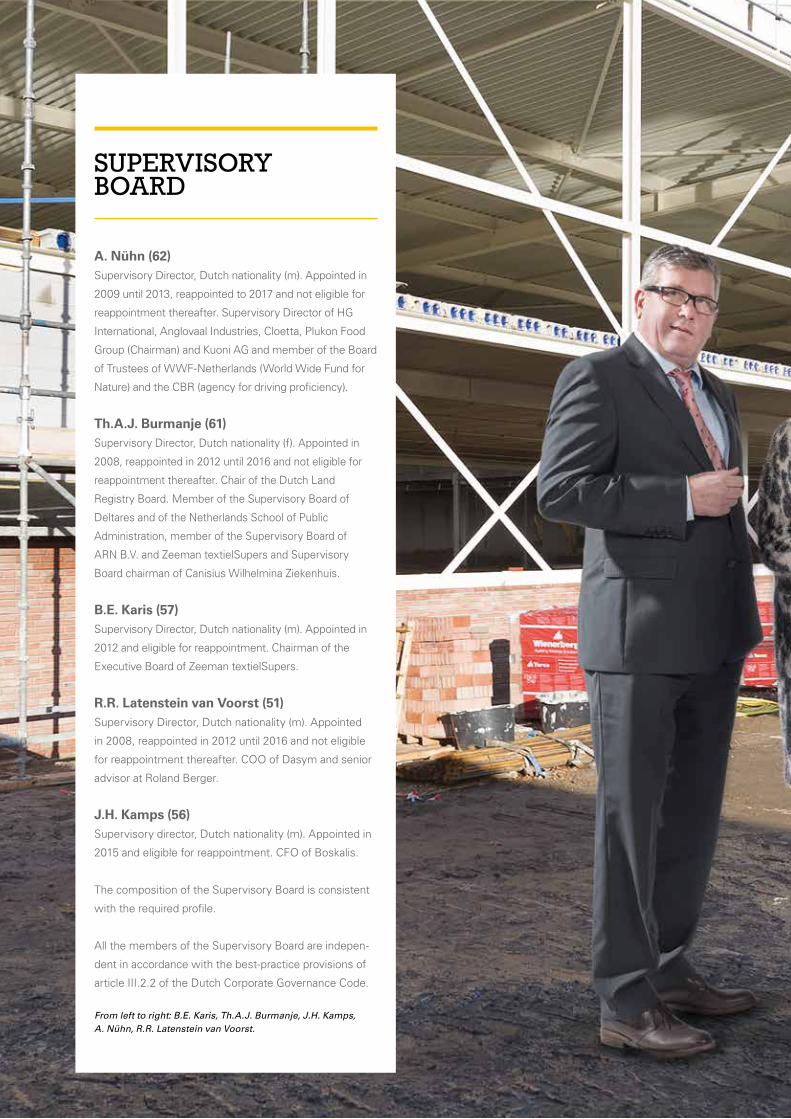
A. Nühn (62)Supervisory Director, Dutch nationality (m). Appointed in
2009 until 2013, reappointed to 2017 and not eligible for
reappointment thereafter. Supervisory Director of HG
International, Anglovaal Industries, Cloetta, Plukon Food
Group (Chairman) and Kuoni AG and member of the Board
of Trustees of WWF-Netherlands (World Wide Fund for
Nature) and the CBR (agency for driving proficiency).
Th.A.J. Burmanje (61)Supervisory Director, Dutch nationality (f). Appointed in
2008, reappointed in 2012 until 2016 and not eligible for
reappointment thereafter. Chair of the Dutch Land
Registry Board. Member of the Supervisory Board of
Deltares and of the Netherlands School of Public
Administration, member of the Supervisory Board of
ARN B.V. and Zeeman textielSupers and Supervisory
Board chairman of Canisius Wilhelmina Ziekenhuis.
B.E. Karis (57)Supervisory Director, Dutch nationality (m). Appointed in
2012 and eligible for reappointment. Chairman of the
Executive Board of Zeeman textielSupers.
R.R. Latenstein van Voorst (51)Supervisory Director, Dutch nationality (m). Appointed
in 2008, reappointed in 2012 until 2016 and not eligible
for reappointment thereafter. COO of Dasym and senior
advisor at Roland Berger.
J.H. Kamps (56)Supervisory director, Dutch nationality (m). Appointed in
2015 and eligible for reappointment. CFO of Boskalis.
The composition of the Supervisory Board is consistent
with the required profile.
All the members of the Supervisory Board are indepen-
dent in accordance with the best-practice provisions of
article III.2.2 of the Dutch Corporate Governance Code.
From left to right: B.E. Karis, Th.A.J. Burmanje, J.H. Kamps, A. Nühn, R.R. Latenstein van Voorst.
SUPERVISORY BOARD

101
STRATEGIEOp hoofdlijnen

102 | Sligro Food Group 2015

STRATEGIEOp hoofdlijnen
STATEMENTSINANCIAL
2015

ConsolidatedPROFIT AND LOSS ACCOUNTfor 2015
(x € million)
Note 2015 2014 20131)
Net sales 2, 3 2,670 2,572 2,498
Cost of sales (2,050) (1,976) (1,920)
Gross margin 620 596 578
Other operating income 4 2 5 5
Staff costs 5 (281) (271) (265)
Premises costs (59) (62) (63)
Selling costs (23) (24) (22)
Logistics costs (79) (77) (72)
General and administrative expenses (20) (18) (18)
Impairments (0) (3) (2)
Depreciation of property, plant and equipment 11 (38) (40) (41)
Amortisation of intangible assets 10 (19) (17) (12)
Total operating expenses (519) (512) (495)
Operating profit 2 103 89 88
Finance income and expense 8 (4) (4) (4)
Share in results of associates 13 6 1 3
Profit before tax 105 86 87
Income taxes 9 (24) (17) (19)
Profit for the year 81 69 68
Attributable to shareholders of the company 81 69 68
Figures per share € € €
Basic earnings per share 20 1.84 1.58 1.55
Diluted earnings per share 20 1.84 1.58 1.55
Proposed dividend 19 1.20 1.10 1.05
1) ) This concerns the comparative figures for the year taken from the 2014 financial statements.
104 | Sligro Food Group 2015

(x € million)
2015 2014 20131)
Profit for the year 81 69 68
Items never recognised in the profit and loss account:
Actuarial gains and losses on defined-benefit plans, net of tax (3) (2)
Items recognised or which may be recognised in the profit and loss account:
Effective part of movements in the fair value of cash flow hedge of long-term loans, net of tax 2 (2) (1)
Reclassified to consolidated profit and loss account 0 0
2 (2) (1)
Income and expense recognised directly in shareholders’ equity 2 (5) (3)
Recognised income and expense for the year 83 64 65
Attributable to shareholders of the company 83 64 65
Consolidated statementOF RECOGNISED INCOME AND EXPENSE for 2015
1) This concerns the comparative figures for the year taken from the 2014 financial statements.
105
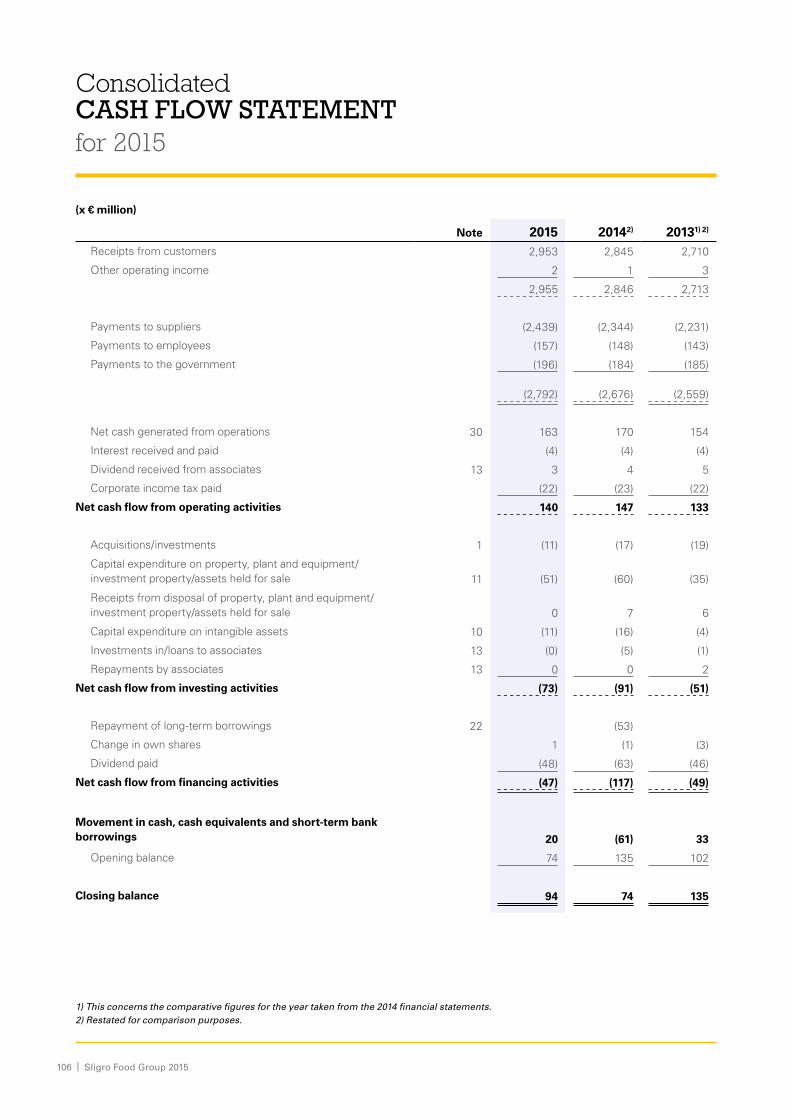
(x € million)
Note 2015 20142) 20131) 2)
Receipts from customers 2,953 2,845 2,710
Other operating income 2 1 3
2,955 2,846 2,713
Payments to suppliers (2,439) (2,344) (2,231)
Payments to employees (157) (148) (143)
Payments to the government (196) (184) (185)
(2,792) (2,676) (2,559)
Net cash generated from operations 30 163 170 154
Interest received and paid (4) (4) (4)
Dividend received from associates 13 3 4 5
Corporate income tax paid (22) (23) (22)
Net cash flow from operating activities 140 147 133
Acquisitions/investments 1 (11) (17) (19)
Capital expenditure on property, plant and equipment/ investment property/assets held for sale 11 (51) (60) (35)
Receipts from disposal of property, plant and equipment/investment property/assets held for sale 0 7 6
Capital expenditure on intangible assets 10 (11) (16) (4)
Investments in/loans to associates 13 (0) (5) (1)
Repayments by associates 13 0 0 2
Net cash flow from investing activities (73) (91) (51)
Repayment of long-term borrowings 22 (53)
Change in own shares 1 (1) (3)
Dividend paid (48) (63) (46)
Net cash flow from financing activities (47) (117) (49)
Movement in cash, cash equivalents and short-term bank borrowings 20 (61) 33
Opening balance 74 135 102
Closing balance 94 74 135
ConsolidatedCASH FLOW STATEMENTfor 2015
1) This concerns the comparative figures for the year taken from the 2014 financial statements.2) Restated for comparison purposes.
106 | Sligro Food Group 2015

(x € million)
ASSETS Note 02-01-2016 27-12-2014 28-12-20131)
Goodwill 10 126 126 126
Other intangible assets 10 67 72 53
Property, plant and equipment 11 315 295 286
Investment property 12 19 15 13
Investments in associates 13 48 45 43
Other financial assets 13 25 9 5
Total non-current assets 600 562 526
Inventories 14 220 213 192
Trade and other receivables 15 144 146 140
Other current assets 16 9 9 7
Assets held for sale 17 4 8 6
Cash and cash equivalents 18 94 74 135
Total current assets 471 450 480
Total assets 1,071 1,012 1,006
EQUITY AND LIABILITIES Note 02-01-2016 27-12-2014 28-12-2013Paid-up and called capital 3 3 3
Reserves 603 567 568
Total shareholders’ equity attributable to shareholders of the company 19 606 570 571
Deferred tax liabilities 9 25 27 28
Employee benefits 5 4 4 4
Other provisions 21 0 0 0
Bank borrowings 22 138 124 119
Total non-current liabilities 167 155 151
Current portion of long-term borrowings 22 53
Bank borrowings 22 0 0 0
Trade and other payables 31 207 200 148
Corporate income tax 9 6 0 4
Other taxes and social security contributions 23 26 33 33
Other liabilities, accruals and deferred income 24 59 54 46
Total current liabilities 298 287 284
Total equity and liabilities 1,071 1,012 1,006
Consolidated BALANCE SHEETas at 2 January 2016 before profit appropriation
1) This concerns the comparative figures for the year taken from the 2014 financial statements.
107

(x € million)
Paid-up and called
capitalShare
premiumOther
reservesRevaluati-on reserve
Hedging reserve
Treasury shares
reserve Total
Balance as at 28-12-2013 3 31 551 3 (4) (13) 571
Transactions with owners
Share-based payments (1) (1)
Dividend paid (63) (63)
Change in own shares (1) (1)
0 0 (64) 0 0 (1) (65)
Total realised and unrealised results
Profit for the year 69 69
Investment property (1) 1
Cash flow hedge (2) (2)
Reclassification 0 0
Actuarial results (3) (3)
0 0 65 1 (2) 0 64
Balance as at 27-12-2014 3 31 552 4 (6) (14) 570
Transactions with owners
Share-based payments 0 0
Dividend paid (48) (48)
Change in own shares 1 1
0 0 (48) 0 0 1 (47)
Total realised and unrealised results
Profit for the year 81 81
Investment property (0) 0
Cash flow hedge 2 2
0 0 81 0 2 0 83
Balance as at 02-01-2016 3 31 585 4 (4) (13) 606
Consolidated statement of CHANGES IN EQUITY for 2015 before profit appropriation
108 | Sligro Food Group 2015

NOTES to the consolidated financial statements
Accounting policies Page
A. General 110
B. Financial year 110
C. Compliance with IFRS 110
D. Accounting policies used in the preparation of the
consolidated financial statements 110
E New standards and interpretations 110
F. Specific choices under IFRS 110
G Accounting policies of a more critical nature 111
H. Other accounting policies 112
I. Basis of consolidation 115
J Segment information 115
K. Earnings per share 115
109

A. GeneralSligro Food Group N.V. is based in Veghel, the Netherlands.
The consolidated financial statements comprise the financial
information of the company itself and that of its subsidiaries
(together referred to as the Group).
B. Financial yearUnder the Articles of Association, the financial year coincides
with the calendar year. The year is actually closed on the last
Saturday of the financial year in accordance with the
internatio nal system of week numbering and thus on
2 January 2016 in the year under review. The 2015 financial
year has 53 weeks. The comparative figures for the 2014 and
2013 financial years relate to 52 weeks. The 2016 financial
year will consist of 52 weeks.
C. Compliance with IFRSThe consolidated financial statements have been prepared in
accordance with International Financial Reporting Standards
as adopted by the European Union (EU-IFRS). The financial
statements were authorised for issue by the Executive Board
on 29 January 2016.
D. Accounting policies used in the preparation of the consolidated financial statements
The financial statements are presented in millions of euros,
except where otherwise indicated. The euro is the functional
currency. The percentages are calculated on the underlying
figures in thousands. The historical cost convention has been
applied except for investment property and derivative
instruments, which are stated at fair value. Assets held for
sale are recognised at the lower of their existing carrying
amount and fair value, less costs to sell.
The preparation of the financial statements in conformity
with IFRS requires management to make judgements,
estimates and assumptions that affect the application of
accounting policies and the reported amounts of assets,
liabilities, income and expenses. Estimates and associated
assumptions are based on historical experience and other
factors that are believed to be reasonable in the circumstan-
ces. Their outcome forms the basis for the judgement on the
carrying amounts of assets and liabilities which cannot easily
be determined from other sources. Actual results may differ
from these estimates. Estimates and underlying assumptions
are reviewed on an ongoing basis. Revisions to accounting
estimates are recognised in the period in which the estimates
are revised if the revision only affects that period, or in the
revision period and any future periods affec ted if the revision
affects the current and future periods.
The carrying amounts of qualifying assets are tested for
indications of impairment. If there are any such indications,
the recoverable amount of the asset is estimated on the
basis of the present value of the expected future cash flows
or the fair value less costs to sell. An impairment loss is
recognised if the carrying amount is higher than the
recoverable amount. The accounting policies set forth below
have been consistently applied relative to 2014.
E. New standards and interpretationsThe Group has elected not to apply the new standards IFRS
9 Financial Instruments, IFRS 15 Revenue from Contracts
with Customers and IFRS 16 Leases ahead of time. These
standards are not expected to have any material impact on
the Group’s financial statements.
F. Specific choices under IFRSIn some instances, IFRS permits various options in the
application of accounting principles. The most important
choices are explained below:
MEASUREMENT OF FAIR VALUEA number of accounting policies and disclosures require the
measurement of fair value.
The Group periodically reviews the significant changes in
value. Where fair value measurement is based on external
information, the Group assesses the documentary evidence
of fair value obtained from the third parties concerned to
verify that the amounts arrived at satisfy IFRS requirements,
including the hierarchical level of the fair values into which
such measured amounts are classified. More information on
the assumptions underlying the measurement of fair value is
contained in the following notes:
Accounting policy
Investment property F
Other financial assets, fair value hedge H2
Assets held for sale H13
Bank borrowings H2
PROPERTY, PLANT AND EQUIPMENTIFRS allows the option of measuring property, plant and
equipment (or individual assets) at either cost or fair value.
Sligro Food Group opted for cost-based treatment since this
involves a more straightforward calculation in our specific
business.
110 | Sligro Food Group 2015
INVESTMENT PROPERTYIFRS allows the option of measuring investment property at
either cost or fair value. The investment property comprises
supermarket premises leased to Group franchisees. In
contrast to the other property included in property, plant and
equipment, the fair value is unequivocal. Moreover, the
Group may not be the owner of these premises but may be
subletting them. This property accordingly has the nature of
a financial investment and the fair value provides a more
accurate view of the economic performance. The existence
of a transparent property market for supermarket premises
means that the fair value can be calculated by applying a
typical market capitalisation factor to the rental income.
CASH FLOW STATEMENTIFRS allows the cash flow statement to be prepared using
either the direct method or the indirect method, albeit with a
preference for the direct method, and this is the method
adopted by the Group as it provides the most accurate view
of the actual cash flows. A reconciliation with the indirect
method is included in note 30.
G. Accounting policies of a more critical nature
G1 NET SALESThis is the proceeds from the sale of goods and services to
third parties, net of value added tax, volume, other discounts
and the value of loyalty programmes. Sales made in
partnership with suppliers of fresh produce are also included.
Some product lines are supplied directly to the stores of
supermarket franchisees. However, since the contract terms,
commercial management and financial settlement are
arranged by the Group, the amounts concerned are included
in the Group’s revenue. Sales are recognised when the
significant risks and rewards of ownership have been
transferred to the purchaser or the service has been
performed.
G2 COST OF SALESThis is made up of the cost of purchasing the goods supplied.
Bonuses, promotional payments and payment discounts
received from suppliers are deducted from the purchase
cost. Various types of compensation are received from
suppliers, the two main ones being:
i Temporary price reductions, usually relating to special
offers to customers with the aim of increasing direct
sales volumes. In most cases, the supplier actually
charges the lower purchase price for the agreed period
but sometimes the normal price is charged and the
discount is invoiced separately by the Group, based on
the quantities sold. The benefit of temporarily lower
purchase prices is reflected directly in the cost of sales
and therefore at least partially offsets the lower selling
prices charged to customers.
ii Bonuses, usually based on annual agreements.
Sometimes the bonus is a fixed or graduated percentage
of the purchase value of total purchases (or an increase
therein). Usually, advance payments on the bonus are
received. As well as bonuses, the annual agreements
frequently contain arrangements on promotional
payments, usually subject to various forms of
commercial collaboration. Promotional payments may
be either absolute amounts or fixed or graduated
percentages of the purchase value. Where receipt of a
bonus can be expected with reasonable certainty, it is
reflected in the carrying amount of inventories.
Promotional payments are not deducted from inventories
because they are intended to cover the selling costs.
111
G3 GOODWILL AND OTHER INTANGIBLE ASSETS
All acquisitions are accounted for using the purchase
method. With effect from 2010, goodwill is recognised in
respect of the difference between the fair value of the
purchase price payable and the initially recognised amount
(generally the fair value) of the identifiable assets and
liabilities acquired.
In the case of acquisitions prior to 28 December 2003,
goodwill is the amount calculated according to the previously
applicable accounting standards. Goodwill is carried at cost
less any cumulative impairment losses. Goodwill is allocated
to cash-generating units. Goodwill is not amortised but
tested for impairment annually, or when there is an indication
of impairment. In the case of associates, the goodwill is
reflected in the carrying amount of the investment. All other
intangible assets are carried at cost less straight-line
amortisation over the estimated useful life of the assets
concerned which, in the case of supermarket stores, is
estimated at ten years and, in the case of customer bases in
Foodservice, also ten years. Where long-term customer
accounts stem from specific sign-up fees with customers,
the life of the asset is the same as the period of the contract.
Impairment tests are performed when there are indications
that they are required. The cost of internally generated
goodwill and trademarks is expensed. Software developed
by third parties is capitalised at cost, provided its technical
feasibility has been demonstrated. Internally developed
software, provided it satisfies a number of criteria including
technical feasibility, is similarly capitalised. Software
maintenance costs are expensed. Capitalised software is
amortised over three years using the straight-line method.
G4 PROPERTY, PLANT AND EQUIPMENTItems of property, plant and equipment are carried at cost
less straight-line depreciation based on the estimated useful
life of the assets concerned. Cost includes directly attribu-
table finance costs where the effect is material as regards
amount or term to maturity. Where assets are made up of
parts with different useful lives, each part is treated as a
separate item (component approach). The maximum depre-
ciation period for alterations to rented premises is the remai-
ning term of the lease. Where necessary, impairment losses
are recognised.
The applicable depreciation percentages are:
Land Nil
Buildings/alterations 3 to 12½
Retail premises 31/3
Plant and equipment 12½ to 331/3
Other 20 to 331/3
H. Other accounting policies H1 FOREIGN CURRENCYTransactions denominated in foreign currencies are transla-
ted at the spot rate on the transaction dates. Receivables and
payables are translated at the exchange rate on the balance
sheet date, with exchange differences recognised in the
profit and loss account. As all the Group’s subsidiaries,
associates and joint ventures are Dutch or Belgian companies
there is no translation risk. The treatment of financial
derivatives is described below.
H2 FINANCIAL INSTRUMENTSNon-derivative financial instrumentsNon-derivative financial instruments comprise other financial
assets, trade and other receivables, other current assets,
cash and cash equivalents, bank borrowings, trade and other
payables and other liabilities and accruals.
Derivative financial instrumentsThe Group makes use of financial derivatives to hedge
the exchange rate and interest rate risks associated with its
operating and financing activities. In accordance with its
treasury policy, the Group neither holds nor issues derivatives
for trading purposes. However, derivatives which do not
meet the criteria for hedge accounting are treated as trading
instruments. Derivative financial instruments are recognised
at fair value. The gain or loss on revaluation to fair value is
recognised immediately in the profit and loss account. If
derivatives do, however, meet the criteria for hedge
accounting, recognition of any resulting gain or loss depends
on the nature of the item that is hedged, as explained below.
112 | Sligro Food Group 2015

The fair value of forward interest rate and exchange rate
contracts is the estimated amount that the Group would
have to pay or would receive if the instruments were
cancelled on the balance sheet date. This information is
provided by statements obtained from reputable financial
institutions which act as the counterparties. A positive fair
value of derivatives is recognised as other financial assets
and a negative fair value is included in long-term debt.
HedgingCash flow hedgeWhen a derivative financial instrument is designated as a
hedge associated with the variability of the cash flows (due
to interest rates and exchange rates) from a recognised
liability, the effective portion of a gain or loss on the derivative
financial instrument is recognised in equity (via the statement
of recognised income and expense). This item is transferred
to the profit and loss account in the same period or periods in
which the underlying liability affects the result. The
ineffective portion of any gains or losses is recognised
immediately.
Hedging monetary assets and liabilitiesWhere a derivative financial instrument is used to hedge the
currency risk on a recognised monetary liability, hedge
accounting is in principle not used, meaning that the gain or
loss on exchange is recognised in the profit and loss account.
H3 OTHER OPERATING INCOMEThis item includes rental income from investment and other
property. It also includes any gains and losses in the fair value
of investment property and book profits or losses on the sale
of such property and on the disposal of assets included in
property, plant and equipment, together with similar income.
H4 EXPENSES - GENERALThe presentation of expenses is based on classification by
nature. The same classification is used for internal reporting
purposes. Expenses are recognised in the year to which they
relate. Rents and operating lease instalments are charged to
the profit and loss account on a straight-line basis over the
periods of the contracts concerned.
H5 EMPLOYEE BENEFITSi Defined-contribution plans Pension scheme contribution liabilities under defined-
contribution plans are recognised as an expense in the
profit and loss account when the contributions fall due.
This is the case for almost all of the Group’s schemes
providing privately insured benefits to top up state
benefits including the schemes provided by EMTÉ
Supermarkten and for certain groups of employees, such
as fruit and vegetable and meat department staff, which
are covered by industry pension funds. These arrange-
ments are classed as a defined-contribution plan because
the Group is only under obligation to pay the agreed level
of contributions and does not bear any additional actuarial
or other risks in respect of the accrued length of service.
ii Defined-benefit plans The new pension scheme provided by Stichting
Pensioenfonds Sligro Food Group replaced the old
defined-benefit pension arrangements, with effect from
1 June 2014, and qualifies under IAS 19 as a collective
money purchase arrangement, i.e. defined-contribution
plan. The old scheme was terminated at the end of May
2014, resulting in a non-recurring accounting (i.e.
non-cash) gain on pensions of €4 million before tax in
2014. The new scheme has minimal impact on the cost
of the actual pension contributions borne by the Group.
iii Other long-term employee benefits The Group’s net obligation in respect of long-service
benefits is the amount of the future benefits attributable
to employee service in the reporting period and prior
periods. The obligation is measured using the projected
unit credit method and calculated at present value.
iv Option rights The share option plan in force until 2014 gave a broad
group of employees the option of acquiring Sligro Food
Group N.V shares. The fair value of the share options is
accounted for as staff costs, with a corresponding
addition to shareholders’ equity and liabilities. Since the
options are granted unconditionally, the fair value of the
options is expensed in the year in which the options are
granted. The options are payable half in shares and the
other half in either shares or cash. The first 50% is
therefore treated as being ‘equity settled’, with the cost
expensed and a corresponding addition to shareholders’
equity, with no further adjustments. The second 50% is
113
treated as being ‘cash settled’, with the cost expensed
and a corresponding increase in the liabilities, this latter
item being adjusted each year through profit or loss,
depending on the movements in the fair value of the
position.
A change has been made to the share option plan with
effect from 2015, award of the options (Groen Bloed
Certificaten- ‘Green Blood Depositary Receipts’)
becoming conditional on continued service from 2015
onwards. The fair value of the options is amortised on a
straight-line basis over the vesting period of the option
rights. Profit-sharing granted with effect from 2015 is
payable entirely in shares. These shares are then frozen
for one year for staff and for four years in the case of
management. These options are treated as ‘equity
settled’ in their entirety.
H6 FINANCE INCOME AND EXPENSEThese items are interest and similar costs payable to third
parties and interest receivable from customers in respect of
loans granted and/or deferred payments. The calculation is
made using the effective interest method.
H7 SHARE IN RESULTS OF ASSOCIATESThis concerns the Group’s share in results of associates.
H8 INCOME TAXESThe tax charge shown in the profit and loss account
comprises the corporate income tax payable for the year
together with any movements in deferred tax except where
such liabilities relate to items that are accounted for directly
in equity. The corporate income tax payable for the year is
the expected amount of tax payable on the taxable profit,
taking account of any adjustments in respect of the tax
liability in preceding years. The tax burden is affected by tax
facilities and costs which are not deductible or only partially
deductible for tax purposes.
The provision for deferred tax liabilities results from
temporary differences between accounting policies used for
tax purposes and for reporting purposes. No provisions have
been formed in respect of goodwill that is not tax-deductible
and in respect of investments in associates qualifying for the
substantial-holding exemption. The amount of the provision
is calculated at the tax rate applicable on the balance sheet
date or the rate (substantively) enacted at the balance sheet
date.
H9 INVESTMENT PROPERTYInvestment property is carried at fair value, which is based
on the market value, as derived from a capitalisation factor
applied to the rental income, and also depending on the
expected long-term continuity as supermarket premises. The
capitalisation factor applied is generally between 10.5 and 13
times the rental income but, in the case of some less viable
premises, a lower valuation may be applied. The internally
determined capitalisation factor is regularly reviewed by
reference to external market data, such as professional
appraisals. As already disclosed under H3, rental income and
any fair value gains and losses are included in other operating
income.
H10 FINANCIAL ASSETSInvestments in associates are accounted for using the equity
method and, at initial recognition, are stated at cost, including
goodwill, but excluding associated transaction costs, with a
carrying amount of not less than nil, unless the Group is
under an obligation to absorb losses either partially or
entirely. Unrealised intragroup results are eliminated. Other
financial assets mainly comprise interest-bearing loans to
customers and loans to associates. The loans are carried at
amortised cost less any impairment losses.
H11 INVENTORIESInventories are carried at the lower of cost, using the FIFO
method, or market value, which is taken as being the
estimated sales value in normal circumstances, less selling
costs. The carrying amount includes allowances for internal
distribution, whereas bonus discounts are deducted.
H12 TRADE AND OTHER RECEIVABLES AND OTHER CURRENT ASSETS
Trade receivables are initially carried at fair value and
subsequently at amortised cost less any impairment losses.
H13 ASSETS HELD FOR SALEAssets held for sale are recognised at the lower of carrying
amount or fair value, less costs to sell. On classifying assets
as being held for sale, any impairment losses are taken to the
profit and loss account. If necessary, valuation is based on
external appraisals.
H14 CASH AND CASH EQUIVALENTSCash and cash equivalents comprise cash balances and
credit balances at banks and are carried at face value.
Overdrafts forming an integral part of the Group’s cash
management and payable on demand are included in the
cash flow statement in the movement in cash, cash
equivalents and short-term bank borrowings.
114 | Sligro Food Group 2015

H15 PROVISIONSThe provision for deferred tax liabilities is included at face
value calculated at the prevailing or, if known, future tax rate
and has already been explained in H8.
The provision for employee benefits is explained in H5. The
other provisions relate to existing obligations connected to
risks relating to franchises and guarantees carried at the
amounts estimated as probably being payable in the future.
Where the effect is material, the carrying amount of the
future obligation is discounted.
H16 INTEREST-BEARING DEBTInterest-bearing debt is initially recognised at fair value less
related transaction costs. The liabilities are subsequently
carried at amortised cost determined using the effective
interest method.
H17 OTHER LIABILITIES, ACCRUALS AND DEFERRED INCOME
These are carried at amortised cost.
I. Basis of consolidationSubsidiaries are those entities over which Sligro Food Group
N.V has control. Subsidiaries are fully consolidated. They are
the wholly-owned companies Sligro Food Group Nederland
B.V., Veghel, and Sligro Food Group International B.V.,
Veghel. Sligro Food Group International B.V. is the holding
company of the 100% interest in Sligro België N.V., Antwerp.
Sligro Food Group Nederland B.V. is the holding company for
the following wholly-owned subsidiaries:
Foodservice• Sligro B.V., Veghel.
• De Dis B.V., Ter Apel (86%).
• Van Hoeckel B.V., ‘s-Hertogenbosch.
• Horeca Totaal Sluis B.V., Sluis.
• Bouter B.V., Zoetermeer.
Food retail• EMTÉ Franchise B.V., Veghel.
• EMTÉ Supermarkten B.V., Veghel.
- EMTÉ Vleescentrale B.V., Veghel.
• EMTÉ Vastgoed B.V., Veghel.
The effectiveness of the Group’s legal structure is appraised
each year with a view to simplification where appropriate.
Associates are those entities in which the Group has
significant influence, but not control, over the financial and
operating policies. The consolidated financial statements
include the share in the results of associates measured using
the equity method. Subsidiaries and associates are included
in the consolidation from the date on which control or
significant influence is obtained to the date on which it
ceases.
Intercompany items and any unrealised gains and losses on
such transactions are eliminated in the preparation of the
consolidated financial statements.
J. Segment informationSligro Food Group reports its results according to the main
segments of foodservice and food retail. This segmentation
matches that of internal management information precisely.
In attributing the results to the main segments, a distinction is
made between directly attributable income and expenses and
assets and liabilities and those which are not directly
attributable, the latter mainly concerning the Group’s
integrated back-office activities, which are attributed to the
main segments using reasonable and consistently applied
allocation methods.
K. Earnings per shareThe Group reports both basic and diluted earnings per share
(EPS). The net result per ordinary share is calculated on the
basis of the profit attributable to the shareholders of the
Group divided by the weighted average number of ordinary
shares in issue during the year. In calculating the diluted
earnings per share, the profit attributable to the shareholders
of the Group and the weighted average number of ordinary
shares in issue during the year are adjusted for the potential
dilutive effect on the number of ordinary shares of share
options awarded to staff.
115

116 | Sligro Food Group 2015

NOTES to the consolidated financial statements
Notes Page
1. Acquisitions, investments and disposals 118
2. Segment information 119
3. Net sales 120
4. Other operating income 120
5. Employee-related items 120
a. Staff costs 120
b. Employee benefits provision 121
c. Pensions and pension funds 121
d. Long-service benefits 121
e. Share-based payments (share option scheme) 122
6. Remuneration of Executive Board and Supervisory Board 123
7. Audit fees 124
8. Finance income and expense 125
9. Income taxes 125
10. Goodwill and other intangible assets 127
11. Property, plant and equipment 129
12. Investment property 130
13. Investments in associates and other financial assets 131
14. Inventories 132
15. Trade and other receivables 132
16. Other current assets 133
17. Assets held for sale 133
18. Cash and cash equivalents 133
19. Shareholders’ equity 134
20. Earnings per share 135
21. Other provisions 135
22. Long-term and short-term borrowings 136
23. Other taxes and social security contributions 137
24. Other liabilities, accruals and deferred income 137
25. Risk management 137
26. Operating lease and rental obligations 141
27. Investment obligations 142
28. Contingent liabilities 142
29. Management estimates and assessments 142
30. Cash flow statement 143
31. Related-party disclosures 144
117

(x € million)
2015 2014Intangible assets 4 16
Property, plant and equipment 4 1
Inventories 4 2
Trade and other receivables 5 2
Cash and cash equivalents 0 3
Deferred tax liabilities (1) (3)
Employee benefits (0) (0)
Trade and other payables (5) (1)
Total identifiable net assets 11 20
Less: cash and cash equivalents (0) (3)
Debt-free purchase price 1) 11 17
1. Acquisitions, investments and disposals
One acquisition was made in 2015, namely that of the shares of CaterTech B.V., Zoetermeer. CaterTech is a specialist advisory,
design and supply company for professional kitchens, catering equipment and refrigeration systems and also provides related
installation and maintenance services. With its specialised range of own brands and licensed products (some on an exclusive
basis) CaterTech focuses mainly on hotels, company restaurants, healthcare institutions, educational establishments and ships’
galleys. CaterTech achieved sales of €22 million in 2014. The company has around 106 full-time equivalent employees. The
takeover was completed on 6 July 2015 and the figures for CaterTech have been included in the consolidation as from July. With
effect from 1 January 2016, CaterTech and all its subsidiaries have been merged into a single legal entity named Bouter B.V.
This acquisition added approximately €16 million to consolidated net sales in 2015. If this acquisition had formed part of the Group
for the entire year, the sales figure would have been approximately €11 million higher.
Final financial settlement of the acquisition of the wholesale business of Rooswinkel Horeca Groothandel B.V. made in 2014 also
took place in 2015. The purchase price depended on the achievement of certain criteria and the final payment was made
accordingly, completing the acquisition.
An analysis of the acquired assets and equity and liabilities is as follows:
1) Included in the transaction with CaterTech were bank borrowings of €5 million, which have been deducted in arriving at the purchase price for the shares.
118 | Sligro Food Group 2015

2. Segment information
The results and net capital employed can be analysed by segment as follows:
(x € million)
Foodservice Food Retail Total
2015 2014 2015 2014 2015 2014Net sales1) 1,829 1,749 841 823 2,670 2,572
Other operating income 1 4 1 1 2 5
Total income 1,830 1,753 842 824 2,672 2,577
Operating profit 89 83 14 6 103 89
Finance income and expense (4) (4)
Share in results of associates 2 1 4 0 6 1
Income taxes (24) (17)
Profit for the year 81 69
Segment assets 698 660 213 230 911 890
Associates 13 13 35 32 48 45
Unallocated assets 112 77
Total assets 711 673 248 262 1,071 1,012
Segment liabilities 213 202 86 85 299 287
Unallocated equity and liabilities 772 725
Total equity and liabilities 213 202 86 85 1,071 1,012
Net capital employed 2) 486 458 127 145 613 603
Net interest-bearing debt 3), provisions and associates (7) (33)
Group equity 606 570
Staff costs 180 170 101 101 281 271
Number of employees 4) 3,258 3,165 2,482 2,669 5,740 5,834
Capital expenditure 5) 52 56 8 7 60 63
Disposals 5) (0) (3) (0) (0) (0) (3)
Investment in customer bases 3 11 1 0 4 11
Depreciation 6) and amortisation software 33 33 10 14 43 47
Other amortisation 7 6 7 7 14 13
1) There are no transactions between the segments. 2) Excluding associates. 3) Interest-bearing debt less freely available cash and cash equiva-lents and the fair value of derivatives. 4) Certain head office staff who perform activities on behalf of the Group as a whole have been included in the Foodservice activities. 5) Involving property, plant and equipment, investment property, assets held for sale and software (at transaction level) 6) Including impairments.
119

3. Net sales
This is very largely made up of domestic sales of food and food-related non-food articles to consumers and retail traders (Food
Retail), institutional customers, the hospitality sector, company restaurants and other large-scale caterers (Foodservice).
The analysis of revenue by activity is as follows:
(x € million)
2015 2014Foodservice 1,829 1,749
Food Retail 841 823
2,670 2,572
Goods/services
Goods supplied 2,648 2,551
Services rendered 22 21
2,670 2,572
4. Other operating income
(x € million)
Note 2015 2014Investment property rental income 12 2 2
Fair value adjustments on investment property 12 (0) 0
Other rental income 1 1
Book profit (loss) on sale of property, plant and equipmentand other incidental gains and losses 11 (1) 2
2 5
5. Employee-related items
5.A. STAFF COSTSStaff costs are made up as follows:
(x € million)
Note 2015 2014Salaries 204 194
Social security contributions 32 31
Net benefit expense on defined-benefit plans 5.c 0
Defined-contribution plan contributions 17 13
Share-based payments 5.e 0 1
Contract/temporary staff 12 17
Other staff costs 16 15
281 271
120 | Sligro Food Group 2015

5.C. PENSIONS AND PENSION FUNDSWithin the Group there are basically two pension schemes,
connected with the two principal collective labour agree-
ments covering the Group’s activities.
There were changes to all the pension schemes mentioned
below in 2015, in line with the new statutory rules, to bring
the contribution rates within the band between permitted
minimum and maximum pension base percentages.
Food Retail Chains CLAThe staff of EMTÉ Supermarkten come under this CLA. The
pension scheme is administered by the Food Industry
Pension Fund. It is an indexed average pay scheme, with
indexation conditional on satisfactory funding. This arrange-
ment is classed as a defined-contribution plan because the
Group is only under obligation to pay the agreed level of
contributions and does not bear any additional actuarial or
other risks in respect of the accrued length of service. The
industry pension fund has a reserve deficit. EMTÉ
Supermarkten does not have any obligation beyond the
payment of contributions. The level of contributions is linked
to the pension base and is calculated in the same manner for
all companies affiliated to the Pension Fund.
Other CLAs/industry-wide pension fundsA small proportion of the Group’s employees is covered by
other industry pension funds. The schemes are conditional
indexed average pay schemes and the related pension funds
also have reserve deficits. These arrangements, too, are
classed as a defined-contribution plans because the Group is
only under obligation to pay the agreed level of contributions
and does not bear any additional actuarial or other risks in
respect of the accrued length of service.
Food Wholesale Sector CLAThe other staff within the Group come under this CLA. The
pension scheme for these employees is administered by
Stichting Pensioenfonds Sligro Food Group. In 2014, agree-
ment was reached on a new pension scheme for these
employees. The treatment as a defined-benefit plan was
discontinued at the end of May 2014 and has been treated
as a defined-contribution plan since that date. The new
scheme came into operation on 1 January 2015, with the
contribution rate fixed for five years. The Group does not
have any obligation beyond the payment of the agreed level
of contributions.
The discontinuation of the old scheme at the beginning of
June 2014 resulted in a non-recurring accounting (i.e.
non-cash) gain on pensions of €4 million in 2014. From
1 June 2014 onwards, the net expense has been the same
as the amount of the employer’s contributions payable.
5.B. EMPLOYEE BENEFITS PROVISIONThis provision can be analysed as follows:
(x € million)
Note 2015 2014Post-employment benefits 5c
Long-service benefits 5d 4 4
4 4
5.D. LONG-SERVICE BENEFITS
(x € million)
2015 2014Opening balance 4 4
Benefits paid (0) (0)
Benefit expense for the year 0 0
Actuarial result (also expensed) for the year 0 0
Closing balance 4 4
121
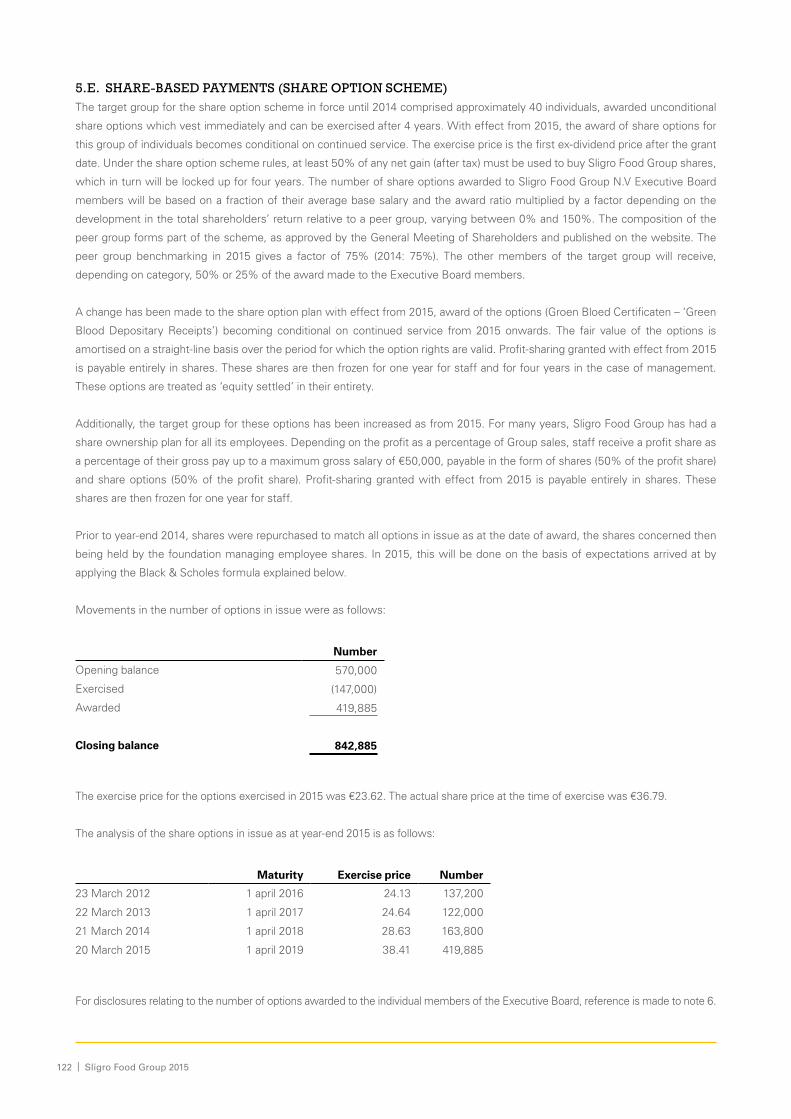
5.E. SHARE-BASED PAYMENTS (SHARE OPTION SCHEME)The target group for the share option scheme in force until 2014 comprised approximately 40 individuals, awarded unconditional
share options which vest immediately and can be exercised after 4 years. With effect from 2015, the award of share options for
this group of individuals becomes conditional on continued service. The exercise price is the first ex-dividend price after the grant
date. Under the share option scheme rules, at least 50% of any net gain (after tax) must be used to buy Sligro Food Group shares,
which in turn will be locked up for four years. The number of share options awarded to Sligro Food Group N.V Executive Board
members will be based on a fraction of their average base salary and the award ratio multiplied by a factor depending on the
development in the total shareholders’ return relative to a peer group, varying between 0% and 150%. The composition of the
peer group forms part of the scheme, as approved by the General Meeting of Shareholders and published on the website. The
peer group benchmarking in 2015 gives a factor of 75% (2014: 75%). The other members of the target group will receive,
depending on category, 50% or 25% of the award made to the Executive Board members.
A change has been made to the share option plan with effect from 2015, award of the options (Groen Bloed Certificaten – ‘Green
Blood Depositary Receipts’) becoming conditional on continued service from 2015 onwards. The fair value of the options is
amortised on a straight-line basis over the period for which the option rights are valid. Profit-sharing granted with effect from 2015
is payable entirely in shares. These shares are then frozen for one year for staff and for four years in the case of management.
These options are treated as ‘equity settled’ in their entirety.
Additionally, the target group for these options has been increased as from 2015. For many years, Sligro Food Group has had a
share ownership plan for all its employees. Depending on the profit as a percentage of Group sales, staff receive a profit share as
a percentage of their gross pay up to a maximum gross salary of €50,000, payable in the form of shares (50% of the profit share)
and share options (50% of the profit share). Profit-sharing granted with effect from 2015 is payable entirely in shares. These
shares are then frozen for one year for staff.
Prior to year-end 2014, shares were repurchased to match all options in issue as at the date of award, the shares concerned then
being held by the foundation managing employee shares. In 2015, this will be done on the basis of expectations arrived at by
applying the Black & Scholes formula explained below.
Movements in the number of options in issue were as follows:
Number
Opening balance 570,000
Exercised (147,000)
Awarded 419,885
Closing balance 842,885
The exercise price for the options exercised in 2015 was €23.62. The actual share price at the time of exercise was €36.79.
The analysis of the share options in issue as at year-end 2015 is as follows:
Maturity Exercise price Number
23 March 2012 1 april 2016 24.13 137,200
22 March 2013 1 april 2017 24.64 122,000
21 March 2014 1 april 2018 28.63 163,800
20 March 2015 1 april 2019 38.41 419,885
For disclosures relating to the number of options awarded to the individual members of the Executive Board, reference is made to note 6.
122 | Sligro Food Group 2015

The costs connected with this scheme have been calculated by independent experts, using the Black & Scholes Model and, for the
award made in March 2015, amount to €1.8 million (2014: €0.4 million) over the entire vesting period of 4 years. The allocation for
2015 amounts to €0.3 million.
The calculations are based on the following assumptions:
• Risk-free interest rate: 0.17% (2014: 0.65%).
• Volatility: 19%, based on a 4-year historical average (2014: 18%).
• Dividend yield: 2.9% (2014: 4.0%).
• Vesting period: 4 years (2014: no change).
6. Remuneration of Executive Board and Supervisory Board
The remuneration charged to the profit and loss account for the company’s Executive Directors in 2015 amounted to €2,366
thousands (2014: €1,892). The remuneration can be analysed as follows:
(x € 1,000)
K.M. SlippensR.W.A.J. van der Sluijs 1)
H.L. van Rozendaal 2)
W.J.P Strijbosch
Total
2015 2014 2015 2015 2014 2015 2014 2015 2014Fixed salary 438 434 257 117 377 380 377 1,192 1,188
Short-term bonus 145 50 85 - 44 126 44 356 138
Long-term bonus 145 50 85 - 44 126 44 356 138
Pension contribution and compensation 103 98 45 38 118 89 85 275 301
Value of options 33 24 33 33 24 33 24 132 72
Voluntary social security contributions 11 10 4 1 9 9 9 25 28
Statutory social security contributions 9 9 9 3 9 9 9 30 27
Total 884 675 518 192 625 772 592 2,366 1,892
1) Refers to the whole of 2015.2) Refers to the period January-April 2015.
The short-term and long-term bonuses are based on performance in the year in question and are paid in the following year.
These bonuses are 50% (2014: 50%) determined by the extent to which the budgeted profit target is achieved. If less than
90% of the target is reached, the bonus is nil, whereas achieving the target will lead to a short-term bonus of 15% of the
fixed salary (2014: 15%). If the target is exceeded, the bonus is increased in line with the percentage outperformance. For
2015, the other 50% depends on the achievement of the next phase of the CSR agenda, the introduction of Supply Chain
Finance, the rollout of EMTÉ 3.0 ‘The Tastiest Supermarket’ and the achievement of the ‘Kicken op Kosten’ cost-saving
targets. The long-term bonus is equal to the short-term bonus but has to be used to purchase Sligro Food Group shares that
then have to be held for at least four years. The 2015 bonuses were calculated at 110% of the target level (2014: 38%).
The value of the options concerns the number of options awarded in the year multiplied by the value of each option based on
the formula stated in note 5.e. In relation to share and share option transactions, the acquirers are bound by insider trading
rules. Additionally, transactions in shares are only allowed in the two weeks following publication of the results for the year,
the interim results and the shareholders’ meeting and on condition that there is no suggestion of inside information.
123

Voluntary social security contributions includes incapacity benefit plan insurance premiums. The members of the Executive
Board are also able to claim expenses and a mileage allowance for using their own cars in connection with the business.
Since these benefits serve to cover actual costs incurred and are not considered to form part of the remuneration as such,
they have not been included in the above totals.
The annual remuneration for the chairman of the Supervisory Board, A. Nühn, was €48 thousands (2014: €40) and that of
the other members of the Supervisory Board €34 thousands (2014: €32). The remuneration for the newly appointed
Supervisory Board member in 2015 was €26 thousands. Members of the Supervisory Board also received attendance fees
totalling €35 thousands (2014: nil). The remuneration is not performance-related. The total remuneration amounted to €211
thousands (2014: €136). No options have been awarded to the Supervisory Board, nor have any loans, advances or
guarantees been granted to either the Executive Board or the Supervisory Board.
Movements in share and option ownership were as follows:
Equities Exercise priceK.M.
SlippensR.W.A.J.
van der SluijsW.J.P
Strijbosch
Opening balance 92,708 1,484 5,304
Purchase 3,374 927 1,307
Sale
Closing balance 96,082 2,411 6,611
Options
Opening balance 38,000 14,100 28,200
Exercised 23,62 (9,800) (2,450)
Awarded 38,41 7,700 7,700 7,700
Closing balance 35,900 19,350 35,900
The actual share price at the time of exercise in 2015 was €36.79.
The number of options in issue as at year-end can be analysed as follows:
maturing on 1 April 2016 24.13 9,800 2,450 9,800
maturing on 1 April 2017 24.64 8,000 4,000 8,000
maturing on 1 April 2018 28.63 10,400 5,200 10,400
maturing on 1 April 2019 38.41 7,700 7,700 7,700
Closing balance 35,900 19,350 35,900
None of the members of the Supervisory Board owns any shares in the company or options to acquire the company’s shares
(2014: no change).
7. Audit fees
The fee for auditing the financial statements has been included in the general administrative expenses and in 2015 amounted to
€280 thousands (2014: €220). The 2015 fees include an amount of €30 thousands in respect of additional costs relating to the
audit of the preceding financial year. Other activities performed by the external auditors mainly concern other audit activities,
including scrutiny of customer-related contracts, for which fees charged in 2015 by the auditors amounted to €45 thousands
(2014: €33). The auditors are not engaged to perform consultancy work.
124 | Sligro Food Group 2015

8. Finance income and expense
(x € million)
2015 2014Finance income from loans granted to customers and late payment credit charges received from customers, plus interest on tax paid in advance 0 1
Finance expense for finance-related obligations (4) (5)
(4) (4)
9. Income taxes
9.A.1. TAX (CORPORATE INCOME TAX)A ‘Horizontal Monitoring Covenant’ was signed with the Dutch Tax and Customs Administration in 2014. A covenant of this
kind lays down agreements reached between the tax authorities and the company and reduces the chance of ‘surprises’.
The Dutch tax system recognises a difference between the reported profit and taxable profit arising from differences
between the carrying amount and tax base of intangible assets, property, inventories, receivables and provisions.
The tax charge in the profit and loss account can be analysed as follows:
(x € million)
2015 2014Tax for the year 25 20
Prior-year adjustments 2 (1)
Tax liability for the year 27 19
Taxes accounted for directly in recognised income
Movement in cash flow hedge of long-term loan (0) 0
Actuarial gains and losses on defined-benefit plans 1
(0) 1
Movement in deferred tax liabilities (3) (3)
Tax shown in the profit and loss account 24 17
9.A.2. EFFECTIVE TAX BURDENThe effective tax burden can be analysed as follows:
(x € million)
2015 2014Profit before tax 105 86
Tax burden at the standard rate of 25.0% 26 21
Prior-year adjustments 2 (1)
Other, including tax facilities and tax-exempt income, including tax-free results of associates, capital expenditure allowances and innovation allowances
(4) (3)
Effective tax burden 22.8% (2014: 20.2%) 24 17
125
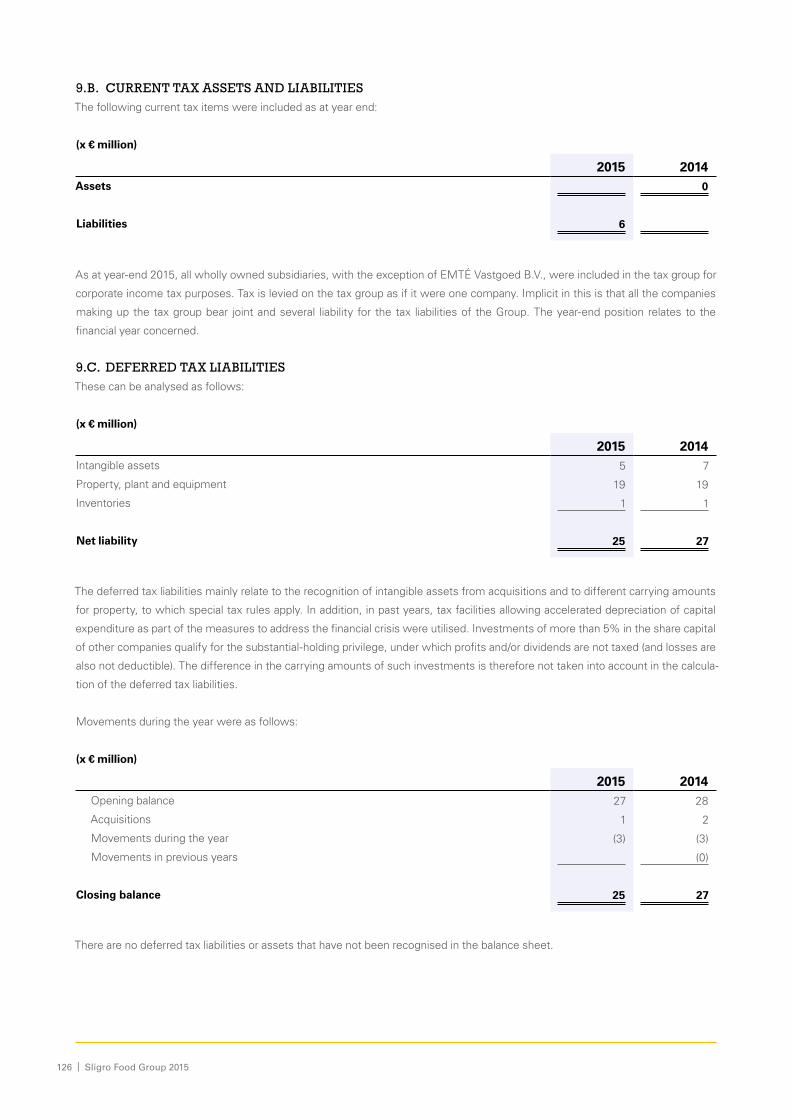
9.B. CURRENT TAX ASSETS AND LIABILITIESThe following current tax items were included as at year end:
(x € million)
2015 2014Assets 0
Liabilities 6
As at year-end 2015, all wholly owned subsidiaries, with the exception of EMTÉ Vastgoed B.V., were included in the tax group for
corporate income tax purposes. Tax is levied on the tax group as if it were one company. Implicit in this is that all the companies
making up the tax group bear joint and several liability for the tax liabilities of the Group. The year-end position relates to the
financial year concerned.
9.C. DEFERRED TAX LIABILITIESThese can be analysed as follows:
(x € million)
2015 2014Intangible assets 5 7
Property, plant and equipment 19 19
Inventories 1 1
Net liability 25 27
The deferred tax liabilities mainly relate to the recognition of intangible assets from acquisitions and to different carrying amounts
for property, to which special tax rules apply. In addition, in past years, tax facilities allowing accelerated depreciation of capital
expenditure as part of the measures to address the financial crisis were utilised. Investments of more than 5% in the share capital
of other companies qualify for the substantial-holding privilege, under which profits and/or dividends are not taxed (and losses are
also not deductible). The difference in the carrying amounts of such investments is therefore not taken into account in the calcula-
tion of the deferred tax liabilities.
Movements during the year were as follows:
(x € million)
2015 2014Opening balance 27 28
Acquisitions 1 2
Movements during the year (3) (3)
Movements in previous years (0)
Closing balance 25 27
There are no deferred tax liabilities or assets that have not been recognised in the balance sheet.
126 | Sligro Food Group 2015
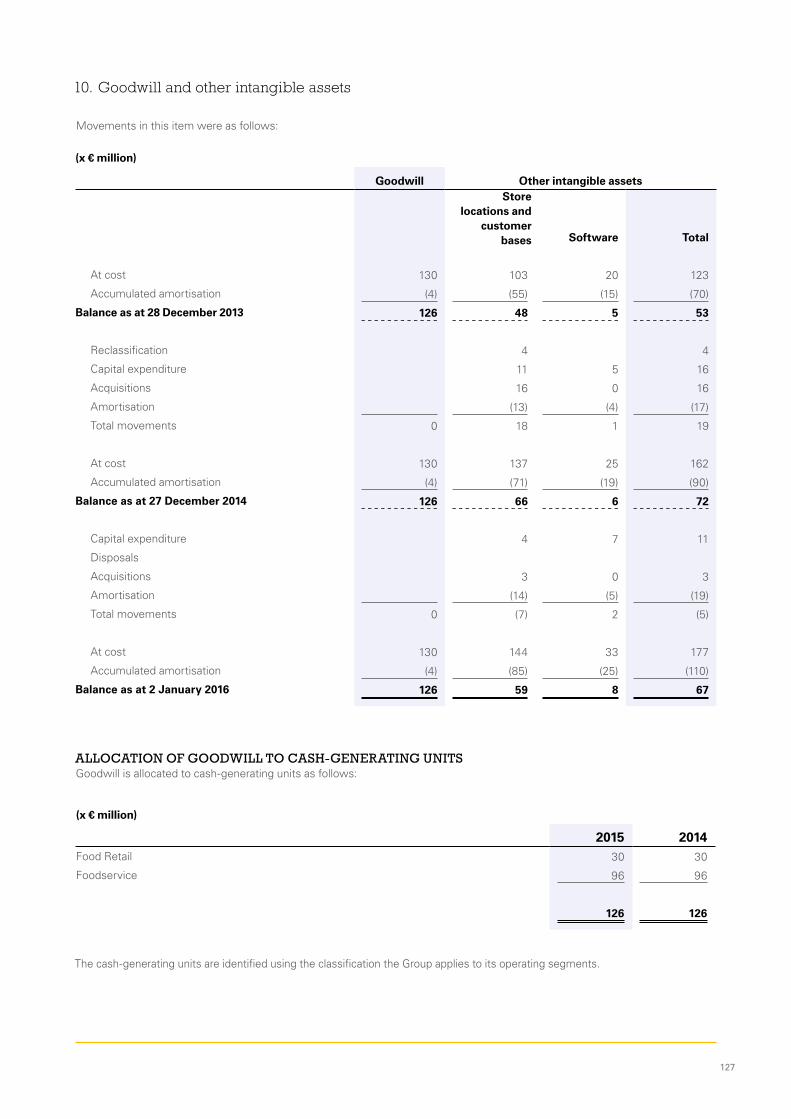
10. Goodwill and other intangible assets
Movements in this item were as follows:
(x € million)
Goodwill Other intangible assetsStore
locations and customer
bases Software Total
At cost 130 103 20 123
Accumulated amortisation (4) (55) (15) (70)
Balance as at 28 December 2013 126 48 5 53
Reclassification 4 4
Capital expenditure 11 5 16
Acquisitions 16 0 16
Amortisation (13) (4) (17)
Total movements 0 18 1 19
At cost 130 137 25 162
Accumulated amortisation (4) (71) (19) (90)
Balance as at 27 December 2014 126 66 6 72
Capital expenditure 4 7 11
Disposals
Acquisitions 3 0 3
Amortisation (14) (5) (19)
Total movements 0 (7) 2 (5)
At cost 130 144 33 177
Accumulated amortisation (4) (85) (25) (110)
Balance as at 2 January 2016 126 59 8 67
ALLOCATION OF GOODWILL TO CASH-GENERATING UNITSGoodwill is allocated to cash-generating units as follows:
(x € million)
2015 2014Food Retail 30 30
Foodservice 96 96
126 126
The cash-generating units are identified using the classification the Group applies to its operating segments.
127

The recoverable amounts of the Foodservice and Food Retail
cash-generating units are based on a calculation of the value
in use arrived at by taking the net present value of the
estimated future cash flows that will be generated by the
continued use of these cash- generating units. Based on this
calculation, it has been concluded that the recoverable
amount of both the Foodservice and the Food Retail
cash-generating units is considerably higher than the carry-
ing amount and that therefore no impairment loss needs to
be recognised (2014: no change).
IMPORTANT ASSUMPTIONS USED IN THE ESTIMATES OF THE NET PRESENT VALUE OF THE CASH FLOWSThe basis is the average operating profit before amortisation
(EBITA) in the preceding year and the budget for the current
year, the reasonableness of the assumption being tested
against the operating profits in earlier years. The main
assumptions used in calculating the recoverable amount are
the discount rate, the terminal growth rate and the rate of
growth in EBITA, which are as follows:
DISCOUNT RATE (9%)The discount rate before tax used for the Foodservice and
Food Retail activities has been derived from the weighted
average cost of capital (WACC) as used by financial analysts,
adjusted to reflect a normalised capital structure.
TERMINAL GROWTH RATE (1%)For the Foodservice and Food Retail activities, the net
present value model is based on estimated cash flows over a
period of five years. The terminal growth rate is derived from
the nominal GDP growth rate in the Netherlands.
ESTIMATED EBITA GROWTH RATE (1%)The estimated growth in EBITA is given by the compound
annual growth over the first five years of the plans used for
impairment testing and also takes account of past experience.
SENSITIVITY ANALYSISA sensitivity analysis has been performed on the
assumptions used to estimate the net present value of the
cash flows. If the discount rate is increased by 2%-points or
the terminal growth rate is reduced by 2%-points, there is
still ample room between the net present value and the
carrying amount.
128 | Sligro Food Group 2015
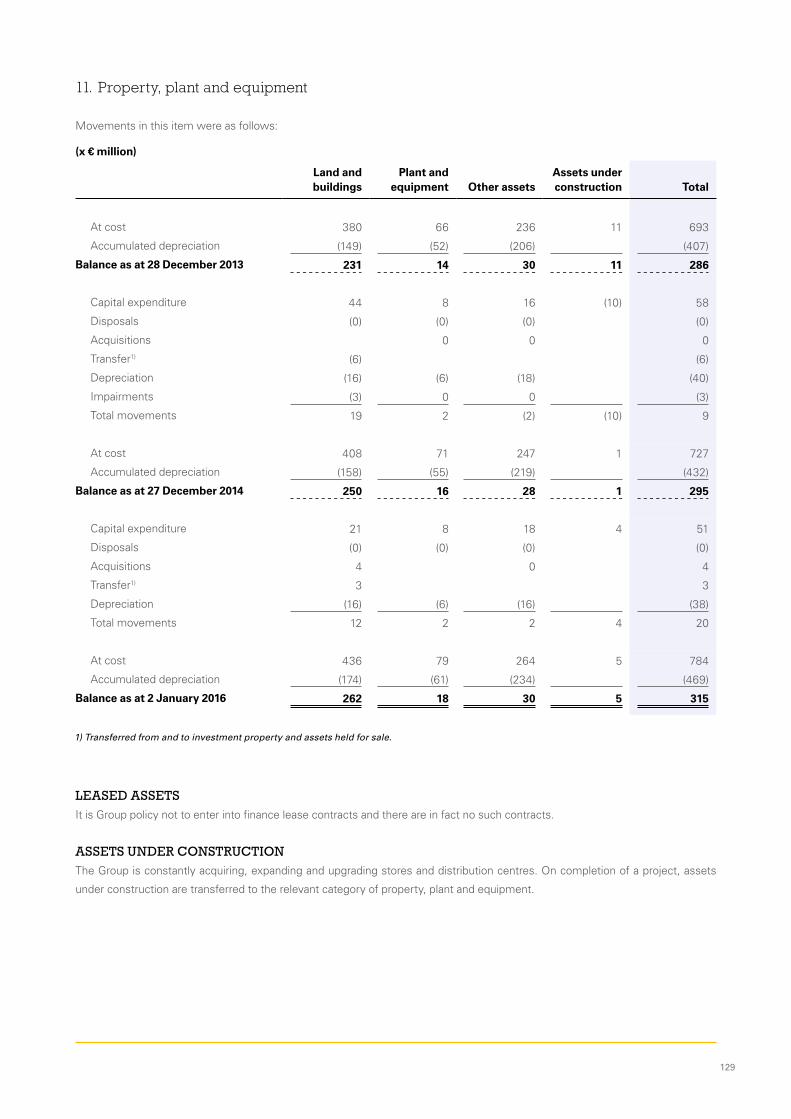
11. Property, plant and equipment
Movements in this item were as follows:
(x € million)
Land and buildings
Plant and equipment Other assets
Assets under construction Total
At cost 380 66 236 11 693
Accumulated depreciation (149) (52) (206) (407)
Balance as at 28 December 2013 231 14 30 11 286
Capital expenditure 44 8 16 (10) 58
Disposals (0) (0) (0) (0)
Acquisitions 0 0 0
Transfer1) (6) (6)
Depreciation (16) (6) (18) (40)
Impairments (3) 0 0 (3)
Total movements 19 2 (2) (10) 9
At cost 408 71 247 1 727
Accumulated depreciation (158) (55) (219) (432)
Balance as at 27 December 2014 250 16 28 1 295
Capital expenditure 21 8 18 4 51
Disposals (0) (0) (0) (0)
Acquisitions 4 0 4
Transfer1) 3 3
Depreciation (16) (6) (16) (38)
Total movements 12 2 2 4 20
At cost 436 79 264 5 784
Accumulated depreciation (174) (61) (234) (469)
Balance as at 2 January 2016 262 18 30 5 315
LEASED ASSETSIt is Group policy not to enter into finance lease contracts and there are in fact no such contracts.
ASSETS UNDER CONSTRUCTIONThe Group is constantly acquiring, expanding and upgrading stores and distribution centres. On completion of a project, assets
under construction are transferred to the relevant category of property, plant and equipment.
1) Transferred from and to investment property and assets held for sale.
129

WHOLESALE OUTLETS, RETAIL STORES AND DISTRIBUTION CENTRESLand and buildings can be analysed as follows:
(x € million)
2015 2014Land 75 68
Supermarket store premises 23 22
Buildings 107 102
Subtotal of properties owned 205 192
Land occupied by leased premises 3 3
Leasehold improvements 54 55
262 250
The area of land totals 855,000 m2 (2014: 823,000 m2), of which 285,000 m2 (2014: 285,000 m2) is accounted for by the central
complex.
Company-owned premises can be specified as follows:
Number x 1,000 m2 x € million
2015 2014 2015 2014 2015 2014Cash-and-carry wholesale outlets 26 24 169 154 83 71
Customer distribution centres 5 5 82 81 34 35
Production companies 3 3 15 17 10 11
Central complex 1 1 136 136 42 45
Supermarkets operated by the Group 20 18 35 25 32 30
Other 4 - 10 - 4 -
59 51 447 413 205 192
12. Investment property
(x € million)
2015 2014Opening balance 15 13
Capital expenditure 2
Transferred from property, plant and equipment 2 2
Fair value adjustments (0) 0
Closing balance 19 15
The investment property includes 8 (2014: 7) supermarket premises leased to franchisees on operating leases. The gross floor
area amounted to 11,869 m2 (2014: 9,510 m2). The rental income is disclosed in note 4. The future minimum lease payments
under non-cancellable leases are disclosed in note 26. The direct costs associated with the investment property amounted to €13
thousands (2014: €28). The leases are on normal terms. External appraisals were conducted in 2015 for validation purposes.
130 | Sligro Food Group 2015

13. Investments in associates and other financial assets
(x € million)
Note 2015 2014Associates 48 45
Other financial assets
Loans to associates 0
Loans to customers 7 7
Fair value of derivatives 22 18 2
25 9
ASSOCIATESThe investments in associates are as follows:
(in %)
2015 2014Foodservice
O. Smeding & Zn. B.V., Sint Annaparochie 49 49
M. Ruig & Zn. B.V., Oostzaan 25 25
G. Verhoeven Bakkerij B.V., Veldhoven 25 25
Slagerij Kaldenberg B.V., Herwijnen 33 33
Vemaro B.V., Venlo 40 40
Coöperatieve Inkoopvereniging Superunie B.A., Beesd
Food Retail
Spar Holding B.V., Waalwijk 45 45
Super Direct Retail B.V.1), Zaltbommel 37 37
1) In insolvency.
The carrying amounts of the investments in associates derive from the most recently published figures. All the investments, with the
exception of that in Super Direct Retail B.V., are of a strategic nature. Voting rights are equal to the percentage interest in each case.
Movements in investments in associates were as follows:
(x € million)
2015 2014Opening balance 45 43
Investments and disposals (0) 5
Share in results 6 1
Dividend (3) (4)
Closing balance 48 45
131

The summarised financial information for the associates, on the basis of a 100% interest as shown by their most recent financial
statements (i.e. 2014 or 2013) , is as follows:
(x € million) Spar Holding B.V. Other associates
2015 2014 2015 2014Assets 77 75 68 65
Liabilities 49 40 55 57
Shareholders' equity 28 35 13 8
Net sales 439 454 924 827
Net earnings 1 6 5 0
OTHER FINANCIAL ASSETS The loans to customers have maturities averaging several years and are usually at market interest rates, although some are interest-
free.
14. Inventories
Inventories were made up as follows:
(x € million)
2015 2014Central distribution centre 64 64
Stores and regional distribution centres 146 139
Packaging deposits 8 8
Stock in transit 2 2
220 213
In the carrying amount of inventories a provision for obsolescence is included for an amount of €6 million (2014: €7).
15. Trade and other receivables
(x € million)
2015 2014Trade receivables 88 89
Suppliers 56 57
144 146
Receivables from suppliers represent bonuses, promotional allowances and credit notes not yet settled. The carrying amount of the
trade receivables has been written down to fair value by an amount of €4 million (2014: €4).
The movements in this item were as follows:
(x € million)
2015 2014Opening balance 4 3
Accounts written off (1) (1)
Charged to the result 1 2
Closing balance 4 4
132 | Sligro Food Group 2015

16. Other current assets
(x € million)
2015 2014Other amounts receivable and prepaid expenses 9 9
The other amounts receivable and prepaid expenses include staff loans and receivables in respect of investment projects.
17. Assets held for sale
(x € million)
2015 2014Property 4 8
This concerns 7 (2014: 10) real estate projects, mainly in the food retail segment. The premises concerned are for sale with
immediate possession. Also recognised as assets held for sale are premises which have been on the market for longer than one
year. Despite this, the intention is still to sell these premises in the short term. Three properties were transferred to property, plant
and equipment during the year.
(x € million)
2015 2014Opening balance 8 6
Transfer (4) 5
Impairments (0) (0)
Disposals (3)
Closing balance 4 8
18. Cash and cash equivalents
(x € million)
2015 2014Cash balances and cash in transfer 17 18
Freely available bank balances 72 51
Time deposits 5 5
94 74
The maturity of the time deposit is 30 September 2016 and is associated with guarantees provided by a financial institution.
133

19. Shareholders’ equity
PAID-UP AND CALLED CAPITALThe authorised capital amounts to €12,000,000 divided into 200,000,000 shares with a nominal value of 6 euro cents each.
The issued and paid-up capital as at 2 January 2016 amounted to €2,655,300.90 (27 December 2014: €2,655,300.90).
Movements in the number of shares in issue were as follows:
(x 1,000)
2015 2014Opening balance 44,255 44,255
Movements 0 0
Closing balance 44,255 44,255
Repurchased (465) (570)
All shareholders are entitled to dividends as declared from time to time and have the right to cast one vote per share in shareholders’
meetings. The overall changes in equity are analysed in greater detail on page 108.
SHARE PREMIUMThis includes amounts paid in on the shares over and above the nominal value.
OTHER RESERVESAn amount of €8 million of the other reserves (2014: €5) is not freely distributable.
REVALUATION RESERVEWhere recognition of investment property at fair value leads to a positive adjustment of the carrying amount, a revaluation reserve
is formed of the same amount, after allowing for deferred tax liabilities. This reserve is not freely distributable.
HEDGING RESERVEThis comprises the effective part of the cumulative net movement in the fair value of cash flow hedges of long-term loans. This
reserve is not freely distributable.
TREASURY SHARES RESERVEThis represents the purchase price of the 465,000 of the company’s own shares repurchased in connection with the share option
programme.
134 | Sligro Food Group 2015
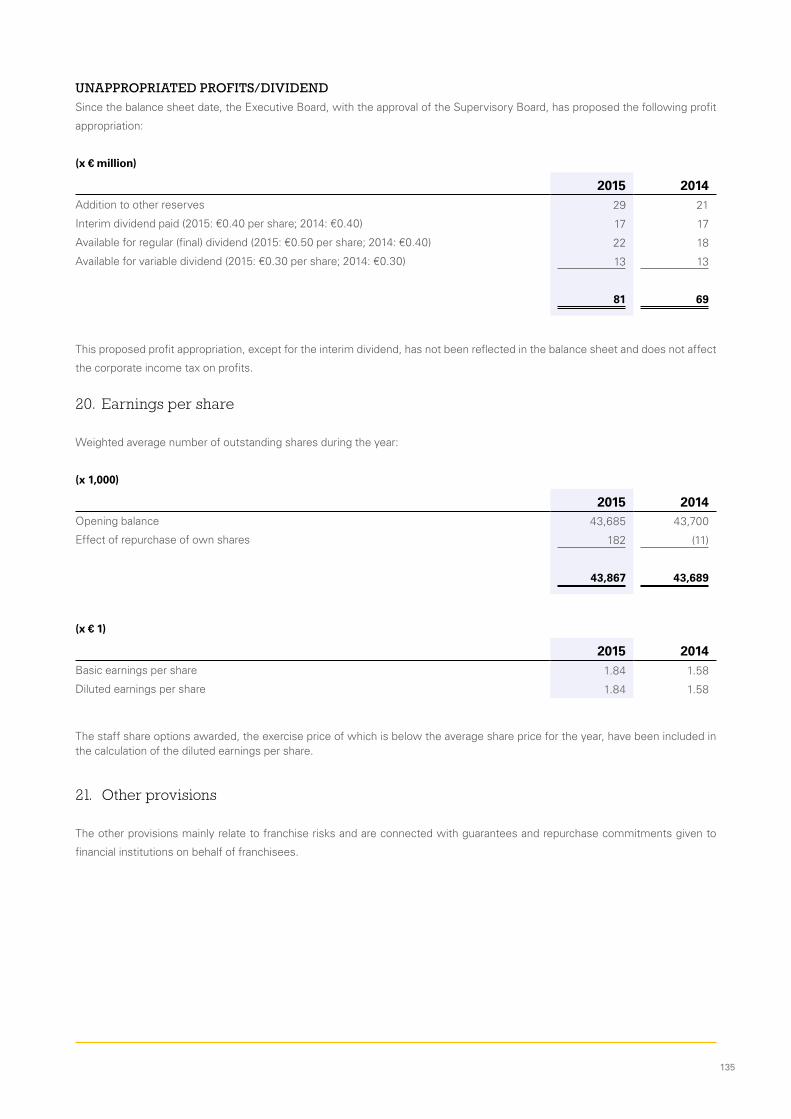
UNAPPROPRIATED PROFITS/DIVIDENDSince the balance sheet date, the Executive Board, with the approval of the Supervisory Board, has proposed the following profit
appropriation:
(x € million)
2015 2014Addition to other reserves 29 21
Interim dividend paid (2015: €0.40 per share; 2014: €0.40) 17 17
Available for regular (final) dividend (2015: €0.50 per share; 2014: €0.40) 22 18
Available for variable dividend (2015: €0.30 per share; 2014: €0.30) 13 13
81 69
This proposed profit appropriation, except for the interim dividend, has not been reflected in the balance sheet and does not affect
the corporate income tax on profits.
20. Earnings per share
Weighted average number of outstanding shares during the year:
(x 1,000)
2015 2014Opening balance 43,685 43,700
Effect of repurchase of own shares 182 (11)
43,867 43,689
(x € 1)
2015 2014Basic earnings per share 1.84 1.58
Diluted earnings per share 1.84 1.58
The staff share options awarded, the exercise price of which is below the average share price for the year, have been included in the calculation of the diluted earnings per share.
21. Other provisions
The other provisions mainly relate to franchise risks and are connected with guarantees and repurchase commitments given to
financial institutions on behalf of franchisees.
135
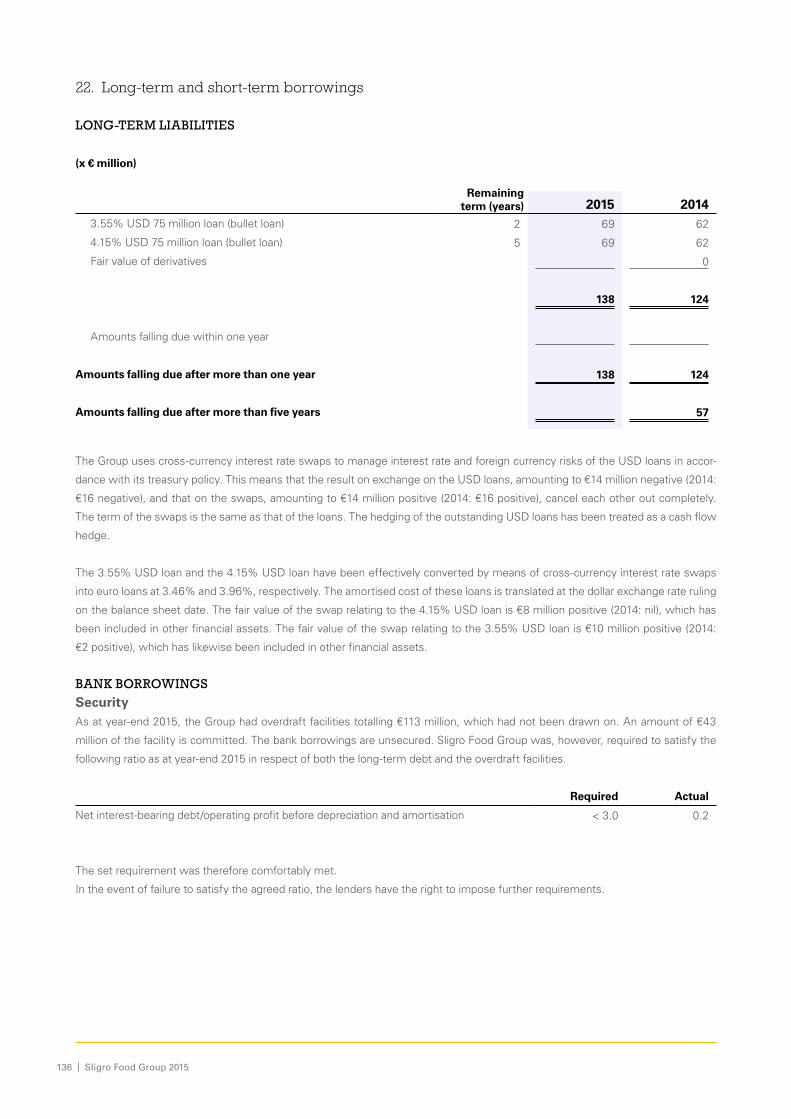
22. Long-term and short-term borrowings
LONG-TERM LIABILITIES
(x € million)
Remaining term (years) 20142015
3.55% USD 75 million loan (bullet loan) 2 69 62
4.15% USD 75 million loan (bullet loan) 5 69 62
Fair value of derivatives 0
138 124
Amounts falling due within one year
Amounts falling due after more than one year 138 124
Amounts falling due after more than five years 57
The Group uses cross-currency interest rate swaps to manage interest rate and foreign currency risks of the USD loans in accor-
dance with its treasury policy. This means that the result on exchange on the USD loans, amounting to €14 million negative (2014:
€16 negative), and that on the swaps, amounting to €14 million positive (2014: €16 positive), cancel each other out completely.
The term of the swaps is the same as that of the loans. The hedging of the outstanding USD loans has been treated as a cash flow
hedge.
The 3.55% USD loan and the 4.15% USD loan have been effectively converted by means of cross-currency interest rate swaps
into euro loans at 3.46% and 3.96%, respectively. The amortised cost of these loans is translated at the dollar exchange rate ruling
on the balance sheet date. The fair value of the swap relating to the 4.15% USD loan is €8 million positive (2014: nil), which has
been included in other financial assets. The fair value of the swap relating to the 3.55% USD loan is €10 million positive (2014:
€2 positive), which has likewise been included in other financial assets.
BANK BORROWINGS SecurityAs at year-end 2015, the Group had overdraft facilities totalling €113 million, which had not been drawn on. An amount of €43
million of the facility is committed. The bank borrowings are unsecured. Sligro Food Group was, however, required to satisfy the
following ratio as at year-end 2015 in respect of both the long-term debt and the overdraft facilities.
Required Actual
Net interest-bearing debt/operating profit before depreciation and amortisation < 3.0 0.2
The set requirement was therefore comfortably met.
In the event of failure to satisfy the agreed ratio, the lenders have the right to impose further requirements.
136 | Sligro Food Group 2015

23. Other taxes and social security contributions
(x € million)
2015 2014VAT, excise duty and waste management contribution 19 21
Payroll tax and social security contributions 7 12
Pension contributions 0 0
26 33
24. Other liabilities, accruals and deferred income
(x € million)
2015 2014Employees 27 23
Customer bonuses 9 11
Packaging deposits 6 5
Loyalty scheme liabilities 6 4
Other 11 11
59 54
The employees item includes liabilities in respect of profit-sharing, accrued paid annual leave plus holiday allowances.
25. Risk management
The Group is exposed to credit, liquidity and market risks (interest rate, exchange rate and other risks) in its ordinary operations.
There have been no changes in the Group’s risk policy or in the management of these risks compared with the preceding year.
CREDIT RISKThe Group is exposed to a variety of credit risks connected with its operations. In the case of the food retail activities, the
supermarkets sell exclusively for cash or using guaranteed payment methods and so there is essentially no credit risk. The largest
credit risk for the Group is concentrated among supermarket franchisees in that, for some of the Group’s customers, in addition to
the usual suppliers’ credit terms, there is a credit risk associated with the financing of independent store operators. This can take
the form of direct loans, included in financial assets, or guarantees/repurchase commitments for credit lines provided by financial
institutions. The risks are minimised by assessing the profitability of individual stores and their independent operators. A store’s
assets also provide security. Each project is carefully considered in ‘store network consultation’ project meetings and the
outstanding receivables are monitored daily. Periodic assessments of the viability of stores are also performed. As at year-end
2015, the receivables from food retail customers included in other financial assets totalled approximately €3 million (2014: €4) and
in trade receivables totalled approximately €8 million (2014: €9).
137

The aging of these trade receivables is as follows:
(x € million)
< 1 month 1-3 months 3-12 months > 12 months Total
2015 8 0 0 0 8
2014 9 0 0 0 9
In the case of the foodservice activities, some supplies are made without guaranteed advance payment. However, payment for
goods and services is largely by direct debit (Dutch payment product name: Bedrijven Euro-incasso) and customers only initiate
payments to a limited extent. Although direct debit does not guarantee payment, should a customer have insufficient funds,
experience has shown that, owing to the diversification provided by a large customer base and the short payment period allowed,
the credit risk in relation to the volume of foodservice supplies made on credit is fairly minor. Despite the financial difficulties of
some of our Foodservice customers, the risks and the losses remained relatively small although there has been an increase. As at
year-end 2015, the receivables from food retail customers included in other financial assets totalled approximately €4 million
(2014: €3) and in trade receivables totalled approximately €80 million (2014: €80).
The aging of these trade receivables is as follows:
(x € million)
< 1 month 1-3 months 3-12 months > 12 months Total
2015 80 0 0 80
2014 80 0 0 80
As at year-end 2015, the Group had receivables from suppliers totalling €56 million (2014: €57 million), mainly relating to agreed
annual purchase volumes, which are paid after the end of the year. If a supplier should default on these payments, the Group
would generally be able to recover the amount receivable by setting it against accounts payable to the supplier concerned.
LIQUIDITY RISKThe Group aims to hold sufficient liquid funds (including in the form of commitments by financial institutions) to meet its financial
liabilities at any time. This is achieved in part by financing operations to a relatively large extent by medium and long-term credit
lines with different repayment schedules. Moreover (partly in view of the changes in credit market conditions), the availability of
€43 million of the short-term facilities is legally enforceable.
Given below is an analysis of the financial liabilities, including estimated interest payments.
(x € million)
Carrying amount
Contractual cash flows < 1 year 1 - 5 years > 5 years
Non-current liabilities 1) 138 130 4 126
Current liabilities 298 298 298
436 428 302 126
1) Contractual cash flows are included at the swap rate on the maturity date of the liabilities.
138 | Sligro Food Group 2015

MARKET RISK (INTEREST RATE, EXCHANGE RATE AND OTHER MARKET RISKS)The risk of volatility in exchange rates and interest rates is
partly hedged by means of derivatives.
Interest rate riskNote 22 provides an analysis of the long-term financing and
associated interest rate terms.
Currency riskThe Group is exposed to an exchange rate risk on loans and
on goods purchases. This mainly concerns the US dollar. As
mentioned in the accounting policies under heading H2, the
exchange risk on the loans is entirely hedged. The Group also
hedges a proportion of its dollar purchase obligations by
means of forward currency contracts. The policy is to hedge
transactions where settlement will be more than two months
ahead and not to hedge transactions due for earlier settle-
ment. The annual dollar purchase volume is approximately
USD 26 million, with an average term of approximately two
months. Hedge accounting is not applied to forward currency
contracts for purchase obligations. The effect of exchange
rate movements is included in the cost of sales.
SENSITIVITY ANALYSESInterest ratesChanges in the interest rate have hardly any impact on the
Group’s results.
Exchange ratesThe effect of the US dollar exchange rate vis-à-vis the euro is
relatively minor since movements in the value of the euro
can be reflected fairly simply and rapidly in the selling prices.
Labour costs/energyDirectly attributable labour costs account for more than 50%
of total costs. The effect of a general increase of half a
percentage point in labour costs is estimated to reduce the
result before tax by approximately €1 million. Approximately
6% of the cost base is directly or indirectly dependent on
energy prices. The effect of a general increase in energy
prices by 5% is also approximately €1 million.
Capital managementThe Group attempts to make maximum use of its available
credit lines for funding purposes, provided the stipulated
ratio can be comfortably met. The Group does not have a
specific target return on capital employed. The aim is to
achieve average growth in net profit which at least keeps
pace with the target average rate of revenue growth. In 2015,
estimates of future growth potential were revised
downwards.
Fair valueThe carrying amount of financial instruments is almost the
same as the fair value. Financial instruments carried at fair
value are included in the category ‘level 2’, which means that
the valuation is based on amounts provided by a financial
institution, which are derived from market data and other
sources. The property investments are also measured at fair
value and are included in ‘level 3’ (own valuation method
based on knowledge available within the Group, as disclosed
under F in the accounting policies).
139

OTHER RISKS GeneralLike any other business, the Group faces the usual risks
associated with its commercial activities. Those risks which
affect the Group more particularly are considered in greater
detail below and comprehensive risk disclosures can be
found on pages 73 et seq.
The business cycle and competitionSince the Group’s activities are primarily concerned with the
basic human need for food, it is food products which account
for the bulk of the sales and demand for them is not particu-
larly cyclical, although there can be shifts of emphasis
between the Group’s two business lines of Foodservice and
Food retail. Moreover, in our markets we are seeing the
growth of online initiatives, new entrants to the market and
non-food retailers attempting to take a slice of the food
market. Although this puts pressure on certain segments of
our markets (niche markets), it also offers opportunities.
A process of consolidation is taking place in the markets in
which the Group sells and among the suppliers to those
markets, with direct customers, wholesale distributors and
supermarket chains supplied by the Group all becoming
bigger. There is evidence of the same trend among suppliers
to the Group. These and other factors mean that the Group
operates in highly competitive markets and is not always able
to pass on its cost increases to its customers in full. Cost
increases therefore largely have to be absorbed by efficiency
improvements in order to maintain profitability, let alone lift
profits.
In the food retail business in particular, periods of intensified
competition occur on a regular basis, generally known in the
industry as price wars. The effects are also felt in the
foodservice market, albeit usually to a lesser extent.
AcquisitionsThe Group’s plans for expansion include growth through
acquisitions as well as organic growth. In recent years, the
Group has aimed to make a relatively large acquisition every
one or two years. In 2015, CaterTech was acquired, adding
1% to the Group’s annual sales. Although we have a great
deal of experience with takeovers and the various associated
financial, integration and other risks, there is still, despite all
the proper due diligence procedures beforehand, a greater
level of risk associated with growth through acquisitions than
is the case with organic growth. In principle we try to include
newly acquired companies in the information system
operated by the Group as quickly as possible to bring them
rapidly under central management and control. As at year-
end 2015, this was true for all activities.
Information systemsThe Group is highly dependent on its internally developed IT
systems, which are maintained and upgraded by a team of
experienced specialists. Comprehensive measures are in
place to safeguard the continuity of data processing. Further
progress on this front was recorded in 2015. The high level of
integration of the Group’s activities means that a systems
failure would bring a large part of the business to a standstill
within a few days.
Food safetySince the Group is primarily engaged in the food supply and
processing chain, food safety is crucial. The Group observes
strict food safety practices as regards both food processing
and the products themselves throughout the various links in
the organisation.
Compliance with external quality standards is a given. We
have detailed procedures in place to minimise the consequen-
ces in case of threats to public health. Failure to abide by
these principles could have serious implications for the
Group’s market position.
AuthoritiesPublic authorities on occasion take drastic actions, which can
have a major impact on operations. Such official measures
can be unpredictable, unjustified or both.
140 | Sligro Food Group 2015

26. Operating lease and rental obligations
Contracts under which the Group is lessee:
(x € million)
2015 2014Operating lease obligations
< 1 year 0 0
1-5 years 0 0
> 5 years
Expense in the year 1 0
Rental obligations for premises occupied by the Group
< 1 year 34 33
1-5 years 106 100
6-10 years 72 62
> 10 years 18 21
Expense in the year 34 34
Present value 215 205
Rental obligations on behalf of customers
< 1 year 4 4
1-5 years 8 9
> 5 years 3 3
Present value 13 15
The operating lease obligations relate mainly to ICT systems. The rental obligations for premises occupied by the Group concern
111 premises (2014: 109) The rental obligations on behalf of customers are matched by leases entered into by the customers for
almost exactly the same amounts. There is a broad variety as regards rental obligations, frequently including the option for the
tenant to renew the lease. The present value stated above is the face value of the rents concerned plus expected annual increases
calculated using a discount rate of two percentage points above the risk-free interest rate. During 2015 the risk-free rate decreased,
which resulted in an increase of the present value.
Contracts under which the Group is lessor:
(x € million)
2015 2014Investment property
< 1 year 2 1
1-5 years 3 1
> 5 years 2 1
Other property
< 1 year 1 2
1-5 years 3 4
> 5 years
The investment property relates to property owned by the Group that is leased to franchisees of the Group. Other property
includes items relating to the partial subletting of property used by the Group. This may relate to property owned by the Group and
property which the Group rents.
141

27. Investment obligations
As at year-end 2015, there were investment obligations
totalling approximately €15 million (2014: €12).
28. Contingent liabilities
Repurchase commitmentsRepurchase commitments have been given to financial
institutions in respect of credit lines granted to retail
customers involving a total exposure of €3 million (2014: €2).
Store alterations, inventories and shop fittings funded by the
loans and advances have been furnished as security for
these repurchase commitments and so they will not normally
give rise to any material financial losses. Where the need
nevertheless arises, provisions are made to cover possible
losses.
ClaimsClaims have been filed against Sligro Food Group and/or
Group companies. These claims are being contested, despite
none of them being of material significance.
29. Management estimates and assessments
GoodwillNote 10 contains information about the measurement of
goodwill and the impairment tests that are performed.
Credit, liquidity and other market risksNote 25 contains information on these risks, together with a
sensitivity analysis.
Receivables from suppliersThis concerns an estimate of the payments expected from
suppliers as disclosed in note 15.
Property, plant and equipment, investment property and assets held for saleThe Group owns a relatively large amount of property used
by the Group itself, investment property which it leases to
customers and assets held for sale. As at year-end 2015,
these items, excluding capital expenditure on leased
premises, totalled approximately €228 million (2014: €215).
An assumption has been made of continuing use for the
existing purpose unless the assets concerned have been
classified as held for sale. Any changes in this assumption,
for example as a result of relocations, can lead to an
adjustment of the carrying amount down to a lower fair value
less costs to sell. It may also be found that the fair value less
costs to sell is higher than the carrying amount.
142 | Sligro Food Group 2015

30. Cash flow statement
The cash flow statement has been prepared using the direct method. The cash flow statement includes receipts and payments
rather than income and expenses. Acquisitions are accounted for in the cash flow statement at the purchase price net of cash and
cash equivalents. The debt-free amount and the purchase price of acquisitions and investments are disclosed in note 1. Receipts
from customers are sales including VAT and the movement in receivables from customers. Payments to the government include
both those for VAT and excise duties as well as payments of payroll deductions, social security contributions and pension
contributions. The corporate income tax paid is shown separately.
The following table shows the reconciliation of the cash generated from operations and the operating profit:
(x € million)
2015 2014EBIT 103 89
Depreciation and amortisation 57 57
Impairments (0) 3
EBITDA 160 149
Other operating income included in cash flow from investing activities 1 (4)
161 145
Changes in working capital and other movements:
Inventories (3) (20)
Trade and other receivables and other current assets 4 (7)
Current liabilities (1) 57
Provisions 0 0
Shareholders' equity 2 (5)
2 25
Net cash generated from operations 163 170
The item cash, cash equivalents and short-term bank borrowings can be reconciled with the balance sheet as follows:
(x € million)
2015 2014Cash and cash equivalents 94 74
Bank borrowings 0 0
94 74
143
31. Related-party disclosures
In the field of short-life perishables, the company operates in
partnership with and has investments in the fresh produce
suppliers listed in note 13. In 2015, this business represented
a combined purchase volume at market prices of €214 million
(2014: €194). As at year-end 2015, the amount owed to these
companies in connection with trading was €14 million (2014:
€15). In view of the nature of the liabilities, they have been
treated as ordinary trade payables.
For tobacco products, the Group has an alliance with a partner
in the form of its 40% stake in Vemaro B.V. Vemaro B.V. also
has a loan facility from the Group under which borrowing
amounted to nil (2014: €0). This loan is included in the other
financial assets. The Group also guarantees certain of
Vemaro’s receivables from certain customers. As at year-end
2015, the amount owed to Vemaro in connection with trading
was €6 million (2014: €8). In view of the nature of the account,
it has been included in trade payables.
The Group is a member of the Superunie purchase
cooperative, which looks after the procurement of the food
retail products. The purchase volume in 2015 amounted to
€954 million (2014: €945). As at year-end 2015, the amount
owed in connection with trading was €75 million (2014: €77).
In view of the nature of the liabilities, they have been treated
as trade payables.
The transactions and relations with Stichting Pensioenfonds
Sligro Food Group and the Executive and Supervisory Boards
are explained in notes 5 and 6.
In 2015, 105,000 Sligro Food Group shares were sold (2014:
15,000 purchased) at market price in transactions with Stich-
ting Werknemersaandelen Sligro Food Group.
In 2015, a Supply Chain Finance programme was established
and was rolled out in the closing quarter of the year. This
programme enables participating suppliers to discount their
invoices with a participating bank at an interest rate of 0.9%
points above 1-month Euribor. The trade payables item as at
year-end 2015 includes an amount of €7 million relating to
the participating suppliers. The method of preparation of the
cash flow statement remains unchanged compared with
preceding years. Sligro Food Group receives a (small)
compensation from this programme that is recognised in
other operating income.
144 | Sligro Food Group 2015

145

(x € million)
2015 2014 2013Share in profits of subsidiaries 81 69 68
Other gains and losses 0 0 0
Profit for the year 81 69 68
CompanyPROFIT AND LOSS ACCOUNTfor 2015
146 | Sligro Food Group 2015

(x € million)
ASSETS 02-01-2016 27-12-2014 28-12-2013Intangible assets 8 8 8
Financial assets 603 562 558
Total non-current assets 611 570 566
Receivables from group companies 5
Total current assets 5
Total assets 611 570 571
EQUITY AND LIABILITIES 02-01-2016 27-12-2014 28-12-2013Shareholders' equity
Paid-up and called capital 3 3 3
Share premium 31 31 31
Other reserves 479 459 458
Legal reserves 12 8 11
Unappropriated profit 81 69 68
606 570 571
Payables to group companies 5 0
Total current liabilities 5 0
Total equity and liabilities 611 570 571
CompanyBALANCE SHEETas at 2 January 2016 before profit appropriation
147

GeneralThe company financial statements have been prepared in accordance with Part 9, Book 2, of the Netherlands Civil Code, applying
the accounting policies defined in section D of the accounting policies for the consolidated financial statements, with carrying
amounts of investments in companies where the company has significant influence measured using the net asset value and
applying the accounting policies of the consolidated financial statements. In preparing the company profit and loss account, the
company has availed itself of the exemption pursuant to Section 402, Book 2, of the Netherlands Civil Code.
Assets
INTANGIBLE ASSETSGoodwill(x € million)
2015 2014Opening balance
Acquisition cost 10 10Accumulated amortisation (2) (2)
8 8Disposals
Closing balance 8 8
Acquisition cost 10 10Accumulated amortisation (2) (2)
Financial assets
(x € million)
2015 2014Investments 574 537Receivables from group companies 29 25
603 562
INVESTMENTSThis relates to the wholly-owned subsidiaries Sligro Food Group Nederland B.V. and Sligro Food Group International B.V.
Movements were as follows:
(x € million)
2015 2014Opening balance 537 533Result 81 69Investments 1Share-based payments 0 (1)Income and expense recognised directly in equity 2 (5)Change in own shares 1 (1)Dividend (48) (58)
Closing balance 574 537
NOTES to the company financial statements(amounts in millions of euros unless stated otherwise)
148 | Sligro Food Group 2015

RECEIVABLES FROM GROUP COMPANIESThis item includes two loans for a combined amount of €29 million (2014: €25). One loan is for €25 million (2014: €25), maturing
on 1 January 2023 and the other is for €4 million (2014: nil), maturing on 1 January 2021. These loans are redeemable in full on
maturity. Both loans bear interest at a rate of 1% per annum.
Equity and liabilities
SHAREHOLDERS’ EQUITYChanges in equity are presented in greater detail on page 108 and further information on shareholders’ equity is given in note 19
to the consolidated financial statements.
Reconciliation of the reserves in the company financial statements with those in the consolidated financial statements is as
follows:
(x € million)
2015 2014Consolidated
Other reserves 585 552
Hedging reserve (4) (6)
Treasury shares reserve (13) (14)
Revaluation reserve 4 4
572 536
Company
Other reserves 479 459
Unappropriated profit 81 69
Legal reserves 12 8
572 536
LEGAL RESERVESThis item comprises the legal reserve for investments in subsidiaries/associates and the revaluation reserve.
Movements were as follows:
(x € million)
2015 2014Opening balance 8 11
Movement during the year 4 (3)
Closing balance 12 8
Of the legal reserves of €12 million (2014: €8), an amount of €8 million (2014: €5) relates to the difference between the retained
profits calculated on the basis of the parent company’s accounting policies plus the movements accounted for directly in the
equity of the companies invested in (resulting from revaluations] and the part thereof that is distributable to the parent. The legal
reserves are calculated on an individual basis.
Contingent liabilitiesAs part of the Sligro Food Group N.V. tax group, the company is liable for the tax payable by the tax group as a whole.
149
The company has assumed joint and several liability for debts arising from the legal acts of its direct and indirect subsidiaries,
pursuant to Section 403, Book 2, of the Netherlands Civil Code, as stated on page 115.
Duly signed for publication,
Veghel, 29 January 2016
Supervisory Board:
A. Nühn, chairman
Th.A.J. Burmanje
J.H. Kamps
B.E. Karis
R.R. Latenstein van Voorst
Executive Board:
K.M. Slippens, chairman
R.W.A.J. van der Sluijs
W.J.P. Strijbosch
150 | Sligro Food Group 2015

151
Independent auditor’s report
To the General Meeting of Shareholders of Sligro Food Group N.V.
Report on the audit of the financial statements 2015
Our opinionWe have audited the financial statements 2015 of Sligro
Food Group N.V. (the Company), based in Veghel. The
financial statements include the consolidated financial
statements and the company financial statements.
In our opinion:
• The consolidated financial statements give a true and fair
view of the financial position of Sligro Food Group N.V. as
at 2 January 2016, and of its result and its cash flows for
2015 in accordance with International Financial Reporting
Standards as adopted by the European Union (EU-IFRS)
and with Part 9 of Book 2 of the Dutch Civil Code.
• The company financial statements give a true and fair
view of the financial position of Sligro Food Group N.V. as
at 2 January 2016, and of its result for 2015 in accordance
with Part 9 of Book 2 of the Dutch Civil Code.
What we have auditedThe consolidated financial statements comprise:
1. The consolidated balance sheet as at 2 January 2016.
2. The following statements for 2015: the consolidated profit
and loss account, the consolidated statement of
recognised income and expense, consolidated state ment
of changes in equity and consolidated cash flow
statement.
3. The notes comprising a summary of the significant
accounting policies and other explanatory information.
The company financial statements comprise:
1. The company balance sheet as at 2 January 2016.
2. The company profit and loss account for 2015.
3. The notes comprising a summary of the significant
accounting policies and other explanatory information.
The basis for our opinionWe conducted our audit in accordance with Dutch law,
including the Dutch Standards on Auditing. Our responsi-
bilities under those standards are further described in the
“Our responsibilities for the audit of the financial statements”
section of our report.
We are independent of Sligro Food Group N.V. in accordance
with the “Verordening inzake de onafhankelijkheid van
accountants bij assurance-opdrachten (ViO)” and other
relevant independence regulations in the Netherlands.
Furthermore we have complied with the “Verordening
gedrags- en beroepsregels accountants (VGBA)”.
We believe the audit evidence we have obtained is sufficient
and appropriate to provide a basis for our opinion.
Our audit approachAs part of our audit we have determined materiality and used
it to assess the risks of material misstatement. We have
specifically assessed accounts where subjectivity is high
because of estimates regarding uncertain future
developments. We have likewise specifically focused on the
risk related to management override of controls and the risk
of material misstatement due to fraud. In addition, our audit
expressly included the continuity and reliability of the
automated information systems.
OTHER INFORMATION
• Prepared in accordance with Part 9 Book 2 Dutch Civil Code.
• Consistent with �nancial statements.
Executive board report
Materiality for the �nancial statements as a whole €6 million (2014: €6).
Materiality
• Bonuses, promotional contributions and payment discounts.
• Sales contracts Foodservice activity.
• Reliability and continuity of the IT environment.
Key audit matters
Deloitte audited the company and all consolidated subsidiaries.
Scope
Company and consolidated �nancial
statements
152 | Sligro Food Group 2015

MaterialityMisstatements may arise from fraud or error and are
considered material if, individually or in the aggregate, they
could reasonably be expected to influence the economic
decisions of users taken on the basis of these financial
statements. Materiality affects the nature, timing and extent
of our audit procedures and the evaluation of the effect of
identified misstatements on our opinion.
Based on our professional judgement we determined the
materiality for the financial statements as a whole at
€6 million. The materiality is based on 6% of profit before
tax. We have also taken into account misstatements and/or
possible misstatements that in our opinion are material for
the users of the consolidated financial statements for
qualitative reasons.
Materiality overview
2015 2014Basis for group materiality
6% of profit before tax
€105 million
7% of profit before tax
€86 million
Group materiality level
€6 million €6 million
We agreed with the Supervisory Board that misstatements,
which are identified during the audit, would be reported to
them, as well as smaller findings and observations, and
smaller misstatements that in our view must be reported on
qualitative grounds.
Scope of the group audit Considering we are ultimately responsible for the opinion,
we are also responsible for directing, supervising and
performing the group audit. In this respect we have
determined the nature and extent of the audit procedures to
be carried out for group entities. Most important were size
and/or risk profile of the group entities or operations.
For Sligro Food Group N.V., our group audit focused on all
entities within the consolidation. We have performed audit
procedures at all group entities ourselves and we have not
used the work of other auditors as part of our audit. The
investments in associates reported in the financial
statements are (minority share) investments that select their
own external auditor. We are not the external auditor of these
associates, but where deemed necessary, we have
performed certain procedures ourselves, or used the work
performed by the statutory auditor of an associate. At the
time the financial statements of Sligro Food Group N.V. are
being prepared, the statutory audits of the financial
statements of the associates most of the time have not yet
been completed. Therefore we have, for example in respect
of the investment in Spar Holding B.V. (carrying amounts in
the financial statements of Sligro Food Group N.V. €35
million), performed procedures in addition to the work of the
statutory auditor of Spar Holding B.V.
By performing the procedures mentioned above, we have
been able to obtain sufficient and appropriate audit evidence
about the group’s financial information to provide an opinion
about the consolidated financial statements.
153

Our key audit mattersIn the key audit matters we describe those matters that, in our professional judgement, were of most significance in our audit of
the financial statements. We have communicated the key audit matters to the supervisory board. The key audit matters are not a
comprehensive reflection of all matters discussed.
These matters were addressed in the context of our audit of the financial statements as a whole and in forming our opinion
thereon, and we do not provide a separate opinion on these matters.
Key audit matter How the key audit matter was addressed in the audit
Bonuses, promotional contributions and payment discountsSupplier’s bonuses and promotional contributions are regular business practices in the sector. The share of supplier’s bonuses and promotional contributions to Sligro Food Group N.V.’s profit before tax is very substantial. Final agreements with the suppliers on these contributions are most often concluded in the year following the year of reporting. This leads to an element of estimation in the financial statements. The Company discloses the relevant accounting policies in Note G2 to the consolidated financial statements.In summary:Sligro Food Group N.V. receives various forms of compensation from suppliers, which can be divided into two main types:i. Temporary price reductions (“promotions”), usually associated with
promotional offers to customers, are aimed at increasing direct sales volumes. In most cases, the lower purchase price is charged by the supplier for the agreed period. The benefit of temporarily lower purchase prices is reflected directly in the cost of sales.
ii. Bonuses are usually based on annual agreements (“bonuses”).Reasonably foreseeable bonuses are included in the valuation of invento-ry. This does not apply to promotional allowances as these are intended to cover sales efforts.
Our audit focused on both testing the design and implementation of internal control measures on behalf of the executive board (including the basis for the esti-mates, segregation of duties, contract management and authorizations) as well as on a number of substan-tive tests (auditing the outcome of the estimates of last year, reviewing the support of the estimates based on the contracts with the suppliers and confirmation of the agreed conditions with the suppliers).Based on historical figures, test of details and analyti-cal procedures we have audited the impact on the inventory valuation of classifying contributions as promotions or bonuses. Management has refined the method of estimating the supplier’s bonuses and promotional contributions to be received at the end of the reporting year and will also invest in a further improvement of the way conditions can be structured, managed and processed in an electronic way in the coming period.
Sales contracts Foodservice activitySligro Food Group N.V. serves a large number of customers operating in different segments of the hospitality and service market.Depending on the nature and size of the activities of its customers Sligro Food Group N.V. segments the customers in a number of different groups. It is possible that segments have different conditions for certain products. Applying the right contracts and conditions for the various customer groups is important and as a consequence a key audit matter for us.
We have evaluated internal controls governing the classification of new customers in the relevant and appropriate groups as part of our audit procedures. We have performed substantive audit procedures to determine whether the different customer groups are charged based on approved prices. In case cost prices are important to determine the relevant selling prices we have performed specific (substantive) analytical procedures in order to verify the proper application of contractual conditions.
Reliability and continuity of the IT environmentSligro Food Group N.V. is highly dependent on the reliability and continu-ity of the IT environment to support automated data processing in its operations. This dependency results in high attention to the IT environ-ment by both the executive board and to us as external auditor. Sligro Food Group N.V. uses, in addition to a number of standard applications, a large number of (partially internally) custom-made applications. Contrast-ing to standard applications that are commonly used worldwide by many users, custom-made applications lead to a number of specific challenges to the reliability and continuity of data processing. In connection with our audit work, we have evaluated the data centers, the general controls surrounding the IT (General IT Controls), a number of programmed controls and systems relevant to the financial statements and internal reports.
In 2015 we have not relied on automated data process-ing for certain processes. Alternatively we gained the required level of assurance from additional activities including data analytics and verification and analyses of relations between movements in cash and goods. IT audit specialists have been deployed to assist us in making various data analysis. During 2015 the executive board has given high priority to a program aiming for further improvement in a number of processes in the area of reducing and better monitoring of access to and maintenance of the systems of automated data processing.
154 | Sligro Food Group 2015

Responsibilities of the Executive Board and the supervisory board for the financial statements The Executive Board is responsible for the preparation and
fair presentation of the financial statements in accordance
with EU-IFRS and Part 9 of Book 2 of the Dutch Civil Code,
and for the preparation of the Executive Board report in
accordance with Part 9 of Book 2 of the Dutch Civil Code.
Furthermore, the Executive Board is responsible for such
internal control as the Executive Board determines is
necessary to enable the preparation of the financial state-
ments that are free from material misstatement, whether
due to fraud or error.
As part of the preparation of the financial statements, the
Executive Board is responsible for assessing the Company’s
ability to continue as a going concern. Based on the financial
reporting frameworks mentioned, the Executive Board
should prepare the financial statements using the going
concern basis of accounting unless Executive Board either
intends to liquidate the company or to cease operations, or
has no realistic alternative but to do so.
The Executive Board should disclose events and
circumstances that may cast significant doubt on the
company’s ability to continue as a going concern in the
financial statements.
The supervisory board is responsible for overseeing the
company’s financial reporting process.
Our responsibilities for the audit of the financial statements Our objective is to plan and perform the audit assignment in
a manner that allows us to obtain sufficient and appropriate
audit evidence for our opinion.
Our audit has been performed with a high, but not absolute,
level of assurance, which means we may not have detected
all errors and fraud.
For our responsibilities we refer to the appendix.
We communicate with the Supervisory Board regarding,
among other matters, the planned scope and timing of the
audit and significant audit findings, including any significant
findings in internal control that we identify during our audit.
We provide the Supervisory Board with a statement that we
have complied with relevant ethical requirements regarding
independence, and to communicate with them all relation-
ships and other matters that may reasonably be thought to
bear on our independence, and where applicable, related
safeguards.
From the matters communicated with the Supervisory
Board, we determine those matters that were of most
significance in the audit of the financial statements of the
current period and are therefore the key audit matters. We
describe these matters in our auditor’s report unless law or
regulation precludes public disclosure about the matter or, in
extremely rare circumstances, when non-mentioning is in
the public interest.
Report on other legal and regulatory requirements
Report on the Executive Board report and the other information Pursuant to legal requirements of Part 9 of Book 2 of the
Dutch Civil Code (concerning our obligation to report about
the management board report and other information):
• We have no deficiencies to report as a result of our
examination whether the executive board report, to the
extent we can assess, has been prepared in accordance
with Part 9 of Book 2 of the Dutch Civil Code, and whether
the information as required by Part 9 of Book 2 of the
Dutch Civil Code has been annexed.
• We report that the executive board report, to the extent
we can assess, is consistent with the financial statements.
EngagementWe were engaged by the General Meeting of Shareholders
as auditor of Sligro Food Group N.V. on 19 March 2014 as of
the audit for year 2014 and have operated as statutory auditor
ever since that date.
Eindhoven, 29 January 2016
Deloitte Accountants B.V.
J. Hendriks
155

Appendix to the independent auditor’s report
Our responsibilities for the audit of the financial statementsWe have exercised professional judgment and have
maintained professional skepticism throughout the audit, in
accordance with Dutch Standards on Auditing, ethical
require ments and independence requirements. Our audit
included e.g.:
• Identifying and assessing the risks of material
misstatement of the financial statements, whether due to
fraud or error, designing and performing audit procedures
responsive to those risks, and obtaining audit evidence
that is sufficient and appropriate to provide a basis for our
opinion. The risk of not detecting a material misstatement
resulting from fraud is higher than for one resulting from
error, as fraud may involve collusion, forgery, intentional
omissions, misrepresentations, or the override of internal
control.
• Obtaining an understanding of internal control relevant to
the audit in order to design audit procedures that are
appropriate in the circumstances, but not for the purpose
of expressing an opinion on the effectiveness of the
Company’s internal control.
• Evaluating the appropriateness of accounting policies
used and the reasonableness of accounting estimates and
related disclosures made by management.
• Concluding on the appropriateness of management’s use
of the going concern basis of accounting, and based on
the audit evidence obtained, whether a material
uncertainty exists related to events or conditions that may
cast significant doubt on the Company’s ability to continue
as a going concern. If we conclude that a material
uncertainty exists, we are required to draw attention in
our auditor’s report to the related disclosures in the
financial statements or, if such disclosures are inadequate,
to modify our opinion. Our conclusions are based on the
audit evidence obtained up to the date of our auditor’s
report. However, future events or conditions may cause
the Company ceasing to continue as a going concern.
• Evaluating the overall presentation, structure and content
of the financial statements, including the disclosures.
• Evaluating whether the financial statements represent the
underlying transactions and events in a manner that
achieves fair presentation.
156 | Sligro Food Group 2015

Proposed profit appropriationAs stated in note 19, the Executive Board, with the approval
of the Supervisory Board, has proposed the following profit
appropriation since the balance sheet date:
(x € million)
Addition to other reserves 29
Payment of interim dividend (€0.40 per share) 17
Available for regular (final) dividend (€0.50 per share) 22
Available for distribution as variable dividend (€0.30 per share) 13
81
Article 46 of the Articles of Association contains the following
provisions with regard to distributions and reserves:
1) The company may make distributions to shareholders
and other parties entitled to the distributable profit only
insofar as its shareholders’ equity is greater than the
paid-up and called capital plus the reserves required to
be held by law or the Articles of Association.
2) Subject to the approval of the Supervisory Board, the
Executive Board is authorised to add all or part of the
profit to the reserves. Such an addition to the reserves
may be reversed by a resolution supported by a majority
of two- thirds of the votes cast at a general meeting at
which more than half the issued capital is represented.
3) Any profit remaining after the addition to the reserves as
referred to in the previous paragraph of this article shall
be at the disposal of the general meeting.
4) Insofar as the general meeting does not resolve to
distribute profit for any specific year, such profit shall be
added to the reserves.
5) Subject to the approval of the Supervisory Board, the
Executive Board may make interim distributions
provided the requirement of paragraph 1 of this article
has been met and is evidenced by an interim statement
of assets and liabilities as referred to in Section 105(4),
Book 2, of the Netherlands Civil Code. The company
shall file the statement of assets and liabilities at the
office of the Commercial Register within eight days of
the date on which the resolution to make the distribution
is published. The second sentence of paragraph 9 of this
article is applicable mutatis mutandis to interim
distributions.
6) On a proposal of the Executive Board which has been
approved by the Supervisory Board, the general meeting
may resolve to appropriate profit to a distributable reserve.
7) On a proposal of the Executive Board which has been
approved by the Supervisory Board, the general meeting
may, without prejudice to the provisions the Articles of
Association relating to the issue of shares, resolve to
distribute profit in the form of shares in the company or
depositary receipts therefor
8) Profit distributions shall be made at a place and time to
be determined by the general meeting but no later than
one month after adoption of the relevant resolution by
the general meeting.
9) Profit distributions not claimed within five years of the
date on which they became payable shall revert to the
company.
10) A loss may be charged to the reserves required to be
held by law only insofar as permitted by law.
157

(x € million)9)
2015 2014 2013 2012 2011Results
Net sales 2,670 2,572 2,498 2,468 2,420
EBITDA 160 149 143 142 159
EBITA 122 106 100 99 115
EBIT 103 89 88 89 105
Profit for the year 81 69 68 69 78
Net cash flow from operating activities 140 147 133 129 124
Free cash flow 78 78 101 96 76
Proposed dividend 52 48 46 46 46
Equity and liabilities
Shareholders' equity1) 606 570 571 555 541
Net capital employed 2) 660 651 640 659 692
Total assets 1,071 1,012 1,006 968 931
Employees
Year average (full-time equivalents) 5,740 5,834 5,829 5,848 5,880
Staff costs5) 253 239 234 227 217
Capital expenditure
Net capital expenditure4) 60 60 36 33 46
Depreciation5) 38 40 41 43 44
Ratios
Increase in sales (%) 3.8 2.9 1.3 1.9 5.9
Increase in profit (%) 17.4 1.5 (0.9) (12.3) 11.4
Gross margin as % of sales 23.2 23.2 23.1 22.6 23.2
EBITDA as % of sales 6.0 5.8 5.7 5.8 6.6
EBITA as % of sales 4.6 4.1 4.0 4.0 4.7
EBIT as % of sales 3.8 3.5 3.5 3.6 4.3
Profit after tax as % of sales 3.0 2.7 2.7 2.8 3.2
Return on average Shareholders' equity6) 13.7 12.0 12.1 12.5 15.0
EBIT as % of average
net capital employed 15.7 13.8 13.6 13.1 15.2
Shareholders' equity as % of total assets 56.6 56.3 56.8 57.3 58.1
Sales per employee (x €1,000) 465 441 429 422 412
Staff costs per employee (x €1,000) 44 41 40 39 37
Figures per share of €0.067) nominal value (in euros)
Shares in issue (millions) 43.8 43.7 43.7 43.8 44.0
Shareholders' equity 13.84 13.05 13.07 12.65 12.30
Net earnings 1.84 1.58 1.55 1.56 1.78
Proposed dividend, as form 2014 including interim dividend 1.20 1.10 1.05 1.05 1.05
of which variable dividend8) 0.30 0.30 0.25 0.25 0.20
1) Before profit appropriation. 2) Total assets less cash and cash equivalents and swaps, less short-term liabilities excluding interest-bearing portion. 3) Salaries, social security charges and net benefit expense. 4) See note 2, footnote 5. 5) Excluding impairments. 6) Calculated on profit for the year. 7) Prior-year figures restated for the share split in 2007. 8) 2009: Jubilee bonus. 9) Changes in accounting policies are only reflected in restatement of the figures for the preceding year which also appear in the main financial statements.
TEN-YEAR REVIEW
158 | Sligro Food Group 2015

2010 2009 2008 2007 2006
2,286 2,258 2,168 2,066 1,661
146 149 147 135 119
99 106 107 101 93
91 98 99 96 90
70 74 71 74 62
107 123 103 83 78
66 73 74 8 51
31 44 28 28 24
500 482 426 375 313
689 645 644 645 571
937 852 875 858 719
5,513 5,552 5,600 5,083 3,662
203 197 191 171 127
41 47 36 82 32
47 42 40 34 26
1.3 4.2 4.9 24.4 7.5
(5.5) 4.2 (3.9) 19.5 22.0
23.1 23.3 23.8 22.9 21.6
6.4 6.6 6.8 6.5 7.2
4.3 4.7 4.9 4.9 5.6
4.0 4.3 4.5 4.6 5.4
3.1 3.3 3.3 3.6 3.7
14.3 16.4 17.8 21.6 21.5
13.6 15.2 15.3 15.8 18.3
53.3 56.6 48.7 43.7 43.5
415 407 387 406 454
37 36 34 34 35
44.1 44.3 43.7 43.1 42.4
11.34 10.90 9.75 8.69 7.37
1.59 1.68 1.63 1.72 1.46
0.70 1.00 0.65 0.65 0.57
0.30
159

GLOBAL REPORTING INITIATIVE (GRI) TABLE
General Standard Disclosures Description Whereabouts in report
G4-1 Directors' statement of responsibilities Foreword
G4-3 Name of the reporting organisation Sligro Food Group N.V.
G4-4 Main brands, products and/or services Profile
G4-5 Head office location Corridor 11, 5466 RB Veghel
G4-6 Number of countries in which the organisation is active Profile
G4-7 Ownership structure and legal form Profile/Sligro shares
G4-8 Sales markets Profile
G4-9 Size of reporting organisation Key figures
G4-10 Total number of employees by employment contract and gender Heading ‘Workforce make-up and diversity’ in section Organisation and employees
G4-11 Percentage of employees covered by a Collective Labour Agreement
Heading 'Employment terms and conditions' in section Organisation and employees
G4-12 Description of the organisation’s supply chain Heading ‘One business, one policy’ in CSR section
G4-13 Significant changes during reporting period regarding the organisation’s size, structure, ownership or supply chain None
G4-14 Report on whether and how the precautionary approach or principle is addressed by the organisation
Heading 'Corporate culture’ in section Organisation and employees
G4-15Externally developed economic, environmental and social charters, principles or other initiatives to which the organisation subscribes or which it endorses
Heading ‘Affiliations and administrative involvement’ in the CSR section
G4-16 Membership of associations (such as industry associations) and/or national/international advocacy organisations
Heading ‘Affiliations and administrative involvement’ in the CSR section
G4-17 All entities included in the organisation’s financial statements or equivalent documents Financial statements
G4-18 Process for determining contents of report CSR section - About this report
G4-19 List of all material aspects identified in the process for defining report content Heading ‘Our core themes’ in the CSR section
G4-20 Set the aspect boundary within the organisation CSR section
G4-21 Set the aspect boundary outside the organisation CSR section
G4-22 Report the effect of any restatements of information provided in previous reports, and the reasons for such restatements
Heading 'CO2' in section Our Core themes ‘The environment'
G4-23 Significant changes compared with previous reporting periods None
G4-24 List of groups of interested parties involved by the organisation Heading ‘Stakeholder dialogue’ in the CSR section
G4-25 Basis for identification and selection of interested parties to be involved
Heading ‘Stakeholder dialogue’ in the CSR section
G4-26Report on the organisation’s approach to stakeholder engagement, including frequency of engagement by type and by stakeholder group
Heading ‘Stakeholder dialogue’ in the CSR section
G4-27Report on key topics and concerns that have been raised through stakeholder engagement, and how the organisation has responded to those key topics and concerns through its reporting
Heading ‘Stakeholder dialogue’ in the CSR section
G4-28 Reporting period 2015
G4-29 Date of most recent report 29 January 2016
G4-30 Reporting cycle Annual
G4-31 Contact point for questions about report or contents [email protected] CSR section - About this report
G4-32Report on the ‘in accordance’ option the organisation has chosen and the GRI Content Index for the chosen option and reference to the External Assurance Report
Heading ‘About this report’ in the CSR section
G4-33 Report on the organisation’s policy and current practice with regard to seeking external assurance for the report Auditor’s report
G4-34
Management structure of the organisation, including committees reporting to the senior management body and responsible for specific tasks, such as determining strategy or providing an overview of the organisation.
Directors and management
G4-56 Description of the organisation’s values, principles, standards and norms of behaviour, such as codes of conduct and codes of ethics.
Heading 'BSCI' in section Our core themes ‘Our product range' / Corporate Governance
160 | Sligro Food Group 2015

Specific Standard Disclosures
PEOPLE
Our employees DMA Description of the management approachHeading ‘Our employees’ in section Our Core themes ‘People’ and section Organisation and employees
G4-LA6 Injuries, occupational diseases, sickness absence and work-related deaths by region and gender
Heading 'Safety' in section Organisation and employees
G4-LA10Programmes for competency management and lifelong learning aimed at guaranteeing the ongoing employability of staff and to help them at the end of their career
Heading ‘Learning and development’ in section Organisation and employees
Our community DMA Description of the management approach Heading ‘Sustainable’ in section Our core themes ‘Our product range’
G4-HR1Percentage and total number of substantial investment agreements including clauses on human rights or subject to verification of compliance with human rights
Sustainable under ‘Our product range’
G4-HR4
Activities in respect of which it has been determined that there could be substantial risk to the right of free association and the right to negotiate collective labour agreements and measures taken to uphold those rights
Sustainable under ‘Our product range’
G4-HR5Activities in respect of which it has been determined that there could be a substantial risk of child labour and measures taken to prevent child labour
Sustainable under ‘Our product range’
G4-HR6Activities in respect of which it has been determined that there could be a substantial risk of cases of forced or compulsory labour and measures taken to prevent forced or compulsory labour
Sustainable under ‘Our product range’
Our customers DMA Description of the management approach Heading ‘Energy’ in section Our core themes ‘The environment’
G4-PR5 Results of customer satisfaction surveysHeading ‘Ratings’ in section Trends in Food Retail and the heading ‘Ratings’ in the section Trends in FoodService.
THE ENVIRONMENT
Energy DMA Description of the management approach Heading 'Energy' in section Our core themes ‘The environment’
G4-EN3 Energy consumption within the organisation Heading ‘Energy’ in section Our core themes ‘The environment’
G4-EN4 Energy consumption outside of the organisation Heading ‘Energy’ in section Our core themes ‘The environment’
G4-EN6 Reduction of energy consumption Heading ‘Energy’ in section Our core themes ‘The environment’
G4-EN7 Reductions in energy requirements of products and servicesHeading Sustainable distribution in urban areas’ in section Our core themes ‘The environment’
CO2 DMA Description of the management approach Heading ‘CO2’ in section Our core themes ‘The environment’
G4-EN15 Direct greenhouse gas (GHG) emissions (scope 1) Heading ‘CO2’ in section Our core themes ‘The environment’
G4-EN16 Energy indirect greenhouse gas (GHG) emissions (scope 2) Heading ‘CO2’ in section Our core themes ‘The environment’
G4-EN17 Other indirect greenhouse gas (GHG) emissions (scope 3) Heading ‘CO2’ in section Our core themes ‘The environment’
G4-EN19 Reduction of greenhouse gas (GHG) emissions Heading ‘CO2’ in section Our core themes ‘The environment’
Packaging and waste DMA Description of the management approach Heading ‘Waste’ in section
Our core themes ‘The environment’
THE PRODUCT RANGE
Sustainable DMA Description of the management approach Heading ‘Sustainable’ in section Our core themes ‘Our product range’
Indicator Number of items as part of eerlijk & heerlijk (honest & delicious) concept
Heading ‘Sustainable’ in section Our core themes ‘Our product range’
Health DMA Description of the management approach Heading ‘Health’ in section Our core themes ‘Our product range’
Indicator Number of IKB products CSR section
Indicator Undertaking to introduce a healthier product range? Heading ‘Health’ in section Our core themes ‘Our product range’
Food waste DMA Description of the management approach Heading ‘Food waste’ in section Our core themes ‘Our product range’
161

EERLIJK & HEERLIJK CERTIFICATION MARKS
Food
ORGANICEuropean organic logo EKO
Demeter
Bio Equitable
EcoSocial
Biogarantie
Agriculture Biologique
Bio Siegel
Bio Suisse
IBD Organico
Argencert
USDA Organic
Ø-Merket
Australian Certified Organic
FAIR TRADEFairtrade / Max Havelaar
UTZ Certified
Fair for Life
For Life
Fairtrade Cocoa Program
Fairtrade Sugar Program
Bio Equitable
SUSTAINABILITYMSC
ASC
Naturland Wildfish
VISwijzer groen
VISwijzer oranje
Milieukeur
Rainforest Alliance
Beter Leven label 1 star
Beter Leven label 2 stars
Beter Leven label 3 stars
Keten Duurzaam Varkensvlees
Label Rouge
France Limousin
CPE Vrije Uitloop
BAP
Non-Food
ORGANICEKO
Demeter
FAIR TRADEFairtrade / Max Havelaar
SUSTAINABILITYEU Ecolabel
Nordic Ecolabel
Der Blaue Engel
Milieukeur
PEFC
FSC
Kiemplantlogo
OK Compost
Ecover
Terra Vitis
Keten Duurzaam Varkensvlees
Sustainable Cleaning
OK compost HOME
Natuurvlees Coöperatie Nederland
162 | Sligro Food Group 2015

Key staff
MANAGERS AND OFFICERS
A. AaldersS. van AchtR. BartenJ. van den BergP. van BerkelM. BogaersD. BögelsG. BosJ. de BreeJ. DekkerM. van DintherD. GruppenR. de HaasJ. van HeerebeekJ. van HeereveldF. HofstraI. HuntjensD. van IperenW. JansenH. JaspersK. KiestraM. KivitsA. LambrechtsP. LampertP. van den LangenbergM. de ManC. MuldersF. PunteM. RijnsburgerA. de RooijR. van RuitenL. RuttenN. van SanteG. SchneemannK. SlippensR. van der SluijsB. StapelJ. StormW.J. StrijboschG. van der VeekenM. van VeghelH. VerberkA. VerlouwS. van VijfeijkenJ. te VoertW. van WijkJ. van der WijstE. WildemanP. Wille
head of purchase planning department, Sligro Food Grouphead of HR - Foodservice, Sligro Food Groupassistant manager, support management department, Sligro Delivery Servicelogistics manager, Sligro Food Groupproduction company manager, Sligro Food Group, general manager of Van Hoeckelhead of studio, Sligro Food Grouppurchasing and product range manager, Sligro Food Groupmanager accounting & reporting Sligro Food GroupHR manager, Sligro Food Groupassistant manager, production company operations, Sligro Food Groupaccount manager, Sligro Delivery Servicesite manager, Sligro Eindhovenassistant sales manager, Van Hoeckelmarketing and sales manager, Food Retailhead of accounting, Sligro Food Groupregional manager, Sligro Delivery Service - Amsterdamhead of quality department, Sligro Food Groupmanager, Foodservice Delivery Servicehead of internal and external communication, Sligro Food GroupInformation and software architect, Sligro Food Groupoperations manager, Food Retailhead of purchasing and product range management - food, Sligro Food Groupmanager - Belgiumregional manager, Sligro Vlissingenhead of HRM, Food Retailassistant operations manager, Sligro Delivery Servicemanager, Foodservice Cash-and-Carryhead of property management, Sligro Food Grouppurchase officer, non-resale goods, Sligro Food Grouphead of purchasing and product range management - fresh produce, Sligro Food Groupsite manager, Retail DC Kapelleoperations manager, Sligro Delivery Serviceassistant HR manager, Sligro Food Groupmarketing and sales managerCEO, Sligro Food GroupCFO, Sligro Food Groupnational account manager, Sligro Delivery Servicemanager of BouterFoodservice director, Sligro Food Groupcompany secretary, Sligro Food GroupICT manager, Sligro Food Grouptransport operations manager, Sligro Food Grouphead of building works, Sligro Food Grouphead of GID/WID, Sligro Food Groupprogramme manager, purchase and product range management, Sligro Food Groupregional manager, Sligro - The Hague Foreparkhead of purchasing and product range management - non-food, Sligro Food Groupsupply chain project coordinator, Sligro Food Grouphead of franchise operations, Food Retail
163

164 | Sligro Food Group 2015

AcknowledgementsThis report was produced entirely in-house with the
cooperation of the following persons and departments.
Coordination and designWilco Jansen
Mieke van der Valk
Studio Sligro Food Group
Executive Board
PhotographyHagemeier fotografie
New Brand Activators
PaperThis report is printed on FSC®-certified paper
PrintingBek 1op1 publiceren | www.bek.nl | [email protected] | Veghel
Disclaimer The 2015 annual report of Sligro Food Group N.V. is available
in Dutch and English. The original financial statements were
drafted in Dutch. In case of any discrepancies between the
English and the Dutch text, the latter will prevail. Copies of the
annual report in Dutch and English are available on r equest
from Public Relations Department, Sligro Food Group N.V.,
Veghel, Netherlands.
Sligro Food Group N.V.
Corridor 11
5466 RB Veghel
Netherlands
1055232

ANNUAL REPORT 2015
AN
NU
AL R
EP
OR
T 2015