ANNUAL REPORT 2015 - Homepage - NEPI · 2 new europe property investments plc – annual report...
140
ANNUAL REPORT 2015
Transcript of ANNUAL REPORT 2015 - Homepage - NEPI · 2 new europe property investments plc – annual report...

ANNUAL REPORT 2015

OVERVIEW
Company profile 3Board of Directors 6Directors’ report 8Portfolio overview 18Analysis of shareholders and share trading 56Beneficial shareholding of Directors 57
CORPORATE GOVERNANCE
Corporate governance 58Key risk factors 64Sustainability report 65
FINANCIAL STATEMENTS
Directors’ responsibility for the annual financial statements 73Independent auditor's report 74Financial statements 75
ANNUAL GENERAL MEETING
Notice of 2016 Annual General Meeting 130Notes to notice of Annual General Meeting 132
APPENDICES
Management accounts 128Schedule of properties 134

The terms ‘NEPI’, the ‘Group’, the ‘Company’, ‘we’, ‘our’ and ‘us’ refer to New Europe Property Investments plc and, as applicable, its subsidiaries and/or interests in joint-ventures and associates.
More information on our website
www.nepinvest.com
PHOTO: SHOPPING CITY DEVA, ROMANIA

2 NEW EUROPE PROPERTY INVESTMENTS PLC – ANNUAL REPORT 2015PHOTO: CITY BUSINESS CENTRE, TIMISOARA, ROMANIA

NEW EUROPE PROPERTY INVESTMENTS PLC – ANNUAL REPORT 2015 3
The investment strategy is biased towards long-term
leases in Euro with strong corporate covenants.
On 31 December 2015, the portfolio had an outstanding
weighted average lease duration of 5.6 years, while 64%
of the rental income was generated by contracts with
large tenants and major franchisees.
NEPI is internally managed by a team which combines
asset management, investment, development, leasing
and financial expertise.
The Group is investment-grade rated by Moody's and
Standard & Poor's.
NEPI usually distributes at least 90% of its net rental
profits on a semi-annual basis.
14
12
10
8
6
4
2
— Share price — Share price with dividend reinvested
SHARE PRICE (€)
14
12
10
8
6
4
2
2009 2010 2011 2012 2013 2014 2015
Company profile
New Europe Property Investments plc is a property
investor and development group, listed on the Main
Board of the Johannesburg Stock Exchange Limited
(JSE), the regulated market of the Bucharest Stock
Exchange (BVB) and the Alternative Investment Market
(AIM) of the London Stock Exchange (LSE).
NEPI acquires, develops and manages regionally
dominant retail assets in emerging European Union
markets with high-growth potential. The Group built
up an exceptional property portfolio and development
pipeline in Romania, Slovakia and Serbia and is
progressing with a retail expansion programme in other
emerging European markets with high consumption
growth potential. The Group also invests in A-grade
offices in Romanian cities with significant multinational
tenant demand.
TRADING VOLUME (million shares)

4 NEW EUROPE PROPERTY INVESTMENTS PLC – ANNUAL REPORT 2015
LETTABLE AREA OF PROPERTIES
thousand m²
20
09
201
1
201
3
201
0
201
2
201
4
201
5
140
214 21
9
279
43
3
527
*
756
*
SHARES IN ISSUEmillion
20
09
201
1
201
3
201
0
201
2
201
4
201
5
41
77
103
144
20
4
278 2
99
TOTAL NUMBER OF PROPERTIES
20
09
201
1
201
3
201
0
201
2
201
4
201
5
30
33 34
41
51
29
* 34*
*Starting 2014, the Company reclassified 20 of the non-core properties as held for sale. Their aggregated value is less than 2% of the total asset value. Extensions to existing properties were also excluded from the count.
NUMBER OF SHAREHOLDERS
20
09
201
1
201
3
201
0
201
2
201
4
201
5
23
2 642
1,9
07
3,47
9
6,01
1
8,6
38
12,
80
0

NEW EUROPE PROPERTY INVESTMENTS PLC – ANNUAL REPORT 2015 5
*Starting 2014, the Company reclassified 20 of the non-core properties as held for sale. Their aggregated value is less than 2% of the total asset value. Extensions to existing properties were also excluded from the count.
FAIR VALUE OF INVESTMENT PROPERTIES
€ million
20
09
201
1
201
3
201
0
201
2
201
4
201
5
146
314
342
44
5
874
1,2
52
1,8
14
DISTRIBUTION PER SHARE
€ cents
20
09
201
1
201
3
201
0
201
2
201
4
201
5
15.
77
17.6
1 20.
25 2
3.2
9 26.
79
32.
22
35.
34
ADJUSTED NAV PER SHARE
€
20
09
201
1
201
3
201
0
201
2
201
4
201
5
1.9
7 2.2
2 2.4
3
2.8
8
3.70
4.6
3
5.2
5
GEARING(loans–cash)/(investment property+listed securities)
20
09
201
1
201
3
201
0
201
2
201
4
201
5
46
% 49
%
32
%
25
%
23
%
8%
14.6
%
PHOTO: MEGA MALL, BUCHAREST, ROMANIA

6 NEW EUROPE PROPERTY INVESTMENTS PLC – ANNUAL REPORT 2015
Executive
Tiberiu Smaranda graduated with a degree in management and marketing. He started his career at Flamingo Group (Flanco), one of Romania’s leading electronics and white goods retailers, where he was involved in retail management, development and expansion for nearly eight years, and was responsible for the company’s expansion into Bulgaria, Croatia, Hungary, Macedonia, Moldova and Serbia. He joined NEPI in 2009 as Leasing Manager, and is currently responsible for leasing, retail developments, asset management and key-tenants relationship.
TIBERIU SMARANDA Executive Director Appointed on 25 September 2013
BA
Board of Directors
Alex Morar graduated with a dual degree in finance and information systems from Stern School of Business, New York University. He began his career as an analyst at Julius Baer Investment Bank. He later joined the financial advisory practice of Deloitte Romania where he spent two years working on large projects and M&A transactions. He joined NEPI upon its founding in 2007 and has contributed to all aspects of the business since then, being recently focused on the investments and acquisitions programme, with a view to expanding NEPI’s portfolio throughout the Central Eastern Europe region.
ALEX MORAR Chief Executive Officer Appointed as Director on 25 September 2013 and as CEO on 7 August 2015
BSc
Mirela Covasa graduated with a finance degree from Bucharest Academy of Economic Studies and is a member of the Association of Chartered Certified Accountants (ACCA) and Chamber of Financial Auditors of Romania (CAFR). Prior to working for NEPI, she was senior manager at PricewaterhouseCoopers, where she spent eight years performing audit assignments in Romania, Slovenia and India. She has worked in accounting and auditing for fourteen years. Ms Covasa joined NEPI in February 2012 and is currently responsible for the financial management of the Company.
MIRELA COVASA Finance Director Appointed on 10 February 2015
BCom, ACCA, CAFR

NEW EUROPE PROPERTY INVESTMENTS PLC – ANNUAL REPORT 2015 7
Non-executive
Dan Pascariu is a prominent figure in Romanian banking. His career started at the Romanian Bank for Foreign Trade in 1973, where he held the position of Chairman and CEO. Mr Pascariu is a non-executive Chairman of the Supervisory Board of Unicredit Bank, Romania. The founder and first President of the Romanian Banking Association, as well as a co-founder and associate professor at the Romanian Banking Institute, Mr Pascariu is currently on the board of directors of various financial institutions in Romania and abroad.
DAN PASCARIU Independent Non-executive Chairman Appointed on 30 March 2009
MBA
Jeffrey Zidel is a successful property developer and investor, and has been involved in many aspects of the property industry for over 40 years. He is currently the Chairman of Fortress Income Fund, and was one of the co-founders of Resilient REIT Limited. Mr Zidel is Vice President of the South African Council of Shopping Centres and director of the South African Property Owners Association.
JEFFREY ZIDELIndependent Non-Executive DirectorAppointed on 11 November 2009
Desmond de Beer has significant experience in property investment and management. He spent several years in the banking industry, first at Barclays Bank, South Africa, where he was Bond Manager at the Barclays Trust. Subsequently, he was appointed General Manager, Corporate Equity and became a member of the Executive Committee at Nedcor Investment Bank. Since 2002, Mr de Beer is the Managing Director of Resilient REIT Limited, listed on the JSE.
DESMOND DE BEER Independent Non-executive Director Appointed on 21 October 2008
BProc, MAP
Michael Mills is experienced public company chairman and managing director with significant operating and financial experience across a range of sectors. A chartered accountant, he has held senior financial roles in a number of multinational companies. His recent experience includes chairman or CEO roles on the boards of UK listed companies operating in the finance sector, software development, healthcare services and manufacturing and a US based distribution business.
MICHAEL MILLSIndependent Non-Executive DirectorAppointed on 13 August 2007
BSc, FCA
Nevenka Pergar is the owner and director of an independent advisory company that offers legal and business consultancy, mainly to foreign investors in Slovenia. She also acts as a local partner of PwC Czech Republic. Ms Pergar has acquired a wide experience in public services serving in Slovenia’s Ministry of Economy and she was member of two Slovenian governments, first as a Secretary General of the Government and then as a Junior Minister for Public Administration. She is currently a member of AmCham and The Managers’ Association of Slovenia.
NEVENKA PERGARIndependent Non-Executive DirectorAppointed on 10 February 2015
LLB, MBA
Mr Emslie is a Chartered Accountant, with more than 30 years’ experience in the financial services sector and property management. He held various positions within the ABSA Group (currently part of Barclays) during a period of 21 years, latterly as Head of ABSA Corporate and Business Bank, Head of ABSA Africa and member of ABSA Group’s Executive Committee. Mr Emslie retired in 2009 and currently holds chairmanship and non-executive directorship positions in various private and public companies.
ROBERT EMSLIEIndependent Non-Executive DirectorAppointed on 4 February 2016
BCom, Hons Acc, CA

8 NEW EUROPE PROPERTY INVESTMENTS PLC – ANNUAL REPORT 2015
DISTRIBUTABLE EARNINGSThe Group achieved 34.76 euro cents in recurring distributable earnings per share for 2015, which combined with the 0.58 euro cents per share non-recurring distributable earnings (which were the result of a financial discount derived from the early repayment of a term loan) represents a 19% improvement in distributable earnings per share compared to 2014. The growth in distributable earnings for 2015 is due to the continuing strong performance of NEPI’s assets, the positive impact of acquisitions and developments completed during the year, and the favourable funding arrangement with the minority shareholder of Mega Mall.
FINAL DISTRIBUTION AND OPTION TO RECEIVE CAPITAL RETURNThe Board declared a distribution of 17.17 euro cents per share for the six months ended 31 December 2015, which combined with the distributable earnings for the first half of the financial year, resulted in a 35.34 euro cents per share distribution for 2015. Shareholders could elect to receive their distribution in cash or by way of an issue of fully paid shares at a ratio of 1.83 new shares for every 100 held.
A circular containing full details of this resolution, accompanied by announcements on the Stock Exchange News Service (SENS) of the Johannesburg Stock Exchange (JSE), the Regulatory News Service (RNS) of the London Stock Exchange (LSE) and the Bucharest Stock Exchange (BVB), was issued on 19 February 2016.
INVESTMENT GRADE RATINGS AND BOND ISSUEIn October 2015, Standard & Poor’s Ratings Services (S&P) assigned NEPI a first-time BBB- preliminary, long-term corporate credit rating. Moody's Investors Service (Moody’s) has upgraded the Company's rating to Baa3, replacing NEPI's 2014 assigned Ba1 rating. Both ratings have a stable outlook.
Subsequent to a roadshow with European fixed-income investors in November 2015, NEPI issued €400 million of unsecured, 5.25 year Eurobonds maturing on 26 February 2021, carrying a 3.750% fixed coupon and with an issue price of 99.597%. This represents a milestone for NEPI, as it is the first time the Company has raised material amounts from European investors, enabling it to compete more effectively in the Central and Eastern European real estate markets in the long term. Of the proceeds, approximately €212 million refinanced existing debt, while the balance is earmarked for acquisitions and developments.
PROSPECTS AND EARNINGS GUIDANCERecurring distributable earnings per share for the year 2016 are projected to be approximately 15% higher compared to 2015. Recurring distributable earnings for the first half of 2016 are expected to be approximately 5% higher compared to the respective period of 2015 due to changes in funding arrangements and timing of completion of developments and acquisitions planned for the first part of 2016. The earnings guidance is based on the assumption that a stable macroeconomic environment prevails, no major corporate failures occur, planned developments remain on schedule, and is sensitive to the impact of the acquisitions currently in the pipeline. This forecast has not been audited or reviewed by NEPI’s auditors and is the responsibility of the Board.
Directors’ report

NEW EUROPE PROPERTY INVESTMENTS PLC – ANNUAL REPORT 2015 9
15%5-year nominal average
compounded annual growth rate in distribution per share
13%increase in adjusted
NAV per share (YOY)
17%increase in recurring
distributable earnings per share (YOY)
46%increase in retail
asset base GLA (YOY)
PHOTO: KRAGUJEVAC PLAZA, KRAGUJEVAC, SERBIA

10 NEW EUROPE PROPERTY INVESTMENTS PLC – ANNUAL REPORT 2015
RETAIL PROPERTY ACQUISITIONS, COMPLETED DEVELOPMENTS AND EXTENSIONS
MEGA MALLOpening date: 14 May 2015
The Group’s largest development to date, the 75,500m2 Gross Leasable Area (GLA) Mega Mall, commenced trading in the first half of 2015, and is currently 98.2% occupied. Since opening, the centre has dominated retail in heavily populated eastern Bucharest, with a catchment area of 910,000 within a 30-minute drive. Peek & Cloppenburg opened its largest store in Romania in Mega Mall during October 2015.
IRIS TITAN SHOPPING CENTERAcquisition date: 1 July 2015
NEPI acquired Iris Titan Shopping Center, a 44,700m2 GLA shopping mall, located in Titan, Bucharest’s most densely populated district. There are 599,000 residents within a 15-minute drive. The property is anchored by Romania’s first, and largest, Auchan hypermarket, and contains numerous international brands, such as Adidas, C&A, CCC, Deichmann, dm, Flanco, H&M, New Yorker and Takko, as well as a seven-screen cinema.
PHOTO: MEGA MALL, BUCHAREST, ROMANIA

NEW EUROPE PROPERTY INVESTMENTS PLC – ANNUAL REPORT 2015 11
CITY PARK EXTENSIONOpening date of first phase: 31 July 2015
SHOPPING CITY DEVA EXTENSIONOpening date: 24 September 2015
The 10,100m2 GLA extension to Shopping City Deva attracts the city's 57,000 inhabitants. There are 277,000 residents within a 45-minute drive. The extension includes new tenants such as Altex, C&A, CCC, a six-screen Cinema City, Deichmann, H&M, Hervis, KFC, New Yorker, Orsay and an entertainment area. The total GLA after the extension is 52,300m2, and these additional brands and facilities strengthen the centre’s regionally dominant position.
SEVERIN SHOPPING CENTER EXTENSION Opening date of first phase: 15 October 2015
The first phase of Severin Shopping Center’s extension, located in Drobeta Turnu Severin, comprises 4,400m2 GLA. The city has 86,000 inhabitants and 175,000 residents live within a 45-minute drive from the shopping centre. New tenants include Benvenuti, a six-screen Cinema City, KFC, as well as leisure and entertainment facilities.
SHOPPING CITY TIMISOARAOpening date for hypermarket and gallery: 26 November 2015
The first section, comprising the hypermarket and gallery (16,300m2 GLA), opened in November and includes tenants such as Carrefour, Media Galaxy, Noriel, Pepco and Zoomania. The adjacent do-it-yourself store, owned by Dedeman, opened in October 2015.
NEPI is progressing with the development of the remaining section (an aditional 40,500m2 GLA). Timisoara has 319,000 inhabitants, is the third largest city in Romania, and 570,000 residents are within a 45-minute drive.
Directors’ report
Acquisitions and developments
The Group completed the acquisition and development of a number of properties during 2015 which are discussed in more detail below. The effective, or opening, date of acquisitions and developments is indicated in parenthesis after the name. All populations are estimates, and all developments and acquisitions are located in Romania unless otherwise specified.
The Group opened the first phase of the mall’s extension, a ten-screen Cinema City, featuring Romania’s second 4DX auditorium (the first is in NEPI’s Mega Mall). The centre is located in Constanta, which has a population of 284,000. There are 541,000 residents within a 45-minute drive.
» continued

12 NEW EUROPE PROPERTY INVESTMENTS PLC – ANNUAL REPORT 2015
RETAIL PROPERTY DEVELOPMENTS AND EXTENSIONS IN PROGRESS
CITY PARK EXTENSION – SECOND PHASE Work on the second phase of City Park’s extension, including tenants such as C&A, Colin's, H&M, Motivi, New Yorker, Sephora, World Class and Zara Home, is on-going and completion is expected during the second quarter of 2016. Once completed, the centre’s total GLA will be 49,800m2.
PROMENADA MALL EXTENSION
The Group is in the process of obtaining new zoning and construction permits for a retail extension and integrated office building to its Promenada Mall, situated in Bucharest’s new central business district. The extension will add approximately 34,000m2 of retail GLA to the existing 40,400m2, while the integrated office will consist of up to 30,000m2 GLA (depending on permitting). The retail extension will include new fashion tenants, a cinema and additional leisure and entertainment facilities, as well as 1,900 new parking spaces that will benefit residents and employees. Subject to permitting, NEPI estimates that the extension will be completed in 2018.
SEVERIN SHOPPING CENTER EXTENSION – SECOND PHASEThe Group will extend Severin Shopping Center with an additional 1,500m2 fashion GLA during 2016, increasing total GLA to 22,400m2.
Directors’ report » continued

NEW EUROPE PROPERTY INVESTMENTS PLC – ANNUAL REPORT 2015 13
SHOPPING CITY TIMISOARA – FASHION AND ENTERTAINMENT SECTIONThe Carrefour hypermarket and gallery opened in the last quarter of 2015, while the fashion and entertainment section is scheduled to be completed in the first quarter of 2016. Tenants will include Bershka, C&A, CCC, Cropp, Deichmann, dm, Douglas, H&M, Hervis, KFC, Koton, LC Waikiki, New Yorker, Orsay, Otter, Pimkie, Pizza Hut, Pull&Bear, Sephora, Sport Vision, Stradivarius, Tom Tailor and Zara. The centre will have substantial modern entertainment and leisure facilities, including a gym and a thirteen-screen cinema (the largest cinema outside of Bucharest), with an IMAX and a 4DX auditorium.
SHOPPING CITY PIATRA NEAMT
The Group is developing a 27,900m2 GLA regional mall in Piatra Neamt. The city has 86,000 inhabitants with 245,000 residents within a 45-minute drive. Carrefour has been secured as a tenant for a 10,000m2 GLA hypermarket together with a six-screen cinema operated by Cinema City. Other secured tenants include C&A, CCC, Orsay and Pepco. The shopping centre is scheduled to open in the fourth quarter of 2016.
PHOTO: PROMENADA MALL, BUCHAREST, ROMANIA

14 NEW EUROPE PROPERTY INVESTMENTS PLC – ANNUAL REPORT 2015
OFFICE PROPERTY ACQUISITIONS, COMPLETED DEVELOPMENTS AND EXTENSIONS
THE OFFICE - SECOND PHASEOpening date: 27 November 2015
The second phase of The Office, Cluj-Napoca, comprising 19,400m2 of A-grade office GLA has been completed, and was ready for tenant fit out in November 2015. As at 8 February 2016, 82% of Phase II has been let.
CITY BUSINESS CENTRE - BUILDINGS D&EAcquisition date: 30 November 2015
NEPI has completed the acquisition of City Business Centre by adding the newest two buildings in the complex to its portfolio. The transaction was initiated through a Forward Purchase Agreement signed in 2012, when the first three buildings were acquired. The total GLA is now 47,100m2 and it the largest A-grade office in Timisoara.

NEW EUROPE PROPERTY INVESTMENTS PLC – ANNUAL REPORT 2015 15
OFFICE DEVELOPMENTS IN PROGRESS
THE OFFICE – THIRD PHASE
Based on the strong demand for quality office space, NEPI will soon commence work on the third phase of The Office, Cluj-Napoca, consisting of 18,500m2 GLA. The Group estimates that it will be completed during 2017.
VICTORIEI OFFICE
This project, located in Victoriei Square, adjacent to the Romanian Government building, includes the development of a modern office and the refurbishment of a historical building. This 8,400m2 GLA landmark office is scheduled for completion in the third quarter of 2016. The delay compared to the initially estimated completion date (December 2015) is due to permitting and the complexity of technical solutions required for the façade of this unique project.
Directors’ report
PHOTO: FLOREASCA BUSINESS PARK, BUCHAREST, ROMANIA
» continued
16 NEW EUROPE PROPERTY INVESTMENTS PLC – ANNUAL REPORT 2015
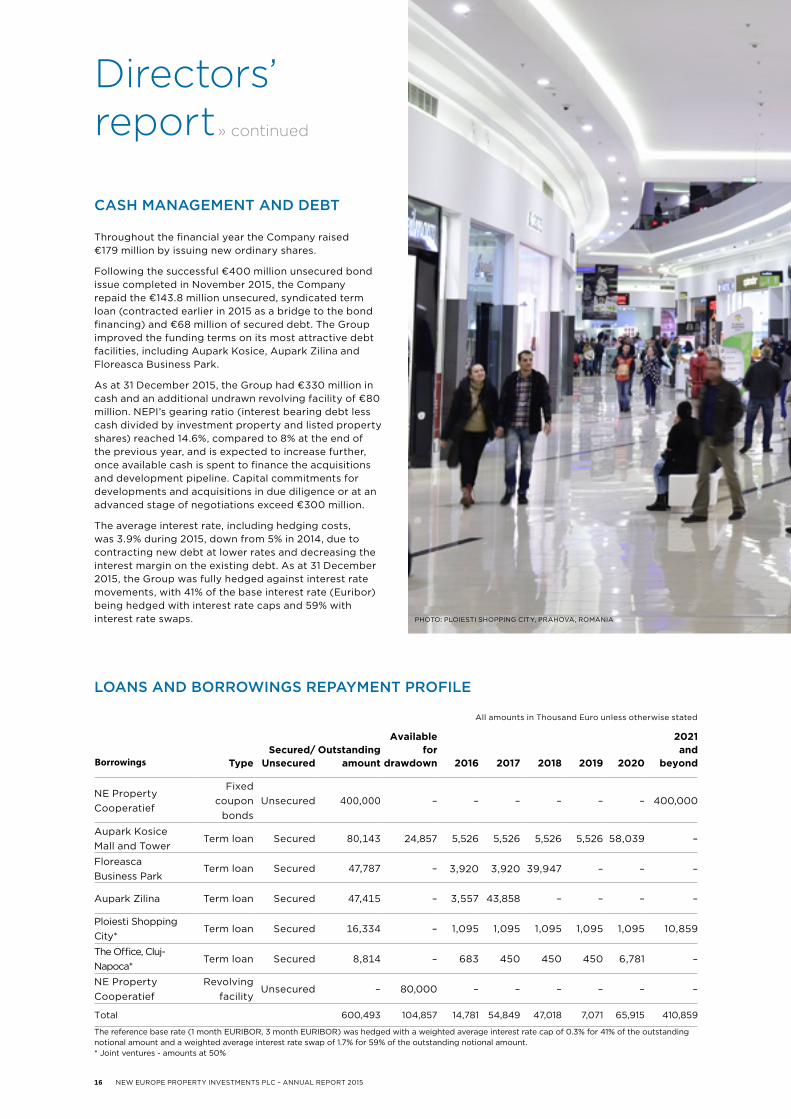
CASH MANAGEMENT AND DEBT Throughout the financial year the Company raised €179 million by issuing new ordinary shares.
Following the successful €400 million unsecured bond issue completed in November 2015, the Company repaid the €143.8 million unsecured, syndicated term loan (contracted earlier in 2015 as a bridge to the bond financing) and €68 million of secured debt. The Group improved the funding terms on its most attractive debt facilities, including Aupark Kosice, Aupark Zilina and Floreasca Business Park.
As at 31 December 2015, the Group had €330 million in cash and an additional undrawn revolving facility of €80 million. NEPI’s gearing ratio (interest bearing debt less cash divided by investment property and listed property shares) reached 14.6%, compared to 8% at the end of the previous year, and is expected to increase further, once available cash is spent to finance the acquisitions and development pipeline. Capital commitments for developments and acquisitions in due diligence or at an advanced stage of negotiations exceed €300 million.
The average interest rate, including hedging costs, was 3.9% during 2015, down from 5% in 2014, due to contracting new debt at lower rates and decreasing the interest margin on the existing debt. As at 31 December 2015, the Group was fully hedged against interest rate movements, with 41% of the base interest rate (Euribor) being hedged with interest rate caps and 59% with interest rate swaps.
LOANS AND BORROWINGS REPAYMENT PROFILE
TypeSecured/
UnsecuredOutstanding
amount
Available for
drawdown 2016 2017 2018 2019 2020
2021 and
beyond
NE Property Cooperatief
Fixed coupon
bondsUnsecured 400,000 – – – – – – 400,000
Aupark Kosice Mall and Tower
Term loan Secured 80,143 24,857 5,526 5,526 5,526 5,526 58,039 –
Floreasca Business Park
Term loan Secured 47,787 – 3,920 3,920 39,947 – – –
Aupark Zilina Term loan Secured 47,415 – 3,557 43,858 – – – –
Ploiesti Shopping City*
Term loan Secured 16,334 – 1,095 1,095 1,095 1,095 1,095 10,859
The Office, Cluj-Napoca*
Term loan Secured 8,814 – 683 450 450 450 6,781 –
NE Property Cooperatief
Revolving facility
Unsecured – 80,000 – – – – – –
Total 600,493 104,857 14,781 54,849 47,018 7,071 65,915 410,859
The reference base rate (1 month EURIBOR, 3 month EURIBOR) was hedged with a weighted average interest rate cap of 0.3% for 41% of the outstanding notional amount and a weighted average interest rate swap of 1.7% for 59% of the outstanding notional amount. * Joint ventures - amounts at 50%
Borrowings
PHOTO: PLOIESTI SHOPPING CITY, PRAHOVA, ROMANIA
Directors’ report» continued
All amounts in Thousand Euro unless otherwise stated

NEW EUROPE PROPERTY INVESTMENTS PLC – ANNUAL REPORT 2015 17
CHANGES TO THE BOARD OF DIRECTORS
As announced on 7 August 2015, Alex Morar has been appointed as CEO to continue the Company's strategy, as Martin Slabbert and Victor Semionov have resigned from their positions of CEO and COO. Mr Morar has been with NEPI since its founding in 2007, being involved in all aspects of the business since.
As announced on 30 December 2015, Mr Dewald Joubert has resigned as Non-executive Director. The Board of Directors appointed Mr Robert Reinhardt Emslie as Non-executive Director, effective from 4 February 2016. Mr Emslie is a Chartered Accountant, with significant experience in banking services and property management, and currently holds chairmanship and non-executive directorship positions in various private and listed companies.
OTHER HIGHLIGHTS
Non-recoverable tenant income for 2015 amounted to €398 thousand, equivalent to 0.26% of annual contractual rental income and expense recoveries.
The Company is actively pursuing investment opportunities in other CEE countries where it currently has no presence and expects to enter new markets in 2016. Although increased competition (arising partly from high liquidity) can be seen across the markets, and yield compression occurred during the past period, NEPI remains well positioned for further expansion, given its established property platform.
TypeSecured/
UnsecuredOutstanding
amount
Available for
drawdown 2016 2017 2018 2019 2020
2021 and
beyond
NE Property Cooperatief
Fixed coupon
bondsUnsecured 400,000 – – – – – – 400,000
Aupark Kosice Mall and Tower
Term loan Secured 80,143 24,857 5,526 5,526 5,526 5,526 58,039 –
Floreasca Business Park
Term loan Secured 47,787 – 3,920 3,920 39,947 – – –
Aupark Zilina Term loan Secured 47,415 – 3,557 43,858 – – – –
Ploiesti Shopping City*
Term loan Secured 16,334 – 1,095 1,095 1,095 1,095 1,095 10,859
The Office, Cluj-Napoca*
Term loan Secured 8,814 – 683 450 450 450 6,781 –
NE Property Cooperatief
Revolving facility
Unsecured – 80,000 – – – – – –
Total 600,493 104,857 14,781 54,849 47,018 7,071 65,915 410,859
The reference base rate (1 month EURIBOR, 3 month EURIBOR) was hedged with a weighted average interest rate cap of 0.3% for 41% of the outstanding notional amount and a weighted average interest rate swap of 1.7% for 59% of the outstanding notional amount. * Joint ventures - amounts at 50%

18 NEW EUROPE PROPERTY INVESTMENTS PLC – ANNUAL REPORT 2015
Group 31 Dec 2015
Group 31 Dec 2014
Total number of properties 34 29
Income-producing properties 31 26
Greenfield developments 3 3
Extensions to existing properties (under construction or under permitting & pre-leasing)
8 3
Fair value of properties (€ million) 1,814 1,252
Annualised property yield 7.6% 7.8%
Lettable area (thousand m²) 999 741
Income-producing properties 756 527
Properties under development (estimated) 205 177
Non-core properties 38 37
Years to expiry 5.6 5.2
Vacancy 2.90% 1.81%
Weighted average rent (€/m²/month) 13.9 13.4
All figures in this section are weighted with the proportion owned by NEPI in each project and exclude properties held for sale. A detailed property schedule is included in this report at pages 134.
Portfolio overview
88+9+3+SRomania 88%Slovakia 9%Serbia 3%
88%ROMANIA
by rentable area
83+14+3+SRomania 83%Slovakia 14%Serbia 3%
83%ROMANIA
by gross rentals
GEOGRAPHICAL PROFILE
SUMMARY
77+19+4+SRetail 77%Office 19%Industrial 4%
77%RETAIL
by rentable area
80+19+1+SRetail 80%Office 19%Industrial 1%
80%RETAIL
by gross rentals
SECTORAL PROFILE

NEW EUROPE PROPERTY INVESTMENTS PLC – ANNUAL REPORT 2015 19
Type A: Large international and national tenants, large listed tenants, government and major franchisees (companies with assets and/or turnovers in excess of €200 million).
Type B: Smaller international and national tenants, smaller listed tenants and medium to large professional firms (companies with assets and/or turnovers ranging from €100 to €200 million).
Type C: Other tenants.
64+7+29+SType A 64%Type B 7%Type C 29%
64%TYPE A
by rentable area
TENANT PROFILE

20 NEW EUROPE PROPERTY INVESTMENTS PLC – ANNUAL REPORT 2015
Portfolio overview
VACANCY PROFILE
The vacancy calculated as a portion of available rentable area at the end of 2015 is 2.9% (excluding properties held for sale) compared to 1.81% at the end of the previous year. The increase in vacancy is mostly attributable to the recently completed office development and recent acquisitions.
Out of the 21,755m² of rentable area vacant as at 31 December 2015, 14,599m² was retail space (1.94%), 6,606m² office (0.87%) and 550m² was industrial (0.07%).
RENTAL ESCALATIONS
The annual rise in rental income is index-linked to the European Consumer Price Index (CPI). The average rent increase during 2015 was 0.97% in Romania, 2.07% in Slovakia and 0.4% in Serbia.
At the end of the year 2015, the weighted average rental escalation by rentable area was 0.92% for retail, 0.34% for office and 1.53% for industrial.
The majority of NEPI’s retail leases are structured to include a base rent, indexed annually, with a further top-up provision related to the tenants’ sales.
EXPIRY PROFILE
140
120
100
80
60
40
20
0
2016 2017 2018 2019
by gross rentals (€m)
2020 2021 2022 2023 2024 2025
Retail Office Industrial
» continued
by rentable area ('000 sqm)800
700
600
500
400
300
200
100
0
2016 2017 2018 2019 2020 2021 2022 2023 2024 2025
Retail Office Industrial
NEW EUROPE PROPERTY INVESTMENTS PLC – ANNUAL REPORT 2015 21
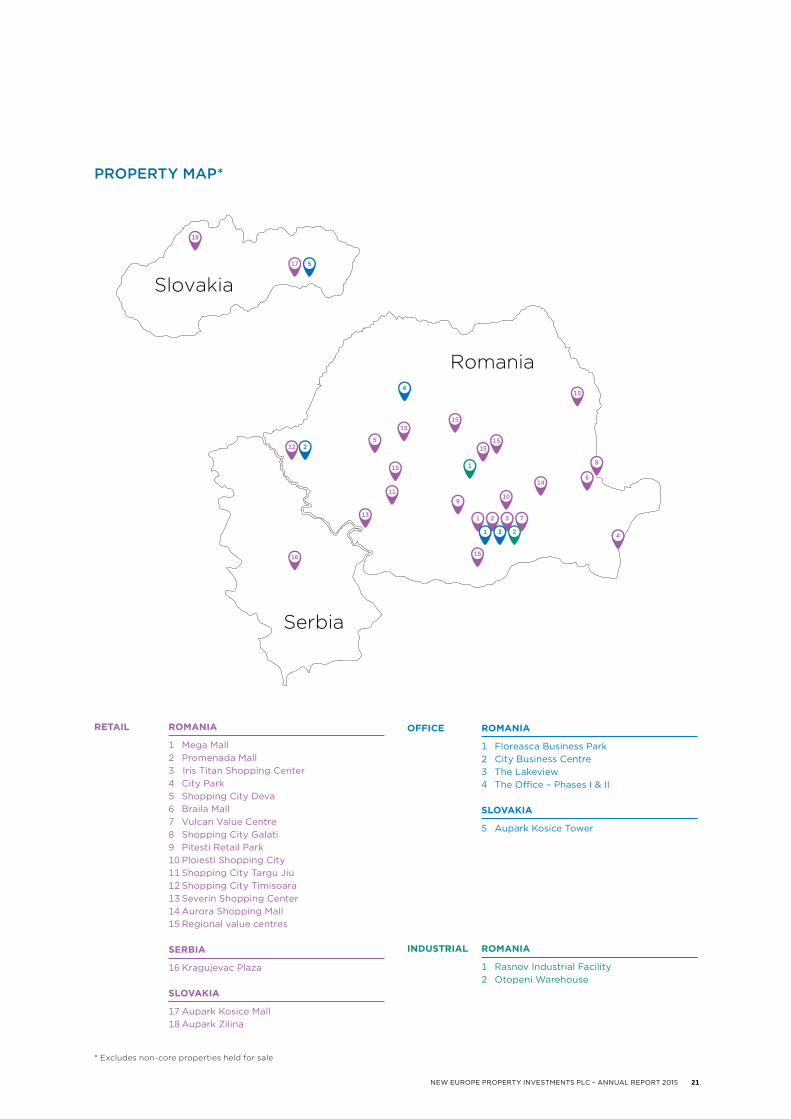
PROPERTY MAP*
14
1
3
4
6
8
2 71
109
11
515
15
15
13
15
16
17 5
4
212
18
15
15
15
Romania
Slovakia
Serbia
231
RETAIL ROMANIA
1 Mega Mall2 Promenada Mall3 Iris Titan Shopping Center4 City Park5 Shopping City Deva6 Braila Mall7 Vulcan Value Centre8 Shopping City Galati9 Pitesti Retail Park10 Ploiesti Shopping City11 Shopping City Targu Jiu12 Shopping City Timisoara13 Severin Shopping Center14 Aurora Shopping Mall15 Regional value centres
SERBIA
16 Kragujevac Plaza
SLOVAKIA
17 Aupark Kosice Mall18 Aupark Zilina
OFFICE ROMANIA
1 Floreasca Business Park2 City Business Centre3 The Lakeview4 The Office – Phases I & II
SLOVAKIA
5 Aupark Kosice Tower
INDUSTRIAL ROMANIA
1 Rasnov Industrial Facility2 Otopeni Warehouse
* Excludes non-core properties held for sale

22 NEW EUROPE PROPERTY INVESTMENTS PLC – ANNUAL REPORT 2015
Promenada Mall
Ownership 70%
GLA 75,500m²
Valuation €240.7 million
Passing rent €17.7 million
Occupancy 98.2%
Major tenantsAdidas, Aldo, Bata, Benvenuti, Brioche Dorée, C&A, Carrefour, CCC, Cinema City, Claire’s, Colin’s, Cropp,
Deichmann, dm, Douglas, Ecco, English Home, Flanco, Folli Follie, Frankie Garage, Geox, H&M, Hervis, Hilfiger Denim, House, Inditex, Intersport, Kenvelo, KFC, Koton, LC Waikiki, Lego, Lem's, Levi’s, MAC, Mango,
Manufaktura by Doncafé, Marks&Spencer, Media Galaxy, Mohito, Musette, New Yorker, Next, Nike, Noriel, Orsay, Otter, Pandora, Paul, Peek&Cloppenburg, Pizza Hut, Pupa, Reserved, Sabon, Samsung, Sephora, Sinsay,
Sport Vision, Stefanel, Steilmann, Subway, Swarovski, Takko, Tom Tailor, Triumph, Yves Rocher
Mega Mall has a very comprehensive tenant mix, with all main brands present in Bucharest; it is home to over 200 tenants, including a number of flagship stores. The mall has a significant entertainment and leisure offering, including a 14-screen Cinema City, which also features the first 4DX auditorium in Romania, a World Class gym with a half-olympic sized swimming pool, and a 10,000m2 food court.
Mega MallBUCHAREST, ROMANIA
RETAIL

NEW EUROPE PROPERTY INVESTMENTS PLC – ANNUAL REPORT 2015 23
Ownership 100%
GLA 40,400m²
Valuation €160.1 million
Passing rent €10.1 million
Occupancy 98.0%
Major tenantsAdidas, Altex, Bershka, Billa, C&A, Calzedonia, Carturesti, Chopstix, Deichmann,
Douglas, DS Damat, Ecco, Flanco, Gant, H&M, Hervis, Humanic, Intersport, Intimissimi, KFC, Killtec, Lacoste, Lego, MAC, Massimo Dutti, McDonalds, Noriel, Oysho,
Paul, Peek&Cloppenburg, Pupa, Sephora, Starbucks, Stefanel, Stradivarius, Tchibo, Tommy Hilfiger, US Polo Assn., Yves Rocher, Zara
Promenada Mall is located in Bucharest’s new central business district, near NEPI’s Floreasca Business Park and The Lakeview. The Group plans to extend the property with approximately 64,000m2 GLA of mixed-use fashion, leisure, entertainment and office space, with permitting currently in progress.
Promenada MallBUCHAREST, ROMANIA

24 NEW EUROPE PROPERTY INVESTMENTS PLC – ANNUAL REPORT 2015
Ownership 100%
GLA 33,800m²
Valuation €140.8 million
Passing rent €9.3 million
Occupancy 93.1%
Major tenantsBata, Beauty Shop, Billa, C&A, Calzedonia, Datart, Deichmann, EXIsport, Gaastra, Geox,
Guess, H&M, Intersport, Lenovo, Mango, Marionnaud, Napapijiri, New Yorker, Nike, Office Shoes, Samsung, Tom Tailor, Tommy Hilfiger, Trussardi, US Polo Assn., Yves Rocher
Aupark Kosice Mall is located on the southern side of the main shopping street, in the city centre of Kosice, the second largest city in Slovakia. The mall provides a wide retail offering, complemented by a leisure and food court area.
Aupark Kosice MallKOSICE, SLOVAKIA
RETAIL

NEW EUROPE PROPERTY INVESTMENTS PLC – ANNUAL REPORT 2015 25
Ownership 100%
GLA 44,700m²
Valuation €90 million
Passing rent €7.6 million
Occupancy 95.9%
Major tenants
Adidas, Auchan, C&A, CCC, Deichmann, dm, Flanco, H&M, Marionnaud, New Yorker, Takko
Acquired in 2015, the property is located in the most densely populated district of Bucharest. It is anchored by the first and largest Auchan hypermarket in Romania, and houses numerous international brands and a seven-screen cinema.
Iris Titan Shopping CenterBUCHAREST, ROMANIA

26 NEW EUROPE PROPERTY INVESTMENTS PLC – ANNUAL REPORT 2015
Ownership 100%
GLA 30,300m²
Valuation €93.8 million
Passing rent €7.6 million
Occupancy 97.1%
Major tenantsAdidas, Bata, BSB, Benvenuti, Bershka, Cinema City, Columbia, Ecco, Guess, KFC, Koton,
Lacoste, LC Waikiki, Mango, Marks&Spencer, McDonalds, Mothercare, Musette, Nike, Oysho, Pandora, Pizza Hut, Pull&Bear, Sport Vision, Stefanel, Stradivarius, Subway, Tom Tailor,
US Polo Assn., Zara
City Park mall has a prime location in Constanta, the fifth largest Romanian city, close to Mamaia, the country’s most popular seaside resort. Phase I of the extension, a ten-screen cinema, including Romania’s second 4DX auditorium, opened on 31 July 2015. The cinema is the second best selling Cinema City in Romania, after the one located in Mega Mall.
City ParkCONSTANTA, ROMANIA
RETAIL

NEW EUROPE PROPERTY INVESTMENTS PLC – ANNUAL REPORT 2015 27
Ownership 100%
GLA 25,100m²
Valuation €102.3 million
Passing rent €7.2 million
Occupancy 98.9%
Major tenantsBilla, C&A, Calzedonia, Camaieu, Datart, Deichmann, Ecco, EXIsport, Guess, H&M,
Mango, Marionnaud, New Yorker, Nike, Orsay, Orange, Slovak Telekom, Takko, Tom Tailor, Tommy Hilfiger
This regional mall is located in the historic centre of Zilina, Slovakia, the capital of a region with 700,000 residents. It is the best performing mall in the region, with the largest and widest retail offering, a simple and efficient layout and high occupancy.
Aupark ZilinaZILINA, SLOVAKIA
28 NEW EUROPE PROPERTY INVESTMENTS PLC – ANNUAL REPORT 2015
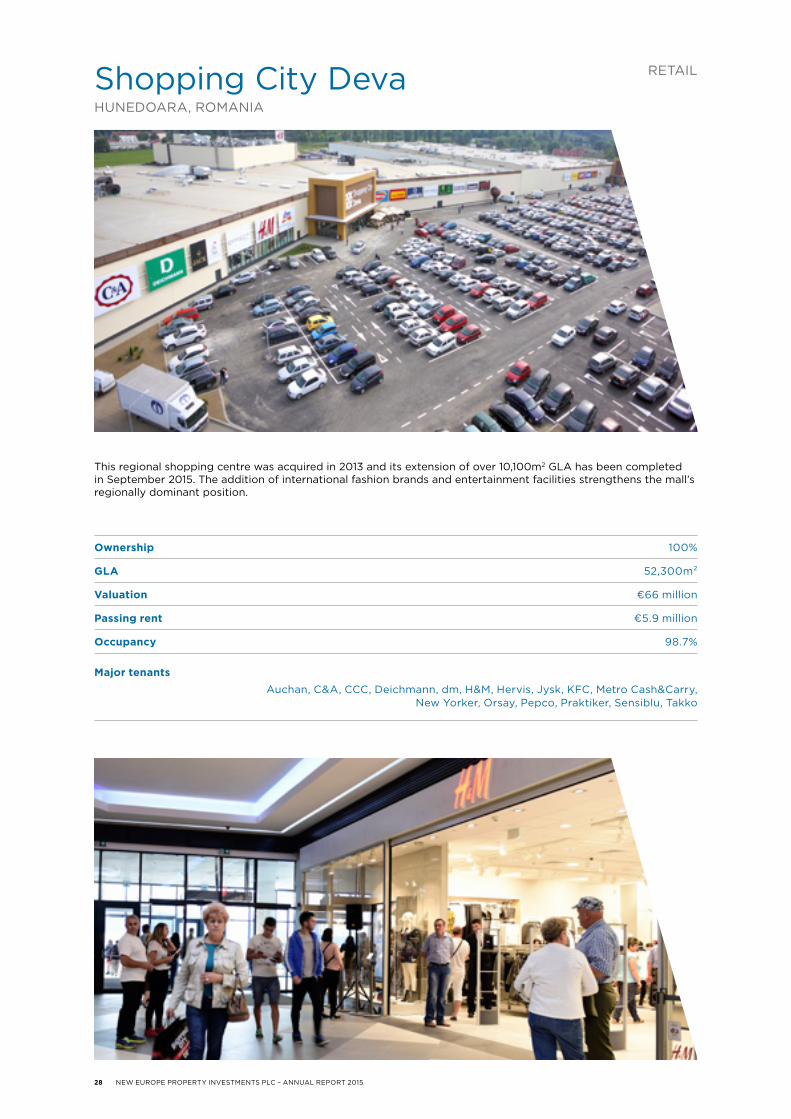
Ownership 100%
GLA 52,300m²
Valuation €66 million
Passing rent €5.9 million
Occupancy 98.7%
Major tenantsAuchan, C&A, CCC, Deichmann, dm, H&M, Hervis, Jysk, KFC, Metro Cash&Carry,
New Yorker, Orsay, Pepco, Praktiker, Sensiblu, Takko
This regional shopping centre was acquired in 2013 and its extension of over 10,100m2 GLA has been completed in September 2015. The addition of international fashion brands and entertainment facilities strengthens the mall’s regionally dominant position.
Shopping City DevaHUNEDOARA, ROMANIA
RETAIL

NEW EUROPE PROPERTY INVESTMENTS PLC – ANNUAL REPORT 2015 29
Ownership 100%
GLA 54,800m²
Valuation €73.4 million
Passing rent €5.5 million
Occupancy 97.6%
Major tenantsAltex, Benvenuti, C&A, Carrefour, CCC, Cinema City, Deichmann, Flanco, H&M, Hervis,
Kingfisher, KFC, Lem's, Musette, Naturlich, New Yorker, Office Shoes, Orsay, Pepco, Segafredo
Braila Mall was acquired in 2009, and a subsequent three-phase redevelopment has resulted in a threefold footfall increase. With a diverse range of tenants, including a large entertainment and leisure area, this regional mall dominates Braila and Galati counties.
Braila MallBRAILA, ROMANIA
30 NEW EUROPE PROPERTY INVESTMENTS PLC – ANNUAL REPORT 2015
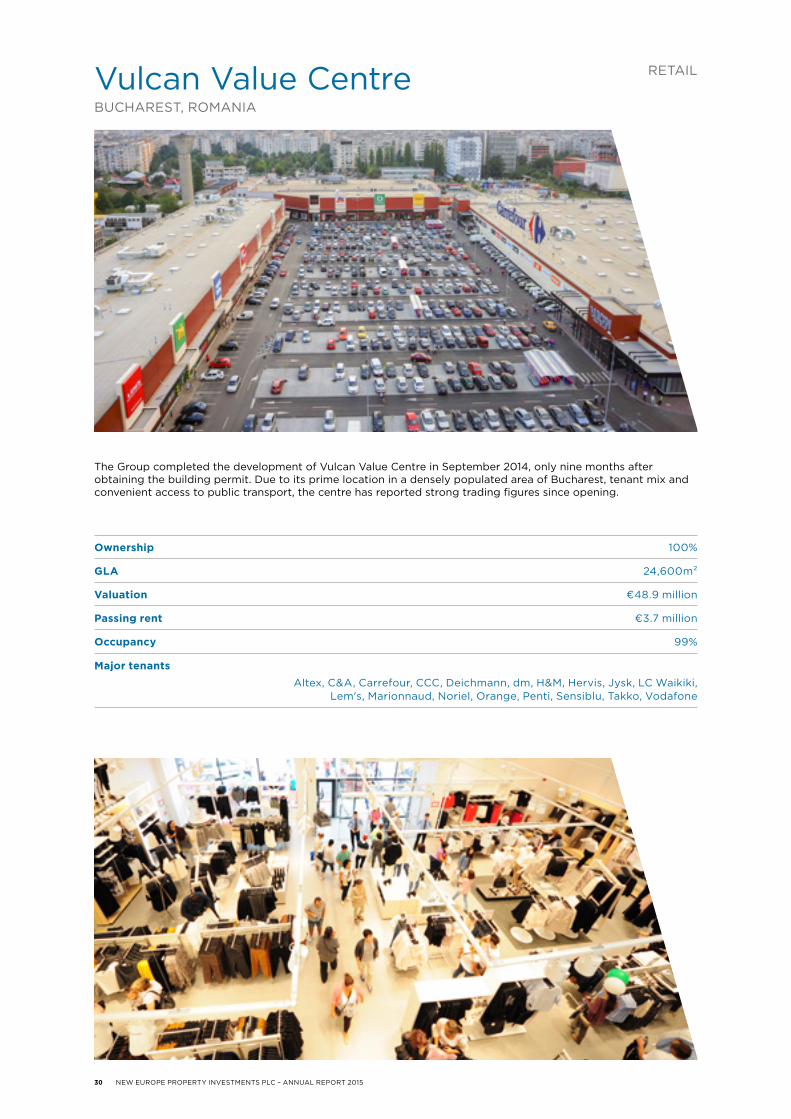
Ownership 100%
GLA 24,600m²
Valuation €48.9 million
Passing rent €3.7 million
Occupancy 99%
Major tenantsAltex, C&A, Carrefour, CCC, Deichmann, dm, H&M, Hervis, Jysk, LC Waikiki,
Lem's, Marionnaud, Noriel, Orange, Penti, Sensiblu, Takko, Vodafone
The Group completed the development of Vulcan Value Centre in September 2014, only nine months after obtaining the building permit. Due to its prime location in a densely populated area of Bucharest, tenant mix and convenient access to public transport, the centre has reported strong trading figures since opening.
Vulcan Value CentreBUCHAREST, ROMANIA
RETAIL
NEW EUROPE PROPERTY INVESTMENTS PLC – ANNUAL REPORT 2015 31
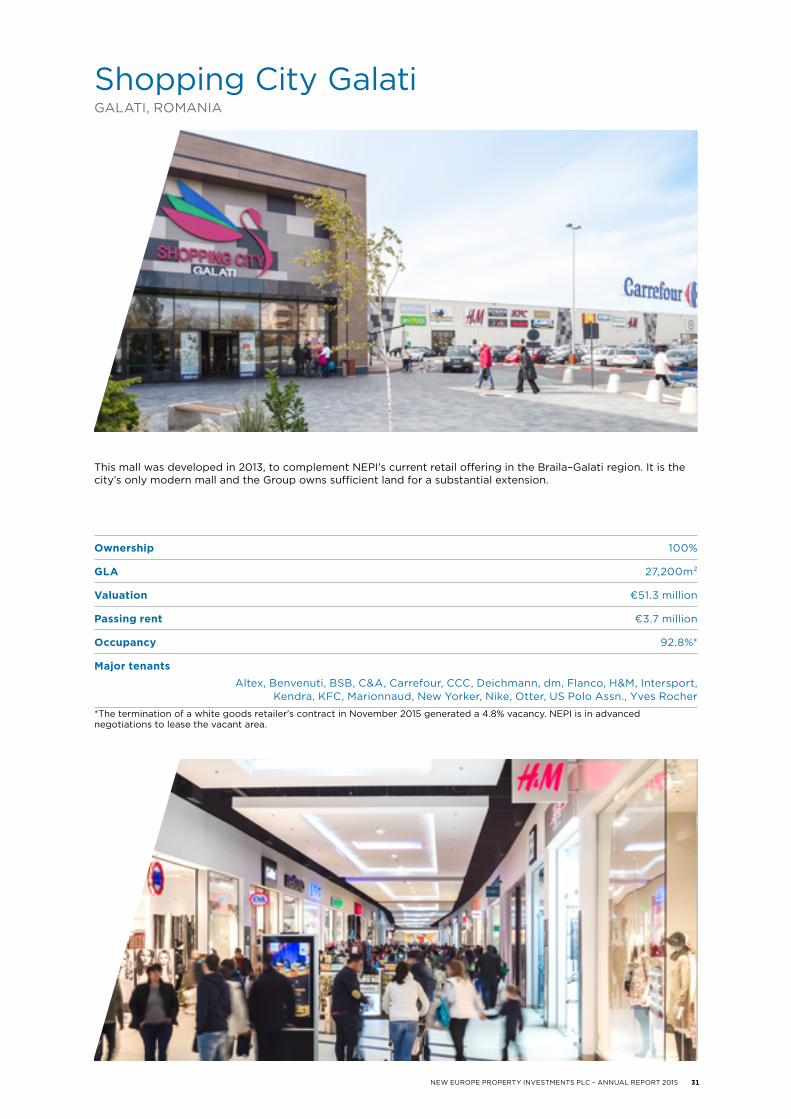
Ownership 100%
GLA 27,200m²
Valuation €51.3 million
Passing rent €3.7 million
Occupancy 92.8%*
Major tenantsAltex, Benvenuti, BSB, C&A, Carrefour, CCC, Deichmann, dm, Flanco, H&M, Intersport,
Kendra, KFC, Marionnaud, New Yorker, Nike, Otter, US Polo Assn., Yves Rocher
*The termination of a white goods retailer's contract in November 2015 generated a 4.8% vacancy. NEPI is in advanced negotiations to lease the vacant area.
This mall was developed in 2013, to complement NEPI’s current retail offering in the Braila–Galati region. It is the city’s only modern mall and the Group owns sufficient land for a substantial extension.
Shopping City GalatiGALATI, ROMANIA
32 NEW EUROPE PROPERTY INVESTMENTS PLC – ANNUAL REPORT 2015
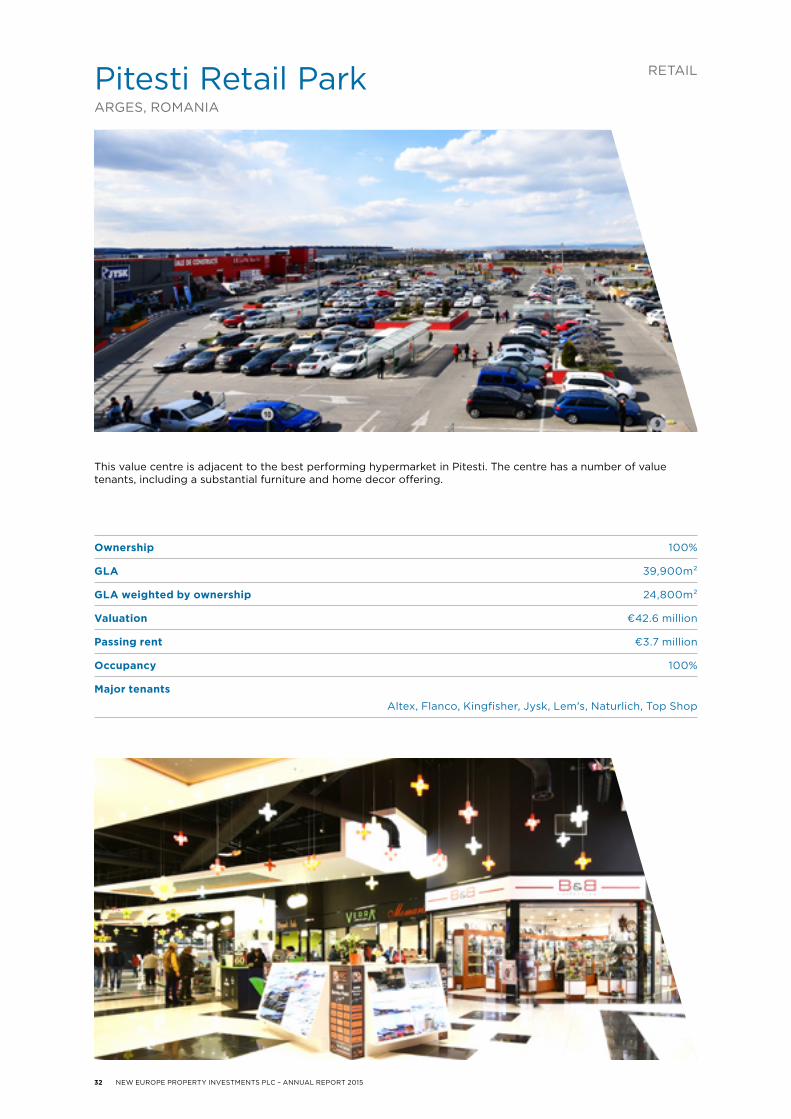
Ownership 100%
GLA 39,900m²
GLA weighted by ownership 24,800m²
Valuation €42.6 million
Passing rent €3.7 million
Occupancy 100%
Major tenantsAltex, Flanco, Kingfisher, Jysk, Lem's, Naturlich, Top Shop
This value centre is adjacent to the best performing hypermarket in Pitesti. The centre has a number of value tenants, including a substantial furniture and home decor offering.
Pitesti Retail ParkARGES, ROMANIA
RETAIL

NEW EUROPE PROPERTY INVESTMENTS PLC – ANNUAL REPORT 2015 33
Ownership 100%
GLA 21,900m²
Valuation €40 million
Passing rent €3.4 million
Occupancy 94.1%*
Major tenantsAsian Wok, Bata, C&A, Cineplexx, Deichmann, Home Centre, Idea, McDonald's, New Yorker,
Nike, Orsay, Sport Vision, Terranova, Tom Tailor
*The termination of a fashion retailer's contract generated a 3.7% vacancy. NEPI is in advanced negotiation to lease the vacancy to international fashion brands.
Kragujevac Plaza is Serbia’s only mall outside the capital city. The centre opened in 2012 and dominates the region. It is the Group’s first Serbian acquisition, and will serve as a platform for prudent further expansion in Serbia and neighbouring countries.
Kragujevac PlazaKRAGUJEVAC, SERBIA

34 NEW EUROPE PROPERTY INVESTMENTS PLC – ANNUAL REPORT 2015
Ownership 50%
GLA 46,400m²
GLA weighted by ownership 23,200m²
Valuation weighted by ownership €41.2 million
Passing rent weighted by ownership €3.2 million
Occupancy 97.0%
Major tenantsAltex, Bershka, Carrefour, CCC, Chopstix, Cinema City, Deichmann, Douglas, Flanco, H&M,
Intersport, Lem's, LC Waikiki, Kendra, KFC, Koton, Marionnaud, New Yorker, Orsay, Paul, Pizza Hut, Pull&Bear, Sabon, Sephora, Stradivarius, Takko, Yves Rocher, Zara
This is the dominant mall in Prahova, a region with 760,000 residents. A smaller competing mall opened in late 2013. This development had no impact on trading levels of Ploiesti Shopping City, which continues its upward trend in sales since opening.
Ploiesti Shopping CityPRAHOVA, ROMANIA
RETAIL

NEW EUROPE PROPERTY INVESTMENTS PLC – ANNUAL REPORT 2015 35
Ownership 100%
GLA 26,900m²
Valuation €38.9 million
Passing rent €3.0 million
Occupancy 99.6%
Major tenantsAltex, Benvenuti, C&A, Carrefour, CCC, Deichmann, dm, Flanco, H&M, Jysk, Kendra, KFC,
Marionnaud, New Yorker, Orsay, Pepco, Salamander, Sensiblu, Spartan, Takko, Yves Rocher
The Group completed the development of this regional mall in Targu Jiu during 2014, within a year of the issuance of the building permit. The centre is located on one of the city’s main roads in a densely populated district.
Shopping City Targu JiuGORJ, ROMANIA

36 NEW EUROPE PROPERTY INVESTMENTS PLC – ANNUAL REPORT 2015
Ownership 100%
GLA 16,300m²
Valuation €23.3 million
Passing rent €2.0 million
Occupancy 100%
Major tenantsCarrefour, Kendra, Media Galaxy, Noriel, Orange, Pepco,
Raiffeisen, Sensiblu, Telekom, Yves Rocher, Zoomania
NEPI is progressing with the development of the 56,800m2 GLA of a regional mall situated in a densely populated district of Timisoara, Romania. The Carrefour hypermarket and service gallery with a total GLA of 16,300m2 opened in November 2015. The adjacent do-it-yourself store, owned by Dedeman, opened in October 2015.
Shopping City TimisoaraTIMISOARA, ROMANIA
HYPERMARKET AND GALLERY
RETAIL

NEW EUROPE PROPERTY INVESTMENTS PLC – ANNUAL REPORT 2015 37
Ownership 100%
GLA 20,900m²
Valuation €26.4 million
Passing rent €2.0 million
Occupancy 96.2%*
Major tenantsAltex, Benvenuti, Carrefour, CCC, Cinema City, Deichmann, Kendra,
KFC, Lee Cooper, New Yorker, Noriel, Orsay, Pepco, Sensiblu, Spartan, Takko
*Leasing of the extension advanced after year-end and occupancy level will reach 98% in the second quarter of 2016.
This regional mall was acquired in 2013. The first phase of the planned extension, comprising 4,400m2 GLA, includes a six-screen cinema, leisure and entertainment area and was completed in October 2015.
Severin Shopping CenterMEHEDINTI, ROMANIA

38 NEW EUROPE PROPERTY INVESTMENTS PLC – ANNUAL REPORT 2015
Ownership 100%
GLA 18,000m²
Valuation €8.1 million
Passing rent €1.5 million
Occupancy 100%
Major tenantsAltex, Carrefour, Benvenuti, CCC, Deichmann, Kendra, New Yorker, Orsay, Pepco, Sensiblu
Aurora Shopping Mall is situated on the main boulevard of Buzau, Romania, a major transit hub for two of the country’s main historical regions. NEPI plans to reconfigure and refurbish the mall, including building a cinema and improving the layout and tenant configuration.
Aurora Shopping MallBUZAU, ROMANIA
RETAIL

NEW EUROPE PROPERTY INVESTMENTS PLC – ANNUAL REPORT 2015 39
The value centres are located in Alba Iulia, Alexandria, Brasov, Petrosani, Sfantu Gheorghe, Sighisoara and Vaslui. They are all benefiting from adjacent Carrefour or Kaufland hypermarkets.
Regional Value CentresROMANIA
GLA *85,900m²
GLA weighted by ownership 24,900m²
Valuation weighted by ownership €30.6 million
Passing rent weighted by ownership €2.5 million
Occupancy 100%
Major tenantsAltex, Animax, C&A, Deichmann, dm, Mobexpert, New Yorker, Noriel, Pepco, Takko
* The respective retail centres are part of larger retail schemes. The remaining balance of the GLA is owned by third parties.
PHOTO: VASLUI, VASLUI, ROMANIA
PHOTO: BRASOV VALUE CENTRE, BRASOV, ROMANIA

40 NEW EUROPE PROPERTY INVESTMENTS PLC – ANNUAL REPORT 2015
Floreasca Business Park is located in Bucharest’s new central business district, in close proximity to NEPI’s Promenada Mall and The Lakeview office building. In recent years this area has seen significant development, including new A-grade offices, a shopping mall and infrastructure.
Floreasca Business ParkBUCHAREST, ROMANIA
Ownership 100%
GLA 36,200m²
Valuation €103.0 million
Passing rent €7.4 million
Occupancy 99.1%
Major tenants
Berlin Chemie, BGP Products, Colliers, Daikin, DHL, Exxon Mobil, Federal Mogul, General Electric, Goodyear, Holcim, L'Oreal, Lenovo, Mars, Regus, Royal Canin, Sandoz, Wipro
OFFICE

NEW EUROPE PROPERTY INVESTMENTS PLC – ANNUAL REPORT 2015 41
NEPI has finalised the acquisition of City Business Centre in 2015, by adding the newest two buildings in the complex to its portfolio. The transaction was initiated through a Forward Purchase Agreement signed in 2012, when the first three buildings were acquired. The property is the largest A-grade office in Timisoara.
City Business CentreTIMIS, ROMANIA
Ownership 100%
GLA 47,100m²
Valuation €92.1 million
Passing rent €7.3 million
Occupancy 97.7%*
Major tenants3Pillar Global, Accenture, Alcatel, Autoliv, Banca Transilvania, Bosch, Deloitte,
Ernst&Young, Generali, Hella, IBM, Maerz Ofenbau, OMV Petrom, Raiffeisen Bank, Toluna, Unicredit Tiriac Bank, Unified Post, Visma, Wipro
*Vacancy excludes the rentable areas under earn-out arrangements, applicable to the buildings acquired in 2015.

42 NEW EUROPE PROPERTY INVESTMENTS PLC – ANNUAL REPORT 2015
This A-grade office building was acquired in 2013. It is located close to Floreasca Business Park and Promenada Mall, in Bucharest's new central business district.
The LakeviewBUCHAREST, ROMANIA
Ownership 100%
GLA 25,600m²
Valuation €67 million
Passing rent €5.1 million
Occupancy 95.3%*
Major tenants
Abbvie, Alcon, Huawei, LeasePlan, NEPI, Novartis, Philips, PricewaterhouseCoopers
*Part of this vacant space, representing 3.3% of the total GLA, will be leased during the second quarter of 2016.
OFFICE

NEW EUROPE PROPERTY INVESTMENTS PLC – ANNUAL REPORT 2015 43
After the completion of Phase I in 2014, the second phase of The Office, comprising 19,400m2 of A-grade office GLA, was completed in November 2015. Based on the continued strong demand for quality office space, construction of the third phase, consisting of 18,500m2 GLA, has commenced in January 2016. The Group is targeting its completion in 2017.
The OfficeCLUJ, ROMANIA
Ownership 50%
GLA 40,700m²
GLA weighted by ownership 20,350m²
Valuation weighted by ownership €38 million
Passing rent weighted by ownership €2.7 million
Occupancy (Phase I) 98.7%
Occupancy (Phase II) 60.4%*Major tenants
3Pillar Global, Betfair, Bombardier, Bosch, COS, Deloitte, Ernst&Young, HP, Leoni, Lohika Systems, MOL, National Instruments, Wolters Kluwer, Yardi, Yonder
* As of 14 March 2016 the occupancy level is 88%.
44 NEW EUROPE PROPERTY INVESTMENTS PLC – ANNUAL REPORT 2015
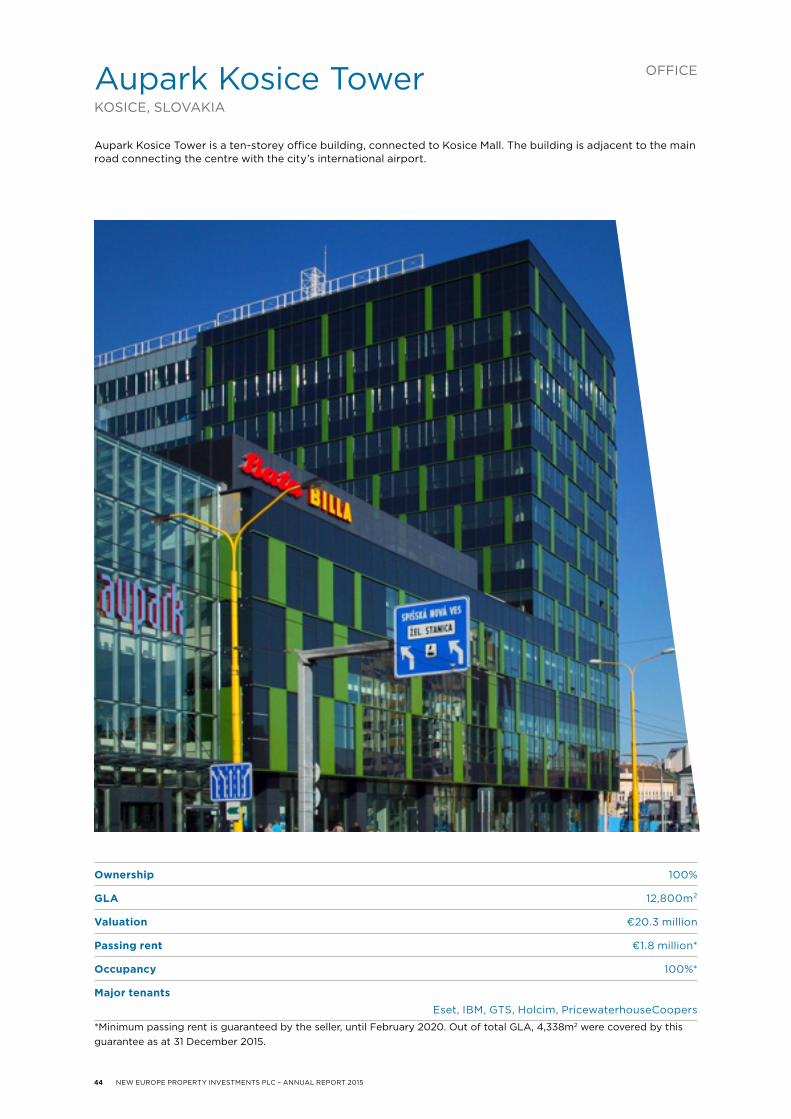
Ownership 100%
GLA 12,800m²
Valuation €20.3 million
Passing rent €1.8 million*
Occupancy 100%*
Major tenantsEset, IBM, GTS, Holcim, PricewaterhouseCoopers
*Minimum passing rent is guaranteed by the seller, until February 2020. Out of total GLA, 4,338m2 were covered by this guarantee as at 31 December 2015.
Aupark Kosice Tower is a ten-storey office building, connected to Kosice Mall. The building is adjacent to the main road connecting the centre with the city’s international airport.
Aupark Kosice TowerKOSICE, SLOVAKIA
OFFICE

NEW EUROPE PROPERTY INVESTMENTS PLC – ANNUAL REPORT 2015 45
Industrial PortfolioOTOPENI & RASNOV, ROMANIA
Ownership 100%
GLA 27,900m²
Valuation €16.5 million
Passing rent €1.8 million
Occupancy 98.0%
Major tenantsDelamode, Dexion, DM Elektron, Psi Control, UPS
The Group owns two industrial properties: Rasnov Industrial Facility (Brasov county) and Otopeni Warehouse (adjacent to Bucharest's international airport).
PHOTO: OTOPENI WAREHOUSE, ILFOV, ROMANIA

46 NEW EUROPE PROPERTY INVESTMENTS PLC – ANNUAL REPORT 2015
Portfolio overview
The Group has steadily increased its investment in developments and, during the last five years, completed developments and redevelopments have significantly contributed to the growth in distributable earnings per share. NEPI’s development pipeline, including redevelopments and extensions, has increased to €601 million (estimated at cost), of which €145 million had been spent by 31 December 2015. This represents an increase of €54 million compared with the previous year.
DEVELOPMENTS AND EXTENSIONS PIPELINE
600
Committed: projects currently under constructionControlled: projects where the land is controlled, but not yet under constructionCapitalised interest not included
Finalised Money spent Committed Controlled Further opportunities
(200) 4002000
DEC 2014
DEC 2015
€m
CLUJ-NAPOCA
TIMISOARA
CONSTANTABUCHAREST
23
1
DROBETATURNU SEVERIN
4
PIATRA NEAMT
24
1
SATU MARE
3
BRAILA
5
SFANTUGHEORGHE
6
VASLUI
6
UNDER CONSTRUCTION
1. Shopping City Timisoara - Fashion and Entertainment section
2. City Park extension - Phase II
3. Victoriei Office
4. Severin Shopping Center extension - Phase II
UNDER PERMITTING AND PRE-LEASING
1. Promenada Mall extension
2. Shopping City Piatra Neamt
3. Shopping City Satu Mare
4. The Office – Phase III
5. Braila Mall extension
6. Regional value centres extension
DEVELOPMENTS AND EXTENSIONS MAP
» continued

NEW EUROPE PROPERTY INVESTMENTS PLC – ANNUAL REPORT 2015 47
The first phase of this development was completed in November 2015 and includes a Carrefour hypermarket and the adjacent gallery. The phase currently under development will include international and national fashion brands, a thirteen-screen cinema with an IMAX and a 4DX auditorium, and other entertainment and leisure facilities. It is scheduled for opening on 31 March 2016. The Group has the available land to extend the centre to up to 80,000m2.
Shopping City TimisoaraTIMISOARA, ROMANIA
Ownership 100%Lettable area - Hypermarket and Gallery 16,300m2
Estimated lettable area - Fashion and Entertainment 40,500m2
Passing rent - Hypermarket and Gallery €2.0 millionEstimated rental value - Fashion and Entertainment €5.6 million
Targeted opening Q1 2016
Major tenants - Fashion and Entertainment
Adidas, Bershka, C&A, CCC, Cinema City, Collin's, Cropp, Deichmann, dm, Douglas, Flanco, H&M, Hervis, Intersport, KFC, Koton, LC Waikiki, Lee Cooper, Levi's, Motivi, New Yorker, Orsay, Pimkie,
Pizza Hut, Pull&Bear, Pupa, Sephora, Sport Vision, Stradivarius, Tom Tailor, Top Shop, Vodafone, Zara
FASHION AND ENTERTAINMENT
RENDER
RETAIL

48 NEW EUROPE PROPERTY INVESTMENTS PLC – ANNUAL REPORT 2015
Ownership 100%
Lettable area - Property in use 30,300m²
Estimated lettable area - Extension under construction 19,500m²
Passing rent - Property in use €7.6 million
Estimated rental value - Extension under construction €4.1 million
Targeted opening of extension Q2 2016
Major tenants - ExtensionC&A, CCC, Colin’s, Geox, DS Damat, H&M, House, Lego, Levi's, MAC, Mohito, Motivi, New Yorker,
Noriel, Orsay, Paul, Pimkie, Pupa, Reserved, Sabon, Sephora, Tommy Hilfiger, World Class, Zara Home
Phase II of the extension, comprising 19,500m2 GLA of international fashion brands is scheduled for opening in Q2 2016. After completion, City Park’s GLA will increase to 49,800m2 and will establish the mall as the dominant retail centre in the region.
City Park extension - Phase IICONSTANTA, ROMANIA
RENDER
RETAIL

NEW EUROPE PROPERTY INVESTMENTS PLC – ANNUAL REPORT 2015 49
The planned extension of Promenada Mall will include approximately 64,000m2* gross leasable area of mixed-use fashion, leisure, entertainment and office space.
Promenada Mall extensionBUCHAREST, ROMANIA
Ownership 100%
Lettable area - Property in use 40,400m²
Estimated lettable area - Mall Extension up to 34,000m²
Estimated lettable area - Office extension up to 30,000m²
Passing rent - Property in use €10.1 million
Targeted opening of extension 2018
* Promenada Mall’s extension’s GLA depends on permitting.
RENDER
50 NEW EUROPE PROPERTY INVESTMENTS PLC – ANNUAL REPORT 2015
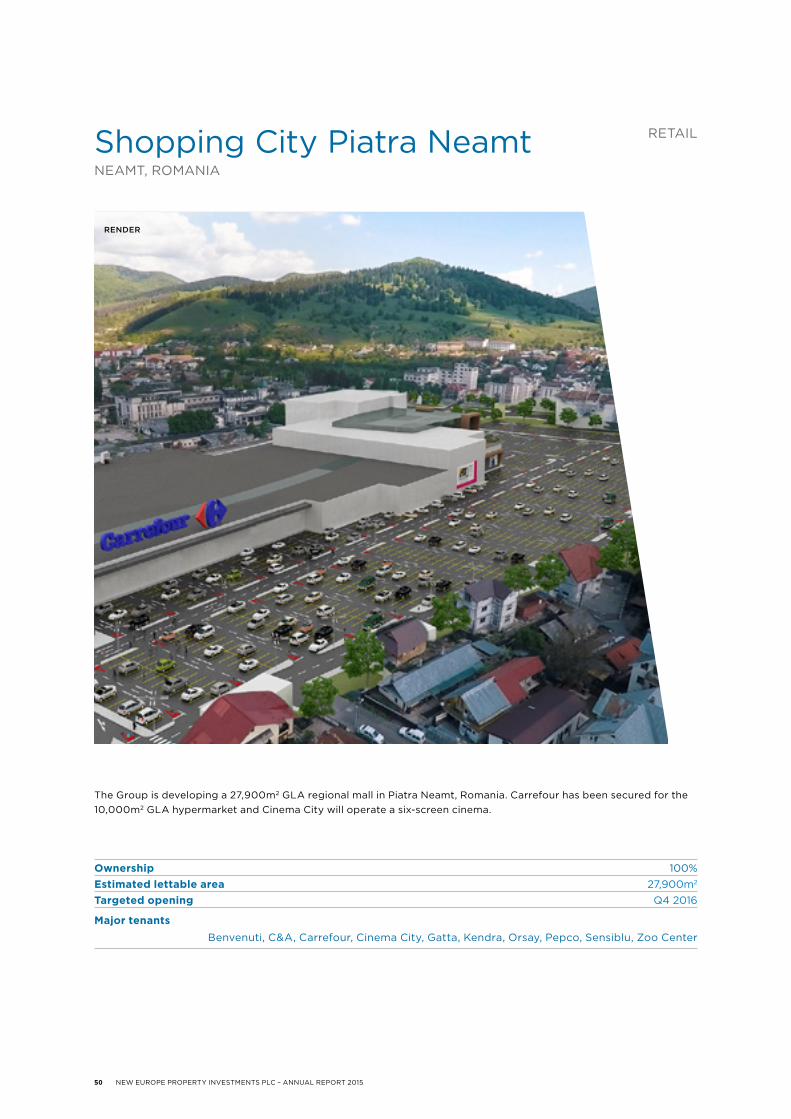
The Group is developing a 27,900m2 GLA regional mall in Piatra Neamt, Romania. Carrefour has been secured for the 10,000m2 GLA hypermarket and Cinema City will operate a six-screen cinema.
Shopping City Piatra NeamtNEAMT, ROMANIA
Ownership 100%Estimated lettable area 27,900m2
Targeted opening Q4 2016
Major tenantsBenvenuti, C&A, Carrefour, Cinema City, Gatta, Kendra, Orsay, Pepco, Sensiblu, Zoo Center
RENDER
RETAIL
NEW EUROPE PROPERTY INVESTMENTS PLC – ANNUAL REPORT 2015 51
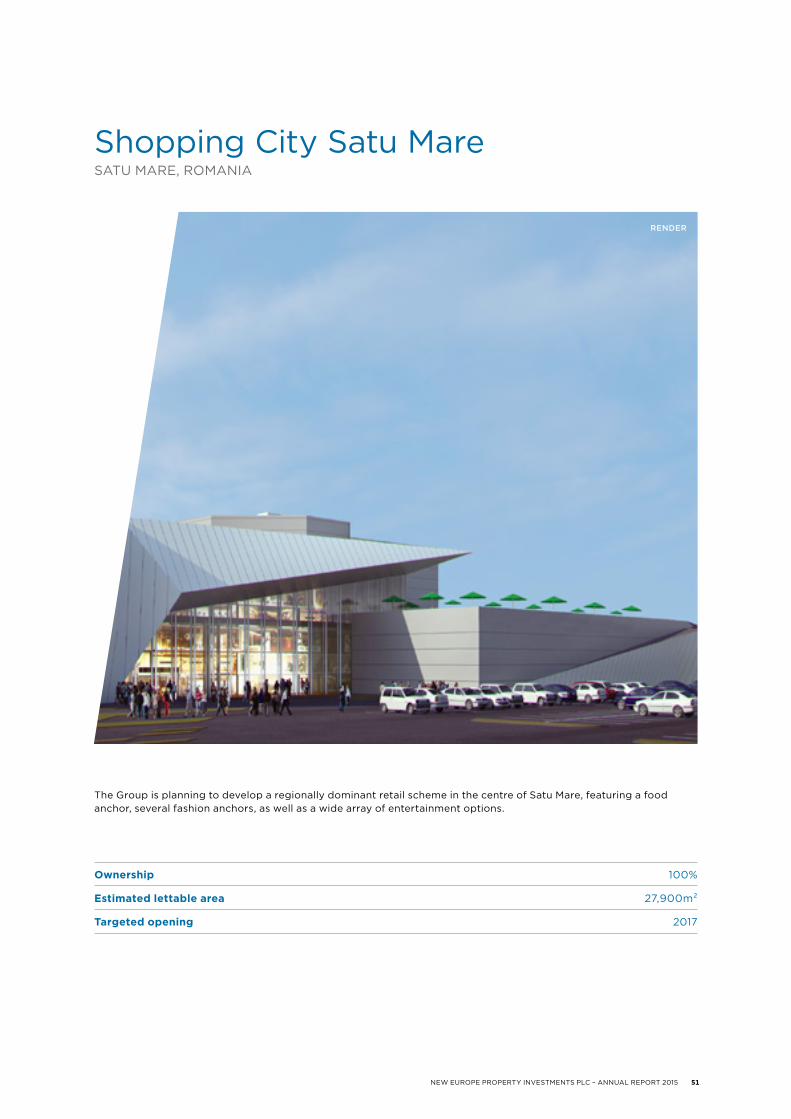
The Group is planning to develop a regionally dominant retail scheme in the centre of Satu Mare, featuring a food anchor, several fashion anchors, as well as a wide array of entertainment options.
Shopping City Satu MareSATU MARE, ROMANIA
Ownership 100%
Estimated lettable area 27,900m²
Targeted opening 2017
RENDER

52 NEW EUROPE PROPERTY INVESTMENTS PLC – ANNUAL REPORT 2015
Ownership 100%
Lettable area - Property in use 54,800m²
Estimated lettable area - Extension 2,400m²
Passing rent - Property in use €5.5 million
Targeted opening of extension Q4 2016
The Group is planning to redevelop the food court and extend the fashion offering of the centre in 2016, based on strong tenant demand. Negotiations are in progress with renowned fashion anchors.
Braila Mall extensionBRAILA, ROMANIA
RENDER
RETAIL

NEW EUROPE PROPERTY INVESTMENTS PLC – ANNUAL REPORT 2015 53
Due to the success of the value centres and demand from the tenants, the Group is able to develop extensions on some of the land available in Sfantu Gheorghe and Vaslui, adding to the fashion offering.
Value Centres
VasluiVASLUI, ROMANIA
Sfantu GheorgheHARGHITA, ROMANIA
RENDER: VASLUI VALUE CENTRE, VASLUI, ROMANIA
Ownership 100%
Lettable area - Property in use 1,800m²
Estimated lettable area - Extension 2,800m²
Passing rent - Property in use €0,2 million
Targeted opening of extension Q3 2016
Ownership 100%
Lettable area - Property in use 1,600m²
Estimated lettable area - Extension 1,000m²
Passing rent - Property in use €0,2 million
Targeted opening of extension Q2 2017

54 NEW EUROPE PROPERTY INVESTMENTS PLC – ANNUAL REPORT 2015
Based on the strong demand for quality office space, in January 2016, the Group started the development of a third phase of this A-grade office development. Various current tenants have expressed interest in renting additional office space.
The Office - Phase IIICLUJ, ROMANIA
RENDER
OFFICE
Ownership 50%
Lettable area - Property in use 40,700m²
Estimated lettable - Extension 18,500m²
Passing rent - Property in use €5.4 million
Targeted opening of Phase III Q3 2017

NEW EUROPE PROPERTY INVESTMENTS PLC – ANNUAL REPORT 2015 55
Ownership 100%
Lettable area 8,400m²
Estimated rental value €2.9 million
Targeted opening Q3 2016
Victoriei Office is a unique concept that includes the development of a modern, A-grade office and the refurbishment of a historical building. It is located in Victoriei Square, in central Bucharest, adjacent to the Romanian Government building.
Victoriei OfficeBUCHAREST, ROMANIA
RENDER
OFFICE

56 NEW EUROPE PROPERTY INVESTMENTS PLC – ANNUAL REPORT 2015
Analysis of shareholders and share trading
Number of shareholders31 Dec 2015
Percentage of shareholders31 Dec 2015
Number of shares held
31 Dec 2015
Percentage of issued shares
31 Dec 2015
Shareholder spread in terms of the JSE Listings RequirementsPublic 12,759 99.60 204,868,115 68.61
Non-public 51 0.40 93,722,449 31.39
Out of which Directors and employees 44 0.34 11,448,975 3.83
TOTAL 12,810 100.00 298,590,564 100.00
Size of holding (shares)Up to 2,500 10,014 78.17 6,767,379 2.27
2,501 – 10,000 1,632 12.74 7,988,985 2.67
10,001 – 100,000 882 6.89 26,961,100 9.03
100,001 – 1,000,000 239 1.87 81,329,812 27.24
1,000,001 – 3,500,000 30 0.23 58,445,622 19.57
Over 3,500,000 13 0.10 117,097,666 39.22
TOTAL 12,810 100.00 298,590,564 100.00
Registered shareholders owning 5% or more of issued sharesNumber of
shares heldPercentage of issued shares
31 Dec 2015Fortress Income Fund Ltd 51,800,000 17.35
Public Investment Corporation 30,473,474 10.21
Resilient REIT Limited 24,190,000 9.34
TOTAL 110,173,474 36.90
31 Dec 2014Resilient REIT Limited 25,820,000 9.28
Fortress Income Fund Ltd 24,525,000 8.82
Capital Property Fund Ltd 24,190,000 8.70
Gepf Equity 18,119,035 6.51
TOTAL 92,654,035 33.31
Beneficial shareholding of 5% or more of issued sharesNumber of
shares heldPercentage of issued shares
31 Dec 2015Fortress Income Fund Ltd 51,800,000 17.35
Public Investment Corporation 30,473,474 10.21
Resilient REIT Limited 27,900,000 9.34
TOTAL 110,173,474 36.90
31 Dec 2014Resilient REIT Limited 25,820,000 9.28
Fortress Income Fund Ltd 24,525,000 8.82
Capital Property Fund Ltd 24,190,000 8.70
Gepf Equity 18,119,035 6.51
TOTAL 92,654,035 33.31

NEW EUROPE PROPERTY INVESTMENTS PLC – ANNUAL REPORT 2015 57
Beneficial shareholding of Directors
At 31 Dec 2015Direct
holdingIndirect holding
Total shares
held
Percentage of issued
sharesDesmond de Beer – 8,492,338 8,492,338 2.84
Jeffrey Zidel 298,201 1,833,229 2,131,430 0.71
Alexandru Morar – 742,951 742,951 0.25
Tiberiu Smaranda – 455,000 455,000 0.15
Mirela Covasa – 271,629 271,629 0.09
TOTAL 298,201 11,795,147 12,093,348 4.04
At 31 Dec 2014Desmond de Beer – 9,027,912 9,027,912 3.25
Martin Slabbert – 5,022,596 5,022,596 1.81
Jeffrey Zidel 293,676 1,904,697 2,198,373 0.79
Victor Semionov – 1,429,194 1,429,194 0.52
Alexandru Morar – 1,353,894 1,353,894 0.49
Tiberiu Smaranda – 972,537 972,537 0.35
Dan Pascariu – 164,813 164,813 0.06
TOTAL 293,676 19,875,643 20,169,319 7.25
There were no changes to beneficial shareholdings for Directors after the year end.
PHOTO: MEGA MALL, BUCHAREST, ROMANIA

58 NEW EUROPE PROPERTY INVESTMENTS PLC – ANNUAL REPORT 2015
Corporate governance
The Board recognises the importance of sound corporate governance, endorses and monitors compliance with the King III Report on Corporate Governance in South Africa and the Quoted Companies Alliance Corporate Governance Guidelines for Smaller Quoted Companies in the UK. The Board confirms that the Company is compliant with the provisions of King III in all material respects. A register of the 75 King III principles and the Company’s compliance with them is available on the Company website.
The Directors recognise the need to manage the Group with integrity and to provide effective leadership based on an ethical foundation. This includes timely, relevant and meaningful reporting to shareholders and other stakeholders, that provide a proper and objective overview on the Company and its activities, directing the strategy and operations of the Group with the intention of building a sustainable business, and considering the short and long-term impact of this strategy on the economy, society and the environment. The Board will ensure that the Group is a responsible corporate citizen through the corporate governance policies detailed below.
BOARD OF DIRECTORS
The Board comprises six independent non-executive directors and three executive directors. The roles of Chair and Chief Executive Officer are clearly defined to ensure a balance of power. The Directors of the Company are listed on pages 6 and 7. The Board’s main functions include:
— adopting strategic plans and ensuring they are carried out by Management;
— considering and approving major issues, including acquisitions, disposals and reporting;
— monitoring NEPI’s operational performance, and— overseeing the effectiveness of the internal controls
designed to ensure that assets are safeguarded, proper accounting records are maintained and that the financial information on which business decisions are made and which is issued for publication is reliable.
The Directors’ varied backgrounds and experience provide NEPI with an appropriate mix of knowledge and expertise that is necessary to manage the business effectively. Furthermore, a clear division of responsibilities at Board level ensures a balance of power and authority, so that no individual can take unilateral decisions. The Board aims to meet formally at least quarterly. There are no external advisors who regularly attend, or are invited to, attend Board committee meetings. Company policies and procedures are adopted by all subsidiaries.
The Board is confident that the Group has established an effective framework and processes for compliance with laws, codes, rules and standards. There were no material or immaterial regulatory penalties, sanctions or fines for contravening or non-compliance with statutory obligations imposed on the Group companies or any of its directors or officers.
APPOINTMENT OF DIRECTORS
Directors are appointed by the Board or at the Annual General Meeting (AGM). Board appointed directors need to be re-appointed by the shareholders at the subsequent AGM. The longest serving third of the directors must be re-appointed by the shareholders annually. Board appointments are conducted in a formal and transparent manner by the entire Board following reccomendations made by the Nomination Committee.
INVESTMENT COMMITTEEMembers: Desmond de Beer (Chair), Jeffrey Zidel and Alex Morar
The Investment Committee considers all acquisitions, developments and investment sales. Appropriate investments or disposals are subsequently presented to the Board for consideration.
REMUNERATION COMMITTEEMembers: Desmond de Beer (Chair), Jeffrey Zidel and Robert Reinhardt Emslie
The Remuneration Committee assesses and recommends to the Board the remuneration and incentivisation of the Company’s directors.

NEW EUROPE PROPERTY INVESTMENTS PLC – ANNUAL REPORT 2015 59
NOMINATION COMMITTEEMembers: Dan Pascariu (Chair), Jeffrey Zidel and Michael Mills
The Nomination Committee helps the Board of Directors identify individuals qualified to become Board members and makes recommendations regarding Board composition.
RISK COMMITTEEMembers: Nevenka Pergar (Chair), Michael Mills and Mirela Covasa
In February 2015, the Board decided to separate the Audit and Risk Committee into two distinct committees.
The Risk Committee develops a risk management policy and monitors its implementation. The Group’s risk management policies identify and analyse Group risks, set appropriate limits and controls and monitor risks and adherence to limits. The Directors have overall responsibility for the Group’s internal control and for reviewing its effectiveness.
The controls identify and manage Group risks rather than completely eliminating failure. Therefore, internal controls provide reasonable, but not absolute, assurance against material misstatement or loss. The implementation and operation of these systems is the responsibility of the management and processes are communicated regularly to employees informing them of their responsibilities. Systems include strategic planning, appointment of qualified staff, regular reporting and monitoring of performance and effective control over investments. Internal financial control is appropriate for the size and activities of the Group.
Significant risks identified are communicated to the Board, together with the recommended actions.
AUDIT COMMITTEEMembers: Michael Mills (Chair), Nevenka Pergar and Robert Reinhardt Emslie
The Audit Committee, comprising three independent non-executive directors, meets at least four times a year and is primarily responsible for the Group’s financial performance being properly reported on and monitored, including reviewing the annual and interim accounts, results announcements, internal control systems and procedures, and accounting policies.
Internal financial controls are based on comprehensive and regular reporting. Detailed revenue, cash flow and capital forecasts are prepared and updated throughout the year, and approved by the Board.
The Audit Committee is primarily responsible for making recommendations to the Board regarding the appointment, re-appointment and removal of the external auditor. It ensures the scope of the auditor’s work is sufficient and that they are fairly remunerated. In accordance with Company policy, the Committee also supervises the appointment of the auditor for non-audit services and reviews external audit plans and the results of their work. The Committee meets with the external auditor to discuss and review the accounts and audit procedures.
The Board has concluded that committee members have the necessary skills and experience to make worthwhile contributions to the committee’s deliberations. Additionally, the Chair has the requisite accounting and financial management experience. The Committee has considered and found the expertise and experience of the Finance Director appropriate for the position.
The Committee met five times during the financial year. In order to fulfill its responsibility of monitoring the integrity of financial reports issued to shareholders, the Audit Committee has reviewed the accounting principles, policies and practices adopted during the preparation of financial information and examined documentation relating to the Annual Report and interim financial statements. The clarity of disclosures included in the financial statements was reviewed by the Audit Committee, as was the basis for significant estimates and judgements. The Audit Committee complied with its legal and regulatory responsibilities and the Company Charter, and recommended the Annual Report to the Board for approval.

60 NEW EUROPE PROPERTY INVESTMENTS PLC – ANNUAL REPORT 2015
Corporate governance
ATTENDANCE AT BOARD AND COMMITTEE MEETINGS IN 2015
BoardInvestment Committee
Audit Committee^
Risk Committee^
Remuneration Committee
Nomination Committee
Alexandru Morar 4/4 5/5
Dan Pascariu 4/4 1/1 1/1
Desmond de Beer 4/4 5/5 1/1
Dewald Joubert* 4/4 5/5 1/1
Jeffrey Zidel 4/4 5/5 5/5 1/1
Martin Slabbert** 2/4 2/5
Michael Mills 4/4 5/5 1/1 1/1
Mirela Covasa 4/4 1/1
Nevenka Pergar 4/4 1/1
Robert Reinhardt Emslie*** 0/4
Tiberiu Smaranda 4/4
Victor Semionov** 2/4
* Resigned on 30 December 2015 ** Resigned on 7 August 2015 *** Appointed on 4 February 2016 ^ The Audit and Risk Committee was separated into two committees in February 2015
» continued
EXTERNAL AUDIT
The external auditor confirmed to the Audit Committee its independence from the Group during the year. The Committee considered the information pertaining to the external auditor’s relationships with the Group that might reasonably have a bearing on the external auditor’s independence and the audit engagement partner and employees’ objectivity, as well as related safeguards and procedures, and concluded that the external auditor’s independence was not impaired. The Committee approved the external auditor’s terms of engagement and scope of work. Currently, this includes the audit of the annual consolidated and separate financial statements of the Group and its subsidiaries. Based on the submitted reports, the Committee reviewed, in conjuction with the external auditor, their findings and confirmed that all significant matters had been satisfactorily resolved.
GOVERNANCE OF STAKEHOLDERS’ RELATIONSHIPSThe main stakeholders are considered to be shareholders, employees, tenants, suppliers, fixed income investors, fiscal administrations of the locations where the Group carries out its activities and the banks they have entered into contractual agreements. NEPI has a transparent information communication policy, to enable stakeholders to assess the Group’s economic value and prospects. The Group did not refuse any requests for information in accordance with the Promotion of Access to Information Act (2000).
INTERNAL AUDIT
During 2011, the Group implemented an internal audit function, performed by an independent, professional firm which reported directly to the Chief Executive Officer and the Chair of the Audit Committee. In 2015 the Group hired an internal audit manager, with extensive experience in fraud investigation, cost reduction and organisational restructuring, with a view to optimise business processes as well as to identify and mitigate related operational risks.
The Internal auditor carries out risk-oriented audits of operational and functional activities, based on the guidance of the Audit Committee.
The Audit Committee also examined and discussed with the auditor the appropriateness of internal controls and the utilisation of the Internal auditor and made recommendations to the Board
COMPANY SECRETARY
All Directors have access to the advice of the Company Secretary, who provides guidance to the Board and to individual members regarding how to properly discharge their responsibilities.
The Board considers the Company Secretary's ability to perform his duties on an annual basis.
After careful consideration, the qualifications, experience and competence of the Company Secretary, Cornelius Eduard Cassell, were deemed appropriate by the Board of Directors. The Directors also concluded that the relationship with the Company Secretary, who is not a member of the Board of Directors and is not involved in the day to day management of the Company, is at arm’s length and there is no conflict of interests.

NEW EUROPE PROPERTY INVESTMENTS PLC – ANNUAL REPORT 2015 61
DIRECTORS’ REMUNERATION
Remuneration policy is aligned with the Group’s strategic objective of creating long-term sustainable value for shareholders.
Directors received base pay only, as bonuses have not been part of Company policy. Executive salaries are competitive and increases are determined by reference to individual performance, inflation and market-related factors. Directors’ remuneration for 2015 is disclosed in Note 36 to the financial statements.
Share purchase scheme allocations have been determined annually by the Remuneration Committee based on performance. The Group provided loans to participants for the purpose of acquiring shares.
No share purchase scheme allocations have been made during 2015, as the Company was reconsidering its remuneration policy. In February 2016, the Remuneration Committee has proposed and the Board has approved the salient features of a new remuneration scheme, which will combine a base salary, a short term KPI-based share award and a further long-term KPI-based share-award. A circular containing the details of such new scheme will be published for shareholders’ approval, upon receipt of adequate confirmations from relevant regulatory bodies.
There are no remuneration schemes encouraging retention, apart from those rewarding performance.
GOVERNANCE OF INFORMATION TECHNOLOGY
The Board confirms that processes exist ensuring timely, relevant, accurate and accessible IT reporting from management.
COMMUNICATIONThe Board accepts its accountability to shareholders for the Group’s performance and activities. NEPI communicates with shareholders principally through its website, Annual Report and announcements. The AGM gives the Directors the opportunity to inform shareholders about current, and proposed, operations and enables them to express their views on business activities.
DIRECTORS’ DEALINGS
Dealing in Company securities by Directors, their associates, and Company officials is regulated and monitored in accordance with the JSE Listings Requirements, AIM Rules and BVB Requirements. NEPI maintains a closed period from the end of a financial period to publication of the financial results.
ETHICS
NEPI is committed to ethical behaviour throughout its business. Its ethical standards are the principles of honesty, integrity, fairness and transparency and are applicable to the Group’s shareholders, employees, customers, partners, service providers, government, society and the community.
EMPLOYEESThe Group’s employees are essential to its success and the Company is committed to treating them with dignity, trust and respect, and to build long-term relationships based on enforceable employment legislation and respect for human rights.
CUSTOMERSCustomer satisfaction is an overriding concern for the Group, and plays a vital role in property management. In the current highly competitive environment, the Group’s success depends on meeting customers’ needs.
GOVERNMENTThe Group seeks to build and manage a sound relationship with governmental authorities on an arm’s length basis. No attempts to improperly influence governmental decisions by offering, paying, soliciting, or accepting bribes, in any shape or form are tolerated.

62 NEW EUROPE PROPERTY INVESTMENTS PLC – ANNUAL REPORT 2015
PHOTO: PROMENADA MALL, BUCHAREST, ROMANIA

NEW EUROPE PROPERTY INVESTMENTS PLC – ANNUAL REPORT 2015 63
Corporate governance
» continued
SOCIAL AND ENVIRONMENTAL RESPONSIBILITYThe Group is an integral part of the community in which it operates and is committed to building sound relationships, based on trust, honesty, and fairness. Not only is environmental compliance legally obligatory, but it is also an important component of the Group’s commitment to the community and developing its good reputation. NEPI therefore is dedicated to minimising the environmental impact of its activities by reducing waste, emissions and discharges, and using energy efficiently.
CONFLICT OF INTERESTA conflict of interest arises whenever an employee’s position or responsibilities present an opportunity for personal gain inconsistent with the Group’s best interest. Individuals are responsible for their own ethical behaviour, and are expected to act, at all times and in all ways, in the best interests of the Company. If and when they consider a conflict of interest exists, the Compliance Officer is to be notified immediately. A dedicated Compliance register is regularly updated and submitted to the Board for review and approval.
INSIDER TRADINGThe Group prohibits all managers and employees from using confidential information, not generally known or available to the public, for personal gain.
EQUAL EMPLOYMENT AND NON-DISCRIMINATIONThe Group maintains the highest ethical standard and complies with all applicable legislation, rules, and regulations. The Group’s continued success depends on employing the most qualified people and establishing a working environment free from discrimination, harassment, intimidation or coercion based on race, religion, gender, age, nationality or disability.

64 NEW EUROPE PROPERTY INVESTMENTS PLC – ANNUAL REPORT 2015
Risk description Impact areas Key mitigants
INVESTMENTS– Delays in executing appropriate
property investment and development strategies, or executing in less favourable conditions
- Increased pressure from competition due to availability of capital on the market
– Net asset value– Total property return
(income and capital)– Shareholder earnings (distribution)
– Defined investment strategy– Defined asset appraisal process– Review of all opportunities against
predetermined criteria– Monitoring of macroeconomic
and property market trends- Analysing an extensive pipeline
DEVELOPMENTS– Development and construction
risk including contractor solvency and availability
– Reduced development returns– Cost overruns– Programme delays leading to
potential loss of occupier revenue– Failure to secure planning permission
– Close supply chain relationships facilitate assessment and monitoring
– Assessment of contractors prior to appointment
INVESTOR DEMAND– Decrease in demand by
investors for real estate– Net asset value– Potential pressure on banking covenants
– Investing in prime properties– Strong financial covenants– Active asset management
OFFICE OCCUPIER MARKET– Weakened occupier demand for
office developments, oversupply and potential vacancies due to financial market rationalisation and economic uncertainty
– Rental income and cash flow– Reduced strength of occupier covenant
and increased arrears/bad debts– Cost of occupier incentives
for new lettings– Empty unit (void) costs– Net asset value
– Focus on long-lease profiles– High occupancy– Quality assets easier to re-let
RETAIL OCCUPIER MARKET– Reduced retail occupier demand
for space, increased supply and occupier defaults
– Rental income and cash flow– Empty unit (void) costs– Net asset value
– Diversified occupier base– Long leases and strong financial covenants– Quality assets easier to re-let– Close occupier relationships assist in
understanding changing requirements– Review of consumer trends– Retail occupiers at risk monitored regularly
FINANCING AVAILABILITY– Shortage of financing or
re-financing at acceptable cost
– Adverse changes in macroeconomic conditions or NEPI's performance may lead to rating downgrade and/or unavailability of capital
– Inability to fund property investments or development programme
– Increased cost of finance
– Spread of sources and maturity of facilities– Committed but undrawn facilities maintained– Continuing and extensive capital market
and bank relationship management
COST OF FINANCE– Adverse interest rate movements – Increased cost of borrowing and hedging – Conservative interest hedging policy
– Exposure reduced by replacing variable interest loans with fixed interest bonds
– Hedging effectiveness regularly monitored
CREDIT RISK
– Financial counterparty credit risk – Loss of hedge– Loss of deposits– Cost of rearranging facilities– Incremental changes in financing rate
– Summary of exposures by bank and credit ratings reviewed monthly
– Spread of sources and maturity of facilities– Cash placed across a range of deposit accounts– Credit worthiness of derivative
counterparties assessed
Key risk factorsThe Group’s main risks relate to property and finance. The overall philosophy of the Group is conservative, whilst tolerating the inherent property risks, including fluctuations in asset value, vacancies and volatility in rents. Key risks are assessed by ranking exposure on the basis of probability and magnitude, while sensitivity analysis is conducted at Group level. Other risks, notably those related to interest and exchange rates, are closely managed and actively hedged. Potential breaches of loan or bond covenants are minimised through a conservative financing policy and a regular, close review of compliance indicators. Changes in fiscal legislation in the markets where the Group operates are expected to result in increasing tax expenses in the future.
The Group has appropriate internal risk management and control systems. Key elements of the systems are: a management structure to enable effective decision making; monthly review of key performance indicators, including turnovers, rent collection, vacancies, arrears and doubtful debtors, and regular review of performance against budgets. Strict procedures are also observed for the periodic production of monthly, quarterly and annual figures based on policies. The internal management reporting system identifies developments in the value of investments, income and expenses. Electronic data processing is used within automated information systems, including a back-up and recovery plan to restore data.
The Internal auditor provides detailed reports with suggested improvements for management. The Board reviews the auditors' conclusions on the internal control environment, supervises the internal control framework and procedures and takes appropriate action.
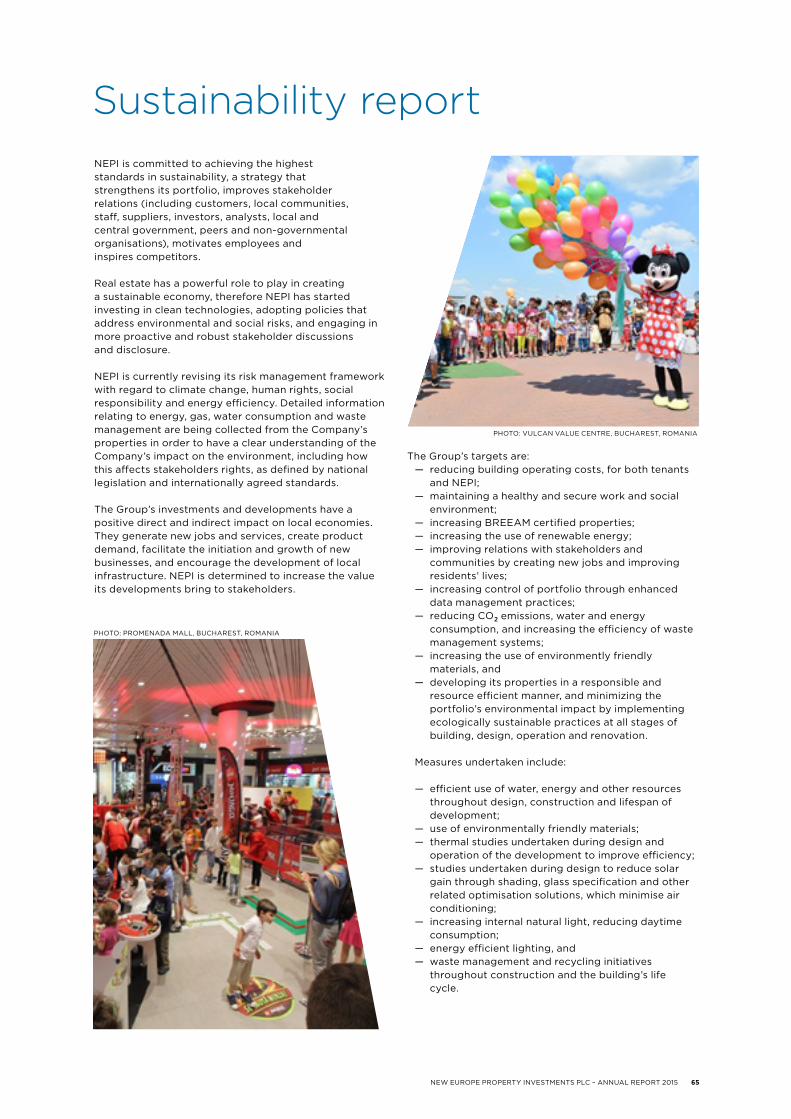
NEW EUROPE PROPERTY INVESTMENTS PLC – ANNUAL REPORT 2015 65
NEPI is committed to achieving the highest standards in sustainability, a strategy that strengthens its portfolio, improves stakeholder relations (including customers, local communities, staff, suppliers, investors, analysts, local and central government, peers and non-governmental organisations), motivates employees and inspires competitors.
Real estate has a powerful role to play in creating a sustainable economy, therefore NEPI has started investing in clean technologies, adopting policies that address environmental and social risks, and engaging in more proactive and robust stakeholder discussions and disclosure.
NEPI is currently revising its risk management framework with regard to climate change, human rights, social responsibility and energy efficiency. Detailed information relating to energy, gas, water consumption and waste management are being collected from the Company’s properties in order to have a clear understanding of the Company’s impact on the environment, including how this affects stakeholders rights, as defined by national legislation and internationally agreed standards. The Group’s investments and developments have a positive direct and indirect impact on local economies. They generate new jobs and services, create product demand, facilitate the initiation and growth of new businesses, and encourage the development of local infrastructure. NEPI is determined to increase the value its developments bring to stakeholders.
The Group’s targets are:— reducing building operating costs, for both tenants
and NEPI;— maintaining a healthy and secure work and social
environment;— increasing BREEAM certified properties;— increasing the use of renewable energy;— improving relations with stakeholders and
communities by creating new jobs and improving residents’ lives;
— increasing control of portfolio through enhanced data management practices;
— reducing CO2 emissions, water and energy consumption, and increasing the efficiency of waste management systems;
— increasing the use of environmently friendly materials, and
— developing its properties in a responsible and resource efficient manner, and minimizing the portfolio’s environmental impact by implementing ecologically sustainable practices at all stages of building, design, operation and renovation.
Measures undertaken include:
— efficient use of water, energy and other resources throughout design, construction and lifespan of development;
— use of environmentally friendly materials;— thermal studies undertaken during design and
operation of the development to improve efficiency; — studies undertaken during design to reduce solar
gain through shading, glass specification and other related optimisation solutions, which minimise air conditioning;
— increasing internal natural light, reducing daytime consumption;
— energy efficient lighting, and— waste management and recycling initiatives
throughout construction and the building’s life cycle.
Sustainability report
PHOTO: PROMENADA MALL, BUCHAREST, ROMANIA
PHOTO: VULCAN VALUE CENTRE, BUCHAREST, ROMANIA

66 NEW EUROPE PROPERTY INVESTMENTS PLC – ANNUAL REPORT 2015
All challenges and opportunities are prioritised in accordance with the long-term organisational strategy, long-term business prospects, as well as NEPI’s financial performance.
The Group is committed to realising its long-term financial objectives, while maximising the positive and minimising the negative effects of its activities on society and the environment. This is achieved through the understanding and rigorous management of the environmental, ethical and social impact of its operations.
NEPI’s initial sustainability strategy involves several key elements, arranged into four main strategic components.
BUSINESS INTEGRITYThis involves the continuous awareness of the economic, social and environmental impact of investments, transparency of business operations and the integration of investment and procurement practices with social and environmental factors where relevant during the decision making process. The Company’s commitment to integrity involves:
— a Code of Ethics communicated to, and discussed with, staff regularly and updated annually;
— compliance with relevant legislation, including meticulous corporate governance, and compliance with The King Report on Corporate Governance and the Quoted Companies Alliance Corporate Governance Guidelines for Smaller Quoted Companies;
— no historic legal, tax or regulatory infringements, and
— regular, consistent and transparent shareholder communication, including announcements, annual investor property tours, annual meetings, investor presentations and the Company website.
PHOTO: PROMENADA MALL, BUCHAREST, ROMANIA

NEW EUROPE PROPERTY INVESTMENTS PLC – ANNUAL REPORT 2015 67
Sustainability report
SUSTAINABLE OPERATIONSThese are achieved through an environmentally, socially and economically sound portfolio management.
BREEAM is the world’s leading environmental assessment method and rating system. Buildings that obtain BREEAM recognition have achieved the highest corporate, organisational and environmental objectives, and set the standard for sustainable design, construction and operation.
The Group obtained BREEAM certification for several of its largest assets: — in 2009 The Lakeview, Bucharest, was the first Romanian building awarded ‘Very Good’ Design certification; it was later assigned a ‘Very Good’ In Use asset and ‘Excellent’ Building Management certifications; — in 2013, Floreasca Business Park, Bucharest, became the first, and only Romanian building, awarded ‘Very Good’ In Use certificate for a green development, while the property management team were awarded ‘Excellent’ certification. The In Use certification was renewed in 2014; — City Business Centre’s buildings A, B, C and D, Timisoara, received ‘Very Good’ Building Management and In Use Asset certifications; in 2016 the newest building of the complex, building E, is also eligible to apply for the BREEAM In Use and Asset certifications; — The Office, Cluj, was awarded ‘Excellent’ Design certification for both phases of the development; in 2016, phase I of the development will become eligible to apply for the BREEAM In Use and Asset certifications; — Braila Mall and Galati Shopping City were both assigned ‘Very Good’ In Use Asset certifications; — Ploiesti Shopping City applied for a BREEAM In Use Asset certification and is expecting to be certified in 2016; — the Group applied for a BREEAM evaluation for Victoriei Office project, currently under development in Bucharest, and is aiming for ‘Excellent’ interim design certification.
NEPI is aware that its properties’ design significantly impacts occupants’ health. A range of factors, including air quality, heating, lighting, acoustics, interior layout and views, can affect workers’ health, satisfaction and performance. This is why all NEPI’s properties utilise design features with a proven positive impact on its occupiers wellbeing.
For instance, the Group’s Victoriei Office is planned to have an internal greenwall, while The Office, a joint-venture located in Cluj employs state-of-the-art technology and incorporates numerous ecological features.
The impact of a building’s location is also considered when analysing the portfolio’s carbon footprint and proximity to major public transport lines is a priority when selecting a location for a development or an acquisition. Seeking to further reduce the carbon footprint, bike racks are available throughout the portfolio, including The Lakeview, Floreasca Business Centre, City Business Centre, The Office, Braila Mall, etc. Furthermore, The Office has joined a car pooling program, a more environmentally friendly and sustainable way to travel, that also reduces expenditures and carbon emissions.
» continued

68 NEW EUROPE PROPERTY INVESTMENTS PLC – ANNUAL REPORT 2015
ElectricityReducing ongoing electricity use by optimising consumption is one of the Group’s main objectives. All new developments prioritise natural light, while low-energy bulbs, combined with light sensors are used wherever practical. The shopping centres and office buildings’ skylights are having a reflective film fitted to reduce solar gain during the summer, cutting down on air conditioning needs.
Similarly, escalators are fitted with motion sensors and stop automatically when not in use, while developments with multiple elevators use computerised systems to monitor keypad commands reducing overall lift movements.
The Group has continued to extend energy-efficient LED lighting throughout the portfolio, and this system is installed in Floreasca Business Park, The Lakeview, Promenada Mall and Braila Mall.
Water Company policy regarding water usage is concerned with not only ensuring the supply is of the highest quality, but also that consumption is minimised. Purity is of paramount importance, so, although supplied by the municipal network, it is cleansed further using mechanical filters. Throughout the portfolio new water faucets are being installed, along with equipment that detects leaks, enabling them to be remedied immediately. Where possible, waste water is collected, treated and recycled in closed-circuit systems for non-potable use.
WasteTenants are regularly informed about on-site waste management processes and policy, while supplier purchasing contracts and green leases establish minimal requirements for the sorting and recycling of refuse. NEPI is designing an integrated waste management system to serve the entire core portfolio, increasing selective waste collection rate and minimising landfill.
PHOTO: PROMENADA MALL, BUCHAREST, ROMANIA
Sustainability report » continued

NEW EUROPE PROPERTY INVESTMENTS PLC – ANNUAL REPORT 2015 69

70 NEW EUROPE PROPERTY INVESTMENTS PLC – ANNUAL REPORT 2015
COMMUNITY ENGAGEMENTThis involves active collaboration with local communities, supporting local relevant initiatives, addressing community needs and supporting improvements in social conditions and living standards. A few examples are listed below.
Throughout various properties in the portfolio diverse educational programs were organised with the support of local authorities, such as Kids on the Moon, which teaches children about the planets in our solar system, Little Chefs' Day, promoting healthy eating.
Braila MallEvents were organised with the local police department regarding road safety regulations, and held at the centre, along with a biking competition for children and a chess tournament.
The shopping centre, in conjunction with local non-governmental organisations (NGOs), also organised a gender equality and non-discrimination programme and collected donations for children suffering from Down’s syndrome.
Aupark Kosice MallThe mall provides a rent-free area to non-profit organisations, which was used by the Slovak League Against Cancer, during a very popular holiday, to raise awareness about this affliction. Besides informing the public about the condition, people could also donate to the organisation.
An area was also used by the Slovak Red Cross youth section; medical school students informed the public about disease prevention, the dangers of smoking and healthy lifestyles.
Aupark Košice team have formed a partnership with White Pencil, a public charity that raises money and awareness about blind people's needs, and participated in the volunteer project Our City, which enables individuals or companies to participate in a selection of activities designed to protect the environment.
Galati Shopping CityBuilding on similar events in previous years, Shopping City Galati hosted in 2015 a series of activities supporting social involvement and community contribution.
These events included: International Happiness Day, Chemistry Olympics, Pick Your Favourite Hero, ‘Gulliver’ International Animation Festival, Global Village, County Children Centre show, fundraising events, children’s painting exhibition, creative workshops, installing a recycling system, City Days and many others.
Shopping City Galati, in conjunction with local authorities, including the police, fire brigade and emergency services, city hall, cultural institutions, as well as representatives of various NGOs, actively supported and promoted social responsibility and community involvement.
Through these activities, Shopping City Galati encourages education, cultural pursuits, art, diversity, health, and environmental awareness, while enhancing its role within the local and regional community.
City Park Mall of ConstantaThrough the ‘Together we can clean our city’ programme, which promotes a responsible behaviour towards nature, the centre helped plant over 3,000m2 of park land, donated benches and trash bins to the community, and together with over 200 volunteers, cleaned a local park.
In addition to this, together with regional authorities, the mall is involved in a campaign designed to rejuvenate the city- plant trees and flowers, clean local parks, outside entertainment areas and local city buses, clean and repaint building façades and prune hedges.
The centre hosted a fundraising in order to obtain financial support for low income families in a nearby village. It also located a photo booth, selling instant photos, in the mall with all profits being donated to these families.
Sustainability report » continued

NEW EUROPE PROPERTY INVESTMENTS PLC – ANNUAL REPORT 2015 71
Corporate Social Responsibility (CSR) The Group is developing a long-term CSR programme, that can be implemented in communities where NEPI operates shopping centres and office buildings. NEPI will focus on realistically implementable solutions to social issues, and increase communication with the communities where it is present. The CSR programme will be carried out in cooperation with Romanian NGOs, enabling NEPI to benefit from their existing structure, logistics, personnel, know-how and expertise.To facilitate this initiative, two directions were identified.
I. Education and retraining
Preparing children for life through education programmes on safety, which deal with emergency situations and career guidance.
2. National retraining courses for unemployed adults run in conjunction with organising job fairs with free access and support.
3. Identify and support young talents to pursue their passions and professional goals.
II. Environment
The Group's plan is to focus on urban environmental projects, such as the rehabilitation of green spaces for local communities.
PEOPLE AND ETHICAL VALUESThis involves creating an organisational culture based on mutual respect, diversity, performance, talent, human values and professional and personal development. The Company’s remuneration policy encourages individual achievement, is comparable with the industry standard and is reviewed annually based on a performance evaluation process. NEPI has a social diversity employment policy and applies zero tolerance to any discrimination based on gender, age or race.
NEXT STEPSTo improve the performance of its sustainability strategy NEPI is developing existing relationships into partnerships aimed at resolving common challenges. The Company is particularly interested in establishing mutually beneficial relationships with organisations with greater experience and proven results in these fields. Such close affiliations will result in better sustainable performance for NEPI and its tenants, and improved environmental and social conditions for communities.
PHOTO: BRAILA MALL, BRAILA, ROMANIA - "KIDS ON THE MOON" EVENT

72 NEW EUROPE PROPERTY INVESTMENTS PLC – ANNUAL REPORT 2015
Financial statementsFOR THE YEAR ENDED 31 DECEMBER 2015
Directors’ responsibility for the annual financial statements 73
Independent auditor’s report 74
Statement of financial position 75
Statement of comprehensive income 76
Statement of changes in equity 77
Statement of cash flows 79
Notes to the financial statements 80

NEW EUROPE PROPERTY INVESTMENTS PLC – ANNUAL REPORT 2015 73
DECLARATION BY COMPANY SECRETARY
In terms of the Companies Act of South Africa 71 of 2008 (‘the Act’), as amended, I certify that the Company has lodged with the Registrar of Companies all such returns as are required of an external company registered in terms of ‘the Act’ and that all such returns are true, correct and up to date.
Cornelius Eduard Cassell Company Secretary 16 March 2016
Directors’ responsibility for the annual financial statements
The Directors are responsible for preparing the Directors’ Report, the consolidated and parent Company annual financial statements in accordance with applicable laws and regulations.
In preparing these financial statements it is the Directors’ responsibility to:— select suitable accounting policies and then apply them consistently; — make judgements and estimates that are reasonable and prudent; — state whether they have been prepared in accordance with International Financial Reporting Standards — prepare the financial statements on the going concern basis unless it is inappropriate to presume that the Group and Company will continue in business; and — prepare financial statements which give a true and fair view of the state of affairs of the Group and Company and of the profit or loss of the Group and Company for that period.
The directors confirm that they have complied with the above in preparing the financial statements.
The Directors are responsible for keeping proper accounting records that disclose with reasonable accuracy at any time the financial position of the Group and Company and to allow for the preparation of financial statements. They have general responsibility for taking such steps as are reasonably available to them to safeguard the Group’s assets and to prevent and detect fraud and other irregularities.
The Directors are responsible for the maintenance and integrity of the corporate and financial information included on the Company’s website.
The Group and Company financial statements were approved by the Board of Directors on 16 March 2016 and signed on its behalf by:
Alex Morar Mirela CovasaChief Executive Officer Finance Director
74 NEW EUROPE PROPERTY INVESTMENTS PLC – ANNUAL REPORT 2015
Independent Auditor’s report
Report on the Financial StatementsWe have audited the accompanying consolidated and parent company financial statements (‘the financial statements’) of New Europe Property Investments plc and its subsidiaries (‘the Group’) which comprise the consolidated and company statements of financial position as at 31 December 2015 and the consolidated and parent company statements of comprehensive income, consolidated and parent company statements of changes in equity and consolidated and parent company statements of cash flows for the year then ended and a summary of significant accounting policies and other explanatory notes.
Directors’ Responsibility for the Financial StatementsThe directors are responsible for the preparation and fair presentation of these financial statements in accordance with applicable Isle of Man law and International Financial Reporting Standards and for such internal control as the directors determine is necessary to enable the preparation of financial statements that are free from material misstatement, whether due to fraud or error.
Auditor’s ResponsibilityOur responsibility is to express an opinion on these financial statements based on our audit. This report, including the opinion, has been prepared for and only for the company’s members as a body in accordance with our engagement letter dated 3 February 2016 and for no other purpose. We do not, in giving this opinion, accept or assume responsibility for any other purpose or to any other person to whom this report is shown or into whose hands it may come save where expressly agreed by our prior consent in writing.
We conducted our audit in accordance with International Standards on Auditing. Those Standards require that we comply with ethical requirements and plan and perform the audit to obtain reasonable assurance whether the financial statements are free from material misstatement.
An audit involves performing procedures to obtain audit evidence about the amounts and disclosures in the financial statements. The procedures selected depend on the auditor’s judgment, including the assessment of the risks of material misstatement of the financial statements, whether due to fraud or error. In making those risk assessments, the auditor considers internal control relevant to the entity’s preparation and fair presentation of the financial statements in order to design audit procedures that are appropriate in the circumstances, but not for the purpose of expressing an opinion on the effectiveness of the entity’s internal control. An audit also includes evaluating the appropriateness of accounting policies used and the reasonableness of accounting estimates made by the directors, as well as evaluating the overall presentation of the financial statements.
We believe that the audit evidence we have obtained is sufficient and appropriate to provide a basis for our audit opinion.
OpinionIn our opinion:
— the consolidated financial statements give a true and fair view of the financial position of the Group as at 31 December 2015 and of its financial performance and its cash flows for the year then ended in accordance with International Financial Reporting Standards; and
— the parent company financial statements give a true and fair view of the financial position of the parent company as at 31 December 2015 and of its financial performance and its cash flows for the year then ended in accordance with International Financial Reporting Standards.
Peter Craig For and on behalf of PricewaterhouseCoopers LLC Chartered Accountants Douglas, Isle of Man 16 March 2016
to the members of New Europe Property Investments plc

NEW EUROPE PROPERTY INVESTMENTS PLC – ANNUAL REPORT 2015 75
Statement of financial position
Note
Group 31 Dec 2015
Group 31 Dec 2014
Company 31 Dec 2015
Company 31 Dec 2014
ASSETS
Non-current assets 1,829,440 1,368,193 1,581,447 1,460,030
Investment property 1,732,760 1,269,299 – –
— Investment property at fair value 9 1,576,019 978,980 – –
— Investment property under development 10 156,741 208,246 – –
— Advances for investment property 32 – 82,073 – –
Goodwill 12 23,986 17,639 – –
Investments in subsidiaries 5 – – 140,230 140,220
Loans granted to subsidiaries 5 – – 1,422,891 1,291,783
Investments in joint-ventures 33 15,640 13,241 – –
Loans granted to joint-ventures 33 36,674 30,395 – –
Other long-term assets 11 18,098 37,444 16,090 27,953
Financial assets at fair value through profit or loss 20 2,282 175 2,236 74
Current assets 381,097 148,705 56,479 19,704
Trade and other receivables 14 54,487 40,469 49,849 7,166
Loans granted to subsidiaries 5 – – 5,622 11,175
Cash and cash equivalents 15 326,610 108,236 1,008 1,363
Investment property held for sale 16 25,255 27,360 – –
TOTAL ASSETS 2,235,792 1,544,258 1,637,926 1,479,734
EQUITY AND LIABILITIES
Equity attributable to equity holders 1,496,550 1,241,289 1,635,022 1,475,579
Share capital 17 2,986 2,746 2,986 2,746
Share premium 17 1,213,325 1,074,310 1,213,325 1,074,310
Share-based payment reserve 18 4,797 4,127 4,797 4,127
Currency translation reserve (1,229) (1,229) – –
Accumulated profit 275,042 167,133 413,914 394,396
Non-controlling interest 5 1,629 (5,798) – –
Total liabilities 739,242 302,969 2,904 4,155
Non-current liabilities 661,717 241,345 2,149 3,496
Bank borrowings 19 162,788 171,071 – –
Bonds 19 392,140 – – –
Deferred tax liabilities 23 89,652 57,517 – –
Other long-term liabilities 22 14,988 9,171 – –
Financial liabilities at fair value through profit or loss 20 2,149 3,586 2,149 3,496
Current liabilities 77,525 61,624 755 659
Trade and other payables 21 62,827 38,365 572 333
Bank borrowings 19 13,424 23,259 183 326
Interest accrued on bonds 19 1,274 – – –
TOTAL EQUITY AND LIABILITIES 2,235,792 1,544,258 1,637,926 1,479,734
Net asset value per share (euro) 24 5.01 4.52
Adjusted net asset value per share (euro) 24 5.25 4.63
All amounts in Thousand Euro unless otherwise stated

76 NEW EUROPE PROPERTY INVESTMENTS PLC – ANNUAL REPORT 2015
Statement of comprehensive income
Note
Group 31 Dec 2015
Group 31 Dec 2014
Company 31 Dec 2015
Company 31 Dec 2014
Contractual rental income and expense recoveries 148,799 87,017 – –
Property operating expenses (44,732) (25,268) – –
Net rental and related income 25 104,067 61,749 – –
Administrative expenses 26 (6,695) (2,839) (1,732) (1,576)
EBITDA* 97,372 58,910 (1,732) (1,576)
Acquisition fees 27 (933) (2,357) (8) (49)
Fair value adjustments of investment property 28 81,742 27,980 – –
Fair value gains of financial investments at fair value through profit or loss 13 – 1,299 – 1,965
Dividends received from financial investments 13 – 2,417 – 2,417
Share-based payment expense 18 (670) (675) (670) (675)
Foreign exchange loss (339) (241) – –
Gain on acquisition of subsidiaries 32 – 1,400 – –
Gain on disposal of investment property – 619 – –
Other operating income – – 2,217 856
Profit before net finance (expense)/ income 177,172 89,352 (193) 2,938
Net finance (expense)/ income 29 (916) 3,278 69,087 34,899
— Finance income 7,613 7,315 71,101 35,219
— Finance expense (8,529) (4,037) (2,014) (320)
Changes in fair value of financial instruments 1,149 (1,866) 1,113 (2,792)
Share of profit of joint-ventures 33 2,399 4,148 – –
Profit before tax 179,804 94,912 70,007 35,045
Deferred tax expense 23 (13,979) (637) – –
Profit after tax 165,825 94,275 70,007 35,045
Total comprehensive income for the year 165,825 94,275 70,007 35,045
(Profit)/loss attributable to non-controlling interests 5 (7,427) 4,920 – –
PROFIT FOR THE YEAR ATTRIBUTABLE TO EQUITY HOLDERS 158,398 99,195 70,007 35,045
Weighted average number of shares in issue 30 284,461,222 225,426,685
Diluted weighted average number of shares in issue 30 285,813,260 229,775,959
Basic weighted average earnings per share (euro cents) 30 55.68 44.00
Diluted weighted average earnings per share (euro cents) 30 55.42 43.17
Distributable earnings per share (euro cents) 30 35.34 29.69
All amounts in Thousand Euro unless otherwise stated
* EBITDA (Earnings Before Interest, Taxes, Depreciation and Amortisation) represents the Group's Operating profit, defined as Net rental and related income less Administrative expenses.
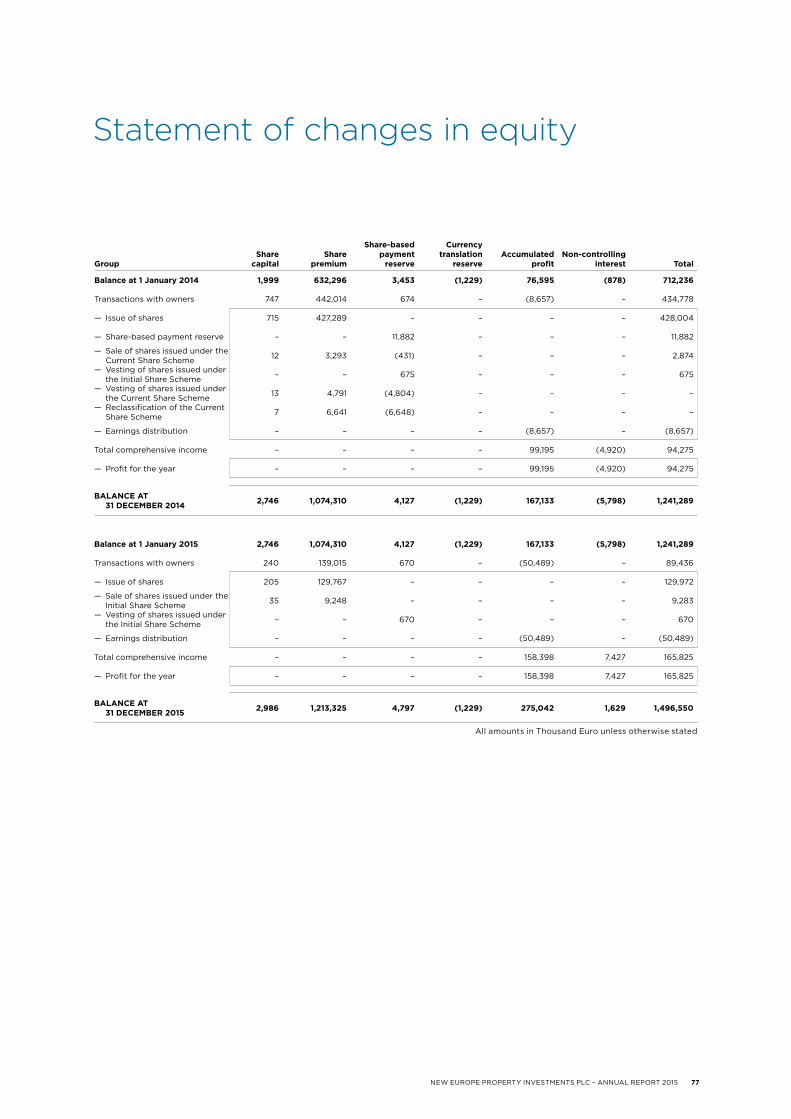
NEW EUROPE PROPERTY INVESTMENTS PLC – ANNUAL REPORT 2015 77
Statement of changes in equity
GroupShare
capitalShare
premium
Share-based payment
reserve
Currency translation
reserveAccumulated
profitNon-controlling
interest Total
Balance at 1 January 2014 1,999 632,296 3,453 (1,229) 76,595 (878) 712,236
Transactions with owners 747 442,014 674 – (8,657) – 434,778
— Issue of shares 715 427,289 – – – – 428,004
— Share-based payment reserve – – 11,882 – – – 11,882
— Sale of shares issued under the Current Share Scheme 12 3,293 (431) – – – 2,874
— Vesting of shares issued under the Initial Share Scheme – – 675 – – – 675
— Vesting of shares issued under the Current Share Scheme 13 4,791 (4,804) – – – –
— Reclassification of the Current Share Scheme 7 6,641 (6,648) – – – –
— Earnings distribution – – – – (8,657) – (8,657)
Total comprehensive income – – – – 99,195 (4,920) 94,275
— Profit for the year – – – – 99,195 (4,920) 94,275
BALANCE AT 31 DECEMBER 2014 2,746 1,074,310 4,127 (1,229) 167,133 (5,798) 1,241,289
Balance at 1 January 2015 2,746 1,074,310 4,127 (1,229) 167,133 (5,798) 1,241,289
Transactions with owners 240 139,015 670 – (50,489) – 89,436
— Issue of shares 205 129,767 – – – – 129,972
— Sale of shares issued under the Initial Share Scheme 35 9,248 – – – – 9,283
— Vesting of shares issued under the Initial Share Scheme – – 670 – – – 670
— Earnings distribution – – – – (50,489) – (50,489)
Total comprehensive income – – – – 158,398 7,427 165,825
— Profit for the year – – – – 158,398 7,427 165,825
BALANCE AT 31 DECEMBER 2015 2,986 1,213,325 4,797 (1,229) 275,042 1,629 1,496,550
All amounts in Thousand Euro unless otherwise stated

78 NEW EUROPE PROPERTY INVESTMENTS PLC – ANNUAL REPORT 2015
Statement of changes in equity ››continued
CompanyShare
capitalShare
premium
Share-based payment
reserveAccumulated
profit Total
Balance at 1 January 2014 1,999 632,296 3,453 368,008 1,005,756
Transactions with owners 747 442,014 674 (8,657) 434,778
— Issue of shares 715 427,289 – – 428,004
— Share-based payment reserve – – 11,882 – 11,882
— Sale of shares issued under the Current Share Scheme 12 3,293 (431) – 2,874
— Vesting of shares issued under the Initial Share Scheme – – 675 – 675
— Vesting of shares issued under the Current Share Scheme 13 4,791 (4,804) – –
— Earnings distribution – – – (8,657) (8,657)
— Reclassification of the Current Share Scheme reserve 7 6,641 (6,648) – –
Total comprehensive income – – – 35,045 35,045
— Profit for the year – – – 35,045 35,045
BALANCE AT 31 DECEMBER 2014 2,746 1,074,310 4,127 394,396 1,475,579
Balance at 1 January 2015 2,746 1,074,310 4,127 394,396 1,475,579
Transactions with owners 240 139,015 670 (50,489) 89,436
— Issue of shares 205 129,767 – – 129,972
— Sale of shares issued under the Initial Share Scheme 35 9,248 – – 9,283
— Vesting of shares issued under the Initial Share Scheme – – 670 – 670
— Earnings distribution – – – (50,489) (50,489)
Total comprehensive income – – – 70,007 70,007
— Profit for the year – – – 70,007 70,007
BALANCE AT 31 DECEMBER 2015 2,986 1,213,325 4,797 413,914 1,635,022
All amounts in Thousand Euro unless otherwise stated
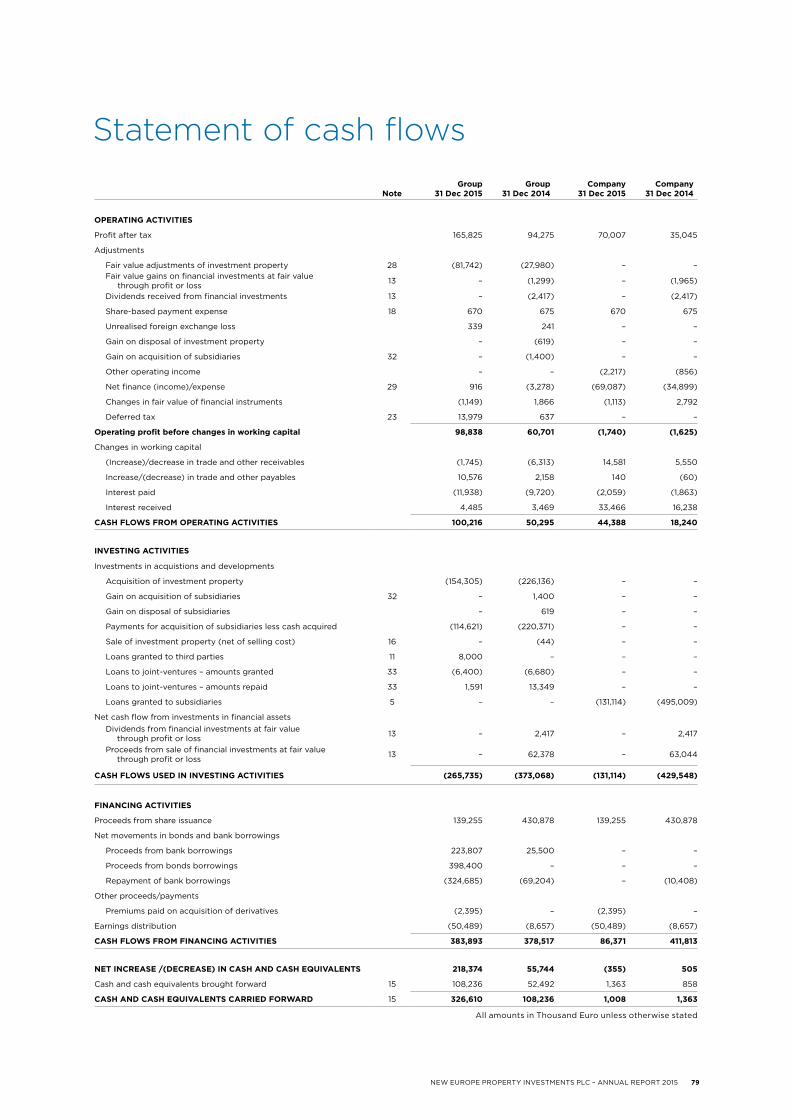
NEW EUROPE PROPERTY INVESTMENTS PLC – ANNUAL REPORT 2015 79
Statement of cash flows
NoteGroup
31 Dec 2015Group
31 Dec 2014Company
31 Dec 2015Company
31 Dec 2014
OPERATING ACTIVITIES
Profit after tax 165,825 94,275 70,007 35,045
Adjustments
Fair value adjustments of investment property 28 (81,742) (27,980) – – Fair value gains on financial investments at fair value
through profit or loss 13 – (1,299) – (1,965)
Dividends received from financial investments 13 – (2,417) – (2,417)
Share-based payment expense 18 670 675 670 675
Unrealised foreign exchange loss 339 241 – –
Gain on disposal of investment property – (619) – –
Gain on acquisition of subsidiaries 32 – (1,400) – –
Other operating income – – (2,217) (856)
Net finance (income)/expense 29 916 (3,278) (69,087) (34,899)
Changes in fair value of financial instruments (1,149) 1,866 (1,113) 2,792
Deferred tax 23 13,979 637 – –
Operating profit before changes in working capital 98,838 60,701 (1,740) (1,625)
Changes in working capital
(Increase)/decrease in trade and other receivables (1,745) (6,313) 14,581 5,550
Increase/(decrease) in trade and other payables 10,576 2,158 140 (60)
Interest paid (11,938) (9,720) (2,059) (1,863)
Interest received 4,485 3,469 33,466 16,238
CASH FLOWS FROM OPERATING ACTIVITIES 100,216 50,295 44,388 18,240
INVESTING ACTIVITIES
Investments in acquistions and developments
Acquisition of investment property (154,305) (226,136) – –
Gain on acquisition of subsidiaries 32 – 1,400 – –
Gain on disposal of subsidiaries – 619 – –
Payments for acquisition of subsidiaries less cash acquired (114,621) (220,371) – –
Sale of investment property (net of selling cost) 16 – (44) – –
Loans granted to third parties 11 8,000 – – –
Loans to joint-ventures – amounts granted 33 (6,400) (6,680) – –
Loans to joint-ventures – amounts repaid 33 1,591 13,349 – –
Loans granted to subsidiaries 5 – – (131,114) (495,009)
Net cash flow from investments in financial assetsDividends from financial investments at fair value
through profit or loss 13 – 2,417 – 2,417
Proceeds from sale of financial investments at fair value through profit or loss 13 – 62,378 – 63,044
CASH FLOWS USED IN INVESTING ACTIVITIES (265,735) (373,068) (131,114) (429,548)
FINANCING ACTIVITIES
Proceeds from share issuance 139,255 430,878 139,255 430,878
Net movements in bonds and bank borrowings
Proceeds from bank borrowings 223,807 25,500 – –
Proceeds from bonds borrowings 398,400 – – –
Repayment of bank borrowings (324,685) (69,204) – (10,408)
Other proceeds/payments
Premiums paid on acquisition of derivatives (2,395) – (2,395) –
Earnings distribution (50,489) (8,657) (50,489) (8,657)
CASH FLOWS FROM FINANCING ACTIVITIES 383,893 378,517 86,371 411,813
NET INCREASE /(DECREASE) IN CASH AND CASH EQUIVALENTS 218,374 55,744 (355) 505
Cash and cash equivalents brought forward 15 108,236 52,492 1,363 858
CASH AND CASH EQUIVALENTS CARRIED FORWARD 15 326,610 108,236 1,008 1,363
All amounts in Thousand Euro unless otherwise stated

80 NEW EUROPE PROPERTY INVESTMENTS PLC – ANNUAL REPORT 2015
1 GENERAL
New Europe Property Investments plc is a limited liability company incorporated in the Isle of Man on 23 July 2007 and domiciled at Anglo International House, 2nd floor, Lord Street, Douglas, Isle of Man. The Company is listed on the Main Board of the Johannesburg Stock Exchange Limited (JSE), the regulated market of the Bucharest Stock Exchange (BVB) and the Alternative Investment Market (AIM) of the London Stock Exchange (LSE). In addition, one of the Company’s subsidiaries has issued in 2015 debt instruments listed on the Irish Stock Exchange (Note 19). The Group includes the Company and its subsidiaries, as detailed in ‘Basis of consolidation’ in Note 3.4.
The Group’s consolidated financial statements and the Company’s separate financial statements are collectively referred to as the Financial Statements.
Group’s activities are detailed in the ‘Directors’ Report’.
The financial statements for the year ended 31 December 2015 were authorised for issue, in accordance with the Directors’ resolution, on 16 March 2016.
2 COMPARATIVE PERIOD
The comparative period is the year ended 31 December 2014.
3 ACCOUNTING POLICIES
The financial statements have been prepared in accordance with Isle of Man company law and International Financial Reporting Standards (IFRS). The accounting policies set out below have been consistently applied to all periods presented unless otherwise stated.
3.1 Functional and presentation currencyThe consolidated financial statements are presented in Euro (€, EUR) thousands unless otherwise stated.
For subsidiaries preparing their financial statements in a foreign currency, the functional currency is determined by the relevant, primary economic environment. One determining factor is the currency in which the majority of cash flows, goods and services are denominated and settled in the respective country. When the functional currency cannot be clearly identified, International Accounting Standard (IAS) 21 allows management to determine the functional currency that most faithfully represents the economic effects of the underlying transactions, events and conditions. Any change in the functional currency must be made prospectively in accordance with IAS 21.
Certain subsidiaries are located in Central and Eastern European countries that do not use the Euro as a functional currency. However, the eurozone has a clear influence on the macroeconomic environment of these countries and there is a synchronisation of growth. In addition, external and intragroup financing is concluded in Euro, excess cash balances are held in, or converted into Euro as quickly as possible, Euro represents the contract currency for rental agreements. Also, where the subsidiaries have significant developments, construction suppliers are contracted in Euro.
3.2 Basis of preparationThe financial statements are prepared on the historical cost basis, except for investment property, land for investment property under development, derivatives and other assets and liabilities at fair value through profit or loss.
Investment property, land for investment property under development and derivatives and other assets and liabilities at fair value through profit or loss are measured at fair value.
Management prepared these financial statements on a going concern basis. There are no uncertainties relating to events and conditions that cast a significant doubt upon the Group’s ability to continue as a going concern.
The preparation of financial statements in conformity with IFRS requires management to make judgements, estimates and assumptions that affect the application of policies and reported amounts of assets and liabilities, income and expenses. Estimates and associated assumptions, are based on experience and other factors believed to be reasonable under the circumstances, and enable judgements to be made about the carrying values of assets and liabilities not readily apparent from other sources. Actual results may differ from these estimates.
Notes to the financial statements
NEW EUROPE PROPERTY INVESTMENTS PLC – ANNUAL REPORT 2015 81
Estimates and underlying assumptions are reviewed on an ongoing basis. Revisions to accounting estimates are recognised in the period when the estimate is revised, if the revision affects only that phase. If the revision affects both current and future periods it will be recognised in both.
3.3 Statement of complianceThe financial statements have been consistently prepared in accordance with IFRS and its interpretations adopted by the International Accounting Standards Board (IASB) and the requirements of relevant Isle of Man company law.
3.4 Basis of consolidation
SubsidiariesThe financial statements incorporate the assets, liabilities, operating results and cash flows of the Company and its subsidiaries.
Subsidiaries are all entities, including those that are structured, over which the Group has control. The Group controls an entity when it is exposed to, or has rights to, variable returns from its involvement with the entity and has the ability to affect those returns through its power over it. Subsidiaries are fully consolidated from the date control is transferred to the Group. They are deconsolidated from the date control ceases. The purchase method is used to account for the acquisition of subsidiaries. Identifiable acquired assets and liabilities, and contingent liabilities, assumed in a business combination are measured at their fair values on the date of acquisition. The consideration transferred for the acquired entity is measured at the fair value of the assets given up, equity instruments issued and liabilities incurred, or assumed, including fair value of assets or liabilities from contingent consideration arrangements, but excluding acquisition related costs, such as advisory, legal, valuation and similar professional services.
The accounting policies of the subsidiaries are consistent with those of the holding Company.
In the Company’s separate financial statements, investments in subsidiaries are stated at cost less accumulated impairment losses.
Transactions eliminated on consolidationIntra-group balances and any unrealised gains and losses arising from intra-group transactions are eliminated when preparing the financial statements.
Jointly controlled entitiesThe Group has contractual arrangements with other parties that represent joint-ventures. These take the form of agreements to jointly control other entities.
Starting 1 January 2013, as a result of the adoption of IFRS 11 Joint Arrangements, the Group accounts for its investments in joint-ventures using the equity method. Under the equity method, the initial recognition of an investment in a joint-venture is at cost; the carrying amount is subsequently increased or decreased to recognise the Group’s share of profit or loss of the joint-venture. Distributions received from a joint-venture reduce the carrying amount of the investment. The Group classifies its investment in joint-ventures as a non-current asset, and recognises its share of the joint-ventures’ net result in the Statement of comprehensive income.
3.5 Investment property at fair valueInvestment properties are held to earn rental income, capital appreciation or both.
The cost of investment property acquired by any other means than a business combination consists of the purchase price and directly attributable expenditure. Subsequent expenditure relating to investment property is capitalised when future economic benefits from the use of the asset are probable and the cost of the item can be measured reliably. All other subsequent expenditure is recognised as an expense during the period it is incurred.
After initial recognition, investment properties are measured at fair value. Fair value is determined annually by external, independent professional valuers, with appropriate and recognised qualifications and recent experience in the location and category of property being valued. Valuations are based on the open market value, using either the discounted cash flow method, the capitalisation of net income method or a combination of both. Gains or losses

Notes to the financial statements » continued
82 NEW EUROPE PROPERTY INVESTMENTS PLC – ANNUAL REPORT 2015
arising from changes in the fair values are included in the Statement of comprehensive income for the period during which they arise. Unrealised gains, net of deferred tax, are classified as non-distributable in the accumulated profits. Unrealised losses, net of deferred tax, are transferred to a non-distributable reserve within the accumulated profit, up to, but not exceeding, the balance of the reserve.
Gains or losses on disposal of investment property are calculated as proceeds less carrying amount. Where the Group disposes of a property at fair value, the carrying value, immediately prior to the sale, is adjusted to the transaction price. The adjustment is recorded in the Statement of comprehensive income for the year within fair value adjustments of investment property.
3.6 Investment property under developmentProperty that is being constructed or developed for future use as investment property is classified as investment property under development and carried at cost until construction or development is complete, or its fair value can be reliably determined. Once valued it is reclassified and accounted for as investment property.
The land on which investment property is constructed or developed is carried at fair value, which is determined annually by external, independent professional valuers, with appropriate and recognised qualifications and recent experience in the location and category of property being valued. Valuations are done using the market comparable approach or residual approach.
Gains or losses arising from changes in the fair values are included in the Statement of comprehensive income during the period when they arise. Unrealised gains, net of deferred tax, are classified as non-distributable in the accumulated profits. Unrealised losses, net of deferred tax, are transferred to a non-distributable reserve up to, but not exceeding, the balance of the reserve.
3.7 Investment property held for saleInvestment property is classified as a non-current asset held for sale if its carrying amount will be recovered mainly through a sale transaction rather than continuing use. For this to apply the property must be available for immediate sale in its present condition, subject only to terms that are usual and customary for sales of such property and its sale must be highly probable. The sale will be considered highly probable if the following criteria are met:
— the Board must be committed to a plan to sell the property and an active programme to locate a buyer and complete the sale must be initiated;
— the property must be actively marketed at a price that is reasonable in relation to its current fair value, and— the sale of property should be expected to qualify for recognition as a completed sale within one year of the date
of classification.
On classification as held for sale, investment property that is measured at fair value continues to be so measured.
3.8 GoodwillGoodwill arises on acquisition of subsidiaries and joint-ventures that constitute a business. Goodwill represents the amount paid in excess of the Group’s interest in the net fair value of the identifiable assets and liabilities of the acquired entity. When the excess is negative (negative goodwill) it is recognised directly in the Statement of comprehensive income.
Subsequent measurementGoodwill is not amortised, but is tested for impairment at least annually.
After initial recognition, goodwill is measured at cost, less any accumulated impairment losses. For the purpose of impairment testing, goodwill acquired in a business combination is, from the date of acquisition, allocated to each of the Group’s cash generating units that are expected to benefit from the synergies of the combination, irrespective of whether other assets or liabilities of the acquired entity are assigned to those units.
Goodwill is usually generated exclusively by the recognition of deferred tax liabilities. The carrying amount of the cash generating unit includes the values of the investment property, goodwill and the related deferred tax liability. Impairment testing is performed using the fair value less costs to sell approach where the fair value is the property value as determined in the external valuation reports.

NEW EUROPE PROPERTY INVESTMENTS PLC – ANNUAL REPORT 2015 83
If the deferred tax liability is subsequently reduced or eliminated, the goodwill arising from the initial recognition of the deferred tax provision may be impaired. Goodwill is tested for impairment simultaneously with the corresponding investment property.
3.9 Loans to participants in the Current Share Scheme (as defined in Note 18)Loans to participants in the Current Share Scheme are initially recognised at the amount granted, carried at amortised cost and tested annually for impairment.
3.10 Property, plant and equipment and intangible assetsProperty, plant and equipment and intangible assets are initially recognised at acquisition cost, carried at amortised cost and tested annually for impairment.
For property, plant and equipment the costs of minor repairs and maintenance are expensed when incurred while gains and losses on disposals are determined by comparing the proceeds with the carrying amount. Both are recognised in the Statement of comprehensive income for the year.
The cost of computer licences and property, plant and equipment is depreciated on a straight-line basis over the length of their useful lives:
Useful lives in years
Computer licences 1–3
Office improvements over the term of the underlying lease
Office equipment 2–16
Equipment used in owner-managed activities 3–22
3.11 Bonds and Bank borrowingsBorrowings are recognised initially at the fair value of the liability (determined using the prevailing market rate of interest if significantly different from the transaction price) and net of transaction costs incurred. In subsequent periods, borrowings are stated at amortised cost using the effective interest method. Any difference between the fair value of the borrowing at initial recognition and the proceeds received is recognised in accordance with the substance of the transaction: to equity, if the premium or discount at initial recognition effectively represents a capital transaction with the Group’s owners, or in the Statement of comprehensive income, within finance activity.
Foreign currency translation differences are recognised as foreign exchange differences within finance income or finance costs.
Borrowing costs that are directly attributable to the acquisition, construction or production of qualifying assets, such as properties developed for future sale, capital appreciation or rental income, are capitalised as part of the cost of these assets. The capitalisation of borrowing costs ceases when the majority of the activities necessary to prepare the qualifying asset for its intended use or sale are complete.
Borrowings are classified as current liabilities unless the Group has an unconditional right to defer settlement of the liability for at least 12 months after the reporting date.
The Group derecognises its financial liability (or part of a financial liability) from its Statement of financial position when, and only when, it is extinguished. This occurs when the obligation specified in the contract is discharged, cancelled or expires. An exchange between the Group and a lender of debt instruments with substantially different terms is accounted for as an extinguishment of the original financial liability and the recognition of a new financial liability. Similarly, a substantial modification of the terms of an existing financial liability, or a part of it, is accounted for as an extinguishment of the original financial liability and the recognition of a new financial liability.
If the Group repurchases a part of a financial liability, it allocates the previous carrying amount of the financial liability between the part that continues to be recognised and the part that is derecognised based on the relative fair values of those parts on the date of the repurchase. The difference between the carrying amount allocated to the part derecognised and the consideration paid for the part derecognised, including any non-cash assets transferred or liabilities assumed, is recognised in the Statement of comprehensive income.

Notes to the financial statements » continued
84 NEW EUROPE PROPERTY INVESTMENTS PLC – ANNUAL REPORT 2015
3.12 Tenant security depositsTenant security deposits represent financial advances made by lessees as guarantees during the lease and are repayable by the Group upon termination of contracts. Tenant security deposits are recognised at nominal value.
3.13 Financial instrumentsFinancial instruments include cash and cash equivalents, trade and other receivables, trade and other payables, derivative financial instruments and loans granted by the Company to its subsidiaries. The Group holds derivative financial instruments to hedge its interest rate risk exposures. Such derivative financial instruments are initially recognised at fair value on the date a derivative contract is entered into and subsequently re-measured at fair value. Derivatives are carried as assets when the fair value is positive and as liabilities when the fair value is negative.
Derivatives are classified as current or non-current on the basis of their maturity date.
The Company may invest in listed property shares which are initially recognised at cost and subsequently re-measured at fair value. The fair value of the shares is determined by referring to published price quotations in an active market. Any loans payable incurred for the purpose of financing these investments are measured at amortised cost and presented net of the cash collateral paid by the Company at the acquisition of each share (see Note 13).
These financial investments are classified as current or non-current assets, based on the estimated selling date. The loan payable in this respect follows the classification of the investments.
3.13.1 Initial recognition and subsequent measurementFinancial instruments are initially measured at fair value, which, except for financial instruments at fair value through profit or loss and derivatives, include directly attributable transaction costs. Subsequent to initial recognition, financial instruments are measured as follows:
FINANCIAL INSTRUMENT MEASUREMENT METHOD
Loans granted to subsidiaries (presented only in the Company’s financial statements)
Carried at amortised cost using the effective interest rate method, net of impairment losses
Loans granted to joint-ventures Carried at amortised cost using the effective interest rate method, net of impairment losses
Trade and other receivables Carried at amortised cost using the effective interest rate method, net of impairment losses
Trade and other payables Carried at amortised cost using the effective interest rate method
Cash and cash equivalents Carried at amortised cost using the effective interest rate method, net of impairment losses
Loans granted to participants in the Current Share Scheme Carried at amortised cost using the effective interest rate method, net of impairment losses
Financial liabilities, including loans and borrowings Measured at amortised cost using the effective interest rate method
Derivative financial instruments Carried at fair value with changes therein recognised in the Statement of comprehensive income, hedge accounting is not applied
Financial investments at fair value through profit or loss Carried at fair value with changes therein recognised in the Statement of comprehensive income
The fair values of the financial assets and liabilities are estimates of the amount that the instrument could be exchanged in a current transaction between willing parties, other than in a forced or liquidation sale. The following methods and assumptions were used to estimate the fair values:
— Cash and cash equivalents, trade and other receivables, trade and other payables, tenant deposits, current portion of loans and borrowings are estimated at their carrying amounts due to the short-term maturities of these instruments;
— The fair values of the derivative interest rate cap and swap contracts are estimated by discounting expected future cash flows using current market interest rates and yield curve over the remaining term of the instrument, and
— The fair values of financial investments are estimated based on quoted prices in active markets as at balance sheet date.
NEW EUROPE PROPERTY INVESTMENTS PLC – ANNUAL REPORT 2015 85
The financial assets and liabilities are categorised according to the following levels:— Level 1: Quoted (unadjusted) market prices in active markets for identical assets or liabilities;— Level 2: Valuation techniques for which the lowest level input that is significant to the fair value measurement
is directly or indirectly observable, and— Level 3: Valuation techniques for which the lowest level input that is significant to the fair value measurement
is unobservable.
3.13.2 Derecognition
Financial assetsA financial asset (or, where applicable, a part of a financial asset or part of a group of similar financial assets) is derecognised when:
— the contractual rights to receive cash flows from the asset have expired, or— the Group or Company has transferred its rights to receive cash flows from the asset and either has transferred
substantially all the risks and rewards of the asset, or has neither transferred nor retained substantially all the risks and rewards of the asset, but has transferred control of the asset.
Financial liabilitiesA financial liability is de-recognised when the obligation under the liability is discharged or cancelled or expires. Where an existing liability is replaced by another from the same lender on substantially different terms, or the terms of an existing liability are substantially modified, such an exchange or modification is treated as a de-recognition of the original liability and the recognition of a new liability, and the difference in the respective carrying amounts is recognised in the Statement of comprehensive income.
3.13.3 OffsetFinancial assets and financial liabilities are offset and the net amount reported in the Statement of financial position when the Group and/or Company has a legally enforceable right to set off the recognised amounts and intends either to settle on a net basis or to realise the asset and settle the liability simultaneously. Deferred tax and VAT assets and liabilities are the main items offset, and these are assessed at each property level.
3.14 Impairment of financial assetsA financial asset not carried at fair value through profit or loss is assessed at each reporting date to determine whether there is objective evidence that it is impaired. A financial asset is impaired if objective evidence indicates that a loss event has occurred after the initial recognition of the asset and that the loss event had a negative effect on the estimated future cash flows of that asset that can be estimated reliably.
The Group considers evidence of impairment for receivables at a specific asset level.
All receivables are individually assessed for impairment.
An impairment loss in respect of a financial asset measured at amortised cost is calculated as the difference between its carrying amount and the present value of the estimated future cash flows, discounted at the asset’s original effective interest rate and is recognised through an allowance account. When a subsequent event causes the amount of impairment loss to decrease, the decrease in impairment loss is reversed through the Statement of comprehensive income for the year.
If in a subsequent period, the amount of the impairment loss decreases and the decrease can be related objectively to an event occurring after the impairment was recognised (such as an improvement in the debtor’s credit rating), the previously recognised impairment loss is reversed by adjusting the allowance account through the Statement of comprehensive income for the year.
Uncollectable assets are written-off against the related impairment loss provision after all the necessary procedures to recover the asset have been completed and the amount of the loss has been determined. Subsequent recoveries of amounts previously written-off are credited to the impairment loss account within the Statement of comprehensive income for the year.
Notes to the financial statements » continued
86 NEW EUROPE PROPERTY INVESTMENTS PLC – ANNUAL REPORT 2015
3.15 Cash and cash equivalentsCash and cash equivalents include cash balances, call deposits and short-term, highly-liquid investments with original maturities of three months or less that are readily convertible to known amounts of cash and which are subject to an insignificant risk of changes in value. Bank overdrafts that are repayable on demand and form an integral part of the Group’s cash management include a component of cash and cash equivalents for the purpose of the Statement of cash flows.
3.16 Share capital and share premiumOrdinary shares are classified as equity. External costs directly attributable to the issue of new shares are shown as a deduction in equity from the proceeds.
3.17 Share-based payment reserveThe Group has accounted for the Initial Share Scheme (Note 18) as a share option scheme. The fair value of share option granted to key individuals and their nominated entities is recognised as an expense, with a corresponding increase in equity, over the period that the participants become unconditionally entitled to the shares. The amount recognised as an expense is adjusted to reflect the actual number of shares that vest. The interest charged by the Company on the loans granted in terms of the Initial Share Scheme is not recognised to the Statement of comprehensive income but added for calculation of distributable earnings purposes only (Note 30).
The fair value measurement inputs include share price on measurement date, exercise price of the instrument, expected volatility (based on weighted average historic volatility of similar listed companies), expected life of the instrument (considered as vesting period) and the risk free interest rate (based on government bonds).
Prior to 2014, the Current Share Scheme (Note 18) was accounted for by recognising in the share-based payment reserve the value of the loans given to employees. The share-based payment reserve was converted to share capital and share premium at each vesting date. During 2014, the Group reassessed its accounting policy in relation to the Current Share Scheme and given that it is a non-recourse scheme (i.e. recourse in relation to loans issued is not limited to shares issued), the Company changed its accounting treatment and recognised loans given into share capital and share premium directly, instead of recognising via the share based payment reserve.
3.18 Other reserves
3.18.1 Currency translation reservesThe financial statements reported as at 31 December 2012 required translation of foreign operations’ figures. Exchange differences arising, if any, were classified as equity and transferred to the Group’s currency translation reserve. The assets, liabilities and equity of the Group’s operations with a functional currency other than Euro were expressed in Euro using exchange rates prevailing at 31 December 2012. Income and expense items were translated at the average exchange rates for the period, unless exchange rates fluctuated significantly during the period, in which case the exchange rates at the dates of the transactions are used. Exchange differences arising, if any, were classified as equity and transferred to the Group’s currency translation reserve. Such translation differences were recognised in the Statement of comprehensive income in the period in which the foreign operation is disposed of.
Starting from 1 January 2013, the Group adopted Euro as functional currency for all its operations. The Group did not recognise any subsequent movements to the currency translation reserves.
3.18.2 Accumulated profitThe balance on the Statement of comprehensive income is transferred to accumulated profit at the end of each financial period. Distribution paid in cash is deducted from accumulated profit. Distribution for which shareholders elected to receive capital return is reflected as an issue of shares from the share premium account.
3.19 ProvisionsProvisions for liabilities are recognised when the Group has a present legal or constructive obligation as a result of past events, when it is probable that an outflow of resources embodying economic benefits will be required to settle the obligation. The amount recognised as a provision is the best estimate of the expenditure required to settle the obligation at the reporting date. Where the effect of the time value of money is material the amount of the provision is the present value of the expenditure expected to be required to settle the obligation.
NEW EUROPE PROPERTY INVESTMENTS PLC – ANNUAL REPORT 2015 87
Provisions are reassessed at each reporting date, and are included in the financial statements at their net present values using discount rates appropriate to the Group in the economic environment at each reporting date.
3.20 RevenueRevenue comprises rental and related income and recovery of expenses, excluding VAT.
Rental incomeRental income receivable from operating leases, less the Group’s initial direct cost of entering into the leases, is recognised on a straight-line basis over the duration of the lease, except for contingent rental income which is recognised when it arises.
Service charges and expenses recoverable from tenantsIncome arising from expenses recharged to tenants is recognised on an accrual basis.
As specified in the lease agreements, the Group has the primary responsibility for providing services to tenants (electricity, water and gas utilities, interior and exterior cleaning, security, maintenance, repairs, etc). The Group negotiates directly with the suppliers all contracts for services provided to tenants. These contracts are concluded between the Group subsidiaries which own the properties and the direct supplier. As the Group sometimes uses the same providers for services across most of its portfolio, it can negotiate better prices through the economies of scale. The Group bears the responsibility of meeting the contractual deadlines agreed in the contracts with its suppliers and is liable for payment of the services, regardless of whether they are able to recover these charges from the tenants. The Group also bears the inventory risk for the necessary spare parts purchased for the maintenance and repairs required by the tenants. The Group bears the credit risk for the amounts receivable from tenants. The Group negotiates and pays all expenses incurred by the tenants and then re-invoices these costs to them as defined in the contractual clauses included in the lease agreements. A flat fee is charged monthly during the year. This fee is estimated based on the previous year’s actual costs.
After the year-end, the annual service charge reconciliation is performed based on actual costs. For contracts terminated during the year, the Group estimates the service charge to be collected based on the current budget and last year’s actual costs. The Group therefore bears the risk of not collecting the service charge differences for non-performing tenants. The Group is considered principal in these transactions, in terms of the IAS 18 requirements.
3.21 Property operating and administrative expensesProperty operating expenses and administrative expenses are recognised on an accrual basis.
3.22 Operating leasesWhere the Group is a lessee in a lease which does not transfer substantially all the risks and rewards incidental to ownership from the lessor to the Group, the total lease payments are charged to the Statement of comprehensive income for the year on a straight-line basis over the lease term. The lease term is the non-cancellable period for which the lessee has contracted to lease the asset together with any further terms for which the lessee has the option to continue to lease the asset, with or without further payment, when at the inception of the lease it is reasonably certain that the lessee will exercise the option.
3.23 Dividend receivedDividend/distribution income is recognised in the Statement of comprehensive income on the date the Group or Company’s right to receive payment is established.
3.24 Dividend distributedDistribution is recorded as a liability and deducted from equity in the period in which it is declared and approved. Any distribution declared after the reporting period and before the financial statements are authorised for issue is disclosed in Note 30.
Notes to the financial statements » continued
88 NEW EUROPE PROPERTY INVESTMENTS PLC – ANNUAL REPORT 2015
3.25 TaxationTaxation on the profit or loss for the year comprises current and deferred tax. Current income tax and liabilities are measured at the amount expected to be recovered from, or paid to, taxation authorities. The tax rates and tax laws used to compute the amount are those that are enacted, or substantively enacted, by the reporting date. Current income tax relating to items recognised directly in equity is recognised directly in equity and not in the Statement of comprehensive income. Management periodically evaluates positions taken in tax returns with respect to situations in which applicable tax regulations are subject to interpretation and establishes provisions where appropriate.
Deferred tax is determined using the Statement of financial position liability method and is based on temporary differences between the carrying amounts of assets and liabilities for financial reporting purposes and their tax bases. The amount of deferred tax provided is based on the expected manner of realisation or settlement of the carrying amount of assets and liabilities, using tax rates enacted or substantively enacted at the date of the Statement of financial position, which are expected to apply to the period when the temporary differences will reverse or the tax loss carried forward will be utilised.
The following temporary differences are not provided for: goodwill not deductible for tax purposes; the initial recognition of assets or liabilities that affect neither accounting nor taxable profit, and differences relating to investments in subsidiaries that are unlikely to reverse in the foreseeable future.
A deferred tax asset is recognised based on the assumption that it is probable that future taxable profits will be available against which it can be utilised. Deferred tax assets are reduced to the extent that it is no longer probable that the related tax benefit will be realised.
The tax income or expense incurred by the Group reflects deferred tax accrued in the subsidiaries of the Group located in Romania, Serbia and Slovakia. The current income tax incurred in 2014 and 2015 is immaterial but is expected to increase in the future.
Output Value Added Tax (VAT) related to sales is payable to tax authorities on either the collection of receivables from customers or the delivery of services to customers depending on which occurs first. Input VAT is generally recoverable against output VAT upon receipt of the invoice. The tax authorities permit the settlement of VAT on a net basis. VAT relating to sales and purchases is recognised in the Statement of financial position on a gross basis and is disclosed separately as an asset and liability. Where provision has been made for impairment of receivables, the loss is recorded for the gross amount of the debt, including VAT.
3.26 Segment reportingManagement decisions and consequent allocation of resources are based on individual property level reports, which are analysed in detail. Management has a hands-on approach and is involved in day-to-day activities. Regular management meetings are held at least monthly for each property, where the top management of the Group and each property manager analyse the financial results, decide whether any repairs or improvements are necessary, review rent collection issues and allocate resources to resolve any delays with tenants and review maintenance plans, vacancies and the status of any contract negotiations, as well as other operational matters. The results of these discussions ensure management decisions are specific to each of the properties. The Segmental Reporting summarises the results recorded by the properties held by the Group. The properties can be classified as retail, office or industrial properties, depending on industry practice.
The Group’s Chief Operating Decision Makers (CODM) are the executive directors and they take decisions based on detailed reports. These are prepared regularly and are presented to the Board of Directors, which approves the results and gives guidance on the subsequent strategy to be undertaken.
Segment results, assets and liabilities include items directly attributable to a segment, as well as those that can be allocated there on a reasonable basis. Unallocated items comprise mainly investments (other than investment property) and related revenue, corporate assets and head office expenses. Segment capital expenditure is the total cost incurred during the period to acquire property, plant and equipment and intangible assets other than goodwill.
Financial information in respect of investment property is provided to the Board of Directors: net rentals (including gross rent and property expenses) and valuation gains and losses. Individual properties are aggregated into segments with similar economic characteristics.

NEW EUROPE PROPERTY INVESTMENTS PLC – ANNUAL REPORT 2015 89
Consequently, the Group is considered to have three reportable operating segments:— Retail segment: acquires, develops and leases retail properties;— Office segment: acquires, develops and leases office properties, and— Industrial segment: acquires, develops and leases industrial facilities.
The Group also reports by geographic segments, currently Romania, Serbia and Slovakia.
3.27 Earnings per shareThe Group presents basic and diluted earnings per share.
Basic earnings per share are calculated by dividing annual profit for the year attributable to equity holders by the weighted average number of shares in issue during the year.
Diluted earnings per share is determined by adjusting the profit for the year and the weighted average number of shares in issue for the dilutive effects of all potential ordinary shares issued under the Initial Share Scheme (as defined in Note 18).
3.28 Distributable earnings per shareThe Group presents distributable earnings per share, in accordance with its distribution policy.
Distributable earnings per share are calculated by dividing the distributable profit (earnings plus deferred tax, less/plus fair value increases/decreases, less/plus capital gains/losses on disposal, plus interest due from participants in the Initial Share Scheme and other adjustments that the Board may consider necessary) for the period by the number of shares in issue which are entitled to distribution at the end of the period.
3.29 Headline earnings per shareThe Group presents basic and diluted headline earnings per share.
Headline earnings are an additional earnings number that is permitted by IAS 33. The starting point is earnings as determined in IAS 33, excluding ‘separately identifiable re-measurements’, net of related tax (both current and deferred) and minority interest, other than re-measurements specifically included in headline earnings (referred to as included re-measurements).
A re-measurement is an amount recognised in the Statement of comprehensive income relating to any change (whether realised or unrealised) in the carrying amount of an asset or liability that arose after the initial recognition of such asset or liability. A re-measurement may be recognised in the Statement of comprehensive income either when the re-measurement occurs or subsequently. This latter situation occurs when re-measurements are initially recorded in equity (in accordance with the relevant IFRS) and subsequently included or recognised in the Statement of comprehensive income.
3.30 Business combinationsBusiness combinations are accounted for using the acquisition method. The acquisition is recognised at the aggregate amount of the consideration transferred, measured at fair value on the date of acquisition and the amount of any non-controlling interest in the acquired entity.
For each business combination, the acquirer measures the non-controlling interest in the acquired entity either at fair value or as a proportionate share of their identifiable net assets. Transaction costs incurred are expensed.
When the Group acquires a business, it assesses the financial assets and liabilities assumed for appropriate classification and designation, in accordance with the contractual terms, economic circumstances and pertinent conditions on the date of acquisition.
Any contingent consideration to be transferred by the acquirer will be recognised at fair value on the date of acquisition. Subsequent changes to the fair value of any contingent consideration classified as a liability will be recognised in the Statement of comprehensive income. Acquisition accounting is finalised when the Group has gathered all the necessary information, which must occur within 12 months of the acquisition date. There are no exemptions from the 12-month rule for deferred tax assets or changes in the contingent consideration.

Notes to the financial statements » continued
90 NEW EUROPE PROPERTY INVESTMENTS PLC – ANNUAL REPORT 2015
3.31 Changes in accounting policy and disclosuresThe accounting policies adopted are consistent with those of the previous financial year except for the following amended IFRSs which have been adopted by the Group as of 1 January 2015. None of these standards has had a material impact on the Group’s operations.
Defined Benefit Plans: Employee Contributions - Amendments to IAS 19 (issued in November 2013 and effective for annual periods beginning 1 July 2014)
The amendment allows entities to recognise employee contributions as a reduction in the service cost in the period in which the related employee service is rendered, instead of attributing the contributions to the periods of service, if the amount of the employee contributions is independent of the number of years of service.
Annual Improvements to IFRSs 2012 (issued in December 2013 and effective for annual periods beginning on or after 1 July 2014, unless otherwise stated below).
The improvements consist of changes to seven standards. IFRS 2 was amended to clarify the definition of a ‘vesting condition’ and to define separately ‘performance condition’ and ‘service condition’; The amendment is effective for share-based payment transactions for which the grant date is on or after 1 July 2014.IFRS 3 was amended to clarify that (1) an obligation to pay contingent consideration which meets the definition of a financial instrument is classified as a financial liability or as equity, on the basis of the definitions in IAS 32, and (2) all non-equity contingent consideration, both financial and non-financial, is measured at fair value at each reporting date, with changes in fair value recognised in profit and loss. Amendments to IFRS 3 are effective for business combinations where the acquisition date is on or after 1 July 2014.IFRS 8 was amended to require (1) disclosure of the judgements made by management in aggregating operating segments, including a description of the segments which have been aggregated and the economic indicators which have been assessed in determining that the aggregated segments share similar economic characteristics, and (2) a reconciliation of segment assets to the entity’s assets when segment assets are reported.The basis for conclusions on IFRS 13 was amended to clarify that deletion of certain paragraphs in IAS 39 upon publishing of IFRS 13 was not made with an intention to remove the ability to measure short-term receivables and payables at invoice amount where the impact of discounting is immaterial.IAS 16 and IAS 38 were amended to clarify how the gross carrying amount and the accumulated depreciation are treated where an entity uses the revaluation model. IAS 24 was amended to include, as a related party, an entity that provides key management personnel services to the reporting entity or to the parent of the reporting entity (‘the management entity’), and to require to disclose the amounts charged to the reporting entity by the management entity for services provided.
Annual Improvements to IFRSs 2013 (issued in December 2013 and effective for annual periods beginning on or after 1 July 2014) The improvements consist of changes to four standards. The basis for conclusions on IFRS 1 is amended to clarify that, where a new version of a standard is not yet mandatory but is available for early adoption; a first-time adopter can use either the old or the new version, provided the same standard is applied in all periods presented.IFRS 3 was amended to clarify that it does not apply to the accounting for the formation of any joint arrangement under IFRS 11. The amendment also clarifies that the scope exemption only applies in the financial statements of the joint arrangement itself.The amendment of IFRS 13 clarifies that the portfolio exception in IFRS 13, which allows an entity to measure the fair value of a group of financial assets and financial liabilities on a net basis, applies to all contracts (including contracts to buy or sell non-financial items) that are within the scope of IAS 39 or IFRS 9. IAS 40 was amended to clarify that IAS 40 and IFRS 3 are not mutually exclusive. The guidance in IAS 40 assists preparers to distinguish between investment property and owner-occupied property. Preparers also need to refer to the guidance in IFRS 3 to determine whether the acquisition of an investment property is a business combination
3.32 Standards issued but not yet effective and not early adopted
IFRS 9 “Financial Instruments” (issued in July 2014 and effective for annual periods beginning on or after 1 January 2018). Key features of the new standard are:• Financial assets are required to be classified into three measurement categories: those to be measured
subsequently at amortised cost, those to be measured subsequently at fair value through other comprehensive income (FVOCI) and those to be measured subsequently at fair value through profit or loss (FVPL).
• Classification for debt instruments is driven by the entity’s business model for managing the financial assets and whether the contractual cash flows represent solely payments of principal and interest (SPPI). If a debt instrument is held to collect, it may be carried at amortised cost if it also meets the SPPI requirement. Debt instruments that meet the SPPI requirement that are held in a portfolio where an entity both holds to collect

NEW EUROPE PROPERTY INVESTMENTS PLC – ANNUAL REPORT 2015 91
assets’ cash flows and sells assets may be classified as FVOCI. Financial assets that do not contain cash flows that are SPPI must be measured at FVPL (for example, derivatives). Embedded derivatives are no longer separated from financial assets but will be included in assessing the SPPI condition.
• Investments in equity instruments are always measured at fair value. However, management can make an irrevocable election to present changes in fair value in other comprehensive income, provided the instrument is not held for trading. If the equity instrument is held for trading, changes in fair value are presented in profit or loss.·
• Most of the requirements in IAS 39 for classification and measurement of financial liabilities were carried forward unchanged to IFRS 9. The key change is that an entity will be required to present the effects of changes in own credit risk of financial liabilities designated at fair value through profit or loss in other comprehensive income.
• IFRS 9 introduces a new model for the recognition of impairment losses – the expected credit losses (ECL) model. There is a ‘three stage’ approach which is based on the change in credit quality of financial assets since initial recognition. In practice, the new rules mean that entities will have to record an immediate loss equal to the 12-month ECL on initial recognition of financial assets that are not credit impaired (or lifetime ECL for trade receivables). Where there has been a significant increase in credit risk, impairment is measured using lifetime ECL rather than 12-month ECL. The model includes operational simplifications for lease and trade receivables.
• Hedge accounting requirements were amended to align accounting more closely with risk management. The standard provides entities with an accounting policy choice between applying the hedge accounting requirements of IFRS 9 and continuing to apply IAS 39 to all hedges because the standard currently does not address accounting for macro hedging.
The Group is currently assessing the impact of the new standard on its financial statements.
IFRS 14, Regulatory Deferral Accounts (issued in January 2014 and effective for annual periods beginning on or after 1 January 2016). IFRS 14 permits first-time adopters to continue to recognise amounts related to rate regulation in accordance with their previous GAAP requirements when they adopt IFRS. However, to enhance comparability with entities that already apply IFRS and do not recognise such amounts, the standard requires that the effect of rate regulation must be presented separately from other items. An entity that already presents IFRS financial statements is not eligible to apply the standard. The new standard is not expected to impact the Group’s financial statements.
Accounting for Acquisitions of Interests in Joint Operations - Amendments to IFRS 11 (issued on 6 May 2014 and effective for the periods beginning on or after 1 January 2016). This amendment adds new guidance on how to account for the acquisition of an interest in a joint operation that constitutes a business. The amendment is not expected to impact the Group’s financial statements.
Clarification of Acceptable Methods of Depreciation and Amortisation - Amendments to IAS 16 and IAS 38 (issued on 12 May 2014 and effective for the periods beginning on or after 1 January 2016). In this amendment, the IASB has clarified that the use of revenue-based methods to calculate the depreciation of an asset is not appropriate because revenue generated by an activity that includes the use of an asset generally reflects factors other than the consumption of the economic benefits embodied in the asset. The amendment is not expected to materially impact the Group’s financial statements.
IFRS 15, Revenue from Contracts with Customers (issued on 28 May 2014 and effective for the periods beginning on or after 1 January 2018). The new standard introduces the core principle that revenue must be recognised when the goods or services are transferred to the customer, at the transaction price. Any bundled goods or services that are distinct must be separately recognised, and any discounts or rebates on the contract price must generally be allocated to the separate elements. When the consideration varies for any reason, minimum amounts must be recognised if they are not at significant risk of reversal. Costs incurred to secure contracts with customers have to be capitalised and amortised over the period when the benefits of the contract are consumed. The Group is currently assessing the impact of the new standard on its financial statements.
Agriculture: Bearer plants - Amendments to IAS 16 and IAS 41 (issued on 30 June 2014 and effective for annual periods beginning 1 January 2016). The amendments change the financial reporting for bearer plants, such as grape vines, rubber trees and oil palms, which now should be accounted for in the same way as property, plant and equipment because their operation is similar to that of manufacturing. Consequently, the amendments include them within the scope of IAS 16, instead of IAS 41. The produce growing on bearer plants will remain within the scope of IAS 41. The amendments are not expected to impact the Group’s financial statements.
Equity Method in Separate Financial Statements - Amendments to IAS 27 (issued on 12 August 2014 and effective for annual periods beginning 1 January 2016). The amendments will allow entities to use the equity method to account for investments in subsidiaries, joint ventures and associates in their separate financial statements. The amendments are not expected to materially impact the Company’s financial statements.
Notes to the financial statements » continued
92 NEW EUROPE PROPERTY INVESTMENTS PLC – ANNUAL REPORT 2015
Sale or Contribution of Assets between an Investor and its Associate or Joint Venture - Amendments to IFRS 10 and IAS 28 (issued on 11 September 2014 and effective for annual periods beginning on or after a date to be determined by the IASB). These amendments address an inconsistency between the requirements in IFRS 10 and those in IAS 28 in dealing with the sale or contribution of assets between an investor and its associate or joint venture. The main consequence of the amendments is that a full gain or loss is recognised when a transaction involves a business. A partial gain or loss is recognised when a transaction involves assets that do not constitute a business, even if these assets are held by a subsidiary. The Group is currently assessing the impact of the amendments on its financial statements.
Annual Improvements to IFRSs 2014 (issued on 25 September 2014 and effective for annual periods beginning on or after 1 January 2016). The amendments impact 4 standards. IFRS 5 was amended to clarify that change in the manner of disposal (reclassification from "held for sale" to "held for distribution" or vice versa) does not constitute a change to a plan of sale ore distribution, and does not have to be accounted for as such. The amendment to IFRS 7 adds guidance to help management determine whether the terms of an arrangement to service a financial asset which has been transferred constitute continuing involvement, for the purposes of disclosures required by IFRS 7. The amendment also clarifies that the offsetting disclosures of IFRS 7 are not specifically required for all interim periods, unless required by IAS 34.The amendment to IAS 19 clarifies that for post-employment benefit obligations, the decisions regarding discount rate, existence of deep market in high-quality corporate bonds, or which government bonds to use as a basis, should be based on the currency that the liabilities are denominated in, and not the country where they arise. IAS 34 will require a cross reference from the interim financial statements to the location of "information disclosed elsewhere in the interim financial report". The Group is currently assessing the impact of the amendments on its financial statements.
Disclosure Initiative Amendments to IAS 1 (issued in December 2014 and effective for annual periods on or after 1 January 2016). The Standard was amended to clarify the concept of materiality and explains that an entity need not provide a specific disclosure required by an IFRS if the information resulting from that disclosure is not material, even if the IFRS contains a list of specific requirements or describes them as minimum requirements. The Standard also provides new guidance on subtotals in financial statements, in particular, such subtotals (a) should be comprised of line items made up of amounts recognised and measured in accordance with IFRS; (b) be presented and labelled in a manner that makes the line items that constitute the subtotal clear and understandable; (c) be consistent from period to period; and (d) not be displayed with more prominence than the subtotals and totals required by IFRS standards. The amendment is not expected to have a material impact on the Group’s financial statements.
Investment Entities: Applying the Consolidation Exception Amendment to IFRS 10, IFRS 12 and IAS 28 (issued in December 2014 and effective for annual periods on or after 1 January 2016). The Standard was amended to clarify that an investment entity should measure at fair value through profit or loss all of its subsidiaries that are themselves investment entities. In addition, the exemption from preparing consolidated financial statements if the entity’s ultimate or any intermediate parent produces consolidated financial statements available for public use was amended to clarify that the exemption applies regardless whether the subsidiaries are consolidated or are measured at fair value through profit or loss in accordance with IFRS 10 in such ultimate or any intermediate parent’s financial statements. The amendment is not expected to have a material impact on the Group’s financial statements.
IFRS 16 "Leases" (issued in January 2016 and effective for annual periods beginning on or after 1 January 2019). The new standard sets out the principles for the recognition, measurement, presentation and disclosure of leases. All leases result in the lessee obtaining the right to use an asset at the start of the lease and, if lease payments are made over time, also obtaining financing. Accordingly, IFRS 16 eliminates the classification of leases as either operating leases or finance leases as is required by IAS 17 and, instead, introduces a single lessee accounting model. Lessees will be required to recognise: (a) assets and liabilities for all leases with a term of more than 12 months, unless the underlying asset is of low value; and (b) depreciation of lease assets separately from interest on lease liabilities in the income statement. IFRS 16 substantially carries forward the lessor accounting requirements in IAS 17. Accordingly, a lessor continues to classify its leases as operating leases or finance leases, and to account for those two types of leases differently. The Group is currently assessing the impact of the new standard on its financial statements.
Recognition of Deferred Tax Assets for Unrealised Losses - Amendments to IAS 12 (issued in January 2016 and effective for annual periods beginning on or after 1 January 2017). The amendment has clarified the requirements on recognition of deferred tax assets for unrealised losses on debt instruments. The entity will have to recognise deferred tax asset for unrealised losses that arise as a result of discounting cash flows of debt instruments at market interest rates, even if it expects to hold the instrument to maturity and no tax will be payable upon collecting the principal amount. The economic benefit embodied in the deferred tax asset arises from the ability of the holder of the debt instrument to achieve future gains (unwinding of the effects of discounting) without paying taxes on those gains. The Group is currently assessing the impact of the new standard on its financial statements.
Disclosure Initiative - Amendments to IAS 7 (issued on 29 January 2016 and effective for annual periods beginning on or after 1 January 2017) The amended IAS 7 will require disclosure of a reconciliation of movements in liabilities arising from financing activities. The Group is currently assessing the impact of the new standard on its financial statements.

NEW EUROPE PROPERTY INVESTMENTS PLC – ANNUAL REPORT 2015 93
4 CRITICAL ACCOUNTING ESTIMATES AND JUDGEMENTS IN APPLYING ACCOUNTING POLICIES
The Group’s management discusses with the Audit Committee the development, selection and disclosure of the Group’s critical accounting policies and estimates, as well as their application.
The estimates and associated assumptions are based on historical experience and various other factors reasonable under the circumstances. These are used to make judgements about the carrying values of assets and liabilities that are not apparent from other sources. Actual results may differ from these estimates.
The estimates and associated assumptions are reviewed on an ongoing basis. Revisions to accounting estimates are recognised in the period when the estimate is revised if the revision affects only that period or in the period of the revision and future periods if the revision affects both.
Judgements that have the most significant effect on the amounts recognised in the financial statements and estimates that can cause a significant adjustment to the carrying amount of assets and liabilities within the next financial year are detailed below.
Valuation of investment propertiesInvestment property is stated at its fair value based on reports prepared by international valuers at each half year reporting period. Valuations are based principally on discounted cash flow projections based on reliable estimates of future cash flows, using discount rates that reflect current market assessments of the uncertainty in the amount and timing of the cash flows. These are supported by the terms of any existing lease and other contracts and by external evidence such as current market rents for similar properties in the same location and condition.
In preparing the valuation reports on the Group’s investment property, the external appraisers excluded distressed sales when considering comparable sales prices. Management reviewed the appraisers’ assumptions relating to the discounted cash flow models used in the valuations, and confirmed that factors such as the discount rate applied have been appropriately determined considering the market conditions at the end of the reporting period.
Valuations of the income generating properties are based on cash flow statements, in which the present value of net operating income during a ten-year period and the residual value of the property at the end of the period are calculated.
Forecasts of net operating income are based on leases signed at the time of the valuation date, the estimated rental values for existing leases when they expire and the estimated achievable rental values of the existing vacancies. The value of long-term vacancies is estimated based on the properties’ location and condition. The valuers’ assessments of non-recoverable expenses are based on their experience of comparable properties and historical costs provided by the Group.
The discount rates used are nominal returns on total capital before tax and vary between 7.5% and 12%. The required rates of return are based on assessments of the market’s required returns for similar properties. The discount rate is set individually for each property and is based on the condition and location, the stability of the tenant and lease length.
Business combinations or asset acquisitionsThe Group assesses for each property or entity acquired whether the transaction represents a business combination or an asset acquisition. The basis for this assessment is described in Note 3.30.

Notes to the financial statements » continued
94 NEW EUROPE PROPERTY INVESTMENTS PLC – ANNUAL REPORT 2015
5 INVESTMENT IN SUBSIDIARIES AND JOINT-VENTURES
The Company has direct investments and indirect holdings in other Group companies that were included in the consolidated financial statements, and are detailed below:
Subsidiary/ joint-venture
Incorporation/date became subsidiary or
joint-ventureCountry of
incorporation Principal activity Investment
Effective interest
(%)
Immediate parent
investment 31 Dec 2015
Immediate parent
investment 31 Dec 2014
AUPARK Žilina SC as Oct 2008/ Aug 2013 Slovakia Services indirect 100 * *
AUPARK Žilina spol sro Dec 2003/ Aug 2013 Slovakia Property-owning Indirect 100 15,463 15,463
AUPARK Kosice SC s.r.o Nov 2008/Dec 2014 Slovakia Services Indirect 100 1,935 -
AUPARK Kosice spol. s.r.o Jan 2004/Dec 2014 Slovakia Property-owning Indirect 100 9,567 -
AUPARK Tower Kosice s.r.o Nov 2008/Dec 2014 Slovakia Property-owning Indirect 100 3,401 -
Aurora Mall Buzau SRL Oct 2012 Romania Property-owning Indirect 100 2 2
Braila Promenada Mall SRL Sep 2009 Romania Property-owning Indirect 100 8,300 8,300
Brasov Shopping City SRL Jun 2011 Romania Property-owning Indirect 100 2 2
Cluj Business Centre SRL** Jul 2012 Romania Property-owning Indirect 50 * *
Degi Titan SRL Apr 2005/Jul 2015 Romania Property-owning Indirect 100 43,078 -
E-power Supply s.r.o. Nov 2015 Slovakia Services Indirect 100 5 -
ELJ Vatra SRL Feb 2007/ Aug 2013 Romania Property-owning Indirect 70 1 1
Everest Investitii si Consultanta SRL Feb 2005/ Nov 2013 Romania Property-owning Indirect 100 28,431 28,431
FDC Braila BV Sep 2009 Netherlands Holding Indirect 100 7,875 7,875
Floreasca Business Park SRL Dec 2010 Romania Property-owning Indirect 100 * *
Floreasca City Center SRL Oct 2005/Oct 2014 Romania Property-owning Indirect 100 38,952 38,973
Floreasca Center SRL Apr 2011/Nov 2014 Romania Property-owning Indirect 100 27,044 27,323
Galati Shopping City SRL Jun 2012 Romania Property-owning Indirect 100 2 2
General Building Management SRL Aug 2004/ Jan 2008 Romania Property-owning Indirect 100 1,402 1,402
General Investment SRL Mar 2003/ Jan 2008 Romania Property-owning Indirect 100 19,708 19,708
Ingen Europe BV Dec 2010 Netherlands Holding Indirect 100 17,579 17,579
INLOGIS VI s.r.o Jun 2011/Dec 2014 Slovakia Property-owning Indirect 100 6,545 -
Lakeview Office Building SRL Jul 2004/ Jan 2013 Romania Property-owning Indirect 100 13,529 13,529
Marketing Advisers SRL Apr 2014 Romania Services Indirect 100 2 2
Mercureal SRL Jul 2005/ Aug 2013 Romania Property-owning Indirect 100 21,010 21,010
Modatim Business Facility SA Nov 2015 Romania Property-owning Indirect 100 33,214 -
NE Property Coöperatief UA Oct 2007 Netherlands Holding Indirect 100 336,000 336,000
NEPI Bucharest One SRL Sep 2007 Romania Property-owning Indirect 100 3,845 3,845
NEPI Bucharest Two SRL Dec 2007 Romania Property-owning Indirect 100 2,756 2,756
Nepi Three Building Management SRL Mar 2013 Romania Property-owning Indirect 100 2 2
Nepi Four Real Estate Solutions SRL Mar 2013 Romania Property-owning Indirect 100 2 2
Nepi Five Property Development SRL Mar 2013 Romania Property-owning Indirect 100 2 2
NEPI Six Development SRL May 2012 Romania Property-owning Indirect 100 2 2
NEPI Seven Business Management SRL Jun 2012 Romania Property-owning Indirect 100 2 2
NEPI Ten Development Solutions SRL Jun 2012 Romania Property-owning Indirect 100 2 2
Nepi Fourteen Management Solutions SRL Jan 2014 Romania Property-owning Indirect 100 2 2
Nepi Fifteen Real Estate Administration SRL Jan 2014 Romania Property-owning Indirect 100 2 2
Nepi Sixteen Real Estate Investment SRL Jul 2014 Romania Property-owning Indirect 100 2 2
Nepi Seventeen Land Development SRL Jul 2014 Romania Property-owning Indirect 100 2 2
NEPI Real Estate Development d.o.o. Nov 2014 Serbia Services Indirect 100 10 10
NEPI Investment Management Ltd (BVI)*** Jul 2007/Jun 2010 British Virgin Islands Holding Direct 100 6,826 6,826
NEPI Investment Management Ltd*** Aug 2007/Jun 2010 Cyprus Holding Indirect 100 2 2
NEPI Investment Management SRL Jun 2010 Romania Services Indirect 100 7,280 7,280
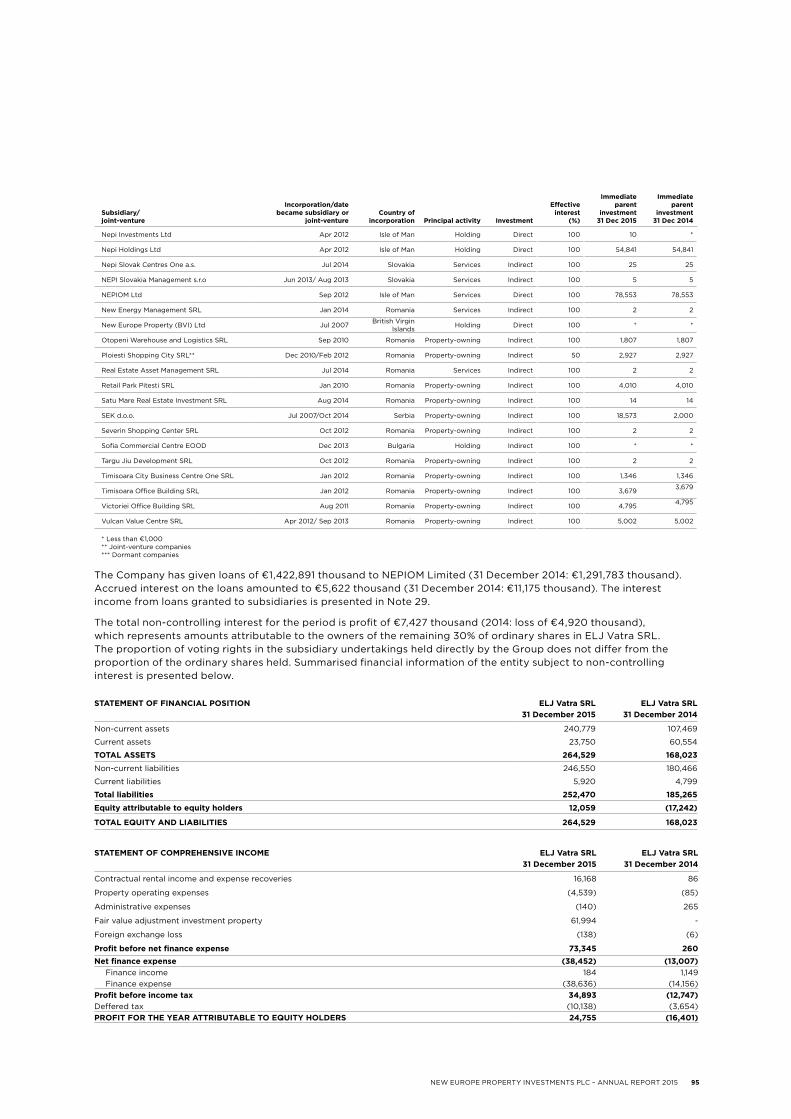
NEW EUROPE PROPERTY INVESTMENTS PLC – ANNUAL REPORT 2015 95
The Company has given loans of €1,422,891 thousand to NEPIOM Limited (31 December 2014: €1,291,783 thousand). Accrued interest on the loans amounted to €5,622 thousand (31 December 2014: €11,175 thousand). The interest income from loans granted to subsidiaries is presented in Note 29.
The total non-controlling interest for the period is profit of €7,427 thousand (2014: loss of €4,920 thousand), which represents amounts attributable to the owners of the remaining 30% of ordinary shares in ELJ Vatra SRL. The proportion of voting rights in the subsidiary undertakings held directly by the Group does not differ from the proportion of the ordinary shares held. Summarised financial information of the entity subject to non-controlling interest is presented below.
Subsidiary/ joint-venture
Incorporation/date became subsidiary or
joint-ventureCountry of
incorporation Principal activity Investment
Effective interest
(%)
Immediate parent
investment 31 Dec 2015
Immediate parent
investment 31 Dec 2014
Nepi Investments Ltd Apr 2012 Isle of Man Holding Direct 100 10 *
Nepi Holdings Ltd Apr 2012 Isle of Man Holding Direct 100 54,841 54,841
Nepi Slovak Centres One a.s. Jul 2014 Slovakia Services Indirect 100 25 25
NEPI Slovakia Management s.r.o Jun 2013/ Aug 2013 Slovakia Services Indirect 100 5 5
NEPIOM Ltd Sep 2012 Isle of Man Services Direct 100 78,553 78,553
New Energy Management SRL Jan 2014 Romania Services Indirect 100 2 2
New Europe Property (BVI) Ltd Jul 2007 British Virgin Islands Holding Direct 100 * *
Otopeni Warehouse and Logistics SRL Sep 2010 Romania Property-owning Indirect 100 1,807 1,807
Ploiesti Shopping City SRL** Dec 2010/Feb 2012 Romania Property-owning Indirect 50 2,927 2,927
Real Estate Asset Management SRL Jul 2014 Romania Services Indirect 100 2 2
Retail Park Pitesti SRL Jan 2010 Romania Property-owning Indirect 100 4,010 4,010
Satu Mare Real Estate Investment SRL Aug 2014 Romania Property-owning Indirect 100 14 14
SEK d.o.o. Jul 2007/Oct 2014 Serbia Property-owning Indirect 100 18,573 2,000
Severin Shopping Center SRL Oct 2012 Romania Property-owning Indirect 100 2 2
Sofia Commercial Centre EOOD Dec 2013 Bulgaria Holding Indirect 100 * *
Targu Jiu Development SRL Oct 2012 Romania Property-owning Indirect 100 2 2
Timisoara City Business Centre One SRL Jan 2012 Romania Property-owning Indirect 100 1,346 1,346
Timisoara Office Building SRL Jan 2012 Romania Property-owning Indirect 100 3,679 3,679
Victoriei Office Building SRL Aug 2011 Romania Property-owning Indirect 100 4,795 4,795
Vulcan Value Centre SRL Apr 2012/ Sep 2013 Romania Property-owning Indirect 100 5,002 5,002
* Less than €1,000** Joint-venture companies*** Dormant companies
STATEMENT OF FINANCIAL POSITION ELJ Vatra SRL ELJ Vatra SRL31 December 2015 31 December 2014
Non-current assets 240,779 107,469
Current assets 23,750 60,554
TOTAL ASSETS 264,529 168,023
Non-current liabilities 246,550 180,466
Current liabilities 5,920 4,799
Total liabilities 252,470 185,265
Equity attributable to equity holders 12,059 (17,242)
TOTAL EQUITY AND LIABILITIES 264,529 168,023
STATEMENT OF COMPREHENSIVE INCOME ELJ Vatra SRL ELJ Vatra SRL31 December 2015 31 December 2014
Contractual rental income and expense recoveries 16,168 86
Property operating expenses (4,539) (85)
Administrative expenses (140) 265
Fair value adjustment investment property 61,994 -
Foreign exchange loss (138) (6)
Profit before net finance expense 73,345 260Net finance expense (38,452) (13,007)
Finance income 184 1,149Finance expense (38,636) (14,156)
Profit before income tax 34,893 (12,747)Deffered tax (10,138) (3,654)PROFIT FOR THE YEAR ATTRIBUTABLE TO EQUITY HOLDERS 24,755 (16,401)

Notes to the financial statements » continued
96 NEW EUROPE PROPERTY INVESTMENTS PLC – ANNUAL REPORT 2015
6 FINANCIAL RISK MANAGEMENT AND FINANCIAL INSTRUMENTS
The Group has exposure to the following risks due to its use of financial instruments: credit, liquidity, market, currency and interest rate. This note presents information about the Group’s exposure to each, as well as its objectives, policies and processes for measuring and managing risk.
The Board of Directors has overall responsibility for the establishment and oversight of the Group’s risk management framework. The Board has delegated the responsibility for developing this framework to the Risk Committee. This Committee reports to the Board of Directors on its activities, oversees how management monitors compliance policies and procedures, and reviews the adequacy of the framework with regard to the risks faced.
The Group’s policies are established to identify and analyse the risks it may encounter by performing its activities, to set appropriate limits and controls, and to monitor risks and adherence to limits. These policies and systems are reviewed regularly to reflect changes in market conditions and Group activities. The fair value of all financial instruments is the same as the carrying amounts reflected on the Statement of financial position.
Below is a comparison, by class, of the carrying amounts and fair value of the Group’s and Company's financial instruments carried in the financial statements.
Note LevelGroup
31 Dec 2015Group
31 Dec 2014Group
31 Dec 2015Group
31 Dec 2014
Carrying amount Fair value
Financial assetsLoans to participants in the Current Share Scheme (including
accrued interest) 11 3 16,090 27,953 16,090 27,953
Financial assets at fair value through profit or loss 20 2 2,282 175 2,282 175
Trade and other receivables less VAT 14 3 19,523 12,896 19,523 12,896
Loans granted to joint-ventures 33 3 36,674 30,395 36,674 30,395
Loans granted to third parties 11 3 – 8,000 – 8,000
Cash and cash equivalents 15 3 326,610 108,236 326,610 108,236
TOTAL 401,179 187,655 401,179 187,655
Financial liabilities
Bank borrowings 19 3 176,212 194,330 176,212 194,330
— Rate capped 81,346 90,966 81,346 90,966
— Rate swapped 94,866 103,364 94,866 103,364
Bonds 19 3 393,414 – 393,414 –
Financial liabilities at fair value through profit or loss 20 2 2,149 3,586 2,149 3,586
Trade and other payables 21 3 62,827 38,365 62,827 38,365
TOTAL 634,602 236,281 634,602 236,281
Note LevelCompany
31 Dec 2015Company
31 Dec 2014Company
31 Dec 2015Company
31 Dec 2014
Carrying amount Fair value
Financial assetsLoans to participants in the Current Share Scheme (including
accrued interest) 11 3 16,090 27,953 16,090 27,953
Loans granted to subsidiaries 5 3 1,428,513 1,302,958 1,428,513 1,302,958
Financial assets at fair value through profit or loss 20 2 2,236 74 2,236 74
Trade and other receivables 14 3 49,849 7,166 49,849 7,166
Cash and cash equivalents 15 3 1,008 1,363 1,008 1,363
TOTAL 1,497,696 1,339,514 1,497,696 1,339,514
Financial liabilities
Loans and borrowings 3 183 326 183 326
— Rate capped 183 326 183 326
Financial liabilities at fair value through profit or loss 20 2 2,149 3,496 2,149 3,496
Trade and other payables 21 3 572 333 572 333
TOTAL 2,904 4,155 2,904 4,155

NEW EUROPE PROPERTY INVESTMENTS PLC – ANNUAL REPORT 2015 97
6.1 Credit riskCredit risk is the risk of financial loss to the Group if a tenant, or counterparty to a financial instrument, fails to meet its contractual obligations, and arises principally from the Group’s receivables from tenants.
The carrying amount of financial assets represents the maximum credit exposure. The maximum exposure to credit risk at the reporting date is set out below.
As at 31 December 2015 the marked-to-market value of derivative asset positions is net of a credit valuation adjustment attributable to derivative counterparty default risk. Changes in counterparty credit risk had no material effect on the fair value of the derivatives and other financial instruments recognised at fair value through profit or loss.
Trade and other receivables relate mainly to the Group’s tenants. When monitoring customer credit risk, customers are grouped according to their credit characteristics, including whether they are an individual or legal entity, the industry they work in, business size and previous financial difficulties.
The credit risk of loans to participants in the Current Share Scheme is considered to be offset as these are guaranteed with shares (see details in Note 18).
The exposure to credit risk is mainly influenced by the tenant’s individual characteristics. The Group’s widespread customer base reduces credit risk. The majority of rental income is derived from type A tenants (large international and national tenants; large listed tenants; government and major franchisees and companies with assets and/or turnovers exceeding €200 million), but there is no concentration of credit risk with respect to trade debtors.
Management has established a credit policy where new customers are analysed individually for credit worthiness before standard payment terms and conditions are offered. When available the evaluation includes external ratings.
The Group establishes an allowance for impairment based on its estimate of incurred losses in respect of trade and other receivables and investments. The allowance’s main element is a specific loss component that relates to individually significant exposures. The carrying value of financial assets approximates their fair value.
Credit exposure on financial instruments NoteGroup
31 Dec 2015Group
31 Dec 2014Company
31 Dec 2015Company
31 Dec 2014
Loans to participants in the Current Share Scheme (including accrued interest) 11 16,090 27,953 16,090 27,953
Loans granted to subsidiaries 5 – – 1,428,513 1,302,958
Loans granted to joint-ventures 33 36,674 30,395 – –
Non-current receivables 11 1,402 8,777 – –
Financial assets at fair value through profit or loss 20 2,282 175 2,236 74
Trade and other receivables 14 54,487 40,469 49,849 7,166
Cash and cash equivalents 15 326,610 108,236 1,008 1,363
TOTAL 437,545 216,005 1,497,696 1,339,514
Ageing of tenant receivablesGroup
31 Dec 2015Group
31 Dec 2014
Receivables not due 9,322 6,297
Receivables past due but not impaired 4,992 1,482
Under 30 days 3,322 1,188
30–60 days 454 146
60–90 days 391 65
Over 90 days 825 83
TOTAL (Note 14) 14,314 7,779
The increase in balances of receivables past due is mostly attributable to acquisitions finalised in 2015. The Group is working on implementing its collection procedures and expects that balances will decrease in the short term. Part of the amounts were collected after the balance sheet date; also, the Group has guarantees received from tenants (in cash or letters of guarantee from banks) that are higher than the balance receivable.

Notes to the financial statements » continued
98 NEW EUROPE PROPERTY INVESTMENTS PLC – ANNUAL REPORT 2015
Loans granted to joint-ventures and subsidiaries are not due.
The Group assessed its receivables for impairment and concluded that an amount of €280 thousand (31 December 2014: €67 thousand) is unlikely to be recovered in respect of current period revenues: therefore an allowance for doubtful debts was charged to the Statement of comprehensive income.
For purposes of cash management the Group has deposit accounts with a number of banks. The arrangements in place result in a favourable mix between flexibility and interest earnings. The banks’ credit ratings, as well as exposure per each bank are constantly monitored. Over 95% of the Group's cash is held with investment grade rated banks.
6.2 Liquidity riskLiquidity risk is the risk that the Group will not be able to meet its financial obligations when due. The Group’s approach to managing this risk ensures, as far as possible, it will always have sufficient liquidity to meet its liabilities when due, under normal and stressed conditions, without incurring unacceptable losses or risking damage to its reputation. To ensure this occurs, the Group prepares budgets, cash flow analyses and forecasts, which enable the Directors to assess the level of financing required for future periods. Budgets and projections are used to assess any future potential investments, and are compared to existing funds held on deposit to evaluate the nature, and extent of any future funding requirements.
The Group receives rental income on a monthly basis. Typically, the Group ensures it has sufficient cash on demand to meet expected operational expenses. This excludes the potential impact of extreme circumstances that cannot reasonably be predicted, such as natural disasters.
Further reference to bank loan maturity analysis is made in Note 19.
Group 31 Dec 2015 Noteunder
3 months 3–12 months 1–5 years over 5 years Total
Bonds and bank borrowings 19 4,371 10,327 162,788 392,140 569,626
Tenant deposits 21 54 304 – – 358Financial liabilities at fair value
through profit or loss 20 – – 2,149 – 2,149
Trade and other payables 21 12,494 49,975 – – 62,469
Other long-term liabilities 22 – – – 14,988 14,988
TOTAL 16,919 60,606 164,937 407,128 649,590
Group 31 Dec 2014 Noteunder
3 months 3–12 months 1–5 years over 5 years Total
Bonds and bank borrowings 19 3,123 20,136 153,717 17,354 194,330
Tenant deposits 21 314 1,781 – – 2,095Financial liabilities at fair value
through profit or loss 20 – – 3,586 – 3,586
Trade and other payables 21 6,983 29,287 – – 36,270
Other long-term liabilities 22 – – – 9,171 9,171
TOTAL 10,420 51,204 157,303 26,525 245,452

NEW EUROPE PROPERTY INVESTMENTS PLC – ANNUAL REPORT 2015 99
6.3 Market riskMarket risk is the risk that changes in market prices, such as foreign exchange rates or interest rates will affect the Group’s fair value or future cash flows of financial instruments. Changes in market prices can also affect the valuation of the Group’s financial investments. The objective of market risk management is to manage market risk exposures within acceptable parameters, while optimising returns. The carrying value of financial assets and liabilities approximates their fair value.
6.3.1 Currency riskThe Group’s current assets and liabilities are exposed to foreign currency risk on purchases and receivables denominated in Romanian leu (RON), Great British pound sterling (£, GBP), Serbian dinar (RSD) and South African rand (R, ZAR).
Cash inflows received in other currencies than Euro are converted to Euro using the spot rate available on the collection date. The Group applies this policy to control its exposure to monetary assets and liabilities denominated in currencies other than the one cash inflows are received in.
6.3.2 Interest rate riskThe Group is exposed to interest rate risk on loans, borrowings and cash balances held. Group policy is to hedge this risk through the use of derivative financial instruments. As at 31 December 2015 and 31 December 2014, the Group held interest rate swaps and interest rate caps as further disclosed in Notes 19 and 20.
Sensitivity analysis for interest bearing financial instrumentsA change of 100 Basis Points (bps) in interest rates would have increased/(decreased) equity and profit for the year as shown below. Calculations are based on the cash and loans and borrowings balances outstanding at the respective balance sheet dates. Cash and loans and borrowings balances are subject to change over the year, therefore the calculations are not representative for the year as a whole. This analysis assumes that all other variables, particularly foreign currency rates, remain constant.
Loans and borrowings with swapped interest rates are not affected by market changes in interest rates.
Group31 Dec 2015
Group31 Dec 2014
Company31 Dec 2015
Company31 Dec 2014
Loans to participants in Current Share Scheme (including accrued interest) 16,090 27,953 16,090 27,953
Loans and borrowings (variable or capped rate) (81,346) (90,966) (183) –
TOTAL (65,256) (63,013) 15,907 27,953

Notes to the financial statements » continued
100 NEW EUROPE PROPERTY INVESTMENTS PLC – ANNUAL REPORT 2015
6.3.3 Market risk for listed property sharesDuring 2014 all financial investments were disposed of (for further details on financial investments at fair value through profit or loss see Note 13).
Group 31 Dec 2015Profit or loss
100bps increaseProfit or loss
100bps decrease Equity
100bps increaseEquity
100bps decrease Loans to participants in Current Share
Scheme 161 (161) 161 (161)
Loans and borrowings (variable or capped rate) (813) 813 (813) 813
TOTAL (652) 652 (652) 652
Group 31 Dec 2014Profit or loss
100bps increaseProfit or loss
100bps decrease Equity
100bps increaseEquity
100bps decreaseLoans to participants in Current Share
Scheme 280 (280) 280 (280)
Loans and borrowings (variable or capped rate) (910) 910 (910) 910
TOTAL (630) 630 (630) 630
Company 31 Dec 2015Profit or loss
100bps increaseProfit or loss
100bps decrease Equity
100bps increaseEquity
100bps decrease Loans to participants in Current Share
Scheme 161 (161) 161 (161)
Loans and borrowings (variable or capped rate) (2) 2 (2) 2
TOTAL 159 (159) 159 (159)
Company 31 Dec 2014Profit or loss
100bps increaseProfit or loss
100bps decrease Equity
100bps increaseEquity
100bps decrease Loans to participants in Current Share
Scheme 280 (280) 280 (280)
Loans and borrowings (variable or capped rate) – – – –
TOTAL 280 (280) 280 (280)

NEW EUROPE PROPERTY INVESTMENTS PLC – ANNUAL REPORT 2015 101
7 INTERNAL CONTROLS TO MANAGE RISKS
The Board is responsible for the Group’s system of internal control and for reviewing its effectiveness. This system is designed to mitigate rather than eliminate the risk of failure to meet business objectives, and can only provide reasonable, not absolute, assurance against material misstatement or loss.
The key features of the Group’s system of internal control include:— Strategic and business planning: the Group produces, and agrees, a business plan each year, to which the
performance of the business is regularly monitored;— Investment appraisal: capital projects, major contracts and business and property acquisitions are reviewed in
detail and approved by the Investment Committee, and/or the Board where appropriate, in accordance with delegated authority limits;
— Financial monitoring: profitability, cash flow and capital expenditure are closely monitored and key financial information is reported to the Board regularly, including explanations of variances between actual and budgeted performance, and
— Systems of control procedures and delegated authority: clearly defined guidelines and approval limits exist for capital and operating expenditure and other key business transactions and decisions.
8 CAPITAL MANAGEMENT
The primary objective of the Group’s capital management is to ensure it complies with its quantitative banking covenants and maintains a strong credit rating. No changes were made in the objectives, policies or processes during the years ended 31 December 2015 and 31 December 2014.
Capital is primarily monitored using the gearing ratio, computed as interest bearing debt less cash divided by investment property and listed property shares, which increased to 14.0% (31 December 2014: 6.8%).
The Group’s policy is to maintain a strong capital base of equity so as to maintain investor, creditor and market confidence and to sustain future business development. The Board of Directors also monitors the level of distributions to shareholders. Neither the Company, nor its subsidiaries, are subject to externally imposed capital requirements.
The Group will retain high levels of access to liquidity to finance the Group’s development pipeline and to pursue further investment opportunities.
9 INVESTMENT PROPERTY AT FAIR VALUE
Investment property is carried at fair value and is assessed on an annual basis.
Movement in investment property at fair valueGroup
31 Dec 2015Group
31 Dec 2014
Carrying value at beginning of year 978,980 703,811
Additions from business combinations (Note 32) 268,733 197,940
Transferred from Investment property under development 225,668 76,532
Fair value adjustments (Note 28) 102,974 34,198
Investment property reclassified as held for sale (336) (33,501)
CARRYING VALUE 1,576,019 978,980
Notes to the financial statements » continued
102 NEW EUROPE PROPERTY INVESTMENTS PLC – ANNUAL REPORT 2015
The fair value of completed investment property is determined using the discounted cash flow method (DCF), with explicit assumptions regarding the benefits and liabilities of ownership over the asset’s life, including an exit, or terminal, value. As an accepted method within the income approach to valuation, the DCF method involves the projection of a series of cash flows onto a real property interest. To these projected cash flow series, an appropriate, market-derived discount rate is applied to establish the present value of cash inflows associated with the real property.
The duration of cash flow, and the specific timing of inflows and outflows, are determined by events such as rent reviews, lease renewal and related lease-up periods, re-letting, redevelopment or refurbishment. The appropriate duration is typically driven by market behaviour. In the case of investment properties, periodic cash flow is typically estimated as gross income less vacancy, non-recoverable expenses, collection losses, lease incentives, maintenance costs, agent and commission fees, and other operating and management expenses. The series of periodic net cash inflows, combined with the estimated terminal value anticipated at the end of the projection period, is then discounted.
For the years ended 31 December 2015 and 31 December 2014, the Group commissioned independent year-end appraisal reports on its investment property from DTZ Echinox Consulting and Jones Lang LaSalle, both members of the Royal Institution of Chartered Surveyors (RICS). The fair value of investment property is based on these. The Group’s investment property is classified Level Three on the fair value hierarchy as defined in IFRS 7.
As at 31 December 2015, the investment property at fair value portfolio had a vacancy rate of 2.40% (31 December 2014: 1.81%).
At the end of the reporting period, the Group’s portfolio included retail, office and industrial properties.
IFRS 13 defines fair value as the price that would be received for selling an asset or paid for transferring a liability in an orderly transaction between market participants at the measurement date. The Group currently discloses fair values according to a ‘fair value hierarchy’ (as per IFRS 13) which categorises the inputs used in valuation techniques into three levels. The hierarchy gives the highest priority (Level 1) to quoted prices in active markets for identical assets or liabilities and the lowest priority (Level 3) to unobservable inputs. The fair value hierarchy is explained below:
— Level 1: quoted prices (unadjusted) in active markets for identical assets or liabilities that the entity can access at measurement date;
— Level 2: use of a model with inputs (other than quoted prices included within Level 1) that are directly, or indirectly, observable market data, and
— Level 3: use of a model with inputs not based on observable data.
The Group’s investment property is categorised as Level 3. There were no transfers between hierarchy levels during the year.
The residual value is the market value of the property at the end of the calculation period, which is based on the forecast net operating income for the first year after the calculation period. The required yield at the end of the calculation period is between 5.93% and 18.52%. The Group’s resulting weighted average net yield was 7.62% for the entire property portfolio (retail: 7.55%; office: 7.65%; industrial: 10.91%).
Based on the year-end valuation net yield of 7.62%, an increase/decrease of 25bps would result in a €55,938 thousand decrease/increase in the Group’s property portfolio (2014: net yield of 7.82%, increase of 25bps would have resulted in a €30,321 thousand decrease).
The significant unobservable inputs used in the fair value measurement categorised within Level 3 of the fair value hierarchy of the Group’s property portfolio, together with the impact of significant movements in these inputs on the fair value measurement, are detailed below:
Unobservable input Impact on fair value of increase in input
Estimated rental value Increase
Net initial yield Decrease
Net reversionary yield Decrease

NEW EUROPE PROPERTY INVESTMENTS PLC – ANNUAL REPORT 2015 103
Land included in Investment property under development is carried at fair value and is assessed on an annual basis. For the year ended 31 December 2015, the Group commissioned independent year-end reports from DTZ Echinox Consulting and Jones Lang LaSalle, based on which the fair value of investment property was adjusted. Land included in Investment property under development is classified Level Three on the fair value hierarchy as defined in IFRS 7.
Additions from asset deals include land plots purchased for development of retail and office projects.
Borrowing costs capitalised in 2015 amount to €7,804 thousand (2014: €7,035 thousand) and were calculated using an average annual interest rate of 3.91% (2014: 5.03%).
10 INVESTMENT PROPERTY UNDER DEVELOPMENT
11 OTHER LONG-TERM ASSETS
Other long-term assets are classified below:
Non-current receivables included in 2014 secured loans given to third parties that carried interest rate at 8.9% per annum, which have been settled in 2015.
Movement in Investment property under developmentRetail
Group31 Dec 2015
Group31 Dec 2014
Carrying value at beginning of year 193,174 89,985
Additions from business combinations (Note 32) 10,800 –
Additions from asset deals and construction in progress 152,090 176,381
Fair value adjustments (Note 28) 1,470 2,791
Assets which became operational and were transferred to Investment property at fair value (224,928) (75,983)
CARRYING VALUE 132,606 193,174
Movement in Investment property under development Office
Group31 Dec 2015
Group31 Dec 2014
Carrying value at beginning of year 15,072 13,669
Additions from asset deals and construction in progress 8,982 1,862
Fair value adjustments (Note 28) 829 218
Assets which became operational and were transferred to Investment property at fair value (740) (549)
Investment property under development reclassified as held for sale (8) (128)
CARRYING VALUE 24,135 15,072
Balance of investment property under development Group31 Dec 2015
Group31 Dec 2014
Retail 132,606 193,174
Office 24,135 15,072
TOTAL 156,741 208,246
Group 31 Dec 2015
Group 31 Dec 2014
Company 31 Dec 2015
Company 31 Dec 2014
Loans to participants in the Current Share Scheme (Note 18) 16,090 27,953 16,090 27,953
Non-current receivables 1,402 8,777 – –
Property, plant and equipment and intangible assets 606 714 – –
TOTAL 18,098 37,444 16,090 27,953

Notes to the financial statements » continued
104 NEW EUROPE PROPERTY INVESTMENTS PLC – ANNUAL REPORT 2015
12 GOODWILL
The Group recognised goodwill for the following business acquisitions:
The following movements in goodwill occurred during the year ended 31 December 2015:— the acquisitions of Aupark Kosice, Iris Titan Shopping Center and City Business Centre generated goodwill that
results from the deferred taxation liability at acquisition date, and this goodwill was written-off against the increase in the fair value of the property (as shown in the year-end revaluation report, compared to the acquisition price), and
— the remaining goodwill generated through the acquisition of Promenada Mall was written-off against the increase in the fair value of the property (as shown in the revaluation report as at 30 June 2015, compared to the acquisition price).
The following movements in goodwill occurred during the year ended 31 December 2014:— the acquisition of Promenada Mall generated goodwill from the deferred taxation liability as at the acquisition
date, and this goodwill was written-off against the increase in the fair value of the property (as shown in the year-end revaluation report, compared to the acquisition price), and
— the Regional Offices portfolio goodwill was written-off against the decrease in the related deferred taxation liability (which generated the initial goodwill).
Balance at 1 Jan 2014
Net additions
Adjustments/impairment
Balance at 31 Dec 2014
Net additions
Adjustments/impairment
Balance at 31 Dec 2015
Regional offices portfolio 1,072 – (1,072) – – – –
Pitesti Retail Park 1,671 – – 1,671 – – 1,671
Floreasca Business Park 1,664 – – 1,664 – – 1,664
Internalisation of NEPI Investment Management 5,882 – – 5,882 – – 5,882
City Business Centre 2,030 – – 2,030 2,717 – 4,747
The Lakeview 3,899 – – 3,899 – – 3,899
Promenada Mall – 3,934 (1,441) 2,493 – (2,493) –
Aupark Kosice – – – – 11,189 (6,000) 5,189
Iris Titan Shopping Center – – – – 4,905 (3,971) 934
TOTAL 16,218 3,934 (2,513) 17,639 18,811 (12,464) 23,986

NEW EUROPE PROPERTY INVESTMENTS PLC – ANNUAL REPORT 2015 105
16 INVESTMENT PROPERTY HELD FOR SALE
14 TRADE AND OTHER RECEIVABLES
13 FINANCIAL INVESTMENTS AT FAIR VALUE THROUGH PROFIT OR LOSS
The Group will retain high levels of access to liquidity, aimed at financing the Group’s development pipeline and pursuing further investment opportunities. Depending on the developments and acquisitions pipeline, the management may decide to invest a portion of the cash in highly-liquid dividend-paying listed property shares.
During 2014, the financial investments portfolio was disposed of (balance as at 31 December 2013: €61,079 thousand).
In 2014, the financial investments generated €2,417 thousand in dividends and €1,299 thousand in capital gains.
Financial investments were designated as financial assets at fair value through profit or loss and classified as current assets.
The fair values of financial investments are determined based on quoted prices in active markets: therefore, they are classified, from acquisition to disposal date, as Level One on the fair value hierarchy as defined in IFRS 7.
15 CASH AND CASH EQUIVALENTS
Group 31 Dec 2015
Group 31 Dec 2014
Company 31 Dec 2015
Company 31 Dec 2014
VAT receivable 34,964 27,573 – –
Tenant receivables 14,314 7,779 – –
Other receivables 3,369 2,473 49,775* 7,117*
Prepaid property expenses 1,739 2,532 – –
Other prepaid fees 101 112 74 49
TOTAL 54,487 40,469 49,849 7,166
*includes intercompany receivable balances from other Group companies of €47,792 (31 December 2014: €5,595).
Details of cash and cash equivalents by currenciesGroup
31 Dec 2015Group
31 Dec 2014Company
31 Dec 2015Company
31 Dec 2014EUR 305,610 98,062 960 1,238
RON 17,021 9,181 – –
RSD 3,931 868 – –
ZAR 47 122 47 122
GBP 1 3 1 3
TOTAL 326,610 108,236 1,008 1,363
Investment property held for saleGroup
31 Dec 2015Group
31 Dec 2014
Carrying value at beginning of year 27,360 1,561
Additions from investment property at fair value 336 33,501
Additions from investment property under development 8 128
Disposals – (44)
Fair value adjustments (Note 28) (2,449) (7,786)
CARRYING VALUE 25,255 27,360

Notes to the financial statements » continued
106 NEW EUROPE PROPERTY INVESTMENTS PLC – ANNUAL REPORT 2015
17 SHARE CAPITAL AND SHARE PREMIUM
Movement of ordinary sharesShare capital €0.01/share
Share premium
Issued as of 1 January 2014 1,999 632,296
— Issued 4,656,679 ordinary shares at €5.0500/share* 47 (47)
— Issued 4,988,467 ordinary shares at €6.3800/share* 50 (50)
— Issued 15,041,885 ordinary shares at €6.65000/share** 150 99,844
— Issued 13,640,777 ordinary shares at €7.33000/share** 136 99,864
— Issued 19,347,453 ordinary shares at €7.75000/share** 194 149,769
— Issued 13,848,743 ordinary shares at €5.78000/share*** 138 79,829
— Sale of shares issued under the Current Share Scheme 12 3,677
— Vesting of shares issued under the Current Share Scheme reserve 13 4,791
— Reclassification of the Current Share Scheme 7 6,641
— Issue cost recognised to equity – (2,304)
CARRIED FORWARD AS AT 31 DECEMBER 2014 2,746 1,074,310
* The shares were issued in respect of the return of capital: 14 April and 6 October 2014. ** The shares were issued as part of the book build: 11 August, 29 October and 1 December 2014. *** The shares were issued on 17 April 2014 as part of the private placement.
— Issued 4,285,745 ordinary shares at €8.4600/share¹ 43 (43)
— Issued 1,351,765 ordinary shares at €9.4600/share¹ 14 (14)
— Issued 14,814,814 ordinary shares at €8.8000/share2 148 130,230
— Issue cost recognised to equity – (663)
— Interest in order to elect return of capital – 232
— Re-allocation of shares under Current Share Scheme – 24
— Sale of shares issued under the Current Share Scheme 14 3,661
— Sale of shares issued under the Initial Share Scheme 21 5,588
CARRIED FORWARD AS AT 31 DECEMBER 2015 2,986 1,213,325
¹ The shares were issued in respect of the return of capital: 30 March and 28 September 2015.² The shares were issued as part of the book build: 12 October 2015.

NEW EUROPE PROPERTY INVESTMENTS PLC – ANNUAL REPORT 2015 107
¹Option to receive capital returnGiven the Group’s ongoing development and acquisition programme, and following requests from shareholders, the Board explored alternatives to cash distributions to shareholders. As a result, shareholders had the option to receive:
— 17.35 euro cents per share distribution for the six months ended 31 December 2014 as a cash distribution, or a return of capital through an issue of new shares, credited as fully paid up, at a ratio of 2.05 new shares for every 100 shares, and
— 18.17 euro cents per share distribution for the six months ended 30 June 2015 as a cash distribution, or a return of capital through an issue of new shares, credited as fully paid up, at a ratio of 1.92 new shares for every 100 shares
Shares were issued from the share premium account.
²Book build 12 October 2015
In order to seize potential acquisition and development opportunities the Company increased its cash reserves by issuing 14,818,814 ordinary shares through accelerated book build processes that generated over €130 million in 2015.
The equity raise was completed as part of a vendor consideration placing and where required under the Company’s general authority to issue shares for cash approved by NEPI shareholders at the annual general meeting of the Company held on Monday, 18 May 2015.
The issued share capital figure excludes shares issued under the Initial Share Scheme (set out in Note 18) but includes the shares sold by the participants in share purchase schemes to other investors and those issued under the Current Share Scheme.
Ordinary shares carry the right to vote at general meetings, to distribution and to the surplus assets of the Group on winding-up.
Ordinary shares carry pre-emption and transfer rights as indicated in the Company’s Admission Document published at the time of admission to the AIM.
18 SHARE-BASED PAYMENTS
The Company issued shares to employees under two share purchase schemes.
The first share purchase scheme was in place before the internalisation of NEPI’s Investment Advisor (the Initial Share Scheme). The second share purchase scheme was approved by shareholders on 3 May 2011, and amended on 26 April 2012, and is the scheme in terms of which all new share purchase scheme issues are implemented (the Current Share Scheme; collectively, the Initial Share Scheme and Current Share Scheme are defined as share purchase schemes).
Share purchase schemes align the interests of executive directors and key individuals with those of the shareholders. The Company achieves this by granting loans to participants in the share purchase schemes to buy shares, the repayment of which can be made in part out of the distribution payable in relation to the shares. Of the shares initially subscribed for, 20% vest annually.
The Company offers each participant the immediate right to subscribe for the permitted number of shares at their then market value, less a maximum discount of 5%, together with a loan to fund the purchase. Each loan carries interest at the weighted average rate that the Company is able to borrow money from its bankers. Loans are repayable in full, together with interest, ten years after its subscription date, but can be repaid earlier.
The Company has security interests that ensure the repayment of the principal and interest on the Company’s loan to participants. Regarding shares issued under the Initial Share Scheme, the Company’s recourse against participants is limited to the shares issued through this scheme.
Pending repayment of the loan, the distributions on such shares are used to repay loan interest. If the share

Notes to the financial statements » continued
108 NEW EUROPE PROPERTY INVESTMENTS PLC – ANNUAL REPORT 2015
distribution exceeds interest payment then the excess is paid to the participant, if this is not the case then the shortfall must be paid by the participant to the Company. In the Current Share Scheme, any excess distribution after interest payment is used to repay the loan.
The maximum number of shares that can be issued under the share purchase schemes is 15,000,000. As at 31 December 2015, 25,000 shares remained issued under the Initial Share Scheme (31 December 2014: 3,612,052) and loans in amount of €64.5 thousand (31 December 2014: €9,132 thousand) remained outstanding under the Initial Share Scheme.
During 2015, no shares were issued under the Current Share Scheme (2014: 2,070,000 shares) and loans in amount of €16,090 thousand remained outstanding under the Current Share Scheme (2014: €27,953 thousand). Refer to Note 11.
Accounting treatmentThe Initial Share Scheme is accounted for as a share option scheme. Therefore, the fair value of share-based payment, determined at grant date, is expensed over the vesting period (2015: €670 thousand, 2014: €675 thousand) with a corre-sponding increase in the share-based payment reserve. The interest charged by the Company on the Initial Share Scheme loans is not recognised in the Statement of comprehensive income, but added for the calculation of distributable earnings purposes only (2015: €89 thousand; 2014: €542 thousand).
Prior to 2014, the Current Share Scheme was accounted for by recognising the value of the shares issued as an asset, classified as ‘loan to participants in the Current Share Scheme’ (Note 11) and respectively as equity, classified as ‘share-based payment reserve’. At each vesting date, the vested value of the Current Share Scheme shares was reclassified from ‘share-based payment reserve’ to ‘share capital’. The accrued interest is recognised as finance income in the Statement of comprehensive income.
During 2014, the Company changed its accounting policy with respect to the equity classification of the Current Share Scheme, as described in Note 3.17. As a result, amounts related to shares issued under this scheme and not vested were reclassified from the share based payment reserve to share capital and share premium. The impact of this reclassification is presented in the Statement of Changes in Equity (for 2014).
19 BONDS AND BANK BORROWINGS
In October 2015, Standard & Poor's Rating Services (S&P) assigned NEPI a first-time BBB- preliminary, long-term corporate credit rating. Moody's Investors Service (Moody's) has upgraded the Company's rating to Baa3, replacing NEPI's 2014 assigned Ba1 rating. Both ratings have a stable outlook.
Following this, NEPI successfully issued €400,000 thousand unsecured bonds. The Group repaid the €143,800 thousand unsecured, syndicated term loan (contracted earlier in 2015 as a bridge to the bond financing) and €67,989 thousand of secured debt.
As at year-end, the Group had an undrawn unsecured revolving credit facility in amount of €80,000 thousand.
The remaining bank loans are detailed below. The repayment profile for outstanding loans, excluding future interest, is detailed below. In addition to these loans, the Group has loans and borrowings related to its joint-ventures.
The debt’s average interest rate, including hedging costs, was approximately 3.9% during 2015, down from 5% in 2014, due to contracting new debt at lower rates and decreasing the interest margin on the existing debt. As at 31 December 2015, the Group was fully hedged against interest rate movements, with 46% of the base interest rate (EURIBOR) being hedged with interest rate caps and 54% with interest rate swaps.
Number of sharesGroup
31 Dec 2015Group
31 Dec 2014
Maximum number of share purchase schemes shares which can be offered for subscription 15,000,000 15,000,000
Share purchase schemes shares outstanding at the end of the period 3,340,829 9,631,204
Share purchase schemes shares available but unissued 1,095,210 1,095,210
NEW EUROPE PROPERTY INVESTMENTS PLC – ANNUAL REPORT 2015 109
Floreasca Business Park – Raiffeisen Bank International loanThe Group contracted a loan facility from Raiffeisen Bank International for Floreasca Business Park, which matures during October 2018 and is repayable in quarterly instalments.
Security— General security over the property (fair value as at 31 December 2015 of €102,980 thousand), current assets, cash
inflows from operating activities, accounts and receivables of Floreasca Business Park, and— Corporate Guarantee issued by the Company for a maximum amount of €7,000 thousand.
Covenants— Loan to value ratio of maximum 65%;— Debt service cover ratio of minimum 110% for 2014 and 120% thereafter, and— Yield on debt on minimum 10% per annum (based on EBITDA - Earnings Before Interest, Taxes,
Depreciation and Amortisation).
Interest bearing borrowings Group, 31 Dec 2015 Type
Payable in less than 1 year
Payable in 1–5 years
Payable over 5 years Total
NE Property Cooperatief Fixed coupon bonds – – 400,000 400,000
Aupark Kosice Mall and Tower Term loan 5,526 74,617 – 80,143
Floreasca Business Park Term loan 3,920 43,867 – 47,787
Aupark Zilina Term loan 3,557 43,858 – 47,415Accrued interest on loans and deferred loan costs 421 446 – 867
Accrued interest on bonds 1,274 – – 1,274
Deferred bond costs – – (6,260) (6,260)
Discount on bonds issue – – (1,600) (1,600)
TOTAL 14,698 162,788 392,140 569,626
Interest bearing borrowings Group, 31 Dec 2014 Type
Payable inless than 1 year
Payable in 1–5 years
Payable over 5 years Total
Floreasca Business Park Term loan 3,920 47,787 – 51,707
Aupark Zilina Term loan 1,954 47,416 – 49,370
The Lakeview Term loan 2,110 25,603 – 27,713
City Business Centre Term loan 1,314 5,786 17,354 24,454
Shopping City Galati Term loan 1,355 17,518 - 18,873
Pitesti Retail Park Term loan 11,131 – – 11,131
Regional value centres Term loan 623 10,390 – 11,013
Accrued interest 1,092 – – 1,092
Deferred loan costs (240) (783) – (1,023)
TOTAL 23,259 153,717 17,354 194,330

Notes to the financial statements » continued
110 NEW EUROPE PROPERTY INVESTMENTS PLC – ANNUAL REPORT 2015
Aupark Zilina – VUB Banka loanAt the acquisition of Aupark Zilina in 2013, the Group took over two investment loans from Vseobecna Uverova Banka (VUB). In December 2015 the Group extended the loan period with 1 year (the new maturity date is 30 September 2017).
Security— General security over the land and building (fair value as at 31 December 2015 of €102,300 thousand), current
assets, cash inflows from operating activities, accounts and receivables of Aupark Zilina.
Covenants— Loan to value ratio of maximum 60%;— Loan to cost ratio of maximum 80%, and— Debt service cover ratio of minimum 120%.
Aupark Kosice - Tatra banka, a.s. and Ceskoslovenska obchodna banka, a.s.In December 2014, the Group acquired Aupark Kosice Shopping Centre and Aupark Office Tower Kosice, and in December 2015 successfully refinanced the loan facilities from Tatra banka and Ceskoslovenska banka in a total amount of €105,000 thousand. The loans mature on 30 September 2020 and are payable in quarterly instalments.
Security
— General security over the land and buildings (total fair value as at 31 December 2015 of €161,100 thousand), current assets, cash inflows from operating activities, accounts and receivables of Aupark Kosice Shopping Centre and Aupark Office Tower Kosice
Covenants
— Debt service cover ratio of minimum 120%, and
— Loan to value of maximum 70% for 2016, and 65% thereafter.
NE Property Cooperatief (fixed coupon bonds)In 2015, following S&P's credit rating and Moody's upgrade on the rating assigned in 2014, the Group successfully issued 400,000 thousand of unsecured, 5.25 year Eurobonds. The bonds mature on 26 February 2021 and carry a 3.750% fixed coupon, with an issue price of 99.597%.
Covenants
— Solvency Ratio of maximum 0.60,
— Consolidated Coverage Ratio of minimum 2:1, and
— As at any Measurement Date, Unsecured Consolidated Total Assets shall equal 180 percent or more of the aggregate outstanding principal amount of Unsecured Consolidated Total Indebtedness.
NE Property Cooperatief - Raiffeisen Bank International revolving facilityIn 2014, following Moody's initial credit rating, Raiffeisen Bank International underwrote an €80,000 thousand, unsecured revolving credit facility, which was undrawn at year end.
Covenants
— Solvency Ratio of maximum 0.40,
— Consolidated Coverage Ratio of minimum 2:1, and
— As at any Measurement Date, Unsecured Consolidated Total Assets shall equal 300 percent or more of the aggregate outstanding principal amount of Unsecured Consolidated Total Indebtedness.

NEW EUROPE PROPERTY INVESTMENTS PLC – ANNUAL REPORT 2015 111
20 FINANCIAL ASSETS AND LIABILITIES AT FAIR VALUE THROUGH PROFIT OR LOSS
The fair value of the Group’s financial instruments resulting from derivative instruments are summarised below.
21 TRADE AND OTHER PAYABLES
22 OTHER LONG-TERM LIABILITIES
These interest rate caps and fixed interest rate swaps are not designated as cash flow hedges, and are classified as Level Two of the fair value hierarchy as defined by IFRS 7.
Group31 Dec 2015
Group31 Dec 2014
Financial assets— Company 2,236 74
— Subsidiaries 46 101
TOTAL FINANCIAL ASSETS 2,282 175
Financial liabilities— Company 2,149 3,496
— Subsidiaries – 90
TOTAL FINANCIAL LIABILITIES 2,149 3,586
Group31 Dec 2015
Group31 Dec 2014
Company31 Dec 2015
Company31 Dec 2014
Deferred consideration on business combinations 21,286 14,400 – –
Advances from tenants 14,930 7,271 – –
Payable for assets under construction 12,473 7,297 – –
Property-related payables 11,911 4,807 – –
Administrative and secretarial accrued expenses 1,869 2,495 572 333
Tenant deposits 358 2,095 – –
TOTAL 62,827 38,365 572 333
Group31 Dec 2015
Group31 Dec 2014
Tenant deposits 10,919 5,039
Other long-term liabilities 2,450 2,450
Provisions 1,619 1,682
TOTAL 14,988 9,171
Notes to the financial statements » continued
112 NEW EUROPE PROPERTY INVESTMENTS PLC – ANNUAL REPORT 2015
23 CORPORATE TAX CHARGE AND DEFERRED TAX
Deferred tax liability results from the following types of differences:
Group subsidiaries are subject to corporate tax on an annual basis. The Group carries forward aggregate fiscal losses of €211,246 thousand (31 December 2014: €114,318 thousand), out of which €198,122 thousand are available for up to seven years to offset against any future taxable profits of the companies in which the losses arose, and €13,124 thousand are available for up to three years to offset against any future taxable profits of the companies in which the losses arose. Deferred tax assets are recognised for unused tax losses to the extent that it is probable that taxable profit will be available against which the losses can be utilised. Significant management judgement is required to determine recognisable deferred tax assets, based on the timing of fiscal loss expiry and the level of future taxable profits and future tax planning strategies. Deferred tax assets have not been recognised for fiscal losses of €4,032 thousand (31 December 2014: €15,835 thousand) as there is uncertainty whether the companies that recorded such fiscal losses will generate taxable profit in the future.
The deferred tax balance, as at 31 December 2015 is the net effect of deferred tax assets resulted from fiscal losses and deferred tax liabilities resulted from differences between the fiscal base and the accounting base of assets and liabilities, especially investment property. Deferred tax liabilities are not expected to be settled within the following five years from the reporting date.
The Group does not withhold taxes on distribution paid.
Group31 Dec 2015
Group31 Dec 2014
Current tax expense – –
Deferred tax expense 13,979 637
TAX EXPENSE 13,979 637
Deferred tax brought forward 57,517 50,678
Deferred tax acquired in business combinations (Note 32) 18,156 5,254
Other adjustments – 948
DEFERRED TAX LIABILITY CARRIED FORWARD 89,652 57,517
Group31 Dec 2015
Group31 Dec 2014
Fiscal losses 207,214 83,141
Deferred tax asset 33,700 13,517
Temporary differences between accounting and fiscal value of investment property (730,446) (409,946)
Deferred tax liability (123,352) (71,034)
NET DEFERRED TAX LIABILITY (89,652) (57,517)
Reconciliation of tax rateGroup
31 Dec 2015Group
31 Dec 2014Company
31 Dec 2015Company
31 Dec 2014
Profit before tax 179,804 94,912 70,007 35,045
Isle of Man income tax at 0% – – – –
Effect of higher rates on overseas earnings – – – –
Total current year tax excluding deferred tax – – – –
EFFECTIVE TAX RATE 0.00% 0.00% 0.00% 0.00%

NEW EUROPE PROPERTY INVESTMENTS PLC – ANNUAL REPORT 2015 113
24 NET ASSET VALUE PER SHARE
25 NET RENTAL AND RELATED INCOME
Where the Group is the lessor, the future minimum lease payments receivable under non-cancellable operating leases are detailed below.
Reconciliation of net asset value to adjusted net asset valueGroup
31 Dec 2015Group
31 Dec 2014
Adjusted net asset value 1,566,199 1,288,689
— Net asset value per the Statement of financial position 1,496,550 1,241,289
— Loans in respect of the Initial Share Scheme (Note 18) 64 9,132
— Deferred tax liabilities 89,652 57,517
— Goodwill (23,986) (17,639)
— Deferred tax liabilities for joint-ventures 3,919 (1,610)
Net asset value per share (euro) 5.01 4.52
Adjusted net asset value per share (euro) 5.25 4.63
Number of shares for net asset value per share purposes (Note 30) 298,565,564 274,526,188
Number of shares for adjusted net asset value per share purposes (Note 30) 298,590,564 278,138,240
Group31 Dec 2015
Group31 Dec 2014
Rent 106,388 63,100
Service charge recoveries 23,208 13,834
Other recoveries 19,203 10,083
Contractual rental income and expense recoveries 148,799 87,017
Property management, tax, insurance and utilities (26,900) (15,032)
Property maintenance cost (16,920) (9,905)
Provisions and allowances for doubtful debts (912) (331)
Property operating expenses (44,732) (25,268)
TOTAL 104,067 61,749
Group31 Dec 2015
Group31 Dec 2014
No later than 1 year 122,852 79,474
Later than 1 year and not later than 5 years 333,988 219,569
Later than 5 years 248,614 137,582
TOTAL 705,454 436,625
Notes to the financial statements » continued
114 NEW EUROPE PROPERTY INVESTMENTS PLC – ANNUAL REPORT 2015
26 ADMINISTRATIVE EXPENSES
27 ACQUISITION FEESThe Group incurred acquisition fees in respect of the following:
28 FAIR VALUE ADJUSTMENTS OF INVESTMENT PROPERTY
* The adjustment in 2014 refers only to Promenada Mall. The adjustment in 2015 also refers to Promenada Mall, acquired in October 2014 (€2,493 thousand), and the following properties acquired in 2015: Aupark Kosice (€6,000 thousand); Iris Titan Shopping Center (€3,971 thousand). (Note 32)
Goodwill recognised at acquisition date, arising mostly due to deferred tax liabilities (Note 12), was adjusted against the increase in value for investment property, determined as the difference between the fair value as per the valuations at 31 December 2014, at 30 June 2015 and as well as at 31 December 2015, and the acquisition price.
Group31 Dec 2015
Group31 Dec 2014
Company31 Dec 2015
Company31 Dec 2014
Staff costs* (2,138) (239) – –
Directors’ remuneration (Note 36) (1,237) (800) (1,151) (670)
Audit and advisory services (1,930) (1,155) (76) (419)
Travel and accommodation (540) (196) (174) –
Companies administration (504) (102) – –
Stock exchange expenses (289) (270) (289) (270)
Support and maintenance services (57) (77) (42) (217)
TOTAL (6,695) (2,839) (1,732) (1,576)
* Staff costs capitalised as investment property under development in 2015 amount to €1,577 thousand (2014: €788 thousand). The increase in staff costs in 2015 compared to 2014 is due to the increase in number of employees following the Group's growth in operations. Also, in 2015 there were no issues of shares as part of the Group's share purchase scheme, and the Board approved cash bonuses for staff.
Group31 Dec 2015
Group31 Dec 2014
Company31 Dec 2015
Company31 Dec 2014
Fees for finalised acquisitions (742) (1,649) (8) (49)
Fees for ongoing acquisitions (180) (383) – –
Fees for terminated acquisitions (11) (325) – –
TOTAL (933) (2,357) (8) (49)
Group31 Dec 2015
Group31 Dec 2014
Fair value adjustments of investment property – gross increase from revaluations (Notes 9, 10 and 16) 102,824 29,421
Adjustment for goodwill recognised at acquisition date* (12,464) (1,441)
Estimated liability for Further payments in respect of City Business Centre (6,520) –
Estimated liabilities for further works (2,098) –
TOTAL 81,742 27,980
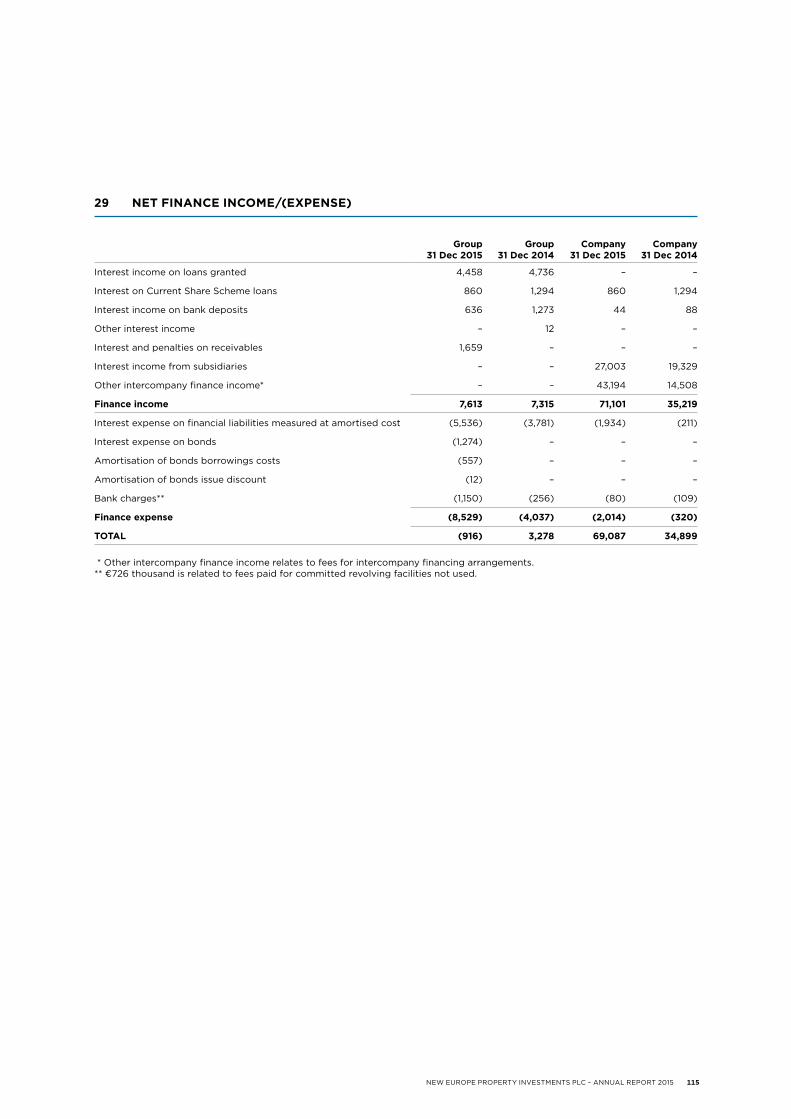
NEW EUROPE PROPERTY INVESTMENTS PLC – ANNUAL REPORT 2015 115
29 NET FINANCE INCOME/(EXPENSE)
Group31 Dec 2015
Group31 Dec 2014
Company31 Dec 2015
Company31 Dec 2014
Interest income on loans granted 4,458 4,736 – –
Interest on Current Share Scheme loans 860 1,294 860 1,294
Interest income on bank deposits 636 1,273 44 88
Other interest income – 12 – –
Interest and penalties on receivables 1,659 – – –
Interest income from subsidiaries – – 27,003 19,329
Other intercompany finance income* – – 43,194 14,508
Finance income 7,613 7,315 71,101 35,219
Interest expense on financial liabilities measured at amortised cost (5,536) (3,781) (1,934) (211)
Interest expense on bonds (1,274) – – –
Amortisation of bonds borrowings costs (557) – – –
Amortisation of bonds issue discount (12) – – –
Bank charges** (1,150) (256) (80) (109)
Finance expense (8,529) (4,037) (2,014) (320)
TOTAL (916) 3,278 69,087 34,899
* Other intercompany finance income relates to fees for intercompany financing arrangements.** €726 thousand is related to fees paid for committed revolving facilities not used.
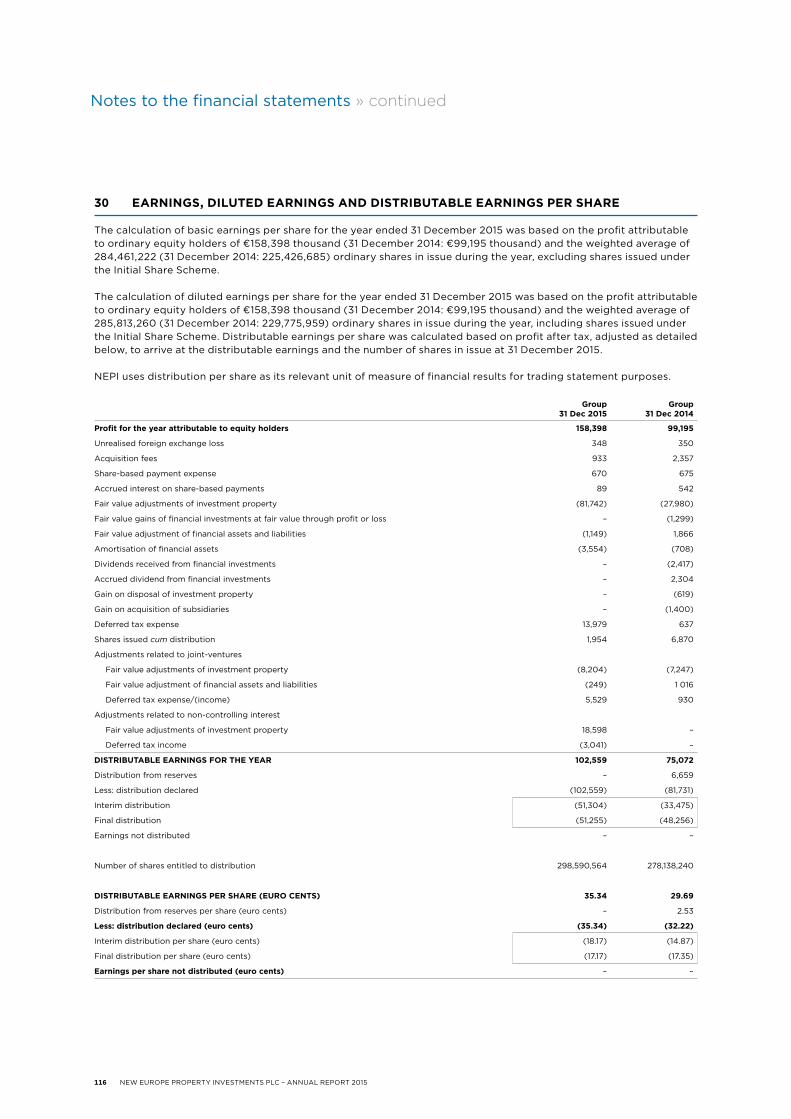
Notes to the financial statements » continued
116 NEW EUROPE PROPERTY INVESTMENTS PLC – ANNUAL REPORT 2015
30 EARNINGS, DILUTED EARNINGS AND DISTRIBUTABLE EARNINGS PER SHARE
The calculation of basic earnings per share for the year ended 31 December 2015 was based on the profit attributable to ordinary equity holders of €158,398 thousand (31 December 2014: €99,195 thousand) and the weighted average of 284,461,222 (31 December 2014: 225,426,685) ordinary shares in issue during the year, excluding shares issued under the Initial Share Scheme.
The calculation of diluted earnings per share for the year ended 31 December 2015 was based on the profit attributable to ordinary equity holders of €158,398 thousand (31 December 2014: €99,195 thousand) and the weighted average of 285,813,260 (31 December 2014: 229,775,959) ordinary shares in issue during the year, including shares issued under the Initial Share Scheme. Distributable earnings per share was calculated based on profit after tax, adjusted as detailed below, to arrive at the distributable earnings and the number of shares in issue at 31 December 2015.
NEPI uses distribution per share as its relevant unit of measure of financial results for trading statement purposes.
Group31 Dec 2015
Group31 Dec 2014
Profit for the year attributable to equity holders 158,398 99,195
Unrealised foreign exchange loss 348 350
Acquisition fees 933 2,357
Share-based payment expense 670 675
Accrued interest on share-based payments 89 542
Fair value adjustments of investment property (81,742) (27,980)
Fair value gains of financial investments at fair value through profit or loss – (1,299)
Fair value adjustment of financial assets and liabilities (1,149) 1,866
Amortisation of financial assets (3,554) (708)
Dividends received from financial investments – (2,417)
Accrued dividend from financial investments – 2,304
Gain on disposal of investment property – (619)
Gain on acquisition of subsidiaries – (1,400)
Deferred tax expense 13,979 637
Shares issued cum distribution 1,954 6,870
Adjustments related to joint-ventures
Fair value adjustments of investment property (8,204) (7,247)
Fair value adjustment of financial assets and liabilities (249) 1 016
Deferred tax expense/(income) 5,529 930
Adjustments related to non-controlling interest
Fair value adjustments of investment property 18,598 –
Deferred tax income (3,041) –
DISTRIBUTABLE EARNINGS FOR THE YEAR 102,559 75,072
Distribution from reserves – 6,659
Less: distribution declared (102,559) (81,731)
Interim distribution (51,304) (33,475)
Final distribution (51,255) (48,256)
Earnings not distributed – –
Number of shares entitled to distribution 298,590,564 278,138,240
DISTRIBUTABLE EARNINGS PER SHARE (EURO CENTS) 35.34 29.69
Distribution from reserves per share (euro cents) – 2.53
Less: distribution declared (euro cents) (35.34) (32.22)
Interim distribution per share (euro cents) (18.17) (14.87)
Final distribution per share (euro cents) (17.17) (17.35)
Earnings per share not distributed (euro cents) – –

NEW EUROPE PROPERTY INVESTMENTS PLC – ANNUAL REPORT 2015 117
Weighted average number of shares (excluding the Initial Share Scheme shares) for basic earnings per share purposes
Weighted average number of shares (including the Initial Share Scheme shares) for diluted earnings per share purposes
2015 Event Number of shares % of period Weighted average
01/01/15 Period opening 274,526,188 21 57,318,655
18/03/15 Sales of scheme 1 shares 274,964,515 3 9,064,764
30/03/15 Return of capital 279,250,260 4 10,740,395
13/04/15 Sales of scheme 1 shares 280,213,403 4 12,317,073
29/04/15 Sales of scheme 1 shares 280,307,170 8 21,562,090
27/05/15 Sales of scheme 1 shares 280,534,117 4 12,331,170
12/06/15 Sales of scheme 1 shares 282,367,737 30 83,779,438
28/09/15 Return of capital 283,719,502 4 10,912,289
12/10/15 Book build 298,534,316 12 35,266,416
24/11/15 Sales of scheme 1 shares 298,565,564 10 31,168,933
31/12/2015 Year-end 284,461,222
2014 Event Number of shares % of period Weighted average
01/01/2014 Period opening 199,836,882 29 56,547,250
14/04/2014 Return of capital 204,493,561 1 1,685,386
17/04/2014 Private placement 218,342,304 19 41,389,063
25/06/2014 Issue of shares under the Current Share Scheme 220,412,304 13 28,459,830
11/08/2014 Book build 235,454,189 6 14,877,600
03/09/2014 Sale of shares issued under the Initial Share Scheme 236,549,491 9 21,445,421
06/10/2014 Return of capital 241,537,958 6 15,262,014
29/10/2014 Book build 255,178,735 9 23,134,336
01/12/2014 Book build 274,526,188 8 22,625,785
31/12/2014 Year-end 225,426,685
2015 Event Number of shares % of period Weighted average
01/01/15 Period opening 278,138,240 24 67,242,212
30/03/15 Return of capital 282,423,985 50 141,211,993
28/09/15 Return of capital 283,775,750 4 10,914,452
12/10/15 Book build 298,590,564 22 66,444,604
31/12/2015 Year-end 298,590,564 285,813,260
2014 Event Number of shares % of period Weighted average
01/01/2014 Period opening 204,544,236 29 57,879,276
14/04/2014 Return of capital 209,200,915 1 1,724,183
17/04/2014 Private placement 223,049,658 19 42,281,391
25/06/2014 Issue of shares under the Current Share Scheme 225,119,658 13 29,067,648
11/08/2014 Book build 240,161,543 15 36,947,930
06/10/2014 Return of capital 245,150,010 6 15,490,248
29/10/2014 Book build 258,790,787 9 23,461,802
01/12/2014 Book build 278,138,240 8 22,923,481
31/12/2014 Year-end 229,775,959

Notes to the financial statements » continued
118 NEW EUROPE PROPERTY INVESTMENTS PLC – ANNUAL REPORT 2015
31 HEADLINE EARNINGS AND DILUTED HEADLINE EARNINGS PER SHARE
The calculation of headline earnings per share for the year ended 31 December 2015 was based on headline earnings of €84,097 thousand (31 December 2014: €68,061 thousand) and the weighted average of 284,461,222 ordinary shares in issue during 2015 (2014: 225,426,685), excluding those issued under the Initial Share Scheme.
32 BUSINESS COMBINATIONS
During the reported period, the Group made several acquisitions in Romania and Slovakia for a total consideration of €196,456 thousand, and resulting in €18,811 thousand goodwill due to deferred tax liability, as at the acquisition date. Part of the goodwill resulted was subsequently written-off against the increase in the acquired properties’ fair value as at 31 December 2015 (Note 12).
In 2014, a gain from acquisition of subsidiaries of €1,400 thousand was realised in relation to the 2010 acquisition of Floreasca Business Park. This gain was due to a contractual amount retained from the purchase price, for the purpose of securing certain obligations undertaken by the sellers. The contractual obligations were not fulfilled within the agreed contractual term and consequently the amount was not released.
Aupark Kosice (18 December 2014)In February 2015 the Group finalised the acquisition of Aupark Kosice from HB Reavis Group BV.
Aupark Kosice includes a 34,000m2 GLA regional mall (Aupark Kosice Mall), and an adjoining 12,800m2 GLA office building (Aupark Kosice Tower). The Group also purchased a 4.1ha development site (Malinovsky Barracks). The transaction had the effective date 18 December 2014, however it was finalised in February 2015 and therefore has been recognised in the 2015 financial statements. The amount paid in 2014, of €82,073 thousand, was recognised in the Group’s financial statements as an advance for investment property.
The fair value of the company’s identifiable assets and liabilities at the acquisition date are detailed below.
Investment property 165,000
- Investment property at fair value 154,200
- Investment property under development 10,800
Current assets 9,599
Current liabilities (8,677)
Non-current liabilities (82,875)
Deferred tax liabilities (11,189)
Total identifiable net assets at fair value 71,858
Goodwill arising on acquisition 11,189
Total consideration payable 83,047
Amounts retained from sellers (1,500)
Total consideration paid in cash 81,547
Reconciliation of profit for the year to headline earningsGroup
31 Dec 2015Group
31 Dec 2014Profit for the year attributable to equity holders 158,398 99,195
Fair value adjustments of investment property (81,742) (27,980)
Gain on sale of investment property – (619)
Gain on acquisition of subsidiaries – (1,400)
Total tax effects of adjustments 14,333 4,952
Fair value adjustment of investment property for joint-ventures (8,204) (7,247)
Total tax effects of adjustments for joint-ventures 1,312 1,160
HEADLINE EARNINGS 84,097 68,061Weighted average number of shares in issue 284,461,222 225,426,685
Diluted weighted average number of shares in issue 285,813,260 229,775,959
Headline earnings per share (euro cents) 29.56 30.19
Diluted headline earnings per share (euro cents) 29.42 29.62

NEW EUROPE PROPERTY INVESTMENTS PLC – ANNUAL REPORT 2015 119
From the effective acquisition date, Aupark Kosice has contributed €11,915 thousand to profit after tax and €13,907 thousand to the Group’s recoveries and contractual rental income. Goodwill arose from the deferred tax liability, and €6,000 thousand was subsequently written-off against the increase in the property fair value as at 31 December 2015 (Note 12).
Iris Titan Shopping Center (1 July 2015)In August 2015 the Group acquired Iris Titan Shopping Center from Aberdeen Asset Management Deutschland AG and Degi Beteiligungs GmbH, a 44,700m2 GLA mall in Bucharest, Romania, that opened in 2008.
The effective acquisition date was 1 July 2015, and the company’s fair value of identifiable assets and liabilities at the acquisition date are detailed below.
From the effective date of acquisition, Iris Titan Shopping Center has contributed €3,505 thousand to profit after tax and €3,576 thousand to the Group’s recoveries and contractual rental income. Goodwill arose from the deferred tax liability, and €3,790 thousand was subsequently written-off against the increase in the property fair value as at 31 December 2015 (Note 12).
City Business Centre (30 November 2015)In December 2015 the Group completed the acquisition of City Business Centre, by adding the newest two buildings in the complex to its portfolio. The entity acquired is Modatim Business Facilities from MTInv Holding BV and Mr Ovidiu Sandor. The company owns buildings D and E of the City Business Centre office buildings complex, a 47,100m2 GLA property located in the centre of Timisoara, Romania. Building D was open for business in September 2012 and building E in July 2015.
The effective acquisition date was 30 November 2015, and the company’s fair value of identifiable assets and liabilities at the acquisition date are detailed below.
From the effective date of acquisition, Modatim Business Facility has contributed €162 thousand to profit after tax and €220 thousand to the Group’s recoveries and contractual rental income. Goodwill arose mostly from the deferred tax liability of €2,063 thousand. (Note 12).
Investment property 86,000
Current assets 5,164
Current liabilities (960)
Non-current liabilities (1,154)
Deferred tax liabilities (4,905)
Total identifiable net assets at fair value 84,145
Goodwill arising on acquisition 4,905
Total consideration payable 89,050
Amounts retained from sellers -
Total consideration paid in cash 89,050
Investment property 28,533
Current assets 1,038
Current liabilities (256)
Non-current liabilities (5,610)
Deferred tax liabilities (2,063)
Total identifiable net assets at fair value 21,642
Goodwill arising on acquisition 2,717
Total consideration payable 24,359
Amounts retained from sellers (5,000)
Total consideration paid in cash 19,359

Notes to the financial statements » continued
120 NEW EUROPE PROPERTY INVESTMENTS PLC – ANNUAL REPORT 2015
33 JOINT-VENTURES
The summarised financial statements of the joint-ventures are presented below at 100%.
Contingent consideration
The Group has agreed to two subsequent price adjustments in respect of this business combination, which are computed based on the variation in occupancy and are payable in cash to the sellers.
A further €6,520 thousand was estimated as the fair value of the properties related to current vacancies, which are expected to be filled in the near future. This amount was estimated by independent valuers and included in the year-end appraisal reports for City Business Centre, and also recorded as a payable in these financial statements.
STATEMENT OF FINANCIAL POSITION
31 Dec 2015 Ploiesti Shopping City
The Office Total
Non-current assets 84,035 79,193 163,228
Current assets 3,468 4,018 7,486
TOTAL ASSETS 87,503 83,211 170,714
Non-current liabilities 78,257 51,997 130,254
Current liabilities 3,899 5,281 9,180
Total liabilities 82,156 57,278 139,434Equity attributable to equity holders 5,347 25,933 31,280
TOTAL EQUITY AND LIABILITIES 87,503 83,211 170,714
31 Dec 2014Ploiesti
Shopping CityThe
Office TotalNon-current assets 81,244 49,186 130,430
Current assets 6,356 2,566 8,922
TOTAL ASSETS 87,600 51,752 139,352
Non-current liabilities 69,424 24,442 93,866
Current liabilities 3,578 15,426 19,004
Total liabilities 73,002 39,868 112,870Equity attributable to equity holders 14,598 11,884 26,482
TOTAL EQUITY AND LIABILITIES 87,600 51,752 139,352
STATEMENT OF COMPREHENSIVE INCOME 31 Dec 2015 Ploiesti
Shopping CityThe
Office Total
Contractual rental income and expense recoveries 9,057 3,367 12,424
Property operating expenses (2,948) (807) (3,755)
Administrative expenses (232) 190 (42)
Fair value adjustment investment property 1,901 14,507 16,408
Foreign exchange gain/(loss) (20) 10 (10)
Profit before net finance expense 7,758 17,267 25,025
Net finance expense (6,523) (3,146) (9,669)
Finance income 16 8 24
Finance expense (6,539) (3,154) (9,693)
Changes in fair value of financial instruments 568 (68) 500
Profit before income tax 1,803 14,053 15,856
Defered tax (7,780) (3,278) (11,058)
PROFIT/(LOSS) FOR THE YEAR ATTRIBUTABLE TO EQUITY HOLDERS (5,977) 10,775 4,798
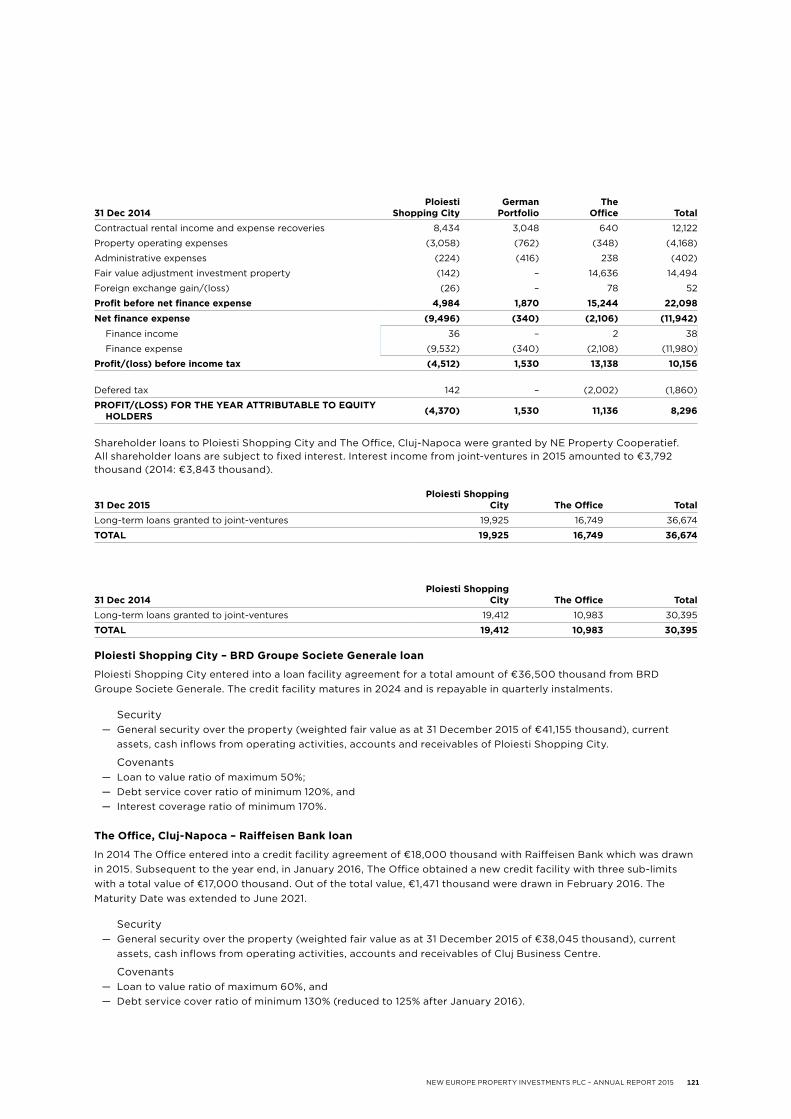
NEW EUROPE PROPERTY INVESTMENTS PLC – ANNUAL REPORT 2015 121
31 Dec 2014Ploiesti
Shopping CityGerman
PortfolioThe
Office TotalContractual rental income and expense recoveries 8,434 3,048 640 12,122
Property operating expenses (3,058) (762) (348) (4,168)
Administrative expenses (224) (416) 238 (402)
Fair value adjustment investment property (142) – 14,636 14,494
Foreign exchange gain/(loss) (26) – 78 52
Profit before net finance expense 4,984 1,870 15,244 22,098Net finance expense (9,496) (340) (2,106) (11,942)
Finance income 36 – 2 38
Finance expense (9,532) (340) (2,108) (11,980)
Profit/(loss) before income tax (4,512) 1,530 13,138 10,156
Defered tax 142 – (2,002) (1,860)
PROFIT/(LOSS) FOR THE YEAR ATTRIBUTABLE TO EQUITY HOLDERS (4,370) 1,530 11,136 8,296
Shareholder loans to Ploiesti Shopping City and The Office, Cluj-Napoca were granted by NE Property Cooperatief. All shareholder loans are subject to fixed interest. Interest income from joint-ventures in 2015 amounted to €3,792 thousand (2014: €3,843 thousand).
31 Dec 2015Ploiesti Shopping
City The Office TotalLong-term loans granted to joint-ventures 19,925 16,749 36,674
TOTAL 19,925 16,749 36,674
31 Dec 2014Ploiesti Shopping
City The Office TotalLong-term loans granted to joint-ventures 19,412 10,983 30,395
TOTAL 19,412 10,983 30,395
Ploiesti Shopping City – BRD Groupe Societe Generale loan
Ploiesti Shopping City entered into a loan facility agreement for a total amount of €36,500 thousand from BRD Groupe Societe Generale. The credit facility matures in 2024 and is repayable in quarterly instalments.
Security— General security over the property (weighted fair value as at 31 December 2015 of €41,155 thousand), current
assets, cash inflows from operating activities, accounts and receivables of Ploiesti Shopping City.
Covenants— Loan to value ratio of maximum 50%;— Debt service cover ratio of minimum 120%, and— Interest coverage ratio of minimum 170%.
The Office, Cluj-Napoca – Raiffeisen Bank loan
In 2014 The Office entered into a credit facility agreement of €18,000 thousand with Raiffeisen Bank which was drawn in 2015. Subsequent to the year end, in January 2016, The Office obtained a new credit facility with three sub-limits with a total value of €17,000 thousand. Out of the total value, €1,471 thousand were drawn in February 2016. The Maturity Date was extended to June 2021.
Security— General security over the property (weighted fair value as at 31 December 2015 of €38,045 thousand), current
assets, cash inflows from operating activities, accounts and receivables of Cluj Business Centre.
Covenants— Loan to value ratio of maximum 60%, and— Debt service cover ratio of minimum 130% (reduced to 125% after January 2016).

Notes to the financial statements » continued
122 NEW EUROPE PROPERTY INVESTMENTS PLC – ANNUAL REPORT 2015
34 SEGMENT REPORTING
Reporting segments are retail, office and industrial, and the Group primarily manages operations in accordance with this classification.
Administrative costs, profit/loss on disposal of investment property, finance revenue, finance costs and income tax are not reported on a segment basis. There are no sales between segments. Segment results, assets and liabilities include items directly attributable to a segment, as well as those that can be allocated on a reasonable basis. Unallocated items include mainly investments (other than investment property) and related revenue, corporate assets (primarily Company headquarters), head office expenses and income tax assets and liabilities.
Segment capital expenditure is the total cost incurred during the period to acquire property, plant and equipment and intangible assets. Segment assets represent investment property. Segment liabilities represent loans and borrowings, as these are the only liabilities reported on a segmental basis. The Group’s format for segment reporting is based on business segments.
Disposal of German Portfolio
In December 2014, the Group sold its interest in the German properties acquired in 2008 to its co-investor for €18.2 million on a debt-free basis, which represents a premium of €619 thousand to the book value. This is consistent with Group strategy to invest in higher-growth eastern European markets.
Segment results 31 Dec 2015 Retail Office Industrial Corporate Total
Contractual rental income and expense recoveries 120,046 26,728 2,025 – 148,799
Property operating expenses (38,080) (6,437) (215) – (44,732)
Administrative expenses (3,582) (1,162) (141) (1,810) (6,695)
Acquisition fees (873) (57) (3) – (933)
Fair value adjustments of investment property 85,433 (3,323) (368) – 81,742
Share-based payment expense – – – (670) (670)
Foreign exchange gain/(loss) (443) 107 (3) – (339)
Profit before net financing cost 162,501 15,856 1,295 (2,480) 177,172
Net finance income/(expense) 3,465 (2,209) (88) (2,084) (916)
— Finance income 1,661 1,568 – 4,384 7,613
— Finance expense 1,804 (3,777) (88) (6,468) (8,529)
Changes in fair value of financial instruments (26) 62 – 1,113 1,149
Share of profit of joint-ventures (4,625) 7,024 – – 2,399
Profit before tax 161,315 20,733 1,207 (3,451) 179,804
Deferred tax expense (14,373) 189 205 – (13,979)
Profit after tax 146,942 20,922 1,412 (3,451) 165,825
Non-controlling interest (7,427) – – – (7,427)
PROFIT FOR THE YEAR ATTRIBUTABLE TO EQUITY HOLDERS 139,515 20,922 1,412 (3,451) 158,398
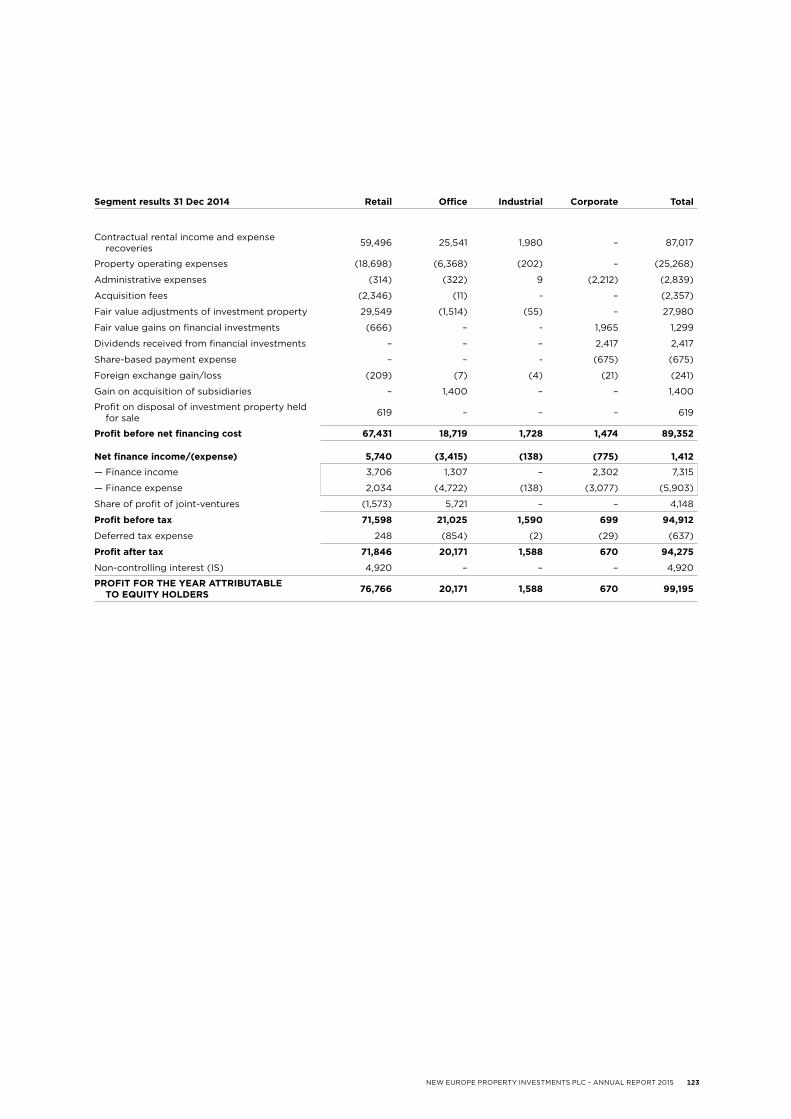
NEW EUROPE PROPERTY INVESTMENTS PLC – ANNUAL REPORT 2015 123
Segment results 31 Dec 2014 Retail Office Industrial Corporate Total
Contractual rental income and expense recoveries 59,496 25,541 1,980 – 87,017
Property operating expenses (18,698) (6,368) (202) – (25,268)
Administrative expenses (314) (322) 9 (2,212) (2,839)
Acquisition fees (2,346) (11) - – (2,357)
Fair value adjustments of investment property 29,549 (1,514) (55) – 27,980
Fair value gains on financial investments (666) – - 1,965 1,299
Dividends received from financial investments – – – 2,417 2,417
Share-based payment expense – – - (675) (675)
Foreign exchange gain/loss (209) (7) (4) (21) (241)
Gain on acquisition of subsidiaries – 1,400 – – 1,400
Profit on disposal of investment property held for sale 619 – – – 619
Profit before net financing cost 67,431 18,719 1,728 1,474 89,352
Net finance income/(expense) 5,740 (3,415) (138) (775) 1,412
— Finance income 3,706 1,307 – 2,302 7,315
— Finance expense 2,034 (4,722) (138) (3,077) (5,903)
Share of profit of joint-ventures (1,573) 5,721 – – 4,148
Profit before tax 71,598 21,025 1,590 699 94,912
Deferred tax expense 248 (854) (2) (29) (637)
Profit after tax 71,846 20,171 1,588 670 94,275
Non-controlling interest (IS) 4,920 – – – 4,920
PROFIT FOR THE YEAR ATTRIBUTABLE TO EQUITY HOLDERS 76,766 20,171 1,588 670 99,195

Notes to the financial statements » continued
124 NEW EUROPE PROPERTY INVESTMENTS PLC – ANNUAL REPORT 2015
Segment assets and liabilities 31 Dec 2015 Retail Office Industrial Corporate Total
SEGMENT ASSETS
Non-current assets 1,443,616 344,828 16,508 24,488 1,829,440
Investment property 1,409,757 306,495 16,508 – 1,732,760
— Investment property at fair value 1,277,151 282,360 16,508 – 1,576,019
— Investment property under development 132,606 24,135 – – 156,741
Goodwill 11,702 7,192 – 5,092 23,986
Investments in joint-ventures 2,673 12,967 – – 15,640
Loans granted to joint-ventures 19,926 16,748 – – 36,674
Other long-term assets (457) 1,395 – 17,160 18,098
Financial assets at fair value through profit or loss 15 31 – 2,236 2,282
Current assets 82,727 15,850 591 281,929 381,097
Trade and other receivables 48,415 4,507 108 1,457 54,487
Cash and cash equivalents 34,312 11,343 483 280,472 326,610
Investment property held for sale 5,917 19,338 – – 25,255
TOTAL ASSETS 1,532,260 380,016 17,099 306,417 2,235,792
SEGMENT LIABILITIES
Non-current liabilities 192,415 72,677 1,942 394,683 661,717
Bank borrowings 114,930 47,464 – 394 162,788
Bonds – – – 392,140 392,140
Deferred tax liabilities 67,826 21,559 267 – 89,652
Other long-term liabilities 9,659 3,654 1,675 – 14,988
Financial liabilities at fair value through profit or loss – – – 2,149 2,149
Current liabilities 49,460 26,361 430 1,274 77,525
Trade and other payables 40,664 21,733 430 – 62,827
Bank borrowings 8,796 4,628 – – 13,424
Interest accrued on bonds – – – 1,274 1,274
TOTAL LIABILITIES 241,875 99,038 2,372 395,957 739,242

NEW EUROPE PROPERTY INVESTMENTS PLC – ANNUAL REPORT 2015 125
Since August 2013 the Group has commenced operations in Slovakia through the acquisition of Aupark Zilina, and since September 2014 in Serbia through the acquisition of Kragujevac Plaza. The Group’s segmental results are detailed below.
Segment assets and liabilities 31 Dec 2014 Retail Office Industrial Corporate Total
SEGMENT ASSETS
Non-current assets 1,044,641 264,335 16,876 42,341 1,368,193
Investment property 1,011,680 240,743 16,876 – 1,269,299
— Investment property at fair value 736,434 225,670 16,876 – 978,980
— Investment property under development 193,173 15,073 – – 208,246
— Advances for investment property 82,073 – – – 82,073
Goodwill 6,617 5,929 – 5,093 17,639
Investments in joint-ventures 7,299 5,942 – – 13,241
Loans granted to joint-ventures 19,502 10,893 – – 30,395
Other long-term assets (497) 768 – 37,173 37,444
Financial assets at fair value through profit or loss 40 60 – 75 175
Current assets 103,304 6,775 332 38,294 148,705
Trade and other receivables 35,976 3,283 47 1,163 40,469
Cash and cash equivalents 67,328 3,492 285 37,131 108,236
Investment property held for sale 5,823 21,537 – – 27,360
TOTAL ASSETS 1,153,768 292,647 17,208 80,635 1,544,258
SEGMENT LIABILITIES
Non-current liabilities 122,231 113,654 1,941 3,519 241,345
Bank borrowings 75,109 95,962 – – 171,071
Deferred tax liabilities 42,238 14,989 266 24 57,517
Other long-term liabilities 4,884 2,612 1,675 – 9,171
Financial liabilities at fair value through profit or loss – 91 – 3,495 3,586
Current liabilities 45,762 15,457 441 (36) 61,624
Trade and other payables 30,504 7,782 441 (362) 38,365
Bank borrowings 15,258 7,675 – 326 23,259
TOTAL LIABILITIES 167,993 129,111 2,382 3,483 302,969
Geographical segments resultsRomania
2015Slovakia
2015Serbia
2015Romania
2014Slovakia
2014Serbia
2014Total 2015
Total 2014
Net operating income 80,482 20,342 3,243 53,227 7,280 1,242 104,067 61,749
Profit before tax 149,429 26,867 3,508 91,568 1,598 1,746 179,804 94,912
Investment property 1,417,875 274,885 40,000 1,130,299 99,500 39,500 1,732,760 1,269,299

Notes to the financial statements » continued
126 NEW EUROPE PROPERTY INVESTMENTS PLC – ANNUAL REPORT 2015
35 CONTINGENT ASSETS AND LIABILITIES
GuaranteesGroup policy is to provide financial guarantees to subsidiaries to the extent required in the normal course of business. The Company has issued corporate letters of guarantee for part of the credit facilities (see Note 19).
As at 31 December 2015, the Group had received letters of guarantee from tenants worth €27,180 thousand (31 December 2014: €10,601 thousand) and from suppliers worth €16,312 thousand (31 December 2014: €7,529 thousand) related to ongoing developments.
36 RELATED PARTY TRANSACTIONS
Identity of related parties with whom material transactions have occurredThe subsidiaries and Directors are related parties. The subsidiaries of the Company are detailed in Note 5. Directors are presented in the ‘Board of Directors’ section.
Material related party transactionsLoans to, and investments in, subsidiaries are set out in Note 5. Directors’ fees for the periods mentioned below were paid either during that respective period or during the following period. No other payments were made to Directors, except for reimbursements of travel and accommodation.
Directors’ feesTotal Group
31 Dec 15Company 31 Dec 15
Subsidiaries 31 Dec 15
Total Group 31 Dec 14
Company 31 Dec 14
Subsidiaries 31 Dec 14
Victor Semionov* 296 266 30 134 75 59
Alexandru Morar 233 219 14 125 116 9
Tiberiu Smaranda 199 178 21 125 78 47
Mirela Covasa*** 173 155 18 – – –
Martin Slabbert* 166 163 3 267 252 15
Jeffrey Zidel 33 33 – 33 33 –
Desmond de Beer 32 32 – 32 32 –
Dan Pascariu 30 30 – 30 30 –
Dewald Joubert** 28 28 – 28 28 –
Michael Mills 26 26 – 26 26 –
Nevenka Pergar*** 21 21 – – – –
TOTAL 1,237 1,151 86 800 670 130* Martin Slabbert, chief executive officer, and Victor Semionov, chief operating officer, have resigned on 7 August 2015The following compensation packages have been approved by the Board of Directors in August 2015: - Martin Slabbert, as indirect beneficiary: vesting of 347,500 shares which have been allocated as part of the share purchase scheme during 2011-2013, and sale by the Company of 308,652 NEPI shares, previously issued, at their initial issue price of €5.74/share; - Victor Semionov, as indirect beneficiary: vesting of 391,000 shares which have been allocated as part of the share purchase scheme during 2011-2014; - Victor Semionov, as direct beneficiary: a compensation of €190 thousand (included in the table). ** Dewald Joubert, independent non-executive director, has resigned from the board of directors of NEPI on 30 December 2015 *** Mirela Covasa was appointed as Finance Director and Nevenka Pergar was appointed as a non-executive director on 10 February 2015
All amounts above represent the total cost to company in respect of these transactions.

NEW EUROPE PROPERTY INVESTMENTS PLC – ANNUAL REPORT 2015 127
Name of Director Number of shares held as at 31 Dec 2015
Tiberiu Smaranda 455,000
Alex Morar 391,000
MIrela Covasa 271,629
TOTAL 1,117,629
Name of Director Number of shares held as at 31 Dec 2014
Martin Slabbert 2,266,012
Victor Semionov 1,405,985
Alex Morar 1,183,583
Tiberiu Smaranda 861,537
TOTAL 5,717,117
Shares held under the purchase schemes by the Directors or by entities in which they have an indirect beneficial interest
37 SUBSEQUENT EVENTS
Change in managementAs announced on 30 December 2015, Mr Dewald Joubert has resigned as Non-executive Director. The Board of Directors appointed Mr Robert Reinhardt Emslie as non-executive Director, effective from 4 February 2016. Mr Emslie is a Chartered Accountant, with significant experience in the financial services sector and property management, and currently holds chairmanship and non-executive directorship positions in various private and listed companies.
Financing agreementsIn January 2016, the Group concluded an agreement with BRD – Groupe Societe Generale SA for the financing of Timisoara City Business Centre One amounting to €20,000 thousand. The loan was not drawn up to publishing date of the financial statements.
The Directors are not aware of any other subsequent events from 31 December 2015 and up to the date of signing these financial statements, not arising in the normal course of business, which are likely to have a material effect on the financial information contained in this report, other than as disclosed in the Directors’ report.
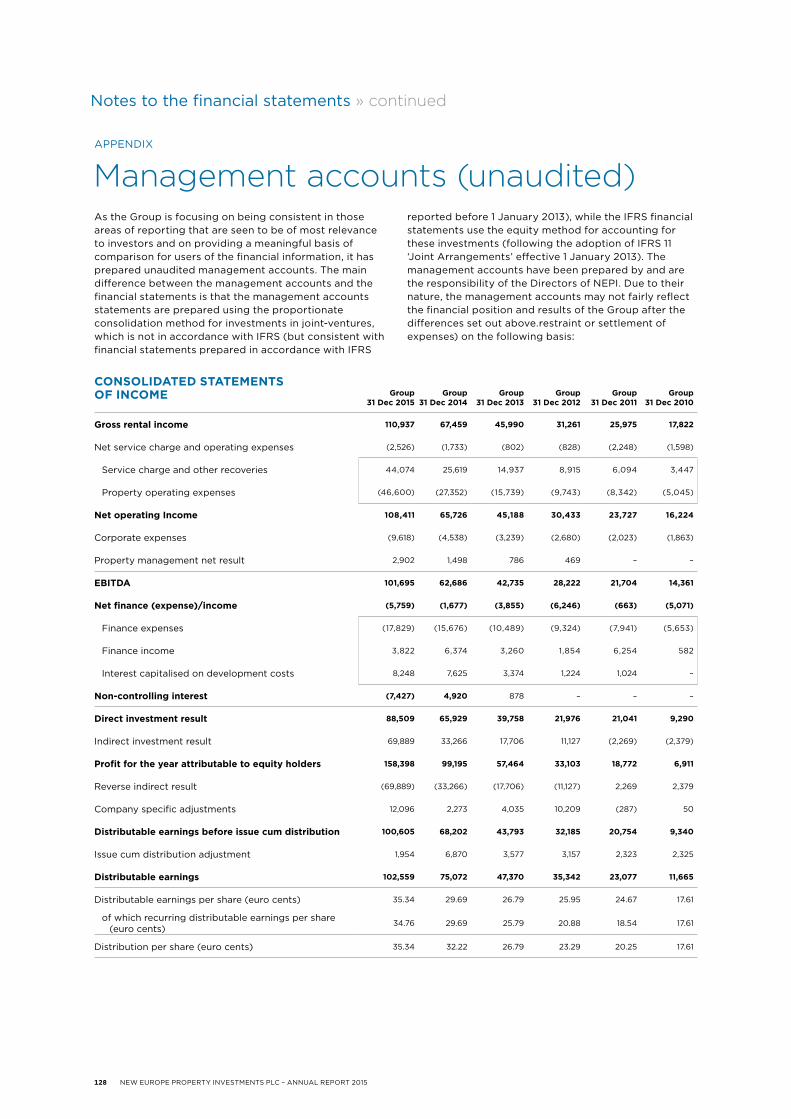
Notes to the financial statements » continued
128 NEW EUROPE PROPERTY INVESTMENTS PLC – ANNUAL REPORT 2015
Management accounts (unaudited)As the Group is focusing on being consistent in those areas of reporting that are seen to be of most relevance to investors and on providing a meaningful basis of comparison for users of the financial information, it has prepared unaudited management accounts. The main difference between the management accounts and the financial statements is that the management accounts statements are prepared using the proportionate consolidation method for investments in joint-ventures, which is not in accordance with IFRS (but consistent with financial statements prepared in accordance with IFRS
reported before 1 January 2013), while the IFRS financial statements use the equity method for accounting for these investments (following the adoption of IFRS 11 ‘Joint Arrangements’ effective 1 January 2013). The management accounts have been prepared by and are the responsibility of the Directors of NEPI. Due to their nature, the management accounts may not fairly reflect the financial position and results of the Group after the differences set out above.restraint or settlement of expenses) on the following basis:
APPENDIX
Group 31 Dec 2015
Group 31 Dec 2014
Group 31 Dec 2013
Group 31 Dec 2012
Group 31 Dec 2011
Group 31 Dec 2010
Gross rental income 110,937 67,459 45,990 31,261 25,975 17,822
Net service charge and operating expenses (2,526) (1,733) (802) (828) (2,248) (1,598)
Service charge and other recoveries 44,074 25,619 14,937 8,915 6,094 3,447
Property operating expenses (46,600) (27,352) (15,739) (9,743) (8,342) (5,045)
Net operating Income 108,411 65,726 45,188 30,433 23,727 16,224
Corporate expenses (9,618) (4,538) (3,239) (2,680) (2,023) (1,863)
Property management net result 2,902 1,498 786 469 – –
EBITDA 101,695 62,686 42,735 28,222 21,704 14,361
Net finance (expense)/income (5,759) (1,677) (3,855) (6,246) (663) (5,071)
Finance expenses (17,829) (15,676) (10,489) (9,324) (7,941) (5,653)
Finance income 3,822 6,374 3,260 1,854 6,254 582
Interest capitalised on development costs 8,248 7,625 3,374 1,224 1,024 –
Non-controlling interest (7,427) 4,920 878 – – –
Direct investment result 88,509 65,929 39,758 21,976 21,041 9,290
Indirect investment result 69,889 33,266 17,706 11,127 (2,269) (2,379)
Profit for the year attributable to equity holders 158,398 99,195 57,464 33,103 18,772 6,911
Reverse indirect result (69,889) (33,266) (17,706) (11,127) 2,269 2,379
Company specific adjustments 12,096 2,273 4,035 10,209 (287) 50
Distributable earnings before issue cum distribution 100,605 68,202 43,793 32,185 20,754 9,340
Issue cum distribution adjustment 1,954 6,870 3,577 3,157 2,323 2,325
Distributable earnings 102,559 75,072 47,370 35,342 23,077 11,665
Distributable earnings per share (euro cents) 35.34 29.69 26.79 25.95 24.67 17.61
of which recurring distributable earnings per share (euro cents)
34.76 29.69 25.79 20.88 18.54 17.61
Distribution per share (euro cents) 35.34 32.22 26.79 23.29 20.25 17.61
CONSOLIDATED STATEMENTS OF INCOME

NEW EUROPE PROPERTY INVESTMENTS PLC – ANNUAL REPORT 2015 129
Group 31 Dec 2015
Group 31 Dec 2014
Group 31 Dec 2013
Group 31 Dec 2012
Group 31 Dec 2011
Group 31 Dec 2010
ASSETS
Non-current assets 1,858,740 1,389,772 920,924 444,667 362,403 328,992
Investment property 1,814,357 1,334,512 872,465 416,674 341,802 313,755
Income producing properties at fair value 1,655,219 1,038,545 758,623 393,966 316,393 300,899
Developments at cost 159,138 213,894 113,842 22,708 25,409 12,856
Advances paid for investment property – 82,073 – – – –
Goodwill 23,986 17,639 16,218 13,189 13,351 13,850
Other long-term assets 18,115 37,446 29,831 14,728 6,213 –
Financial assets at fair value through profit or loss 2,282 175 2,410 76 1,037 1,387
Current assets 410,095 180,526 149,920 213,841 62,816 31,185
Investment property held for sale 25,255 27,360 1,561 28,665 – –
Trade and other receivables 55,229 41,199 31,443 15,799 7,751 7,338
Financial investments at fair value through profit or loss – – 61,079 81,865 – –
Cash and cash equivalents 329,611 111,967 55,837 87,512 55,065 23,847
TOTAL ASSETS 2,268,835 1,570,298 1,070,844 658,508 425,219 360,177
LIABILITIES 772,285 329,009 358,608 264,886 189,960 205,090
Loans and borrowings 201,095 218,399 266,136 219,148 164,866 178,412
Bonds 393,414 – – – – –
Deferred tax liabilities 93,571 55,907 50,160 22,321 15,086 15,586
Other long-term liabilities 15,443 9,446 4,059 – – –
Financial liabilities at fair value through profit and loss 3,417 5,104 4,699 7,730 2,380 1,223
Trade and other payables 65,345 40,153 33,554 15,687 7,628 9,869
EQUITY ATTRIBUTABLE TO EQUITY HOLDERS 1,496,550 1,241,289 712,236 393,622 235,259 155,087
TOTAL LIABILITIES AND EQUITY ATTRIBUTABLE TO EQUITY HOLDERS
2,268,835 1,570,298 1,070,844 658,508 425,219 360,177
Adjusted NAV per share (euro) 5.25 4.63 3.70 2.88 2.43 2.22
CONSOLIDATED STATEMENTS OF FINANCIAL POSITION

130 NEW EUROPE PROPERTY INVESTMENTS PLC – ANNUAL REPORT 2015
Notice of 2016 AGM
Notice is hereby given that the ninth Annual General Meeting of New Europe Property Investments plc (‘NEPI’ or ‘the Company’) will be held at its registered office being 2nd Floor, Anglo International House, Lord Street, Douglas, Isle of Man on 12 May 2016 at 08:30 AM British Summer Time (‘BST’), to address and, if deemed fit, to adopt of the resolutions set out below.
ORDINARY BUSINESS
To consider and, if deemed fit, to pass, with or without modification, the ordinary resolutions below.1 To receive and adopt the reports of the Directors and Auditor of the Company and the financial statements for
the year ended 31 December 2015.
2 To re-elect those Directors of the Company who will retire by rotation at the Company’s Annual General Meeting, in accordance with Article 86 of the Articles of Association of the Company, and being eligible, have offered themselves for re-election.
2.1 Alex Morar;
2.2 Dan Pascariu;
2.3 Jeff Zidel, and
2.4 Tiberiu Smaranda.
3 To re-elect those Directors of the Company who had been appointed by the Company’s Board of Directors since the last Annual General Meeting of the Company, who will retire at the Company’s Annual General Meeting, in accordance with article 81 of the Articles of Association of the Company, and being eligible, have offered themselves for re-election:
3.1 Robert Emslie.
4 To authorise the Directors of the Company to fix their remuneration in accordance with Article 95 of the Articles of Association of the Company.
In terms of the Company’s Articles of Association, in order for each of resolutions 1 to 4 above to be adopted, such resolutions must be approved by a member or members holding a majority in excess of 50% of the voting rights exercisable by shareholders, present in person or by proxy.
SPECIAL BUSINESS
To consider and, if deemed fit, to pass the following special resolutions:5 To appoint PricewaterhouseCoopers as Auditor of the Group and Company and to authorise the Company’s
Directors to fix their remuneration.
6 So as to maintain the maximum ‘headroom’ available to the Directors for expanding the Company’s business by allotting equity securities of the Company for cash on a non-pre-emptive basis, the shareholders are to consider and, if thought fit, pass the following resolution: Resolved as a special resolution that, subject to the restrictions set out below and subject to the provisions of Article 5.3 of the Company’s Articles of Association, the Listings Requirements of the JSE Ltd, the AIM Rules for Companies issued by the London Stock Exchange plc and the rules of the Bucharest Stock Exchange, the Directors of the Company be and are hereby authorised until this authority lapses at the next Annual General Meeting of the Company, provided that this authority shall not extend beyond 15 months, to allot and issue shares of the Company (including the grant or issue of options or convertible securities that are convertible into an existing class of shares) for cash (or for the extinction or payment of any liability, obligation or commitment, restraint or settlement of expenses) on the following basis:
NEW EUROPE PROPERTY INVESTMENTS PLC – ANNUAL REPORT 2015 131
6.1 the shares which are the subject of the issue for cash must be of a class already in issue or, where this is not the case, must be limited to such shares or rights as are convertible into a class already in issue;
6.2 the allotment and issue of shares for cash shall be made only to persons qualifying as ‘public shareholders’, as defined in the Listings Requirements of the JSE Ltd, and not to ‘related parties’;
6.3 the total aggregate number of shares which may be issued for cash in terms of this authority may not exceed 29,859,056 shares, being 10% of the Company’s issued shares as at the date of notice of this Annual General Meeting. Accordingly, any shares issued under this authority prior to this authority lapsing shall be deducted from the 29,859,056 shares the Company is authorised to issue in terms of this authority for the purpose of determining the remaining number of shares that may be issued in terms of this authority;
6.4 in the event of a sub-division or consolidation of shares prior to this authority lapsing, the existing authority shall be adjusted accordingly to represent the same allocation ratio;
6.5 the maximum discount at which shares may be issued is 10% of the weighted average traded price of such shares measured over the 30 business days prior to the date that the price of the issue is agreed between the Company and the party subscribing for the shares, and
6.6 after the Company has issued shares in terms of this general authority to issue shares for cash representing, on a cumulative basis within a financial year, 5% or more of the number of shares in issue prior to that issue, the Company shall publish an announcement containing full details of that issue, including:
6.6.1 the number of shares issued;
6.6.2 the average discount to the weighted average traded price of the shares over the 30 business days prior to the date that the issue is agreed in writing between the Company and the party/ies subscribing for the shares, and
6.6.3 the effects of the issue on the net asset value per share, net tangible asset value per share, earnings per share, headline earnings per share, and if applicable diluted earnings and diluted headline earnings per share.
In terms of the Listings Requirements of the JSE Ltd, in order for resolutions 5 and 6 above to be adopted, the support of at least 75% of the total number of votes exercisable by shareholders, present in person or by proxy, is required.
QUORUMA quorum for the purposes of considering the resolutions above shall consist of three shareholders of the Company personally present (and if the shareholder is a body corporate, the representative of the body corporate) or by proxy and entitled to attend and vote on the business to be transacted at the Annual General Meeting or one person entitled to attend and to vote on the business to be transacted, being a member able to exercise in aggregate at least 25% of all the voting rights that are able to be exercised on at least one matter to be decided at the meeting and being present in person or by proxy.
By order of the Board, CE Cassell COMPANY SECRETARY

132 NEW EUROPE PROPERTY INVESTMENTS PLC – ANNUAL REPORT 2015
Notes to Notice of Annual General Meeting, dated 12 May 2016
1 A member of the Company who is entitled to attend the Company’s Annual General Meeting and vote thereat is entitled to appoint one or more proxies to attend and, on a poll, vote instead of that member.
2 A proxy of a member need not be a member of the Company.
3 A form of proxy is included with this notice (on page 133) and instructions for its use are shown on the form.
4 A duly completed and signed form of proxy must be received by the Company’s registrar, Sabre Fiduciary Limited, at the Company’s registered office (which is detailed in this notice) no later than 48 (forty eight) hours before the time that the meeting is due to commence. Delivery by e-mail is acceptable, as detailed in the proxy form on page 133.
5 Completion and return of a form of proxy does not preclude a member of the Company from attending the Annual General Meeting and voting in person.
6 Pursuant to regulation 22 of the Uncertificated Securities Regulations 2006 (SD 743/06), the Company specifies that in order to have the right to attend and vote at the meeting (and also for the purpose of calculating how many votes a person entitled to attend and vote may cast), a person must be entered on the register of members of the Company by no later than 08:30 AM BST on 12 May 2016 (‘the Register Time and Date’), being not more than two working days before the time fixed for the meeting to commence. Changes to entries on the register after the Register Time and Date shall be disregarded in determining the rights of any person to attend and vote at the meeting.
7 The Company’s register of Directors’ interests in the share capital and debentures of the Company, together with copies of service agreements under which the Directors of the Company are employed, are available for inspection at the Company’s registered office during normal business hours from the date of this notice until the date of the Annual General Meeting and will also be available for inspection at the place of the Annual General Meeting for at least 15 minutes prior to and during the meeting.

NEW EUROPE PROPERTY INVESTMENTS PLC – ANNUAL REPORT 2015 133
Proxy Form
Please insert the full name and address of the member in CAPITAL LETTERS and return this form to the Company’s registered address at 2nd Floor, Anglo International House, Lord Street, Douglas, Isle of Man, IM1 4LN for attention of Cornelius Eduard Cassell, Company Secretary, or in electronic format to the e-mail address [email protected]
I/We ……………………………………………………………………………… of ………………………………………………………………………………
being a member/members of New Europe Property Investments plc hereby appoint the Chairman of the meeting, or failing him ……………………………………………………………………………… as my/our proxy to vote for me/us on my/our behalf at the Annual General Meeting of the Company to be held at 2nd Floor, Anglo International House, Lord Street, Douglas, Isle of Man on 12 May 2016 at 08:30 AM BST and at any adjournment thereof.
If you wish to appoint your own proxy delete the words ‘the Chairman of the meeting’ and insert the name of your proxy in the space provided in CAPITAL LETTERS. Please indicate with an X in the spaces provided below how you wish your votes to be cast. If you do not specify how you wish any vote to be cast you will be deemed to have authorised your proxy to vote or abstain from voting as he/she thinks fit.
ORDINARY BUSINESS
yes no
1 To receive and adopt the reports of the Directors and Auditor of the Company and the financial statements for the year ended 31 December 2015.
2 To re-elect those Directors of the Company who will retire by rotation in accordance with article 86 of the Articles of Association of the Company:
2.1 Alex Morar;
2.2 Dan Pascariu;
2.3 Jeff Zidel, and
2.4 Tiberiu Smaranda.
3 To re-elect those Directors of the Company who will retire at the Company’s Annual General Meeting, in accordance with article 81 of the Articles of Association of the Company, and being eligible, have offered themselves for re-election:
3.1 Robert Emslie.
4 To authorise the Directors of the Company to fix their remuneration
SPECIAL BUSINESS
yes no
5 To appoint PricewaterhouseCoopers as Auditor of the Group and to authorise the Company’s Directors to fix their remuneration.
6 General authority to issue shares for cash as proposed in the notice of the Annual General Meeting.
signature date

134 NEW EUROPE PROPERTY INVESTMENTS PLC – ANNUAL REPORT 2015
Schedule of propertiesAPPENDIX
Weighted by ownership
Property nameYear opened/
acquired Type Location GLA GLAValuation/
Cost to date Passing rent*Average rental
€/m2/month Occupancy
m² m² €m €mTOTAL PROPERTIES 1 127 400 998 500 1 839.6 140.0
INCOME PRODUCING PROPERTIES 875 200 755 550 1 655.3 125.7 13.9 97.1%RETAIL 684 900 585 600 1 318.4 99.6 14.2 97.5%
Mega Mall** 2015 Mall Romania 75 500 75 500 240.7 17.7 19.5 98.2%Promenada Mall 2013/2014 Mall Romania 40 400 40 400 160.1 10.1 20.8 98.0%Aupark Kosice Mall 2011/2014 Mall Slovakia 33 800 33 800 140.8 9.3 22.9 93.1%Iris Titan Shopping Center 2008/2015 Mall Romania 44 700 44 700 90.0 7.6 14.2 95.9% City Park 2008/2013 Mall Romania 30 300 30 300 93.8 7.6 20.9 97.1%Aupark Zilina 2010/2013 Mall Slovakia 25 100 25 100 102.3 7.2 23.9 98.9%Shopping City Deva 2007/2013 Mall Romania 52 300 52 300 66.0 5.9 9.4 98.7%Braila Mall 2008/2009 Mall Romania 54 800 54 800 73.4 5.5 8.4 97.6%Vulcan Value Centre 2014 Value centre Romania 24 600 24 600 48.9 3.7 12.5 99.0%Shopping City Galati 2013 Mall Romania 27 200 27 200 51.3 3.7 11.3 92.8%Pitesti Retail Park 2007/2010 Value centre Romania ^39 900 24 800 42.6 3.7 12.4 100%Kragujevac Plaza 2012/2014 Mall Serbia 21 900 21 900 40.0 3.4 12.9 94.1%Ploiesti Shopping City*** 2012 Mall Romania 46 400 23 200 41.2 3.2 11.5 97.0%Shopping City Targu Jiu 2014 Mall Romania 26 900 26 900 38.9 3.0 9.3 99.6%Shopping City Timisoara - Phase I (A) 2015 Mall Romania 16 300 16 300 23.3 2.0 10.2 100%Severin Shopping Center 2009/2013 Mall Romania 20 900 20 900 26.4 2.0 8.0 96.2%Aurora Shopping Mall 2008/2014 Mall Romania 18 000 18 000 8.1 1.5 6.9 100%Regional value centres 2007-2014 Value centre Romania ^85 900 24 900 30.6 2.5 8.4 100%
OFFICE 162 400 142 050 320.4 24.3 14.3 95.4%Floreasca Business Park 2009/2010 Office Romania 36 200 36 200 103.0 7.4 17.0 99.1%
City Business Centre 2007-2015/2012-2015 Office Romania 47 100 47 100 92.1 7.3 12.9 ^^97.7%
The Lakeview 2010/2013 Office Romania 25 600 25 600 67.0 5.1 16.6 95.3%The Office - Phase I & Phase II *** 2014-2015 Office Romania 40 700 20 350 38.0 2.7 11.1 80.5%Aupark Kosice Tower 2012/2014 Office Slovakia 12 800 12 800 20.3 1.8 11.7 100%
INDUSTRIAL 27 900 27 900 16.5 1.8 5.4 98.0%Rasnov Industrial Facility 2007 Industrial Romania 23 000 23 000 11.9 1.3 4.7 97.6%Otopeni Warehouse 2006/2010 Industrial Romania 4 900 4 900 4.6 0.5 8.5 100%
DEVELOPMENTS UNDER CONSTRUCTION 69 900 69 900 82.3 12.8Shopping City Timisoara - Phase I (B) Mall development Romania 40 500 40 500 41.3 5.6City Park extension - Phase II Mall extension Romania 19 500 19 500 16.8 4.1
Victoriei Office Office development Romania 8 400 8 400 24.1 2.9
Severin Shopping Center extension - Phase II Mall extension Romania 1 500 1 500 0.1 0.2
DEVELOPMENTS UNDER PERMITTING AND PRE-LEASING 144 500 135 250 76.7
Promenada Mall extension Mall/Office extension Romania ^^^64 000 64 000 30.1
Shopping City Piatra Neamt Mall development Romania 27 900 27 900 10.8Shopping City Satu Mare Mall development Romania 27 900 27 900 5.5The Office - Phase III*** Office extension Romania 18 500 9 250 1.5Braila Mall extension Mall extension Romania 2 400 2 400 0.3
Regional value centres extension Value centres extension Romania 3 800 3 800 -
Land held for extensions and developments 28.5
NON-CORE PROPERTIES 37 800 37 800 25.3 1.5 * Estimated rental value for developments.
** The Group holds 70% interest in Mega Mall. Mega Mall is accounted for at 100% in the IFRS financial statements and a corresponding 30%
non-controlling interest is included in Equity.
*** The Group holds 50% interest in Ploiesti Shopping City (in partnership with Carrefour Property) and The Office, Cluj-Napoca
(in partnership with Ovidiu Sandor, an experienced Romanian office developer).
^ The respective retail centres are part of larger retail schemes. The remaining balance of the GLA is owned by third parties.
^^ Vacancy excludes the rentable areas under the earn-out arrangements.
^^^ Promenada Mall’s extension’s GLA depends on permitting.

NEW EUROPE PROPERTY INVESTMENTS PLC – ANNUAL REPORT 2015 135
Weighted by ownership
Property nameYear opened/
acquired Type Location GLA GLAValuation/
Cost to date Passing rent*Average rental
€/m2/month Occupancy
m² m² €m €mTOTAL PROPERTIES 1 127 400 998 500 1 839.6 140.0
INCOME PRODUCING PROPERTIES 875 200 755 550 1 655.3 125.7 13.9 97.1%RETAIL 684 900 585 600 1 318.4 99.6 14.2 97.5%
Mega Mall** 2015 Mall Romania 75 500 75 500 240.7 17.7 19.5 98.2%Promenada Mall 2013/2014 Mall Romania 40 400 40 400 160.1 10.1 20.8 98.0%Aupark Kosice Mall 2011/2014 Mall Slovakia 33 800 33 800 140.8 9.3 22.9 93.1%Iris Titan Shopping Center 2008/2015 Mall Romania 44 700 44 700 90.0 7.6 14.2 95.9% City Park 2008/2013 Mall Romania 30 300 30 300 93.8 7.6 20.9 97.1%Aupark Zilina 2010/2013 Mall Slovakia 25 100 25 100 102.3 7.2 23.9 98.9%Shopping City Deva 2007/2013 Mall Romania 52 300 52 300 66.0 5.9 9.4 98.7%Braila Mall 2008/2009 Mall Romania 54 800 54 800 73.4 5.5 8.4 97.6%Vulcan Value Centre 2014 Value centre Romania 24 600 24 600 48.9 3.7 12.5 99.0%Shopping City Galati 2013 Mall Romania 27 200 27 200 51.3 3.7 11.3 92.8%Pitesti Retail Park 2007/2010 Value centre Romania ^39 900 24 800 42.6 3.7 12.4 100%Kragujevac Plaza 2012/2014 Mall Serbia 21 900 21 900 40.0 3.4 12.9 94.1%Ploiesti Shopping City*** 2012 Mall Romania 46 400 23 200 41.2 3.2 11.5 97.0%Shopping City Targu Jiu 2014 Mall Romania 26 900 26 900 38.9 3.0 9.3 99.6%Shopping City Timisoara - Phase I (A) 2015 Mall Romania 16 300 16 300 23.3 2.0 10.2 100%Severin Shopping Center 2009/2013 Mall Romania 20 900 20 900 26.4 2.0 8.0 96.2%Aurora Shopping Mall 2008/2014 Mall Romania 18 000 18 000 8.1 1.5 6.9 100%Regional value centres 2007-2014 Value centre Romania ^85 900 24 900 30.6 2.5 8.4 100%
OFFICE 162 400 142 050 320.4 24.3 14.3 95.4%Floreasca Business Park 2009/2010 Office Romania 36 200 36 200 103.0 7.4 17.0 99.1%
City Business Centre 2007-2015/2012-2015 Office Romania 47 100 47 100 92.1 7.3 12.9 ^^97.7%
The Lakeview 2010/2013 Office Romania 25 600 25 600 67.0 5.1 16.6 95.3%The Office - Phase I & Phase II *** 2014-2015 Office Romania 40 700 20 350 38.0 2.7 11.1 80.5%Aupark Kosice Tower 2012/2014 Office Slovakia 12 800 12 800 20.3 1.8 11.7 100%
INDUSTRIAL 27 900 27 900 16.5 1.8 5.4 98.0%Rasnov Industrial Facility 2007 Industrial Romania 23 000 23 000 11.9 1.3 4.7 97.6%Otopeni Warehouse 2006/2010 Industrial Romania 4 900 4 900 4.6 0.5 8.5 100%
DEVELOPMENTS UNDER CONSTRUCTION 69 900 69 900 82.3 12.8Shopping City Timisoara - Phase I (B) Mall development Romania 40 500 40 500 41.3 5.6City Park extension - Phase II Mall extension Romania 19 500 19 500 16.8 4.1
Victoriei Office Office development Romania 8 400 8 400 24.1 2.9
Severin Shopping Center extension - Phase II Mall extension Romania 1 500 1 500 0.1 0.2
DEVELOPMENTS UNDER PERMITTING AND PRE-LEASING 144 500 135 250 76.7
Promenada Mall extension Mall/Office extension Romania ^^^64 000 64 000 30.1
Shopping City Piatra Neamt Mall development Romania 27 900 27 900 10.8Shopping City Satu Mare Mall development Romania 27 900 27 900 5.5The Office - Phase III*** Office extension Romania 18 500 9 250 1.5Braila Mall extension Mall extension Romania 2 400 2 400 0.3
Regional value centres extension Value centres extension Romania 3 800 3 800 -
Land held for extensions and developments 28.5
NON-CORE PROPERTIES 37 800 37 800 25.3 1.5 * Estimated rental value for developments.
** The Group holds 70% interest in Mega Mall. Mega Mall is accounted for at 100% in the IFRS financial statements and a corresponding 30%
non-controlling interest is included in Equity.
*** The Group holds 50% interest in Ploiesti Shopping City (in partnership with Carrefour Property) and The Office, Cluj-Napoca
(in partnership with Ovidiu Sandor, an experienced Romanian office developer).
^ The respective retail centres are part of larger retail schemes. The remaining balance of the GLA is owned by third parties.
^^ Vacancy excludes the rentable areas under the earn-out arrangements.
^^^ Promenada Mall’s extension’s GLA depends on permitting.

136 NEW EUROPE PROPERTY INVESTMENTS PLC – ANNUAL REPORT 2015
Company New Europe Property Investments plcRegistration number 001211VJSE share code: NEP, AIM share code: NEPI, BVB share code: NEP2nd Floor, Anglo International House Lord Street, Douglas, Isle of Man, IM1 4LN
Company Administrator and Registrar Sabre Fiduciary Ltd2nd Floor, Anglo International HouseLord Street, Douglas, Isle of Man, IM1 4LNPhone +44 (0) 2031 801 547Fax +44 1624 629 282
Auditors PricewaterhouseCoopers LLC60 Circular Road, Douglas, IM1 1SA, Isle of Man
Reporting Accountants PricewaterhouseCoopers Inc2 Eglin Road, Sunninghill 2157, Private Bag X36, South Africa
Nominated Adviser and Broker Smith & Williamson Corporate Finance Ltd25 Moorgate, London EC2R 6AY, UK
JSE Sponsor Java Capital6A Sandown Valley Crescent, Sandton, 2196, JHB
Romanian Adviser Intercapital Invest33 Aviatorilor Blvd, Bucharest, Romania
www.nepinvest.com

NEW EUROPE PROPERTY INVESTMENTS PLC – ANNUAL REPORT 2015 137