Annual Report 2015 - Camposol€¦ · Annual Report 2015. 2 1 ... by increasing the conversion of...
79
Annual Report 2015
Transcript of Annual Report 2015 - Camposol€¦ · Annual Report 2015. 2 1 ... by increasing the conversion of...

Annual Report
2015

12
Annual Report 2015 CAMPOSOL
Annual Report
2015

2
Content1. Letter from the CEO ........................................................ 4
2. Overview .............................................................................. 62.1 Vision2.2 Mission 2.3 Corporate Values 2.4 Business Principles 2.5 Our People2.6 Board of Directors 2.7 Management Team 2.8 Organizational Chart2.9 Legal Structure 2.10 Brief History
3. Products & Categories ..................................................... 20
4. Board Of Directors Report ............................................. 304.1 Main Activities 4.2 Market Situation 4.3 Company Strategy 4.4 Summary of the Year4.5 Operations 4.6 Working Environment4.7 Code of Ethics & Conduct4.8 Social Responsibility 4.9 Research, Development and Innovation 4.10 Supply Chain 4.11 Financial Results 4.12 Allocation of Net Income 4.13 Internal Audit and Internal Control4.14 Financial Calendar4.15 Future Prospects 4.16 External Auditors 4.17 Corporate Governance
5. Key Investment Considerations ................................... 46
6. Independent Auditor’s Report And
Audited Financial Statements ....................................... 48

54
Annual Report 2015 CAMPOSOL
Twenty-fifteen was a challenging year for CAMPOSOL, as well as for the Peruvian agricultural exporting sector in general, due to lower volumes as a result of the “El Niño” phenomena.
However, we have been able to keep our leadership in the Peruvian agro-industrial sector and face these situations with fast answers and a clear view of the company strengths, which we address with fresh and healthy products that, we believe, have the best perspectives in the future.
In this sense, in 2015, CAMPOSOL’s total sales amounted to USD 272.9 million (vs. USD 253.5 million in 2014) and EBITDA amounted to USD 42.4 million (vs. USD 34.0 million in 2014). In 2015, profit amounted to USD 12.5 million compared to the loss of USD 34.4 million during the same period last year.
The main reasons for the increased revenues for all 2015 were higher volumes of blueberries and shrimp, and in the prices of avocados to 1.97 per net KG (1.81 in 2014), mangos to 1.68 per net KG (1.48 in 2014) and blueberries to 10.84 per net KG (10.46 in 2014). This represents up 8.8%, 13.5% and 4%, respectively.
Selling expenses decreased from USD 37.6 million in 2014 to USD 30.3 million in 2015 due to changes in financial conditions of sale (change of FOB to CFR / CIF terms) applied to higher volumes sold. This decrease was primarily as a result of a USD 3.5 million decrease in 2015 selling expenses from freight and customs duties, a USD1.3 million decrease in 2015 selling expenses from representation expenses, USD 2.1 million no provision for amortization of intangible management portfolio, which occurred in 2014.
Total inventories decreased from USD 95.2 million at December 31st, 2014, to USD 47.1 million by the end of the fourth quarter of 2015. The variation of USD 48.1 million is explained mainly by the decrease of finished product such as artichokes, asparagus, and peppers. Also, trade accounts receivable decreased from USD 46.0 million at the end of 2014 to USD 40.7 million at the end of 2015, explained by higher collections to clients.
As a result, the total working capital (accounts receivable + inventories - accounts payable) decreased to USD 53.4
million at the end of 2015 from USD 92.9 million at the end of 2014. Current working capital as of December 31st, 2015 is 19.8% of sales (34.7%). Such significant reduction is the result of the company´s effort to improve working capital needs.
In the future, the Company expects to continue its diversification strategy by increasing the blueberries production in the Fruits & Vegetables (F&V) segment and by increasing the conversion of shrimp ponds in the Seafood segment. The Company also expects to continue to reinforce the Trading segment through more direct sales to retailers, adding value to its clients through commercial, marketing and service initiatives, which should result in higher margins.
In line with this strategy, the Company has invested significantly in specializing the company in the F&V segment, diversifying its portfolio of products and customers, as well as increasing its presence in key markets with favorable and encouraging results. In line with this vision, the Company has decided to continue empowering its fresh and frozen business segments, and exit the preserved business. The Company considers these strategic changes in CAMPOSOL’S businesses will allow for greater specialization, efficiency and focus on product categories in which the Company has made significant investments in recent years, and thus maximize opportunities for growth and consolidation of its business.
Likewise, 2016 will require us also to focus on consolidating CAMPOSOL’S structure, processes, and policies, as well as reinforcing aspects regarding good corporate governance, internal control, forecasts, and project development, among others.
Based on CAMPOSOL’s solid fundamentals and market perspectives we believe that we will be able to position as a worldwide and leading healthy food company shortly.
Yours sincerely,
Manuel Salazar Diez CansecoCEOCamposol Holding Ltd.
01 Letter from the CEO
IN THE FUTURE, THE COMPANY ExPECTS TO CONTINUE ITS DIVERSIFICATION STRATEGY BY INCREASING THE BLUEBERRIES PRODUCTION IN THE FRUITS & VEGETABLES (F&V) SEGMENT AND BY INCREASING THE CONVERSION OF SHRIMP PONDS IN THE SEAFOOD SEGMENT.
DEAR ShAREhOLDERS, PARtnERS AnD COLLAbORAtORS

76
Annual Report 2015 CAMPOSOL
CAMPOSOL is the leading agro industrial company in Peru, the largest avocado grower and soon the largest blueberry producer in the world. It is involved in the harvest, processing, and marketing of high-quality agriculture and marine products, such as avocados, blueberries, grapes, mangos, tangerines, shrimp, scallops, among other, which are exported to Europe, the United States of America and Asia.
CAMPOSOL is a vertically integrated company located in Peru, it is the third largest private employer in the country, with more than 15 thousand workers in high production seasons, and is committed to supporting sustainable development through social responsibility policies and projects aimed to increase the shared value for all of its stakeholders.
CAMPOSOL was the first Peruvian agro-industrial company to be a member of the United Nations Global Compact, the first to present annual Sustainability Reports (aligned to GRI indicators) and has achieved the following international certifications: BSCI, Global Gap, IFS, HACCP and BRC among others.
2.1 ViSiOn
Our vision is to become one of the main five leaders to provide healthy food to families worldwide.
2.2 MiSSiOn
Our mission is to provide the world healthy day-to-day food with guaranteed quality, seeking the welfare of people and the environment through innovation, research, and care in all details of its processes.
2.3 VALuES
CAMPOSOL has established the following corporate values:
integrity: We are honest. We honor our commitments and are responsible for the consequences of our actions, always contemplating the triple bottom line: economic, social and environmental.
02Overview
CAMPOSOL IS THE LEADING AGRO INDUSTRIAL COMPANY IN PERU, THE LARGEST AVOCADO GROWER AND SOON THE LARGEST BLUEBERRY PRODUCER IN THE WORLD.

98
Annual Report 2015 CAMPOSOL
Respect: We appreciate and esteem people. We foster good relations within an environment where ideas and feedback are highly appreciated.
teamwork: We share our objectives and strategies, and we strive to be communicative and transparent, creating an open and flexible atmosphere where team objectives take precedence over personal goals.
Excellence: We all work to attain the highest standards of performance, innovation, and quality in all stages of our processes, activities and products. We pay close attention to details and endeavor to comply with the international market demands and expectations.
Austerity: We work towards achieving efficiency along the whole chain of value while maintaining strict discipline on our cost management and implementing policies that impede questionable spending.
2.4 buSinESS PRinCiPLES
CAMPOSOL acts according to four primary principles that guide its activity and interaction with society.
human Resources Management: CAMPOSOL recognizes its commitment with its collaborators to establish the best working conditions that allow their well-being as well as their professional and personal development, in a pleasant environment. Further, CAMPOSOL provides permanent training opportunities and seeks to identify and acknowledge its most outstanding workers.
Ethics: CAMPOSOL is convinced that each one of its members must apply ethical principles to all of its relations with clients, suppliers, shareholders, employees and the society in general, as they guarantee CAMPOSOL’s reputation in the markets.
Honesty, dignity, respect, loyalty, proper behavior, efficiency, and transparency are the highest values that guide CAMPOSOL’s relationship with its stakeholders.
Social Development and Community Relations:CAMPOSOL is committed to balancing its impact caused by its operations, as well as improving the positive impact that creates value for the community in general. Thus, we work under social responsibility guidelines in our areas of influence.
CAMPOSOL promotes ethical relations based on trust to our community in general, its inhabitants, local, regional and national government, as well as the support organizations and other involved actors, to establish a permanent dialog and mutual respect with our neighbors.
Quality, Environment, Safety and health: CAMPOSOL’s products directly affect its clients’ health, which demands CAMPOSOL to be aligned to the primary international standards that guarantee that its products are free of risks for human consumption. Thus, the concept of innocuousness is of inestimable value in all of CAMPOSOL’s industry and chain of value.
All of CAMPOSOL’s products are manufactured with processes that comply with legal norms and stringent regulations related to its activities that include local laws and destination countries’ regulations, world-recognized international standards, requirements, protocols, standards and specifications from clients and the internal norms and procedures established in CAMPOSOL’s integrated management system.
2.5 OuR PEOPLE
The development of a competitive agro-exporting industry is essential for Peru because of, amongst other reasons, its great contribution to the generation of formal employment opportunities in the country. During the last ten years, Peru has been able to create more than 800,000 jobs in modern agriculture. Such development provides income and promotes economic clusters in areas where there are no other major employment options. CAMPOSOL is highly committed to its people and their development, even more, when the Company is on its way to becoming the largest employer in the country in the next few years. A characteristic of our industry is the seasonal
employment due to the diversification of our production that depends on factors such as weather patterns, each product´s harvest periods and contingencies that arise throughout its cycles.
In 2015, CAMPOSOL´s family was comprised of over 15,000 collaborators during high production seasons. The largest number of our workers come from adjacent areas to our orchards in the district of Chao, province of Virú, region of La Libertad, followed by our operations in the Piura region; both of which present high unemployment and low education rates.
CAMPOSOL also generates an impact on the indirect employment of the areas in which it operates because it also hires third-party companies for transportation, food service, lab and health services, amongst others, most of which are rendered by companies established by members of its communities. Please refer to the Section “Working Environment” in this report, for more detailed information on these matters.
IN 2015, CAMPOSOL´S FAMILY WAS COMPRISED OF OVER 15,000 COLLABORATORS DURING HIGH PRODUCTION
SEASON. THE LARGEST NUMBER OF OUR WORKERS COME FROM ADjACENT AREAS TO OUR ORCHARDS.
1110
Annual Report 2015 CAMPOSOL
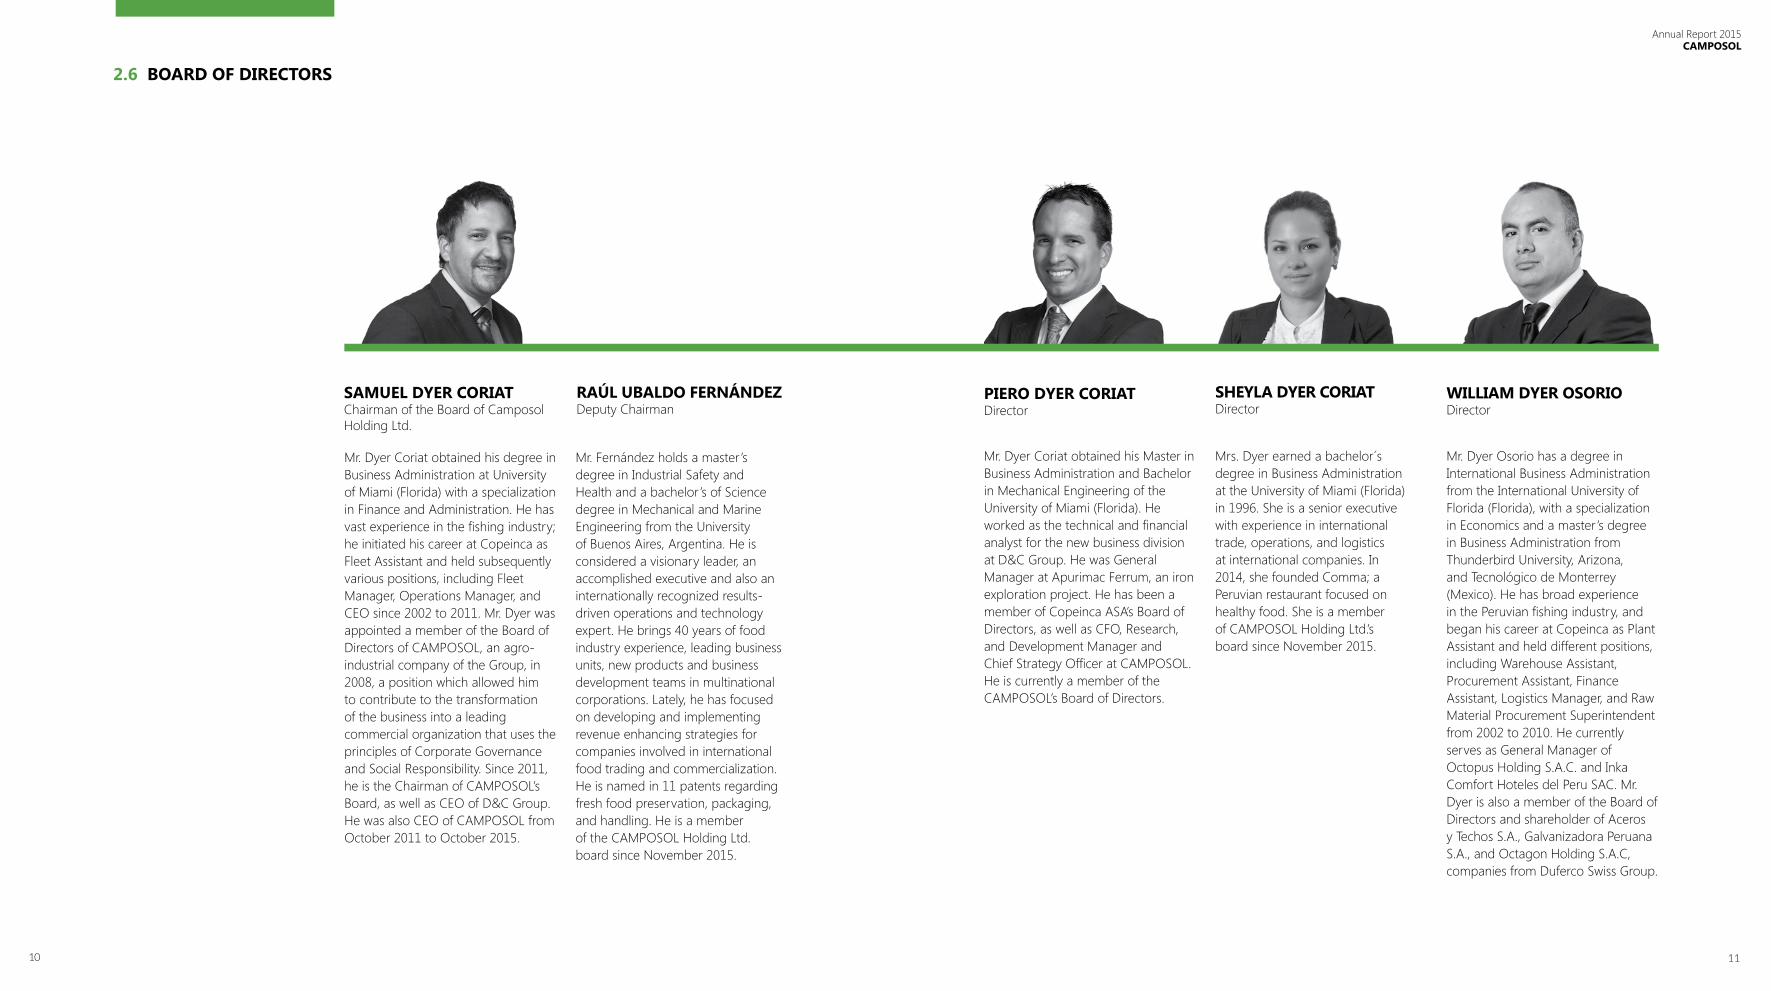
RAúL ubALDO FERnánDEzDeputy Chairman
Mr. Fernández holds a master ’s degree in Industrial Safety and Health and a bachelor’s of Science degree in Mechanical and Marine Engineering from the University of Buenos Aires, Argentina. He is considered a visionary leader, an accomplished executive and also an internationally recognized results-driven operations and technology expert. He brings 40 years of food industry experience, leading business units, new products and business development teams in multinational corporations. Lately, he has focused on developing and implementing revenue enhancing strategies for companies involved in international food trading and commercialization. He is named in 11 patents regarding fresh food preservation, packaging, and handling. He is a member of the CAMPOSOL Holding Ltd. board since November 2015.
Mr. Dyer Coriat obtained his degree in Business Administration at University of Miami (Florida) with a specialization in Finance and Administration. He has vast experience in the fishing industry; he initiated his career at Copeinca as Fleet Assistant and held subsequently various positions, including Fleet Manager, Operations Manager, and CEO since 2002 to 2011. Mr. Dyer was appointed a member of the Board of Directors of CAMPOSOL, an agro-industrial company of the Group, in 2008, a position which allowed him to contribute to the transformation of the business into a leading commercial organization that uses the principles of Corporate Governance and Social Responsibility. Since 2011, he is the Chairman of CAMPOSOL’s Board, as well as CEO of D&C Group. He was also CEO of CAMPOSOL from October 2011 to October 2015.
SAMuEL DyER CORiAt Chairman of the Board of Camposol Holding Ltd.
PiERO DyER CORiAt Director
Mr. Dyer Coriat obtained his Master in Business Administration and Bachelor in Mechanical Engineering of the University of Miami (Florida). He worked as the technical and financial analyst for the new business division at D&C Group. He was General Manager at Apurimac Ferrum, an iron exploration project. He has been a member of Copeinca ASA’s Board of Directors, as well as CFO, Research, and Development Manager and Chief Strategy Officer at CAMPOSOL. He is currently a member of the CAMPOSOL’s Board of Directors.
WiLLiAM DyER OSORiO Director
Mr. Dyer Osorio has a degree in International Business Administration from the International University of Florida (Florida), with a specialization in Economics and a master ’s degree in Business Administration from Thunderbird University, Arizona, and Tecnológico de Monterrey (Mexico). He has broad experience in the Peruvian fishing industry, and began his career at Copeinca as Plant Assistant and held different positions, including Warehouse Assistant, Procurement Assistant, Finance Assistant, Logistics Manager, and Raw Material Procurement Superintendent from 2002 to 2010. He currently serves as General Manager of Octopus Holding S.A.C. and Inka Comfort Hoteles del Peru SAC. Mr. Dyer is also a member of the Board of Directors and shareholder of Aceros y Techos S.A., Galvanizadora Peruana S.A., and Octagon Holding S.A.C, companies from Duferco Swiss Group.
ShEyLA DyER CORiAt Director
Mrs. Dyer earned a bachelor´s degree in Business Administration at the University of Miami (Florida) in 1996. She is a senior executive with experience in international trade, operations, and logistics at international companies. In 2014, she founded Comma; a Peruvian restaurant focused on healthy food. She is a member of CAMPOSOL Holding Ltd.’s board since November 2015.
2.6 bOARD OF DiRECtORS

1312
Annual Report 2015 CAMPOSOL
PEDRO JAViER MORALES GARCéSCamposol Fruits & Vegetables CEO
MAnuEL SALAzAR DiEz CAnSECOCEO of Camposol Holding Ltd.
JORGE RAMiREz RubiOCamposol Seafood CEO
Mr. Morales is an agricultural engineer from the Universidad Nacional Agraria La Molina with an MBA from ESAN University. Mr. Morales has vast experience in the agro-industrial sector. He began his career at CAMPOSOL 15 years ago as Head of Parcel; he subsequently became Head of Farm and was appointed Superintendent of New Areas in 2004, responsible for sowing 2,000 ha of asparagus. In 2009 he was promoted to Manager of New Crops and was responsible for managing 1,400 ha plantation of avocados, grapes, and tangerines in La Libertad. Then, in 2011, he was appointed Manager of the Asparagus Business Unit. Later in 2013, he took over the Blueberry Business Unit and at the end of 2013 has been named Deputy CEO at CAMPOSOL, until 2014 when he was appointed CEO of CAMPOSOL Fruits & Vegetables.
Mr. Ramirez holds a bachelor’s degree in Business Administration with a specialization in Finance from the Loyola University (New Orleans, USA) and an MBA from ITESM (México) - ESPOL (Ecuador). He has vast international experience in Strategic Planning, Corporate Finance, Mergers & Acquisitions and International Affairs. Mr. Ramirez worked previously at Amanco Group and Mexichem (1995-2008) and held various positions in Ecuador, Costa Rica and Brazil, his last one being CFO for Latin America. He has also served as CFO at CAMPOSOL Holding Ltd. (2008-2013), Copeinca ASA (2012) and Grupo EFE (2014-2015).
CARMEn ROSA GRAhAM AyLLón Director
Mrs. Graham is a business manager graduated from the Universidad del Pacífico, IBM Systems Engineer, and MBA from the Adolfo Ibáñez School of Management in Miami. She has advanced studies in management, corporate responsibility, and innovation at universities of Harvard, Georgetown, Monterrey, and Piura. She has been General Manager at IBM Colombia in 1999, General Manager at IBM Peru and Bolivia in 2011, and IBM Regional Strategy Manager in 2004. Mrs. Graham has been rector of the Universidad del Pacífico in 2007. She is currently an advisor in governance and member of the Board of Directors of Ferreycorp S.A., Interbank, and Nextel del Perú, as well as a member of the Consultative Committee at APM Terminals and Chairwoman at Fundación Backus and WCD Peru (Women Corporate Directors).
SuSAnA ELéSPuRu GuERRERO Director
Mrs. Eléspuru became a member of CAMPOSOL’s Board of Directors in May 2014. She developed her career as a senior executive, business consultant and search of managers for more than 30 years. She began her career at Procter & Gamble, where she was Deputy Corporate Chairwoman, Chairwoman of the Board of Directors, and General Manager for Peru, Ecuador, and Bolivia. Ms. Eléspuru chaired Eléspuru Consultores, a company related to strategic management for multinational and local companies. She has vast experience in corporate governance, strategic planning, business competitiveness, and organizational development. She was chairwoman of IPAE from 2011 to 2013, chaired the CADE 2001, and led the Escuela de Empresarios of IPAE.
2.7 MAnAGEMEnt tEAM
Mr. Salazar holds a bachelor’s degree in Economics from Clark University (Massachusetts, USA), an MBA from Georgetown University (Washington, USA), and a Ph.D. in Management from the University of Lleida (Spain). He has more than 20 years of professional experience in managerial roles of local and regional responsibility in large companies with an exceptional career. His previous position was as CEO of Louis Dreyfus Commodities for Peru and Chile. Mr. Salazar began his career at Banco de Crédito del Perú in 1991 and consolidated in the banking sector. He ultimately assumed the position of Risk Manager for the Andean region at West Merchant Bank. He Later was Manager of Planning and Strategy at Corporation Lindley - after the acquisition of ELSA. He has a solid background as CEO, including the design of strategic, commercial and financial planning for large and complex organizations that operates in different markets, as well as broad experience in leadership, culture transformation management and control systems.

1514
Annual Report 2015 CAMPOSOL
ALEJAnDRO ARRiEtA POnGOLegal & Corporate Affairs Manager
MARíA CRiStinA COutuRiER LLEREnAFinance and Administration Manager
GuiLLERMO DEFiLiPPi RODRíGuEzHuman Resources & Development Manager
JOSé AntOniO GóMEz bAzánCamposol Trading CEO
FRAnCESCA CARnESELLA FiGuEROLAMarketing, Communications and Sustainability Manager
MARiO MELGAR DE LA PuEntESupply Chain Manager
Mr. Arrieta is an attorney graduated from the Universidad de Piura. He has previously worked as Senior Associate at Rodrigo, Elías & Medrano and Lazo, and De Romaña & Gagliuffi. His excellence and performance on these law firms have been recognized in the 2014 issue of the “The Legal 500 Latin America”, an international magazine specialized in the research of performance of law firms worldwide. He has also been a counsellor at the Ministry of Economy and Finance (National Council for Competitiveness) and has worked as a professor at the Faculty of Law at the Universidad de Piura and associate professor at the Faculty of Law in the Pontificia Universidad Católica del Perú. Mr. Arrieta has published research papers in different specialized magazines and newspapers. He currently participates as a speaker in different programs.
Mrs. Couturier is CFO and is responsible for Corporate Finance, Accounting, Treasury, Information Technologies, Business Planning and Administration. Mrs. Couturier holds an MBA in finance and a BA in Economics from Hofstra University (New York, USA). Mrs. Couturier has over 23 years of experience and has held positions in various multinational corporations. She was Chief Financial Officer at SN Power Peru S.A. (Statkraft) from 2008 through 2013. She has also worked in other industries and companies such as Electroandes S.A., PSEG (USA), jP Morgan Chase/Flemings (UK), Prisma SAB, and Southern Copper Corporation. Mrs. Couturier has extensive experience in corporate finance, mergers and acquisitions, and change management.
Mrs. Carnesella is an economist from the Universidad del Pacífico and has an MBA from the Universidad de Piura and post-graduate studies in communications and social responsibility at the Pontificia Universidad Católica del Peru and ESAN, respectively. She has served as counselor to the Minister of Economy and Finance, as well as to the Minister of Energy and Mines, and Chairman of the Private Investment Promotion Commission. She was appointed Press & Communications Director of the Ministry of Foreign Affairs in Peru. She was the Image and Communications Manager at BBVA and General Manager at the BBVA Foundation, as well as Corporate Image Manager at TIM Peru (now Claro).
Mr. Melgar is a corporate communication specialist graduated from Universidad de Lima and has a master’s degree in Transport and Logistics (the Blue MBA) from Copenhagen Business School (Copenhague, Denmark). He has also taken a post-graduate course in Project Management from the Implement Consulting Group (Denmark). Throughout his experience at Maersk Line, he developed the Areas of Marketing, e-Commerce, and sale of transport services for perishable goods. Mr. Melgar has also worked as Managing Director for Logistics Operations at Geodis Wilson. He has a 20-year experience leading projects related to international transport and logistics solutions in Peru and Europe.
Mr. Defilippi is an attorney graduated from the Pontificia Universidad Católica del Perú, has a degree in Human Resources Management from CENTRUM and the Universidad de Barcelona (Spain). Mr. Defilippi has more than 20-year experience in Human Resources Management and has developed strategies and implemented programs for attracting, retaining and developing talent in companies such as Warner-Lambert Peru, Colgate-Palmolive Peru, Mission Hills (Mexico), Yanbal International and Minsur. He has also led programs for talent management and employee engagement.
Mr. Gómez has extensive international experience in the food industry and international trade. He is a PMA board member and past chair of the Institute of Asparagus and Vegetables. His previous experience includes management positions at Chiquita Brands International in the U.S.A., Costa Rica, and Europe, and most recently as General Manager with headquarters in Florida. He was formerly Director of Corporate Banking Projects at Banco de Crédito del Perú and Project Manager at IBM Peru.

1716
Annual Report 2015 CAMPOSOL
BOARD OF DIRECTORS
CFO
SUPPLY CHAIN MANAGEMENT
INTERNAL AUDIT
MANGOES & GRAPES
BUSINESS UNIT
ASPARAGUS & MANDARINS
BUSINESS UNIT
AVOCADOBUSINESS
UNIT
BLUEBERRYBUSINESS
UNITTRADE OFFICE
EUTRADE OFFICE
USAOPERATIONSCOMMERCIAL
CORPORATE GENERAL MANAGER
FRUITS & VEGETABLESGENERAL MANAGER
TRADINGGENERAL MANAGER
SEAFOODGENERAL MANAGER
HUMAN MANAGEMENT AND DEVELOPMENT
LEGAL AND CORPORATE AFFAIRS
INFORMATIONTECHNOLOGY
CORPORATE FINANCE
ADMINISTRATION
FOREIGN TRADE
HUMAN DEVELOPMENT
MARKETING, COMMUNICATIONAND SUSTAINABILITY
PROCESS AND CONTINUOUS IMPROVEMENT
CORPORATECOMMUNICATIONS
OPERATIONS
LOGISTICS
COMMERCIAL FRESH & FROZEN
IMS - R&D
FINANCE
HUMAN RESOURCESMANAGEMENT
OPERATIONS SOUTH AREA
SALES MANAGER
OPERATIONSMANAGER
OFFICE MANAGER
INTENSIVE GROW
SEMI- INTENSIVE
GROW
LAB
MAINTENANCE
FINANCE
IMS
HUMAN RESOURCES AND ADMINISTRATION
FRESH PRODUCTS
STOCK UP ON
SALES MANAGER
OPERATIONSMANAGER
OFFICE MANAGER
LOCAL SALESOFFICE
INVESTOR RELATIONS
GENERAL ACCOUNTING
SHRIMP BUSINESS
UNIT
2.8 ORGAnizAtiOnAL ChARt

1918
Annual Report 2015 CAMPOSOL
2.9 LEGAL StRuCtuRE 2.10 bRiEF hiStORy
CAMPOSOL began operating in 1997 after purchasing its first land stock in La Libertad region located in the north of Peru, approximately 600 Kms. from Lima. During that same year, the company was able to acquire more land in the same region through a public option in the context of the Chavimochic Special Irrigation Project.
In its first and second stage, the Chavimochic Special Irrigation Project has supplied water to more than 78,000 Has of the desert on the northern coast of Peru. Nowadays, the third stage of the project is expected to allow the development of another 60,000 Has in its area of influence by several private companies.
In 1998 the Company began to acquire and develop land in Piura, located 1,000 Kms. North of Lima, and by the end of 1999, CAMPOSOL began exporting agro-industrial products.
The vision and the commitment of everyone involved in the objectives of the Company resulted in CAMPOSOL rapidly becoming the leading agro-industrial company in Peru, annually occupying the first place in agro-exports and generating approximately 15,000 direct work positions during the high production seasons. Today, the Company has more than 24,000 own Has between Chao, Virú, and Piura.
In 2006, CAMPOSOL founded Marinazul with which it began an aquaculture business producing and exporting shrimp in the Tumbes region, located in the extreme north of Peru. This Company has grown and diversified consistently ever since becoming the leader in the country occupying today more than 2,000 own hectares, as well as having the most modern private biotechnology research and development installations in Peru.
At present, CAMPOSOL is the largest grower of Hass Avocados in the world, soon to be the largest producer of blueberries in the world. It is involved in the harvest, processing, and marketing of other high quality agricultural and marine products such as avocados, blueberries, grapes,
mangos, tangerines, asparagus, shrimps, with commercial offices in the United States of America (Florida) and Europe (Rotterdam).
As a more mature company, CAMPOSOL is orienting its efforts towards innovation and biotechnological research. At the same time, CAMPOSOL is looking to increase its skills in the marketing programs using an even greater international presence as well as alliances with companies and clients that have significant experience, leadership, and coverage in important markets around the world. Given the performance, CAMPOSOL has had during the last decade and the growing preference of consumers for quality food that contributes to good health, the Company can look towards the future with optimism, supported fundamentally on the solidness of its operations, the professionalism of its employees and its good corporate practices.
(1) Includes 100% ownership of Camarones S.A.C., Pacífico Azul S.A., Marante Investment S.A.C., Palmas Hill Investments S.A. and Congelados y Frescos S.A.C.; a 80% stake in Corporación Refrigerados INY S.A. and a 75% in Pesquera ABC S.A.C.
(2) Includes 100% ownership of Muelles y Servicios S.A.C. and Nor Agro Perú S.A.C., and 69.76% stake in Marinasol S.A. (with the remainging 30.24% owned by Madoca Corp.)
CAMPOSOL HOLDING LTD. (CY)
CAMPOSOL S.A. (2)
MARINAZULS.A. (1)
CAMPOINCAS.A.
CAMPOSOL EUROPA S.L. (SP)
CAMPOSOL FRESH B.V. (NL)
PERSEA INC(US)
CAMPOSOL FRESH (US)
GRAINLENS LTD. (CY)
SIBOURE HOLDINGS LTD. (CY)
BLACKLOCUSTLTD. (CY)
MADOCA CORP. (PA)
99.999999%
0.02% 0.000001%
99.98%
27.38%
87.27%
12.73%
46% 0.2%
54%
61.33%
94.55%
100%
100%
100%
63.94%
8.6%
0.004%
38.665%
99.80%

2120
Annual Report 2015 CAMPOSOL03
Products and categories
CAMPOSOL considers paramount to maintain a diversified portfolio of products, to exploit the selling windows better and optimize its harvesting, packing, sales and marketing efforts.
CAMPOSOL’s main products are avocados, blueberries, asparagus (white and green), mangoes, grapes, and tangerines. The Company also has a shrimp production center (Marinazul) in the north of Peru. All production is currently oriented to the export markets.
PRODUCTS CATEGORIES MAIN DESTINATIONS
Avocados Fresh and frozen
The US, the Netherlands, France, Japan and Spain.
Blueberries Fresh The US and the Netherlands.
Green and White Asparagus
Fresh, preserved and frozen
The Netherlands, US, France, Spain and Germany.
Tangerine FreshThe UK, The Netherlands and Canada
MangoesFresh, preserved and frozen
The US, the Netherlands, Germany, and Japan.
Grapes Fresh The Netherlands, US and China.
Peppers Preserved Spain, Germany and the US.
Shrimp Frozen US, France, Spain and Italy.
At December 31st, 2015, the Group has seven operating segments which are: avocado, blueberry, asparagus, mango, grapes, pepper and seafood. Artichoke, which produced this single presentation is not considered a reportable segment anymore, considering that from Management’s perspective artichoke will not be relevant in the decision-making; therefore Artichoke’s CGU is presented as discontinued operations. These products are further distinguished in fresh and frozen products.
The seven operating segments are engaged in producing, processing and commercializing some agricultural products, presented in fresh, preserved (until 2015) and frozen, which are mainly exported to European markets and the United States of America.
All production and related assets are in Peru.
CAMPOSOL CONSIDERS PARAMOUNT TO MAINTAIN A DIVERSIFIED PORTFOLIO OF PRODUCTS, TO ExPLOIT THE SELLING WINDOWS BETTER AND OPTIMIzE ITS HARVESTING, PACKING, SALES AND MARKETING EFFORTS.
AT DECEMBER 31ST 2015, THE GROUP HAS SEVEN OPERATING SEGMENTS WHICH ARE: AvOCADO, BLUEBERRY, ASPARAGUS, MANGO, GRAPES, PEPPER AND SEAFOOD.

2322
Annual Report 2015 CAMPOSOL
CAMPOSOL continues to be a leading company in the Peruvian non- traditional agro-industry exports and has three main product categories: Fresh, Preserved, and Frozen. 56% of total revenues in 2015 came from fresh products, 27% from preserved products and 15% from frozen products.
AvocadosAvocados are one of the most profitable crops on CAMPOSOL’s portfolio, with a gross margin in 2015 of 49.5% and thus, reductions of price affect the profitability of the Company much more than any other crop.In 2015, revenues from our avocados segment were USD53.7 million and represented 19.7% of our total revenues, which represented a decrease of USD19.7 million from USD73.4 million in 2014 (29.0% of our total revenues in 2014).
Fresh avocados are our main avocado product, which in 2015 represented 16.8% of our total sales (USD 46.1 million) and 85.5% of our total avocado sales.
The decrease in revenues from our avocados segment in 2015 was primarily a result of
• A 32.2% decrease in volumes sold, from 40,204 net MT in 2014 to 27,274 net MT in 2015. Volume decrease mainly due to both the presence of a weak El Niño phenomenon during 2014 and a moderated El Niño phenomenon during 2015, which took place during months in which the plant required cold temperatures to secure its natural flowering process, and a reduction of expected yields because of seasonality.
• Decrease in revenues was partially offset by an 8.8% increase in average prices for avocados in 2015, from USD1.81 per net kg in 2014 to USD1.97 per net kg in 2015. Price increase mainly due to (i) the implementation of our new commercial strategy, which increased the participation of retail channels, (ii) a 5.0% increase in average prices for fresh avocados and (iii) a 2.6% increase in average prices for frozen avocados.
CAMPOSOL sold 25,344 net MT of fresh avocados in 2015 (38,424 MT in 2014), at an average price of USD 1.81 per net KG during 2015 (USD 1.72 in 2014) representing a
decrease of 34.0% in volume sold and an increase of 5% in price levels compared to 2014.
CAMPOSOL sold 1,930 net MT of frozen avocados in 2015 (1,780 MT in 2014) at an average price of USD 3.93 per net KG during 2015 (USD 3.83 in 2014), representing an increase of 8.4% in volume sold and an increase of 2.6% in price levels compared to 2014.
During 2015, total gross margin for avocados was 49.5%, down 2.9 pp (percentage points) from the year before.
Principal destinies for our avocados:
Market 2015Revenues % 2014
Revenues %
Asia 3,909 7% 2,918 4%
United States 24,252 45% 48,351 66%
Europe 22,803 42% 19,521 27%
Others 2,714 5% 2,610 4%
53,678 73,400

2524
Annual Report 2015 CAMPOSOL
blueberriesBlueberries are the most profitable crop on CAMPOSOL’s portfolio, with a gross margin of 75.0% in 2015. The largest investments during the last two years were made in this crop.
In 2015, revenues from our blueberries segment were USD48.1 million and represented 17.6% of our total revenues, which represented an increase of USD38.6 million, or 404.0 %, from USD9.5 million in 2014 (3.8% of total revenues in 2014).
Fresh blueberries are our principal blueberry product, which in 2015 represented 17.5% of our total sales (USD 47.7 million) and 99.3% of our total blueberries sales.
The increase in revenues from our blueberries segment in 2015 was primarily a result of
• A 386.4% increase in volumes sold, from 912 net MT in 2014 to 4,436 net MT in 2015, due to increased production in 532 has; and
• A 3.6% increase in average prices for blueberries in 2015, from USD10.46 per net kg in 2014 to USD10.84 per net kg in 2015, due to the implementation of our new commercial strategy, which increased the participation of retail channels.
During 2015, total gross margin for blueberries was 75.0%, down 3.9 pp (percentage points) from the year before.
Principal destinies for our blueberries:
Market 2015Revenues % 2014
Revenues %
Asia 129 0% 752 8%
United States 28,447 59% 5,940 62%
Europe 18,702 39% 2,850 30%
Others 793 2% 0 0%
48,071 9,542
Market 2015Revenues % 2014
Revenues %
Asia 1,343 2% 1,327 2%
United States 7,866 21% 13,695 21%
Europe 32,032 75% 48,702 75%
Others 1,591 2% 1,498 2%
42,833 65,222
AsparagusPeru is the most important supplier of asparagus in the world. Peruvian asparagus production is highly efficient given the country’s geographic location and climatic advantage, with one of the highest yields among asparagus producers (11.4 MT per hectare in 2013).
Due to Peru´s climate characteristics, asparagus is harvested all year‐long, but fresh asparagus´s sales are stronger in the first and fourth quarter. CAMPOSOL and the other Peruvian producers have an advantage regarding other producing countries since they can offer product outside the traditional windows of the northern hemisphere consumption.
In 2015, revenues from our asparagus segment were USD42.8 million and represented 15.7% of our total revenues, which represented a decrease of USD22.4 million, or 34.4%, from USD65.2 million in 2014 (25.7% of total revenues in 2014).
White asparagus is our principal asparagus product, which in 2015 represented 12.1% of our total sales (USD 32.9 million) and 76.8% of our total asparagus sales.
The decrease in revenues from our asparagus segment in 2015 was primarily a result of
• A 35.8% decrease in volumes sold, from 16,600 net MT in 2014 to 10,653 net MT in 2015, due to both the presence of a weak El Niño phenomenon during 2014 and a moderated El Niño event during 2015, and a reduction of average yields because of older fields. The lower harvested volumes resulted in lower volumes of white asparagus sold and lower volumes of preserved asparagus sold.
CAMPOSOL sold 4,107 net MT of fresh asparagus in 2015 (6,588 MT in 2014), at an average price of USD 4.66 per net KG during 2015 (USD 4.36 in 2014), representing a decrease of 37.7% in volume sold and a decrease of 0.7% in price levels compared to 2014.
CAMPOSOL sold 6,158 net MT of preserved asparagus in 2015 (9,408 MT in 2014), at an average price of USD 3.62 per net KG during 2015 (USD 3.56 in 2014), representing a decrease of 34.55% in volume sold and an increase of 1.7%
in price levels compared to 2014. CAMPOSOL sold 388 net MT of frozen asparagus in 2015 (604 MT in 2014), at an average price of USD 4.80 per net KG during 2015 (USD 4.22 in 2014), representing a decrease of 35.8% in volume sold and an increase of 13.7% in price levels compared to 2014.
During 2015, total gross margin for asparagus was 12.8%, down 8.7 pp (percentage points) from the year before.
Principal destinies for our asparagus:

2726
Annual Report 2015 CAMPOSOL
MangosIn 2015, revenues from our mangos segment were USD 23.1 million and represented 8.5% of our total revenues, which represented a decrease of USD 0.4 million, or 1.8%, from USD 23.5 million in 2014 (9.3% of our total revenues in 2014)
Fresh and frozen mangos are our principal mango products, which in 2015 represented 64.4% and 31.3%, respectively, of our total mango sales.
CAMPOSOL sold 10,063 net MT of fresh mangos in 2015 (9,993 MTs in 2014) at an average price of USD 1.48 per net KG during 2015 (USD 1.31 in 2014), representing a decrease of 7.0% in volume sold and an increase of 11.5% in price levels compared to 2014.
CAMPOSOL sold 3,406 net MT of frozen mangos in 2015 (5,714 MTs in 2014) at an average price of USD 2.12 per net KG during 2015 (USD 1.75 in 2014), representing an increase of 42.4% in volume sold and a decrease of 21.1% in price levels compared to 2014.
Market 2015Revenues % 2014
Revenues %
Asia 1,967 9% 2,729 12%
United States 7,841 34% 10,205 43%
Europe 11,226 49% 9,215 39%
Others 2,048 9% 1,350 6%
23,082 23,499
Market 2015Revenues % 2014
Revenues %
Asia 5,148 31% 10,528 44%
United States 1,276 8% 3,419 14%
Europe 6,729 40% 7,721 33%
Others 3,691 22% 2,026 9%
16,844 23,694
During 2015, total gross margin for mango was 31.5%, down 3.1 pp (percentage points) from the year before.
Principal destinies for our mangos:
GrapesIn 2015 revenues from our grapes segment were USD 16.8 million, and represented 6.2% of our total revenues, which represented a decrease of USD 6.9 million, or 28.9 %, from USD 23.7 million in 2014 (9.3% of our total revenues in 2014). Grapes are only sold in the fresh category.
The decrease in revenues from our grapes segment in 2015 was primarily a result of
• A 12.9% decrease in volumes sold, from 11,798 net MT in 2014 to 9,806 net MT in 2015, due to both the presence of a weak El Niño phenomenon during 2014 and a moderate El Niño event during 2015, affecting harvested volumes; and
• A 14.4% decrease in average prices for grapes in 2015, from USD 2.01 per net kg in 2014 to USD 1.72 per net kg in 2015, due to an increase in sold fresh product presentations with lower prices.
During 2015, total gross margin for grapes was -1.0%, down 19.2 pp (percentage points) from the year before. Principal destinies for our grapes:

2928
Annual Report 2015 CAMPOSOL
ShrimpIn 2015, revenues from our seafood segment were USD 57.2 million, which represented 21.0% of our total revenues, which represented an increase of USD 23.4 million, or 69.2%, from USD 33.8 million in 2014 (13.3% of our total revenues in 2014).
Frozen shrimp are our principal seafood product, which represented 94.5% of our total seafood sales, in 2015.
The increase in revenues from our seafood segment in 2015 was primarily a result of
• A 244.4% increase in volumes sold, from 2,993 net MT in 2014 to 10,309 net MT in 2015, due to an increase in shrimp production and the incorporation of other seafood
products. The increase in production due to acquisitions compensated the reduction in yields observed in semi-intensive shrimp ponds as a result of the occurrence of a moderate El Niño phenomenon during 2015;
• A 50.9% decrease in average prices in 2015, from USD 11.28 per net kg in 2014 to USD 5.54 per net kg in 2015, mainly due to a decrease in shrimp prices of 26.0%, from USD 9.80 per net kg in 2014 to USD 7.25 per net kg in 2015. The decrease in prices corresponds to the recovery of global production after the effect of EMS on shrimp ponds around the world.
During 2015 total gross margin for shrimp was 1.5%, down 26.4pp (percentage points) from the year before.
Principal destinies for our shrimp:
Market 2015Revenues % 2014
Revenues %
Asia 3,043 5% 2,260 7%
United States 18,945 33% 24,920 74%
Europe 27,449 48% 353 1%
Others 7,719 14% 6,222 18%
57,156 33,755
ArtichokesOn 17 December 2015, the Group signed a contract of sale in which transfers the ownership of his line of preserved products to a third party (Sociedad Agrícola Virú S.A.C.), the same that will be effective in january 2016.
As a result of the disposal of the preserved products line, Artichoke’s CGU, which produced this single presentation, is not considered a reportable segment anymore, considering that from management’s perspective artichoke will not be relevant in the decision making. Therefore, Artichoke’s CGU is presented as discontinued operations. The results of the sale of this product are not shown with the other segments in revenues and is presented in a separate line in the Income Statement.
CAMPOSOL sold 6,448 net MT of artichoke during 2015 (5,548 MT in 2014), at an average price of USD 2.58 per net KG during 2015 (USD 2.54 in 2014) representing an increase of 16.2% in volume sold and an increase of 0.2% in price levels compared to 2014.
During 2015, total gross margin for artichoke was 6.0%, down 1.2 pp (percentage points) from the year before.
IN 2015, REVENUES FROM OUR SEAFOOD SEGMENT WERE USD 57.2 MILLION, WHICH REPRESENTED 21.0% OF OUR TOTAL REVENUES, WHICH REPRESENTED AN INCREASE OF USD 23.4 MILLION, OR 69.2%, FROM USD 33.8 MILLION IN 2014.
PeppersIn 2015, revenues from our peppers segment were USD21.2 million and represented 7.8% of our total revenues, which represented an increase of USD 6.5 million from USD 14.7 in 2014 (5.5% of our total revenues in 2014).
Frozen and preserved piquillo peppers were our principal pepper product, which in 2015 represented 13.2% and 83.4%, respectively, of our total peppers sales.
CAMPOSOL sold 9,053 net MT of preserved piquillo peppers in 2015 (6,485 MT in 2014) at an average price of USD 1.92
per net KG during 2015 (USD 1.87 in 2014), representing an increase of 39.6% in volume sold and a decrease of 2.7% in price levels compared to 2014.
CAMPOSOL sold 732 net MT of frozen piquillo peppers in 2015 (20 MTs in 2014) at an average price of USD 3.22 per net KG during 2015 (USD 2.63 in 2014), representing an increase of 22% in price levels compared to 2014.
During 2015, total gross margin for peppers was 1.7% down 2.4 pp (percentage points) from the year before.

3130
Annual Report 2015 CAMPOSOL04
board of Directors Report
4.1 MAin ACtiVitiES
CAMPOSOL is a global healthy food provider that integrally manages its supply chain: its fields, processing, and distribution. CAMPOSOL’s portfolio includes the following products: blueberries, avocados, mangos, grapes, tangerines, asparagus, shrimps and other marine products, all exported to the world.
The planted fields and packaging facilities are located in Peru, in La Libertad, Piura and Tumbes regions. The Company owns most of the fields where its products are sowed and harvested, having total control of the growing, harvesting and packing phases of its final products. It also has alliances and industrial relations with other growers to process and commercialize their products, assuring the same quality standards to clients.
To ensure high service levels to its clients and to monitor in a close manner trends in its main markets, CAMPOSOL has strengthened its commercial arms through direct offices in Europe (the Netherlands) and the US (Florida).
4.2 MARkEt SituAtiOn
AGROinDuStRy:
Peruvian agricultural exports amounted to USD 5,285 million in 2015, 26% more than in the previous year. Peru has become one of the world’s top-10 food supplier countries by exporting asparagus, coffee, mangoes, maca, quinoa, olives, grapes, avocados, artichoke, dried peppers, beans, tangerines, gingers, broad beans, onions, fresh peas, and berries.
Some products experienced important growth versus 2014, like fresh mangoes (+42%), frozen mangoes (+49%), non-frozen prepared vegetables (+37%), cocoa grain (+21%), fresh asparagus (+9%) and grapes (+9%) stood out.
Also some countries experienced significant growth, like Vietnam (+74%), Puerto Rico (+30%), Mexico (+17%), Chile (+17%), England (+13%), Netherlands (+10%), United
States (+8%), and other nations increased their demand for Peruvian products during 2015.The major exporting companies in 2015 were Camposol SA, Persales Huancaruna SAC, Sociedad Agricola Virú SA, Complejo Industrial Beta SA, DanPer Trujillo SAC and Gloria SA, among others.
CAMPOSOL’s products were exported to 53 countries. The main markets were the USA, which in 2015 accounted for 50% of total volume, followed by Germany with 12% and Spain with 8%.
AvocadosPeru is the second largest exporter of avocados in the World. La Libertad region is the first producer of avocado in Peru, with 36% of the total exports.
Avocados sales between january-November shows an 8% decrease versus the same period in 2014 when exports totaled USD306.2, total tonnage shipped last year were 169,694 tons.
Camposol continued to lead avocado exports with the 14% of the total volume, followed by Soc. Agricola Drokasa (11%) and Cerro Prieto (11%).
Camposol exported 25,300 MT of fresh avocados to 22 countries during 2015, representing a decrease of 34% versus 2014, due to the alternate bearing nature of the fruit. USA and Europe were the main destinations, with 46% sales and 42% respectively, sales to Asia accounted for 7% and 4% to Chile.
There are high expectations for the Asian Market, especially after signing the Phytosanitary Protocol that allows Peruvian avocados into China, and after Peru sent its first shipment to japan in August 2015. blueberriesOver the past four years, the growth of Peruvian blueberry exports has been impressive. It went from almost zero in 2011 to USD 0.5 million in 2012; then jumped to USD 15 million in 2013 and then to USD 29 million in 2014. Total sales in 2015 were over USD 94 million, which is three times more than in 2014.
CAMPOSOL IS A GLOBAL HEALTHY FOOD PROVIDER THAT INTEGRALLY MANAGES ITS SUPPLY CHAIN: ITS FIELDS, PROCESSING, AND DISTRIBUTION
CAMPOSOL IS A GLOBAL HEALTHY FOOD PROVIDER THAT INTEGRALLY MANAGES ITS SUPPLY CHAIN: ITS FIELDS, PROCESSING, AND DISTRIBUTION.

3332
Annual Report 2015 CAMPOSOL
The number of markets demanding the fruit has also increased. In 2015, Peru shipped to 20 countries, ten more than in 2014. The United States remains the biggest customer, accounting for more than half of the purchases (USD 53.2 million), followed by the Netherlands (USD 25.7 million), the United Kingdom (USD 11,5 million), and Hong Kong (USD 6.0 million).
Blueberry exports were one of La Libertad’s most notorious increases in agricultural product exports. Blueberry exports from La Libertad accounted for over 90% of national exports, then Ancash with 3%, Lima with 2%, and Ica with 1%. The 80% of the total volume of Peruvian blueberries was exported by Camposol and Talsa with the 42% and 38% respectively.
Camposol exported 4,400 MT of fresh blueberries to 20 countries. The USA is the leading market for Camposol’s blueberries exports (60%) followed by Germany (20%) and UK (15%).
AsparagusPerú: Fresh Asparagus exports in 2014 totaled USD 380 million at an average price downward USD 2.89 kilo, representing a decrease of 6 % and 12 % respectively over 2013.
One of Camposol’s main products, which represented 15.7% of the company’s total sales during 2015.
Camposol sold 10,600 MT of asparagus, 4,100 MT of fresh, 6,000 preserved and 400 of frozen, representing a decrease of 37.6%, 34.5%, and 35.7% respectively.
Mango In 2015, Peruvian mango exports not only increased in value and prices but also arrived in new destinations.
Peruvian mango exports grew by 34% in value in 2015, amounting to USD 187 million and an average price of USD 1.49 per kilo. The volume achieved amounted to 125,800 MT. These results are good when compared to the previous
PRODUCTS CATEGORIES MAIN MARKETS
Avocados Fresh and frozen
The USA, Germany, Spain, France, and The Netherlands
Blueberries Fresh The USA, Germany, UK and The Netherlands
Green and White Asparagus
Fresh, preserved and frozen
Germany, USA, France, Spain and The Netherlands
Tangerine FreshThe UK, The Netherlands and Canada
Mangoes FreshThe USA, Germany, The Netherlands, Canada and Japan
Grapes Fresh Russia, Poland and USA
Peppers Preserved Spain, Germany and USA
Artichokes Preserved USA
Shrimp Frozen USA
year, in which the export value amounted to approximately USD139 million, the average price was USD1.15 per kilo, and the export volume totaled 120,800 MT.
Mango exports reached a total of 28 destinations. However, the two main markets, i.e. the Netherlands and the United States, have accounted for nearly 70% of the total export volume value and 55% of its volume since 2011.
The number of companies exporting mangoes also increased, as it went from 152 in 2014 to 178 in 2015, however only three of them continued to lead exports. These companies are Dominus SAC, Sunshine Export SAC, and Camposol SA. However, their share in the overall total value and volume exported decreased.
GrapesFresh grapes were deemed as Peru’s top non-traditional agro-exports produce” having ousted asparagus for a third consecutive year.
In 2015, fresh grape exports amounted USD 699.1 million, 8.8% of the sales in 2014 and 309,926 MT, 17% more than the last year.
The two regions that produce the most grapes in Peru are Ica and Piura, while the main exporters are El Pedregal, Sociedad Agricola Rapel, Complejo Agroindustrial Beta, and Agricultural Ecosac, among others.
Camposol has 326 grape hectares, 90% of which are Redglobe varieties; the remaining grapes are of the Flame Seedless variety, and other varieties are being tested (the former are not being exported yet).
The larger production of the Company is of the Redglobe variety; the main markets destination are Western Europe, Russia, China and, generally, the entire Asian market.In 2015, Camposol exported 9,800 TM of grapes to 35 countries.
Camposol sold 9,800 TM of grapes during 2015; revenues were USD 16.8 million representing 6.2% of Camposol’s total revenue during 2015.
CAMPOSOLMain
Destinations
Other 17%
France 4%
Netherlands 4%
UK 4%
Spain 8%
Germany 12%
50% USA

3534
Annual Report 2015 CAMPOSOL
ShRiMP inDuStRy:
According to the Food & Agriculture Organization of the United Nations (FAO), world production of shrimp, both captured and farmed, is approximately 8 million MT, while modern world shrimp farming is about 4.5 million MT per year. Shrimp is now one of the most important internationally traded fishery commodity in terms of value, accounting for about 15% of the total value of internationally traded fish products in 2011. In many tropical developing countries like Honduras, Ecuador, and Brazil, it is the most valuable fishery export.
World demand for shrimp peaked in 2011, with the value of global shrimp imports growing 17%, as a result of the economic recovery and a slight decrease in international
4.4 SuMMARy OF thE yEAR
2015 was a challenging year for CAMPOSOL, as well as for the Peruvian agricultural exporting sector in general due to lower volumes as a result of the “El Niño” natural phenomenon.
However, we have been able to keep our leadership in the Peruvian agro-industrial sector and face these situations with fast answers and a clear view of the company strengths, which are focused on fresh and healthy products that, we believe, have the best perspectives in the future. In this sense, in 2015, CAMPOSOL’s total sales amounted to USD 272.9 million (vs. USD 253.5 million in 2014) and EBITDA amounted to USD 42.5 million (vs. USD 34.0 million in 2014). In 2015, profit amounted to USD 12.5 million compared to a loss of USD 34.4 million during the same period last year.
The main reasons for the increased revenues for 2015 were higher volumes of blueberries, shrimp, and other seafood products. Also, the increase in prices of avocados to 1.97 per net KG (1.81 in 2014), mangos to 1.68 per net KG (1.48 in 2014), and blueberries to 10.84 per net KG (10.46 in 2014). This represents up 8.8%, 13.5% and 4%, respectively.
In the future, the Company expects to continue its diversification strategy by increasing the blueberries production in the Fruits & Vegetables (F&V) segment and by increasing the conversion of shrimp ponds in the Seafood segment. The Company also expects to continue to reinforce the Trading segment through more direct sales to retailers, adding value to its clients through commercial, marketing and service initiatives which should result in higher margins.
In line with this strategy, the Company has invested significantly in specializing the company in the F&v segment, diversifying its portfolio of products and customers, as well as increasing its presence in key markets with favorable and encouraging results. In line with this vision, the Company has decided to continue empowering its fresh and frozen business segments, and exit the preserved business. The Company considers these strategic changes in CAMPOSOL’S businesses will allow for greater specialization, efficiency and focus on product categories in which the Company has made significant investments in recent years, and thus maximize opportunities for growth and consolidation of its business.
production that caused a sharp increase in prices. World farmed shrimp production volumes decreased in 2012 and particularly in 2013, mainly because of disease-related problems, such as early mortality syndrome (EMS), in some countries in Asia and Latin America.
The (EMS) is a serious emerging disease of cultured shrimp. The impacts of EMS -include production losses, loss of income and profit for small-scale producers and commercial enterprises, higher shrimp prices owing to supply shortages, and impacts on trade. However, the recovery began in late 2014 and 2015, where production returned to steady levels, and prices descend to the standard of the period 2011 to 2012.
Provide the world healthy high quality food, seaking the welfare of the people and the environment throug innovation, research
and putting special care in all the details of the process.
ViSiOn
MiSSiOn
DRiVERS
VALuES
IN THE FUTURE, THE COMPANY ExPECTS TO CONTINUE ITS DIVERSIFICATION STRATEGY BY INCREASING THE BLUEBERRIES PRODUCTION IN THE FRUITS & VEGETABLES (F&V) SEGMENT AND BY INCREASING THE CONVERSION OF SHRIMP PONDS IN THE SEAFOOD SEGMENT.
Be a world leader in providinghealthy food
to the families of the world.
Profi
tabi
lity
Effic
ienc
y
Qua
lity
Envi
ronm
enta
l &So
cial
Res
pons
ibili
ty
Honesty Respect Austerity Excelence Team Work
Inno
vatio
n
4.3 COMPAny StRAtEGy
In line with the Company’s vision of becoming a global company that provides families all over the world with healthy food, CAMPOSOL´s strategy is supported by the following rationale:

3736
Annual Report 2015 CAMPOSOL
Segment/Crop Has
FRUITS &VEGETABLES
Asparagus 1,262
Avocados 2,655
Mangos 450
Grapes 326
Tangerines 145
Blueberries 1,050
TOTAL 5,887
SEAFOOD
Shrimp 724
4.5 OPERAtiOnS
As of December 2015, operations were located mainly in the regions of La Libertad, Piura and Tumbes with 26,489 own Has: 24,35o Has for fruits & vegetables, and 2,139 Has for seafood. The Company had a total of 5,888 productive Has in La Libertad and Piura regions as of December 31, 2015, where asparagus, avocados, mangos, grapes, tangerines and blueberries are harvested. It also had 724 productive Has in Tumbes where it produces shrimps.
During 2015, the Company invested USD 28.6 million (USD 63.3 million in 2014), of which USD 10.9 million were invested in additional planting and blueberries fields maintenance, USD 1.5 million in planting of grapes, USD 0.5 million in planting of tangerines, USD 7.7 million were invested in equipment and infrastructure (USD 5.4 million in the plant and USD 2.3 million in farms),USD 8.0 million were invested in its shrimp and other seafood products business (USD 5.2 million in intensive planting and other minor investments and USD 2.8 million in purchase of land).
Location Own Rented
FRUITS &VEGETABLES
Trujillo Planta Chao
Piura NorAgro SAVSA
Piura Empafrut
Piura Don Packing
Huaral Torre Blanca
Chincha Emapac
SEAFOOD
Tumbes San Isidro
Tumbes La Cruz
Tumbes Cofresac
Paita ABC
Chimbote Centinela
PROCESSING PLANTSPRODUCTIVE HAS AS OF DECEMBER 31ST 2015 4.6 WORkinG EnViROnMEnt
CAMPOSOL is the third largest private employer of Peru reaching over 15,000 workers during peak production seasons. As an active member of the Global Compact of the United Nations, it acts by the highest ethical principles, aiming to be an example of compliance with labor and social standards, both local and internationally, with a clear orientation to promote the wellbeing of all of our employees.
Thus, CAMPOSOL provides equal opportunities and working conditions for all employees, regardless of race, color, gender, religion, sexual or political orientation in all of its operations.During the last three years, CAMPOSOL has had a remarkable growth in its level of employees, from 10,000 to over 15,000 workers during peak seasons. We expect to continue growing the number of employees, based on the Company’s growth strategy in new products, like blueberries and tangerines, and the consolidation of our frozen business, among others.
During 2015, we have strengthened our employer brand in our areas of influence to attract workers we require for our operations, based on fair treatment, safe working environment, competitive salaries and training opportunities. Also, CAMPOSOL has continued with its efforts to develop strategic skills for our workers to train and guide them through their personal growth, with the support of a continuous process of acquisition, strengthening and transformation of individual expertise and commitment to corporate motivation.
In this sense, more than 3,750 training programs were held during 2015, covering several matters as quality, safety, hygiene, environmental care, sexual harassment prevention, as well technical courses for sanitization, irrigation, fertilization, pest control, maintenance, production improvement, and executive programs developing leadership and management skills.

3938
Annual Report 2015 CAMPOSOL
Safety and health at workCAMPOSOL provides a safe, hygienic and healthy workplace and takes the necessary measures to prevent accidents and injuries that may arise, be related to or take place during work or as a result of the Company´s operations. CAMPOSOL has systems to detect, avoid or respond to possible risks to the safety and health of its employees. Employees could refuse to conduct any unsafe work or any work that risks their life.
Freedom of association and collective bargainingCAMPOSOL respects the decisions of its employees and the right of association and collective bargaining. The Company does not interfere in any way in the establishment, operation or administration of such organizations of employees, neither in the collective bargaining activities.
Prohibition of child laborCAMPOSOL forbids child labor. Employees must be at least 18 years old when hired. Child labor refers to any mental, physical, social or morally dangerous or harmful activity for children or any activity that directly interferes in their compulsory education needs defined as such by the equal authority as well as the highest international standards.
Prohibition of deprivation of freedom and forced laborCAMPOSOL forbids any enslaving servitude or any form of forced labor. CAMPOSOL shall neither require any deposits nor withhold original ID documents as a work condition. Likewise, the Company shall not subcontract suppliers or production facilities that force work to be conducted by employees under any exploitation or forced labor.
In particular, the CAMPOSOL’S 2015 Training Program completed more than 210,000 training hours, 95% delivered to field or plant workers and 5% of professionals and executives, resulting in 127 workers with job skills certifications. Also, 182 employees attended the Management and Leadership Development Program, and more than 500 employees benefited from discount agreements to study various management, technical and updated programs in Universities and Technical Schools.
Similarly, CAMPOSOL has implemented programs that will foster the potential of its employees in order to assure their adequacy with the required job profile, while developing the skills needed for certification programs regarding various tasks performed by the Company, such as HACCP, Tesco Nurture, Kosher, BASC, IPM, Global Compact, BRC, IFS, USGMP, NSF Cook and Thurber, Global Gap, USGAP, BSCI and Code of Conduct Audits.It is worth mentioning that during 2015, there were none labor disruptions nor strikes or workdays lost. The Company was able to handle good relationships with its Labor Unions, using improved communication with union leaders and workers. CAMPOSOL’S collective bargaining conducted in 2015 achieved labor agreements with its three labor unions for a three years labor peace.
On the other hand, during 2015, CAMPOSOL reviewed with Hay Group its salary structure aimed to internal equity and competitiveness among agribusiness companies. Also, CAMPOSOL joined the “Agribusiness Club” promoted by Hay Group for wages and benefits researches and analysis for the agro-exporting industry.
Additionally, CAMPOSOL offers services and benefits to its employees such as personal loans for health or housing, financial benefits for the schooling of their children, as well as counseling and economic benefits to support a death in their families, amongst others. In the same manner, the Company pays close attention to its employees’ family health, or work problems, which are attended by skilled personnel. Also, the Social Welfare area coordinates various integration, wellness, sports and recognition activities during the year, as well as celebrations such as Labor Day, Mother’s and Father’s Day, Christmas, etc. CAMPOSOL strongly encourages sports activities, by always providing the time and infrastructure to perform them.
As an example, CAMPOSOL’s internal “Olympic Games,” which includes a diverse range of sports, have a significant participation and are very enthusiastic and competitive.
4.7 CODE OF EthiCS & COnDuCt
During 2015 CAMPOSOL formally issued its Code of Ethics and Conduct to strengthen ethical behavior at all levels of the Company and improve the control environment, thus making it a more stable and prosperous organization. In this sense, the Code of Ethics and Conduct CAMPOSOL describes the way we work and behave with each of the stakeholders with whom we interact. Its content is a reflection of our values and summarizes the fundamental beliefs of CAMPOSOL. During 2015, the company has been conducting a comprehensive training program by which a deployment is assured to all staff.
Additionally, the Company has various mechanisms for detecting potential irregular situations related to deviations to the Code of Ethics and internal regulations of CAMPOSOL, including reviews of Internal Audit and External Audit, management oversight and our Confidential Reporting System, or “Ethics Line.”
This system was developed in 2014 and is administered by a third party -in this case, the firm Ernst & Young- to ensure the anonymity of all allegations. Through this channel, all complaints are reviewed and have an attention mechanism that ensures strict confidentiality on the identity of the person who reports a complaint, providing a workplace free of retaliation of any kind, seeking to ensure that investigations are objective and receive the same treatment of confidentiality.
According to our social responsibility policy, which is aligned with international standards such as ISO2600, SA 8000 and BSCI, among other, CAMPOSOL acts according to the following ethical criteria:

4140
Annual Report 2015 CAMPOSOL
non-Discrimination CAMPOSOL forbids discrimination practices in contracting personnel and in their professional behavior due to race, color, religion, sex, age, physical capacities, nationality or any other legally prohibited condition.
Disciplinary measuresCAMPOSOL must treat all its employees with dignity and respect. The use of corporal punishments, psychological punishments, confinement, violent threatening, or any other form of harassment or abuse as a method of discipline and control is neither practiced nor tolerated.
Work scheduleCAMPOSOL is responsible for guaranteeing its employees to work according to the applicable laws and labor standards regarding the number of working hours and days. If there is any conflict between a statute and a mandatory industrial standard, CAMPOSOL must solve this situation according to what is established regarding which standard provides a larger benefit for the employee. Personnel must have at least one day off after a consecutive period of six working days.
SalaryCAMPOSOL must provide its employees with salaries and benefits that comply with the applicable laws and corresponding collective agreements, including those referring to the payment of overtime and other extra pay agreements.
SustainabilityCAMPOSOL develops an integral Social Responsibility Policy having as a priority: its employees and the communities, the proper use of its resources in all its operations and especially emphasizing the use of water and energy.
EnvironmentCAMPOSOL conducts its operations under the applicable norms and its environmental commitments that include monitoring of emissions, management of sewage waters, environmental noise, and solid waste, among other; this allows us to mitigate its significant environmental impacts and helps to improve its environmental performance continually.
4.8 SOCiAL RESPOnSibiLity
CAMPOSOL believes that to guarantee the sustainability of its business; it is essential to ensure that it operates in full compliance with ethical principles, respecting people and the environment. This guarantee is achieved by acting by the social responsibility policy of our organization and in line with the principles and objectives of the UN World Global Compact, of which we are an active member since 2008.
As a result, the Company contemplates in all its decisions the triple result: economic, social and environmental and is transparent when sharing its results in these aspects. In this sense, CAMPOSOL was the first agro-industrial company to publish annual sustainability reports aligned with the GRI indicators, which are available on our web page: www.camposol.com.pe. The aim of this report is to reflect in a transparent and systematic way the main indicators that show the environmental and social performance of the Company, as well as the programs and activities carried out regarding social responsibility each year.
Also, the Company tries hard to communicate and put into practice social responsibility principles and values in all the processes, operations and areas of the Company transversally and makes efforts to attend to the contributions and comments of its stakeholders, which leads the Company to regularly carry out investigative studies on the attitudes and perceptions of these groups, in order to understand
CAMPOSOL DEVELOPS AN INTEGRAL SOCIAL RESPONSIBILITY POLICY HAVING AS PRIORITY: ITS EMPLOYEES AND THE COMMUNITIES, THE PROPER USE OF ITS RESOURCES IN ALL ITS OPERATIONS AND ESPECIALLY EMPHASIzING IN THE USE OF WATER AND ENERGY.
their opinions and points of view with regard to our performance, and to permit us to take the adequate measures to correct if necessary.
We invite you to share our sustainability reports with us at:
http://www.CAMPOSOL.com.pe/espanol/en_investors_sustainability_reports

4342
Annual Report 2015 CAMPOSOL
4.9 RESEARCh, DEVELOPMEnt AnD innOVAtiOn
CAMPOSOL believes that innovation is a key aspect to boost competitiveness and growth in the mid and long term. We do so through policies, projects, investigations, market research, and analysis of potential new products and development of new technology. The focus is on products that could benefit from the Peruvian climatic advantages and also help diversify its portfolio of products and clients.
The Research, Development, and Innovation area also seeks to find innovative solutions to extend the shelf life of fresh produce and reduce production costs and research for new alternatives for pest control and new food presentations. CAMPOSOL is proud to say that, during 2015, the company started a large scale production of blueberries which began as an R&D project back in 2008.
It is also worth noting that CAMPOSOL has been successfully executing funded projects by Innovate Peru, as well as FINCyT, Government institutions aimed to promote innovation, which results are used for other potential beneficiaries. CAMPOSOL is also performing a sustainable management system through insect biological control agents – pests-, and it counts, since 2006, with a laboratory of “Beneficial Insects and Entomopathogenic Growing.”
CAMPOSOL’ s investigation lines are mainly focused on: • Production improvement.• Pest control and diseases.• New agricultural growing, products or packing developments.• Molecular biotechnology.• Research and Development Laboratory.
4.10 SuPPLy ChAin
CAMPOSOL shall guarantee its suppliers to be informed of CAMPOSOL’S Code of Ethics & Conduct, its terms and conditions, its meaning and what its implementation implies.
4.11 FinAnCiAL RESuLtS
In 2015, CAMPOSOL’s total sales amounted to USD 272.9 million (USD 253.5 million in 2014). The main reasons for the increased revenues for the full year 2015 were higher volumes of blueberries, shrimp and other seafood products, and the increase prices of avocados to 1.97 per net KG (1.81 in 2014), mangos to 1.68 per net KG (1.48 in 2014) and blueberries to 10.84 per net KG (10.46 in 2014). This represent up 8.8%, 13.5% and 4%.
Total Cost of Goods Sold was USD 193.2 million (USD 171.3 million in 2014), representing around 62.8% of total sales (67.6% in 2014).
Gross profit decreased to USD 79.5 million (USD 82.2 million in 2014), which resulted in a gross margin of 29.1% compared to 32.4% in 2014. The main reasons for the decreased gross profit and margin were the higher cost of productions relation to grapes and shrimp.Administrative expenses decreased from USD 28.7 million in 2014 to USD 24.9 million in 2015. The variation of USD 3.8 million is explained mainly by lower professional fees, travel and representation expenses.
Selling expenses decreased from USD 37.6 million in 2014 to USD 30.3 million in 2015 due to changes in commercial conditions of sale (change of FOB to CFR / CIF terms) applied to higher volumes sold. This decrease was primarily as a result of a USD 3.5 million decrease in 2015 selling expenses from freight and customs duties, a USD1.3 million decrease in 2015 selling expenses from representation expenses, USD 2.1 million no provision for amortization of intangible management portfolio, which occurred in 2014.
In 2015, financial costs amounted to USD 25.0 million (USD 22.8 million in 2014). Such increase is mainly explained by the interest incurred from the additional USD 75 million,
9,875% senior unsecured noted issued during the second quarter of 2014.
In 2015, profit amounted to USD 12.5 million compared to a loss of USD 34.4 million during the same period last year.
EBITDA amounts to USD 42.5 million (USD 34.0 million in 2014).
During 2015, non-current assets increased to USD 497.6 million compared to USD 452.9 million at the end of 2014. Such increase as a consequence of calculating fair value biological assets IAS 41.
Total inventories decreased from USD 95.2 million at December 31st, 2014, to USD 47.1 million by the end of the fourth quarter of 2015. The variation of USD 48.1 million is explained mainly by the decrease of finished product such as artichokes, asparagus, and peppers.
Trade accounts receivable decreased from USD 46.0 million at the end of 2014 to USD 40.7 million at the end of 2015, explained by higher collections to clients.As of December 31st, 2015, trade accounts payables decreased to USD 34.4 million at the end of 2015 from USD 48.3 million at the end of 2014. Such decrease is due primarily contracted payments to the supplier.
As a result, the total working capital (accounts receivable + inventories - accounts payable) decreased to USD 53.4 million at the end of 2015 from USD 92.9 million at the end of 2014. Current working capital as of December 31st, 2015 is 19.8% of sales (34.7%). Such significant reduction is the result of the company´s effort to improve working capital needs
Total liabilities decreased to USD 347.0 million in 2015 compared to USD 377.7 million at the end of 2015.
The Company’s debt, gross of capitalized fees, decreased from USD 277.4 million at the end of 2014 to USD 250.9 million at the end of 2015, mainly due to the paid off interest of senior unsecured notes and bank loans. The Company’s debt includes USD 200.0 million of senior unsecured notes at 9.875%, bond interest for paid USD 6.7 million (USD
THE RESEARCH, DEVELOPMENT AND INNOVATION AREA ALSO SEEKS TO FIND INNOVATIVE SOLUTIONS TO ExTEND THE SHELF LIFE OF FRESH PRODUCE AND REDUCE PRODUCTION COSTS AND RESEARCHES FOR NEW ALTERNATIVES FOR PEST CONTROL AND NEW FOOD PRESENTATIONS.

4544
Annual Report 2015 CAMPOSOL
5.6 million in 2014), USD 36.1 million of working capital financing (59.6), USD 7.3 million in leasing and other (10.5) and USD 0.8 million to sellers of acquired companies (1.7).
During 2015, the Company generated USD 33.6 million (used -30.8 million in 2014) in operations and invested USD -9.8 million (-62.3 million in 2014) in financing activities, the Company paid USD -27.6 million (USD 96.4 million in 2014), resulting in a net decrease in cash of USD -3.9 million (increase of 3.3 million in 2014). The Company ended the year with USD 26.7 million in cash (USD 30.5 million in 2014).
4.12 ALLOCAtiOn OF nEt inCOME
The Board of Directors has proposed that the net loss of CAMPOSOL is attributable to retained result. The proposal reflects display the current accumulated profit or loss.
4.13 intERnAL AuDit AnD intERnAL COntROL
The Company’s Internal Audit Management (“IA”) reports to the Board of Directors’ Audit Committee. Its mission is to evaluate the Company’s internal control system, by assisting to identify and minimize risks to achieve the Company’s main objectives and comply with its policies.
Internal Audit is entrusted with risk identification and assessment, mitigation controls and required action plans to prevent risk occurrence or repetition, identification and evaluation of actions and events to optimize existing policies. The Company intends to maintain the Internal Audit function separate from the Compliance and Legal functions and is progressing towards enhancing the Compliance function with the assistance of specialized external counsel.
At present, the internal control process applied by Internal Audit consists primarily of the following stages: (i) identify the initial or inherent risk; (ii) categorize the risk; (iii) identify mitigation control measures; (iv) test and results of the control; (iv) categorize the control; and (v) determine the residual risk. An action plan is defined and further revised as needed, and its results allow the Company to categorize and control risks.
To optimize the Company’s goal to develop a comprehensive Strategic Risk Plan, the Company has recently retained an external consultant to assist in this effort.
Internal Audit prepared an Annual Plan on Base: previous internal audit reports in coordination with Ernst & Young (IA outsourcing 2013-2015), Contingencies (legal, tax, administrative, labor) with external and internal lawyers, Price Waterhouse Cooper audited financial statements, as well as CAPEx & OPEx budgets with the CFO and the Chief of budget.
4.14 FinAnCiAL CALEnDAR 2016
05.02.2016 Results presentation Q4 2015 17.06.2016 Results presentation Q1 2016 18.08.2016 Results presentation Q2 2016 28.10.2016 Results presentation Q3 2016
4.15 FutuRE PROSPECtS The Company is focused on adding value to its clients through commercial, marketing and service initiatives, which should result in higher margins. Additionally, CAMPOSOL is analyzing new opportunities to consolidate its leadership through the additional planting of current crops, planting of new crops, strategic alliances, acquisitions, and divestitures.
CAMPOSOL will continue positioning itself in the US market, the largest market for avocados and blueberries in the world, and in other markets with high growth potentials like Europe and Asia. Our investments in blueberries, carried out in 2014, have not yet reached full maturity, so we expect further growth to come from this crop in the next few years.
4.16 ExtERnAL AuDitORS
The auditors, PricewaterhouseCoopers Limited (PwC) have expressed their willingness to continue in office.
4.17 CORPORAtE GOVERnAnCE
CAMPOSOL is committed to the practice of sound corporate governance, which strengthens the confidence in the Company and contributes, as a result, to the best possible value for the shareholders, the employees, and other stakeholders. The objective of corporate governance is to regulate the division of roles between shareholders, the Board, and management in a more comprehensive way compared to what is required by current legislation.
CAMPOSOL IS COMMITTED TO THE PRACTICE OF SOUND CORPORATE GOVERNANCE, WHICH STRENGTHENS THE CONFIDENCE IN THE COMPANY AND CONTRIBUTES, AS A RESULT, TO THE BEST POSSIBLE VALUE FOR THE SHAREHOLDERS, THE EMPLOYEES, AND OTHER STAKEHOLDERS.

4746
Annual Report 2015 CAMPOSOL
A combination of strong fundamentals, solid strategy, management capacity and corporate governance place in a unique position in the competitive landscape.
a) Strategic Location: The Peruvian Climatic Advantage. Due to its location in the Peruvian coastal desert plains, the crops are exposed to reduced variations of temperatures throughout the year, which supports higher yields.Also, the Company can commercialize its products in windows in which there are lower volumes from traditional producer countries (counter-cycle).
b) Vertical integration: CAMPOSOL is present in the entire value chain and has the flexibility to commercialize its products fresh, preserved or frozen.
c) Diversified Product Portfolio: CAMPOSOL produces five of the most important nontraditional export produce.
d) Global reach with World Class Customers: Products are sold by the leading retailers in Europe and USA. Low client concentration risk.
e) Future Strong Growth without additional planting investments: Only 32% of our avocados has are fully matured and thus generating the optimum yields. They will all reach maturity within the next three years.The US, which is the largest market for avocados, was fully open for Peruvian products in 2011 as the cold treatment was no longer required. Strong competitive position versus local peers due to its scale.
05key investment Considerations
A COMBINATION OF STRONG FUNDAMENTALS, SOLID STRATEGY, MANAGEMENT CAPACITY AND CORPORATE GOVERNANCE PLACE IN A UNIqUE POSITION IN THE COMPETITIVE LANDSCAPE.
A COMBINATION OF STRONG FUNDAMENTALS, SOLID STRATEGY, MANAGEMENT CAPACITY AND CORPORATE GOVERNANCE PLACE IN A UNIqUE POSITION IN THE COMPETITIVE LANDSCAPE.

Annual Report 2015 CAMPOSOLAnnual Report 2015
CAMPOSOL
4948
06independent Auditor’s Report And Audited Financial Statements
CAMPOSOL hOLDinG LiMitED AnD SubSiDiARiES
CONSOLIDATED FINANCIAL STATEMENTS 31 DECEMBER 2015 AND 2014 TOGETHER WITH THE REPORT OF THE INDEPENDENT AUDITORS
CONTENTS Pages
General information 50
Board of directors’ report 51 - 55
Independent auditors’ report 56 - 57
Consolidated statement of financial position 58 - 59
Consolidated statement of comprehensive income 60 - 61
Consolidated statement of changes in equity 62 - 63
Consolidated statement of cash flows 64 - 65
Notes to the consolidated financial statements 66 - 150
USD = United States dollar PEN = Sol € = Euros NOK = Norwegian Krone

Annual Report 2015 CAMPOSOLAnnual Report 2015
CAMPOSOLCONSOLIDATED FINANCIAL STATEMENTS 31 DECEMBER 2015 AND 2014
5150
GEnERAL inFORMAtiOn
DirectorsSamuel Barnaby Dyer Coriat - ChairmanPiero Martin Dyer Coriat (appointed 5 November 2015)Samuel Edward Dyer Ampudia (appointed 15 january 2008 and resigned 5 November 2015) Rosa Amelia Coriat Valera (appointed 15 May 2014 and resigned 5 November 2015) Maria Susana Elespuru Guerrero Carmen Rosa Graham Ayllon Mariano Felipe Paz Soldan Franco (appointed 15 May 2014 and resigned 7 july 2015) William Paul Dyer Osorio (appointed 23 july 2015)Sheyla Dyer Coriat (appointed 5 November 2015)Raul Ubaldo Fernandez (appointed 6 November 2015)
Company SecretaryAltruco Secretarial LimitedKanika International Business Center, 6th Floor,Profiti Ilia No 4 Germasogeia, Limassol 4046,Cyprus
Registered officeKanika International Business Center, 6th Floor,Profiti Ilia No 4 Germasogeia, Limassol 4046,Cyprus
independent auditorsPricewaterhouseCoopers LimitedCyprus
bOARD OF DiRECtORS’ REPORt(IN THOUSANDS OF U.S. DOLLARS UNLESS OTHERWISE STATED)
The Board of Directors presents its report together with the audited consolidated financial statements of Camposol Holding Limited (the “Company”) and its subsidiaries (collectively referred to as the “Group”) for the year ended 31 December 2015.
Principal activities
Camposol Holding Limited is the holding company of the Camposol Group (hereinafter the “Group”). During the year 2015 the Group continued its agricultural activities consolidating its position as a key player in the fruits, vegetables and shrimps industry.
Financial results
The Group’s results for the year are set out on page 9. The Board of Directors does not recommend the payment of dividends, and the profit for the year is retained.
In 2015, adjusted EBITDA was USD42,476, 24.8% more than during 2014 (USD34,038), which is primarily due to higher volumes of blueberries, tangerines, shrimp and other seafood products, as well as increasing prices of blueberries, and a decrease in selling and administrative expenses. Adjusted EBITDA margin increased to 15.6% in 2015 from 13.4% in 2014. Adjusted EBITDA represents sales minus cost of sales minus administrative expenses minus selling expenses plus depreciation plus amortization of intangibles plus non-cash costs included in cost of sales, and excluding the effect (positive or negative) of net change in fair value of biological assets. EBITDA for 2014 was adjusted by considering the discontinued operations.
Review of developments, position and performance of the Group’s business and its position
The profit of the Group for the year ended 31 December 2015 was USD17,418 (2014: loss of USD33,644). Turnover in 2015 increased to USD272,692, compared to sales for 2014 of USD253,456. On 31 December 2015 the total assets of the Group were USD657,665 (2014: USD676,070) and the net assets were USD310,713 (2014: net assets USD298,362). The financial position, development and performance of the Group as presented by Management in these consolidated financial statements; adequately reflect the business results of the year.
Future developments
The Group sets as its strategic priorities for the years 2016, 2017 and 2018 the maintenance of its position as a global leader in the avocados markets and the diversification in new products to satisfy demand of products. These are key factors in the development strategy to ensure the future growth of the group.

Annual Report 2015 CAMPOSOLAnnual Report 2015
CAMPOSOLCONSOLIDATED FINANCIAL STATEMENTS 31 DECEMBER 2015 AND 2014
5352
In line with this vision, the Group decided to continue enhance their business of fresh and frozen products, and stop producing preserved products. These strategic changes in the Group’s business will allow greater specialization, efficiency and focus on product categories in which the Group has invested and thereby maximize opportunities for growth and consolidation of their business.
In this regard, the Group has signed an agreement with Sociedad Agricola Viru, for transfer the plant of preserved line for the processing of fruits and vegetables. Following this, the artichoke segment is discontinued.
The Group has sales offices in North America (Fort Laurderdale) and Europe (Rotterdam) in order to position themselves as leaders in the areas of avocados and blueberries.
The Group also expects to continue its diversification strategy by increasing the production capacity of blueberry and shrimp and other minor related products.
Risk management
In line with any other agricultural businesses the Group is exposed to risks, the most significant of which are natural phenomena such as the hot and cold ocean currents of “El Niño” and “La Niña” which impact agricultural production, adverse movements in the market prices for fruit and vegetables, interest rate risk and liquidity risk. (Note 3.1).
The Group monitors and manages these risks through various control mechanisms. Detailed information relating to risk management is set out in Notes 3, 4 and 35 to the financial statements.
branches
The Group did not operate through any branches during the year.
Share capital
There were no changes in the share capital in 2015 and 2014.
Directors
The Directors of the Company at the date of this report are as shown on page 1.
Directors who served during the year and up to the date of this report, except for Mariano Felipe Paz Soldan Franco, Samuel Edward Dyer Ampudia and Rosa Amelia Coriat valera are the following:
Appointed Resigned
Samuel Barnaby Dyer Coriat 15 january 2008 - Piero Martin Dyer Coriat 5 November 2015 - Samuel Edward Dyer Ampudia 15 january 2008 5 November 2015Rosa Amelia Coriat Valera 15 May 2014 5 November 2015Maria Susana Elespuru Guerrero 15 May 2014 - Carmen Rosa Graham Ayllon 15 May 2014 - Mariano Felipe Paz Soldan Franco 15 May 2014 7 july 2015William Paul Dyer Osorio 23 july 2015 - Sheyla Dyer Coriat 5 November 2015 - Raul Ubaldo Fernandez 6 November 2015 -
All of the Directors, except Mariano Felipe Paz Soldan Franco, Samuel Edward Dyer Ampudia and Rosa Amelia Coriat Valera shall hold office until the next Annual General Meeting and are eligible for re-appointment by the shareholders.
As of November 6th 2015, the Board of Camposol Holding Limited is composed by the following members: Samuel Barnaby Dyer Coriat as Executive Chairman, Piero Martin Dyer Coriat as Deputy Chairman, Maria Susana Elespuru Guerrero, Carmen Rosa Graham Ayllon, William Paul Dyer Osorio, Sheyla Dyer Coriat and Raul Ubaldo Fernandez as members. The Board of Camposol Holding Ltd has four committees: (1) Audit, internal control and risks committee: The members of this committee are Maria Susana Elespuru Guerrero as President, Piero Martin Dyer Coriat and William Paul Dyer Osorio; (2) Strategy committee: The members of this committee are Samuel Barnaby Dyer Coriat as President, Piero Martin Dyer Coriat and Raul Ubaldo Fernandez; (3) Corporate governance, compensation and social responsibility: The members of this committee are Carmen Rosa Graham Ayllon as President, Sheyla Dyer Coriat and William Paul Dyer Osorio; (4) Executive: The members of this committee are Samuel Barnaby Dyer Coriat, Carmen Rosa Graham Ayllon and Maria Susana Elespuru Guerrero.
The changes in the remuneration of the Board of Directors are disclosed in Note 36.
bonds
On 26 january 2012, Camposol S.A., Camposol Holding Limited’s subsidiary, successfully issued a USD125,000 9.875% senior unsecured notes due in 2017, which will be guaranteed by Camposol Holding Limited as parent guarantor and Marinazul S.A. and Campoinca S.A. as subsidiary guarantors.
Settlement of the bond issue occurred on 2 February 2012. The net proceeds from the bond issue were used to repay long term debt, to finance capital expenditures and for general corporate purposes.

Annual Report 2015 CAMPOSOLAnnual Report 2015
CAMPOSOLCONSOLIDATED FINANCIAL STATEMENTS 31 DECEMBER 2015 AND 2014
5554
With this transaction, the Company extended the maturity of its long term debt to 5 years under much more flexible conditions than the previous long-term debt facility, which allowed it to better face its strategic challenges in the next years.
On 30 April 2014, Camposol S.A., Camposol Holding Limited’s subsidiary, successfully reopened its 9.875% USD125 million senior Notes due 2017 raising gross proceeds of USD75 million, which will be guaranteed by Camposol Holding Limited as parent guarantor and Marinazul S.A. and Campoinca S.A. as subsidiary guarantors. The net proceeds from the bond issue were used for capital expenditures, mainly for the expansion of the blueberries’ and shrimps’ businesses.
The Notes were issued as additional notes and form a single issue with the USD125 million 9.875% Notes due 2017 issued on February 2, 2012. The total aggregate principal amount of the 9.875% Notes due 2017 outstanding following this reopening is USD200 million.
Events after the balance sheet date
On 17 December, 2015, Camposol S.A. concludes a contract of sale in which transfers ownership of its processing line of preserved asparagus to Sociedad Agricola Viru S.A.C., which will be effective on january 2016.
The Group is expecting to acquire 100% of the shares of Congelados y Frescos S.A.C. (Cofresac), by exchange of stock of Agroindustrias Santa Angela S.A.C., through its subsidiary Marinazul S.A., which will be effective in the first semester of 2016. Cofresac has, processing assets of seafood products located in Tumbes – Peru and cultivated ponds. The Group expect to increase the capacity to process seafood products with this acquisition.
On 4 March 2016, 521,376 Ordinary shares of nominal value of EURO 0,01 each were allotted and issued out of the authorized but unissued share capital of the Company as follows:
• 430,621 ordinary shares of nominal value EURO 0,01 each at a premium of EURO 3,679,608.15 to Generación del Pacífico Grupo SL;
• 47,300 ordinary shares of nominal value EURO 0,01 each at a premium of EURO 404,170.18 to Osterlin Luis Dyer Ampudia;
• 11,738 ordinary shares of nominal value EURO 0,01 each at a premium of EURO 100,298.32 to William P. Dyer Osorio;• 15,179 ordinary shares of nominal value EURO 0,01 each at a premium of EURO 129,703.70 to Sergio Dyer Osorio;• 10,356 ordinary shares of nominal value EURO 0,01 each at a premium of EURO 88,486.98 to Yazmin Dyer Osorio;• 6,182 ordinary shares of nominal value EURO 0,01 each at a premium of EURO 52,822.21 to Rodrigo Dyer Fernandez.
Additional details are disclosed in Note 39.
No other material events occurred after the end of the financial year.
independent auditors
PricewaterhouseCoopers Limited has expressed their willingness to continue in office. A resolution giving authority to the Board of Directors to fix their remuneration will be proposed at the Annual General Meeting.
By order of the Board
Samuel Barnaby Dyer Coriat - Chairman
Piero Martin Dyer Coriat - Director
Cyprus5 April 2016

Annual Report 2015 CAMPOSOLAnnual Report 2015
CAMPOSOLCONSOLIDATED FINANCIAL STATEMENTS 31 DECEMBER 2015 AND 2014
5756
inDEPEnDEnt AuDitOR’S REPORttO thE MEMbERS OF CAMPOSOL hOLDinG LiMitED
Report on the consolidated financial statements
We have audited the accompanying consolidated financial statements of Camposol Holding Limited (the “Company”) and its subsidiaries (together with the Company, “the Group”), which comprise the consolidated balance sheet as at 31 December 2015, and the consolidated statements of comprehensive income, changes in equity and cash flows for the year then ended, and a summary of significant accounting policies and other explanatory information.
Board of Directors’ responsibility for the consolidated financial statements
The Board of Directors is responsible for the preparation of consolidated financial statements that give a true and fair view in accordance with International Financial Reporting Standards as adopted by the European Union and the requirements of the Cyprus Companies Law, Cap. 113, and for such internal control as the Board of Directors determines is necessary to enable the preparation of consolidated financial statements that are free from material misstatement, whether due to fraud or error.
Auditor’s responsibility
Our responsibility is to express an opinion on these consolidated financial statements based on our audit. We conducted our audit in accordance with International Standards on Auditing. Those Standards require that we comply with ethical requirements and plan and perform the audit to obtain reasonable assurance about whether the consolidated financial statements are free from material misstatement.
An audit involves performing procedures to obtain audit evidence about the amounts and disclosures in the consolidated financial statements. The procedures selected depend on the auditor ’s judgment, including the assessment of the risks of material misstatement of the consolidated financial statements, whether due to fraud or error. In making those risk assessments, the auditor considers internal control relevant to the entity’s preparation of consolidated financial statements that give a true and fair view in order to design audit procedures that are appropriate in the circumstances, but not for the purpose of expressing an opinion on the effectiveness of the entity’s internal control. An audit also includes evaluating the appropriateness of accounting policies used and the reasonableness of accounting estimates made by the Board of Directors, as well as evaluating the overall presentation of the consolidated financial statements.
We believe that the audit evidence we have obtained is sufficient and appropriate to provide a basis for our audit opinion.
Opinion
In our opinion, the consolidated financial statements give a true and fair view of the financial position of the Group as at 31 December 2015, and of its financial performance and its cash flows for the year then ended in accordance with International
Financial Reporting Standards as adopted by the European Union and the requirements of the Cyprus Companies Law, Cap. 113.
Report on other legal requirements
Pursuant to the additional requirements of the Auditors and Statutory Audits of Annual and Consolidated Accounts Laws of 2009 and 2013, we report the following:
• We have obtained all the information and explanations we considered necessary for the purposes of our audit.
• In our opinion, proper books of account have been kept by the Group, so far as appears from our examination of these books.
• The consolidated financial statements are in agreement with the books of account.
• In our opinion and to the best of our information and according to the explanations given to us, the consolidated financial statements give the information required by the Cyprus Companies Law, Cap. 113, in the manner so required.
• In our opinion, the information given in the report of the Board of Directors is consistent with the consolidated financial statements.
Other matter
This report, including the opinion, has been prepared for and only for the Company’s members as a body in accordance with Section 34 of the Auditors and Statutory Audits of Annual and Consolidated Accounts Laws of 2009 and 2013 and for no other purpose. We do not, in giving this opinion, accept or assume responsibility for any other purpose or to any other person to whose knowledge this report may come to.
Constantinos TaliotisCertified Public Accountant and Registered Auditorfor and on behalf of
PricewaterhouseCoopers LimitedCertified Public Accountants and Registered Auditors
Nicosia, 5 April 2016

Annual Report 2015 CAMPOSOLAnnual Report 2015
CAMPOSOLCONSOLIDATED FINANCIAL STATEMENTS 31 DECEMBER 2015 AND 2014
5958
At 31 December note 2015 2014 ASSEtS nOn-CuRREnt ASSEtS Property, plant and equipment 6 176,905 194,102 Investment in associate 7 2,036 1,782 Intangible assets 8 13,717 16,584 Non-current portion of biological assets 9 300,783 237,725 Deferred income tax 4,131 2,667 Total non-current assets 497,572 452,860 CuRREnt ASSEtS Prepaid expenses 970 1,142 Current portion of biological assets 9 14,211 19,227 Inventories 12 47,102 95,236 Other accounts receivable 13 14,115 15,657 Income tax credit 7,281 7,949 Trade accounts receivable 14 40,709 45,994 Cash subject to restriction 15 - 7,500 Cash and cash equivalents 15 26,647 30,505 151,035 223,210 Assets classified as held for sale 37 9,058 - Total current assets 160,093 223,210 total assets 657,665 676,070 Equity attributable to shareholders of the parent Share capital 16 507 507 Share premium 16 212,318 212,318 Other reserves 16 825 825 Retained earnings 89,222 76,570 302,872 290,220 Non-controlling interest 7,841 8,142 total equity 310,713 298,362
LiAbiLitiES nOn-CuRREnt LiAbiLitiES Long - term debt 19 204,851 206,117 Deferred income tax 46,201 35,139 Provisions 22 4,930 4,833 Total non-current liabilities 255,982 246,089 CuRREnt LiAbiLitiES Current portion of long-term debt 19 9,924 11,682 Trade accounts payable 20 34,355 48,315 Other accounts payable 21 5,223 6,637 Income tax payable 1,420 1,948 Provisions 22 3,928 3,434 Bank loans 23 36,120 59,603 Total current liabilities 90,970 131,619 Total liabilities 346,952 377,708 Total equity and liabilities 657,665 676,070
Approved for issue and signed on behalf of the Board of Directors of Camposol Holding Limited on 5 April 2016.
Directors
Samuel Barnaby Dyer Coriat - Chairman
Piero Martin Dyer Coriat - Director
The notes on pages 67 to 150 are an integral part of these consolidated financial statements.
CAMPOSOL hOLDinG LiMitED AnD SubSiDiARiESCOnSOLiDAtED StAtEMEnt OF FinAnCiAL POSitiOn(IN THOUSANDS OF U.S. DOLLARS)

Annual Report 2015 CAMPOSOLAnnual Report 2015
CAMPOSOLCONSOLIDATED FINANCIAL STATEMENTS 31 DECEMBER 2015 AND 2014
6160
For the year ended 31 December note 2015 2014 Continuing operations Revenue 25 272,692 253,456 Cost of sales 26 ( 193,203) ( 171,300)Gross profit 79,489 82,156 Net gain (loss) arising from changes in fair value of biological assets 9 39,634 ( 46,807)Gross profit after adjustment for biological assets 119,123 35,349 Selling expenses 27 ( 30,319) ( 37,562)Administrative expenses 28 ( 24,904) ( 28,703)Other income 30 9,518 18,431 Other expenses 30 ( 15,534) ( 9,411)Net foreign exchange transactions losses ( 5,222) ( 3,063)Operating profit (loss) 52,662 ( 24,959) Share of profit of investments accounted for using the equity method 7 253 918 Financial income 31 13 116 Financial cost 31 ( 24,969) ( 22,798)Profit (loss) before income tax 27,959 ( 46,723)Income tax (expense) benefit 33 ( 11,055) 12,623 Profit (loss) for the year from continuing operations (attributable to equity holders of the parent) 16,904 ( 34,100) Discontinued operations: Profit for the year from discontinued operations 37 514 456 Profit (loss) for the year 17,418 ( 33,644)Other comprehensive income (loss): Currency translation adjustment (Item that may be subsequently reclassified to profit or loss) ( 4,879) ( 764)Other adjustment (Items that will not be reclassifiedto profit or loss) - - Total comprehensive income (loss) for the year 12,539 ( 34,408)
CAMPOSOL hOLDinG LiMitED AnD SubSiDiARiESCOnSOLiDAtED StAtEMEnt OF COMPREhEnSiVE inCOME (IN THOUSANDS OF U.S. DOLLARS)
Profit (loss) attributable to: Owners of the parent 16,628 ( 33,951)Non-controlling interest 790 307 17,418 ( 33,644) Total comprehensive income (loss) for the year attributable to: Owners of the parent 12,652 ( 34,715)Non-controlling interests ( 113) 307 12,539 ( 34,408) total comprehensive income attributable to owners of the parent arises from: Continuing operations 12,138 ( 35,171)Discontinued operations 514 456 12,652 ( 34,715) total comprehensive income attributable to non-controlling interests: Continuing operations ( 113) 307 Discontinued operations - - ( 113) 307 Basic and diluited earnings (losses) per share from continuing and discontinued operations to the equity holders of parent during the year (expressed in U.S. Dollars per share): From continuing operations 0.505 ( 1.153)From discontinuing operations 0.016 0.015 Basic and diluted earnings (losses) per ordinary share 34 0.521 ( 1.138) Items in other comprehensive income above are disclosed net of tax.
The notes on pages 67 to 150 are an integral part of these consolidated financial statements.

Annual Report 2015 CAMPOSOLAnnual Report 2015
CAMPOSOLCONSOLIDATED FINANCIAL STATEMENTS 31 DECEMBER 2015 AND 2014
6362
Attributable to owners of the parent nOn- number Share Share Other Retained controlling total notes of shares capital premium reserves earnings total interest equity balances as of 1 January 2014 32,404 507 212,318 825 111,285 324,935 806 325,741 Comprehensive income: Loss for the year - - - - ( 33,951) ( 33,951) 307 ( 33,644) Other comprehensive income: Currency translation adjustment - - - - ( 764) ( 764) - ( 764)total comprehensive income - - - - ( 34,715) ( 34,715) 307 ( 34,408) Transactions with owners: Non-controlling interest arising on business combination 24 - - - - - 7,029 7,029 Total transactions with owners - - - - - 7,029 7,029 balances as of 31 December 2014 32,404 507 212,318 825 76,570 290,220 8,142 298,362 balances at 1 January 2015 32,404 507 212,318 825 76,570 290,220 8,142 298,362 Comprehensive income: Profit for the year - - - - 16,628 16,628 790 17,418 Other comprehensive income: Currency translation adjustment - - - - ( 3,976) ( 3,976) ( 903) ( 4,879)total comprehensive income - - - - 12,652 12,652 ( 113) 12,539 Transactions with owners: Dividends distribution - - - - - - ( 188) ( 188)Total transactions with owners - - - - - - ( 188) ( 188) balances as of 31 December 2015 32,404 507 212,318 825 89,222 302,872 7,841 310,713
CAMPOSOL hOLDinG LiMitED AnD SubSiDiARiESCOnSOLiDAtED StAtEMEnt OF ChAnGES in EQuityfor the years ended 31 December 2015 and 2014(IN THOUSANDS OF U.S. DOLLARS)
Companies which do not distribute 70% of their profits after tax, as defined by the Special Contribution for the Defence of the Republic Law, by the end of the two years after the end of the year of assessment to which the profits refer, will be deemed to have distributed this amount as dividend. Special contribution for defence at 15% will be payable on such deemed dividend to the extent that the shareholders for deemed dividend distribution purposes at the end of the period of two years from the end of the year of assessment to which the profits refer, are Cyprus tax residents.The special contribution for defence rate increased to 17% in respect of profits of year of assessment 2009 and to 20% in respect of profits of years
of assessment 2010 and 2011 and is reduced back to 17% in respect of profits of years of assessment 2012 onwards. The amount of this deemed dividend distribution is reduced by any actual dividend paid out of the profits of the relevant year by the end of the period of two years from the end of the year of assessment to which the profits refer. This special contribution for defence is paid by the Company for the account of the shareholders. The notes on pages 67 to 150 are an integral part of these consolidated financial statements.

Annual Report 2015 CAMPOSOLAnnual Report 2015
CAMPOSOLCONSOLIDATED FINANCIAL STATEMENTS 31 DECEMBER 2015 AND 2014
6564
For the year ended 31 December note 2015 2014
CASh FLOWS FROM OPERAtinG ACtiVitiES Cash receipts from costumers 285,932 277,021 Cash paid to suppliers and employees ( 232,118) ( 301,112)Interest paid ( 23,564) ( 19,201)Income tax paid ( 2,734) ( 1,816)Custom duties refund collections 7,660 9,034 Other collections - 5,251 Other payments ( 1,587) - Net cash generated from (used in) operating activities 32 33,589 ( 30,823) CASh FLOWS FROM inVEStinG ACtiVitiES Transfer to cash subject to restriction 7,500 ( 7,500)Purchases of property, plant and equipment ( 11,921) ( 34,941)Investment in biological assets ( 11,183) ( 4,490)Purchase of intangibles, excluding goodwill 8 ( 1,683) ( 156)Acquisition of subsidiary, net of cash acquired - ( 15,449)Proceeds from sale of property, plant and equipment 7,461 203 Net cash used in investing activities ( 9,826) ( 62,333) CASh FLOWS FROM FinAnCinG ACtiVitiES Bank loans proceeds 23 128,383 121,590 Bank loans payments 23 (151,866) (88,987)Bonds issue, net of transaction costs 19 - 73,374 Payments of long-term debt 19 (4,138) (9,556)Net cash (used in) generated from financial activities (27,621) 96,421
Net (decrease) increase in cash and cash equivalents ( 3,858) 3,265 Cash and cash equivalents at beginning of year 30,505 27,240 Cash and cash equivalents at end of year 15 26,647 30,505 Non-cash transactions: Property, plant and equipment acquired under finance lease 19 - 5,273
CAMPOSOL hOLDinG LiMitED AnD SubSiDiARiESCOnSOLiDAtED StAtEMEnt OF CASh FLOWS(IN THOUSANDS OF U.S. DOLLARS)
The notes on pages 67 to 150 are an integral part of these consolidated financial statements.

Annual Report 2015 CAMPOSOLAnnual Report 2015
CAMPOSOLCONSOLIDATED FINANCIAL STATEMENTS 31 DECEMBER 2015 AND 2014
6766
OVERViEW OF nOtES tO thE COnSOLiDAtED FinAnCiAL StAtEMEntS31 DECEMBER 2015 AND 2014
COntEntSNote
1 General information2 Summary of significant accounting policies3 Financial risk management4 Critical accounting estimates and judgments5 Segment information6 Property, plant and equipment7 Investment in associate8 Intangible assets9 Biological assets10 Financial instruments by category11 Credit quality of financial assets12 Inventories13 Other accounts receivable14 Trade accounts receivable15 Cash and cash equivalents and cash subject to
restriction16 Shareholders’ equity17 Deferred income tax18 Workers’ profit sharing19 Long-term debt20 Trade accounts payable
21 Other accounts payable22 Provisions23 Bank loans24 Business combination25 Revenue26 Cost of sales27 Selling expenses28 Administrative expenses29 Personnel expenses30 Other income and expenses31 Financial income and costs32 Cash generated from operations33 Income tax expense34 Basic and diluted earnings per share35 Contingent liabilities36 Transactions with shareholders and other related
parties37 Non-current assets held for sale and discontinued
operations38 Commitments and guarantees39 Events after the reporting period
(IN THOUSANDS OF U.S. DOLLARS UNLESS OTHERWISE STATED)
1 GEnERAL inFORMAtiOn
a) Business activities
Camposol Holding Limited (hereinafter the Company) formerly Camposol Holding PLC until 30 April 2014, was incorporated in Cyprus on 9 july 2007, in accordance with the provisions of the Cyprus Companies Law, Cap. 113. The Company was a public limited liability company until 30 April 2014 and was converted to a private limited liability company, in accordance with the provisions of the Cyprus Companies Law, Cap. 113. Camposol Holding Limited and subsidiaries are hereinafter referred as the Group. The Company through its subsidiaries is mainly engaged in investing in the agriculture business, shrimp farming and managing the export of agricultural products mainly to the United States and to the European Union.
The Company’s legal address is Kanika International Business Center, 6th Floor, Profiti Ilia No 4 Germasogeia, Limassol 4046, Cyprus.
The Company’s shares were listed in the Oslo Axess Stock Exchange from May 2008 and the last day of listing was 20 December 2013.
As of 31 December 2015 Generación del Pacífico Grupo S.L., ultimate controlling party, (formerly Dyer Coriat Holding SL) has 82.59% (100% as of 2014) of the Shares of the Company. The remainder of the Company’s issued share capital in 2015 is spread amongst several shareholders.
On 16 October 2015, the Board of Directors of the Company approved the resolution in writing to transfer the Registered Office of the Company to Peru.
The subsidiaries and their activities are as follows: Direct or indirect equity interest Country of as of 31 December Company Principal activity incorporation 2015 2014 Camposol S.A. Agribusiness Peru 100% 100% Nor Agro Perú S.A.C. Farmland owner Peru 100% 100% Prodex S.A.C. Agriculture Peru 100% 100% Vegesol S.A. Agriculture Peru 100% 100% Campoinca S.A. Farmland owner Peru 100% 100% Muelles y Servicios Paita S.R.L. Services Peru 100% 100% Marinazul S.A. Shrimp farming Peru 99.99% 99.99% Domingo Rodas S.A. Shrimp farmland rental Peru 100% 100% Camarones S.A.C. Shrimp farmland rental Peru 100% 100% Marinasol S.A. Fish canning Peru 100% 100%

Annual Report 2015 CAMPOSOLAnnual Report 2015
CAMPOSOLCONSOLIDATED FINANCIAL STATEMENTS 31 DECEMBER 2015 AND 2014
6968
Direct or indirect equity interest Country of as of 31 December Company Principal activity incorporation 2015 2014
Inversiones Agrícolas Inmobiliarias S.A.C. Farmland owner Perú 99.99% 99% Corporación Refrigerados Iny S.A. Shrimp farming Peru 80% 80% Pesquera ABC S.A.C. Seafood processing business Peru 75% 75% Pacifico Azul S.A. Shrimp farmland rental Peru 100% 100% Camposol Europa S.L. Distribution Spain 100% 100% Camposol Fresh B.V. Distribution Netherlands 100% 100% Madoca Corp. Holding Panama (*) 100% 100% Grainlens Limited Holding Cyprus (*) 100% 100% Blacklocust Limited Holding Cyprus (*) 100% 100% Siboure Holding Limited Holding Cyprus (*) 100% 100% Persea, Inc. Holding USA 100% 100% Camposol Fresh U.S.A., Inc. Distribution USA 100% 100% Camposol Specialties, Inc. Distribution USA 100% 100%
(*) In process to transfer the Registered Office of these entities to Peru.
Camposol S.A. is one of the subsidiaries of the Group which is a Peruvian agribusiness corporation incorporated in the city of Lima on 31 january 1997. Camposol S.A. contributes substantially with all of the consolidated Group’s revenues and net profit.
The legal address of Camposol S.A. is Avenida El Derby 250, Urbanización El Derby de Monterrico, Santiago de Surco, Lima, Peru; its operating and commercial office is located in Carretera Panamericana Norte Km. 497.5, Chao, viru, La Libertad, three production establishments or agricultural lands are located in Carretera Panamericana Norte Kms. 510, 512 and 527 in the department of La Libertad, Peru. In addition, Camposol S.A. operates two administrative offices in the department of Piura and Arequipa.
In addition, the Company has an associate, Empacadora de Frutos Tropicales S.A.C. which is engaged in the processing and commercialization of fresh fruit products (Note 7).
The subsidiary Inversiones Inmobiliarias Agrícolas S.A.C.was incorporated on 28 August 2014.
The subsidiaries Corporación Refrigerados Iny S.A., Pesquera ABC S.A.C. and Pacifico Azul S.A., were acquired from third parties during 2014 (Note 24).
The company Agro Industrial Santa Angela S.A., was acquired from third parties during 2015, as part of an assets purchase (Note 6).
On 17 December 2015, the Group signed a contract of sale in which transfers the ownership of its asparagus line of preserved products to a third party (Sociedad Agrícola Viru S.A.C.), the same that will be effective in january 2016.
The table below presents details of the available agricultural land of the Group:
Area in Hectares (Ha) Land Peruvian region 2015 2014
Mar Verde La Libertad 2,496 2,496Agricultor La Libertad 1,726 1,726Gloria La Libertad 1,018 1,018Agromás La Libertad 414 414Virú - San josé La Libertad 616 616Compositan La Libertad 3,778 3,778Yakuy Minka La Libertad 2,770 2,770INAIN La Libertad 11 11Huangala - Terra Piura 2,677 2,677Santa Ana Piura 3,370 3,370Santa Anita Piura 128 128Santa julia Piura 2,183 2,183María Auxiliadora Piura 1,980 1,980La Merced Piura 1,000 1,000Ocoto Alto Piura 112 112Ocoto Bajo Piura 31 31Ica Ica 900 900Tumbes Tumbes 2,887 1,579 28,097 26,789
The Group carries out its activities over the following planted areas:
Area in Hectares (Ha) 2015 2014
Asparagus 1,261 1,922Avocados 2,655 2,653Mangoes 450 527Grapes 327 451Shrimp 724 1050Tangerine 145 102Blueberry 1,050 566 6,612 7,271

Annual Report 2015 CAMPOSOLAnnual Report 2015
CAMPOSOLCONSOLIDATED FINANCIAL STATEMENTS 31 DECEMBER 2015 AND 2014
7170
b) Economic environment of the Company
Following three years of economic recession, the Cyprus economy has recorded positive growth in the first half of 2015. As from April 2015, the restrictive measures and capital controls which were in place since March 2013 have been lifted. In recognition of the progress achieved on the fiscal front and the economic recovery, as well as the enactment of the foreclosure and insolvency framework, the international credit rating agencies have upgraded the credit ratings for the Cypriot sovereign, however the rating continues to be “non-investment grade”. At the same time there are some major downside risks emanating from the high level of non-performing loans in the banking sector and the limited availability of credit.
The economic conditions described above, did not impact the operations of the Group, since the Group conducts its operating, financing and investing activities outside the Cypriot territory.
c) Approval of the financial statements
The 2015 consolidated financial statements of the Group were approved by the Board of Directors’ Meeting held in the offices of the Company in Lima on 5 April 2016.
2 SuMMARy OF SiGniFiCAnt ACCOuntinG POLiCiES
The principal accounting policies applied in the preparation of these consolidated financial statements are set out below. These policies have been consistently applied to all the years presented, unless otherwise stated.
2.1 basis of preparation
The consolidated financial statements of the Group have been prepared in accordance with International Financial Reporting Standards (IFRS), as adopted by the European Union (EU) and IFRIC Interpretations.
The consolidated financial statements have been prepared under the historical cost convention, as modified by biological assets recognized at fair value, investment in associate recognized under the equity method accounting and assets of disposal group classified as held for sale recognised at the lower of their carrying amount and fair value less costs to sell. The financial statements are expressed in thousands of United States Dollars, unless otherwise stated. The consolidated financial statements have been prepared using three years presentation and the same accounting policies have been applied for all three years presented. The preparation of financial statements in conformity with IFRSs requires the use of certain critical accounting estimates. It also requires management to exercise its judgment in the process of applying the Group’s accounting policies. The areas involving a higher degree of judgment or complexity, or areas where assumptions and estimates are significant to the consolidated financial statements are disclosed in Note 4.
2.2 Adoption of new and revised iFRSs
As of the date of the authorisation of the consolidated financial statements, all International Financial Reporting Standards issued by the International Accounting Standards Board (IASB) that are effective as of 1 january 2015 have been adopted by the EU through the endorsement procedure established by the European Commission.
During the current year the Group adopted all the new and revised International Financial Reporting Standards (IFRS) that are relevant to its operations and are effective for accounting periods beginning on 1 january 2015. This adoption did not have a material effect on the accounting policies of the Group.
At the date of preparation of these financial statements the following International Financial Reporting Standards were issued by the International Accounting Standards Board but were not yet effective in the European Union:
i) Adopted by the European union
Amendments
• Amendments to IAS 19 – Defined benefit plans: Employee contributions (effective for annual periods beginning 1 February 2015).
• Annual Improvements 2012 (effective for annual periods beginning on or after 1 February 2015).• Amendments to IFRS 11 – Accounting for acquisitions of Interests in Joint Operations (effective for annual periods
beginning on or after 1 january 2016).• Amendments to IAS 16 and IAS 38 - Clarification of Acceptable Methods of Depreciation and Amortization
(effective for annual periods beginning on or after 1 january 2016).• Amendments to IAS 16 and IAS 41 - Agriculture: Bearer plants (effective for annual periods beginning on or after
1 january 2016).• Amendments to IAS 27 - Equity Method in Separate Financial Statements (effective for annual periods beginning
on or after 1 january 2016).• Annual Improvements 2014 (effective for annual periods beginning on or after 1 January 2016)• Amendments to IAS 1 - Disclosure Initiative (effective for annual periods beginning on or after 1 January 2016).
ii) not yet adopted by the European union
new standards
• IFRS 9 “Financial Instruments” (and subsequent amendments to IFRS 9 and IFRS 7) (effective for annual periods beginning on or after 1 january 2018).
• IFRS 14, Regulatory Deferral Accounts (issued in January 2014 and effective for annual periods beginning on or after 1 january 2016).
• IFRS 15, Revenue from Contracts with Customers (issued in May 2014) including amendments and effective for annual periods beginning on or after 1 january 2018.
• IFRS 16 “Leases” (issued in January 2016 and effective for annual periods beginning on or after 1 January 2019).

Annual Report 2015 CAMPOSOLAnnual Report 2015
CAMPOSOLCONSOLIDATED FINANCIAL STATEMENTS 31 DECEMBER 2015 AND 2014
7372
Amendments
• Amendments to IFRS 10 and IAS 28 - Sale or Contribution of Assets between an Investor and its Associate or Joint Venture (effective for annual periods beginning on or after 1 january 2016).
• Amendment to IFRS 10, IFRS 12 and IAS 28 - Investment Entities: Applying the Consolidation Exception (effective for annual periods beginning on or after 1 january 2016).
• Amendments to IAS 12 (issued in January 2016 and effective for annual periods beginning on or after 1 January 2017).
• Amendments to IAS 7(issued on 29 January 2016 and effective for annual periods beginning on or after 1 January 2017).
The Board of Directors expects that the adoption of these financial reporting standards in future periods will not have a material effect on the financial statements of the Group, with the exception of the following:
Amendments to IAS 16 and IAS 41 - Agriculture: Bearer plants (effective for annual periods beginning on or after 1 January 2016). The amendments change the financial reporting for bearer plants, such as avocados, asparagus, mangoes, tangerine, grapes and blueberries, which now should be accounted for in the same way as property, plant and equipment because their operation is similar to that of manufacturing. Consequently, the amendments include them within the scope of IAS 16, instead of IAS 41. The produce growing on bearer plants will remain within the scope of IAS 41.
As required under IAS 8, the change in accounting policy must be applied retrospectively. As a consequence, the bear plants describe above will be reclassified to property, plant and equipment effective 1 January 2015 and comparative figures will be restated accordingly.
The bear plants will be depreciated over their useful life which are estimated as follow: i) avocados, mangoes, tangerine and grapes between 20-25 years; ii) asparagus between 8-10 years; and iii) blueberries 11 years.
As permitted under the transitional rules, the fair value of the bear plants at 1 january 2015 will be deemed to be their cost going forward. At the date of preparation of these financial statements, the Group have not calculated the fair value of the bear plants to the transition date, and is assessing whether these assets will be accounted for under cost or revaluation method accordingly to IAS 16.
The Group expects to conclude the calculation and decide the accounting method in the second quarter of 2016, therefore it is not possible to determine the impacts of this change at the transition date nor at 31 December 2015.
2.3 Consolidation
The consolidated financial statements include the assets, liabilities, results and cash flows of the Company and its subsidiaries detailed in Note 1-(a).
a) Subsidiaries
Subsidiaries are all entities (including structured entities) over which the Group has control. The group controls an entity when the group is exposed to, or has rights to, variable returns from its involvement with the entity and has the ability to affect those returns through its power over the entity.
The entity has power over the investee where the investor possess the right that gives it the current ability to direct the relevant activities. Subsidiaries are fully consolidated from the date on which control is transferred to the group. They are deconsolidated from the date that control ceases. The Group applies the acquisition method to account for business combinations. The consideration transferred for the acquisition of a business is the fair values of the assets transferred, the liabilities incurred to the former owners of the acquiree and the equity interests issued by the Group. The consideration transferred includes the fair value of any asset or liability resulting from a contingent consideration arrangement. Identifiable assets acquired and liabilities and contingent liabilities assumed in a business combination are measured initially at their fair values at the acquisition date. The Group recognizes any non-controlling interest in the acquiree on an acquisition-by-acquisition basis, either at fair value or at the non-controlling interest’s proportionate share of the recognized amounts of acquiree’s identifiable net assets.
Acquisition-related costs are expensed as incurred.
The excess of the consideration transferred, any non-controlling interest in the acquiree and the acquisition-date fair value of any previous equity interest in the acquiree over the fair value of the identifiable net assets acquired is recorded as goodwill (note 2.8 - a). If the total of consideration transferred, non-controlling interest recognized and previously held interest measured is less than the fair value of the net assets of the business acquired, these cases are defined as a bargain purchase, the difference is recognized directly in the consolidated statement of comprehensive income.
Inter-company transactions, balances and unrealized gains on transactions between Group companies are eliminated. Unrealized losses are also eliminated. When necessary amounts reported by subsidiaries have been adjusted to conform with the Group’s accounting policies.
b) Associates
Associates are all entities over which the group has significant influence but not control, generally accompanying a shareholding of between 20% and 50% of the voting rights. Investments in associates are accounted for using the equity method of accounting. Under the equity method, the investment is initially recognized at cost, and the carrying amount is increased or decreased to recognize the investor’s share of the profit or loss of the investee after the date of acquisition. The Group’s investment in associates includes goodwill identified on acquisition.
If the ownership interest in an associate is reduced but significant influence is retained, only a proportionate share of the amounts previously recognized in other comprehensive income is reclassified to profit or loss, where appropriate.
The Group’s share of post-acquisition profit or loss of an associate, is recognized in the consolidated statement of

Annual Report 2015 CAMPOSOLAnnual Report 2015
CAMPOSOLCONSOLIDATED FINANCIAL STATEMENTS 31 DECEMBER 2015 AND 2014
7574
comprehensive income, and its share of post-acquisition movements in other comprehensive income of the associate is recognized in other comprehensive income of the Group with a corresponding adjustment to the carrying amount of the investment. When the Group’s share of losses in an associate equals or exceeds its interest in the associate, including any other unsecured receivables, the Group does not recognize its share of further losses, unless it has incurred legal or constructive obligations or made payments on behalf of the associate.
Unrealized gains on transactions between the Group and its associates are eliminated to the extent of the Group’s interest in the associates. Unrealized losses are also eliminated unless the transaction provides evidence of an impairment of the asset transferred. Accounting policies of associates have been changed where necessary to ensure consistency with the policies adopted by the Group.
Dilution gains and losses arising from changes in the interest on investments in associates are recognized in the consolidated statement of comprehensive income.
The carrying amount of equity-accounted investments in associates is tested for impairment in accordance with the policy described in Note 2.11.
2.4 Segment information
Operating segments are reported in a manner consistent with the internal reporting provided to the chief operating decision-maker. The chief operating decision-maker, who is responsible for allocating resources, assess performance of the operating segments and makes strategic decisions has been identified as the Board of Directors.
2.5 Foreign currency translation
a) Functional and presentation currency
Items included in the financial statements of each of the Group’s entities are measured using the currency of the primary economic environment in which each entity operates (‘the functional currency’). The consolidated financial statements are presented in US Dollars, which is the Group’s presentation currency.
b) Transactions and balances
Foreign currency transactions are translated into the functional currency using the exchange rates prevailing at the dates of the transactions or valuation where items are re-measured. Foreign exchange gains and losses resulting from the settlement of such transactions and from the translation at year-end exchange rates of monetary assets and liabilities denominated in foreign currencies are recognized in the consolidated statement of comprehensive income.
Foreign exchange gains and losses that relate to borrowings, cash and cash equivalents and other accounts are presented in the consolidated statement of comprehensive income within ‘net foreign exchange transactions losses’.
c) Group companies
The results and financial position of all the Group entities (none of which has the currency of a hyper inflationary economy) that have a functional currency different from the presentation currency are translated into the presentation currency as follows:
(a) assets and liabilities for each statement of financial position presented are translated at the closing rate at the date of that consolidated statement of financial position;
(b) income and expenses for each income statement are translated at average exchange rates (unless this average is not a reasonable approximation of the cumulative effect of the rates prevailing on the transaction dates, in which case income and expenses are translated at the rate on the dates of the transactions);
(c) equity balances, except for retained earnings, are translated at the historical exchange rates; and (d) all resulting exchange differences are recognized in other comprehensive income and included in retained earnings.
Goodwill and fair value adjustments arising on the acquisition of a foreign entity are treated as assets and liabilities of the foreign entity and translated at the closing rate.
2.6 Property, plant and equipment
Property, plant and equipment are stated at cost less accumulated depreciation and impairment losses.
Historical cost comprises the purchase price and any cost directly attributable to bringing the asset into working condition for its intended use. Cost of replacing part of the plant and equipment is recognized in the carrying amount of the plant and equipment if the recognition criteria are satisfied. All other repair and maintenance costs are recognized in profit or loss as incurred.
Subsequent costs are included in the asset’s carrying amount or recognized as a separate asset, as appropriate, only when it is probable that future economic benefits associated with the item will flow to the Group and the cost of the item can be measured reliably. The carrying amounts of replaced parts are derecognized. All other repairs and maintenance are charged to profit or loss during the financial period in which they are incurred.
The cost less the residual value of each item of property, plant and equipment is depreciated over its useful life.
Land is not depreciated. Depreciation on other assets is calculated using the straight-line method over the estimated useful life of individual assets, as follows: years
Buildings and other constructions Between 10 and 33Irrigation structure 70Plant and equipment Between 5 and 10Furniture and fixtures 10Other equipment Between 3 and 10Vehicles 5

Annual Report 2015 CAMPOSOLAnnual Report 2015
CAMPOSOLCONSOLIDATED FINANCIAL STATEMENTS 31 DECEMBER 2015 AND 2014
7776
Depreciation commences when assets are available for use as intended by management.
The assets residual values and useful lives are reviewed, and adjusted prospectively if appropriate, at each financial year-end. At 31 December 2015, there were no changes resulting from the review.
An assets’ carrying amount is written-down immediately to its recoverable amount, if the asset’s carrying amount is greater than its estimated recoverable amount (Note 2.9).
Gains and losses on disposals are determined by comparing the proceeds with the carrying amount and are recognized within ‘other income’ or ‘other expenses’, respectively, in the consolidated statement of comprehensive income.
2.7 Assets held for sale
Non-current assets (or disposal groups) are classified as held for sale if their carrying amount will be recovered principally through a sale transaction rather than through continuing use and a sale is considered highly probable. They are measured at the lower of their carrying amount and fair value less costs to sell.
An impairment loss is recognised for any initial or subsequent write-down of the asset (or disposal group) to fair value less costs to sell. A gain is recognised for any subsequent increases in fair value less costs to sell of an asset (or disposal group), but not in excess of any cumulative impairment loss previously recognised. A gain or loss not previously recognised by the date of the sale of the non-current asset (or disposal group) or is recognised at the date of derecognition.
Non-current assets held for sale (including those that are part of a disposal group) are not depreciated or amortised while they are classified as held for sale. Interest and other expenses attributable to the liabilities of a disposal group classified as held for sale continue to be recognised.
Non-current assets classified as held for sale and the assets of a disposal group are presented separately from the other assets in the consolidated statement of financial position. The liabilities of a disposal group classified as held for sale are presented separately from other liabilities in the consolidated statement of financial position.
A discontinued operation is a component of the entity that has been disposed of or is classified as held for sale and that represents a separate major line of business or geographical area of operations, is part of a single co-ordinated plan to dispose of such a line of business or area of operations, or is a subsidiary acquired exclusively with a view to resale. The results of discontinued operations are presented separately in the statement of comprehensive income.
2.8 intangible assets
a) Goodwill Goodwill is initially measured as the excess of the consideration transferred over the fair value of the net acquirer ’s identifiable assets, liabilities, contingent liabilities and non-controlling interest at the date of acquisition. When the accounting for a
business combination is not completed by the end of the reporting period in which the business combinations took place, the Group reports provisional amounts for those items with valuation process still incomplete.
The net identifiable assets acquired and liabilities assumed accounted at provisional fair values at acquisition date may be retroactively adjusted to reflect additional information gathered on facts and circumstances existing at acquisition date which, if known, would have affected the measurement of the amounts originally recognized. The period allowed by the IFRS 3 for the amendment of provisional amounts recognized should not exceed one year from the acquisition date.
For the purpose of impairment testing, goodwill acquired in a business combination is allocated to each of the cash-generating-units, or groups of cash-generating-units, that is expected to benefit from the synergies of the combination. Each unit or group of units to which the goodwill is allocated represents the lowest level within the entity at which the goodwill is monitored for internal management purposes. Goodwill is monitored at the operating segment level.
Goodwill impairment reviews are undertaken annually or more frequently if events or changes in circumstances indicate a potential impairment. The carrying value of the CGU which goodwill is allocated to is compared to the recoverable amount, which is the higher of value in use and the fair value less costs of disposal. Any impairment is recognized immediately as an expense and is not subsequently reversed.
b) Customer relationships Customer relationships acquired in a business combination are initially recognized at fair value at the date of the acquisition and subsequently at cost less amortization over their estimated useful lives which range from 2 to 8 years.
The intangible asset is valued using an income approach and the “multi-period excess earnings” method. The excess of earnings is defined as the difference between after-tax operating cash flows generated by the existing customers at the acquisition date; and, the contribution costs required by the remaining assets (tangible and intangible) for maintaining the relationships with the customer. The application of the “multi-period excess earnings” requires the following estimations:
• Future sales attributable to the existing customer list at the acquisition date, excluding any sales from other customers without an established and clear relationship. The sales forecast for each customer, or customer category, takes into consideration organic sales growth as well as the deterioration rate for this customer list.
• Calculation of operating margins (EBIT), taking into account only costs related to the existing customer base at the acquisition date.
c) Computer software Acquired computer software licenses are capitalized on the basis of the costs incurred to acquire and bring to use the specific software. These costs are amortized over their estimated useful lives of ten years.
Costs associated with maintaining computer software or programs are recognized as an expense as they are incurred. Development costs that are directly attributable to the design and testing of identifiable and unique software products controlled by the Group are recognized as intangible assets when the following criteria are met:
• it is technically feasible to complete the software product so that it will be available for use;• management intends to complete the software product and use or sell it;

Annual Report 2015 CAMPOSOLAnnual Report 2015
CAMPOSOLCONSOLIDATED FINANCIAL STATEMENTS 31 DECEMBER 2015 AND 2014
7978
• there is an ability to use or sell the software product;• it can be demonstrated how the software product will generate probable future economic benefits;• adequate technical, financial and other resources to complete the development and to use or sell the software product
are available; and• the expenditure attributable to the software product during its development can be reliably measured.
Directly attributable costs that are capitalized as part of the software product include the software development employee costs and an appropriate portion of relevant overheads.
Other development expenditures that do not meet these criteria are recognized as an expense as incurred.
Development costs previously recognized as an expense are not recognized as an asset in a subsequent period.
2.9 Impairment of non-financial assets
Goodwill, intangible assets that have an indefinite useful life or intangible assets not ready to use are not subject to amortization and are tested annually for impairment. Assets that are subject to amortization and other assets are reviewed for impairment whenever events or changes in circumstances indicate that the carrying amount may not be recoverable.
An impairment loss is recognized for the amount by which the asset’s carrying amount exceeds its recoverable amount. The recoverable amount is the higher of an asset’s fair value less costs of disposal and value in use. For the purposes of assessing impairment, assets are grouped at the lowest levels for which there are largely independent cash inflows (cash-generating units). Prior impairments of non-financial assets (other than goodwill) are reviewed for possible reversal at each reporting date.
Fair value is the price received to sell an asset in an orderly transaction between market participants at measurement date. In assessing the value in use of an asset, its estimated future cash flows are discounted to their present value using a pre-tax discount rate that reflects current market assessments of the time value of money and the risks specific to the asset. For an asset that does not generate cash inflows largely independent of those from other assets, the recoverable amount is determined for the cash -generating unit to which the asset belongs.
2.10 Financial assets
Classification
The Group classifies its financial assets in the category loans and receivables. The classification depends on the purpose for which the financial assets were acquired. Management determines the classification of its financial assets at initial recognition.
Loans and receivables are non-derivative financial assets with fixed or determinable payments that are not quoted in an active market. They are included in current assets, except for maturities greater than 12 months after the end of the reporting period. These are classified as non-current assets. The Group’s loans and receivables comprise ‘trade accounts
receivable’, ‘other accounts receivable’ and ‘cash and cash equivalents and cash subject to restriction’ in the consolidated statement of financial position (Notes 14, 13 and 15, respectively).
Recognition, derecognition and measurement
Loans and receivables are initially recognized at fair value plus transaction costs and subsequently carried at amortised cost using the effective interest method. Loans and receivable are derecognized when the rights to receive cash flows from the assets have expired or have been transferred and the Group has transferred substantially all risks and rewards of ownership.
Offsetting financial instruments
Financial assets and liabilities are offset and the net amount reported in the consolidated statement of financial position when there is a legally enforceable right to offset the recognized amounts and there is an intention to settle on a net basis or realise the asset and settle the liability simultaneously. The legally enforceable right must not be contingent on future events and must be enforceable in the normal course of business and in the event of default, insolvency or bankruptcy of the company or the counterparty.
2.11 Impairment of financial assets
The Group assesses at the end of each reporting period whether there is objective evidence that a financial asset or group of financial assets is impaired. A financial asset or a group of financial assets is impaired and impairment losses are incurred only if there is objective evidence of impairment as a result of one or more events that occurred after the initial recognition of the asset (a ‘loss event’) and that loss event (or events) has an impact on the estimated future cash flows of the financial asset or group of financial assets that can be reliably estimated.
Evidence of impairment may include indications that the debtors or a group of debtors is experiencing significant financial difficulty, default or delinquency in interest or principal payments, the probability that they will enter bankruptcy or other financial reorganization, and where observable data indicate that there is a measurable decrease in the estimated future cash flows, such as changes in arrears or economic conditions that correlate with defaults.
The amount of the loss of loans and receivables category is measured as the difference between the asset’s carrying amount and the present value of estimated future cash flows (excluding future credit losses that have not been incurred) discounted at the financial asset’s original effective interest rate. The carrying amount of the asset is reduced and the amount of the loss is recognized in the consolidated income statement. If a loan or held-to-maturity investment has a variable interest rate, the discount rate for measuring any impairment loss is the current effective interest rate determined under the contract. As a practical expedient, the Group may measure impairment on the basis of an instrument’s fair value using an observable market price.
If, in a subsequent period, the amount of the impairment loss decreases and the decrease can be related objectively to an event occurring after the impairment was recognized (such as an improvement in the debtor’s credit rating), the reversal of the previously recognized impairment loss is recognized in the consolidated statement of comprehensive income.

Annual Report 2015 CAMPOSOLAnnual Report 2015
CAMPOSOLCONSOLIDATED FINANCIAL STATEMENTS 31 DECEMBER 2015 AND 2014
8180
2.12 biological assets
Biological assets are living animals or plants managed by the Group for sale. These are asparagus, avocados, mangoes, grapes, shrimp, pepper, tangerine and blueberry which are to be harvested as agricultural produce.
Bearer biological assets are those assets capable of producing more than one harvest or are able to sustain regular harvests (as for example: asparagus, mangoes, avocados and grapes). Cost that relate to the agricultural activity include planting, harvesting, seedlings, irrigation, agrochemicals and fertilizers are capitalized. Administrative, selling and other expenses not related to the production of the biological assets are expended in the consolidated statement of comprehensive income. Bearer biological assets are classified as current and non-current depending on their maturity period.
Biological assets are measured at fair value less costs to sell on initial recognition and at each statement of financial position date. The fair value of biological assets excludes the land upon which the biological assets are harvested. Cost approximates fair value when little or no biological transformation has taken place since the costs were originally incurred or the impact of biological transformation on price is not expected to be material.
Costs to sell include all incremental costs directly attributable to the sale of the biological assets, excluding finance costs and income taxes. The fair value of a biological asset in its present location and condition is determined based on the present value of expected net cash flows from the biological asset discounted at a current market-determined pre-tax rate.
In determining the fair value of a biological asset based on the expected net discounted cash flows, the following factors have been taken into account:
i) the productive life of the asset;ii) the period over which the asset will mature;iii) the expected future sales price;iv) the cost expected to arise through the life of the asset;v) a pre-tax discount rate; andvi) volume produced.
The application of factors mentioned above requires the use of estimates and judgments by management (Note 4).
Expected future sale prices for all biological assets are determined by reference to observable data in the relevant market. Costs expected to arise through the life of the biological assets are estimated based on historical data.
The gain or loss arising from initial recognition of a biological asset at fair value less costs to sell and from a change in fair value less costs to sell of a biological asset is recognized in the consolidated statement of comprehensive income in the period in which they arise. Agricultural produce harvested from the Group’s biological assets is initially measured at its fair value less costs to sell at the point of harvest. The fair value of agricultural produce is determined based on market prices. The gain or loss arising from initial recognition of agricultural produce as a result of harvesting is recognized in the consolidated statement of comprehensive income for the period in which it arises. The cost of the agricultural produce included in inventories for subsequent sale is deemed to be the fair value of produce less costs to sell at the point of harvest in the local market.
2.13 inventories
Inventories are stated at the lower of cost and net realizable value. Cost is determined using the average cost method.
The cost of biological products is determined as the fair value less estimated point of sale costs at the time of harvest (Note 2.12).
Net realizable value is the estimated sale price in the ordinary course of business, less estimated cost to place inventories in selling conditions and commercialization and distributions expenses. The cost of inventories may not be recovered if: i) the inventories are damaged or become wholly or partially obsolete; and ii) their selling prices decline or the estimated necessary costs to be incurred to produce their sale increase. In such circumstances, inventories are written-off to their net realizable value. The Group determines the provision for obsolescence as follows:
Fresh and frozen products 100% of cost at expirationPreserved products 50% of cost after 2 years
The provision for obsolescence is estimated on an item by item basis or for groups of items with similar characteristics (with same crop, market and similar other characteristics).
2.14 trade accounts receivable
Trade accounts receivable are amounts due from customers for merchandise sold in the ordinary course of business. If collection is expected in one year or less, they are classified as current assets. If not, they are presented as non-current assets.
Trade accounts receivable are recognized initially at fair value and subsequently measured at amortized cost using the effective interest method, less provision for impairment.
A provision for impairment of trade receivables is estimated when there is objective evidence that the Group will not be able to collect all amounts due according to the original terms of the invoice. The amount of the provision is the difference between the carrying amount and the present value of the recoverable amounts and this difference is recognized in the consolidated statement of comprehensive income in ‘other expenses’. Accounts receivable provided for are written-off when they are assessed as uncollectible.
2.15 Cash and cash equivalents
In the consolidated statement of cash flows, cash and cash equivalents includes cash at banks and in hand, deposits held at call with banks, short-term, highly liquid investments funds, that are readily convertible to known amounts of cash and which are subject to an insignificant risk of changes in value with original maturities of three months or less. Cash and cash equivalents excludes cash subject to restriction.

Annual Report 2015 CAMPOSOLAnnual Report 2015
CAMPOSOLCONSOLIDATED FINANCIAL STATEMENTS 31 DECEMBER 2015 AND 2014
8382
2.16 Share capital
Ordinary shares are classified as equity. Any excess received over the par value of issued shares is classified as share premium.
Incremental costs directly attributable to the issue of new shares or options are shown in equity as a deduction, net of tax, from the proceeds.
Where any Group company purchases the Company’s equity share capital (treasury shares), the consideration paid, including any directly attributable incremental costs is deducted from equity attributable to the Company’s equity holders until the shares are cancelled or reissued. Where such shares are subsequently sold, any consideration received, net of any directly attributable incremental transaction costs and the related income tax effects, is included in equity attributable to the Company’s equity holders.
2.17 trade accounts payable
Trade accounts payable are obligations to pay for goods or services that have been acquired in the ordinary course of business from suppliers. Trade accounts payable are classified as current liabilities if payment is due within one year or less (or in the normal operating cycle of the business if longer). If not, they are presented as non-current liabilities.
Trade accounts payable are recognized initially at fair value and subsequently measured at amortized cost using the effective interest method.
2.18 bank loans and long-term debt
Bank loans and long-term debt are recognized initially at fair value, net of transaction costs incurred. Bank loans and long-term debt are subsequently carried at amortized cost; any difference between the proceeds (net of transaction costs) and the redemption value is recognized in the consolidated statement of comprehensive income over the period of the borrowing using the effective interest method.
Fees paid on the establishment of loan facilities are recognized as transaction costs of the loan to the extent that it is probable that some or all of the facility will be drawn down.
Long-term debt are classified as current liabilities unless the Group has an unconditional right to defer settlement of the liability for at least 12 months after the consolidated statement of financial position date.
Bank loans for working capital uses are classified as current liabilities as the settlement of these liabilities are in the short-term.
2.19 Leases
Leases in which a significant portion of the risks and rewards of ownership are retained by the lessor are classified as operating leases. Payments made under operating leases (net of any incentives received from the lessor) are charged to the income statement on a straight-line basis over the period of the lease.
The Group leases certain property, plant and equipment. Leases of property, plant and equipment where the Group has substantially all the risks and rewards of ownership are classified as finance leases. Finance leases are capitalized at the lease’s commencement at the lower of the fair value of the leased property and the present value of the minimum lease payments.
Each lease payment is allocated between the liability and finance charges. The corresponding rental obligations, net of finance charges, are included in long-term debt. The interest element of the finance cost is charged to the income statement over the lease period so as to produce a constant periodic rate of interest on the remaining balance of the liability for each period. The property, plant and equipment acquired under finance leases are depreciated over the shorter of the useful life of the asset and the lease term.
When assets are leased out under a finance lease, the present value of the lease payments is recognized as a receivable. The difference between the gross receivable and the present value of the receivable is recognized as unearned finance income. The unearned finance income is recognized as income over the term of the lease on a straight-line basis.
2.20 Current and deferred income tax
Income tax expense for the period comprises current and deferred income tax. Income tax is recognized in the consolidated statement of comprehensive income, except to the extent that it relates to items recognized in other comprehensive income or directly in equity. In this case the income tax is also recognized in other comprehensive income or directly in equity, respectively.
The current income tax charge is calculated on the basis of the tax laws enacted or substantively enacted at the consolidated statement of financial position date in the countries where the Company and its subsidiaries operate and generate taxable income. Management periodically evaluates positions taken in tax returns with respect to situations in which applicable tax regulation is subject to interpretation. It establishes provisions where appropriate on the basis of amounts expected to be paid to the tax authorities.
Deferred income tax is recognized, using the liability method, on temporary differences arising between the tax bases of assets and liabilities and their carrying amounts in the consolidated financial statements. However, the deferred income tax is not accounted for when it arises from the initial recognition of an asset or liability in a transaction other than a business combination that at the time of the transaction affects neither accounting nor taxable profit or loss. Deferred income tax is determined using tax rates (and laws) that have been enacted or substantially enacted at the date of the consolidated statement of financial position and are expected to apply when the related deferred income tax asset is realized or the deferred income tax liability is settled.

Annual Report 2015 CAMPOSOLAnnual Report 2015
CAMPOSOLCONSOLIDATED FINANCIAL STATEMENTS 31 DECEMBER 2015 AND 2014
8584
Deferred income tax assets are recognized only to the extent that it is probable that future taxable profit will be available against which the temporary differences can be utilized.
Deferred income tax liabilities are provided on temporary differences arising on investments in subsidiaries and associates, except where the timing of the reversal of the temporary difference is controlled by the Group and it is probable that the temporary difference will not reverse in the foreseeable future. Generally the Group is unable to control the reversal of the temporary difference for associates. Only where there is an agreement in place that gives the Group the ability to control the reversal of the temporary difference it is not recognized.
Deferred income tax assets are recognized on deductible temporary differences, only to the extent that is it is probable the temporary difference will reverse in the future and there is sufficient taxable profit available against which the temporary difference can be utilised.
Deferred income tax assets and liabilities are offset when there is a legally enforceable right to offset current tax assets against current tax liabilities and when the deferred income taxes assets and liabilities relate to income taxes levied by the same taxation authority on either the same taxable entity or different taxable entities where there is an intention to settle the balances on a net basis.
The Group did not recognise any deferred income tax liability for unremitted earnings from Peruvian subsidiaries to Cyprus companies, since there is no legal obligation to pay income tax to the tax authorities of Cyprus and Peru until dividends are distributed. Additionally, it is unlikely a distribution of dividends to take place in the foreseeable future based on the decision of the board of Directors.
2.21 Provisions
Provisions are recognized when the Group has a present obligation (legal or constructive) as a result of a past event, it is probable that an outflow of resources will be required to settle the obligation and the amount has been reliably estimated.
Where there are a number of similar obligations, the likelihood that an outflow will be required in settlement is determined by considering the class of obligations as a whole. A provision is recognized even if the likelihood of an outflow with respect to any one item included in the same class of obligations may be small.
Provisions are measured at the present value of the expenditures at fair value expected to be required to settle the obligation using a pre-tax rate that reflects current market assessments of the time value of money and the risks specific to the obligation. The increase in the provision due to passage of time is recognized as interest expense.
2.22 Employee benefits
Workers’ profit sharing and other employee benefits
In accordance with Peruvian Legislation, Peruvian entities of the Group are required to provide for workers’ profit sharing
equivalent to 10% of taxable income in Peru of each year. This amount is charged to the consolidated statement of comprehensive income (distributed among cost of sales, administrative expenses and selling expenses, as appropriate). This charge is a deductible expense for income tax purposes.
Statutory bonuses
The Peruvian Group Companies recognizes the expense in bonuses and the related liabilities under Peruvian legal tax regulations. Statutory bonuses consist of two (2) annual one-month salaries paid in july and December every year.
Employees’ severance indemnities
Employees’ severance indemnities of Peruvian Group Companies personnel comprise indemnities determined under Peruvian laws and regulations and which has to be credited to bank accounts selected by employees in May and November every year. The annual employees’ severance indemnities equal one-month salary. The Group does not have obligations of additional payments once these annual deposits, to which each worker is entitled to, are made.
2.23 Revenue recognition
Revenue is measured at the fair value of the consideration received or receivable, and represents amounts receivable for goods supplied, stated net of discounts, returns and value added taxes. The Group recognizes revenue when the amount of revenue can be reliably measured; when it is probable that future economic benefits will flow to the entity; and when specific criteria have been met for each of the group’s activities, as described below. The Group bases its estimate of return on historical results, taking into consideration the type of customer, the type of transaction and the specifics of each arrangement. The following specific recognition criteria must also be met before revenue is recognized:
a) Sales of goods
Sales of goods are recognized when all risks and rewards of ownership have been transferred to the buyer, usually on delivery of the goods. Sales of goods comprise:
• Exports of fresh products. This mainly includes fresh products of asparagus, avocados, blueberries, mangoes and grapes. Revenue is recognized when export delivery conditions are met. The delivery conditions are meet when the Group do retains no control, neither risk and benefits of the products according to the contract and there is no unfulfilled obligation that could affect the buyer acceptance of the products. Some of these exports are invoiced at a fixed price while others on a preliminary liquidation basis (provisionally priced). In the case of sales invoiced in a preliminary liquidation basis, the value of the provisionally priced fresh products is initially and subsequently re-measured using the forward selling price for the respective quotation period agreed with the customer until this quotation period ends. The selling price of fresh products can be measured reliably as these products are actively traded on international markets. The change in value of provisionally priced contracts that occurred after the end of

Annual Report 2015 CAMPOSOLAnnual Report 2015
CAMPOSOLCONSOLIDATED FINANCIAL STATEMENTS 31 DECEMBER 2015 AND 2014
8786
the period but before the issue of the financial statements up-to 15 February, is recorded as an adjustment to revenue and to trade receivables within the period.
• Exports of preserved and frozen products. This mainly includes asparagus, peppers, shrimps and artichokes. Revenue is recognized when export delivery conditions are met. The delivery conditions are meet when the Group do retains no control, neither risk and benefits of the products according to the contract and there is no unfulfilled obligation that could affect the buyer acceptance of the products.
• Domestic sales. Revenue is recognized on delivery.
b) Interest income
Interest income is recognized using the effective interest method.
2.24 Costs and expenses
Cost of sales corresponds to the cost of production of goods sold, and is recorded simultaneously with the recognition of revenue. Other costs and expenses are recognized on an accrual basis and recorded in the periods to which they are related.
2.25 Contingent liabilities and assets
Contingent liabilities are not recognized in the financial statements but disclosed in notes to the financial statements unless their occurrence is estimated as remote. Contingent assets are not recognized in the financial statements, unless virtually certain, and are disclosed only if their realization is assessed as probable.
2.26 Custom duties refunds
Custom duties refunds (drawback) correspond to a tax benefit granted by the Peruvian Government by means of which the Group is reimbursed for the custom duties paid on the importation of goods that are a component of the FOB value of the exported products. The refund of these custom duties is credited to the cost of sales in the consolidated statement of comprehensive income when the Group has the right to claim the refund (when the export is completed).
2.27 non-controlling interest
The Group recognises non-controlling interests in an acquired entity either at fair value or at the non-controlling interest’s proportionate share of the acquired entity’s net identifiable assets. This decision is made on an acquisition-by-acquisition basis. For the non-controlling interests in, the Group elected to recognise the non-controlling interests in at its proportionate share of the acquired net identifiable assets. See Note 2.3 for the Group’s accounting policies for business combinations.
Non-controlling interests in the results and equity of subsidiaries are shown separately in the consolidated statement of comprehensive income, consolidated statement of changes in equity and consolidated statement of financial position, respectively.
2.28 Reclassification of items
In 2015 the Group reclassified “net foreign exchange transactions losses” USD5,222 of the consolidated statement of comprehensive income from the financial results to operating results. The Group considers that classification of this item is more appropriate based on their nature, as it has generated from operating activities. The net foreign exchange transferred in 2015 and 2014 amounts to USD5,222 and USD3,063, respectively.
In 2015 the Group reclassified “payable interest” of the consolidated statement of financial position from other accounts payable to long-term debt. The Group considers that classification of this item is more appropriate based on their nature, as it has generated from long-term debt. The interest payable transferred in 2015 and 2014 amounts to USD8,400 and USD8,690, respectively.
3 FinAnCiAL RiSk MAnAGEMEnt
3.1 Financial risk factors
The Group activities is exposed to risks arising from climatic changes and financing risks (including foreign exchange risk, fair value interest rate risk, cash flows interest rate risk and price risk), credit risk and liquidity risk.
The Group’s geographic spread of agricultural lands allows a high degree of mitigation against adverse climatic conditions such as droughts and temperature changes as a result of climatic events. The Group has strong environmental policies and procedures in place to mitigate climatic risk.
The seasonal nature of the agricultural products of the Group requires a high level of cash flow in the second half of the year. The Group actively manages the working capital requirements and has sufficient credit facilities to meet the cash flow requirements.
a) Market risk
i) Foreign exchange risk
The Group’s entities operate locally and internationally and are exposed to foreign exchange risk arising from other currency exposures, primarily with respect to the Sol and Euros. The Group’s entities buy and sell its products and services and obtain funding for its working capital and investments mainly in its functional currency. Some minor costs are incurred in Sol and

Annual Report 2015 CAMPOSOLAnnual Report 2015
CAMPOSOLCONSOLIDATED FINANCIAL STATEMENTS 31 DECEMBER 2015 AND 2014
8988
some sales are made in Euros, therefore Group’s entities financial results are not significantly affected by exchange rate fluctuations between their functional currency and foreign currency. Management assumes the exchange risk related to its operations; therefore it does not carry out a hedging strategy with derivative financial instruments to cover its exchange risk. As of 31 December 2015 and 2014 the Group had the following assets and liabilities in Sol (PEN) and Euros (€) (expressed in USD000):
2015 total 2014 total PEn € uSD PEn € uSDAssetsCash and cash equivalents 1,941 8,902 10,843 3,206 2,766 5,972Trade and other accounts receivable 14,817 10,294 25,111 19,658 13,999 33,657 16,758 19,196 35,954 22,864 16,765 39,629
Liabilities Accounts payable 14,365 2,976 17,341 25,283 3,131 28,414Asset position, net 2,393 16,220 18,613 (2,419) 13,634 11,215
The remaining balance of cash and cash equivalents and trade and other accounts receivable amounting to USD45,684 relates to balances denominated in United States Dollar (2014: USD67,976).
The remaining balance of liabilities, except for the deferred income tax, amounting to USD246,984 relates to balances denominated in United States Dollar (2014: USD331,354).
The following table demonstrates the sensitivity to a reasonable possible change in Sol exchange rate and Euro exchange rate for twelve months against the US Dollar, with all other variables held constant, on the Group’s pre-tax profit:
Increase/ decrease Effect on in profit Increase/ decrease Effect on in profit PEn rate before tax € rate before tax
2015 +8% 190 +8% 1,298 -8% ( 190) -8% ( 1,298)2014 +4% 96 +4% 545 -4% ( 96) -4% ( 545)
ii) Cash flows and fair value of interest rate risk
Changes in interest rates impact primarily loans and long-term borrowings by changing either their fair value (fixed rate debt) or their future cash flows (variable rate debt).
Since all interest bearing loans and borrowings have a fixed interest rate, the Group is not exposed to cash flow interest rate risk.
Fixed rate borrowings of the Group are negotiated at market rates on a timely basis, in order to reduce the Group´s exposure to fair value interest rate risk. However, the Group is exposed to interest rate risk on fair value of its borrowings. The Group assumes this risk; therefore it does not carry out a hedging strategy with derivative financial instruments to cover its fair value interest rate risk.
iii) Price risk
The Group is not exposed to commodity price risk.
The Group is exposed to fresh products price risk as the value of the provisionally priced fresh products re-measured using the forward selling price for the respective quotation period agreed with the customer until this quotation period ends. The Group assumes this risk and does not use hedge instruments to manage its price risks.
b) Credit risk
Credit risk is the risk that counterparty will not meet its obligations under a financial instrument or customer contract leading to a financial loss. The Group is exposed to credit risk on trade and other receivables and deposits in banks.
The maximum exposure to credit risk is the carrying amount of accounts receivable and its deposits in financial institutions (Note 15) as shown on the consolidated statement of financial position. Sales transactions are carried out with a number of different counterparties, which mitigates credit risk concentration. The Group seeks for external assistance to evaluate the rating of the possible new customer. With this information, a credit limit for the customer is set. Management makes efforts in building long-lasting relationships with customers (over 6 months). As of 31 December 2015 and 2014, no credit limits were exceeded during the reporting period, and management does not expect significant losses from non-performance by these counterparties.
The accounts receivable from a single customer represent 14 per cent of the balance as of 31 December 2015 (18 per cent as of 31 December 2014). All new transactions with this customer are being executed with letters of credit to mitigate credit risk exposure.
In addition, the Group has a multimarket credit insurance coverage over the exports of fresh and preserved products in an aggregate amount up to USD185, 000 at 31 December 2015 (USD216, 000 in 2014).
c) Liquidity risk
The Group has sufficient credit capacity to have access to credit lines with top-ranked financial institutions (institutions with no history of default and prestigious locally) under market terms. In addition, the Group develops new bank relationships in order to have adequate funding available all the time. However, with the current world financial crisis there is a risk that banks may revise the terms of the lines of credit. The Group assumes this risk. As of 31 December 2015, lines of credit available not used amounts to USD32,100.

Annual Report 2015 CAMPOSOLAnnual Report 2015
CAMPOSOLCONSOLIDATED FINANCIAL STATEMENTS 31 DECEMBER 2015 AND 2014
9190
The table below analyses the Group’s non-derivative financial liabilities and allocates them into relevant maturity groupings based on the remaining period at the date of the statement of financial position to the contractual maturity date. The amounts disclosed in the table are the contractual undiscounted cash flows. Balances due within 12 months (with the exception of borrowings) equal their carrying balances as the impact of discounting is not significant.
between 1 between 2 Within 1 year and 2 years and 6 years total uSD uSD uSD uSD 2015 Long - term debt 21,597 205,240 1,502 228,339 Trade accounts payable 34,355 - - 34,355Other accounts payable (Note 10) 4,782 - - 4,782Bank loans 36,315 - - 36,315 97,049 205,240 1,502 303,791 2014Long - term debt 24,703 23,579 206,204 254,486Trade accounts payable 48,315 - - 48,315Other accounts payable (Note 10) 6,634 - - 6,634Bank loans 87,160 - - 87,160 166,812 23.579 206,204 396,595
3.2 Capital risk management
The Group’s objectives when managing capital are to safeguard the Group’s ability to continue as a going concern in order to provide returns for shareholders and benefits for other stakeholders and to maintain an optimal capital structure to reduce the cost of capital.
Consistent with others in the industry the Group monitors capital on the basis of the gearing ratio. This ratio is calculated as net debt divided by total capital. Net debt is calculated as total borrowings (including ‘current and non-current borrowings’ as shown in the consolidated statement of financial position), less cash and cash equivalents. Total capital is calculated as equity as shown in the consolidated statement of financial position plus net debt.
As of December 2015 and 2014, the Group’s strategy was to maintain the gearing ratio in no more than 0.5. The gearing ratios at 31 December 2015 and 2014 were as follows:
2015 2014 uSD uSD
Bank loans (Note 23) 36,120 59,603Long - term debt (Note 19) 214,775 217,799Less cash and cash equivalents (Note 15) ( 26,647) ( 30,505)Net debt (a) 224,248 246,897
Total equity as per statement of financial position (b) 310,713 298,362Total capital as defined by management (a) + (b) 534,961 545,259Gearing ratio (a) / (a) + (b) 0.42 0.45
At 2015 the decrease in the gearing ratio is mainly due to the decrease in bank loans balances and the increase in total equity, due to net gain arising from changes in fair value of biological assets for the year 2015.
3.3 Fair value estimation
The carrying amount of trade accounts receivable and trade accounts payable are similar to their fair values, as the impact of discounting is not significant. The fair value of financial liabilities for disclosure purposes is estimated by discounting the future contractual cash flows at the current market interest rate that is available to the Group for similar financial instruments.
The information used by the Group to estimate the fair value is categorized in following levels:• Quoted prices (unadjusted) in active markets for identical assets or liabilities (Level 1).• Inputs other than quoted prices included within level 1 that are observable for the asset or liability, either directly (that
is, as prices) or indirectly (that is, derived from prices) (Level 2).• Inputs for the asset or liability that are not based on observable market data (that is, unobservable inputs) (Level 3).
See Note 9 for disclosures of the measurement of biological assets.
As of 31 December 2015 and 2014, the Group does not maintain any other financial assets or liabilities measured at fair value since they are measured at amortized cost.

Annual Report 2015 CAMPOSOLAnnual Report 2015
CAMPOSOLCONSOLIDATED FINANCIAL STATEMENTS 31 DECEMBER 2015 AND 2014
9392
4 CRitiCAL ACCOuntinG EStiMAtES AnD JuDGMEntS
4.1 Critical accounting estimates and assumptions
The Group makes estimates and assumptions concerning the future. The resulting accounting estimates will, by definition, seldom equal the related actual results. The estimates and assumptions that have a significant risk of causing a material adjustment to the carrying amounts of assets and liabilities within the next financial year are discussed below.
Critical accounting estimates made by management are continually evaluated and are based on historical experience and other factors, including expectation of future foreseeable events that are believed to be reasonable under the circumstances. Management performs sensitivity analysis as a way of determining the potential impact of the changes of estimates on the fair value of biological assets.
The most significant use of judgment is the estimation of the fair value of biological assets, including asparagus, avocados, mangoes, grapes, shrimp and blueberries. The inputs to the valuation models are derived from observable market data where possible, but where observable market data are not available, judgment is required to establish fair values. The judgments include considerations of plantation volumes, cost per ton, depletion and the discount rate used to estimate the fair value. The valuation of biological assets is described in more detail in Note 9.
The estimates and assumptions that have a significant risk of causing a material adjustment to the carrying amounts of assets and liabilities within the next financial year are addressed below.
Estimation of fair value of biological assets - Note 2.12 and 9
To assess the fair value of biological assets the Group takes into account the criteria set out in IAS 41 and IFRS 13, which requires that a biological asset should be measured at its fair value less the estimated point-of-sale costs. The fair value indicated is determined by using the present value of net cash flows expected to be obtained from the assets. Determining the fair value of an asset requires the application of judgment to decide on the way in which biological asset will be recovered and assumptions to be used in its determination.
In this regard, in determining fair value, the Management uses estimates for plantation volumes, cost per ton and exhaustion to the point of harvest. The changes in assumptions or estimates used in the calculations could influence the outcome thereof.
The model inputs involve estimates that are updated annually. The fair value has been determined in US dollars and the discounted net cash flows included in estimates of management consider a discount rate determined in relation to the cost of financing of the Group (Weighted Average Cost of Capital). The Group carries out a sensitivity analysis of the biological assets taking into consideration the WACC discount, and taking into account the discount rate that the most representative companies used in the market.
Management considers that volatility levels of higher/lower than 5% would give rise to a material effect in its profits for the year. These sensitivity percentages have been determined based on the effect on profits for the year resulting of
the application of the fair value of biological assets under IAS 41 and IFRS 13. The variables used in the determination of the fair values of the biological assets that may be subject to variance are: i) the forecast of revenue and costs, and ii) determination of the discount rate under WACC. With respect to the revenue and costs forecasts, it should be noted that it has been determined based on the harvest and investment forecast for the coming years, which Management considers their changes of estimates depend on quality factors of the produce. These quality factors are monitored by Management through a detailed ongoing follow-up. With respect to the discount rate under WACC, its determination has been subject to sensitivity analysis in relation with comparable companies having a similar financial structure.
Increase/ decrease Effect on profit rate before tax uSD
2015 +5% 1,982 -5% ( 1,982)
2014 + 5% ( 2,340) -5% 2,340
Review of long-lived assets carrying amounts and impairment charges - Notes 6 and 8
The Group assesses annually whether a provision for impairment is required to be made under the accounting policy described in Note 2. This determination requires Management’s judgment in analyzing evidence of impairment as well as in determining value in use. For the latter, judgment is required in preparing the expected future cash flows, including forecasts of the Group’s future operation, forecasts of economic factors that may impact revenue and costs as well as in determining the discount rate to be applied to those cash flows. As a result of the evaluation of internal and external evidence, the Group arrived at the conclusion that there is no sufficient relevant evidence of impairment that may require impairment test to be performed on these assets.
Estimation of income tax - Notes 2.20, 17 and 33
Determination of the tax obligations and expenses requires interpretations of the applicable tax laws and regulations. The Group receives advice from its professional legal tax counsel before making any decision on tax matters. Even though Management considers its estimates are prudent and appropriate, differences of interpretation may arise with Tax Authorities that may require future tax adjustments. The Group recognizes liabilities for situations observed in preliminary tax audits based on estimates as to whether the payment of additional taxes is required. When the final tax result of these situations is different from the amounts that were initially recorded, the differences are charged to the current and deferred income tax assets and liabilities in the period in which this fact is determined. The Group performed sensitivity analysis on the possibility of inappropriate interpretations of tax law. In this it has assessed the probability of change of estimates to quantify its impact on the financial statements.

Annual Report 2015 CAMPOSOLAnnual Report 2015
CAMPOSOLCONSOLIDATED FINANCIAL STATEMENTS 31 DECEMBER 2015 AND 2014
9594
Where the actual final outcome (on the judgment areas) differs by 10% from management’s estimates, the Group would need to:
Effect on income tax 2015 2014 uSD uSD
Decrease the income tax liability ( 1,106) ( 1,262)Increase the income tax liability 1,106 1,262
4.2 Critical judgments in applying the Group´s accounting policies
Determination of functional currency - note 2.5
Management has determined the functional currency of the Group’s principal operating entities to be the US Dollar. These entities sell their products in international markets to customers in a number of countries and sales are influenced by a number of currencies. Most operating costs are incurred in Peru but many are invoiced in US Dollars and the price of some raw materials and supplies are influenced by the US Dollar. The borrowings and cash balances of these entities are held in US Dollars. Management has used its judgment to determine the functional currency, taking into account the secondary factors and concluded that the currency that most faithfully represents the economic environment and conditions of these entities is the United States Dollar.
Biological assets (Note 2.12 and 9)
In measuring the fair value of biological assets, critical judgments were used:
Critical judgments in determining the fair value of biological assets involved various key assumptions, such as: (i) impact of weather conditions on expected yields which are built on theoretical expected yields, (ii) projected prices which considers current and historic volatility, (iii) projected costs which considers current and historic performance, and (iv) projected production which considers current and historic performance. The impact on changing these assumptions is disclosed in Note 9.
Impairment test on goodwill (Note 2.9)
Critical judgments used in determining the recoverable amount of avocado’s CGU relates to Management’s consideration of prior-year events in the market that corresponds to an increase in the supply of avocado in the Group’s principal markets, which affected prices of avocado and resulted in a change in the Group’s sales strategy. These considerations were relevant to estimate the expected future cash flows and have been factored into the coming years.
Critical judgments used in determining the recoverable amount of asparagus’s CGU relates to Management’s consideration of prior-year events that corresponds to climatic changes and weather conditions as well as year to come expectations,
which affected the expected volumes to be harvested. These considerations were relevant to estimate the expected future cash flows and have been factored into the coming years.
5 SEGMEnt inFORMAtiOn
The Group’s Chief Operating Decision-Maker uses product information to manage resources and to identify those production lines which may eventually cease to generate value for the Group, and based on that information, decisions are made to develop other production lines. The Group has eight reportable segments which comprised nine cash-generating units, namely asparagus, avocado, artichoke, pepper, mango, seafood (shrimps and shellfish), grapes and blueberry. Goodwill arising from the acquisition of Camposol S.A. was allocated to the cash generating units of asparagus and avocado. Goodwill arising from the acquisition of Pesquera ABC S.A.C. was allocated to the cash generating unit of Shellfish.
Since the acquisition of Pesquera ABC S.A.C. in 2014, the Group formed the segment Seafoods, which includes the cash generating unit Shrimps and the cash generating unit Shellfish, which is composed by the business acquired. Shrimps cash generating unit is engaged in production, cultivation, harvesting, processing and sales of shrimps and Shellfish cash generating unit is engaged in collecting, processing and export sales of shellfish and other seafoods.
The eight reportable segments are engaged in producing, processing and commercializing a number of agricultural products, presented in fresh, preserved (until 2015) and frozen, which are mainly exported to European markets and the United States of America.
The products include asparagus, avocado, pepper, mango, seafoods, grapes and blueberry. These are further distinguished in fresh and frozen products.
All production and related assets are in Peru.
The analysis of sales below is based on the country/area in which the customer is located.
2015 2014 uSD uSD
Europe 140,100 101,664USA 91,633 109,561Asia 16,233 20,591Canada 2,697 3,948South America 20,893 16,504Other 1,136 1,188 272,692 253,456
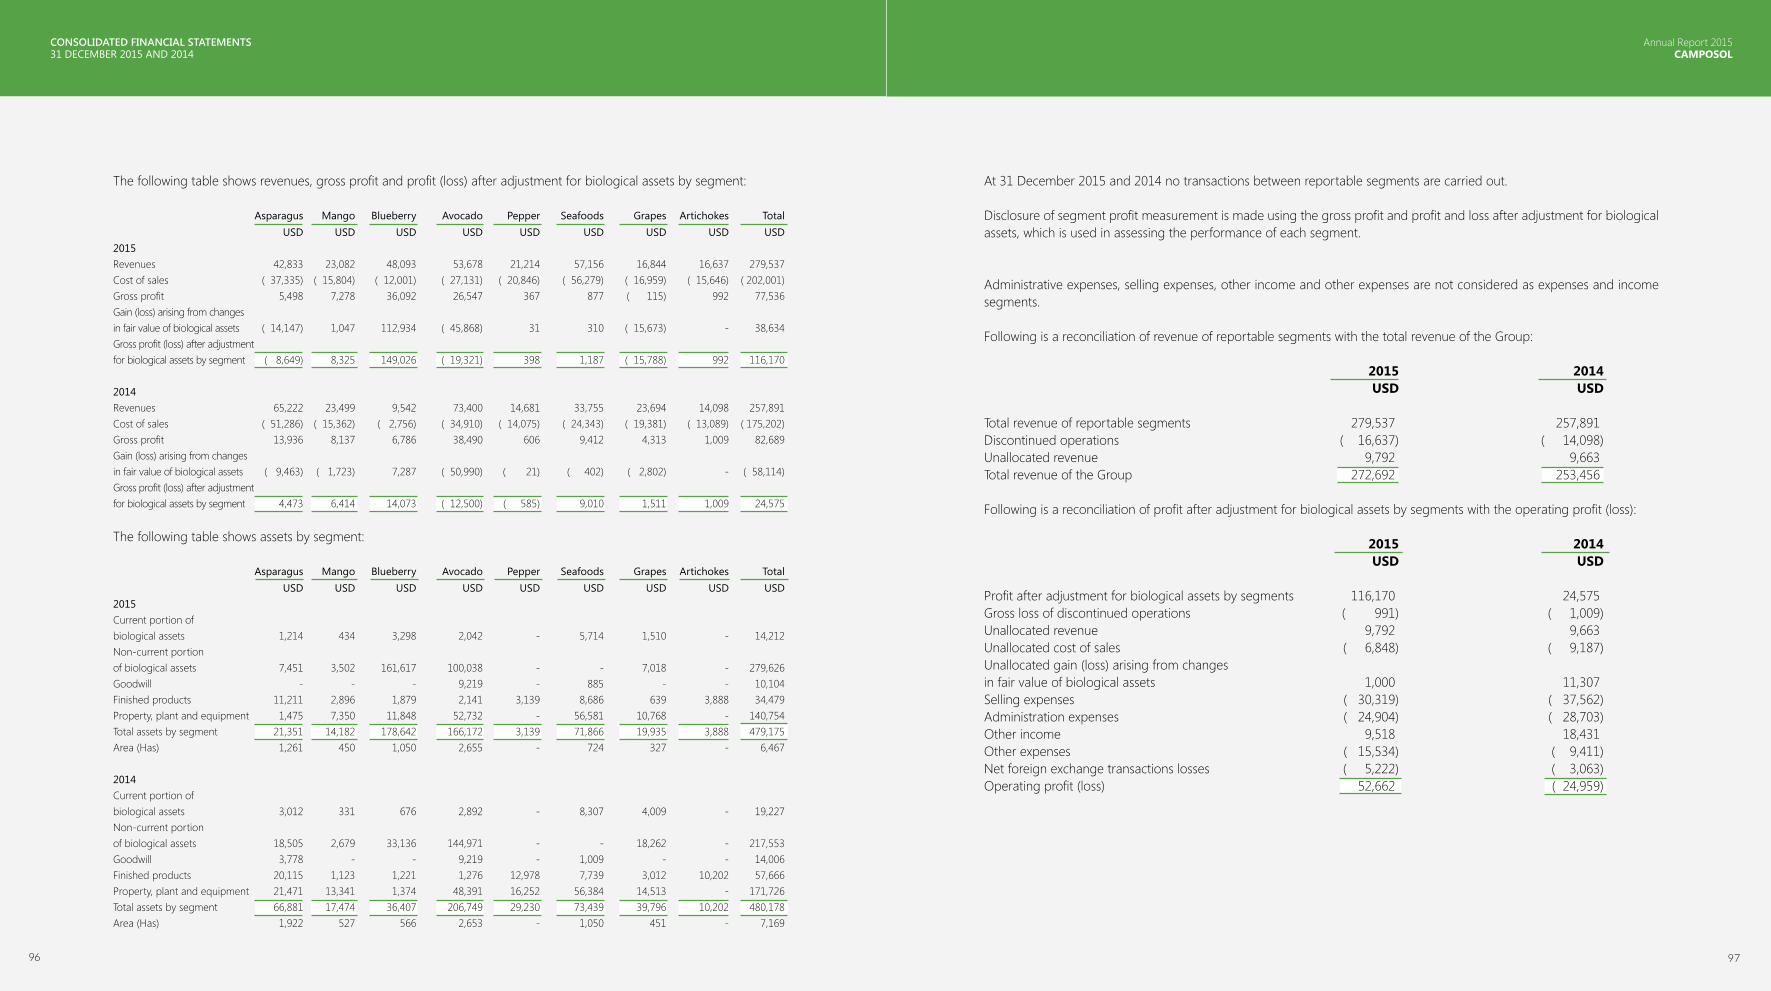
Annual Report 2015 CAMPOSOLAnnual Report 2015
CAMPOSOLCONSOLIDATED FINANCIAL STATEMENTS 31 DECEMBER 2015 AND 2014
9796
The following table shows revenues, gross profit and profit (loss) after adjustment for biological assets by segment:
Asparagus Mango Blueberry Avocado Pepper Seafoods Grapes Artichokes Total USD USD USD USD USD USD USD USD USD2015 Revenues 42,833 23,082 48,093 53,678 21,214 57,156 16,844 16,637 279,537Cost of sales ( 37,335) ( 15,804) ( 12,001) ( 27,131) ( 20,846) ( 56,279) ( 16,959) ( 15,646) ( 202,001)Gross profit 5,498 7,278 36,092 26,547 367 877 ( 115) 992 77,536Gain (loss) arising from changes in fair value of biological assets ( 14,147) 1,047 112,934 ( 45,868) 31 310 ( 15,673) - 38,634Gross profit (loss) after adjustment for biological assets by segment ( 8,649) 8,325 149,026 ( 19,321) 398 1,187 ( 15,788) 992 116,170
2014 Revenues 65,222 23,499 9,542 73,400 14,681 33,755 23,694 14,098 257,891Cost of sales ( 51,286) ( 15,362) ( 2,756) ( 34,910) ( 14,075) ( 24,343) ( 19,381) ( 13,089) ( 175,202)Gross profit 13,936 8,137 6,786 38,490 606 9,412 4,313 1,009 82,689Gain (loss) arising from changes in fair value of biological assets ( 9,463) ( 1,723) 7,287 ( 50,990) ( 21) ( 402) ( 2,802) - ( 58,114)Gross profit (loss) after adjustment for biological assets by segment 4,473 6,414 14,073 ( 12,500) ( 585) 9,010 1,511 1,009 24,575
The following table shows assets by segment:
Asparagus Mango Blueberry Avocado Pepper Seafoods Grapes Artichokes Total USD USD USD USD USD USD USD USD USD2015 Current portion of biological assets 1,214 434 3,298 2,042 - 5,714 1,510 - 14,212Non-current portion of biological assets 7,451 3,502 161,617 100,038 - - 7,018 - 279,626Goodwill - - - 9,219 - 885 - - 10,104Finished products 11,211 2,896 1,879 2,141 3,139 8,686 639 3,888 34,479Property, plant and equipment 1,475 7,350 11,848 52,732 - 56,581 10,768 - 140,754Total assets by segment 21,351 14,182 178,642 166,172 3,139 71,866 19,935 3,888 479,175Area (Has) 1,261 450 1,050 2,655 - 724 327 - 6,467
2014 Current portion ofbiological assets 3,012 331 676 2,892 - 8,307 4,009 - 19,227Non-current portion of biological assets 18,505 2,679 33,136 144,971 - - 18,262 - 217,553Goodwill 3,778 - - 9,219 - 1,009 - - 14,006Finished products 20,115 1,123 1,221 1,276 12,978 7,739 3,012 10,202 57,666Property, plant and equipment 21,471 13,341 1,374 48,391 16,252 56,384 14,513 - 171,726Total assets by segment 66,881 17,474 36,407 206,749 29,230 73,439 39,796 10,202 480,178Area (Has) 1,922 527 566 2,653 - 1,050 451 - 7,169
At 31 December 2015 and 2014 no transactions between reportable segments are carried out.
Disclosure of segment profit measurement is made using the gross profit and profit and loss after adjustment for biological assets, which is used in assessing the performance of each segment.
Administrative expenses, selling expenses, other income and other expenses are not considered as expenses and income segments.
Following is a reconciliation of revenue of reportable segments with the total revenue of the Group:
2015 2014 uSD uSD
Total revenue of reportable segments 279,537 257,891Discontinued operations ( 16,637) ( 14,098)Unallocated revenue 9,792 9,663Total revenue of the Group 272,692 253,456
Following is a reconciliation of profit after adjustment for biological assets by segments with the operating profit (loss):
2015 2014 uSD uSD
Profit after adjustment for biological assets by segments 116,170 24,575Gross loss of discontinued operations ( 991) ( 1,009)Unallocated revenue 9,792 9,663Unallocated cost of sales ( 6,848) ( 9,187)Unallocated gain (loss) arising from changes in fair value of biological assets 1,000 11,307Selling expenses ( 30,319) ( 37,562)Administration expenses ( 24,904) ( 28,703)Other income 9,518 18,431Other expenses ( 15,534) ( 9,411)Net foreign exchange transactions losses ( 5,222) ( 3,063)Operating profit (loss) 52,662 ( 24,959)

Annual Report 2015 CAMPOSOLAnnual Report 2015
CAMPOSOLCONSOLIDATED FINANCIAL STATEMENTS 31 DECEMBER 2015 AND 2014
9998
Gross profit by type of produce for the year ended 31 December is as follows:
2015 2014 Cost of Gross Cost of Gross Revenue sales profit Revenue sales profit uSD uSD uSD uSD uSD uSD
Fresh 151,662 ( 74,758) 76,904 146,637 ( 84,753) 61,884Preserved 39,716 ( 39,175) 541 46,287 ( 39,216) 7,071Frozen 72,349 ( 69,714) 2,635 48,756 ( 34,668) 14,088Others 8,965 ( 9,556) ( 591) 11,776 ( 12,663) ( 887) 272,692 ( 193,203) 79,489 253,456 ( 171,300) 82,156
Following is a reconciliation of total assets by segments with total assets:
2015 2014 uSD uSD
Total assets by segments 479,175 480,178Unallocated biological assets 21,156 20,172Unallocated inventories 12,623 37,570Unallocated property, plant and equipment 36,151 22,376Unallocated intangible assets 3,613 2,578Investment in associate 2,036 1,782Deferred income tax 4,131 2,667Assets classified as held for sale 9,058 -Prepaid expenses 970 1,142Other accounts receivable 14,115 15,657Income tax credit 7,281 7,949Trade accounts receivable 40,709 45,994Cash and cash equivalents 26,647 30,505Cash subject to restriction - 7,500 Total assets 657,665 676,070Unallocated area (Has) 145 102
The following table shows revenues and gross profit by customer:
Major 10 Major 11 to 20 Major 21 to 28 Other customers customers customers customers total uSD uSD uSD uSD uSD
year 2015Revenues 142,178 28,142 13,365 89,007 272,692Gross profit 54,947 5,938 3,012 15,592 79,489
year 2014Revenues 104,030 27,954 15,577 105,895 253,456Gross profit 36,687 8,468 3,015 33,986 82,156

Annual Report 2015 CAMPOSOLAnnual Report 2015
CAMPOSOLCONSOLIDATED FINANCIAL STATEMENTS 31 DECEMBER 2015 AND 2014
101100
6 PROPERty, PLAnt AnD EQuiPMEnt
building Furniture, and other Plant and fixtures and Construction Land constructions equipment equipment Vehicles in progress total uSD uSD uSD uSD uSD uSD
Year ended 31 December 2014Opening net book amount 44,909 32,982 35,939 6,258 1,588 6,928 128,604Acquisition of subsidiaries 14,646 14,834 5,568 1,450 102 2,044 38,644Additions 761 94 7,871 4,161) 405 26,922 40,214Disposals - - ( 450) ( 87) ( 87) (26) (650)Transfers - 11,513 89 - - ( 11,602) - Adjustments - 23 ( 84) ( 354) - ( 2,416) ( 2,831)Depreciation charge - ( 1,874) ( 6,287) ( 1,313) ( 405) - ( 9,879)Closing net book amount 60,316 57,572 42,646 10,115 1,603 21,850 194,102
At 31 December 2014Cost 60,316 75,238 83,101 17,071 5,299 21,850 262,875Accumulated depreciation - ( 17,666) ( 40,455) ( 6,956) ( 3,696) - ( 68,733)Net book amount 60,316 57,572 42,646 10,115 1,603 21,850 194,102
Year ended 31 December 2015Opening net book amount 60,316 57,572 42,646 10,115 1,603 21,850 194,102Additions 3,708 - 7,658 2,637 104 5,887 19,994Transferred to disposal groupclassified as held for sale ( 3,567) - ( 1,751) - - - ( 5,318)Disposals ( 323) ( 1,871) ( 1,140) ( 80) ( 93) ( 587) ( 4,094)Transfers - 11,633 - - - ( 11,633) -Adjustments - ( 22) ( 302) ( 30) 42 ( 10,734) ( 10,442)Impairment charge - - ( 1,148) - - - ( 1,148)Exchanges differences ( 1,460) ( 1,486) ( 700) ( 233) 24 ( 194) ( 4,049)Depreciation charge - ( 3,152) ( 6,946) ( 1,682) ( 360) - ( 12,140)Closing net book amount 58,674 62,674 38,921 10,727 1,320 4,589 176,905
At 31 December 2015Cost 58,674 82,317 78,788 19,035 4,496 4,589 247,899Accumulated Impairment - - - ( 1,148) - - - (1,148)Accumulated depreciation - ( 19,643) ( 38,719) ( 8,308) ( 3,176) - ( 69,846)Net book amount 58,674 62,674 38,921 10,727 1,320 4,589 176,905
a) As of 31 December 2015 gain on disposal of property, plant and equipment amounts to USD6,697 (losses of USD177 as of 31 December 2014) (see Note 30). The carrying amount of assets disposed of during 2015 amounted to USD4,094 (USD650 as of 31 December 2014).
b) The carrying amount of property, plant and equipment acquired under finance leases is as follows:
2015 2014 uSD uSD
Building and other constructions 4,029 4,004Plant and equipment 6,387 6,647Furniture, fixtures and equipment 877 938Vehicles 229 383 11,522 11,972
The payments of these obligations are secured with the assets acquired under the lease contracts.
c) At 31 December 2015 the net adjustments to construction in progress correspond to the negative variation of permanents investments in the year amounting to USD8,148 which are related to the costs of preparation of a land prior to planting, but have not yet assigned a crop, USD1,400 to the reclassifications of intangible assets and USD894 related to other assets. At 31 December 2014 the net adjustments mainly corresponds to units in transit amounting to USD1,715 and negative variation of permanent investments for the year amounting to USD701. The other adjustments in buildings and other constructions, plant and equipment, and other equipment, correspond to the reclassifications for presenting the fixed assets in the corresponding category according to their nature.
d) As of 31 December 2015 and 2014, property, plant and equipment are insured up to a value of USD80,000. Management believes that this policy is consistent with international practices in the industry and takes into account the risk of eventual losses due to the nature of the assets.
e) The total depreciation for the year 2015 includes USD1,450 that corresponds to the depreciation of the fair value of acquired assets in business combinations (USD1,584 at 2014).
f) The allocation of the depreciation charge is as follows:
2015 2014 uSD uSD
Cost of sales (Note 26) 11,259 9,122Administrative expenses (Note 28) 881 757 12,140 9,879
g) Bank borrowings are secured by fixed assets with a total amount of USD 55,300 in 2015 (USD47,000 in 2014) (Note 19).

Annual Report 2015 CAMPOSOLAnnual Report 2015
CAMPOSOLCONSOLIDATED FINANCIAL STATEMENTS 31 DECEMBER 2015 AND 2014
103102
7 inVEStMEnt in ASSOCiAtE
% share in the in the capital 2015 2014 % uSD uSD
Empacadora de Frutos Tropicales S.A.C. 40.00 2,036 1,782
On 30 September 2006 Camposol S.A. participated in the incorporation of Empacadora de Frutos Tropicales S.A.C (Empafrut), a Peruvian company engaged in the processing and commercialization of fresh fruit products, mainly mangoes. The cost of the investment amounted to USD600. Empafrut is not a listed entity.
The Group’s share in the 2015 income of this company amounted to USD253 (USD918 in 2014) which are shown separately in the consolidated statement of comprehensive income.
There were no transactions with the owners of the rest of the interest.
The summarized financial information at 100% for this associated company available at 31 December is as follows:
2015 2014 uSD uSD
Total assets 8,460 7, 468Total liabilities 3,370 3, 011Total revenue 6,125 7, 282Profit for the year 1,799 2,507Total equity
8 intAnGibLE ASSEtS
The movement of the cost and the accumulated amortization of intangibles assets is as follows:
Customer Goodwill relationships Software Other total uSD uSD uSD uSD uSD
Year ended 31 December2014Opening net book amount 12,997 2,133 2,861 158 18,149Additions - - 152 - 156Acquisition of subsidiary 1,009 - - - 1,009Disposals - - ( 45) ( 28) ( 73)Amortization charge - ( 2,133) ( 490) ( 34) ( 2,657)Closing net book amount 14,006 - 2,478 100 16,584
As at 31 December 2014Cost 14,006 9,566 5,015 396 28,983Accumulated amortization - ( 9,566) ( 2,537) ( 296) ( 12,399)Net book amount 14,006 - 2,478 100 16,584
Year ended 31 December2015Opening net book amount 14,006 - 2,478 100 16,584Additions - - 1,683 - 1,683Impairment charge ( 3,778) - - - ( 3,778)Exchange differences ( 124) - - - ( 124)Amortization charge - - ( 548) ( 100) ( 648)Closing net book amount 10,104 - 3,613 - 13,717
As at 31 December 2015Cost 13,882 9,566 6,994 - 30,442Accumulated impairment ( 3,778) - - - ( 3,778)Accumulated amortization - ( 9,566) ( 3,381) - ( 12,947)Net book amount 10,104 - 3,613 - 13,717
The amortization of customer relationship amounting to USD2,133 in 2014 was charged to selling expenses (Note 27) and the amortization of software was charged to administrative expenses (Note 28) by USD537 (USD482 for 2014) and to cost of sales (Note 26) by USD11 for 2015 (USD 8 in 2014) in the consolidated statement of comprehensive income.

Annual Report 2015 CAMPOSOLAnnual Report 2015
CAMPOSOLCONSOLIDATED FINANCIAL STATEMENTS 31 DECEMBER 2015 AND 2014
105104
Goodwill
On 17 October 2007, Camposol AS acquired 100% of the outstanding shares of Siboure Holding Inc, parent of Camposol S.A.; as a result of this transaction the Group recognized a goodwill amounting to USD9,542.
In 2010 Marinazul S.A. acquired 100% of the shares of Domingo Rodas S.A. for a consideration of USD164. The fair value of the net liabilities acquired amounted to USD883 giving rise to a goodwill amounting to USD1,047. In addition the Group acquired in 2010 100% of the outstanding shares of Camarones S.A. for a consideration of USD321. The fair value of the net assets acquired amounted to USD399, giving rise to the recognition of a gain amounting to USD78.
In 2011 the Group recorded an adjustment of USD2,408 to the deferred tax liability, which has been recognised in goodwill instead of the results for the year, since it related to Peruvian tax laws which existed at the date of Group reorganization and affected fixed assets acquired as part of transaction.
In February 2014, Marinazul S.A. acquired 100% of the outstanding shares of Pacífico Azul S.A.C. for a consideration of USD4,338. The fair value of the net assets acquired amounted to USD5,102 (Note 24), giving rise to the recognition of a gain amounting to USD764.
In November 2014, Marinazul S.A. acquired 80% of the outstanding shares of Corporación Refrigerados INY S.A. for a consideration of USD9,876. The fair value of the net assets acquired amounted to USD30,280 (Note 24), giving rise to the recognition of a gain amounting to USD14,348. In addition, the Group acquired 75% of the outstanding shares of Pesquera ABC S.A.C., for a consideration of USD3,928. The fair value of the net assets acquired amounted to USD3,892 (Note 24), giving rise to a goodwill amounting to USD1,009.
The impairment charge in asparagus CGU arose following the decision in November 2015 of not to continue producing preserved asparagus and the decision to reduce the number of cultivate Has in asparagus for focusing on giving priority to other products and lines of business.
impairment tests on goodwill
The carrying amount of asparagus segment has been reduced to its recoverable amount through recognition of an impairment loss against goodwill. This loss has been included in ‘other expenses’ in the statement of comprehensive income.
An impairment test on goodwill was performed by comparing the recoverable amount of the cash-generating units (value in use for asparagus, avocados and shellfish for 2015; value in use for asparagus and avocados and fair value less cost to sell for shellfish for 2014) and their carrying amount (including goodwill). To estimate the value in use, the Group has used the following assumptions:
• Projections are based on the Group’s forecasts approved by management.• 7-year term (8-year in 2014) for asparagus and avocado and 5-year term for shellfish of cash flows has been used
in the calculation, as the forecasted cash flows can be based on reasonable and reliable assumptions. In the case of asparagus and avocado a seven-year term is used to be consequent with long-term contracts with clients and cash flows applied for all other business with biological assets.
• Projections do not include cash inflows or outflows from financing activities.• Future cash flows are real pre-tax for asparagus, avocado and shellfish (post-tax for shellfish in 2014).• The risk adjusted rate is affected by the specific industry and market risks; therefore it represents the rate that a market
participant would use.• Goodwill is allocated to three cash-generating units (asparagus, avocado and shellfish) as follows:
Asparagus Avocado Shellfish2015 - 9,219 8852014 3,778 9,219 1,009
• Cash flows projections comprise the entire cash flows expected to be generated in the normal course of business, including the cash flows that relate to biological assets. All relevant non-current assets have been allocated to each CGU.
• Cash flows beyond the seven-year (eight-year in 2014) for asparagus and avocado and five-year for shellfish period are extrapolated using the estimated growth rates of 0% for asparagus and avocado and 1.5% for shellfish. The growth rate does not exceed the long-term average growth rate for the industry in which the CGU operates.
The key assumptions used for value in use calculations in 2015 and 2014 are as follows:
2015 2014 Asparagus Avocado Shellfish Asparagus Avocado Shellfish
Compound annual growth rate (%) -42 13 23 -3.3 7 14.1Budgeted gross margin (%) 15 56 20 25 56 20Export prices (USD) 4 1.6 5.7 4.4 1.6 10.4Risk adjusted rate (%) 11.6 12.5 10.8 11.1 11.6 10.2Recoverable amount of the CGU 8,991 - - - - -
Compound annual growth rate, budgeted gross margin, export prices and risk adjusted rate disclosure above corresponds to the initial seven-year (eight-year in 2014) for asparagus and avocado and to the initial five-year for shellfish for 2015 and 2014.
These assumptions have been used for the analysis of each CGU within the operating segment.
Management determined budgeted gross margin based on past performance and its expectations of market development.
Budgeted gross margin used in value in use for Asparagus has decreased. This is mainly driven by the decision of the Group not to continue with the preserved line of Asparagus and focusing on new products and line of business.
The average growth rates used are consistent with the actual performance in the avocado, asparagus and shellfish CGU’s and with the forecasts included in industry reports.
The average growth rate used in the value in use calculation for asparagus has decreased, since there are older crops that have lower yield expectations as well as the actual management decision not to continue producing preserved asparagus

Annual Report 2015 CAMPOSOLAnnual Report 2015
CAMPOSOLCONSOLIDATED FINANCIAL STATEMENTS 31 DECEMBER 2015 AND 2014
107106
and the decision of reducing the number of hectares in asparagus for focusing on giving priority to other products and lines of business.
Export prices are the average in the initial seven-year period for asparagus and avocado and five-year period for shellfish. Management determined budgeted export prices based on past performance, current industry trends and its expectations of market development.
The risk adjusted rates used are pre-tax for asparagus, avocado and shellfish and reflect specific risks relating to the relevant operating segment (pre-tax for asparagus and avocado and post-tax for shellfish in 2014)
Sensitivity analysis of asparagus, avocado and shellfish
Management performs a sensitivity analysis to assess the impact of changes in the assumptions used in the valuation model. In this respect, during 2015 the risk adjusted rate used by the Group was 12.5% for avocado, 11.6% for Asparagus and 10.8% for Shellfish. By modifying the risk adjusted rate to 16.0%, 7.2% and 30.24% for avocado, asparagus and shellfish, respectively, the recovery amounts would be equal to the carrying amounts in 2015, 20.71%, 13.65% and 13.9% in 2014, respectively.
budgeted compound annual budgeted compound annual budgeted compound annual growth (Avocado CGU) growth (Asparagus CGU) growth (Shellfish CGU) year Variation impairment year Variation impairment year Variation impairment
2015 -10% - 2015 -5% 7,866 2015 -10% - 2014 -2% - 2014 -2% - 2014 -5% -
Prices (Avocado CGU) Prices (Asparagus CGU) Prices (Shellfish CGU) year Variation impairment year Variation impairment year Variation impairment
2015 -15% -3,661 2015 -5% 6,402 2015 -15% - 2014 -8% 261 2014 -22% 893 2014 -10% -
budgeted Gross Margin budgeted Gross Margin budgeted Gross Margin(Avocado CGU) (Asparagus CGU) (Shellfish CGU) year Variation impairment year Variation impairment year Variation impairment
2015 -10% 927 2015 -5% 6,876 2015 -15% - 2014 -13% 308 2014 -15% - 2014 -15% -
Yields (Avocado CGU) Yields (Asparagus CGU) Yields (Shellfish CGU) year Variation impairment year Variation impairment year Variation impairment
2015 -5% - 2015 -5% 4,968 2015 -5% - 2014 -5% - 2014 -5% - 2014 -5% -
Despite the small growth rate in avocado, there is enormous potential for growth based on the opening of new markets for the coming years, improvements in production processes, and improvement in the performance of harvest.
Customer relationships
The relationships with customers established over time become a valuable intangible for the Group. The loyalty of the customers had positive impacts on sales and profits during the last 10 years of operation of Camposol Group enabling the Group to reach a foreseeable growth.
Predictable commercial relationships generate a set of economic benefits to the Group, including increased sales and minimization of sharp fluctuations in sales.
The useful life of customer relationships is amortized over their estimated useful lives ranging from 2 to 8 years. As of 31 December 2014 the customer relationship is fully amortized.

Annual Report 2015 CAMPOSOLAnnual Report 2015
CAMPOSOLCONSOLIDATED FINANCIAL STATEMENTS 31 DECEMBER 2015 AND 2014
109108
9 biOLOGiCAL ASSEtS
The Group measures the value of agricultural plants and shrimps using the expected cash flows for the production of each of its biological assets. The cash flows included in the projections are discounted at the risk adjusted rates between 10.80% and 12.32%.
The movement for the period in the fair value of biological assets is as follows:
Additions and Opening balance deductions Closing balance Market Less non Market value Final current current Area value Area (Note 32) Area balance portion portion has uSD has uSD has uSD uSD uSD
2015Asparagus 1,922 21,517 ( 661) ( 12,853) 1,261 8,664 ( 1,214) 7,450Avocados 2,653 147,863 2 ( 45,783) 2,655 102,080 ( 2,042) 100,038Mangoes 527 3,010 ( 77) 925 450 3,935 ( 433) 3,502Shrimp 1,050 8,307 ( 326) ( 2,593) 724 5,714 ( 5,714) -Grapes 451 22,271 ( 126) ( 13,742) 327 8,529 ( 1,510) 7,019Tangerine 102 20,172 44 985 145 21,157 - 21,157Blueberry 566 33,812 485 131,103 1,050 164,915 ( 3,298) 161,617 7,271 256,952 ( 659) 58,042 6,612 314,994 ( 14,211) 300,783
2014Asparagus 2,395 34,247 ( 473) ( 12,730) 1,922 21,517 ( 3,012) 18,505Avocados 2,643 198,307 10 ( 50,444) 2,653 147,863 ( 2,892) 144,971Mangoes 450 4,250 77 ( 1,240) 527 3,010 ( 331) 2,679Pepper 332 570 ( 332) ( 570) - - - -Shrimp 636 6,193 414 2,114 1,050 8,307 ( 8,307) -Grapes 451 25,900 - ( 3,629) 451 22,271 ( 4,009) 18,262Tangerine 102 8,986 - 11,186 102 20,172 - 20,172Blueberry 212 23,716 354 10,096 566 33,812 ( 676) 33,136 7,221 302,169 50 ( 45,217) 7,271 256,952 ( 19,227) 237,725
The main assumptions used to estimate the fair values of the biological assets were as follows:
Asparagus: • 34 plots in Mar verde, Agricultor, San José, Sincromax, and Yakuy Minka (44 plots in 2014).• Plots have a useful life of 10 years for 2015 and 2014.• Each harvest cycle lasts 6 months for 2015 and 2014. • Assumed reduction of 45% of production in year 2018 due to the “Fenómeno del Niño” for 2015 and 2014.
• Plots have their first harvest after 1 year from planting 2015 and 2014.• Risk adjusted rate of 11.57% for 2015 (11.1% for 2014).
Avocados: • 57 plots in Agromás, Marverde, Frusol, Terra, Agricultor and Yakuy Minka. (56 plots in 2014).• Plots have a useful life of 20 years for 2015 and 2014.• Every harvest cycle lasts 1 year for 2015 and 2014.• Assumed reduction of 80% of production in year 2018 due to the “Fenómeno del Niño” for 2015 and 2014.• Plots have their first harvest after 3 years from planting 2015 and 2014.• Risk adjusted rate of 12.45% for 2015 (11.64% for 2014). Mangoes: • 16 plots in Atypsa, Balfass and Dunas (14 plots in 2014). • Plots have a useful life of 25 years for 2015 (20 years in 2014).• Every harvest cycle lasts 1 year for 2015 and 2014.• Assumed reduction of 80% of production in year 2018 due to the “Fenómeno del Niño” for 2015 and 2014. • Plots have their first harvest after 3 years from planting 2015 and 2014.• Risk adjusted rate of 11.74% for 2015 (12.24% for 2014).
Grapes: • 20 plots in Agroalegre (14 plots in 2014). • The plots have a useful life of 20 years for 2015 and 2014. • Each harvest cycle last 1 year for 2015 and 2014.• Assumed reduction of 80% of production in year 2018 due to the “Fenómeno del Niño” for 2015 and 2014. • Plots have their first harvest after 1 year from planting 2015 and 2014.• Risk adjusted rate of 11.98 % for 2015 (11.39% for 2014).
Blueberry:• 31 plots in Agromas, Marverde, Gloria, Agricultor, Oro azul and Yakuy Minka (21 plots in 2014). • The plots have a useful life of 11 years for 2015 and 2014.• Each harvest cycle last 1 year for 2015 and 2014.• Assumed reduction of 45% of production in year 2018 due to the “Fenómeno del Niño” for 2015 and 2014. • Plots have their first harvest after 2 years from planting 2015 and 2014.• Risk adjusted rate of 11.13 % for 2015 (11,14% for 2014).
Tangerine: • 6 plots in Yakuy Minka (5 plots in 2014).• The plots have a useful life of 20 years for 2015 and 2014.• Each harvest cycle last 1 year for 2015 and 2014.• Assumed reduction of 80% of production in year 2018 due to the “Fenómeno del Niño” for 2015 and 2014. • Plots have their first harvest after 3 years from planting.• Risk adjusted rate of 12.45 % for 2015 (11.64% for 2014).

Annual Report 2015 CAMPOSOLAnnual Report 2015
CAMPOSOLCONSOLIDATED FINANCIAL STATEMENTS 31 DECEMBER 2015 AND 2014
111110
Shrimps: • 204 shrimp farms that cover an area of 1,330.35 Has for 2015 (1,050 Has for 2014).• Each has a useful life between 180 and 200 days, for 2015 and 2014.• Each harvest cycle of shrimps lasts approximately 25 weeks, including preparation, maintenance, and harvest for 2015
and 2014.• Risk adjusted rate of 10.82% for 2015 (10.68% for 2014).
The following table demonstrates the sensitivity to a reasonably possible change in the projected production, with all other variables held constant, on the Group’s pre-tax profit:
Increase/ decrease production rate Effect on profit before tax uSD 2015+2% 10,005-2% ( 10,005)2014+2% 8,363-2% ( 8,363)
The following table demonstrates the sensitivity to a reasonably possible change in the projected prices for each biological asset, with all other variables held constant, on the Group’s pre-tax profit:
Increase/ decrease production rate Effect on profit before tax uSD 2015+2% 9,947-2% ( 9,947)2014+2% 8,094-2% ( 8,094)
The following table demonstrates the sensitivity to a reasonably possible change in the projected maintenance costs of growing and harvesting, with all other variables held constant, on the Group’s pre-tax profit:
Increase/ decrease production rate Effect on profit before tax uSD2015+2% ( 5,390)-2% 5,3902014+2% ( 5,393)-2% 5,393
The following table demonstrates the sensitivity to a reasonably possible change in expected yields performance for each biological asset, with all other variables held constant, on the Group’s pre-tax profit:
Increase/ decrease production rate Effect on profit before tax uSD2015+2% 7,112-2% ( 7,112)2014+2% 9,372-2% ( 9,372)
The reconciliation in the fair value of the biological assets within level 3 of the hierarchy is as follows:
Asparagus Avocados Mangoes Pepper Shrimp Grapes tangerine blueberry total uSD uSD uSD uSD uSD uSD uSD uSD uSD31 December 2015Initial balance of fair value 21,517 147,863 3,010 - 8,307 22,271 20,172 33,812 256,952Harvest ( 7,847) ( 12,713) ( 2,785) ( 189) (52,870) ( 7,140) ( 1,152) ( 2,679) ( 87,375)Price change 1,102 ( 12,883) 2,293 - ( 2,596) 785 1,382 5,369 ( 4,548)Change in fair value due tobiological transformation ( 15,249) ( 32,985) ( 1,246) 31 2,906 ( 16,458) ( 382) 107,565 44,182Increase due to purchases 9,141 12,798 2,663 158 49,967 9,071 1,137 20,848 105,783Final balance of fair value 8,664 102,080 3,935 - 5,714 8,529 21,157 164,915 314,994
Total gains or losses for the period included in profit or loss for assets held at the end of the reporting period,under ‘Change in fair value of biological assets’ ( 14,147) ( 45,868) 1,047 31 310 ( 15,673) 1,000 112,934 39,634
31 December 2014Initial balance of fair value 34,247 198,307 4,250 570 6,193 25,900 8,986 23,716 302,169Harvest ( 14,493) ( 14,371) ( 2,234) ( 570) (22,601) ( 9,839) (990) ( 752) ( 65,850)Price change 5,764 ( 19,114) 1,965 - 2,323 1,026 3,936 ( 9,449) ( 13,549)Change in fair value due tobiological transformation ( 15,227) ( 31,876) ( 3,689) ( 21) ( 2,725) ( 3,828) 7,371 16,737 ( 33,258)Increase due to purchases 11,226 14,917 2,727 21 25,117 9,012 869 3,560 67,449Final balance of fair value 21,517 147,863 3,010 - 8,307 22,271 20,172 33,812 256,952
Total gains or losses for the period included in profit or loss for assets held at the end of the reporting period,under ‘Change in fair value of biological assets’ ( 9,463) ( 50,990) ( 1,724) ( 21) ( 402) ( 2,802) 11,307 7,288 ( 46,807)

Annual Report 2015 CAMPOSOLAnnual Report 2015
CAMPOSOLCONSOLIDATED FINANCIAL STATEMENTS 31 DECEMBER 2015 AND 2014
113112
Range of Fair value at 31 December unobservable Relationship 2015 2014 Valuation Unobservable inputs(probability- of unobservable Description USD USD technique inputs weighted average) inputs to fair value
Asparagus 8,664 21,517 Discounted cash flows Crop yield - tonnes 2.8 – 9.2 (6.4) The higher the crop yield, plantation Per hectare (white) per year the higher the fair value Crop yield - tonnes 1.3 - 6.8 (4.1) The higher the crop yield, Per hectare (green) per year the higher the fair value White asparagus 1,571 - 1,401 The higher the market price, price per tonne the higher the fair value Green asparagus 1,571 - 1,401 The higher the market price, price per tonne the higher the fair value Discounted rate 2015 (11.57%) The higher the discount rate, 2014 (11.1%) the lower the fair value
Avocados 102,080 147,856 Discounted cash flows Crop yield - tonnes 3.7 – 18.2 (16.5) The higher the crop yield, plantation Per hectare per year the higher the fair value Avocados price 936 – 953 The higher the market price, per tonne the higher the fair value Discounted rate 2015 (12.45%) The higher the discount rate, 2014 (11.64%) the lower the fair value
Mangoes 3,935 3,010 Discounted cash flows Crop yield - tonnes 2.9 – 34 (20.6) The higher the crop yield, plantation Per hectare per year the higher the fair value Mangoes price 532 - 565 The higher the market price, per tonne the higher the fair value Discounted rate 2015 (11.74%) 2014 (12.24%) The higher the discount rate,
Shrimp 5,714 8,307 Discounted cash flows Crop yield - tonnes 0.542 – 2.95 The higher the crop yield, plantation Per hectare per year the higher the fair value Shrimp price 4,554 The higher the market price, the higher the fair value Discounted rate 2015 (10.82%) The higher the discount rate, 2014 (10.68%) the lower the fair value
Range of Fair value at 31 December unobservable Relationship 2015 2014 Valuation Unobservable inputs(probability- of unobservable Description USD USD technique inputs weighted average) inputs to fair value
Grapes 8,529 22,271 Discounted cash flows Crop yield - tonnes 11.9 – 24.6 (23.6) The higher the crop yield, plantation Per hectare per year the higher the fair value Grapes price 1,291 - 1,387 The higher the market price, per tonne the higher the fair value Discounted rate 2015 (11.98%) The higher the discount rate, 2014 (11.39%) the lower the fair value Tangerine 21,157 20,172 Discounted cash flows Crop yield - tonnes 17 - 75 (61.9) The higher the crop yield, plantation Per hectare per year the higher the fair value Tangerine price 683 - 712 The higher the market price, per tonne the higher the fair value Discounted rate 2015 (12.45%) The higher the discount rate, 2014 (11.64%) the lower the fair value
Blueberry 164,915 33,812 Discounted cash flows Crop yield - tonnes 8.5 – 16.8 (12.1) The higher the crop yield, plantation Per hectare per year the higher the fair value Blueberry price 4,529 – 4,648 The higher the market price, per tonne the higher the fair value Discounted rate 2015 (11.13%) The higher the discount rate, 2014 (11.14%) the lower the fair value
Valuation processes of the Group
The Group’s finance department includes a team that performs the valuations of biological assets required for financial reporting purposes, including level 3 fair values.
This team reports directly to the chief financial officer (CFO) and the audit committee (AC).
Discussions of valuation processes and results are held between the CFO, AC and the valuation team at least once every quarter, in line with the Group’s quarterly reporting dates.
At 31 December 2015 and 2014 valuation inputs for biological assets correspond to level 3 of the hierarchy defined in Note 3.3. There were no transfers between any levels during the year.

Annual Report 2015 CAMPOSOLAnnual Report 2015
CAMPOSOLCONSOLIDATED FINANCIAL STATEMENTS 31 DECEMBER 2015 AND 2014
115114
10 FinAnCiAL inStRuMEntS by CAtEGORy
Financial assets as per the statement of financial position as of 31 December 2015 and 2014 are as follows:
2015 2014 uSD uSD Loans and receivables:Trade accounts receivable (Note 14) 40,709 45,994Other accounts receivable (excluding prepayments and statutory obligations) (Note 13) 6,414 3,648Cash and cash equivalents (Note 15) 26,647 38,005 73,770 87,647
Financial liabilities as per the consolidated financial position as of 31 December 2015 and 2014 are as follow:
2015 2014 uSD uSD Other financial liabilitiesTrade accounts payable (Note 20) 34,355 48,315Other accounts payable (excluding statutory liabilities and non-financial liabilities) (Note 21) 4,782 6,634Bank loans (Note 23) 36,120 59,603Long-term debt (Note 19) 214,775 217,799 290,032 332,351
11 CREDit QuALity OF FinAnCiAL ASSEtS
The Group assesses the credit quality of its accounts receivable by reference to historical information about the counterparties’ default rates as follows: 2015 2014 uSD uSD Trade accounts receivableNew costumers (less than 6 months as a costumer) 1,359 7,440Existing customers (more than 6 months) without non-compliance experience in the past 26,872 30,660Existing customers (more than 6 months)with some non-compliance experience in the past 10,102 7,894 38,333 45.994
Other accounts receivableExisting customers (more than 6 months)without non-compliance experience in the past 5,091 3,648See credit quality of deposits in banks in Note 15.
12 inVEntORiES
2015 2014 uSD uSD Finished products:- Asparagus 11,211 20,115- Peppers 3,139 12,978- Artichokes 148 10,202- Shrimp 8,686 7,739- Avocados 2,141 1,276- Mangoes 2,896 1,123- Grapes 639 3,012- Blueberry 1,879 1,221Product in process 1,536 1,862Supplies 11,385 15,806Packs 7,975 13,602Seeds, seedlings and others 2,186 4,005In-transit raw material and supplies 747 2,596Other 1,094 2,516 55,662 98,053Provision for obsolescence of inventories ( 8,560) ( 2,817) 47,102 95,236
As of 31 December 2015, remaining artichoke inventory correspond to frozen produce.
Finished products by type of produce for the year ended 31 December is as follows:
2015 2014 uSD uSD
Fresh 3,275 12,882Preserved 17,915 39,219Frozen 13,289 5,565 34,479 57,666
As of 31 December 2015 and 2014 inventories are free of any pledges as guarantee on liabilities.
The cost of inventories of continued and discontinued operations recognized as expense and included in the cost of sales amounted to USD154,651 (2014: USD133,997).

Annual Report 2015 CAMPOSOLAnnual Report 2015
CAMPOSOLCONSOLIDATED FINANCIAL STATEMENTS 31 DECEMBER 2015 AND 2014
117116
The movement of the provision for impairment of other accounts receivable is as follows:
2015 2014 uSD uSD
Opening balance ( 883) ( 609)Additions (Note 30) ( 14) ( 205)Written-off - - Provisions arising from business combination - ( 83)Reclassification 31 14Balance at the end of the year ( 866) ( 883)
Other accounts receivables not provisioned are current and are not impaired.
The drawback (custom duties refund) recovered during the year 2015 amounted to USD7,660 (USD9,034 in 2014). Receivables from employees are not interest-bearing and are unsecured.
14 tRADE ACCOuntS RECEiVAbLE
2015 2014 uSD uSD
Third parties 46,597 52,150Less: Provision for impairment of trade accounts receivable ( 5,888) ( 6,156) 40,709 45,994
Trade accounts receivable mainly comprise invoices for the sale of fresh, preserved and frozen products. Turnover ranges between 30 and 120 days (between 30 and 180 days in 2014) and are not interest-bearing.
Trade accounts receivable in foreign currency amounts to USD10,242 in Euros (USD13,999 in Euros in 2014).
The remaining balances for both years are denominated in US Dollars.
2015 2014 uSD uSD
Movement in the provision for obsolescence of inventories: Opening balance ( 2,817) ( 868)Additions (Notes 30 and 32) ( 4,969) ( 5,102)Net realizable value impairment (Note 32) ( 2,482) - Write-off (Note 32) 1,710 3,377)Provisions arising from business combination - ( 224)Others ( 2) - Balance at the end of the year ( 8,560) ( 2,817)
The additions corresponds mainly to impaired supplies (Note 30 and 32) and net realizable value impairment is related to finished products (Note 32).
13 OthER ACCOuntS RECEiVAbLE
2015 2014 uSD uSD
Value added tax (IGV in Perú) 6,169 8,074Custom duties refund (Drawback in Perú) 1,240 2,491Due from employees 209 344Prepayments to suppliers 292 1,444Rental of the pepper plant 1,300 -Loans to third parties 4,231 2,266Related companies (Note 36) 40 -Subsidies 353 332Claims to third parties 625 444Accounts receivable for services rendered to third parties 395 395Other 127 750 14,981 16,540Less:Provision for impairment of other accounts receivable ( 866) ( 883) 14,115 15,657
Loans to third parties corresponds to loans granted to minor farmers, that Camposol makes to incentive the agro in the region. This loans are short term and are not guarantee.

Annual Report 2015 CAMPOSOLAnnual Report 2015
CAMPOSOLCONSOLIDATED FINANCIAL STATEMENTS 31 DECEMBER 2015 AND 2014
119118
The movement of the provision for impairment of trade accounts receivable is as follows:
2015 2014 uSD uSD
Opening balance ( 6,156) ( 4,893)Additions (Notes 30 and 32) ( 285) ( 1,356)Recoveries (Note 30) 121 - Write-Off 268 -Reclassification 164 93Balance at the end of the year ( 5,888) ( 6,156)
The Group does not ask for collaterals to secure the full collection of its trade accounts receivable.
As of 31 December 2015 and 2014, the accounts provided for impairment have more than one year past due.
As of 31 December 2015 and 2014, the ageing analysis of trade accounts receivable is as follows:
31-90 91-180 180-360 More than total Current days days days 360 days uSD uSD uSD uSD uSD uSD
At 31 December 2015 40,709 37,541 2,364 165 558 81At 31 December 2014 45,994 38,860 4,969 409 1,649 107
As of 31 December 2015, trade accounts receivable amounting to USD81 (USD107 in 2014) although past due for more than one year, are not impaired; therefore, no provision for impairment on these accounts has been accounted for. As of December 31, 2015, trade accounts receivable amounting to USD5,888 (USD6,156 in 2014) are impaired; for which the Group has recognized a provision for impairment. The individually impaired accounts relate to customers who are in unexpected difficult economic situations or / and under litigation. These accounts are past due for more than a year.
As of 31 December 2015 and 2014 these impaired customers have not pledged any security for their debt.
The fair value of accounts receivable approximates their carrying amounts due to their short-term maturities.
15 CASh AnD CASh EQuiVALEntS AnD CASh SubJECt tO REStRiCtiOn
2015 2014 uSD uSD
Cash in hand 36 42Cash at banks 18,163 20,789In-transit remittances 337 5Short-term deposits 6,000 7,500Short-term investments 2,111 2,169Cash and cash equivalents 26,647 30,505
Cash subject to restriction - 7,500 26,647 38,005
The Group’s cash at bank amounts to USD15,802, USD1,944 and USD8,901 (USD32,030, USD3,206 and USD2,766 in 2014) in U.S. Dollars, Sol and Euros, respectively. The 2015 short-term deposits are denominated in U.S. Dollars.
The short-term deposits for 2015 and 2014 comprise balance in banks with maturities of less than three months. As of 31 December 2015 the time deposits have generated interest for USD 13 (USD116 to 31 December 2014) (Note 31).
Cash subject to restriction corresponds to guarantee deposits in a bank account in Scotiabank. On December 23, 2014, Camposol S.A. voiced its interest of private initiative called “Supplemental Development of Santa Anita Wholesale Market”. The project includes the concession for the design, construction, financing, maintenance and operation of a modular and multifunctional for handling fresh produce plant. In order to formalize this intention, Camposol S.A. constituted a joint bank letter of guarantee in favor of the City Hall of Lima by a rising value to USD 7.5 million with a term of 180 days from the date of issuance. Since Camposol S.A. lost the public tender in March 2015, the restricted cash was released to the Company.
The short-term investments correspond to a fixed portfolio of debt instruments which bears a short-term market interest rate of 1.57%. At 31 December 2015 have been generated a negative profitability for USD57 (negative profitability for USD 8 to 31 December 2014) (Note 31).
Their credit classification is as follows: 2015 2014 uSD uSD Bank deposits Classification Aaa 3,717 2,814Classification A + 11,909 24,157Classification A 10,646 3,325Others 2 162 26,274 30,458
The balances above do not include the balance of cash in hand and in-transit remittances.

Annual Report 2015 CAMPOSOLAnnual Report 2015
CAMPOSOLCONSOLIDATED FINANCIAL STATEMENTS 31 DECEMBER 2015 AND 2014
121120
16 ShAREhOLDERS’ EQuity
Share capital and premium
The share capital and premium are as follows:
number of Share Share shares capital premium total uSD uSD
31 December 2015 and 2014 32,404 507 212,318 212,825
In 2015 and 2014, the total authorized number of ordinary shares is 40,000,000 shares with a par value of €0.01 per share. All shares issued have been fully paid-in.
The Group’s 2,570,000 initial shares do not entitled the holder to any voting rights or the right to dividend distribution. These shares correspond to the first capital contribution for purposes of creating the entity.
On March 13, 2015 the Shareholders approved the conversion, re-assignation and the re-classification of the initial 2,570,000 dormant shares to ordinary shares; therefore, these shares grant the voting rights, participation in dividend distributions.
In April 2008, the Company issued 27,925,070 shares to the shareholders of Camposol AS (Norway) in exchange for an equal number of shares in that Company.
In May 2008, the Company issued 1,908,750 new ordinary shares at a price of 7,859 US dollars per share.
Share premium reserve is not available for distribution by way of a dividend.
treasury shares
The Group was authorized to acquire own shares up to a maximum of 10% of the issued shares of the Company granted by the Annual General Meeting held on 24 May 2011. As of 31 December 2012, the Group held 2,968,502 own shares, constituting approximately 9.95% of the issued shares in the Company.
The Group paid a total amount of USD11,592 for the purchase of 2,968,502 of its own shares (total nominal value of 17 US dollars).
On 21 October 2013, the Board of Directors of Camposol Holding Limited unanimously approved the tender of Camposol Holding Limited and Camposol S.A., holding 2,968,502 shares in the Company. The Group received a total amount of USD 12,417 for sale 2,968,502 own shares. The gain on disposal of treasury shares amounted to USD825 is recognized as other reserves in the consolidated statements of changes in equity.
Shareholder
As of 31 December 2015 Generación del Pacífico Grupo S.L., ultimate controlling party, (formerly Dyer Coriat Holding SL) has 82.59% (100% as of December 2014) of the Shares of the Company. The remainder of the Company’s issued share capital in 2015 is spread amongst several shareholders. non-controlling interest
The non-controlling interest is related to the change in the shareholding in Marinazul S.A., Corporación Refrigerados Iny S.A. and Pesquera ABC S.A.C. (Note 24). There were no transactions with non-controlling interest in 2015 and 2014. The total non-controlling interest as of 31 December 2015 is USD7,841 (USD8,142 for 2014).
Summarized financial information on subsidiaries with material non-controlling interests
Summarized statement of financial position
Corporación Refrigerados iny S.A. Pesquera AbC S.A.C. As at 31 December As at 31 December 2015 2014 2015 2014 uSD uSD uSD uSD
CurrentAssets 21,102 17,726 5,104 4,350Liabilities ( 7,554) ( 4,902) ( 5,845) ( 5,374)Total current net assets 13,548 12,824 ( 741) ( 1,024)
Non-currentAssets 22,014 25,821 5,315 6,224Liabilities ( 7,828) ( 8,479) ( 983) 1,231Total non-current net assets 14,186 17,342 4,332 4,993Net assets 27,734 30,166 3,591 3,969

Annual Report 2015 CAMPOSOLAnnual Report 2015
CAMPOSOLCONSOLIDATED FINANCIAL STATEMENTS 31 DECEMBER 2015 AND 2014
123122
Summarized statement of comprehensive income
Corporación Refrigerados iny S.A. Pesquera AbC S.A.C. For the year ended For the year ended 2015 2014 2015 2014 uSD uSD uSD uSD
Revenue 44,860 2,947 10,014 1,161Profit before income tax 1,999 524 157 147Income tax expense/income ( 281) - ( 11) -Profit for the year 1,718 524 146 147Other comprehensive income - CTA ( 3,691) ( 657) ( 651) ( 87)Total comprehensive income ( 1,973) ( 133) ( 505) 60Total comprehensive allocated to non-controlling interests ( 395) ( 27) ( 126) 15Dividends paid to non-controlling interests 188 - - -
Summarized statement of cash flows
Corporación Refrigerados iny S.A. Pesquera AbC S.A.C. For the year ended For the year ended 2015 2014 2015 2014 uSD uSD uSD uSD
Cash flows from operating activities:- Cash generated from operations ( 3,574) 3,732 ( 1,637) 700- Interest paid ( 255) ( 552) ( 126) ( 119)- Income tax paid ( 116) ( 9) - -Net cash generated from operating activities ( 3,945) 3,171 ( 1,763) 581
Net cash generated from investing activities ( 186) ( 404) ( 114) ( 314)
Net cash generated from financing activities 3,678 ( 2,174) 2,149 ( 352)
Net (decrease) increase in cash and cash equivalents ( 453) 593 272 ( 85)Cash and cash equivalents at beginning of year 1,125 532 230 315Cash and cash equivalents at end of year 672 1,125 502 230
17 DEFERRED inCOME tAx
The movement in the deferred income tax liabilities is as follows:
2015 2014 uSD uSD
Opening balance 32,472 40,124Expense for the year (Note 33) 11,055 ( 12,984)Balance at the end of the year 42,070 32,472
Deferred tax relates to the following items: Opening income Acquisition of Closing balance statement Subsidiaries Equity balance uSD uSD uSD uSD uSD2015 Deferred tax assets Tax losses carried-forward 10,370 1,549 - 11,919Provisions 964 194 - ( 3) 1,155Other 522 ( 238) - - 284 11,856 1,505 - ( 3) 13,358Deferred tax liabilities Fair value of biological assets 33,138 5,524 - - 38,662 Fair value of fixed assets at acquisition of subsidiary 8,844 ( 201) ( 51) 8,592Foreign exchange - Non-monetary assets 7,210 - - 7,210Differences in depreciation rates 106 192 - 298Gain on investments in associates 177 38 - 215 Currency translation adjustments 938 - - ( 1,632) ( 694)Other 1,125 ( 203) - 223 1,145 44,328 12,560 ( 1,460) 55,428 ( 32,472) ( 11,055) 1,457 ( 42,070)
2014 Deferred tax assets Tax losses carried-forward 7,271 3,099 - - 10,370Provisions 748 90 126 - 964Other 346 176 - - 522 8,365 3,365 126 - 11,856Deferred tax liabilities Fair value of biological assets 41,475 ( 8,745) 408 - 33,138Fair value of fixed assets at acquition of subsidiary 6,165 ( 395) 3,074 - 8,844Fair value of customer relationships 320 ( 320) - - - Differences in depreciation rates 402 ( 296) - - 106Gain on investments in associates 40 137 - - 177Currency translation adjustments - - 817 121 938Other 87 - 1,038 - 1,125 48,489 ( 9,619) 5,337 121 44,328 ( 40,124) 12,984 ( 5,211) ( 121) ( 32,472)

Annual Report 2015 CAMPOSOLAnnual Report 2015
CAMPOSOLCONSOLIDATED FINANCIAL STATEMENTS 31 DECEMBER 2015 AND 2014
125124
Deferred income tax assets are recognized for tax losses carried-forward to the extent that the realization of the related tax benefit through future taxable profits is probable
The Group did not recognise any deferred income tax liability for unremitted earnings from Peruvian subsidiaries to Cyprus companies, since there is no legal obligation to pay income tax to the tax authorities of Cyprus and Peru until dividends are distributed. Additionally, it is unlikely a distribution of dividends to take place in the foreseeable future based on the decision of the board of Directors.
The deferred income tax from tax losses carried-forward can be applied to taxable income to be generated in the following years:
2015 2014 uSD uSD
2016 3,892 2,3692017 1,554 4,3572018 2,574 3,6442019 3,900 - 11,920 10,370
In Peru, tax losses can be carried forward by choosing one of the two tax-loss offsetting regimes available; by one of them, tax losses may be carried forward over 4 consecutive years after the year in which they have been obtained and then they expire; by the second offsetting regime; tax losses are offset at a 50% of the taxable income obtained year after year and they do not expire. The Group has selected the first regime; and at the reporting date; based on Management’s estimate of its future tax losses, no tax loss would expire.
18 WORkERS’ PROFit ShARinG
In accordance with Peruvian Legislation Camposol S.A. and Marinazul S.A. shall provide for a workers’ profit sharing equivalent to 10% of the taxable income of each year. The amount of the workers’ profit sharing must be paid during the second quarter of the following year of its determination (Note 2.22).
19 LOnG-tERM DEbt
This item includes:
type of debt Guarantee Annual interest rate 2015 2014 uSD uSD
Bonds Camposol Holding LTD, Marinazul S.A. 9.875% 206,704 205,453 and Campoinca S.A. Other borrowings Domingo Rodas S.A. fixed assets 3% 801 1,664Bank borrowings - 5.5% 564 884Finance lease liabilities Property subject to financial lease Between 4.30% 6,702 9,657 and 8.72% 214,775 217,799Less-current portion ( 9,924) ( 11,682) 204,851 206,117
All loans are denominated in United States Dollars.
For purposes of reconciliation with the information provided in the statement of cash flows, following is the movement of long-term borrowings for the years ended 31 December 2015 and 2014:
Finance total Other bank lease long-term borrowings bonds borrowings liabilities debt uSD uSD uSD uSD uSD
Balance as of 1 january 2014 2,211 127,951 1,126 11,937 143,225Cash transactionsRepayment of long-term borrowings ( 547) - ( 242) ( 8,767) ( 9,556)Bonds issue - 75,000 - - 75,000Transactions costs - ( 1,626) - - ( 1,626)Non-cash transactionsBorrowing assumed on business combination - - - 1,214 1,214Purchase of fixed assets underfinance lease - - - 5,273 5,273Accrued interest - 4,269 - - 4,269Balance as of 31 December 2014 1,664 205,594 884 9,657 217,799
Balance as of 1 january 2015 1,664 205,594 884 9,657 217,799Cash transactionsRepayment of long-term borrowings ( 863) - ( 320) ( 2,955) ( 4,138)Non-cash transactionsAccrued interest - 1,114 - - 1,114Balance as of 31 December 2015 801 206,708 564 6,702 214,775

Annual Report 2015 CAMPOSOLAnnual Report 2015
CAMPOSOLCONSOLIDATED FINANCIAL STATEMENTS 31 DECEMBER 2015 AND 2014
127126
On 30 April 2014, Camposol S.A., Camposol Holding PLC’s subsidiary, successfully reopened its 9.875% USD125 million senior Notes due 2017 raising proceeds of USD75 million, which will be guaranteed by Camposol Holding Limited as parent guarantor and Marinazul S.A. and Campoinca S.A. as subsidiary guarantors. The net proceeds from the bond issue were used for capital expenditures, mainly for the expansion of the blueberries’ and shrimps’ businesses.
The Notes were issued as additional notes of, and form a single issue with, the USD125 million 9.875% Notes due 2017 issued on February 2, 2012. The total aggregate principal amount of the 9.875% Notes due 2017 that will be outstanding following this reopening will be USD200 million.
The issue of these bonds includes certain restrictive covenants. If during any period of time the Notes obtains Investment Grade Ratings from two Rating Agencies and no payment default or Event of Default has occurred and is continuing, the Issuer, the Parent Guarantor and its Restricted Subsidiaries will not be subject to the following provisions of the Indenture:
i) Change of control: Putable at 101% of principal plus accrued and unpaid interest.
ii) Limitation on indebtedness and Disqualified Stock:a. The Leverage Ratio is less than (i) 3.5 to 1.0 during the period from the Original Issue Date through june 30, 2013
and (ii) 3.25 to 1.0 from july 1, 2013 through the Maturity Date.b. Working capital shall not to exceed 25% of net sales.c. Other Indebtedness shall not to exceed the greater of USD 20,000 and 5% of the total assets.
iii) Limitation on Restricted Payments:a. Declare or pay any dividend or make any distribution. b. Purchase, redeem, retire or otherwise acquire for value any shares of Capital Stock.
iv) Limitation on Issuances of Guarantees by Restricted Subsidiariesa. Loans and advances to officers, directors and employees of the Parent Guarantor or any Subsidiary in the ordinary course of business in an aggregate principal amount not exceeding USD 2,000 at any time.
v) Limitation on Liensa. Not to exceed 10% of the total assets
vi) Limitation on Asset Salesa. At least 75% is paid in cash or temporary cash investments
vii) Limitation on Business Activities a. Only permitted Businesses
According to management evaluation of these covenants, at 31 December 2015 and 2014 non default event has occurred.
The maturity of the non - current portion of long - term debt is as follows:
2015 2014 uSD uSD
1 year 203,390 1,9172 years 1,436 202,9193 years 25 1,258More than 3 years - 23 204,851 206,117
Fair values
The carrying amounts and fair value of the non-current borrowings are as follows:
Carrying amount Fair value 2015 2014 2015 2014 uSD uSD uSD uSD
Bank borrowings 289 562 274 533Bonds 199,866 198,307 181,903 180,484Finance lease liabilities 4,194 6,567 3,972 4,081Other borrowings 502 681 501 681 204,851 206,117 186,650 185,779 At 31 December 2015 and 2014 valuation inputs for calculating fair value of long-term debt correspond to level 3 of the hierarchy defined in Note 3.3. There were no transfers between any levels during the year.
a) Bonds
USD125,000 9.875% Senior Notes due 2017
On 26 january 2012, Camposol S.A. and its guarantors Camposol Holding LTD, Marinazul S.A. and Campoinca S.A. agreed with Credit Suisse Securities (USA) LLC and Santander Investment Securities Inc., as representatives of several purchasers, to issue and sell to the several purchasers, USD125,000 of the principal of its 9.875% Senior Notes due in 2017 to be issued under an indenture dated 2 February 2012, signed between Camposol S.A., the Guarantors, and Wells Fargo Bank, National Association, as trustee, guaranteed on an unsecured senior basis by Camposol Holding LTD, Marinazul S.A. and Campoinca S.A. Coupons bear a 9.875% interest and are payable on a semi-annual basis. Cash proceeds were used to pay the long term debt obtained to finance capital expenditures and for general corporate uses. The bonds are listed on the Luxembourg Stock Exchange.

Annual Report 2015 CAMPOSOLAnnual Report 2015
CAMPOSOLCONSOLIDATED FINANCIAL STATEMENTS 31 DECEMBER 2015 AND 2014
129128
21 OthER ACCOuntS PAyAbLE
2015 2014 uSD uSD
Vacations and other payables to employees 3,771 5,156Board remuneration 115 100Worker’s pension fund payable 355 426Deferred gain on sale and leaseback 55 3Accrual of unbilled services - 352Other 927 600 5,223 6,637
Other accounts payable are due within 12 months, not interest-bearing and are mainly denominated in Sol.
22 PROViSiOnS Contingent liability Legal arising on a business Other claims combination provisions total uSD uSD uSD uSD
At 1 January 2014 1,600 - 877 2,477Acquisition of subsidiary (Note 24) - 5,876 - 5,876Unused amounts reversed - - ( 86) ( 86)At 31 December 2014 1,600 5,876 791 8,267
At 1 January 2015 1,600 5,876 791 8,267Additional provisions - - 1,662 1,662Payments ( 200) - - ( 200)Reclassification - - ( 417) ( 417)Accrued interest - 399 - 399Unused amounts reversed ( 853) - - ( 853)At 31 December 2015 547 6,275 2,036 8,858
According to the income tax regime currently in force in Peru, Camposol S.A. has to withhold from the payment of coupons a 4.99% as the income tax of non-domiciled entities. Since the bonds purchase agreement does not complete the payment of the withholding tax by the holders, Camposol S.A. will assume it as its own expense.
b) Finance leases
The future minimum lease payments under finance leases together with the present value of net minimum lease payments are as follows:
2015 2014 Minimum Present value Minimum Present value payments of payments payments of payments uSD uSD uSD uSD
Within one year 2,787 2,639 3,551 3,361After one year but no more than five years 4,410 4, 063 7,078 6,296Total minimum lease 7,197 6,702 10,629 9,657payments less amounts representing finance charges ( 495) ( 972) Present value of minimum lease payments 6,702 9,657
20 tRADE ACCOuntS PAyAbLE
2015 2014 uSD uSD
Suppliers 31,343 42,540Bills of exchange payable 2,027 4,885Payables to related parties (Note 36) 985 890 34,355 48,315
Trade accounts payables to suppliers are mainly in US dollars, are due within 12 months and are not interest-bearing.
Bills of exchange in U.S. dollars and Sol, amounts to USD1,956 and USD71, respectively (In 2014 USD4,275 and USD610, respectively each currency), which are due within 3 months and bear interest at an annual average rate of 9%. The average payment terms of trade payables are between 30 to 60 days.

Annual Report 2015 CAMPOSOLAnnual Report 2015
CAMPOSOLCONSOLIDATED FINANCIAL STATEMENTS 31 DECEMBER 2015 AND 2014
131130
2015 2014 uSD uSD
Non-current (Note 24) 4,930 4,833Current 3,928 3,434Total 8,858 8,267
Excessive legal provision from previous years was reversed in 2015, the amount was USD853. New provisions were realized for USD1,662, in part for the provision of benefit performance, which is included in other provisions.
23 bAnk LOAnS
2015 2014 uSD uSD Loans -Banco Continental (Peru) 16,150 10,000Banco Scotiabank (Peru) 12,500 9,400Banco Interbank (Peru) 7,470 19,203Banco Santander (Peru) - 12,500Banco ICBC Peru Bank (Peru) - 3,500Multibank, Inc (Panama) - 5,000 36,120 59,603
For purposes of reconciliation with the information provided in the consolidated statement of cash flows, following is the movement of bank loans for the years ended 31 December:
2015 2014 uSD uSD
Initial balance 59,603 26,025Cash transactionsBank loans proceeds 128,383 121,590Bank loans payments ( 151,866) ( 88,987)Non-cash transactionsBank loans assumed on business combination - 975Closing balance 36,120 59,603
Loans represent promissory notes with maturities up to 180 days, which were obtained for working capital. These loans bear fixed annual interest rates that are between 1.55 per cent and 4.50 per cent (between 2.60 per cent and 5.70 per cent in 2014). These loans are guaranteed by inventories and lands of the Group for the similar amounts of the loans.
24 buSinESS COMbinAtiOn
a) Pacifico Azul S.A.
On 28 February 2014, Marinazul S.A. (subsidiary of the Company) acquired 100% of the share capital of Pacifico Azul S.A., for a consideration of USD4,338. The net assets value of the acquired entity at the purchase date amounted to USD5,102, giving rise to the recognition of a gain in the consolidated statement of comprehensive income of USD764.
The acquired entity was engaged in shrimp farming. As a result of the acquisition, the Group expects to increases its hectares and level of production.
The following table summarizes the consideration paid by Marinazul S.A., the fair value of assets acquired and liabilities assumed at the acquisition date.
Recognised amounts of identifiable assets acquired and liabilities assumed uSDCash and cash equivalents 528Other accounts receivable 549Inventories 909Prepaid expenses 4Property, plant and equipment 5,824Trade accounts payable ( 45)Other accounts payable ( 297)Long-term debt ( 1,422)Deferred income tax ( 948)Total identifiable net assets 5,102
Purchase consideration 4,338Total identifiable net assets ( 5,102)Gain in acquisition ( 764)
Purchase consideration 4,338Cash and cash equivalents by acquired subsidiary ( 528)Cash consideration 3,810
Acquisition-related costs of USD19 have been charged to administrative expenses in the consolidated income statement for the year ended 31 December 2014.
The fair value of other receivables is USD549. The gross contractual amount for other receivables due is USD574, of which USD25 is expected to be uncollectible.

Annual Report 2015 CAMPOSOLAnnual Report 2015
CAMPOSOLCONSOLIDATED FINANCIAL STATEMENTS 31 DECEMBER 2015 AND 2014
133132
The gain on acquisition is supported by valuations performed by independent appraisers. The sale and purchase agreement does not contemplate any contingent consideration that may affect the consideration paid on acquisition.
The gain on acquisition is explained by the fact that the former owner needed to exit the specific business of the acquired entity in order to pursue other business that is currently developing.
The amounts of the net identifiable assets and liabilities recognized in the consolidated financial statements are final values as established by IFRS 3.
The revenue included in the consolidated statement of comprehensive income since 28 February 2014 contributed by Pacifico Azul was USD121. Pacifico Azul also contributed loss of USD44 over the same period.
Had Pacifico Azul been consolidated from 1 January 2014, the consolidated statement of income would show pro-forma revenue of USD269,306 and loss of USD19,447.
On 17 November 2014, Marinazul S.A. (subsidiary of the Company) acquired 80% of the share capital of Corporacion Refrigerados INY S.A., for a consideration of USD9,876. The net assets value of the acquired entity at the purchase date amounted to USD30,280, giving rise to the recognition of a gain in the consolidated statement of comprehensive income of USD14,348.
The acquired entity was engaged in shrimp farming, industrial processing and distribution of sea products. As a result of the acquisition, the Group expects to increase its hectares and to manage its entire supply chain: fields, processing and distribution. The following table summarizes the consideration paid by Marinazul S.A., the fair value of assets acquired and liabilities assumed at the acquisition date.
Recognised amounts of identifiable assets acquired and liabilities assumed uSDCash and cash equivalents 1,954Trade accounts receivable 6,943Other accounts receivable 2,857Inventories 4,810Biological assets 1,046Prepaid expenses 68Intangibles 36Property, plant and equipment 26,415Bank loans ( 317)Trade accounts payable ( 2,527)Other accounts payable ( 7,105)Long-term debt ( 595)Deferred income tax ( 3,305)Total identifiable net assets 30,280
Purchase consideration ( 9,876)Non-controlling interest (20%) (Note 16) ( 6,056)Gain in acquisition ( 14,348)
Purchase consideration 9,876Cash and cash equivalents by acquired subsidiary ( 1,954)Cash consideration 7,922
Acquisition-related costs of USD247 have been charged to administrative expenses in the consolidated income statement for the year ended 31 December 2014.
The fair value of trade and other receivables is USD9,800 and includes trade accounts receivable with a fair value of USD6,943. The gross contractual amount for trade accounts receivable due is USD7,039, of which USD96 is expected to be uncollectible. The gross contractual amount for other receivables due is USD2,891 of which USD34 is expected to be uncollectible.
A contingent liability of USD4,833 has been recognized for a pending lawsuit in which Corporacion Refrigerados INY S.A. is a defendant. The claim has arisen from previous years examination of Peruvian Tax Authority in which resulted additional tax liabilities. As of 31 December 2015, the courts have not reached any decision on the case. The potential undiscounted amount of all future payments that the group could be required to make if there was an adverse decision related to the lawsuit is estimated to be USD22,744. As of 31 December 2014, there has been no change in the amount recognized for the liability at 17 November 2014, as there has been no change in the range of outcomes or assumptions used to develop the estimates.

Annual Report 2015 CAMPOSOLAnnual Report 2015
CAMPOSOLCONSOLIDATED FINANCIAL STATEMENTS 31 DECEMBER 2015 AND 2014
135134
A contingent liability of USD825 has been recognized for several tax-related contingencies.
The gain on acquisition is supported by valuations performed by independent appraisers. The sale and purchase agreement does not contemplate any contingent consideration that may affect the consideration paid on acquisition.
The gain on acquisition is explained by the death of the principal founder (principal owner of the company) in which heirs wanted to exit business of the acquired entity in order to pursue other business. The amounts of the net identifiable assets and liabilities recognized in the consolidated financial statements are final values as established by IFRS 3.
The revenue included in the consolidated statement of comprehensive income since 17 November 2014 contributed by Corporacion Refrigerados INY S.A. was USD2,661. Corporacion Refrigerados INY S.A. also contributed profit of USD453 over the same period.
Had Corporacion Refrigerados INY S.A. been consolidated from 1 january 2014, the consolidated statement of income would show pro-forma revenue of USD302,992 and loss of USD16,926.
c) Pesquera ABC S.A.C
On 17 November 2014, Marinazul S.A. (subsidiary of the Company) acquired 75% of the share capital of Pesquera ABC S.A.C, for a consideration of USD3,928. The net assets value of the acquired entity at the purchase date amounted to USD3,892, giving rise to the recognition of goodwill of USD1,009.
The acquired entity was engaged in purchasing, processing and selling seafood’s products on local and international markets. As a result of the acquisition, the Group is expected to manage its entire supply chain: purchasing, processing and distribution.
The following table summarizes the consideration paid by Marinazul S.A., the fair value of assets acquired and liabilities assumed at the acquisition date.
Recognised amounts of identifiable assets acquired and liabilities assumed uSDCash and cash equivalents 211Trade accounts receivable 702Other accounts receivable 1,642Inventories 980Prepaid expenses 14Property, plant and equipment 6,405Bank loans ( 658)Trade accounts payable ( 3,358)Other accounts payable ( 469)Long-term debt ( 619)Deferred income tax ( 958)Total identifiable net assets 3,892
Non-controlling interest (25%) (Note 16) ( 973)Goodwill 1,009Purchase consideration 3,928
Cash and cash equivalents by acquired subsidiary ( 211)Cash consideration 3,717
Acquisition-related costs of USD98 have been charged to administrative expenses in the consolidated income statement for the year ended 31 December 2014.
The fair value of trade and other accounts receivable is USD2,344. The gross contractual amount for trade and other receivables due is USD1,359, of which USD41 is expected to be uncollectible.
A contingent liability of USD218 has been recognized for several tax-related contingencies.The revenue included in the consolidated statement of comprehensive income since 17 November 2014 contributed by Pesquera ABC S.A.C. was USD822. Pesquera ABC S.A.C. also contributed loss of USD112 over the same period.
Had Pesquera ABC S.A.C. been consolidated from 1 january 2014, the consolidated statement of income would show pro-forma revenue of USD272,117 and loss of USD20,887.

Annual Report 2015 CAMPOSOLAnnual Report 2015
CAMPOSOLCONSOLIDATED FINANCIAL STATEMENTS 31 DECEMBER 2015 AND 2014
137136
25 REVEnuE
Revenue represents the sale of fresh, preserved and frozen biological products.
For the years ended 31 December, comprise the following (Note 5):
2015 2014 uSD uSD
Asparagus 42,833 65,222Avocado 53,678 73,400Pepper 21,214 14,681Mango 23,082 23,499Seafoods 57,156 33,755Grapes 16,844 23,694Blueberry 48,093 9,542Other 9,792 9,663 272,692 253,456
26 COSt OF SALES
Cost of sales for the years ended December 31 comprise the following:
2015 2014 uSD uSD
Cost of inventories recognized as expenses ( 139,005) 120,930Personnel expenses (Note 29) 50,192 48,934Depreciation (Note 6) 11,259 9,122Custom duties refund ( 7,253) ( 7,686) 193,203 171,300
In Peru, Camposol S.A., Marinazul S.A. and Corporación Refrigerados INY S.A. are beneficiaries of a simplified procedure for custom duties refunding (Drawback), at a rate of 4.0% of FOB value of exports.
The cost of inventories recognized as expenses include amortization of software by USD 11 for 2015, USD 8 for 2014 (Note 8).
At 2015 the Group recognized in cost of sale a reduction in the book value of the inventories by carrying them out the net realizable value amounting to USD2,482 (Note 12 and 32).
27 SELLinG ExPEnSES
Selling expenses for the years ended December 31 comprise the following: 2015 2014 uSD uSD Freight 14,986 15,702Custom duties 5,673 8,500Amortization of customer relationships (Note 8) - 2,133Personnel expenses (Note 29) 4,003 3,936Selling commissions 412 256Analysis and quality control 545 216Consulting services 879 1,345Travel and business expenses 931 2,208Insurances 1,119 990Subscriptions to associations 240 691Other expenses 1,531 1,585 30,319 37,562
28 ADMiniStRAtiVE ExPEnSES
Administrative expenses for the years ended December 31 are comprised of the following: 2015 2014 uSD uSD
Personnel expenses (Note 29) 11,832 11,547Professional fees 2,517 5,751Statutory auditors’ remuneration 56 86Audit services and others 279 230Depreciation (Note 6) 881 757Travel and business expenses 768 1,420Transport and telecommunications 923 1,066Directors’ remuneration (Note 29) 394 370Renting of machinery and equipment 2,428 1,919Amortization of computer software (Note 8) 537 482Materials and supplies 889 1,196Maintenance 745 1,038Insurances 233 279Utilities 95 67Taxes other than income tax 150 190Other expenses 2,177 2,305 24,904 28,703

Annual Report 2015 CAMPOSOLAnnual Report 2015
CAMPOSOLCONSOLIDATED FINANCIAL STATEMENTS 31 DECEMBER 2015 AND 2014
139138
The other expenses stated above includes fees of USD125 (2014: USD80) for tax consultancy services and other non-audit services charged by the Company’s statutory audit firm.
29 PERSOnnEL ExPEnSES
Personnel expenses for the years ended December 31 are comprised of the following:
2015 2014 uSD uSD
Salaries and wages 56,041 55,397Vacations 2,296 2,251Other employees’ benefits 7,011 5,266Other expenses 1,073 1,873 66,421 64,787
Personnel expenses are allocated as follows: 2015 2014 uSD uSD
Cost of sales (Note 26) 50,192 48,934Selling expenses (Note 27) 4,003 3,936Administrative expenses (Note 28) 11,832 11,547Directors’ remuneration - (Note 28) 394 370 66,421 64,787
30 OthER inCOME AnD ExPEnSES
Other income and expenses for the years ended December 31 are comprised of the following:
2015 2014 uSD uSD Other income Reversion of legal claims (Note 22) 853 -Recovery of written-off accounts receivable (Note 14) 121 -Gain on sale of property, plant and equipment (Note 32) 6,697 -Indemnity of insurance 522 1,025Services to third parties 784 1,177Gain on bargain purchase (Note 24) - 15,112Gain on leaseback - 942Other 541 175 9,518 18,431Other expenses Obsolescence of inventories (Notes 12) ( 4,969) ( 5,102)Donations and samples ( 104) (191)Impairment of trade and other receivable (Notes 13 and 14) ( 299) ( 1,562)Impairment of goodwill and fixed assets (Note 6 and 8) ( 4,926) -Expiration of drawback ( 1,363) -Write-off of blueberry project ( 627) -Write-off of missing inventory and fixed assets ( 342) ( 424)Moratory interest and fines ( 123) ( 369)Loss on sale of property, plant and equipment (Note 32) - ( 177)Loss on sale of supplies ( 825) -Acquisition-related costs of subsidiaries (Note 24) - ( 364)Services ( 744) ( 605)Other ( 1,212) ( 617) ( 15,534) ( 9,411)

Annual Report 2015 CAMPOSOLAnnual Report 2015
CAMPOSOLCONSOLIDATED FINANCIAL STATEMENTS 31 DECEMBER 2015 AND 2014
141140
31 FinAnCiAL inCOME AnD COStS
Financial income and costs for the years ended December 31 are comprised of the following:
2015 2014 uSD uSD Income Interest (Note 15) 13 116
Costs Interest on bonds and bank loans ( 22,415) ( 19,375)Interest on finance leases ( 1,311) ( 2,247)Tax on financial transactions ( 1,035) ( 1,021)Interest on accounts payable to suppliers ( 57) ( 103)Loss in investment funds (Note 15) ( 57) ( 8)Other finance costs ( 94) ( 44) ( 24,969) ( 22,798)
32 CASh GEnERAtED FROM OPERAtiOnS
note 2015 2014 uSD uSD Reconciliation of profit for the year to net cash from(used in) operating activities:Profit before income tax 27,959 ( 46,723)Depreciation 6 12,140 9,879Amortization 8 648 2,657Transference to biological assets 5,422 5,612Impairment of trade accounts receivable 13 and 14 299 1,562Obsolescence of inventories 12 4,969 5,102Impairment of plant and equipment 6 1,148 - Net realisable value impairment 12 and 26 2,482 - Recovery of doubtful accounts 14 ( 121) - Fair value of biological assets 9 ( 58,042) 45,217Gain / (loss) on sale of fixed assets 30 ( 6,697) 177Impairment of goodwill 8 3,778) - Gain on disposal of intangibles 8 - 73Loss attributable to associate 7 ( 254) ( 918)Deferred income tax 33 11,055) ( 12,984)Net exchange difference 518 1,254Write down off trade accounts receivable 13 and 14 (268) - Write down off inventories 12 ( 1,710) ( 3,377)Gain in acquisition of subsidiaries 24 - (15,112)Reversion of unused contingencies 22 ( 853) - Increase (decrease) of cash flows from operations due to changes in assets and liabilities: Trade accounts receivable 5,562 7,904Other accounts receivable 2,037 ( 11,168)Inventories 38,651 ( 34,103)Prepaid expenses 172 ( 115)Trade accounts payable ( 13,960) ( 12,340)Other accounts payable ( 1,467) 26,701Net cash generated from (used in) operating activities 33,589 (30,823)

Annual Report 2015 CAMPOSOLAnnual Report 2015
CAMPOSOLCONSOLIDATED FINANCIAL STATEMENTS 31 DECEMBER 2015 AND 2014
143142
• Offsetting 50% of the annual taxable profits until they are exhausted.
The Company has chosen the first system to offset tax losses.
At December 31, 2015, deferred income tax assets have been impaired due to the maturity of tax losses which amount to USD2,506. c) The Peruvian Tax Authority may review and, if required, amend the income tax or the tax loss carry forward determined by the Company and its subsidiaries in the last four years, as from january 1 of the following year in which the tax return of the corresponding income tax was filed (years open to examination). Since discrepancies may arise over the proper interpretation of the tax law applicable to the Group, it is not possible to anticipate at this date whether additional tax liabilities will arise as a result of eventual examinations. Additional tax, fines and interest, if any, will be recognized in results of the period in which the disagreement with the Peruvian tax authorities is resolved. Management considers that no significant liabilities will arise as a result of any eventual tax examinations.
The following table shows the income tax and value-added tax returns subject to review by the Tax Authority corresponding to the Company and its subsidiaries.
years open to tax review Company income tax Value Added tax Camposol Holding Limited 2009-2015 -Camposol S.A. 2011-2015 December 2011-2015Prodex S.A.C. 2011-2015 December 2011-2015 Vegetales del Norte S.A.C. 2011-2015 December 2011-2015 Muelles y Servicios Paita S.A.C. 2011-2015 December 2011-2015 Nor Agro Perú S.A. 2011-2015 December 2011-2015Marinasol S.A. 2011-2015 December 2011-2015 Marinazul S.A. 2011-2015 December 2011-2015 Grainlens Ltd. 2007-2015 -Blacklocust Ltd. 2009-2015 -Siboure Holding Ltd. 2008-2015 -Madoca Corp. 2011-2015 December 2011-2015Camposol Europa S.L. 2011-2015 December 2011-2015Campoinca S.A. 2011-2015 December 2011-2015Camposol Fresh B.V. 2011-2015 December 2011-2015Domingo Rodas S.A. 2011-2015 December 2011-2015Camarones S.A.C. 2011-2015 December 2011-2015Corporación Refrigerados YNI S.A. 2011-2015 December 2011-2015Pesquera ABC S.A.C. 2011-2015 December 2011-2015Pacifico Azul S.A.C. 2011-2015 December 2011-2015Inversiones Agrícolas Inmobiliarias S.A.C. 2014-2015 December 2014-2015
33 inCOME tAx ExPEnSE
a) According to the Peruvian tax legislation in force the income tax is determined on separate basis. Management has determined the taxable income under the general income tax regime, which requires adding to and deducting from the result derived from the accounting records maintained in Sol is those items considered as taxable and non-taxable, respectively.
As established under Law No.27360 dated 30 October 2000, that amends the Income Tax Law of individuals and legal persons engaged in the growing of crops and /or cattle as well as in industrial agriculture, the applicable income tax rate is 15%. This income tax regulations is applicable until 31 December 31 2021.
The standard rate of Cyprus income tax for 2015 and 2014 is 12.5% and for the Peruvian subsidiaries it ranges between 28% and 15% (30% and 15% for 2014).
2015 2014 uSD uSD Current income tax - 361Deferred income tax (Notes 17 and 32) 11,055 ( 12,984)Income tax expense (credit) 11,055 ( 12,623)
b) For the years 2015 and 2014 the income tax credited to income differs from the theoretical amount that would arise using the tax rate applicable to profit before workers’ profit sharing and income tax as follows:
2015 2014 uSD uSD Profit (loss) before income tax 27,959 ( 46,723)Theoretical income tax 4,194 ( 7,008)Income not subject to tax ( 1,531) ( 982)Expenses not deductible for tax purposes 169 459Impairment and expiration of tax loss 2,506 -Foreign exchange – non monetary assets 7,044 -Impact of change in tax rate 467 ( 4,421)Other ( 1,794) ( 671)Income tax expense / (credit) 11,055 ( 12,623)
According to tax Peruvian Legislation, there are two systems to offset net losses arising from 2004:
• Offsetting the total tax loss against the future taxable profits to be obtained in the four years from the fiscal year following the year in which the tax loss was generated; after those four years have elapsed, any remaining tax loss that has not been offset, will not be able to be offset against future taxable profits.

Annual Report 2015 CAMPOSOLAnnual Report 2015
CAMPOSOLCONSOLIDATED FINANCIAL STATEMENTS 31 DECEMBER 2015 AND 2014
145144
34 bASiC AnD DiLutED EARninGS PER ShARE
basic earnings per share
Basic earnings per share is calculated by dividing the profit attributable to equity holders of the Group by the weighted average number of ordinary shares in issue during the year excluding ordinary shares purchased by the company and held as treasury shares (Note 16).
2015 2014
Profit (loss) from continuing operations attributable toowners of the parent (USD) 16,114 ( 34,407)Profit from discontinued operations attributable toowners of the parent (USD) 514 456Profit (loss) attributable to owners of the parent (USD) 16,628 ( 33,951)
Weighted average number of ordinary outstanding shares (thousands) 31,897 29,834 Basic earnings (losses) per share (USD) 0.521 ( 1.138)
The Company was incorporated on july 9, 2007. One class of 2,570,000 initial shares does not grant the voting rights or participation in dividend distributions and are not taken into account for the purposes of determining earnings per share.
On March 13, 2015 the Shareholders approved the conversion, re/assignation and the re/classification of the initial 2,570,000 dormant shares to ordinary shares; therefore, these shares grant the voting rights, participation in dividend distributions and are taken into account for the purposes of determining earnings per share since that date.
Share capital was increased through the exchange of shares with Camposol S.A. shareholders in March 2008 comprising 27,925,070 shares and a private placement with Fondo de Inversion Agroindustrial (FIDAF) of 1,908,750 shares.
Diluted earnings per share
Diluted earnings per share is calculated by adjusting the weighted average number of ordinary shares outstanding to assume conversion of all dilutive potential ordinary shares. The Group has not transactions which are dilutive. The Group determines the number of potential shares using the average market share price of the Group’s shares for the year. However, since during 2015 and 2014 the exchange value of the potential shares was greater than the fair value of the shares, the Group did not consider any potential ordinary shares for determination of the dilutive earnings per share; the dilutive earnings per share being the same as the basic earnings per share.
35 COntinGEnt LiAbiLitiES
As of 31 December 2015 the Group has labor-related contingencies and other claims amounting to USD547 (USD1,600 in 2014) which is included in the balance of provisions (Note 22).
36 tRAnSACtiOnS With ShAREhOLDERS AnD OthER RELAtED PARtiES
a) Transactions
The main transactions carried out between the Group and its related parties are as follows:
2015 2014 uSD uSD
i) Associate Empacadora de Frutos Tropicales S.A.C.Sale of services 3 45Purchase of services 3,643 4,372
ii) Entities related to Directors Apoyo Consultoría S.A.C. Purchase of services 3 41
Gestion del Pacifico S.A.C Sale of services 44 5Purchase of services and others 194 2,440Purchase of fixed assets 43 112
Asoc. para la certif. de productores agricolas proveedores Camposol Purchase of raw material 28 - Desarrollo Inmobiliario Mar Verde S.A.C.Sale of fixed assets 8,951 -
Integrity Packaging S.A.Sale of services 1 - Purchase of services 371 -

Annual Report 2015 CAMPOSOLAnnual Report 2015
CAMPOSOLCONSOLIDATED FINANCIAL STATEMENTS 31 DECEMBER 2015 AND 2014
147146
b) Amounts due from/to related parties
Other accounts receivable (Note 13) 2015 2014 uSD uSDi) Entities related to Directors Empacadora de Frutos Tropicales S.A.C. 1 - Gestión del Pacífico S.A.C. (*) 8 - Desarrollo Inmobiliario Mar Verde S.A.C. 31 - 40 -
Trade payables (Note 20)
i) AssociatesEmpacadora de Frutos Tropicales S.A.C. 570 720
ii) Entities related to Directors Gestión del Pacífico S.A.C. (*) 96 170Asoc. para la certif. de productores agricolas proveedores Camposol 47 - Apoyo Consultoría S.A.C. 1 - Integrity Packaging S.A. 271 - 985 890
(*) A manager of the Group is a shareholder of Gestión del Pacífico S.A.C.
The transactions during the year with related companies correspond to purchase of consulting, legal services, cash loans for working capital and purchase of raw materials.
These balances have no schedule date for collection or payment and do not bear interest; however, the effect on results, if interest would be charged, is not significant.
c) Compensation of the Group key management
2015 2014 uSD uSD
Salaries of key management (excluding remuneration of Directors) 3,174 3,715Remuneration of Directors (all of which are non - executives) 394 370
There are no management services provided by a related party to the Group
37 nOn-CuRREnt ASSEtS hELD FOR SALE AnD DiSCOntinuED OPERAtiOnS
The assets related to line of asparagus and artichokes have been presented as held for sale following the approval of the Group’s management and shareholders on November 2015 to sell these assets. The completion date for the transaction is expected by March 2016.
2015 2014 uSD uSD
Assets of disposal group classified as held for sale
Property, plant and equipment (Note 6) 1,751 - Assets from Agroindustrial Santa Angela (Note 6) 3,567 - Inventory 3,740 - 9,058 -
In December 2015, the Board decided to discontinue operations of Artichoke. On january and February 2016, the Group sold its production plant in the city of Trujillo for USD350. The profit from operations of this segment is shown under discontinued operations in the consolidated statement of comprehensive income of USD260.
A summary of the results of artichoke is shown below:
2015 2014 uSD uSD Profit and loss Revenue 16,637 14,098Cost of sales ( 15,646) ( 13,089)Gross loss 991 1,009
Selling expenses ( 515) ( 553)Operating loss 476 456
Loss before income tax 476 456Deferred income tax 38 -Profit for the year from discontinued operations 514 456
Cash flowsOperating activities 1,324 3,136Investing activities - - Financing activities - - 1,324 3,136

Annual Report 2015 CAMPOSOLAnnual Report 2015
CAMPOSOLCONSOLIDATED FINANCIAL STATEMENTS 31 DECEMBER 2015 AND 2014
149148
38 COMMitMEntS AnD GuARAntEES
a) Commitments and guarantees in respect of the bonds are set out in Note 19.
b) On October, 2008, Camposol S.A. signed an agreement with Peru Land & Farming LLC (PL&F) by means of which the Company gives first option to purchase avocado production from a designated area of 800 Has to be sold in the United States of America. When the US market opens for Peruvian avocado, PL&F will have the right to purchase 100% of the production from that area. The option will gradually decrease over ten years, after which it will maintain a lifetime option for 30% of the production in the designated area. The transactions will be settled at market price. At the reporting date, no changes in the agreement with PL&F have occurred.
c) On December 2014, Camposol S.A. issued a guarantee letter in favor of the Municipality of Lima amounting to USD7,500 for the project “Complementary design of the Wholesale Market of Santa Anita”. This project comprises putting up for concession the design, construction, financing, conservation and exploitation of the infrastructure relating to complementary design of the Wholesale Market of Santa Anita (“Desarrollo Complementario del Mercado Mayorista de Santa Anita”). The project also comprises building a modular and multifunctional plant to manage fresh produce. Different types of services will be provided related to the Project within the framework of the Peruvian Law for Wholesale Markets and Rules for application. The Project is divided in six areas for the different processes that will be performed within the Wholesale Market of Santa Anita (“WMSA”). These processes comprise providing value-added services to wholesalers, related parties which trade perishable products for human consumption, such as supermarkets.
Additionally, the Project will comprise constructing and developing complementary service areas, such as electric substations, machinery rooms for equipment and control over the cooling chain, restrooms and dressing rooms for workers and the general public, areas to handle waste material, vehicle and pedestrian areas, as well as parking lots and green areas.
The Project is intended to make WMSA become the major perishables supply point for the larges distribution chains in Metropolitan Lima as well as a potential strategic logistics point for wholesale producers and retailers in Lima seeking to become international.
As of 24 March 2015 the City Hall of Lima dismissed this private initiative, superseding the continuation of this project.
39 EVEntS AFtER thE REPORtinG PERiOD
• On 17 December, 2015, Camposol S.A. concludes a contract of sale in which transfers ownership of its processing line of preserved asparagus to Sociedad Agricola Viru S.A.C., which will be effective on january 2016.
• The Group is expecting to acquire 100% of the shares of Congelados y Frescos S.A.C. (Cofresac), by exchange of stock of Agroindustrias Santa Angela S.A.C., through its subsidiary Marinazul S.A., which will be effective in the first semester of 2016. Cofresac has, processing assets of seafood products located in Tumbes – Peru and cultivated ponds. The Group expect to increase the capacity to process seafood products with this acquisition.
Details of net assets acquired and goodwill are as follows:
uSD
Cash and cash equivalents 31Trade accounts receivable 381Other accounts receivable 13Inventories 144Prepaid expenses 8Property, plant and equipment 6,621Trade accounts payable ( 119)Other accounts payable ( 292)Long-term debt ( 121)Deferred income tax ( 702)Total identifiable net assets 5,964
uSD
Purchase consideration 3,587Total identifiable net assets ( 5,964)Gain in acquisition ( 2,377)
Purchase consideration 3,587Cash and cash equivalents by acquired subsidiary ( 31)Cash consideration 3,556
The purchase consideration represents the fair value of the shares of Santa Angela S.A.C at the date of the disposal and did not include any additional cash consideration.
There is no additional assets, liabilities and contingent liabilities identified in the purchase.

Annual Report 2015 CAMPOSOLCONSOLIDATED FINANCIAL STATEMENTS
31 DECEMBER 2015 AND 2014
150
There have been no additional relevant activities subsequent to the balance sheet date.
On 4 March 2016, 521,376 Ordinary shares of nominal value of EURO 0,01 each were allotted and issued out of the authorized but unissued share capital of the Company as follows:
• 430,621 ordinary shares of nominal value EURO 0,01 each at a premium of EURO 3,679,608.15 to Generación del Pacífico Grupo SL;
• 47,300 ordinary shares of nominal value EURO 0,01 each at a premium of EURO 404,170.18 to Osterlin Luis Dyer Ampudia;
• 11,738 ordinary shares of nominal value EURO 0,01 each at a premium of EURO 100,298.32 to William P. Dyer Osorio;• 15,179 ordinary shares of nominal value EURO 0,01 each at a premium of EURO 129,703.70 to Sergio Dyer Osorio;• 10,356 ordinary shares of nominal value EURO 0,01 each at a premium of EURO 88,486.98 to Yazmin Dyer Osorio;• 6,182 ordinary shares of nominal value EURO 0,01 each at a premium of EURO 52,822.21 to Rodrigo Dyer Fernandez.
No other material event occurred after the end of the financial year.
Independent auditor report in pages 56.

Annual Report
2015
Design: Carla Franco Photo: Julio Janssen / Gonzalo Olmos / Alex Bryce

www.camposol.com.pe