Annual Report 2014 - isuzu.co.jp18 Isuzu Motors Limited Annual Report 2014 (3) Financial conditions...
22
Financial Section ISUZU MOTORS LIMITED Annual Report 2014 Consolidated Five-Year Summary 16 MD&A 17 Consolidated Balance Sheets 20 Consolidated Statements of Income 22 Consolidated Statements of Comprehensive Income 23 Consolidated Statements of Change in Net Assets 23 Consolidated Statements of Cash Flows 24 Notes to Consolidated Financial Statements 25 Report of Independent Auditors 36
Transcript of Annual Report 2014 - isuzu.co.jp18 Isuzu Motors Limited Annual Report 2014 (3) Financial conditions...

Financial Section
ISUZU MOTORS LIMITED
Annual Report 2014
Consolidated Five-Year Summary 16
MD&A 17
Consolidated Balance Sheets 20
Consolidated Statements of Income 22
Consolidated Statements of Comprehensive Income 23
Consolidated Statements of Change in Net Assets 23
Consolidated Statements of Cash Flows 24
Notes to Consolidated Financial Statements 25
Report of Independent Auditors 36
16 I suzu Motor s L imi ted ■ Annual Repor t 2014
Consolidated Five-Year Summary
2014 2013 2012 2011 2010 2014
For the Year:
Net sales
Cost of sales
Gross profit
Selling, general and administrative expenses
Operating income
Income before extraordinary items
Income before income taxes
Net income
At Year-End:
Total assets
Net assets
¥ 1,080,928
962,056
118,872
107,862
11,010
11,393
9,139
8,401
¥ 1,110,383
354,534
¥1,415,544
1,213,996
201,548
113,328
88,220
91,258
76,700
51,599
¥ 1,112,459
387,058
¥ 1,400,074
1,189,109
210,964
113,591
97,373
102,893
101,881
91,256
¥ 1,213,402
479,644
¥ 1,655,588
1,400,877
254,710
123,927
130,783
141,719
138,213
96,537
¥ 1,340,822
620,959
$ 17,109,003
14,005,867
3,103,136
1,410,083
1,693,053
1,813,254
1,831,021
1,159,309
$ 14,785,832
7,471,374
¥ 1,760,858
1,441,483
319,374
145,125
174,249
186,620
188,448
119,316
¥ 1,521,757
768,953
2014 2013 2012 2011 2010 2014
For the Year:
Net sales
Cost of sales
Gross profit
Selling, general and administrative expenses
Operating income
Income before extraordinary items
Income before income taxes
Net income
At Year-End:
Total assets
Net assets
$ 9,588,244
8,012,111
1,576,132
860,897
715,235
771,072
774,858
549,388
$ 8,243,405
4,262,310
¥ 649,533
570,685
78,847
72,658
6,188
5,151
3,221
14,250
¥ 811,200
245,296
¥ 870,575
742,952
127,623
80,201
47,422
55,258
43,937
39,036
¥ 781,001
275,682
¥ 943,656
800,826
142,829
76,722
66,106
73,615
72,187
79,029
¥ 836,916
356,397
¥ 967,489
814,986
152,502
80,614
71,888
76,603
78,815
53,689
¥ 841,816
400,589
¥ 986,822
824,606
162,215
88,603
73,612
79,358
79,748
56,543
¥ 848,411
438,677
Note: U.S dollar amounts are translated from yen, for convenience only, at the rate of ¥102.92 = US$1; the approximate exchange rate prevailing on the Foreign Exchange
Market on March 31, 2014.
Millions of yen
Millions of yen
Thousands ofU.S. dollars
Thousands ofU.S. dollars
Non-Consolidated Five-Year Summary

17
Financial Section
Management’s Discussion and Analysis of Financial Condition and Results of Operation
Exchange rate fluctuations caused by the weakness of the yen combined with material cost reductions to contribute ¥25.3 billion and ¥20.2 billion, respectively, while sales and model mix fluctuations added ¥7.2 billion. Offsetting these were factors including a ¥4.8 billion increase in costs associated with the growth in sales and ¥4.5 billion in economic fluctuations.
As a result, Isuzu’s operating margin increased to 9.9%, compared to 7.9% for the previous year.
4. Non-operating gains/losses In fiscal 2014, Isuzu posted a non-operating gain of ¥12.3 billion, an improvement of ¥1.4 billion from the previous year.
Equity-method investment income fell ¥300 million from the previous year to ¥10.5 billion.
Reduction of interest-bearing debt resulted in a net interest (interest and dividends minus interest expenses) gain of ¥1.9 billion, an improvement of ¥1.6 billion compared to the previous year. This was augmented by a foreign exchange gain of ¥100 million, compared to a foreign exchange loss of ¥1.7 billion for the previous year.
5. Extraordinary gains/losses In fiscal 2013, Isuzu posted an extraordinary loss of ¥3.5 billion, reflecting extraordinary losses including loss on disposal of noncurrent assets, impairment loss, and loss on reevaluation of investments in nonconsolidated subsidiaries and credit obligations, and extraordinary income including gain from the sale of fixed assets, gain on sale of investment securities, and compensation income for expropriation. In fiscal 2014, Isuzu posted an extraordinary gain of ¥1.8 billion, reflecting an improvement of ¥5.3 billion from the previous year. Key factors reflect extraordinary losses, including loss on disposal of noncurrent assets, loss on change in equity, and loss on step acquisitions, and extraordinary income including gain from the sale of fixed assets, gain on sale of investment securities, and gain on negative goodwill.
6. Taxes Isuzu’s net tax expense in fiscal 2013 including current income taxes and deferred income taxes was ¥28.3 billion. In fiscal 2014, the net tax expense was ¥44.6 billion.
7. Minority interests Minority interests consist primarily of profits returned to the minority shareholders of Isuzu’s locally incorporated subsidiaries in the ASEAN region, China, and North America, and its Japanese parts manufacturers. Minority interests in fiscal 2014 increased to ¥24.4 billion, compared to ¥13.3 billion in fiscal 2013.
8. Net income The Group posted a net profit of ¥119.3 billion in fiscal 2014, an improvement of ¥22.7 billion from the previous year. Net income per share came to ¥70.43.
The following provides an analysis of the financial condition and results of operation in fiscal 2014. The following information contains forward-looking statements that reflect the judgment of management as of June 27, 2014.
(1) Significant accounting policies and estimates The consolidated financial statements of the Isuzu Group are prepared in accordance with generally accepted accounting principles of Japan. In the preparation of these statements, the amounts recorded for items including allowance for doubtful accounts, inventory, investments, income taxes, retirement benefits, and provision for product warranties are estimates that reflect the judgment of management. Due to the uncertain nature of estimates, in some cases actual results may vary from initial estimates, and this may have a negative impact on business results.
(2) Results of operations1. Overview of fiscal 2014 The Company posted sales of ¥1,760.8 billion (up 6.4% from the previous year), operating income of ¥174.2 billion (up 33.2% from the previous year), ordinary income of ¥186.6 billion (up 31.7% from the previous year), and net income of ¥119.3 billion (up 23.6% from the previous year).
2. Net sales In fiscal 2014, Isuzu’s consolidated-basis sales rose 6.4% from the previous year to ¥1,760.8 billion.
In the domestic commercial vehicle market, Isuzu maintained its high market share through the introduction of products with superior fuel efficiency and economy, capturing 33.4% of the medium-duty and heavy-duty trucks market (down 0.5 points from the previous year) and 39.6% of the light-duty (2-3 ton) truck market (up 0.1 points from the previous year). Demand for medium- and heavy-duty trucks rose to 79,929 (up 16.6% from the previous year) and demand for light-duty trucks rose to 91,520 (up 21.0% from the previous year) due in part to post-earthquake reconstruction demand and the government’s economic stimulation measures. As a result, domestic sales rose to ¥630.5 billion (up 6.5% from the previous year).
Sales in Asia fell 1.2% from the previous year to ¥595.7 billion. Although the market environment in Thailand slowed more than had been expected at the beginning of the fiscal year, the Group continued to maintain its high share with 31% of the Thai market.
North American sales rose 36.3% from the previous year to ¥98.6 billion, reflecting growth in demand due to a trend towards recovery in the U.S. economy.
Sales to other regions grew 12.3% to ¥435.8 billion, reflecting increased sales, particularly in the Middle East, Africa, and other regions.
3. Operating incomeOperating income in fiscal 2014 was ¥174.2 billion, up 33.2%
from a year earlier.

18 I suzu Motor s L imi ted ■ Annual Repor t 2014
(3) Financial conditions1. Cash flow Isuzu generated cash and cash equivalents (“net cash”) of ¥210.7 billion in fiscal 2014, up ¥32.8 billion from the previous year. Net cash of ¥159.2 billion provided by operating activities offset net cash of ¥110.3 billion used in investing activities and net cash of ¥38.4 billion used in financing activities. Free cash flow, calculated by subtracting cash flow provided by investing activities from cash flow provided by operating activities, resulted in a net cash inflow of ¥48.8 billion (down 38.7% from the previous year).
Cash flow from operating activities Cash flow from operating activities rose 16.1% to ¥159.2 billion from the previous year.
Net cash inflows of ¥188.4 billion from the effects of accounting for income before income taxes and majority interests and ¥42.0 billion from depreciation and amortization offset net cash outflows of ¥55.6 billion stemming from income tax and other payments.
Cash flow from investing activities Net cash used in investing activities increased 92.1% to ¥110.3 billion due primarily to an increase in expenditures associated with the purchase of fixed assets.
Cash flow from financing activities Net cash used in financing activities fell 46.7% to ¥38.4 billion.
The change was due primarily to the Group’s repayment of interest-bearing debt and its payment of dividends.
2. AssetsAs of March 31, 2014, combined consolidated assets totaled
¥1,521.7 billion, an increase of ¥180.9 billion from the previous year.
The figure includes ¥50.0 billion in cash and time deposits as well as ¥71.7 billion in property, plant and equipment.
3. LiabilitiesTotal liabilities at March 31, 2014, increased ¥32.9 billion from
the previous year to ¥752.8 billion.A decline in accrued retirement benefits of ¥68.7 billion
associated with the application of new accounting standards offset an increase of ¥97.4 billion in liabilities associated with retirement benefits.
4. Net assetsNet assets increased ¥147.9 billion in fiscal 2014 to ¥768.9
billion.Key factors included net income of ¥119.3 billion. As a result, Isuzu’s equity ratio improved 2.1 points from a year
earlier to 41.6%.
RisksThere are certain risks that could have a significant impact on
our earnings results, financial condition, and other information contained in the annual securities report, or share prices, and these risks are outlined below. (The following information includes forward-looking statements that reflect the judgment of management as of June 27, 2014).
1. Economic situation/supply and demand trends in Isuzu’s major markets
Vehicles account for an important portion of the Isuzu Group’s worldwide operating revenue, and demand for these vehicles is affected by the economic situation in the various countries and regions where Isuzu sells vehicles. Therefore, economic recession and an ensuing decline in demand in the Group’s major markets could have a negative impact on the Group’s performance and financial position. Price competition also entails the risk of price fluctuation for Isuzu products.
2. Interest rate fluctuationsThe Isuzu Group is constantly working to tighten its cash
flow management. Concerning the cost of financing, the Group remains vulnerable to the risk of higher interest payments having a negative impact on its performance and financial position should market rates rise sharply.
3. Foreign exchange fluctuationsThe business of the Isuzu Group includes the manufacture
and sale of products in several regions around the world. Local currency amounts for sales, expenses, assets, debt, and other items are therefore converted into Japanese yen in the preparation of Isuzu’s consolidated financial statements. Depending on the exchange rate in effect at the time of conversion, the yen amount for these items may change even if the underlying currency value has not changed. Moreover, because exchange rate fluctuations influence the prices paid by the Group for raw materials denominated in foreign currencies as well as the pricing of the products the Group sells, they may have a negative impact on the Group’s performance and financial position.
4. Dependence on major customersThe Isuzu Group supplies vehicle components to General
Motors Corporation (Detroit, MI) and its affiliates as well as to other vehicle manufacturers. Sales to these customers are affected by fluctuations in production and sales at these customer companies and other factors over which the Isuzu Group has no control, and therefore they could have a negative impact on the Group’s performance and financial position.
5. Suppliers and other providers of parts, materials, etc.The Isuzu Group sources the raw materials, components, and
products required for production from outside suppliers. Should supply-demand conditions significantly exceed suppliers’ capacity,

19
Financial Section
or should that capacity be dramatically reduced due to an accident or other unforeseen contingency affecting supplier facilities, it is possible that Isuzu may be unable to source these items in sufficient volume. Shortages or delays in the supply of parts and other materials could have a negative impact on the Group’s performance and financial position. It is also possible that a tight supply-demand situation would result in price increases for raw materials and other supplies, which could also have a negative impact on the Group’s performance and financial position by triggering rising costs if the increases cannot be absorbed internally, for example through improved productivity, or passed on to sales prices.
6. Product defectsAt its plants both inside and outside Japan, the Isuzu Group
manufacturers products according to the strictest globally accepted quality control standards. However, in the unusual event of a large-scale recall or product liability award (the Group is covered by product liability insurance, but in the case of costs exceeding insurance coverage), there could be a negative impact on the Group’s performance and financial position.
7. Joint venturesThe Isuzu Group engages in business in some countries in the
form of joint ventures due to legal and other requirements in those countries. Changes in the management policy, operating environment, etc., of these joint ventures could affect their performance, which could in turn produce a negative impact on the Group’s performance and financial position.
8. Disasters, power outages, and other interruptionsAlthough the Isuzu Group regularly conducts disaster
prevention inspections and facilities examinations at all sites in order to minimize the potential of a negative impact due to an interruption in the manufacturing process, it may not be possible to completely eliminate or minimize the impact that would arise from a disaster, power outage, or other interruption.
Additionally, a new H1N1 virus or other infectious disease pandemic could pose significant obstacles to the Group’s production and sales activities.
9. Securities investmentsThe Isuzu Group invests in securities to produce, sell, and
distribute its products as well as to build and maintain good relationships with its business partners. For marketable securities, a downturn in share prices could have a negative impact on the Group’s performance and financial position. In addition, if the financial condition of the companies in which Isuzu has invested, including through non-marketable securities, were to deteriorate due to factors such as a worsening business environment, this could have a negative impact on the Group’s performance and financial position.
10. Fluctuations in accounting estimatesThe Company develops “liabilities associated with retirement
benefits,” “deferred tax assets,” and other estimates as necessary in compiling its consolidated financial statements in line with rational standards. However, due to the uncertain nature of estimates, actual results may vary from estimated amounts, and this could have a negative impact on the Group’s performance and financial position.
11. Potential risks associated with international activities and foreign ventures
The Isuzu Group conducts its manufacturing and marketing activities in a broad range of overseas markets in addition to the Japanese domestic market. The following risks are inherent in such overseas business development and could have a negative impact on the Group’s performance and financial position:
• Unfavorable changes in the political or business climate • Difficulties in recruiting and retaining personnel • Inadequate technological infrastructure could have a negative
impact on the Group’s manufacturing activities or its customers’ support of its products and services
• Potential negative tax consequences • Social unrest stemming from terrorism, war, natural disasters
or other factors
12. Limits on intellectual property protectionThe Isuzu Group has accumulated technology and expertise
that differentiate it from its rivals; however, in certain regions due to legal restrictions the Group is unable to fully protect, or can only partly protect, its proprietary technology and expertise through intellectual property rights. As a result, the Group may be unable to effectively prevent third parties from using its intellectual property to make similar products.
13. Legal requirementsThe Isuzu Group is subject to various government regulations
in the countries in which it does business, such as business and investment approvals, statutes related to national security, tariffs, and other import and export regulations. The Group is also subject to legal requirements concerning areas such as commerce, antitrust, patents, consumer rights, taxation, foreign exchange, environment conservation, recycling, and safety. Unexpected changes or interpretations of these regulations could have a negative impact on the Group’s performance and financial position. Exhaust emissions regulations are generally being tightened amid growing environmental awareness. Since substantial investment is required to comply with these regulations, failure to generate sufficient sales to recover this investment could have a negative impact on the Group’s performance and financial position.

20 I suzu Motor s L imi ted ■ Annual Repor t 2014
Assets 2013 2014 2013 2014
Current Assets:
Cash and time deposits (Note 2)
Receivable:
Notes and accounts receivable
Less: allowance for doubtful receivable
Lease investment assets
Inventories
Deferred tax assets (Note 6)
Other current assets
Total Current Assets
Investments and Advances:
Investment securities (Note 3)
Unconsolidated subsidiaries and affiliated companies
Others
Long-term loans
Deferred tax assets (Note 6)
Other investments and advances
Less: allowance for doubtful accounts
Total Investments and Advances
Property, Plant and Equipment (Note 4)
Land (Note 8)
Buildings and structures
Machinery and equipment
Lease assets
Vehicles on operating leases
Construction in progress
Less: accumulated depreciation
Net Property, Plant and Equipment
Other Assets
Total Assets
See accompanying notes to consolidated financial statements.
Consolidated Balance Sheets (As of March 31, 2014 and 2013 )
¥ 234,849
253,140
(1,022)
18,526
182,865
29,286
28,297
745,944
69,364
59,548
1,103
26,483
37,123
(1,910)
191,713
275,149
300,006
689,778
14,750
6,816
44,459
(758,160)
572,799
11,299
¥ 1,521,757
¥ 184,764
254,644
(824)
—
175,923
27,147
24,556
666,212
72,042
50,380
1,378
19,266
22,087
(1,558)
163,596
264,705
275,173
620,204
14,200
—
14,307
(687,569)
501,020
9,992
¥ 1,340,822
$ 2,281,860
2,459,586
(9,930)
180,008
1,776,777
284,558
274,949
7,247,811
673,969
578,587
10,724
257,321
360,702
(18,560)
1,862,745
2,673,425
2,914,947
6,702,085
143,315
66,230
431,978
(7,366,499)
5,565,483
109,791
$ 14,785,832
Millions of yenThousands ofU.S. dollars

21
Financial Section
Liabilities and Net Assets 2014 2013 2014
Current Liabilities:
Short-term loans
Electronically recorded obligations - operating
Notes and accounts payable
Lease obligations
Accrued expenses
Accrued income taxes (Note 6)
Deposits received
Other current liabilities
Total Current Liabilities
Long-term Debt (Note 4)
Accrued Retirement Benefits (Note 5)
Net Defined Benefit Liability (Note 5)
Deferred Tax Liabilities (Note 6)
Deferred Tax Liabilities Related to Land Revaluation (Note 8)
Other Long-term Liabilities
Contingent Liabilities (Note 9)
Net Assets
Shareholders’ Equity (Note 7)
Common and preferred stock
Common stock:
Authorized 3,369,000,000 shares in 2014 and 2013
Issued 1,696,845,339 shares in 2014 and 2013
Capital surplus
Retained earnings
Less: treasury stock, at cost 2,260,843 common shares in 2014
Total Shareholders’ Equity
Accumulated Other Comprehensive Income
Unrealized holding gains on securities
Unrealized losses on hedging instruments
Revaluation reserve for land (Note 8)
Foreign currency translation adjustments
Remeasurements of defined benefit plans
Total accumulated other comprehensive income
Minority Interests
Total Net Assets
Total Liabilities and Net Assets
See accompanying notes to consolidated financial statements.
$ 497,262
87,483
3,004,217
35,237
563,234
251,493
25,207
495,147
4,959,283
808,204
—
946,731
37,432
476,660
86,144
394,917
491,200
4,503,428
(6,579)
5,382,966
117,523
(990)
754,229
75,304
(174,931)
771,135
1,317,272
7,471,374
$ 14,785,832
¥ 59,972
—
315,266
2,916
53,430
33,014
2,652
43,536
510,789
80,724
68,769
—
2,002
49,142
8,435
40,644
50,427
364,477
(686)
454,863
10,531
(420)
79,342
(15,362)
—
74,091
92,005
620,959
¥ 1,340,822
¥ 51,178
9,003
309,194
3,626
57,968
25,883
2,594
50,960
510,409
83,180
—
97,437
3,852
49,057
8,866
40,644
50,554
463,492
(677)
554,014
12,095
(101)
77,625
7,750
(18,003)
79,365
135,573
768,953
¥ 1,521,757
Millions of yenThousands ofU.S. dollars

22 I suzu Motor s L imi ted ■ Annual Repor t 2014
2014 2013 2014Net Sales
Cost of Sales
Gross Profit
Selling, General and Administrative Expenses
Operating Income
Other Income (Expenses):
Interest and dividend income
Interest expense
Equity in earnings of unconsolidated subsidiaries and affiliates
Others, net
Income before Extraordinary Items
Extraordinary Items:
Gain on sales of investment securities
Gain on sales or disposal of property, plant and equipment, net
Gain on negative goodwill
Unrealized holding loss on non-consolidated subsidiaries and affiliates
Impairment loss on fixed assets (Note 13)
Loss on change in equity
Loss on step acquisitions
Others, net
Income before Income Taxes and Minority Interests
Income Taxes (Note 6):
Current
Deferred
Income Before Minority Interests
Minority Interests in Income of Consolidated Subsidiaries
Net Income
Yen U.S. dollars
Per Share of Common Stock
Net Income
—Basic
See accompanying notes to consolidated financial statements.
Consolidated Statements of Income (For the years ended March 31, 2014 and 2013 )
¥ 1,760,858
1,441,483
319,374
145,125
174,249
4,030
(2,071)
10,535
(123)
186,620
580
393
6,387
(11)
(370)
(2,880)
(1,161)
(1,108)
¥ 188,448
47,236
(2,587)
143,799
24,483
¥ 119,316
¥ 70.43
¥ 1,655,588
1,400,877
254,710
123,927
130,783
2,853
(2,583)
10,871
(205)
141,719
138
1,414
90
(3,504)
(266)
—
—
(1,378)
¥ 138,213
38,893
(10,530)
109,850
13,313
¥ 96,537
¥ 56.98
$ 17,109,003
14,005,867
3,103,136
1,410,083
1,693,053
39,157
(20,123)
102,363
(1,195)
1,813,254
5,642
3,822
62,063
(116)
(3,602)
(27,984)
(11,285)
(10,772)
$ 1,831,021
458,965
(25,141)
1,397,196
237,887
$ 1,159,309
$ 0.68
Millions of yenThousands ofU.S. dollars

23
Financial Section
Balance at March 31, 2012
Cash dividends
Reversal of revaluation reserve for land
Net income
Acquisition of treasury stock
Disposal of treasury stock
Change of scope of equity method
Net changes on items other than shareholders’ equity
Balance at March 31, 2013
Cash dividends
Reversal of revaluation reserve for land
Net income
Acquisition of treasury stock
Disposal of treasury stock
Change of scope of equity method
Net changes on items other than shareholders’ equity
Balance at March 31, 2014
¥ 64,155
27,849
92,005
43,568
¥ 135,573
—
—
(18,003)
¥ (18,003)
¥ 40,644
40,644
¥ 40,644
¥ 280,032
(11,863)
(227)
96,537
364,477
(20,337)
119,316
36
¥ 463,492
¥ (653)
(33)
(686)
(75)
84
¥ (677)
¥ 7,505
3,025
10,531
1,564
¥ 12,095
¥ 79,114
227
79,342
(1,717)
¥ 77,625
¥ (216)
(203)
(420)
318
¥ (101)
¥ (41,366)
26,004
(15,362)
23,112
¥ 7,750
¥ 50,427
50,427
126
¥ 50,554
Balance at March 31, 2013
Cash dividends
Reversal of revaluation reserve for land
Net income
Acquisition of treasury stock
Disposal of treasury stock
Change of scope of equity method
Net changes on items other than shareholders’ equity
Balance at March 31, 2014
See accompanying notes to consolidated financial statements.
Consolidated Statements of Change in Net Assets (Note 7) (For the years ended March 31, 2014 and 2013 )
Consolidated Statements of Comprehensive Income (For the years ended March 31, 2014 and 2013 )
$ (4,082)
3,092
$ (990)
$ 893,947
423,325
$ 1,317,272
$ (6,672)
(730)
823
$ (6,579)
$ 102,323
15,199
$ 117,523
$ 770,913
(16,684)
$ 754,229
—
(174,931)
$ (174,931)
$ 489,968
1,232
$ 491,200
$ 3,541,369
(197,601)
1,159,309
351
$ 4,503,428
Millions of yen
Commonstock
Capitalsurplus
Retainedearnings
Treasurystock,at cost
Unrealizedholding gains onsecurities
Revaluation reserve for
land
Unrealized losses on hedging
instruments
Foreign currency
translationadjustments
Minorityinterests
Remeasure-ments of defined
benefit plans
Thousands of U.S. dollars
Commonstock
Capitalsurplus
Retainedearnings
Treasurystock,at cost
Unrealizedholding gains onsecurities
Revaluation reserve for
land
Unrealized losses on hedging
instruments
Foreign currency
translationadjustments
Minorityinterests
2013 2014 2013 2014 Income Before Minority Interests
Other Comprehensive Income
Unrealized holding gains on securities
Unrealized losses on hedging instruments
Foreign currency translation adjustments
Revaluation reserve for land
Share of other comprehensive income of associates accounted for using the equity method
Total other comprehensive income (Note 14)
Comprehensive Income (Note 14)
Comprehensive Income Attributable to
Comprehensive income attributable to owners of the parent
Comprehensive income attributable to minority interests
See accompanying notes to consolidated financial statements.
¥ 143,799
1,588
318
14,481
84
8,417
24,891
168,690
142,593
¥ 26,096
¥ 109,850
3,015
(203)
26,746
227
9,020
38,806
148,657
125,591
¥ 23,066
$ 1,397,196
15,433
3,092
140,709
822
81,791
241,848
1,639,045
1,385,483
$ 253,561
Remeasure-ments of defined
benefit plans
$ 394,917
$ 394,917
$ (149,262)
224,567
$ 75,304
Millions of yenThousands ofU.S. dollars

24 I suzu Motor s L imi ted ■ Annual Repor t 2014
2014 2013 2014
Cash Flows from Operating Activities
Net income before income taxes and minority interests
Depreciation and amortization
Equity in earnings of unconsolidated subsidiaries and affiliates
Increase in provision for retirement benefits
Decrease (Increase) in provision for allowance for product warranty
Increase in provision for bonus accounts
Decrease in provision for allowance for doubtful accounts
Increase (Decrease) in net defined benefit liability
Interest and dividend income
Interest expenses
Gain on disposal of property assets
Loss on disposal of property assets
Gain (Loss) on sales of securities, net
Loss on impairment of fixed assets
Other extraordinary loss (income)
Decrease (Increase) in notes and accounts receivable
Decrease (Increase) in lease investment assets
Decrease (Increase) in inventories
Decrease (Increase) in other current assets
Increase (Decrease) in notes and accounts payable
Increase (Decrease) in accrued expenses and taxes
Increase (Decrease) in deposit received
Increase (Decrease) in other current liabilities
Others
Cash received from interest and dividend
Cash paid for interest
Cash paid for income taxes
Net Cash Provided by Operating Activities
Cash Flows from Investing Activities
Payment on purchase of investment securities
Proceeds from sales of investment securities
Payment on purchase of property, plant and equipment
Proceeds from sales of property, plant and equipment
Payment on long-term loans receivable
Collection of long-term loans receivable
Increase (Decrease) in short-term loans receivable
Increase (Decrease) in fixed deposits
Purchase of shares of subsidiaries resulting in change in scope of consolidation
Others
Net Cash Used in Investing Activities
Cash Flows from Financing Activities
Increase (Decrease) in short-term debt
Proceeds from long-term debt
Repayment on long-term debt
Redemption of bonds
Proceeds from minority shareholders
Repayment of lease obligations
Proceeds from sales of treasury shares
Payment on acquisition of treasury stock
Payment on dividends made by parent company
Payment on dividends to minority shareholders
Net Cash Used in Financing Activities
Effect of Exchange Rate Changes on Cash and Cash Equivalents
Net Increase (Decrease) in Cash and Cash Equivalents
Cash and Cash Equivalents at Beginning of the Year
Increase (Decrease) in Cash and Cash Equivalents due to change in scope of consolidation
Cash and Cash Equivalents at End of the Year (Note 2)
See accompanying notes to consolidated financial statements.
Consolidated Statements of Cash Flows (Note 15) (For the years ended March 31, 2014 and 2013)
¥ 188,448
42,698
(10,535)
—
1,614
1,292
(66)
1,454
(4,030)
2,071
(393)
1,124
(580)
370
(2,503)
22,550
(18,526)
5,149
(4,008)
(17,806)
651
(191)
(2,187)
982
9,450
(2,164)
(55,656)
159,209
(9,103)
5,532
(79,591)
2,575
(144)
232
1,792
(17,242)
119
(14,566)
(110,395)
7,170
27,410
(48,476)
—
4,522
(2,862)
330
(58)
(20,318)
(6,192)
(38,473)
13,321
23,660
177,879
9,171
¥ 210,710
$ 1,831,021
414,871
(102,363)
—
15,684
12,557
(648)
14,136
(39,157)
20,123
(3,822)
10,921
(5,642)
3,602
(24,328)
219,111
(180,008)
50,030
(38,947)
(173,013)
6,333
(1,861)
(21,252)
9,548
91,824
(21,028)
(540,771)
1,546,920
(88,456)
53,759
(773,331)
25,027
(1,402)
2,259
17,416
(167,537)
1,160
(141,533)
(1,072,637)
69,675
266,328
(471,007)
—
43,941
(27,816)
3,211
(564)
(197,423)
(60,166)
(373,822)
129,434
229,894
1,728,323
89,109
$ 2,047,327
¥ 138,213
35,896
(10,871)
2,076
938
638
1,238
—
(2,853)
2,583
(1,414)
1,440
(14)
266
(2,513)
2,503
—
(7,186)
3,091
(23,848)
769
(764)
9,749
(557)
8,970
(2,741)
(18,481)
137,125
(5,838)
79
(51,280)
3,854
(709)
323
19
(5,430)
—
1,512
(57,470)
(3,706)
1,536
(39,242)
(20,000)
6,978
(3,180)
—
(26)
(11,842)
(2,671)
(72,155)
8,547
16,046
160,665
1,166
¥ 177,879
Millions of yenThousands ofU.S. dollars

25
Financial Section
1. Basis of Presenting the Financial StatementsThe accompanying consolidated financial statements of Isuzu Motors
Limited (“the Company”) and consolidated subsidiaries are prepared
on the basis of accounting principles generally accepted in Japan,
which are different in certain respects as to application and disclosure
requirement of International Financial Reporting Standards, and are
compiled from the consolidated financial statements prepared by
the Company as required by the Financial Instruments and Exchange
Law of Japan. In addition, the notes to the consolidated financial
statements include information which is not required under accounting
principles generally accepted in Japan but is presented herein as
additional information.
In order to facilitate the understanding of readers outside Japan,
certain reclassifications have been made to the consolidated financial
statements prepared for domestic purposes and relevant notes have
been added.
The yen amounts are rounded down in millions. Therefore, total
or subtotal amounts do not correspond with the aggregation of such
account balances.
U.S. dollar amounts have been translated from Japanese yen for
convenience only at the rate of ¥102.92 = US$1, the approximate
exchange rate prevailing on the Foreign Exchange Market on March 31,
2014. The translations should not be construed as a representation that
Japanese yen have been or could be converted into U.S. dollars at that
rate. The U.S. dollar amounts are then rounded down in thousands.
Certain reclassifications have been made in the 2013 financial
statements to conform to the presentation for 2014.
2. Summary of Significant Accounting Policiesa) Consolidation The consolidated financial statements include the accounts of the
Company and significant subsidiaries. All significant inter-company
balances and transactions have been eliminated in consolidation.
The excess of cost of investments in the subsidiaries and affiliates over
the fair value of the net assets of the acquired subsidiaries at the dates
of acquisition is recognized as a consolidation goodwill, which is being
amortized over an estimated periods not exceeding 20 years.
b) Foreign Currency TranslationReceivables and payables denominated in foreign currencies are
translated into Japanese yen at the exchange rate of the balance sheet
date, and differences arising from the translation are included in the
financial statements of income as a gain or loss. The Company translates
the balance sheet accounts of foreign consolidated subsidiaries into
Japanese yen at the exchange rate of the balance sheet date of each
of those subsidiaries. Financial statements of income accounts of
consolidated overseas subsidiaries are translated using the average
exchange rate of the statements of income’s period. Differences arising
from the translation are presented as foreign currency translation
adjustments and minority interests in the balance sheet.
c) SecuritiesThe accounting standard for financial instruments requires that securities
be classified into three categories: trading, held-to-maturity or other
securities.
Marketable securities classified as other securities are carried at
fair value with changes in unrealized holding gain or loss, net of
the applicable income taxes, included directly in net assets. Non-
marketable securities classified as other securities are carried at cost
determined by the moving average method.
d) Inventories Inventories of the Company are valued at cost using the weighted
average method. (Balance sheet values are measured by the lower of cost
or market method.) Inventories of consolidated subsidiaries are principally
valued at cost using the specific identification method. (Balance sheet
values are measured by the lower of cost or market method.)
e) Property, Plant and Equipment (excluding lease assets)Property, plant and equipment are stated at cost. Depreciation of
property, plant and equipment of the Company and its consolidated
subsidiaries is calculated principally by the straight-line method
based on the estimated useful lives. Depreciation of property, plant
and equipment of few consolidated subsidiaries is calculated by the
declining balance method.
f) Software (excluding lease assets) Software used by the Company and its consolidated subsidiaries is
amortized using the straight-line method, based on the estimated useful
lives (generally 5 years).
g) LeasesThe Company, as a lessor, leases properties under arrangements. Sales
and cost of sales relating to finance lease transactions are recognized on
receipt of lease payments.
The Company is also a lessee of various assets. Lease assets relating
to finance lease transactions without transfer of ownership are
depreciated over the lease period by the straight-line method, assuming
the residual value is zero.
In addition, lease transactions whose commencement dates were on
or prior to March 31, 2008 are accounted for on a basis similar to that
for operating lease.
h) Employees’ Retirement Benefits The Company and its consolidated subsidiaries have defined benefit
pension plans. Consolidated subsidiaries have also defined contribution
pension plans.
The estimated amount of all retirement benefits to be paid at future
retirement dates is allocated equally to each service year using the
estimated number of total service years. Prior service costs are being
amortized as incurred by the straight-line method over periods, which
are shorter than the average remaining years of service of the eligible
employees. Actuarial gains or losses are amortized by the straight-line
method over periods within the average remaining years of service of
the eligible employees commencing with the following periods.
Some of the consolidated subsidiaries are adopting the simplified
method of calculating their retirement benefit obligations and its cost.
In the method, the amount which would be required to be paid
if all eligible employees of its subsidiaries voluntarily terminated their
employment as of the balance sheet date is recognized as retirement
benefit obligation.
Notes to Consolidated Financial Statements
26 I suzu Motor s L imi ted ■ Annual Repor t 2014
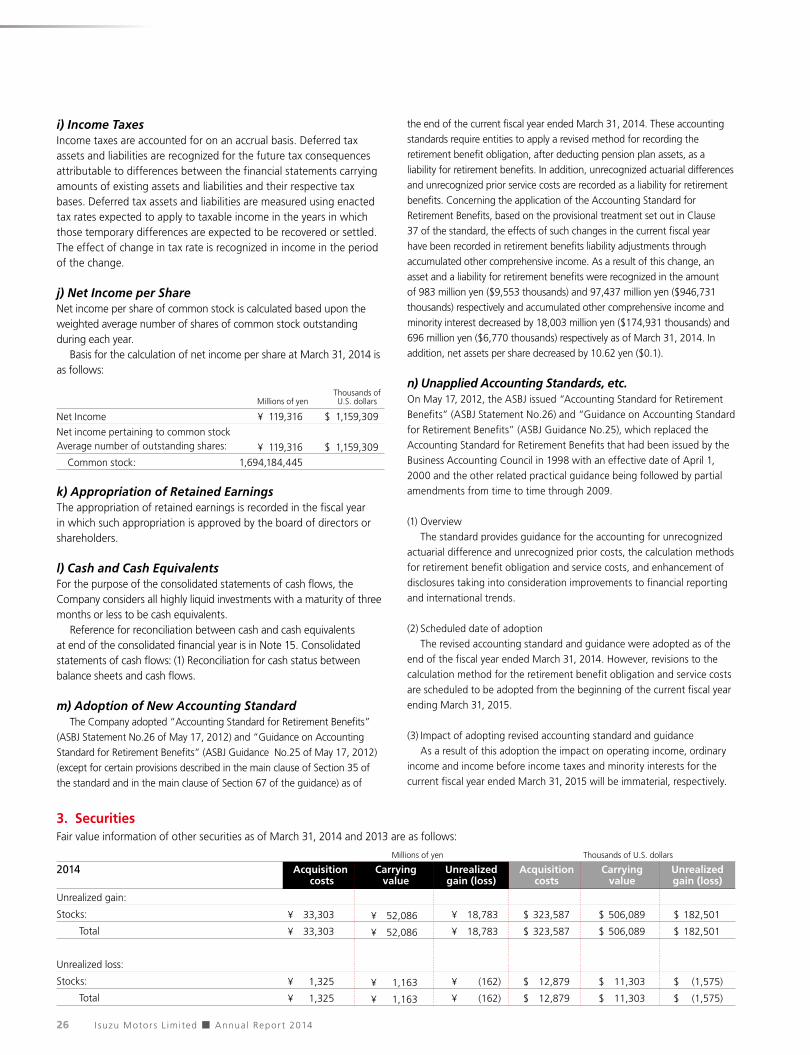
i) Income TaxesIncome taxes are accounted for on an accrual basis. Deferred tax assets and liabilities are recognized for the future tax consequences attributable to differences between the financial statements carrying amounts of existing assets and liabilities and their respective tax bases. Deferred tax assets and liabilities are measured using enacted tax rates expected to apply to taxable income in the years in which those temporary differences are expected to be recovered or settled. The effect of change in tax rate is recognized in income in the period of the change.
j) Net Income per ShareNet income per share of common stock is calculated based upon the weighted average number of shares of common stock outstanding during each year.
Basis for the calculation of net income per share at March 31, 2014 is as follows:
Thousands of
Millions of yen U.S. dollars
Net Income ¥ 119,316 $ 1,159,309
Net income pertaining to common stock Average number of outstanding shares: ¥ 119,316 $ 1,159,309
Common stock: 1,694,184,445
k) Appropriation of Retained Earnings The appropriation of retained earnings is recorded in the fiscal year in which such appropriation is approved by the board of directors or shareholders. l) Cash and Cash Equivalents For the purpose of the consolidated statements of cash flows, the Company considers all highly liquid investments with a maturity of three months or less to be cash equivalents.
Reference for reconciliation between cash and cash equivalents at end of the consolidated financial year is in Note 15. Consolidated statements of cash flows: (1) Reconciliation for cash status between balance sheets and cash flows.
m) Adoption of New Accounting StandardThe Company adopted “Accounting Standard for Retirement Benefits”
(ASBJ Statement No.26 of May 17, 2012) and “Guidance on Accounting
Standard for Retirement Benefits” (ASBJ Guidance No.25 of May 17, 2012)
(except for certain provisions described in the main clause of Section 35 of
the standard and in the main clause of Section 67 of the guidance) as of
the end of the current fiscal year ended March 31, 2014. These accounting
standards require entities to apply a revised method for recording the
retirement benefit obligation, after deducting pension plan assets, as a
liability for retirement benefits. In addition, unrecognized actuarial differences
and unrecognized prior service costs are recorded as a liability for retirement
benefits. Concerning the application of the Accounting Standard for
Retirement Benefits, based on the provisional treatment set out in Clause
37 of the standard, the effects of such changes in the current fiscal year
have been recorded in retirement benefits liability adjustments through
accumulated other comprehensive income. As a result of this change, an
asset and a liability for retirement benefits were recognized in the amount
of 983 million yen ($9,553 thousands) and 97,437 million yen ($946,731
thousands) respectively and accumulated other comprehensive income and
minority interest decreased by 18,003 million yen ($174,931 thousands) and
696 million yen ($6,770 thousands) respectively as of March 31, 2014. In
addition, net assets per share decreased by 10.62 yen ($0.1).
n) Unapplied Accounting Standards, etc.On May 17, 2012, the ASBJ issued “Accounting Standard for Retirement
Benefits” (ASBJ Statement No.26) and “Guidance on Accounting Standard
for Retirement Benefits” (ASBJ Guidance No.25), which replaced the
Accounting Standard for Retirement Benefits that had been issued by the
Business Accounting Council in 1998 with an effective date of April 1,
2000 and the other related practical guidance being followed by partial
amendments from time to time through 2009.
(1) Overview
The standard provides guidance for the accounting for unrecognized
actuarial difference and unrecognized prior costs, the calculation methods
for retirement benefit obligation and service costs, and enhancement of
disclosures taking into consideration improvements to financial reporting
and international trends.
(2) Scheduled date of adoption
The revised accounting standard and guidance were adopted as of the
end of the fiscal year ended March 31, 2014. However, revisions to the
calculation method for the retirement benefit obligation and service costs
are scheduled to be adopted from the beginning of the current fiscal year
ending March 31, 2015.
(3) Impact of adopting revised accounting standard and guidance
As a result of this adoption the impact on operating income, ordinary
income and income before income taxes and minority interests for the
current fiscal year ended March 31, 2015 will be immaterial, respectively.
2014
3. SecuritiesFair value information of other securities as of March 31, 2014 and 2013 are as follows:
Millions of yen Thousands of U.S. dollars
Acquisition Carrying Unrealized Acquisition Carrying Unrealized costs value gain (loss) costs value gain (loss)
Unrealized gain:
Stocks:
Total
Unrealized loss:
Stocks:
Total
$ 182,501
$ 182,501
$ (1,575)
$ (1,575)
$ 506,089
$ 506,089
$ 11,303
$ 11,303
$ 323,587
$ 323,587
$ 12,879
$ 12,879
¥ 18,783
¥ 18,783
¥ (162)
¥ (162)
¥ 52,086
¥ 52,086
¥ 1,163
¥ 1,163
¥ 33,303
¥ 33,303
¥ 1,325
¥ 1,325

27
Financial Section
2013 Millions of yen
Acquisition Carrying Unrealized costs value gain (loss)
Unrealized gain:
Stocks:
Total
Unrealized loss:
Stocks:
Total
¥ 16,040
¥ 16,040
¥ (198)
¥ (198)
¥ 45,991
¥ 45,991
¥ 2,515
¥ 2,515
¥ 29,950
¥ 29,950
¥ 2,713
¥ 2,713
Proceeds from sales of securities classified as other securities amounted to ¥651 million ($6,333 thousands) with an aggregate gain on sales of
¥293 million ($2,854 thousands) for the year ended March 31, 2014.
Non-marketable securities classified as other securities at March 31, 2014 amounted to ¥6,298 million ($61,194 thousands).
4. Long-Term Debt Long-term debt at March 31, 2014 and 2013 are as follows:
2014 2013 2014
Loans
Lease obligations
Less: current portion
Total long-term debts
¥ 104,995
9,473
31,288
¥ 83,180
¥ 122,541
8,940
50,758
¥ 80,724
$1,020,163
92,051
304,011
$ 808,204
Thousands of Millions of yen U.S. dollars
The annual maturities of long-term debt at March 31, 2014 are
summarized as follows:
Planned maturity date
Over 1 year within 2 years
Over 2 years within 3 years
Over 3 years within 4 years
Thereafter
Total
¥ 44,424
33,144
3,500
2,110
¥ 83,180
$ 431,642
322,040
34,013
20,507
$ 808,201
Thousands of Millions of yen U.S. dollars
The assets pledged as collateral for certain loans and other liabilities at
March 31, 2014 and 2013 are as follows: Thousands of Millions of yen U.S. dollars
2014 2013 2014
Building and structures
Machinery and equipment
Land
Others
¥ 11,255
11,687
13,101
202
$ 109,358
113,559
127,300
1,965
¥ 10,371
6,654
5,662
84
5. Retirement Benefit PlansThe Company has defined benefit plans, i.e., corporate pension fund
and lump-sum payment plans. Certain consolidated subsidiaries have
defined benefit plans, i.e., corporate pension fund, welfare pension fund
1. Defined benefit plans as of March 31, 2014 are follows;
(1) The reconciliation between beginning and ending balance of
projected benefit obligation Thousands of Millions of yen U.S. dollars
plans, and lump-sum payment plans and defined contribution pension
plans. The Company and its consolidated subsidiaries occasionally make
severance payments in addition to the retirement benefits noted above.
Some of the consolidated subsidiaries are adopting the simplified
method to determine net defined benefit obligations. In addition, the
Company and some of its consolidated subsidiaries have joined the multi-
employer defined benefit corporate pension plan, and the multi-employer
welfare pension fund plan. Among the above-mentioned plans, those,
for which it is possible to figure out, in a rational manner, the amount of
the pension assets which corresponds to the amount of the contributions
to be made by the Company, are included in the notes on the defined
benefit plan. Those, for which it is impossible to calculate, in a rational
manner, the amount of the pension assets which corresponds to the
amount of the contributions to be made by the Company are accounted
for in the same way as the defined contribution pension plan.
Changes in benefit obligation: 2014 2014
Projected benefit obligation
at beginning of the year
Service cost
Interest cost on projected benefit obligation
Actuarial loss
Benefit paid
Prior service cost
Increased by newly consolidated subsidiaries
Others
Projected benefit obligation
at end of the year
[Note]
Benefit obligations in certain subsidiaries calculated by the simplified method are included.
¥ 150,442
6,886
2,285
562
(8,135)
837
2,867
3,845
¥ 159,590
$ 1,461,740
66,908
22,205
5,462
(79,048)
8,136
27,860
37,363
$ 1,550,626

28 I suzu Motor s L imi ted ■ Annual Repor t 2014
(2) The reconciliation between beginning and ending balance of plan
assets
(3) The reconciliation between ending balance of projected benefit
obligation and plan assets and those balances on consolidated balance
sheet as of March 31, 2014
(5) Items recorded to accumulated other comprehensive income,
re-measurements of defined benefit plans (before related tax effects)
(7) Actuarial assumptions used to determine costs and obligations for
retirement benefits (Weighted Average)
(6) Allocation of plan assets
(4) Breakdown of retirement benefit cost
Thousands of Millions of yen U.S. dollars
Thousands of Millions of yen U.S. dollars
Thousands of Millions of yen U.S. dollars
Ratio
Thousands of Millions of yen U.S. dollars
Changes in plan assets: 2014 2014
Plan assets at beginning of the year
Expected return on plan assets
Actuarial gain on plan assets
Employer’s contributions
Benefit paid during the current fiscal year
Others
Plan assets at end of the year
[Note]
Plan assets in certain subsidiaries calculated by the simplified method are included.
¥ 53,633
1,253
2,289
8,375
(4,790)
2,374
¥ 63,136
$ 521,123
12,182
22,244
81,373
(46,547)
23,071
$ 613,448
2014 2014
Service cost
Interest cost on projected benefit obligation
Expected return on plan assets
Amortization of actuarial net loss
Amortization of prior service cost
Net retirement benefit cost to defined benefit plans
[Note]
Retirement benefit cost in certain subsidiaries calculated by the simplified method are included.
¥ 6,886
2,285
(1,253)
4,360
38
¥ 12,317
$ 66,908
22,205
(12,182)
42,370
378
$ 119,679
2014 2014
Projected benefit obligation under funded schemes
Plan assets
Projected benefit obligation under non-funded schemes
Asset and liability on the consolidated balance sheet, net
Net defined benefit liability
Net defined benefit assets
Net liability for retirement benefits
in the balance sheet
[Notes]
1. Assets related to retirement benefit plans are included in the consolidated balance sheet, investment and advances, other investment and advances.2. Plan assets and projected benefit obligations in certain subsidiaries calculated by the simplified method are included.
¥ 96,257
(63,136)
33,120
63,333
¥ 96,454
97,437
(983)
¥ 96,454
$ 935,261
(613,448)
321,812
615,365
$ 937,178
946,731
(9,553)
$ 937,178
2014 2014
Unrecognized prior service cost
Unrecognized actuarial loss
Total
¥ 1,113
22,945
¥ 24,059
$ 10,817
222,948
$ 233,765
2014 2014
Discount rate
Expected long-term return rates on plan asset
2014 2014
Debt securities
Equity securities
Cash and deposits
Life insurance company general accounts
Other assets
Total
In order to determine the expected long-term rate of return on assets,
were considered the current and expected future allocation of the
pension assets and the variety of the assets constituting the pension
assets.
1.6%
2.5%
33%
34%
9%
21%
3%
100%
2. Defined contribution pension plans and multi-employer pension
plans as of March 31, 2014 are follows;
Required contributions of certain subsidiaries to defined contribution
pension plans are ¥251million ($2,439 thousands).
Required contributions of multi-employer pension, which are
accounted for by the same method with as defined contribution
pension plans to welfare pension fund plans is ¥134million ($1,305
thousands).
The funded status of multi-employer pension as of March 31, 2013
The main factor of the difference indicated above, is the 3,414 million-
yen ($33,173 thousands) balance of the prior service cost. In this multi-
employer pension plan, the prior service cost is being amortized evenly
over the period of 20 years and the remaining period is 11 years at the
end of the current fiscal year. The Company and its subsidiaries have
Plan Assets
Projected benefit obligation in pension financing
Difference
¥ 10,936
15,772
¥ (4,835)
$ 106,264
153,250
$ (46,986)
Thousands of Millions of yen U.S. dollars

29
Financial Section
2013 2013
Service cost
Interest cost on projected benefit obligation
Expected return on plan assets
Amortization of actuarial net loss
Amortization of prior service cost
Net retirement benefit cost
Other
Total
2014 2013
Discount rates
Expected rates of return on plan assets
2013 2013
Retirement benefit obligation
at end of the year
Fair value of plan assets
Accrued retirement benefits
Prepaid pension cost
Net
(Details on net amount)
Unrecognized actuarial loss
Unrecognized prior service cost
Net
[Notes]
1. The government-sponsored portion of the benefits under the welfare pension fund plans has been included in the amounts shown in the above table.2. Certain subsidiaries apply the simplified method for the calculation of retirement benefits.
expensed the special contribution of 49 million yen ($477 thousands)
made in the current fiscal year in the current consolidated financial
statements.
The rate, indicated above, is not equal to the actual percentage of
contributions the Company and its subsidiaries have made to the
multi-employer plan.
6. Income TaxesAccrued income taxes in the balance sheets include corporation tax,
inhabitant tax and enterprise tax.
The significant components of the Company and its consolidated
subsidiaries’ deferred tax assets and liabilities as of March 31, 2014 and
2013 are as follows:
Thousands of Millions of yen U.S. dollars
2014 2013 2014
Deferred tax assets:
Accrued retirement benefits
Net defined benefit liability
Loss on write-down of
investments in subsidiaries and
allowance for doubtful accounts
Accrued expenses
Accrued bonus
Loss on inventory write down
Loss carry-forward
Unrealized profit eliminated
in consolidation etc.
Others
Total gross deferred tax assets
Valuation allowance
Total deferred tax assets
Deferred tax liabilities:
Reserve for reduction entry
of fixed assets
Unrealized holding gain on securities
Others
Total deferred tax liabilities
Net deferred tax assets
Deferred tax liabilities:
Reserve for reduction entry
of fixed assets
Unrealized holding gain on securities
Others
Net deferred tax liabilities
—
¥ 32,398
12,766
11,084
5,981
1,158
4,934
16,684
13,006
¥ 98,015
(34,992)
¥ 63,022
(310)
(5,757)
(1,184)
¥ (7,252)
¥ 55,770
(900)
(140)
(2,811)
¥ (3,852)
¥ 22,992
—
12,272
7,037
5,404
1,212
7,394
12,519
19,341
¥ 88,175
(36,365)
¥ 51,810
(31) (4,409) (955) ¥ (5,396)
¥ 46,413
(1,215)
(79)
(707)
¥ (2,002)
—
$ 314,790
124,044
107,697
58,116
11,253
47,947
162,114
126,378
$ 952,343
(339,996)
$ 612,346
(3,015)
(55,938)
(11,513)
$ (70,467)
$ 541,879
(8,745)
(1,366)
(27,320)
$ (37,432)
(2) Retirement benefit cost for the years ended March 31 is as follows:
(3) Actuarial assumptions used to determine costs and obligations for
retirement benefits
Thousands of Millions of yen U.S. dollars
¥ 7,322
2,807
(1,323)
4,808
(56)
¥ 13,557
211
¥ 13,768
$ 77,849
29,846
(14,070)
51,123
(604)
$ 144,143
2,248
$ 146,392
2014 2014
The ratio of contributions of the Company and its consolidated subsidiaries
in the total contributions of multi-employer pension plan
11.2%
3. Retirement benefit plan as of March 31, 2013 accounted for with
the legacy policy are follows;
(1) Retirement benefit obligation as of March 31, 2013 Thousands of Millions of yen U.S. dollars
¥ (150,442)
53,633
68,769
(1,265)
¥ (29,304)
¥ (29,077)
¥ (226)
¥ (29,304)
$ (1,599,599)
570,270
731,196
(13,456)
$ (311,587)
$ (309,175)
$ (2,412)
$ (311,587)
Amortization periods of
prior service cost
Amortization periods of
actuarial net loss (gain)
Amortization periods of net obligation arising
from accounting changes
1.0-2.5%
1.3-2.5%
1-10 years
(Straight line method)
10-19 years (Straight line or Declining balance method)
1 year

30 I suzu Motor s L imi ted ■ Annual Repor t 2014
A reconciliation between effective statutory tax rate and the effective
tax rate reflected in the accompanying consolidated statements of
income for the years ended March 31, 2014 and 2013 are as follows:
n Correction of amounts of Deferred tax assets and Deferred tax
liabilities due to changes in Corporation Tax Rates, Etc.
The “Act for Partial Revision of the Income Tax Act, etc.” (Law
No. 10 of 2014) was promulgated on March 31, 2014, as a result of
which the Company is no longer subject to the special reconstruction
corporation tax effective the fiscal year beginning on or after April 1,
2014. In conjunction with this promulgation, the effective statutory
tax rate used to measure deferred tax assets and deferred tax liabilities
with respect to the temporary difference expected to be eliminated in
the fiscal year beginning on April 1, 2014 is changed from the previous
38.0% to 35.6%.
As a result of this change, deferred tax assets (after deduction
of deferred tax liabilities) decreased by 1,337 million yen ($12,995
thousands), and unrealized gain or loss from hedging activities
increased by 1 million yen ($14 thousands) and income taxes (deferred)
increased by 1,338 million yen ($13,009 thousands).
Other contingencies
Isuzu Motors Co., (Thailand) Ltd., a subsidiary of the Company in
Thailand engaged in production and distribution of vehicles, was in
discussions with the relevant authorities in Thailand over preferential
custom duty related to the past transactions. At present it is difficult to
make a reasonable estimate of the potential monetary impact resulting
from those discussions and the impact has not been reflected to the
current consolidated financial statements.
2014 2013
Effective statutory tax rate
Tax credit
Net valuation allowance
Difference in tax rates applied at
foreign subsidiaries
Loss for this fiscal year by
consolidated subsidiaries
Equity in earnings of
unconsolidated subsidiaries and affiliates
Foreign withholding tax
Per capital levy of inhabitant tax
Decrease in deferred tax assets due
to change in corporation tax rates
Others
Effective tax rate
38.0%
(7.3)
(3.3)
(7.6)
0.5
(3.0)
2.5
0.1
—
0.7
20.5
38.0%
(5.0)
0.5
(11.3)
0.6
(2.2)
1.7
0.1
0.7
0.7
23.7
7. Shareholders’ EquityChanges in the numbers of shares issued and outstanding for the years
ended March 31, 2014 and 2013 are as follows:
Common stock outstanding 2014 2013
Balance at beginning of the year 1,696,845,339 1,696,845,339
Increase due to convertible stocks converted — —
Balance at end of the year 1,696,845,339 1,696,845,339
Treasury stock outstanding 2014 2013
Balance at beginning of the year 2,584,146 2,512,857
Increase due to purchase of odd stocks 148,858 71,289
Decrease due to sale of stocks (472,161) —
Balance at end of the year 2,260,843 2,584,146
8. Land RevaluationIn accordance with the Law concerning Revaluation of Land enacted
on March 31, 1999, the land used for business owned by the Company
and its domestic consolidated subsidiaries was revalued, and the
unrealized gain on the revaluation of land, net of deferred tax, was
reported as “Revaluation Reserve for Land” within net assets, and the
relevant deferred tax was reported as “Deferred Tax Liabilities related
to Land Revaluation” in liabilities for the fiscal year ended March 31,
2014.
Revaluation Date: March 31, 2000
In accordance with the Law concerning Revaluation of Land enacted
on March 31, 1998, the land used for business owned by certain
consolidated subsidiaries accounted for by the equity method was
revalued.
Revalued Date: March 31, 2001
The method of revaluation is as follows:
Under article 2-4 of the Enforcement Ordinance on Law concerning
Revaluation of Land, the land price for the revaluation was determined
based on the official notice prices assessed and published by the
Commissioner of National Tax Agency of Japan as basis for calculation
of Landholding Tax as stipulated in article 16 of the Landholding Tax
Law. Appropriate adjustments for the shape of land and the timing of
the assessment have been made. The land price for the revaluation for
some of the land is based on appraisal value.
The difference between the total fair value of business land, based
on the article 10 of the Enforcement Ordinance on Law concerning
Revaluation of Land, as of the end of the current fiscal year and
the total book value after revaluation revalued was ¥65,510 million
($636,514 thousands).
9. Contingent LiabilitiesContingent liabilities at March 31, 2014 and 2013 are as follows:
Thousands of Millions of yen U.S. dollars
2014 2013 2014
Guarantees of bank loans ¥ 697 ¥ 1,128 $ 6,776

31
Financial Section
Millions of yen Thousands of U.S. dollars
Classification Type of derivative transactions
Foreign exchange forward contracts
Buy
Japanese yen
Non-market U.S. dollar
transaction Foreign exchange forward contracts
Sell
Australian dollar
U.S. dollar
Others
Total
10. Lease Transactions1. Lessor
(1) Finance lease
i) Net investments in direct finance leases as of March 31, 2014 are as
follows:
2. Lessee
(1) Finance lease
Finance lease transactions, except for those which substantially transfer
the ownership to the lease, are as follows:
i) Amounts equivalent to acquisition costs, accumulated depreciation
and net book value of the finance lease assets as of March 31, 2014
and 2013
ii) Future minimum lease payments of finance lease as of March 31,
2014 and 2013 are as follows:
Amounts equivalent to interest expenses are calculated by the
interest method based on an excess of the sum of lease payments over
amounts equivalent to acquisition costs.(2) Operating lease
i) Future minimum lease payments to be received after the end of the
fiscal year are as follows:
(2) Operating lease
Future minimum lease payments of operating lease as of March 31,
2014 and 2013 are as follows:
Thousands of Millions of yen U.S. dollars
Thousands of Millions of yen U.S. dollars
Thousands of Millions of yen U.S. dollars
ii) Future minimum lease payments to be received after the end of the
fiscal year are as follows:
Thousands of Millions of yen U.S. dollars
Thousands of Millions of yen U.S. dollars
Thousands of Millions of yen U.S. dollars
2014 2013 2014
Acquisition costs
Accumulated depreciation
Net balance
2014 2013 2014
Due within 1 year
Thereafter
Total
2014 2013 2014
Due within 1 year
Thereafter
Total
¥ 446
392
53
¥ 28
23
52
¥ 1,768
6,119
7,887
¥ 1,129
976
152
¥ 105
56
161
¥ 1,277
5,472
6,749
$ 4,335
3,813
521
$ 276
231
508
$ 17,179
59,458
76,637
2014 2014
Total minimum lease payments to be received
Estimated unguaranteed
residual value of leased assets
Amounts equivalent to interest income
Net investment in direct finance leases
2014 2014
Due within 1 year
Thereafter
Total
2014 2014
Due within 1 year
Over 1 year within 2 years
Over 2 years within 3 years
Over 3 years within 4 years
Over 4 years within 5 years
Thereafter
Total
¥ 18,573
1,821
(1,868)
18,526
¥ 1,685
5,857
7,543
¥ 3,914
3,867
3,854
3,838
2,898
199
18,573
$ 180,467
17,697
(18,155)
180,008
$ 16,379
56,914
73,293
$ 38,032
37,578
37,454
37,296
28,163
1,940
180,467
11. DerivativesDerivatives recognized in the consolidated financial statements for the fiscal year ended March 31, 2014 are as follows:
1. Derivative transactions for which hedge accounting is not applied
(1) Foreign exchange-related
Contract amount
5,056
706
4,566
1,510
785
12,623
Over one year
—
—
—
—
—
—
Fair value
(66)
8
(102)
(4)
1
(163)
Unrealized gain (loss)
(66)
8
(102)
(4)
1
(163)
Contract amount
49,125
6,866
44,373
14,677
7,633
122,674
Over one year
—
—
—
—
—
—
Fair value
(648)
83
(999)
(39)
10
(1,593)
Unrealized gain (loss)
(648)
83
(999)
(39)
10
(1,593)

32 I suzu Motor s L imi ted ■ Annual Repor t 2014
(2*) Since interest rate swaps under the exceptional accounting method are accounted for as an integral part of long-term debt, the hedged
item, their fair values are included in the fair value of the underlying long-term debt.
(2) Interest rate-related
Millions of yen Thousands of U.S. dollars
Hedge accounting Type of derivative Main hedged itemsmethod transactions
Interest rate swaps Principal accounting
Pay fixed receive Long-term debtmethod
floating
Interest rate swaps Interest rate swaps
under the exceptional Pay fixed receive Long-term debt
accounting method floating
Total
Contract amount
—
38,859
38,859
Over one year
—
36,349
36,349
Fair value
—
(2*)
—
Contract amount
—
377,573
377,573
Over one year
—
353,178
353,178
Fair value
—
(2*)
—
2. Derivative transactions for which hedge accounting is applied
(1) Foreign exchange-related
Millions of yen Thousands of U.S. dollars
Hedge accounting Type of derivative Main hedged itemsmethod transactions
Foreign exchange forward contracts
Principal accounting Buy
method Japanese yen Accounts payable
Sell
U.S. dollar Accounts receivable
Australian dollar
Foreign exchange Foreign exchange
forward contracts under forward contracts
the designated hedge Sell Accounts receivable
accounting method U.S. dollar
Australian dollar
Total
Contract amount
4,457
11,306
3,858
4,201
6,140
29,962
Over one year
—
—
—
—
—
—
Contract amount
43,308
109,855
37,486
40,819
59,664
291,134
Over one year
—
—
—
—
—
—
(1*) Since foreign exchange forward contracts under the designated hedge accounting method are accounted for as an integral part of accounts
receivable, the hedged item, their fair values are included in the fair value of the underlying accounts receivables.
12. Financial InstrumentsFinancial instruments recognized in the consolidated financial statements for the fiscal year ended March 31, 2014 are as follows. Financial instru-
ments, whose fair values are not readily available, are not included in the following table.
Millions of yen Thousands of U.S. dollars
(1) Cash and time deposits
(2) Notes and accounts receivable
(3) Lease investment assets
(4) Investment securities
(5) Notes and accounts payable
(6) Electronically recorded obligations - operating
(7) Short-term loans
(8) Accrued expenses
(9) Long-term debt
(10) Derivatives
Because market prices of unlisted equity securities of ¥6,298 million ($61,194 thousands) and equity securities of non-consolidated subsidiaries and
affiliates of ¥69,364 million ($673,969 thousands) are not readily available, and their future cash flow cannot be estimated. It is extremely difficult to
assume their fair values. Therefore, they are not included in “(4) Investment securities” mentioned above.
The figures in parenthesis indicate those posted in liabilities
Carrying value
234,849
253,140
18,526
53,250
(309,194)
(9,003)
(23,516)
(41,623)
(104,995)
(257)
(
Fair value
234,849
253,140
18,984
53,250
(309,194)
(9,003)
(23,516)
(41,623)
(105,407)
(257)
Difference
—
—
458
—
—
—
—
—
(412)
—
Carrying value
2,281,860
2,459,586
180,008
517,393
(3,004,217)
(87,483)
(228,488 )
(404,426)
(1,020,163 )
(2,510 )
Fair value
2,281,860
2,459,586
184,460
517,393
(3,004,217)
(87,483)
(228,488 )
(404,426)
(1,024,170 )
(2,510 )
Difference
—
—
4,451
—
—
—
—
—
(4,006)
—
Fair value
(14)
6
(86)
(1*)
(94)
Fair value
(138)
65
(844)
(1*)
(916)

33
Financial Section
13. Impairment Loss on Fixed AssetsImpairment loss on fixed assets recognized in the consolidated financial
statements for the fiscal year ended March 31, 2014 is as follows:
Thousands of
Type Millions of yen U.S. dollars
Land
Machinery and equipment
Construction in progress
Other
¥ 166
20
88
95
$ 1,612
200
859
929
As a general rule, assets were grouped into business assets,
idle assets and assets for rent. Idle assets and assets for rent were
individually grouped by each item. For business assets, idle assets
that were in need for impairment due to the decline in fair value of
land, and business assets to be disposed of, their carrying values were
written down to the recoverable amounts.
As for business assets that had been decided to be disposed,
impairment loss, if any, is recognized at the point of time when the
decision is made on the disposal.
Breakdown of the impairment loss by asset type is as follows:
Thousands of Location Usage Type Millions of yen U.S. dollars
Fujisawa-shi, Kanagawa prefecture
Shimotsuga-gun, Tochigi prefecture
Kita Kyushu-shi, Fukuoka prefecture
Sendai-shi Miyagi prefecture
Total
Idle assets
Idle assets
Idle assets
Idle assets
Machinery, Buildings and other
Machinery
Buildings and structures
Structures
$ 2,294
85
773
448
$ 3,602
¥ 236
8
79
46
¥ 370
The recoverable amounts of assets are estimated based on the net
amount that those assets could be sold (net selling amount) for land
and buildings. The net selling amount is determined by the appraisal
value based on real estate appraisal standards.
14. Notes to Consolidated Statements of Comprehensive Income(1) Comprehensive income for the fiscal year ended March 31, 2013
Millions of yen
Comprehensive income attributable to owners of the parent
Comprehensive income attributable to minority interests
Total
¥ 125,591
23,066
¥ 148,657
(2) Other comprehensive income for the fiscal year ended March 31, 2013
Millions of yen
Unrealized holding gain on securities
Unrealized gain from hedging instruments
Revaluation reserve for land
Foreign currency translation adjustments
Share of other comprehensive income of non-consolidated
subsidiaries and affiliates accounted for using the equity method
Total
¥ 3,015
(203)
227
26,746
9,020
¥ 38,806
Millions of yen Thousands of U.S. dollars
Cash and time deposits
Notes and receivable
Lease investment assets
Total
Within one year
¥ 234,849
¥ 253,140
¥ 3,904
¥ 491,894
Over one year
—
—
¥ 14,622
¥ 14,622
Within one year
$ 2,281,860
$ 2,459,586
$ 37,936
$ 4,779,383
Over one year
—
—
$ 142,072
$ 142,072
Reclassification adjustments for other comprehensive income for the fiscal
year ended March 31, 2014 are as follows:
Thousands of
Details Millions of yen U.S. dollars
Unrealized holding gain on securities:
Gains arising during the current period
Reclassification adjustment for loss realized
Net current period change, before income taxes
Income taxes on net current period change
Net unrealized holding gain on securities
Unrealized loss from hedging instruments:
Losses arising during the current period
Reclassification adjustment for gain realized
Net current period change, before income taxes
Income taxes on net current period change
Net unrealized loss from hedging instruments
Revaluation reserve for land:
Losses arising during the current period
Income taxes on net current period change
Net revaluation reserve for land
Foreign currency translation adjustments:
Losses arising during the current period
Reclassification adjustment for gain realized
Net current period change, before income taxes
Income taxes on net current period change
Net foreign currency translation adjustments
Share of other comprehensive income of
unconsolidated subsidiaries and affiliates
accounted for using the equity method:
Losses arising during the current period
Reclassification adjustment for loss realized
Net current period change, before income taxes
Income taxes on net current period change
Net share of other comprehensive income of
unconsolidated subsidiaries and affiliates
accounted for using the equity method
Total other comprehensive income
$ 29,821
(2,738)
27,082
(11,059)
$ 15,433
$ 6,496
(3,637)
2,859
233
$ 3,092
$ 823
1
$ 822
$ 141,080
(379)
140,701
—
$ 140,701
$ 99,540
(17,749)
81,791
—
$ 81,791
$ 241,848
¥ 3,069
(281)
2,787
(1,138)
¥ 1,588
¥ 668
(374)
294
23
¥ 318
¥ 84
0
¥ 84
¥ 14,520
(39)
14,481
—
¥ 14,481
¥ 10,244
(1,826)
8,417
—
¥ 8,417
¥ 24,891
The redemption schedule for monetary receivables and marketable
securities with maturity dates after the end of the fiscal year is as
follows:

34 I suzu Motor s L imi ted ■ Annual Repor t 2014
Thousands of
Millions of yen U.S. dollars
2014 2013 2014
Cash on hand and in banks
Time deposits with maturities
exceeding three months
Cash and cash equivalents
¥ 184,764
(6,885)
¥ 177,879
¥ 234,849
(24,138)
¥ 210,710
$ 2,281,860
(234,532)
$ 2,047,327
15. Consolidated Statements of Cash Flows(1) Reconciliation for cash status between balance sheets and cash flows
Thousands of
Millions of yen U.S. dollars
2014 2013 2014
Assets and liabilities relating to finance
lease transactions
(2) Contents of important non-cash transactions
¥ 3,654
¥ 4,341
$ 42,181
16. Business CombinationBusiness combinations by means of acquisitionEstablishment of IJT Technology Holdings Co., Ltd. by means of joint share transfer
IJT Technology Holdings Co., Ltd. was established as of October 1, 2013, by means of joint share transfer from I Metal Technology Co., Ltd. (hereinafter called I Metal Technology), a subsidiary of the Company and Jidosha Buhin Kogyo Co., Ltd. (hereinafter called Jidosha Buhin Kogyo) and TDF Corporation (hereinafter called TDF), both of which are affiliated with the Company. The transaction was accounted for by the purchase method, provided in the accounting standard for business combinations, assuming I Metal Technology as the acquirer and Jidosha Buhin Kogyo and TDF as acquirees.
1. Outline of the business combination (1) Names and business description of the acquirees Names of the acquirees: Jidosha Buhin Kogyo Co., Ltd.
TDF Corporation
Description of their businesses: Manufacture of automobile
parts and others
(2) Objectives of the business combination The companies involved in the business combination are a subsidiary
and two affiliates of the Company and they are the Company’s
important business partners.
Integration of their operations and becoming subsidiaries of the
Company, will enable the following:
1) Agile development and expansion of overseas business centering on
the ASEAN region.
2) Evolving function of Japan operation as a hub for technological
improvements and developments.
3) Strengthened capability for offering for new products, new
technologies, and low-cost products.
(3) Effective date of the business combination October 1, 2013
(4) Legal form of the business combination Establishment of a joint holding company by transferring shares
(5) Name of the joint holding company after the share transfer IJT Technology Holdings Co., Ltd.
(6) Percentage of the acquired voting rights ...................... 41.62%
(7) Reason for the determination of the acquirer company I Metal Technology Co., Ltd. was determined as a acquirer because it
was a subsidiary of the Company.
2. Period for which the acquirees’ business results are included in the Company’s consolidated financial statements From April 1, 2013 to December 31, 2013
The business results for the period of April 1, 2013 to September 31, 2013
were presented as on equity in earning of affiliates under the equity method.
3. Cost of acquisition of the acquired companies and its breakdown Consideration
JT Technology Holdings’ common shares ...............................................
............................................... 17,131 million yen ($166,458 thousands)
Cost of acquisition .................. 17,131 million yen ($166,458 thousands)
4. Share exchange ratio, method of calculating the ratio, and number of shares issued (1) Share exchange ratio 1) For one share of common stock of I Metal Technology, 0.34 share of
common stock of IJT Technology Holdings
2) For one share of common stock of Jidosha Buhin Kogyo, 1 share of
common stock of IJT Technology Holdings
3) For one share of common stock of TDF, 0.4 share of common stock of
IJT Technology Holdings
(2) Method of calculation The calculation of the share exchange ratios was performed by several
third-party financial advisors and the concerned parties determined the
ratios based on the valuation report from those financial advisors.
(3) Number of shares issued ......................... 49,154,282 shares
5. Amount and cause of gain recognized from negative goodwill(1) Amount of gain recognized from negative goodwill ....................... ...................................................6,387 million yen ($62,063 thousands)
(2) Cause of negative goodwill The negative goodwill arose due to the gap between our equity
interest in each of the acquiree companies and the acquisition cost.
6. Assets acquired and liabilities assumed as of the date of the business combination. Current assets 31,990 million yen ($310,832 thousands)
Fixed assets 33,603 million yen ($326,499 thousands)
Total assets 65,594 million yen ($637,331 thousands)
Current liabilities 24,002 million yen ($233,216 thousands)
Fixed liabilities 10,073 million yen ($97,875 thousands)
Total liabilities 34,076 million yen ($331,092 thousands)
7. Estimated impact of the business combination on the consolidated profit and loss statement of this current fiscal year, and the method of estimation, assuming that this business combination were completed on the beginning of the current fiscal year. As the impact on the consolidated profit and loss statement is immaterial, disclosure is omitted.

35
Financial Section
Millions of yen
b) Geographical information
(i) Net salesMillions of yen
Millions of yen
Total
1,760,858
Total
572,799
Other
697,609
Other
33,535
Thailand
432,663
Thailand
69,621
Japan
630,586
Japan
469,643
Thousands of U.S. dollars
Thousands of U.S. dollars
Total
17,109,003
Total
5,565,483
Other
6,778,171
Other
325,832
Thailand
4,203,878
Thailand
676,461
Japan
6,126,953
Japan
4,563,189
(ii) Property, plant and equipment
Millions of yen
Net sales
425,584
134,695
Name of customers
Tri Petch Isuzu Sales Co., Ltd.
ITOCHU Corporation
Thousands of U.S. dollars
Net sales
4,135,099
1,308,736
Name of customers
Tri Petch Isuzu Sales Co., Ltd.
ITOCHU Corporation
(Note) Net sales are geographically classified by country or region in which
customers are located.
(Note) Net sales are geographically classified by country or region in which
customers are located.
(3) Information on impairment loss of noncurrent assets by business
segment
Year ended March 31, 2014
The Company and its consolidated subsidiaries are composed of a
single business segment, primarily engaged in manufacture and sale of
vehicles and its components, industrial engines.
Therefore the disclosure of this information is omitted.
(4) Information on amortization expense of goodwill and remaining
unamortized balance by business segment
Year ended March 31, 2014
The Company and its consolidated subsidiaries are composed of a
single business segment, primarily engaged in manufacture and sale of
vehicles and its components, industrial engines.
Therefore the disclosure of this information is omitted.
(5) Information on negative goodwill by business segment
Year ended March 31, 2014
The Company and its consolidated subsidiaries are composed of a
single business segment, primarily engaged in manufacture and sale of
vehicles and its components, industrial engines.
Therefore the disclosure of this information is omitted.Sales to third parties
Total
1,760,858
Other
299,105
Enginesand
components
112,456
Parts for overseas
production
79,806
Vehicles
1,269,489 Sales to third parties
Total
17,109,003
Other
2,906,197
Enginesand
components
1,092,661
Parts for overseas
production
775,426
Vehicles
12,334,718
Thousands of U.S. dollars
c) Information by each major customer
17. Subsequent Event1. Acquisition of treasury stock
The Company made a resolution at a meeting of its Board of Directors held
on May 12, 2014, on matters relating to an acquisition of treasury stock
pursuant to the provisions of Article 156 of the Corporation Law as applied
by replacing the provisions of Section 3, Article 165 of the Corporation
Law, as described below.
(1) Reason for acquisition of treasury stock Primarily to improve capital efficiency and implement a flexible capital policy.
(2) Type and number of shares to be acquired Common stock Up to: 20,000,000 shares (1.18% of the total number of outstanding shares excluding treasury stock as of
March 31, 2014)
(3) Total acquisition cost Up to: 10,000,000,000 yen ($97,162 thousands)
(4) Acquisition period From May 13, 2014 to June 30, 2014
2. Consolidation of shares, etc.
The Company resolved at a meeting of its Board of Directors held on
May 12, 2014, to carry out a consolidation of shares (at a rate of one
share for every two shares), a change in the number of shares making
up one unit (from 1,000 shares to 100 shares) and a change in the total
number of shares issuable by the Company (from 3,369,000,000 shares
to 1,700,000,000 shares) with the aim of enhancing the ease of trading
the Company’s shares, and improving their liquidity, and to submit
proposals regarding these changes at the 112th Annual General Meeting
of Shareholders held on June 27, 2014. This proposal was approved at the
Annual General Meeting of Shareholders and the effective date for the
consolidation of shares and all the other changes is October 1, 2014.
Per share information for the current fiscal year calculated on the
assumption that the consolidation of shares and other changes were
carried out at the beginning of the current fiscal year is as follows:
Net Assets per Share: 747.53 yen ($7.26)
Net Income per Share: 140.85 yen ($1.36)
18. Segment Information(1) Segment informationYear ended March 31, 2014 The Company and its consolidated subsidiaries compose a single business segment, primarily engaged in manufacture and sale of vehicles and its components, industrial engines. Therefore the disclosure of segment information is omitted.
(2) Related informationYear ended March 31, 2014 a) Information by product and service

36 I suzu Motor s L imi ted ■ Annual Repor t 2014
Report of Independent Auditors