
ANNUAL REPORT 2014 - BOBST Investors: Investors · Bobst Group SA Annual report 2014 – Letter to...
99
ANNUAL REPORT 2014 Bobst Group SA
Transcript of ANNUAL REPORT 2014 - BOBST Investors: Investors · Bobst Group SA Annual report 2014 – Letter to...

ANNUAL REPORT 2014Bobst Group SA

Bobst Group SA Annual report 2014 – Key figures
MID- TO LONG-TERM FINANCIAL TARGETS
Sales (in billion CHF) 1.4 – 1.5Operating result (EBIT) min. 8%Return on capital employed (ROCE) min. 15%Payout ratio 30 – 50%Equity ratio* 40 – 45%
* Excluding impact of IAS 19R.
KEY FIGURES
In million CHF
2010
2011 (restated)
2012 (restated)
2013 (restated)
2014
AssetsNon-current assets 645.8 39% 742.2 43% 558.9 37% 571.1 37% 524.6 32%
Current assets 997.6 61% 975.4 57% 966.8 63% 955.9 63% 1 098.6 68% 1 643.4 100% 1 717.6 100% 1 525.7 100% 1 527.0 100% 1 623.2 100%Liabilities Equity 577.7 35% 557.1 32% 410.1 27% 508.1 33% 454.8 28%
Non-current liabilities 508.2 31% 680.9 40% 600.8 39% 407.7 27% 482.1 30%
Current liabilities 557.5 34% 479.6 28% 514.8 34% 611.2 40% 686.3 42% 1 643.4 100% 1 717.6 100% 1 525.7 100% 1 527.0 100% 1 623.2 100%
Net cash/Net debt -163.3 -256.2 -190.4 -109.0 -17.7
Sales 1 280.2 1 270.3 1 263.7 1 353.9 1 300.0 Operating result (EBIT) 61.3 27.5 19.0 60.3 81.7As % of sales 4.8% 2.2% 1.5% 4.5% 6.3% Net result 49.3 2.5 -5.0 27.7 53.0As % of sales 3.9% 0.2% -0.4% 2.0% 4.1%As % of equity 8.5% 0.4% -1.2% 5.5% 11.7%
Capital expenditure (CAPEX) 56.8 87.6 62.5 29.5 27.1
Return on capital employed (ROCE) n/a n/a 2.5% 8.6% 12.6%
Share incomeShare price at the end of the year 43.0 23.3 26.1 30.3 38.4Market capitalization 765.8 415.0 464.8 538.8 634.3EPS (16 518 478 shares) 2.98 0.03 -0.43 1.58 3.06Price-earnings ratio 14.4 776.7 -60.7 19.1 12.5Dividend paid: – total, in million CHF 0.0 0.0 0.0 13.4 20.6– payout ratio 0.0% 0.0% 0.0% 48.4% 38.9%– dividend yield 0.0% 0.0% 0.0% 2.5% 3.3% Headcount 5 121 5 343 5 124 4 929 4 841% change compared to previous year -6.7% 4.3% -4.1% -3.8% -1.8%

1
Bobst Group SA Annual report 2014 – Contents
CONTENTSAnnual Report 2014 02 Letter to our shareholders 04Corporate Governance 06 Financial statement 2014 20 Contents 21 Consolidated financial statement 24 Bobst Group SA, statutory accounts 78
Remuneration Report 2014 88 Part A Content and method of determining 90 compensation, shareholding programs and the grant of loans
Part B 2014 Board and Executive Committee 93 compensation

ANNUAL REPORT 2014Bobst Group SA
2

3

4
“125 YEARS OF PASSION FOR PEOPLE AND FOR TECHNICAL INNOVATION”
Bobst Group and its environmentIn 2014, the global economy remained positive overall, but with large shifts in growth rates impacting the investment potential of many economies. Political instability in countries such as Ukraine, Syria, and Egypt, as well as currency fluctuations, has impinged on business dynamics. In Asia, the Chinese growth rate is lower than expected, while India has started to regain confidence after the last elections. North America is progressing strongly, yet South America remains subdued. In this challenging context, the resilience of the packaging industry represents a key element in the capacity of the Group to reach the ambitious objectives set for the year. Due to Amazon, eBay, Zalando, and others, e-commerce is contributing to a bright, strong future for packaging.
Value creationBobst Group has set a clear mid-term target for value creation of a minimum 8% EBIT and 15% ROCE. With the excellent performance of 2014 reaching 6.3% EBIT level, we were one year ahead of the average yearly improvement needed to get to the 8% mid-term. The decision of the Swiss National Bank on January 15, 2015 to discontinue the EUR/CHF 1.20 minimum floor introduced in 2011 will change the landscape for the Swiss export industry.
The Swiss-based operations, and translation effects, have a large impact on the Group’s EBIT. In light of this, value creation becomes more difficult to achieve and our mid-term objective will have to be adjusted, while maintaining our market and product strategies.
Group StrategyWe will continue to generate profitable growth by deploying our Group strategy based on the four pillars of effective organization, operational excellence, people and growth.We express the company values through the words “People – Knowledge and Values”, emphasizing behaviors, innovations and customer satisfaction.
TurnoverConsolidated sales for the full year 2014 amounted to CHF 1.3 billion, a decrease of CHF 54 million, or 4%, compared with 2013. The operating profit was CHF 81.7 million. As a share of the total turnover, the geographical distribution shows that the biggest increase occurred in Europe, with 46.3%, while Asia/Oceania was disappointing with 21.7%.
This was mainly due to important one-time sales in Indonesia recorded in 2013 and to a general slowdown of machines imported into China in 2014. The Americas gained slightly with a 29.2% share, while Africa recorded 2.8%.
Sales in the second half of the year were again higher than in the first semester. Sales of Sheet-fed products remained stable compared to the previous year, with strong activity in flat-bed die-cutters, flexo presses and folder-gluers for corrugated board compensating for the reduced demand for products in the folding carton industry.
The Business Unit Web-fed suffered in 2014, with sales down 15.8% due to lower activity in tobacco markets and in special machines for film applications. Consolidation among customers, new regulations and e-cigarettes might impact our activities in tobacco in the near future.
Sales of services and spare parts have been negatively impacted by exchange rate effects.
Our consolidated net result for 2014 of CHF 53 million represents an increase of CHF 25.3 million (91%) comparedto 2013.
The Board of Directors proposes a dividend for 2014 amounting to CHF 1.25 per share, which represents an increase of CHF 0.50 per share (67%) compared to CHF 0.75 per share in 2013.
Innovation is our company’s DNAInnovation is decisive for our future. As such we have launched or will be launching more than eight new models between Q1 2014 and Q2 2015:
In Folding Carton, the NOVACUT 106 ER Autoplaten® with in-line blanking offers easy automation of carton die-cutting, the SP 92 FCH & 106 FCH directly address the needs of the Chinese foiling market, and the LILA II range of folder-gluers brings added flexibility to packaging manufacture.
DEAR SHAREHOLDERS
Bobst Group SA Annual report 2014 – Letter to our shareholders

5
For Corrugated Board, in growing markets, the NOVAFLUTE allows users to enter the high quality litho-laminating business and the FFG 8.20 DISCOVERY produces a very wide range of boxes. The EXPERTFOLD 145/165 gives users true control over their corrugated board folding and gluing operations.
For Flexible Materials, the RS 3.0 delivers high quality and efficiency in gravure printing onto film, while the RS 5002 is a compact machine delivering good performance for users not requiring high levels of automation.
Some entities of the Group developed specific continuous improvement programs which are the result of a great multicultural team spirit and ultimately tend to increase customer satisfaction and profitability.
Board of Directors re-election/election At the forthcoming Annual General Meeting of Shareholders on April 29, 2015, the mandates of all members of the Board of Directors will come to an end. Alain Guttmann, Thierry de Kalbermatten, Michael W.O. Garrett, Ulf Berg and Jürgen Brandt will be proposed for re-election for a new period of one year. Prof. Dr. Gian-Luca Bona, CEO of Empa, will be proposed as a new member of the Board. His profile and experience will bring the company important added value in the field of new technologies, especially in the digital world.
Outlook for 2015Since December 2014, falling oil prices have been acting as a stimulus for consumption in the mature economies, while increasing risks in the emerging ones, particularly Russia and Brazil, with a possible domino effect on the world economy.
In Europe this situation is forcing the European Central Bank to put into place quantitative easing and the European authorities to make structural reforms. Thus economic recovery is very unlikely in the coming months, with growth expected to be around 0.8% in 2015.
In the United States, growth should reach a yearly average of 3% in 2015.
China is witnessing the first diminution of its key rate since 2012. The estimated 7% Chinese growth for 2015 is relative, as it remains in the context of gradual structural slowdown.
In 2015, Bobst Group will focus its strategy on innovation and product launches. We will dedicate core resources and energy to keeping our technological lead and enhancing customer satisfaction – which is one of our main priorities.
Our customers acknowledge our commitment to development and higher throughput.
On the Digital Packaging Solutions side, in 2015 we will be installing prototypes for digital printing at corrugated board sites.
The Business Unit Services has started a transformation program spanning the next two years to align every technology and process worldwide.
As bookings were good in the last months of 2014, the Group started 2015 with a higher backlog of orders than theyear before, and we assume that our customers’ positive investment mood will continue for the first months of 2015. The Group therefore anticipates a good utilization of production capacities for at least the first semester.
However, a significant negative impact comes from the decision of the Swiss National Bank to discontinue the minimum exchange rate of CHF 1.20 per Euro.
Vision leading to valuesThe vision of the company should be something powerful enough to encourage employees and to foster personalcommitment. It should contribute to the building of foundations for the next generation and be the driving factorbehind success – providing that everyone in the company adheres to it. To build and personify this vision, we needstrong, passionate collaborators and leaders who:— Understand that customers are essential to our
livelihood;— Contribute to value creation, both human and financial,
to foster mutual success;— Create an environment where it is enjoyable to live and
work.
We want to thank all our employees for their professionalism and involvement, as well as their determination to ensure the company’s success.
Our appreciation also goes to our shareholders, customers, banks, and financial partners, who have supported ussteadfastly over the long term. We will strive to deserve their confidence by further strengthening Bobst Group’s role as a leading player in the packaging industry.
Alain Guttmann
Chairman of the Board
Jean-Pascal Bobst
Chief Executive Officer
Bobst Group SA Annual report 2014 – Letter to our shareholders

6
Bobst Group SA Annual report 2014 – Corporate governance
CORPORATE GOVERNANCE

7
The amendments to the Articles of Association of Bobst Group SA necessary pursuant to the Federal Ordinance against Excessive Compensation (OaEC) will be tabled for the Annual General Meeting on 29 April 2015. References to the amended Articles of Association will figure, where required, in the Corporate Governance chapter of the Annual report 2015. The information in this chapter follows the sequence in the Annex to the Directive on Information relating to Corporate Governance of the SIX Swiss Exchange.
GROUP STRUCTURE AND SHAREHOLDERS
Group structureBobst Group, supplier of equipment and services for printing, coating & laminating, cutting, folding, and gluing, as well as other processes linked to the manufacturing of packaging, is organized by technical processes in three Business Units (BU):— BU Sheet-fed: combines the product lines for the folding carton and corrugated board
industries.— BU Web-fed: combines the product lines for the flexible materials industry and the Web-
fed Solutions product line for the folding carton industry.— BU Services: with a worldwide network of service centers, provides spare parts and
services to customers in the packaging industries and offers a full range of solutions allowing them to get the most from their equipment.
The sales organization is dedicated by industries – folding carton, corrugated board and flexible materials – and aligned with the activities of customers.
Bobst Group SA, based in Mex, Switzerland, is the holding company listed on the SIX Swiss Exchange and owns a number of non-listed companies as shown on page 74.
SIX SWISS EXCHANGE: BOBNN or 1268465 – ISIN: CH0012684657 – SIX TELEKURS: BOBNN,4 or 1268465,4 – BLOOMBERG: BOBNN SW press equity press enter – REUTERS: BOBNN.S. Market capitalization of Bobst Group SA CHF 634 million as at 31 December 2014.
Bobst Group SA Annual report 2014 – Corporate governance

8
Bruno de KalbermattenHonorary Chairman.
Bobst Group SA Annual report 2014 – Corporate governance
BOARD OF DIRECTORS Alain Guttmann Chairman.1958, Swiss national.
MScE, University of Lausanne (HEC).
Since 2005 Managing partner of CapDconsulting.
2000 – 2004 Founder of SFF Financial Services, and manager of a private equity fund.
1996 – 2000 Ernst & Young Consulting: Executive Vice President Central Europe and CEO for Switzerland.
1986 – 1996 Director and partner of ICME management consulting Lausanne and Paris.
1983 – 1986 Marketing brand manager for Jacobs Suchard.
Other Board Memberships:JBF Finance, Origins Holdings, Nextway, Voxia communication, Biokema, Wider. Member of various boards within the Bobst Group organization.
Thierry de KalbermattenVice Chairman.1954, Swiss national.
BA, University of Lausanne (HEC). MBA, IMD Lausanne, Switzerland.
1994 – 2005 Member of Bobst Group Executive Committee.
1990 – 1994 Head of Logistics Department at Bobst SA.
1986 – 1990 Marketing Manager at Bobst Group Inc., Roseland, USA.
1984 – 1986Rolex SA, Geneva, Switzerland.
1980 – 1982 UBS, Lausanne and Zurich, Switzerland.
Other Board Memberships:JBF Finance SA, Vice Chairman.
Michael W.O. Garrett1942, British and Australian national.
Graduate of IMD Business School Lausanne.
1961 – 2005 Nestlé: Market Head Australia and Japan and Executive Vice President, responsible for Zone Asia-Oceania-Africa & Middle East.
Other Board Memberships:Nestlé India, Hasbro Inc. USA and Gottex Fund Management Holdings Limited in Guernsey.

9
Bobst Group SA Annual report 2014 – Corporate governance
Ulf Berg 1950, Swiss national.
Diploma and PhD Mechanical Engineering, Technical University of Denmark.
Partner of BLR & Partners AG, Thalwil, Switzerland.
2004 – 2009CEO and subsequently Chairman of Sulzer Ltd, Switzerland.
2003 – 2004 CEO of SIG Beverages Int. Ltd, a division of SIG AG, Switzerland.
1999 – 2001CEO of Carlo Gavazzi Holding Ltd, Zug, Switzerland.
Other Board Memberships:EMS Chemie Holding SA Switzerland, Synagro Ltd Baltimore, USA, EEW Energy from Waste GmbH, Helmstedt, Germany, Stellba AG, Dottikon, Switzerland, Greater Zurich Area AG, Zurich, Switzerland, AM-Tec Kredit AG, Zurich, Switzerland, Member of the Executive Committee of Swissmem.
Jürgen Brandt1956, German national.
Bachelor of Science in Economic Engineering (Dipl. Wirtschafts-Ingenieur), Esslingen, Germany.
2015Owner of Brandt International Consulting GmbH, Switzerland.
2010 – 2014CFO of Sulzer Ltd, Winterthur, Switzerland.
2007 – 2010 CFO and Member of the Management Board, Austrian Energy & Environment Group GmbH, Austria.
2006 – 2007CFO of Von Roll Inova AG, Zurich, Switzerland.
2006CFO of Power Group Europe, Foster Wheeler, Finland.
2005 – 2006CFO of Sylvania Lighting International Ltd, Germany.
1999 – 2004Senior Vice President Finance Power and Environment Division, Alstom Power, France.
1997 – 1999CFO of Alstom Boilers GmbH, Germany.

10
Significant shareholdersRefer to the statutory accounts, page 83.
Cross-shareholdingsThere are no cross-shareholdings with other companies.
CAPITAL STRUCTUREThe share capital of Bobst Group SA is structured in registered shares of CHF 1.–. See Articles of Association under http://investors.bobst.com/documents.
CapitalThe amount of the ordinary share capital is CHF 16 518 478.–.The ordinary share capital is divided into 16 518 478 registered shares.
Authorized and conditional capital/Shares and participation certificates/ Dividend-right certificatesThere is no authorized and conditional capital, and there are no participation certificates, nor profit sharing certificates.
Changes in capital within the last three yearsSee notes to the statutory accounts, page 83.
Limitations on transferability and nominee registrationsThere are no limitations on the transferability of the shares. Nominees are registered pursuant to Article 11 of the Articles of Association.(http://investors.bobst.com/documents).
No nominee will be registered with voting rights for more than five percent of the shares issued. The Board may grant an exception to the five percent limit. No such exception has been granted in the year under review.
Convertible bonds and warrants/optionsThere are no convertible bonds or warrants/options.
Bobst Group SA Annual report 2014 – Corporate governance
11
Bobst Group SA Annual report 2014 – Corporate governance
BOARD OF DIRECTORS
Members of the Board of Directors/Other activities and vested interestThis information is available on pages 8–9 under the individual CV’s of the Board members.The members of the Board are all non-executive and none of them has operational management tasks for Bobst Group SA, or for any subsidiary. None of the members of the Board has been a member of the management of Bobst Group SA, or of any subsidiary, for the last three years.
Mr. Alain Guttmann was mandated as support for various mergers and acquisitions projects. Refer to the Remuneration report, Part B, page 94. No other member of the Board has significant business connections with Bobst Group SA or any subsidiary.
Elections and terms of office (see table below)With the entry into force on 1 January 2014 of the Federal Ordinance against Excessive Compensation in listed companies, the members of the Board are elected or re-elected for periods of one year.
Internal organizational structureThe Board has a Chairman and a Vice Chairman; it also has a Secretary who is not a member of the Board.
The Board meets at least five times per year in order to deal with the items on the agenda prepared by the Chairman. In 2014, the Board met six times – one meeting of a day and a half, one full day meeting and four half-day meetings. Four meetings were attended by all Board members, two meetings were attended by four out of five Board members. Members of the Group Executive Committee were present at all meetings.
For each meeting Board members receive the necessary documents in advance. The Board meetings are usually held at the head office of Bobst Group SA but, occasionally, the Board convenes at the site of one of the Group companies, or at any other business related location. While, from time to time, the Board meets with only its members present, as a rule the members of the Group Executive Committee are present and inform the Board about the activity in their respective area of responsibility.
The Remuneration and Nomination Committee is composed of members elected by the General Assembly and assumes the functions defined in the Remuneration and Nomination Committee Charter (http://investors.bobst.com/documents).
Members of the Board Since To be re-elected
Alain Guttmann, Chairman 2009 2015Thierry de Kalbermatten, Vice Chairman 2) 2005 2015Michael W.O. Garrett 1) 2005 2015Ulf Berg 4) 2006 2015Jürgen Brandt 3) 2013 2015
1) Chairman of the Remuneration and Nomination Committee.2) Member of the Remuneration and Nomination Committee.3) Chairman of the Audit Committee.4) Member of the Audit Committee.

12
The Remuneration and Nomination Committee meets at least twice a year. In 2014, its members met for three half-day meetings. All meetings were attended by all Committee members, with the Chairman of the Board, the Chief Executive Officer and the Head of Group HR, who acted as Secretary of the Committee, present.
The Audit Committee is composed of Board members designated by the Board and assumes the functions defined in the Audit Committee Charter under http://investors.bobst.com/documents.
In 2014, one full-day meeting and two half-day meetings were attended by all Audit Committee members. The Chairman of the Board, the Chief Executive Officer, the Chief Financial Officer, and the Head of Legal and Compliance, attended all meetings. The lead external auditor also attended all meetings.
Definition of areas of responsibilityPursuant to the Organization Regulations of the Company (http://investors.bobst.com/documents), the Board delegates the management of the Company and the Group to the CEO who chairs the Group Executive Committee.
The Board retains the attributions which are expressly conferred to it by law or the Articles of Association (http://investors.bobst.com/documents), and the attributions which cannot be delegated pursuant to Article 716a of the Swiss “Code des Obligations”.
In addition, pursuant to the Organization Regulations of the Board (http://investors.bobst.com/documents), the Board retains certain key competencies, in particular: the competence to determine the strategy and the goals of the Company and of the Bobst Group, and to determine the financial strategy; the competence to approve the annual budget of the Company and the consolidated budget of the Group; the competence to approve the procurement of credit by the Company or any of its majority-owned affiliates if the amount exceeds CHF 30 million or if the total of credit procurement per financial year exceeds CHF 50 million, or if such approval is a condition by the creditor; the competence to supervise the execution by the CEO of the management duties delegated to him; the competence to verify the Internal Control System and the Risk Evaluation Process; and the competence to supervise the application of corporate governance principles in the Group.
The competencies of the Chief Executive Officer are defined in the Organization Regulations of the Company (http://investors.bobst.com/documents).
The Group Executive Committee (GEC) consists of:— the Chief Executive Officer (CEO);— the Chief Financial Officer (CFO);— the managers of the Business Units.
Its competencies are defined in the Organization Regulations of the Company (http://investors.bobst.com/documents).
Bobst Group SA Annual report 2014 – Corporate governance

13
Bobst Group SA Annual report 2014 – Corporate governance
Information and control instruments vis-à-vis the Group Executive CommitteeThe Board receives a monthly report which presents the business activity and the treasury situation, as well as the evolution of the key items of the balance sheet. On a quarterly basis a detailed report compares the actual figures with the budget and forecast. In July the medium term business plan is reviewed in detail. In December, the budget of the Group is presented for approval. The Group has internal control procedures which are regularly analyzed by the external auditors.
The internal audit function provides separate evaluations of the effectiveness and efficiency of the internal control systems at the level of the Group companies. On the basis of these evaluations, recommendations for improvement are formulated. Resources for this function are organized by project with multidisciplinary teams created in relation to the type of engagement. When needed, external resources are involved. The chief audit executive establishes an annual engagement plan to determine the priorities of the internal audit activity, along with the companies to be analyzed. The plan is submitted to the Audit Committee for approval. Audit results are discussed with the management of the companies concerned, who have to define deadlines and actions for the implementation of the recommendations. The chief audit executive regularly reports to the Audit Committee on performance relative to the initial audit plan, as well as any significant risk exposures and control issues.
The Group has defined and set up a risks and opportunities management system which is a systematic procedure for identifying and assessing risks and opportunities and for implementing appropriate risk control mechanisms. It is designed to enhance risk transparency and risk awareness, and thereby to ensure that opportunities can be consistently utilized and risks controlled. It is focused on, and supports the achievement of, the mid- and long-term objectives of the Group. This exercise is carried out with the annual business plan review. The primary responsibility for risks and opportunities management is vested in the Business Units as part of their business responsibility.
Major risks and opportunities are supported by action plans to limit the risks and ensure opportunities are benefitted from. These action plans are followed and controlled periodically. Reports are prepared and made available to the Group Executive Committee and Board of Directors.
GROUP EXECUTIVE COMMITTEE
Members of senior management/Other activities and vested interestThis information is available on pages 14–15 under the individual CV’s of the Group Executive Committee members.
Management contractsThere are no management contracts with legal entities or individuals outside the Bobst Group.

14
Bobst Group SA Annual report 2014 – Corporate governance
GROUP EXECUTIVE COMMITTEE
Jean-Pascal BobstChief Executive Officersince 07.05.2009. 1965, Swiss national.
Mechanical engineer HES (University of Applied Sciences), INSEAD: Service for Executive and PED (Program for Executive Development).
Since 1994 with Bobst: various Management positions.
1991Schindler Berlin, Production Eastern Europe.
Board Memberships: Member of various boards within the Bobst Group organization. JBF Finance SA, Member. Foundation Aslane, Chairman. Foundation Lumière & Vie, Member.
Attilio TissiChief Financial Officersince 08.11.2011. 1968, Swiss and Italian national.
Lic. oec. HSG, University of St. Gallen.
Since 2008 with Bobst as Controller Group Supply Production and Logistics, Managing Director Bobst SA, and Chief Financial Officer ad interim from May until October 2011.
2002 – 2007Associate of MCC Management Consulting & Coaching, Schaffhausen.
1998 – 2001SIG Positec International AG, Neuhausen, successively as Head Mergers & Acquisitions, CFO.
1994 – 1997Assistant to the Group CFO at SIG Holding AG, Neuhausen.
Board Memberships: Member of various boards within the Bobst Group organization.
Philippe MillietHead of Business Unit Sheet-fed since 08.11.2011. 1963, Swiss national.
Pharmacy degree. MBA, University of Lausanne.
Since June 2011 with Bobst.
2004 – 2010Head of Health Division at Galenica Holding Ltd, Bern. Member of the Corporate Executive Committee.
2002 – 2003Chief Executive Officer of Unicible Ltd, Lausanne.
1996 – 2001Chief Executive Officer of Galexis Ltd, Schönbühl. Member of the Executive Management Group of Galenica Holding Ltd, Bern.
1992 – 1996Associate, Engagement Manager at McKinsey & Company, Inc., Geneva.
Board Memberships: Member of various boards within the Bobst Group organization. Swiss Post, Bern, Member.

15
Bobst Group SA Annual report 2014 – Corporate governance
Erik BothorelHead of Business Unit Web-fed since 01.01.2010. 1962, French national.
Master degree in mechanical engineering, Saint-Etienne National School, France.University third cycle in Automation and Artificial Intelligence, IIRIAM, France.
Since 2004 with Bobst successively as Managing Director and Head of gravure product line at Rotomec SpA then Bobst Group Italia SpA.
2001 – 2003Barbieri & Tarozzi, Italy, Group General Manager.
1998 – 2001 SASIB, Italy, General and Business Unit Manager.
1987 – 1998Jobs, France and Italy, successively Sales Manager, General Manager.
Board Memberships: Member of various boards within the Bobst Group organization.
Stephan MärzHead of Business Unit Services since 01.04.2011.1971, German national.
Mechanical engineer, Technical University, Munich (TUM). Business administration studies (TUM).
Since April 2011 with Bobst.
2006 – 2011GF Agie Charmilles Group, Switzerland, successively as Head of Business Development, Head of Customer Services, Group Management Member.
2004 – 2005Georg Fischer AG, Switzerland, Head of Strategic Projects.
1997 – 2004 Roland Berger Strategy Consultants, Germany, Senior Project Manager.
Board Memberships: Member of various boards within the Bobst Group organization.

16
COMPENSATION, SHAREHOLDINGS AND LOANS
Compensation and Shareholding ProgramsSee separate Remuneration Report 2014, Part A, pages 90 to 92.
Performance related PaySee separate Remuneration Report 2014, Part A, page 92 and Part B, page 93.
Loans, credits, post-employment benefitsSee separate Remuneration Report 2014, Part A, page 92 and Part B, page 94.
Vote on Remuneration by the General AssemblyPursuant to OaEC, Article 31, subparagraph 3, the Board of Directors will submit to the Annual General Meeting of Shareholders on 29 April 2015 the following proposals for adoption: — The total amount of remuneration available for the members of the Board of Directors
for the period from the Annual General Meeting of Shareholders held in 2015 through the Annual General Meeting of Shareholders to be held in 2016;
— The total amount of remuneration available for the members of the Group Executive Committee for the calendar year 2016.
SHAREHOLDERS’ PARTICIPATION
Voting rights restrictions and representationOnly shareholders registered with voting rights and the Independent Representative elected by the General Assembly may represent shareholders in the General Meeting of Shareholders (see Articles of Association under http://investors.bobst.com/documents).
Instructions to Independent RepresentativeThe invitation to the Annual General Meeting of Shareholders on 29 April 2015 indicates the procedure by which registered shareholders can give their voting instructions to the Independent Representative in electronic form. Shareholders may continue to provide voting instructions in writing.
Statutory quorumsThe decisions by the General Meeting of Shareholders which require a qualified majority are mentioned in Article 22 of the Articles of Association (http://investors.bobst.com/documents).
AgendaThe Articles of Association (http://investors.bobst.com/documents) stipulate that requests for including items in the agenda of the General Meeting of Shareholders have to be made at least forty days prior to the date of the meeting.
Shareholders who represent shares with a total nominal value of one million Francs (CHF 1 000 000.–) can ask for the inclusion of an item on the agenda.
Inscriptions into the share registerThe share register is closed for new registrations a few days prior to the date of the General Meeting of Shareholders.
Bobst Group SA Annual report 2014 – Corporate governance

17
CHANGES OF CONTROL AND DEFENSE MEASURES
Duty to make an offerThe Articles of Association (http://investors.bobst.com/documents) contain an opting-out clause: the obligation to present an offer to purchase all the listed securities of the Company (Article 32 of the Federal Act on Stock Exchanges and Securities of 24 March 1995), does not apply to the owners and purchasers of shares of the Company (Article 22 subparagraph 2 and Article 52 of the Act).
AUDITORS
Duration of the mandate and term of office of the lead auditorErnst & Young SA Lausanne, have acted as statutory auditors of the holding company since its incorporation in 2001 and as the auditors of the consolidated financial statements of Bobst Group since 1989. They also audit the Swiss affiliated companies.
The responsibility of the engagements is assumed by one head auditor. The current head auditor is in charge for the first time for the audit of the 2014 financial statements.
Pursuant to Article 730a of the Swiss “Code des Obligations”, a head auditor may be in charge of an audit for seven years at most.
For the affiliated companies abroad, functions of auditors are assumed mainly by Ernst & Young.
Auditing fees/Additional feesFees billed by Ernst & Young (worldwide) for the audit of the individual statements of Bobst Group SA and its subsidiaries, on the one hand, and for the audit of the consolidated financial statements on the other hand, for the year 2014, amounted to CHF 883 208.–.
For other professional services, additional fees billed by Ernst & Young (worldwide), for the same period, amounted to CHF 309 017.–, of which CHF 165 777.– was for tax advice and compliance, CHF 98 803.– for audit related services, CHF 42 095.– for transaction consulting, and CHF 2 342.– for other services.
Informational instruments pertaining to the external auditIn 2014 the external auditors met three times with the Audit Committee. The Management Letter of the external auditors is the basis for discussions on the annual financial statements.
Once a year, the Audit Committee reviews the performance, independence and remuneration (based on a benchmark) of the external auditors, and submits a proposal to the Board of Directors on which auditing company should be nominated for election at the General Meeting of Shareholders.
On an annual basis, the Audit Committee also reviews the scope of external auditing, approves the audit plan, and discusses the corresponding audit results with the external auditors.
Bobst Group SA Annual report 2014 – Corporate governance

18
INFORMATION POLICY
Bobst Group SA publishes:an annual report in English, together with the financial statements as at 31 December, the consolidated financial statements, source and utilization of funds, notes to the consolidated financial statements, statutory accounts with notes, auditors’ reports, a remuneration report, an annual profile in English, Chinese and French, and a half-year report in English. All these documents are available on the website (http://investors.bobst.com/publications), along with a sustainable development report in English and French (http://investors.bobst.com/documents).
Press releases, available on the same day on the website (http://investors.bobst.com/publications) – traditionally one at the beginning of the year announcing the consolidated Group turnover for the previous year and the outlook for the current year, one when publishing the annual report and the remuneration report, one when publishing the half-year report, and others as the need may occur pursuant to rules on ad hoc publicity.
Conferences for financial analysts and the media: one is held on the day of the publication of the annual financial statements, another takes place at the beginning of December.
Presentations are available on the same day on the website (http://investors.bobst.com/publications).
Annual General Meeting of Shareholders.
Teleconferences for financial analysts and the media, available next day on the website (http://investors.bobst.com/publications): one when publishing the press release at the beginning of the year announcing the Group consolidated turnover for the previous year and the outlook for the current year, another when publishing the half-year report and the related press release, and others as the need may occur.
Bobst Group SA Annual report 2014 – Corporate governance

19
Website links and contactBobst Group SAP.O. BoxCH-1001 LausanneSwitzerlandTel. +41 21 621 21 11Fax +41 21 621 20 70
www.bobst.com – to reach the site home page.
http://investors.bobst.com – to reach the investors pages directly and get the press releases and ad hoc publicity (http://investors.bobst.com/adhocreleases), the agenda of events (http://investors.bobst.com/agenda), the annual, remuneration, and half-year reports, the teleconferences and the presentations for financial analysts and the media (http://investors.bobst.com/publications), the Articles of Association of Bobst Group SA (http://investors.bobst.com/documents), the Organization Regulations of Bobst Group SA, the Remuneration and Nomination Committee Charter and the Audit Committee Charter.
http://investors.bobst.com/order – to subscribe and order financial information.
[email protected] – to mail questions not addressed in the above documentation.
Disclosure of shareholdingsBobst Group SAShare RegisterP.O. BoxCH-1001 LausanneSwitzerlandFax +41 21 621 20 37
Bobst Group SA Annual report 2014 – Corporate governance

20
Bobst Group SA Annual report 2014 – Financial statements 2014
FINANCIAL STATEMENTS

21
Bobst Group SA Annual report 2014 – Financial statements 2014 – Contents
CONTENTS
Comments 22 Primary statementsConsolidated profit and loss 24 Consolidated statement of comprehensive income 25Consolidated balance sheet as at 31 December 26Consolidated cash flow statement 28Changes in consolidated equity 29 Accounting information and policiesNote 1 General information 30Note 2 Accounting information and policies 30Results for the yearNote 3 Segment reporting 34Note 4 Sales 37 Note 5 Other operating income 38 Note 6 Raw materials and services 38 Note 7 Personnel costs 39Note 8 Research & Development 39Note 9 Other operating expenses 40Note 10 Financial result 40Note 11 Taxation 41Operating assets and liabilitiesNote 12 Intangible fixed assets 44Note 13 Goodwill 46Note 14 Investments in associates 48Note 15 Correction of an error 50Note 16 Tangible fixed assets 50Note 17 Receivables 53Note 18 Transfer of assets 53Note 19 Finance lease receivables 53Note 20 Credit risk related to client receivables 54Note 21 Inventories 55 Note 22 Provisions 55Note 23 Employee benefits 57Risk management and capital structureNote 24 Financial instruments 61Note 25 Financial risk management 67Note 26 Borrowings 68Note 27 Capital management 70
Note 28 Earnings per share 70
Note 29 Dividends 70Other financial informationNote 30 Changes in the scope of consolidation 71Note 31 Share-based payment compensation 71Note 32 Contingent liabilities 71Note 33 Related parties 72Note 34 Capital commitments 73Note 35 Subsequent events 73Note 36 List of the Group Companies 74 Report of the Group auditors 76 Financial statements of Bobst Group SA, statutory 79accountsReport of the statutory auditors 84
Bobst Group is continuously developing the Group’s financial reporting. The consolidated financial statements have been restructured in order to provide users with financial information which is more understandable and better structured to explain the performance and financial position of the Group. The notes have been grouped in 5 sections. Each section starts with an introduction which explains the purpose and content of that section. Accounting policies and accounting judgments and estimates applied to the preparation of the consolidated financial statements have been moved to the beginning of the note to which they relate in order to provide appropriate context.

22
Bobst Group SA Annual report 2014 – Financial statements 2014 – Consolidated financial statements
COMMENTS
SUMMARY The Group started 2014 with a slightly lower backlog of orders than the year before. Order entries were low in the first months of the year 2014 and again in August and September. In between there were several good months and the Group recorded very good order entries in the last quarter of the year. For the full year 2014, consolidated sales decreased by CHF 54 million to CHF 1.3 billion.
Sales in the second half of 2014 reached CHF 740 million compared with CHF 560 million in the first six months of the year, and to CHF 791 million in the second semester 2013.
The profitability of the Group has significantly improved. Operating result (EBIT) reached CHF 81.7 million (CHF 60.3 million in 2013) and net result CHF 53.0 million (CHF 27.7 million in 2013). The strong operating result together with a further reduction in net working capital, resulted in a very good cash inflow from operating activities of CHF 129.4 million (CHF 83.2 million in 2013). This cash has been used mainly for the repayment of the bonds which matured in May 2014 and to increase the cash position in the year-end balance sheet. The return on capital employed (ROCE) reached 12.6% compared to 8.6% in 2013.
SALESConsolidated sales for full-year 2014 amounted to CHF 1.3 billion, a decrease of CHF 54 million or 4.0% compared to 2013.
In million CHF In %
Decrease in volume -45 -3.3Exchange rate variance* -9 -0.7Decrease in sales -54 -4.0
* Exchange rate impact due to conversion for consolidation only.
Sales of Sheet-fed products remained stable compared to the previous year at CHF 639 million. Demand for products for the corrugated equipment industry was strong and compensated a weaker demand for products for the folding carton industry. Sales of Web-fed products decreased by 15.8% and achieved CHF 283 million for the year 2014. The reduction is mainly due to lower demand for special machines and complex lines. Sales of Services and spare parts remained stable compared to the previous year at CHF 377 million.
The geographical distribution shows a 2% increase in sales in Europe. A significant improvement in some countries including Poland, Spain and Italy was partly eroded by lower sales in Russia, Romania, Germany and the UK. Sales in the Americas decreased by 3.3% compared to the excellent year 2013. Turnover in the US increased but other countries – in particular Mexico and Brazil – recorded lower sales than in 2013. Sales in Asia remained significantly below the previous year. This was mainly due to important one-time sales recorded in 2013 in Indonesia and a slow down in China.
2014 2013 Variance
In million CHF In % In million CHF In % in %
Europe 602 46.3 590 43.6 +2.0Americas 380 29.2 393 29.0 -3.3Asia & Oceania 282 21.7 330 24.4 -14.5Africa 36 2.8 41 3.0 -12.2Total 1 300 100.0 1 354 100.0 -4.0
OPERATING RESULT (EBIT)The operating result in the reporting year amounted to CHF 81.7 million compared to an operating result of CHF 60.3 million in the previous year. This significant improvement was achieved due to the full year impact of the Group transformation measures and a very good utilization of the Groups industrial capacities which have been adapted to the demand.

23
COMMENTS
The Group’s results for the reporting year were negatively influenced by transformation costs and one-time events. Restructuring and transformation costs of CHF 6.2 million were only partially compensated by government grants of CHF 4.3 million for on-job training.
In million CHF
Group restructuring and transformation costs -6.2Governments grants 4.3Net negative impact on Operating Result (EBIT) -1.9Calculated tax impact 0.7Net negative impact on Net Result -1.2
In comparison to the above net negative impact of CHF -1.9 million on operating result and of CHF -1.2 million on net result, the net impact of one-time events in 2013 amounted to CHF -12.3 million at the operating result level and to CHF -9.1 million at the net result level.
Without the transformation costs and the influence of one-time events, the underlying operating result increased from CHF 72.6 million in 2013 to an underlying operating result of CHF 83.6 million in 2014.
In million CHF Business Unit
Sheet-fedBusiness Unit
Web-fed Business Unit
Services Other Total
Published Operating Result (EBIT) 26.2 16.8 38.8 -0.1 81.7Restructuring/one-time events 1.1 0.3 0.5 0.0 1.9Underlying Operating Result (EBIT) 2014 27.3 17.1 39.3 -0.1 83.6Underlying Operating Result (EBIT) 2013* 14.2 28.8 31.2 -1.6 72.6
NET RESULTThe net result reached CHF 53.0 million compared to CHF 27.7 million in 2013. The improvement of the net result comes from the better operating result but also from significantly higher results of associated companies, reduced financing cost and lower tax charges.
Excluding transformation costs and the influence of one-time events, the net result would have reached CHF 54.2 million in 2014 compared to CHF 36.8 million in the previous year.
The net result attributable to shareholders (CHF 50.5 million) represents an earning per registered share of CHF 3.06 (2013: CHF 1.58).
BALANCE SHEETThe strong operating results together with a further reduction in net working capital enabled the Group to reduce net debt from CHF 109.0 million in 2013 to CHF 17.7 million in 2014. The cash position increased by CHF 69.1 million to CHF 386.3 million (CHF 317.2 million in 2013).
SHAREHOLDERS’ EQUITYDespite the positive net result of the year the consolidated shareholders’ equity decreased by CHF 66.5 million and amounts to 27.9% in relation to the total balance sheet for 2014 (33.6% in 2013). The reduction is mainly due to the impact of the reduced discount rates applied to the accounting of employee benefits as required by IAS 19R (CHF -91.3 million compared to a positive impact of CHF 73.4 million in 2013).
DIVIDEND PROPOSALThe Board of Directors proposes to the Annual General Meeting of Shareholders the payment of a dividend of CHF 1.25 per share (CHF 0.75 in 2013).
This proposal is in line with the Group’s dividend policy which recommends a payout ratio between 30–50% of the net consolidated profit after tax.
* Restated.
Bobst Group SA Annual report 2014 – Financial statements 2014 – Consolidated financial statements

24
Bobst Group SA Annual report 2014 – Financial statements 2014 – Consolidated financial statements
CONSOLIDATED PROFIT AND LOSS
In million CHF Notes 2014 2013
Sales 04 1 300.0 1 353.9
Other operating income 05 18.0 24.4Raw materials and services 06 -761.3 -816.0Personnel costs 07 -424.4 -440.3Depreciation and amortization 12, 16 -38.2 -41.0Other operating expenses 09 -12.4 -20.7Operating result (EBIT) 81.7 60.3
Share of net result in associates 14 7.3 1.6Interest expenses 10 -16.8 -22.5Other financial expenses and income 10 -0.1 3.5Result before income tax 72.1 42.9
Income tax 11 -19.1 -15.2Net result 53.0 27.7
Attributable: To shareholders 50.5 26.2To non-controlling interest 2.5 1.5
Earnings per registered share (in CHF) 28 3.06 1.58Diluted earnings per registered share (in CHF) 28 3.06 1.58

25
Bobst Group SA Annual report 2014 – Financial statements 2014 – Consolidated financial statements
CONSOLIDATED STATEMENT OF COMPREHENSIVE INCOME
In million CHF Notes 2014 2013
Net result 53.0 27.7
Other comprehensive income(loss) to be reclassified to profit and loss in subsequent periods:Currency translation differences 5.2 -2.8Net gain(loss) on cash flow hedge reclassified to profit and loss 24 -3.1 -1.3Net gain(loss) on cash flow hedges 24 -5.6 3.1Income tax 11 3.5 -0.7Total other comprehensive income(loss) to be reclassified to profit and loss in subsequent periods 0.0 -1.7
Other comprehensive income(loss) not to be reclassified to profit and loss in subsequent periods:Remeasured gains(losses) on defined benefit plans 23 -120.2 96.1Income tax 11 28.9 -22.7Total other comprehensive income(loss) not to be reclassified to profit and loss in subsequent periods -91.3 73.4
Other comprehensive income(loss) for the period, net of tax -91.3 71.7
Total comprehensive income(loss) for the period -38.3 99.4
Attributable:To shareholders -42.2 97.9To non-controlling interest 3.9 1.5

26
Bobst Group SA Annual report 2014 – Financial statements 2014 – Consolidated financial statements
CONSOLIDATED BALANCE SHEET AS AT 31 DECEMBER
In million CHF Notes31 December
2014
31 December 2013
(restated)1 January 2013
(restated)
Intangible fixed assets 12 33.9 36.7 47.2Goodwill 13 77.4 78.0 77.2Tangible fixed assets 15, 16 294.4 303.4 319.5Financial assets other 3.4 8.0 8.2Investments in associates 14 63.0 58.3 56.4Employee benefits 23 0.0 33.6 0.0Receivables 17 6.8 7.4 9.9Finance lease receivables 19 0.6 10.2 4.4Prepaid expenses and accrued income 1.3 1.2 1.1Deferred tax assets 11 43.8 34.3 35.0Non-current assets 524.6 571.1 558.9 Inventories 21 319.9 313.7 317.7Receivables 17 288.6 287.9 321.9Finance lease receivables 19 6.3 7.5 8.3Income tax receivables 11.9 9.9 5.9Financial assets other 75.0 7.0 0.0Prepaid expenses and accrued income 9.6 7.1 4.5Derivative financial instruments 24 1.0 5.6 3.1Cash and cash equivalents 386.3 317.2 305.4Current assets 1 098.6 955.9 966.8 Total assets 1 623.2 1 527.0 1 525.7

27
Bobst Group SA Annual report 2014 – Financial statements 2014 – Consolidated financial statements
CONSOLIDATED BALANCE SHEET AS AT 31 DECEMBER
In million CHF Notes31 December
2014
31 December 2013
(restated)1 January 2013
(restated)
Share capital 16.5 17.8 17.8Reserves 385.5 463.0 398.4Net result 50.5 26.2 -7.1Shareholders’ equity 452.5 507.0 409.1Non-controlling interest 2.3 1.1 1.0Equity 454.8 508.1 410.1 Borrowings 26 268.3 264.1 411.5Provisions 22 13.8 3.9 5.3Employee benefits 23 141.2 56.0 118.8Trade and other payables 29.6 28.1 28.7Accrued expenses and deferred income 0.0 0.1 0.1Deferred tax liabilities 11, 15 29.2 55.5 36.4Non-current liabilities 482.1 407.7 600.8 Borrowings 26 210.7 162.1 84.3Provisions 22 43.7 53.3 35.4Employee benefits 23 3.8 3.8 3.3Trade and other payables 327.6 296.5 323.3Accrued expenses and deferred income 72.0 84.3 50.6Income tax payables 17.8 10.3 17.4Derivative financial instruments 24 10.7 0.9 0.5Current liabilities 686.3 611.2 514.8 Total liabilities and equity 1 623.2 1 527.0 1 525.7

28
CONSOLIDATED CASH FLOW STATEMENT
In million CHF 2014 2013
Net result 53.0 27.7Elimination of income from associates -7.3 -1.6Elimination of income taxes 19.1 15.2Elimination of depreciation, amortization, employee benefits and provisions 35.0 58.0Elimination of the result on disposal of assets -0.8 11.3Elimination of interest expenses(income) 11.7 15.9Elimination of derivative financial instruments results 5.4 -0.6Changes in inventories -2.4 2.5Changes in receivables 13.6 -24.0Changes in payables 17.6 6.3Paid taxes -15.5 -27.5Cash flow from operating activities Total A 129.4 83.2
Purchase of intangible assets -6.2 -5.7Purchase of tangible assets -19.7 -23.6Purchase of financial assets -75.0 -18.6Loans and advances made -1.5 -1.0Proceeds from sale of tangible assets 4.1 50.6Proceeds from sale of financial assets 7.0 11.6Loan repayments and advances received 4.5 0.7Interest received 5.1 6.1Dividends received 1.4 0.6Cash flow from(used in) investing activities Total B -80.3 20.7
Proceeds from borrowings 211.9 13.9Repayments of borrowings -156.9 -78.9Interest paid -18.5 -23.7Dividends paid to Group shareholders -12.5 0.0Dividends paid to non-controlling interest -0.8 -0.9Cash flow from(used in) financing activities Total C 23.2 -89.6 Effects of exchange variances Total D -3.2 -2.5 Increase in cash and cash equivalents A+B+C+D 69.1 11.8
Cash and cash equivalents at beginning of period 317.2 305.4Cash and cash equivalents at end of period 386.3 317.2Variance 69.1 11.8
Cash and cash equivalents comprise cash on hand and demand deposits, and other short-term highly liquid investments that are easily and quickly convertible to a known amount of cash.
Bobst Group SA Annual report 2014 – Financial statements 2014 – Consolidated financial statements

29
In million CHFShare
capitalOwn
sharesHedge
reserveTranslation
reserveOther
reservesRetained earnings
Total sha-reholders’
equity
Non-controlling
interest Equity
Balance at 1 January 2013 (as previously reported) 17.8 -1.4 0.8 -84.9 0.2 488.2 420.7 1.0 421.7Restatement (note 15) -11.6 -11.6 -11.6Balance at 1 January 2013 (restated) 17.8 -1.4 0.8 -84.9 0.2 476.6 409.1 1.0 410.1Result for the period 26.2 26.2 1.5 27.7Currency translation differences -0.1 -2.7 -2.8 -2.8Net gain(loss) on cash flow hedges reclassified to profit and loss during the year -1.3 -1.3 -1.3Net gain(loss) on cash flow hedges during the year 3.1 3.1 3.1Actuarial gains(losses) on defined benefit plans 96.1 96.1 96.1Income tax -0.7 -22.7 -23.4 -23.4Total comprehensive income(loss) 0.0 0.0 1.0 -2.7 0.0 99.6 97.9 1.5 99.4Share-based payments 0.0 0.0Dividends 0.0 -1.0 -1.0Change in liability recognized on put option 0.0 -0.4 -0.4Balance at 31 December 2013 (restated) 17.8 -1.4 1.8 -87.6 0.2 576.2 507.0 1.1 508.1 Balance at 1 January 2014 17.8 -1.4 1.8 -87.6 0.2 576.2 507.0 1.1 508.1Result for the period 50.5 50.5 2.5 53.0Currency translation differences -0.2 4.0 3.8 1.4 5.2Net gain(loss) on cash flow hedges reclassified to profit and loss during the year -3.1 -3.1 -3.1Net gain(loss) on cash flow hedges during the year -5.6 -5.6 -5.6Actuarial gains(losses) on defined benefit plans -120.2 -120.2 -120.2Income tax 3.5 28.9 32.4 32.4Total comprehensive income(loss) 0.0 0.0 -5.4 4.0 0.0 -40.8 -42.2 3.9 -38.3Share-based payments 0.2 0.2 0.2Own shares cancellation -1.3 1.4 -0.1 -0.0 -0.0Dividends -12.5 -12.5 -0.8 -13.3Change in liability recognized on put option 0.0 -1.9 -1.9Balance at 31 December 2014 16.5 0.0 -3.6 -83.6 0.4 522.8 452.5 2.3 454.8
At year end 2014, the number of issued shares is 16 518 478 (2013: 17 810 002) with a par value of CHF 1.00. The movement is linked to the capital decrease made by cancellation of own shares.
CHANGES IN CONSOLIDATED EQUITY
Bobst Group SA Annual report 2014 – Financial statements 2014 – Consolidated financial statements

30
Bobst Group SA Annual report 2014 – Financial statements 2014 – Consolidated financial statements
ACCOUNTING INFORMATION AND POLICIES
This section describes the basis of preparation of the consolidated financial statements and the Group’s accounting policies that are applicable to the financial statements as a whole. Accounting policies, critical accounting estimates and judgements that are specific to a note are included in the note to which they relate. This section also explains new accounting standards, amendments and interpretations, that the Group has adopted in the current financial year or will adopt in subsequent years.
NOTE 1GENERAL INFORMATIONBobst Group SA, a company incorporated in Switzerland and having its main offices at 3, Route de Faraz, in Mex, Switzerland, is the holding company of the Bobst Group, worldwide leading supplier of equipment and services to packaging manufacturers in the folding carton, corrugated board and flexible materials industries. NOTE 2ACCOUNTING INFORMATION AND POLICIESAccounting policies have been consistently applied to all years presented, unless other stated.
Basis of preparationThe consolidated financial statements have been prepared in accordance with International Financial Reporting Standards (IFRS). The consolidated financial statements have been prepared on the historical cost basis, except for the financial instruments which are valued at fair value or amortized cost.
The net defined benefit (asset) liability is measured at the fair value of plan assets less the present value of the defined benefit obligation as explained in Note 23.
In addition, for financial reporting purposes, fair value measurements are categorized into Level 1, 2 or 3 based on the degree to which the inputs to the fair value measurements are observable and the significance of the inputs to the fair value measurements in its entirety, which are described in Note 24.
Changes in accounting policies and disclosuresThe Group has adopted the following new standards and amendments to standards for the first time for the financial year beginning on or after 1 January 2014. The list is not exhaustive but only disclose the changes relevant to the Group.
Investment Entities – Amendments to IFRS 10, IFRS 12 and IAS 27These amendments provide an exception to the consolidation requirement for entitiesthat meet the definition of an investment entity under IFRS 10 Consolidated FinancialStatements. The exception to the consolidation requires investment entities to accountfor subsidiaries at fair value through profit or loss. These amendments have no impact on the Group since none of the entities in the Group qualifies as an investment entity under IFRS 10.
Offsetting Financial Assets and Financial Liabilities – Amendments to IAS 32These amendments clarify the meaning of ‘currently has a legally enforceable right toset-off’ and also clarify the criteria for the non-simultaneous settlement mechanisms of clearing houses to qualify for offsetting. These amendments have no impact on the Group.
Novation of Derivatives and Continuation of Hedge Accounting – Amendments to IAS 39These amendments provide relief from discontinuing hedge accounting when novation of a derivative designated as a hedging instrument meets certain criteria. These amendments have no impact on the Group as it has not novated its derivatives during the current or prior periods.
31
Bobst Group SA Annual report 2014 – Financial statements 2014 – Consolidated financial statements
ACCOUNTING INFORMATION AND POLICIES
Recoverable Amount Disclosures for Non-Financial Assets – Amendments to IAS 36These amendments remove the unintended consequences of IFRS 13 Fair Value Measurement on the disclosures required under IAS 36 Impairment of Assets. In addition, these amendments require disclosure of the recoverable amounts for the assets or cash-generating units for which an impairment loss has been recognized or reversed during the period. The Group early adopted these disclosure requirements in the annual consolidated financial statements for the year ended 31 December 2013.
Levies – IFRIC 21IFRIC 21 provides guidance on accounting for a liability to pay levies in accordance with the requirements of IAS 37, Provisions, Contingent Liabilities and Contingent Assets.
The interpretation clarifies that an entity should recognize a liability for a levy no earlier than when the activity that triggers payment, as identified by the relevant legislation, occurs. It also clarifies that a levy liability is accrued progressively only if the activity that triggers payment occurs over a period of time, in accordance with the relevant legislation. For a levy that is triggered upon reaching a minimum threshold, no liability is recognized before the specified minimum threshold is reached. The interpretation requires these same principles to be applied in interim financial statements.
The Group is not currently subject to significant levies. The adoption of the interpretation has had no significant effect on the financial statements for earlier periods and on the financial statements for the period ended 31 December 2014.
Standards, amendments and interpretations to the existing standards (mandatory for periods beginning on/or after 1 January 2015) that have not been early adopted by the Bobst Group.
IFRS 9 Financial InstrumentsIFRS 9 was issued in November 2009 and October 2010 and replaces the parts of IAS 39 that relate to the classification and measurement of financial instruments.
IFRS 9 requires financial assets to be measured at amortized cost or fair value. The determination is made at initial recognition and the classification depends on the entity’s business model for managing its financial instruments and the contractual cash flow characteristics of the instrument.
For financial liabilities measured at fair value, the standard requires that the amount of change in the fair value of the financial liability that is attributable to changes in the credit risk of that liability is recorded in other comprehensive income rather than the income statement, unless this creates an accounting mismatch.
IFRS 9 is effective for annual periods beginning on or after 1 January 2015, with early adoption permitted.
IFRS 15 Revenue from Contracts with CustomersIFRS 15, published in May 2014, establishes a comprehensive framework for determining whether, how much and when revenue is recognized. Under IFRS 15 revenue is recognized at an amount that reflects the consideration to which an entity expects to be entitled in exchange for transferring goods or services to a customer.
The new revenue standard is applicable to all entities and will supersede all current revenue recognition requirements under IFRS. Either a full or modified retrospective application is required for annual periods beginning on or after 1 January 2017, with early adoption permitted.
Bobst Group has not yet finished all the analyses needed regarding these changes. Consequently, all potential impacts cannot be measured yet. The list of new standards and amendments that are not yet effective is not exhaustive but lists those that are relevant for the Group.

32
Bobst Group SA Annual report 2014 – Financial statements 2014 – Consolidated financial statements
Basis of consolidationThe consolidated financial statements incorporate the financial statements of Bobst Group SA and its subsidiaries (the Group).
The subsidiaries are those companies controlled, directly or indirectly, by Bobst Group SA. The control is effective when Bobst Group SA is exposed, or has rights, to variable returns from its involvement with the subsidiary and has the ability to affect those returns through its power over the subsidiary to direct the relevant activities.
Assets, liabilities, income and expenses of a subsidiary acquired or disposed of during the year are included in the consolidated statement of comprehensive income from the date the Group gains control until the date the Group ceases to control the subsidiary.
Where necessary, adjustments are made to the financial statements of subsidiaries to bring their accounting policies in line with those used by the Group.
All intra-Group transactions, balances, income and expenses (including dividends) are eliminated during the consolidation.
Non-controlling interest is identified separately from the equity of the owners of the parent. Losses applicable to the non-controlling interest in a subsidiary are allocated to the non-controlling interest even if that results in a deficit balance.
Scope of consolidationThe changes in the scope of consolidation with respect to the prior year are shown in Note 30. The consolidated companies are listed on note 36. The closing date of the companies is 31 December.
Business combinations Business combinations are accounted for using the acquisition method. The cost of an acquisition is measured as the aggregate of the consideration transferred, measured at fair value at the acquisition date, and the amount of any non-controlling interest in the acquiree.
Acquisition-related costs are recognized in profit or loss as incurred.When the Group acquires a business, it assesses the financial assets and liabilities
assumed for appropriate classification and designation in accordance with the contractual terms, economic circumstances and pertinent conditions as at the acquisition date.If the business combination is achieved in stages, the acquisition date fair value of the Group’s previously held equity interest in the acquiree is remeasured to fair value at the acquisition date through profit or loss.
Any contingent consideration to be transferred by the Group will be recognized at fair value at the acquisition date and included as part of the consideration transferred in a business combination. If the contingent consideration is classified as equity, it is not remeasured and settlement is accounted for within equity. Otherwise, subsequent changes to the fair value of the contingent consideration are recognized in profit or loss.
Non-controlling interestFor each business combination, the Group measures the non-controlling interest in the acquiree either at fair value or at the proportionate share of the acquiree’s identifiable net assets. The choice of measurement basis is made on a transaction-by-transaction basis.
Bobst Group SA has purchased a call option and written a put option over the remaining 35% of shares in Gordon Ltd not currently owned by the Group.
The call option is exercisable by Bobst Group SA at any time and the written put option can only be exercised from 1 January 2016 by the minority shareholder of Gordon Ltd. Both options have no time limit, however, upon death or disability of the seller, Bobst Group SA is required to exercise the call option.
The exercise price for the call and put is variable and based on the same formula that reflects the estimated fair value of the remaining 35% of Gordon Ltd.
ACCOUNTING INFORMATION AND POLICIES

33
Bobst Group SA Annual report 2014 – Financial statements 2014 – Consolidated financial statements
The Group has determined that it has not acquired a present ownership interest in the shares held by the Gordon Ltd non-controlling interest holders. The non-controlling interest continues to receive an allocation of profit or loss and is reclassified as a financial liability (measured as the present value of the put strike price) at each reporting date as if the acquisition of the non-controlling interest took place at that date.
Foreign currenciesThe individual financial statements of each Group entity are presented in the currency of the primary economic environment in which the entity operates (its functional currency). For the purpose of the consolidated financial statements, the results and financial position of each entity are expressed in Swiss Francs, which is the functional currency of Bobst Group SA and the presentation currency for the consolidated financial statements.
In preparing the financial statements of the individual entities, transactions in currencies other than the entity’s functional currency (foreign currencies) are recorded at the rates of exchange prevailing on the dates of the transactions. At each balance sheet date, all items denominated in foreign currencies are translated at the rates prevailing on the balance sheet date. Exchange differences arising from the settlement of monetary items, and from the retranslation of monetary items, are included in profit and loss for the period, except when deferred in other comprehensive income as qualifying cash flow hedges.
In order to hedge its exposure to certain foreign exchange risks, the Group enters into forward contracts and options (see note 24 for details of the Group’s accounting policies in respect of such derivative financial instruments).
For the purpose of presenting consolidated financial statements, the assets and liabilities of the Group’s foreign currency operations (including comparatives) are translated into Swiss Francs using exchange rates prevailing on the balance sheet date. Income, expense and cash flow items (including comparatives) are translated at the average exchange rates for the period. The exchange differences arising on translation for consolidation are recognized in other comprehensive income.
Goodwill and fair value adjustments arising from the acquisition of a foreign operation are treated as assets and liabilities of the foreign operation and translated at the closing rate.
The principal foreign exchange rates used in the translation of financial statements for the two years ended 31 December 2014 were as follows:
Balance sheet Profit and loss statement
2014 2013 2014 2013
Main exchange ratesEuro zone 1 EUR 1.20 1.23 1.21 1.23USA 1 USD 0.99 0.89 0.92 0.92United Kingdom 1 GBP 1.54 1.47 1.50 1.45China 1 CNY 0.16 0.15 0.15 0.15
SIGNIFICANT ACCOUNTING JUDGEMENTS AND ESTIMATES
The financial statements prepared in accordance with IFRS contain certain assumptions and estimates that influence the figures presented in this report. They are based on analyses and judgements which are continuously reviewed and adapted if necessary.
The Group’s accounting policies which the management considers to be particularly subject to elements of judgement are set out in detail in the relevant notes:
— Taxation (Note 11); — Goodwill (Note 13); — Provisions (Note 22); — Employee benefits (Note 23).
ACCOUNTING INFORMATION AND POLICIES

34
Bobst Group SA Annual report 2014 – Financial statements 2014 – Consolidated financial statements
This section explains the results and performance of the Group for the two financial years 2013 and 2014. Disclosures are provided for segment reporting, operating expenses and income, finance expenses and income and taxation. For taxation, balance sheet disclosures are also provided in this section. The disclosures for the Group’s share of net result in associates are provided in the operating assets and liabilities section.
NOTE 3SEGMENT REPORTING
Operating segments are reported in a manner consistent with the internal reporting provided to the chief operating decision-maker. The chief operating decision-maker, who is responsible for allocating resources and assessing performance of the operating segment, has been identified as the Group Executive Committee.
The Group Executive Committee is identified as chief operating decision-maker and reviews the Group’s internal reporting in order to assess performance and allocate resources.
Internal reporting is based on the same accounting principles as the ones used to establish these financial statements and segment performance is assessed based on the operating result (EBIT).
Group financing (including finance costs and finance income) and income taxes are managed on a Group basis and are not allocated to operating segments.
The reportable segments of the Group are as follows: — BU Sheet-fed combines machine sales of all product lines in the folding carton and
corrugated board industries; — BU Web-fed covers machine sales activities linked to the flexible materials industry,
including the Web-fed Solutions product line; — BU Services expands Bobst Group’s service offering by developing the sale of supplies
and by supporting customers in their operational activities; — the segment “Other” includes secondary activities which are not significant for
the Group.
RESULTS FOR THE YEAR

35
Bobst Group SA Annual report 2014 – Financial statements 2014 – Consolidated financial statements
NOTE 3SEGMENT REPORTING (CONTINUED)
No operating segments were aggregated to form the above reportable operating segments.Inter-segment operations correspond to the contribution paid by the Business Unit
Services to the other Business Units for the right to sell spare parts and services for their equipment. These contributions do not generate internal margin.
In million CHF 2014 2013
RevenueSheet-fed third party sales 639.2 638.9Sheet-fed inter-segment 18.8 18.8Sheet-fed total revenue 658.0 657.7
Web-fed third party sales 282.9 336.5Web-fed inter-segment 3.8 3.8Web-fed total revenue 286.7 340.3
Services third party sales 377.3 376.6
Other third party sales 0.6 1.9
Eliminations inter-segment -22.6 -22.6
Total third party sales 1 300.0 1 353.9
Sheet-fed Web-fed Services Other Total
In million CHF 2014 2013 2014 2013 2014 2013 2014 2013 2014 2013
ResultsTotal segment operating result (EBIT) 26.2 5.7 16.8 25.4 38.8 30.8 -0.1 -1.6 81.7 60.3Share of result of associates 7.3 1.6 7.3 1.6Financial result -16.9 -19.0Result before income tax 72.1 42.9Segment operating result (EBIT) includes:Depreciation and amortization -27.1 -27.8 -2.7 -4.6 -8.4 -8.4 0.0 -0.2 -38.2 -41.0Government grants 3.4 4.7 0.1 0.2 0.8 0.9 0.0 0.0 4.3 5.8Restructuring costs (personnel) -4.5 -4.1 -0.4 -0.1 -1.3 -1.3 0.0 0.0 -6.2 -5.5Exceptional losses on assets 0.0 -6.8 0.0 -3.5 0.0 0.0 0.0 0.0 0.0 -10.3Exceptional losses on inventories 0.0 -2.3 0.0 0.0 0.0 0.0 0.0 0.0 0.0 -2.3
RESULTS FOR THE YEAR

36
Bobst Group SA Annual report 2014 – Financial statements 2014 – Consolidated financial statements
NOTE 3SEGMENT REPORTING (CONTINUED)
Sheet-fed Web-fed ServicesOther and non
allocated Total
In million CHF 2014 2013 2014 2013 2014 2013 2014 2013 2014 2013
Total assets 707.2 708.0 172.9 214.5 273.7 274.2 469.4 330.3 1 623.2 1 527.0Total assets includes: Investments in associates (Note 14) 63.0 58.3 63.0 58.3Total liabilities and equity 404.7 313.1 151.1 160.9 131.5 111.8 935.9 941.2 1 623.2 1 527.0
All assets are allocated to reportable segments except cash and cash equivalent and current financial assets other.
All liabilities are allocated to reportable segments except borrowings and equity.
GEOGRAPHIC INFORMATION
In million CHF 2014 2013
Revenue from external salesSwitzerland (domicile country) 20.2 1.6% 19.6 1.4%United States of America 259.8 20.0% 232.5 17.2%Germany 106.0 8.1% 120.6 8.9%Greater China region 97.8 7.5% 109.7 8.1%Other countries 816.2 62.8% 871.5 64.4%Total 1 300.0 100.0% 1 353.9 100.0% Non-current assetsSwitzerland (domicile country) 213.8 52.7% 222.6 53.3%Greater China region 44.4 10.9% 44.0 10.5%Italy 44.0 10.9% 45.5 10.9%Germany 40.9 10.1% 42.7 10.2%Other countries 62.6 15.4% 63.3 15.1%Total 405.7 100.0% 418.1 100.0%
Revenues are allocated to countries on the basis of the client’s location. Non-current assets consist of tangible and intangible fixed assets as well as goodwill.
RESULTS FOR THE YEAR

37
Bobst Group SA Annual report 2014 – Financial statements 2014 – Consolidated financial statements
NOTE 4SALES
Accounting policiesRevenue from the sale of goods and services is measured at the fair value of the consideration received or receivable, net of returns, trade discounts, rebates and other sales taxes or duty.
The Group recognizes revenue when the amount of revenue can be reliably measured, it is probable that future economic benefits will flow to the Group and when specific criteria have been met for each of the Group’s activities as described below.
Sale of goods – machines. Revenue from the sale of machines is recognized when the significant risks and rewards of ownership have been transferred to the buyer, recovery of the consideration is probable, the associated costs can be estimated reliably, there is no continuing management involvement with the machines and the amount of revenue can be measured reliably.
Sale of goods – spare parts. Spare parts revenue is mainly recognized upon shipment representing the time of transfer of significant risks and rewards.
Sale of services. Revenue from services rendered include various services, such as maintenance contracts, reactive services and upgrades. Sales of services are recognized as revenue in the accounting period in which the services are rendered, which means that they are allocated over the contractual period.
If a machine sale includes subsequent delivery of parts and/or service, the corresponding amount is deferred and recognized as revenue when the recognition criteria are met for the corresponding category.
Business segment information is stated in Note 3.
In million CHF 2014 2013
Distribution by business activity: Machines 918.7 973.9Spare parts 313.8 311.5Services 67.5 68.5Total 1 300.0 1 353.9
RESULTS FOR THE YEAR

38
Bobst Group SA Annual report 2014 – Financial statements 2014 – Consolidated financial statements
RESULTS FOR THE YEAR
NOTE 5OTHER OPERATING INCOME
Accounting policiesGovernment grants are recognized where there is a reasonable assurance that the grant will be received and all attached conditions will be complied with. When the grant relates to an expense item, it is recognized as income over the period necessary to match the grant on a systematic basis to the costs that it is intended to compensate. When the grant relates to an asset, it is recognized as deferred income and released to income in equal amounts over the expected useful life of the related asset.
Rental from leased machines. The Group’s policy for recognition of revenue from operating leases is described in the Note 16 Tangible fixed assets.
In million CHF 2014 2013
Resolved disputes 2.7 3.5Capitalized production 0.4 3.1Transfer of operating charges 4.4 5.1Government grants 4.3 5.8Income from leased machines 0.1 0.1Other 6.1 6.8Total 18.0 24.4
Government grants consist of an amount of CHF 4.3 million (2013: CHF 1.8 million) for on-job training. In 2013, government grants also included CHF 4.0 million to support the BOBST Apprenticeship Center.
NOTE 6RAW MATERIALS AND SERVICES
In million CHF 2014 2013
Material costs 555.1 591.5Rent, Maintenance, Energy 32.8 33.6Marketing, Communication, Travel 53.1 55.7External staff 11.5 10.4Transport, Customs, Insurance 35.1 40.3Administration and other costs 73.7 84.5Total 761.3 816.0

39
Bobst Group SA Annual report 2014 – Financial statements 2014 – Consolidated financial statements
RESULTS FOR THE YEAR
NOTE 7PERSONNEL COSTS
In million CHF 2014 2013
Wages and salaries 335.8 345.3Social expenses and other personnel expenses 88.6 95.0Total 424.4 440.3
Since 2009 an important Group transformation program generated significant restructuring costs, of which 6.2 million relate to personnel costs in 2014 (2013: CHF 5.5 million).
NOTE 8RESEARCH & DEVELOPMENT
Accounting policiesInternal research costs are costs incurred to gain new technical knowledge and understanding. These costs are charged directly to profit and loss.
Internal development costs are incurred for the application of research findings to plan and develop new products for commercial production. These costs would qualify for capitalization as intangible assets only if the Group can demonstrate all of the following criteria:
— the technical feasibility of completing the intangible asset so that the asset will be available for use or sale;
— its intention to complete and its ability to use or sell the asset; — how the asset will generate future economic benefits; — the availability of resources to complete the asset; — the ability to measure reliably the expenditure during development.
The development projects undertaken by the Group are subject to technical and other uncertainties such that, in the opinion of the management, the criteria for capitalization are not met unless prior products have been successfully launched in the market. Internal development costs that do not meet criteria are charged to profit and loss.
CHF 74.2 million was spent on Research & Development (CHF 68.9 million in 2013). These costs were not capitalized in 2014 and 2013. All three business segments have focused their efforts on the improvement of existing models, on the development of new products, as well as on research for the standardization of the components of manufactured products of the Group.

40
Bobst Group SA Annual report 2014 – Financial statements 2014 – Consolidated financial statements
NOTE 9OTHER OPERATING EXPENSES
In million CHF 2014 2013
Taxes on capital and other taxes 8.7 9.2Non-recurrent charges 0.2 10.3Other 3.5 1.2Total 12.4 20.7
The non recurrent charges relate exclusively to the write-off of fixed assets which were no longer used.
NOTE 10FINANCIAL RESULT
Accounting policiesInterest income is accrued on a time basis, by reference to the principal outstanding and at the effective interest rate applicable, which is the rate that exactly discounts estimated future cash receipts through the expected life of the financial asset to that asset’s net carrying amount.
In million CHF 2014 2013
Interest expenses -16.8 -22.5Interest income 5.1 6.6Exchange rate differences 6.4 -1.6Gains(losses) on derivative financial instruments -5.4 0.6Other financial income 3.9 1.9Other financial expenses -10.1 -4.0Total other financial expenses and income -0.1 3.5Total -16.9 -19.0
The other financial expenses include an expense of CHF 3.3 million related to the exchange of CHF 60 million of the CHF 250 million 5% debenture bonds 2009–2015 (BOB09) for the new bond BOB14 (see note 26) and an amount of CHF 3.7 million related to the write-off of a loan made to a subcontractor.
RESULTS FOR THE YEAR

41
Bobst Group SA Annual report 2014 – Financial statements 2014 – Consolidated financial statements
NOTE 11TAXATION
Income taxAccounting policiesThe tax expense for the period comprises current and deferred tax. Tax is recognized in the income statement, except to the extent that it relates to items recognized in other comprehensive income or directly in equity. In this case, the tax is also recognized in other comprehensive income or directly in equity.
The tax currently payable is based on taxable profit for the year. Taxable profit differs from profit as reported in the income statement because it excludes items of income or expense that are taxable or deductible in other years, and it further excludes items that are never taxable or deductible. The Group’s liability for current tax is calculated using tax rates prevailing on the balance sheet date.
Accounting judgements and estimatesUncertainties exist with respect to the interpretation of complex tax regulations, changes in tax laws, and the amount and timing of future taxable income. Given the wide range of international business relationships and the long-term nature and complexity of existing contractual agreements, differences arising between the actual results and the assumptions made, or future changes to such assumptions, could necessitate future adjustments to tax income and expenses already recorded. The Group establishes provisions, based on reasonable estimates, for possible consequences of audits by the tax authorities of the respective countries in which it operates. The amount of such provisions is based on various factors, such as experience of previous tax audits and differing interpretations of tax regulations by the taxable entity and the responsible tax authority. Such differences in interpretations may arise for a wide variety of issues depending on the conditions prevailing in the respective domicile of the Group companies.
In million CHF 2014 2013
Current tax expense 21.0 20.5Adjustments in respect of current income tax of previous year 0.0 -1.4Deferred taxes income(expense) -1.9 -3.9Total 19.1 15.2
The total above expense for each year can be reconciled as follows:Result before income tax (including result of associates) 72.1 42.9Result of associates -7.3 -1.6Result before income tax (excluding result of associates) 64.8 41.3
Taxes at the weighted average income tax rate 22.9 16.9Tax effect of utilization of tax losses not previously recognized -3.1 -2.0Adjustments in respect of current income tax of previous year 0.0 -1.4Changes in tax rates -0.7 2.0Other effects 0.0 -0.3Total 19.1 15.2
RESULTS FOR THE YEAR

42
Bobst Group SA Annual report 2014 – Financial statements 2014 – Consolidated financial statements
RESULTS FOR THE YEAR
NOTE 11 (CONTINUED)TAXATION
The weighted average income tax rate based on rates prevailing in the different jurisdictions reached 35.3% in 2014 (41.0% in 2013). The decrease of the applicable weighted average tax rate was caused by a change in the profitability mix of the Group’s subsidiaries in the different countries. For 2014 and 2013, losses were realized by companies having lower tax rates thus negatively impacting the weighted average tax rate.
The tax credit(charge) relating to components of other comprehensive income is as follows:
2014
In million CHF Before Tax Tax credit(charge) After Tax
Currency translation 5.2 0.0 5.2Cash flow hedge reclassified to profit and loss during the year -3.1 1.2 -1.9Cash flow hedges -5.6 2.3 -3.3Remeasurements of post employment benefit -120.2 28.9 -91.3Other comprehensive income -123.7 32.4 -91.3
Deferred taxAccounting policiesDeferred tax is recognized on temporary differences between the carrying amounts of assets and liabilities in the financial statements and the corresponding tax bases used in the computation of taxable profit. Deferred tax liabilities are generally recognized for all taxable temporary differences and deferred tax assets are recognized to the extent that it is probable that taxable profits will be available, against which deductible temporary differences can be utilized. Such assets and liabilities are not recognized if the temporary difference arises from goodwill or from the initial recognition (other than in a business combination) of other assets and liabilities in a transaction that affects neither the taxable profit nor the accounting profit.
Deferred tax liabilities are recognized for taxable temporary differences arising from investments in subsidiaries and associates, as well as from interests in joint ventures, except where the Group is able to control the reversal of the temporary difference, and where it is probable that the temporary difference will not reverse in the foreseeable future.
The carrying amount of deferred tax assets is reviewed at each reporting date and reduced to the extent that it is no longer probable that sufficient taxable profits will be available to allow all or part of the asset to be recovered. Deferred tax is calculated at the tax rates that are expected to apply in the period when the liability is settled or the asset realized, based on tax rates that have been enacted or substantively enacted at the reporting date. Deferred tax is charged or credited to profit and loss, except when it relates to items charged or credited directly to equity, in which case the deferred tax is also dealt with in equity.
Deferred tax assets and liabilities are offset when there is a legally enforceable right to set off current tax assets against current tax liabilities and when they relate to income taxes levied by the same tax authority, within the same taxable entity, and when the Group intends to settle its current tax assets and liabilities on a net basis.

43
Bobst Group SA Annual report 2014 – Financial statements 2014 – Consolidated financial statements
RESULTS FOR THE YEAR
NOTE 11 (CONTINUED)TAXATION
Accounting judgements and estimatesDeferred tax assets are recognized for unused tax losses to the extent that it is probable that taxable profit will be available against which the losses can be utilized. Significant management judgment is required to determine the amount of deferred tax asset that can be recognized, based upon the likely timing and level of future taxable profits together with future tax strategies.
2 014 2013 (restated)
In million CHF Assets Liabilities Assets Liabilities
Fixed assets 1.0 24.1 1.2 22.0Inventories 8.5 21.4 6.4 24.4Receivables 2.4 2.9 2.3 3.3Employee benefits 34.0 0.0 14.0 7.7Provisions 4.4 7.2 5.5 6.9Other 7.8 3.6 3.0 3.7Loss carry-forwards 15.7 0.0 14.4 0.0Gross deferred taxes 73.8 59.2 46.8 68.0Offset of assets and liabilities -30.0 -30.0 -12.5 -12.5Net deferred taxes 43.8 29.2 34.3 55.5
On the balance sheet date, the Group has unused tax losses of CHF 70.0 million (2013: CHF 79.8 million) available to offset against future profits. Included in these unrecognized tax losses are losses of CHF 3.0 million (2013: CHF 3.8 million) that will expire within two to five years, whereas others may be carried forward indefinitely.
No material additional tax liabilities due to dividend payments from subsidiaries and associates are expected. There are no income tax consequences related to the payment of dividends by Bobst Group SA to its shareholders.
The increase of CHF 35.8 million (2013: decrease of CHF 19.7 million) in net deferred tax assets can be explained by:
— an increase of CHF 1.9 million (2013: increase of CHF 3.9 million) recognized in the profit and loss statement;
— an increase of CHF 32.4 million (2013: decrease of CHF 23.4 million) recognized directly in other comprehensive income;
— an increase of CHF 1.5 million (2013: decrease of 0.2 million) due to exchange variations.
There is no impact in 2014 and 2013 due to the change in the scope of consolidation.

44
Bobst Group SA Annual report 2014 – Financial statements 2014 – Consolidated financial statements
OPERATING ASSETS AND LIABILITIES
This section describes the assets used to generate the Group’s performance and the liabilities incurred. Liabilities relating to the Group’s financing activities are included in section ‘Risk management and capital structure’ and balance sheet information in respect of taxation are covered in section ‘Results for the year’. This section also provides detailed disclosures on the Group’s employee benefits.
NOTE 12INTANGIBLE FIXED ASSETS
Accounting policiesBrands and Patents. Brands and patents are measured initially at purchase cost and are amortized on a straight-line basis over the shorter of their contractual or useful economic lives (10–20 years).
Computer Software. Acquired computer software licenses are capitalized on the basis of the costs incurred to acquire and put into service the specific software. These costs are amortized on a straight-line basis over their estimated useful life (3–7 years).
Intangible assets that have an indefinite useful life are not subject to amortization and are tested annually for impairment. Intangible assets that are subject to amortization are reviewed for impairment whenever events or changes in circumstances indicate that the carrying amount may not be recoverable. An impairment loss is recognized for the amount by which the asset’s carrying value exceeds its recoverable amount. The recoverable amount is the higher of an asset’s fair value less costs to sell and its value in use. For the purpose of assessing impairment, assets are grouped at the lowest levels for which there are separately identifiable cash flows (cash-generating units).
In million CHFBrands and
Patents Software Other In progress Total
Gross valueAt the beginning of the year 2014 35.0 98.1 4.7 3.4 141.2Additions 0.2 4.6 0.0 1.4 6.2Disposals and decreases 0.0 -0.7 0.0 0.0 -0.7Change in the scope of consolidation 0.0 0.0 0.0 0.0 0.0Currency variances 1.1 0.0 0.3 0.0 1.4Transfers 0.0 2.8 0.0 -2.8 0.0At year-end 2014 36.3 104.8 5.0 2.0 148.1 Accumulated amortizationAt the beginning of the year 2014 -25.6 -77.6 -1.3 0.0 -104.5Additions -2.0 -7.8 -0.1 0.0 -9.9Disposals and decreases 0.0 0.7 0.0 0.0 0.7Change in the scope of consolidation 0.0 0.0 0.0 0.0 0.0Currency variances -0.4 0.0 -0.1 0.0 -0.5Transfers 0.0 0.0 0.0 0.0 0.0At year-end 2014 -28.0 -84.7 -1.5 0.0 -114.2Net value at year-end 2014 8.3 20.1 3.5 2.0 33.9
There is no impairment charge or reversal included in the 2014 amortization charge.

45
Bobst Group SA Annual report 2014 – Financial statements 2014 – Consolidated financial statements
OPERATING ASSETS AND LIABILITIES
NOTE 12 (CONTINUED)INTANGIBLE FIXED ASSETS
In million CHFBrands and
Patents Software Other In progress Total
Gross valueAt the beginning of the year 2013 35.1 98.2 11.6 6.8 151.7Additions 0.0 2.2 0.0 3.4 5.6Disposals and decreases -0.2 -8.8 -6.9 -0.1 -16.0Change in the scope of consolidation 0.0 0.0 0.0 0.0 0.0Currency variances 0.1 -0.2 0.0 0.0 -0.1Transfers 0.0 6.7 0.0 -6.7 0.0At year-end 2013 35.0 98.1 4.7 3.4 141.2 Accumulated amortizationAt the beginning of the year 2013 -22.1 -74.7 -7.7 0.0 -104.5Additions -3.7 -8.2 -0.5 0.0 -12.4Disposals and decreases 0.2 5.1 6.9 0.0 12.2Change in the scope of consolidation 0.0 0.0 0.0 0.0 0.0Currency variances 0.0 0.2 0.0 0.0 0.2Transfers 0.0 0.0 0.0 0.0 0.0At year-end 2013 -25.6 -77.6 -1.3 0.0 -104.5Net value at year-end 2013 9.4 20.5 3.4 3.4 36.7
There is no impairment charge or reversal included in the 2013 amortization charge.

46
Bobst Group SA Annual report 2014 – Financial statements 2014 – Consolidated financial statements
OPERATING ASSETS AND LIABILITIES
NOTE 13GOODWILL
Accounting policiesGoodwill arising from the acquisition of a subsidiary represents the excess of the cost of acquisition over the Group’s interest in the net fair value of the identifiable assets, liabilities and contingent liabilities of the subsidiary or jointly controlled entity recognized at the date of acquisition.
Goodwill is initially measured at cost, being the excess of the aggregate of the consideration transferred and the amount recognized for non-controlling interests, and any previous interest held, over the net identifiable assets acquired and liabilities assumed.
If the fair value of the net assets acquired is in excess of the aggregate consideration transferred, the Group re-assesses whether it has correctly identified all the assets acquired and all of the liabilities assumed and reviews the procedures used to measure the amounts to be recognized at the acquisition date.
If the re-assessment still results in an excess of the fair value of net assets acquired over the aggregate consideration transferred, then the gain is recognized in profit or loss.
After initial recognition, goodwill is measured at cost less any accumulated impairment losses. For the purpose of impairment testing, goodwill is allocated to each of the Group’s cash-generating units expected to benefit from the synergies of the combination.
Cash-generating units to which goodwill has been allocated are tested for impairment annually, or more frequently when there is an indication that the unit may be impaired.
If the recoverable amount of the cash-generating unit is less than the carrying amount of the unit, the impairment loss is allocated first to reduce the carrying amount of any goodwill allocated to the unit, and then to the other assets of the unit, pro rata on the basis of the carrying amount of each asset in the unit. An impairment loss recognized for goodwill is not reversed in a subsequent period.
On disposal of a subsidiary or a jointly controlled entity, the attributable amount of goodwill is included in the determination of the profit or loss on disposal.
Accounting judgements and estimatesThe Group determines whether goodwill is impaired at least once a year. This requires an estimation of the value in use of the cash-generating units to which the goodwill is allocated.
For the estimation of the value in use, the Group has to make an estimate of the expected future cash flows from the cash-generating unit and choose a suitable discount rate in order to calculate the present value of those cash flows.
Significant assumptions and valuations are necessary to make these estimates. Factors such as volume, selling price, material and personnel costs, capital expenditures and the outcome of R&D activities, as well as market conditions and other economic factors, are considered based on assumptions that management regards as reasonable.
Due to these factors, actual cash flows and values could vary from the forecasted future cash flows and related values derived using discounting techniques.

47
Bobst Group SA Annual report 2014 – Financial statements 2014 – Consolidated financial statements
NOTE 13 (CONTINUED)GOODWILL
In million CHF 2014 2013
At the beginning of the year 78.0 77.2Increase arising from acquisition of subsidiaries 0.0 0.0Exchange rate variances -0.6 0.8Total 77.4 78.0 Goodwill is allocated by Business Units (BU) as follows:BU Sheet-fed 18.5 18.6BU Web-fed 30.1 30.4BU Services 28.8 29.0Total 77.4 78.0
For impairment tests, the recoverable amounts are determined by value-in-use calculations that are based on financial forecasts over three years as approved by management.
The three year forecast is founded on the following key assumptions, which are based on past experience: the fundamentals of the packaging industry remain solid and packaging consumption is forecasted to grow, with an evolution which is different from industry to industry as well as by region. Bobst Group’s markets are expected to remain challenging, mainly due to political and economic uncertainties in the Euro zone as well as in Africa and the Middle East. Volumes can continue to increase in the next few years through innovation, a focus on emerging markets, development in the medium segment and increased activity in services. The forecasted profitability is expected to further improve over the next three years, but is negatively impacted by the decision of the Swiss National Bank to discontinue the minimum exchange rate of CHF 1.20 per Euro. Measures which shall significantly limit the negative impact of the new currency situation on the Groups results are currently evaluated.
Cash flows for the next three years are extrapolated from these forecasts, and cash flows beyond this three year period are frozen to a nil increase. The discount rates used are pre-tax and reflect specific risks relating to the different business segments, i.e. BU Sheet-fed 4.9% (2013: 5.2%), BU Web-fed 4.9% (2013: 5.2%), BU Services 4.1% (2013: 4.5%). The management believes that any reasonably possible change in the key assumptions on which recoverable amounts are based would not cause the aggregate carrying amount to exceed the aggregate recoverable amount of each cash-generating unit.
At the end of the year 2014, a decrease by 10% of the future cash flows or an increase of 1% of the discount rates would not necessitate any impairment charge of goodwill for any of the three business segments.
OPERATING ASSETS AND LIABILITIES

48
Bobst Group SA Annual report 2014 – Financial statements 2014 – Consolidated financial statements
OPERATING ASSETS AND LIABILITIES
NOTE 14INVESTMENTS IN ASSOCIATES
Accounting policiesAn associate is an entity over which the Group has significant influence.
Significant influence is the power to participate in the financial and operating policy decisions of the investee, but is not control or joint control over those policies. The results, assets and liabilities of associates are incorporated in these financial statements using the equity method of accounting.
Under the equity method, investments in associates are carried in the consolidated balance sheet at cost, as adjusted for post-acquisition changes in the Group’s share of the net assets of the associate, less any impairment in the value of individual investments.
If an associate is over-indebted and the Group’s interest is reduced to zero, additional losses are provided for only to the extent that the Group has a legal or constructive obligation.
Any excess of the cost of acquisition over the Group’s share of the net fair value of the identifiable assets, liabilities and contingent liabilities of the associate, recognized at the date of acquisition, is recognized as goodwill.
The goodwill is included in the carrying amount of the investment and is assessed for impairment as part of the investment.
Any excess of the Group’s share of the net fair value of the identifiable assets, liabilities and contingent liabilities over the cost of acquisition, after reassessment, is recognized immediately in profit or loss.
Where a Group entity transacts with an associate of the Group, profits and losses are eliminated to the extent of the Group’s interest in the relevant associate.

49
Bobst Group SA Annual report 2014 – Financial statements 2014 – Consolidated financial statements
NOTE 14 (CONTINUED)INVESTMENTS IN ASSOCIATES
In million CHF 2014 2013
Changes over the period are the following:Beginning of the year 58.3 56.4Share of result of associates 7.3 1.6Dividends received -1.4 -0.6Exchange differences -1.2 0.9Total 63.0 58.3
The Group has a 30% (2013: 30%) interest in BHS Corrugated Maschinen- und Alagenbau GmbH located in Weiherhammer Germany, which is active in the sectors of corrugated board and service.
Summarized financial information regarding BHS is set out below:Current assets 160.1 120.2Non-current assets 92.8 62.4Current liabilities 154.0 101.2Equity 98.9 81.4Group’s interest 30% 30%Group’s share in equity 29.7 24.4Goodwill 30.8 31.4Group’s carrying amount of the investment 60.5 55.8 Revenue 296.9 284.8Profit for the year (continuing operations) 22.9 4.5Group’s share of profit for the year 6.9 1.3
Summarized proportionate values of other associate (Duo-Technik GmbH) Group’s carrying amount of the investment 2.5 2.5Group’s share of profit for the year 0.4 0.3
There are no unrecognized losses on investments in associates.
OPERATING ASSETS AND LIABILITIES

50
Bobst Group SA Annual report 2014 – Financial statements 2014 – Consolidated financial statements
OPERATING ASSETS AND LIABILITIES
NOTE 15CORRECTION OF AN ERROR
Accounting policiesIn the case the Group identifies a material error during the year relating to prior periods, the error is corrected retrospectively by restating the comparative amounts for the prior periods presented in which the error occurred.
In 2014, the Group conducted a detailed review on IFRS adjustment entries on intangible and tangible depreciation calculation. An error dating back to the conversion to IFRS in 2005 has been discovered in the accumulated depreciation on land and building and the error has been corrected by restating each of the affected financial statement line items for the prior period.
The effect of the restatement on those previously reported financial statements is summarized below:In million CHF 31 December 2013 1 January 2013
Increase in accumulated depreciation on land and buildings 15.0 15.0Decrease on deferred tax liabilities -3.4 -3.4Decrease on total equity -11.6 -11.6
The correction did not have any impact on profit and loss account, other comprehensive income, cash flow statement or earning per share.
NOTE 16TANGIBLE FIXED ASSETS
Accounting policiesLand is booked at purchase cost and is not depreciated.
The other tangible fixed assets are booked at purchase or manufacturing costs less accumulated depreciation and accumulated impairment. Depreciation on other tangible fixed assets is calculated using the straight-line method as follows:
Buildings (including investment properties) 10–30 yearsTechnical installation, industrial equipment 7–20 yearsMachines leased to customers According to their useful lifeIT equipment 4 yearsOther 5–7 yearsIn progress Not depreciated
An asset’s carrying amount is written down immediately to its recoverable amount if the asset’s carrying amount is greater than its estimated recoverable amount.
Gains and losses on disposals are determined by comparing the proceeds with the carrying amount and are recognized in the income statement.
Leases are classified as finance leases whenever the terms of the lease transfer substantially all the risks and rewards of ownership to the lessee. All other leases are classified as operating leases.

51
Bobst Group SA Annual report 2014 – Financial statements 2014 – Consolidated financial statements
OPERATING ASSETS AND LIABILITIES
NOTE 16 (CONTINUED)TANGIBLE FIXED ASSETS
The Group as lessor. Bobst Group companies may act as direct lessor to customers. In accordance with IAS 17, leases where the Group transfers substantially all risks and benefits of ownership of the leased machine are disclosed as finance lease receivables.
Amounts due from lessees under finance leases are recorded as finance lease receivables at the amount of the Group’s net present value for expected lease payments.
Finance lease income is allocated to accounting periods so as to reflect a constant periodic rate of return on the Group’s net investment outstanding in respect of the leases.
Leases where the Group does not transfer substantially all risks and benefits of ownership of the asset are classified as operating leases.
Rental income from operating leases is recognized on a straight-line basis over the term of the relevant lease.
Initial direct costs incurred in negotiating and arranging an operating lease are added to the carrying amount of the leased asset and recognized on a straight-line basis over the lease term.
Tangible assets that are subject to depreciation are reviewed for impairment whenever events or changes in circumstances indicate that the carrying amount may not be recoverable. An impairment loss is recognized for the amount by which the asset’s carrying value exceeds its recoverable amount. The recoverable amount is the higher of an asset’s fair value less costs to sell and its value in use.
For the purpose of assessing impairment, assets are grouped at the lowest levels for which there are separately identifiable cash flows (cash-generating units).
In million CHFLand and buildings
Technical instal.,
industrial equipment
Machines leased to
customers
IT
equipment
Other
In progress
Total
Gross valueAt the beginning of the year 2014 469.2 163.5 2.3 40.9 24.8 0.3 701.0Additions 5.1 1.8 0.2 1.0 1.4 11.4 20.9Disposals and decreases -1.2 -2.5 -0.8 -0.4 -2.2 0.0 -7.1Change in the scope of consolidation 0.0 0.0 0.0 0.0 0.0 0.0 0.0Currency variances 1.3 0.2 0.0 0.1 0.5 0.0 2.1Transfers 0.3 0.9 0.0 0.2 0.1 -1.5 0.0At year-end 2014 474.7 163.9 1.7 41.8 24.6 10.2 716.9
Accumulated depreciationAt the beginning of the year 2014 -229.1 -112.9 -0.1 -35.3 -20.2 0.0 -397.6Additions -17.4 -5.7 -0.4 -3.3 -1.5 0.0 -28.3Disposals and decreases 0.5 0.9 0.2 0.4 2.0 0.0 4.0Change in the scope of consolidation 0.0 0.0 0.0 0.0 0.0 0.0 0.0Currency variances -0.3 0.0 0.0 0.0 -0.3 0.0 -0.6Transfers 0.0 0.0 0.0 0.0 0.0 0.0 0.0At year-end 2014 -246.3 -117.7 -0.3 -38.2 -20.0 0.0 -422.5Net value at year-end 2014 228.4 46.2 1.4 3.6 4.6 10.2 294.4
There were no borrowing costs capitalized during the years ended 31 December 2013 and 2014.

52
Bobst Group SA Annual report 2014 – Financial statements 2014 – Consolidated financial statements
OPERATING ASSETS AND LIABILITIES
NOTE 16 (CONTINUED)TANGIBLE FIXED ASSETS
In million CHFLand and buildings
Technical instal.,
industrial equipment
Machines leased to
customers
IT
equipment
Other
In progress
Total
Gross valueAt the beginning of the year 2013 461.6 164.3 0.0 41.1 26.4 4.0 697.4Additions 7.7 10.0 2.3 1.3 1.3 1.3 23.9Disposals and decreases 0.0 -13.9 0.0 -1.4 -2.7 -0.8 -18.8Change in the scope of consolidation 0.0 0.0 0.0 0.0 0.0 0.0 0.0Currency variances -0.9 -1.2 0.0 -0.2 -0.3 0.1 -2.5Transfers 0.8 4.3 0.0 0.1 0.1 -4.3 1.0At year-end 2013 469.2 163.5 2.3 40.9 24.8 0.3 701.0
Accumulated depreciationAt the beginning of the year 2013 (restated) -212.4 -110.8 0.0 -33.2 -21.5 0.0 -377.9Additions -16.9 -6.5 -0.1 -3.6 -1.5 0.0 -28.6Disposals and decreases 0.0 4.8 0.0 1.4 2.6 0.0 8.8Change in the scope of consolidation 0.0 0.0 0.0 0.0 0.0 0.0 0.0Currency variances 0.2 0.6 0.0 0.1 0.2 0.0 1.1Transfers 0.0 -1.0 0.0 0.0 0.0 0.0 -1.0At year-end 2013 (restated) -229.1 -112.9 -0.1 -35.3 -20.2 0.0 -397.6Net value at year-end 2013 (restated) 240.1 50.6 2.2 5.6 4.6 0.3 303.4
Tangible fixed assets are insured at the replacement value of CHF 795 million (2013: CHF 760 million).
There is no impairment charge (2013: CHF 0.0 million) or reversal included in the annual depreciation charge of CHF 28.3 million (2013: CHF 28.6 million).
There are no significant tangible fixed assets financed with leases.

53
Bobst Group SA Annual report 2014 – Financial statements 2014 – Consolidated financial statements
OPERATING ASSETS AND LIABILITIES
NOTE 17RECEIVABLES
2014 2013
In million CHF CurrentNon-
current Total CurrentNon-
current Total
Trade receivables from third parties 246.0 1.0 247.0 233.3 0.4 233.7Receivables from the sale of fixed assets 0.8 1.0 1.8 0.4 1.5 1.9Various receivables from third parties 41.8 4.8 46.6 54.2 5.5 59.7Total 288.6 6.8 295.4 287.9 7.4 295.3
NOTE 18TRANSFER OF ASSETS
Finance lease receivables include discounted receivables with recourse amounting to CHF 1.4 million (2013: CHF 2.7 million). The Group remains responsible until the transferred receivables are paid in full. The corresponding liability appears under trade and other payables.
The carrying amount of the original receivables before the transfer amounted to CHF 1.4 million (2013: CHF 2.7 million)
NOTE 19FINANCE LEASE RECEIVABLES
The discounted receivables with recourse (see Note 18) are not included in the following analysis.
In million CHF 2014 2013
Maturity within one year 5.0 5.4Maturity between one to five years 0.6 10.8Maturity after five years 0.0 0.0Total 5.6 16.2Less: unearned finance income -0.1 -1.2Total 5.5 15.0 Analyzed as: Recoverable within one year 4.9 4.8Recoverable between one and five years 0.6 10.2Recoverable after five years 0.0 0.0Total 5.5 15.0
The Group enters into finance lease arrangements with clients for the machines sold.
The weighted average term of finance lease contracts is 0.8 years (2013: 3.9 years). The average interest rate of all the lease contracts is approximately 1.8% (2013: 5.0%) per annum.

54
Bobst Group SA Annual report 2014 – Financial statements 2014 – Consolidated financial statements
OPERATING ASSETS AND LIABILITIES
NOTE 20 CREDIT RISK RELATED TO CLIENT RECEIVABLES
Credit risks are linked with the inability or unwillingness of counterparties to a transaction to fulfill their obligations.
Customers: determination of the payment conditions resulting in the trade receivables takes into consideration the country risk as well as solvency of the counterparty. Reserve of property clauses are also utilized until final payment.
In relation to longer-term payment conditions agreed upon, and depending on the negotiations with the customer, guarantees including, among others, export credit agencies and private insurers are used.
When risk conditions allow it, it is also regular practice to discount without recourse amounts due by customers. There is no particular risk concentration on the customer receivables. Local and Group finance members monitor the payment conditions.
Banks and counterparties: for other financial assets the concern of credit risk imposes the use of good quality counterparties. Cash is deposited with a variety of well established banks to protect against any concentration risk.
In million CHF 2014 2013
Trade receivables 264.5 250.5Finance lease receivables 7.4 19.9Total gross value 271.9 270.4Less provision for impairment -19.4 -19.0Total for the analysis 252.5 251.4 The aging of the amounts past due but not impaired is as follows:< 2 months 48.4 49.92–6 months 17.6 16.5> 6 months 11.3 14.3 + not yet due 175.2 170.7 Total 252.5 251.4
2014 2013
Movements in the provision for impairment were as follows:At the beginning of the year -19.0 -23.0Additions -3.0 -4.0Utilizations 2.0 5.7Releases 0.8 2.4Currency variances -0.2 -0.1At year-end -19.4 -19.0
The maximum exposure to credit risk at the reporting date is the carrying amount of client receivables mentioned above.

55
Bobst Group SA Annual report 2014 – Financial statements 2014 – Consolidated financial statements
OPERATING ASSETS AND LIABILITIES
NOTE 21INVENTORIES
Accounting policiesRaw materials are stated at the lower of either the cost or the net realizable value, using the weighted average method. Work in progress and finished products are stated at the lower of the production costs or the net realizable value. Production costs comprise direct materials and, where applicable, direct labor costs and those overheads that have been incurred in bringing the inventories to their present location and condition. Net realizable value represents the estimated selling price less all estimated costs of completion and costs to be incurred in marketing, selling and distribution. Valuation adjustments are made for slow-moving items and excess stock.
In million CHF 2014 2013
Raw materials 154.1 155.9Work in progress 80.1 75.7Finished products* 85.7 82.1Total 319.9 313.7
* Including CHF 17.1 million (2013: CHF 12.3 million) for demonstration machines.
The carrying amount of inventories carried at the realizable value (less costs to sell) is CHF 49.6 million (2013: CHF 44.1 million).
The amount for write-down recognized as expense during the year is CHF 8.3 million (2013: CHF 18.6 million).
NOTE 22PROVISIONS
Accounting policiesProvisions are recognized when the Group has a present obligation as a result of a past event, and when it is probable that the Group will be required to settle that obligation. Provisions are evaluated based upon the best estimate of the expenditure required to settle the obligation at the balance sheet date and are discounted to present value where the effect is material. Provisions are classified as warranties/product liabilities, litigations, restructuring and other.
Accounting judgements and estimatesProvisions are created for a variety of possible events. However, by definition, provisions contain a higher degree of estimates than other balance sheet items, since the estimated obligations can cause greater or less cash drain depending on how the situation materializes.

56
Bobst Group SA Annual report 2014 – Financial statements 2014 – Consolidated financial statements
OPERATING ASSETS AND LIABILITIES
NOTE 22 (CONTINUED)PROVISIONS
In million CHF
Warranties/ Product
liabilities Litigations Restructuring Other 2014 2013
At the beginning of the year 32.9 14.7 1.8 7.8 57.2 40.7Additions 22.4 7.6 0.0 1.2 31.2 46.0Utilizations -20.3 -1.8 -1.3 0.0 -23.4 -22.5Releases -4.9 -0.6 -0.4 -1.4 -7.3 -7.3Currency translation adjustment -0.3 0.0 0.0 0.1 -0.2 0.3Transfers 0.0 1.4 0.0 -1.4 0.0 0.0At year-end 29.8 21.3 0.1 6.3 57.5 57.2 Of which non-current 0.9 11.1 0.1 1.7 13.8 3.9Of which current 28.9 10.2 0.0 4.6 43.7 53.3At year-end 29.8 21.3 0.1 6.3 57.5 57.2
Warranties/Product liabilities include provisions for technical risks, customer claims and penalties in the context of product deliveries and services. The provision is based on expected claims for product liabilities on sales that have already taken place, on historical warranty data and a weighting of all possible outcomes against their associated probabilities. Warranty expenses are expected before expiration of the granted warranty period.
Litigations include provisions for current and probable legal proceedings related to events in the past. A number of subsidiaries are subject to various legal proceedings that arise including product liability, commercial, employment and tax litigations or intellectual property disputes. The expected timing of future cash outflows is uncertain as it will depend upon the outcome of the legal proceedings.
For restructuring provisions, constructive obligation to restructure arises only when a detailed formal plan exists which identifies at least the business or part of the business concerned, the principal sites affected, the location, function and approximate number of employees who will be compensated for terminating their services, the expenditures that will be undertaken, and the timing of the implementation; and when the features of this plan have been communicated in a manner that raised a valid expectation in those affected by it that the restructuring plan will be carried out.

57
Bobst Group SA Annual report 2014 – Financial statements 2014 – Consolidated financial statements
OPERATING ASSETS AND LIABILITIES
NOTE 23EMPLOYEE BENEFITS
Accounting policiesThe Group operates various post-employment schemes, including both defined benefit and defined contribution pension plans.
Defined contribution post-employment benefits. A defined contribution plan is a pension plan under which the Group pays fixed contributions into a separate entity. The Group has no legal or constructive obligations to pay further contributions if the fund does not hold sufficient assets to pay all employees the benefits relating to employee service in the current or prior periods. The contributions to such plans are recorded as expenses in the period in which they are incurred.
Defined benefit post-employment benefits. The liabilities of the Group arising from defined benefit obligations are determined using the projected unit credit method. Any net pension asset is limited to the present value of future economic benefits available to the Group in the form of refunds from the plan or expected reductions in future contributions to the plan. Valuations are carried out on a regular basis by independent actuaries. Actuarial gains and losses arise mainly from changes in long-term assumptions (e.g. discount rate, salary increase) and from differences between actuarial assumptions and what has actually occurred. They are recorded in other comprehensive income and are not recycled through the profit and loss at any later point in time.
The pension costs are recorded in personnel costs and consist of: — service cost, which corresponds to the acquisition of one additional year of rights and
the effect of plan amendments and curtailments; — net interest income or net interest expense, which is calculated on the defined benefit
obligation net of the value of plan assets, by applying the discount rate used to determine the defined benefit obligation.
The difference between the actual return on plan assets and the interest income calculated by applying the discount rate is recorded in other comprehensive income.
A liability for termination benefits is recognized at the earlier of when the entity can no longer withdraw the offer of the termination benefit and when the entity recognizes any related restructuring costs.
Accounting judgements and estimatesIn various countries there are pension and other retirement plans. Several statistical and other factors that attempt to anticipate future events are used in calculating the expense and liability related to the plans. These factors include assumptions about the discount rate, the expected return on plan assets, the mortality rate and the expected rate of salary increase. The actuarial assumptions used may differ from actual results due to changing market and economic conditions.
The Group has, apart from the legally required social security schemes, several defined benefit plans.
They are either externally funded, with the assets of the schemes held separately from those of the Group in independently administrated funds, or unfunded.The largest plans are in Switzerland, which account for 92% (2013: 92%) of the Group’s total defined benefit obligation and 95% (2013: 95%) of its plan assets.

58
Bobst Group SA Annual report 2014 – Financial statements 2014 – Consolidated financial statements
OPERATING ASSETS AND LIABILITIES
NOTE 23 (CONTINUED)EMPLOYEE BENEFITS
The BOBST pension plan in Switzerland is a funded defined plan (hybridplan) providing retirement benefits based on a participant’s accumulated account balance. The plan also provides benefits on death, disability and termination. The Bobst pension fund is a pension foundation registered with the Swiss supervisory authority in the canton of Vaud.
As a result, the pension fund must comply with the compulsory insurance requirements as per the Swiss Federal Law on Occupational retirement, Survivor’s and Disability Pension Funds (LPP/BVG). The fund undertakes to respect at least the minimum requirements imposed by the LPP/BVG and its ordinances. If the plan is underfunded under Swiss Law, the foundation board decides measures that will allow the coverage ratio to get back to 100% within an appropriate horizon of time (usually, a time horizon of 5 to 7 years is considered to be appropriate). The foundation board is equally represented by employer and employees representatives and is responsible for the fund’s management.
Post-employment health care plans are limited to the USA.Other employee benefits represent amounts due to employees under deferred
compensations arrangements such as long-service awards, jubilee premiums and end of service indemnities depending upon certain seniority criteria. The following is a summary of the status of the pension and other employee benefit plans as at 31 December 2014 and 2013:
Swiss International
In million CHF 2014 2013 2014 2013
Fair value of plan assets at year end 1 065.0 1 015.2 55.3 48.6Benefit obligation at year end -1 162.1 -1 003.7 -101.4 -84.6Net assets(liabilities) in the balance sheet -97.1 11.5 -46.1 -36.0
In million CHF 2014 2013
Benefit obligation at the beginning of the year -1 088.3 -1 139.1Service cost -13.6 -15.6Interest cost -24.4 -22.6Employee contributions -10.6 -10.9Benefit payments 50.6 63.9Actuarial gains(losses) -173.3 35.7Foreign currency translation -3.9 0.3Benefit obligation at year-end -1 263.5 -1 088.3of which unfunded -63.5 -52.4 Fair value of plan assets at the beginning of the year 1 063.8 1 018.0Interest income 22.8 19.1Return on plan assets in excess (excluding interest income) 51.6 59.9Employee contributions 10.4 10.7Employer contributions 14.5 14.8Benefit payments -44.7 -58.6Foreign currency translation 1.9 -0.1Fair value of plan assets at year-end 1 120.3 1 063.8
The weighted average duration of the Defined Benefit Obligation (DBO) at the end of the current financial year is 15.3 years (14.9 years at the end of 2013).

59
Bobst Group SA Annual report 2014 – Financial statements 2014 – Consolidated financial statements
OPERATING ASSETS AND LIABILITIES
NOTE 23 (CONTINUED)EMPLOYEE BENEFITS
In million CHF 2014 2013
Defined benefits net assets(liabilities) in the balance sheet -143.2 -24.5Liabilities from defined contribution plans -1.8 -1.7Net assets(liabilities) in the balance sheet -145.0 -26.2
Reflected in the balance sheet as follows:Employee benefits assets 0.0 33.6Pension plans and other employee benefits liabilities -145.0 -59.8Net assets(liabilities) in the balance sheet -145.0 -26.2
The movement in the net defined benefits liabilities is as follows:Net assets(liabilities) in the balance sheet at the beginning of the year -24.5 -121.1Net periodic benefit cost -16.6 -19.5Employer contributions 14.5 14.8Benefit payments 5.6 5.3Amount recognized in other comprehensive income -120.2 96.1Foreign currency translation -2.0 -0.1Net assets(liabilities) in the balance sheet at year-end -143.2 -24.5
The net periodic benefit cost recorded in the income statement consists of the following components:Service cost 13.6 15.6Interest cost 24.4 22.6Interest income related to plan assets -22.8 -19.1Immediate recognition of gain(loss) arising during year 1.4 0.4Total defined benefit expenses 16.6 19.5
The movement in the other comprehensive income is as follows: Remeasurement of defined benefit obligation due to changes in demographic assumptions gains(losses) -1.7 0.6Remeasurement of defined benefit obligation due to changes in financial assumptions gains(losses) -151.9 38.2Remeasurement of defined benefit obligation due to experience gains(losses) -18.2 -2.5Return on plan assets in excess(below) interest income 51.6 59.8Total gain(loss) recognized in other comprehensive income -120.2 96.1
These expenses are included in personnel costs (Note 7).

60
Bobst Group SA Annual report 2014 – Financial statements 2014 – Consolidated financial statements
OPERATING ASSETS AND LIABILITIES
NOTE 23 (CONTINUED)EMPLOYEE BENEFITS
The actuarial assumptions used to calculate the benefit obligations vary according to the economic conditions of the country in which the plan is located. The main assumptions are as follows:
Swiss International
2014 2013 2014 2013
Discount rate 1.10% 2.15% 3.26% 4.16%Expected rate of salary increase 1.50% 2.00% 2.77% 3.25%Medical cost trend rate for next year n/a n/a 7.50% 7.50%
2014 2014
Swiss International
The sensitivity of the DBO to changes in the main actuarial assumptions is as follows: Increase(decrease)Discount rateIncrease by 0.25% -42.5 -2.7 Decrease by 0.25% 44.8 2.9 Expected rate of salary increaseIncrease by 0.25% 2.3 2.0 Decrease by 0.25% -2.3 -1.9 Medical cost trendIncrease by 1.00% n/a 5.2 Decrease by 1.00% n/a -4.2
Swiss International
2014 2013 2014 2013
The weighted average asset allocation of funded defined benefit plans at the year end is as follows:Equity securities 25.0% 29.9% 54.6% 36.8%Debt securities 33.2% 30.7% 44.2% 18.8%Real estate 27.2% 26.2% 0.4% 2.6%Cash and other investments 14.6% 13.2% 0.8% 41.8%
Cash, as well as most equity and debt securities, have a quoted market price in an active market. Other assets including real estate and other investments do not have a quoted market price. The plans have no investment in Bobst Group’s own financial instruments or property used by entities of the Group.
The strategic allocation of plan assets is performed with the objective to achieve a return on investment and availability of funds that match the requirement of future cash outflows. The following main cash outflows are expected in future periods:
In million CHF Swiss International
The following main cash outflows are expected in future periods:Within 1 year 14.9 3.8

61
Bobst Group SA Annual report 2014 – Financial statements 2014 – Consolidated financial statements
RISK MANAGEMENT AND CAPITAL STRUCTURE
This section sets out the policies and procedures applied to manage the Group’s capital structure and the financial risks the Group is exposed to. Bobst Group considers as permanent financing or capital resources the following: borrowings and equity. Bobst Group manages its permanent financing or capital resources to achieve capital efficiency, provide flexibility to invest through the economic cycle and give efficient access to debt markets at attractive cost levels.
NOTE 24FINANCIAL INSTRUMENTS
Accounting policiesA financial instrument is any contract that gives rise to a financial asset of one entity and a financial liability or equity instrument of another entity.
Financial assets and financial liabilities are recognized when a Group entity becomes a party to the contractual provisions of the instruments.
Financial assetsInitial recognition and measurementFinancial assets comprise Cash and cash equivalents, Receivables, Accrued income, Financial assets other and Derivative financial instruments.
Financial assets are classified, at initial recognition, as Financial assets at fair value through profit or loss or as Loans and receivables. The classification depends on the nature and purpose of the financial assets and is determined at the time of initial recognition.
All financial assets are recognized initially at fair value plus, in the case of financial assets not recorded at fair value through profit or loss, transaction costs that are attributable to the acquisition of the financial asset.
All purchases and sales are recognized at trade date, i.e. the date at which the commitment to purchase or sell the asset is entered into.
Subsequent measurementThe subsequent measurement of financial assets depends on their classification:
— Financial assets at fair value through profit or loss. Financial assets at fair value through profit or loss include Derivative financial instruments unless they are designated as effective hedging instruments as defined by IAS 39. Financial assets at fair value through profit or loss are carried in the balance sheet at fair value with net changes recognized in the statement of profit or loss.
— Loans and receivables. This category is the most relevant to the Group. Loans and receivables are non-derivative financial assets with fixed or determinable payments that are not quoted in a active market. After initial measurement, such financial assets are subsequently measured at amortized cost using the effective interest rate method, less impairment.

62
Bobst Group SA Annual report 2014 – Financial statements 2014 – Consolidated financial statements
RISK MANAGEMENT AND CAPITAL STRUCTURE
NOTE 24 (CONTINUED)FINANCIAL INSTRUMENTS
DerecognitionA financial asset is derecognized when:
— the contractual rights to receive cash flows expire, or — the Group has transferred its rights to receive cash flows from the asset and either the
Group has transferred substantially all the risks and rewards of the asset, or the Group has neither transferred nor retained substantially all the risks and rewards of the asset but has transferred control of the asset.
When the Group has transferred its rights to receive cash flows from an asset or has entered into a pass-through arrangement, it evaluates if and to what extent it has retained the risks and rewards of ownership. When it has neither transferred nor retained substantially all of the risks and rewards of the asset, nor transferred control of the asset, the Group continues to recognize the transferred asset to the extent of the Group’s continuing involvement. In that case, the Group also recognizes an associated liability. The transferred asset and the associated liability are measured on a basis that reflects the rights and obligations that the Group has retained.
Impairment of financial assetsThe Group assesses at the end of each reporting date whether there is any objective evidence that a financial asset or group of financial assets is impaired. A financial asset or a group of financial assets is impaired and impairment losses are incurred only if there is objective evidence of impairment as a result of one or more events that occurred after the initial recognition of the asset (a “loss event”) and that loss event has an impact on the estimated future cash flows of the financial asset or group of financial assets that can be reliably estimated.
Evidence of impairment may include: indications that the debtors or a group of debtors are experiencing significant financial difficulties; default or delinquency in interest or principal payments; the probability that they will encounter bankruptcy; and where observable data indicate that there is a measurable decrease in the estimated future cash flows. The amount of the loss is measured as the difference between the asset’s carrying amount and the present value of estimated future cash flows. The carrying amount of the asset is reduced through the use of an allowance account and the loss is recognized in the consolidated profit and loss statement.
If, in a subsequent period, the amount of the impairment loss decreases and the decrease can be related objectively to an event occurring after the impairment was recognized (such as an improvement in the debtor’s credit rating), the reversal of the previously recognized impairment loss is included in the consolidated profit and loss statement.
Financial liabilities and equity instrumentsClassificationDebt and equity instruments issued by a Group entity are classified as either financial liabilities or as equity in accordance with the substance of the contractual arrangements and the definitions of a financial liability and an equity instrument.

63
Bobst Group SA Annual report 2014 – Financial statements 2014 – Consolidated financial statements
RISK MANAGEMENT AND CAPITAL STRUCTURE
NOTE 24 (CONTINUED)FINANCIAL INSTRUMENTS
Equity instrumentsAn equity instrument is any contract that evidences a residual interest in the assets of an entity after deducting all of its liabilities. Equity instruments issued by a Group entity are recognized at the proceeds received, net of direct issue costs.
Repurchase of the Company’s own equity instruments is recognized and deducted directly in equity. No gain or loss is recognized in profit or loss on the purchase, sale, issue or cancellation of the Company’s own equity instruments.
Financial liabilitiesInitial recognition and measurementFinancial liabilities comprise Trade and other payables, Borrowings, Accrued expenses and Derivative financial instruments. Financial liabilities are classified, at initial recognition, as Financial liabilities at fair value through profit and loss or as Other financial liabilities. All financial liabilities are recognized initially at fair value and, in the case of other financial liabilities, net of directly attributable transaction costs.
Subsequent measurementThe subsequent measurement of financial liabilities depends on their classification:
— Financial liabilities at fair value through profit and loss. This category includes Derivative financial instruments unless they are designated as effective hedging instruments as defined by IAS 39. Financial liabilities at fair value through profit or loss are carried in the balance sheet at fair value with net changes recognized in the statement of profit or loss.
— Other financial liabilities. After initial recognition, interest-bearing loans and borrowings are subsequently measured at amortized cost using the effective interest rate method (EIR). Gains and losses are recognized in profit or loss when the liabilities are derecognized as well as through the EIR amortization process. Amortized cost is calculated by taking into account any discount or premium on acquisition and fees or costs that are an integral part of the EIR. The EIR amortization is included as finance costs in the statement of profit or loss.
DerecognitionA financial liability is derecognized when the obligation under the liability is discharged, cancelled or expires. The difference between the carrying amount of the financial liability derecognized and the consideration paid and payable is recognized in the statement of profit or loss.
Offsetting of financial instrumentsFinancial assets and financial liabilities are offset and the net amount reported in the balance sheet when there is legally enforceable right to offset the recognized amounts and there is an intention to settle on a net basis or realize the asset and settle the liability simultaneously.

64
Bobst Group SA Annual report 2014 – Financial statements 2014 – Consolidated financial statements
RISK MANAGEMENT AND CAPITAL STRUCTURE
NOTE 24 (CONTINUED)FINANCIAL INSTRUMENTS
The Group classifies its financial assets and liabilities into the following categories as per IFRS 7:
FINANCIAL ASSETS
2014 2013
In million CHFCarrying amount Fair value
Carrying amount Fair value
At fair value through
profit and loss
Loans and
receivables
Financial assets other – Non-current 3.4 3.4 8.0 8.0 xFinancial assets other – Current 75.0 75.0 7.0 7.0 xTrade receivables 247.0 247.0 233.7 233.7 xFinance lease receivables 6.9 6.9 17.7 18.5 xOther receivables 41.5 41.5 48.9 48.9 xAccrued income 3.5 3.5 3.9 3.9 xDerivative financial instruments 1.0 1.0 5.6 5.6 x Cash and cash equivalents 386.3 386.3 317.2 317.2 xTotal 764.6 764.6 642.0 642.8
FINANCIAL LIABILITIES
2014 2013
In million CHFCarrying amount Fair value
Carrying amount Fair value
At fair value through
profit and loss
Other financial liabilities
Borrowings – Bank and other current 20.9 20.9 12.2 12.2 xBorrowings – Bank and other non-current 9.3 9.3 14.8 14.8 xBorrowings – Debenture bonds 448.8 452.1 399.2 412.9 xTrade and other payables 206.0 206.0 191.0 191.0 xAccrued expenses 64.1 64.1 62.1 62.1 xDerivative financial instruments 10.7 10.7 0.9 0.9 x Total 759.8 763.1 680.2 693.9
The fair value of the financial assets and liabilities are included in the amount at which the instrument could be exchanged in a current transaction between willing parties, other than in a forced or liquidation sale.
The Group uses the following methods and assumptions in estimating the fair value of financial assets and liabilities measured at fair value on a recurring basis:
— the carrying amount of financial assets other, trade receivables, other receivables, cash and cash equivalents, trade and other payables, accrued expenses and accrued income, approximate their fair value;
— the fair value of finance lease receivables and borrowings are estimated by discounting their future cash flows at market rates;
— the fair value of derivative financial instruments is determined using price quotes for similar instruments, appropriately adjusted.

65
Bobst Group SA Annual report 2014 – Financial statements 2014 – Consolidated financial statements
RISK MANAGEMENT AND CAPITAL STRUCTURE
NOTE 24 (CONTINUED)FINANCIAL INSTRUMENTS
Derivative financial instruments and hedging activities
Accounting policiesThe Group uses derivative financial instruments (forward currency contracts) to manage its exposure to foreign exchange rate risk, according to Group’s management policies. The Group does not use derivative financial instruments for speculative purposes.
The derivative financial instruments are initially recognized at fair value on the date on which a derivative contract is entered into and are subsequently re-measured at fair value.
The method of recognizing the resulting gain or loss depends on whether the derivative is designated as a hedging instrument. In practice, if the Group uses hedge accounting, it relates only to hedges that comply with cash flow hedge definition.
Derivatives are carried as financial assets when the fair value is positive and as financial liabilities when the fair value is negative.
The Group documents at the inception of the transaction the relationship between hedging instruments and hedged items, as well as its risk management objectives and strategy for undertaking various hedging transactions. The Group also documents its assessment, both at hedge inception and on an ongoing basis, of whether the derivatives that are used in hedging transactions are highly effective in offsetting changes in fair value or cash flows of hedged items.
The effective portion of changes in the fair value of derivatives that are designated and qualify as cash flow hedges is recognized in other comprehensive income. The gain or loss relating to the ineffective portion is recognized immediately in the statement of profit or loss. Amounts accumulated in equity are reclassified to profit or loss in the periods when the hedged item affects profit or loss.
When a hedging instrument expires or is sold, terminated or exercised or when a hedge no longer meets the criteria for hedge accounting, any cumulative gain or loss existing in equity at that time remains in equity and is recognized when the forecast transaction is ultimately recognized in the statement of profit or loss. When a forecast transaction is no longer expected to occur, the cumulative gain or loss that was reported in equity is immediately transferred to the statement of profit or loss.
2014 2013
In million CHF Assets Liabilities Assets Liabilities
Forward foreign exchange contracts 1.0 10.7 5.6 0.9Total current portion 1.0 10.7 5.6 0.9

66
Bobst Group SA Annual report 2014 – Financial statements 2014 – Consolidated financial statements
RISK MANAGEMENT AND CAPITAL STRUCTURE
NOTE 24 (CONTINUED)FINANCIAL INSTRUMENTS
Currency derivatives (forwards)The Group utilizes currency derivatives to hedge significant future transactions and cash flows. The Group is party to a variety of foreign currency forward contracts in the management of its exchange exposures. The instruments purchased are primarily denominated in the invoicing currencies of the Group. The forwards are in principle designated to address exchange rate exposures for the following twelve months and are renewed on a revolving basis as required.
On the balance sheet date, the total notional amount of outstanding forward foreign exchange contracts to which the Group is committed amounts to CHF 309.9 million (2013: CHF 320.3 million).
The fair value of currency derivatives that are designated and effective as cash flow hedges (hedge accounting) representing a net liability of CHF 5.6 million (2013: a net asset of CHF 3.1 million) is recorded through other comprehensive income. This represents a variation of CHF -8.7 million (2013: CHF 1.8 million) when compared with the previous year.
The Group does not currently designate its foreign currency denominated debt as a hedging instrument for the purpose of hedging the translation of its foreign operations.
Offsetting Financial assets and Financial liabilitiesThe Group is subject to a cash pooling agreement in Italy. As a consequence, a current borrowing amounting to CHF 17.7 million (2013: CHF 26.3 million ) has been offset with cash and cash equivalents.
Fair value hierarchyThe table below summarizes the fair value hierarchy of the financial instruments carried at fair value:
Fair value measurements at the end of reporting period using:
In million CHF 2014 Level 1 Level 2
Derivative financial instruments:Forward foreign exchange contracts 1.0 0.0 1.0Total financial assets carried at fair value 1.0 0.0 1.0
Derivative financial instruments:Forward foreign exchange contracts 10.7 0.0 10.7Total financial liabilities carried at fair value 10.7 0.0 10.7
Fair value measurements at the end of reporting period using:
2013 Level 1 Level 2
Derivative financial instruments:Forward foreign exchange contracts 5.6 0.0 5.6Total financial assets carried at fair value 5.6 0.0 5.6
Derivative financial instruments:Forward foreign exchange contracts 0.9 0.0 0.9Total financial liabilities carried at fair value 0.9 0.0 0.9

67
Bobst Group SA Annual report 2014 – Financial statements 2014 – Consolidated financial statements
RISK MANAGEMENT AND CAPITAL STRUCTURE
NOTE 24 (CONTINUED)FINANCIAL INSTRUMENTS
The Group uses the following hierarchy for determining and disclosing the fair value of financial instruments by valuation technique:Level 1: quoted prices (unadjusted) in active markets for identical assets or liabilities.Level 2: inputs other than quoted prices included within level 1 that are observable
for the asset or liability, either directly (i.e. as prices) or indirectly (i.e. derived from prices).
Level 3: techniques which use inputs which have a significant effect on the recorded fair value that are not based on observable market data.
The Group has no financial instruments with fair value that are determined by reference to significant unobservable inputs, i.e. those that would be classified as level 3 in the fair value hierarchy, nor have there been any transfers of assets or liabilities between levels of the fair value hierarchy.
There are no non-recurring fair value measurements.
NOTE 25FINANCIAL RISK MANAGEMENT
The Bobst Group way of managing financial matters aims for strong decentralization, whether for cash management, short and long-term borrowing, or foreign exchange risks. Decentralization enables a more rapid local reaction, with the result of more cost-efficient transactions. Moreover, it enables the use of natural hedge at the level of the Group companies. There is strict regular reporting on such matters to the Group treasury.
Finally, given the tight management of the balance sheet structures of the individual Group companies, Group treasury is systematically involved to bring in global expertise when negotiating credit lines and other borrowings, with the aim of ensuring conditions in line with the rating of the Group.
Liquidity riskSufficient reserve of cash is maintained to at all times meet the Group’s liquidity requirements. Cash is managed in a decentralized way, but under strict reporting and forecasting to the Group treasury, which enables quick reactions when necessary.
The table below summarizes the maturity profile of the Group’s financial liabilities, based on contractual undiscounted payments.
In million CHF 2014Less than
1 year
Between 1 and
5 years
Over
5 years 2013Less than
1 year
Between 1 and
5 years
Over
5 years
Borrowings 507.5 217.5 137.7 152.3 446.9 169.6 277.2 0.1Trade and other payables 206.0 176.4 29.6 0.0 191.0 162.8 28.2 0.0Accrued expenses 64.1 64.1 0.0 0.0 62.1 62.1 0.0 0.0Derivative financial instruments 10.7 10.7 0.0 0.0 0.9 0.9 0.0 0.0Total 788.3 468.7 167.3 152.3 700.9 395.4 305.4 0.1
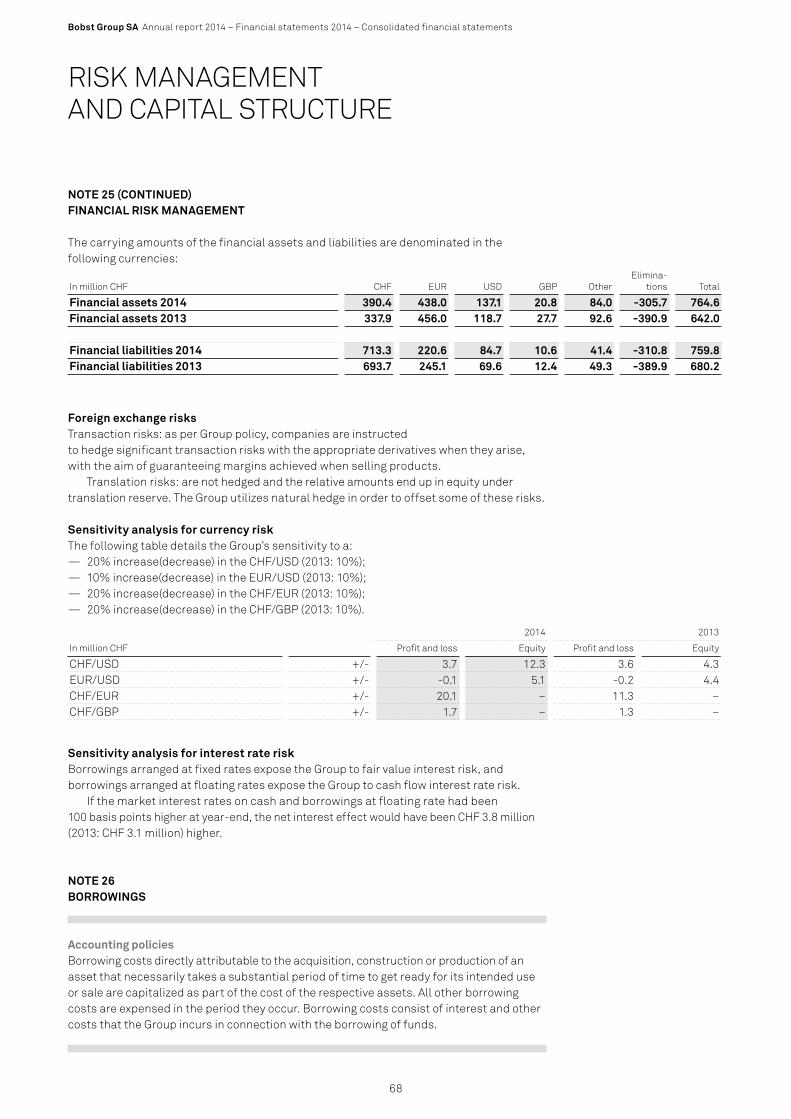
68
Bobst Group SA Annual report 2014 – Financial statements 2014 – Consolidated financial statements
RISK MANAGEMENT AND CAPITAL STRUCTURE
NOTE 25 (CONTINUED)FINANCIAL RISK MANAGEMENT
The carrying amounts of the financial assets and liabilities are denominated in the following currencies:
In million CHF CHF EUR USD GBP OtherElimina-
tions Total
Financial assets 2014 390.4 438.0 137.1 20.8 84.0 -305.7 764.6Financial assets 2013 337.9 456.0 118.7 27.7 92.6 -390.9 642.0 Financial liabilities 2014 713.3 220.6 84.7 10.6 41.4 -310.8 759.8Financial liabilities 2013 693.7 245.1 69.6 12.4 49.3 -389.9 680.2
Foreign exchange risksTransaction risks: as per Group policy, companies are instructed to hedge significant transaction risks with the appropriate derivatives when they arise, with the aim of guaranteeing margins achieved when selling products.
Translation risks: are not hedged and the relative amounts end up in equity under translation reserve. The Group utilizes natural hedge in order to offset some of these risks.
Sensitivity analysis for currency riskThe following table details the Group’s sensitivity to a:
— 20% increase(decrease) in the CHF/USD (2013: 10%); — 10% increase(decrease) in the EUR/USD (2013: 10%); — 20% increase(decrease) in the CHF/EUR (2013: 10%); — 20% increase(decrease) in the CHF/GBP (2013: 10%).
2014 2013
In million CHF Profit and loss Equity Profit and loss Equity
CHF/USD +/- 3.7 12.3 3.6 4.3EUR/USD +/- -0.1 5.1 -0.2 4.4CHF/EUR +/- 20.1 – 11.3 –CHF/GBP +/- 1.7 – 1.3 –
Sensitivity analysis for interest rate riskBorrowings arranged at fixed rates expose the Group to fair value interest risk, and borrowings arranged at floating rates expose the Group to cash flow interest rate risk.
If the market interest rates on cash and borrowings at floating rate had been 100 basis points higher at year-end, the net interest effect would have been CHF 3.8 million (2013: CHF 3.1 million) higher.
NOTE 26BORROWINGS
Accounting policiesBorrowing costs directly attributable to the acquisition, construction or production of an asset that necessarily takes a substantial period of time to get ready for its intended use or sale are capitalized as part of the cost of the respective assets. All other borrowing costs are expensed in the period they occur. Borrowing costs consist of interest and other costs that the Group incurs in connection with the borrowing of funds.
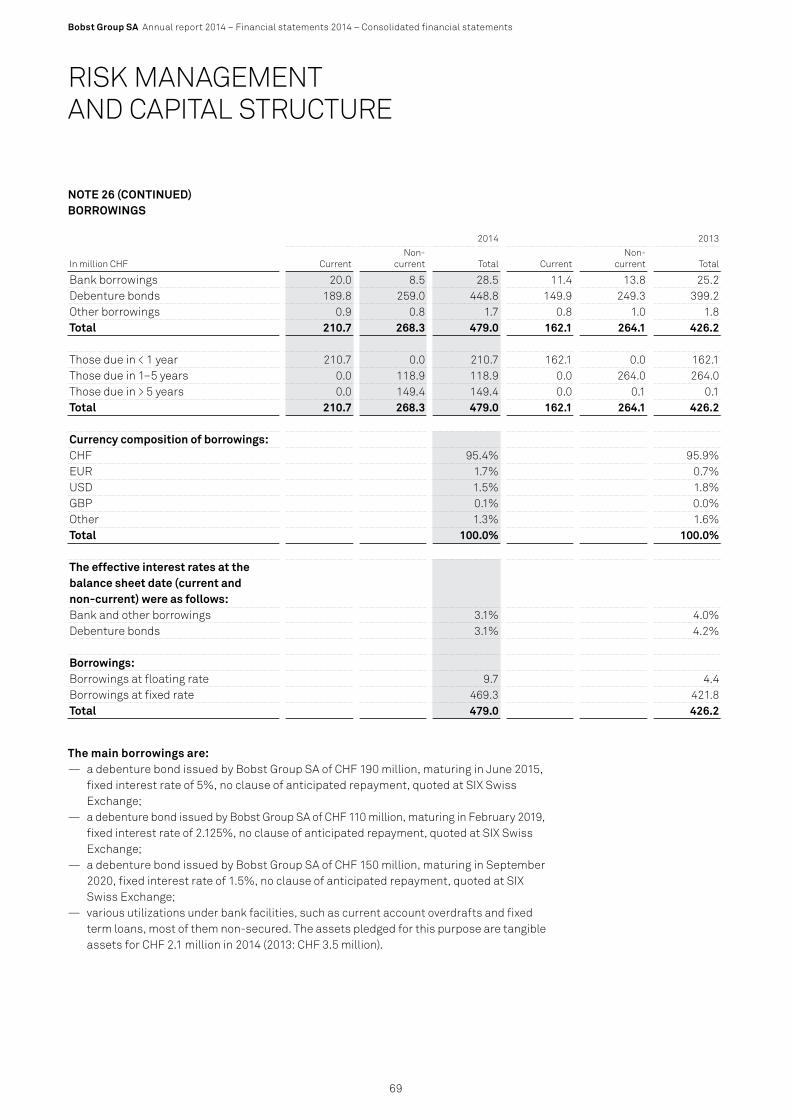
69
Bobst Group SA Annual report 2014 – Financial statements 2014 – Consolidated financial statements
RISK MANAGEMENT AND CAPITAL STRUCTURE
NOTE 26 (CONTINUED)BORROWINGS
2014 2013
In million CHF CurrentNon-
current Total CurrentNon-
current Total
Bank borrowings 20.0 8.5 28.5 11.4 13.8 25.2Debenture bonds 189.8 259.0 448.8 149.9 249.3 399.2Other borrowings 0.9 0.8 1.7 0.8 1.0 1.8Total 210.7 268.3 479.0 162.1 264.1 426.2 Those due in < 1 year 210.7 0.0 210.7 162.1 0.0 162.1Those due in 1–5 years 0.0 118.9 118.9 0.0 264.0 264.0Those due in > 5 years 0.0 149.4 149.4 0.0 0.1 0.1Total 210.7 268.3 479.0 162.1 264.1 426.2 Currency composition of borrowings:CHF 95.4% 95.9%EUR 1.7% 0.7%USD 1.5% 1.8%GBP 0.1% 0.0%Other 1.3% 1.6%Total 100.0% 100.0% The effective interest rates at the balance sheet date (current and non-current) were as follows:Bank and other borrowings 3.1% 4.0%Debenture bonds 3.1% 4.2% Borrowings:Borrowings at floating rate 9.7 4.4Borrowings at fixed rate 469.3 421.8Total 479.0 426.2
The main borrowings are: — a debenture bond issued by Bobst Group SA of CHF 190 million, maturing in June 2015,
fixed interest rate of 5%, no clause of anticipated repayment, quoted at SIX Swiss Exchange;
— a debenture bond issued by Bobst Group SA of CHF 110 million, maturing in February 2019, fixed interest rate of 2.125%, no clause of anticipated repayment, quoted at SIX Swiss Exchange;
— a debenture bond issued by Bobst Group SA of CHF 150 million, maturing in September 2020, fixed interest rate of 1.5%, no clause of anticipated repayment, quoted at SIX Swiss Exchange;
— various utilizations under bank facilities, such as current account overdrafts and fixed term loans, most of them non-secured. The assets pledged for this purpose are tangible assets for CHF 2.1 million in 2014 (2013: CHF 3.5 million).

70
NOTE 27CAPITAL MANAGEMENT
The Group’s objectives when managing capital are to safeguard the Group’s ability to continue as a going concern in order to provide returns for shareholders and benefits for other stakeholders as well as to maintain an optimal capital structure to reduce cost of the capital.
In order to maintain or adjust the capital structure, the Group may adapt the amount of dividend paid to shareholders, return capital to shareholders, issue new shares or sell assets.
The Group monitors capital on the basis of the equity ratio. This ratio is calculated as equity divided by the total assets of the balance sheet. Equity is defined as shown in the consolidated balance sheet. The Group’s policy is to maintain an equity ratio of approximately 35% as per the Group’s mid- to long-term management objectives.
In million CHF 2014 2013
Total equity 454.8 508.1Total balance sheet 1 623.2 1 527.0Equity ratio 28.0% 33.3%
NOTE 28EARNINGS PER SHARE
2014 2013
Net result attributable to shareholders (in million CHF) 50.5 26.2Average number of registered shares 16 518 478 16 518 478Earnings per registered share (in CHF) 3.06 1.58Diluted earnings per registered share (in CHF) 3.06 1.58
The average number of outstanding registered shares is calculated based on the number of shares issued, less the weighted average of own shares. Since there were no conversion rights and no option rights outstanding, earnings per registered share have not been diluted.
NOTE 29DIVIDENDS
On 8 May 2014, a dividend of CHF 0.75 per share was paid to shareholders. At the Annual General Meetings of Shareholders held on 24 April 2013, the shareholders renounced the distribution of any dividend.
A dividend of CHF 1.25 will be proposed by the Board of Directors. This proposal is subject to approval by the shareholders at the Annual General Meeting of Shareholders on 29 April 2015.
RISK MANAGEMENT AND CAPITAL STRUCTURE
Bobst Group SA Annual report 2014 – Financial statements 2014 – Consolidated financial statements

71
This section includes additional financial information that are either required by the accounting standards or management considers these to be relevant information for shareholders.
NOTE 30CHANGES IN THE SCOPE OF CONSOLIDATION
Company Transaction Control % Business unit Country Date
2014Bobst Paris Creation 100% Services FR 28.08.2014Bobst France Participations Creation 100% Services FR 28.08.2014BG Properties Creation 100% Sheet-fed BR 01.09.2014
2013Rapidex SM., Angers Merger* 100% Sheet-fed FR 07.11.2013
* Merger with Bobst Lyon S.A.S., Villeurbanne.
NOTE 31SHARE-BASED PAYMENT COMPENSATION
Accounting policiesThe Group uses share-based awards for the compensation (Variable Pay Plan – VPP) of the Group Executive Committee. The cost of equity-settled compensation is measured by reference to the market value of the shares at the date on which they are granted. This cost is included in the personnel expenses.
A predefined portion of the bonus of key executives is share-settled. All the rights attached to the shares are definitely transferred at the grant date (no vesting conditions), except sale, which is blocked for a period of three years. The number of shares granted depends on the share market price at the grant date. For the performance period that ended 31 December 2014, 14 646 shares have been granted (2013: 6 845). The expense recorded in 2014 in the personnel costs amounts to CHF 0.4 million (2013: CHF 0.2 million).
NOTE 32CONTINGENT LIABILITIES
In million CHF 2014 2013
Guarantee obligations in favor of third parties 1.1 4.4
Contingent liabilities are mentioned for the full nominal amount.
Bobst Group SA Annual report 2014 – Financial statements 2014 – Consolidated financial statements
OTHER FINANCIAL INFORMATION
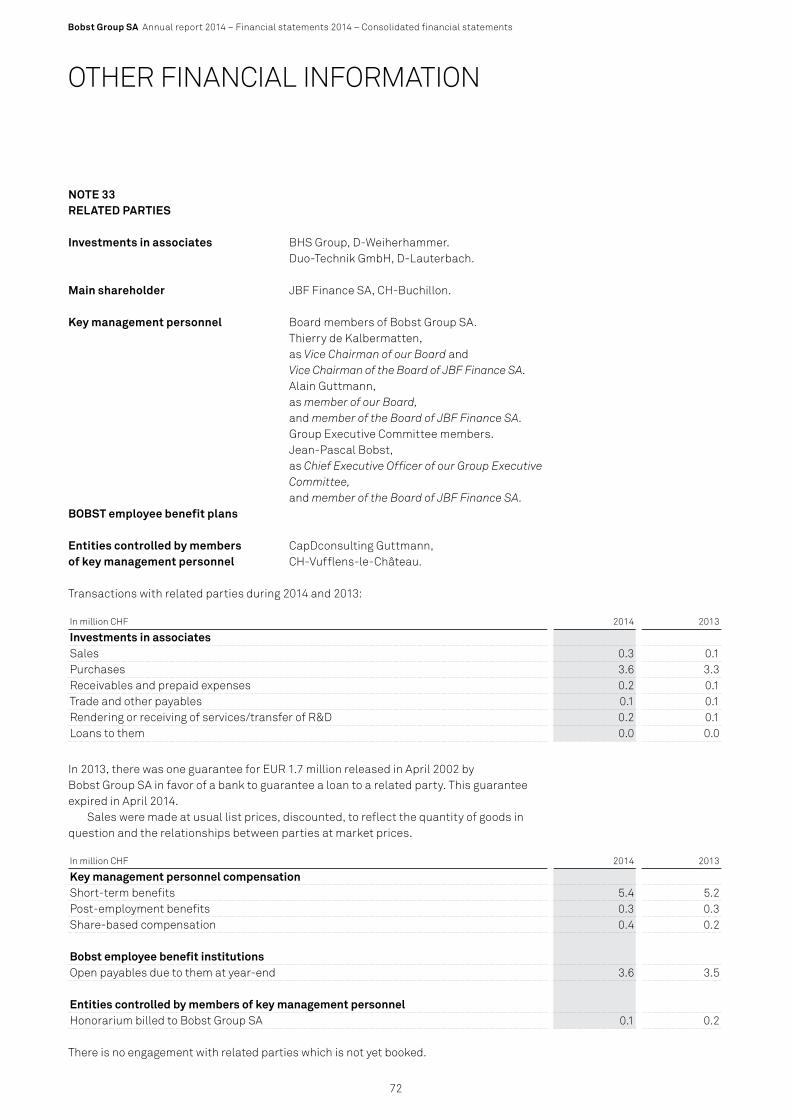
72
Bobst Group SA Annual report 2014 – Financial statements 2014 – Consolidated financial statements
OTHER FINANCIAL INFORMATION
NOTE 33RELATED PARTIES
Investments in associates BHS Group, D-Weiherhammer. Duo-Technik GmbH, D-Lauterbach.
Main shareholder JBF Finance SA, CH-Buchillon.
Key management personnel Board members of Bobst Group SA. Thierry de Kalbermatten, as Vice Chairman of our Board and Vice Chairman of the Board of JBF Finance SA. Alain Guttmann, as member of our Board, and member of the Board of JBF Finance SA. Group Executive Committee members. Jean-Pascal Bobst, as Chief Executive Officer of our Group Executive Committee, and member of the Board of JBF Finance SA.BOBST employee benefit plans
Entities controlled by members CapDconsulting Guttmann, of key management personnel CH-Vufflens-le-Château.
Transactions with related parties during 2014 and 2013:
In million CHF 2014 2013
Investments in associatesSales 0.3 0.1Purchases 3.6 3.3Receivables and prepaid expenses 0.2 0.1Trade and other payables 0.1 0.1Rendering or receiving of services/transfer of R&D 0.2 0.1Loans to them 0.0 0.0
In 2013, there was one guarantee for EUR 1.7 million released in April 2002 by Bobst Group SA in favor of a bank to guarantee a loan to a related party. This guarantee expired in April 2014.
Sales were made at usual list prices, discounted, to reflect the quantity of goods in question and the relationships between parties at market prices.
In million CHF 2014 2013
Key management personnel compensationShort-term benefits 5.4 5.2Post-employment benefits 0.3 0.3Share-based compensation 0.4 0.2
Bobst employee benefit institutionsOpen payables due to them at year-end 3.6 3.5
Entities controlled by members of key management personnelHonorarium billed to Bobst Group SA 0.1 0.2
There is no engagement with related parties which is not yet booked.

73
NOTE 34CAPITAL COMMITMENTS
As at 31 December 2014, the Group has no capital commitments.
NOTE 35SUBSEQUENT EVENTS
The consolidated financial statements were approved for publication by the Boardof Directors on 10 March 2015. They are also subject to approval by the Annual GeneralMeeting of Shareholders.
On 15 January 2015, the Swiss National Bank announced that it was discontinuing the minimum exchange rate of 1.20 Swiss francs per euro. This resulted in a significant strengthening of the Swiss franc against all major currencies in which the Group operates. The Group has assessed the impact, particularly on counterparty risk, currency exposures and intangible assets, including goodwill. The event described has no impact on the accounting policies applied, including on the valuation principles followed or on management estimates, in the preparation of the consolidated financial statements for the year ended 31 December 2014.
There were no other events between 31 December 2014 and 10 March 2015 that would necessitate additional adjustments to the book values of the Group’s assets or liabilities, or which require disclosure.
OTHER FINANCIAL INFORMATION
Bobst Group SA Annual report 2014 – Financial statements 2014 – Consolidated financial statements

74
Bobst Group SA Annual report 2014 – Financial statements 2014 – Consolidated financial statements
OTHER FINANCIAL INFORMATION
NOTE 36 LIST OF GROUP COMPANIES
Holding company
Switzerland Bobst Group SA, Mex CHF 17 810 002 n
Affiliated companies
Germany Bobst Beteiligungsgesellschaft mbH, Meerbusch EUR 9 407 771 100.0 C n
Bobst Meerbusch GmbH, Meerbusch EUR 2 000 000 100.0 C n
Bobst Stuttgart GmbH, Neuhausen a. d. Fildern EUR 5 601 000 100.0 C n n
Bobst Bielefeld GmbH, Bielefeld EUR 1 534 000 100.0 C n n
Belgium Bobst Benelux NV, Berchem EUR 124 000 100.0 C n
Denmark Bobst Scandinavia ApS, Rodovre DKK 125 000 100.0 C n
Spain Bobst Ibérica, S.L., Barcelona EUR 700 000 100.0 C n
France Bobst Paris, Antony (branch) – – – – n
Bobst Paris EUR 611 289 100.0 C n
Bobst France Participations EUR 612 289 100.0 C n
Bobst Lyon S.A.S., Villeurbanne EUR 11 360 000 100.0 C n n
United Kingdom Bobst UK Holdings Ltd, Redditch GBP 24 478 115 100.0 C n
Bobst UK & Ireland Ltd, Redditch GBP 2 100.0 C n
Bobst Manchester Ltd, Heywood GBP 4 000 100 100.0 C n n
Italy Bobst Italia SpA, Piacenza EUR 6 486 000 100.0 C n n
Poland Bobst Polska Sp. z o.o., Lodz PLN 50 000 100.0 C n
Russia Bobst CIS LLC, Moscow RUB 200 000 100.0 C n
Switzerland Bobst Grenchen AG, Grenchen CHF 1 000 000 100.0 C n n
Bobst Mex SA, Mex CHF 30 409 730 100.0 C n n
BM Participations SA, Mex CHF 100 000 100.0 C n
Czech Republic Bobst Central Europe s.r.o., Brno CZK 100 000 100.0 C n
Tunisia Bobst Africa & Middle East Ltd, Tunis TND 10 000 100.0 C n
Brazil Bobst Latinoamérica do Sul Ltda, Itatiba BRL 34 696 041 100.0 C n n
BG Properties BRL 1 000 100.0 C n
United States Bobst North America Inc., Roseland USD 575 960 100.0 C n
Mexico Bobst Latinoamérica Norte SA de CV, Mexico MXN 200 000 100.0 C n
China Bobst (Shanghai) Ltd, Shanghai CNY 52 216 742 100.0 C n n
Gordon Ltd, Hong Kong HKD 10 000 65.0 C n n
Bobst Hong Kong Ltd, Hong Kong USD 2 100.0 C n
India Bobst India Private Ltd, Pune INR 235 311 400 100.0 C n n
Indonesia PT Bobst Group Indonesia, Jakarta IDR 885 000 000 100.0 C n
Japan Bobst Japan Ltd, Tokyo JPY 200 000 000 100.0 C n
Malaysia Bobst Malaysia Sdn. Bhd., Petaling Jaya MYR 500 000 100.0 C n
Singapore Bobst Group Singapore Pte Ltd, Singapore SGD 100 000 100.0 C n
Thailand Bobst (Thailand) Ltd, Bangkok THB 25 000 100.0 C n
Associated companies
Germany Duo-Technik GmbH, Lauterbach EUR 72 000 40.0 E n
Germany BHS Corr. Maschinen- und Anl. GmbH, Weiherhammer EUR 6 000 000 30.0 E n n n
C = Full consolidation method E = Equity method
Sal
es a
nd s
ervi
ces
Con
solid
atio
n
Con
trol
%
Sha
re c
apit
al
in lo
cal c
urre
ncy
Oth
er
Pro
duct
ion
Cur
renc
y

75
Bobst Group SA Annual report 2014 – Financial statements 2014 – Consolidated financial statements

76
Bobst Group SA Annual report 2014 – Financial statements 2014 – Consolidated financial statements

77
Bobst Group SA Annual report 2014 – Financial statements 2014 – Consolidated financial statements

78
Bobst Group SA Annual report 2014 – Financial statements 2014 – Statutory accounts
STATUTORYACCOUNTS

79
Bobst Group SA Annual report 2014 – Financial statements 2014 – Statutory accounts
BALANCE SHEET AS AT 31 DECEMBER OF BOBST GROUP SA
In million CHF 2014 2013
Assets Participations and loans to affiliated companies 503.1 563.6Financial fixed assets 503.1 563.6
Miscellaneous receivables from affiliated companies 0.0 0.2Miscellaneous receivables 0.1 0.5
Other financial assets 0.0 7.0Cash and cash equivalents (including own shares) 165.8 51.9Prepaid expenses 1.2 0.8Current assets 167.1 60.4
Total assets 670.2 624.0
Liabilities Share capital 16.5 17.8 Reserves: – general 7.2 7.2 – own shares 0.0 1.4 Available earnings – balance carried forward 137.1 142.0 – profit for the year 10.0 6.2 Equity 170.8 174.6 Debenture bonds 260.0 250.0 Provisions 1.7 1.7 Non-current liabilities 261.7 251.7 Debenture bonds 190.0 150.0 Debts to affiliated companies 0.0 2.0 Short-term debts 47.7 45.7 Current liabilities 237.7 197.7 Total liabilities and equity 670.2 624.0
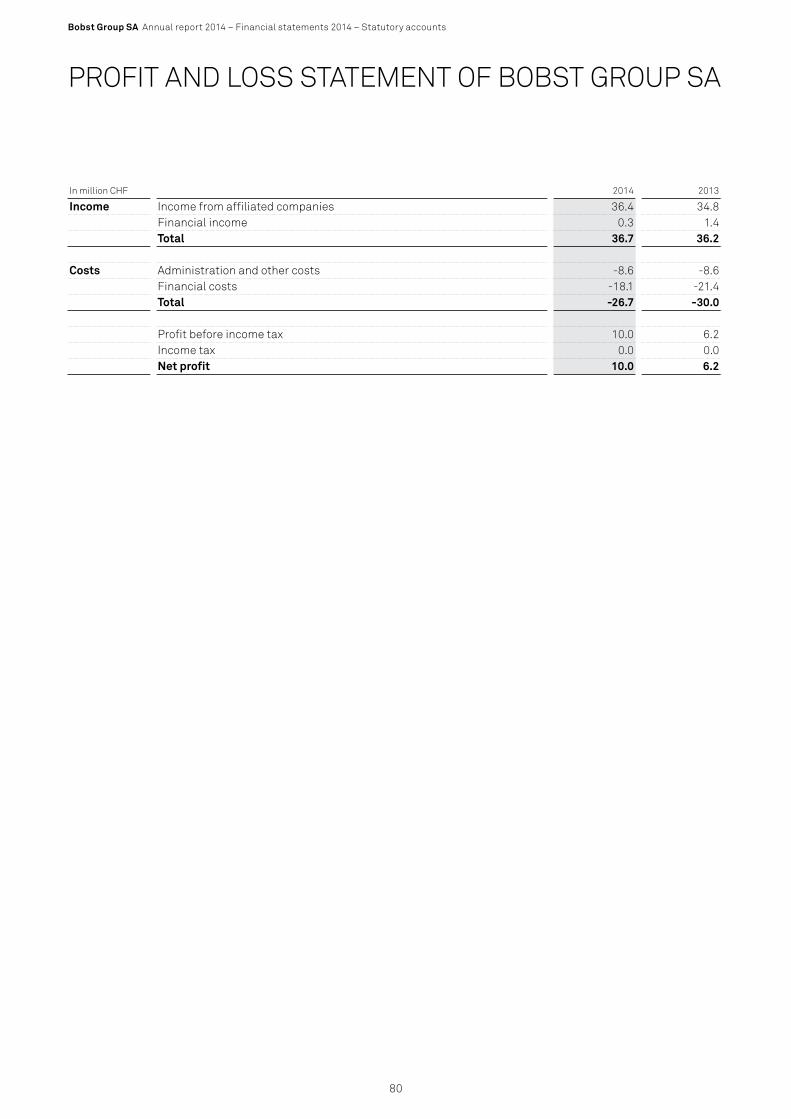
80
Bobst Group SA Annual report 2014 – Financial statements 2014 – Statutory accounts
PROFIT AND LOSS STATEMENT OF BOBST GROUP SA
In million CHF 2014 2013
Income Income from affiliated companies 36.4 34.8 Financial income 0.3 1.4 Total 36.7 36.2 Costs Administration and other costs -8.6 -8.6 Financial costs -18.1 -21.4 Total -26.7 -30.0 Profit before income tax 10.0 6.2 Income tax 0.0 0.0 Net profit 10.0 6.2

81
Bobst Group SA Annual report 2014 – Financial statements 2014 – Statutory accounts
NOTES TO THE FINANCIAL STATEMENTS AND PROPOSAL FOR THE APPROPRIATION OF AVAILABLE EARNINGS (BOBST GROUP SA)
ACCOUNTING PRINCIPLES
GeneralBobst Group SA is the holding company of the Bobst Group. The annual accounts are prepared in accordance with Swiss law and with generally accepted principles.
Conversion of foreign currenciesTransactions in foreign currencies are converted to Swiss francs (CHF) at the prevailing rate on the date of the transaction. The necessary provisions for exchange rate variances are made when preparing the Balance Sheet.
Participations and receivables related to investmentsParticipations and loans are carried at their gross acquisition values, reduced by necessary provisions. The evaluation of the participations covers essentially the profitability, in accordance with the principle of prudence.
EXPLANATORY NOTES FOR VARIOUS ELEMENTS
A. BALANCE SHEET
Participations and loans to affiliated companiesThe complete list of affiliated companies of the Bobst Group is found at the end of the consolidated financial statements. This list also provides information concerning the activities of each entity (Note 36).
In million CHF 2014 2013
Subdivision:Participations 340.9 341.0Loans to affiliated companies 162.2 222.6Total 503.1 563.6
Cash and cash equivalentsIn 2013, the cash and cash equivalents included CHF 1.4 million in own shares.
Debenture bondsAmount: CHF 190.0 millionLength: Six years, fixedMaturity: 22 June 2015 Rate: 5%Quotation: SIX Swiss Exchange
Amount: CHF 110.0 millionLength: Five years, fixedMaturity: 20 February 2019Rate: 2.125%Quotation: SIX Swiss Exchange

82
Bobst Group SA Annual report 2014 – Financial statements 2014 – Statutory accounts
NOTES TO THE FINANCIAL STATEMENTS AND PROPOSAL FOR THE APPROPRIATION OF AVAILABLE EARNINGS (BOBST GROUP SA)
Debenture bonds (continued)Amount: CHF 150.0 millionLength: Six years, fixedMaturity: 30 September 2020Rate: 1.5%Quotation: SIX Swiss Exchange
Contingent liabilities2014: CHF 168.4 million2013: CHF 170.8 million
B. PROFIT AND LOSS STATEMENTAll income and expenses exclusively concern the activities of the holding company and require no special comments.
C. BOARD AND EXECUTIVE COMPENSATION DISCLOSURESThe disclosures required by Swiss Law on Board and Executive compensation are shown in the remuneration report.
D. RISK ASSESSMENT DISCLOSURESAs part of the Group risks and opportunities management system, a systematic procedure for identifying and assessing risks and opportunities, as well as for implementing appropriate risk control mechanisms, is in place.
During the risk assessment, Group units evaluate the financial impact of the most significant risks on their results.
The outcome of the assessment and the approved measures are summarized in a report which is made available to the Group Executive Committee member responsible for the unit.
In addition, a risk evaluation and prioritization is prepared by the Group Executive Committee. The result is discussed with the Audit Committee of the Board of Directors.Financial risk management is described in more detail in Note 25 to the Group’s consolidated financial statements.
Proposal for the appropriation of available earnings
In million CHF 2014 2013
Carried forward 134.8 142.0Reduction of capital, net of transfer of own shares reserve 1.3 0.0Dividends unpaid on own shares 1.0 0.0Profit for the year 10.0 6.2Total 147.1 148.2
The proposal is as follows:Dividend of CHF 1.25/CHF 0.75 per share 20.6 13.4Balance to retained earnings 126.5 134.8Total 147.1 148.2

Bobst Group SA Annual report 2014 – Financial statements 2014 – Statutory accounts
83
NOTES TO THE FINANCIAL STATEMENTS AND PROPOSAL FOR THE APPROPRIATION OF AVAILABLE EARNINGS (BOBST GROUP SA)
E. SHARE CAPITAL2014 2013 2012
Number of registered shares
par value CHF 1.–
Number of registered shares
par value CHF 1.–
Number of registered shares
par value CHF 1.–
Issued sharesBalance at 1 January 17 810 002 17 810 002 17 810 002 Reduction -1 291 524Balance at 31 December 16 518 478 17 810 002 17 810 002
Significant shareholders
Shareholders as per latest publications according to Article 20 of the Federal Act on Stock Exchanges and Securities Trading (SESTA)— JBF Finance SA:
11 January 2014: 50.01%. Publication by JBF Finance SA that the shareholders of JBF Finance SA, subject to a shareholders’ agreement, hold 8 906 104 registered shares of Bobst Group SA (50.01%) of which 8 758 590 are registered in the name of JBF Finance SA.
— Silchester International Investors LLP*: 9 November 2010: 11.53%.
— Bobst Group SA: 24 June 2014: 0.00%. Cancellation of all treasury shares/share capital reduction.
— Sarasin Investmentfonds AG: 15 November 2011: 3.39%.
Shareholders as per Share Register as at 31 December 2014
2014 2013 2012Number of
registered shares par value
CHF 1.–
Number of registered shares
par value CHF 1.–
Number of registered shares
par value CHF 1.–
JBF Finance SA 8 859 040 53.63% 8 753 656 49.16% 8 747 210 49.12%Nortrust Nominees Ltd* 1 980 935 11.99% 1 996 627 11.21% 1 990 860 11.18%Public Shareholders 5 678 503 34.38% 5 768 195 32.39% 5 780 408 32.45%Total shares outstanding 16 518 478 16 518 478 16 518 478 Treasury shares 0 0.00% 1 291 524 7.25% 1 291 524 7.25%Total shares issued 16 518 478 100.00% 17 810 002 100.00% 17 810 002 100.00%
* Nortrust Nominees Ltd is registered as nominee of a number of shareholders, among them Silchester International Investors LLP.
2014 2013 2012Number of
registered shares par value
CHF 1.–
Number of registered shares
par value CHF 1.–
Number of registered shares
par value CHF 1.–
Treasury shares in mil-lion CHFBook value 0.0 1.4 1.4 Market value 0.0 39.1 33.7

84
Bobst Group SA Annual report 2014 – Financial statements 2014 – Statutory accounts
SHARE OWNERSHIPThe total number of Bobst Group SA shares owned as at 31 December 2014 by non-executive members of the Board, by Group Executive Committee members, and by persons closely linked to them was as per the table below:
Non-executiveMembers of the Board
Number of sharesowned
Group ExecutiveCommittee Members
Number of sharesowned
Thierry de Kalbermatten 90 Jean-Pascal Bobst 15 385Michael W.O. Garrett 2 000 Attilio Tissi 3 707Ulf Berg 18 000 Philippe Milliet 1 719Jürgen Brandt 2 000 Erik Bothorel 2 364
Stephan März 2 085Total 2014 22 090 Total 2014 25 260
The total number of Bobst Group SA shares owned as at 31 December 2013 by non-executive members of the Board, by Group Executive Committee members, and by persons closely linked to them was as per the table below:
Non-executiveMembers of the Board
Number of sharesowned
Group ExecutiveCommittee Members
Number of sharesowned
Thierry de Kalbermatten 90 Jean-Pascal Bobst 11 776Michael W.O. Garrett 2 000 Attilio Tissi 2 961Ulf Berg 18 000 Philippe Milliet 758 Jürgen Brandt 2 000 Erik Bothorel 2 105
Stephan März 1 330Total 2013 22 090 Total 2013 18 930
Persons closely linked to the non-executive members of the Board and to the Group Executive Committee members are their spouses, their children under the age of eighteen, any legal entities that they own or otherwise control, or any legal or natural person who is acting as their fiduciary.
NOTES TO THE FINANCIAL STATEMENTS AND PROPOSAL FOR THE APPROPRIATION OF AVAILABLE EARNINGS (BOBST GROUP SA)

Bobst Group SA Annual report 2014 – Financial statements 2014 – Statutory accounts
85

86
Bobst Group SA Annual report 2014 – Financial statements 2014 – Statutory accounts

87
Bobst Group SA Annual report 2014 – Financial statements 2014 – Statutory accounts

REMUNERATION REPORT 2014Bobst Group SA
88

89

90
Bobst Group SA Remuneration report 2014 – Part A
PART ACONTENT AND METHOD OF DETERMINING COMPENSATION, SHAREHOLDING PROGRAMS AND THE GRANT OF LOANS
GENERAL PRINCIPLESThe remuneration policy at BOBST, for all employees, and in particular for the Group Executive Committee members, focuses on achieving a high level of performance to ensure sustained growth of the Company and value creation. The compensation of the Group Executive Committee and of the members of the Board of Directors is reviewed on an annual basis by the Remuneration and Nomination Committee, which proposes appropriate measures to the Board of Directors.
All amounts stated are gross and include all fixed and variable remuneration allocated to the members of the Board and to the Executive Committee for the year under review.
Board of DirectorsThe members of the Board of Directors receive a fixed remuneration and a representation allowance in cash. The remuneration of the members of the Board of Directors reflects their expected level of commitment and accountability.
Group Executive CommitteeThe remuneration of the members of the Group Executive Committee is designed to reward performance, and to be competitive and attractive in line with their responsibilities.
The remuneration of the members of the Group Executive Committee is composed of the following components: — a fixed annual base salary in cash;— a variable component, linked to performance, paid part in cash and part in shares
blocked for three years.
RESPONSIBILITY AND PROCEDURE FOR THE DETERMINATION OF REMUNERATION
Board of DirectorsThe Remuneration and Nomination Committee submits to the Board for approval a remuneration system for the Board which respects the principles defined in its charter (http://investors.bobst.com/documents).
Group Executive CommitteeThe Remuneration and Nomination Committee submits the remuneration system for the Group Executive Committee and the total remuneration of the Chief Executive Officer to the Board for approval, pursuant to the principles defined in its charter (http://investors.bobst.com/ documents).
The Remuneration and Nomination Committee approves, upon proposal of the Chief Executive Officer, the total compensation of each ordinary member of the Group Executive Committee and submits to the Board of Directors for approval the total amount of compensation of all the members of the Group Executive Committee.
COMPENSATION SYSTEM
Board of DirectorsThe amount of the compensation of the members of the Board is set at its discretion, pursuant a proposal by the Remuneration and Nomination Committee.

91
Bobst Group SA Remuneration report 2014 – Part A
The members of the Board of Directors receive a fixed remuneration and a representation allowance in cash as detailed in the table below:
Members of the Board do not receive a variable compensation. They are not affiliated to any company pension plan.
The members of the Board are all non executive and none of them has operational management tasks within Bobst Group SA, nor any subsidiary. None of the members of the Board has been a member of the management of Bobst Group SA, or of any subsidiary in the last three years.
Group Executive CommitteeThe compensation of the Group Executive Committee members is governed by a total reward policy. The compensation system is reviewed by the Remuneration and Nomination Committee on an annual basis and approved by the Board of Directors based on a proposal by the Remuneration Compensation and Nomination Committee.
The compensation of the members of the Group Executive Committee is composed of the following components:
Annual compensation system for the members of the Group Executive Committee
Base remuneration Variable remuneration (VPP)
Variable Pay Plan (Cash) Variable Pay Plan (Shares)
— Base salary— Pension plan contributions — Representation allowances — Others
— Incentive in cash 1) — Incentive in shares blocked for 3 years 2)
1) The part of the VPP paid in cash represents 90% of the whole variable remuneration for the GEC members and 70% for the CEO.
2) The part of the VPP paid in shares blocked for 3 years represents 10% of the whole variable remuneration for the GEC members and 30% for the CEO.
Base salaryThe level of the base salary is set at the discretion of the Board of Directors, pursuant to a proposal by the Remuneration and Nomination Committee. The remuneration of the members of the Group Executive Committee is designed to be competitive and attractive in line with their responsibilities.
In addition, a yearly representation allowance of CHF 28 500.– is granted to each member of the Group Executive Committee including the CEO.
Annual compensation of the members of the Board of Directors Fixed remuneration in cash in CHF 1)
Chairman of the Board 2) 325 000Vice Chairman of the Board 3) 230 000Member of the Board 140 000Audit Committee – Chairman 20 000Audit Committee – members 20 000Compensation and Nomination Committee – Chairman 0Compensation and Nomination Committee – members 0Representation allowance for the Chairman of the Board of Directors 17 000Representation allowance for the other members of the Board of Directors 12 0001) Gross amount without social security contribution.2) The Chairman of the Board of Directors does not receive additional remuneration for Committee activities.3) The Vice Chairman of the Board of Directors does not receive additional remuneration for Committee activities.
92
Bobst Group SA Remuneration report 2014 – Part A
Variable remuneration (VPP)The annual target VPP corresponds to a percentage of the base annual salary – around 120% for the CEO and in the range of 66% for the other members of the Group Executive Committee. The actual VPP paid depends on the achievement of the agreed targets which are set in January of each year.
For the CEO and the CFO, 60% of these targets are of a financial nature (such as Group operating profit and return on capital employed [ROCE]) and 40% are personal targets, which can be both qualitative and quantitative.
For the other members of the Group Executive Committee, 75% of these objectives are of a financial nature (such as Group and Business Unit operating profits, Group and Business Unit return on capital employed [ROCE]) and 25% are individual objectives, which can be both qualitative and quantitative.
For each of the defined objectives, a target value as well as a “kick-in” and “ceiling” levels are set. No payout is granted if the “kick-in” level is not reached. The maximum payout is 1.5 times the target value when the “ceiling” level is attained or surpassed.
Exceptions to this policy may be adopted at the discretion of the Board.
Shareholding Program The amount of the variable remuneration paid in the form of shares in Bobst Group SA is valued at fair market value close to the date when the Board approves the annual accounts. The shares are blocked at allocation for a period of three years.
Pension plan contributionsThe members of the Group Executive Committee are enrolled into the social security system and the local pension plan of an affiliate.
They are also affiliated to an additional dedicated pension scheme providing risk cover and a pension contribution. The annual pension amount covered is CHF 220 000.– for the CEO and CHF 100 000.– for other Group Executive Committee members.
EMPLOYMENT CONTRACTSThe members of the Group Executive Committee all have employment contracts with a notice period of twelve months.
LOANSNo loan or credits are granted to the members of the Board of Directors or of the Group Executive Committee.
ADDITIONAL INFORMATIONThe Group provides each member of the Group Executive Committee with a company car.No additional fee or remuneration (consulting, acquisition, divestment or others) is granted to the GEC members for activities within the Group.
The members of the Board of Directors and of the Group Executive Committee do not receive any component of compensation other than those listed above.
The members of the Board of Directors and of the Group Executive Committee do not contractually have severance pay.

93
Bobst Group SA Remuneration report 2014 – Part B
PART BBOARD AND EXECUTIVE COMMITTEE COMPENSATION
PRELIMINARY REMARKThe elements of the compensation presented in this chapter have been determined by applying the principles described in Part A of this document.
All amounts stated are gross and include all fixed and variable remuneration allocated to the members of the Board and to the Executive Committee for the year under review.
Board of DirectorsIn 2014, the members of the Board of Directors received a fixed remuneration and a representation allowance in cash as detailed in the table below:
Members of the Board Revenue in CHFRepresentation
allowance in CHF Cash in CHF
Alain Guttmann, Chairman 325 000 17 000 342 000Thierry de Kalbermatten, Vice Chairman 230 000 12 000 242 000Ulf Berg 160 000 12 000 172 000Michael W.O. Garrett 140 000 12 000 152 000Jürgen Brandt 160 000 12 000 172 000Total remuneration 2014 1 015 000 65 000 1 080 000
In 2013, the members of the Board of Directors received a fixed remuneration and a representation allowance in cash as detailed in the table below:
Members of the Board Revenue in CHFRepresentation
allowance in CHF Cash in CHF
Charles Gebhard, Chairman (until 30.03.2013) 165 000 6 000 171 000Alain Guttmann, Chairman (since 01.04.2013) 287 500 12 000 299 500Thierry de Kalbermatten, Vice Chairman 230 000 12 000 242 000Ulf Berg 155 000 12 000 167 000Michael W.O. Garrett 140 000 12 000 152 000Hans Rudolf Widmer (until 30.03.2014) 80 000 6 000 86 000Jürgen Brandt (since 01.04.2013) 120 000 9 000 129 000Total remuneration 2013 1 177 500 69 000 1 246 500
None of the Board members are affiliated to the Group’s pension funds.
In addition, the Group had to pay contributions for Federal Old Age, Survivor and Disability Insurance (AVS) and Unemployment Insurance and family LPC amounting to CHF 59 405.20 (2013: CHF 65 672.–).

94
Bobst Group SA Remuneration report 2014 – Part B
Group Executive CommitteeIn 2014, the members of the Group Executive Committee received the compensation detailed in the table below:
In 2013, the members of the Group Executive Committee received the compensation detailed in the table below:
In addition, the Group had to pay contributions for Federal Old Age, Survivor and Disability Insurance (AVS), Unemployment Insurance and family LPC amounting to CHF 247 665.– (2013: CHF 217 097.–).
COMPENSATION FOR FORMER MEMBERS OF GOVERNING BODIESDuring the year under review, there was no other compensation conferred to former members of governing bodies in relation with their former activity as governing bodies or not conforming to market practice, either by Bobst Group SA or its subsidiaries.
ADDITIONAL FEES AND REMUNERATIONS Fees of CHF 75 520.60, have been paid by Bobst Group SA to CapDconsulting Guttmann, Vufflens-le-Château, owned by Mr. Alain Guttmann, Chairman of the Board of Directors of Bobst Group SA, for various consulting activities.
Base remu- neration Variable Pay Plan (VPP)
Pension plans
Payment in kind Total 2014
Cash CHF Cash CHF Shares* number
Shares in CHF CHF CHF CHF
Total remuneration:
Group Executive Committee 2 213 500 1 814 579 14 646 363 742 315 839 21 870 4 729 526Highest compensation: Jean-Pascal Bobst, CEO 684 500 739 200 10 634 264 102 87 482 4 320 1 779 601
Base remu- neration Variable Pay Plan (VPP)
Pension plans
Payment in kind Total 2013
Cash CHF Cash CHF Shares* number
Shares in CHF CHF CHF CHF
Total remuneration:
Group Executive Committee 2 058 650 1 600 266 6 845 194 025 314 524 25 406 4 192 868Highest compensation: Jean-Pascal Bobst, CEO 678 500 660 455 3 609 102 299 87 031 4 320 1 532 603
* The value of a bonus in shares, the sale of which is blocked for a period of three years, is equal to 83.96% of their market value at the date of attribution. The share price at the date of attribution was CHF 29.58 (2013: CHF 33.76).

95
Bobst Group SA Remuneration report 2014 – Part B

96
Certain statements in the annual report, including but not limited to those regarding expectations for general economic development and the market situation, expectations for customer industry profitability and investment willingness, expectations for Company growth, development and profitability and the realization of synergy benefits and cost savings, and statements preceded by “expects”, “estimates”, “forecasts” or similar expressions, are forward-looking statements. These statements are based on current decisions and plans as well as on currently known factors. They involve known and unknown risks and uncertainties which may cause the actual results to materially differ from the results currently expected by the Company.
Potential risks and uncertainties include such factors as general economic conditions, foreign exchange rate and interest rate fluctuations, competitive product and pricing pressures, the Company’s operating conditions, and regulatory developments.

Bobst Group SAP.O. BoxCH-1001 LausanneSwitzerlandTel. +41 21 621 21 11Fax +41 21 621 20 70www.bobst.com
Investor RelationsTel. +41 21 621 25 60Fax +41 21 621 20 69E-mail: [email protected]
Security symbolsSIX SWISS EXCHANGE: BOBNN or 1268465ISIN: CH0012684657SIX Telekurs: BOBNN,4 or 1268465,4Bloomberg: BOBNN SW press equity press enterReuters: BOBNN.S
Disclosure of shareholdingsBobst Group SAShare RegisterP.O. BoxCH-1001 LausanneSwitzerlandFax +41 21 621 20 37
Website linkshttp://investors.bobst.com/documents – to reach the Articles of Association of Bobst Group SA, the Organization Regulations of Bobst Group SA, the Worldwide code of employee and business conduct, the Charter of Group policy with regard to health, safety at work and environmental protection.http://investors.bobst.com/publications – to reach the Annual reports, Annual profiles and Sustainable development reports of Bobst Group SA.


