ANNUAL REPORT 2014 - Aldar Properties Uploads/IR_Annual_Report_2014-EN.pdf · 02 Aldar Annual...
72
ANNUAL REPORT 2014
Transcript of ANNUAL REPORT 2014 - Aldar Properties Uploads/IR_Annual_Report_2014-EN.pdf · 02 Aldar Annual...

ANNUAL REPORT 2014

OVERVIEWCHAIRMAN’S MESSAGE 02CEO’S MESSAGE 04CFO’S MESSAGE 06
FINANCIAL STATEMENTSBOARD OF DIRECTOR’S REPORT 11 FINANCIAL REVIEW 12 INDEPENDENT AUDITOR’S REPORT 16CONSOLIDATED STATEMENT OF FINANCIAL POSITION 18CONSOLIDATED INCOME STATEMENT 20CONSOLIDATED STATEMENT OF COMPREHENSIVE INCOME 21CONSOLIDATED STATEMENT OF CHANGES IN EQUITY 22CONSOLIDATED STATEMENT OF CASH FLOWS 23NOTES TO THE CONSOLIDATED FINANCIAL STATEMENTS 25
CONTENTS

Aldar Annual Report 2014 01

02 Aldar Annual Report 2014
OVERVIEW OF BUSINESS
ABUBAKER SEDDIQ AL KHOORIChairman
This has been one of the most exciting years for Aldar and the real estate sector, as Abu Dhabi’s stable path of economic development creates significant real demand for property.
Delivering on our strategy2014 has been a very positive year for Aldar and Abu Dhabi. The process of economic diversification in Abu Dhabi has continued at a good pace. Increase in non-oil activities, substantial investments in infrastructure by the Government, expansion of the industrial capability, development of a vibrant education and healthcare sector and the creation of a dynamic financial hub, is enlarging our population by approximately 6% each year and is driving an increased demand for high-quality property. Our economy is forecast to grow at around 3½% annually.
CHAIRMAN’S MESSAGE

Aldar Annual Report 2014 03
Aldar is not only a beneficiary of this growth but a vital and active contributor to Abu Dhabi’s economic development and a valued partner of the Government of Abu Dhabi. We have been the voice of the private sector and have worked with the government to nurture a positive and open business environment which has contributed to the sharing of experiences across the business community and an increase in demand for our property from local and international investors.
As the leading real estate developer in Abu Dhabi, Aldar has taken a prominent and responsible role in helping raise the standard of property that is brought to the market and we now have a good track record of creating a healthy environment for investors and end-users. Regulation has played an important role and as a result, the property industry is now much more focussed on delivering the right product at the right time, to meet real customer driven demand. Availability of information has also helped the public to make the right purchasing decisions.
Our three project launches this year were well thought out and we were rewarded with strong sales at each of our launch events. In November this year we successfully launched Yas Mall and realised our vision to create an unrivalled retail and leisure destination that has transformed the landscape of Abu Dhabi for our people and for the region.
With this focus on delivery of key developments and prudent financial management, Aldar is now in an excellent position to move further into this new phase of growth.We are operating in a favourable environment and a maturing and increasingly stable real estate market.
Our financial position is strong and we have achieved our aims for 2014. Recurring revenues from our income-generating assets continued to grow, our net profit remained healthy and our debt reduction strategy is on track to meet our targets.
Our strong balance sheet generated increased confidence in Aldar from the international financial community, and this was illustrated by further upgrades to our credit rating to investment grade.
As I consider how the business is working now and how well we are configured for the future, I am happy that we have brought all the pieces of the Aldar mosaic together at the right speed and in the right order to create a clear picture of the company’s growth in the future.
The final piece of this mosaic was added in 2014 when we appointed Mohamed Khalifa Al Mubarak as Chief Executive Officer. Finding the right person to lead Aldar was clearly an important decision for us and we ensured we took the time and employed an effective process to make the right choice.
With his extensive experience of the Abu Dhabi corporate landscape and of Aldar, Mohamed continues to lead a very strong team to drive the company forward. He has helped create one team and one identity with a winning culture that will sustain us for the future.
This has been one of the most exciting years for Aldar and the real estate sector, as Abu Dhabi’s stable path of economic development creates significant real demand for property. We remain confident with the fundamentals in our home market with a clear government development plan, prudent fiscal management and increased contributions from the wider economy. Aldar will remain focused on our strategy of strengthening our balance sheet and deleveraging our business, growing recurring income and quality of earrings, monetising our land bank, and delivering shareholder value.
As I reflect on the achievements of this last year and look forward to 2015, I wish to thank the Abu Dhabi Government, our investors and customers for their continued contribution to Aldar’s progress. I would also like to thank our team who have worked with passion and determination to achieve so many great successes this year. Collectively, we have created a solid, sustainable business that will continue to prosper.

04 Aldar Annual Report 2014
OVERVIEW OF BUSINESS
MOHAMED KHALIFA AL MUBARAKChief Executive Officer
A year of accomplishment 2014 has been a pivotal year for Aldar in which we executed our strategy to monetise our land bank and deliver a significant number of high quality developments to the expanding Abu Dhabi market, grow our recurring revenue streams from income generating assets and deleverage our balance sheet.
CEO’S MESSAGE
The commercial performance of our Asset Management portfolio was particularly strong this year and we have been encouraged by the strength of demand in Abu Dhabi for high-quality developments with modern facilities and amenities.
Aldar Annual Report 2014 05
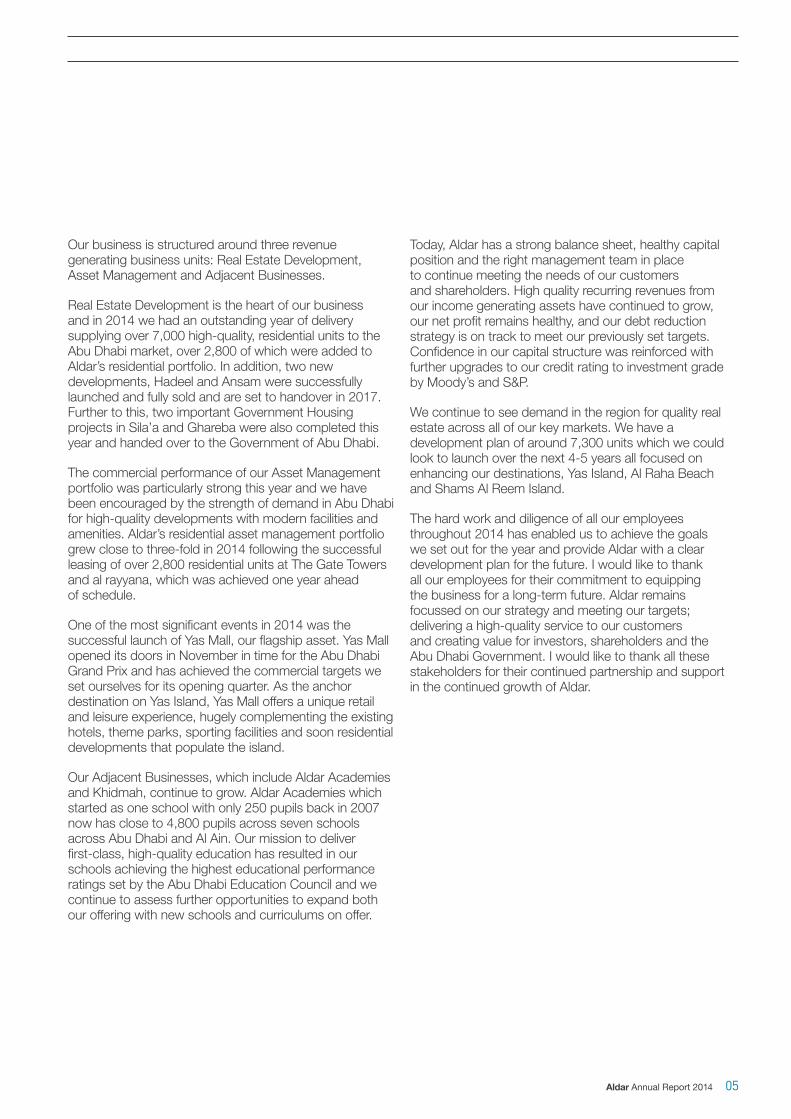
Our business is structured around three revenue generating business units: Real Estate Development, Asset Management and Adjacent Businesses.
Real Estate Development is the heart of our business and in 2014 we had an outstanding year of delivery supplying over 7,000 high-quality, residential units to the Abu Dhabi market, over 2,800 of which were added to Aldar’s residential portfolio. In addition, two new developments, Hadeel and Ansam were successfully launched and fully sold and are set to handover in 2017. Further to this, two important Government Housing projects in Sila’a and Ghareba were also completed this year and handed over to the Government of Abu Dhabi.
The commercial performance of our Asset Management portfolio was particularly strong this year and we have been encouraged by the strength of demand in Abu Dhabi for high-quality developments with modern facilities and amenities. Aldar’s residential asset management portfolio grew close to three-fold in 2014 following the successful leasing of over 2,800 residential units at The Gate Towers and al rayyana, which was achieved one year ahead of schedule.
One of the most significant events in 2014 was the successful launch of Yas Mall, our flagship asset. Yas Mall opened its doors in November in time for the Abu Dhabi Grand Prix and has achieved the commercial targets we set ourselves for its opening quarter. As the anchor destination on Yas Island, Yas Mall offers a unique retail and leisure experience, hugely complementing the existing hotels, theme parks, sporting facilities and soon residential developments that populate the island.
Our Adjacent Businesses, which include Aldar Academies and Khidmah, continue to grow. Aldar Academies which started as one school with only 250 pupils back in 2007 now has close to 4,800 pupils across seven schools across Abu Dhabi and Al Ain. Our mission to deliver first-class, high-quality education has resulted in our schools achieving the highest educational performance ratings set by the Abu Dhabi Education Council and we continue to assess further opportunities to expand both our offering with new schools and curriculums on offer.
Today, Aldar has a strong balance sheet, healthy capital position and the right management team in place to continue meeting the needs of our customers and shareholders. High quality recurring revenues from our income generating assets have continued to grow, our net profit remains healthy, and our debt reduction strategy is on track to meet our previously set targets. Confidence in our capital structure was reinforced with further upgrades to our credit rating to investment grade by Moody’s and S&P.
We continue to see demand in the region for quality real estate across all of our key markets. We have a development plan of around 7,300 units which we could look to launch over the next 4-5 years all focused on enhancing our destinations, Yas Island, Al Raha Beach and Shams Al Reem Island.
The hard work and diligence of all our employees throughout 2014 has enabled us to achieve the goals we set out for the year and provide Aldar with a clear development plan for the future. I would like to thank all our employees for their commitment to equipping the business for a long-term future. Aldar remains focussed on our strategy and meeting our targets; delivering a high-quality service to our customers and creating value for investors, shareholders and the Abu Dhabi Government. I would like to thank all these stakeholders for their continued partnership and support in the continued growth of Aldar.

06 Aldar Annual Report 2014
OVERVIEW OF BUSINESS
GREG FEWERChief Financial Officer
Improved quality of earningsLast year we refined our business model to be geared towards the growth of our recurring revenues, reduction in gross debt, and the prudent identification of value-driven development opportunities. In 2014, Aldar has made impressive progress across all these business priorities, and as a result, the composition of our earnings was of significantly higher quality in 2014.
CFO’S MESSAGE
Aldar’s two main operational divisions both contributedmeaningfully to our bottom line. This performance hasincreased cash flows that have been used to repay debt and improve our balance sheet significantly.

Aldar Annual Report 2014 07
Aldar’s two main operational divisions both contributed meaningfully to our bottom line. This performance has increased cash flows that have been used to repay debt and improve our balance sheet significantly.
Asset Management
Our recurring revenue growth strategy has been underway for some time and in 2014 we achieved considerable success. During the year, our residential asset management portfolio grew almost three-fold following the successful leasing and handover of over 2,800 units at The Gate Towers and al rayyana.
Our hotel portfolio performed exceptionally well with occupancy up to 81% across the year, supported by a very impressive last quarter which saw the Abu Dhabi Formula 1 race in November and strong growth in tourist numbers visiting Abu Dhabi. Similar improvements were achieved with our commercial office space, which reached 91% leasing, versus 82% a year ago, demonstrating the demand for high quality office space in the market.
As a result of this expanded, high quality, income generating asset base, our recurring revenues, which include investment properties, hotels, schools, operative villages, and leisure, were up 23% in 2014 to AED 2.25 billion.
This growth is set to continue into 2015 as we see further stabilisation across our recurring revenue asset portfolio. Yas Mall, our flagship asset, contributed six weeks of trading into our 2014 numbers, and once fully stabilised will be the largest recurring revenue asset by income.
Development
From a development perspective, of the 7,000 residential units we handed over this year, close to 2,000 units flowed through our profit and loss as development revenues, mostly attributable to handovers at The Gate Towers, and we are now very much at the end of this development cycle with only several hundred units to book as revenue in 2015.
Aldar’s future development pipeline was activated in April 2014, with the launch of the first off-plan sales in the Abu Dhabi market since 2010: Ansam on Yas Island and Al Hadeel at Al Raha Beach. Aldar remains committed to real estate development in Abu Dhabi and has a clear and defined development plan focused on enhancing our existing destinations, Yas Island, Al Raha Beach and Shams Al Reem Island.
Alongside Development and Asset Management, our adjacent businesses also continue to perform well. Aldar Academies saw a 12% jump in student numbers for the
2014/15 academic year. Khidmah, our property and facilities management business also saw growth and improved performance having secured new management contracts during the year.
Debt management
Our debt strategy is well on track and has delivered a further strengthening of our balance sheet, with gross debt down to AED 9.2 billion from AED 13.8 billion a year ago and net debt to equity ratio falling to 30% (2013: 65%). Our refinancing efforts, which commenced with the $750 million five-year Sukuk issued in late 2013, continued into 2014 with new banking agreements signed that refinanced and extended the debt maturity, and reduced our weighted average interest cost to 2.7%, down from 5.9% a year ago. This translates into significant cash interest savings, which are now a quarter of what they were 18 months ago on an annualised basis.
The positive market outlook and strength of our balance sheet resulted in significant upgrades from both Moody’s and S&P in November and December respectively, upgrading Aldar to investment grade. This was an important milestone for Aldar, which achieved an unprecedented series of notch upgrades from both Moody’s and S&P in the last 18 months.
2014 has been a year of execution and delivery for Aldar. Our business is well balanced between a strong recurring revenue assets base and a clear development plan, further supported by a strong balance sheet, with the financial flexibility to continue growth and create further value for shareholders.
OUR RECURRING REVENUES WHICH INCLUDE INVESTMENT PROPERTIES, HOTELS, SCHOOLS, OPERATIVE VILLAGES, AND LEISURE, WERE UP 23% IN 2014 TO AED 2.25 BILLION
GROSS DEBT DOWN TO AED 9.2 BILLION FROM AED 13.8 BILLION A YEAR AGO AND NET DEBT TO EQUITY RATIO FALLING TO 30%

08 Aldar Annual Report 2014
OVERVIEW OF BUSINESS

Aldar Annual Report 2014 09

ALDAR PROPERTIES PJSCREPORTS AND CONSOLIDATED FINANCIAL STATEMENTS FOR THE YEAR ENDED 31 DECEMBER 2014
Pages
Board of Directors’ report 11
Financial review 12
Independent auditor’s report 16
Consolidated statement of financial position 18
Consolidated income statement 20
Consolidated statement of comprehensive income 21
Consolidated statement of changes in equity 22
Consolidated statement of cash flows 23
Notes to the consolidated financial statements 25
10 Aldar Annual Report 2014
FINANCIAL STATEMENTS

Board of Directors’ reportOn behalf of the Board of Directors, I am delighted to present the consolidated audited financial statements of Aldar Properties PJSC (“the Company”) and its subsidiaries (together referred to as “the Group”) for the year ended 31 December 2014.
Principal activitiesThe principal activities of the Group continue to be the property development, investment and management of its real estate assets including offices, malls, hotels, schools, marinas and golf courses.
Financial resultsThe financial results of the Group have been presented on page 20 of these consolidated financial statements. Please also refer to financial review section for details.
Financial statementsThe Directors reviewed and approved the consolidated financial statements of the Group for the year ended 31 December 2014.
Directors
The members of the Board of Directors as of 31 December 2014 are:
Mr. Abubaker Seddiq Al Khoori ChairmanMr. Ali Eid Al Mheiri Vice ChairmanDr. Sultan Ahmed Al Jaber DirectorMr. Mubarak Matar Al Humairi DirectorMr. Ali Majid Al Mansouri DirectorMr. Ali Saeed Abdulla Sulayem Al Falasi DirectorMr. Mansour Mohamed Al Mulla DirectorMr. Ahmed Khalifa Mohamed Al Mehairi DirectorMr. Mohamed Haji Al Khoori DirectorMr. Martin Lee Edelman Director
ReleaseThe Directors release from liability the external auditor and management in connection with their duties for the year ended 31 December 2014.
On behalf of the Board of Directors
ABUBAKER SEDDIQ AL KHOORIChairman
11 February 2015
Aldar Annual Report 2014 11

FINANCIAL REVIEW
The financial information contained in this review is based on the consolidated financial statements. The nature of and accounting policies for individual line items are detailed in Note 3 to the consolidated financial statements. Extracts from the consolidated statement of financial position, consolidated income statement and consolidated statement of cash flows are as follows:
Key consolidated statement of financial position information
2014AED million
2013AED million
Property, plant and equipment 3,200 3,257Investment properties 14,401 12,026Development work in progress 2,871 4,311Land held for resale 1,815 1,783Trade and other receivables 9,619 13,389Cash and bank balances 4,664 4,294Financing(i) 9,170 13,786
Net assets (total assets less total liabilities) 18,373 16,648
Key consolidated income statement information
2014AED million
2013AED million
Revenue 6,551 5,380Direct costs (5,033) (3,616)Selling and marketing expenses (36) (12)General and administrative expenses:
Staff costs (231) (250)Depreciation and amortisation (228) (309)Reversal/(provisions, impairments and write downs), net 197 (1,136)Pre-opening expenses of operational businesses (50) –Other (137) (158)
Gain on disposal of investment in an associate 42 3Gain on business combination – 2,591 Fair value gain/(loss) on investment properties 474 (341)Share of profit/(loss) from associates and joint ventures 96 (16)Gain on disposal of investment properties 28 –Gain on discontinued operations 10 –Finance income 111 186Finance costs (382) (727)Other income 854 630
2,266 2,225
(i) Financing is defined as outstanding balances from all borrowings and non-convertible bond and Sukuk.
12 Aldar Annual Report 2014
FINANCIAL STATEMENTS

Key consolidated cash flow statement information
2014AED million
2013AED million
Net cash generated from operating activities 6,638 4,417
Net cash generated from/(used in) investing activities 66 (603)
Net cash used in financing activities (5,656) (2,746)
Cash and cash equivalents at the end of the year 3,126 2,078Short term deposits and restricted balances with banks 1,538 2,216
Cash and bank balances at the end of the year 4,664 4,294
HighlightsThe Group’s net profit for the year ended 31 December 2014 was AED 2,266 million compared to AED 2,225 million for the year 2013. Revenue for the year was AED 6,551 million as compared to AED 5,380 million for the year 2013. Recurring revenues from investment properties and other operational businesses amounted to AED 2,249 million compared to AED 1,830 million for 2013. This increase was primarily due to improved performance of the Group’s operational assets such as hotels, schools, and investment properties, in particular growth in residential investment properties successfully leased into the market.
For the three months ended 31 December 2014, the Group’s net profit was AED 718 million and revenue was AED 1,270 million, including recurring revenues of AED 701 million. Overall quarterly revenues were driven by the handover of residential units, mainly at Gate Towers, and an increased contribution from newly leased residential properties at our al rayyana and Gate Towers developments, which are now mostly leased out.
During the year, the Group reduced its gross debt from AED 13.8 billion to AED 9.2 billion and refinanced existing bank loans to further reduce the Group’s cost of borrowing thus improving the Group’s liquidity position and extending its debt maturity profile. The Group maintains strong liquidity position with AED 4.7 billion in cash and bank balances at year end in addition to AED 1.6 billion in undrawn committed bank facilities.
Operational achievements• Yas Mall officially opened on 19 November, 2014 with over 98% of the total retail space committed by tenants.• During the year, the Group delivered 1,975 residential units to customers including 104 unit sales during the fourth quarter.• As of the report date, the Group had completed the leasing of the 1,526 residential units at al rayyana development and over 1,340
units at Gate Towers which were retained for leasing.• During the year, the Group launched three major new off plan residential developments in prime areas of Abu Dhabi. The
developments include apartment units at Ansam on Yas Island, apartment and townhouse units at Al Hadeel, Raha Beach, and luxury villa land plots at Nareel Island.
Analysis of income statementRevenueThe Group’s revenue is mostly generated from the sale of completed properties, rental income from investment properties and income from its operational businesses. Revenue for the year is primarily driven by the unit handovers at the Gate Towers and sale of B2 Tower on Reem Island in addition to the increasing recurring revenue streams.
The Group earned AED 4,302 million from property development activities during the year, mainly from the sale of completed properties and construction revenue. The recurring revenue from the Group’s investment properties, operative villages and other operational businesses was AED 2,249 million for the year compared to AED 1,830 million for 2013.
Direct costs and gross profit For the twelve months ended 31 December 2014, direct costs included AED 3,794 million mainly for cost of properties sold and construction costs and AED 1,239 million for costs of operational business and investment properties. The overall increase in direct costs is in line with the increase in revenue. Lower gross profit margin for the year is mainly due to the recognition of high margin land plot sales during 2013 compared to this year.
Aldar Annual Report 2014 13

FINANCIAL REVIEW(CONTINUED)
Analysis of income statement (continued) Selling, general and administrative expenses Selling, general and administrative expenses (excluding depreciation and amortisation) were lower compared to the corresponding period mainly because of the reversal of impairment of property, plant and equipment and inventory as well as post-merger operating synergies. These were offset by specific provisions taken during the year, pre-opening expenses for a specific investment property and marketing expenses on newly launched projects.
Other incomeOther income represents mainly AED 311 million income recognised upon handover of infrastructure assets, AED 347 million upon handover of units in the Gate Towers, representing profit on units sold to the Government of Abu Dhabi, and AED 83 million cost recoveries from the Government of Abu Dhabi.
Fair value gainFair value gain on investment properties of AED 474 million mainly resulted from a fair value gain on a change in valuation methodology applied to Yas Mall upon completion and other fair value gains on newly-delivered leased residential properties and improved market conditions. This was offset by fair value loss of other investment properties with reduced rental rates and properties subject to fixed term leasehold interests by the Group.
Finance income/costs The Group’s finance income comprises interest on bank deposits, profit on Islamic deposits and finance income from finance leases. The Group’s finance costs comprise interest payments on its external financing and related hedging costs.
The Group had finance costs of AED 382 million compared to AED 727 million for the year 2013. The decrease is in line with both a reduction in the Group’s borrowings and cost of debt.
Analysis of financial positionEquityThe Shareholders resolved to transfer the share premium to the statutory reserve and thereafter transfer the excess statutory reserve balance representing more than 50% of the share capital account to offset accumulated losses and the share issuance costs. There is no impact on the overall shareholders’ equity as a result of these transfers.
Investment propertiesInvestment properties increased compared to 31 December 2013 due to ongoing work on investment properties under development, mainly Yas Mall prior to its completion, and fair value gain on Yas Mall as a result of the change in valuation methodology post development completion and other fair value gains on leased residential properties, offset by fair value losses on certain investment properties including those subject to fixed term leasehold interests, and transfer of owner-occupied properties to property, plant and equipment.
Development work in progressDevelopment work in progress as at 31 December 2014 decreased compared to 31 December 2013 mainly due to the recognition of cost of sold units, the transfer of leased units to investment properties and completed units to inventories, the disposal of a project development as a result of disposal of a subsidiary, and the write off of certain project costs during the period.
Trade and other receivablesThe Group’s receivables decreased compared to the balance at 31 December 2013 mainly due to collections from the Government of Abu Dhabi and other trade receivables, and a contractual prepayment of finance lease.
FinancingThe Group’s external financing as at 31 December 2014 decreased significantly to AED 9,170 million compared to AED 13,786 million as at 31 December 2013.
14 Aldar Annual Report 2014
FINANCIAL STATEMENTS

Analysis of cash flowsThe Group had net cash inflows of AED 6,638 million from operating activities for the year ended 31 December 2014. This was mainly due to the collection of receivables.
The Group’s net cash inflows from investing activities for the year ended 31 December 2014 are mainly attributable to decrease in restricted bank deposits and term deposits with original maturities above three months and proceeds from the disposal of investment in associate, offset by additions in investment properties.
Net cash outflows from financing activities for the year are mainly due to net repayment of existing borrowings and related finance costs.
GREG FEWERChief Financial Officer
11 February 2015
Aldar Annual Report 2014 15

INDEPENDENT AUDITOR’S REPORTTO THE SHAREHOLDERS OF ALDAR PROPERTIES PJSC ABU DHABI, U.A.E.
Report on the consolidated financial statementsWe have audited the accompanying consolidated financial statements of Aldar Properties PJSC (“the Company”) and its subsidiaries (together “the Group”), which comprise the consolidated statement of financial position as at 31 December 2014, and the consolidated income statement, consolidated statement of comprehensive income, consolidated statement of changes in equity and consolidated statement of cash flows for the year then ended, and a summary of significant accounting policies and other explanatory information.
Management’s responsibility for the consolidated financial statementsManagement is responsible for the preparation and fair presentation of these consolidated financial statements in accordance with International Financial Reporting Standards, and for such internal control as management determines is necessary to enable the preparation of consolidated financial statements that are free from material misstatement, whether due to fraud or error.
Auditor’s responsibilityOur responsibility is to express an opinion on these consolidated financial statements based on our audit. We conducted our audit in accordance with International Standards on Auditing. Those standards require that we comply with ethical requirements and plan and perform the audit to obtain reasonable assurance whether the consolidated financial statements are free from material misstatement.
An audit involves performing procedures to obtain audit evidence about the amounts and disclosures in the consolidated financial statements. The procedures selected depend on the auditor’s judgment, including the assessment of the risks of material misstatement of the consolidated financial statements, whether due to fraud or error. In making those risk assessments, the auditor considers internal control relevant to the entity’s preparation and fair presentation of the consolidated financial statements in order to design audit procedures that are appropriate in the circumstances, but not for the purpose of expressing an opinion on the effectiveness of the entity’s internal control. An audit also includes evaluating the appropriateness of accounting policies used and the reasonableness of accounting estimates made by management, as well as evaluating the overall presentation of the consolidated financial statements.
We believe that the audit evidence we have obtained is sufficient and appropriate to provide a basis for our audit opinion.
16 Aldar Annual Report 2014
FINANCIAL STATEMENTS

OpinionIn our opinion, the consolidated financial statements present fairly, in all material respects the financial position of the Group as of 31 December 2014, and of its financial performance and its cash flows for the year then ended in accordance with International Financial Reporting Standards.
Report on other legal and regulatory requirementsAlso, in our opinion, proper books of account are maintained by the Company, and the financial information included in the Board of Directors’ report related to the consolidated financial statements is in agreement with the books of account. We have obtained all the information and explanations which we considered necessary for the purpose of our audit. According to the information available to us, there were no contraventions of the UAE Federal Commercial Companies Law No. (8) of 1984 (as amended) or the Articles of Association of the Company which might have a material effect on the financial position of the Company or on the results of its operations for the year.
Deloitte & Touche (M.E.)
Georges F. NajemRegistration Number 809
11 February 2015
Aldar Annual Report 2014 17
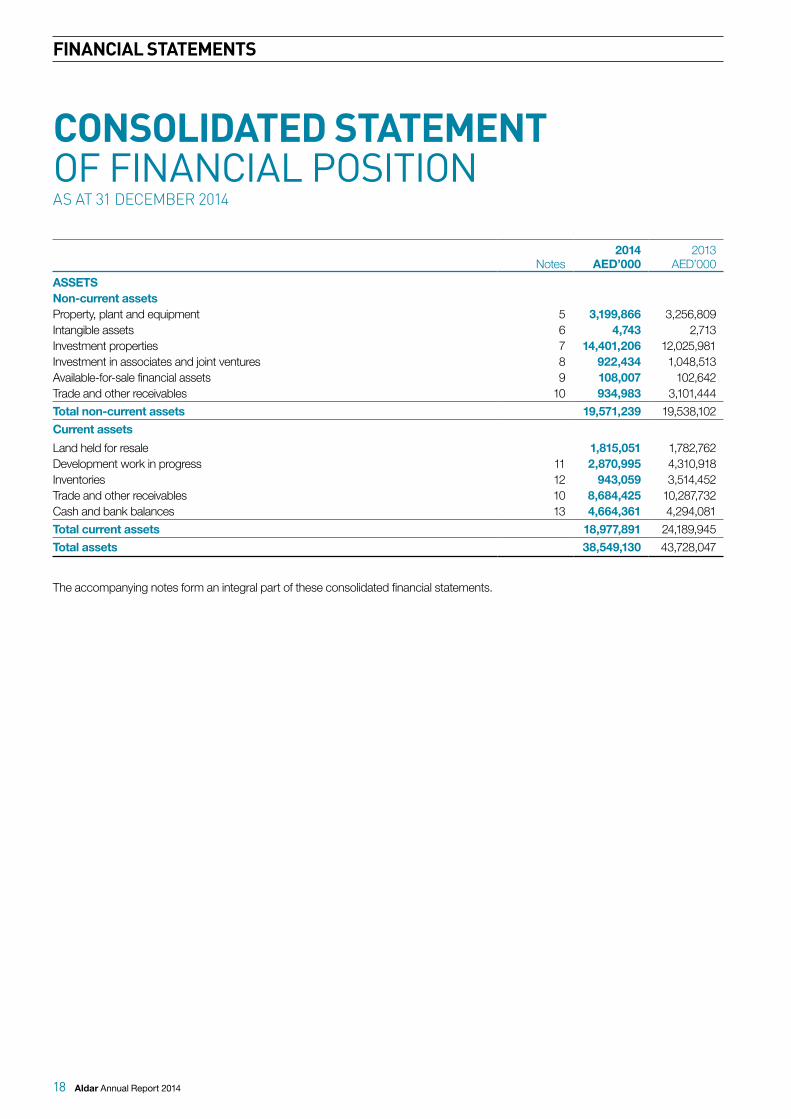
CONSOLIDATED STATEMENT OF FINANCIAL POSITIONAS AT 31 DECEMBER 2014
Notes2014
AED’0002013
AED’000
ASSETSNon-current assetsProperty, plant and equipment 5 3,199,866 3,256,809Intangible assets 6 4,743 2,713Investment properties 7 14,401,206 12,025,981Investment in associates and joint ventures 8 922,434 1,048,513Available-for-sale financial assets 9 108,007 102,642Trade and other receivables 10 934,983 3,101,444
Total non-current assets 19,571,239 19,538,102
Current assets
Land held for resale 1,815,051 1,782,762Development work in progress 11 2,870,995 4,310,918Inventories 12 943,059 3,514,452Trade and other receivables 10 8,684,425 10,287,732Cash and bank balances 13 4,664,361 4,294,081
Total current assets 18,977,891 24,189,945
Total assets 38,549,130 43,728,047
The accompanying notes form an integral part of these consolidated financial statements.
18 Aldar Annual Report 2014
FINANCIAL STATEMENTS

Notes2014
AED’0002013
AED’000
EQUITY AND LIABILITIESCapital and reservesShare capital 14 7,862,630 7,862,630Share premium – 10,412,278Share issuance costs, net – (79,920)Statutory reserve 15 3,931,315 1,235,014Hedging reserve (43,511) (48,296)Fair value reserve 20,013 8,301Retained earnings/(accumulated losses) 6,305,425 (3,015,384)
Equity attributable to the owners of the Company 18,075,872 16,374,623Non-controlling interests 297,510 273,336
Total equity 18,373,382 16,647,959
Non-current liabilitiesNon-convertible bonds and Sukuk 16 2,741,717 2,744,793Bank borrowings 17 4,855,500 2,964,749Retentions payable 147,184 130,842Provision for employees’ end of service benefit 18 101,919 96,901Security deposits – 1,998Other financial liabilities 28,376 33,033
Total non-current liabilities 7,874,696 5,972,316
Current liabilitiesNon-convertible bonds and Sukuk 16 9,983 4,644,771Bank borrowings 17 1,562,398 3,431,542Retentions payable 832,739 1,300,727Advances and security deposits from customers 19 1,398,392 3,144,168Trade and other payables 20 8,496,404 8,583,052Other financial liabilities 1,136 3,512
Total current liabilities 12,301,052 21,107,772
Total liabilities 20,175,748 27,080,088
Total equity and liabilities 38,549,130 43,728,047
ABUBAKER SEDDIQ AL KHOORI MOHAMMED KHALIFA AL MUBARAK GREG FEWERChairman Chief Executive Officer Chief Financial Officer
The accompanying notes form an integral part of these consolidated financial statements.
Aldar Annual Report 2014 19

CONSOLIDATED INCOME STATEMENT FOR THE YEAR ENDED 31 DECEMBER 2014
Notes2014
AED’0002013
AED’000
Revenue 21 6,551,078 5,379,757Direct costs 22 (5,032,672) (3,615,700)
Gross profit 1,518,406 1,764,057
Selling and marketing expenses 23 (35,540) (12,170)General and administrative expenses:Staff costs 24 (231,226) (249,818)Depreciation and amortisation (227,670) (309,188)Reversal/(provisions, impairments and write downs), net 25 196,483 (1,135,997)Pre-opening expenses of operational businesses (50,298) –Other (136,533) (158,051)
Share of profit/(loss) from associates and joint ventures 8 96,006 (16,475)Gain on disposal of investment in an associate 8 42,039 3,018Gain on disposal of investment properties 7 28,437 –Gain on business combination 35 – 2,590,782Fair value gain/(loss) on investment properties 7 474,157 (340,544)Gain on discontinued operations 37 9,720 –Finance income 26 110,587 186,237Finance costs 27 (381,795) (727,020)Other income 28 853,580 630,364
Profit for the year 2,266,353 2,225,195
Profit for the year attributable to:Owners of the Company 2,235,136 2,246,294Non-controlling interests 31,217 (21,099)
2,266,353 2,225,195
Basic and diluted earnings per share in AED per share 29 0.284 0.339
The accompanying notes form an integral part of these consolidated financial statements.
20 Aldar Annual Report 2014
FINANCIAL STATEMENTS

CONSOLIDATED STATEMENT OF COMPREHENSIVE INCOME FOR THE YEAR ENDED 31 DECEMBER 2014
2014AED’000
2013AED’000
Profit for the year 2,266,353 2,225,195
Other comprehensive income:Items that may be reclassified subsequently to profit or loss:Changes in fair value of cash flow hedges 4,785 13,125Changes in fair value of available-for-sale financial assets 10,696 1,213Reclassification adjustment relating to available-for-sale financial assets disposed of during the year 1,016 (1,525)
Other comprehensive income for the year 16,497 12,813
Total comprehensive income for the year 2,282,850 2,238,008
Total comprehensive income/(loss) for the year attributable to:Owners of the Company 2,251,633 2,259,107
Non-controlling interests 31,217 (21,099)
2,282,850 2,238,008
The accompanying notes form an integral part of these consolidated financial statements.
Aldar Annual Report 2014 21

CONSOLIDATED STATEMENT OF CHANGES IN EQUITY FOR THE YEAR ENDED 31 DECEMBER 2014
Notes
Share capital
AED’000
SharepremiumAED’000
Shareissuance
costs, netAED’000
Statutoryreserve
AED’000
Hedgingreserve
AED’000
Fair valuereserve
AED’000
Retainedearnings/
(accumulatedlosses)
AED’000
Attributable to owners
of theCompanyAED’000
Non- controlling
interestsAED’000
TotalAED’000
Balance at 1 January 2013 4,085,129 7,984,873 (79,920) 1,010,385 (59,896) 7,088 (4,768,152) 8,179,507 – 8,179,507Profit for the year – – – – – – 2,246,294 2,246,294 (21,099) 2,225,195Other comprehensive income – – – – 11,600 1,213 – 12,813 – 12,813Dividends declared 30 – – – – – – (268,897) (268,897) – (268,897)Conversion of bonds into shares 16 396,501 297,375 – – – – – 693,876 – 693,876Issue of shares as consideration for the acquisition of Sorouh 35 3,381,000 2,130,030 – – – – – 5,511,030 – 5,511,030Non-controlling interests arising on the acquisition of Sorouh 35.2 – – – – – – – – 294,435 294,435Transfer to statutory reserve 15 – – – 224,629 – – (224,629) – – –
Balance at 1 January 2014 7,862,630 10,412,278 (79,920) 1,235,014 (48,296) 8,301 (3,015,384) 16,374,623 273,336 16,647,959Net transfers during the year(i) – (10,412,278) 79,920 2,696,301 – – 7,636,057 – – –Profit for the year – – – – – – 2,235,136 2,235,136 31,217 2,266,353Other comprehensive income – – – – 4,785 11,712 – 16,497 – 16,497Dividends declared 30 – – – – – – (550,384) (550,384) – (550,384)Disposal of interest in a subsidiary 37 – – – – – – – – (7,043) (7,043)
Balance at 31 December 2014 7,862,630 – – 3,931,315 (43,511) 20,013 6,305,425 18,075,872 297,510 18,373,382
(i) During the Annual General Meeting held on 26 March 2014, the Shareholders resolved to transfer the share premium to the statutory reserve and thereafter transfer the excess statutory reserve balance representing more than 50% of the share capital to offset accumulated losses amounting to AED 3,015,384,428 and the share issuance costs amounting to AED 79,920,364.
The accompanying notes form an integral part of these consolidated financial statements.
22 Aldar Annual Report 2014
FINANCIAL STATEMENTS

CONSOLIDATED STATEMENT OF CASH FLOWSFOR THE YEAR ENDED 31 DECEMBER 2014
2014AED’000
2013AED’000
Cash flows from operating activitiesProfit for the year 2,266,353 2,225,195Adjustments for:
Depreciation and amortisation 236,776 309,188Finance income (110,587) (186,237)Dividend income (7,276) (4,939)Finance costs 352,536 680,365Amortisation of prepaid finance costs 29,259 46,655Fair value (gain)/loss on investment properties (474,157) 340,544Share of (profit)/loss from associates and joint ventures (96,006) 16,475Release of provision for onerous contracts (43,570) (17,000)Impairments/write-offs on projects 33,201 1,009,451Provision for impairment of trade receivables/cancellations 28,033 40,476Reversal of impairment of inventories (105,940) –Provision for impairment of gross amounts due from construction contracts – 86,070Reversal of impairment on property, plant and equipment and intangible assets, net (148,905) –Reversal of impairment of investment in an associate (2,877) –Reversal of accruals (84,086) –Reversal of unrealised gain on sale of asset to a joint venture – (18,592)Gain on business combination – (2,590,782)Gain on disposal of an associate (42,039) (3,018)Gain on disposal of an investment in available-for-sale financial assets (1,249) –Gain on disposal of a subsidiary (9,720) (3,455)Gain on disposal of property, plant and equipment (168) (6,220)Gain on disposal of investment property (28,437) –Provision for end of service benefit, net 5,018 (1,489)
Operating cash flows before changes in working capital 1,796,159 1,922,687Changes in working capital:Decrease in trade and other receivables 3,751,062 2,487,764Increase in development work in progress (155,311) (363,277)Decrease in inventories 3,448,546 1,831,746Decrease in retentions payable (451,647) (43,674)Decrease in advances and security deposits from customers (1,745,775) (1,918,966)(Decrease)/increase in trade and other payables (5,089) 501,169
Net cash generated from operating activities 6,637,945 4,417,449
The accompanying notes form an integral part of these consolidated financial statements.
Aldar Annual Report 2014 23

CONSOLIDATED STATEMENT OF CASH FLOWSFOR THE YEAR ENDED 31 DECEMBER 2014 (CONTINUED)
2014AED’000
2013AED’000
Cash flows from investing activitiesPayments for purchases of property, plant and equipment (50,121) (37,427)Proceeds from disposal of property, plant and equipment 168 8,655Payments for purchases of intangible assets (5,914) (1,062)Additions to investment properties (953,553) (1,199,702)Payments for investment in joint ventures – (89,402)Cash acquired on business combination – 1,521,478Payments for investment in available-for-sale financial assets (4,315) (14,222)Proceeds from disposal of available-for-sale financial assets 10,895 –Proceeds from disposal of an associate 200,000 122,474Proceeds from disposal of an investment property 74,174 –Finance income received 25,415 25,436Dividends received 91,303 27,091Movement in term deposits with original maturities above three months 456,324 (1,070,269)Movement in restricted bank balances 221,776 104,293
Net cash generated from/(used in) investing activities 66,152 (602,657)
Cash flows from financing activitiesRepayment of non-convertible bonds (4,590,000) (3,750,000)Financing raised 5,917,591 6,371,300Repayment of borrowings (5,846,984) (4,332,154)Finance costs paid (600,206) (806,492)Dividends paid (536,118) (213,114)Directors’ remuneration paid – (16,000)
Net cash used in financing activities (5,655,717) (2,746,460)
Net increase in cash and cash equivalents 1,048,380 1,068,332Cash and cash equivalents at the beginning of the year 2,077,607 1,009,275
Cash and cash equivalents at the end of the year (Note 13) 3,125,987 2,077,607
The accompanying notes form an integral part of these consolidated financial statements.
24 Aldar Annual Report 2014
FINANCIAL STATEMENTS

NOTES TO THE CONSOLIDATED FINANCIAL STATEMENTSFOR THE YEAR ENDED 31 DECEMBER 2014
1 General information The establishment of Aldar Properties PJSC (“the Company”) was approved by Decision No. (16) of 2004 of the Abu Dhabi Department of Planning and Economy dated 12 October 2004. The Company’s incorporation was declared by Ministerial Resolution No. (59) of 2005 issued by the UAE Minister of Economy dated 23 February 2005.
The Company is domiciled in the United Arab Emirates and its registered office address is PO Box 51133, Abu Dhabi.
The Company’s ordinary shares are listed on the Abu Dhabi Securities Exchange.
The Company and its subsidiaries (together referred to as “the Group”) are engaged in various businesses primarily the development, sales, investment, construction, management and associated services for real estate. In addition, the Group is also engaged in development, construction, management and operation of hotels, schools, marinas and golf courses.
On 27 June 2013, the Company issued shares as consideration for the acquisition of the net assets of Sorouh Real Estate PJSC (henceforth referred to as “Sorouh”) to Sorouh’s shareholders in the ratio of 1.288 new shares in the Company for each share held in Sorouh. The transaction was approved in the shareholders’ meeting on 3 March 2013. The impact of the acquisition on the comparative numbers of these consolidated financial statements has been detailed in Note 35.
2 Application of new and revised International Financial Reporting Standards (IFRSs)2.1 New and revised IFRSs applied with no material effect on the consolidated financial statements The following new and revised IFRSs have been adopted in these consolidated financial statements. The application of these new and revised IFRSs has not had any material impact on the amounts reported for the current and prior years but may affect the accounting for future transactions or arrangements.
New and revised IFRSs Summary of requirements
Amendments to IAS 19 Employee Benefits
The amendment clarifies the requirements that relate to how contributions from employees or third parties that are linked to service should be attributed to periods of service.
Amendments to IAS 32 Financial Instruments: Presentation
The amendments provide guidance on the offsetting of financial assets and financial liabilities.
Amendments to IAS 36 Impairment of Assets relating to recoverable amount disclosures for non-financial assets
The amendments restrict the requirements to disclose the recoverable amount of an asset or CGU to period in which an impairment loss has been recognized or reversed. They also expand and clarify the disclosure requirements applicable when an asset or CGU’s recoverable amount has been determined on the basis of fair value less costs of disposal.
Amendments to IAS 39 Financial Instruments: Recognition and Measurement, Novation of Derivatives and Continuation of Hedge Accounting
The amendments allow the continuation of hedge accounting when a derivative is novated to a clearing counterparty and certain conditions are met.
Amendments to IFRS 10 Consolidated Financial Statements, IFRS 12 Disclosure of Interests in Other Entities and IAS 27 Separate Financial Statements – Guidance on Investment Entities
On 31 October 2012, the IASB published a standard on investment entities, which amends IFRS 10, IFRS 12, and IAS 27 and introduces the concept of an investment entity in IFRSs. The objective of this project is to develop an exemption from the requirement to consolidate subsidiaries for eligible investment entities (such as mutual funds, unit trusts, and similar entities), instead requiring the use of the fair value to measure those investments.
IFRIC 21 Levies This Interpretation was developed to address the concerns about how to account for levies that are based on financial data of a period that is different from that in which the activity that give rise to the payment of the levy occurs.
Aldar Annual Report 2014 25

2 Application of new and revised International Financial Reporting Standards (IFRSs) (continued) 2.2 New and revised IFRS in issue but not yet effectiveAt the date of authorisation of these consolidated financial statements, the following new and revised IFRSs were in issue but not yet effective:
New and revised IFRSsEffective for annual periods beginning on or after
Annual improvements 2012-2014 covering amendments to IFRS 5, IFRS 7, IAS 19, IAS 34 1 January 2016
Annual improvements 2010-2012 covering amendments to IFRS 2, IFRS 3, IFRS 8, IFRS 13, IAS 16, IAS 24 and IAS 38
1 July 2014
Annual improvements 2011-2013 covering amendments to IFRS 1, IFRS 3, IFRS 13 and IAS 40 1 July 2014
Amendment to IAS 19 Employee Benefits relating to defined benefit plans and employee contributions
1 July 2014
IFRS 9 Financial Instruments (as revised in 2010) Not earlier than 1 January 2018
Amendments to IFRS 9 Financial Instrument to introduce a new expected loss impairment model and limited changes to the classification and measurement requirements for financial assets
1 January 2018
IFRS 14 Regulatory Deferral Accounts 1 January 2016
IFRS 15 Revenue from Contracts with Customers 1 January 2017
Amendments to IFRS 11 Accounting for Acquisitions of Interests in Joint Operations 1 January 2016
Amendments to IAS 16 and IAS 38 Clarification of Acceptable Methods of Depreciation and Amortisation 1 January 2016
Amendments to IAS 16 and IAS 41 Equity Method in Separate Financial Statements 1 January 2016
Amendments to IAS 27 Agriculture: Bearer Plants 1 January 2016
Amendments to IAS 1 Disclosure Initiative 1 January 2016
Amendments to IFRS 10, IFRS 12 and IAS 28 Investment Entities: Applying the Consolidation Exception 1 January 2016
Amendments to IFRS 10 and IAS 28 Sale or Contribution of Assets between an Investor and its Associate or Joint Venture 1 January 2016
Amendment to IFRS 7 Financial Instruments: Disclosures relating to transition to IFRS 9 (or otherwise when IFRS 9 is first applied) When IFRS 9 is first applied
Amendments to IAS 39 Financial Instruments When IFRS 9 is first applied
Management anticipates that these new standards, interpretations and amendments will be adopted in the Group’s consolidated financial statements for the period beginning 1 January 2015 or as and when they are applicable and adoption of these new standards, interpretations and amendments, except for IFRS 15, may have no material impact on the consolidated financial statements of the Group in the period of initial application.
IFRS 15 was issued in May 2014 and establishes a five-step model that will apply to revenue arising from contracts with customers. Under IFRS 15 revenue is recognised at an amount that reflects the consideration to which an entity expects to be entitled in exchange for transferring goods or services to a customer. The principles in IFRS 15 provide a more structured approach to measuring and recognising revenue. The new revenue standard is applicable to all entities and supersedes all current revenue recognition requirements under IFRS. Either a full or modified retrospective application is required for annual periods beginning on or after 1 January 2017 with early adoption permitted.
The Group is assessing the impact of early adopting IFRS 15. Based on an analysis of the contractual relationships with customers, the adoption of the standard may result in a change to the timing of revenue recognition.
NOTES TO THE CONSOLIDATED FINANCIAL STATEMENTSFOR THE YEAR ENDED 31 DECEMBER 2014 (CONTINUED)
26 Aldar Annual Report 2014
FINANCIAL STATEMENTS

3 Summary of significant accounting policies3.1 Statement of complianceThe consolidated financial statements have been prepared in accordance with International Financial Reporting Standards (IFRS) and also comply with the applicable requirements of the laws in the UAE.
3.2 Basis of preparationThe consolidated financial statements have been prepared on the historical cost basis except for the revaluation of investment properties and certain financial instruments. The principal accounting policies are set out below.
For the purpose of these consolidated financial statements, UAE Dirhams (AED) is the functional and the presentation currency of the Group.
3.3 Basis of consolidationThe consolidated financial statements incorporate the financial statements of the Company and entities (including structured entities) controlled by the Company and its subsidiaries. Control is achieved when the Company:
• has power over the investee;• is exposed, or has rights, to variable returns from its involvement with the investee; and • has the ability to use its power to affect its returns.
The Company reassesses whether or not it controls an investee if facts and circumstances indicate that there are changes to one or more of the three elements of control listed above.
When the Company has less than a majority of the voting rights of an investee, it has power over the investee when the voting rights are sufficient to give it the practical ability to direct the relevant activities of the investee unilaterally. The Company considers all relevant facts and circumstances in assessing whether or not the Company’s voting rights in an investee are sufficient to give it power, including:
• the size of the Company’s holding of voting rights relative to the size and dispersion of holdings of the other vote holders; • potential voting rights held by the Company, other vote holders or other parties; • rights arising from other contractual arrangements; and • any additional facts and circumstances that indicate that the Company has, or does not have, the current ability to direct the relevant
activities at the time that decisions need to be made, including voting patterns at previous shareholders’ meetings.
Consolidation of a subsidiary begins when the Company obtains control over the subsidiary and ceases when the Company loses control of the subsidiary. Specifically, income and expenses of a subsidiary acquired or disposed of during the year are included in the consolidated statement of profit or loss and other comprehensive income from the date the Company gains control until the date when the Company ceases to control the subsidiary.
Profit or loss and each component of other comprehensive income are attributed to the owners of the Company and to the non-controlling interests. Total comprehensive income of subsidiaries is attributed to the owners of the Company and to the non-controlling interests even if this results in the non-controlling interests having a deficit balance.
When necessary, adjustments are made to the financial statements of subsidiaries to bring their accounting policies into line with the Group’s accounting policies.
All intragroup assets and liabilities, equity, income, expenses and cash flows relating to transactions between members of the Group are eliminated in full on consolidation.
Aldar Annual Report 2014 27

3 Summary of significant accounting policies (continued)3.3 Basis of consolidation (continued)
Name of subsidiaryOwnership interest
Country ofincorporation Principal activity
Al Raha Gardens Property LLC 100% UAE Development, sale and management of properties
Al Jimi Mall LLC 100% UAE Development and management of investment property
Addar Real Estate Services LLC 100% UAE Property development
Al Raha Infrastructure Company LLC 100% UAE Development, sale and management of properties
Aldar Academies LLC 100% UAE Investment in, and management of entities providing educational services
Aldar Facilities Management LLC 100% UAE Investment in, and management of, entities providing facilities management services
Aldar Commercial Property Developments LLC 100% UAE Ownership, management and development of buildings
Aldar Hotels and Hospitality LLC 100% UAE Investment in, and management of, entities providing hotels and hospitality services
Aldar Marinas LLC 100% UAE Managing and operating marinas, sports clubs and marine machinery
Abu Dhabi World Trade Centre LLC 100% UAE Development and management of, and investment in, properties and related activities
Nareel Island Development Company LLC 100% UAE Development and management of, and investment in, properties and related activities
Yas Marina LLC 100% UAE Ownership, development and management of marinas and related activities
Yas Yacht Club LLC 100% UAE Management of yachts and marine sports
Yas Hotel LLC 100% UAE Ownership, development and management of hotels
Yas Links LLC 100% UAE Ownership and management of golf courses and golf clubs
Al Muna Primary School LLC 100% UAE Providing educational services
Gate Towers Shams Abu Dhabi LLC 100% UAE Development of Gate Towers
Sorouh Abu Dhabi Real Estate LLC 100% UAE Act as Mudarib in accordance with the Sukuk Issue structure
Sorouh International Limited(i) 100% UAE Holding company of foreign entities
Sorouh International Development Limited(i) 100% UAE Development of properties and real estate
Sorouh International Morocco Limited(i) 100% UAE Development of properties and real estate
Lulu Island for Project Development LLC 100% UAE Development of properties and real estate
Tilal Liwa Real Estate Investment LLC 100% UAE Property, rental and management
Al Seih Real Estate Management LLC 91.4% UAE Management and leasing of real estate; real estate projects investment
Seih Sdeirah Real Estate LLC 91.4% UAE Property rental and management; real estate projects investment
Sorouh Egypt for Investment and Tourism Development SAE(i)
80% Egypt Investment in tourism activity
Khidmah LLC 60% UAE Management and leasing of real estate
Pivot Engineering & General Contracting Co. (WLL) 60% UAE Engineering and general construction works
(i) Disposed of during the year (Note 37).
NOTES TO THE CONSOLIDATED FINANCIAL STATEMENTSFOR THE YEAR ENDED 31 DECEMBER 2014 (CONTINUED)
28 Aldar Annual Report 2014
FINANCIAL STATEMENTS

3.4 Business combinationsAcquisitions of subsidiaries are accounted for using the purchase method. The cost of the business combination is measured as the aggregate of the fair values (at the date of exchange) of assets given, liabilities incurred or assumed, and equity instruments issued by the Group in exchange for control of the acquiree, plus any costs directly attributable to the business combination. The acquiree’s identifiable assets, liabilities and contingent liabilities that meet the conditions for recognition under IFRS 3 Business Combinations are recognised at their fair values at the acquisition date, except for non-current assets (or disposal groups) that are classified as held for sale in accordance with IFRS 5 Non-current Assets Held for Sale and Discontinued Operations, which are recognised and measured at fair value less costs to sell.
Goodwill arising on acquisition is recognised as an asset and initially measured at cost, being the excess of the cost of the business combination over the Group’s interest in the net fair value of the identifiable assets, liabilities and contingent liabilities recognised.
Non-controlling interests that are present ownership interests and entitle their holders to a proportionate share of the entity’s net assets in the event of liquidation may be initially measured either at fair value or at the non-controlling interests’ proportionate share of the recognised amounts of the acquiree’s identifiable net assets.
When a business combination is achieved in stages, the Group’s previously held equity interest in the acquiree is remeasured to fair value at the acquisition date (i.e. the date when the Group obtains control) and the resulting gain or loss, if any, is recognised in profit or loss. Amounts arising from interests in the acquiree prior to the acquisition date that have previously been recognised in other comprehensive income are reclassified to profit or loss where such treatment would be appropriate if that interest were disposed of.
If the initial accounting for a business combination is incomplete by the end of the reporting period in which the combination occurs, the Group reports provisional amounts for the items for which the accounting is incomplete. Those provisional amounts are adjusted during the measurement period, or additional assets or liabilities are recognised, to reflect new information obtained about facts and circumstances that existed at the acquisition date that, if known, would have affected the amounts recognised at that date.
3.5 Investments in associates and joint ventures An associate is an entity over which the Group has significant influence that is neither a subsidiary nor an interest in a joint venture. Significant influence is the power to participate in the financial and operating policy decisions of the investee but is not control or joint control over those policies.
A joint venture is a joint arrangement whereby the parties that have joint control of the arrangement have rights to the net assets of the joint arrangement. Joint control is the contractually agreed sharing of control of an arrangement, which exists only when decisions about the relevant activities require unanimous consent of the parties sharing control.
The results and assets and liabilities of associates or joint ventures are incorporated in these consolidated financial statements using the equity method of accounting, except when the investment is classified as held for sale, in which case it is accounted for under IFRS 5 Non-current Assets Held for Sale and Discontinued Operations. Under the equity method, an investment in an associate or a joint venture is initially recognised are carried in the consolidated statement of financial position at cost and as adjusted thereafter to recognise for post-acquisition changes in the Group’s share of the profit or loss and other comprehensive income of the associate and joint venture.
Losses of an associate or joint venture in excess of the Group’s interest in that associate or joint venture (which includes any long term interests that, in substance, form part of the Group’s net investment in associate or joint venture) are recognised only to the extent that the Group has incurred legal or constructive obligations or made payments on behalf of the associate or joint venture.
Where an entity in the Group transacts with an associate or joint venture of the Group, profits and losses are eliminated to the extent of the Group’s interest in the relevant associate or joint venture.
Aldar Annual Report 2014 29

3 Summary of significant accounting policies (continued) 3.6 Investment in joint operations A joint operation is a joint arrangement whereby the parties that have joint control of the arrangement have rights to the assets, and obligations for the liabilities, relating to the arrangement. Joint control is the contractually agreed sharing of control of an arrangement, which exists only when decisions about the relevant activities require unanimous consent of the parties sharing control.
When a group entity undertakes its activities under joint operations, the Group as a joint operator recognises in relation to its interest in a joint operation:
• its assets, including its share of any assets held jointly;• its liabilities, including its share of any liabilities incurred jointly;• its revenue from the sale of its share of the output arising from the joint operation;• its share of the revenue from the sale of the output by the joint operation; and• its expenses, including its share of any expenses incurred jointly.
The Group accounts for the assets, liabilities, revenues and expenses relating to its interest in a joint operation in accordance with IFRSs applicable to the particular assets, liabilities, revenues and expenses.
When a group entity transacts with a joint operation in which a group entity is a joint operator (such as a sale or contribution of assets), the Group is considered conducting the transaction with other parties to the joint operation and profits and losses resulting from the transactions are recognised in the Group’s consolidated financial statements only to the extent of other parties’ interests in the joint operation.
When a group entity transacts with a joint operation in which a group entity is a joint operator (such as a purchase of assets), the Group does not recognise its share of the gains and losses until it resells those assets to a third party.
3.7 Revenue recognitionRevenue is recognised in the consolidated income statement at the fair value of the consideration received or receivable as follows:
Sale of propertiesRevenue from the sale of properties is recognised when all of the following conditions have been satisfied:
• the Group has transferred to the buyer the significant risks and rewards of ownership of the property;• the Group retains neither continuing managerial involvement to the degree usually associated with ownership nor effective control
over the property sold;• the amount of revenue can be measured reliably;• it is probable that the economic benefits associated with the transaction will flow to the Group; and• the costs incurred or to be incurred in respect of the transaction can be measured reliably.
Construction contractsWhere the outcome of a construction contract can be estimated reliably, revenue and costs are recognised by reference to the stage of completion of the contract activity at the end of the reporting period, measured based on the proportion of contract costs incurred for work performed to date relative to the estimated total contract costs, except where this would not be representative of the stage of completion. Variations in contract work, claims and incentive payments are included to the extent that the amount can be measured reliably and its receipt is considered probable.
Changes in estimates used in the determination of the amount of revenue and expenses are recognised in profit or loss in the period in which the change is made.
Where the outcome of a construction contract cannot be estimated reliably, contract revenue is recognised to the extent of contract costs incurred that it is probable will be recoverable. Contract costs are recognised as expenses in the period in which they are incurred.
When it is probable that total contract costs will exceed total contract revenue, the expected loss is recognised as an expense immediately.
Costs of contracts include all direct costs of labour, materials, depreciation of property, plant and equipment and costs of subcontracted works, plus an appropriate proportion of construction overheads and general and administrative expenses of the year, which are allocated to construction contracts in progress during the year.
Where contract costs incurred to date plus recognised profits less recognised losses exceed progress billings, the surplus is shown as amounts due from customers for contract work. For contracts where progress billings exceed contract costs incurred to date plus recognised profits less recognised losses, the surplus is shown as the amounts due to customers for contract work. Amounts received before the related work is performed are included in the statement of financial position, as a liability, as advances received. Amounts billed for work performed but not yet paid by the customer are included in the statement of financial position under trade and other receivables.
NOTES TO THE CONSOLIDATED FINANCIAL STATEMENTSFOR THE YEAR ENDED 31 DECEMBER 2014 (CONTINUED)
30 Aldar Annual Report 2014
FINANCIAL STATEMENTS

3 Summary of significant accounting policies (continued) 3.7 Revenue recognition (continued)Income from investment properties Rental incomeThe Group’s policy for recognition of revenue from operating leases is described in 3.8 below.
Service charges and expenses recoverable from tenantsIncome arising from expenses recharged to tenants is recognised in the period in which the expense can be contractually recovered. Service charges and other such receipts are included gross of the related costs in revenue as the Group acts as principal in this respect.
Income from hotelsIncome from hotels comprises revenue from rooms, food and beverages and other associated services provided, and is recognised when the goods are sold or services are rendered.
Income from leisure businessesIncome from leisure businesses comprises revenue from goods sold and services provided at marinas and golf course, and is recognised when the goods are sold or services are rendered.
Income from schoolsRegistration fee is recognised as income when it is received. Tuition fee income is recognised on a monthly basis over the period of instruction. Tuition fees received in advance are recorded as deferred income.
Dividend incomeDividend income from investments is recognised when the Group’s right to receive payment has been established.
Interest incomeInterest income is accrued on a time basis, by reference to the principal outstanding and effective interest rate applicable.
3.8 LeasingLeases are classified as finance leases whenever the terms of the lease transfer substantially all the risks and rewards of ownership to the lessee. All other leases are classified as operating leases.
The Group as lessorAmounts due from lessees under finance leases are recorded as receivables at the amount of the Group’s net investment in the leases. Finance lease income is allocated to accounting periods so as to reflect a constant periodic rate of return on the Group’s net investment outstanding in respect of the leases.
Rental income from operating leases is recognised on a straight-line basis over the term of the relevant lease. Initial direct costs incurred in negotiating and arranging an operating lease are added to the carrying amount of the leased asset and recognised on a straight-line basis over the lease term.
The Group as lesseeAssets held under finance leases are initially recognised as assets of the Group at their fair value at the inception of the lease or, if lower, at the present value of the minimum lease payments. The corresponding liability to the lessor is included in the consolidated statement of financial position as a finance lease obligation.
Lease payments are apportioned between finance charges and reduction of the lease obligation so as to achieve a constant rate of interest on the remaining balance of the liability. Finance charges are charged directly to profit or loss, unless they are directly attributable to qualifying assets, in which case they are capitalised in accordance with the Group’s general policy on borrowing costs (see Note 3.10 below).
Operating lease payments are recognised as an expense on a straight-line basis over the lease term, except where another systematic basis is more representative of the time pattern in which economic benefits from the leased asset are consumed. Contingent rentals arising under operating leases are recognised as an expense in the period in which they are incurred.
In the event that lease incentives are received to enter into operating leases, such incentives are recognised as a liability. The aggregate benefit of incentives is recognised as a reduction of rental expense on a straight-line basis, except where another systematic basis is more representative of the time pattern in which economic benefits from the leased asset are consumed.
Aldar Annual Report 2014 31

3 Summary of significant accounting policies (continued) 3.9 Foreign currenciesTransactions in currencies other than AED (foreign currencies) are recorded at the rates of exchange prevailing at the dates of the transactions. At the end of each reporting period, monetary items denominated in foreign currencies are retranslated at the rates prevailing at that date. Non-monetary items carried at fair value that are denominated in foreign currencies are retranslated at the rates prevailing at the date when the fair value was determined. Non-monetary items that are measured in terms of historical cost in a foreign currency are not retranslated.
3.10 Borrowing costs Borrowing costs directly attributable to the acquisition, construction or production of qualifying assets, which are assets that necessarily take a substantial period of time to get ready for their intended use or sale, are added to the cost of those assets, until such time as the assets are substantially ready for their intended use or sale.
Investment income earned on the temporary investment of specific borrowings pending their expenditure on qualifying assets is deducted from the borrowing costs eligible for capitalisation.
All other borrowing costs are recognised in profit or loss in the period during which they are incurred.
3.11 Property, plant and equipmentProperty, plant and equipment are stated at historical cost less accumulated depreciation and accumulated impairment loss. Historical cost includes expenditure that is directly attributable to the acquisition of the asset.
Subsequent costs are included in the asset’s carrying amount or recognised as a separate asset, as appropriate, only when it is probable that future economic benefits associated with the item will flow to the Group and the cost of the item can be measured reliably. All other repairs and maintenance expenses are charged to the profit or loss in the period in which they are incurred.
Depreciation is calculated using the straight-line method to allocate the assets’ cost to their residual values over their estimated useful lives as follows:
Years
Buildings 20 – 30
Labour camps 5
Furniture and fixtures 5
Office equipment 3 – 5
Computers 3
Motor vehicles 4
Leasehold improvements 3 – 4
Freehold land is not depreciated.
Assets held under finance leases are depreciated over the shorter of their expected useful lives or the term of the relevant lease.
The estimated useful lives, residual values and depreciation method are reviewed at each year end, with the effect of any changes in estimate accounted for on a prospective basis.
An asset’s carrying amount is written down immediately to its recoverable amount if the asset’s carrying amount is greater than its estimated recoverable amount.
The gain or loss arising on the disposal or retirement of an item of property, plant and equipment is determined as the difference between the sales proceeds and the carrying amount of the asset and is recognised in the profit or loss.
3.12 Capital work in progressProperties or assets in the course of construction for production, supply or administrative purposes, or for purposes not yet determined, are carried at cost, less any recognised impairment loss. Cost includes all direct costs attributable to the design and construction of the property including related staff costs, and for qualifying assets, borrowing costs capitalised in accordance with the Group’s accounting policy. When the assets are ready for intended use, the capital work in progress is transferred to the appropriate property, plant and equipment category and is depreciated in accordance with the Group’s policies.
NOTES TO THE CONSOLIDATED FINANCIAL STATEMENTSFOR THE YEAR ENDED 31 DECEMBER 2014 (CONTINUED)
32 Aldar Annual Report 2014
FINANCIAL STATEMENTS

3 Summary of significant accounting policies (continued) 3.13 Investment property Investment property comprises completed properties and properties under development. Completed properties are properties held to earn rentals and/or for capital appreciation and properties under development are properties being constructed or developed for future use as investment property.
Investment property is measured initially at cost including transaction costs and for properties under development all direct costs attributable to the design and construction including related staff costs. Subsequent to initial recognition, investment property is measured at fair value. Gains or losses arising from changes in the fair value of investment property are included in the profit or loss in the period in which they arise.
Upon completion of construction or development, a property is transferred from properties under development to completed properties.
3.14 Development work in progressDevelopment work in progress consists of property being developed principally for sale and is stated at the lower of cost or net realisable value. Cost comprises all direct costs attributable to the design and construction of the property including direct staff costs. Net realisable value is the estimated selling price in the ordinary course of the business less estimated costs to complete and applicable variable selling expenses.
3.15 InventoriesInventories comprise completed properties held for sale in the ordinary course of business and other operating inventories. Inventories are stated at the lower of cost and net realisable value. Cost is calculated using the weighted average cost method and comprises construction/acquisition costs and other charges incurred in bringing inventory to its present location and condition. Net realisable value represents the estimated selling price less all estimated selling and marketing costs to be incurred.
3.16 Land held for resaleLand held for resale is stated at the lower of cost and net realisable value. Costs include the cost of land acquired and all direct costs attributable to the infrastructure works of the land. Net realisable value represents the estimated selling price of the land less all estimated costs necessary to make the sale.
3.17 Intangible assetsIntangible assets acquired separately are reported at cost less accumulated amortisation and accumulated impairment losses. Amortisation is charged on a straight-line basis over their estimated useful lives. The estimated useful lives are reviewed at the end of each annual reporting period, with effect of any changes in estimate being accounted for on a prospective basis.
Computer softwareAcquired computer software licences are capitalised on the basis of the costs incurred to acquire and bring to use the specific software. These costs are amortised on a straight-line basis over their estimated useful lives which is normally a period of three to five years.
LicensesAcquired licenses are shown at historical cost. Licenses have a finite useful life and are carried at cost less accumulated amortisation. Amortisation is calculated using the straight-line method to allocate the cost of licenses over their estimated useful lives.
3.18 Impairment of tangible and intangible assets excluding goodwill At the end of each reporting period, the Group reviews the carrying amounts of its tangible and intangible assets to determine whether there is any indication that those assets have suffered an impairment loss. If any such indication exists, the recoverable amount of the asset is estimated in order to determine the extent of the impairment loss (if any). Where it is not possible to estimate the recoverable amount of an individual asset, the Group estimates the recoverable amount of the cash-generating unit to which the asset belongs. Where a reasonable and consistent basis of allocation can be identified, corporate assets are also allocated to individual cash-generating units, or otherwise they are allocated to the smallest group of cash-generating units for which a reasonable and consistent allocation basis can be identified.
Recoverable amount is the higher of fair value less costs to sell and value in use. In assessing value in use, the estimated future cash flows are discounted to their present value using a discount rate that reflects current market assessments of the time value of money and the risks specific to the asset.
If the recoverable amount of an asset (or cash-generating unit) is estimated to be less than its carrying amount, the carrying amount of the asset (or cash-generating unit) is reduced to its recoverable amount. An impairment loss is recognised immediately in profit or loss, unless the relevant asset is carried at a revalued amount, in which case the impairment loss is treated as a revaluation decrease.
Aldar Annual Report 2014 33

3 Summary of significant accounting policies (continued) 3.18 Impairment of tangible and intangible assets excluding goodwill (continued)Where an impairment loss subsequently reverses, the carrying amount of the asset (or cash-generating unit) is increased to the revised estimate of its recoverable amount, but so that the increased carrying amount does not exceed the carrying amount that would have been determined had no impairment loss been recognised for the asset (or cash-generating unit) in prior years. A reversal of an Summary of significant accounting policies impairment loss is recognised immediately in profit or loss, unless the relevant asset is carried at a revalued amount, in which case the reversal of the impairment loss is treated as a revaluation increase.
Provisions are recognised when the Group has a legal or constructive obligation as a result of a past event, it is probable that an outflow of resources will be required to settle the obligation, and the amount can be reliably estimated.
3.19 ProvisionsWhen some or all of the economic benefits required to settle a provision are expected to be recovered from a third party, a receivable is recognised as an asset if it is virtually certain that reimbursement will be received and the amount of receivable can be measured reliably.
Provisions are measured at the present value of the expenditures expected to be required to settle the obligation at the end of the reporting period, using a rate that reflects current market assessments of the time value of money and the risks specific to the obligation.
Onerous contractsPresent obligations arising under onerous contracts are recognised and measured as provisions. An onerous contract is considered to exist where the Group has a contract under which the unavoidable costs of meeting the obligations under the contract exceed the economic benefits expected to be received from the contract.
3.20 Employee benefitsAn accrual is made for the estimated liability for employees’ entitlement to annual leave and leave passage as a result of services rendered by eligible employees up to the end of the year.
Provision is also made for the full amount of end of service benefit due to non-UAE national employees in accordance with the UAE Labour Law, for their period of service up to the end of the year. The accrual relating to annual leave and leave passage is disclosed as a current liability, while the provision relating to end of service benefit is disclosed as a non-current liability.
Pension contributions are made in respect of UAE national employees to the UAE General Pension and Social Security Authority in accordance with the UAE Federal Law No. (2), 2000 for Pension and Social Security. Such contributions are charged to the profit or loss during the employees’ period of service.
3.21 Government grantsGovernment grants are not recognised until there is reasonable assurance that the Group will comply with the conditions attaching to them and that the grants will be received.
Government grants are recognised in profit or loss on a systematic basis over the periods in which the Group recognises as expenses the related costs for which the grants are intended to compensate. Specifically, government grants whose primary condition is that the Group should purchase, construct or otherwise acquire non-monetary assets are recognised as deferred government grant in the statement of financial position and transferred to profit or loss on a systematic and rational basis over the useful lives of the related assets.
Government grants that are receivable as compensation for expenses already incurred or for the purpose of giving immediate financial support to the group with no future related costs are recognised in profit or loss in the period in which they become receivable.
The benefit of a government loan at a below-market rate of interest is treated as a government grant, measured as the difference between proceeds received and the fair value of the loan based on prevailing market interest rates.
Land granted by the Government of Abu Dhabi is recognised at nominal value where there is reasonable assurance that the land will be received and the Group will comply with any attached conditions, where applicable.
3.22 Financial assetsFinancial assets are classified into the following specified categories: ‘available-for-sale’ (AFS) financial assets and ‘loans and receivables’. The classification depends on the nature and purpose of the financial assets and is determined at the time of initial recognition. Loans and receivable include cash and bank balances, trade and other receivables, amounts due from related parties and loans and advances to third parties.
Cash and cash equivalentsCash and cash equivalents include cash on hand and deposits held with banks (excluding deposits held under lien) with original maturities of three months or less.
NOTES TO THE CONSOLIDATED FINANCIAL STATEMENTSFOR THE YEAR ENDED 31 DECEMBER 2014 (CONTINUED)
34 Aldar Annual Report 2014
FINANCIAL STATEMENTS

3 Summary of significant accounting policies (continued) 3.22 Financial assets (continued)AFS financial assetsInvestments are recognised and derecognised on a trade date basis where the purchase or sale of an investment is under a contract whose terms require delivery of the investment within the timeframe established by the market concerned, and are initially measured at fair value, plus directly attributable transaction costs.
AFS investments are measured at subsequent reporting dates at fair value unless the latter cannot be reliably measured. Gains and losses arising from changes in fair value are recognised in other comprehensive income and accumulated in the investment revaluation reserve in equity, with the exception of impairment losses, interest calculated using effective interest method and foreign exchange gains and losses on monetary assets, which are recognised in profit or loss.
Where the AFS investment is disposed of or is determined to be impaired, at which time the cumulative gains or losses previously accumulated in the investment revaluation reserve is reclassified to the profit or loss.
Dividends on AFS equity instruments are recognised in profit or loss when the Group’s right to receive the dividends is established.
Loans and receivablesLoans and receivables are non-derivative financial assets with fixed or determinable payments that are not quoted in an active market. Loans and receivables are measured at amortised cost, less any impairment. Interest income is recognised by applying the effective interest rate, except for short-term receivables when the recognition of interest would be immaterial.
Impairment of financial assetsFinancial assets are assessed for indicators of impairment at the end of each reporting period. Financial assets are considered to be impaired when there is objective evidence that, as a result of past event, the estimated future cash flows of the investment have been affected.
For unquoted shares classified as AFS at cost, objective evidence of impairment could include:
• significant financial difficulty of the issuer or counterparty; or• default or delinquency in interest or principal payments; or• it becoming probable that the counterparty will enter bankruptcy or financial re-organisation.
For certain categories of financial assets, such as trade receivables, assets that are assessed not to be impaired individually are assessed for impairment on a collective basis. Objective evidence of impairment for a portfolio of receivables could include the Group’s past experience of collecting payments, an increase in the number of delayed payments in the portfolio past the average credit period, as well as observable changes in national or local economic conditions that correlate with default on receivables.
For financial assets carried at amortised cost, the amount of the impairment is the difference between the asset’s carrying amount and the present value of estimated future cash flows, discounted at the financial asset’s original effective interest rate.
The carrying amount of the financial asset is reduced by the impairment loss directly for all financial assets with the exception of trade receivables, where the carrying amount is reduced through the use of an allowance account. When a trade receivable is considered uncollectible, it is written off against the allowance account. Subsequent recoveries of amounts previously written off are credited against the allowance account. Changes in the carrying amount of the allowance account are recognised in profit or loss.
With the exception of AFS equity instruments, if, in a subsequent period, the amount of the impairment loss decreases and the decrease can be related objectively to an event occurring after the impairment was recognised, the previously recognised impairment loss is reversed through profit or loss to the extent that the carrying amount of the investment at the date the impairment is reversed does not exceed what the amortised cost would have been had the impairment not been recognised.
In respect of AFS equity securities, impairment losses previously recognised through profit or loss are not reversed through profit or loss. Any increase in fair value subsequent to an impairment loss is recognised directly in other comprehensive income.
Derecognition of financial assetsThe Group derecognises a financial asset only when the contractual rights to the cash flows from the asset expire; or it transfers the financial asset and substantially all the risks and rewards of ownership of the asset to another entity. If the Group neither transfers nor retains substantially all the risks and rewards of ownership and continues to control the transferred asset, the Group recognises its retained interest in the asset and an associated liability for amounts it may have to pay. If the Group retains substantially all the risks and rewards of ownership of a transferred financial asset, the Group continues to recognise the financial asset.
Aldar Annual Report 2014 35

3 Summary of significant accounting policies (continued) 3.23 Financial liabilities and equity instruments issued by the GroupClassification as debt or equityDebt and equity instruments are classified as either financial liabilities or as equity in accordance with the substance of the contractual arrangement.
Equity instrumentsAn equity instrument is any contract that evidences a residual interest in the assets of an entity after deducting all of its liabilities. Equity instruments issued by the Group are recorded at the proceeds received, net of direct issue costs.
Other financial liabilitiesOther financial liabilities, including borrowings, are initially measured at fair value, net of transaction costs.
Other financial liabilities are subsequently measured at amortised cost using the effective interest method, with interest expense recognised on an effective yield basis, except for short-term payables when recognition of interest would be immaterial.
The effective interest method is a method of calculating the amortised cost of a financial liability and of allocating interest expense over the relevant period. The effective interest rate is the rate that exactly discounts estimated future cash payments through the expected life of the financial liability, or, where appropriate, a shorter period.
Derecognition of financial liabilitiesThe Group derecognises financial liabilities when, and only when, the Group’s obligations are discharged, cancelled or they expire.
3.24 Derivative financial instrumentsThe Group enters into derivative financial instruments to manage its exposure to interest rate risk, including interest rate swaps.
Derivative financial instruments are initially measured at fair value at contract date, and are subsequently re-measured at fair value at the end of each reporting period. All derivatives are carried at their fair values as assets where the fair values are positive and as liabilities where the fair values are negative. A derivative is presented as a non-current asset or a non-current liability if the remaining maturity of the instrument is more than 12 months and it is not expected to be realised or settled within 12 months. Other derivatives are presented as current assets or current liabilities.
Fair values of the derivatives are carried out by independent valuers by reference to quoted market prices, discounted cash flow models and recognised pricing models as appropriate.
Changes in the fair value of derivative financial instruments that do not qualify for hedge accounting are recognised in profit or loss as they arise. Derivative financial instruments that do not qualify for hedge accounting are classified as held for trading derivatives.
For the purpose of hedge accounting, the Group designates certain derivatives into two types of hedge categories: (a) fair value hedges which hedge the exposure to changes in the fair value of a recognised asset or liability; and (b) cash flow hedges which hedge exposure to variability in cash flows that are either attributable to a particular risk associated with a recognised asset or liability, or a highly probable forecasted transaction that will affect future reported net income.
Hedge accountingIn order to qualify for hedge accounting, it is required that the hedge should be expected to be highly effective, i.e. the changes in fair value or cash flows of the hedging instrument should effectively offset corresponding changes in the hedged item and the effectiveness can be reliably measured. At inception of the hedge, the Group documents its risk management objective and strategy for undertaking various hedge transactions, including the identification of the hedging instrument, the related hedged item, the nature of risk being hedged, and how the Group will assess the effectiveness of the hedging relationship. Subsequently, the hedge is required to be assessed and determined to be an effective hedge on an ongoing basis.
Note 33.5(b) sets out details of the fair values of the derivative instruments used for hedging purposes. Movements in the hedging reserve in equity are also detailed in the consolidated statement of changes in equity.
Fair value hedgesChanges in the fair value of derivatives that are designated and qualify as fair value hedges are recorded in profit or loss immediately, together with any changes in the fair value of the hedged item that are attributable to the hedged risk.
Hedge accounting is discontinued when the Group revokes the hedging relationship, the hedging instrument expires or is sold, terminated, or exercised, or no longer qualifies for hedge accounting. The adjustment to the carrying amount of the hedged item arising from the hedged risk is amortised to the profit of loss from that date.
NOTES TO THE CONSOLIDATED FINANCIAL STATEMENTSFOR THE YEAR ENDED 31 DECEMBER 2014 (CONTINUED)
36 Aldar Annual Report 2014
FINANCIAL STATEMENTS

3 Summary of significant accounting policies (continued) 3.24 Derivative financial instruments (continued)Cash flow hedgesThe effective portion of changes in the fair value of derivatives that are designated and qualify as cash flow hedges is recognised in other comprehensive income. The gain or loss relating to the ineffective portion is recognised immediately in profit or loss.
Amounts previously recognised in other comprehensive income and accumulated in hedging reserve in equity are recycled in profit or loss in the periods when the hedged item is recognised in profit or loss, in the same line of the profit or loss as the recognised hedged item. However, when the forecast transaction that is hedged results in the recognition of a non-financial asset or a non-financial liability, the gains and losses previously accumulated in equity are transferred from equity and included in the initial measurement of the cost of the asset or liability.
Hedge accounting is discontinued when the Group revokes the hedging relationship, the hedging instrument expires or is sold, terminated, or exercised, or no longer qualifies for hedge accounting. Any cumulative gain or loss accumulated in equity at that time remains in equity and is recognised when the forecast transaction is ultimately recognised in profit or loss. When a forecast transaction is no longer expected to occur, the cumulative gain or loss that was deferred in equity is recognised immediately in profit or loss.
4 Critical accounting judgments and key sources of estimation uncertainty While applying the accounting policies as stated in Note 3, management of the Group has made certain judgments, estimates and assumptions that are not readily apparent from other sources. The estimates and associated assumptions are based on historical experience and other factors that are considered to be relevant. Actual results may differ from these estimates.
The estimates and underlying assumptions are reviewed on an ongoing basis. Revision to accounting estimates are recognised in the period of the revision in which the estimate is revised if the revision affects only that period, or in the period of the revision and future periods if the revision affects both current and future periods.
4.1 Critical judgments in applying accounting policiesSignificant judgments made by management that have a significant risk of causing a material adjustment to the carrying amounts of assets and liabilities within the next financial year are:
Classification of leasesThe Group, as a lessor, has entered into long-term lease arrangements for plots of land with entities outside the Gulf Cooperation Council (non-GCC entities) whereby the lease term under each lease is valid for a period of 99 years renewable at the option of the lessees for an indefinite duration.
In the process of determining whether these arrangements represent operating leases or finance leases, the Group’s management has made various judgments. In making its judgments, the Group’s management considered the terms and conditions of the lease agreements and the requirements of IAS 17 Leases, including the Basis for Conclusions on IAS 17 provided by the International Accounting Standards Board and related guidance, to determine whether significant risks and rewards associated with the land in accordance with each lease term would have been transferred to the lessees despite there being no transfers of title. The Group evaluated the transfer of risks and rewards before and after entering into the lease arrangements, and has obtained a legal opinion from independent legal advisors. Management has determined that in the lease arrangements referred to above, the Group transferred substantially all risks and rewards of ownership to the lessees with practical ability for the lessees to exercise unilaterally all rights on the plots of land. Accordingly, management is satisfied that these arrangements represent finance leases.
Classification of propertiesIn the process of classifying properties, management has made various judgments. Judgment is needed to determine whether a property qualifies as an investment property, property, plant and equipment and/or property held for resale. The Group develops criteria so that it can exercise that judgment consistently in accordance with the definitions of investment property, property, plant and equipment and property held for resale. In making its judgment, management considered the detailed criteria and related guidance for the classification of properties as set out in IAS 2, IAS 16 and IAS 40, and in particular, the intended usage of property as determined by the management.
Aldar Annual Report 2014 37

4 Critical accounting judgments and key sources of estimation uncertainty (continued)4.2 Key sources of estimation uncertaintyThe key assumptions concerning the future, and other key sources of estimation uncertainty at the end of the reporting period, that have a significant risk of causing a material adjustment to the carrying amounts of assets and liabilities within the next financial year, are discussed below:
Estimation of total costs of construction contracts As described in Note 3, when the outcome of a construction contract can be estimated reliably, revenues and costs are recognised by reference to stage of completion of the contract activity at the end of the reporting period. In judging whether the outcome of the construction contract can be estimated reliably, management has considered the detailed criterion for determination of such outcome as set out in IAS 11 Construction Contracts. For the purpose of estimating the stage of completion of contract activity, management has considered the forecasts for revenue and costs related to each construction contract. When it is estimated that total contract costs will exceed total contract revenue, the expected loss is recognised as an expense immediately. The management has considered the costs to be incurred based on analysis and forecast of construction work to be executed.
Fair value of investment properties and investment properties under development The fair value of investment properties is determined by independent real estate valuation experts using recognised valuation methods. These methods comprise the Residual Value Method, and the Income Capitalisation Method.
The Residual Value Method requires the use of estimates such as future cash flows from assets (comprising of selling and leasing rates, future revenue streams, construction costs and associated professional fees, and financing cost, etc.), targeted internal rate of return and developer’s risk and targeted profit. These estimates are based on local market conditions existing at the end of the reporting period.
Under the Income Capitalisation Approach, the income receivable under existing lease agreements and projected future rental streams are capitalised at appropriate rates to reflect the investment market conditions at the valuation dates.
Such estimations are based on certain assumptions, which are subject to uncertainty and might materially differ from the actual results.
The continuing volatility in the global financial system and in the real estate industry has contributed to the significant reduction in transaction volumes in the UAE. Therefore, in arriving at their estimates of market values as at 31 December 2014, the valuers have used their market knowledge and professional judgement and have not only relied solely on historic transactional comparables. In these circumstances, there is greater degree of uncertainty than which exists in a more active market in estimating market values of investment property.
The key assumptions used are as follows:
Range %
Targeted internal rate of return 11 – 15
Rental yield 8 – 11
Estimation of net realisable value for inventory and development work in progress Properties held for resale and properties classified under development work in progress are stated at lower of cost or net realisable value (NRV). NRV is assessed with reference to sales prices, costs of completion and advances received and market conditions existing at the end of the reporting period. For certain properties, NRV is determined by the Group having taken suitable external advice and in the light of recent market transactions, where available.
Impairment of property, plant and equipment and capital work in progress Properties classified under property, plant and equipment and capital work in progress are assessed for impairment based on the assessment of cash flows on individual cash-generating units when there is an indication that those assets have suffered an impairment loss. Cash flows are determined with reference to recent market conditions, prices existing at the end of the reporting period, contractual agreements and estimations over the useful lives of the assets and discounted using a range of discounting rates that reflects current market assessments of the time value of money and the risks specific to the asset. The net present values are compared to the carrying amounts to assess any probable impairment.
Useful lives of property, plant and equipment and intangible assetsManagement reviews the residual values and estimated useful lives of property, plant and equipment and intangible assets at the end of each annual reporting period in accordance with IAS 16 and IAS 38. Management determined that current year expectations do not differ from previous estimates based on its review.
NOTES TO THE CONSOLIDATED FINANCIAL STATEMENTSFOR THE YEAR ENDED 31 DECEMBER 2014 (CONTINUED)
38 Aldar Annual Report 2014
FINANCIAL STATEMENTS

4 Critical accounting judgments and key sources of estimation uncertainty (continued)4.2 Key sources of estimation uncertainty (continued)Valuation of unquoted AFS equity investments Valuation of unquoted AFS equity investments is normally based on recent market transactions on an arm’s length basis, fair value of another instrument that is substantially the same, expected cash flows discounted at current rates for similar instruments or other valuation models.
Impairment of investments in/receivable from joint ventures and associates Management regularly reviews its investments in joint ventures and associates for indicators of impairment. This determination of whether investments in joint ventures and associates are impaired, entails Management’s evaluation of the specific investee’s profitability, liquidity, solvency and ability to generate operating cash flows from the date of acquisition and until the foreseeable future. The difference between the estimated recoverable amount and the carrying value of investment and/or receivable is recognised as an expense in profit or loss. Management is satisfied that no additional impairment is required on its investments in associates and joint ventures (Note 8) and it’s receivables from associates and joint ventures (Note 10.5) in excess of amount already provided.
Impairment of trade and other receivablesAn estimate of the collectible amount of trade and other receivables is made when collection of the full amount is no longer probable. This determination of whether the receivables are impaired, entails Management’s evaluation of the specific credit and liquidity position of the customers and related parties and their historical recovery rates, including discussion with the legal department and review of the current economic environment. Management is satisfied that no additional impairment is required on its trade and other receivables in excess of amount already provided (Note 10.1).
Derivative financial instruments The fair values of derivative financial instruments measured at fair value are generally obtained by reference to quoted market prices, discounted cash flow models and recognised pricing models as appropriate.
Aldar Annual Report 2014 39

5 Property, plant and equipment
Land andbuildingsAED’000
Labour camps
AED’000
Furnitureand fixtures
AED’000
Officeequipment
AED’000Computers
AED’000
MotorvehiclesAED’000
Leaseholdimprove-
mentsAED’000
Capitalwork
in progressAED’000
TotalAED’000
Cost1 January 2013 5,807,132 1,502,474 405,755 47,037 70,468 4,586 11,656 474,480 8,323,588Additions 1,437 2,230 9,451 6,314 3,441 2,321 – 12,233 37,427Acquired under business combination 150,845 – 156,252 1,135 6,984 270 1,949 1,586 319,021Disposals – – (32,300) – – (1,781) – – (34,081)
1 January 2014 5,959,414 1,504,704 539,158 54,486 80,893 5,396 13,605 488,299 8,645,955Additions 3,109 3,519 20,003 8,009 8,413 370 40 6,658 50,121Transfer from investment properties (Note 7) 93,556 – – – – – – – 93,556Transfers, net (86,431) 424,299 – – – – – (467,280) (129,412)Disposals – – (912) – – – – – (912)
31 December 2014 5,969,648 1,932,522 558,249 62,495 89,306 5,766 13,645 27,677 8,659,308
Accumulated depreciation and impairment1 January 2013 2,461,416 1,369,549 285,432 31,633 62,380 3,199 10,467 467,280 4,691,356Charge for the year 164,169 70,451 63,922 8,531 5,287 1,095 214 – 313,669Acquired under business combination 56,739 – 116,860 880 5,110 270 733 – 180,592Impairment 235,175 – – – – – – – 235,175Disposals – – (30,008) – – (1,638) – – (31,646)
1 January 2014 2,917,499 1,440,000 436,206 41,044 72,777 2,926 11,414 467,280 5,389,146Charge for the year 130,447 27,120 60,314 8,719 6,661 812 237 – 234,310(Reversal of impairment)/impairment (150,601) – – 278 – – – – (150,323)Transfers, net 30,050 424,299 – – – – – (467,280) (12,931)Disposals – – (760) – – – – – (760)
31 December 2014 2,927,395 1,891,419 495,760 50,041 79,438 3,738 11,651 – 5,459,442
Carrying amount 31 December 2014 3,042,253 41,103 62,489 12,454 9,868 2,028 1,994 27,677 3,199,866
31 December 2013 3,041,915 64,704 102,952 13,442 8,116 2,470 2,191 21,019 3,256,809
All of the Group’s property, plant and equipment are located in the United Arab Emirates.
NOTES TO THE CONSOLIDATED FINANCIAL STATEMENTSFOR THE YEAR ENDED 31 DECEMBER 2014 (CONTINUED)
40 Aldar Annual Report 2014
FINANCIAL STATEMENTS

5 Property, plant and equipment (continued)The depreciation charge for the year has been allocated as follows:
2014AED’000
2013AED’000
Cost of sales 9,106 6,222General and administrative expenses 225,204 307,447
234,310 313,669
During the year, the Group carried out a review of recoverable amounts of its property, plant and equipment. The review led to a reversal of impairment of AED 150 million (2013: impairment loss of AED 235 million) (Note 25), which has been recorded in the consolidated income statement. The recoverable amount of relevant assets has been determined on the basis of their value in use by reference to the discounted cash flow method using yield of 8% to 8.5% and discount rate of 11% to 11.5% (2013: 8.25% to 8.75% and 11%).
6 Intangible assets
LicensesAED’000
ComputerSoftwareAED’000
TotalAED’000
Cost1 January 2013 1,430 64,575 66,005Additions – 1,062 1,062Acquired under business combination – 975 975
1 January 2014 1,430 66,612 68,042Additions – 5,914 5,914Write-off (1,430) – (1,430)
31 December 2014 – 72,526 72,526
Accumulated amortisation1 January 2013 12 62,976 62,988Charge for the year – 1,741 1,741Acquired under business combination – 600 600
1 January 2014 12 65,317 65,329Charge for the year – 2,466 2,466Write-off (12) – (12)
31 December 2014 – 67,783 67,783
Carrying amount 31 December 2014 – 4,743 4,743
31 December 2013 1,418 1,295 2,713
Aldar Annual Report 2014 41
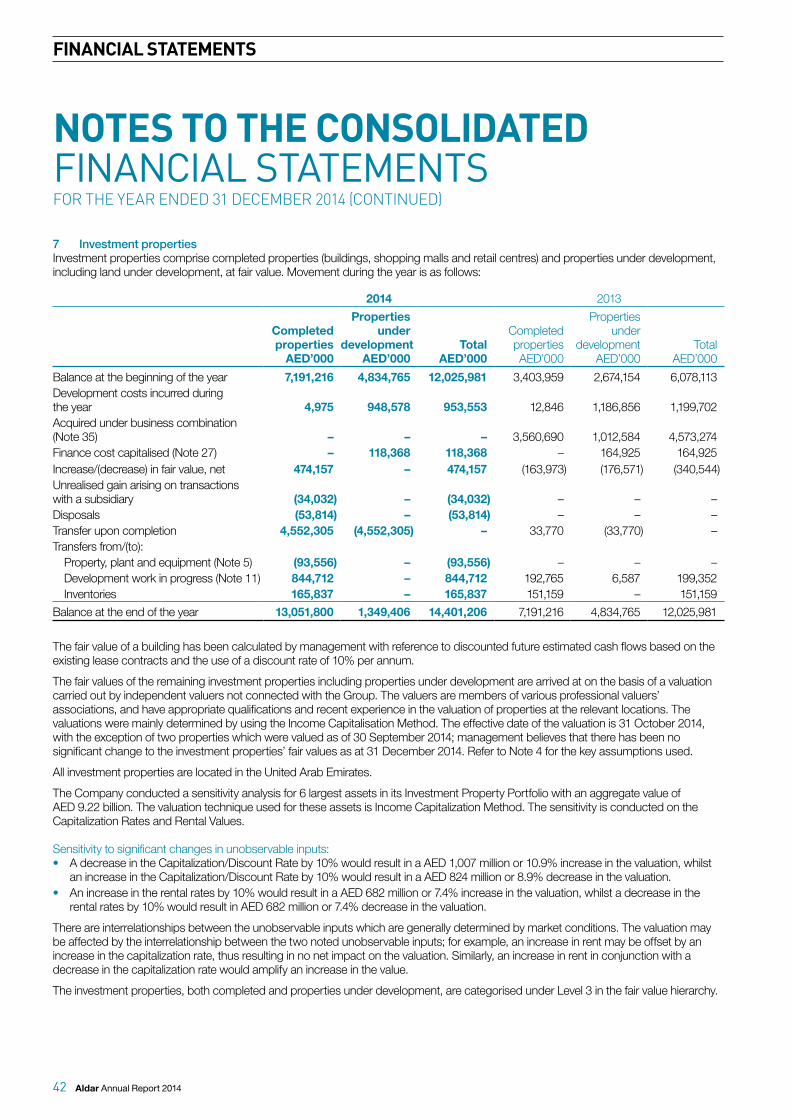
7 Investment propertiesInvestment properties comprise completed properties (buildings, shopping malls and retail centres) and properties under development, including land under development, at fair value. Movement during the year is as follows:
2014 2013
Completedproperties
AED’000
Propertiesunder
developmentAED’000
TotalAED’000
CompletedpropertiesAED’000
Propertiesunder
developmentAED’000
TotalAED’000
Balance at the beginning of the year 7,191,216 4,834,765 12,025,981 3,403,959 2,674,154 6,078,113Development costs incurred during the year 4,975 948,578 953,553 12,846 1,186,856 1,199,702Acquired under business combination (Note 35) – – – 3,560,690 1,012,584 4,573,274Finance cost capitalised (Note 27) – 118,368 118,368 – 164,925 164,925Increase/(decrease) in fair value, net 474,157 – 474,157 (163,973) (176,571) (340,544)Unrealised gain arising on transactions with a subsidiary (34,032) – (34,032) – – –Disposals (53,814) – (53,814) – – –Transfer upon completion 4,552,305 (4,552,305) – 33,770 (33,770) –Transfers from/(to):
Property, plant and equipment (Note 5) (93,556) – (93,556) – – –Development work in progress (Note 11) 844,712 – 844,712 192,765 6,587 199,352Inventories 165,837 – 165,837 151,159 – 151,159
Balance at the end of the year 13,051,800 1,349,406 14,401,206 7,191,216 4,834,765 12,025,981
The fair value of a building has been calculated by management with reference to discounted future estimated cash flows based on the existing lease contracts and the use of a discount rate of 10% per annum.
The fair values of the remaining investment properties including properties under development are arrived at on the basis of a valuation carried out by independent valuers not connected with the Group. The valuers are members of various professional valuers’ associations, and have appropriate qualifications and recent experience in the valuation of properties at the relevant locations. The valuations were mainly determined by using the Income Capitalisation Method. The effective date of the valuation is 31 October 2014, with the exception of two properties which were valued as of 30 September 2014; management believes that there has been no significant change to the investment properties’ fair values as at 31 December 2014. Refer to Note 4 for the key assumptions used.
All investment properties are located in the United Arab Emirates.
The Company conducted a sensitivity analysis for 6 largest assets in its Investment Property Portfolio with an aggregate value of AED 9.22 billion. The valuation technique used for these assets is Income Capitalization Method. The sensitivity is conducted on the Capitalization Rates and Rental Values.
Sensitivity to significant changes in unobservable inputs:• A decrease in the Capitalization/Discount Rate by 10% would result in a AED 1,007 million or 10.9% increase in the valuation, whilst
an increase in the Capitalization/Discount Rate by 10% would result in a AED 824 million or 8.9% decrease in the valuation.• An increase in the rental rates by 10% would result in a AED 682 million or 7.4% increase in the valuation, whilst a decrease in the
rental rates by 10% would result in AED 682 million or 7.4% decrease in the valuation.
There are interrelationships between the unobservable inputs which are generally determined by market conditions. The valuation may be affected by the interrelationship between the two noted unobservable inputs; for example, an increase in rent may be offset by an increase in the capitalization rate, thus resulting in no net impact on the valuation. Similarly, an increase in rent in conjunction with a decrease in the capitalization rate would amplify an increase in the value.
The investment properties, both completed and properties under development, are categorised under Level 3 in the fair value hierarchy.
NOTES TO THE CONSOLIDATED FINANCIAL STATEMENTSFOR THE YEAR ENDED 31 DECEMBER 2014 (CONTINUED)
42 Aldar Annual Report 2014
FINANCIAL STATEMENTS
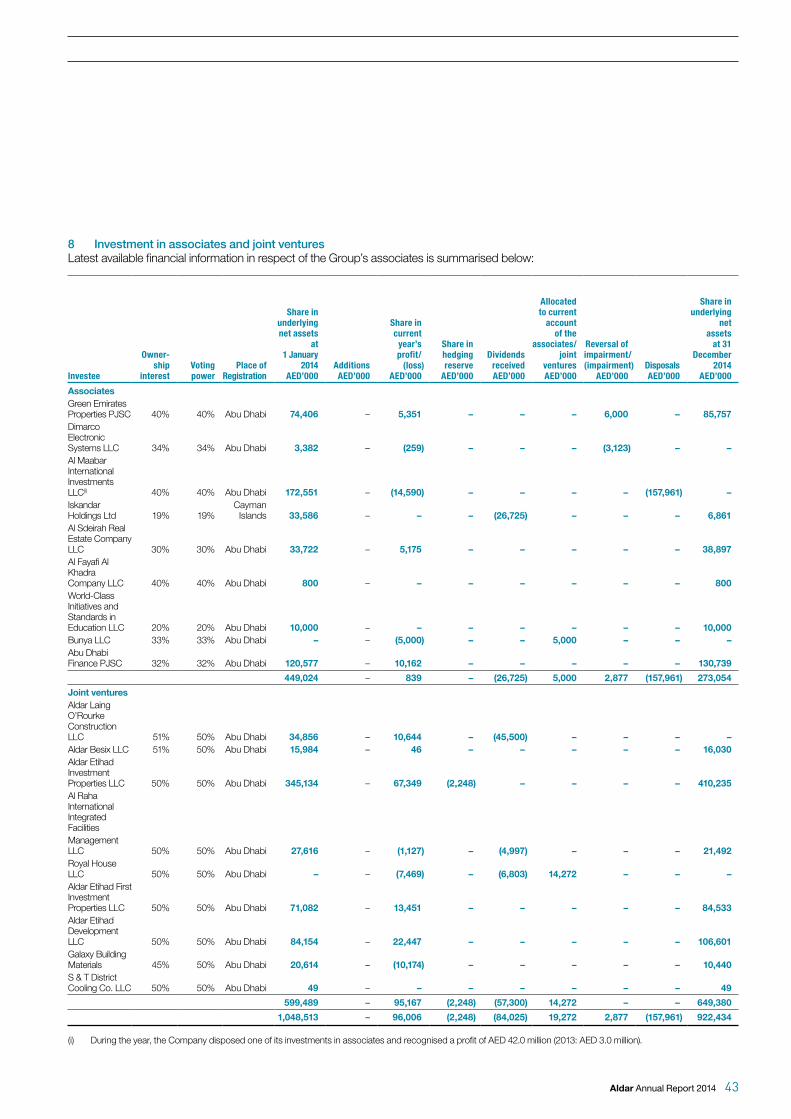
8 Investment in associates and joint venturesLatest available financial information in respect of the Group’s associates is summarised below:
Investee
Owner-ship
interestVotingpower
Place ofRegistration
Share inunderlyingnet assets
at1 January
2014AED’000
AdditionsAED’000
Share incurrent
year’sprofit/
(loss)AED’000
Share inhedgingreserve
AED’000
DividendsreceivedAED’000
Allocated to current
account of the
associates/joint
venturesAED’000
Reversal ofimpairment/(impairment)
AED’000DisposalsAED’000
Share inunderlying
netassets
at 31December
2014 AED’000
AssociatesGreen Emirates Properties PJSC 40% 40% Abu Dhabi 74,406 – 5,351 – – – 6,000 – 85,757Dimarco Electronic Systems LLC 34% 34% Abu Dhabi 3,382 – (259) – – – (3,123) – –Al Maabar International Investments LLC(i) 40% 40% Abu Dhabi 172,551 – (14,590) – – – – (157,961) –Iskandar Holdings Ltd 19% 19%
CaymanIslands 33,586 – – – (26,725) – – – 6,861
Al Sdeirah Real Estate Company LLC 30% 30% Abu Dhabi 33,722 – 5,175 – – – – – 38,897Al Fayafi Al Khadra Company LLC 40% 40% Abu Dhabi 800 – – – – – – – 800World-Class Initiatives and Standards in Education LLC 20% 20% Abu Dhabi 10,000 – – – – – – – 10,000Bunya LLC 33% 33% Abu Dhabi – – (5,000) – – 5,000 – – –Abu Dhabi Finance PJSC 32% 32% Abu Dhabi 120,577 – 10,162 – – – – – 130,739
449,024 – 839 – (26,725) 5,000 2,877 (157,961) 273,054
Joint venturesAldar Laing O’Rourke Construction LLC 51% 50% Abu Dhabi 34,856 – 10,644 – (45,500) – – – –Aldar Besix LLC 51% 50% Abu Dhabi 15,984 – 46 – – – – – 16,030Aldar Etihad Investment Properties LLC 50% 50% Abu Dhabi 345,134 – 67,349 (2,248) – – – – 410,235Al Raha International Integrated Facilities Management LLC 50% 50% Abu Dhabi 27,616 – (1,127) – (4,997) – – – 21,492Royal House LLC 50% 50% Abu Dhabi – – (7,469) – (6,803) 14,272 – – –Aldar Etihad First Investment Properties LLC 50% 50% Abu Dhabi 71,082 – 13,451 – – – – – 84,533Aldar Etihad Development LLC 50% 50% Abu Dhabi 84,154 – 22,447 – – – – – 106,601Galaxy Building Materials 45% 50% Abu Dhabi 20,614 – (10,174) – – – – – 10,440S & T District Cooling Co. LLC 50% 50% Abu Dhabi 49 – – – – – – – 49
599,489 – 95,167 (2,248) (57,300) 14,272 – – 649,380
1,048,513 – 96,006 (2,248) (84,025) 19,272 2,877 (157,961) 922,434
(i) During the year, the Company disposed one of its investments in associates and recognised a profit of AED 42.0 million (2013: AED 3.0 million).
Aldar Annual Report 2014 43

8 Investment in associates and joint ventures (continued)Latest available financial information in respect of the Group’s associates is summarised below:
2014AED’000
2013AED’000
Total assets 2,849,518 4,871,059Total liabilities (2,072,601) (3,820,624)
Net assets 776,917 1,050,435
Group’s share of net assets of associates 273,054 449,024
Total revenue 168,679 201,488
Total profit/(loss) for the year 9,995 (107,852)
Latest available financial information in respect of the Group’s joint ventures is summarised below:
2014AED’000
2013AED’000
Total assets 2,947,613 2,937,518Total liabilities (1,900,290) (1,932,034)
Net assets 1,047,323 1,005,484
Group’s share of net assets of joint ventures 649,380 599,489
Total revenue 338,735 487,706
Total profit for the year 191,104 198,665
9 Available-for-sale (AFS) financial assets
2014AED’000
2013AED’000
Investment in UAE quoted securities 34,170 11,526Investment in UAE unquoted securities 35,201 45,562Investment in international unquoted securities 38,636 45,554
108,007 102,642
Movement during the year is as follows:
2014AED’000
2013AED’000
Balance at the beginning of the year 102,642 151,461Additions 4,315 14,222Disposals (9,646) –Fair value gain during the year, net 10,696 1,213Acquired under business combination – 95,746Transferred to investments in associates – (160,000)
Balance at the end of the year 108,007 102,642
Subject to the Group’s overall operating strategy, the Group intends to dispose of these investments in the normal course of business if a favourable price is offered.
During the year, dividend income received from AFS financial assets amounted to AED 7.3 million (31 December 2013: AED 4.9 million).
In addition, during the year, one of the investments was publicly listed and commenced trading on the secondary market for private companies of Abu Dhabi Securities Exchange (ADX). Accordingly, this investment has been classified under quoted securities.
NOTES TO THE CONSOLIDATED FINANCIAL STATEMENTSFOR THE YEAR ENDED 31 DECEMBER 2014 (CONTINUED)
44 Aldar Annual Report 2014
FINANCIAL STATEMENTS

10 Trade and other receivables
2014AED’000
2013AED’000
Non-current portionTrade receivables (Note 10.1) 6,935 407,525Less: Provision for impairment and cancellations (6,935) (29,322)
– 378,203Receivable from project finance (Note 10.3) 163,588 490,265Receivable from the Government of Abu Dhabi (Note 10.4) 655,458 2,106,909Due from joint ventures (Notes 10.5) 101,937 112,067Other 14,000 14,000
934,983 3,101,444
Current portionTrade receivables (Note 10.1) 2,518,957 2,592,322Less: Provision for impairment and cancellations (548,842) (564,117)
1,970,115 2,028,205Refundable costs (Note 10.2) 2,107,207 2,785,587Receivable from project finance (Note 10.3) 17,927 101,493Receivable from the Government of Abu Dhabi (Note 10.4) 2,055,347 3,802,512Due from joint ventures (Notes 10.5) 366,020 342,117Gross amount due from customers on construction contracts (Note 10.6) 414,792 141,488Advances and prepayments 1,060,737 617,950Accrued interest 10,148 8,230Other 682,132 460,150
8,684,425 10,287,732
10.1 Trade receivables Trade receivables represent mainly the amounts due from sales of plots of land, properties and revenue from construction contracts. At the end of the year, 55% of the trade receivables (31 December 2013: 40% of the trade receivables) is due from its top five customers. Concentration of credit risk is mitigated due to the fact that the customers have already made instalment payments, in some cases substantial, on the plots, which the Group would contractually be entitled to retain in the event of non-completion of the remaining contractual obligations in order to cover losses incurred by the Group.
Interest is charged at 12% per annum on the outstanding past due amounts from sales of plots and properties. No collateral is taken on trade receivables.
Ageing of trade receivables
2014AED’000
2013AED’000
Not past due 842,823 1,323,682 Not past due but impaired 6,935 29,322Past due but not impaired (more than 180 days) 1,127,292 1,082,726 Past due and impaired (more than 180 days) 548,842 564,117
Total trade receivables 2,525,892 2,999,847
Aldar Annual Report 2014 45

10 Trade and other receivables (continued)Movement during the year in provision for impairment and cancellations in trade receivables is as follows:
2014AED’000
2013AED’000
Balance at the beginning of the year 593,439 114,819Acquired under business combination – 384,139Impairment recognised during the year (Note 25) 28,033 115,718Released upon cancellation of sales (65,695) (21,237)
Balance at the end of the year 555,777 593,439
10.2 Refundable costsRefundable costs represent costs incurred on behalf of the Government of Abu Dhabi in relation with development of infrastructure of various projects and real estate developments. These amounts will be refunded by the relevant Government Authorities upon completion.
10.3 Receivable from project finance
Minimum paymentsPresent value of
minimum payments
2014AED’000
2013AED’000
2014AED’000
2013AED’000
Amounts receivable from project finance:Within one year 21,854 107,525 17,927 101,493In the second to fifth year 76,017 348,715 51,249 245,639After five years 308,963 657,188 112,339 244,626
406,834 1,113,428 181,515 591,758Less: unearned finance income (225,319) (521,670) – –
Present value of minimum payments receivable 181,515 591,758 181,515 591,758
Non-current receivables 163,588 490,265
Current receivables 17,927 101,493
181,515 591,758
During the year, a receivable from project finance amounting to AED 337 million was settled.
10.4 Receivable from the Government of Abu Dhabi Receivable from the Government of Abu Dhabi represents the amount receivable against certain assets sold in 2009 and 2011 and the recognition of land plots handed over.
10.5 Due from joint ventures
Non-current Current
2014AED’000
2013AED’000
2014AED’000
2013AED’000
Gross receivables 169,429 172,005 382,151 358,248Less: Provision for impairment (67,492) (59,938) (16,131) (16,131)
101,937 112,067 366,020 342,117
NOTES TO THE CONSOLIDATED FINANCIAL STATEMENTSFOR THE YEAR ENDED 31 DECEMBER 2014 (CONTINUED)
46 Aldar Annual Report 2014
FINANCIAL STATEMENTS
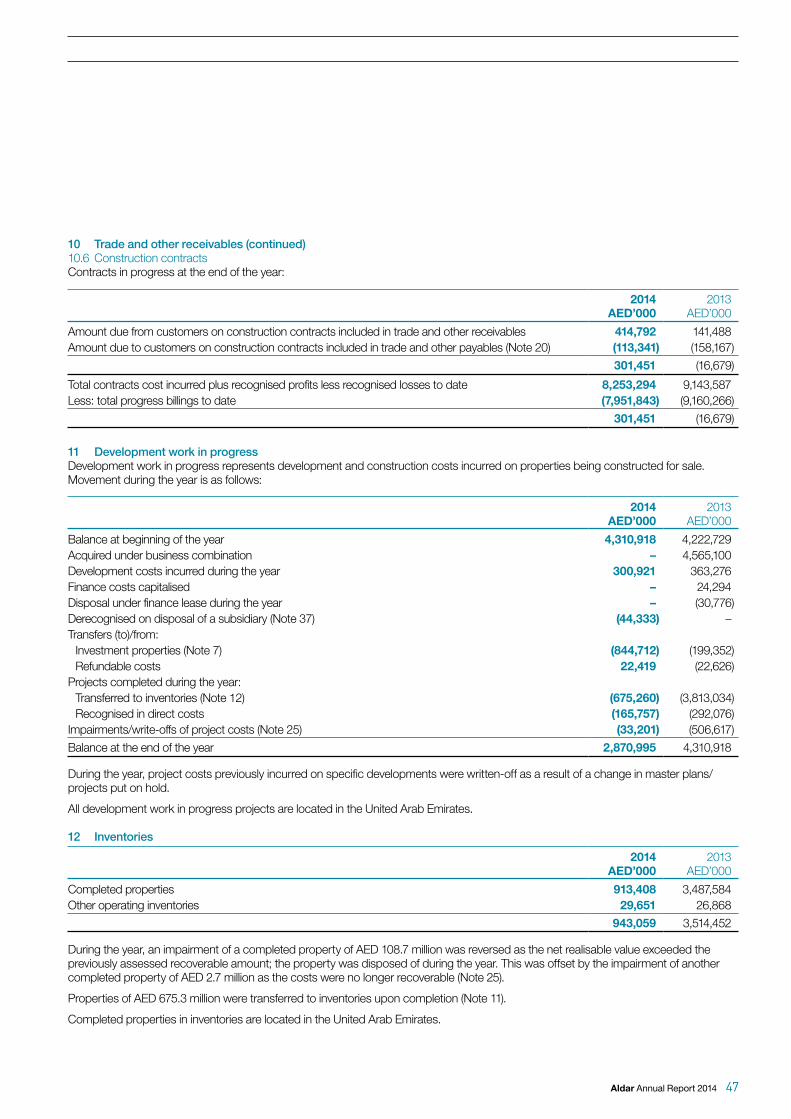
10 Trade and other receivables (continued) 10.6 Construction contractsContracts in progress at the end of the year:
2014 AED’000
2013AED’000
Amount due from customers on construction contracts included in trade and other receivables 414,792 141,488Amount due to customers on construction contracts included in trade and other payables (Note 20) (113,341) (158,167)
301,451 (16,679)
Total contracts cost incurred plus recognised profits less recognised losses to date 8,253,294 9,143,587Less: total progress billings to date (7,951,843) (9,160,266)
301,451 (16,679)
11 Development work in progress Development work in progress represents development and construction costs incurred on properties being constructed for sale. Movement during the year is as follows:
2014AED’000
2013AED’000
Balance at beginning of the year 4,310,918 4,222,729Acquired under business combination – 4,565,100Development costs incurred during the year 300,921 363,276Finance costs capitalised – 24,294Disposal under finance lease during the year – (30,776)Derecognised on disposal of a subsidiary (Note 37) (44,333) –Transfers (to)/from: Investment properties (Note 7) (844,712) (199,352) Refundable costs 22,419 (22,626)Projects completed during the year: Transferred to inventories (Note 12) (675,260) (3,813,034) Recognised in direct costs (165,757) (292,076)Impairments/write-offs of project costs (Note 25) (33,201) (506,617)
Balance at the end of the year 2,870,995 4,310,918
During the year, project costs previously incurred on specific developments were written-off as a result of a change in master plans/ projects put on hold.
All development work in progress projects are located in the United Arab Emirates.
12 Inventories
2014AED’000
2013AED’000
Completed properties 913,408 3,487,584Other operating inventories 29,651 26,868
943,059 3,514,452
During the year, an impairment of a completed property of AED 108.7 million was reversed as the net realisable value exceeded the previously assessed recoverable amount; the property was disposed of during the year. This was offset by the impairment of another completed property of AED 2.7 million as the costs were no longer recoverable (Note 25).
Properties of AED 675.3 million were transferred to inventories upon completion (Note 11).
Completed properties in inventories are located in the United Arab Emirates.
Aldar Annual Report 2014 47
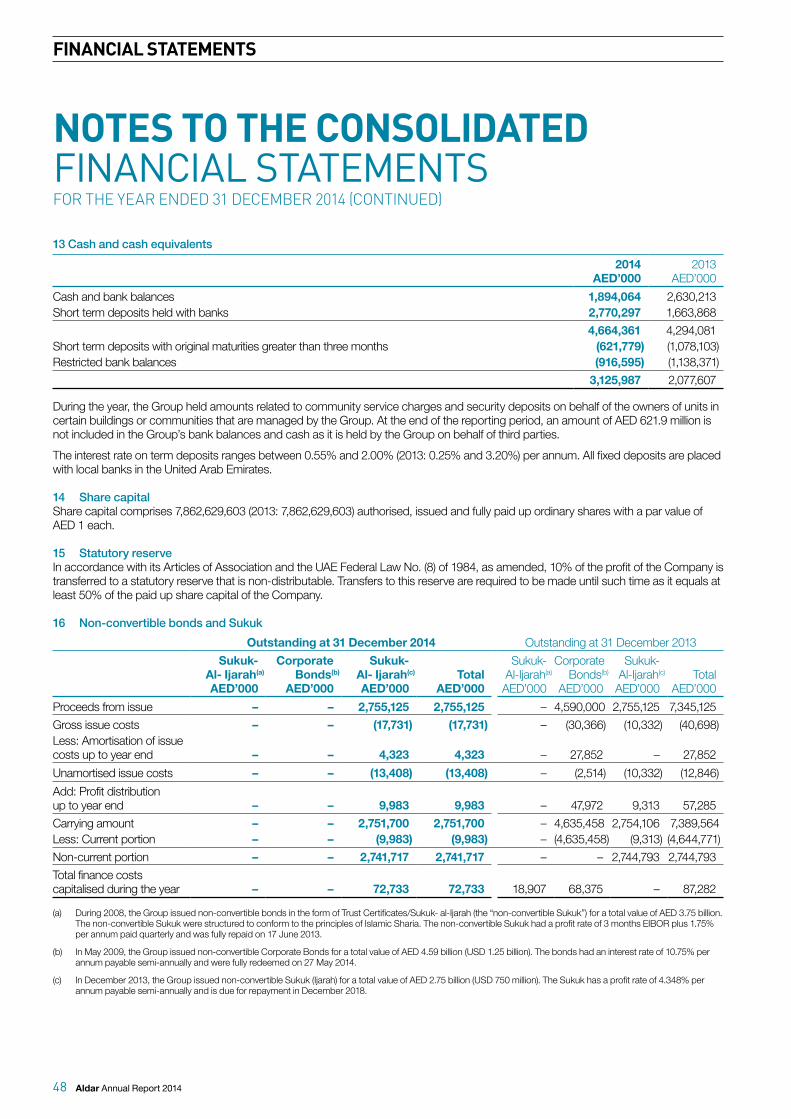
13 Cash and cash equivalents
2014AED’000
2013AED’000
Cash and bank balances 1,894,064 2,630,213Short term deposits held with banks 2,770,297 1,663,868
4,664,361 4,294,081Short term deposits with original maturities greater than three months (621,779) (1,078,103)Restricted bank balances (916,595) (1,138,371)
3,125,987 2,077,607
During the year, the Group held amounts related to community service charges and security deposits on behalf of the owners of units in certain buildings or communities that are managed by the Group. At the end of the reporting period, an amount of AED 621.9 million is not included in the Group’s bank balances and cash as it is held by the Group on behalf of third parties.
The interest rate on term deposits ranges between 0.55% and 2.00% (2013: 0.25% and 3.20%) per annum. All fixed deposits are placed with local banks in the United Arab Emirates.
14 Share capital Share capital comprises 7,862,629,603 (2013: 7,862,629,603) authorised, issued and fully paid up ordinary shares with a par value of AED 1 each.
15 Statutory reserve In accordance with its Articles of Association and the UAE Federal Law No. (8) of 1984, as amended, 10% of the profit of the Company is transferred to a statutory reserve that is non-distributable. Transfers to this reserve are required to be made until such time as it equals at least 50% of the paid up share capital of the Company.
16 Non-convertible bonds and Sukuk
Outstanding at 31 December 2014 Outstanding at 31 December 2013
Sukuk- Al- Ijarah(a)
AED’000
CorporateBonds(b)
AED’000
Sukuk-Al- Ijarah(c)
AED’000Total
AED’000
Sukuk-Al-Ijarah(a)
AED’000
CorporateBonds(b)
AED’000
Sukuk-Al-Ijarah(c)
AED’000Total
AED’000
Proceeds from issue – – 2,755,125 2,755,125 – 4,590,000 2,755,125 7,345,125
Gross issue costs – – (17,731) (17,731) – (30,366) (10,332) (40,698)Less: Amortisation of issue costs up to year end – – 4,323 4,323 – 27,852 – 27,852
Unamortised issue costs – – (13,408) (13,408) – (2,514) (10,332) (12,846)
Add: Profit distribution up to year end – – 9,983 9,983 – 47,972 9,313 57,285
Carrying amount – – 2,751,700 2,751,700 – 4,635,458 2,754,106 7,389,564Less: Current portion – – (9,983) (9,983) – (4,635,458) (9,313) (4,644,771)
Non-current portion – – 2,741,717 2,741,717 – – 2,744,793 2,744,793
Total finance costs capitalised during the year – – 72,733 72,733 18,907 68,375 – 87,282
(a) During 2008, the Group issued non-convertible bonds in the form of Trust Certificates/Sukuk- al-Ijarah (the “non-convertible Sukuk”) for a total value of AED 3.75 billion. The non-convertible Sukuk were structured to conform to the principles of Islamic Sharia. The non-convertible Sukuk had a profit rate of 3 months EIBOR plus 1.75% per annum paid quarterly and was fully repaid on 17 June 2013.
(b) In May 2009, the Group issued non-convertible Corporate Bonds for a total value of AED 4.59 billion (USD 1.25 billion). The bonds had an interest rate of 10.75% per annum payable semi-annually and were fully redeemed on 27 May 2014.
(c) In December 2013, the Group issued non-convertible Sukuk (Ijarah) for a total value of AED 2.75 billion (USD 750 million). The Sukuk has a profit rate of 4.348% per annum payable semi-annually and is due for repayment in December 2018.
NOTES TO THE CONSOLIDATED FINANCIAL STATEMENTSFOR THE YEAR ENDED 31 DECEMBER 2014 (CONTINUED)
48 Aldar Annual Report 2014
FINANCIAL STATEMENTS

17 Bank borrowingsOutstanding amount
CurrentNon-
current TotalUnusedfacility Security Interest rate Maturity Purpose
Capitalisedinterest
AED’000 AED’000 AED’000 AED’000 AED’000
31 December 2014:Government loan 80,724 242,173 322,897 – Unsecured 1 year USD LIBOR + 0.35% December 2017 Development of Yas Island –Term loan – 280,000 280,000 – Secured relevant EIBOR + 1.30% July 2019 Refinancing of debts 738
Term loan – – – – Secured 3 months EBOR + 3.50% June 2014Working capital requirements 700
Revolving loan – – – 120,000 Secured relevant EIBOR + 1.25% July 2017 Refinancing of debts –Murabaha financing – – – – Secured 6 months EBOR + 0.85% April 2014 General corporate purpose 191Murabaha financing – – – – Secured 6 months EBOR + 0.85% April 2014 General corporate purpose 104Murabaha financing – – – – Secured 3 months EBOR + 2.75% May 2014 Al Bateen Park 917Term loan – 600,000 600,000 – Secured relevant EIBOR + 1.35% July 2019 Refinancing of debts 2,931Revolving loan – 153,817 153,817 746,183 Secured relevant EIBOR + 1.25% July 2017 Refinancing of debts –Term loan – 160,000 160,000 – Secured relevant EIBOR + 1.40% June 2019 Refinancing of debts 422Revolving loan – – – 240,000 Secured relevant EIBOR + 1.30% June 2017 Refinancing of debts –Term Loan – 1,377,000 1,377,000 – Secured 3 months LIBOR + 1.4% November 2016 General corporate purpose 5,356Term loan 152,083 1,112,118 1,264,201 – Secured 3 months LIBOR + 1.4% November 2018 General corporate purpose 5,356Ijarah facility – 280,000 280,000 – Secured relevant EIBOR + 1.40% July 2019 General corporate purpose –Ijarah facility – – – 420,000 Secured relevant EIBOR + 1.30% July 2017 General corporate purpose –Ijarah facility – – – – Secured 3 months EBOR + 3.40% April 2015* General corporate purpose 9,792Murabaha facility – – – 120,000 Secured relevant EIBOR + 1.30% 3 years from
1st Murabaha settlement
General corporate purpose –
Murabaha facility – – – – Secured 3 months EBOR + 3.75% November 2014 General corporate purpose 2,674Revolving loan 1,000,000 – 1,000,000 – Secured 3 months EBOR + 1.50% January 2015 General corporate purpose 11,548Lease facility – 80,000 80,000 – Secured relevant EIBOR + 1.40% December 2019 General corporate purpose –Term loan 312,500 625,000 937,500 Secured 3 months EBOR + 1% December 2017 General corporate purpose 4,906Unamortised borrowing cost – (54,608) (54,608) –Accrual for interests and profits 17,091 – 17,091 –
1,562,398 4,855,500 6,417,898 1,646,183 45,635
31 December 2013:Government loan – 315,879 315,879 – Unsecured 1 year USD LIBOR + 0.35% December 2017 Development of Yas Island –Term loan 28,550 111,064 139,614 – Secured 3 months EBOR + 1.00% January 2021 Al Mamoura building –Murabaha financing 33,214 – 33,214 – Secured 6 months EBOR + 0.85% April 2014 General corporate purpose 515Murabaha financing 18,000 – 18,000 – Secured 6 months EBOR + 0.85% April 2014 General corporate purpose 277Murabaha financing 120,301 – 120,301 – Secured 3 months EBOR + 2.75% May 2014 Al Bateen Park 2,269Term loan 89,630 – 89,630 – Secured 3 months EBOR + 3.50% June 2014 Working capital
requirements 3,268Ijarah facility 500,000 – 500,000 – Secured 3 months EBOR + 3.075% November 2014 General corporate purpose 7,448Ijarah facility – 500,000 500,000 – Secured 3 months EBOR + 3.40% January 2015 General corporate purpose 7,448Ijarah facility – 500,000 500,000 – Secured 3 months EBOR + 3.725% April 2015 General corporate purpose 7,448Murabaha facility 300,000 – 300,000 – Secured 3 months EBOR + 3.75% November 2014 General corporate purpose 4,469Wakala agency loan 37,500 215,625 253,125 – Secured 3 months EBOR + 3.50% December 2016 Working capital
requirements –Revolving loan 2,250,000 1,000,000 3,250,000 – Secured 3 months EBOR + 1.50% January 2015 General corporate purpose 32,028Mudaraba facility 29,384 323,224 352,608 – Secured 6 months EBOR + 2.5% March 2016 General corporate purpose 51Term loan – – – – Secured 3 months USD LIBOR +
2.0%October 2013 General corporate purpose 8,013
Ijarah facility – – – – Secured 3 months EBOR + 2.75% May 2013 Al Raha Beach infrastructure 3,831
Club loan – – – – Secured 3 months EBOR + 2.45% September 2014 General corporate purpose 24,241Term loan – – – 1,377,000 Secured 3 months LIBOR + 1.4% November 2016 General corporate purpose –Term loan – – – 1,377,000 Secured 3 months LIBOR + 1.4% November 2018 General corporate purpose –Term loan – – – 1,250,000 Secured 3 months EBOR + 1% December 2017 General corporate purpose –Unamortised borrowing cost (15,140) (1,043) (16,183) – –Accrual for interests and profits 40,103 – 40,103 – –
3,431,542 2,964,749 6,396,291 4,004,000 101,306
(*) The full loan balance was prepaid during the year.
Aldar Annual Report 2014 49

NOTES TO THE CONSOLIDATED FINANCIAL STATEMENTSFOR THE YEAR ENDED 31 DECEMBER 2014 (CONTINUED)
17 Bank borrowings (continued) The borrowings are repayable as follows:
2014AED’000
2013AED’000
Current Within one year 1,562,398 3,431,542
Non-currentIn the second to fifth year 4,855,500 2,964,749
6,417,898 6,396,291
The Group assumed through the acquisition of Sorouh (disclosed in Note 35) an AED 2.7 billion four-year club loan facility consisting of a term loan and revolving credit, with both conventional and Islamic tranches, and secured by certain assets. The loan was prepaid in full in December 2013.
The Group assumed through the acquisition of Sorouh (disclosed in Note 35) a loan of AED 5.9 million. The loan was at an interest at the rate of 6 months EIBOR plus a margin of 1.25% per annum and was repayable over 7 years. The loan was secured by a mortgage over the villas of one of the development projects. The loan was paid in full in December 2013.
In March 2012, the Group signed a revolving facility from a local bank for AED 4.0 billion bearing interest of EBOR + 1.5% margin of which tranche A of AED 3.0 billion was repayable on 31 January 2014 and tranche B of AED 1.0 billion on 31 January 2015. The Group drew down a total of AED 3.25 billion and the remaining AED 750 million remained undrawn. During the year, the Group repaid the full tranche A outstanding balance of AED 2.25 billion while tranche B outstanding balance of AED 1.0 billion was repaid in January 2015.
In November 2013, the Group signed a term loan facility from a local bank for AED 1.25 billion bearing interest of EIBOR plus 1% margin and repayable in four equal installments commencing 15 December 2014. This loan is secured by assignment of Government receivables. The full balance was drawn as of 31 December 2014. Also, in November 2013, the Group signed a term loan facility from a local bank for USD 750 million (AED 2.75 billion) bearing interest of LIBOR plus 1.4 % margin of which USD 375 million (50%) is repayable in one bullet payment in November 2016 and the remaining USD 375 million is repayable in quarterly instalments until November 2018. The full balance was drawn as of 31 December 2014.
In July 2014, the Group signed bilateral facilities with local banks for AED 3.2 billion, bearing average interest of EIBOR plus 1.31% margin/profit. The facilities comprise AED 1.8 billion revolving credit facilities for a tenor of 3 years and AED 1.4 billion term loans for a tenor of 5 years, all repayable as bullets. These loans are secured, and as at 31 December 2014, the Group has drawn AED 1.55 billion and AED 1.65 billion remained committed and undrawn.
Loan securities are in the form of mortgage over plots of land, assignment of project receivables and lien on bank deposits. Certain Group’s borrowings carry a net worth covenant.
Borrowings repaid during the year amounted to AED 10.44 billion.
50 Aldar Annual Report 2014
FINANCIAL STATEMENTS
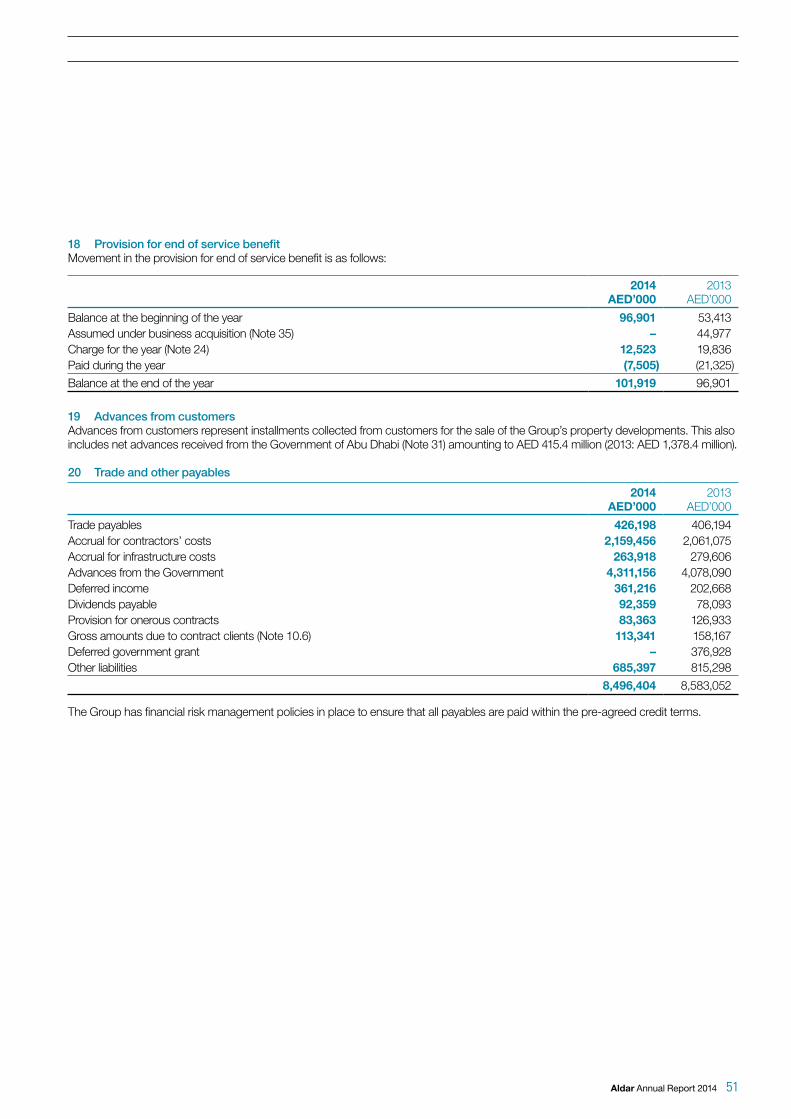
18 Provision for end of service benefitMovement in the provision for end of service benefit is as follows:
2014AED’000
2013AED’000
Balance at the beginning of the year 96,901 53,413Assumed under business acquisition (Note 35) – 44,977Charge for the year (Note 24) 12,523 19,836Paid during the year (7,505) (21,325)
Balance at the end of the year 101,919 96,901
19 Advances from customersAdvances from customers represent installments collected from customers for the sale of the Group’s property developments. This also includes net advances received from the Government of Abu Dhabi (Note 31) amounting to AED 415.4 million (2013: AED 1,378.4 million).
20 Trade and other payables
2014 AED’000
2013 AED’000
Trade payables 426,198 406,194Accrual for contractors’ costs 2,159,456 2,061,075Accrual for infrastructure costs 263,918 279,606Advances from the Government 4,311,156 4,078,090Deferred income 361,216 202,668Dividends payable 92,359 78,093Provision for onerous contracts 83,363 126,933Gross amounts due to contract clients (Note 10.6) 113,341 158,167Deferred government grant – 376,928Other liabilities 685,397 815,298
8,496,404 8,583,052
The Group has financial risk management policies in place to ensure that all payables are paid within the pre-agreed credit terms.
Aldar Annual Report 2014 51

21 Revenue
2014AED’000
2013AED’000
Property development and sales 3,796,802 3,377,357Income from operating businesses 2,754,276 2,002,400
6,551,078 5,379,757
22 Direct costs
2014AED’000
2013AED’000
Cost of properties sold 3,328,837 2,322,348Direct costs for operating businesses 1,703,835 1,293,352
5,032,672 3,615,700
23 Selling and marketing expenses
2014AED’000
2013AED’000
Corporate advertising 23,761 9,242Exhibitions and sponsorships 6,471 2,824Project marketing 2,156 58Other 3,152 46
35,540 12,170
24 Staff costs
2014AED’000
2013AED’000
Salaries, bonuses and other benefits 589,383 682,144Staff training and development 6,165 3,886Post-employment benefit (Note 18) 12,523 19,836
608,071 705,866
Staff costs allocated to:Projects under development 21,573 26,426Direct operating costs 355,272 429,622General and administrative expenses 231,226 249,818
608,071 705,866
25 Reversal/(provisions, impairments and write downs), net
2014AED’000
2013AED’000
Reversal of impairment/(impairment) of property, plant and equipment (Note 5) 150,323 (235,175)Provision for trade and other receivables (Note 10.1) (28,033) (115,718)Write down of development work in progress (Note 11) (33,201) (506,617)Reversal of impairment/(write down) of inventories (Note 12) 105,940 (33,448)Reversal of impairment of investment in an associate (Note 8) 2,877 –Write-off of refundable costs – (230,536)Others (1,423) (14,503)
196,483 (1,135,997)
NOTES TO THE CONSOLIDATED FINANCIAL STATEMENTSFOR THE YEAR ENDED 31 DECEMBER 2014 (CONTINUED)
52 Aldar Annual Report 2014
FINANCIAL STATEMENTS

26 Finance income
2014AED’000
2013AED’000
Interest and profit income:Islamic deposits 7,482 6,163Bank fixed deposits 11,508 15,359Call and current accounts 812 797
Gross income 19,802 22,319Financing element earned on receivables, net 49,103 99,408Financing income earned on receivables from project finance 34,130 56,957Other finance income 7,552 7,553
110,587 186,237
Finance income earned on financial assets, analysed by category of asset is as follows:
2014AED’000
2013AED’000
Loans and receivables 90,785 163,918Cash and bank balances 19,802 22,319
110,587 186,237
27 Finance costs
2014AED’000
2013AED’000
Gross costs 490,297 907,822Less: Amounts included in the cost of qualifying assets(i) (118,368) (189,219)
371,929 718,603Recycling of hedging reserve loss 9,866 8,417
381,795 727,020
(i) The weighted average capitalisation rate of funds borrowed is 1.16% (2013: 1.48%) per annum.
28 Other income
2014AED’000
2013AED’000
Reversal for project provisions and cost recoveries 63,405 1,157Government grant income recognised upon handover of units in the Gate Tower (Note 31.1.b) 346,928 95,961Government grant income recorded upon handover of infrastructure assets (Note 31.1.c) 311,128 434,841Government grant income related to costs recovered from Government (Note 31.2) 83,121 70,000Other 48,998 28,405
853,580 630,364
Aldar Annual Report 2014 53

29 Earnings per shareBasic earnings per share amounts are calculated by dividing profit for the year attributable to ordinary equity holders of the parent by the weighted average number of ordinary shares outstanding during the year. As there are no dilutive instruments outstanding, basic and diluted earnings per share are identical.
The calculation of basic and diluted earnings per share attributable to the owners of the Company is based on the following data:
2014 2013
Earnings (AED’000)Earnings for the purpose of basic and diluted earnings per share (profit for the year attributable to owners of the Company) 2,235,136 2,246,294
Weighted average number of sharesWeighted average number of ordinary shares for the purpose of basic and diluted earnings per share 7,862,629,603 6,617,976,154
30 DividendsAt the annual general assembly held on 26 March 2014, the Shareholders approved the recommendation of the Board of Directors to distribute dividends of AED 0.07 per share for a total of AED 550.4 million. The Board of Directors propose a cash dividend of AED 0.09 per share for 2014. The proposed dividend is subject to the approval of the Shareholders at the annual general assembly.
31 Transactions and balances with related parties Related parties include the Company’s major shareholders, Directors and businesses controlled by them and their families or over which they exercise significant management influence as well as key management personnel. The Government of Abu Dhabi, through entities controlled, or jointly controlled by the Government of Abu Dhabi (together referred to as “Government”) is a major shareholder in the Company.
Related party balances:
2014AED’000
2013AED’000
Due from/(to) Government:Refundable costs (Note 10.2) 2,107,207 2,785,587Receivable from assets sold (Note 10) 2,710,805 5,909,421Other receivables 172,265 130,759
4,990,277 8,825,767
Advances received (Note 19 and 20) (4,726,603) (5,456,502)
Due from associates and joint ventures (Note 10.5) 467,957 454,184
Due to joint ventures for project-related work:Contract payables (32,692) (32,692)Retention payables (815) (815)
(33,507) (33,507)
Certain receivables from joint ventures carry interest of 9% and are repayable within 2 to 5 years from the end of the year.
2014AED’000
2013AED’000
Due from/(to) major shareholder owned by Government and/or its associated companies:Receivable from project finance (Note 10.3) 146,783 555,101Due to a major shareholder, net (126,714) (99,214)
20,069 455,887
NOTES TO THE CONSOLIDATED FINANCIAL STATEMENTSFOR THE YEAR ENDED 31 DECEMBER 2014 (CONTINUED)
54 Aldar Annual Report 2014
FINANCIAL STATEMENTS

31 Transactions and balances with related parties (continued)Significant transactions with related parties during the year are as follows:
2014AED’000
2013AED’000
Key management compensation:Salaries, bonuses and other benefits 14,866 18,521Post-employment benefits 689 2,012
15,555 20,533
Directors remuneration paid 23,999 16,000
2014AED’000
2013AED’000
Income from Government and major shareholder owned by Government:Revenue from sale of land and properties 1,253,327 1,812,013Project management income 63,811 47,497Rental income 242,797 239,476Government grant income (Note 28) 741,177 600,802
2,301,112 2,699,788
Work provided by joint ventures 311 3,042
Finance income from project finance and joint ventures 38,543 63,723
31.1 In January 2013, Sorouh announced that the Government of Abu Dhabi had agreed to reimburse up to AED 1.6 billion of infrastructure costs, and to purchase units in the Gate Towers development for AED 1.6 billion. As of 31 December 2014, AED 2.9 billion has been received. These transactions have been accounted for as follows:
a) AED 1.6 billion of the amount received has been recorded as an advance received from Government, included in “advances from customers” and AED 1.3 billion has been recorded as “advances from the Government of Abu Dhabi” under trade and other payables. As of 31 December 2014, the balance in “advances from the customers” is AED Nil (Note 19) and AED 554.0 million in “advances from the Government of Abu Dhabi” (Note 20).
b) The difference between the selling price of units in the Gate Towers and the fair market price has been recorded as a deferred government grant under trade and other payables (Note 20). This will be recognised in profit or loss upon handover of the units. During the year, an amount of AED 346.9 million was recognised as government grant income upon handover of units.
c) The amount and timing of the infrastructure cost reimbursement is subject to the completion of certain audit and technical inspections and assessments to be performed by the relevant government authority. Once these activities are completed, there will be reasonable assurance that the grant will be received and at that point it will be recognised as a deferred government grant in the consolidated statement of financial position. Once the conditions of the grant are met, i.e. infrastructure assets are handed over to the designated authorities, the deferred government grant will be recognised as other income in profit or loss. During the year, an amount of AED 311.1 million was recognised as government grant income, recorded under other income in the consolidated income statement, upon handover of infrastructure assets.
31.2 During the year the Group recognised AED 83.1 million (2013: AED 70.0 million) as government grant income being compensations received for certain costs previously incurred.
31.3 Outstanding borrowings of AED 3,534.2 million (31 December 2013: AED 5,575.8 million) are due to the Government and banks controlled by the Government.
Aldar Annual Report 2014 55

32 Commitments and contingencies32.1 Capital commitmentsCapital expenditure contracted but not yet incurred at the end of the year is as follows:
2014AED’000
2013AED’000
Projects under development 420,169 390,628Reimbursable project works in progress 5,466,525 6,488,606Investment in associates 79,569 83,885Other 4,090 7,259
5,970,353 6,970,378
The above commitments are spread over a period of one to five years.
The Group has paid an amount of AED 937.1 million (2013: AED 408.9 million) as advances to the suppliers and contractors against the above commitments.
32.2 Operating lease commitmentsThe Company has leased out certain buildings. The amounts of committed future lease inflows are as follows:
The Company as lessor
2014AED’000
2013AED’000
Buildings:Within one year 183,188 257,122In the second to fifth year 642,445 1,009,808After five years 173,726 298,110
999,359 1,565,040
The Company as lesseeThe Company has annual operating lease commitments with respect to rental of land and buildings. The minimum lease payments are as follows:
2014AED’000
2013AED’000
Land:Within one year 43,599 41,724In the second to fifth year 132,180 150,058After five years 360,493 381,083
536,272 572,865
The Group does not have the option to purchase the leased premises at expiry of the lease period but the lease can be renewed upon mutual agreements of both parties.
32.3 ContingenciesLetters of credit and bank guarantees
2014AED’000
2013AED’000
Letters of credit and bank guarantees:Issued by the Group 497,516 372,403
Group’s share in contingencies of joint ventures 243,039 203,467
During 2012, a contractor lodged a claim, which was unsubstantiated in the notice, for AED 300 million, allegedly for an extension of time and works performed and not paid.
NOTES TO THE CONSOLIDATED FINANCIAL STATEMENTSFOR THE YEAR ENDED 31 DECEMBER 2014 (CONTINUED)
56 Aldar Annual Report 2014
FINANCIAL STATEMENTS
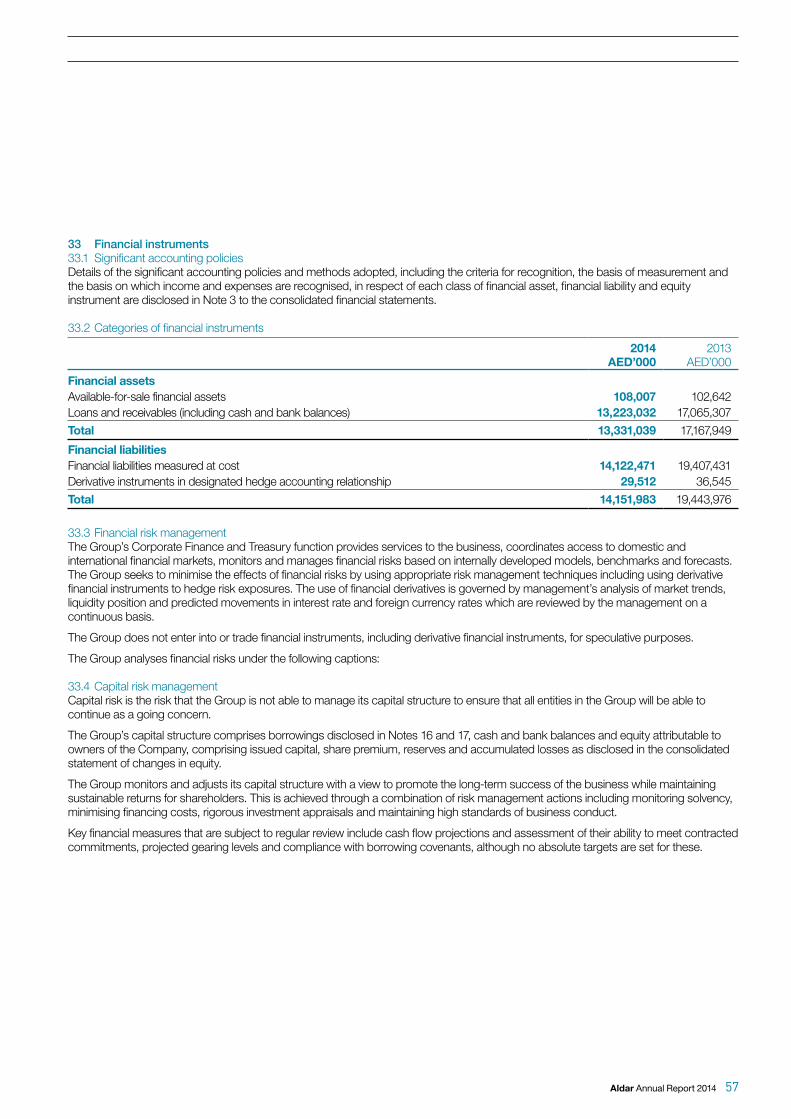
33 Financial instruments33.1 Significant accounting policiesDetails of the significant accounting policies and methods adopted, including the criteria for recognition, the basis of measurement and the basis on which income and expenses are recognised, in respect of each class of financial asset, financial liability and equity instrument are disclosed in Note 3 to the consolidated financial statements.
33.2 Categories of financial instruments
2014AED’000
2013AED’000
Financial assetsAvailable-for-sale financial assets 108,007 102,642Loans and receivables (including cash and bank balances) 13,223,032 17,065,307
Total 13,331,039 17,167,949
Financial liabilitiesFinancial liabilities measured at cost 14,122,471 19,407,431Derivative instruments in designated hedge accounting relationship 29,512 36,545
Total 14,151,983 19,443,976
33.3 Financial risk management The Group’s Corporate Finance and Treasury function provides services to the business, coordinates access to domestic and international financial markets, monitors and manages financial risks based on internally developed models, benchmarks and forecasts. The Group seeks to minimise the effects of financial risks by using appropriate risk management techniques including using derivative financial instruments to hedge risk exposures. The use of financial derivatives is governed by management’s analysis of market trends, liquidity position and predicted movements in interest rate and foreign currency rates which are reviewed by the management on a continuous basis.
The Group does not enter into or trade financial instruments, including derivative financial instruments, for speculative purposes.
The Group analyses financial risks under the following captions:
33.4 Capital risk managementCapital risk is the risk that the Group is not able to manage its capital structure to ensure that all entities in the Group will be able to continue as a going concern.
The Group’s capital structure comprises borrowings disclosed in Notes 16 and 17, cash and bank balances and equity attributable to owners of the Company, comprising issued capital, share premium, reserves and accumulated losses as disclosed in the consolidated statement of changes in equity.
The Group monitors and adjusts its capital structure with a view to promote the long-term success of the business while maintaining sustainable returns for shareholders. This is achieved through a combination of risk management actions including monitoring solvency, minimising financing costs, rigorous investment appraisals and maintaining high standards of business conduct.
Key financial measures that are subject to regular review include cash flow projections and assessment of their ability to meet contracted commitments, projected gearing levels and compliance with borrowing covenants, although no absolute targets are set for these.
Aldar Annual Report 2014 57

33 Financial instruments (continued)33.4 Capital risk management (continued)The Group monitors its cost of debt on a regular basis. At 31 December 2014, the weighted average cost of debt was 2.65% (2013: 5.89%). Investment and development opportunities are evaluated against an appropriate equity return in order to ensure that long-term shareholder value is created.
The covenants of six (2013: two) borrowing arrangements require the Group maintaining a minimum equity of AED 6.0 billion.
33.5 Market risk managementMarket risk is the risk that the fair value or future cash flows of a financial asset or liability will fluctuate because of changes in market prices. Market risk comprises three types of risk: foreign currency risk, interest rate risk and other price risk.
a) Foreign currency risk managementThe Group has no significant cross-border trading transactions and therefore, foreign exchange transaction exposure is negligible. However, it does borrow money in foreign currencies primarily in US Dollars. The Group’s currency exposure therefore is in relation to the repayment of loans and also the translation risk associated with converting outstanding loan balances back into UAE Dirhams in the Group consolidated accounts at the end of each reporting period. The exchange rate between UAE Dirhams and US Dollars is fixed and therefore the Group considers foreign exchange risk associated with repayment of loans and translation as minimum.
Foreign currency sensitivity analysisThe carrying amounts of the Group’s foreign currency denominated monetary assets and liabilities at the end of the reporting period are as follows:
Liabilities Assets
2014AED’000
2013AED’000
2014AED’000
2013AED’000
US Dollar 5,400,249 7,350,102 942,762 369,821Pound Sterling(i) 131 – – –Euro(ii) 432 434 – –
5,400,812 7,350,536 942,762 369,821
There is no significant impact on US Dollar as the UAE Dirham is pegged to the US Dollar.
Based on the sensitivity analysis, to a 20% increase/decrease in the AED against the relevant foreign currencies (assumed outstanding for the full year):
i. there is AED 26 thousand (2013: AED nil) net revaluation gain/(loss) on the Pound Sterling outstanding balances.
ii. there is AED 86 thousand (2013: AED 87 thousand) net revaluation gain/(loss) on the Euro outstanding balances.
NOTES TO THE CONSOLIDATED FINANCIAL STATEMENTSFOR THE YEAR ENDED 31 DECEMBER 2014 (CONTINUED)
58 Aldar Annual Report 2014
FINANCIAL STATEMENTS

33 Financial instruments (continued)33.5 Market risk management (continued)b) Interest rate risk managementThe Company is exposed to interest rate risk as entities in the Group borrow funds at both fixed and floating interest rates. The risk is managed by the Group by maintaining an appropriate mix between fixed and floating rate borrowings, by the use of interest rate swap contracts.
The Group’s exposures to interest rates on financial assets and financial liabilities are detailed in Notes 13, 16, and 17.
Interest rate sensitivity analysisThe sensitivity analyses below have been determined based on the exposure to interest rates for both derivatives and non-derivative instruments at the end of the reporting period. For floating rate assets and liabilities, the analysis is prepared assuming the amount of asset or liability outstanding at the end of the reporting period was outstanding for the whole year.
If interest rates had been 100 basis points higher/lower and all other variables were held constant, the Group’s profit for the year ended 31 December 2014 would decrease/increase by AED 39.3 million (2013: profit decrease/increase by AED 46.9 million). The Company’s sensitivity to interest rates has decreased due to significant loan repayments during the year.
Interest rate swap contractsUnder interest rate swap contracts, the Group agrees to exchange the difference between fixed and floating rate interest amounts calculated on agreed notional principal amounts. Such contracts enable the Group to mitigate the risk of changing interest rate on the fair value of issued fixed rate debt and the cash flow exposures on the issued variable rate debt.
Cash flow hedgesAll interest rate swap contracts exchanging floating rate interest amounts for fixed rate interest amounts are designated as cash flow hedges in order to reduce the Group’s cash flow exposure resulting from variable interest rates on borrowings. The interest rate swaps and the payments on the loan occur simultaneously.
The Group’s derivative financial instruments were contracted with counterparties operating in the United Arab Emirates.
33.6 Credit risk managementCredit risk in relation to the Group, refers to the risk that a counter party will default on its contractual obligations resulting in financial loss to the Group.
Key areas where the Group is exposed to credit risk are trade and other receivables and bank and cash balances and derivative financial assets (liquid assets).
The Group has adopted a policy of only dealing with creditworthy counterparties as a means of mitigating the risk of financial loss from defaults. The Group attempts to control credit risk by monitoring credit exposures, limiting transactions with specific non-related counterparties, and continually assessing the creditworthiness of such non-related counterparties.
Concentration of credit riskConcentration of credit risk arise when a number of counterparties are engaged in similar business activities, or activities in the same geographic region, or have similar economic features that would cause their ability to meet contractual obligations to be similarly affected by changes in economic, political or other conditions. Concentration of credit risk indicates the relative sensitivity of the Group’s performance to developments affecting a particular industry or geographic location. Details on concentration of trade receivable balances are disclosed in Note 10. Management believes that the concentration of credit risk is mitigated by having received instalment payments, in some cases substantial, which the Group would contractually be entitled to retain in the event of non-completion of the remaining contractual obligations in order to cover the losses incurred by the Group.
At 31 December 2014, 100% (2013: 100%) of the deposits were placed with 6 banks. Balances with banks are assessed to have low credit risk of default since these banks are among the major banks operating in the UAE and are highly regulated by the central bank.
Trade and other receivables and balances with banks are not secured by any collateral. The amount that best represents maximum credit risk exposure on financial assets at the end of the reporting period, in the event counter parties fail to perform their obligations generally approximates their carrying value.
Aldar Annual Report 2014 59

33 Financial instruments (continued)33.7 Liquidity risk management The responsibility for liquidity risk management rests with the management of the Group, which has built an appropriate liquidity risk management framework for the management of the Group’s short, medium and long term funding and liquidity management requirements. The Group manages liquidity risk by maintaining adequate reserves, banking facilities and committed borrowing facilities, by continuously monitoring forecast and actual cash flows and matching the maturity profiles of financial assets and liabilities.
The following tables detail the Group’s remaining contractual maturity for its non-derivative financial assets and liabilities. The tables have been drawn up based on the undiscounted cash flows of non-derivative financial assets and liabilities based on the earliest date on which the Group can be required to pay or collect. The table includes both interest and principal cash flows. Maturity profile of non-derivative financial assets and liabilities at the end of the reporting period is as follows:
Effectiveinterest
rate< 1 month
AED’000
1 to 3 months AED’000
3 monthsto 1 year AED’000
1 to 5 years AED’000
> 5 yearsAED’000
Total AED’000
31 December 2014:Financial assetsNon-interest bearing instruments – 1,204,751 135,161 6,524,069 879,403 – 8,743,384Receivables from project finance 8.06% – 5,125 16,729 76,017 308,964 406,835Variable interest rate instruments Note 13 1,153,724 1,905,499 1,615,286 – – 4,674,509
Total 2,358,475 2,405,785 8,156,084 955,420 308,964 13,824,728
Financial liabilitiesNon-interest bearing instruments(1) – 112,375 2,791,525 1,919,241 16,490 – 4,839,631 Non-convertible bonds Note 16 9,983 – – 2,755,125 – 2,765,108Variable interest rate instruments Note 17 1,007,109 38,021 517,269 4,910,107 – 6,472,506Derivative instruments 1,136 – – 28,376 – 29,512
Total 1,130,603 2,829,546 2,436,510 7,710,098 – 14,106,757
31 December 2013:Financial assetsNon-interest bearing instruments – 350,934 22,882 9,790,428 2,407,941 – 12,572,185Receivables from project finance 11.25% – 17,466 84,026 245,639 244,626 591,757Variable interest rate instruments Note 13 2,629,728 586,250 2,209,495 – – 5,425,473
Total 2,980,662 626,598 12,083,949 2,653,580 244,626 18,589,415
Financial liabilitiesNon-interest bearing instruments(1) – 229 452,510 4,866,274 1,388,157 – 6,707,170Non-convertible bonds Note 16 – – 10,332 2,727,290 – 2,737,622Fixed interest rate instruments 4% – – – – – –Variable interest rate instruments Note 17 – – 3,429,166 2,930,580 – 6,359,746Derivative instruments – – 2,376 1,136 33,033 36,545
Total 229 452,510 8,308,148 7,047,163 33,033 15,841,083
(1) Including security deposits from customers.
NOTES TO THE CONSOLIDATED FINANCIAL STATEMENTSFOR THE YEAR ENDED 31 DECEMBER 2014 (CONTINUED)
60 Aldar Annual Report 2014
FINANCIAL STATEMENTS

34 Fair value of financial instrumentsExcept as disclosed in the following table, Management considers that the carrying amounts of financial assets and financial liabilities recognised at amortised cost in the consolidated financial statements approximate their fair values.
As at 31 December 2014
GrossCarryingamount
AED’000
Fairvalue
AED’000
Financial liabilities at amortised cost Sukuk-al-Ijarah (Note 16) 2,755,125 2,872,218
Following the amendment to IFRS 7, all financial instruments that are required to be measured at fair value (subsequent to initial recognition) should be disclosed in a fair value hierarchy or grouping into 3 levels (Levels 1 to 3) based on the degree to which the fair value is observable.
Level 1 fair value is derived from quoted prices (unadjusted) in active markets for identical assets or liabilities. Level 2 fair value measurements are derived from inputs other than quoted prices, and Level 3 are those that are derived from valuation techniques using unobservable inputs.
As at 31 December 2014, the Group’s financial assets that are stated at fair value are grouped as follows:
Level 1AED’000
Level 2AED’000
Level 3AED’000
TotalAED’000
Available-for-sale investmentsEquities 34,170 73,837 – 108,007
During the year, one of the investments got listed and commenced trading on the secondary market for private companies of Abu Dhabi Securities Exchange (ADX). Accordingly, this investment has been transferred from level 2 to level 1 (Note 9).
The fair values of derivative instruments amounting to AED 30 million pertaining to interest rate swap are determined by independent valuers (see Note 33.5) and are measured at the present value of future cash flows estimated and discounted based on the applicable yield curves derived from quoted interest rates. The derivative instruments are categorised as level 2.
35 Business combinationOn 27 June 2013, the Company acquired 100% ownership interest in Sorouh Real Estate PJSC through a share exchange. Accordingly, the ownership interest in the following entities which were subsidiaries of Sorouh Real Estate PJSC, was transferred to the Company.
Name of subsidiaries Principal activity
Proportionof voting
equity interestsacquired
Gate Towers Shams Abu Dhabi LLC Development of Gate Towers 100%Sorouh Abu Dhabi Real Estate LLC Act as Mudareb in accordance with the Sukuk Issue structure 100%Sorouh International Limited Holding company of foreign entities 100%Sorouh International Development Limited Development of properties and real estate 100%Sorouh International Morocco Limited Development of properties and real estate 100%Lulu Island for Project Development LLC Development of properties and real estate 100%Tilal Liwa Real Estate Investing LLC Property, rental and management 100%Al Seih Real Estate Management LLC Management and leasing of real estate; real estate
projects investment91.4%
Seih Sdeirah Real Estate L.L.C. Property rental and management; real estate projects investment 91.4%Sorouh Egypt for Investment and Tourism Development Investment in tourism activity 80%Khidmah LLC Management and leasing of real estate 60%Pivot Engineering & General Contracting Co. (WLL) Engineering and general construction works 60%
Aldar Annual Report 2014 61

35 Business combination (continued) 35.1 Assets acquired and liabilities recognised at the date of acquisition
AED’000
ASSETSProperty, plant and equipment 138,429Intangible assets 375Investment properties 4,573,274Investment in associates and joint ventures 219,197Available for sale financial assets 95,746Trade and other receivables 2,720,943Development work in progress 4,565,100Land held for resale 1,748,470Inventories 111,764Cash and bank balances 1,521,478
Total assets 15,694,776
LIABILITIESBorrowings 2,112,140Retentions payable 271,078Provision of employees’ end of service benefits 44,977Advances from customers 2,933,585Trade and other payables 1,934,979Other financial liabilities 1,770
Total liabilities 7,298,529
Net assets acquired 8,396,247
35.2 Non-controlling interestsThe non-controlling interest recognised at the acquisition date was measured by reference to the fair value of the non-controlling interest and amounted to AED 294.4 million.
Company
Percentageof non-
controlling interest
Pivot Engineering & General Contracting Co. WLL 40%Khidmah LLC 40%Sorouh Egypt for Investment and Tourism Development S.A.E. 20%Al Seih Real Estate Management LLC 8.6%Seih Sdeirah Real Estate LLC 8.6%
35.3 Gain arising on acquisition
AED’000
Consideration transferred equal to fair value of 3,381 million shares issued to the shareholders of acquiree company 5,511,030Add: Fair value of non-controlling interests 294,435Less: Fair value of identifiable net assets acquired (8,396,247)
Gain arising on acquisition taken to profit or loss for the year (2,590,782)
Acquisition-related costs were recognised as an expense during the period in which they were incurred.
The gain on acquisition arises from the difference between the fair value of Sorouh’s assets, including land assets which were previously held at nominal value, and the consideration transferred.
IFRS 3 determines that the effective acquisition date is, inter alia, the date on which all required conditions and approvals have been substantively satisfied.
NOTES TO THE CONSOLIDATED FINANCIAL STATEMENTSFOR THE YEAR ENDED 31 DECEMBER 2014 (CONTINUED)
62 Aldar Annual Report 2014
FINANCIAL STATEMENTS
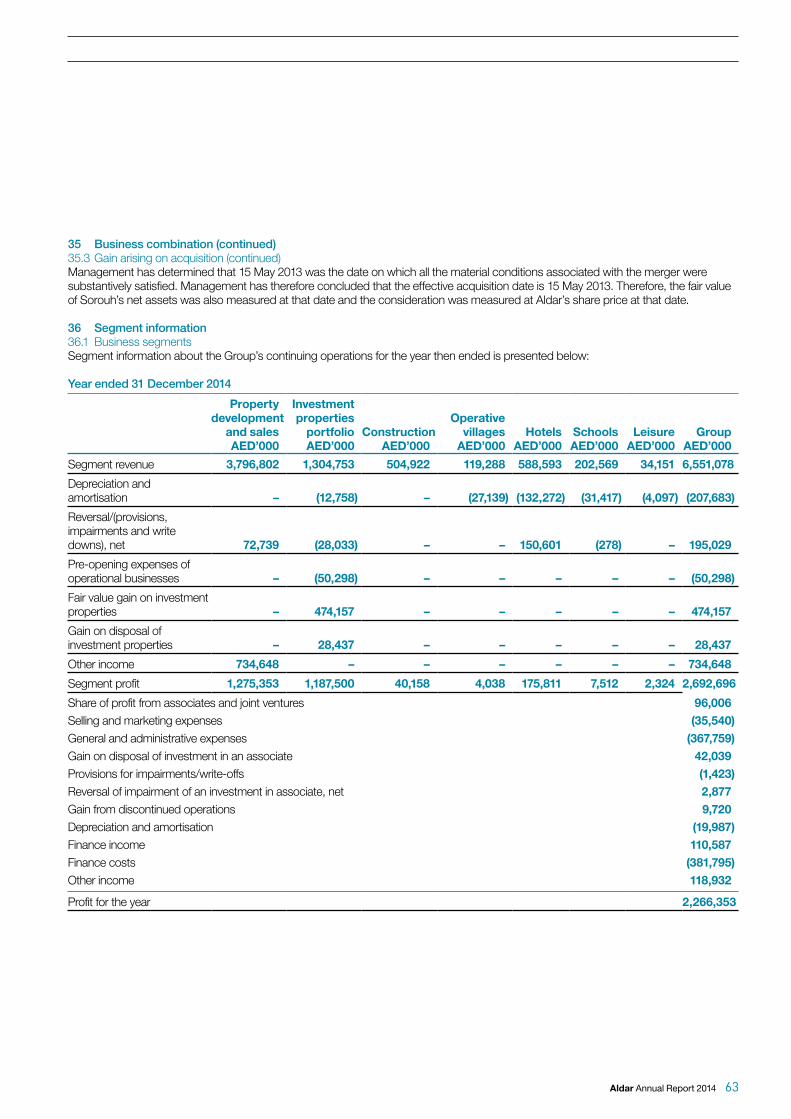
35 Business combination (continued) 35.3 Gain arising on acquisition (continued)Management has determined that 15 May 2013 was the date on which all the material conditions associated with the merger were substantively satisfied. Management has therefore concluded that the effective acquisition date is 15 May 2013. Therefore, the fair value of Sorouh’s net assets was also measured at that date and the consideration was measured at Aldar’s share price at that date.
36 Segment information36.1 Business segmentsSegment information about the Group’s continuing operations for the year then ended is presented below:
Year ended 31 December 2014
Propertydevelopment
and salesAED’000
Investmentproperties
portfolioAED’000
ConstructionAED’000
Operativevillages
AED’000Hotels
AED’000SchoolsAED’000
LeisureAED’000
GroupAED’000
Segment revenue 3,796,802 1,304,753 504,922 119,288 588,593 202,569 34,151 6,551,078
Depreciation and amortisation – (12,758) – (27,139) (132,272) (31,417) (4,097) (207,683)
Reversal/(provisions, impairments and write downs), net 72,739 (28,033) – – 150,601 (278) – 195,029
Pre-opening expenses of operational businesses – (50,298) – – – – – (50,298)
Fair value gain on investment properties – 474,157 – – – – – 474,157
Gain on disposal of investment properties – 28,437 – – – – – 28,437
Other income 734,648 – – – – – – 734,648
Segment profit 1,275,353 1,187,500 40,158 4,038 175,811 7,512 2,324 2,692,696
Share of profit from associates and joint ventures 96,006Selling and marketing expenses (35,540)General and administrative expenses (367,759)Gain on disposal of investment in an associate 42,039Provisions for impairments/write-offs (1,423)Reversal of impairment of an investment in associate, net 2,877Gain from discontinued operations 9,720Depreciation and amortisation (19,987)Finance income 110,587Finance costs (381,795)Other income 118,932
Profit for the year 2,266,353
Aldar Annual Report 2014 63

36 Segment information (continued)36.1 Business segments (continued)Year ended 31 December 2013
Propertydevelopment
and salesAED’000
Investmentproperties
portfolioAED’000
ConstructionAED’000
Operativevillages
AED’000Hotels
AED’000SchoolsAED’000
LeisureAED’000
GroupAED’000
Segment revenue 3,377,357 897,860 172,292 224,296 504,022 171,775 32,155 5,379,757
Depreciation and amortisation – (12,959) – (70,455) (172,905) (26,657) (5,248) (288,224)
Provisions, impairments and write downs (774,205) (40,546) (86,071) – (235,175) – – (1,135,997)
Fair value loss on investment properties – (340,544) – – – – – (340,544)
Segment profit/(loss) 194,300 76,247 (83,914) (2,225) (298,056) (3,639) (2,742) (120,029)
Share of loss from associates and joint ventures (16,475)
Selling and marketing expenses (5,697)
General and administrative expenses (295,021)
Gain on disposal of investment in associate 3,018
Gain on business combination 2,590,782
Depreciation and amortisation (20,964)
Finance income 186,237
Finance costs (727,020)
Other income 630,364
Profit for the year 2,225,195
The segment assets and liabilities and capital expenditure for the year then ended are as follows:
Propertydevelopment
and salesAED’000
Investmentproperties
portfolioAED’000
Operativevillages
AED’000Construction
AED’000Hotels
AED’000SchoolsAED’000
LeisureAED’000
UnallocatedAED’000
GroupAED’000
As at 31 December 2014Assets 14,370,383 15,425,785 128,942 1,032,233 2,772,796 480,073 55,135 4,283,783 38,549,130
Liabilities 7,617,941 1,164,042 130,996 1,028,485 163,753 180,768 18,431 9,871,332 20,175,748
Capital expenditure – – – – – – – 50,121 50,121
Projects expenditure 300,921 953,553 – – – – – – 1,254,474
As at 31 December 2013Assets 22,112,969 12,929,524 717,492 1,426,950 2,628,939 369,928 58,888 3,483,357 43,728,047
Liabilities 10,946,693 692,965 153,805 1,022,424 151,444 55,585 19,343 14,037,829 27,080,088
Capital expenditure 12,230 – – – – – – 25,197 37,427
Projects expenditure 363,276 1,199,702 – – – – – – 1,562,978
The accounting policies of the reportable segments are the same as the Group’s accounting policies described in Note 3.
Segment profit represents the profit earned by each segment without allocation of central administration, selling and marketing costs and directors’ salaries, share of profits of associates and joint ventures, other gains and losses, finance income and finance costs. This is the measure reported to the chief operating decision maker for the purposes of resource allocation and assessment of segment performance.
NOTES TO THE CONSOLIDATED FINANCIAL STATEMENTSFOR THE YEAR ENDED 31 DECEMBER 2014 (CONTINUED)
64 Aldar Annual Report 2014
FINANCIAL STATEMENTS

36 Segment information (continued)36.1 Business segments (continued)For the purposes of monitoring segment performance and allocating resources between segments:• all assets are allocated to reportable segments other than interests in associates and joint ventures, available for sale assets and
‘other financial assets’. Assets used jointly by reportable segments are allocated on the basis of the revenues earned by individual reportable segments; and
• all liabilities are allocated to reportable segments other than borrowings, convertible and non-convertible bonds and ‘other financial liabilities’. Liabilities for which reportable segments are jointly liable are allocated in proportion to segment assets.
36.2 Geographical segmentsThe Group operated only in one geographical segment, i.e., United Arab Emirates.
37 Disposal of a subsidiary On 3 November 2014, the Group disposed its subsidiary Sorouh International Development Limited which in turn owned 80% of Sorouh Egypt for Investment and Tourism Development SAE.
37.1 Analysis of assets and liabilities over which control was lost
AED’000
AssetsTrade and other receivables 9,350Development work in progress 44,333Property, plant and equipment 152
Total assets 53,835
LiabilitiesTrade and other liabilities (56,512)
Net liabilities disposed of (2,677)
37.2 Gain on disposal of a subsidiary
AED’000
Consideration received –Net liabilities disposed of 2,677Non-controlling interests 7,043
Gain on disposal 9,720
The gain on disposal is included in the gain from discontinued operations in the consolidated income statement.
38 Approval of consolidated financial statementsThe consolidated financial statements were approved by the Board of Directors and authorised for issue on 11 February 2015.
Aldar Annual Report 2014 65

NOTES
66 Aldar Annual Report 2014
FINANCIAL STATEMENTS

Aldar Annual Report 2014 67

NOTES
68 Aldar Annual Report 2014
FINANCIAL STATEMENTS


Aldar HQAl Raha BeachAbu Dhabi www.aldar.com Tel: +971 2 810 5555