Annual Report 2013 - sml.com.pk · PDF fileDirector’s Report ... Faisalabad Office...
104
Annual Report 2013
Transcript of Annual Report 2013 - sml.com.pk · PDF fileDirector’s Report ... Faisalabad Office...

Annual Report2013
01
CONTENTS
Vision, Mission & Values ......................................................................................................................................02
Company Information .........................................................................................................................................05
Management Committees.................................................................................................................................06
Shareholders’ Information..................................................................................................................................07
Company Profile ....................................................................................................................................................10
Director’s Report ...................................................................................................................................................12
Board and its Committee Meetings ..............................................................................................................15
Chief Executive’s Review.....................................................................................................................................16
Production Data.....................................................................................................................................................18
Financial Highlights..............................................................................................................................................20
Statement of Compliance with Code of Corporate Governance .........................................................21
Review Report to the Members on Statement of Compliance with
Code of Corporate Governance ....................................................................................................................23
Auditors’ Report to the Members ....................................................................................................................27
Balance Sheet .........................................................................................................................................................28
Profit and Loss Account ......................................................................................................................................30
Statement of Comprehensive Income...........................................................................................................31
Cash Flow Statement ...........................................................................................................................................32
Statement of Changes in Equity ......................................................................................................................33
Notes to the Financial Statements ..................................................................................................................34
Pattern of Holding of Shares .............................................................................................................................95
Notice of Annual General Meeting .................................................................................................................98
Form of Proxy

To gain and maintain leadership in theindustries it competes in by producing thebest quality products with lowest possiblecost.
To give the best returns to shareholders byoptimal allocation of resources to theproducts and markets the company competesin.
To provide the best value products andservices to its customers through investmentin technology, human resources, operationalsystems and processes.
To provide the best working environmentto i ts employees and provideopportunities to them for enhancing theirskills.
To work with its farmers, suppliers anddistributors as partners developing theirexpertise and profitability.
To pursue environment friendly policiesand effectively and efficiently use allenergy resources aiming for zero wasteand a clean healthy environment in itsvicinity.
To be a socially responsible corporate citizen supporting education, health, environmentand socio economic development of the society.
VISION, MISSION & VALUES
02

03

04

Board Of Directors
1. Chairman (Non-Executive) Muhammad Anwar2. Chief Executive Officer Ahsan M. Saleem
In alphabetic order:3. Executive Director Ali Altaf Saleem4. Non-Executive Director Khalid Bashir5. Non-Executive Director Muhammad Arshad6. Non-Executive Director Rasul Bux Phulpoto (NIT)7. Non-Executive Director Shehryar Mazhar
Chief Financial OfficerS.M. Chaudhry
Company SecretaryAsif Ali
Audit CommitteeChairmanKhalid Bashir
From Left to Right
MemberMuhammad AnwarAli Altaf Saleem
COMPANY INFORMATION
Human Resource & Remuneration CommitteeChairmanMuhammad Anwar
05
MemberKhalid BashirAli Altaf Saleem

MANAGEMENT COMMITTEES
Chairman Muhammad Pervaiz AkhtarS.M. Chaudhry
Ibrahim Ahmad Cheema
This committee is responsible for devising the I.T strategy within the organization to keep all informationsystems of the Company updated in a fast changing environment.
Executive CommitteeChairman Ahsan M. Saleem
Anjum M. SaleemAli Altaf Saleem
This committee devises long term policies and visions for the Company with the sole objective for providingthe best returns to shareholders by optimum allocation of existing resources. The Committee is also responsiblefor review of Company’s operation on ongoing basis, establishing and ensuring adequacy of internal controlsand monitoring compliance of key policies.
Business Strategy CommitteeChairman Ahsan M. Saleem
Anjum M. SaleemAli Altaf Saleem
Muhammad Pervaiz AkhterS.M. Chaudhry
Manzoor Hussain Malik
This Committee is responsible for formulation of business strategy, review of risks and their mitigation plan.Further, the Committee is also responsible for staying abreast of developments and trends in the Industry toassist the Board in planning for future capital intensive investments and growth of the Company.
System and Technology Committee
06

SHAREHOLDERS’ INFORMATION
Stock Exchange Listing
Shakarganj Mills Limited is a listedcompany and its shares are traded onall the three stock exchanges ofPakistan. Daily quotes on theCompany’s stock can be obtainedfrom leading newspapers. Shakarganjis listed under ‘Food Producers’
Public InformationFinancial analysts, Stock brokers,interested investors and financialmedia desiring information about“Shakarganj” should contactMr. Asif Aliat the Company’s Office, Jhang.Tel: 047 763 1001 - 05Fax: 047 763 1011E-mail: [email protected]
Shareholders’ Information
Inquiries concerning lost stockcertificates, dividend payment,change of address, verification oftransfer deeds and share transfersshould be directed to CorpTecAssociates (Pvt) Limited ShareRegistrar of the Company at Lahore.Tel: 042 3517 0336 - 7Fax: 042 3517 0338E-mail: [email protected]
Products• Sugar• Bio Fuel• Bio Power• Building Materials• Yarn• Tiger Compost
Legal AdvisorHassan & Hassan Advocates,Lahore
BankersAllied Bank LimitedMCB Bank LimitedNational Bank of PakistanThe Bank of PunjabUnited Bank LimitedStandard Chartered BankSilk Bank LimitedBank Alfalah LimitedFaysal Bank LimitedAskari Bank Limited
Works
Principal FacilityManagement HouseToba Road, Jhang, PakistanTel: 047 763 1001 - 05Fax: 047 763 1011E-mail: [email protected]
Satellite FacilityManagement House63 km, Jhang Sargodha RoadBhone, PakistanTel: 048 688 9211 - 13Fax: 047 763 1011
Websitewww.shakarganj.com.pkNote: This Report is available onShakarganj website.
Registered and Principal Office10th Floor, BOP Tower10-B Block E 2, Gulberg IIILahore, PakistanTel: 042 3578 3801- 06Fax: 042 3578 3811
Karachi Office12th Floor, Sidco Avenue Centre264 R.A. Lines, Karachi, PakistanTel: 021 3568 8149Fax: 021 3568 0476
Faisalabad OfficeNishatabad, New Lahore RoadFaisalabad, PakistanTel: 041 875 2810Fax: 041 875 2811
Share RegistrarCorpTec Associates (Pvt) Limited503-E, Johar TownLahoreTel: 042 3517 0336 - 7Fax: 042 3517 0338E-mail: [email protected]
Annual General MeetingThe 46th Annual General Meeting ofShakarganj Mills Limited will be heldon Tuesday, 28 January 2014 at 11:30a.m. at Qasr-e-Noor, 9-E-2, MainBoulevard, Gulberg III, Lahore
07

08
Late Mian Mazhar Karim(12 July 1935 - 12 September 2013)
Surely we belong to Allah and to Him shall we return

OBITUARY
We report with sadness that MIAN MAZHAR KARIM, founding member of Crescent Group & Chairman of the
Board of Directors of your Company passed away on 12 September 2013. He was 78 years old.
May Allah rest his soul in eternal peace
Mian Mazhar Karim's tenure as chairman at Shakarganj Mills Limited spanned over three decades. His superb
leadership during this time, marked by transition and financial challenges, is widely recognized as laying the
groundwork for the Crescent Group and Company's success. The Board, the management and all others while
paying glowing tribute to him, acknowledge his tremendous contributions for the Crescent Group, Company
and the economy of this country.
His affiliation with Crescent Group spans over sixty years. He was continuously involved with Crescent Group
activities, as a senior director, strong financial supporter, an effective executive volunteer, and a committed
guardian who never hesitated to accept the obligations of multiple board memberships and chairmanships.
All who knew Mian Mazhar Karim, remark on his personal integrity, business acumen, and unwavering
determination. He was known for considerable personal charm and wit and great sensitivity to others. Mian
Sahib had many affiliations, including chairman of Pakistan Jute Mills Association, senior trustee of Crescent
Foundation, trustee of Crescent Educational Trust and senior director of The Crescent Textile Mills Limited. He
was also the chairman of the Board of Directors of Crescent Steel & Allied Products Limited. He also served as
a director/trustee of numerous other companies and foundations. Mian Mazhar Karim will serve as a role model
for the coming generations and will always be fondly remembered and missed.
May Allah the Almighty rest his soul in eternal peace and give patience to his loved ones to bear thisgreat loss
09

10
Shakarganj Mills Limited was incorporated in Pakistanin 1967 as a Public Limited Company and is listed onall three stock exchanges of Pakistan. Shakarganj isa leading manufacturer of food products, bio fueland building materials as well as textiles. We transformrenewable crops such as sugarcane and cotton intovalue added products comprising refined sugar,textiles, bio fuel and building materials in additionto generating bio power from biogas. The Companyhas two manufacturing facilities in Jhang District.Our registered office is in Lahore.
Shakarganj Mills, through its interest in ShakarganjFood Products Limited, is also active in productionof dairy and fruit products.
Sugar Business:
We have two manufacturing facilities, located inDistrict Jhang. We produce different types of sugarcomprising pharmaceutical, beverage andcommercial grades sugar as well as soft brown sugar,castor and icing sugar, sugar cubes, sachets and retailpacks.
Our combined crushing capacity is of 20,000 MT ofsugarcane per day which is extendable to 32,000 MTper day.
Bio Fuel Business:
We have distilleries located at Jhang and Bhonewhere various grades of bio fuel are produced. Ourproducts include rectified bio fuel for industrial andfood grades, anhydrous bio fuel for fuel grade andextra neutral bio fuel for pharmaceutical and perfumegrades. The combined capacity of our distilleries is280,000 - 300,000 litres per day.
Bio Power Business:
Biogas power generation facility is located at Jhang.
This facility comprises an Effluent Treatment Plant(ETP) and a Power Generation Facility. ETP operationsinvolve biological treatment of distillery waste toproduce methane and a biological de-sulphurizationplant to remove sulphur from the methane gas. Thisgas is then used in the power house to produceelectricity which is sold to a utility company on thenational grid. The present capacity of this plant is 8megawatts. For better control, from January 2013ETP has been transferred to Bio Fuel Business.
Building Materials Business:
Our Building Materials Division is located at Jhangfacility, with a capability to produce 12 x 4 feet sheetsof particle board of varying thickness. Our dailyproduction capacity is 30 cubic metres.
Textile Business:
Located at Jhang, this cotton spinning unit producescarded cotton yarns ranging from 10/s to 30/s anddoubled cotton yarn ranging from 8 to 15 TPI. Theinstalled capacity is 25,856 spindles for cottonspinning and 2,304 spindles for doubling.
Farming & Allied Business:
This comprises different parcels of land mainly locatedat Jhang Division nearby our manufacturing facilities.Total area under cultivation is over 1,800 acres ofwhich nearly 1,355 acres is owned land and rest isleased. The main crops include sugarcane, wheat,gram, maize, fodder and seasonal vegetables. A dairyfarm located at Jhang has been developed, with aherd of 250 milking and fattening cattle. Small herdof rams and bucks for fattening purpose has alsobeen developed.
Shakarganj has also launched a new product in thearea of non chemicals fertilizers under the brandname of “Shakarganj Tiger Compost”. The product as
COMPANY PROFILE

11
organic fertilizer has been developed using aerobicdecomposition process with addition of standardizedmicrobial culture in filter cake. The compost is a richsource of organic matter, with macro and micronutrients to help improve soil is very useful for bettergrowth, yield and quality of all field crops in generaland specifically for sugarcane. This is at its initial stageand would grow up in the farmer’s community withthe practical exposures.
Business Vision and Strategy:
Shakarganj’s vision is to create country’s leadingrenewable ingredients business. We aim to achieve thisby building a consistent portfolio of distinctive,profitable, high-value solutions in products and servicesfor our customers. Shakarganj is committed to providelong-term value for our shareholders. Our strategy isto build a stronger value added business with a low-cost commodity base.
We focus on five key business objectives to deliverconsistent growth.
- Serve our Customers:
Delivering excellent customer service is at the core ofeverything we do. Our aim is to be the partner of choicein our customers’ processes and to help them developmore successful consumer products.
- Operate Efficiently and Safely:
We aim to be the lowest-cost and most efficientproducer in all our markets. Through our expertise inhigh-volume process management, our focus is ontechnical and manufacturing excellence and theefficient use of services such as logistics and utilities.We are continually working to improve operational
efficiency and strive to ensure safe and healthyconditions for everyone at our sites.
- Invest in Long Term Assets and Partnerships:
We continually evaluate investment opportunities thatwould add strategic value by enabling us to enter newmarkets or add products, technologies and knowledgemore efficiently than we could organically. We also aimto grow our business by forming joint ventures andpartnerships to enhance the capabilities of our existingproduct portfolio. Using alliances and joint venturescan be an efficient way to lower our cost of investingin new areas and markets, and will help secure accessto new and complementary technology and expertise.
- Invest in Technology and People:
We are investing in our research and developmentcapabilities to help us in developing innovativesolutions that meet our customers’ product challenges.We are also complementing our own capabilitiesthrough business and technology partnerships, anduniversity collaborations. To develop talent, improveleadership and help our employees succeed, we operatevarious programs designed to ensure the right skills atall levels to grow our business.
- Grow the Contribution from Value AddedProducts:
We are committed to grow the contribution from ourvalue added products. Value added products utilizetechnology and intellectual property enabling us toobtain a price premium along with sustainable and/orhigher margins.
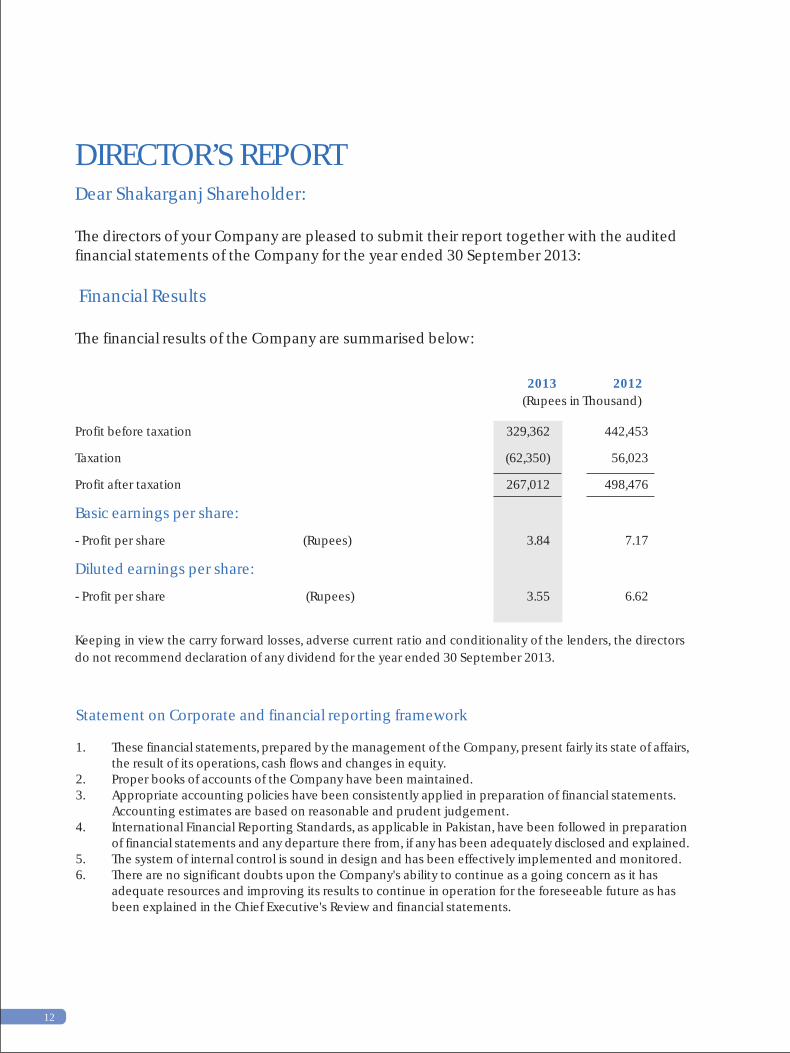
2013 2012 (Rupees in Thousand)
Profit before taxation 329,362 442,453
Taxation (62,350) 56,023
Profit after taxation 267,012 498,476
Basic earnings per share:
- Profit per share (Rupees) 3.84 7.17
Diluted earnings per share:
- Profit per share (Rupees) 3.55 6.62
Keeping in view the carry forward losses, adverse current ratio and conditionality of the lenders, the directorsdo not recommend declaration of any dividend for the year ended 30 September 2013.
Dear Shakarganj Shareholder:
The directors of your Company are pleased to submit their report together with the auditedfinancial statements of the Company for the year ended 30 September 2013:
Financial Results
The financial results of the Company are summarised below:
DIRECTOR’S REPORT
Statement on Corporate and financial reporting framework
1. These financial statements, prepared by the management of the Company, present fairly its state of affairs,the result of its operations, cash flows and changes in equity.
2. Proper books of accounts of the Company have been maintained.3. Appropriate accounting policies have been consistently applied in preparation of financial statements.
Accounting estimates are based on reasonable and prudent judgement.4. International Financial Reporting Standards, as applicable in Pakistan, have been followed in preparation
of financial statements and any departure there from, if any has been adequately disclosed and explained.5. The system of internal control is sound in design and has been effectively implemented and monitored.6. There are no significant doubts upon the Company's ability to continue as a going concern as it has
adequate resources and improving its results to continue in operation for the foreseeable future as hasbeen explained in the Chief Executive's Review and financial statements.
12

7. The significant deviations from last year in operating results have been explained in detail together withthe reason thereof in the Chief Executive's Review as endorsed by the Directors.
8. Key operating and financial data for the last six years in summarized form is annexed.9. The outstanding statutory duties, taxes, charges and levies, if any have been fully disclosed in the financial
statements.10. The significant plans and decisions particularly corporate restructuring of the Company along with future
prospects and risks & uncertainties have been briefly outlined in the Chief Executive's Review as endorsedby the Directors. The detail information is also available in financial statements.
11. The directors of the Company having 15 years of experience on the board of a listed company are exemptfrom the requirements of directors training program. All the board members except two qualify for exemptionunder this provision of the Code. As per arrangement of the Company, one of the directors has completedtraining course in March 2013 and the Company will also arrange training for remaining directors as perrequirements.
12. Total number of regular employees at the end of the year was 2,118.13. Following is the value of investments of funds based on their respective audited accounts for the year ended
30 September 2013:
Gratuity Fund Rupees 48.75 millionPension Fund Rupees 285.88 millionProvident Fund Rupees 143.96 million
Auditors
The auditors KPMG Taseer Hadi & Co., Chartered Accountants, will retire and are eligible for re-appointment asauditors of the Company for the next year. The Audit Committee of the Board has recommended the re-appointmentof KPMG Taseer Hadi & Co, Chartered Accountants as auditors for the year ending 30 September 2014 forconsideration of members at the forthcoming Annual General Meeting.
Meetings of the Board of Directors
During the year four (4) meetings of the Board of Directors, four (4) meetings of the Audit Committee and one (1)meeting of the Human Resource and Remuneration Committee were held and the attendance of each Directoris annexed herewith.
Pattern of Shareholding
The pattern of shareholding and additional information thereof is attached.
No trade in the shares of the Company was carried out by the directors, executives and their spouses and minorchildren except the following:
Name of Director/ Shares purchased Shares SoldSpouses / Executive
Mr. Ahsan M. Saleem 500 45Mr. Anjum M. Saleem 1,565,087 -Mr. Altaf M. Saleem 25,141 -Mr. Ali Altaf Saleem 240 -Mrs. Shahnaz A. Saleem 126 -Mrs. Saira Anjum Saleem 221 -
13

Directors
Mian Mazhar Karim, founding member of Crescent Group and Chairman of the Board of Directors of your Companypassed away on 12 September 2013. May Allah rest his soul in eternal peace. Mian Mazhar Karim's tenure aschairman at Shakarganj Mills Limited spanned over three decades. His superb leadership during this time, markedby transition and financial challenges, is widely recognized as laying the groundwork for the Company's success.The Board while paying glowing tribute to him, acknowledge his tremendous contributions for the Company andthe economy of this country. The Board has co-opted Mr. Shehryar Mazhar as director to fill in the casual vacancyfor the remainder of the Board's term.
During the year, Mrs. Rubina Rizvi (Nominee NIT) resigned from the Board of Directors. The Board has co-optedMr. Rasul Bux Phulpoto, also Nominee NIT for the remainder of the Board's term. While welcoming the newlyappointed director, the board records its appreciation for the valuable contribution of outgoing director.
Default in payments of debts
The details of overdue debts and the measures taken by the Company to address and settle such default situationhas been adequately explained in the Chief Executive's Review which is endorsed by the Directors. The detailedinformation is also available in the financial statements.
Financial Statements
The financial statements of the Company have been duly audited and approved without qualification by theauditors of the Company, KPMG Taseer Hadi & Co, Chartered Accountants and their report is attached with thefinancial statements. The Company auditors have given a paragraph of emphasis drawing attention to the conditionsthat may affect the Company's ability to continue as a going concern, for which complete information andexplanation are included in the Chief Executive's Review.
Chief Executive's Review
The directors endorse the contents of the Chief Executive's Review for the year ended 30 September 2013 whichcontains the state of Company's affairs, operational performance, debts status and default and a reasonableindication of the future prospects and other requisite information. The contents of the report shall be read alongwith this report and shall form an integral part of the Directors Report in terms of Section 236 of the CompaniesOrdinance, 1984 and requirements of Code of Corporate Governance under Listing Regulations of the StockExchanges.
No material changes and commitments affecting the financial position of the Company have occurred betweenthe end of the financial year to which this balance sheet relates and the date of the Director’s Report.
By Order of the Board
Ahsan M. SaleemDate: 26 December 2013 Chief Executive Officer
14
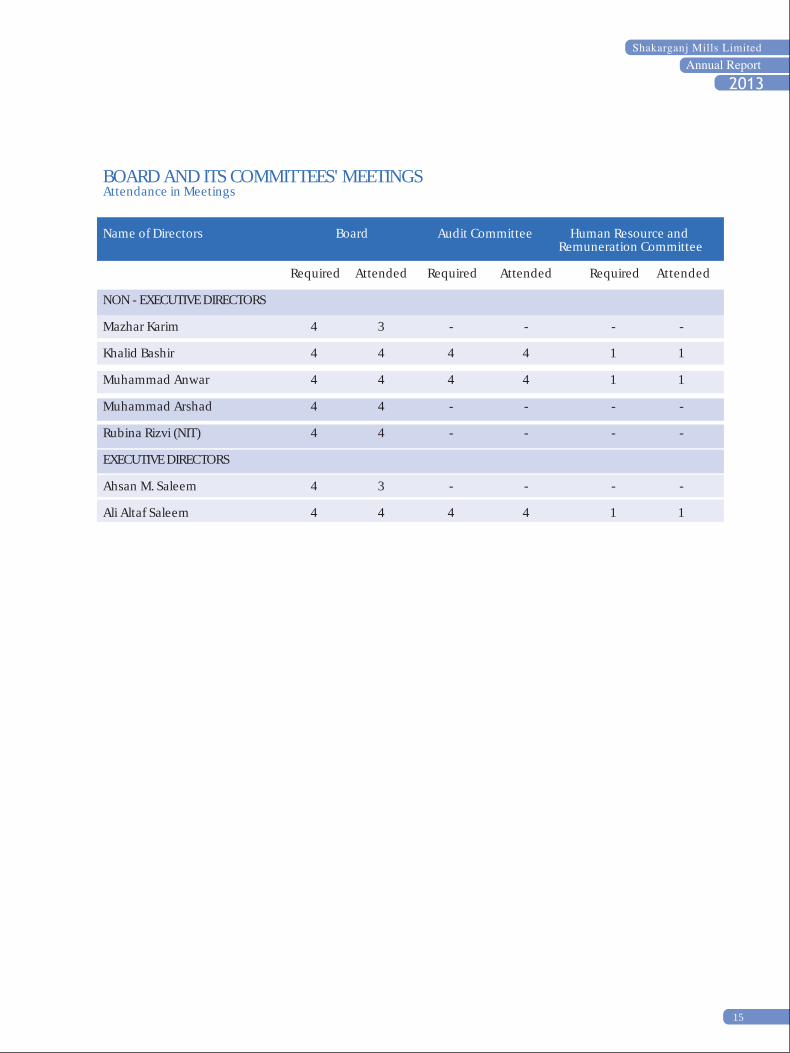
Name of Directors Board Audit Committee Human Resource and Remuneration Committee
Required Attended Required Attended Required Attended
NON - EXECUTIVE DIRECTORS
Mazhar Karim 4 3 - - - -
Khalid Bashir 4 4 4 4 1 1
Muhammad Anwar 4 4 4 4 1 1
Muhammad Arshad 4 4 - - - -
Rubina Rizvi (NIT) 4 4 - - - -
EXECUTIVE DIRECTORS
Ahsan M. Saleem 4 3 - - - -
Ali Altaf Saleem 4 4 4 4 1 1
BOARD AND ITS COMMITTEES' MEETINGSAttendance in Meetings
15
CHIEF EXECUTIVE'S REVIEWI welcome you to the 46th Annual General Meeting of Shakarganj Mills Limited. It is my pleasure to present theaudited financial statements of the Company for the year ended 30 September 2013.
Performance of your Company during the year under review has improved further and your Company has postedpositive results for the current year as well. Higher sugarcane recovery, better results in the Textile Division, andimproved performance of the stock market have all contributed to the positive results in FY 2012-13.
Our Sugar Division crushed 1,409,811 MT of sugarcane to produce 133,753 MT of sugar, at a recovery of 9.49percent. This was an overall increase of 7% in sugar recovery compared to the previous fiscal year where weproduced 173,620 MT of sugar from 1,957,358 MT of sugarcane at a recovery of 8.87 percent. Our research anddevelopment activities to promote new varieties of sugarcane have contributed significantly to this improvementin sucrose recovery.
Bio fuel production for the year fell to 63.37 million litres from 93.80 million litres in the previous year, a decreaseof 32% due to unavailability of sufficient quantities of molasses. The Company still maintained its position as thenumber one exporter of bio fuel, qualifying for Best Export Trophy awarded by the Federation of Pakistan Chambersof Commerce & Industry (FPCCI). Export sales accounted for about 93 percent of our total sale of bio fuel.
Bio power generation by the Company was adversely affected by inconsistent distillery operations and non-availability of sufficient spent wash beyond July 2013, the output during the year was 22.86 million units ascompared to previous year generation of 27.78 million units. As a result of extensive repair & maintenance ofbio gas generators, the profitability also remained under pressure.
In the period under review, our Building Materials Division produced 6,963 cubic metres of particle boardcompared to the record production of 8,789 cubic metres during the previous year. We used our own bagasseas well as purchase bagasse from other sugar mills to maximize capacity utilization at this division, however, dueto non-availability of power beyond July 2013, the production had to be stopped.
Despite 95% capacity utilisation, yarn production at our Textile Division fell slightly to 6.60 million kg from 6.80 millionkg in the previous year. Profits from this division, however, contributed significantly toward the bottom line.
Business & Financial Review:
Lower crushing affected almost all our business segments, however, the overall performance of the Companyduring the FY2012-13 was satisfactory. Due to non-availability of molasses, the production of bio fuel sufferedin last quarter as well as closure of bio power business. All these factors impacted adversely the operationalresults as the Company earned an operating profit of Rs 569 million compared to Rs 1,033 million in the previousyear. The profit after tax earned during the year was Rs 267 million as compared to Rs 498 million during theprevious year. As explained in our last annual report, the Company has been in a tight liquidity position sincelast few years. Our current ratio has been adversely affected due to reclassification of various long term obligationsas short term borrowings. This has led to the current liabilities of the Company exceeding its current assets byRs 5,197 million. As at 30 September 2013, the total overdue principal and markup amounted to Rs 2,409. Themanagement has taken a number of steps to overcome these issues including restructuring of loans andrepayments, with cooperation from its existing lenders.
As a part of the restructuring process, the Company has successfully disposed off several assets such as theDargai Shah Sugar & Bio Power Units, partial divestment of Safeway Mutual Fund Limited, Asian Stocks FundLimited and some agricultural land. The detail of restructuring process, significant future plans, defaults inpayments of debts and reasons thereof etc. have been given in financial statements particularly in Note 1.2,annexed to the accounts. The Company has successfully negotiated with a majority of its lenders on bilateralterms and obtained various short term finance facilities to help overcome the liquidity crunch and increasedcapacity utilization.
Keeping in view the position, without qualifying their opinion, the Company auditors' have given a paragraphof emphasis in auditors' report drawing attention to conditions that may affect the Company's ability to continueas a going concern. The Company believes that there is no significant doubt upon its ability to continue as agoing concern as it has adequate resources & operating capabilities to continue in operation for the foreseeablefuture. It will continue as a going concern as the current situation is temporary in nature and would reverse innear future because of support from all stakeholders and concerted efforts being made by the management.The management is also confident that through restructuring of liabilities, availability of improved liquidity,higher operational activities and positive financial results, the Company will be able to remove the doubts of
16

its ability as a going concern as stated by the auditors in the paragraph of emphasis. The steps taken by themanagement so far and planned in future are explained in Note 1.2 to the financial statements.
Corporate Social Responsibility
We actively seek opportunities to contribute to the communities in which we do business and to improve theenvironments that sustain us all. Areas of primary focus are education, health and safety, energy conservation andwaste reduction, and community building. We always aim to be an exemplary corporate citizen and health andsafety and environmental concerns are always among our key focal points. Our Social Action Programme deliversa variety of social services in our extended community under the banner of “Sukh Char Programme” These servicesinclude education, healthcare, promotion of arts and protection of our cultural heritage. During the year Shakarganjcontributed around Rs. 10 million toward these activities. As a responsible member of the corporate community,Shakarganj always contributes substantially towards the national economy on account of taxes and othergovernment levies. The year under consideration was no different and your Company's contribution to federal,provincial and local taxes was in excess of Rs 426 million.
Outlook
The external environment in the country will continue to remain challenging for some time to come, however, thegovernment at both federal and provincial levels seems determined to revive the industrial sector and has takenvarious steps to remove bottlenecks to improvement. Investors are offered various incentives and several schemesare announced to encourage revival of the industrial sector.
As mentioned in our Future Outlook section of our previous report, performance of the Company strongly dependson the selling price of sugar and performance of its bio fuel & alternate energy business. Government permissionto export sugar, while offering various incentives to help offset the costs related to such exports had a positiveimpact on profitability. Increases in sugar prices, both at the domestic, as well as international level will affect ourbottom line positively.
Our agricultural farming part of Sugar Division also showed significant improvement in its results and contributedpositively towards the bottom line. The management has also planned to arrange increased financing in order tosatisfy the demand for molasses in order to run Bio Fuel operations throughout the year in Fiscal 2014 and aimto avoid the closure situation suffered in Fiscal 2012-2013.
We expect the Textile Division continue its positive contribution in future by improving electricity supply to themanufacturing operation and better marketing of yarn to achieve better profitability. Other business segmentswould continue to contribute to the profits of the Company.
We hope that in spite of all the challenges, next season would be better comparatively, and with the improvementin productivity of various divisions, the Company would continue on track of profitability.Shakarganj has always had a positive forward looking approach in its operations and hopes for the same for allits business segments. We expect to achieve economies of scale, revisiting and simplifying our organizationallayout and reducing costs company-wide for coming years.
General
The Directors are always a source of guidance and support for the management and we appreciate their commitmentto your Company's progress and prosperity. The Directors would also like to express their appreciation for thededicated efforts, loyalty and hard work of the workers, staff and members of the management team. Our sugarcanefarmers are the backbone of our industry and we thank them for their continued support. I would also like to thankour shareholders, customers and other stakeholders for their continued support.
By Order of the Board
On behalf of the Board
Ahsan M. SaleemDate: 26 December 2013 Chief Executive Officer
17

PRODUCTION DATA
Duration Cane Raw Sugar Sugar Season Crushed Processed Produced Recovery
Season (Days) (MT) (MT) (MT) (Percent)
2012-13 135 1,409,811 133,753 9.492011-12 164 1,957,358 173,620 8.872010-11 136 1,567,361 141,549 9.012009-10 109 913,272 78,540 8.622008-09 110 784,056 71,600 9.132007-08 174 2,254,712 177,092 7.852006-07 155 1,587,929 128,170 8.042005-06 170 1,288,548 92,968.40 178,934 6.972004-05 160 1,324,510 67,930.40 177,679 8.632003-04 159 1,614,539 136,813 8.482002-03 196 1,675,370 127,060 7.582001-02 195 1,704,812 128,000 7.532000-01 161 1,054,992 27,811.59 105,550 7.501999-00 144 524,377 39,965 7.631998-99 157 1,350,119 101,479 7.511997-98 163 1,434,389 112,430 7.851996-97 176 1,036,955 79,740 7.691995-96 151 763,316 60,285 7.921994-95 157 1,057,036 86,075 8.111993-94 196 1,203,371 88,117 7.341992-93 161 691,839 54,055 7.851991-92 174 746,506 63,986 8.571990-91 204 866,552 65,537 7.561989-90 187 708,632 57,912 8.171988-89 170 446,325 36,367 7.701987-88 193 698,605 55,726 7.981986-87 149 333,601 27,899 8.361985-86 113 237,602 20,625 8.661984-85 168 441,718 39,523 8.961983-84 173 427,169 35,501 8.311982-83 173 361,291 29,440 8.161981-82 207 466,040 39,474 8.471980-81 187 287,723 25,562 8.891979-80 112 61,207 5,619 8.951978-79 114 107,106 9,267 8.801977-78 177 319,960 27,620 8.611976-77 166 308,987 26,086 8.451975-76 157 246,394 18,865 7.611974-75 107 104,069 8,253 8.301973-74 101 87,825 5,477 6.28
18

Process Building Losses Molasses Bio Fuel Materials Yarn Bio Power (Percent) (MT) (Litres) (m3) (Bags) (MWh)
2.16 61,450 63,372,339 6,963 146,466 22,8652.20 93,575 93,796,731 8,789 149,872 27,7792.02 70,505 68,860,824 5,920 86,209 21,8262.05 40,901 22,669,768 3,562 149,878 27,292 1.95 33 ,070 33,319,694 1,643 148,426 23,542 2.17 117,742 66,490,739 6,540 149,788 17,714 2.30 79,340 35,093,676 1,834 135,935 2.54 71,008 27,625,611 1,477 133,580 2.17 66,190 33,245,964 3,584 119,106 2.41 81,953 35,408,000 5,141 119,922 2.36 84,277 26,233,000 1,668 109,096 2.42 91,890 15,800,156 5,670 96,326 2.31 53,601 10,469,000 1,571 82,063 2.20 24,243 4,967,000 497 96,999 2.23 61,756 5,324,756 1,922 103,555 2.38 73,477 6,350,000 2,784 85,259 2.50 54,711 6,015,000 98,406 2.65 39,397 2,573,700 2,118 83,542 2.77 53,172 5,460,000 5,299 73,938 2.65 60,150 5,250,076 4,335 50,880 2.68 35,980 4,887,020 1,663 115,488 2.53 37,710 4,525,900 3,360 117,902 2.59 47,135 3,422,204 643 113,341 2.31 33,180 3,030,217 97,388 2.44 22,410 2.61 38,740 308,494 2.24 15,060 1,855,809 2.29 11,470 20,239 2.38 22,580 2.40 21,860 2.44 16,255 2.48 21,255 2.42 13,373 2.25 2,358 2.27 4,147 2.44 14,103 2.67 15,228 2.68 11,424 2.75 4,182 3.57 4,726
19

2013 2012 2011 2010 2009 2008Operating Results:Net Sales (Rs 000) 13,507,225 14,762,318 13,354,705 7,794,204 5,101,667 6,789,572Cost of Sales (Rs 000) 12,512,771 13,044,568 12,061,782 7,081,788 4,783,640 6,110,885Gross Profit (Rs 000) 994,454 1,717,750 1,292,923 712,416 318,027 678,687Operating Profit/(Loss) (Rs 000) 568,825 1,033,342 841,167 337,602 (522,307) 208,468Profit/(Loss) Before Tax (Rs 000) 329,362 442,453 (48,195) (675,690) (1,841,910) (794,904)Profit/(Loss) After Tax (Rs 000) 267,012 498,476 (81,523) (879,727) (1,957,821) (806,025)Dividends (Rs 000) - - - - - -Earnings/(Loss) Before Interest, Taxes, Depreciation & Amortization (Rs 000) 1,110,038 1,457,672 1,196,749 547,336 (114,083) 591,974
Per Share Results and Return:Earning Per Share (Rupees) 3.84 7.17 (1.17) (12.66) (28.16) (11.59)Cash Dividend Per Share (Rupees) - - - - - -Dividend Yield Ratio (%) - - - - - -Dividend Pay Out Ratio (%) - - - - - -Market Price Per Share at the end of the year (KSE 100 Index) (Rupees) 19.50 12.90 4.9 4.13 8.12 11.84Price Earning Ratio (Times) 5.08 1.80 (4.19) (0.33) (0.29) (1.02)
Financial PositionReserves (Rs 000) 1,187,887 970,230 892,985 969,241 950,008 1,084,562Current Assets (Rs 000) 1,414,570 2,519,539 2,064,613 3,321,289 2,236,267 4,269,970Current Liabilities (Rs 000) 6,611,816 7,569,321 7,355,989 6,567,466 7,365,047 6,375,012Net Current Assets / (Liabilities) (Rs 000) (5,197,246) (5,049,782) (5,291,376) (3,246,177) (5,128,780) (2,105,042)Property, Plant and Equipment (Rs 000) 6,252,667 6,401,019 5,241,210 4,471,988 6,385,995 5,304,266Total Assets (Rs 000) 8,810,991 9,726,433 7,982,265 8,271,886 10,173,421 12,406,788Long-Term Debt (Rs 000) 2,135,741 2,410,570 2,794,162 2,736,067 2,849,736 2,930,753Shareholders' Equity (Rs 000) 21,110 (603,224) (1,178,945) (1,206,392) (345,917) 1,620,254Share Capital (Rs 000) 695,238 695,238 695,238 695,238 695,238 695,238Break-up Value per Share (Rupees) 0.30 (8.68) (16.96) (17.35) (4.98) 23.31Break-up Value per share includingSurplus on Revaluation of Fixed Assets (Rupees) 31.11 24.14 3.42 7.09 19.47 52.70
Financial Ratios:Current Ratio (Times) 0.21 0.33 0.28 0.51 0.30 0.67Long-Term Debt to Capitalization (%) 99.02 133.38 172.99 178.87 113.82 64.40Total Debt to Total Assets (%) 75.45 82.74 97.02 94.04 86.70 70.47Weighted Average Cost Of Debt % 10.38 12.86 13.94 14.15 17.09 14.27Quick / Acid Test Ratio (Times) 0.13 0.10 0.14 0.49 0.16 0.17Earnings before Interest, Taxes, Depreciation & Amortization Margin (EBITDA) (%) 0.08 0.10 0.10 0.07 (0.02) 7.64
Profitability Ratios:Gross Profit Ratio (%) 7.36 11.64 9.68 9.14 6.23 10.00Net Profit Margin (%) 1.98 3.38 (0.61) (11.29) (38.38) (11.87)Average Collection Period (Days) 5.22 6.01 13.43 0.68 0.98 6.46Fixed Assets Turnover (Times) 2.16 2.31 2.55 1.74 0.80 1.20Total Assets Turnover (Times) 1.53 1.52 1.67 0.94 0.50 0.55
Other Data:Depreciation & Amortization (Rs 000) 342,546 285,750 298,815 359,177 408,224 383,133Capital Expenditure (Rs 000) 371,289 311,455 139,072 94,245 880,730 530,551
FINANCIAL HIGHLIGHTS
20
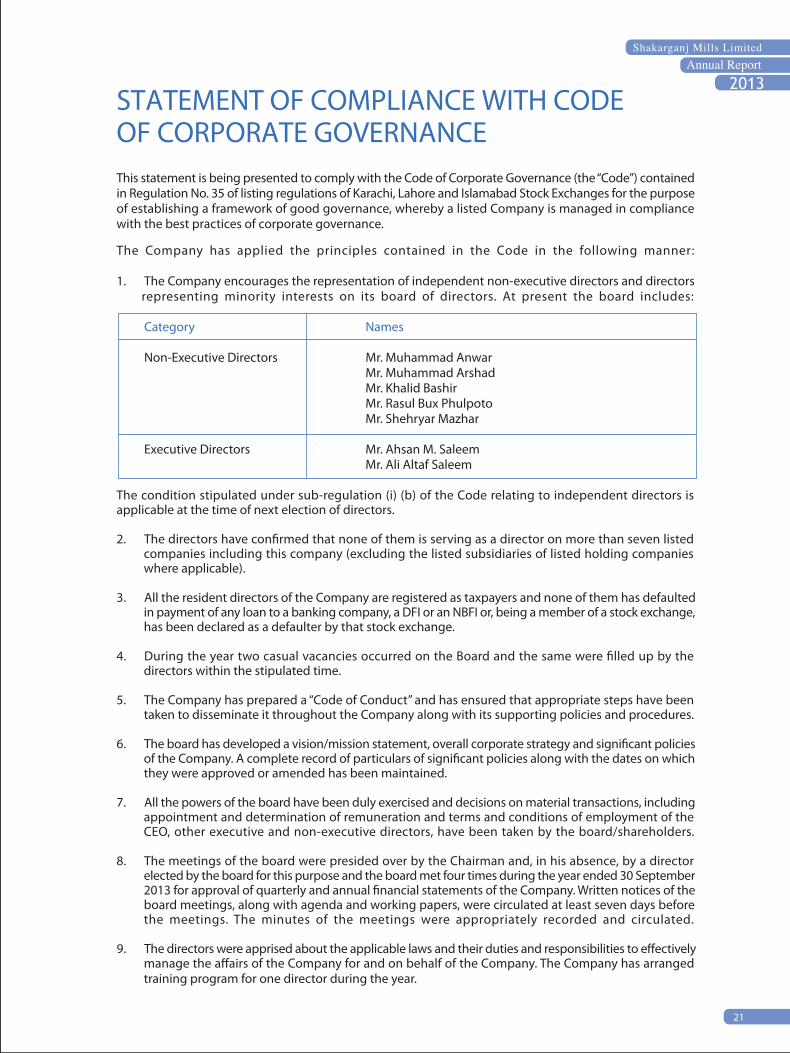
STATEMENT OF COMPLIANCE WITH CODEOF CORPORATE GOVERNANCEThis statement is being presented to comply with the Code of Corporate Governance (the “Code”) containedin Regulation No. 35 of listing regulations of Karachi, Lahore and Islamabad Stock Exchanges for the purposeof establishing a framework of good governance, whereby a listed Company is managed in compliancewith the best practices of corporate governance.
The Company has applied the principles contained in the Code in the following manner:
1. The Company encourages the representation of independent non-executive directors and directorsrepresenting minority interests on its board of directors. At present the board includes:
Category Names
Non-Executive Directors Mr. Muhammad AnwarMr. Muhammad ArshadMr. Khalid BashirMr. Rasul Bux PhulpotoMr. Shehryar Mazhar
Executive Directors Mr. Ahsan M. SaleemMr. Ali Altaf Saleem
The condition stipulated under sub-regulation (i) (b) of the Code relating to independent directors isapplicable at the time of next election of directors.
2. The directors have con�rmed that none of them is serving as a director on more than seven listedcompanies including this company (excluding the listed subsidiaries of listed holding companieswhere applicable).
3. All the resident directors of the Company are registered as taxpayers and none of them has defaultedin payment of any loan to a banking company, a DFI or an NBFI or, being a member of a stock exchange,has been declared as a defaulter by that stock exchange.
4. During the year two casual vacancies occurred on the Board and the same were �lled up by thedirectors within the stipulated time.
5. The Company has prepared a “Code of Conduct” and has ensured that appropriate steps have beentaken to disseminate it throughout the Company along with its supporting policies and procedures.
6. The board has developed a vision/mission statement, overall corporate strategy and signi�cant policiesof the Company. A complete record of particulars of signi�cant policies along with the dates on whichthey were approved or amended has been maintained.
7. All the powers of the board have been duly exercised and decisions on material transactions, includingappointment and determination of remuneration and terms and conditions of employment of theCEO, other executive and non-executive directors, have been taken by the board/shareholders.
8. The meetings of the board were presided over by the Chairman and, in his absence, by a directorelected by the board for this purpose and the board met four times during the year ended 30 September2013 for approval of quarterly and annual �nancial statements of the Company. Written notices of theboard meetings, along with agenda and working papers, were circulated at least seven days beforethe meetings. The minutes of the meetings were appropriately recorded and circulated.
9. The directors were apprised about the applicable laws and their duties and responsibilities to e�ectivelymanage the a�airs of the Company for and on behalf of the Company. The Company has arrangedtraining program for one director during the year.
21

10. The board has approved appointment of CFO, Company Secretary and Head of Internal Audit, includingtheir remuneration and terms and conditions of employment.
11. The directors' report for this year has been prepared in compliance with the requirements of the Codeand fully describes the salient matters required to be disclosed.
12. The financial statements of the Company were duly endorsed by CEO and CFO before approval of theboard.
13. The directors, CEO and executives do not hold any interest in the shares of the Company other thanthat disclosed in the pattern of shareholding.
14. The Company has complied with all the corporate and financial reporting requirements of the Code.
15. The board has formed an Audit Committee. It comprises three members, of whom two are non-executive directors, including the Chairman.
16. The meetings of the audit committee were held four times during the year ended 30 September 2013prior to approval of interim and final results of the Company and as required by the Code. The termsof reference of the committee have been formed and advised to the committee for compliance.
17. The board has formed an HR and Remuneration Committee. It comprises of three members, of whomtwo are non-executive directors and the chairman of the committee is a non-executive director.
18. The board has outsourced the internal audit function to Riaz Ahmad and Company, CharteredAccountants who are considered suitably qualified and experienced for the purpose and are conversantwith the policies and procedures of the company.
19. The statutory auditors of the Company have confirmed that they have been given a satisfactory ratingunder the quality control review program of the ICAP, that they or any of the partners of the firm, theirspouses and minor children do not hold shares of the Company and that the firm and all its partnersare in compliance with International Federation of Accountants (IFAC) guidelines on code of ethics asadopted by the ICAP.
20. The statutory auditors or the persons associated with them have not been appointed to provide otherservices except in accordance with the listing regulations and the auditors have confirmed that theyhave observed IFAC guidelines in this regard.
21. The 'closed period', prior to the announcement of interim/final results, and business decisions, whichmay materially affect the market price of Company's securities, was determined and intimated todirectors, employees and stock exchange(s).
22. Material/price sensitive information has been disseminated among all market participants at oncethrough stock exchange(s).
23. We confirm that all other material principles enshrined in the Code have been complied with.
By order of the Board.
Ahsan M. SaleemDate: 26 December 2013 Chief Executive Officer
22

We have reviewed the statement of compliance with the best practices contained in the Code of CorporateGovernance (“Statement of Compliance”) prepared by the Board of Directors of Shakarganj Mills Limited(“the Company”) to comply with the Listing Regulations of Lahore, Islamabad and Karachi Stock Exchanges,where the Company is listed.
The responsibility for compliance with the Code of Corporate Governance is that of the Board of Directorsof the Company. Our responsibility is to review, to the extent where such compliance can be objectivelyveri�ed, whether the Statement of Compliance re�ects the status of the Company's compliance with theprovisions of the Code of Corporate Governance and report if it does not. A review is limited primarily toinquiries of the Company personnel and review of various documents prepared by the Company to complywith the Code.
As part of our audit of �nancial statements we are required to obtain an understanding of the accountingand internal control systems su�cient to plan the audit and develop an e�ective audit approach. We are notrequired to consider whether the Board's statement on internal control covers all risks and controls, or toform an opinion on the e�ectiveness of such internal controls, the Company's corporate governance proceduresand risks.
Further, Sub- Regulation (x) of Listing Regulation No. 35 of the respective Stock Exchanges, where the Companyis listed, requires the Company to place before the Board of Directors for their consideration and approvalof related party transactions distinguishing between transactions carried out on terms equivalent to thosethat prevail in arm's length transactions and transactions which are not executed at arm's length pricerecording proper justi�cation for using such alternate pricing mechanism. Further, all such transactions arealso required to be separately placed before the audit committee. We are only required and have ensuredcompliance of requirement to the extent of approval of related party transactions by the Board of Directorsand placement of such transactions before the audit committee. We have not carried out any procedures todetermine whether the related party transactions were undertaken at arm's length price or not.
Based on our review, nothing has come to our attention which causes us to believe that the Statement ofCompliance does not appropriately re�ect the Company's compliance, in all material respects, with the bestpractices contained in the Code of Corporate Governance as applicable to the Company for the year ended30 September 2013.
Lahore KPMG Taseer Hadi & Co.Chartered Accountants
Date: 26 December 2013(Bilal Ali)
REVIEW REPORT TO THE MEMBERSON STATEMENT OF COMPLIANCE WITH BESTPRACTICES OF CODE OF CORPORATE GOVERNANCE
23

24

Financial StatementsFor the year ended 30 September 2013
25

26
27
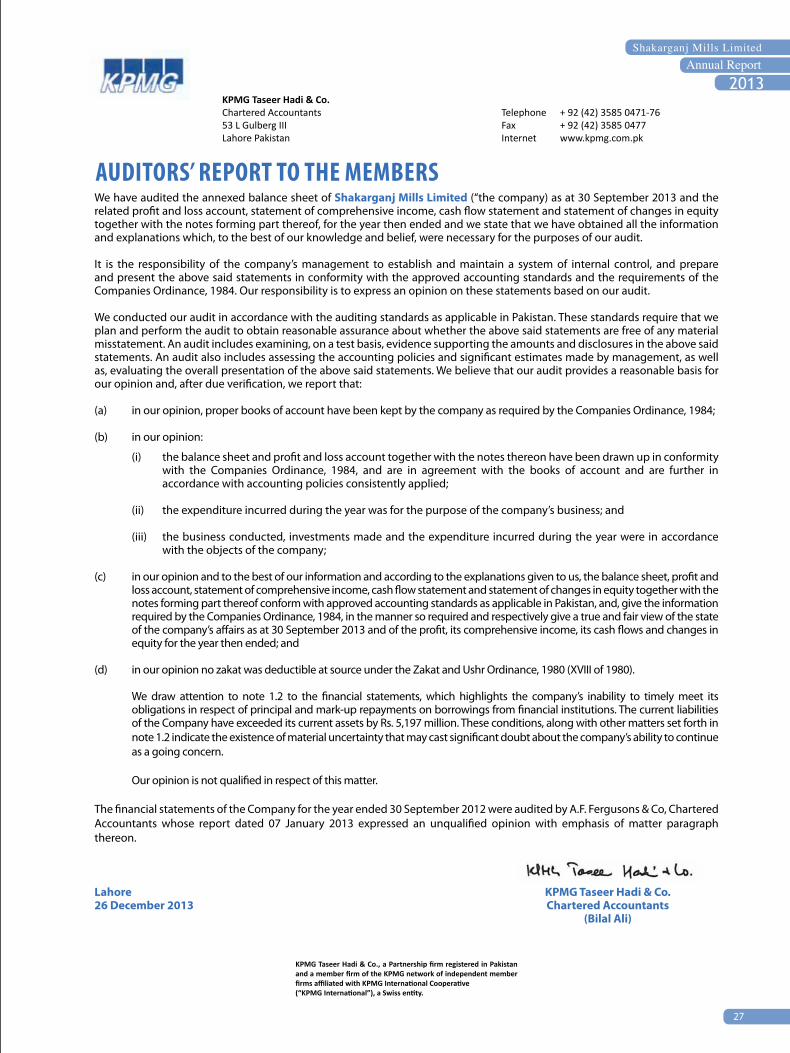
Auditors’ report to the MeMbersWe have audited the annexed balance sheet of Shakarganj Mills Limited (“the company) as at 30 September 2013 and the related profit and loss account, statement of comprehensive income, cash flow statement and statement of changes in equity together with the notes forming part thereof, for the year then ended and we state that we have obtained all the information and explanations which, to the best of our knowledge and belief, were necessary for the purposes of our audit.
It is the responsibility of the company’s management to establish and maintain a system of internal control, and prepare and present the above said statements in conformity with the approved accounting standards and the requirements of the Companies Ordinance, 1984. Our responsibility is to express an opinion on these statements based on our audit.
We conducted our audit in accordance with the auditing standards as applicable in Pakistan. These standards require that we plan and perform the audit to obtain reasonable assurance about whether the above said statements are free of any material misstatement. An audit includes examining, on a test basis, evidence supporting the amounts and disclosures in the above said statements. An audit also includes assessing the accounting policies and significant estimates made by management, as well as, evaluating the overall presentation of the above said statements. We believe that our audit provides a reasonable basis for our opinion and, after due verification, we report that:
(a) in our opinion, proper books of account have been kept by the company as required by the Companies Ordinance, 1984;
(b) in our opinion:
(i) the balance sheet and profit and loss account together with the notes thereon have been drawn up in conformity with the Companies Ordinance, 1984, and are in agreement with the books of account and are further in accordance with accounting policies consistently applied;
(ii) the expenditure incurred during the year was for the purpose of the company’s business; and
(iii) the business conducted, investments made and the expenditure incurred during the year were in accordance with the objects of the company;
(c) in our opinion and to the best of our information and according to the explanations given to us, the balance sheet, profit and loss account, statement of comprehensive income, cash flow statement and statement of changes in equity together with the notes forming part thereof conform with approved accounting standards as applicable in Pakistan, and, give the information required by the Companies Ordinance, 1984, in the manner so required and respectively give a true and fair view of the state of the company’s affairs as at 30 September 2013 and of the profit, its comprehensive income, its cash flows and changes in equity for the year then ended; and
(d) in our opinion no zakat was deductible at source under the Zakat and Ushr Ordinance, 1980 (XVIII of 1980).
We draw attention to note 1.2 to the financial statements, which highlights the company’s inability to timely meet its obligations in respect of principal and mark-up repayments on borrowings from financial institutions. The current liabilities of the Company have exceeded its current assets by Rs. 5,197 million. These conditions, along with other matters set forth in note 1.2 indicate the existence of material uncertainty that may cast significant doubt about the company’s ability to continue as a going concern.
Our opinion is not qualified in respect of this matter.
The financial statements of the Company for the year ended 30 September 2012 were audited by A.F. Fergusons & Co, Chartered Accountants whose report dated 07 January 2013 expressed an unqualified opinion with emphasis of matter paragraph thereon.
Lahore KPMG Taseer Hadi & Co.26 December 2013 Chartered Accountants
(Bilal Ali)
KPMG Taseer Hadi & Co.Chartered Accountants Telephone + 92 (42) 3585 0471-7653 L Gulberg III Fax + 92 (42) 3585 0477Lahore Pakistan Internet www.kpmg.com.pk
KPMG Taseer Hadi & Co., a Partnership firm registered in Pakistan and a member firm of the KPMG network of independent member firms affiliated with KPMG International Cooperative(“KPMG International”), a Swiss entity.

28
bALANCe sheet As at 30 September 2013
Note 2013 2012 (Rupees in thousand)
EQUITY AND LIABILITIES SHARE CAPITAL AND RESERVES Authorized capital 80,000,000 (2012: 80,000,000) ordinary shares of Rs. 10 each 800,000 800,000 50,000,000 (2012: 50,000,000) preference shares of Rs. 10 each 500,000 500,000 1,300,000 1,300,000 Issued, subscribed and paid up capital 69,523,798 (2012: 69,523,798) ordinary shares of Rs. 10 each 5 695,238 695,238 Reserves 1,187,887 970,230 Accumulated loss (1,862,015) (2,268,692)
21,110 (603,224) Surplus on revaluation of property, plant and equipment 6 2,141,914 2,281,579 Non-current liabilities Long term finances 7 26,003 459,964 Liabilities against assets subject to finance lease 8 10,148 18,793
36,151 478,757 Current liabilities Current portion of long term liabilities 10 2,117,610 1,959,402 Short term borrowings 11 1,155,480 2,507,350 Trade and other payables 12 2,422,533 1,979,617 Accrued finance cost 13 916,193 1,122,448 Provision for taxation - 504
6,611,816 7,569,321 Contingencies and commitments 14 - -
8,810,991 9,726,433
The annexed notes 1 to 46 form an integral part of these financial statements.
Chief Executive

29
Note 2013 2012 (Rupees in thousand)
ASSETS NON-CURRENT ASSETS Property, plant and equipment 15 6,252,667 6,401,019 Intangible assets 16 955 1,045 Biological assets 17 13,975 8,895 Investments - related parties 18 1,081,722 750,895 Employees’ retirement benefits 9 8,779 5,071 Long term loans, advances, deposits and prepayments 19 38,323 39,969 Deferred taxation 20 - -
7,396,421 7,206,894
Current assets Biological assets 17 32,600 37,395 Stores, spares and loose tools 21 115,086 129,862 Stock-in-trade 22 522,007 1,765,735 Trade debts 23 71,619 243,138 Investments 24 248,607 119,041 Loans, advances, deposits, prepayments and other receivables 25 324,282 154,767 Cash and bank balances 26 100,369 69,601
1,414,570 2,519,539 8,810,991 9,726,433
ChairmanChairmanChairman
30
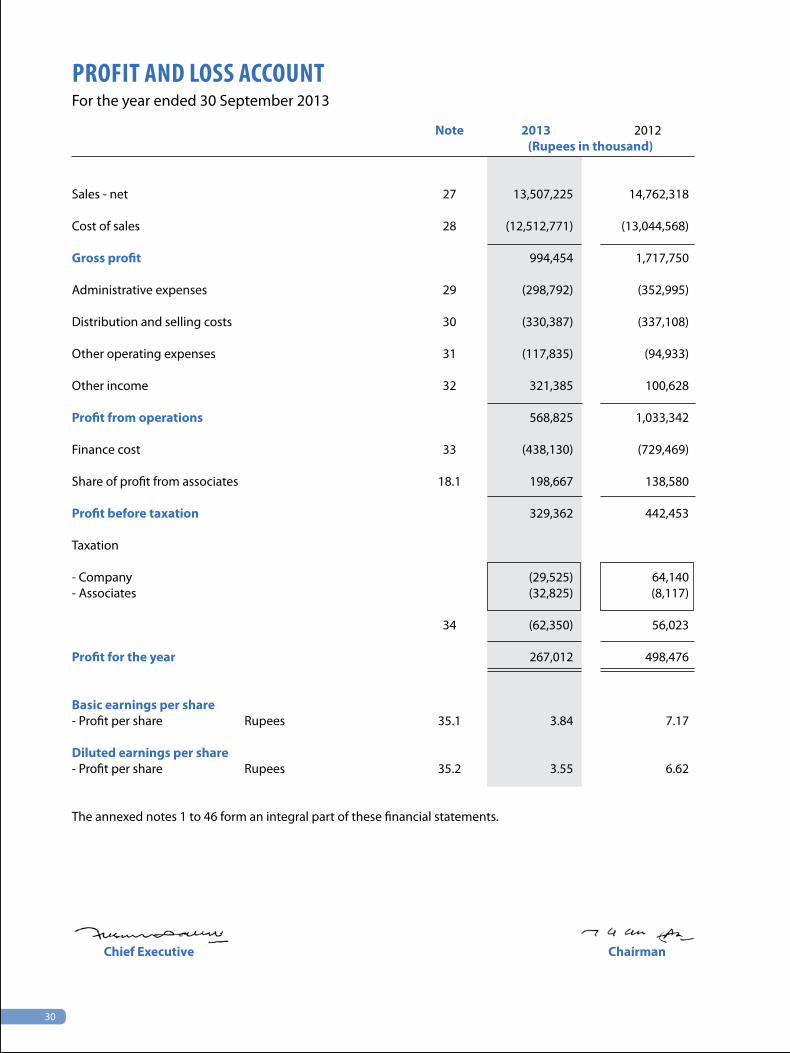
proFit ANd Loss ACCouNt For the year ended 30 September 2013
Note 2013 2012 (Rupees in thousand) Sales - net 27 13,507,225 14,762,318 Cost of sales 28 (12,512,771) (13,044,568) Gross profit 994,454 1,717,750 Administrative expenses 29 (298,792) (352,995) Distribution and selling costs 30 (330,387) (337,108) Other operating expenses 31 (117,835) (94,933) Other income 32 321,385 100,628 Profit from operations 568,825 1,033,342 Finance cost 33 (438,130) (729,469) Share of profit from associates 18.1 198,667 138,580 Profit before taxation 329,362 442,453 Taxation - Company (29,525) 64,140 - Associates (32,825) (8,117)
34 (62,350) 56,023 Profit for the year 267,012 498,476 Basic earnings per share - Profit per share Rupees 35.1 3.84 7.17 Diluted earnings per share - Profit per share Rupees 35.2 3.55 6.62 The annexed notes 1 to 46 form an integral part of these financial statements.
Chief Executive Chairman

31
stAteMeNt oF other CoMpreheNsiVe iNCoMe For the year ended 30 September 2013
2013 2012(Rupees in thousand)
Profit for the period 267,012 498,476 Other comprehensive income Items that may be reclassified to profit and loss
Fair value gain on ‘Available for sale’ investments 210,615 73,326 Share of other comprehensive income of associates 7,042 3,919 Total comprehensive income for the year 484,669 575,721 The annexed notes 1 to 46 form an integral part of these financial statements.
Chief Executive Chairman

32
CAsh FLoW stAteMeNtFor the year ended 30 September 2013
Note 2013 2012 (Rupees in thousand)
Cash flows from operating activities Cash generated from operations 36 2,890,366 1,629,421 Finance cost paid (517,301) (694,650)Taxes paid (146,325) (170,826)Employees’ retirement benefits paid (16,698) (15,443)Net decrease / (increase) in long term deposits 1,381 (33,458) Net cash generated from operating activities 2,211,423 715,044 Cash flows from investing activities Fixed capital expenditure (312,692) (426,094)Dividends received 46,009 36,091 Income from bank deposits received 931 12,467 Proceeds from sale of property, plant and equipment 91,861 57,679 Net cash used in investing activities (173,891) (319,857) Cash flows from financing activities Long term finances - net (512,829) (383,592)Short term borrowings - net (1,484,355) (34,463)Finance lease liabilities - net (9,569) (26,699)Dividends paid (11) (1) Net cash used in financing activities (2,006,764) (444,755) Net increase / (decrease) in cash and cash equivalents 30,768 (49,568)Cash and cash equivalents at the beginning of the year 69,601 119,169
Cash and cash equivalents at the end of the year 26 100,369 69,601
The annexed notes 1 to 46 form an integral part of these financial statements.
Chief Executive Chairman

33
stAteMeNt oF ChANGes iN eQuitYFor the year ended 30 September 2013
C
API
TAL
RESE
RVES
REV
ENU
E RE
SERV
ES
D
iffer
ence
Eq
uity
Shar
e in
of c
apit
al
inve
stm
ent
Acc
umu
late
d
capi
tal
Fair
un
der s
chem
e
Div
iden
d m
arke
t lo
ss
Shar
e Sh
are
rese
rves
of
valu
e of
arr
ange
men
t
equa
li-
valu
e
capi
tal
prem
ium
as
soci
atio
n re
serv
e of
mer
ger
Gen
eral
za
tion
eq
ualiz
atio
n
Tot
al
--
----
----
----
----
----
----
----
----
----
----
----
----
----
----
----
----
----
- (Ru
pees
in th
ousa
nd) -
----
----
----
----
----
----
----
----
----
----
----
----
----
----
----
----
----
-
Bala
nce
as a
t 30
Sept
embe
r 201
1 6
95,2
38
243
,282
1
5,90
4
(38,
437)
1
55,9
30
410
,606
2
2,70
0
83,
000
(2
,767
,168
) (1
,178
,945
)
To
tal c
ompr
ehen
sive
inco
me
for t
he y
ear e
nded
30
Sept
embe
r 201
2
Profi
t for
the
year
-
-
-
-
-
-
-
-
4
98,4
76
498
,476
O
ther
com
preh
ensi
ve in
com
e fo
r the
yea
r:
Fair
valu
e lo
ss o
n ‘A
vaila
ble
for s
ale’
inve
stm
ents
-
-
73,
326
-
-
-
-
-
7
3,32
6
Sh
are
of o
ther
com
preh
ensi
ve in
com
e of
ass
ocia
tes
-
-
3,9
19
-
-
-
-
-
-
3,9
19
-
-
3
,919
7
3,32
6
-
-
-
-
-
77,
245
Tota
l com
preh
ensi
ve in
com
e fo
r the
yea
r -
-
3
,919
7
3,32
6
-
-
-
-
498
,476
5
75,7
21
Bala
nce
as a
t 30
Sept
embe
r 201
2 6
95,2
38
243
,282
1
9,82
3
34,
889
1
55,9
30
410
,606
2
2,70
0
83,
000
(2
,268
,692
) (6
03,2
24)
Profi
t for
the
year
-
-
-
-
-
-
-
-
2
67,0
12
267
,012
O
ther
com
preh
ensi
ve in
com
e fo
r the
yea
r:
F air
valu
e ga
in o
n ‘A
vaila
ble
for s
ale’
inve
stm
ents
-
-
-
2
10,6
15
-
-
-
-
-
210
,615
Sh
are
of o
ther
com
preh
ensi
ve in
com
e of
ass
ocia
tes
-
-
7,0
42
-
-
-
-
-
-
7,0
42
-
-
7
,042
2
10,6
15
-
-
-
-
-
217
,657
Su
rplu
s tr
ansf
erre
d to
acc
umul
ated
loss
es o
n ac
coun
t of
- d
ispo
sal o
f lan
d -
-
-
-
-
-
-
-
9
9,77
0
99,
770
- pro
pert
y, p
lant
and
equ
ipm
ent -
net
of d
efer
red
tax
-
-
-
-
-
-
-
-
39,
895
3
9,89
5
-
-
-
-
-
-
-
-
139
,665
1
39,6
65
-
-
7
,042
2
10,6
15
-
-
-
-
406
,677
6
24,3
34
Bala
nce
as o
n 30
Sep
tem
ber 2
013
695
,238
2
43,2
82
26,
865
2
45,5
04
155
,930
4
10,6
06
22,
700
8
3,00
0
(1,8
62,0
15)
21,
110
The
anne
xed
note
s 1
to 4
6 fo
rm a
n in
tegr
al p
art o
f the
se fi
nanc
ial s
tate
men
ts.
Ch
ief E
xecu
tive
Ch
airm
an

34
Notes to the FiNANCiAL stAteMeNtsFor the year ended 30 September 2013
1. THE COMPANY AND ITS OPERATIONS 1.1 The Company is incorporated in Pakistan and is listed on Karachi, Lahore and Islamabad Stock Exchanges. It
is principally engaged in manufacture, purchase and sale of sugar, bio fuel, building materials, yarn (textile) and engaged in generation and sale of electricity (bio power). The Company has its principal manufacturing facilities at Jhang and satellite manufacturing facilities at Bhone. The registered office of the Company is situated in Lahore.
1.2 Going concern assumption As at the reporting date, the current liabilities of the Company have exceeded its current assets by Rs. 5,197
million (2012: Rs. 5,050 million). However the equity has become positive primarily for reasons of increased share of profits of associates and profit charge on reclassification of investment in Safeway Mutual Fund Limited as mentioned in note 18.2.6. The Company has not been able to meet its various obligations for long term loans, lease financing and short term borrowings. Borrowings (including mark-up payable thereon) aggregating Rs. 2,409 million (2012: Rs. 2,855 million) are over-due for payment.
The Company has been facing liquidity crunch for the last few years. In February 2010, the Company entered into agreements for a bridge finance facility of Rs. 2,466 million and short term running finance facility of Rs. 2,980 million from a consortium of its existing lenders. The bridge finance was envisaged to be operational by April 2010 and fully repaid by June 2011 through sale of certain assets of the Company, identified in the agreement. However, neither the bridge finance facility nor the consortium cash finance could become operative due to delays in obtaining No-objection certificate from National Bank of Pakistan for creation of pari passu charge on the assets against the above new facilities. Furthermore, the Company was not able to liquidate all of the specified assets as per timelines identified in the bridge loan agreement and subsequent to 30 June 2011, these facilities stood expired.
Furthermore, the Company had issued redeemable preference shares in 2005 to the shareholders of the Company which were to be redeemed along with any outstanding dividend payable in December 2009. Due to liquidity crunch the Company has not redeemed the preference shares and preference dividend amounting to Rs. 64.79 million is also outstanding as on 30 September 2013.
The above conditions raise significant doubts on the Company’s ability to continue as a going concern. However, the management is confident of the Company’s ability to continue as a going concern based on its concerted effort to re-profile borrowings and utilisation of improved liquidity in cost efficient operational levels of cane crushing and Bio Fuel manufacturing.
The steps taken by management up till now and planned in future are as follows:
Operational measures
The Company continued with its efforts to achieve operational efficiency in previous year to improve its productivity and financial results in order to generate liquidity for financing of operations and repayment of borrowings. The Company was able to crush 1.410 million tons of sugarcane in current year as compared to 1.957 million tons of sugarcane during the last year but at an increased average recovery of 9.49% (2012: 8.87%). The production of Bio Fuel decreased from 93.80 million litres in last year to 63.37 million litres in current year primarily for reasons of extra ordinary inflationary trends in prices of molasses.
To date the Company has repaid Rs. 1,666 million of the bridge loan through utilisation of improved liquidity resulting from better operational results in current and previous years and sale of certain assets of the Company, namely, Sugar Unit at Dargai Shah, Power Division at Dargai Shah, partial divestment in Safeway Mutual Fund Limited and Asian Stocks Fund Limited and partial disposal of agricultural land.

35
Notes to the FiNANCiAL stAteMeNtsFor the year ended 30 September 2013
After the expiry of Bridge loan facility on 30 June 2011 the Company, in its efforts to re-profile its borrowings, continued the process of negotiations with its lenders seeking short term financing facilities for operational liquidity and relaxation in payments of its existing loan, the details of which are as follows:
Long term financing - secured
The Company requested its lenders for restructuring of over-due balances including mark-up to term borrowings under reduced and/or non-mark-up arrangements. As a result, the Company has been able to restructure/ reschedule various loans from its lenders resulting in relaxation in payments and for others still in over-due deliberations are going on, the details of which are as follows:
- currently negotiating with National Bank of Pakistan to restructure its overdue principal alongwith
mark-up to long term loans with deferred payment terms. Furthermore, the Company is seeking to obtain relaxation / waiver in overdue mark-up on upfront payment;
- restructuring of Rs. 176 million of over-due long term running finance and Rs. 75 million of over-due
accrued mark-up under bridge finance to long term demand finance from The Bank of Punjab;
- restructuring of Rs. 161 million of short term financing and Rs. 76 million of over due mark-up under bridge finance to long term loan under non mark-up arrangements from Allied Bank Limited as explained in note 7.3;
- restructuring of bridge finance of Rs. 181 million to long term loan from United Bank Limited;
- currently in negotiation with MCB Bank Limited for a increased working capital line and relaxation in payment terms. Restructuring of Rs. 473 million of various over-due borrowings to long term loan and rescheduling of long term loan of Rs. 92 million in prior years; and
- negotiating separately with each term finance certificate (TFC) holders for settlement of their
outstanding overdues. During the year, the Company was successful in negotiating its overdue exposure with UBL Fund Managers (one of the TFC holder) as explained in note 7.4.
Short term financing- secured
The Company requested its lenders for following short term secured financing for operational liquidity:
- Working capital line against pledge of sugar at 20% margin for 120 to 150 days with an incentive for
lender to adjust 10% of the new disbursement against settlement of existing over-due loans (principal only); and
- An FE 25 loan in US Dollars with a maturity of 120-150 days after settlement of working capital against
pledge of sugar. Such loan is being offered to be securitised against pledge of molasses/Bio Fuel with an incentive for lender to adjust 20% of the new disbursement against settlement of existing over-due loans (principal only).
Newly disbursed facilities shall be settled upon sale of respective commodities (sugar/ Bio Fuel).

36
The Company after successfully negotiating with some of its lenders on bilateral terms received responses from a number of banks and obtained following working capital lines and FE 25 loans during the year:
Amount (Rupees in million)
Working capital lines:
MCB Bank Limited 1,000 NIB Bank Limited 240 The Bank of Punjab 200 United Bank Limited 540 Bank Alfalah Limited 200 FE 25 loan: Faysal Bank Limited 100 The above facilities have been obtained against pledge of sugar/molasses/Bio Fuel at margin ranging from
15% to 25% and have resulted in significantly improved operational results in current year.
Subsequent to the year ended 30 September 2013, the Company has again requested its lenders for working capital lines for financing of its operations in next year against pledge of stocks of sugar, molasses and Bio Fuel. The Company, as an additional incentive to the lenders, has offered upfront deductions ranging from 5% to 10% on the requested limits for the settlement of overdue / due installments and mark-up. As a result, the Company has been able to secure a working capital line of Rs. 200 million from Standard Chartered Bank Limited with an incentive of reduction in mark-up rate on existing over-dues effective way forward. Furthermore, the bank will release its lien on the shares of Altern Energy Limited and Safeway Mutual Fund pledged with it to enable the Company to sell them. The proceeds realized on sale of above mentioned shares will be used to settle over-due principal and mark-up.
The Company is confident that based on its above mentioned plan it will continue to be supported by the lenders and also be able to reschedule remaining of its existing over-due borrowings as well.
The financial statements have been prepared on a going concern basis based on management’s expectation that:
- the Company will continue to get support of its lenders and will be able to obtain relaxation in
payment terms of its over-due borrowings; and
- the Company will be able to generate adequate liquidity through new short term borrowings and will be successful in utilising such funds to increase its operations and achieve its budgeted targets for production of sugar, Bio Fuel etc.
The financial statements consequently, do not include any adjustments relating to the realisation of its assets and liquidation of any liabilities that might be necessary should the Company be unable to continue as a going concern.
Notes to the FiNANCiAL stAteMeNtsFor the year ended 30 September 2013
37
2. BASIS OF PREPARATION AND STATEMENT OF COMPLIANCE These financial statements have been prepared in accordance with approved accounting standards
as applicable in Pakistan and the requirements of Companies Ordinance, 1984. Approved accounting standards comprise of such International Financial Reporting Standards (IFRSs) issued by the International Accounting Standard Board and Islamic Financial Reporting Standards (IFAs) issued by the Institute of Chartered Accountants of Pakistan as are notified under the provisions of the Companies Ordinance, 1984. Wherever, the requirements of the Companies Ordinance, 1984 or directives issued by the Securities and Exchange Commission of Pakistan differ with the requirements of these standards, the requirements of Companies Ordinance, 1984 or the requirements of the said directives shall prevail.
3. SUMMARY OF SIGNIFICANT ACCOUNTING POLICIES The significant accounting policies adopted in the preparation of these financial statements are set out
below. These policies have been consistently applied to all years presented, unless otherwise stated. 3.1 Accounting convention These financial statements have been prepared under the historical cost convention except for the
measurement of certain items of property, plant and equipment as referred to in note 15 at revalued amounts and recognition of certain employee retirement benefits as referred to in note 9 at present value.
3.2 Taxation Current Provision of current tax is based on the taxable income for the year determined in accordance with the
prevailing law for taxation of income. The charge for current tax is calculated using prevailing tax rates or tax rates expected to apply to the profit for the year if enacted. The charge for current tax also includes adjustments, where considered necessary, to provision for tax made in previous years arising from assessments framed during the year for such years.
Deferred Deferred tax is accounted for using the balance sheet liability method in respect of all temporary differences
arising from differences between the carrying amount of assets and liabilities in the financial statements and the corresponding tax bases used in the computation of the taxable profit. However, the deferred tax is not accounted for if it arises from initial recognition of an asset or liability in a transaction other than a business combination that at the time of transaction neither affects accounting nor taxable profit or loss. Deferred tax liabilities are generally recognized for all taxable temporary differences and deferred tax assets are recognized to the extent that it is probable that taxable profits will be available against which the deductible temporary differences, unused tax losses and tax credits can be utilised.
Deferred tax is calculated at the rates that are expected to apply to the period when the differences reverse
based on tax rates that have been enacted or substantively enacted by the balance sheet date. Deferred tax is charged or credited in the profit and loss account, except in the case of items credited or charged to other comprehensive income or equity in which case it is included in other comprehensive income or equity.
Notes to the FiNANCiAL stAteMeNtsFor the year ended 30 September 2013

38
3.3 Property, plant and equipment
Property, plant and equipment except freehold land and buildings on freehold land are stated at cost less accumulated depreciation and identified impairment loss. Freehold land is stated at revalued amount carried out by independent valuers by reference to its current market price less any identified impairment loss. Buildings are stated at revalued amount carried out by independent valuers by reference to its current market price less accumulated depreciation and identified impairment loss. Any accumulated depreciation at the date of revaluation is eliminated against the gross carrying amount of the buildings, and the net amount is restated to the revalued amount of the buildings. Property, plant and equipment acquired under finance lease are capitalized at the lease’s commencement at the lower of the present value of minimum lease payments under the lease arrangements and the fair value of the leased asset. Costs in relation to certain property, plant and equipment includes borrowing costs referred to in note 3.20.
Increases in the carrying amount arising on revaluation of property, plant and equipment are credited to surplus on revaluation of property, plant and equipment. Decreases that offset previous increases of the same assets are charged against this surplus, all other decreases are charged to income. Each year the difference between depreciation based on the revalued carrying amount of the asset charged to the profit and loss, and depreciation based on the asset’s original cost is transferred from ‘surplus on revaluation of property, plant and equipment’ to ‘other comprehensive income’. All transfers to / from surplus on revaluation of property, plant and equipment are net of applicable deferred income tax.
Depreciation on all property, plant and equipment, except land is charged to profit on the reducing balance method so as to write off the cost of an asset over its estimated useful life at the annual rates given in note 15.1 after taking into account the impact of their residual values, if considered significant.
The assets’ residual values and useful lives are reviewed, at each financial year end, and adjusted if impact on depreciation is significant. The company’s estimate of the residual value of its property, plant and equipment as at 30 September 2013 has not required any adjustment as its impact is considered insignificant.
Depreciation on additions to property, plant and equipment is charged from the month in which the asset is acquired or capitalized, while no depreciation is charged for the month in which the asset is disposed off.
The company assesses at each balance sheet date whether there is any indication that property, plant and equipment may be impaired. If such indication exists, the carrying amount of such assets are reviewed to assess whether they are recorded in excess of their recoverable amount. Where carrying values exceed the respective recoverable amount, assets are written down to their recoverable amounts and the resulting impairment is recognized in income currently. The recoverable amount is the higher of an asset’s fair value less cost to sell and value in use. Where an impairment loss is recognized, the depreciation charge is adjusted in the future periods to allocate the asset’s revised carrying amount over its estimated useful life.
Subsequent costs are included in the asset’s carrying amount or recognized as a separate asset, as appropriate, only when it is probable that future economic benefits associated with the item will flow to the company and the cost of the item can be measured reliably. All other repair and maintenance costs are charged to income during the period in which they are incurred.
The gain or loss on disposal or retirement of an asset represented by the difference between the sale proceeds and the carrying amount of the asset is recognized as an income or expense.
Capital work-in-progress is stated at cost less identified impairment loss, if any.
Notes to the FiNANCiAL stAteMeNtsFor the year ended 30 September 2013

39
3.4 Intangible assets
Intangible assets represent the cost of computer software acquired and are stated at cost less accumulated amortization and any identified impairment loss.
Amortization is charged to income on the straight line basis so as to write off the cost of an asset over its estimated useful life. Amortization on additions is charged from the month in which an asset is acquired or capitalized while no amortization is charged for the month in which the asset is disposed off. Amortization is being charged at annual rates as specified in note 16.
The company assesses at each balance sheet date whether there is any indication that intangible assets may be impaired. If such indication exists, the carrying amount of such assets are reviewed to assess whether they are recorded in excess of their recoverable amounts. Where carrying values exceed the respective recoverable amount, assets are written down to their recoverable amounts and the resulting impairment is recognized in income currently. The recoverable amount is the higher of an asset’s fair value less cost to sell and value in use. Where an impairment loss is recognized, the amortization charge is adjusted in the future periods to allocate the asset’s revised carrying amount over its estimated useful life.
3.5 Biological assets
Biological assets comprise of standing crops and livestock. These are stated at fair value less estimated point-of-sale costs, with any resultant gain or loss recognized in the profit and loss account. The fair value of standing crops is based on the support price fixed by the Government and other factors such as estimated crop yield and area under cultivation. The fair value of livestock is estimated on the basis of market prices of livestock of similar age, breed and genetic merit. Point-of-sale costs include all costs that are necessary to sell the assets, excluding costs necessary to get the assets to the market.
3.6 Leases
The company is the lessee:
Finance leases
Leases where the company has substantially all the risks and rewards of ownership are classified as finance leases. Assets subject to finance lease are initially recognized at lower of present value of minimum lease payments under the lease arrangements and the fair value of assets. Subsequently these assets are stated at cost less accumulated depreciation and any identified impairment loss.
Each lease payment is allocated between the liability and finance cost so as to achieve a constant rate on the balance outstanding. The interest element of the rental is charged to profit over the lease term.
The related rental obligations, net of finance cost, are included in liabilities against assets subject to finance lease as referred to in note 8. The liabilities are classified as current and non-current depending upon the timing of the payment.
Operating leases
Leases where a significant portion of the risks and rewards of ownership are retained by the lessor are classified as operating leases. Payments made under operating leases (net of any incentives received from the lessor) are charged to profit on a straight-line basis over the lease term.
Notes to the FiNANCiAL stAteMeNtsFor the year ended 30 September 2013
40
3.7 Investments
Held to maturity
Investments with fixed maturity that the management has the intent and ability to hold to maturity are classified as held to maturity and are initially measured at cost and at subsequent reporting dates measured at amortized cost using the effective yield method.
Available for sale
Investments, including investments in associated undertakings where the company does not have significant influence, that are intended to be held for an indefinite period or may be sold in response to a need for liquidity, are classified as available for sale. Investments classified as available for sale are initially measured at cost, being the fair value of consideration given. At subsequent reporting dates, these investments are remeasured at fair value, unless fair value cannot be reliably measured. Unrealized gains and losses arising from changes in the fair value are included in comprehensive income in the period in which they arise. Investment in un-quoted subsidiaries are carried at cost.
Investments intended to be held for less than twelve months from the balance sheet date or to be sold to raise operating capital, are included in current assets, all other investments are classified as non-current. Management determines the appropriate classification of its investments at the time of the purchase and re-evaluates such designation on a regular basis.
Held for trading
Investments that are acquired principally for the purpose of generating a profit from short term fluctuations in price are classified as trading investments and included in current assets. These are initially measured at cost and at subsequent reporting dates, these investments are remeasured at fair value. Realized and unrealized gains and losses arising from changes in fair value are included in net profit or loss for the period in which they arise.
The fair value of publicly traded securities is based on market prices quoted on the Karachi Stock Exchange at the balance sheet date. The investments for which a quoted market price is not available, are measured at cost as it is not practical to apply any other valuation methodology.
All purchases and sales of investments are recognized on the trade date which is the date that the company commits to purchase or sell the investment. Transaction costs are charged to profit and loss.
At each balance sheet date, the company reviews the carrying amounts of the investments to assess whether there is any indication that such investments have suffered an impairment loss. If any such indication exists, the recoverable amount is estimated in order to determine the extent of the impairment loss, if any. Impairment losses are recognized as expense. In respect of ‘available for sale’ financial assets, cumulative impairment loss less any impairment loss on that financial asset previously recognized in profit and loss account, is removed from equity and recognized in the profit and loss account. Impairment losses recognized in the profit and loss account on equity instruments are not reversed through the profit and loss account.
Investments in associates
Associates are the entities over which the Company has significant influence but not control, generally represented by a shareholding of between 20% and 50% of the voting right. Investments in associates are accounted for using the equity method of accounting. Under the equity method, the investment is initially
Notes to the FiNANCiAL stAteMeNtsFor the year ended 30 September 2013

41
recognized at cost, and the carrying amount is increased or decreased to recognize the company’s share of the profit or loss of the associate after the date of acquisition. The company’s investment in associates includes goodwill identified on acquisition.
If the ownership interest in an associate is reduced but significant influence is retained, only a proportionate share of the amounts previously recognized in other comprehensive income is reclassified to profit or loss where appropriate.
The Company’s share of its associates post acquisition profits or losses is recognized in the profit and loss account and its share in post acquisition movements in the other comprehensive income is recognized in other comprehensive income with a corresponding adjustment to the carrying amount of the investment. When the Company’s share of losses in associates equals or exceeds its interest in the associate including any other unsecured receivables, the Company does not recognize further losses, unless it has incurred legal or constructive obligations or made payments on behalf of the associates. Gain on transactions between the Company and its associates are eliminated to the extent of the Company’s interest in the associate.
Associates, which the group intends to dispose off within twelve months of the balance sheet date are not accounted for under the equity method and are shown under non-current assets held for sale at the lower of carrying and fair value.
Dilution gains and losses arising in investments in associates are recognized in the income statement.
3.8 Stores, spares and loose tools
Usable stores and spares are valued principally at moving average cost, while items considered obsolete are carried at nil value. Items in transit are valued at cost comprising invoice value plus other charges paid thereon. Provision is made in the financial statements for obsolete and slow moving stores and spares based on management’s estimate.
3.9 Stock-in-trade
Stock of raw materials, work-in-process and finished goods, except for those in transit are valued principally at the lower of weighted average cost and net realizable value. Cost of work-in-process and finished goods comprises cost of direct materials, labour and appropriate manufacturing overheads. Cost of own produced molasses, a by product, is determined on the basis of monthly average cost of molasses purchased from third parties. Cost of stillage, a by product of the Effluent Treatment Plant used in the generation of electricity by the Bio Power division is valued at Nil as it does not have any market value.
Materials in transit are stated at cost comprising invoice values plus other charges paid thereon.
Net realizable value signifies the estimated selling price in the ordinary course of business less costs necessary to be incurred in order to make a sale. Provision is made in the financial statements for obsolete and slow moving stock in trade based on management’s estimate.
3.10 Financial assets and liabilities
Financial assets and financial liabilities are recognized at the time when the company becomes a party to the contractual provisions of the instrument and derecognized when the company loses control of contractual rights that comprise the financial assets and in the case of financial liability when the obligation specified in the contract is discharged, cancelled or expired. Any gain or loss on derecognition of financial assets and financial liabilities is included in the profit and loss account for the year. All financial assets and liabilities are initially measured at cost, which is the fair value of consideration given and received
Notes to the FiNANCiAL stAteMeNtsFor the year ended 30 September 2013
42
respectively. These financial assets and liabilities are subsequently measured at fair value or cost as the case may be. The particular measurement methods adopted are disclosed in the individual policy statements associated with each item.
Financial assets include held to maturity, available for sale and held for trading investments, trade debts, loans, advances, deposits and other receivables and cash and bank balances.
Financial liabilities include long term finances, short term borrowings, accrued finance cost and trade and other payables.
3.11 Offsetting of financial assets and liabilities
Financial assets and liabilities are offset and the net amount is reported in the financial statements only when there is a legally enforceable right to set off the recognized amount and the company intends either to settle on a net basis or to realize the assets and to settle the liabilities simultaneously.
3.12 Trade debts
Trade debts and other receivables are recognized initially at invoice value, which approximates fair value, and subsequently measured at amortized cost using the effective interest method, less provision for impairment. A provision for impairment of trade debts and other receivables is established when there is an objective evidence that the Company will not be able to collect all the amount due according to the original terms of the receivable. Significant financial difficulties of the debtors, probability that the debtor will enter bankruptcy or financial reorganization, and default or delinquency in payments are considered indicators that the trade debt is impaired. The provision is recognized in the profit and loss account. When a trade debt is uncollectible, it is written off against the provision. Subsequent recoveries of amounts previously written off are credited to the profit and loss account.
3.13 Cash and cash equivalents
Cash and cash equivalents are carried in the balance sheet at cost. For the purpose of cash flow statement, cash and cash equivalents comprise cash in hand, demand deposits, other short term highly liquid investments that are readily convertible to known amounts of cash and which are subject to an insignificant risk of change in value.
3.14 Non-current assets held for sale
Non-current assets are classified as assets held for sale and stated at the lower of carrying amount and fair value less costs to sell if their carrying value is to be recovered principally through a sale transaction within one year of the date of balance sheet rather than through continuing use.
3.15 Borrowings
Loans and borrowings are recorded at the proceeds received. In subsequent periods, borrowings are stated at amortized cost using the effective yield method. Preference shares, which are redeemable on a specific date at the option of the holder, are classified as liabilities. The dividend on these preference shares is recognized in the profit and loss account as finance cost. Preference shares are classified as equity to the extent there is conclusive evidence that these will not result in an outflow of another financial asset or exchange of financial assets or liabilities under conditions that are potentially unfavorable to the company.
Notes to the FiNANCiAL stAteMeNtsFor the year ended 30 September 2013

43
Finance costs are accounted for on an accrual basis and are included in accrued finance cost to the extent of the amount remaining unpaid.
3.16 Trade and other payables
Trade and other payables are recognized initially at fair value and subsequently measured at amortized cost using the effective interest method. Exchange gains and losses arising on translation in respect of liabilities in foreign currency are added to the carrying amount of the respective liabilities.
Provisions are recognized when the company has a present legal or constructive obligation as a result of past events, it is probable, will result in an outflow of resources embodying economic benefits, to settle the obligation and a reliable estimate of the amount can be made. Provisions are reviewed at year end and adjusted to reflect the current best estimate.
3.17 Deferred income
Deferred income represents excess of sale proceeds in relation to the carrying amount of the asset acquired under sale and lease back arrangement. Deferred income is amortized on a straight line basis over the period of lease term.
3.18 Derivative financial instruments
These are initially recorded at cost on the date a derivative contract is entered into and are remeasured to fair value at subsequent reporting dates. The method of recognizing the resulting gain or loss depends on whether the derivative is designated as a hedging instrument, and if so, the nature of the item being hedged. The company designates certain derivatives as cash flow hedges.
The company documents at the inception of the transaction the relationship between the hedging instruments and hedged items, as well as its risk management objective and strategy for undertaking various hedge transactions. The company also documents its assessment, both at hedge inception and on an ongoing basis, of whether the derivatives that are used in hedging transactions are highly effective in offsetting changes in cash flow of hedged items.
The effective portion of changes in the fair value of derivatives that are designated and qualify as cash flow hedges is recognized in other comprehensive income. The gain or loss relating to the ineffective portion is recognized immediately in the profit and loss account within ‘other operating income/expenses’.
Amounts accumulated in equity are recycled in the profit and loss account in the periods when the hedged item affects profit or loss. The gain or loss relating to the effective portion of interest rate swaps hedging variable rate borrowings is recognized in the profit and loss account within ‘finance costs’. The gain or loss relating to the ineffective portion is recognized in the profit and loss account within ‘other operating income/expenses’.
3.19 Foreign currency transactions and translation
Functional and presentation currency
Items included in the financial statements of the Company are measured using the currency of the primary economic environment in which the Company operates (the functional currency). The financial statements are presented in Pak Rupees, which is the Company’s functional and presentation currency.
Notes to the FiNANCiAL stAteMeNtsFor the year ended 30 September 2013

44
Transactions and balances
Foreign currency transactions are translated into Pak Rupees using the exchange rates prevailing at the dates of the transactions. Foreign exchange gains and losses resulting from the settlement of such transactions and from the translation at year-end exchange rates of monetary assets and liabilities denominated in foreign currencies are recognized in the profit and loss account.
Figures are rounded to nearest thousand.
3.20 Borrowing costs
Mark-up, interest and other charges on borrowings are capitalized up to the date of commissioning of the respective property, plant and equipment, acquired out of the proceeds of such borrowings. All other mark-up, interest and other charges are charged to income.
3.21 Revenue recognition
- Revenue from sales is recognized on dispatch of goods to customers.
- Revenue from sale of electricity is recognized on transmission of electricity to Faisalabad Electric Supply Company (FESCO).
- Dividend on equity investments is recognized as income when the right of receipt is established.
- Return on deposits is accrued on a time proportion basis by reference to the principal outstanding
and the applicable rate of return. 3.22 Segment reporting
Operating segments are reported in a manner consistent with the internal reporting provided to the chief operating decision maker. The chief operating decision maker, who is responsible for allocating resources and assessing performance of the operating segments, has been identified as the Board of Directors of the Company that makes strategic decisions.
3.23 Dividends and appropriations to general reserve
Dividends and appropriations to general reserves are recognized in the financial statements in the period in which these are approved.
3.24 Employees’ retirement benefits
3.24.1 Defined benefit plans The main feature of the schemes operated by the company for its employees of sugar and allied
divisions are as follows: All permanent employees who are in the management cadre of the company participate in an
approved funded defined benefit pension plan. In addition, there is an approved funded defined benefit gratuity scheme for all permanent employees, who are in the management cadre of the company subject to a minimum qualifying period of service according to the terms of employment. Monthly contributions are made to these funds on the basis of actuarial recommendation at the rate of 20% per annum of basic salary for pension and 8.33% per annum of basic salary for gratuity. Actuarial valuation for the schemes was carried out as at 30 September 2013.
Notes to the FiNANCiAL stAteMeNtsFor the year ended 30 September 2013

45
Actual returns on plan assets during the year were Rs. 28.62 million and Rs. 4.93 million for pension and gratuity funds respectively. The actual returns on plan assets represent the difference between the fair value of plan assets at the beginning of the year and as at the end of the year after adjustments for contributions made by the company as reduced by benefits paid during the year.
The future contribution rates of these plans include allowances for deficit and surplus. Projected unit
credit method using the following significant assumptions, is used for valuation of these schemes:
Discount rate: 10% per annum Expected increase in eligible pay: 9% per annum Expected rate of return on plan assets: 11.5% per annum Expected mortality rate: EFU 61-66 mortality table adjusted for company’s experience Expected withdrawal and early retirement rate: Based on experience Plan assets include long term Government bonds, term finance certificates of financial institutions;
preference shares and ordinary shares of listed and unlisted companies and term deposits with banks. Return on Government bonds and debt is at fixed rates.
Experience gains and losses arising during the year are recognized immediately in accordance with
the provisions of IAS 19. The company policy with regard to actuarial gains/losses follows minimum recommended approach
under IAS 19 (revised 2000).
3.24.2 Defined contribution plan There is an approved defined contribution provident fund for all employees. Equal monthly
contributions are made by the employer and the employee to the fund in accordance with the fund rules. Interest is payable to the fund on the balances utilized @ 7-8% per annum, which is charged to profit and loss account.
Retirement benefits are payable to staff on completion of prescribed qualifying period of service
under these schemes. 3.25 Standards, interpretations and amendments to published approved International Financial
Reporting Standards that are not yet effective
The following standards, amendments and interpretations of approved accounting standards will be effective for accounting periods beginning on or after 01 July 2013:
- IAS 19 Employee Benefits (amended 2011) - (effective for annual periods beginning on or after 1
January 2013). The amended IAS 19 includes the amendments that require actuarial gains and losses to be recognized immediately in other comprehensive income; this change will remove the corridor method and eliminate the ability for entities to recognize all changes in the defined benefit obligation and in plan assets in profit or loss, which currently is allowed under IAS 19; and that the expected return on plan assets recognized in profit or loss is calculated based on the rate used to discount the defined benefit obligation. This amendment could change the measurement of the company’s obligation for its retirement benefit related amount of profit and loss account and other comprehensive income.
Notes to the FiNANCiAL stAteMeNtsFor the year ended 30 September 2013
46
The company has not planned to adopt this amendment early, however, had this amendment been adopted early, other comprehensive income would have been increased by Rs. 4.31 million.
- IAS 27 Separate Financial Statements (2011) - (effective for annual periods beginning on or after 1
January 2013). IAS 27 (2011) supersedes IAS 27 (2008). Three new standards IFRS 10 - Consolidated Financial Statements, IFRS 11- Joint Arrangements and IFRS 12- Disclosure of Interest in Other Entities dealing with IAS 27 would be applicable effective 1 January 2013. IAS 27 (2011) carries forward the existing accounting and disclosure requirements for separate financial statements, with some minor clarifications. The amendments have no impact on financial statements of the Company.
- IAS 28 Investments in Associates and Joint Ventures (2011) - (effective for annual periods beginning on
or after 1 January 2013). IAS 28 (2011) supersedes IAS 28 (2008). IAS 28 (2011) makes the amendments to apply IFRS 5 to an investment, or a portion of an investment, in an associate or a joint venture that meets the criteria to be classified as held for sale; and on cessation of significant influence or joint control, even if an investment in an associate becomes an investment in a joint venture. The amendments have no impact on financial statements of the Company.
- Offsetting Financial Assets and Financial Liabilities (Amendments to IAS 32) – (effective for annual
periods beginning on or after 1 January 2014). The amendments address inconsistencies in current practice when applying the offsetting criteria in IAS 32 Financial Instruments: Presentation. The amendments clarify the meaning of ‘currently has a legally enforceable right of set-off’; and that some gross settlement systems may be considered equivalent to net settlement. The amendment would not have significant impact on financial statement of the company.
- Offsetting Financial Assets and Financial Liabilities (Amendments to IFRS 7) – (effective for annual
periods beginning on or after 1 January 2013). The amendments to IFRS 7 contain new disclosure requirements for financial assets and liabilities that are offset in the statement of financial position or subject to master netting agreement or similar arrangement. The amendment would not have significant impact on financial statement of the company.
Annual Improvements 2009–2011 (effective for annual periods beginning on or after 1 January 2013). The new cycle of improvements contains amendments to the following standards, with consequential amendments to other standards and interpretations.
- IAS 1 Presentation of Financial Statements is amended to clarify that only one comparative period
– which is the preceding period – is required for a complete set of financial statements. If an entity presents additional comparative information, then that additional information need not be in the form of a complete set of financial statements. However, such information should be accompanied by related notes and should be in accordance with IFRS. Furthermore, it clarifies that the ‘third statement of financial position’, when required, is only required if the effect of restatement is material to statement of financial position.
- IAS 16 Property, Plant and Equipment is amended to clarify the accounting of spare parts, stand-by equipment and servicing equipment. The definition of ‘property, plant and equipment’ in IAS 16 is now considered in determining whether these items should be accounted for under that standard. If these items do not meet the definition, then they are accounted for using IAS 2 Inventories.
- IAS 32 Financial Instruments: Presentation - is amended to clarify that IAS 12 Income Taxes applies
to the accounting for income taxes relating to distributions to holders of an equity instrument and transaction costs of an equity transaction. The amendment removes a perceived inconsistency between IAS 32 and IAS 12.
Notes to the FiNANCiAL stAteMeNtsFor the year ended 30 September 2013

47
Notes to the FiNANCiAL stAteMeNtsFor the year ended 30 September 2013
- IAS 34 Interim Financial Reporting is amended to align the disclosure requirements for segment assets and segment liabilities in interim financial reports with those in IFRS 8 Operating Segments. IAS 34 now requires the disclosure of a measure of total assets and liabilities for a particular reportable segment. In addition, such disclosure is only required when the amount is regularly provided to the chief operating decision maker and there has been a material change from the amount disclosed in the last annual financial statements for that reportable segment.
- IFRIC 20 - Stripping cost in the production phase of a surface mining (effective for annual periods
beginning on or after 1 January 2013). The interpretation requires production stripping cost in a surface mine to be capitalized if certain criteria are met. The amendments have no impact on financial statements of the Company.
- IFRIC 21- Levies ‘an Interpretation on the accounting for levies imposed by governments’ (effective for
annual periods beginning on or after 1 January 2014). IFRIC 21 is an interpretation of IAS 37 Provisions, Contingent Liabilities and Contingent Assets. IAS 37 sets out criteria for the recognition of a liability, one of which is the requirement for the entity to have a present obligation as a result of a past event (known as an obligating event). The Interpretation clarifies that the obligating event that gives rise to a liability to pay a levy is the activity described in the relevant legislation that triggers the payment of the levy.
- IAS 39 Financial Instruments: Recognition and Measurement- Novation of Derivatives and Continuation of Hedge Accounting (Amendments to IAS 39) (effective for annual periods beginning on or after 1 January 2014). The narrow-scope amendments will allow hedge accounting to continue in a situation where a derivative, which has been designated as a hedging instrument, is novated to effect clearing with a central counterparty as a result of laws or regulation, if specific conditions are met (in this context, a novation indicates that parties to a contract agree to replace their original counterparty with a new one).
- Amendment to IAS 36 “Impairment of Assets” Recoverable Amount Disclosures for Non-Financial Assets
(effective for annual periods beginning on or after 1 January 2014). These narrow-scope amendments to IAS 36 Impairment of Assets address the disclosure of information about the recoverable amount of impaired assets if that amount is based on fair value less costs of disposal.
Apart from above certain other standards, amendments to published standards and interpretations of accounting standards became effective for accounting periods beginning on or after 1 January 2013, however, they do not affect the company’s financial statements.
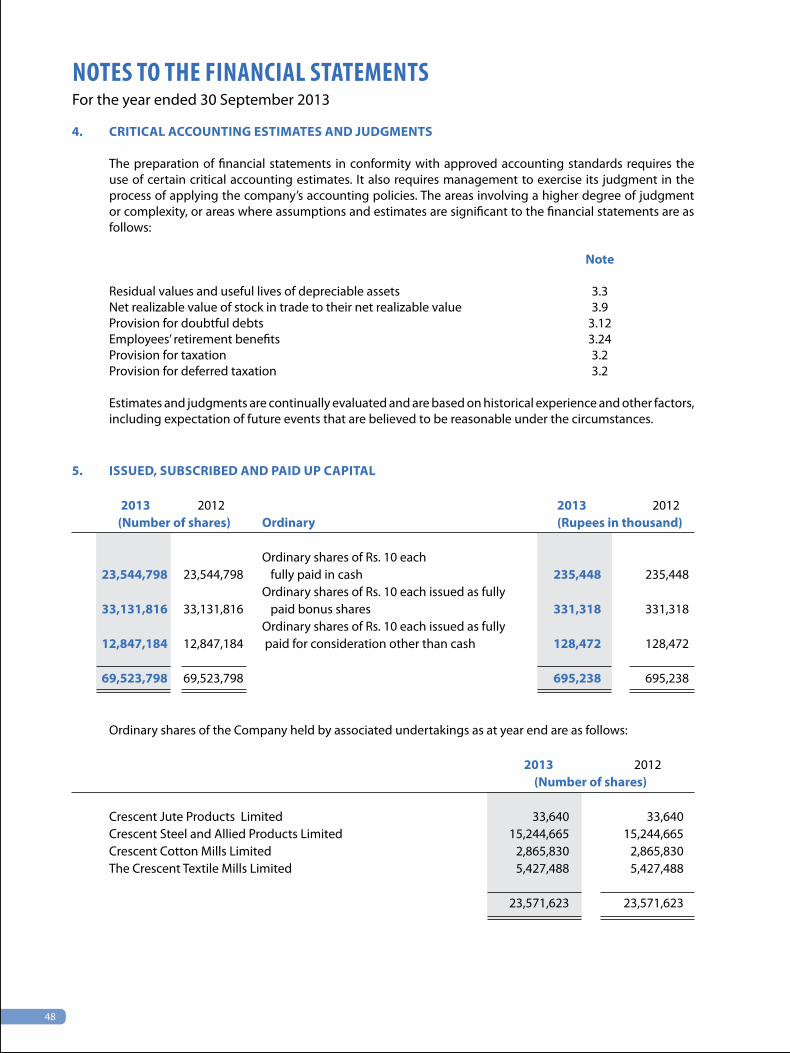
48
4. CRITICAL ACCOUNTING ESTIMATES AND jUDGMENTS The preparation of financial statements in conformity with approved accounting standards requires the
use of certain critical accounting estimates. It also requires management to exercise its judgment in the process of applying the company’s accounting policies. The areas involving a higher degree of judgment or complexity, or areas where assumptions and estimates are significant to the financial statements are as follows:
Note Residual values and useful lives of depreciable assets 3.3 Net realizable value of stock in trade to their net realizable value 3.9 Provision for doubtful debts 3.12 Employees’ retirement benefits 3.24 Provision for taxation 3.2 Provision for deferred taxation 3.2 Estimates and judgments are continually evaluated and are based on historical experience and other factors,
including expectation of future events that are believed to be reasonable under the circumstances.
5. ISSUED, SUBSCRIBED AND PAID UP CAPITAL 2013 2012 2013 2012 (Number of shares) Ordinary (Rupees in thousand)
Ordinary shares of Rs. 10 each 23,544,798 23,544,798 fully paid in cash 235,448 235,448 Ordinary shares of Rs. 10 each issued as fully 33,131,816 33,131,816 paid bonus shares 331,318 331,318 Ordinary shares of Rs. 10 each issued as fully 12,847,184 12,847,184 paid for consideration other than cash 128,472 128,472
69,523,798 69,523,798 695,238 695,238
Ordinary shares of the Company held by associated undertakings as at year end are as follows:
2013 2012(Number of shares)
Crescent Jute Products Limited 33,640 33,640 Crescent Steel and Allied Products Limited 15,244,665 15,244,665
Crescent Cotton Mills Limited 2,865,830 2,865,830 The Crescent Textile Mills Limited 5,427,488 5,427,488
23,571,623 23,571,623
Notes to the FiNANCiAL stAteMeNtsFor the year ended 30 September 2013
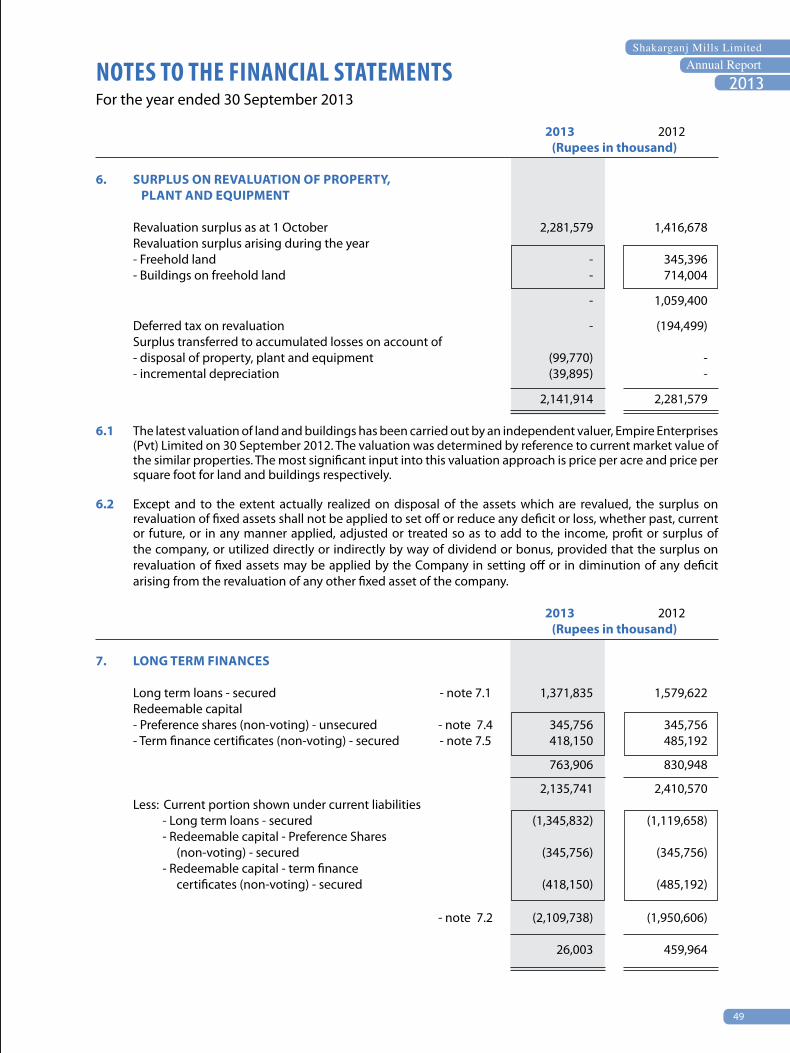
49
2013 2012(Rupees in thousand)
6. SURPLUS ON REVALUATION OF PROPERTY, PLANT AND EQUIPMENT Revaluation surplus as at 1 October 2,281,579 1,416,678 Revaluation surplus arising during the year - Freehold land - 345,396 - Buildings on freehold land - 714,004
- 1,059,400
Deferred tax on revaluation - (194,499) Surplus transferred to accumulated losses on account of - disposal of property, plant and equipment (99,770) - - incremental depreciation (39,895) -
2,141,914 2,281,579 6.1 The latest valuation of land and buildings has been carried out by an independent valuer, Empire Enterprises
(Pvt) Limited on 30 September 2012. The valuation was determined by reference to current market value of the similar properties. The most significant input into this valuation approach is price per acre and price per square foot for land and buildings respectively.
6.2 Except and to the extent actually realized on disposal of the assets which are revalued, the surplus on
revaluation of fixed assets shall not be applied to set off or reduce any deficit or loss, whether past, current or future, or in any manner applied, adjusted or treated so as to add to the income, profit or surplus of the company, or utilized directly or indirectly by way of dividend or bonus, provided that the surplus on revaluation of fixed assets may be applied by the Company in setting off or in diminution of any deficit arising from the revaluation of any other fixed asset of the company.
2013 2012 (Rupees in thousand)
7. LONG TERM FINANCES Long term loans - secured - note 7.1 1,371,835 1,579,622 Redeemable capital - Preference shares (non-voting) - unsecured - note 7.4 345,756 345,756 - Term finance certificates (non-voting) - secured - note 7.5 418,150 485,192
763,906 830,948
2,135,741 2,410,570 Less: Current portion shown under current liabilities - Long term loans - secured (1,345,832) (1,119,658) - Redeemable capital - Preference Shares (non-voting) - secured (345,756) (345,756) - Redeemable capital - term finance certificates (non-voting) - secured (418,150) (485,192) - note 7.2 (2,109,738) (1,950,606)
26,003 459,964
Notes to the FiNANCiAL stAteMeNtsFor the year ended 30 September 2013

50
7.1 Long term loans - secured Loan Lender 2013 2012 Rate of mark-up Number of installments Mark-up per annum outstanding payable
(Rupees in thousand)
1 Silk Bank Limited - 12,500 ** Base rate + 3.75% and monitoring The loan has been repaid during the year. Quarterly fee of 0.2% per annum 2 MCB Bank Limited 73,500 82,688 * Base rate + 2% subject to Eight semi annual installments (including floor of 8% two over-due) of Rs. 9.19 million each ending September 2016. Semi-annual 3 MCB Bank Limited 378,399 425,699 * Base rate + 2% Eight semi annual installments (including two over-due) of Rs. 47.33 million each ending September 2016. Semi-annual 451,899 508,387 4 National Bank of Pakistan Limited 190,326 190,400 * Base rate + 2.5% Six semi annual installments (including five over-due) of Rs. 27.2 million each and one partial installment of Rs. 27.13 million ending June 2014. Semi-annual 5 National Bank of Pakistan Limited 119,674 119,674 ** Base rate + 3% Eleven quarterly installments (including two over-due) of Rs. 10 million each and one partial installment of Rs. 9.67 million ending January 2016. Quarterly 6 National Bank of Pakistan Limited 171,000 171,000 ** Base rate + 2% Twenty quarterly installments (including thirteen over-due) of Rs. 8.55 million each 481,000 481,074 ending June 2015. Quarterly 7 Standard Chartered Bank Limited 1,704 198,065 * Base rate + 2.25% One semi annual partial installment of Rs. 1.7 million ending June 2014. N/A 8 United Bank Limited 107,700 134,833 * Base rate + 1% Three semi annual installments (including one partial over-due of Rs. 17.2 million) of Rs. 30.17 million each and one partial installment of Rs. 16 million ending January 2015. Semi annual 9 The Bank of Punjab 79,812 132,176 ** Base rate + 1% Four quarterly installments of different amounts ending December 2013 including over-due installments of Rs. 74.54 million. Quarterly 10 The Bank of Punjab 75,200 75,251 *** Nil Three installments of different amounts ending 31 August 2014. N/A 155,012 207,427 11 Habib Bank Limited 28,200 37,336 *** Base rate + 1% Two semi annual installments of Rs. 9.43 million each and one installment of Rs. 9.42 million (including one overdue installment of Rs. 9.35 million) ending 31 July 2014. Semi annual 12 Allied Bank Limited - note 7.3 69,400 - *** Nil Six monthly installments of Rs. 10.07 million each (including one overdue partial installment of Rs. 8.96 million ending March 2014. N/A 13 Allied Bank Limited - note 7.3 76,920 - *** Nil Nine equal monthly installments starting from 15 April 2014. N/A 146,320 - 1,371,835 1,579,622
* Base rate: Average ask rate of six-month Karachi Inter Bank Offer Rate (“KIBOR”) reset for each mark-up period** Base rate: Average ask rate of three-month Karachi Inter Bank Offer Rate (“KIBOR”) to be reset for each mark-up period*** Outstanding accrued mark-up restructured and rescheduled and carries no mark-up.
Notes to the FiNANCiAL stAteMeNtsFor the year ended 30 September 2013
51
Security
Loan 1
The loan was secured by way of first pari passu charge over fixed assets of the Company.
Loan 2
These are secured against specific charges on plant and machinery financed through respective loans.
Loan 3
The loan is secured by way of mortgage and hypothecation over mortgaged properties and hypothecated assets and personal guarantees of the directors of the Company.
Loan 4
The loan is secured against first pari passu charge over present and future fixed assets of the Company.
Loan 5 to 6
These are secured by way of first pari passu charge on fixed assets of the Company and specific charge over plant and machinery of satellite facility.
Loan 7
The loan is secured by way of hypothecation over all present and future moveable assets of the Company and mortgage of land and buildings.
Loan 8
These are secured by way of first pari passu charge on all the present and future fixed assets and personal guarantees of the directors of the Company.
Loan 9 to 10
These are secured by way of pari passu charge over fixed assets and personal guarantees of the directors of the Company.
Loan 11
These are secured by way of first pari passu hypothecation charge over all present and future fixed assets and first pari pasu mortgage over immovable fixed assets and personal guarantees of the directors of the Company and pledge of shares of Shakarganj Foods Products Limited (SFPL) by the Company.
Loan 12 to 13
These are secured by way of first pari passu hypothecation charge over all present and future fixed assets and first pari passu mortgage over immovable fixed assets and personal guarantees of the directors of the Company.
Notes to the FiNANCiAL stAteMeNtsFor the year ended 30 September 2013
52
7.2 The aggregate current portion of Rs. 2,110 million (2012: Rs. 1,951 million) includes over-due principal installments aggregating to Rs. 881 million (2012: Rs. 640 million) and Rs. 741 million (2012: Rs. 760 million) representing principal installments which under the term of original loan agreements are due for repayment in period subsequent to 30 September 2014. However, as the Company could not repay on a timely basis the installments due up till the year ended 30 September 2013 and is not compliant with certain debt covenants, which represents a breach of the respective agreements, therefore these loans have been disclosed as a current liability under the guidance contained in “IAS 1 Presentation of financial statements”.
Further the lenders as part of the financing/restructuring agreements have restricted dividend distribution by the company until full satisfaction of the entire over-due amount and other amounts due during the tenor of the finance facilities.
7.3 Short term finance - restructured
During the year, short term finance facility available from Allied Bank Limited under mark-up arrangements have been restructured to an interest free long term loan. This loan is now repayable in fifteen equal monthly installments starting from January 2013 and ending in March 2014. The mark-up outstanding of Rs. 76.93 million as at the restructuring date has also been frozen and converted into an interest free long term loan repayable in nine equal monthly installments starting from April 2014 and ending December 2014. As per the arrangement, the restructuring will remain effective provided the Company does not default on any of its installments otherwise mark-up waiver will be called off and it will be recovered at the rate of three months KIBOR plus 2%. Mark-up of Rs. 23.34 million has not been accrued based on the assertion that the Company will honor the restructuring terms.
7.4 Redeemable preference shares (non-voting) - unsecured
Redeemable Preference shares (non-voting) were issued in 2005 to the shareholders of the company in the ratio of 85 preference shares for every 100 ordinary shares held as on 22 October 2004 and to certain institutional investors in equal proportion. These shares are listed on Lahore and Karachi Stock Exchanges. The conversion option is not binding either on the company or the preference shareholders except in case of the conversion upon maturity, where the preference shareholders opt for conversion, subsequent to the company’s failure to pay preferred dividend during the entire tenure of five years.
Terms of redemption
Preference shareholders may convert preference shares into ordinary shares of the company at the end of every financial year or the company may convert these preference shares into ordinary shares in whole or in part through a tender offer. The conversion is set in the ratio of 167 ordinary shares for every 1,000 preference shares at a face value of Rs. 10 each.
The preference shares were to be redeemed in the year ended on 30 September 2010.
If the Company fails to pay dividends to preference shareholders during the tenure of five years, the preference shares and the unpaid cumulative dividend may at the discretion of the investors be converted into ordinary shares on the basis of the aforementioned conversion ratio.
In case the investor does not opt for the conversion option and the Company is unable to redeem the Preference Shares along with the cumulative dividend then the outstanding preference shares along with cumulative dividend will be redeemed in subsequent three years as under: - Outstanding amount of preference shares and cumulative dividend to be redeemed 33% in sixth year;
Notes to the FiNANCiAL stAteMeNtsFor the year ended 30 September 2013

53
Notes to the FiNANCiAL stAteMeNtsFor the year ended 30 September 2013
- Outstanding amount of preference shares and cumulative dividend to be redeemed 33% in seventh year; and
- Outstanding amount of preference shares and cumulative dividend to be redeemed 33% in eighth
year
The investors will have a put option at the end of the eighth year to put the outstanding preference shares at Par value along with the cumulative dividend to the Company. An event of default will be triggered if the Company fails on the put option.
Preference dividend
The preference shareholders have a preferred right of dividend @ 8.5% per annum on a cumulative basis during the tenure of five years which ended in December 2009. The Company had till 30 September 2012 accrued preferred dividend for periods after the maturity of such shares in December 2009 as it intended to pay the dividends for periods post maturity till the preference shares are redeemed. However, during the current year, the Company has re-evaluated its obligation to pay dividend on preference shares and has decided to restrict its obligation in respect of preferred dividend to the tenure of such shares. As per the terms and conditions to issuance of preference shares, the Company has no obligation to accrue or pay dividends after aforementioned tenure of five years. Consequently, the Company has reversed preferred dividend in respect of periods subsequent to December 2009 aggregating to Rs. 52.82 million in the year ended 30 September 2012.
7.4.1 Preference shares of the company held by related / associated undertakings as at year end are as
follows:
2013 2012(Rupees in thousand)
Crescent Steel and Allied Products Limited 2,999,396 2,999,396 The Crescent Textile Mills Limited 2,746,050 2,746,050 Premier Insurance Company of Pakistan Limited 53,125 53,125 Shakarganj Mills Limited Gratuity Fund 51,000 51,000 Shakarganj Mills Limited Pension Fund 351,500 351,500 Shakarganj Mills Limited Provident Fund 1,700,500 1,700,500
7,901,571 7,901,571
7.5 Redeemable term finance certificates (non-voting) - secured The term finance certificates (TFCs) were issued to finance the acquisition and establishment of the sugar plant at Dargai Shah as well as the Company’s existing business operations and for other purposes permitted by the Memorandum and Articles of Association.
Terms of redemption
The term finance certificates (TFC’s) are redeemable in 10 equal semi-annual installments starting in March 2012 and ending in September 2016. As per the original terms of the agreement the principal balance was payable in ten equal semi-annual installments after a grace period of 1 year. The first installment was due at the end of March 2010. Mark-up is charged at average 6 months KIBOR plus 2.25% and is payable semi-annually in arrears. However, in May 2010, the company signed a second supplementary trust deed with the trustee for relaxation in payment terms.

54
During the year, UBL Fund Managers (TFC holder) executed a settlement arrangement for their outstanding exposure of Rs. 80 million as part of the PPTFC. As per the arrangement the Company will pay monthly installments of Rs. 3.33 million each for 23 months starting from January 2013 till November 2014 and a final installment of PKR 3.41 million on 31 December 2014. The mark-up outstanding of Rs. 49.52 million as at settlement arrangement date has been waived off and no further mark-up (up-to 30 September 2013 Rs. 5.99 million) would be payable till the maturity of outstanding amount provided the Company makes timely payments and remains compliant with the terms of arrangement otherwise this arrangement will stand void and past/ future mark-ups as per the original trust deed will be applicable.
Number of installments outstanding
Six semi annual installments of Rs. 54 million each and one partial overdue installment of Rs. 44.20 million (2012: Rs. 22.9 million) ending September 2016.
Security
The TFC’s are secured by a first pari passu charge by way of hypothecation over all present and future movable fixed assets of the company and first pari passu mortgage by deposit of title deeds over land and building of the Company to the extent of outstanding face value of the TFC’s plus 25% margin.
2013 2012(Rupees in thousand)
8. LIABILITIES AGAINST ASSETS SUBjECT TO FINANCE LEASE Present value of minimum lease payments 18,020 27,589 Less: Current portion shown under current liabilities (7,872) (8,796)
10,148 18,793
The minimum lease payments have been discounted at an implicit interest rate ranging from 12.82% to 13.10% (2012: 15.80% to 17.20%) to arrive at their present value. Rentals are paid in quarterly installments and in case of default in any payment, an additional charge at the rate of 3% to 20% shall be paid. The lessee has the option to purchase the assets after expiry of the lease term.
Taxes, repairs and insurance costs are to be borne by the Company. In case of early termination of lease, the
lessee shall pay entire amount of rentals for unexpired period of lease agreement. The amount of future payments of the lease and the period in which these payments will become due are
as follows: Minimum Future Present value of Lease finance lease liability payments cost 2013 2012 (Rupees in thousand) Not later than one year 9,812 1,940 7,872 8,796 Later than one year and not later than five years 10,961 813 10,148 18,793
20,773 2,753 18,020 27,589
Notes to the FiNANCiAL stAteMeNtsFor the year ended 30 September 2013

55
2013 2012 (Rupees in thousand)
9. EMPLOYEES’ RETIREMENT BENEFITS Classified under non-current assets Pension fund - note 9.1 2,488 935 Gratuity fund - note 9.2 6,291 4,136
8,779 5,071 Profit and Loss account charge for: Pension Benefits - note 9.1 9,814 8,963 Gratuity Benefits - note 9.2 3,176 1,953
12,990 10,916 9.1 Pension fund The amounts recognized in the balance sheet are determined as follows: Present value of defined benefit obligations 273,937 237,192 Fair value of plan assets (284,825) (248,836) Unrecognized actuarial losses 8,400 10,709 Asset as at 30 September (2,488) (935) The movement in the defined benefit obligation over the year is as follows: Present value of defined benefit obligations as at 1 October 237,192 197,781 Current service cost 11,153 9,836 Interest cost 27,277 24,723 Benefits paid during the year (5,699) (12,546) Actuarial losses 4,014 17,398 Present value of defined benefit obligations as at 30 September 273,937 237,192 The movement in the fair value of plan assets of the year is as follows: Fair value as at 1 October 248,836 216,227 Expected return on plan assets 28,616 27,029 Contributions during the year 11,368 10,398 Benefits paid during the year (5,699) (12,546) Actuarial gains 1,704 7,728 Fair value as at 30 September 284,825 248,836
Notes to the FiNANCiAL stAteMeNtsFor the year ended 30 September 2013

56
2013 2012(Rupees in thousand)
The amounts recognized in the profit and loss account are as follows:
Current service cost 11,153 9,836 Interest cost 27,277 24,723 Expected return on plan assets (28,616) (27,029)
Past service cost - 1,433 Total, included in salaries and wages 9,814 8,963 The amounts recognized were included in the profit and loss account as follows: Cost of sales 5,125 4,181 Administrative expenses 4,564 4,686 Selling expenses 88 69 Other expenses 37 27
Total, included in salaries and wages 9,814 8,963
The actual return on plan assets was Rs. 28.62 million (2012: Rs. 34.76 million).
2013 2012
The principal actuarial assumptions used were as follows:
Discount rate 10.0% 11.5%Expected return on plan assets 11.5% 10.5%Future salary increases 9.0% 12.5%Average expected remaining working life time of employees 9 years 12 years
2013 2012
(Rupees in thousand) Plan assets are comprised as follows: Equity Instruments 66,901 39,789 Debt Instruments 243,158 230,160 Others (25,234) (21,113)
284,825 248,836
Fair value of plan assets include ordinary shares and preference shares of the Company whose fair values as at 30 September 2013 are Rs. 8.08 million (2012: Rs. 2.02 million) and Rs. 8.36 million (2012: Rs. 11.64 million) respectively.
Notes to the FiNANCiAL stAteMeNtsFor the year ended 30 September 2013

57
The present value of defined benefit obligation, the fair value of plan assets and the surplus or deficit of pension fund is as follows:
2012-13 2011-12 2010-11 2009-10 2008-09 (Rupees in thousand)
As at 30 September Present value of defined benefit obligations 273,937 237,192 197,782 166,684 161,675 Fair value of plan assets (284,825) (248,836) (216,228) (174,627) (168,530) (Surplus) (10,888) (11,644) (18,446) (7,943) (6,855) Experience adjustment on plan liabilities 4,014 17,398 13,648 (16,227) 8,180 Experience adjustment on plan assets 1,704 7,728 11,181 (8,541) (2,375)
2013 2012(Rupees in thousand)
9.2 Gratuity fund The amounts recognized in the balance sheet are determined as follows: Present value of defined benefit obligations 48,450 36,504 Fair value of plan assets (50,653) (42,835) Unrecognized actuarial losses (4,088) 2,195
Asset as at 30 September (6,291) (4,136) The movement in the defined benefit obligation over the year is as follows: Present value of defined benefit obligations as at 1 October 36,504 29,651 Current service cost 3,903 2,907 Interest cost 4,198 3,706 Benefits paid during the year (4,502) (3,116) Actuarial losses 8,347 3,356
Present value of defined benefit obligations as at 30 September 48,450 36,504 The movement in the fair value of plan assets of the year is as follows: Fair value as at 1 October 42,835 36,026 Expected return on plan assets 4,925 4,503 Contributions during the year 5,332 5,044 Benefits paid during the year (4,502) (3,116) Actuarial gains 2,063 378
Fair value as at 30 September 50,653 42,835
Notes to the FiNANCiAL stAteMeNtsFor the year ended 30 September 2013

58
2013 2012(Rupees in thousand)
The amounts recognized in the profit and loss account are as follows: Current service cost 3,903 2,907 Interest cost 4,198 3,706 Expected return on plan assets (4,925) (4,503) Actuarial gains - (157)
Total, included in salaries and wages 3,176 1,953 The amounts recognized were included in the profit and loss account as follows: Cost of sales 1,717 989 Administrative expenses 1,425 950 Selling expenses 24 - Other expenses 10 14
Total, included in salaries and wages 3,176 1,953 The actual return on plan assets was Rs. 4.93 million (2012: Rs. 4.88 million). 2013 2012
The principal actuarial assumptions used were as follows: Discount rate 10.0% 11.5% Expected return on plan assets 11.5% 11.5% Future salary increases 9.0% 10.5% Average expected remaining working life time of employees 8 years 10 years
2013 2012 (Rupees in thousand) Plan assets are comprised as follows: Equity instruments 25,508 5,759 Debt instruments 40,501 34,688 Others (15,356) 2,388 50,653 42,835
Fair value of plan assets include ordinary shares and preference shares of the Company whose fair values as at 30 September 2013 are Rs. 6.16 million (2012: Rs. 0.76 million) and Rs. 5.41 million (2012: Rs. 0.33 million) respectively.
Notes to the FiNANCiAL stAteMeNtsFor the year ended 30 September 2013

59
The present value of defined benefit obligation, the fair value of plan assets and the surplus or deficit of gratuity fund is as follows:
2012-13 2011-12 2010-11 2009-10 2008-09 (Rupees in thousand)
As at 30 September Present value of defined benefit obligations 48,450 36,504 29,651 45,619 42,362 Fair value of plan assets (50,653) (42,835) (36,023) (52,048) (46,756) Surplus (2,203) (6,331) (6,372) (6,429) (4,394) Experience adjustment on plan liabilities 8,347 3,356 (1,715) (5,132) (4,631) Experience adjustment on plan assets 2,063 378 279 (4,650) (1,162)
2013 2012 (Rupees in thousand)
10. CURRENT PORTION OF LONG TERM LIABILITIES Long term finances - note 7 2,109,738 1,950,606 Liabilities against assets subject to finance lease - note 8 7,872 8,796
2,117,610 1,959,402 11. SHORT TERM BORROWINGS Secured - Running finances - note 11.2 560,806 1,230,877 - Export refinance - note 11.3 301,109 989,612 - Term finances - note 11.4 - 45,682 Unsecured - Short term interest free financing - note 11.5 293,565 241,179
1,155,480 2,507,350 11.1 As per the original terms of the respective agreements with the banks, the aggregate borrowing facilities,
except for those mentioned in note 11.2 and 11.3, stand expired as at 30 September 2013. The Company, as referred to in note 1.2, entered into restructuring agreements with the lenders whereby it was allowed a bridge loan facility of Rs. 2,466 million and short term running finance of Rs. 2,980 million was extended up to 31 October 2010 at the rate of three month KIBOR plus 1% and one month KIBOR plus 3% respectively. However as referred therein, the bridge finance and consortium short term running finance could not become operative. The Company however, has accrued mark-up on facilities aggregating to Rs. 2,466 million at three months of KIBOR plus 1% as it believes that it is liable to pay mark-up under the terms of the bridge loan agreement instead of the original agreements, which stand expired.
11.2 Running finances As per the original facilities, these finances were available at a mark-up ranging from 10.03% to 12.50%
(2012: 11.47% to 16.92%) on the outstanding balance or part thereof.
Notes to the FiNANCiAL stAteMeNtsFor the year ended 30 September 2013
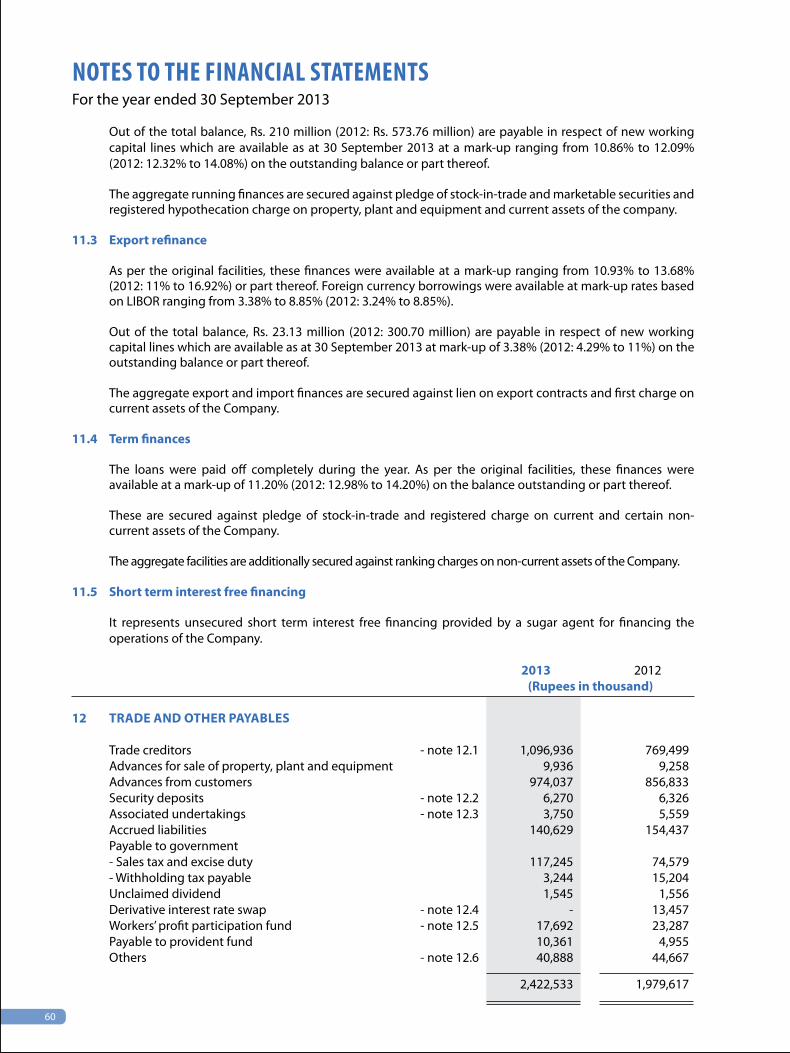
60
Out of the total balance, Rs. 210 million (2012: Rs. 573.76 million) are payable in respect of new working capital lines which are available as at 30 September 2013 at a mark-up ranging from 10.86% to 12.09% (2012: 12.32% to 14.08%) on the outstanding balance or part thereof.
The aggregate running finances are secured against pledge of stock-in-trade and marketable securities and registered hypothecation charge on property, plant and equipment and current assets of the company.
11.3 Export refinance
As per the original facilities, these finances were available at a mark-up ranging from 10.93% to 13.68% (2012: 11% to 16.92%) or part thereof. Foreign currency borrowings were available at mark-up rates based on LIBOR ranging from 3.38% to 8.85% (2012: 3.24% to 8.85%).
Out of the total balance, Rs. 23.13 million (2012: 300.70 million) are payable in respect of new working capital lines which are available as at 30 September 2013 at mark-up of 3.38% (2012: 4.29% to 11%) on the outstanding balance or part thereof.
The aggregate export and import finances are secured against lien on export contracts and first charge on current assets of the Company.
11.4 Term finances
The loans were paid off completely during the year. As per the original facilities, these finances were available at a mark-up of 11.20% (2012: 12.98% to 14.20%) on the balance outstanding or part thereof. These are secured against pledge of stock-in-trade and registered charge on current and certain non-current assets of the Company.
The aggregate facilities are additionally secured against ranking charges on non-current assets of the Company.
11.5 Short term interest free financing
It represents unsecured short term interest free financing provided by a sugar agent for financing the operations of the Company.
2013 2012
(Rupees in thousand)
12 TRADE AND OTHER PAYABLES
Trade creditors - note 12.1 1,096,936 769,499 Advances for sale of property, plant and equipment 9,936 9,258 Advances from customers 974,037 856,833 Security deposits - note 12.2 6,270 6,326 Associated undertakings - note 12.3 3,750 5,559 Accrued liabilities 140,629 154,437 Payable to government - Sales tax and excise duty 117,245 74,579 - Withholding tax payable 3,244 15,204 Unclaimed dividend 1,545 1,556 Derivative interest rate swap - note 12.4 - 13,457 Workers’ profit participation fund - note 12.5 17,692 23,287 Payable to provident fund 10,361 4,955 Others - note 12.6 40,888 44,667
2,422,533 1,979,617
Notes to the FiNANCiAL stAteMeNtsFor the year ended 30 September 2013

61
12.1 Trade creditors include interest free amounts due to associated companies amounting to nil (2012: Rs. 54.44 million) in the normal course of business.
12.2 These are interest free and refundable on completion of contracts. 12.3 These are interest free and represent expenses incurred by related parties on behalf of the Company:
2013 2012(Rupees in thousand)
Crescent Business Management (Private) Limited - 5
Crescent Steel and Allied Products Limited - 1,294 Crescent Software Products Limited 3,750 3,705 Shakarganj Food Products Limited - 555
3,750 5,559 12.4 The Company had entered into derivative interest rate swap arrangements to hedge for the possible
adverse movements in interest rates arising on the interest payments due on its syndicate term loan. Under the terms of the interest rate swap arrangement, the Company was to pay LIBOR plus bank spread to the arranging bank on the syndicate term loan denominated in US $ for the purposes of the interest rate swap, and receive KIBOR on same loan denominated in PAK rupees from the arranging bank. This marked to market arrangement has been completed during the current year and the resulting income of Rs. 13.46 million (2012: Rs. 18.17 million) has been recognized in profit and loss account as referred to in note 32 as this hedging relationship does not meet the criteria of cash flow hedge and does not qualify for special hedge accounting specified in IAS 39 ‘Financial Instruments: Recognition and Measurement’.
2013 2012(Rupees in thousand)
12.5 Workers’ profit participation fund Balance as at 1 October 23,287 - Allocation for the year 17,335 23,287 Interest on funds utilized in the company’s business 779 -
41,401 23,287 Less: Amount paid to workers during the year on behalf of the Fund 23,709 - Balance as at 30 September 17,692 23,287 12.6 Included in other liabilities are provisions aggregating to Rs. 3.12 million (2012: Rs. 17.79 million) in respect
of probable loss from pending litigation of the Company against Sales Tax Authorities and the Excise Department.
The above provisions have been made as per the management’s best estimate against various demands
raised by the Sales Tax Authorities and the Excise Department, which are being contested by the Company at various forums.
Notes to the FiNANCiAL stAteMeNtsFor the year ended 30 September 2013

62
2013 2012(Rupees in thousand)
13 ACCRUED FINANCE COST
Accrued mark-up on: - Long term finances - note 13.1 611,920 720,204
- Liabilities against assets subject to finance leases 4,555 7,294 - Short term borrowings 299,718 394,950
- note 13.2 916,193 1,122,448
13.1 This includes accrued preference dividend amounting to Rs. 64.79 million (2012: Rs. 64.79 million).
13.2 This includes finance cost of Rs. 817 million (2012: Rs. 910.79 million) which is overdue for payment as at 30 September 2013.
14 CONTINGENCIES AND COMMITMENTS 14.1 Contingencies (i) The Company has issued following guarantees: Bank guarantee of Rs. 9.55 million (2012: Rs. 9.55 million) in favour of Sui Northern Gas Pipelines Limited
against performance of contracts. Cross corporate guarantee in favour of Allied Bank Limited to secure long term finance facility availed by
the Company’s associate , Shakarganj Food Products Limited of Rs. 467 million (2012: Rs. 467 million).
Apart from above, outstanding letters of guarantees as at 30 September 2013 amounted to Rs. 5.35 million.
(ii) The Company has issued a post dated cheque in favour of the Collector of Customs against custom
duty clearance in respect of import of plant and machinery amounting to Rs. 9.52 million (2012: Rs. 5.04 million).
(iii) As referred to in note 1.2, the Company entered into a bridge finance agreement with a consortium of banks for Rs. 2,466 million to be repaid by 30 June 2011 from the sale of assets, identified in the agreement. For reasons specified in the note 1.2, the bridge facility could not become operative and expired on 30 June 2011. The Company has, in these financial statements, accrued mark-up based on the reduced rates contained in the bridge finance agreement on its respective borrowings to the tune of Rs. 2,466 million. Had the mark-up been accrued at the terms of original agreements, it would have been higher by Rs. 149.53 million (2012: Rs. 144.40 million) approximately. However, as explained in note 1.2, the Company is in process of negotiation with lenders for restructuring of overdue balances and is confident that the lenders will not demand mark-up as per original agreements.
Moreover, pending the finalisation of restructured terms of payments with all lenders, the Company has not
recognised penalties of Rs. 486.92 million (2012: Rs. 433.31 million) approximately which may be leviable under the terms of borrowings agreements including the bridge finance facility. The Company is confident that it will be able to negotiate restructured terms for repayment of loans and no penalty shall be levied by the lenders.
Notes to the FiNANCiAL stAteMeNtsFor the year ended 30 September 2013

63
Notes to the FiNANCiAL stAteMeNtsFor the year ended 30 September 2013
(iv) The Sindh High Court (the Court) in the case of ‘Kasim Textile’ in its order of 7 May 2013 has held that benefit of carry forward of minimum tax under section 113 of the Income Tax Ordinance, 2001 is only available if tax payable in a tax year is less than minimum tax paid. If in a tax year, a company has assessed losses on which no tax is payable, the company forgoes the right to carry forward minimum tax paid in that year. In the light of this order, the Company is not entitled to carry forward minimum tax paid in the tax year 2010 to 2013 of Rs. 221.15 million as a result of assessed tax losses in these years and adjust it against normal tax liability. Also in the case of refunds claimed in any year, those would also be adjusted accordingly. However, the management is of the view that the verdict has been challenged in the Supreme Court and that they are waiting for the final outcome and accordingly tax liability for the current year has been made on the basis of minimum tax.
(v) The Sindh High Court through its order dated 01 March 2013 declared the amendments made in the WWF
Ordinance, 1971 through Finance Act, 2008 applicable through which WWF is applicable on accounting profits rather than on the taxable income computed after incorporating the brought forward losses. In the light of the above order, the provision to date based on accounting profit comes to Rs. 6.59 million (30 September 2012: Rs. 8.85 million). However, these financial statements does not include any adjustment to this effect since the Company is of the opinion that it does not come under the purview of the order of the Sindh High Court and that the Lahore High Court had already declared the above amendments unconstitutional via the case reported as 2011 PLD 2643.
14.2 Commitments
The Company has the following commitments in respect of:
(i) Contract for capital expenditure amounting to Rs. 72.26 million (2012: Rs. 65.21 million).
(ii) Contracts for acquisition of intangible (computer software) amounting to Rs. 20 million (2012: Rs. 20 million).
(iii) Contracts for other than capital expenditures Rs. 11.05 million (2012: Rs. 8.28 million).
(iv) The amount of future payments under operating leases and the period in which these payments will become due are as follows:
2013 2012
(Rupees in thousand) Not later than one year 1,437 4,992 Later than one year and not later than five years 360 1,350
1,797 6,342 15. PROPERTY, PLANT AND EQUIPMENT Operating assets - note 15.1 5,931,522 6,017,847 Capital work-in-progress - note 15.2 321,145 383,172
6,252,667 6,401,019

64
15.1 Operating assets 2013 (Rupees in thousand) Cost/ Effect of Cost/ Accumulated Depre- Elimination of Accumulated Book re-valued revaluation re-valued depreciation ciation accumulated depreciation value Rate of amount Additions/ amount 30 as at Trans- charge/ depreciation as at 30 as at 30 depreci- 01 October Transfers (deletions)/ September 01 October fers in/ (deletions) against September September ation 2012 in /(Out) (adjustments) 2013 2012 (Out) for the cost on 2013 2013 % year revaluation Owned assets Freehold land 2,018,427 - 13,206 - 1,920,133 - - - - - 1,920,133 - (111,500) Buildings and roads on freehold land 1,048,491 - 42,494 - 1,090,985 - - 80,474 - 80,474 1,010,511 7.5Plant and machinery 5,465,681 - 299,344 - 5,763,521 2,752,241 - 215,814 - 2,966,885 2,796,636 7.5-30 (1,504) (1,170) Tools and equipment 80,511 - 2,766 - 51,169 72,551 - 3,067 - 44,700 6,469 20-40 (32,108) (30,918) Water, electric and weighbridge equipment 280,411 - 4,452 - 276,572 220,694 - 12,845 - 225,831 50,741 20-40 (8,291) (7,708) Furniture and fixtures 45,687 - 2,549 - 48,015 35,148 - 2,440 - 37,476 10,539 20 (221) (112) Office equipment 57,366 - 2,677 - 59,473 48,162 - 4,928 - 52,869 6,604 40 (570) (221) Vehicles 176,390 6,559 2,492 - 181,986 97,938 4,608 16,014 - 115,938 66,048 20 (3,455) (2,622) Laboratory Equipment 22,114 - 1,167 - 23,281 18,761 - 1,690 - 20,451 2,830 40Arms and ammunition 575 - - - 575 287 - 57 - 344 231 10Library books 10,814 - 142 - 10,956 10,134 - 150 - 10,284 672 30 9,206,467 6,559 371,289 - 9,426,666 3,255,916 4,608 337,479 - 3,555,252 5,871,414 - (157,649) (42,751) Leased assets Plant and machinery 92,822 - - - 92,822 27,839 - 4,875 - 32,714 60,108 7.5 - Vehicles 7,083 (6,559) (524) - - 4,770 (4,416) (354) - - - 20 99,905 (6,559) (524) - 92,822 32,609 (4,416) 4,521 - 32,714 60,108 2013 9,306,372 - 370,765 - 9,519,488 3,288,525 192 342,000 - 3,587,966 5,931,522 (157,649) (42,751)
2012 (Rupees in thousand) Cost/ Effect of Cost/ Accumulated Depre- Elimination of Accumulated Book re-valued revaluation re-valued depreciation ciation accumulated depreciation value Rate of amount Additions/ amount 30 as at Trans- charge/ depreciation as at 30 as at 30 depreci- 01 October Transfers (deletions)/ September 01 October fers in/ (deletions) against September September ation 2011 in /(Out) (adjustments) 2012 2011 (Out) for the cost on 2012 2012 % year revaluation
Owned assets
Freehold land 1,671,361 - 1,670 345,396 2,018,427 - - - - - 2,018,427 -Buildings and roads on freehold land 567,725 - 51,374 429,392 1,048,491 260,574 - 24,038 (284,612) - 1,048,491 7.5Plant and machinery 5,312,681 10,281 199,234 - 5,465,681 2,560,667 2,549 211,360 - 2,752,241 2,713,440 7.5-30 - - (54,915) - - - - (21,048) - - - - - (1,600) - - - - (1,287) - - -Tools and equipment 76,372 - 4,139 - 80,511 69,247 - 3,304 - 72,551 7,960 20-40Water, electric and weighbridge equipment 277,100 - 7,038 - 280,411 208,443 - 15,353 - 220,694 59,717 20-40 (3,727) (3,102) -Furniture and fixtures 42,182 - 3,587 - 45,687 32,977 - 2,206 - 35,148 10,539 20 (83) (35) - Office equipment 50,942 - 6,424 - 57,366 42,561 - 5,601 - 48,162 9,204 40Vehicles 121,521 25,540 34,277 - 176,390 68,835 16,963 15,920 - 97,938 78,452 20 (4,948) (3,780) - Laboratory Equipment 18,598 - 3,516 - 22,114 17,343 - 1,418 - 18,761 3,353 40Arms and ammunition 575 - - - 575 216 - 71 - 287 288 10Library books 10,620 - 195 - 10,814 9,996 - 139 - 10,134 680 30 - - (1) - - - - (1) - - -
8,149,677 35,821 311,455 774,788 9,206,467 3,270,859 19,512 279,410 (284,612) 3,255,916 5,950,551 - (63,674) (27,966) (1,600) (1,287) Leased assets Plant and machinery 103,103 (10,281) - - 92,822 25,071 (2,549) 5,317 - 27,839 64,983 7.5
Vehicles 32,623 (25,540) - - 7,083 20,425 (16,678) 1,023 - 4,770 2,313 20 135,726 (35,821) - - 99,905 45,496 (19,227) 6,340 - 32,609 67,296 2012 8,285,403 - 311,455 774,788 9,306,372 3,316,355 285 285,750 (284,612) 3,288,525 6,017,847 (63,674) (27,966) (1,600) (1,287)
Notes to the FiNANCiAL stAteMeNtsFor the year ended 30 September 2013

65
15.1.1 Disposal of property, plant and equipment(Rupees in thousand)
Cost/ Carrying Accumulated Book Sale Mode ofParticulars of assets Sold to value depreciation value proceeds disposal Freehold land Related party Crescent Steel and Allied Products Limited - note 15.1.2 109,100 - 109,100 70,000 Negotiation Outside Party Mr. Muhammad Nawaz 2,400 - 2,400 2,100 -do- Plant and machinery Outside parties Mr. Muhammad Afzal 416 267 149 302 Negotiation Mr. Muhammad Farrukh 800 647 153 652 -do- Water, electric and Outside parties weighbridge equipment Mr. Muhammad Rashid 604 487 117 474 Negotiation Mr. Muhammad Nawaz 600 490 110 862 -do- Mr. Khalid Bashir 489 393 96 500 -do- Mr. Muhammad Shahzad 5,674 5,475 199 505 -do- Vehicles Employees Mr. Muhammad Sadiq 390 300 90 97 As per company policy
Mr. Bashir Ahmad 590 509 81 147 -do-
Outside parties Mr. Ghulam Abbas 360 286 74 160 Negotiation
Mr. Muhammad Younis 351 288 63 443 -do- Mr. Muhammad Younis 555 477 78 380 -do- Mr. Akhtar Abbas 397 147 250 900 -do- Tools and equipment Outside parties Warraich Agro Services 31,690 30,507 1,183 10,000 Negotiation Other assets having book value below Rs. 50,000 3,233 2,478 755 4,339 157,649 42,751 114,898 91,861 15.1.2 The board of directors in their meeting held on 30 May 2013 approved the sale of freehold land measuring
54.55 kanals located at Chak # 253-RB, Dallowal, Faisalabad to M/s Crescent Steel and Allied Products Limited, an associated undertaking, at a negotiated price of Rs. 70 million. The negotiated price is backed by valuation of land carried out by an independent valuer, Saleem Engineers, with reference to current market value of similar properties.
15.1.3 The Company bases its valuation of operating assets suspect to impairment upon valuation performed by an independent valuation expert.
15.1.4 The carrying amount of freehold land and buildings would have been Rs. 257.84 million (2012: Rs. 256.36 million) and Rs. 350.06 million (2012: Rs. 334.49 million) respectively, had there been no revaluation.
2013 2012(Rupees in thousand)
15.1.5 The depreciation charge has been allocated as follows:
Cost of sales - note 28 308,714 255,035 Administrative expenses - note 29 33,832 30,715
342,546 285,750
Notes to the FiNANCiAL stAteMeNtsFor the year ended 30 September 2013

66
15.1.6 The Company reviews the useful lives of property, plant and equipment on regular basis. Any change in estimates in future years might affect the carrying amounts of the respective items of property, plant and equipment with the corresponding effect on the depreciation charge and impairment.
2013 2012(Rupees in thousand)
15.2 Capital work-in-progress Civil works 3,634 8,399 Plant and machinery 224,312 111,528
227,946 119,927 Advances given for capital work in progress - note 15.2.1 93,199 263,245
321,145 383,172 15.2.1 Advances Considered good: - Plant and machinery - note 15.2.4 93,199 267,159 Considered doubtful: - Plant and machinery 1,310 1,310 - Intangibles 15,274 11,674
16,584 12,984
109,783 280,143 Less: Provision against doubtful advances - note 15.2.3 (16,584) (12,984) Less: Impairment charged during the year - (3,914)
93,199 263,245 15.2.2 These advances include interest free amount due to an associated company amounting to Rs. 3.17
million (2012: Nil) in the normal course of business. 15.2.3 Provision against doubtful advances As at 1 October 12,984 12,984 Provision during the year 3,600 -
As at 30 September 16,584 12,984 15.2.4 Advances include an amount given to Mian Muhammad Sugar Mill in pursuance to a purchase
arrangement whereby the Company will get a beneficial interest in the machinery installed at the premises. The movement to date is as follows:
2013 2012 (Rupees in thousand) Advance to date 211,217 196,917 Machinery received (145,776) (50,444)
65,441 146,473 Impairment charged - note 15.2.3.1 (28,148) (28,148)
37,293 118,325
Notes to the FiNANCiAL stAteMeNtsFor the year ended 30 September 2013

67
15.2.3.1 This represents impairment charged to date on advance payment made by the Company for purchase of plant and machinery. The impairment has been recorded based on the valuation carried out on a yearly basis. The latest valuation has been conducted by Saleem Engineers (Pvt) Limited (2012: M/s Empire Enterprises (Pvt) Limited). As a result of valuation, no impairment occurred during the year.
16. INTANGIBLE ASSETS
2013 (Rupees in thousand)
Accumulated Amorti- Accumulated Book value Rate Cost as at Additions/ Cost as at amortization zation amortization as at 30 of amorti- 01 October (transfers/ 30 September 01 October charge for 30 September September ization 2012 deletions) 2013 2012 the year 2013 2013 %
Computer software - acquired 2,000 - 2,000 1,760 60 1,820 180 20 Nepra license fee 1,007 - 1,007 202 30 232 775 3.7-5.0 3,007 - 3,007 1,962 90 2,052 955
2012 (Rupees in thousand)
Accumulated Amorti- Accumulated Book value Rate Cost as at Additions/ Cost as at amortization zation amortization as at 30 of amorti- 01 October (transfers/ 30 September 01 October charge for 30 September September ization 2011 deletions) 2012 2011 the year 2012 2012 %
Computer software - acquired 2,000 - 2,000 1,700 60 1,760 240 20Nepra license fee 1,007 - 1,007 170 32 202 805 3.7-5.0 3,007 - 3,007 1,870 92 1,962 1,045
16.1 The amortization charge for the year has been allocated to cost of sales as referred to in note 28 .
2013 2012(Rupees in thousand)
17. BIOLOGICAL ASSETS
Sugarcane Mature 22,272 32,394 Immature 4,089 -
26,361 32,394 Rice - mature 5,550 4,748 Others - mature 689 253 Livestock - mature 13,975 8,895
46,575 46,290
Non - current 13,975 8,895 Current 32,600 37,395
- note 17.3 46,575 46,290 17.1 The value of sugarcane crops is based on estimated average yield of 595 (2012: 550) maunds per acre on
cultivated area of 240 (2012: 232) acres. The value of rice crops is based on the estimated yield of 34 (2012: 38) maunds per acre on cultivated area of 86 (2012: 93) acres.
17.2 100 acres (2012: Nil) relates to sugarcane cultivation which is valued at a cost of Rs. 4.09 million (2012: Nil).
Notes to the FiNANCiAL stAteMeNtsFor the year ended 30 September 2013

68
2013 2012(Rupees in thousand)
17.3 Movement during the year Livestock As at 1 October 8,895 8,931 Increase due to purchases/costs incurred 413 2,368 Gain / (loss) arising from changes in fair value less estimated point of sale costs 5,548 (172) Decrease due to sale / deceased livestock (881) (2,232)
As at 30 September 13,975 8,895 Crops As at 1 October 37,395 23,702 Increase due to purchases/costs incurred 43,461 45,233 Decrease due to harvest / sales (34,327) (40,229) Fair value loss related to sales during the year (10,001) (5,004) Transferred to finished goods (685) (1,551) Fair value adjustment of agricultural assets - note 31 (3,243) 15,244
As at 30 September 32,600 37,395 46,575 46,290 18. INVESTMENTS - RELATED PARTIES In equity instruments of associates - note 18.1 528,633 652,880 Available for sale - note 18.3 553,089 98,015
1,081,722 750,895 18.1 In equity instruments of associates Cost 545,793 545,793 Brought forward amounts of post acquisition reserves, profits and negative goodwill recognized directly in profit and loss accounts 107,087 (1,926)
652,880 543,867 Share of movement in reserves during the year 7,042 3,919 Share of profit for the year - before taxation 198,667 138,580 - provision for taxation - note 34 (32,825) (8,117)
165,842 130,463 825,764 678,249 Dividends received during the year (32,200) (25,369) Transferred to available for sale - note 18.2.6 (264,931) -
(297,131) (25,369) Balance as on 30 September - note 18.2 528,633 652,880
Notes to the FiNANCiAL stAteMeNtsFor the year ended 30 September 2013

69
2013 2012(Rupees in thousand)
18.2 In equity instruments of associates Quoted Crescent Steel and Allied Products Limited 2,720,062 (2012: 2,720,062) fully paid ordinary shares of Rs. 10 each - note 18.2.5 246,809 204,715 Equity held: 4.82% (2012: 4.82%) Safeway Mutual Fund Limited Nil (2012: 16,579,143) fully paid ordinary shares of Rs. 10 each - note 18.2.6 - 148,771 Equity held till 15 September 2013: 30.45% (2012: 30.45%) Unquoted Shakarganj Food Products Limited 74,654,596 (2012: 74,654,596) fully paid ordinary shares of Rs. 10 each - note 18.2.7 281,824 299,394 Equity Held: 49.24% (2012: 49.24%) 528,633 652,880
18.2.1 Investments in associates include goodwill amounting to Rs. 82.89 million (2012: Rs. 82.89 million).
18.2.2 The Company’s share of the results of its principal associates, all of which are incorporated in Pakistan, and its share of the assets (including goodwill) and liabilities are as follows:
Name Percentage interest Assets Liabilities Revenues Profit/(loss) held ----------- (Rupees in thousand) -----------2013 Crescent Steel and Allied Products Limited 4.82% 279,086 (43,901) 240,964 42,901 Shakarganj Food Products Limited 49.24% 787,759 (577,765) 2,435,397 (17,259)Safeway Mutual Fund Limited 30.45% 358,808 (8,753) 148,327 140,200 1,425,653 (630,419) 2,824,688 165,842 Name Percentage interest Assets Liabilities Revenues Profit/(loss) held ----------- (Rupees in thousand) ----------- 2012 Crescent Steel and Allied Products Limited 4.82% 244,845 (51,661) 190,046 22,690 Shakarganj Foods Products Limited 49.24% 652,447 (424,329) 1,986,195 41,731 Safeway Mutual Fund Limited 30.45% 234,740 (833) 56,491 66,042 1,132,032 (476,823) 2,232,732 130,463
Notes to the FiNANCiAL stAteMeNtsFor the year ended 30 September 2013

70
18.2.3 The Company’s investment in Crescent steel and Allied Products Limited is less than 20% but it is considered to be an associate as per the requirements of IAS - 28 ‘Investments in Associates’ because the Company has significant influence over its financial and operating policies through director and chief executive of the Company.
18.2.4 The above figures of Crescent Steel and Allied Products Limited and Safeway Mutual Fund Limited are based on audited consolidated financial statements as at 30 June 2013.
18.2.5 The Company has assessed the recoverable amount of investment in Crescent Steel and Allied Products Limited based on value in use calculation. This calculation has been made on discounted cashflow methodology which assumes gross profit margin of 12.62% - 14.60%, EBITDA of 16.66% - 18.91%, terminal growth rate of 6.5% and discount rate of approximately 13.5%.
18.2.6 The board of directors of Safeway Mutual Fund Limited in their meeting resolved to convert the company (close end fund) into an open end fund. By virtue of this change in status of the fund, Shakarganj Mills Limited could not exercise significant influence which it had through common directorship. Accordingly the investment in Safeway Mutual Fund Limited has been reclassified to available for sale. This treatment has been done in accordance with the guidelines in IAS-28 i.e. the carrying value has been determined in accordance with the funds net assets value at the conversion date of 16 September 2013 and the resulting gain has been charged to profit and loss account.
2013 2012(Rupees in thousand)
Net assets value as at 16 September 2013 374,025 - Less: Carrying value on the basis of equity method before transfer to available for sale (264,931) - Gain on transfer from equity investment to available for sale 109,094 - 18.2.7 The Company has assessed the recoverable amount of investment in Shakarganj Food Products Limited
based on value in use calculation. This calculation has been made on discounted cash flow methodology which assumes gross profit margin of 15.40% - 16.38%, EBITDA of 2.78% - 3.75%, terminal growth rate of 4% and discount rate of approximately 14.8%.
2013 2012 (Rupees in thousand)
18.3 Available for sale Associated companies - at cost - note 18.3.1 3,000 3,000 Others - at cost - note 18.3.2 521,142 147,117
524,142 150,117
Add: Cumulative fair value gain - note 18.3.3 122,204 41,155 Less: Cumulative impairment losses recognized - note 18.3.4 (93,257) (93,257)
Fair value gain / (loss) 28,947 (52,102)
553,089 98,015
Notes to the FiNANCiAL stAteMeNtsFor the year ended 30 September 2013

71
2013 2012 (Rupees in thousand)
18.3.1 Associated companies Quoted Crescent jute Products Limited 536,817 (2012: 536,817) fully paid ordinary shares of Rs. 10 each - - Market value - Rs. 0.83 million (2012: Rs. 0.54 million) Unquoted Crescent Standard Telecommunications Limited 300,000 (2012: 300,000) fully paid ordinary shares of Rs. 10 each 3,000 3,000 3,000 3,000 18.3.2 Others Unquoted Crescent Group Services (Private) Limited 220,000 (2012: 220,000) fully paid ordinary shares of Rs. 10 each 2,200 2,200 Mutual Funds - Open end Safeway Mutual Fund 19,066,014 (2012: Nil) units of Rs. 10 each - note 18.2.6 374,025 - inclusive of bonus issue @ 15% during the year Market value - Rs. 350.05 million (2012: Nil) Asian Stocks Fund 17,675,292 (2012: 16,245,673) units of Rs. 10 each 144,917 144,917 inclusive of bonus issue @ 8.8% during the year Market value - Rs. 202.21 million (2012: Rs. 97.47 million) 521,142 147,117 18.3.3 Cumulative fair value gain As at 1 October 41,155 17,325 Fair value gain during the year 81,049 23,830 122,204 41,155 Impairment loss transferred to profit and loss account - - As at 30 September 122,204 41,155 18.3.4 Cumulative impairment losses recognized As at 1 October 93,257 93,257 Recognized during the year - - As at 30 September 93,257 93,257 18.3.5 Investments with face value of Rs. 922.49 million (2012: Rs. 922.49 million) and market value of Rs. 1,157.94
million (2012: Rs. 903.82 million) are pledged as security against long term running finances and short term borrowings as referred to in note 7 and 11 respectively.
Notes to the FiNANCiAL stAteMeNtsFor the year ended 30 September 2013

72
2013 2012(Rupees in thousand)
19. LONG TERM LOANS, ADVANCES, DEPOSITS AND PREPAYMENTS Loan to Sui Northern Gas Pipelines Limited - considered good - note 19.2 1,656 2,070 Less: Current portion shown under short term advances - note 25 414 414
1,242 1,656 Advance to Creek Marina (Private) Limited - considered doubtful - note 19.3 38,557 38,557 Security deposits 37,346 38,313
77,145 78,526 Less: Provision against doubtful receivables - note 19.1 (38,822) (38,557)
38,323 39,969 19.1 Provision against doubtful receivables As at 1 October 38,557 - Provision during the year - note 29 265 38,557
As at 30 September 38,822 38,557
19.2 This represents an un-secured loan given to SNGPL for development of infrastructure for supply of gas to the principal facility. Mark-up is charged at the rate of 1.5% per annum. This amount is receivable in 10 equal annual installments ending May 2017.
19.3 This represents payment for two apartments in the Creek Marina Projects pursuant to a settlement
agreement entered into by the Company and the former Crescent Standard Investment Bank Limited (CSIBL) in year 2006. The construction work at the site has been halted since last year due to differences between Defence Housing Authority and the developer. As per minutes of the Third General Body Meeting of Creek Marina Action Committee (CMAC), held in September 2012, the resumption of construction work is still uncertain in near future. Consequently, based on prudence principal the Company provided the above advance in full last year.
2013 2012 (Rupees in thousand) 20. DEFERRED TAxATION The deferred tax asset comprises temporary differences relating to: Accelerated tax depreciation (561,171) (608,290) Revaluation surplus on property, plant and equipment (168,777) (194,499) Unused tax losses 698,485 782,565 Undistributed reserves of associates 31,463 20,224
- -
Notes to the FiNANCiAL stAteMeNtsFor the year ended 30 September 2013

73
Deferred tax asset on tax losses available for carry forward and those representing minimum tax paid available for carry forward u/s 113 of the Income Tax Ordinance, 2001 are recognized to the extent that the realization of related tax benefits through future taxable profits is probable. The company has not recognized deferred tax assets of Rs. 2,173.82 million (2012: Rs. 3,081.24 million ) in respect of tax losses and Rs 280.18 million (2012: Rs. 247.47 million) in respect of minimum tax paid and available for carry forward u/s 113 of the Income Tax Ordinance, 2001, as sufficient tax profits may not be available to set these off in the foreseeable future. Minimum tax paid u/s 113 aggregating to Rs. 280.18 million would not be available for carry forward against future tax liabilities subsequent to years 2014 through 2018. Tax losses amounting to Rs. 1,400.81 million, Rs. 472.62 million, Rs. 390.49 million, Rs. 781.29 million and Rs. 983.55 million expire in tax year 2015, 2016, 2017, 2018, 2019 and 2020 respectively.
2013 2012(Rupees in thousand)
21. STORES, SPARES AND LOOSE TOOLS
Stores 63,248 68,945 Spares 54,916 63,662 Loose tools 1,532 1,865
119,696 134,472 Less: Provision for obsolete items (4,610) (4,610)
115,086 129,862
21.1 Stores and spares include items which may result in fixed capital expenditure but are not distinguishable.
22. STOCK-IN-TRADE
Raw materials 23,552 266,984 Work-in-process 11,771 11,240 Finished goods 486,684 1,487,511
522,007 1,765,735
22.1 Raw materials and finished goods amounting to Rs. 385.70 million (2012: Rs. 890.10 million) are pledged with lenders as security against long term running finances and short term borrowings as referred to in note 7 and note 11 respectively.
22.2 The amount charged to profit and loss account on account of write down of finished goods to net realizable
value amounted to Rs. 9.84 million (2012: Nil). 2013 2012 (Rupees in thousand) 23. TRADE DEBTS Considered good: - Secured - 7 - Unsecured - note 23.1 71,619 243,131
71,619 243,138 Less: Provision for doubtful debts - - 71,619 243,138
Notes to the FiNANCiAL stAteMeNtsFor the year ended 30 September 2013
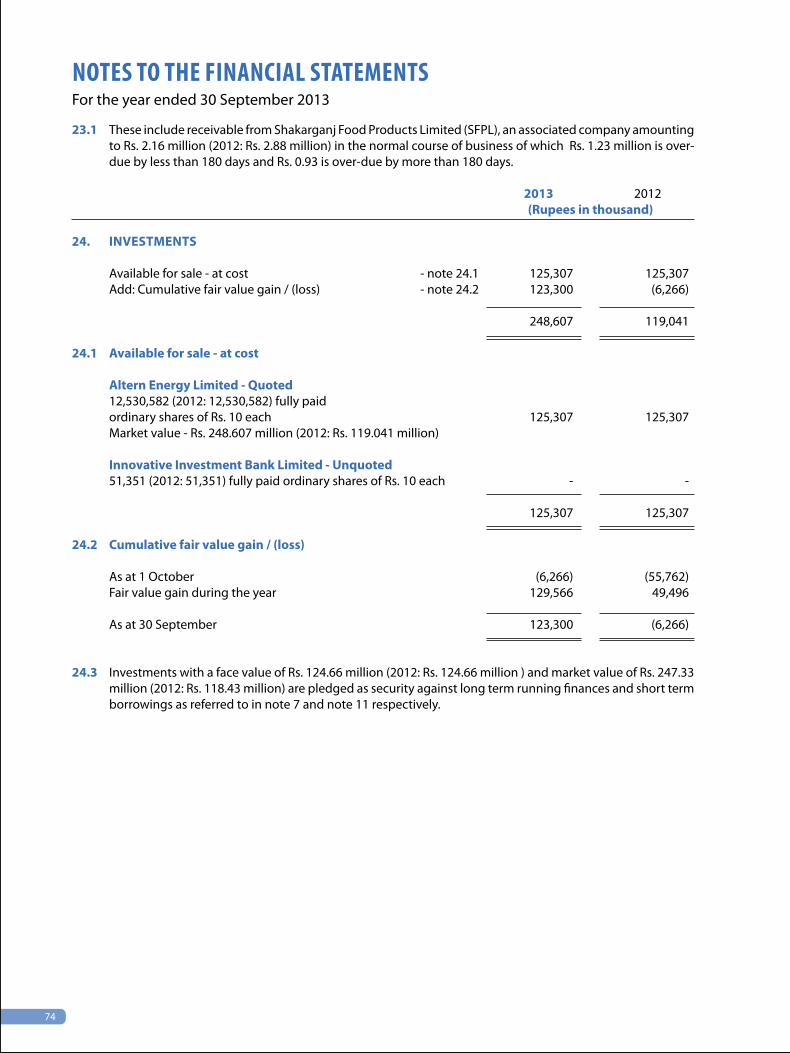
74
23.1 These include receivable from Shakarganj Food Products Limited (SFPL), an associated company amounting to Rs. 2.16 million (2012: Rs. 2.88 million) in the normal course of business of which Rs. 1.23 million is over-due by less than 180 days and Rs. 0.93 is over-due by more than 180 days.
2013 2012(Rupees in thousand)
24. INVESTMENTS Available for sale - at cost - note 24.1 125,307 125,307 Add: Cumulative fair value gain / (loss) - note 24.2 123,300 (6,266)
248,607 119,041 24.1 Available for sale - at cost Altern Energy Limited - Quoted 12,530,582 (2012: 12,530,582) fully paid ordinary shares of Rs. 10 each 125,307 125,307 Market value - Rs. 248.607 million (2012: Rs. 119.041 million) Innovative Investment Bank Limited - Unquoted 51,351 (2012: 51,351) fully paid ordinary shares of Rs. 10 each - - 125,307 125,307 24.2 Cumulative fair value gain / (loss) As at 1 October (6,266) (55,762) Fair value gain during the year 129,566 49,496
As at 30 September 123,300 (6,266)
24.3 Investments with a face value of Rs. 124.66 million (2012: Rs. 124.66 million ) and market value of Rs. 247.33 million (2012: Rs. 118.43 million) are pledged as security against long term running finances and short term borrowings as referred to in note 7 and note 11 respectively.
Notes to the FiNANCiAL stAteMeNtsFor the year ended 30 September 2013

75
2013 2012(Rupees in thousand)
25. LOANS, ADVANCES, PREPAYMENTS AND OTHER RECEIVABLES Advances - considered good - to employees 9,091 8,522 - to suppliers and contractors - note 25.1 53,539 79,961 - to sugarcane growers 72,240 39,225
134,870 127,708 Advances - considered doubtful: - to employees 177 177 - to suppliers and contractors 7,231 6,358 - to sugarcane growers 237 237
7,645 6,772 Due from related parties - unsecured and considered good - note 25.2 138 7,188 Current portion of long term loan receivable from Sui Northern Gas Pipelines Limited - note 25.1 414 414 Receivable from Government - Income tax 116,296 - - Export rebate 39,137 - Security deposits - considered good 12,989 783 Prepayments 6,068 9,204 Margins against bank guarantees 2,800 2,800 Others: - considered good 11,570 6,670 - considered doubtful 1,645 1,645 333,572 163,184 Less: Provision against doubtful receivables - note 25.3 (9,290) (8,417)
324,282 154,767 25.1 These relate to normal business of the Company and are interest free. 25.2 Due from related parties - unsecured and considered good Crescent Cotton Mills Limited 80 80 Crescent Steel and Allied Products Limited 4 5,322 Shakarganj Food Products Limited 54 1,786
138 7,188 25.3 Provision against doubtful receivables As at 1 October 8,417 5,616 Provision during the year 873 3,673 Written off during the year - (872)
As at 30 September 9,290 8,417
Notes to the FiNANCiAL stAteMeNtsFor the year ended 30 September 2013

76
2013 2012(Rupees in thousand)
26. CASH AND BANK BALANCES At banks on: - Saving accounts - Pak rupees - note 26.1 5 80 - Foreign currency - note 26.2 654 583
659 663 - Current accounts 99,049 68,789
99,708 69,452 In hand 661 149
100,369 69,601 26.1 Profit on balances in saving accounts ranges from 0.10% to 6.00% (2012: 0.10% to 6.00%) per annum.
26.2 Foreign currency accounts include US Dollars 5,353 (2012: 5,353) and Euros 635 (2012: 635).
Notes to the FiNANCiAL stAteMeNtsFor the year ended 30 September 2013

77
27. SALES(Rupees in thousand)
Sugar Bio Fuel Building Materials Textile Farms Bio Power Others Total 2013 2012 2013 2012 2013 2012 2013 2012 2013 2012 2013 2012 2013 2012 2013 2012 Represented RepresentedGross sales - Local 6,358,149 8,173,308 238,613 246,538 94,198 134,134 1,869,083 1,663,210 45,466 36,462 180,427 271,952 47,005 40,486 8,832,941 10,566,090 - Export 872,705 - 4,289,589 4,876,810 - - - - - - - - - - 5,162,294 4,876,810 - By-products - - 30,567 - - - 32,378 44,664 - - - - - - 62,945 44,664 - Inter-segment 1,011,392 1,347,608 121,548 115,148 915 - - - 15,058 3,767 65,435 2,982 - - - - 8,242,246 9,520,916 4,680,317 5,238,496 95,113 134,134 1,901,461 1,707,874 60,524 40,229 245,862 274,934 47,005 40,486 14,058,180 15,487,564 Less: Commission to selling agents 6,849 9,737 334 263 6,892 9,867 10,168 7,858 - - - - 17 2,078 24,260 29,803 Sales tax and Special Excise Duty 432,606 605,430 33,151 34,001 13,290 18,501 22,753 - - - 24,895 37,511 - - 526,695 695,443 439,455 615,167 33,485 34,264 20,182 28,368 32,921 7,858 - - 24,895 37,511 17 2,078 550,955 725,246 Net sales 7,802,791 8,905,749 4,646,832 5,204,232 74,931 105,766 1,868,540 1,700,016 60,524 40,229 220,967 237,423 46,988 38,408 13,507,225 14,762,318
27.1 Inter-segment sales have been eliminated from total figures.
28. COST OF SALES
(Rupees in thousand)
Sugar Bio Fuel Building Materials Textile Farms Bio Power Others Total 2013 2012 2013 2012 2013 2012 2013 2012 2013 2012 2013 2012 2013 2012 2013 2012 Represented Represented
Inter-segment 10,274 3,393 972,317 1,259,976 39,507 41,024 61,994 31,705 8,308 375 121,548 132,080 400 952 - - Raw materials consumed 6,061,183 7,816,653 1,947,766 2,347,907 887 620 1,361,558 1,281,319 1,410 611 - - 23,185 16,457 9,395,989 11,463,567 6,071,457 7,820,046 2,920,083 3,607,883 40,394 41,644 1,423,552 1,313,024 9,718 986 121,548 132,080 23,585 17,409 9,395,989 11,463,567 Salaries, wages and other benefits - note 28.2 300,822 316,844 49,539 47,476 8,041 8,841 111,232 93,489 6,890 6,891 2,688 2,633 1,976 1,858 481,188 478,032 Stores and spares consumed 145,883 188,871 22,855 17,677 1,565 2,103 46,503 34,431 7,983 6,928 25,762 12,431 35 - 250,586 262,441 Dyes and chemicals 40,442 51,855 63,557 77,364 20,236 23,529 - - - - 216 18 - - 124,451 152,766 Packing material consumed 72,407 85,378 - - - - 21,685 20,831 - - - - 2,066 2,887 96,158 109,096 Fuel and power 430,514 717,798 151 394 23 27 171,477 173,456 5,270 5,672 36,429 23,978 - - 643,864 921,325 Repairs and maintenance 39,593 44,542 10,988 10,495 825 686 855 532 2,105 1,521 13,848 5,612 15 - 68,229 63,388 Insurance 4,933 4,660 2,528 1,643 122 78 2,735 2,349 511 495 908 1,166 - - 11,737 10,391 Vehicle running and maintenance 9,838 11,163 - - 213 90 - - - - - - - - 10,051 11,253 Travelling and conveyance 2,495 2,286 293 529 25 64 1,651 1,514 - - - - - - 4,464 4,393 Printing and stationery 1,018 1,064 80 119 2 1 - - - - 2 2 - - 1,102 1,186 Rent, rates and taxes 2,420 7,557 - - - - 198 198 5,447 7,467 - - - - 8,065 15,222 Land preparation and irrigation expense - - - - - - - - 13,321 12,822 - - - - 13,321 12,822 Sugarcane research and development - note 28.2 3,552 4,471 - - - - - - - - - - - - 3,552 4,471 Staff training and development 25 42 - - - - - - - - - - - - 25 42 Depreciation on property, plant and equipment - note 15.1.5 192,854 158,544 60,883 50,497 2,200 1,006 21,990 15,767 2,117 2,790 28,670 26,431 - - 308,714 255,035 Amortization on intangibles 60 60 - - - - - - - - 30 32 - - 90 92 Other expenses 34,540 29,735 11,060 7,928 2,219 2,132 2,755 2,605 419 311 702 249 501 274 52,196 43,234 7,352,853 9,444,916 3,142,017 3,822,005 75,865 80,201 1,804,633 1,658,196 53,781 45,883 230,803 204,632 28,178 22,428 11,473,782 13,808,756
Opening work-in-process 1,711 838 - - 1,556 8,486 7,973 9,545 - - - - - - 11,240 18,869 Less: Closing work-in-process (1,654) (1,711) - - (768) (1,556) (9,349) (7,973) - - - - - - (11,771) (11,240) 57 (873) - - 788 6,930 (1,376) 1,572 - - - - - - (531) 7,629 Cost of goods produced 7,352,910 9,444,043 3,142,017 3,822,005 76,653 87,131 1,803,257 1,659,768 53,781 45,883 230,803 204,632 28,178 22,428 11,473,251 13,816,385 Opening stock of finished goods 928,080 517,996 579,564 193,422 9,020 18,344 13,289 32,974 1,551 - - - 3,049 - 1,534,553 762,736 Less: (396,694) (928,080) (58,610) (579,564) (11,862) (9,020) (26,240) (13,289) (685) (1,551) - - (942) (3,049) (495,033) (1,534,553) 531,386 (410,084) 520,954 (386,142) (2,842) 9,324 (12,951) 19,685 866 (1,551) - - 2,107 (3,049) 1,039,520 (771,817) 7,884,296 9,033,959 3,662,971 3,435,863 73,811 96,455 1,790,306 1,679,453 54,647 44,332 230,803 204,632 30,285 19,379 12,512,771 13,044,568
28.1 Inter-segment purchases have been eliminated from total figures.
Notes to the FiNANCiAL stAteMeNtsFor the year ended 30 September 2013

78
28.2 Salaries, wages and other benefits and sugarcane research and development include following in respect of retirement benefits:
2013 2012(Rupees in thousand)
Pension fund 5,125 4,181 Gratuity fund 1,717 989 Provident fund 6,492 6,124
13,334 11,294 29. ADMINISTRATIVE ExPENSES Salaries, wages and other benefits - note 29.1 175,685 177,842 Repairs and maintenance 11,889 13,128 Insurance 4,132 3,749 Vehicle running and maintenance 13,361 15,218 Travelling and conveyance 7,935 6,038 Printing and stationery 1,970 1,765 Electricity and gas 2,075 2,570 Telephone, postage and telegram 5,243 5,081 Legal and professional charges - note 29.2 9,058 20,282 Consultancy and advisory services 4,537 5,014 Rent, rates and taxes 3,362 3,096 Staff training and development 508 562 Entertainment 5,482 10,768 Subscriptions 9,613 10,513 Advertisements 618 288 Registered office expenses 729 726 Provision for doubtful loans, advances, deposits and receivables: - Long term - note 19.1 265 38,557 - Short term - note 25.3 873 3,673 - Capital work in progress - note 15.2.3 3,600 - Depreciation on property, plant and equipment - note 15.1.5 33,832 30,715 Others 4,025 3,410 298,792 352,995 29.1 Salaries, wages and other benefits include following in respect of retirement benefits: Pension fund 4,564 4,686 Gratuity fund 1,425 950 Provident fund 2,269 2,279 8,258 7,915 29.2 Professional services The charges for professional services include the following in respect of auditors’ services for: - Statutory audit 1,350 1,350 - Half yearly review 550 550 - Certification charges 100 140 - Out of pocket expenses 300 139 2,300 2,179
Notes to the FiNANCiAL stAteMeNtsFor the year ended 30 September 2013

79
2013 2012(Rupees in thousand)
30. DISTRIBUTION AND SELLING COSTS Salaries, wages and other benefits - note 31.1 4,512 3,870 Freight and forwarding 306,961 314,587 Handling and distribution 2,781 3,643 Loading and unloading charges 9,961 8,991 Sales promotion expenses 1,104 639 Insurance 4,811 5,215 Others 257 163
330,387 337,108 30.1 Salaries, wages and other benefits include following in respect of retirement benefits: Pension fund 88 69 Gratuity fund 24 - Provident fund 118 117
230 186 31. OTHER OPERATING ExPENSES Workers’ Profit Participation Fund 17,335 23,287 Impairment losses on: - Available for sale investments - long term - - - Property, plant and equipment - note 15.2.4 - 3,914 Social action programme expenses - note 31.1 7,917 8,091 Loss on sale property, plant and equipment - note 15.1.1 34,903 - Net exchange loss 43,875 42,570 Donations - note 31.2 2,312 1,488 Waste water drainage 7,772 8,549 Fair value adjustment of agricultural assets - note 31.3 3,243 - Others 478 7,034 117,835 94,933 31.1 Social action programme expenses include following in respect of retirement benefits: Pension fund 37 27 Gratuity fund 10 14 Provident fund 59 61
106 102 31.2 None of the directors and their spouses had any interest in any of the donees. 31.3 In the year 2012, there was net income from agricultural activities which was classified under other operating
income as referred to in note 32.
Notes to the FiNANCiAL stAteMeNtsFor the year ended 30 September 2013

80
2013 2012(Rupees in thousand)
32. OTHER INCOME
Income from financial assets Dividend income from related parties 13,809 10,722 Gain on marked to market valuation of interest rate swap 13,457 18,165 Gain on transfer of equity investment to available for sale - note 18.2.6 109,094 -
Return on bank deposits 547 701
136,907 29,588 Income from non-financial assets Scrap sales 34,043 4,589 Profit on sale of: - Property, plant and equipment 11,866 21,971 - Store items 1,371 - Liabilities written back 73,587 3,946 Rental income 9,262 13,477 Net income from livestock - 1,459 Fair value adjustment of agricultural assets - note 17.3 - 15,244 Export rebate 39,137 - Others 15,212 10,354
184,478 71,040
321,385 100,628 33. FINANCE COST Interest and mark-up on: - Long term finances - note 33.1 199,535 316,866 - Short term borrowings - note 33.1 192,632 360,294 - Workers’ profit participation fund 1,841 - - Due to gratuity and pension funds - related party 27,922 25,001 - Due to provident fund - related party 889 - - Finance lease 3,253 5,123 Bank charges, commission and excise duty 8,780 12,413 Others 3,278 9,772
438,130 729,469
33.1 This includes penalties aggregating to Rs. 1.71 million (2012: Nil) levied by financial institutions due to delayed payments.
Notes to the FiNANCiAL stAteMeNtsFor the year ended 30 September 2013

81
2013 2012(Rupees in thousand)
34. TAxATION For the year - Current 110,647 137,392 - Deferred - (194,499)
110,647 (57,107) Prior year - Current (81,122) (7,033)
29,525 (64,140) Associates 32,825 8,117
62,350 (56,023) 34.1 The Company takes into account the current income tax law and the decisions taken by appellate
authorities. Instance where the Company’s view differs from the view taken by the income tax department at the assessment stage and where the Company considers that its views on items of material nature is in accordance with law, the amounts are shown as contingent liabilities.
34.2 In view of the available income tax losses, the provision for current taxation represents tax under ‘Final Tax
Regime’ and minimum tax on turnover under section 113 of the Income Tax Ordinance, 2001. Minimum tax under section 113 is available for set off for five years against normal tax liability arising in future years whereas tax under ‘Final Tax Regime’ is not available for set off against normal tax liabilities.
For the purposes of current taxation, the tax losses available for carry forward as at 30 September 2013 are estimated approximately at Rs. 8,447.96 million (2012: Rs. 7,845.79 million).
2013 2012 % %
34.3 Tax charge reconciliation Numerical reconciliation between the average effective tax rate and the applicable tax rate Applicable tax rate 34.00 35.00 Tax effect for income under presumptive tax regime (139.77) (137.91) Tax losses for which no deferred tax is recognised 67.16 88.67 Tax effect of amounts that are not deductible for tax purposes 17.66 2.61 Impact of tax related to associates 6.89 0.58 Effect of change in prior year’s tax and others 33.97 (1.61)
(14.09) (47.66) Average effective tax rate charged to profit and loss account 19.91 (12.66)
Notes to the FiNANCiAL stAteMeNtsFor the year ended 30 September 2013

82
2013 2012
35. EARNINGS PER SHARE 35.1 Basic earnings per share
Profit for the year Rupees 267,012,000 498,476,000 Weighted average number of ordinary shares in issue during the year Number 69,523,798 69,523,798 Earnings per share - basic Rupees 3.84 7.17 35.2 Diluted earnings per share Diluted earnings per share is calculated by adjusting the weighted average number of ordinary shares
outstanding to assume conversion of all dilutive potential ordinary shares. The company has a commitment to convert 1,000 preference shares into 167 ordinary shares of Rs. 10 each. For the purposes of computing the diluted EPS the convertible preference shares are assumed to have been converted into ordinary shares, and the profit/(loss) is adjusted to eliminate the preference dividend.
2013 2012 Profit for the year 267,012,000 498,476,000 Preference dividend on convertible preference shares - -
Profit used to determine diluted earnings per share Rupees 267,012,000 498,476,000 Weighted average number of ordinary shares in issue during the year Number 69,523,798 69,523,798 Assumed conversion of convertible preference shares into ordinary shares Number 5,774,108 5,774,108 Weighted average number of ordinary shares for diluted earnings per share Number 75,297,906 75,297,906
Profit per share - diluted Rupees 3.55 6.62
Notes to the FiNANCiAL stAteMeNtsFor the year ended 30 September 2013

83
2013 2012(Rupees in thousand)
36. CASH GENERATED FROM OPERATING ACTIVITIES Profit before taxation 329,362 442,453 Adjustment for: Depreciation/amortization of: - property, plant and equipment 342,546 285,750 - intangible assets 90 92 Impairment of advance for capital work-in-progress - 3,914 Liabilities written back (73,587) (3,946) Loss / (gain) on sale of property, plant and equipment 23,037 (21,971) Interest from bank deposits (547) (701) Provision for doubtful loans, advances, deposits and receivables: - Long term 265 38,557 - Short term 873 3,673 - Capital work in progress 3,600 - Provision for employees’ retirement benefits 12,990 10,916 Dividend income (13,809) (10,722) Net income from livestock (5,080) (1,459) Gain on marked to market valuation of interest rate swap (13,457) (18,165) Gain on transfer of equity investment to available for sale (109,094) - Share of profit from associates (198,667) (138,580) Finance cost 438,130 729,469
407,290 876,827 Profit before working capital changes 736,652 1,319,280 Effect on cash flow due to working capital changes: Decrease / (increase) in stores and spares 14,776 (23,156) Decrease / (increase) in stock in trade 1,243,728 (679,913) Net decrease / (increase) in biological assets 4,795 (12,198) Decrease in trade debts 171,519 248,508 (Increase) / decrease in loans, advances, prepayments and other receivables (54,476) 339 Increase in trade and other payables 773,372 776,561 2,153,714 310,141 Cash generated from operating activities 2,890,366 1,629,421
Notes to the FiNANCiAL stAteMeNtsFor the year ended 30 September 2013

84
37. REMUNERATION OF CHIEF ExECUTIVE, DIRECTORS AND ExECUTIVES 37.1 The aggregate amount charged in the financial statements for the year for remuneration, including certain
benefits, to the full time working directors and executives of the Company is as follows:
Directors Executives
2013 2012 2013 2012 (Rupees in thousand) (Rupees in thousand)
Managerial remuneration 3,000 2,763 58,530 58,564 Contribution to provident fund, gratuity and pension funds 210 194 10,371 11,700 House rent 1,200 1,105 16,156 18,691 Utilities 300 276 5,955 4,553 Reimbursable expenses 180 - 424 435 Others - - 1,515 5,227
4,890 4,338 92,951 99,170 Number of persons 1 1 46 51
37.2 These financial statements do not include any charge in respect of remuneration or benefits to the Chief Executive. 37.3 The Company also provides some of its executives with company maintained cars, travel facilities and club
membership. 37.4 Aggregate amount charged in the financial statements for the year for fee to 7 directors (2012: 7 directors)
was Rs. 290,000 (2012: Rs. 300,000).
38. PROVIDENT FUND RELATED DISCLOSURE The company operates a provident fund for its employees. The following information is based on audited financial statements of the Fund; 2013 2012 (Rupees in thousand) Size of the fund 148,783 108,537 Cost of investment made 101,426 140,426 Fair value of investments 44,826 71,405 Percentage of investments made 30% 66% The breakup of investments is as follows: Term deposit receipts - MCB Bank Limited - 39,000 Available for sale Ordinary shares - listed companies 9,856 13,368 Preference shares - listed companies 2,954 1,045 Mutual funds 32,016 17,992 44,826 32,405 44,826 71,405 The above investments out of provident fund from the funds received from the Company have been
made in accordance with the requirement of section 227 of the Companies Ordinance, 1984 and the rules formulated for this purpose.
Notes to the FiNANCiAL stAteMeNtsFor the year ended 30 September 2013

85
Notes to the FiNANCiAL stAteMeNtsFor the year ended 30 September 2013
39. NUMBER OF EMPLOYEES
The Company has employed following number of persons: 2013 2012
(Number of persons) - As at 30 September 2,118 2,219 - Average number of employees 2,169 2,200 40. RELATED PARTY DISCLOSURES The related parties comprise associated undertakings, post employment benefit plans, other related
companies, and key management personnel. The company in the normal course of business carries out transactions with various related parties. Amounts due from and due to related parties are shown under receivables and payables, contingencies and commitments are disclosed in note 14 and remuneration of the key management personnel is disclosed in note 37. Other significant transactions with related parties are as follows:
2013 2012 (Rupees in thousand)
Relationship with the Nature of transactions company i. Associated Undertakings Crescent Steel & Allied Purchase of goods 38,584 324,575 Products Limited Sale of goods 150 600 Rendering services 38 2,147 Sale of land 70,000 - Use of material and services - 6,600 Payments to others on behalf of the related party - 6,238 Salary expense and other common expenses 2,816 2,492 Dividend income 8,160 6,800 Shakarganj Food Products Sale of goods 16,181 10,832 Limited Salary expense and other common expenses 2,058 787 Premium Insurance Company of Pakistan Insurance expenses 5,437 4,325 The Crescent Textile Mills Limited Rendering services - 10 Asian Stocks Fund Limited Dividend Income 13,809 10,722 Safeway Mutual Fund Limited Dividend Income 24,040 18,569 ii. Post employment Expense charged in respect of retirement benefit plans benefit plans 21,928 19,496 Transactions with pension and gratuity fund account - Funds received 3,360,441 3,806,062 - Funds paid 3,360,441 3,831,049 - Mark-up expense 27,922 25,001 40.1 All transactions with related parties have been carried out on bilaterally agreed terms.

86
2013 2012
41. CAPACITY AND PRODUCTION
Sugar
Rated crushing capacity - On the basis of 135 days (2012: 164 days) MT 2,088,000 2,564,000
Actual cane crushed MT 1,409,811 1,957,358 The low crushing was due to shortage of sugarcane and liquidity crunch. Bio Fuel On the basis of 306 days (2012: 366 days) working Litres 93,897,270 93,800,000 Actual production Litres 63,372,339 93,796,721 The actual production is 67% of the capacity. The low production was due to non-availability of quality raw
material. Building Materials On the basis of 206 days (2012: 266 days) working m3 6,592 8,778 Actual production m3 6,673 8,789 The actual production is more than 100% of the production capacity. Textile Capacity (converted in 20s counts) kg 7,207,893 7,387,331 Actual production (converted in 20s counts) kg 6,879,867 7,038,544 The actual production is 95% of the capacity which is within normal working standards.
Bio Power On the basis of 253 days (2012: 365 days) KWh 27,081,120 39,072,000 Actual generation KWh 22,864,600 27,778,900 The actual production is 84% of the capacity. The low production was due to shortage of raw material.
Notes to the FiNANCiAL stAteMeNtsFor the year ended 30 September 2013

87
42. BUSINESS SEGMENTS INFORMATION (Rupees in thousand)
Sugar Bio Fuel Building Materials Textile Farms Bio Power Others Elimination Total 2013 2012 2013 2012 2013 2012 2013 2012 2013 2012 2013 2012 2013 2012 2013 2012 2013 2012
Represented Represented
Revenue - External - note 27 6,791,399 7,558,141 4,525,284 5,089,084 74,016 105,766 1,868,540 1,700,016 45,466 36,462 155,532 234,441 46,988 38,408 - - 13,507,225 14,762,318 - Intersegment - note 27 1,011,392 1,347,608 121,548 115,148 915 - - - 15,058 3,767 65,435 2,982 - - (1,214,348) (1,469,505) - -
7,802,791 8,905,749 4,646,832 5,204,232 74,931 105,766 1,868,540 1,700,016 60,524 40,229 220,967 237,423 46,988 38,408 (1,214,348) (1,469,505) 13,507,225 14,762,318
Segment expenses Cost of sales - Intersegment - note 28 10,274 3,393 972,317 1,259,976 39,507 41,024 61,994 31,705 8,308 375 121,548 132,080 400 952 (1,214,348) (1,469,505) - - - External - note 28 7,874,022 9,030,566 2,690,654 2,175,887 34,304 55,431 1,728,312 1,647,748 46,339 43,957 109,255 72,552 29,885 18,427 - - 12,512,771 13,044,568
7,884,296 9,033,959 3,662,971 3,435,863 73,811 96,455 1,790,306 1,679,453 54,647 44,332 230,803 204,632 30,285 19,379 (1,214,348) (1,469,505) 12,512,771 13,044,568 Gross profit (81,505) (128,210) 983,861 1,768,369 1,120 9,311 78,234 20,563 5,877 (4,103) (9,836) 32,791 16,703 19,029 - - 994,454 1,717,750 - Administrative expenses - note 29 160,940 198,845 95,858 113,629 1,546 2,362 32,380 27,680 2,539 3,636 4,559 5,984 970 859 - - 298,792 352,995 - Distribution and selling expenses - note 30 54,247 14,875 273,959 319,903 60 19 2,121 2,311 - - - - - - - - 330,387 337,108
215,187 213,720 369,817 433,532 1,606 2,381 34,501 29,991 2,539 3,636 4,559 5,984 970 859 - - 629,179 690,103
Segment results (296,692) (341,930) 614,044 1,334,837 (486) 6,930 43,733 (9,428) 3,338 (7,739) (14,395) 26,807 15,733 18,170 - - 365,275 1,027,647
Other operating expenses (117,835) (94,933)
Operating Profit 247,440 932,714 Finance costs (438,130) (729,469)Other income 321,385 100,628 Taxation (29,525) 64,140 Share of income from associates-net of tax 165,842 130,463 Profit for the year 267,012 498,476 42.1 Inter-segment sales and purchases Inter-segment sales and purchases have been eliminated from total figures. 42.2 Basis of inter-segment pricing All inter-segment transfers are made at cost. 42.3 Segment assets 3,214,691 3,272,704 946,962 1,579,188 40,635 47,390 323,341 342,358 747,346 754,214 432,164 745,653 942 4,610 - - 5,706,081 6,746,117 Unallocated assets 3,104,910 2,980,316
8,810,991 9,726,433 42.4 Segment liabilities 4,824,046 5,280,716 1,266,031 1,234,749 2,480 255 178,232 154,609 14,917 14,379 18,124 117,341 - - - - 6,303,830 6,802,049 Unallocated liabilities 344,137 1,246,029
6,647,967 8,048,078 42.5 Capital expenditure 81,261 85,133 117,659 120,066 - 8,480 68,066 2,942 - 598 - 48,997 - - - - 266,986 266,216 Unallocated 45,706 85,456
312,692 351,672 42.6 Depreciation on property, plant and equipment 192,854 158,544 60,883 50,497 2,200 1,006 21,990 15,767 2,117 2,790 28,670 26,431 - - - - 308,714 255,035 Unallocated 33,832 30,715
342,546 285,750 42.7 Amortization on intangible assets 60 60 - - - - - - - - 30 32 - - - - 90 92
90 92 42.8 Impairment on capital work-in-progress - 3,914 - - - - - - - - - - - - - - - 3,914
- 3,914 42.9 Secondary reporting format Segment revenue from external customers by geographical areas is as follows: Export sales - Europe - - 1,703,159 4,202,471 - - - - - - - - - - - - 1,703,159 4,202,471 Export sales - Africa 115,877 - - - - - - - - - - - - - - - 115,877 - Export sales - Asia 756,828 - 2,586,430 674,339 - - - - - - - - - - - - 3,343,258 674,339 Local sales 5,918,694 7,558,141 235,695 212,274 74,016 105,766 1,868,540 1,700,016 45,466 36,462 155,532 234,441 46,988 38,408 - - 8,344,931 9,885,508
6,791,399 7,558,141 4,525,284 5,089,084 74,016 105,766 1,868,540 1,700,016 45,466 36,462 155,532 234,441 46,988 38,408 - - 13,507,225 14,762,318
Notes to the FiNANCiAL stAteMeNtsFor the year ended 30 September 2013

88
43. FINANCIAL RISK MANAGEMENT 43.1 Financial risk factors
The Company’s activities expose it to a variety of financial risks: market risk (including currency risk, fair value interest rate risk, cash flow interest rate risk and price risk), credit risk and liquidity risk. The company’s overall risk management programme focuses on the unpredictability of financial markets and seeks to minimise potential adverse effects on the company’s financial performance. The company uses derivative financial instruments to hedge certain risk exposures.
Risk management is carried out by the finance and risk management departments under policies approved by the board of directors. These departments evaluate and hedge financial risks in close co-operation with the company’s operating units. The board provides principles for overall risk management, as well as policies covering specific areas, such as foreign exchange risk, interest rate risk, credit risk, use of derivative financial instruments and non-derivative financial instruments, and investment of excess liquidity.
(a) Market risk (i) Currency risk
Currency risk is the risk that value of a financial instrument will fluctuate due to changes in foreign exchange rates. Currency risk arises mainly where receivables and payables exist due to transactions with foreign buyers and suppliers. The company, where considered necessary, uses money market borrowing contracts against receivables exposed to foreign currency risks.
The Company is exposed to currency risk arising only with respect to the United States Dollar (USD). The Company has a minimal bank balance in Euro and thus is not exposed to currency risk in respect of Euros. Currently, the Company’s foreign exchange risk exposure is restricted to the amounts receivable from / payable to the foreign entities and cash at banks. The Company’s exposure to currency risk is as follows:
2013 2012(USD)
Financial assets Trade debts - 1,244,759 Cash and bank balances - note 26.2 5,353 5,353
Financial liabilities Export refinance - note 11.3 2,851,718 6,183,863 Derivative liability - note 12.4 - 142,099 The following significant exchange rates were applied during the year: Rupees per USD Average rate 98.83 89.92 Reporting date rate 105.50 94.70 At 30 September 2013, if the Rupee had weakened/strengthened by 10% against the US dollar with all other
variables held constant, post-tax profit for the year would have been lower / higher as under, mainly as a result of foreign exchange gains/losses on translation of US dollar-denominated short term borrowings, trade receivables and cash and bank balances.
Notes to the FiNANCiAL stAteMeNtsFor the year ended 30 September 2013

89
Foreign currency sensitivity analysis
The following table demonstrates the sensitivity to a reasonably possible change in the US dollar exchange rate, with all other variables held constant, of the Company’s profit before tax and equity. The Company’s exposure to foreign currency changes for all other currencies is not material.
Change in Effect on Effect on Exchange profit equity rate before tax % (Rupees in thousand) 2013 10% (56,474) (52,888) -10% 56,474 52,888 2012 10% (48,068) (31,244) -10% 48,068 31,244
(ii) Price risk The company is exposed to equity securities price risk because of investments held by the company and
classified as available for sale. The company is not exposed to commodity price risk. To manage its price risk arising from investments in equity securities, the company diversifies its portfolio. Diversification of the portfolio is done in accordance with the limits set by the company.
The company’s investments in equity of other entities that are publicly traded are listed on the following
three stock exchanges, Karachi Stock Exchange, Lahore Stock Exchange and Islamabad Stock Exchange. The summary below explains the impact of increase of the KSE-100 index on equity. The analysis is based
on the assumption that the KSE-100 index had increased/decreased by 10% with all other variables held constant and all the company’s equity instruments moved according to the historical correlation with the KSE-100 index:
Impact on other components of equity 2013 2012 (Rupees in thousand) Karachi Stock Exchange 24,944 21,706
Post-tax profit for the year would increase/decrease as a result of gains/losses on equity securities classified as at fair value through profit or loss. Other components of equity would increase/decrease as a result of gains/losses on equity securities classified as available for sale.
(iii) Cash flow and fair value interest rate risk As the company has no significant interest-bearing assets, the company’s income is substantially
independent of changes in market interest rates. The company’s interest rate risk arises from both long-term and short term borrowings. Borrowings issued
at variable rates expose the company to cash flow interest rate risk. During 2013 and 2012, the company’s borrowings at variable rates were denominated in Rupees.
The company analyses its interest rate exposure on a dynamic basis. Various scenarios are simulated taking
into consideration refinancing, renewal of existing positions, alternative financing and hedging. Based on these scenarios, the company calculates the impact on profit and loss of a defined interest rate shift. The scenarios are run only for liabilities that represent the major interest-bearing positions.
Notes to the FiNANCiAL stAteMeNtsFor the year ended 30 September 2013

90
The Company does not account for any fixed rate financial assets and liabilities at fair value through profit or loss. Therefore a change in interest rates at the reporting date would not affect the carrying value of any of company’s assets or liabilities.
At 30 September 2013, if interest rates on both short term and long borrowings had been 1% higher/lower with all other variables held constant, post-tax profit for the year would have been Rs. 2.85 million (2012: Rs. 51.28 million) lower/higher, mainly as a result of higher/lower interest expense on KIBOR based borrowings.
(b) Credit risk
Credit risk arises from cash and cash equivalents, derivative financial instruments and deposits with banks and financial institutions, as well as credit exposures to wholesale and other customers, including outstanding receivables and committed transactions. For banks and financial institutions, only independently rated parties with a strong credit rating are accepted. If customers are independently rated, these ratings are used. If there is no independent rating, management assesses the credit quality of the customer, taking into account its financial position, past experience and other factors. Individual risk limits are set based on internal or external ratings in accordance with limits set by the board. The utilisation of credit limits is regularly monitored and major sales to customers are settled in cash.
The carrying amount of financial assets represents the maximum credit exposure. The maximum exposure to credit risk at the balance sheet date was:
2013 2012
(Rupees in thousand) Long term loan and deposits 38,323 39,969 Trade debts 71,619 243,138 Loans, advances and other receivables 257,444 58,999 Cash and bank balances 99,708 69,452 467,094 411,558 The credit risk on liquid funds is limited because the counter parties are banks with reasonably high credit
ratings. The Company believes that it is not exposed to major concentration of credit risk as its exposure is spread over a large number of counter parties. The company does not hold any collateral or any other credit enhancement instruments in relation to trade receivables. The aging of trade receivables is as follows:
2013 2012 (Rupees in thousand) Upto 30 days 7,349 158,486 30 to 60 days 27,680 33,339 60 to 180 days 23,639 36,647 180 to 365 days 4,902 13,317 More than 365 days 8,049 1,349
71,619 243,138
Notes to the FiNANCiAL stAteMeNtsFor the year ended 30 September 2013

91
The management estimates the recoverability of trade receivables on the basis of financial position and past history of its customers based on the objective evidence that it will not received the amount due from the particular customer. The provision is written off by the Company when it expects that it cannot recover the balance due. Any subsequent repayments in relation to amount written off, are credited to income statement.
The credit quality of Company’s bank balances can be assessed with reference to external credit ratings as follows:
Rating Rating 2013 2012 Short term Long term Agency (Rupees in thousand)
Askari Bank Limited A1+ AA PACRA 1,272 146 Al-Baraka Islamic Bank A1 A PACRA 1 1 Allied Bank Limited A1+ AA+ PACRA 15,973 107 Bank Alfalah Limited A1+ AA PACRA 22,124 235 Bank Islami Pakistan Limited A1 A PACRA 3 3 The Bank of Punjab A1+ AA - PACRA 769 191 Barclays Bank PLC A1 A+ S&P - - Samba Bank Limited A-1 AA- JCR-VIS - - Faysal Bank Limited A1+ AA PACRA 1,210 507 Habib Bank Limited A-1+ AA+ JCR-VIS 29,660 1,944 KASB Bank Limited A3 BBB PACRA 69 69 MCB Bank Limited A1+ AAA PACRA 8,046 59,338 Meezan Bank Limited A-1+ AA JCR-VIS - - NIB Bank Limited A1+ AA- PACRA 1,160 10 National Bank of Pakistan A-1+ AAA JCR-VIS 2,828 320 Silkbank Limited A-2 A - JCR-VIS 278 2,247 Standard Chartered Bank Limited A1+ AAA PACRA 1,078 4,035 United Bank Limited A-1+ AA+ JCR-VIS 15,231 294 Sindh Bank Limited A-1 AA - JCR-VIS 6 5
99,708 69,452 Due to the Company’s long standing business relationships with theses counterparties and after giving due
consideration to their strong financial standing, management does not expect non-performance by these counter parties on their obligations to the Company. Accordingly, the credit risk is minimal.
(c) Liquidity risk Liquidity risk is the risk that an entity will encounter difficulty in meeting obligations associated with
financial liabilities. Prudent liquidity risk management implies maintaining sufficient cash and marketable securities, the availability of funding through an adequate amount of committed credit facilities and the ability to close out market positions. Due to the dynamic nature of the company’s businesses, the finance department maintains flexibility in funding by maintaining availability under committed credit lines.
Management monitors the forecasts of the company’s undrawn borrowing facilities (note 11) and cash and cash equivalents (note 26) on the basis of expected cash flow. In addition, the company’s liquidity management policy involves projecting cash flows in each quarter and considering the level of liquid assets necessary to meet its liabilities; monitoring balance sheet liquidity ratios against internal and external regulatory requirements; and maintaining debt financing plans.
Notes to the FiNANCiAL stAteMeNtsFor the year ended 30 September 2013

92
The table below analyses the company’s financial liabilities and net-settled derivative financial liabilities into relevant maturity groupings based on the remaining period at the balance sheet to the contractual maturity date. The amounts disclosed in the table are the contractual undiscounted cash flows.
(Rupees in thousand)
Less than Between 1 Between 2 Over 1 year and 2 years and 5 years 5 years
At 30 September 2013
Fixed rate long term debt 345,756 - - - Floating rate long term debt 1,763,982 26,003 - -
Finance lease liabilities - Gross 9,812 10,961 - - Variable rate short term borrowings 1,155,480 - - - Trade and other payables 2,422,533 - - - Accrued finance cost 916,193 - - -
6,613,756 36,964 - -
(Rupees in thousand)
Less than Between 1 Between 2 Over 1 year and 2 years and 5 years 5 years At 30 September 2012 Fixed rate long term debt 345,756 - - - Floating rate long term debt 1,604,850 459,964 - - Finance lease liabilities - Gross 12,161 10,792 11,136 - Variable rate short term borrowings 2,507,350 - - - Derivative financial instruments 13,457 - - - Trade and other payables 1,966,160 - - - Accrued finance cost 1,122,448 - - -
7,572,182 470,756 11,136 -
43.2 Fair value estimation The carrying value of financial assets and liabilities reflected in the financial statements approximate their
fair values. The fair value of financial instruments traded in active markets is based on quoted market prices at the
balance sheet date. The quoted market price used for financial assets held by the company are the current bid prices.
The financial instruments that are not traded in active market are carried at cost and are tested for
impairment according to IAS 39. The carrying value less impairment provision of trade receivables are assumed to approximate their fair
values. The fair value of financial liabilities for disclosure purposes is estimated by discounting future contractual cash flows at the current market interest rate that is available to the Company for similar financial instruments.
Notes to the FiNANCiAL stAteMeNtsFor the year ended 30 September 2013

93
Loans and receivables2013 2012
(Rupees in thousand)
43.3 Financial instruments by categories Long term deposits 38,323 39,969 Trade debts 71,619 243,138 Advances, deposits, prepayments and other receivables 257,444 58,999 Cash and Bank balances 99,708 69,453
Available for sale 2013 2012 (Rupees in thousand)
Investments - available for sale 801,696 217,056
Financial liabilities at amortized cost 2013 2012 (Rupees in thousand)
Long term finances 2,135,741 2,410,570 Liabilities against assets subject to finance lease 18,020 27,589 Short term borrowings - secured 1,155,480 2,507,350 Trade and other payables 2,422,533 1,979,617 Accrued finance cost 916,193 1,122,448 43.4 Capital risk management The Board’s policy is to maintain an efficient capital base so as to maintain investor, creditor and market
confidence and to sustain the future development of its business. The board of directors monitors the return on capital employed, which the Company defines as operating income divided by total capital employed. The board of directors also monitors the level of dividends to ordinary shareholders.
The company’s objectives when managing capital are: (i) to safeguard the entity’s ability to continue as a going concern, so that it can continue to provide
returns for shareholders and benefits for other stakeholders, and (ii) to provide an adequate return to shareholders. The company monitors capital on the basis of the debt-to-equity ratio - calculated as a ratio of total debt to
equity.
Notes to the FiNANCiAL stAteMeNtsFor the year ended 30 September 2013

94
The gearing ratios as at 30 September 2013 and 2012 were as follows:
2013 2012(Rupees in thousand)
Total debt 3,309,241 4,945,509 Total equity 21,110 (603,224) Total debt and equity 3,330,351 4,342,285 Gearing ratio 99% 114% The company manages the capital structure in the context of economic conditions and the risk characteristics
of the underlying assets. In order to maintain or adjust the capital structure, the company may, for example, adjust the amount of dividends paid to shareholders, issue new shares, or sell assets to reduce debt.
For working capital requirements and capital expenditure, the company primarily relies substantially on short term borrowings.
44. DATE OF AUTHORIzATION OF ISSUE These financial statements were authorized for issue on 26 December 2013 by the board of directors of the
company. 45. EVENTS AFTER THE BALANCE SHEET DATE There are no subsequent events occurring after balance sheet date. 46. CORRESPONDING FIGURES Corresponding figures have been re-arranged and re-classified, wherever necessary, for the purposes of
comparison and better presentation as per reporting framework however, no significant re-arrangements have been made.
(Rupees in thousand)
Opening balance of ‘finished goods’ - stock-in-trade for the year ended 30 September 2012 has been classified to ‘raw materials’ - stock-in-trade 47,042
Notes to the FiNANCiAL stAteMeNtsFor the year ended 30 September 2013
Chief Executive Chairman

95
No. of Shareholding Total shares Shareholders From To held
365 1 100 12,468 294 101 500 91,055 258 501 1,000 208,282 412 1,001 5,000 985,445 95 5,001 10,000 711,974 57 10,001 15,000 710,834 28 15,001 20,000 489,957 16 20,001 25,000 376,481 11 25,001 30,000 307,262 7 30,001 35,000 228,240 6 35,001 40,000 228,652 10 40,001 45,000 430,216 10 45,001 50,000 492,814 6 50,001 55,000 320,208 6 55,001 60,000 352,111 2 60,001 65,000 126,500 5 65,001 70,000 334,362 2 70,001 75,000 142,791 2 75,001 80,000 151,705 1 80,001 85,000 83,262 3 85,001 90,000 267,500 4 90,001 95,000 367,668 6 95,001 100,000 599,544 3 100,001 105,000 306,745 1 105,001 110,000 108,866 2 110,001 115,000 225,724 2 115,001 120,000 237,197 4 120,001 125,000 490,054 5 135,001 140,000 681,224 3 140,001 145,000 425,447 2 145,001 150,000 296,627 2 150,001 155,000 304,590 2 155,001 160,000 316,747 1 165,001 170,000 170,000 1 170,001 175,000 174,850
The Companies Ordinance 1984 Form - 34Section 236(1)
1. Incorporation Number 0002546 2. Name of The Company Shakarganj Mills Limited 3. Pattern of Holding of the Shares held by the Shareholders as at : 30 September 2013
pAtterN oF shArehoLdiNG

96
2 175,001 180,000 354,939 1 185,001 190,000 185,275 1 190,001 195,000 193,000 1 195,001 200,000 200,000 1 200,001 205,000 201,400 2 220,001 225,000 447,566 1 225,001 230,000 226,500 1 255,001 260,000 256,000 1 285,001 290,000 289,760 1 300,001 305,000 304,249 1 320,001 325,000 325,000 1 410,001 415,000 412,563 1 525,001 530,000 527,545 1 535,001 540,000 539,696 1 650,001 655,000 654,703 1 655,001 660,000 657,754 1 695,001 700,000 698,500 1 765,001 770,000 765,150 1 1,065,001 1,070,000 1,066,138 1 1,870,001 1,875,000 1,870,800 1 2,105,001 2,110,000 2,108,319 1 2,115,001 2,120,000 2,118,785 1 2,825,001 2,830,000 2,829,942 1 2,865,001 2,870,000 2,865,830 1 2,935,001 2,940,000 2,935,859 1 3,050,001 3,055,000 3,054,913 1 3,805,001 3,810,000 3,809,502 1 5,425,001 5,430,000 5,427,488 1 7,190,001 7,195,000 7,194,553 1 15,240,001 15,245,000 15,244,665
1,666 69,523,796
No. of Shareholding Total shares Shareholders From To held

97
Categories of Shareholder Physical CDC Total %age
Directors, Chief Executive Officer, Their Spouses and Minor Children Chief Executive Mr. Ahsan M. Saleem - 528,000 528,000 0.76 Directors Mr. Ali Altaf Saleem - 290,000 290,000 0.42 Mr. Khalid Bashir - 58,212 58,212 0.08 Mr. Muhammad Anwar - 67,222 67,222 0.10 Mr. Muhammad Arshad - 143,136 143,136 0.21 Director’s Spouses and Their Minor Children Mrs. Shahnaz A. Saleem - 146,300 146,300 0.21
- 1,232,870 1,232,870 1.77
Executives - 6,007,000 6,007,000 8.64
Associated Companies, Undertakings & Related Parties Crescent Steel And Allied Products Limited - 15,244,665 15,244,665 21.93 Crescent Cotton Mills Limited - 2,865,830 2,865,830 4.12 The Crescent Textile Mills Limited - 5,427,488 5,427,488 7.81 Trustees - SGML Gratuity Fund - 59,431 59,431 0.09 Trustees - SGML Pension Fund - 157,441 157,441 0.23 Trustees - SGML Provident Fund - 765,150 765,150 1.10
- 24,520,005 24,520,005 35.27 NIT & ICP (Name Wise Detail) National Bank of Pakistan-Trustee Wing 71 - 71 0.00 National Investment Trust Limited - 185,275 185,275 0.27 NBP - Trustee Department NI(U)T Fund - 7,194,553 7,194,553 10.35
71 7,379,828 7,379,899 10.61 Mutual Funds Asian Stocks Fund Open End - 2,108,319 2,108,319 3.03 Safeway Mutual Fund Open End - 2,118,785 2,118,785 3.05 Golden Arrow Selected Stocks Fund Limited 3,809,502 3,809,502 5.48
- 8,036,606 8,036,606 11.56
Banks, NBFCs, DFIs, Takaful, Pension Funds 102,741 392,216 494,957 0.71 Modarabas 453 - 453 0.00
Insurance Companies 8 - 8 0.00
Other Companies,Corporate Bodies, Trust etc. 544,354 6,726,001 7,270,355 10.46
General Public 918,438 13,663,205 14,581,643 20.97
1,566,065 67,957,731 69,523,796 100.00 Shareholders More Than 5.00%
Crescent Steel And Allied Products Limited 15,244,665 21.93 NBP - Trustee Department NI(U)T Fund 7,194,553 10.35 The Crescent Textile Mills Limited 5,427,488 7.81 Golden Arrow Selected Stocks Fund Limited 3,809,502 5.48

98
NOTICE is hereby given that the Annual General Meeting of the shareholders of SHAKARGANJ MILLS LIMITED (the “Company”) will be held on Tuesday, 28 January 2014 at 11:30 a.m. at Qasr-e-Noor, 9-E-2, Main Boulevard Gulberg-III, Lahore, to transact the following business:
Ordinary Business:
1. To receive, consider and adopt the Directors’ and Auditors’ Reports and Audited Financial Statements of the Company for the year ended 30 September 2013.
2. To appoint Company’s auditors for the financial year ending 30 September 2014 and to fix their remuneration.
By Order of the Board
Asif AliLahore: 26 December 2013 Company Secretary
NOTES:
1. The Share Transfer Book of the Company will remain closed from 21 January 2014 to 28 January 2014 (both days inclusive) to determine the names of members entitled to attend the meeting and vote. Transfers received in order at the Share Registrar Office of the Company, M/s. CorpTec Associates (Private) Limited, 503-E, Johar Town, Lahore by the close of business on 20 January 2014 will be treated in time for attending the meeting.
2. A member entitled to attend and vote at this meeting may appoint any other member as his/her proxy to attend, speak and vote for him/her behalf. The instrument appointing a proxy and the power of attorney or other authority under which it is signed or a notarized attested copy of the power of attorney must he deposited at the Registered Office of the Company at least 48 hours before the time of holding the meeting, and must be signed, stamped and witnessed.
3. Members are requested to timely notify any change in their addresses.
4. Members who have deposited their shares in the Central Depository System of the Central Depository Company of Pakistan Limited will have to follow the under mentioned guidelines as laid down by Securities and Exchange Commission of Pakistan:
A. For Attending the Meeting
a. In case of Individuals, the account holder and/or sub-account holder whose registration details are uploaded as per the CDC Regulations, shall authenticate his/her identity by showing his/her original CNIC or original Passport alongwith Participant ID number and the Account number at the time of attending the Meeting.
b. In case of corporate entity, the Board’s resolution / power of attorney with specimen signature of the nominee shall be produced (unless it has been provided earlier) at the time of the Meeting.
B. For Appointing Proxies
a. In case of individuals, the account holder and/or sub-account holder whose registration details are uploaded as per the CDC Regulations, shall submit the proxy form as per above requirements.
NotiCe oF 46th ANNuAL GeNerAL MeetiNG

99
b. The proxy form shall be witnessed by two persons, whose names, addresses and CNIC numbers shall be mentioned on the form.
c. Attested copies of the CNIC or the passport of beneficial owners and the proxy shall be furnished with the proxy form.
d. The proxy shall produce his original CNIC or original passport at the time of the Meeting.
e. In case of corporate entity, the Board’s resolution / power of attorney with specimen signature shall be furnished (unless it has been provided earlier) along with proxy form to the Company.

100

101
I/We________________________________________ S/o, D/o, W/o ____________________________________ of
_____________________________________________________________________ (full address) a member(s) of
Shakarganj Mills Limited and holder of ________________________________________ shares as per Registered
Folio No. ____________ and/or CDC Participant I.D. No. _______________ and Sub Account No. ______________
do hereby appoint _____________________________ of ___________________________________ (full address)
or failing him/her ____________________________________ of ________________________________________
(full address) as my/our proxy to attend, speak and vote for me/us and on my/our behalf at the Annual General Meeting of Shakarganj Mills Limited scheduled to be held on Tuesday, 28 January 2014 at 11:30 a.m. at Qasr-e-Noor, 9 E 2 Main Boulevard, Gulberg-III, Lahore and at any adjournment thereof.
As witness my / our hand this __________________________ day of __________________________ 2014.
Member ____________________________
Witness ____________________________
Address ____________________________
Dated ______________________________
Notes:
1. A member entitled to attend and vote at a General Meeting is entitled to appoint a proxy2. The instrument appointing a Proxy, together with the Power of Attorney, if any, under which it is signed or a
notarially certified copy thereof, should be deposited at the Registered office, not less than 48 hours before the time of holding the Meeting.
3. CDC account holders will further have to follow the under mentioned guidelines as laid down in circular No.1 dated 26 January 2000 of the Securities & Exchange Commission of Pakistan for appointing proxies.
4. In case of individuals, the account holder or sub-account holder and/or the person whose securities are in group account and their registration details are uploaded as per the Regulations, shall submit the proxy form as per the above requirement.
5. The proxy form shall be witnessed by two persons whose names, addresses and NIC numbers shall be mentioned on the form.
6. Attested copies of NIC or the passport of the beneficial owners and the proxy shall be furnished with the proxy form.
7. The proxy shall produce his original NIC or original passport at the time of the meeting.8. In case of a corporate entity, the Board of Directors’ resolution/power of attorney with specimen signatures
of the proxy holder shall be submitted (unless it has been provided earlier) alongwith proxy form to the Company.
ForM oF proXY
The signature should agreewith the specimen registered
with the Company
Signature onFive-Rupees
Revenue Stamp

102

10th Floor, BOP Tower, 10-B Block E2, Gulberg III, Lahore, PakistanTel: (042) 3578 3801- 06 Fax: (042) 3578 3811www.shakarganj.com.pk
If undelivered, please return to:
BOOK POST