Annual Report 2013 - LEO Pharma Income statement ... ANNUAL REPORT 2013 5 The Executive Board and...
27
Annual Report 2013 LEO PHARMA A/S — We help people achieve healthy skin
Transcript of Annual Report 2013 - LEO Pharma Income statement ... ANNUAL REPORT 2013 5 The Executive Board and...

Annual Report 2013
LEO PHARMA A/S
— We help peopleachieve healthy skin
CONTENTS
MANAGEMENT’S STATEMENT AND INDEPEDENT AUDITOR’S REPORT
Management’s Statement . . . . . . . . . . . . . . . . . . . . . . . . . . . . . . . . . . . . . . . . . . . . . . . . . . . . . . . . . . . . . . . . . . . . . . . . . . . . . . . . . . . . . . . . . . . . . . . . . . . . . . . . . . . . . . . . . . . . . . . . . . . . . . . . . . . . . . . . . . . . . . . . . . . . 5 Independent Auditor’s Report . . . . . . . . . . . . . . . . . . . . . . . . . . . . . . . . . . . . . . . . . . . . . . . . . . . . . . . . . . . . . . . . . . . . . . . . . . . . . . . . . . . . . . . . . . . . . . . . . . . . . . . . . . . . . . . . . . . . . . . . . . . . . . . . . . . . . . . . . . . . . . 7
MANAGEMENT’S REVIEW
Company information . . . . . . . . . . . . . . . . . . . . . . . . . . . . . . . . . . . . . . . . . . . . . . . . . . . . . . . . . . . . . . . . . . . . . . . . . . . . . . . . . . . . . . . . . . . . . . . . . . . . . . . . . . . . . . . . . . . . . . . . . . . . . . . . . . . . . . . . . . . . . . . . . . . . . . . . . . . 8 Financial highlights . . . . . . . . . . . . . . . . . . . . . . . . . . . . . . . . . . . . . . . . . . . . . . . . . . . . . . . . . . . . . . . . . . . . . . . . . . . . . . . . . . . . . . . . . . . . . . . . . . . . . . . . . . . . . . . . . . . . . . . . . . . . . . . . . . . . . . . . . . . . . . . . . . . . . . . . . . . . . . . 9 Management’s Review . . . . . . . . . . . . . . . . . . . . . . . . . . . . . . . . . . . . . . . . . . . . . . . . . . . . . . . . . . . . . . . . . . . . . . . . . . . . . . . . . . . . . . . . . . . . . . . . . . . . . . . . . . . . . . . . . . . . . . . . . . . . . . . . . . . . . . . . . . . . . . . . . . . . . . . .10
ACCOUNTING POLICIES
Accounting policies . . . . . . . . . . . . . . . . . . . . . . . . . . . . . . . . . . . . . . . . . . . . . . . . . . . . . . . . . . . . . . . . . . . . . . . . . . . . . . . . . . . . . . . . . . . . . . . . . . . . . . . . . . . . . . . . . . . . . . . . . . . . . . . . . . . . . . . . . . . . . . . . . . . . . . . . . . . . .23
FINANCIAL STATEMENTS 1 JANUARY – 31 DECEMBER 2013
Income statement . . . . . . . . . . . . . . . . . . . . . . . . . . . . . . . . . . . . . . . . . . . . . . . . . . . . . . . . . . . . . . . . . . . . . . . . . . . . . . . . . . . . . . . . . . . . . . . . . . . . . . . . . . . . . . . . . . . . . . . . . . . . . . . . . . . . . . . . . . . . . . . . . . . . . . . . . . . . . . .33 Balance sheet . . . . . . . . . . . . . . . . . . . . . . . . . . . . . . . . . . . . . . . . . . . . . . . . . . . . . . . . . . . . . . . . . . . . . . . . . . . . . . . . . . . . . . . . . . . . . . . . . . . . . . . . . . . . . . . . . . . . . . . . . . . . . . . . . . . . . . . . . . . . . . . . . . . . . . . . . . . . . . . . . . . . . .34 Cash flow statement . . . . . . . . . . . . . . . . . . . . . . . . . . . . . . . . . . . . . . . . . . . . . . . . . . . . . . . . . . . . . . . . . . . . . . . . . . . . . . . . . . . . . . . . . . . . . . . . . . . . . . . . . . . . . . . . . . . . . . . . . . . . . . . . . . . . . . . . . . . . . . . . . . . . . . . . . . .37 Notes . . . . . . . . . . . . . . . . . . . . . . . . . . . . . . . . . . . . . . . . . . . . . . . . . . . . . . . . . . . . . . . . . . . . . . . . . . . . . . . . . . . . . . . . . . . . . . . . . . . . . . . . . . . . . . . . . . . . . . . . . . . . . . . . . . . . . . . . . . . . . . . . . . . . . . . . . . . . . . . . . . . . . . . . . . . . . . . . . . . . .39 Investments in affiliates . . . . . . . . . . . . . . . . . . . . . . . . . . . . . . . . . . . . . . . . . . . . . . . . . . . . . . . . . . . . . . . . . . . . . . . . . . . . . . . . . . . . . . . . . . . . . . . . . . . . . . . . . . . . . . . . . . . . . . . . . . . . . . . . . . . . . . . . . . . . . . . . . . . . . .51
Presented and adopted at the Annual General Meeting of the Company on 27 March 2014
CVR 56 75 95 14
This Annual Report is an extract of the Company’s statutory annual report pursuant to Section 149 of the Danish Financial Statements Act. The statutory annual report will be submitted to the Danish Business Authority, and a copy may be obtained via the Authority’s website www.cvr.dk.

A NNUA L REPORT 2013 5
The Executive Board and Board of Directors have today considered and adopted the Annual Report of LEO Pharma A/S for the financial year 1 January - 31 December 2013.
The Annual Report is prepared in accordance with the Danish Financial Statements Act.
In our opinion the Financial Statements and the Con-solidated Financial Statements give a true and fair view of the financial position at 31 December 2013 of
the Company and the Group and of the results of the Company and Group operations and cash flows for 2013.
In our opinion Management’s Review includes a true and fair account of the matters addressed in the Review.
We recommend that the Annual Report be adopted at the Annual General Meeting.
Ballerup, 27 March 2014
Management’s Statement
Executive Board:
Gitte P. Aabo Lars Olsen Anders B. Spohr President, CEO
Board of Directors:
Poul Rødbroe Rasmussen Karin Attermann Jannie Kogsbøll Chairman
Lotte Hjortshøj Larsen Peder Holk Nielsen Jens Bo Olesen
Jukka Pertola Jan Rasmussen Per Håkon Schmidt
Gorm M. Thamsborg
—We help people achieve healthy skin
L E O M I S S I O N
A NNUA L REPORT 2013 7
TO THE SHAREHOLDER OF LEO PHARMA A/S
Independent Auditor’s Report
Report on the Financial Statements
We have audited the Consolidated Financial State-ments and the Parent Company Financial Statements of LEO Pharma A/S for the financial year 1 January – 31 December 2013, which comprise income state-ment, balance sheet, statement of changes in equity, notes and summary of significant accounting policies for both the Group and the Parent Company, as well as consolidated cash flow statement. The Consolidated Financial Statements and the Parent Company Finan-cial Statements are prepared in accordance with the Danish Financial Statements Act.
Management’s responsibility for the Financial Statements
Management is responsible for the preparation of Con-solidated Financial Statements and Parent Company Financial Statements that give a true and fair view in accordance with the Danish Financial Statements Act, and for such internal control as Management deter-mines is necessary to enable the preparation of Con-solidated Financial Statements and Parent Company Financial Statements that are free from material mis-statement, whether due to fraud or error.
Auditor’s responsibility
Our responsibility is to express an opinion on the Con-solidated Financial Statements and the Parent Com-pany Financial Statements based on our audit. We conducted our audit in accordance with International Standards on Auditing and additional requirements in accordance with Danish audit regulation. This re-quires that we comply with ethi cal requirements and plan and perform the audit to obtain reasonable assu-rance whether the Consolidated Financial Statements and the Parent Company Financial Statements are free from material misstatement.
An audit involves performing audit procedures to obtain audit evidence about the amounts and disclosures in the Consolidated Financial Statements and the Parent Company Financial Statements. The audit procedures selected depend on the auditor’s judgment, including the assessment of the risks of material misstatement
of the Consolidated Financial Statements and the Par-ent Company Financial Statements, whether due to fraud or error. In making those risk assessments, the auditor considers internal control relevant to the Com-pany’s preparation of Consolidated Financial State-ments and Parent Company Financial Statements that give a true and fair view in order to design audit pro-cedures that are appropriate in the circumstances, but not for the purpose of expressing an opinion on the effectiveness of the Company’s internal control. An audit also includes evaluating the appropriateness of accounting policies used and the reasonableness of ac-counting estimates made by Management, as well as evaluating the overall presentation of the Consolidated Financial Statements and the Parent Company Financial Statements.
We believe that the audit evidence we have obtained is sufficient and appropriate to provide a basis for our audit opinion.
The audit has not resulted in any qualification.
Opinion
In our opinion, the Consolidated Financial Statements and the Parent Company Financial Statements give a true and fair view of the financial position of the Group and the Company at 31 December 2013 and of the results of the Group and the Company operations as well as the consolidated cash flows for the financial year 1 January – 31 December 2013 in accordance with the Danish Financial Statements Act.
Statement on Management’s Review
We have read Management’s Review in accordance with the Danish Financial Statements Act.We have not performed any procedures additional to the audit of the Consolidated Financial Statements and the Parent Company Financial Statements.On this basis, in our opinion, the information provided in Management’s Review is consistent with the Con-solidated Financial Statements and the Parent Com-pany Financial Statements.
Kim Füchsel Lars Baungaard State Authorised Public Accountant State Authorised Public Accountant
Hellerup, 27 March 2014 PricewaterhouseCoopers Statsautoriseret Revisionspartnerselskab
— We are the preferred dermatology care partner improving people’s lives around the world
L E O V I S I O N
MANAGEMENT’S REVIEW 2013 MANAGEMENT’S REVIEW 2013
8 LEO PHARMA A NNUA L REPO RT 2 0 1 3 9
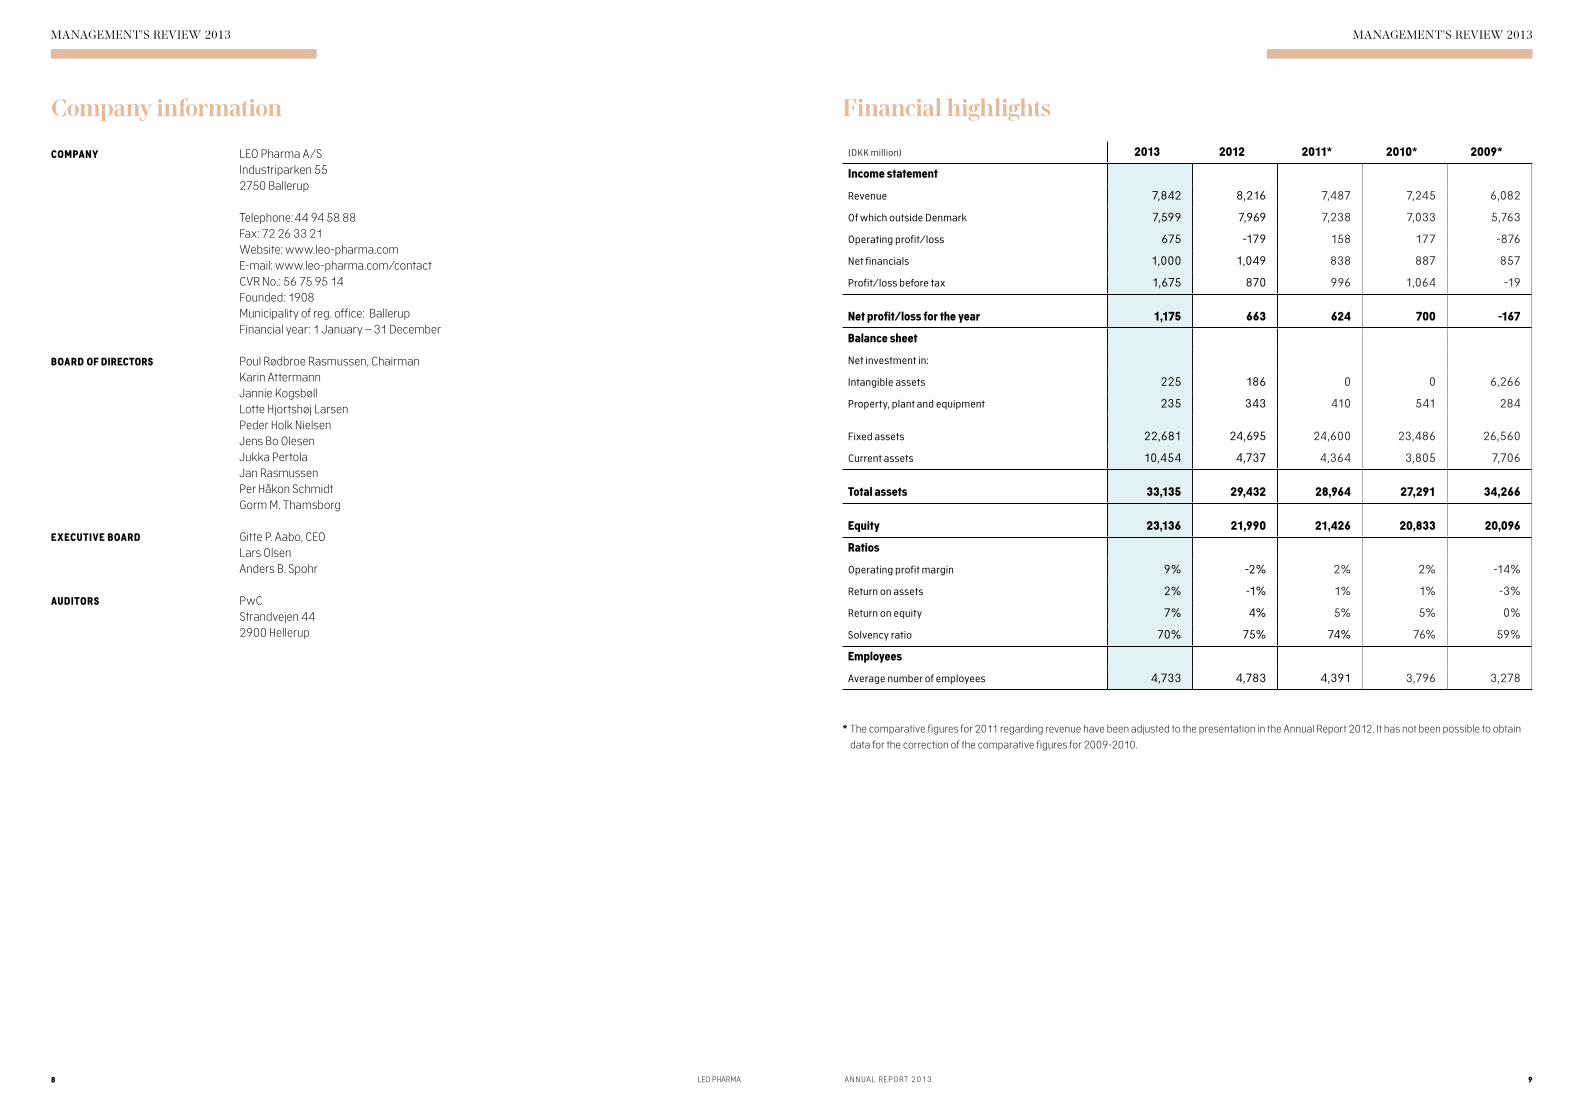
(DKK million) 2013 2012 2011* 2010* 2009*
Income statement
Revenue 7,842 8,216 7,487 7,245 6,082
Of which outside Denmark 7,599 7,969 7,238 7,033 5,763
Operating profit/loss 675 -179 158 177 -876
Net financials 1,000 1,049 838 887 857
Profit/loss before tax 1,675 870 996 1,064 -19
Net profit/loss for the year 1,175 663 624 700 -167
Balance sheet
Net investment in:
Intangible assets 225 186 0 0 6,266
Property, plant and equipment 235 343 410 541 284
Fixed assets 22,681 24,695 24,600 23,486 26,560
Current assets 10,454 4,737 4,364 3,805 7,706
Total assets 33,135 29,432 28,964 27,291 34,266
Equity 23,136 21,990 21,426 20,833 20,096
Ratios
Operating profit margin 9% -2% 2% 2% -14%
Return on assets 2% -1% 1% 1% -3%
Return on equity 7% 4% 5% 5% 0%
Solvency ratio 70% 75% 74% 76% 59%
Employees
Average number of employees 4,733 4,783 4,391 3,796 3,278
COMPANY LEO Pharma A/S Industriparken 55 2750 Ballerup Telephone: 44 94 58 88 Fax: 72 26 33 21 Website: www.leo- pharma.com E-mail: www.leo-pharma.com/contact CVR No.: 56 75 95 14 Founded: 1908 Municipality of reg. office: Ballerup Financial year: 1 January – 31 December
BOARD OF DIRECTORS Poul Rødbroe Rasmussen, Chairman Karin Attermann Jannie Kogsbøll Lotte Hjortshøj Larsen Peder Holk Nielsen Jens Bo Olesen Jukka Pertola Jan Rasmussen Per Håkon Schmidt Gorm M. Thamsborg
EXECUTIVE BOARD Gitte P. Aabo, CEO Lars Olsen Anders B. Spohr
AUDITORS PwC Strandvejen 44 2900 Hellerup
Company information Financial highlights
* The comparative figures for 2011 regarding revenue have been adjusted to the presentation in the Annual Report 2012. It has not been possible to obtain
data for the correction of the comparative figures for 2009-2010.

MANAGEMENT’S REVIEW 2013 MANAGEMENT’S REVIEW 2013
10 LEO PHARMA A NNUA L REPO RT 2 0 1 3 11
2013 was a challenging year for LEO Pharma. Following four years of double digit sales growth, sales slowed down considerably in 2013. Despite a lack of sales growth, LEO Pharma increased both operating profit and net profit in 2013 compared to 2012. The increase in profitability came from a focus on operational excel-lence and on ensuring best use of company resources. The result for 2013 is, in light of the many challenges, considered satisfactory.
In 2013 LEO Pharma continued its journey towards reaching its vision of becoming the preferred derma-tology care partner improving people’s lives around the world and kept building a global and patient-cen-tric organisation. This positively influenced the global organisation’s efficiency, agility and ability to invest the resources where they matter the most: for the be-nefit of patients.
DermatologyLEO Pharma’s mission is to help people achieve healthy skin. Therefore, LEO Pharma mainly develops, manu-factures and markets products in the therapeutic area of dermatology – skin conditions. In 2013 these in-cluded psoriasis, actinic keratosis, eczema and skin infections.
LEO Pharma differentiates between strategic pro-ducts, core products and well-established products. The strategic portfolio comprises the following pro-ducts: Daivobet® Gel (psoriasis), Xamiol® (psoriasis), Picato® (actinic keratosis) and innohep® (thrombosis). Although the field of dermatology is LEO Pharma’s pri-ority, innohep® for the treatment of thrombosis is also considered strategic and accounts for a substantial share of LEO Pharma’s sales.
Management’s Review
LEO Pharma’s revenue in 2013 amounted to DKK 7,842 million. The revenue decreased by 5% in Danish kroner compared to 2012 and in local currencies the decrease was more than 3%.
The decrease in revenue is mainly caused by three events. Most significant was a loss of exclusivity of Dovonex® Cream in the US. In autumn 2012, LEO Pharma met generic competition for Dovonex® Cream in the US and 2013 was the first year with a full-year effect. In addition LEO Pharma decided to end the supply of Heparin to the Japanese market and to di-vest one of LEO Pharma’s well-established products, Fucithalmic®.
Compared to 2012 the combined effect of this is DKK 169 million. Disregarding these three major events, the decrease of revenue in local currencies is nearly 3% compared to an increase of 7% in 2012.
In 2013 the US accounted for 15% of LEO Pharma’s total revenue, which is a decrease from 18% in 2012. The US revenue decreased by 14% in local currency compared to 2012. Excluding loss of exclusivity of Dovonex® Cream the decrease was 12%.
LEO US had expected Picato® to compensate for the overall decrease in revenue, but sales did not increase as fast as expected. However, the total prescription trend on Picato® improved in the fourth quarter, lead-ing to a growth in net sales which is beginning to meet expectations.
Financial results for 2013
REVENUE
USA: LEO Pharma’s largest market.LAMEA: This region encompasses Latin America,
the Middle East and Africa and features some very different markets with similar challenges.
EU5+: This region consists of five EU member states (the UK, France, Germany, Italy and Spain) plus Canada and Australia.
ZOE: This stands for Zone of Europe and comprises the smaller European markets plus Russia.
ASIA: This region covers China, Japan, South Korea and the markets of Southeast Asia.
FIVE REGIONS
MANAGEMENT’S REVIEW 2013 MANAGEMENT’S REVIEW 2013
12 LEO PHARMA A NNUA L REPO RT 2 0 1 3 13
Operating expensesTotal operating expenses decreased by DKK 649 million in 2013 compared to an increase of DKK 767 million in 2012. The decrease is mainly due to focus on operational excellence and more efficient business processes.
In 2013 LEO Pharma also initiated the implementa-tion of a SAP-based ERP system in order to create a new business platform. This will enable LEO Pharma to achieve operational excellence and support the global organisation in building a foundation for future growth.
Other external expenses decreased by DKK 416 million to DKK 2,983 million in 2013. The decrease in costs is a result of LEO Pharma’s ability to adjust the cost level in all LEO markets, without compromising investments in building a patient-centric organisation.
Employee expenses decreased by DKK 38 million to DKK 2,910 million in 2013.
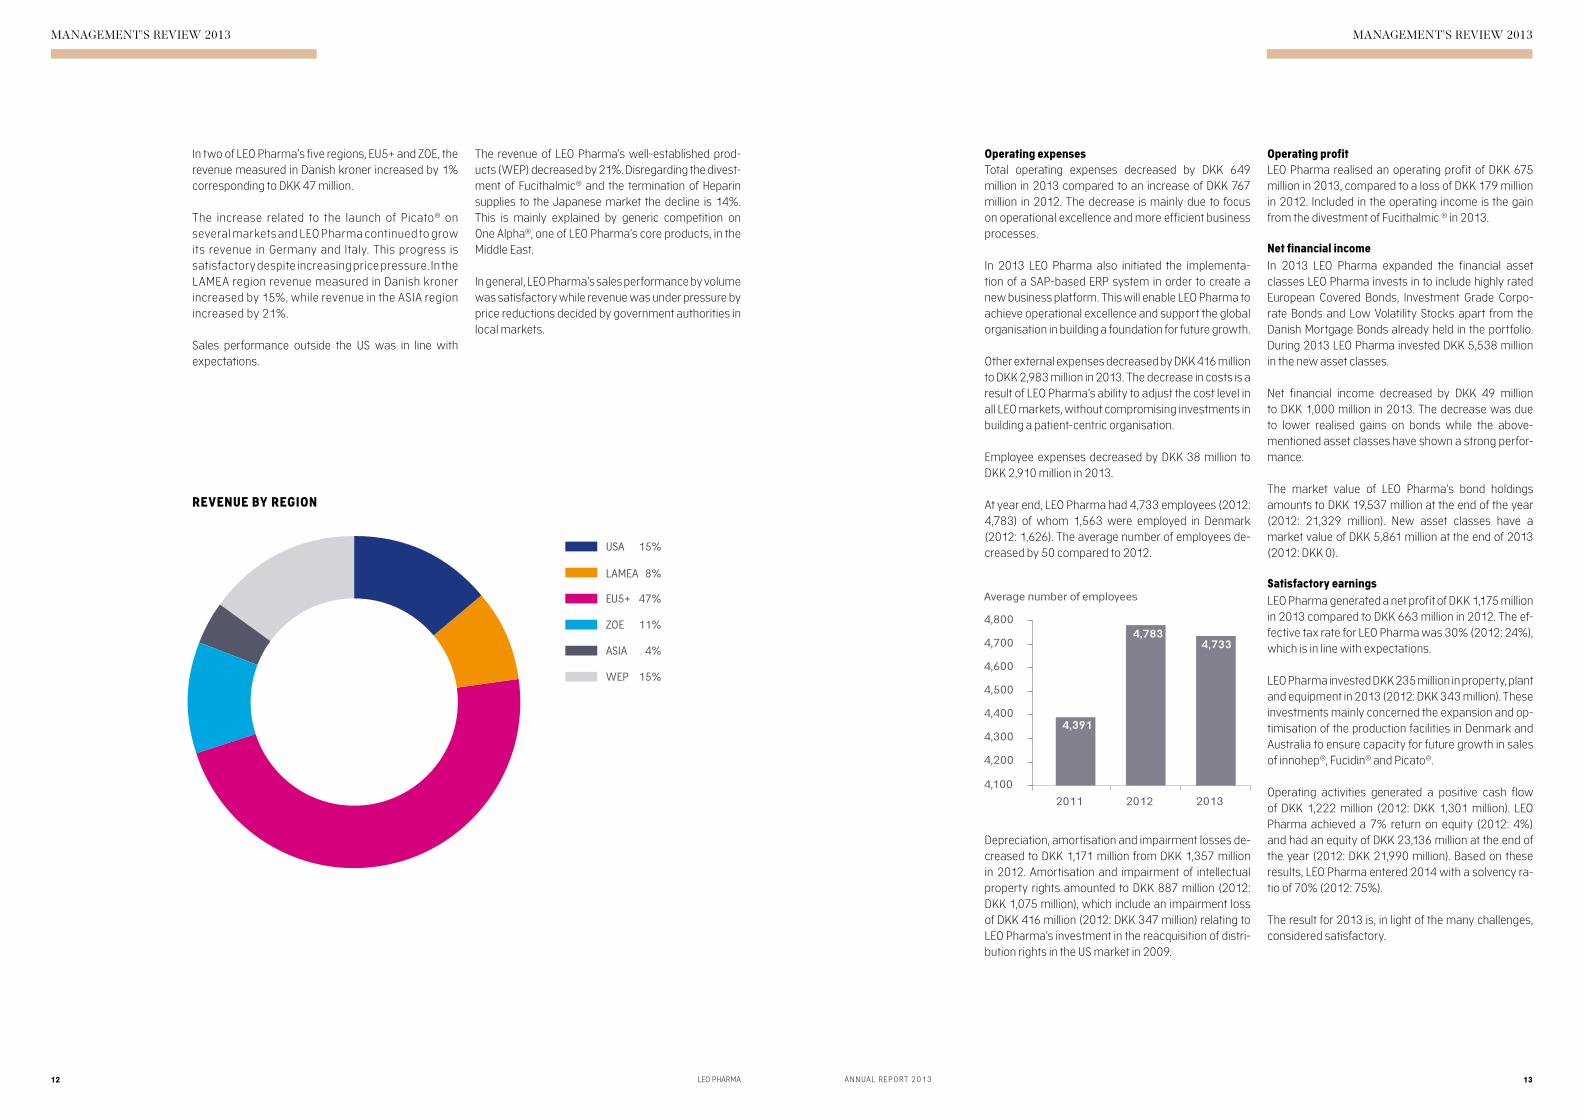
At year end, LEO Pharma had 4,733 employees (2012: 4,783) of whom 1,563 were employed in Denmark (2012: 1,626). The average number of employees de-creased by 50 compared to 2012.
Depreciation, amortisation and impairment losses de-creased to DKK 1,171 million from DKK 1,357 million in 2012. Amortisation and impairment of intellectual property rights amounted to DKK 887 million (2012: DKK 1,075 million), which include an impairment loss of DKK 416 million (2012: DKK 347 million) relating to LEO Pharma’s investment in the reacquisition of distri-bution rights in the US market in 2009.
Operating profitLEO Pharma realised an operating profit of DKK 675 million in 2013, compared to a loss of DKK 179 million in 2012. Included in the operating income is the gain from the divestment of Fucithalmic ® in 2013.
Net financial income
In 2013 LEO Pharma expanded the financial asset classes LEO Pharma invests in to include highly rated European Covered Bonds, Investment Grade Corpo-rate Bonds and Low Volatility Stocks apart from the Danish Mortgage Bonds already held in the portfolio. During 2013 LEO Pharma invested DKK 5,538 million in the new asset classes.
Net financial income decreased by DKK 49 million to DKK 1,000 million in 2013. The decrease was due to lower realised gains on bonds while the above- mentioned asset classes have shown a strong perfor-mance.
The market value of LEO Pharma’s bond holdings amounts to DKK 19,537 million at the end of the year (2012: 21,329 million). New asset classes have a market value of DKK 5,861 million at the end of 2013 (2012: DKK 0).
Satisfactory earnings
LEO Pharma generated a net profit of DKK 1,175 million in 2013 compared to DKK 663 million in 2012. The ef-fective tax rate for LEO Pharma was 30% (2012: 24%), which is in line with expectations.
LEO Pharma invested DKK 235 million in property, plant and equipment in 2013 (2012: DKK 343 million). These investments mainly concerned the expansion and op-timisation of the production facilities in Denmark and Australia to ensure capacity for future growth in sales of innohep®, Fucidin® and Picato®.
Operating activities generated a positive cash flow of DKK 1,222 million (2012: DKK 1,301 million). LEO Pharma achieved a 7% return on equity (2012: 4%) and had an equity of DKK 23,136 million at the end of the year (2012: DKK 21,990 million). Based on these results, LEO Pharma entered 2014 with a solvency ra-tio of 70% (2012: 75%).
The result for 2013 is, in light of the many challenges, considered satisfactory.
In two of LEO Pharma’s five regions, EU5+ and ZOE, the revenue measured in Danish kroner increased by 1% corresponding to DKK 47 million.
The increase related to the launch of Picato® on seve ral markets and LEO Pharma continued to grow its revenue in Germany and Italy. This progress is satisfactory despite increasing price pressure. In the LAMEA region revenue measured in Danish kroner increased by 15%, while revenue in the ASIA region increased by 21%.
Sales performance outside the US was in line with expectations.
The revenue of LEO Pharma’s well-established prod-ucts (WEP) decreased by 21%. Disregarding the divest-ment of Fucithalmic® and the termination of Heparin supplies to the Japanese market the decline is 14%. This is mainly explained by generic competition on One Alpha®, one of LEO Pharma’s core products, in the Middle East.
In general, LEO Pharma’s sales performance by volu me was satisfactory while revenue was under pressure by price reductions decided by government authorities in local markets.
USA 15%
LAMEA 8%
EU5+ 47%
ZOE 11%
ASIA 4%
WEP 15%
Average number of employees
4,100
4,800
4,700
4,600
4,500
4,400
4,300
4,200
4,7834,733
4,391
2011 2012 2013
REVENUE BY REGION
USA 15%
LAMEA 8%
EU5+ 47%
ZOE 11%
ASIA 4%
WEP 15%

MANAGEMENT’S REVIEW 2013
14 LEO PHARMA
LEO Pharma’s transformationTHE JOURNEY CONTINUES
When LEO Pharma embarked on its growth journey in 2009 it started out as a traditional growth journey targeting new markets and new products. Today, that journey has changed into a transformation of LEO Pharma – a move from a traditional pharmaceutical product focus to a holistic view on the patients and their needs.
The first part of LEO Pharma’s growth journey focused on ensuring that LEO Pharma’s solutions reach patients globally. By entering into new markets and establish-ing its own affiliates, LEO Pharma enabled patients to access LEO solutions in more than 100 countries glo-bally. The creation of stepping stones for future growth was also part of the 2013 activities with the establish-ment of LEO affiliates in Japan and Russia. With the establishment of these affiliates, LEO Pharma has for now completed its planned geographical expansion.
Even so, LEO Pharma’s journey continues and go-ing forward LEO Pharma will focus on ensuring that patients get the most out of the solutions through a more holistic approach to diseases instead of focusing solely on the product.
Diseases can be addressed or prevented through changes in behaviour or be treated more effectively through better use of existing therapies and me-thods. Moreover, patients’ needs are not met solely by supplying existing medicines delivered through esta-blished channels, but necessitate different and novel approaches. LEO Pharma’s global patient support programme, QualityCare™, will play a central part in reaching out to patients and their families. The aim of QualityCare™ is to ensure that patients receive relevant information about their skin condition and to help them gain better control of it.
Patients at the centre of everything we doAt least one in four people has a skin disease at any one time. With a mission to help people achieve healthy skin, LEO Pharma is committed to change the impact skin diseases have on people’s lives. An ambi-tion that influences the way LEO Pharma works.
When developing new products or formulations LEO Pharma does not only envisage how a particular mo-lecule works, but also what the disease means to the person and how the right formulation eases applica-tion and thus improves quality of life.
An example of how this approach has come to life is LEO Pharma’s work with the ‘Ointment to Gel’ stra-tegy for Daivobet®, giving people with skin conditions access to a formulation which is easier to apply on the skin.
LEO Pharma is committed to supporting patients maximising the benefit of their treatment and work-ing to increase adherence through the QualityCare™ programmes. By empowering people with skin condi-tions, they get the opportunity to take control of their condition rather than the condition controlling them.
In addition to the approaches mentioned above, LEO Pharma took steps in 2013 to increase trans parency in regard to LEO Pharma’s clinical trials. In October 2013, LEO Pharma publicly announced access to data from its clinical trials back to 1990, in support of LEO Pharma’s patient-centric journey. This places LEO Pharma as a responsible front-runner within the industry.

MANAGEMENT’S REVIEW 2013 MANAGEMENT’S REVIEW 2013
16 LEO PHARMA A NNUA L REPO RT 2 0 1 3 17
GROWING PEOPLE, GROWING LEO
• In 2013 a global engagement survey, LEO Voice, was conducted in the form of a questionnaire distributed to all 4,800 employees. The survey reached a final global response rate of 85.2% and the results will be used by employees and managers to create an even better work environment and a stronger LEO Pharma. The next survey is scheduled to take place in the first half of 2015.
DERMATOLOGY – EXPANDING OUR FOOTPRINT
• A successful area of development was that patients throughout the US and Europe embraced Daivobet® Gel as their psoriatic care solution of choice.
• In 2013 LEO Pharma increased the reach of its global patient support programme QualityCare™- e.g. in the US with dedicated QualityCare™ nurses answering calls from patients to give advice on treatment options and regimes and a joint commu-nication strategy with the National Psoriasis Foundation.
• LEO Pharma concluded the FIELD study in the US – in which advantages of combi-ning traditional cryo-therapy with Picato® treatment were investigated in patients with actinic keratosis (AK).
• LEO Pharma launched Picato® in 16 markets in 2013 covering Europe, Canada and Australia.
NEW MARKETS – FUTURE OPPORTUNITIES
• LEO Pharma established an affiliate in Japan giving patients improved access to LEO solutions. Underlining LEO Pharma’s commitment to the Japanese patients was the company’s first New Drug Application for Daivobet® Ointment for treat-ment of psoriasis in Japan.
• LEO Pharma also entered a distribution and co-promotion partnership with Kyowa Hakko Kirin CO., LTD for Dovobet® Ointment in Japan.
• LEO Pharma prepared for the establishment of an affiliate in Moscow, Russia, with particular focus on ensuring a smooth transfer of distribution rights from Takeda.
INNOHEP® – FULL SPEED AHEAD!
• In support of the large thrombosis franchise LEO Pharma completed enrollment in CATCH – the world’s largest study in cancer associated thrombosis. The CATCH study has the potential to build a strong position for innohep® within cancer associated thrombosis. innohep® thus continues to be a strong, viable and growth- oriented part of LEO Pharma.
USA – YES, WE WILL!
• In November 2013 LEO Pharma signed an exclusive sales and marketing agree-ment with Antares Pharma Inc. on promotion, marketing and sales of Otrexup™ in the US. Otrexup™ is a single-dose auto-injector containing a prescription medicine for psoriasis patients.
LEO Pharma’s five Must-Win Battles (MWBs) form a basis for the company’s key strategic activities.
Through the work with MWBs, LEO Pharma wants to achieve a better foothold in dermatology, in both new and established markets. LEO Pharma also aims at strengthening its organisation and employees. Other key goals are to utilise the full potential of the product innohep®, and to strengthen LEO Pharma’s profile and ac-tivities in the US market.
Progress in LEO Pharma’s Must-Win Battles in 2013
2015

MANAGEMENT’S REVIEW 2013 MANAGEMENT’S REVIEW 2013
18 LEO PHARMA A NNUA L REPO RT 2 0 1 3 19
LEO Pharma invested DKK 1,128 million in Research and Development (R&D) in 2013 and DKK 1,166 million in 2012. The decrease of DKK 38 million was mainly due to a reduction in patent litigations, which more than outweighed an increase in clinical studies and regulatory fees. Investment in R&D as a share of reve-nue was unchanged at 14%. LEO Pharma’s late-stage pipeline was strengthened in 2013.
DERMATOLOGY
Actinic keratosisThree studies between phases I and III are under way worldwide. A New Molecular Entity (NME) with new mechanisms of action has successfully progressed through phase I clinical studies and into phase II. The first clinical trial evaluating field treatment with ingenol mebutate gel subsequent to cryosurgery was com-pleted with excellent results confirming the value of combining treatments. The predictable and favour-able safety profile of Picato® was comparable to pre-vious studies. Four additional FIELD programme stu-dies supporting the use of Picato® in the clinical setting are under way.
Psoriasis
Eight topical and systemic global studies between phases I and III have been performed. These span NMEs with novel mechanisms of action, improved de-livery systems, product enhancements and global ex-pansion with a regulatory filing of Dovobet® Ointment in Japan. Three additional clinical trials are under way and four clinical studies are planned to start in 2014. The global roll-out of Daivobet® Gel (body indication) is well under way.
Eczema/atopic dermatitis
Two NMEs have been developed for the treatment of eczema and tested in clinical phase I trials. Atopic der-matitis primarily affects children which reinforces the need for new NMEs to provide high local effect with no or very little systemic exposure – resulting in a very good safety profile.
THROMBOSIS
In France the Regulatory Authorities approved long-term use of innohep® for cancer associated throm-bosis for three to six months. To better meet patient needs, LEO Pharma initiated a project of introducing three additional treatment syringes with the aim to make long-term use of innohep® even more conve-nient for the patients. Further patient-centric initia-tives are under way to help improve adherence to long-term treatment. These initiatives are developed
in collaboration with health care professionals and patients. In October 2013 the last patient was enrolled in the CATCH study, the world’s largest clinical study in cancer associated thrombosis.
HUMAN CAPITAL
LEO Pharma’s employees are the main driver be-hind the company’s global transformation and form the basis for its continuous success. LEO Pharma’s transformation from a primarily European to a global company has required a shift in mindset among LEO people. Increased collaboration across functions and borders has strengthened awareness about many different cultures within the LEO culture, and the dif-ferent use of business models around the world has been a source of inspiration to LEO people.
LEO Pharma conducted a global engagement survey, LEO Voice, in 2013. The survey reached a response rate of 85.2 %. A key initiative in 2014 for employ-ees and managers will be to turn the responses into actions.
Basis for future earnings RESEARCH AND DEVELOPMENT
Special business and financial risks
LEO Pharma is continuously working on ensuring a reasonable balance between risk exposure and value creation. Therefore, LEO Pharma regularly enters into long-term agreements for the supply of raw materials and other critical input for its production.
Market risks
LEO Pharma makes considerable efforts to protect its intellectual property rights at all times, for both new and existing products, and to ensure that the company carries on its business without infringing the rights of others.
Foreign exchange risks
Based on LEO Pharma’s future operating budgets, cash flows in foreign currencies are hedged on a re-gular basis. The greatest foreign exchange risk is asso-ciated with the following currencies: USD, GBP, CAD, AUD and SAR. These currencies together accounted for 71% of LEO Pharma’s foreign exchange position in 2013 and are, on average, hedged for the coming 12 months’ expected cash flows. The average period for which expected future cash flows in all currencies are hedged is 11 months.
LEO Pharma does not hedge net investments in foreign affiliates. The Group’s hedging is centralised at the pa-rent company.
Liquidity risks
LEO Pharma is wholly owned by the LEO Foundation, which pursues a strategy of reinvesting cash flows in
the parent company. As LEO Pharma has a high sol-vency ratio, no significant liquidity risks are encoun-tered.
Interest rate risks
Interest rate risks occur in connection with our invest-ments in various asset classes. LEO Pharma invests in Low Volatility Stocks, Investment Grade Corporate Bonds and Covered Bonds.
The interest rate risk on our held to maturity portfo-lio of Danish mortgage bonds is eliminated partly by the interest rate risk of our debt portfolio. Interest rate swaps are used to hedge the interest rate for each loan in our debt portfolio.
Credit risks
LEO Pharma’s credit risks relate partly to primary fi-nancial assets and partly to derivative financial in-struments with a positive market value. Credit risks relating to financial assets correspond to the values recognised in the balance sheet.
The market for pharmaceuticals in Southern Europe in particular is still being affected by the financial cri-sis. To avoid future bad debts, LEO Pharma maintains a tight credit policy.
There are not considered to be any material risks rela-ting to individual customers or business partners.
OPERATING RISKS

MANAGEMENT’S REVIEW 2013
20 LEO PHARMA
As 2013 was, 2014 will be a challenging year for LEO Pharma with sales and net income expected to be at the same level of 2013 corrected for the sale of Fucithalmic®. The company’s general growth will be challenged by pricing measures and reimburse-ment issues in a number of markets. Furthermore, LEO Pharma may face a potential loss of exclusivity on Daivobet® Ointment in Europe and the US. Among the highlights of 2014 will be the continued launch of Picato® into new markets as well as the outcome of the CATCH study.
LEO Pharma will continue its journey and increase the efforts in building a global and patient-centric orga-nisation. The ambition is to help as many patients as possible. LEO Pharma will continue its focus on align-ing and developing the organisational structure to meet the challenges of the pharmaceutical industry
and ensure that its resources are invested where they matter the most: for the benefit of patients.
Elements of uncertainty
LEO Pharma’s results may be affected by further generic competition, price pressure due to the continued finan-cial crisis and low interest rates. In addition, the launch of new products is always associated with uncertainty.
Ownership structure
LEO Pharma is wholly owned by the LEO Foundation, Industriparken 55, 2750 Ballerup, Denmark.
Events after the balance sheet date
No events have occurred in the period from the ba-lance sheet date until the presentation of the financial statements which materially affect the assessment of the Annual Report.
Expectations for 2014
LEO Pharma A/S’ compliance with Section 99a and 99b of the Danish Financial Statements Act is reported in a separate Corporate Social Responsibility (CSR) report available on http://www.leo-pharma.com/Home/LEO-Pharma/Corporate-responsibility/Re-ports.aspx.
Corporate social responsibility
ACCOUNTING POLICIES 2013
A NNUA L REPORT 2013 23
The Annual Report of LEO Pharma A/S for 2013 has been prepared in accordance with the provisions of the Danish Financial Statements Act applying to large enterprises of reporting class C.
The accounting policies applied remain unchanged from last year.
Recognition and measurement
Revenues are recognised in the income statement as earned. Furthermore, value adjustments of financial assets and liabilities measured at fair value or amor-tised cost are recognised. Moreover, all expenses are recognised in the income statement, including depre-ciation, amortisation and impairment losses.
Assets are recognised in the balance sheet when it is probable that future economic benefits will flow to the Company, and the value of the asset can be measured reliably.
Liabilities are recognised in the balance sheet when it is probable that future economic benefits will flow out of the Company, and the value of the liability can be measured reliably.
Assets and liabilities are initially measured at cost. Subsequently, assets and liabilities are measured as described for each item below.
Certain financial assets and liabilities are measured at amortised cost, which involves the recognition of a constant effective interest rate over the maturity pe-riod. Amortised cost is calculated as original cost less any repayments and with addition/deduction of the cumulative amortisation of any difference between cost and the nominal amount.
Recognition and measurement take into account pre-dictable losses and risks occurring before the presen-tation of the Annual Report which confirm or refute cir-cumstances existing at the balance sheet date.
Danish kroner are used as the measurement currency. All other currencies are regarded as foreign currencies.
Consolidated Financial Statements
The Consolidated Financial Statements comprise the Parent Company LEO Pharma A/S and affiliates in which LEO Pharma A/S directly or indirectly holds more than 50% of the votes or otherwise exercises control.
The Consolidated Financial Statements are pre-pared by combining the Financial Statements of the Parent Company and all affiliates with subsequent
elimi nation of intercompany transactions, intercom-pany shareholdings and balances as well as unrealised profits from intercompany transactions. The Financial Statements of all companies have been prepared ac-cording to the same accounting policies.
Enterprises acquired during the year and newly formed enterprises are included in the consolidation as from the date of acquisition or formation. Enterprises that are sold or wound up during the year are included in the consolidated income statement up until the date of disposal or until the business was wound up. Compa-rative figures are not restated for newly acquired, sold or wound-up enterprises.
Foreign currency translation
On recognition, transactions in foreign currencies are translated at the exchange rates at the transaction dates. Exchange differences arising between the trans-action date rates and the rates at the payment dates are recognised in financial income and expenses in the income statement.
Receivables, payables and other monetary items in foreign currencies are translated at the exchange rates at the balance sheet date. Any differences between the exchange rates at the balance sheet date and the rate at the time when the receivable or the payable arises, or at recognition in the most recent Financial State-ments, are recognised in financial income and ex-penses in the income statement.
On recognition of foreign affiliates, income statements are translated at the average exchange rates of the pe-riod, and balance sheet items are translated at the ex-change rates at the balance sheet date.
Exchange adjustments arising on the translation of the opening equity of foreign affiliates at the exchange rates at the balance sheet date and on the translation of the income statement from average exchange rates to the exchange rates at the balance sheet date are recognised directly in equity.
Derivative financial instruments
Derivative financial instruments are recognised in the balance sheet at cost and are subsequently measured at their fair values. Positive and negative fair values of derivative financial instruments are recognised in other receivables and other payables respectively.
Changes in the fair values of derivative financial in-struments that are designated and qualify as fair value hedges of a recognised asset or a recognised liability are recognised in the income statement as are any
Accounting policies3011
5868
243
79
9526

ACCOUNTING POLICIES 2013 ACCOUNTING POLICIES 2013
24 LEO PHARMA A NNUA L REPORT 2013 25
Development projects that do not meet the criteria for recognition in the balance sheet are recognised as ex-penses in the income statement as incurred.
Development projects, patents, trademarks and rights are measured at cost less accumulated impairment losses and amortisation. Amortisation is charged sy-stematically over expected useful life, between 3 and 20 years. The amortisation profile is on a straight-line basis adjusted for the risk relating to the underlying as-set, so that up to 33% of the amortisation is brought forward from the second half of the asset’s expected useful life to the first half.
Other costs relating to the maintenance of patents, etc. are expensed.
Projects are assessed on an ongoing basis consider-ing development progress, expected approvals and commercial utilisation.
Property, plant and equipment
Property, plant and equipment are measured at cost less accumulated depreciation and less any accumu-lated impairment losses. Cost comprises expenses for materials, sub-suppliers and labour for fixed assets produced. The total cost of an asset is broken down into components which are depreciated separately if the expected useful lives of the individual components are not the same. Any interest and other borrowing ex-penses are not included in cost.
Gains and losses on the sale of property, plant and equipment are calculated as the difference between the sales price less selling expenses and the carrying amount at the time of sale. Gains and losses are recog-nised in the income statement under other operating income or other operating expenses.
Impairment of fixed assets
The carrying amounts of intangible assets and pro-perty, plant and equipment are reviewed on an an-nual basis to determine whether there is any indication of a decrease in value other than that expressed by a mortisation and depreciation. If so, an impairment test is carried out to determine whether the recover-able amount is lower than the carrying amount, and the asset is written down to its lower recoverable amount.
The recoverable amount of the asset is calculated as the higher of net selling price and value in use. Where a recoverable amount cannot be determined for the individual asset, the assets are assessed in the smallest group of assets for which a reliable recover-
able amount can be determined based on a total assessment.
Leases
Leases under which the Group substantially assumes all the risks and rewards of ownership (finance leases) are recognised in the balance sheet at the lower of the fair value of the leased asset and the net present value of the lease payments computed by applying the inte-rest rate implicit in the lease or an approximated value as the discount rate. Assets acquired under finance leases are depreciated and written down for impair-ment under the same policy as determined for the other fixed assets of the Group.
The remaining lease obligation is capitalised and re-cognised in the balance sheet under debt, and the inte-rest element on the lease payments is charged to the income statement over the lease term.
All other leases are considered operating leases. Pay-ments made under operating leases are recognised in the income statement on a straight-line basis over the lease term.
Parent Company’s investments in affiliates
In the Parent Company, investments in affiliates are measured under the equity method. This means that the affiliates are measured in the balance sheet at the proportionate share of their net asset value with de-duction or addition of unrealised intercompany profits or losses and with addition of any remaining value of positive differences (goodwill) and deduction of any remaining value of negative differences (negative goodwill). The Parent Company’s share of the profit for the year of the affiliates is recognised in the income statement less unrealised intercompany profits.
The total net revaluation of investments in affiliates is transferred upon distribution of profit to ‘Reserve for net revaluation under the equity method’ under equity. The reserve is reduced by dividend distributed to the Parent Company and adjusted for other equity move-ments in affiliates.
changes in the fair value of the hedged asset or the hedged liability.
Changes in the fair value of financial and derivative fi-nancial instruments that are designated and qualify as hedges of future cashflows are recognised as other re-ceivables and other payables and as financial hedges in equity. Income and expenses relating to such hed-ging transactions are transferred from equity on reali-sation of the hedged item and recognised as financial income and expenses.
Revenue
Revenue from the sale of goods for resale and finished goods is recognised in the income statement when the sale is considered effected based on the following cri-teria:
• Delivery and transfer of risk have taken place before year-end
• There is a binding sales agreement• The sales price has been determined and payment
has been received or may with reasonable certainty be expected to be received
Revenue is recognised exclusive of VAT and net of dis-counts relating to sales.
Furthermore, revenue includes licence income and royalties from outlicensed products as well as mile-stone payments and other revenues in connection with partnerships. These revenues are recognised when it is probable that future economic benefits will flow to LEO Pharma A/S and these benefits can be measured reliably.
Consumption of raw materials, consumables and goods for resale
Expenses for raw materials, consumables and goods for resale comprise the raw materials, consumables and goods for resale used to achieve the revenue for the year.
Other external expenses
Other external expenses comprise indirect produc-tion costs and expenses for premises, sales and dis-tribution as well as office expenses, etc. Other exter-nal expenses also include research and development costs – excluding staff expenses – that do not qualify for capitalisation.
Staff expenses
Staff expenses comprise wages and salaries as well as payroll expenses.
Amortisation, depreciation and impairment lossesAmortisation, depreciation and impairment losses comprise amortisation, depreciation and impairment of intangible assets and property, plant and equip-ment.
Other operating income
Other operating income includes non-recurring in-come from the sale of rights and gains on the sale of fixed assets, etc. as well as other operating income of a secondary nature to the core activities of the Group.
As a main rule, the sale of rights, etc. is recognised as income at the time of sale. If the sale results in an obli-gation for the Company, the income is accrued over the duration of the obligation, and in the case of sales where the income is dependent on future events, the amount is recognised as income when the event oc-curs.
Financial income and expenses
Financial income and expenses comprise interest, rea lised and unrealised exchange rate adjustments, price adjustment of securities as well as interest relating to extra payments and repayment under the on-account taxation scheme.
Tax on profit/loss for the year
Tax for the year consists of current tax for the year and deferred tax for the year. The tax attributable to the profit for the year is recognised in the income state-ment, whereas the tax attributable to equity transac-tions is recognised directly in equity. Any changes in deferred tax due to changes to tax rates are recog-nised in the income statement.
Intangible assets
Intangible assets, including development projects, are measured at cost.
Costs of development projects comprise salaries, a mortisation and other expenses directly or indirectly attributable to the Company’s development activities.
Development projects that are clearly defined and iden-tifiable and in respect of which technical feasibili ty, sufficient resources and a potential future market or development opportunity in the enterprise can be demonstrated and where it is the intention to manu-facture, market or use the project, are recognised as intangible assets. This applies if sufficient certainty exists that the value in use of future earnings can cover the cost of production, sales and administrative expenses involved as well as the development costs.
DEPRECIATION IS CALCULATED ON A STRAIGHT-LINE BASIS OVER EXPECTED USEFUL LIFE
Buildings 10 – 25 years
Plant and machinery 5 – 10 years
Other fixtures and fittings, tools and equipment 3 – 10 years
Leasehold improvements 0 – 10 years

ACCOUNTING POLICIES 2013
A NNUA L REPORT 2013 27
Other securitiesThe holding of bonds that are held to maturity is clas-sified as a fixed asset investment. The bonds are ini-tially recognised in the balance sheet at cost. Subse-quently, the holding is measured at amortised cost, which includes revaluation/write-down of the holding of bonds at par over the term of the individual series of bonds.
Inventories
Raw materials and packing materials are measured at the lower of cost under the FIFO method and net reali-sable value.
Work in progress and finished goods are measured at cost. The cost of finished goods and work in progress comprises the cost of raw materials, consumables, di-rect labour and indirect production costs. Indirect pro-duction costs comprise indirect materials and labour as well as maintenance and depreciation of the ma-chinery, factory buildings and equipment used in the manufacturing process and costs of factory admini-stration and management.
The net realisable value of inventories is calculated as sales price with deduction of costs of completion and expenses incurred to effect the sale and is determined allowing for marketability, obsolescence and develop-ment in expected sales price.
Obsolete goods, including slow-moving goods, are ex-pensed.
Receivables
Receivables are measured at amortised cost, which usually corresponds to nominal value less potential bad debts. Based on an individual assessment of each trade receivable, write-downs have been made where this is considered necessary.
Exchange rate adjustments of intercompany balances with affiliates which are considered part of the total net investment in the affiliate are recognised directly in equity.
Other securities, which consist of listed bonds and shares classified as current assets, are measured at their fair values at the balance sheet date. Fair value is determined on the basis of the latest quoted mar-ket price.
Prepayments and deferred income
Prepayments include prepaid expenses incurred re-lating to rent, insurance premiums, subscriptions and interest.
Deferred income includes payments received in re-spect of income in subsequent financial years.
Provisions
Provisions are recognised when – in consequence of an event that occurred before or on the balance sheet date – the Group has a legal or constructive obliga-tion and it is probable that economic benefits must be given up to settle the obligation. Provisions are not dis-counted.
Pensions
Payments into defined contribution plans are re-cognised in the income statement in the period to which they relate, and any amounts payable are re-cognised in other payables in the balance sheet.
In respect of defined benefit plans an annual actuarial calculation is made of the value in use of future pay-ments under the scheme. The value in use is calculated on the basis of assumptions relating to future develop-ments in pay levels, interest rates, inflation and morta-lity. The value in use is calculated only for the benefits to which the employees have earned a right through their employment with the Group. Plan assets are recognised to the extent the Group is able to obtain future economic benefits in the form of reimburse-ment from the pension scheme or reduction of future payments.
Pension costs for the year are recognised in the in-come statement based on actuarial estimates and fi-nancial expectations at the beginning of the year.
Any differences between expected developments in plan assets and pension obligations and realised valu es calculated at the beginning of the year are con-sidered actuarial gains or losses. Actuarial gains and losses are recognised in income or expenses based on a corridor of 0%. Calculated gains and losses are recognised over the expected average remaining em-ployment period of the employees covered by the pen-sion scheme. Pension costs relating to previous years are distributed over the average period until the bene-fits have vested.
Tax
The corporation tax recognised in the income state-ment consists of current tax for the year, changes in provisions for deferred tax and adjustments to pre-vious years. Tax attributable to equity transactions is recognised directly in equity.
20052006 2007200820092010 20112012 201320142015

ACCOUNTING POLICIES 2013
28 LEO PHARMA
Deferred tax is provided under the liability method and comprises all temporary differences between the car-rying amount and tax base of assets and liabilities. De-ferred tax is also included to cover recapture of tax de-ductible losses in foreign affiliates which are expected to become relevant as a consequence of future ear-nings of previously jointly taxed foreign affiliates.
The tax bases of tax losses carried forward and tax in-centives carried forward are included in the calculation of deferred tax to the extent these values are likely to be utilised in future taxable income.
Deferred tax relating to potential gains and losses on investments in affiliates is not included unless the shares are expected to be sold within a short period of time, in which case the shareholdings are transferred to current assets.
Deferred tax is calculated at the expected tax rate for the enterprise concerned. Tax payable includes cur-rent tax calculated on the basis of the expected tax-able income for the year as well as any adjustment for taxes payable for previous years.
The Parent Company is jointly taxed with its Danish affiliates. The jointly taxed Danish enterprises have adopted the on-account taxation scheme. Current tax for the year of the jointly taxed enterprises and tax on re-captured income are recognised in the Parent Company.
The jointly taxed Danish enterprises settle the tax with the Parent Company.
Extra payments and repayments relating to the pay-ment of corporation tax are classified as financial in-come and expenses and are not included in tax provi-sions or in the adjusted income tax.
Definition of key figures
Segment reportingRevenue is broken down geographically and by busi-ness area.
Cash flow statement for the Group
The cash flow statement is prepared according to the indirect method based on profit before tax. The state-ment shows cash flows from operating, investing and financing activities as well as cash and cash equiva-lents at the end of the year.
Cash flows from operating activities are calculated as the Group’s profit for the year before extraordinary items and tax adjusted for non-cash operating items such as depreciation, amortisation and impairment losses as well as changes in working capital. Working capital comprises inventories, trade receivables and trade payables, etc.
Cash flows from investing activities comprise pay-ments from acquisitions and disposals of intangible assets, property, plant and equipment as well as fixed asset investments.
Cash flows from financing activities comprise pay-ments from the raising and repayment of short-term and long-term debt and payments to and from share-holders.
Cash and cash equivalents only comprise cash at bank and in hand.
Average number of employees
Average number of full-time equivalent employees
Operating profit marginOperating profit
Revenuex 100
Return on assetsOperating profit Average assets
x 100
Return on equityProfit before tax Average equity
x 100
Solvency ratioEquity Assets
x 100

Page — 30
LEO Pharma A/S | Financial statements
FINANCIAL STATEMENTS 2013
A NNUA L REPORT 2013 33
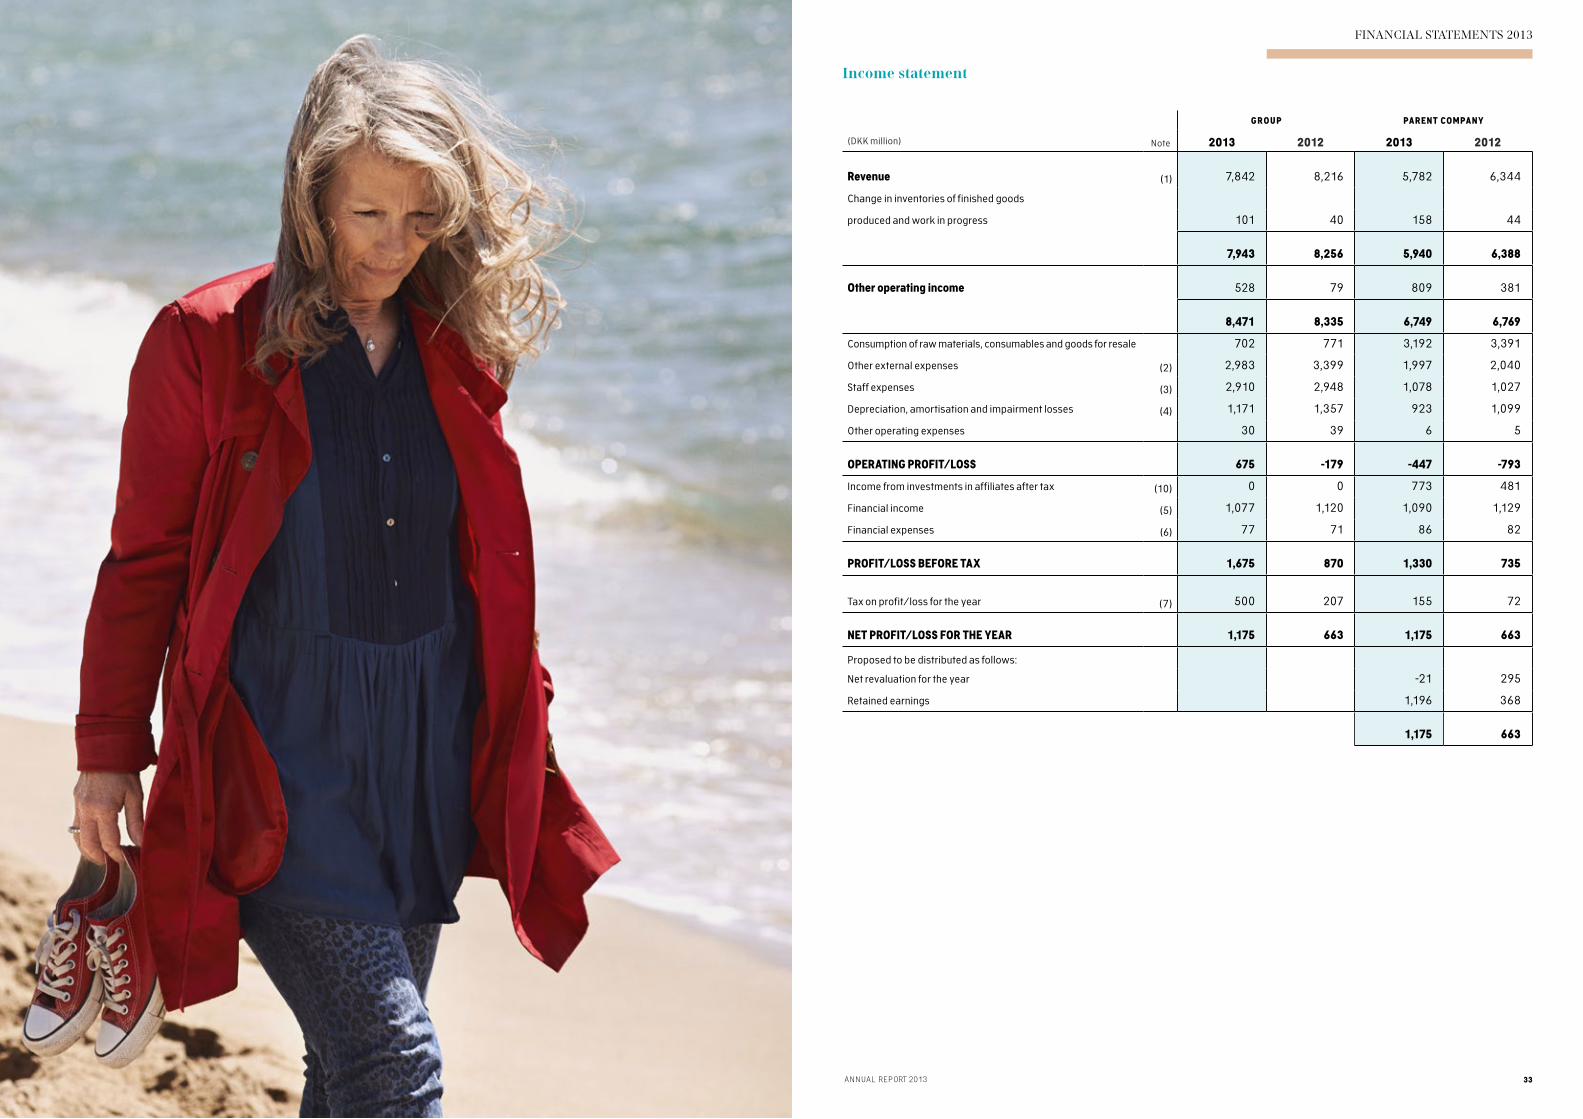
Income statement
Revenue (1) 7,842 8,216 5,782 6,344
Change in inventories of finished goods
produced and work in progress 101 40 158 44
7,943 8,256 5,940 6,388
Other operating income 528 79 809 381
8,471 8,335 6,749 6,769
Consumption of raw materials, consumables and goods for resale 702 771 3,192 3,391
Other external expenses (2) 2,983 3,399 1,997 2,040
Staff expenses (3) 2,910 2,948 1,078 1,027
Depreciation, amortisation and impairment losses (4) 1,171 1,357 923 1,099
Other operating expenses 30 39 6 5
OPERATING PROFIT/LOSS 675 -179 -447 -793
Income from investments in affiliates after tax (10) 0 0 773 481
Financial income (5) 1,077 1,120 1,090 1,129
Financial expenses (6) 77 71 86 82
PROFIT/LOSS BEFORE TAX 1,675 870 1,330 735
Tax on profit/loss for the year (7) 500 207 155 72
NET PROFIT/LOSS FOR THE YEAR 1,175 663 1,175 663
Proposed to be distributed as follows:
Net revaluation for the year -21 295
Retained earnings 1,196 368
1,175 663
GROUP PARENT COMPANY
(DKK million) Note 2013 2012 2013 2012

FINANCIAL STATEMENTS 2013 FINANCIAL STATEMENTS 2013
34 LEO PHARMA A NNUA L REPORT 2013 35
ASSETS
FIXED ASSETS
Intangible assets
Intellectual property rights 375 1,006 375 1,006
Trademarks 18 25 18 25
Development projects 267 291 77 0
Total (8) 660 1,322 470 1,031
Property, plant and equipment
Land and buildings 1,001 1,074 515 526
Leasehold improvements 110 53 0 0
Plant and machinery 655 676 300 342
Other fixtures and fittings, tools and equipment 89 97 73 79
Fixed assets under construction 198 224 79 64
Total (9) 2,053 2,124 967 1,011
Financial fixed assets
Investments in affiliates (10) 0 0 3,587 3,614
Other securities (11) 18,951 20,109 18,951 20,109
Deferred tax assets (14) 1,017 1,140 222 0
Total 19,968 21,249 22,760 23,723
TOTAL FIXED ASSETS 22,681 24,695 24,197 25,765
CURRENT ASSETS
Inventories
Raw materials and consumables 230 235 90 100
Work in progress 902 934 464 315
Finished goods and goods for resale 256 123 241 233
Total 1,388 1,292 795 648
Receivables
Trade receivables 1,651 1,743 556 592
Receivables from affiliates 0 0 552 2,890
Other receivables 948 447 977 359
Prepayments 127 97 55 11
Total 2,726 2,287 2,140 3,852
Other securities 5,861 0 5,861 0
Cash at bank and in hand 479 1,158 11 708
TOTAL CURRENT ASSETS 10,454 4,737 8,807 5,208
TOTAL ASSETS 33,135 29,432 33,004 30,973
EQUITY
Share capital (12) 250 250 250 250
Net revaluation, affiliates 0 0 274 295
Retained earnings 22,886 21,740 22,612 21,445
Total (13) 23,136 21,990 23,136 21,990
PROVISIONS
Deferred tax (14) 48 432 0 61
Pension obligations (15) 2 23 0 0
Other liabilities (16) 632 548 135 46
Total 682 1,003 135 107
LIABILITIES
Short-term liabilities
Credit institutions 7,649 4,810 7,640 4,809
Trade payables 417 350 226 156
Payables to affiliates 100 100 1,372 3,587
Corporation tax 50 129 0 0
Other payables 1,101 1,050 495 324
Total 9,317 6,439 9,733 8,876
TOTAL EQUITY AND LIABILITIES 33,135 29,432 33,004 30,973
Contingencies (17)
Financial instruments (18)
Related parties (19)
Balance sheet at 31 December Balance sheet at 31 December
GROUP PARENT COMPANY
(DKK million) Note 2013 2012 2013 2012
GROUP PARENT COMPANY
(DKK million) Note 2013 2012 2013 2012
LIABILITIES
FINANCIAL STATEMENTS 2013
A NNUA L REPORT 2013 37
GROUP
(DKK million) 2013 2012
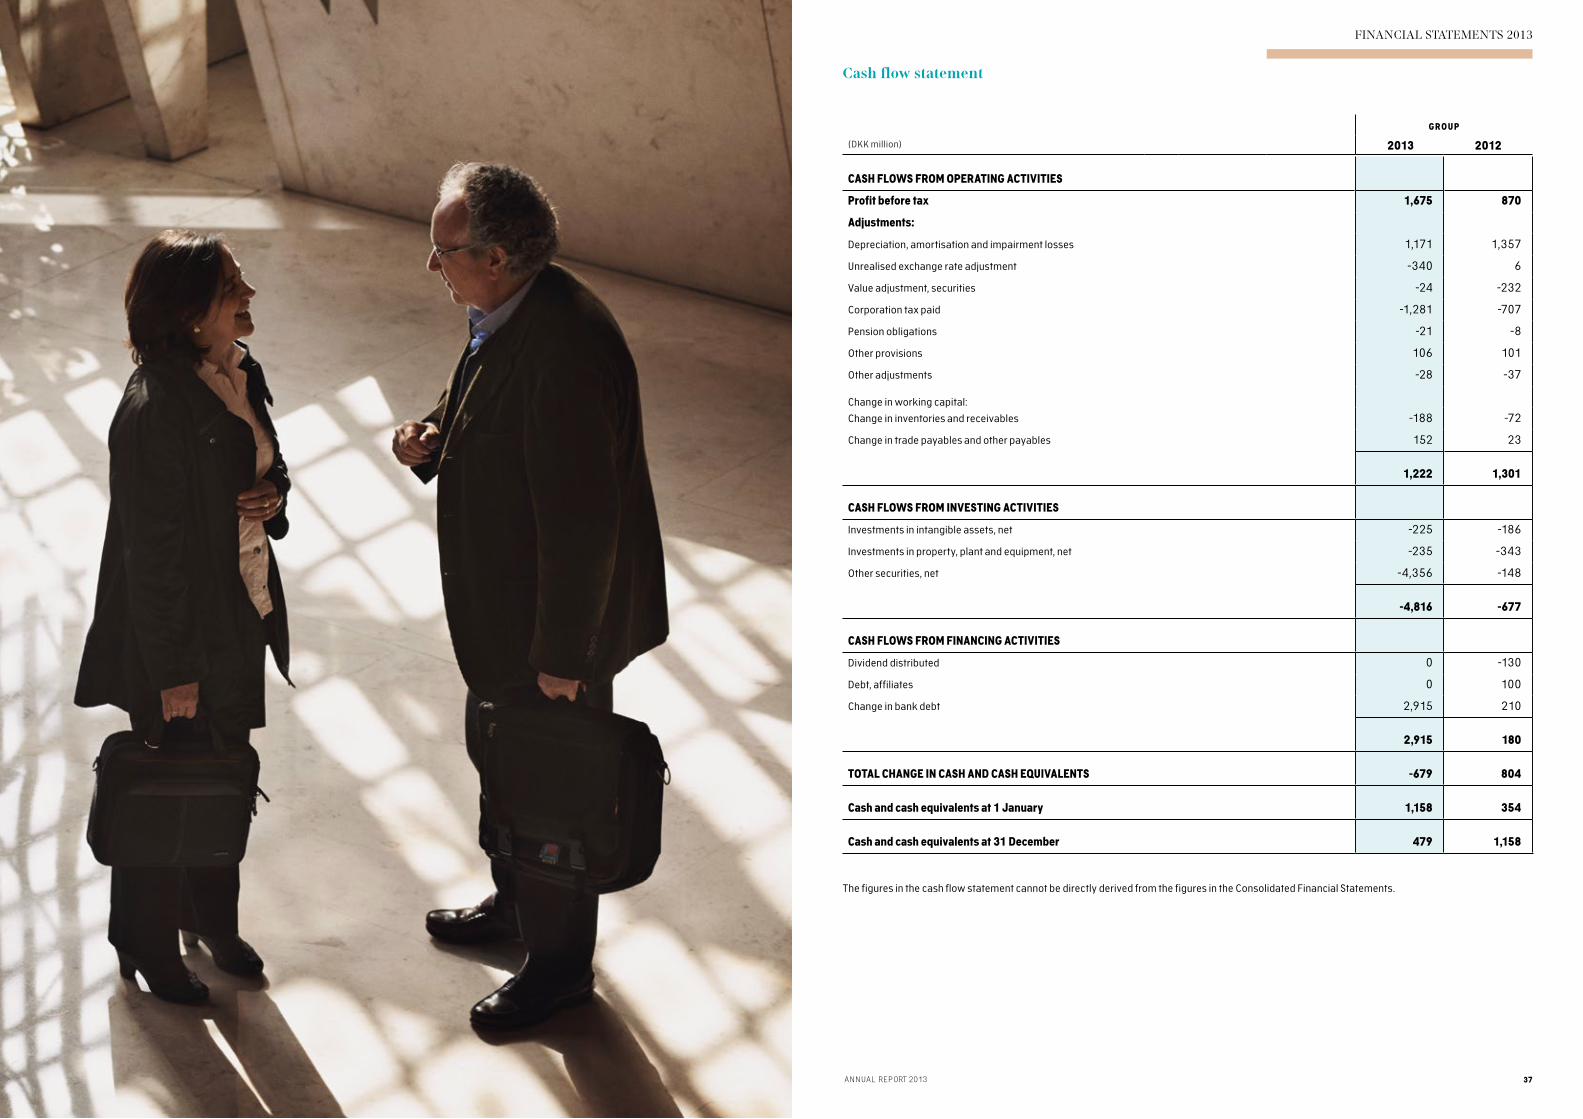
Cash flow statement
CASH FLOWS FROM OPERATING ACTIVITIES
Profit before tax 1,675 870
Adjustments:
Depreciation, amortisation and impairment losses 1,171 1,357
Unrealised exchange rate adjustment -340 6
Value adjustment, securities -24 -232
Corporation tax paid -1,281 -707
Pension obligations -21 -8
Other provisions 106 101
Other adjustments -28 -37
Change in working capital:
Change in inventories and receivables -188 -72
Change in trade payables and other payables 152 23
1,222 1,301
CASH FLOWS FROM INVESTING ACTIVITIES
Investments in intangible assets, net -225 -186
Investments in property, plant and equipment, net -235 -343
Other securities, net -4,356 -148
-4,816 -677
CASH FLOWS FROM FINANCING ACTIVITIES
Dividend distributed 0 -130
Debt, affiliates 0 100
Change in bank debt 2,915 210
2,915 180
TOTAL CHANGE IN CASH AND CASH EQUIVALENTS -679 804
Cash and cash equivalents at 1 January 1,158 354
Cash and cash equivalents at 31 December 479 1,158
The figures in the cash flow statement cannot be directly derived from the figures in the Consolidated Financial Statements .

Page — 38
LEO Pharma A/S | Notes
NOTES TO THE FINANCIAL STATEMENTS 2013
40 LEO PHARMA A NNUA L REPORT 2013 41
NOTES TO THE FINANCIAL STATEMENTS 2013
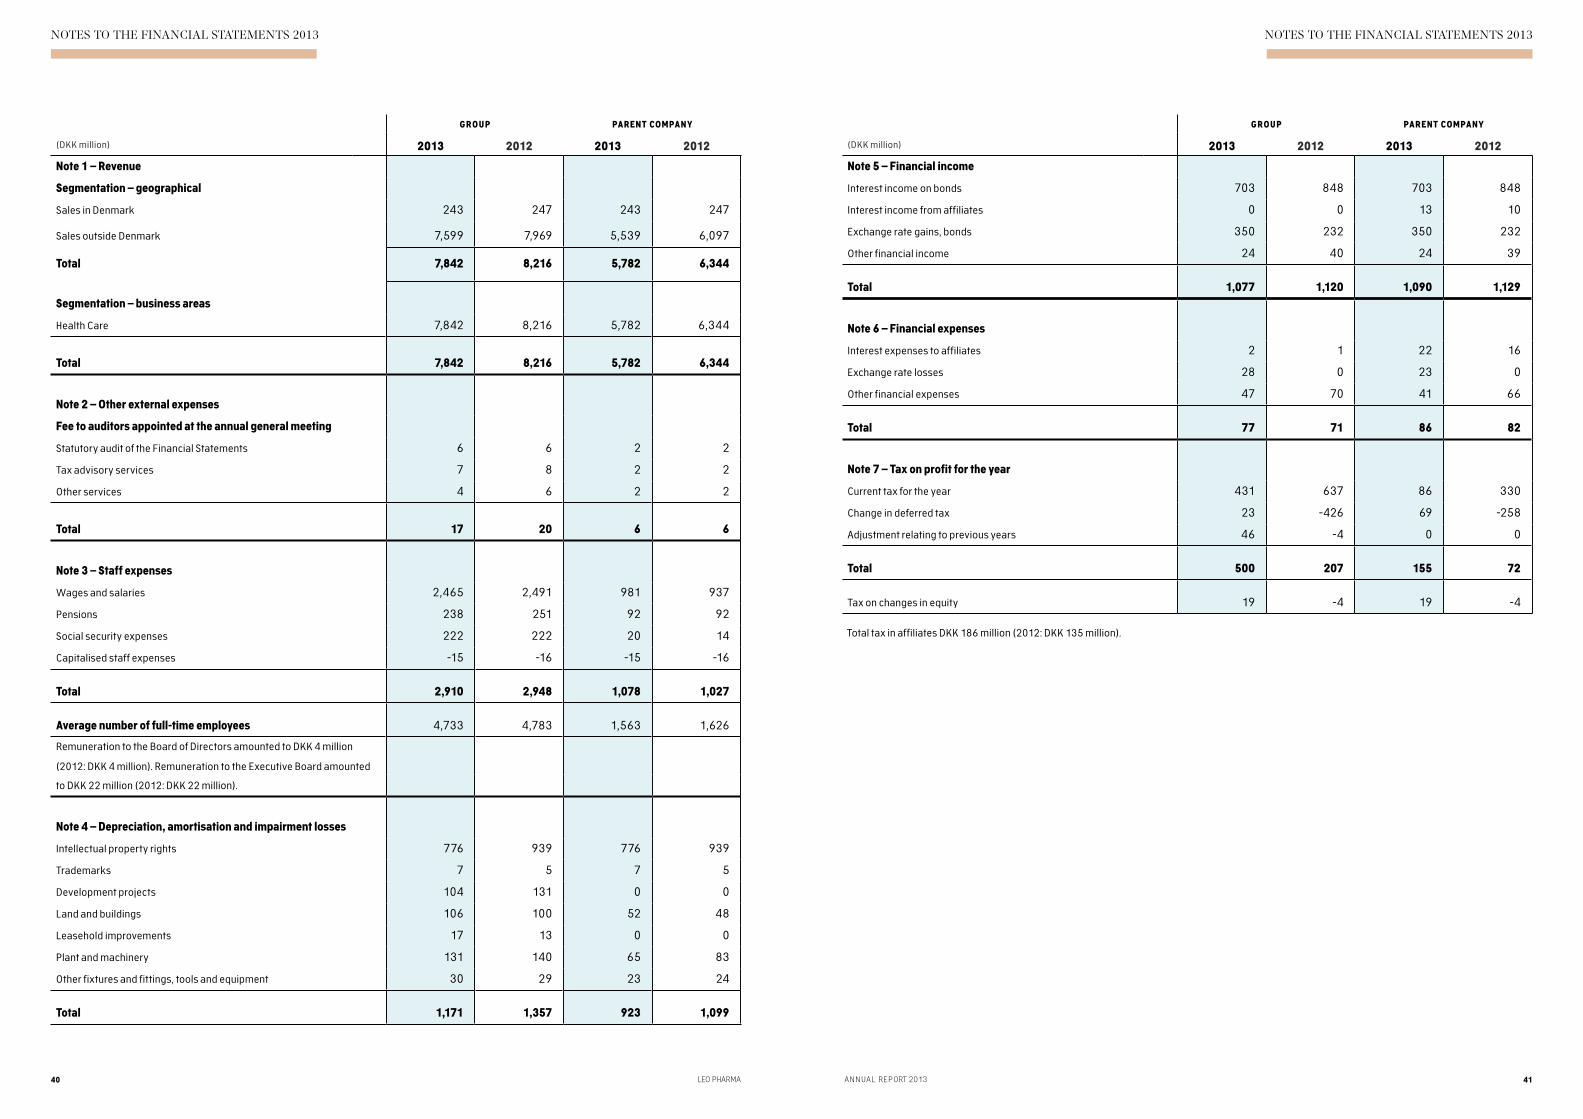
Note 1 – Revenue
Segmentation – geographical
Sales in Denmark 243 247 243 247
Sales outside Denmark 7,599 7,969 5,539 6,097
Total 7,842 8,216 5,782 6,344
Segmentation – business areas
Health Care 7,842 8,216 5,782 6,344
Total 7,842 8,216 5,782 6,344
Note 2 – Other external expenses
Fee to auditors appointed at the annual general meeting
Statutory audit of the Financial Statements 6 6 2 2
Tax advisory services 7 8 2 2
Other services 4 6 2 2
Total 17 20 6 6
Note 3 – Staff expenses
Wages and salaries 2,465 2,491 981 937
Pensions 238 251 92 92
Social security expenses 222 222 20 14
Capitalised staff expenses -15 -16 -15 -16
Total 2,910 2,948 1,078 1,027
Average number of full-time employees 4,733 4,783 1,563 1,626
Remuneration to the Board of Directors amounted to DKK 4 million
(2012: DKK 4 million) . Remuneration to the Executive Board amounted
to DKK 22 million (2012: DKK 22 million) .
Note 4 – Depreciation, amortisation and impairment losses
Intellectual property rights 776 939 776 939
Trademarks 7 5 7 5
Development projects 104 131 0 0
Land and buildings 106 100 52 48
Leasehold improvements 17 13 0 0
Plant and machinery 131 140 65 83
Other fixtures and fittings, tools and equipment 30 29 23 24
Total 1,171 1,357 923 1,099
Note 5 – Financial income
Interest income on bonds 703 848 703 848
Interest income from affiliates 0 0 13 10
Exchange rate gains, bonds 350 232 350 232
Other financial income 24 40 24 39
Total 1,077 1,120 1,090 1,129
Note 6 – Financial expenses
Interest expenses to affiliates 2 1 22 16
Exchange rate losses 28 0 23 0
Other financial expenses 47 70 41 66
Total 77 71 86 82
Note 7 – Tax on profit for the year
Current tax for the year 431 637 86 330
Change in deferred tax 23 -426 69 -258
Adjustment relating to previous years 46 -4 0 0
Total 500 207 155 72
Tax on changes in equity 19 -4 19 -4
Total tax in affiliates DKK 186 million (2012: DKK 135 million) .
GROUP PARENT COMPANY
(DKK million) 2013 2012 2013 2012
GROUP PARENT COMPANY
(DKK million) 2013 2012 2013 2012

NOTES TO THE FINANCIAL STATEMENTS 2013 NOTES TO THE FINANCIAL STATEMENTS 2013
42 LEO PHARMA A NNUA L REPORT 2013 43
(DKK million)
Intellectual
property rights Trademarks
Development
projects
Total
intangible assets
Note 8 - Intangible assets - Group
Cost at 1 January 2013 5,040 33 1,691 6,764
Exchange rate adjustment -1 0 0 -1
Additions during the year 145 0 80 225
Disposals during the year 0 -3 0 -3
Cost at 31 December 2013 5,184 30 1,771 6,985
Amortisation at 1 January 2013 4,034 8 1,400 5,442
Exchange rate adjustment -1 0 0 -1
Amortisation for the year 360 7 104 471
Impairment losses for the year 416 0 0 416
Disposals during the year 0 -3 0 -3
Amortisation at 31 December 2013 4,809 12 1,504 6,325
CARRYING AMOUNT AT 31 DECEMBER 2013 375 18 267 660
Cost at 1 January 2012 4,884 9 1,717 6,610
Exchange rate adjustment 0 0 -26 -26
Additions during the year 156 30 0 186
Disposals during the year 0 -6 0 -6
Cost at 31 December 2012 5,040 33 1,691 6,764
Amortisation at 1 January 2012 3,068 9 1,291 4,368
Exchange rate adjustment 0 0 -22 -22
Reclassified in the balance sheet 27 0 0 27
Amortisation for the year 592 5 131 728
Impairment losses for the year 347 0 0 347
Disposals during the year 0 -6 0 -6
Amortisation at 31 December 2012 4,034 8 1,400 5,442
CARRYING AMOUNT AT 31 DECEMBER 2012 1,006 25 291 1,322
(DKK million)Intellectual
property rights Trademarks
Development
projects
Total
intangible assets
Note 8 - Intangible assets - Parent Company
Cost at 1 January 2013 5,040 30 0 5,070
Additions during the year 145 0 77 222
Cost at 31 December 2013 5,185 30 77 5,292
Amortisation at 1 January 2013 4,034 5 0 4,039
Amortisation for the year 360 7 0 367
Impairment losses for the year 416 0 0 416
Amortisation at 31 December 2013 4,810 12 0 4,822
CARRYING AMOUNT AT 31 DECEMBER 2013 375 18 77 470
Cost at 1 January 2012 4,884 6 0 4,890
Additions during the year 156 30 0 186
Disposals during the year 0 -6 0 -6
Cost at 31 December 2012 5,040 30 0 5,070
Amortisation at 1 January 2012 3,068 6 0 3,074
Reclassified in the balance sheet 27 0 0 27
Amortisation for the year 592 5 0 597
Impairment losses for the year 347 0 0 347
Amortisation and impairment losses on disposals during the year 0 -6 0 -6
Amortisation at 31 December 2012 4,034 5 0 4,039
CARRYING AMOUNT AT 31 DECEMBER 2012 1,006 25 0 1,031

NOTES TO THE FINANCIAL STATEMENTS 2013 NOTES TO THE FINANCIAL STATEMENTS 2013
44 LEO PHARMA A NNUA L REPORT 2013 45
(DKK million)
Land and
buildings
Leasehold
improvements
Plant and
machinery
Other fixtures
and fittings,
tools and
equipment
Fixed assets
under
construction
Total property,
plant and
equipment
Note 9 - Property, plant and equipment - Group
Cost at 1 January 2013 2,171 79 2,197 540 224 5,211
Exchange rate adjustment -3 -10 -5 -3 -14 -35
Additions during the year 58 83 115 25 94 375
Disposals during the year -91 -7 -50 -80 -106 -334
Cost at 31 December 2013 2,135 145 2,257 482 198 5,217
Depreciation and impairment losses at 1 January 2013 1,097 26 1,521 443 0 3,087
Exchange rate adjustment -3 -5 -2 -3 0 -13
Disposals during the year -66 -3 -48 -77 0 -194
Depreciation for the year 105 17 129 30 0 281
Impairment losses for the year 1 0 2 0 0 3
Depreciation and impairment losses at 31 December 2013 1,134 35 1,602 393 0 3,164
CARRYING AMOUNT AT 31 DECEMBER 2013 1,001 110 655 89 198 2,053
Cost at 1 January 2012 2,177 56 2,056 621 274 5,184
Exchange rate adjustment 6 0 4 0 0 10
Additions during the year 166 27 179 33 277 682
Disposals during the year -178 -4 -42 -114 -327 -665
Cost at 31 December 2012 2,171 79 2,197 540 224 5,211
Depreciation and impairment losses at 1 January 2012 1,171 13 1,418 524 0 3,126
Exchange rate adjustment 3 0 2 0 0 5
Disposals during the year -177 0 -39 -110 0 -326
Depreciation for the year 100 13 115 29 0 257
Impairment losses for the year 0 0 25 0 0 25
Depreciation and impairment losses at 31 December 2012 1,097 26 1,521 443 0 3,087
CARRYING AMOUNT AT 31 DECEMBER 2012 1,074 53 676 97 224 2,124
(DKK million) Land and buildings
Plant and
machinery
Other fixtures and
fittings, tools and
equipment
Fixed assets under
construction
Total property,
plant and
equipment
Note 9 - Property, plant and equipment – Parent Company
Cost at 1 January 2013 1,011 1,148 417 64 2,640
Additions during the year 41 24 18 82 165
Disposals during the year 0 -38 -33 -67 -138
Cost at 31 December 2013 1,052 1,134 402 79 2,667
Depreciation and impairment losses at 1 January 2013 485 806 338 0 1,629
Disposals during the year 0 -37 -32 0 -69
Depreciation for the year 52 65 23 0 140
Depreciation at 31 December 2013 537 834 329 0 1,700
CARRYING AMOUNT AT 31 DECEMBER 2013 515 300 73 79 967
Cost at 1 January 2012 1,094 1,069 499 170 2,832
Additions for the year 43 119 27 129 318
Disposals during the year -126 -40 -109 -235 -510
Cost at 31 December 2012 1,011 1,148 417 64 2,640
Depreciation and impairment losses at 1 January 2012 562 762 421 0 1,745
Depreciation for the year 48 58 24 0 130
Impairment losses for the year 0 25 0 0 25
Depreciation and impairment losses, disposals for the year -125 -39 -107 0 -271
Depreciation and amortisation at 31 December 2012 485 806 338 0 1,629
CARRYING AMOUNT AT 31 DECEMBER 2012 526 342 79 64 1,011
NOTES TO THE FINANCIAL STATEMENTS 2013 NOTES TO THE FINANCIAL STATEMENTS 2013
46 LEO PHARMA A NNUA L REPORT 2013 47
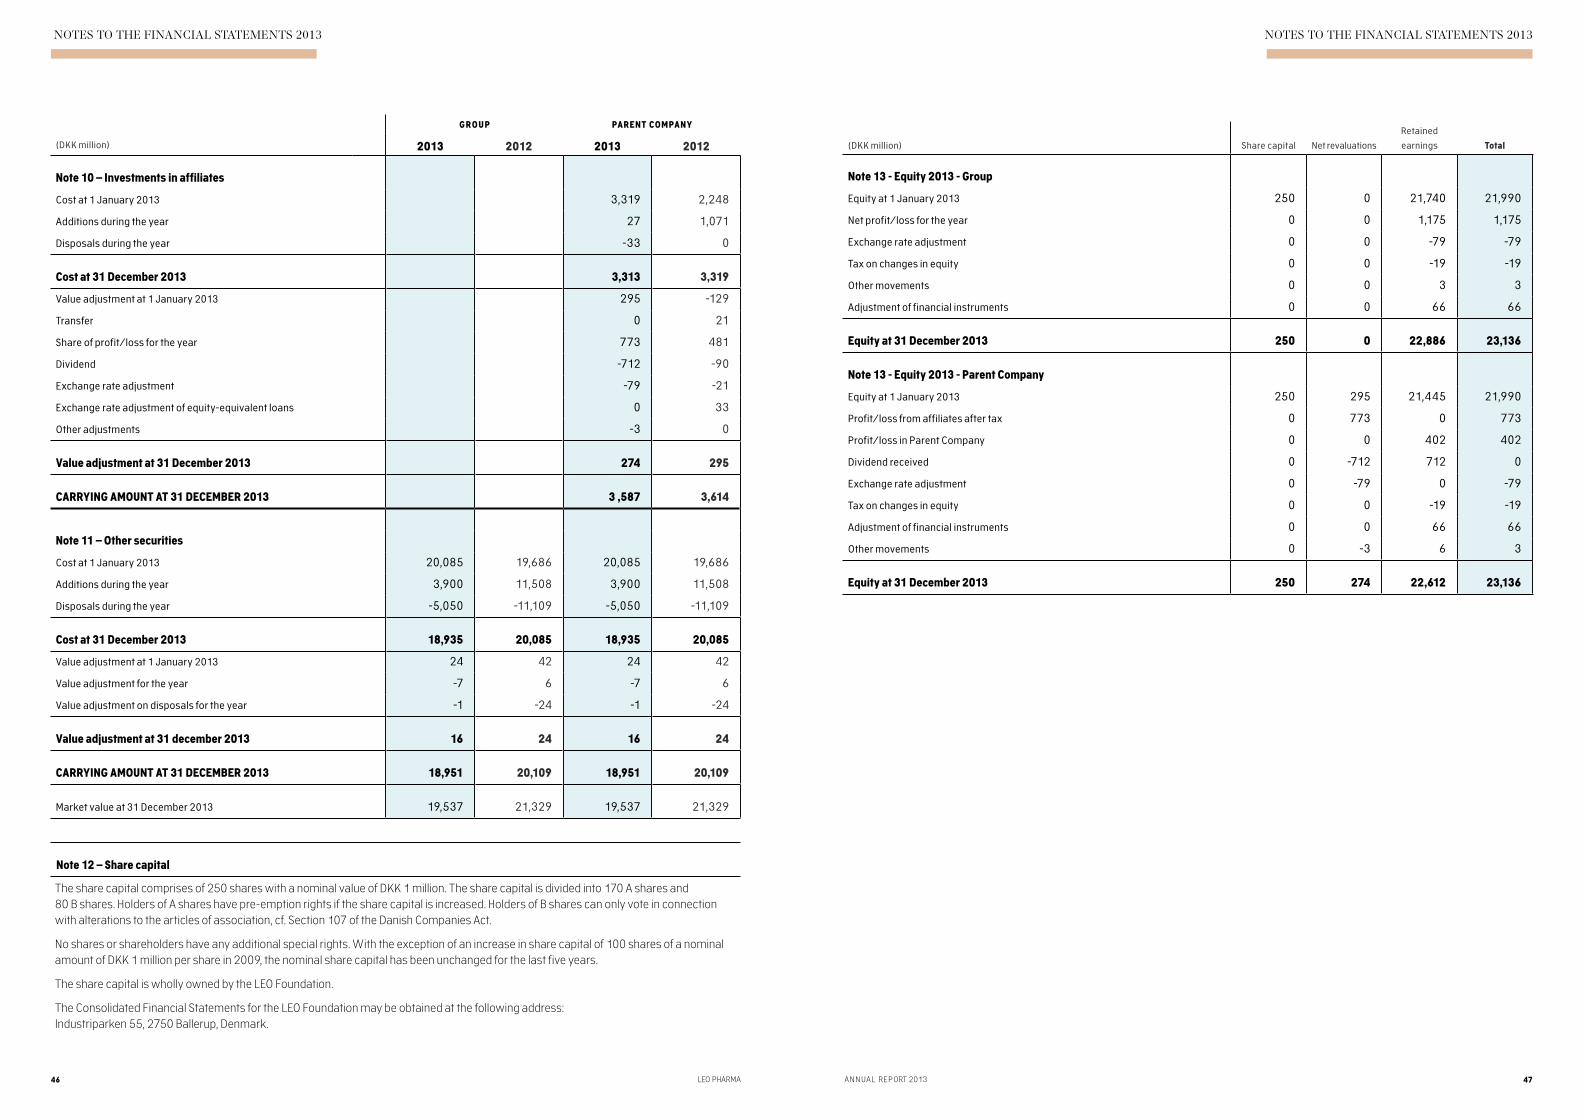
Note 10 – Investments in affiliates
Cost at 1 January 2013 3,319 2,248
Additions during the year 27 1,071
Disposals during the year -33 0
Cost at 31 December 2013 3,313 3,319
Value adjustment at 1 January 2013 295 -129
Transfer 0 21
Share of profit/loss for the year 773 481
Dividend -712 -90
Exchange rate adjustment -79 -21
Exchange rate adjustment of equity-equivalent loans 0 33
Other adjustments -3 0
Value adjustment at 31 December 2013 274 295
CARRYING AMOUNT AT 31 DECEMBER 2013 3 ,587 3,614
Note 11 – Other securities
Cost at 1 January 2013 20,085 19,686 20,085 19,686
Additions during the year 3,900 11,508 3,900 11,508
Disposals during the year -5,050 -11,109 -5,050 -11,109
Cost at 31 December 2013 18,935 20,085 18,935 20,085
Value adjustment at 1 January 2013 24 42 24 42
Value adjustment for the year -7 6 -7 6
Value adjustment on disposals for the year -1 -24 -1 -24
Value adjustment at 31 december 2013 16 24 16 24
CARRYING AMOUNT AT 31 DECEMBER 2013 18,951 20,109 18,951 20,109
Market value at 31 December 2013 19,537 21,329 19,537 21,329
(DKK million) Share capital Net revaluations
Retained
earnings Total
Note 13 - Equity 2013 - Group
Equity at 1 January 2013 250 0 21,740 21,990
Net profit/loss for the year 0 0 1,175 1,175
Exchange rate adjustment 0 0 -79 -79
Tax on changes in equity 0 0 -19 -19
Other movements 0 0 3 3
Adjustment of financial instruments 0 0 66 66
Equity at 31 December 2013 250 0 22,886 23,136
Note 13 - Equity 2013 - Parent Company
Equity at 1 January 2013 250 295 21,445 21,990
Profit/loss from affiliates after tax 0 773 0 773
Profit/loss in Parent Company 0 0 402 402
Dividend received 0 -712 712 0
Exchange rate adjustment 0 -79 0 -79
Tax on changes in equity 0 0 -19 -19
Adjustment of financial instruments 0 0 66 66
Other movements 0 -3 6 3
Equity at 31 December 2013 250 274 22,612 23,136
Note 12 – Share capital
The share capital comprises of 250 shares with a nominal value of DKK 1 million. The share capital is divided into 170 A shares and 80 B shares. Holders of A shares have pre-emption rights if the share capital is increased. Holders of B shares can only vote in connection with alterations to the articles of association, cf. Section 107 of the Danish Companies Act.
No shares or shareholders have any additional special rights. With the exception of an increase in share capital of 100 shares of a nominal amount of DKK 1 million per share in 2009, the nominal share capital has been unchanged for the last five years.
The share capital is wholly owned by the LEO Foundation.
The Consolidated Financial Statements for the LEO Foundation may be obtained at the following address: Industriparken 55, 2750 Ballerup, Denmark.
GROUP PARENT COMPANY
(DKK million) 2013 2012 2013 2012
NOTES TO THE FINANCIAL STATEMENTS 2013 NOTES TO THE FINANCIAL STATEMENTS 2013
48 LEO PHARMA A NNUA L REPORT 2013 49
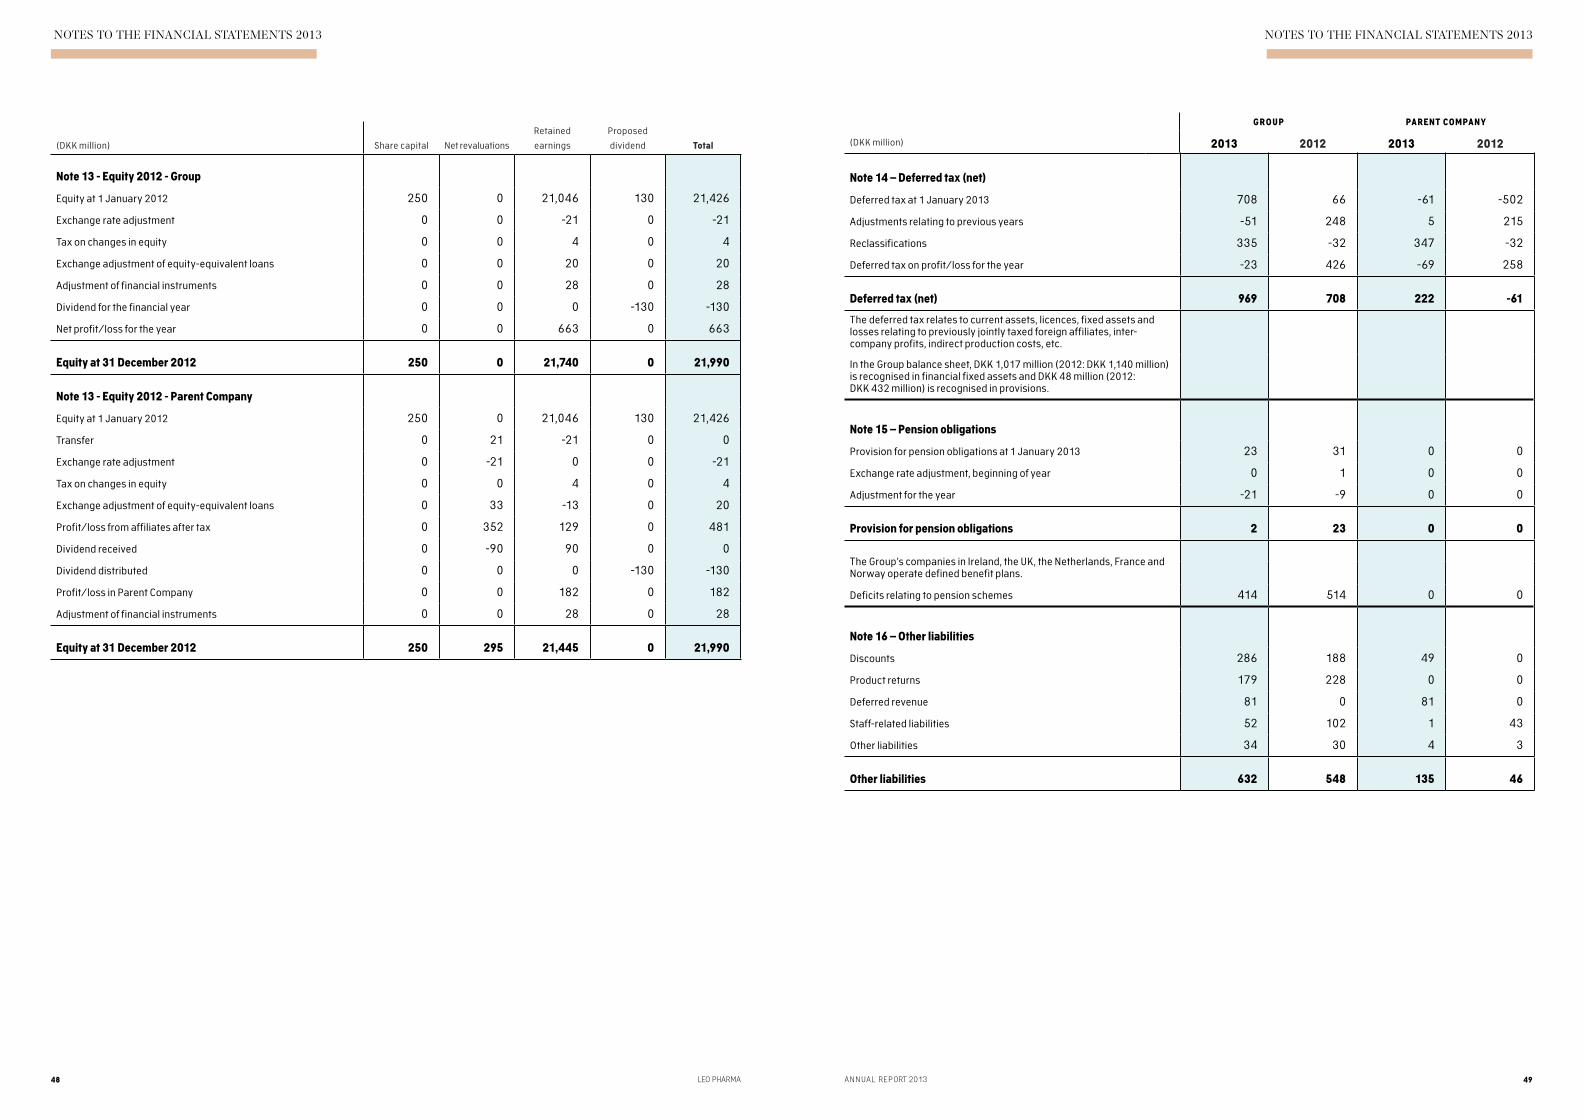
Note 14 – Deferred tax (net)
Deferred tax at 1 January 2013 708 66 -61 -502
Adjustments relating to previous years -51 248 5 215
Reclassifications 335 -32 347 -32
Deferred tax on profit/loss for the year -23 426 -69 258
Deferred tax (net) 969 708 222 -61
The deferred tax relates to current assets, licences, fixed assets and losses relating to previously jointly taxed foreign affiliates, inter-company profits, indirect production costs, etc .
In the Group balance sheet, DKK 1,017 million (2012: DKK 1,140 million) is recognised in financial fixed assets and DKK 48 million (2012: DKK 432 million) is recognised in provisions .
Note 15 – Pension obligations
Provision for pension obligations at 1 January 2013 23 31 0 0
Exchange rate adjustment, beginning of year 0 1 0 0
Adjustment for the year -21 -9 0 0
Provision for pension obligations 2 23 0 0
The Group’s companies in Ireland, the UK, the Netherlands, France and Norway operate defined benefit plans .
Deficits relating to pension schemes 414 514 0 0
Note 16 – Other liabilities
Discounts 286 188 49 0
Product returns 179 228 0 0
Deferred revenue 81 0 81 0
Staff-related liabilities 52 102 1 43
Other liabilities 34 30 4 3
Other liabilities 632 548 135 46
(DKK million) Share capital Net revaluations
Retained
earnings
Proposed
dividend Total
Note 13 - Equity 2012 - Group
Equity at 1 January 2012 250 0 21,046 130 21,426
Exchange rate adjustment 0 0 -21 0 -21
Tax on changes in equity 0 0 4 0 4
Exchange adjustment of equity-equivalent loans 0 0 20 0 20
Adjustment of financial instruments 0 0 28 0 28
Dividend for the financial year 0 0 0 -130 -130
Net profit/loss for the year 0 0 663 0 663
Equity at 31 December 2012 250 0 21,740 0 21,990
Note 13 - Equity 2012 - Parent Company
Equity at 1 January 2012 250 0 21,046 130 21,426
Transfer 0 21 -21 0 0
Exchange rate adjustment 0 -21 0 0 -21
Tax on changes in equity 0 0 4 0 4
Exchange adjustment of equity-equivalent loans 0 33 -13 0 20
Profit/loss from affiliates after tax 0 352 129 0 481
Dividend received 0 -90 90 0 0
Dividend distributed 0 0 0 -130 -130
Profit/loss in Parent Company 0 0 182 0 182
Adjustment of financial instruments 0 0 28 0 28
Equity at 31 December 2012 250 295 21,445 0 21,990
GROUP PARENT COMPANY
(DKK million) 2013 2012 2013 2012

A NNUA L REPORT 2013 51
NOTES TO THE FINANCIAL STATEMENTS 2013
50 LEO PHARMA
Note 17 – Contingencies
The Parent Company’s security provided and guarantee commitments totalled DKK 1,094 million at 31 December 2013 (2012: DKK 1,167 million). The amount relating to the Group totalled DKK 1,135 million at 31 December 2013 (2012: DKK 1,188 million).
Guarantees issued relating to the Group’s Irish companies comprised all liabilities of the companies. At 31 December 2013, the companies had total net liabilities of DKK 132 million (2012: DKK 160 million).
Guarantees issued related to pension commitments in the Group’s companies totalled DKK 856 million at 31 December 2013 (2012: DKK 918 million) of which DKK 414 million (2012: DKK 514 million) has been disclosed as deficits relating to pension schemes in note 15.
The Parent Company had lease obligations of DKK 39 million (2012: DKK 42 million). Of this amount DKK 30 million relates to affiliates (2012: DKK 30 million). Lease obligations relating to the Group totalled DKK 253 million (2012: DKK 318 million).
As security for a bank loan and overdraft facilities at a carrying amount totalling DKK 7,649 million (2012: DKK 4,810 million), as well as the establishment of guarantee commitments at a value of DKK 18 million (2012: DKK 16 million), LEO Pharma A/S has pledged bonds at a carrying amount of 7,565 million (2012: DKK 4,967 million). The amount relating to the Group also totalled DKK 7,565 million (2012: DKK 4,967 million).
At the end of 2013, there are pending patent lawsuits filed by and against LEO Pharma concerning rights related to products in LEO Pharma’s psoriasis portfolio in both the US and Europe. LEO Pharma does not expect the pending cases to have any significant effect on the financial position of the Group.
LEO Pharma A/S will as a global business from time to time have tax audits and tax discussions with tax authorities in different countries regarding transfer pricing issues. Management is of the opinion that current tax audits and tax discussions will have no significant influence on LEO Pharma A/S’ financial position.
Note 18 – Financial instruments
The Group and the Parent Company use both option and forward contracts as part of managing foreign exchange risks.
At 31 December 2013, there are outstanding forward contracts in: AUD, BRL, CAD, CHF, CNH, EUR, GBP, HKD, JPY, KRW, MXN, MYR, NOK, PHP, SAR, SEK, SGD, THB and USD. The total contract amount at 31 December 2013 is DKK1,757 million (2012: DKK 2,509 million).
At 31 December 2013, there are outstanding option contracts in CNH amounting to DKK 182 million. There were no outstanding option contracts at 31 December 2012.
At 31 December 2013, the Group and the Parent Company also have option contracts in the following currencies: CAD, CNH, EUR, GBP, HKD, NZD, RON, SEK, SGD, TRY and USD. At 31 December 2013 the total contract amount is DKK 2,416 million (2012: DKK 2,439 million).
Note 19 – Related parties
LEO Pharma A/S’ related parties with significant influence comprise the Company’s Board of Directors, Executive Board, LEO Fondet and affiliates of LEO Pharma A/S.
LEO Pharma’s related party transactions are all settled on an arm’s length basis.
Nominal capital (Thousand)Reg. office Ownership Currency
Investments in affiliates
Løvens kemiske Fabriks Handelsaktieselskab Denmark 100% DKK 30,000
Aktieselskabet af 30. april 2003 Denmark 100% DKK 3,500
SARL LEO Pharma Algeria 100% DZD 2,000
PBL Australia Pty Ltd. Australia 100% AUD 112,804
Peplin Operations Pty Ltd. Australia 100% AUD 24,000
LEO Pharma Pty Ltd. Australia 100% AUD 5,500
LEO Pharma NV Belgium 100% EUR 273
LEO Pharma LTDA. Brazilia 100% BRL 4,500
LEO Pharma Inc. Canada 100% CAD 8,400
LEO Laboratories Ltd. United Kingdom 100% GBP 12,000
LEO Pharma OY Finland 100% EUR 151
Laboratoires LEO S.A. France 100% EUR 9,000
LEO Pharmaceutical Hellas S.A. Greece 100% EUR 28,600
LEO Pharma BV The Netherlands 100% EUR 227
LEO Laboratories Ltd. Ireland 100% EUR 30,394
Wexport Ltd. Ireland 100% EUR 2,600
LEO Pharma Holding Ltd. Ireland 100% EUR 100
Peplin Ireland Limited Ireland 100% EUR 22,239
LEO Pharma S.p.A. Italy 100% EUR 620
LEO Pharma K.K. Japan 100% JPY 10,000
LEO Pharma Consultancy Company Limited China 100% USD 1,920
LEO Pharma LLC Morocco 100% MAD 100
LEO Pharmaceuticals, S. de R.L. de C.V. Mexico 100% MXN 7,922
LEO Pharma Ltd. New Zealand 100% NZD 85
LEO Pharma AS Norway 100% NOK 3,000
LEO Pharma Sp. z.o.o. Poland 100% PLN 95
LEO Farmacêuticos Lda. Portugal 100% EUR 626
LEO Pharmaceutical Products Sarath Ltd. Switzerland 100% CHF 50
LEO Pharma Asia PTE Ltd. Singapore 100% SGD 100
Laboratorios LEO Pharma S.A. Spain 100% EUR 1,214
LEO Pharma AB Sweden 100% SEK 1,000
Lövens Läkemedel AB Sweden 100% SEK 100
LEO Pharma s.r.o. Czech Republic 100% CZK 350
LEO Pharma SARL Tunisia 100% TND 10
LEO Pharma Ilac Ticaret Anonim Sirketi Turkey 100% TRY 1,300
LEO Pharma GmbH Germany 100% EUR 750
LEO Pharma Inc. USA 100% USD 2,500
Peplin Inc. USA 100% USD 15
LEO Pharma GmbH Austria 100% EUR 76
LEO Pharma Ltd. Korea 100% KRW 1,800,000
LEO Pharmaceutical Products LLC Russia 100% RUB 16,500

LEO Pharma A/SIndustriparken 552750 BallerupDenmark
Tel. +45 44945888www.leo-pharma.com
LEO
® ©
LEO
12
89
5 C
orp
ora
te C
om
mun
icat
ion
s M
AR
20
14
, CV
R 5
6 7
5 9
5 1
4 .
All
LEO
trad
ema
rks
men
tio
ned
in th
is d
ocu
men
t bel
ong
to th
e LE
O G
roup
.