Annual report 2013 - Konecranes · 2018-09-03 · Konecranes annual report 2013 Contents 2...
132
Annual report 2013
Transcript of Annual report 2013 - Konecranes · 2018-09-03 · Konecranes annual report 2013 Contents 2...
www.konecranes.com
Annual report 2013
Ko
nec
ra
nes a
nn
ua
l rep
or
t 2
013
This publication is for general informational purposes only. Konecranes reserves the right at any time, without notice, to alter or discontinue the products and/or specifications referenced herein. This publication creates no warranty on the part of Konecranes, express or implied, including but not limited to any implied warranty or merchantability or fitness for a particular purpose.
© 2014 Konecranes. All rights reserved. 'Konecranes', 'Lifting Businesses', 'TRUCONNECT', 'Agilon', 'SMARTON' and are either registered trademarks or trademarks of Konecranes Plc.
Corporate responsibilityFor corporate responsibility matters please contact [email protected]
Corporate Headquarters
Konecranes PlcP.O. Box 661 (Koneenkatu 8)FI-05801 Hyvinkää, FinlandTel +358 20 427 11Fax +358 20 427 2099
Global Business Area Headquarters
ServiceKonecranes Finland CorporationP.O. Box 662 (Koneenkatu 8)FI-05801 Hyvinkää, FinlandTel +358 20 427 11Fax +358 20 427 4099
Nordic, Eastern Europe and India Konecranes Region NEI P.O. Box 662 (Koneenkatu 8)FI-05801 Hyvinkää, FinlandTel +358 20 427 11Fax +358 20 427 3009
Asia-PacificKonecranes (Shanghai) Co., Ltd.Building 4, No. 100, Lane 2891, South Qilianshan Road Shanghai, 200331, ChinaTel +86 21 2606 1000Fax +86 21 2606 1066
Equipment Konecranes Finland Corporation P.O. Box 662 (Koneenkatu 8)FI-05801 Hyvinkää, FinlandTel +358 20 427 11Fax +358 20 427 3009
Regional Headquarters
AmericasKonecranes, Inc.4401 Gateway Blvd.Springfield, OH 45502, USATel +1 937 525 5533Fax +1 937 322 2832
Western Europe, Middle East and Africa Konecranes Region WEMEAP.O. Box 662 (Koneenkatu 8)FI-05801 Hyvinkää, FinlandTel +358 20 427 11Fax +358 20 427 3009
Konecranes is an industry shaping, global group of dynamic Lifting Businesses™.We are committed to providing our customers with products and services of unrivaled quality, safety, and reliability – and helping improve the efficiency and performance of our customers' business-es. By leveraging our unique know-how and technology, we are able to develop innovative integrated lifting solutions. With our remote services, we can gather real-time information on how our customers’ equipment is performing and help improve operational safety, as well as provide maintenance when it is needed. With solutions that help increase customers’ safety performance and productivity, we are not just lifting things, but entire businesses.

Konecranes annual report 2013
Contents
2Konecranes in a snapshot
42013 Highlights
6CEO’s review
8Chairman’s letter
10Company cornerstones
12Business environment
14Business Area Service
16Business Area Equipment
18Regional overview
20Research & Development
23Product overview
26Corporate responsibility
32GRI
34Corporate governance
44Risk management, internal control, and internal auditing
50Board of Directors
52Group Executive Board
54Senior Management Team
57Financial statements 2013
122Shares & shareholders
126Investor information
128Contact details
1Konecranes 2013Contents
Konecranes is a global industry-leading group of lifting businesses. every-thing we do is targeted at one goal: improving the safety and productivity of our customers’ operations.
Konecranes
In a snapshot
BUSINESS AREAS
ServiceKonecranes offers specialized maintenance services and spare parts for all types and brands of industrial cranes, lifting equipment, and machine tools through a global service network of 600 locations in almost 50 coun-tries.
ProductsKonecranes’ extensive service offering cov-ers inspections, preventive maintenance programs, repairs and improvements, on-call service, spare parts, modernizations, and an array of consultation services.
TRUCONNECT Remote Services lie at the core of Konecranes’ offering and provide a range of information-based services, includ-ing periodic data reporting, real-time diagnos-tics, and remote technical support and pro-duction monitoring.
Market positionKonecranes is the clear market leader in crane service, with the world’s most exten-sive crane service network. The Group is also one of the largest providers of machine tool services.
Service contract baseMore than 430,000 units are covered by Konecranes maintenance contracts. The ma-jority of this equipment has been manufac-tured by companies other than Konecranes. Expert maintenance is provided for any brand of equipment from any manufacturer.
EquipmentBusiness Area Equipment offers compo-nents, cranes, and material handling solu-tions for a wide range of customers, includ-
ing process industries, the nuclear sector, industries handling heavy loads, ports, inter-modal terminals, shipyards, and bulk mate-rial terminals. Products are marketed through a multi-brand portfolio that includes Konecranes and the Group’s power brands: STAHL CraneSystems, SWF Krantechnik, Ver-linde, R&M, and Sanma Hoists & Cranes.
Products Industrial cranes, including industrial crane products, industrial crane solutions, and workstation lifting systems; components, including wire rope hoists, crane kits, electric chain hoists, manual hoists and accessories; nuclear cranes; port cranes; cranes for inter-modal terminals, bulk material unloaders; lift trucks; and shipyard cranes. Konecranes Agilon is a patented materials management solution for managing, storing, picking, and replenishing components that offers im-proved efficiency in material handling.
The product offering features a number of advanced technologies, such as automation and smart features, including sway control, load positioning, and shock load prevention.
Market position Konecranes is the world’s largest supplier of industrial cranes, and a world leader in ex-plosion-protected crane technology. It is also a global leader in electrical overhead trave-ling cranes for process industries and ship-yard gantry cranes; and a strong global sup-plier of cranes and lift trucks for container handling and heavy unitized cargo and bulk material unloading.
Annual production Thousands of standard cranes, tens of thou-sands of wire rope hoists, trolleys, and elec-tric chain hoists, and hundreds of heavy-duty cranes. Hundreds of heavy-duty lift trucks.
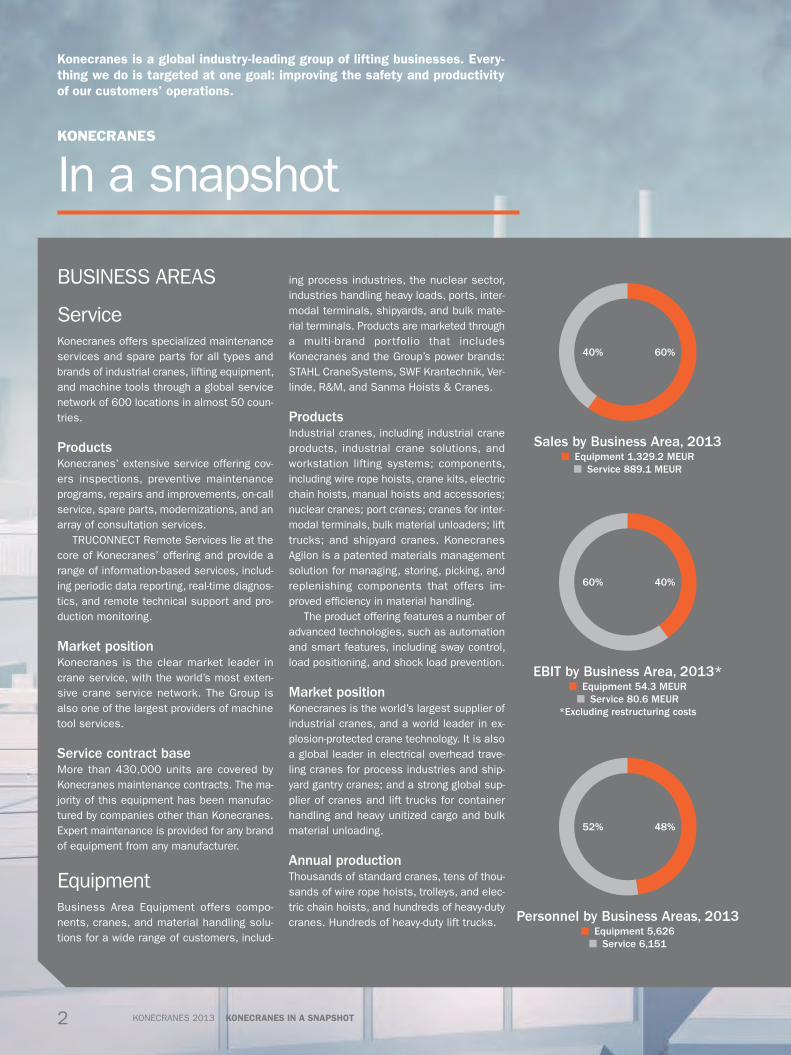
EBIT by Business Area, 2013*■ Equipment 54.3 MEUR ■ Service 80.6 MEUR
*Excluding restructuring costs
Personnel by Business Areas, 2013■ Equipment 5,626 ■ Service 6,151
Sales by Business Area, 2013■ Equipment 1,329.2 MEUR
■ Service 889.1 MEUR
40%
60%
52%
60%
40%
48%
2 Konecranes 2013 KoneCranes in a snapshot

Market leader in industrial cranes and components,
as well as crane service
sales and service in
48 countries
13 countries with
production facilities
One of the largest suppliers of port cranes
and lift trucks
Industry-leading
technology and global modular product platforms
11,800employees in 2013
EUR 2,100 million
of net sales in 2013
head office in hyvinkää
Finland
Listed on nasDaQ oMX helsinki,
Finland
3KONECRANES 2013KoneCranes in a snapshot

2013 HigHligHts
Focus on strategic initiativesChallenging market environment•Demand for maintenance services was
stable overall, with North America con-tinuing to outperform Europe. The slug-gish pace of global economic growth and customers’ hesitancy to make invest-ment decisions impacted demand for new equipment. Equipment orders rose in Asia-Pacific, thanks to a large port automation order from Indonesia, but fell in the Americas and EMEA. Order intake decreased by 2.5 percent in 2013.
•Konecranes’ order book as of the end of the year was 5.2 percent lower than in 2012.
•Net sales decreased by 3.3 percent compared to 2012. While net sales grew slightly in Business Area Service, net sales came in below 2012 in Business Area Equipment, due to a smaller order book at the start of the year and lower order intake during the year.
•The operating margin before restructuring costs was 5.5 percent of sales. Profit-ability improved in Business Area Ser-vice, but declined in Business Area Equipment.
Service outperformed Equipment•Net sales in Business Area Service grew
by 0.6 percent in 2013. The main con-tributors were crane maintenance and spare parts operations in the Americas. The operating margin before restructuring costs was 9.1 percent of sales. Profit-ability improved due to higher volumes and the continued streamlining of opera-tions.
•Net sales in Business Area Equipment were 5.9 percent lower than in 2012. This was mainly attributable to heavy-duty industrial cranes. The operating margin before restructuring costs was 4.1 percent of sales. Profitability was impacted by lower sales, an intense competitive environment, and extra costs related to project deliveries.
New strategic focus areas and restructuring actions•Konecranes clarified and simplified its
strategic focus areas during 2013. The Group’s key strategic initiatives are Industrial Internet, Emerging Markets Offering, and oneKONECRANES.
•Konecranes acquired certain assets from Linde Material Handling, including prod-uct rights and spare parts operations related to container handling lift trucks – and became a long-term supplier of container handling lift trucks to Linde Material Handling’s worldwide distribu-tion network.
•Personnel decreased by 315 as Konecranes expanded actions to improve productivity and reduce costs due to unsatisfactory profitability and the challenging business environment.
•Despite restructuring activities, R&D investments were maintained at 1.2 percent of net sales. Key IT investments also continued, to improve the Group’s operational efficiency and transparency.
•Development of the TRUCONNECT Remote Services offering continued on-schedule. Konecranes’ goal is to offer a full range of remote services, extending from periodic data reporting to real-time diagnostics, technical support, and production monitoring.
•Konecranes introduced the Automated RTG (ARTG) system for container han-dling use. ARTG enables port operators to use their existing yard infrastructure as they switch to automated RTG opera-tion.
•A new crane manufacturing plant was commissioned in Jejuri, India and all manufacturing operations in India were consolidated at the new facility.
4 Konecranes 2013 2013 highlights

Return on capital employed, %
Year end market capitalization*, MEUR * Excluding treasury shares
Year end net debt, MEUR/Gearing, %
■ Net debt ■ Gearing
Return on equity, %
EBIT, MEUR/EBIT margin, %* Excluding restructuring costs
Year-end net working capital, MEUR
Sales/orders, MEUR■ Sales ■ Order intake
09 10 11 12 13
09 10 11 12 13
09 10 11 12 13
09 10 11 12 13
09 10 11 12 13
09 10 11 12 13
09 10 11 12 13
09 10 11 12 13
09 10 11 12 13
1,3
48
.91
,67
1.3
1,5
36
.01
,54
6.3
1,8
96
.11
,89
6.4
1,9
70
.12
,17
1.5
1,9
20
.82
,09
9.6
10%
8%
6%
4%
2%
0%
11
8.8
*
11
5.1
*
11
7.2
*
13
8.3
*
11
5.5
*
Order book, MEUR
60
7.0 75
6.2
99
1.8
94
2.7
89
3.5
0.9
01.0
8
1.0
01
.35
1.0
01.1
1
1.0
51
.47
0.8
5 1.0
5*
Earnings & dividend per share, EUR
■ Earnings per share, basic■ Dividend per share
* The Board’s proposal to the AGM
15
.5
13
8.8 1
91
.6
32
0.0
29
5.5
28
9.4
-77
.7-1
9.1
-17
.4-3
.81
8.1
14
.6
18
.8
10
.9
19
.3
24
.2
17
.1 18
.4
11
.6
50
.52
19
.8
39
.31
81
.8
42
.11
87
.3
1,1
22
.1
1,8
21
.3
83
1.7
1,4
63
.8
1,4
95
.4
5Konecranes 2013 2013 highlights
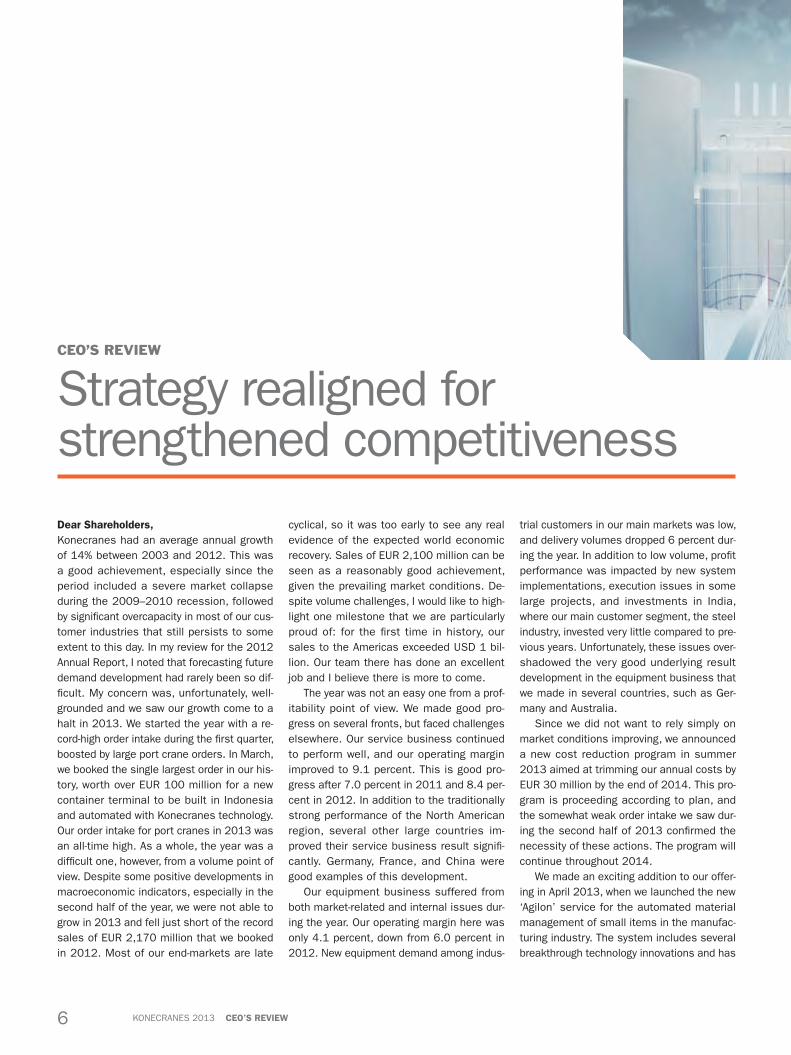
Dear shareholders, Konecranes had an average annual growth of 14% between 2003 and 2012. This was a good achievement, especially since the period included a severe market collapse during the 2009–2010 recession, followed by significant overcapacity in most of our cus-tomer industries that still persists to some extent to this day. In my review for the 2012 Annual Report, I noted that forecasting future demand development had rarely been so dif-ficult. My concern was, unfortunately, well-grounded and we saw our growth come to a halt in 2013. We started the year with a re-cord-high order intake during the first quarter, boosted by large port crane orders. In March, we booked the single largest order in our his-tory, worth over EUR 100 million for a new container terminal to be built in Indonesia and automated with Konecranes technology. Our order intake for port cranes in 2013 was an all-time high. As a whole, the year was a difficult one, however, from a volume point of view. Despite some positive developments in macroeconomic indicators, especially in the second half of the year, we were not able to grow in 2013 and fell just short of the record sales of EUR 2,170 million that we booked in 2012. Most of our end-markets are late
cyclical, so it was too early to see any real evidence of the expected world economic recovery. Sales of EUR 2,100 million can be seen as a reasonably good achievement, given the prevailing market conditions. De-spite volume challenges, I would like to high-light one milestone that we are particularly proud of: for the first time in history, our sales to the Americas exceeded USD 1 bil-lion. Our team there has done an excellent job and I believe there is more to come.
The year was not an easy one from a prof-itability point of view. We made good pro-gress on several fronts, but faced challenges elsewhere. Our service business continued to perform well, and our operating margin improved to 9.1 percent. This is good pro-gress after 7.0 percent in 2011 and 8.4 per-cent in 2012. In addition to the traditionally strong performance of the North American region, several other large countries im-proved their service business result signifi-cantly. Germany, France, and China were good examples of this development.
Our equipment business suffered from both market-related and internal issues dur-ing the year. Our operating margin here was only 4.1 percent, down from 6.0 percent in 2012. New equipment demand among indus-
trial customers in our main markets was low, and delivery volumes dropped 6 percent dur-ing the year. In addition to low volume, profit performance was impacted by new system implementations, execution issues in some large projects, and investments in India, where our main customer segment, the steel industry, invested very little compared to pre-vious years. Unfortunately, these issues over-shadowed the very good underlying result development in the equipment business that we made in several countries, such as Ger-many and Australia.
Since we did not want to rely simply on market conditions improving, we announced a new cost reduction program in summer 2013 aimed at trimming our annual costs by EUR 30 million by the end of 2014. This pro-gram is proceeding according to plan, and the somewhat weak order intake we saw dur-ing the second half of 2013 confirmed the necessity of these actions. The program will continue throughout 2014.
We made an exciting addition to our offer-ing in April 2013, when we launched the new ‘Agilon’ service for the automated material management of small items in the manufac-turing industry. The system includes several breakthrough technology innovations and has
ceo’s review
Strategy realigned for strengthened competitiveness
6 Konecranes 2013 Ceo’s review
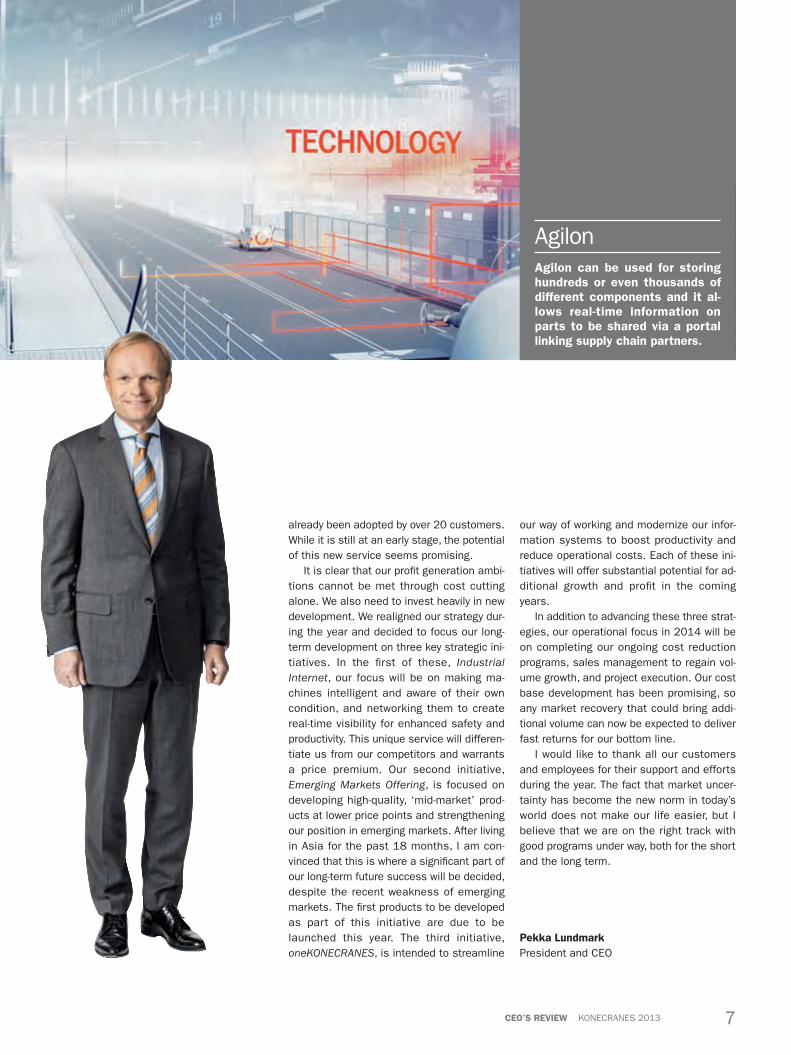
Agilonagilon can be used for storing hundreds or even thousands of different components and it al-lows real-time information on parts to be shared via a portal linking supply chain partners.
already been adopted by over 20 customers. While it is still at an early stage, the potential of this new service seems promising.
It is clear that our profit generation ambi-tions cannot be met through cost cutting alone. We also need to invest heavily in new development. We realigned our strategy dur-ing the year and decided to focus our long-term development on three key strategic ini-tiatives. In the first of these, Industrial Internet, our focus will be on making ma-chines intelligent and aware of their own condition, and networking them to create real-time visibility for enhanced safety and productivity. This unique service will differen-tiate us from our competitors and warrants a price premium. Our second initiative, Emerging Markets Offering, is focused on developing high-quality, ‘mid-market’ prod-ucts at lower price points and strengthening our position in emerging markets. After living in Asia for the past 18 months, I am con-vinced that this is where a significant part of our long-term future success will be decided, despite the recent weakness of emerging markets. The first products to be developed as part of this initiative are due to be launched this year. The third initiative, oneKONECRANES, is intended to streamline
our way of working and modernize our infor-mation systems to boost productivity and reduce operational costs. Each of these ini-tiatives will offer substantial potential for ad-ditional growth and profit in the coming years.
In addition to advancing these three strat-egies, our operational focus in 2014 will be on completing our ongoing cost reduction programs, sales management to regain vol-ume growth, and project execution. Our cost base development has been promising, so any market recovery that could bring addi-tional volume can now be expected to deliver fast returns for our bottom line.
I would like to thank all our customers and employees for their support and efforts during the year. The fact that market uncer-tainty has become the new norm in today’s world does not make our life easier, but I believe that we are on the right track with good programs under way, both for the short and the long term.
pekka lundmark President and CEO
7Konecranes 2013Ceo’s review

Dear Fellow shareholders,2013 was a difficult year for our Group. The world economy, and Europe’s in particular, continued to struggle. In China, for many years the industrial locomotive of the world, the change of leadership took a toll on the economy.
Of course, the picture was not entirely gloomy. In the US, the government, through decisive and well-timed actions, returned the economy to a growth track. In Asia and in Africa, there were also pockets of healthy growth.
It is obvious that in this environment our Group was forced to fight hard for every or-der, be vigilant to seize every opportunity, and defend our positions. Our equipment business had to fight a worldwide battle to win orders. In relative terms, we were suc-cessful, but running projects in previously unknown, new environments taxed the profit-ability of our equipment business.
Our profits were also impacted by several costly Group-wide projects that I believe will enhance our profit capacity in the future.
Our Service business continued to de-velop well, in accordance with the Group’s long-term strategy. While the economy overall did not support investments, our Service ac-tivity was able to post both growth and im-proved profitability.
I therefore feel proud to report that we managed to maintain our total sales level on last year’s level. Our operating profit also re-mained on last year’s level, but one-time items had a serious impact. In the stock market, we were able to defend the market value of our stock reasonably well. We did not succeed, however, in growing the value of our stock. Our dividend capacity remained intact.
In this situation, your Board of Directors did not revert only to cost-cutting. Certainly, capacity must always be trimmed to stay on
cHairman´s letter
Well positioned for future growth and profitability
8 Konecranes 2013 ChairMan’s letter
move has greatly improved our top manage-ment’s understanding of the requirements of the Asia-Pacific region.
We are now taking the next steps in win-ning market share in Asia. Originally, we en-tered the markets there, not with a scaled-down product portfolio, but with an offering reflecting our best available corporate tech-nology. Through this policy, we earned a mar-ket position as a premium producer, with a high level of desirability.
We are now in the process of broadening our product portfolio. With our premium port-folio, as successful as it has been, we can only reach top market segments. The Group is now creating a new range of products, tar-geted towards the mid segment of emerging markets. We will not scale down on safety and performance, but given our good produc-tion presence in low-cost China and India, we believe we will be in a position to offer a high-performance, yet competitively priced range. We will position our new range care-fully on the market, in order not to cannibal-ize our premium segment.
Our long-standing initiative of linking cus-tomer equipment through the internet to our maintenance base (‘internet of things’) is progressing well. With over 5,000 separate installations on line, we have been able to prove the benefit of this approach to our cus-tomers: fast adequate service, for the lowest
cost and best equipment availability. In short: improving our customers’ profitability.
Fellow shareholders, let me end this letter on a positive note. Our American business has continued to develop extremely well. When I started my career in the Group in 1982, our sales in America amounted to USD 14 million. In 2013, our sales in Amer-ica reached USD 1 billion. We owe our Amer-ican team a deeply felt thank-you-so-much and our congratulations. We wish them all a good journey on their way to reaching the USD 2 billion mark.
2013 was not an easy year, not for the world economy and not for the Group. We were able to hold on to our positions, and we completed a number of actions putting us into a position for future growth and growing profits.
My special thanks go to our dedicated workforce. During the year, the number of employee shareholders reached 1,761, i.e. approximately 15% of our total workforce. I cannot think of any better proof of the good spirit in all of our companies, around the globe.
I also want to thank our loyal sharehold-ers and to say welcome to all our new ones.
stig gustavsonChairman of the Board
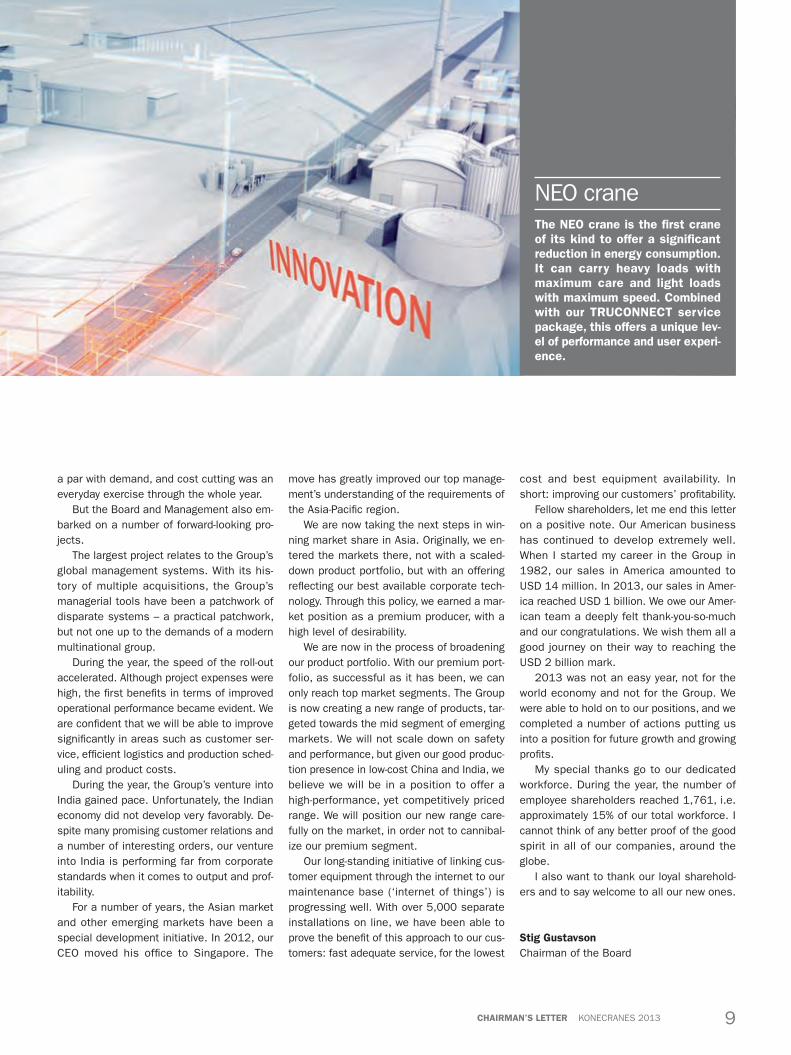
NEO cranethe neo crane is the first crane of its kind to offer a significant reduction in energy consumption. it can carry heavy loads with maximum care and light loads with maximum speed. Combined with our trUConneCt service package, this offers a unique lev-el of performance and user experi-ence.
a par with demand, and cost cutting was an everyday exercise through the whole year.
But the Board and Management also em-barked on a number of forward-looking pro-jects.
The largest project relates to the Group’s global management systems. With its his-tory of multiple acquisitions, the Group’s managerial tools have been a patchwork of disparate systems – a practical patchwork, but not one up to the demands of a modern multinational group.
During the year, the speed of the roll-out accelerated. Although project expenses were high, the first benefits in terms of improved operational performance became evident. We are confident that we will be able to improve significantly in areas such as customer ser-vice, efficient logistics and production sched-uling and product costs.
During the year, the Group’s venture into India gained pace. Unfortunately, the Indian economy did not develop very favorably. De-spite many promising customer relations and a number of interesting orders, our venture into India is performing far from corporate standards when it comes to output and prof-itability.
For a number of years, the Asian market and other emerging markets have been a special development initiative. In 2012, our CEO moved his office to Singapore. The
9Konecranes 2013ChairMan’s letter

not just lifting things, but entire businesses.
company cornerstones
Key strategic initiatives steer investments for the future
Trust in peopleWe want to be known for our great people.
Total service commitmentWe want to be known for always keeping our promises.
Sustained profitabilityWe want to be known as a financially sound company.
we know in real time how millions of lifting devices and machine tools perform.we use this knowledge around the clock to make our customers’ operations safer and more productive.
Values
Vision
Mission
10 Konecranes 2013 CoMpany Cornerstones

People and societyGeneration Y behaves differently. They are IT savvy, and may seek a different work/life bal-ance, challenge leaders of companies and countries and expect ethical behaviour, includ-ing good governance and workplace safety.
World demographicsUrbanization, new megacities, reverse brain drain with talent returning to emerging coun-tries. The age pyramid favors emerging coun-tries over Western countries. Emerging mar-kets will represent a major part of the world’s growth.
TechnologyAdvances in data analytics, automation, sen-sors, wireless networking and nanotechnology are enabling intelligent ‘self-aware’ machines.
Energy and environmentThe need to save energy, find new sources of energy, control emissions and develop clean energy. Environmental awareness is also grow-ing in emerging markets; waste of any kind is increasingly unacceptable.
Megatrends
Key strategic initiatives
Industrial InternetWe make machines intelligent and aware of their condition, and net-work them to create real-time visi-bility for enhanced safety and pro-ductivity. This unique service that we offer our customers differenti-ates us from our competitors and warrants a price premium.
Emerging Markets OfferingWe develop ‘mid-market’ products with high quality but lower price points, and strengthen our position in emerging markets.
oneKONECRANESWe streamline our way of working and modernize our information sys-tems to boost productivity and lower our cost level.
11Konecranes 2013CoMpany Cornerstones

Business environment
Service demand stable, equipment orders affected by modest economic growth
the world’s manufacturing sector activity increased modestly in 2013, but gained steam towards the end of the year. activity remained strong in the Us, but stayed sluggish in the eurozone. in emerging markets, economic growth was lower than expected and did not provide the anticipated impetus to the global economy.
World manufacturing industry activityIn terms of macroeconomic development, 2013 was very similar to 2012, as the US outperformed most other regions. US eco-nomic activity in the manufacturing sector, measured by the purchasing managers’ in-dex (PMI), increased throughout most of the year, and even improved during the second
half. US manufacturing capacity utilization was relatively stable compared to 2012.
PMI surveys showed that Eurozone manu-facturing activity was depressed during the first half of the year, but expanded slightly during the second half. Although this expan-sion was modest, it was generally interpreted as marking a potential turning-point, as it followed a period of contraction over the pre-vious two years. Manufacturing capacity uti-
lization in the European Union was below 2012 on average, but relatively stable com-pared to the second half of 2012. Some signs of a small uptick could be observed towards the end of 2013.
Following a slowdown in 2012, economic growth in emerging markets was expected to accelerate and provide an impetus to the global economy in 2013. Purchasing manag-ers’ indexes in Brazil, Russia, India, and
12 Konecranes 2013 BUsiness environMent

China (BRIC countries) signaled an expan-sion of industrial output at the beginning of 2013. PMIs in BRIC countries lost momen-tum by mid-year, however, leading to down-graded growth forecasts. Chinese PMI data again pointed to a slow rise in manufacturing output towards the end of the year, but there were few signs of this in the real economy.
Overall, manufacturing sector activity worldwide, according to the aggregated JPMorgan Global Manufacturing PMI, in-creased modestly in 2013, but remained below the long-term survey average.
Demand for lifting equipment and servicesCompared to 2012, demand for lifting equip-ment among industrial customers decreased globally in 2013. Demand for process cranes was particularly weak due to a lower level of investment in the mining & metals and pulp
& paper industries. Geographically, demand remained weak in Western Europe, China, and India. In North America, demand for in-dustrial cranes fell back after the solid pro-gress seen in 2012, while demand for crane components remained stable. Demand de-velopment was positive in the Middle East.
Global container traffic grew by approxi-mately 3 percent in 2013, and project activ-ity with container ports was satisfactory. Or-ders for new automated port solutions were lower compared to 2012, as several new automated container terminals were already under construction. Geographically, the most active markets were North America, South-east Asia, Australia, and Africa. Demand was sluggish in Europe, in contrast. Demand for shipyard cranes continued to be concentrat-ed in Brazil.
Overall demand for lifting equipment ser-vices was stable, with regional developments reflecting differences in industrial production
Konecranes’ global market positions:
•Marketshareof16percent•#1incranemaintenanceservices•#1inindustrialcranes&components•#3–5inportcranes•#2–4inlifttrucks.
growth rates. In terms of the largest markets for these services, demand increased in North America while European demand was stable. Demand fell in Asia-Pacific. Within emerging markets, the Middle East and Af-rica saw the strongest growth.
The trend in steel and copper prices re-mained downward in 2013. After relatively stable development during the first half of the year, the euro appreciated somewhat against the US dollar during the second half.
13Konecranes 2013BUsiness environMent

Business area service
Value-added technologies and expertiseWith 600 locations in almost 50 countries, Konecranes has the largest service network in the industry. Service customers operate in a variety of industrial environments, from re-pair shops and general manufacturing sites to paper and steel mills, power plants, and ports.
All aspects of the Konecranes service of-fering are designed to improve the safety and productivity of customers’ businesses. Konecranes’ specialized maintenance ser-vices range from inspection of a single piece of equipment to completely outsourced crane maintenance and operations. Services are bundled into tailor-made programs designed to meet the unique needs of each customer.
A commitment to usage-based mainte-nance and real-time service supports Konecranes’ Industrial Internet key strategic initiative, supported by sustained invest-ments in new technologies.
Stable demand for lifting equipment services Leading industrial companies continued to invest in improving safety and productivity
during 2013, two areas that are the core of Konecranes Service offering. As a result, overall demand for lifting equipment services remained stable throughout the year.
North America continued to act as a key driver for Business Area Service, both in terms of growth and profitability. The resur-gence of the local oil & gas industry was a key factor here, and the automotive sector was also a strong contributor. Developments were also positive in South America; Chile continues to be a strong market for Konecranes and operations are expanding in Brazil.
Europe showed encouraging early signs of an upswing, with Germany being the big-gest driver.
The Middle East and Africa, while still at an early stage in terms of service demand, showed clear signs of growth. There is also upside potential for Konecranes in China, where efforts are being focused on seg-ments that appreciate the benefits of preven-tive maintenance, a reliable source of quality spare parts, technical expertise and cus-tomer service. Konecranes is also optimistic
about future opportunities in Japan and Southeast Asia.
Business Area Service continued to prior-itize profitability over growth during 2013, and recorded steady financial development. With a focus on operational improvements, cost control, market segmentation, and pric-ing, the Business Area recorded improved profitability despite only minor top-line growth. Both the annual value of the mainte-nance contract base and the number of pieces of equipment covered increased com-pared to the end of 2012.
New technologies and broader scope of servicesBusiness Area Service continued to launch new technologies and broaden the scope of its services during 2013.
operational improvements continued in line with the Group’s oneKONECRANES key strategic initiative and the roll-out of various new systems.
Konecranes Business area service offers a comprehen-sive range of service products, maintenance programs, spare parts, and modernization options for all brands and makes of industrial overhead cranes, port equip-ment, and machine tools. Despite continued uncertain-ty in the world economy in 2013, there were positive developments in all of Konecranes’ markets, creating demand for lifting equipment services.
14 Konecranes 2013 BUsiness area serviCe

Key figuresproportion
of group total, % 2013 2012
Change, %
Orders received, MEUR 35 715.9 735.0 -2.6
Order book, MEUR 14 128.1 147.2 -12.9
Net sales, MEUR 40 889.1 884.0 0.6
Operating profit (EBIT), excluding restructuring costs, MEUR 60 80.6 74.6 8.0
Operating margin (EBIT), excluding restructuring costs,% 9.1% 8.4%
Operating profit (EBIT), MEUR 64 67.8 74.6 -9.1
Operating margin (EBIT), % 7.6% 8.4%
Personnel at the end of period 52 6,151 6,119 0.5
Optimized operations and increased productivity with TRUCONNECT Remote Services The scope of the TRUCONNECT Remote Services family, which provides real-time usage and condition monitoring of customers’ equipment, was further extended during 2013.•trUConneCt remote Monitoring and reporting for industrial cranes and lift
trucks is now available in most of Konecranes’ markets, and there are now more than 5,000 active connections worldwide.
•trUConneCt remote support and Diagnostics is used by customers around the globe in a number of critical process applications. Konecranes’ experts pro-vide remote technical support for these customers on a daily basis.
•trUConneCt production efficiency, designed for machine tools, has been rolled out at various pilot locations. Development work is continuing, with additional products being adapted to work with popular brands of machine tool controls.
Read more about remote services www.konecranes.com/service/crane-remote-services
Konecranes’ new CrM system is now in use across all service units, and the Mainte-nance Management system has been de-ployed in three pilot countries, with major rollouts scheduled for 2014.
Business area service continued to ex-plore business models tailored to the needs of emerging markets. Customer feedback has shown that price is not the only pur-chase criterion in these markets. An increas-ing number of customers in these countries appreciate Konecranes’ preventive mainte-nance approach and new technologies, in-cluding the added value offered by remote services.
Development of the trUConneCt offer-ing continued on-schedule. Konecranes’ goal is to offer a full range of remote ser-vices, ranging from periodic data reporting to real-time diagnostics, technical support, and production monitoring. The TRUCONNECT product family has been well-received, not only as a technology platform, but also be-cause of the access it gives customers to the expertise of Konecranes’ people. The momentum behind this approach will con-tinue into 2014, as Konecranes builds on the foundation of real-time service and the Indus-trial Internet. Further growth and improved customer experience through the strategic release of new services and products can be expected.
a large and ongoing effort is under way aimed at supporting global customers throughout the entire lifecycle of their prod-ucts with customized service programs that are unique to the industry.
Advanced service offeringintelligent, self-aware machines are opening up the way for new service concepts. For us, this translates into things like real-time condition monitoring and an increasingly advanced service of-fering.
15Konecranes 2013BUsiness area serviCe
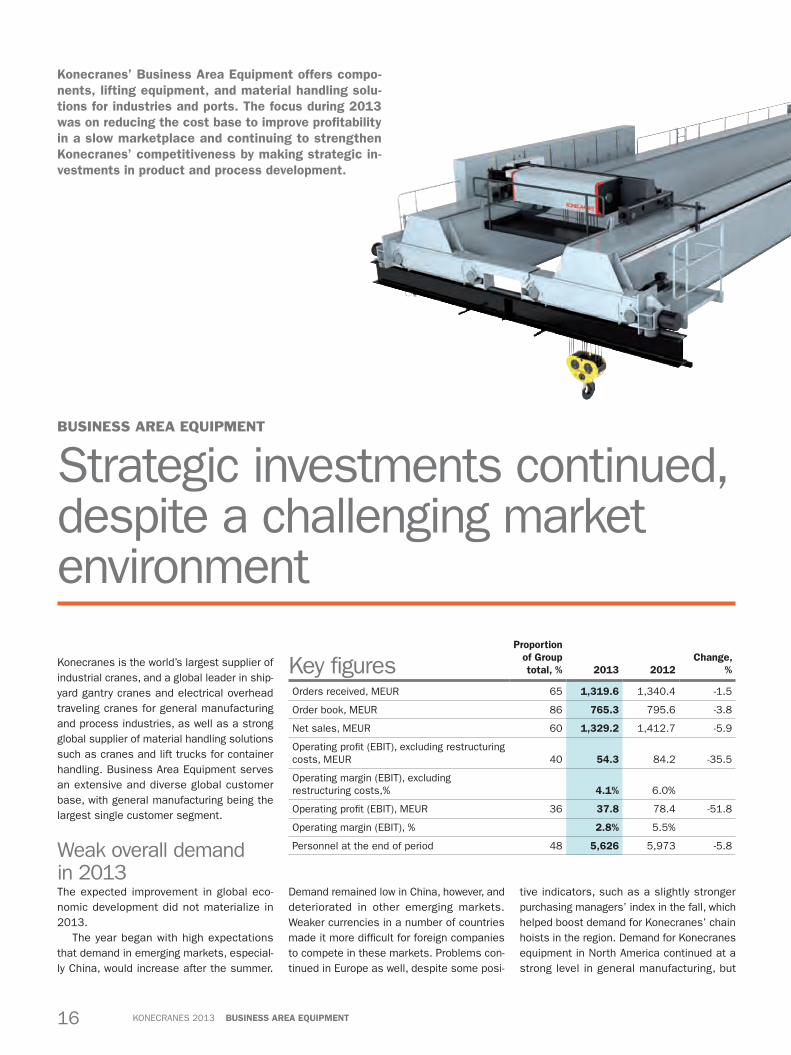
Key figuresproportion
of group total, % 2013 2012
Change, %
Orders received, MEUR 65 1,319.6 1,340.4 -1.5
Order book, MEUR 86 765.3 795.6 -3.8
Net sales, MEUR 60 1,329.2 1,412.7 -5.9
Operating profit (EBIT), excluding restructuring costs, MEUR 40 54.3 84.2 -35.5
Operating margin (EBIT), excluding restructuring costs,% 4.1% 6.0%
Operating profit (EBIT), MEUR 36 37.8 78.4 -51.8
Operating margin (EBIT), % 2.8% 5.5%
Personnel at the end of period 48 5,626 5,973 -5.8
Business area equipment
Strategic investments continued, despite a challenging market environment
Konecranes is the world’s largest supplier of industrial cranes, and a global leader in ship-yard gantry cranes and electrical overhead traveling cranes for general manufacturing and process industries, as well as a strong global supplier of material handling solutions such as cranes and lift trucks for container handling. Business Area Equipment serves an extensive and diverse global customer base, with general manufacturing being the largest single customer segment.
Weak overall demand in 2013 The expected improvement in global eco-nomic development did not materialize in 2013.
The year began with high expectations that demand in emerging markets, especial-ly China, would increase after the summer.
Demand remained low in China, however, and deteriorated in other emerging markets. Weaker currencies in a number of countries made it more difficult for foreign companies to compete in these markets. Problems con-tinued in Europe as well, despite some posi-
tive indicators, such as a slightly stronger purchasing managers’ index in the fall, which helped boost demand for Konecranes’ chain hoists in the region. Demand for Konecranes equipment in North America continued at a strong level in general manufacturing, but
Konecranes’ Business area equipment offers compo-nents, lifting equipment, and material handling solu-tions for industries and ports. the focus during 2013 was on reducing the cost base to improve profitability in a slow marketplace and continuing to strengthen Konecranes’ competitiveness by making strategic in-vestments in product and process development.
16 Konecranes 2013 BUsiness area eQUipMent

Intelligent machinesour intelligent artg and sMar-ton cranes have several hun-dreds of control and measure-ment points to be used for ad-vanced analytics. that’s a lot of intelligence in a crane that can be used to improve the safety and productivity of our customers, es-pecially if combined with fast data networks and data analyt-ics.
Product range•Lifting equipment for industrial use•Container handling solutions•Cranes for shipyards•High-capacity grab unloaders for
bulk material terminals •Material handling equipment for
nuclear power plants•Agilon materials inventory and
management system
See page 23 for product overviews.
Most important customer segments•General manufacturing •Ports•Shipyards•Energy •Mining•Automotive•Steel•Pulp & paper•Nuclear• Intermodal & rail•Oil & gas
was weak in process industries. Demand in the container handling segment was stable, but the number of new larger automation projects started was lower than in 2012.
Given these difficult market conditions, Business Area Equipment’s financial perfor-mance was weaker than in 2012. Lower-than-expected orders led to reduced sales and profitability. Profitability was also impacted by various project execution-related issues.
Key strategic initiatives will guide future success While continuing measures to reduce its cost base, Business Area Equipment also prior-itized product and process development within the framework of Konecranes’ three group-level key strategic initiatives: Indus-trial Internet, Emerging Markets Offering, and oneKONECRANES.
an automated rtg (artg) system for the container handling industry was intro-duced. This offers RTG terminal operators operational cost savings, greater productivity, and increased safety – and is a good exam-ple of the type of pioneering technology that is widening the gap between Konecranes and the competition.
agilon, a new innovative materials man-agement solution, was also launched. This service solution consists of a net portal, a shelving system, and a robot that picks parts, brings them to a service point, and sends refill orders to the supplier. Several
Konecranes customers in Finland were using Agilon by the end of 2013, and the system’s future opportunities are very promising.
the neo crane, an upgraded CXt stand-ard crane, was introduced in Germany. This high-technology crane features new motor technology and remote monitoring as stand-ard. NEO is sold with a TRUCONNECT main-tenance contract, which has proved an attrac-tive package. Development work is continuing, aimed at adding further intelli-gent features. Moving forward, the plan is to introduce the NEO crane in other markets.
Konecranes’ new crane manufacturing plant in Jejuri, india was commissioned in April and all manufacturing operations in In-dia have now been consolidated at the new facility. In addition to the Indian market, the plant is well-placed to serve other markets in Asia, the Middle East, and Africa.
several completely new product families are being developed for emerging market needs, as these markets will account for a major share of the world’s future industrial growth. Konecranes’ offering for customers in emerging markets will remain a key area of development work over the next few years.
group-wide harmonization of processes continued, with a particular emphasis on the new ERP system. This is already being used in the US and will soon be launched in Eu-rope and elsewhere.
17Konecranes 2013BUsiness area eQUipMent
8Production
sites
140Sales & service
SALES LOCATIONS
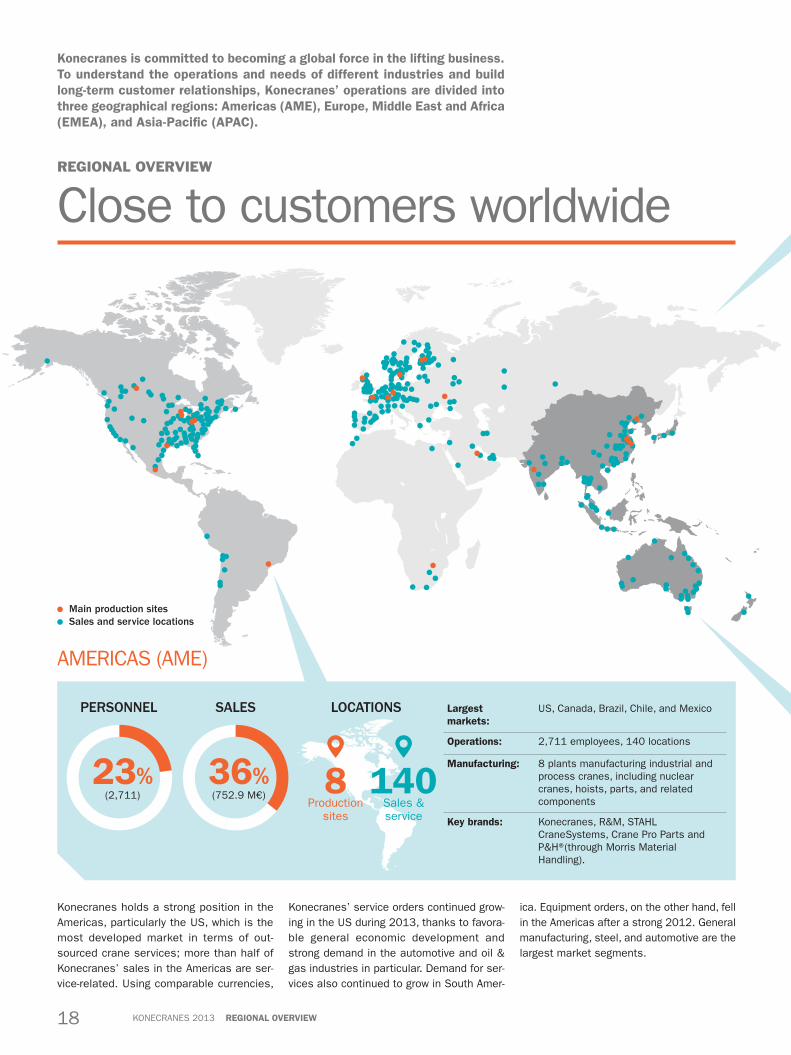
AMERICAS (AME)
PERSONNEL largest markets:
US, Canada, Brazil, Chile, and Mexico
operations: 2,711 employees, 140 locations
Manufacturing: 8 plants manufacturing industrial and process cranes, including nuclear cranes, hoists, parts, and related components
Key brands: Konecranes, R&M, STAHL CraneSystems, Crane Pro Parts and P&H® (through Morris Material Handling).
Konecranes holds a strong position in the Americas, particularly the US, which is the most developed market in terms of out-sourced crane services; more than half of Konecranes’ sales in the Americas are ser-vice-related. Using comparable currencies,
regional overview
Close to customers worldwide
Konecranes’ service orders continued grow-ing in the US during 2013, thanks to favora-ble general economic development and strong demand in the automotive and oil & gas industries in particular. Demand for ser-vices also continued to grow in South Amer-
ica. Equipment orders, on the other hand, fell in the Americas after a strong 2012. General manufacturing, steel, and automotive are the largest market segments.
23%(2,711)
36%(752.9 M€)
Konecranes is committed to becoming a global force in the lifting business. to understand the operations and needs of different industries and build long-term customer relationships, Konecranes’ operations are divided into three geographical regions: americas (aMe), europe, Middle east and africa (eMea), and asia-pacific (apaC).
Main production sites Sales and service locations
18 Konecranes 2013 regional overview

Konecranes is recognized as the technology leader in the Asia-Pacific region, and is the market leader in industrial cranes and crane service, with a strong and growing position in lift trucks and port cranes. Overall, the majority of Konecranes’ APAC sales come from equipment, although the service busi-ness exceeds equipment in more mature markets such as Australia.
SALES LOCATIONS
ASIA-PACIFIC (APAC)
PERSONNEL largest markets:
China, India, Australia, and Indonesia
operations: 2,875 employees, 113 locations
Manufacturing: 5 plants, including joint ventures, manufacturing hoists, industrial cranes, lift trucks, and port cranes
Key brands: Konecranes, STAHL CraneSystems, SWF Krantechnik, Verlinde, and Sanma Hoists & Cranes.
5Production
sites
10Production
sites
113Sales & service
347Sales & service
SALES LOCATIONS
EUROPE, MIDDLE EAST AND AFRICA (EMEA)
PERSONNEL largest markets:
Germany, the UK, France, Finland, Sweden, Russia, Poland, Austria, the UAE, Saudi Arabia, Egypt, South Africa, Nigeria, and Morocco
operations: 6,246 employees, 347 locations
Manufacturing: 10 plants manufacturing cranes and hoists, lift trucks, and steel structures for larger cranes
Key brands: Konecranes, STAHL CraneSystems, SWF Krantechnik, and Verlinde.
EMEA is Konecranes’ largest region and com-prises both mature markets, with a high pro-portion of service sales, and fast-growing economies where service is still small com-pared to equipment sales.
In the mature Western European and Nor-dic markets, the customer focus is primarily on enhancing efficiency and productivity in material handling to offset high labor costs. Konecranes has a very strong market posi-tion in the Nordic countries and an extensive customer base in both equipment and ser-vice. In Eastern Europe, Konecranes has
continued to improve its position across both its key business areas. Manufacturing activ-ity in the region was slow during the first half of 2013, but improved slightly towards the end of the year. Equipment and Service or-ders received in 2013 were lower than in 2012. The largest market segments are gen-eral manufacturing, power, waste-to-energy, automotive, and steel.
The Middle East continues to show high potential, with large investments taking place in infrastructure, petrochemicals, and power. Demand is developing positively, as there is
a high level of interest across the region in Konecranes’ equipment and service offer-ings.
Demand in Africa is growing, with many countries continuing to invest in ports and other infrastructure. Equipment accounts for a high percentage of sales, primarily related to logistics and mining. Demand for services is still relatively small, but showing definite signs of growth. Strong overall development continued in Africa during 2013.
Compared to 2012, the overall demand for lifting equipment in APAC was weaker dur-ing 2013. Economic growth in India and China continued to slow, as did the Austral-ian economy. South-East Asian countries of-fered Konecranes more opportunities than in 2012, however.
Konecranes’ equipment orders in APAC grew in 2013, mainly due to a large port crane
order received from Indonesia. Other equip-ment and service orders declined slightly com-pared to 2012.
General manufacturing remains the larg-est customer segment. Paper, power, steel, ports, waste-to-energy, and mining, especial-ly in Australia, are the other major areas.
24%(2,875)
53%(6,246)
47%(979.8 M€)
17%(366.9 M€)
19Konecranes 2013regional overview

researcH & development
Creating real-time visibility using the Industrial Internet
Award-winning chain hoist seriesresearch work for the red Dot award winning chain hoist series started already in 2008 and fo-cused strongly on ergonomics and user interface. therefore us-ers were involved during the whole design process.
Konecranes is committed to continuously developing its equipment and service offering by making innovative use of the latest technology. the main focus of r&D activities during 2013 was on developing Konecranes' offering to provide real-time visibility for equipment and advanced predictive main-tenance.
Konecranes’ service contract base covers almost 440,000 items of equipment sup-plied by Konecranes and other manufactur-ers, and it represents an important source of input for Konecranes' product develop-ment work. 3,993 service personnel around the world and close to 1.6 million customer contacts annually give Konecranes a thor-ough understanding of its customers’ needs.
Konecranes is continuing to invest in product development to further strengthen its competitiveness. Research and product development expenditure in 2013 totaled
EUR 25.6 million (25.8), equivalent to 1.2 (1.2) percent of net sales.
Konecranes’ focus on research and inno-vation has been strengthened by establish-ing a specialized Research & Innovation (R&I) function.
Industrial Internet is a key development area Konecranes’ R&D work aims at developing efficient products and services that increase customers’ productivity while prioritizing
safety and the environment. Making ma-chines intelligent and networking them to provide real-time visibility on their status has been one of Konecranes’ most important development areas over the last few years. The Industrial Internet was defined as one of Konecranes' three key strategic initiatives in 2013, and extensive development work was concentrated in this area.
TRUCONNECT Remote Services, launched in 2011, is an important area related to the Industrial Internet. The scope of TRUCON-NECT services was extended in 2013, and
20 Konecranes 2013 researCh & DevelopMent

Industrial designIndustrial design forms an important part of Konecranes’ prod-uct design process and helps differentiate the Konecranes brand. High standards of industrial design also allow Konecranes to incorporate greater efficiency, user-friendliness, cost savings, and new materials into its products.
SafetyIn addition to state-of-the-art technology, safety is always a key area of focus for Konecranes. Preventing both injuries and damage to loads are top priorities in research and product development. TRUCONNECT Remote Services, active, sensor-based safety features, shock load elimination, and sway con-trol features are just some examples of Konecranes’ innovative solutions to improve safety.
ProductivityKonecranes develops efficient products and services that in-crease the productivity of its customers’ operations by deliver-ing the best life cycle value. Konecranes’ smart solutions make cranes much easier to handle by simplifying difficult maneuvers, eliminating load sway, and helping position loads in predefined locations. TRUCONNECT Remote Services help optimize maintenance by enabling it to be based on actual crane usage.
Environmental issuesEnvironmental issues are taken into account throughout the life cycles of Konecranes’ products. Particular attention is given to things such as efficient material usage, recyclability, and energy efficiency. Over 98 percent of the material used in a typical Konecranes crane is recyclable. Energy-saving fre-quency converter technology is available with Konecranes equipment and enables up to 70 percent of braking energy to be fed back into the network.
Key priorities of Konecranes’ R&D work
21Konecranes 2013researCh & DevelopMent

the size of the equipment base covered by remote monitoring and service grew rapidly. Analysis of the data collected and making efficient use of it represent an important re-source for future development work.
New products and services featuring ad-vanced technology introduced in 2013 in-cluded Agilon, an innovative materials man-agement solution, and the CXT NEO crane, a high-technology crane package specially de-signed for developed markets. Agilon is a patented materials inventory and manage-ment system that rapidly and automatically stores, picks, and replenishes items weigh-ing up to 25 kg, using a robot to handle both component transfers and refill orders. The CXT NEO crane package includes a number of advanced features and TRUCONNECT re-mote monitoring equipment as standard. This is a new marketing concept for Konecranes and has generated a great deal of interest among customers. Development work on CXT NEO cranes is continuing and will focus on adding further intelligent fea-tures and extending marketing from Germany and Switzerland into new areas.
Another example of Konecranes’ pioneer-ing technology is the Automated RTG (ARTG) system for the container handling industry. This has eliminated the main barriers to full-scale automated RTG operation: yard surface variations and the complexity of handling truck traffic flows along container stacks. The system is built around Konecranes’ market-leading 16-wheel RTGs and includes a com-plete package of truck guidance infrastruc-ture, a Remote Operating Station with a specially developed Graphical User Interface (GUI), and an IT system that interfaces with a customer’s Terminal Operating System (TOS). The system enables RTG terminal op-erators to take an important step towards automation by upgrading their existing yard infrastructure.
Development work on already launched products also continued during 2013. The
new-generation CLX chain hoist family intro-duced in 2012 was extended with further applications. Field tests on the world’s first new hybrid reach stacker for container han-dling continued. This employs an electrical system that offers significantly lower operat-ing and maintenance costs and improved productivity and reduces a stacker's environ-mental impact.
Continued work on Konecranes' offering for emerging markets Konecranes serves customers in different markets using common technological plat-forms and solution sets that are configured and tailored to meet local customer specifi-cations and needs. As the number and pro-duction volumes of customers in emerging markets are growing, Konecranes is highlight-ing the needs of these customers in its cur-rent R&D work.
Emerging markets can be divided into three distinctly different segments in terms of equipment and solution requirements. Konecranes is active in the advanced high-tech solution and midmarket segments, while the lower-specification segment is mainly covered by smaller, local companies. Konecranes' main focus during 2013 was on developing mid-segment products.
Although products for emerging markets must be competitively priced, they cannot be just downgraded versions of products de-signed for industrialized markets. The spe-cific needs of these markets must be taken into account, while keeping costs in check using the latest technological innovations. Quality and safety can never be compro-mised, whatever the market. During 2014, Konecranes plans to further enhance its emerging markets offering with a number of new product launches.
Global innovation community Konecranes has been shifting from local and project-based innovation operations towards a global innovation organization over the last few years. This has resulted in the creation of an innovation community of 30 ‘innovation agents’, who work closely with customers to identify new ideas. Input from this commu-nity is already helping Konecranes create new, innovative products and services to meet its customers’ needs and is expected to become even more important in the fu-ture.
22 Konecranes 2013 researCh & DevelopMent

Product overviewServiceKonecranes offers specialized maintenance and modernization ser-vices for all types of industrial cranes, lifting equipment, and machine tools. These services can cover everything from individual pieces of equipment to customers’ entire operations, boosting the productivity and safety of industrial processes.
A commitment to excellent, proactive, and real-time service is one of our strategic priorities. Konecranes continuously develops its ser-vice offering by drawing on its extensive R&D know-how and over 60 years of maintenance expertise.
Extensive maintenance programs based on harmonized processes are combined with a comprehensive range of services, advanced mod-ern maintenance tools, and online crane usage information.
TRUCONNECT Remote ServicesTRUCONNECT Remote Services represent the latest innovation in Konecranes’ service business, ranging from periodic data reporting to real-time diagnostics, technical support, and production monitoring. TRUCONNECT gives customers access to actual equipment usage data that can be used to enhance the safe use of cranes, optimize main-tenance activities, and plan modernization needs.
CLX Electric Chain Hoistshave been designed to meet and exceed re-quirements across a wide range of different industries and to provide a reliable solution for numerous processes. CLX technology of-fers a wide range of options and speeds, together with lifting capacities of up to 5,000 kg.
Workstation Cranesoffer ergonomic handling for loads up to 2,000 kg. Typical customers include manu-facturing, process industries, and the auto-motive sector.
ATB Airbalancerscan handle loads up to 350 kg. Thanks to their air-powered design and floating load units, AirBalancers offer an invaluable aid for picking, lifting, moving, and placing items.
23Konecranes 2013proDUCt overview
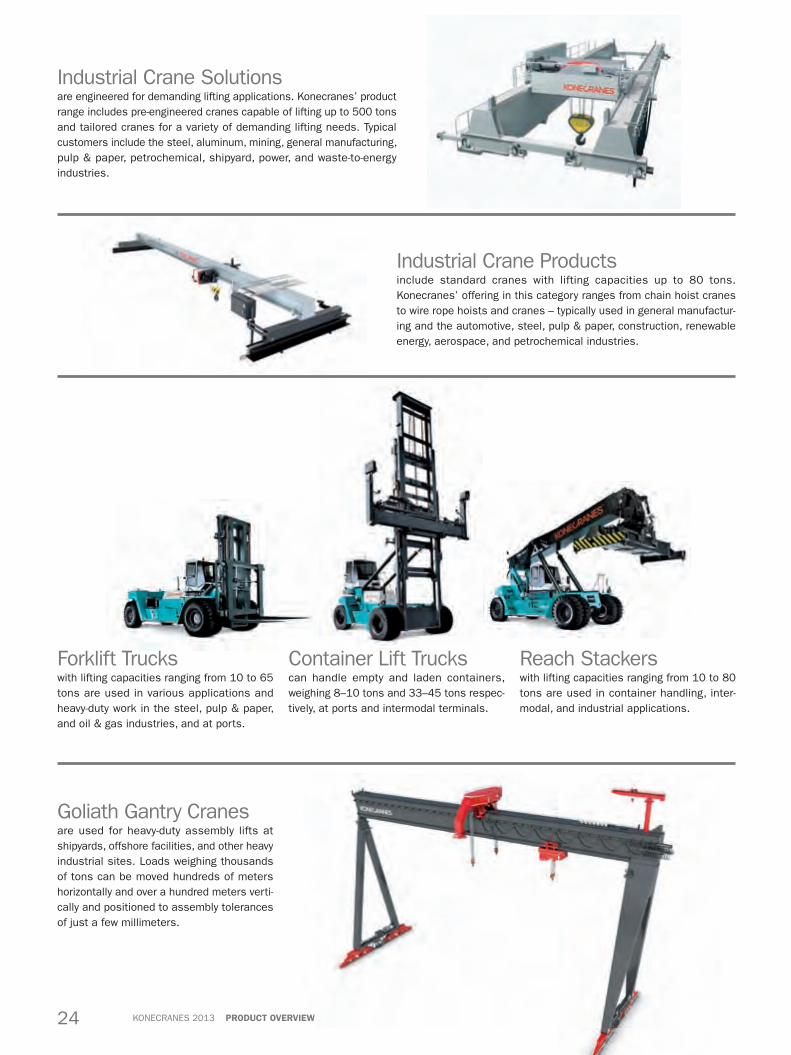
Industrial Crane Solutionsare engineered for demanding lifting applications. Konecranes’ product range includes pre-engineered cranes capable of lifting up to 500 tons and tailored cranes for a variety of demanding lifting needs. Typical customers include the steel, aluminum, mining, general manufacturing, pulp & paper, petrochemical, shipyard, power, and waste-to-energy industries.
Forklift Trucks with lifting capacities ranging from 10 to 65 tons are used in various applications and heavy-duty work in the steel, pulp & paper, and oil & gas industries, and at ports.
Goliath Gantry Cranes are used for heavy-duty assembly lifts at shipyards, offshore facilities, and other heavy industrial sites. Loads weighing thousands of tons can be moved hundreds of meters horizontally and over a hundred meters verti-cally and positioned to assembly tolerances of just a few millimeters.
Container Lift Trucks can handle empty and laden containers, weighing 8–10 tons and 33–45 tons respec-tively, at ports and intermodal terminals.
Reach Stackers with lifting capacities ranging from 10 to 80 tons are used in container handling, inter-modal, and industrial applications.
Industrial Crane Products include standard cranes with lifting capacities up to 80 tons. Konecranes’ offering in this category ranges from chain hoist cranes to wire rope hoists and cranes – typically used in general manufactur-ing and the automotive, steel, pulp & paper, construction, renewable energy, aerospace, and petrochemical industries.
24 Konecranes 2013 proDUCt overview
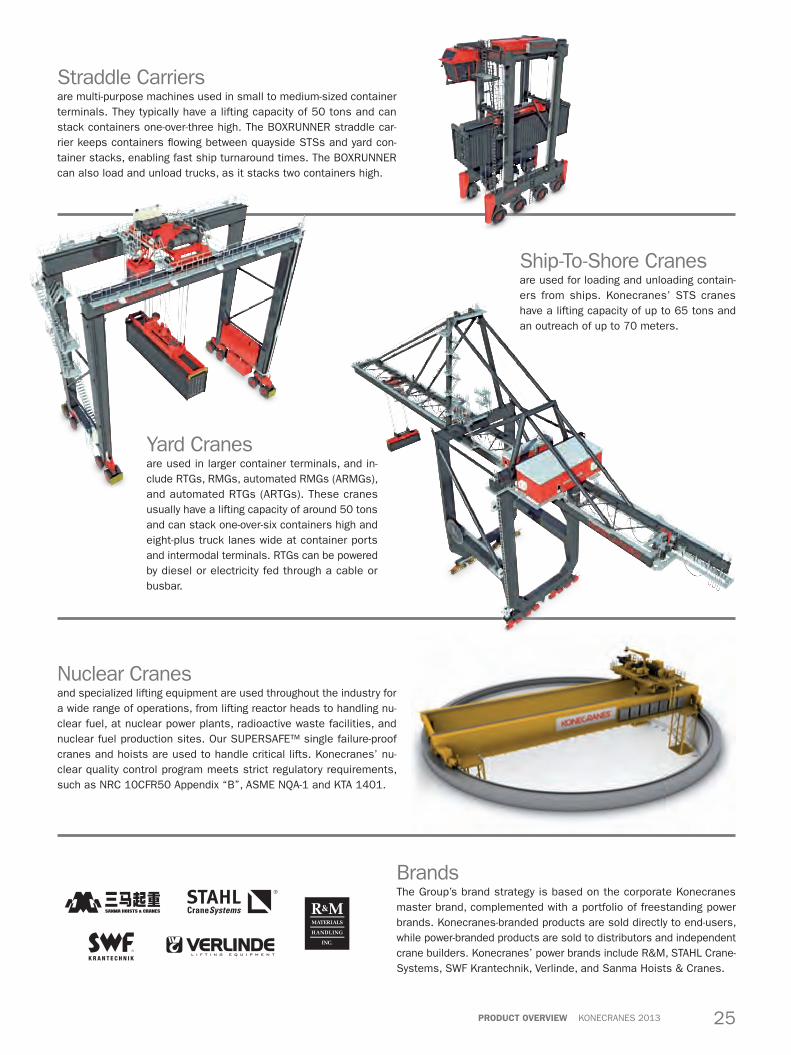
Straddle Carriers are multi-purpose machines used in small to medium-sized container terminals. They typically have a lifting capacity of 50 tons and can stack containers one-over-three high. The BOXRUNNER straddle car-rier keeps containers flowing between quayside STSs and yard con-tainer stacks, enabling fast ship turnaround times. The BOXRUNNER can also load and unload trucks, as it stacks two containers high.
Nuclear Cranes and specialized lifting equipment are used throughout the industry for a wide range of operations, from lifting reactor heads to handling nu-clear fuel, at nuclear power plants, radioactive waste facilities, and nuclear fuel production sites. Our SUPERSAFE™ single failure-proof cranes and hoists are used to handle critical lifts. Konecranes’ nu-clear quality control program meets strict regulatory requirements, such as NRC 10CFR50 Appendix “B”, ASME NQA-1 and KTA 1401.
BrandsThe Group’s brand strategy is based on the corporate Konecranes master brand, complemented with a portfolio of freestanding power brands. Konecranes-branded products are sold directly to end-users, while power-branded products are sold to distributors and independent crane builders. Konecranes’ power brands include R&M, STAHL Crane-Systems, SWF Krantechnik, Verlinde, and Sanma Hoists & Cranes.
Yard Cranes are used in larger container terminals, and in-clude RTGs, RMGs, automated RMGs (ARMGs), and automated RTGs (ARTGs). These cranes usually have a lifting capacity of around 50 tons and can stack one-over-six containers high and eight-plus truck lanes wide at container ports and intermodal terminals. RTGs can be powered by diesel or electricity fed through a cable or busbar.
Ship-To-Shore Cranes are used for loading and unloading contain-ers from ships. Konecranes’ STS cranes have a lifting capacity of up to 65 tons and an outreach of up to 70 meters.
25Konecranes 2013proDUCt overview

PEOPLE
S
AFETY
SMARTER OFFERING FA
IR P
LAY
ENVIRONMENT
corporate responsiBility
Meeting stakeholders’ needs and expectations
Konecranes is committed to continuous improvement in lifting our custom-ers’ businesses and increasing the value of our shareholders’ investment. respecting our employees, the environment, and our stakeholders is funda-mental for sustainable development.
Corporate responsibility is an integral part of what we do. Our vision statement highlights the priority we give to increasing the safety of our customers’ operations, while our com-mitments to international initiatives and con-ventions, such as the UN Declaration of Hu-man Rights and the UN Global Compact, our Code of Conduct, and our values define how we manage our supply chain and our own operations responsibly.
Konecranes operates in almost 50 coun-tries; everywhere we operate, we abide by good corporate governance practices and local laws. Our operations support the devel-opment of local communities through the creation of local jobs.
Konecranes’ corporate responsibility fo-cus areas are Safety, Smarter Offering, Fair Play, the Environment, and People. To over-see the management of these focus areas and other corporate responsibility issues, Konecranes has formed the Konecranes Cor-porate Responsibility Steering Group. This includes senior managers and representa-tives from our business areas, production, product development, human resources, le-gal affairs, and Konecranes’ European Works council. The Steering Group met twice during 2013.
Konecranes follows Global Reporting Ini-tiative (GRI) principles in its reporting on cor-porate responsibility, and aims to meet the
Konecranes’ corporate responsibility focus areas
Corporate responsibility
26 Konecranes 2013 Corporate responsiBility

Hybrid reach stackerKonecranes’ hybrid reach stacker concept means that it is an elec-tric vehicle with on-board genera-tion of electric power.
expectations of its stakeholders – such as customers, owners, and current and future personnel – and build a solid foundation for engaging stakeholders on corporate respon-sibility issues. This report follows G3 guid-ance. Reporting complies with GRI Level C requirements, based on our self-assess-ment. A table of GRI compliance can be found on pages 32–33.
Corporate responsibility reporting follows the same timeframe as our financial report-ing, the calendar year, and currently covers all our major production units and opera-tions. Businesses acquired or closed during 2013 are not included, however. The report-ed indicators have been chosen because they are the most relevant for our operations and stakeholders. The data has been gath-ered via internal information systems and supplemented with information sourced separately. Some of the data included has been scaled up to provide an overall view of our performance, which could result in inac-curacies in some figures. The method used for calculating environmental performance indicators is being revised and we are chang-ing our environmental data reporting signifi-cantly to provide more transparent and ac-curate information on how we can influence various factors and should enable us to show the progress we make more clearly.
Konecranes’ most important stakehold-ers have not changed, and include our share-holders, customers, personnel, suppliers and other partners, the authorities, local commu-nities, and the media.
Konecranes’ stakeholdersKonecranes aims to recognize and meet different stakeholders’ needs and expecta-tions in the area of corporate responsibility as elsewhere. In this chart, we have listed some examples of stakeholder groups and how we engage in dialogue with them.
Customers Continuous dialogue as part of normal business and through customer satis-faction indicators and surveys.
Suppliers and subcontractors•Continuous dialogue as part of
normal business and the Supplier Days event.
•Environmental and ethical require-ments included in general terms and conditions.
ShareholdersThe Annual Report is one way of pro-viding information on Konecranes’ cor-porate responsibility performance and actions for investors and engaging in dialogue.
PersonnelThere are multiple channels for em-ployee dialogue, for example the Konecranes employee satisfaction sur-vey and various feedback channels.
Students, universities, and research institutes•Student cooperation in the form of
trainee and thesis work opportuni-ties.
•Cooperation in different kinds of research programs with universi-ties and research institutes.
There are also many other stakeholder groups, such as local communities, the authorities, media, interest groups, trade unions, and non-govern-mental organizations. We use multiple dialogue channels for communicating with these groups.
27Konecranes 2013Corporate responsiBility

Summary of progress and challenges linked to Konecranes’ five corporate responsibility focus areasFocus area Main achievements Challenges
Safety Steady improvement in lost time accident frequency.
Even more efficient use of proactive leading indicators and preventive measures.
People Fair labor conditions evaluations in our own operations. High employee satisfaction. Low employee turnover.
Company restructuring due to economic reasons.
Environment Environmental data reporting and local follow-up within the Group has improved significantly over the last two years.
Global environmental data and KPI calculations.
Fair Play Rollout of Code of Conduct e-learning over two years covering more than 90% of personnel.
Supplier safety, environmental and quality management coverage. Our target is to systematically cover our top 250 suppliers in these areas
Smarter Offering Numerous product launches improving fuel efficiency, reducing emissions, and improving safety during 2013.
Publish more environmental product declarations.
Safety is a top priority Safety is imperative for Konecranes, as we operate in a multitude of different working conditions, geographical areas, and cultures. We strive to ensure the safety of our person-nel, as well as that of our suppliers’ and customers’ personnel, throughout the life-cycle of our products. We want everyone to arrive home in good health after the working day – and we want to be the safety leader in our industry.
Konecranes continued improving and har-monizing global occupational safety require-ments and instructions during 2013. Corpo-rate minimum requirements of safety in electrical work, working at height, and using personal protective equipment were imple-mented further down in the organization and incorporated into common safety training. Occupational safety requirements and in-structions will continue to be developed over the next few years. Konecranes continued expanding its global Health, Safety and Envi-ronmental (HSE) network to new units and countries, and continued promoting internal cooperation via online meetings.
Proactive safety management progressed and the number of safety observations and near-hit reports carried out by Konecranes personnel increased during 2013. Although we are clearly on the right track here, this remains an area where we want to see fur-ther improvement. The main reasons for safety observations and near-hits continued to relate to the loss of control of equipment, such as hand-held power tools, equipment failures, and housekeeping. Near-hit data is
Lost Time Accident Frequency
Business arealta1, 2013
lta1, 2012
lta1, 2011
lta1, 2010
Konecranes total 8.6 9.5 9.5 11.7
Equipment 7.3 9.9 8 13
Service 10.6 10.3 11.7 12
LTA1= (number of accidents/working hours performed)* 1,000,000 including operatives and office staff
helping us focus our injury prevention and awareness-raising activities.
Our occupational safety key performance indicators show good improvement on Group level as well as in Business Area Equipment. In Business Area Service, the figures re-mained approximately on the same level as last year. The total number of reportable oc-cupational accidents declined by 10% on Group level, by 25% in Equipment and 2% in Service. Accident frequencies also improved on Group level and in Business Area Equip-ment. In Business Area Service, we remained on about the same level as last year. There were no fatalities or serious injuries.
Positive results from Employee Satisfaction Survey and annual development discussions Konecranes’ annual Employee Satisfaction Survey (ESS) is used to assess the level of
satisfaction and engagement of the Group’s employees. It is also a channel for employ-ees to express their views regarding their work and workplace. The response rate to the 2013 survey was similar to that for the 2012 survey: 85 percent (2012: 86%) for the Group as a whole. The total number of re-sponses was 10,281 (2012: 10,383). This was the seventh survey to be organized to date.
When compared to benchmark data, our overall results continue to be positive, de-spite the challenging economic environment. In 2013, our employees rated Konecranes’ values and objectives worth aiming for and reported that they consider their work inter-esting and challenging and that they feel that good work is acknowledged within the Group. Stress levels are seen as an issue in many areas, however, and people feel that there is unnecessary bureaucracy.
ESS results are discussed at all levels of the Group as standard practice, and units and teams create their own improvement plan based on their results.
28 Konecranes 2013 Corporate responsiBility
Annual development discussions – known as Trust, People and Performance (TPP) dis-cussions at Konecranes – are one-to-one meetings between managers and employees, during which people’s goals and personal development plans are discussed and sys-tematically documented. Development dis-cussions are a key part of performance man-agement and ensure that Konecranes and all its employees have the competencies and motivation needed to meet the Group’s cur-rent and future business challenges. Our aim is to hold annual development discussions with all employees; the actual rate in 2013 was about 80%.
The importance of development discus-sions is also reflected in ESS results. The correlation between annual development dis-cussions and the general job satisfaction of all Konecranes employees worldwide contin-ued to be clearly visible in the results of the 2013 survey.
Sharing our way The Konecranes Employee Share Savings Plan, launched in July 2012, continued in 2013. The plan is designed for all employ-ees, except those in countries where it can-not be offered for legal or administrative reasons. Participation is completely volun-tary.
The aim of the plan is that participants save up to five percent of their gross salary every month. This money is used to buy Konecranes shares from the market on be-half of participants. Savings are made for an agreed time period, which extended from July 1, 2012 until June 30, 2013 for the first plan period and extends from July 1, 2013 until June 30, 2014 for the second period. If par-ticipants still hold shares at the end of the agreed saving time (February 2016 for the first plan period and February 2017 for the second plan period), they will receive one matching share for each two initially pur-chased.
We believe the plan will positively influ-ence our mutual sense of being part of the company, worldwide and at all levels of the organization. The participation rate is cur-rently about 16 percent, which is considered satisfactory.
Economic situation effecting personnelThe world economy has been very unstable for some time and personnel were unavoid-
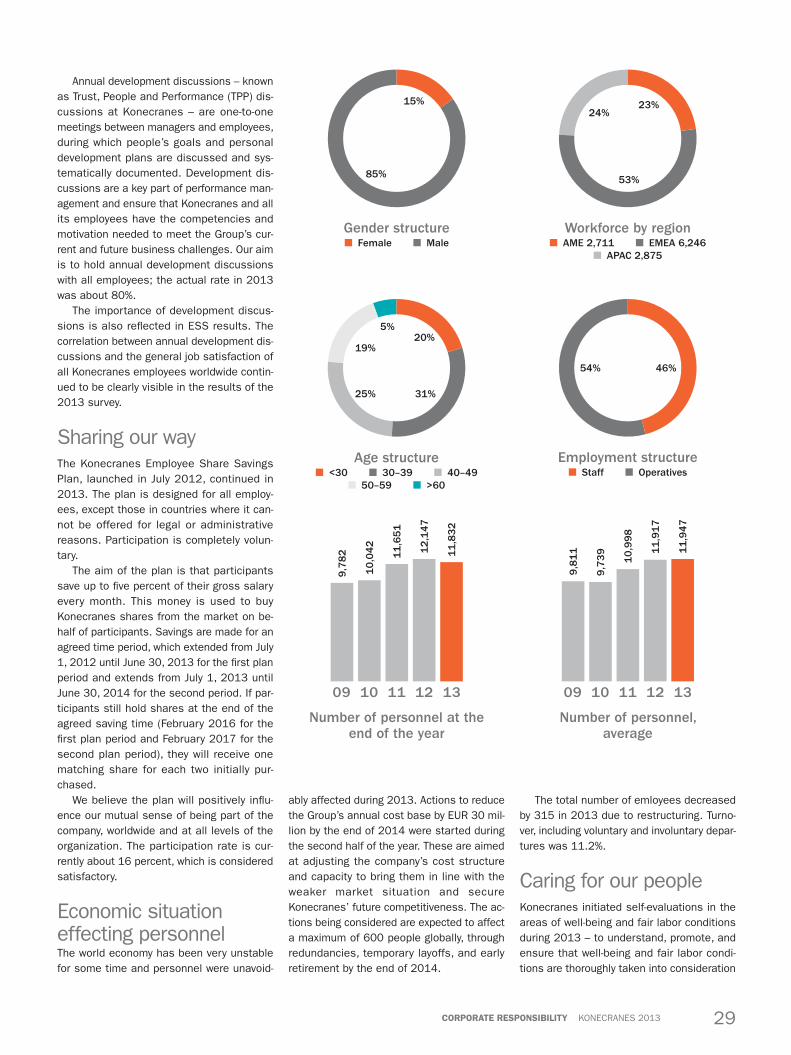
Employment structure■ Staff ■ Operatives
Workforce by region■ AME 2,711 ■ EMEA 6,246
■ APAC 2,875
Gender structure■ Female ■ Male
Number of personnel at the end of the year
09 10 11 12 13
12
,14
7
Number of personnel, average
09 10 11 12 13
11
,83
2
11
,65
1
10
,04
2
9,7
82 1
1,9
47
11
,91
7
10
,99
8
9,7
39
9,8
11
Age structure■ <30 ■ 30–39 ■ 40–49
■ 50–59 ■ >60
85%
15% 23%
46%54%
20%
31%25%
19%
5%
53%
24%
ably affected during 2013. Actions to reduce the Group’s annual cost base by EUR 30 mil-lion by the end of 2014 were started during the second half of the year. These are aimed at adjusting the company’s cost structure and capacity to bring them in line with the weaker market situation and secure Konecranes’ future competitiveness. The ac-tions being considered are expected to affect a maximum of 600 people globally, through redundancies, temporary layoffs, and early retirement by the end of 2014.
The total number of emloyees decreased by 315 in 2013 due to restructuring. Turno-ver, including voluntary and involuntary depar-tures was 11.2%.
Caring for our people Konecranes initiated self-evaluations in the areas of well-being and fair labor conditions during 2013 – to understand, promote, and ensure that well-being and fair labor condi-tions are thoroughly taken into consideration
29Konecranes 2013Corporate responsiBility

by local management. The results of these self-evaluations have been good, and the subsequent discussions based on online responses have been considered useful. There have been no major findings in the area of labor conditions, but smaller improve-ment opportunities have been identified and local improvement actions have been taken.
Ensuring a positive trend in environmental impact We work hard to develop our environmental management and apply the model of con-tinuous improvement in our environmental management. Our main environmental as-pects are energy efficiency, recycling, waste disposal, and chemical management.
We have continued developing our envi-ronmental competencies through Konecranes’ global Health, Safety and Envi-ronment (HSE) network via information shar-ing and online meetings. An environmental e-learning package was announced in the third quarter of 2012 outlining the fundamen-tals of Konecranes’ environmental aspects and how to manage environmental impact. This tool, which is primarily aimed at man-
agement and office staff with access to a PC, is now used in 30 countries and has reached 950 people.
Promoting energy efficiency within the Group continued during 2013. Several units continued with or launched energy efficiency programs aimed at reducing the use of dif-ferent forms of energy. A major facility im-provement project covering heat recovery at the Hämeenlinna gear factory in Finland, for example, was completed at the end of 2013, and we expect this to result in significantly lower district heat usage there in the future.
Environmental aspects Konecranes’ two business areas have quite different types of environmental aspects. For Business Area Service, the most important environmental aspects are fuel consumption and vehicle emissions; while for Business Area Equipment, energy usage, waste han-dling, and chemical storage and usage are the most important. Environmental indicators related to key environmental issues are re-ported in the Environmental Data Table be-low.
Environmental data reporting has been revisited, and the coverage of reporting and how figures are calculated have been signifi-cantly changed. In terms of energy consump-tion, we will now start reporting the energy usage of our production facilities in Business Area Equipment, in addition to fuel consump-tion in Business Area Service. We believe that energy usage and waste generation at our production facilities is a much more ma-terial topic for us than a globally scaled esti-mate including all small rented service office locations.
Water-related questions have become more and more prominent in sustainability assessments in recent years. Although Konecranes’ manufacturing processes do not consume significant quantities of water, we have started tracking our water consump-tion and are now reporting our water con-sumption for the first time. The total volume of water used in our production facilities was 160,100 m3 in 2013.
Smarter offering Usability, eco-efficiency, and safety are the guiding principles in the lifecycle of
Environmental data 2013energy consumption and emissions 2013 2012 2011
Total emissions / sales tCO2e /M€ 28 28 32
Total energy consumption / sales MWh / M€ 82 80 95
Scope 1, energy consumption and direct emissions
Fuel consumption, MWh 96,100 91,200 88,500
Natural gas consumption, MWh 18,800 21,400 27,600
Direct emissions, tCO2e 28,900 28,500 28,700
Scope 2, energy consumption and indirect emissions
Electricity consumption, MWh 41,600 41,500 41,400
District heat consumption, MWh 16,000 19,600 21,900
Indirect emissions, tCO2e 20,900 21,100 20,900
Scope 3, other indirect emissions Business travel, tCO2e 9,000 11,100 11,100
waste (tons)
Metal scrap 1) 8,500 10,000 9,700
Cardboard, paper and wood 1) 1,600 1,700 1,300
Hazardous and electronic and electrical waste 2) 550 450 550
Mixed waste 3) 2,700 2,900 2,650
Environmental data reporting coverage and calculation have been changed. Instead of calculating our global reporting footprint, we now report figures for our manufacturing locations, except fuel consumption, which also includes the service vehicle fleet.1) Waste streams go for recycling2) Waste stream handling split into recycling, incineration and other adequate treatments depending on location3) Waste stream handling split into recycling, incineration, composting and landfill depending on location
30 Konecranes 2013 Corporate responsiBility
Konecranes’ lifting equipment and service offering. We are proud of the eco-efficiency and safety features of our overall offering, and of the user experience, both tangible and intangible, that we are able to give custom-ers. Numerous advanced features have been part of our offering for years.
2013 was an active year in terms of prod-uct launches enhancing environmental effi-ciency and safety. New products launched during the year included a hybrid reach stack-er, a new Auto Start-Stop function, remote monitoring for lift trucks, and an automated RTG system.
Konecranes introduced the world’s first hybrid reach stacker for container handling. With a lifting capacity of 45 tons, this fea-tures a hybrid diesel/electric driveline, an electrified hydraulic lifting system, and super-capacitor-based energy storage. These inno-vations cut fuel consumption and emissions, while offering improved performance in terms of acceleration and lifting response to driver commands. The new hybrid reach stacker of-fers customers substantial cost and environ-mental benefits. Estimated fuel consumption is around 10 liters/hour during normal han-dling of fully loaded containers, significantly less than that of conventional reach stack-ers.
The new Auto Start-Stop feature for lift trucks turns off the engine whenever a unit is idle for a specified period of time and re-starts it automatically when needed. The benefit here is very clear-cut: when an engine is not running, fuel consumption is zero. The Auto Start-Stop system recognizes the differ-ence between a temporary stop and the end of a job, and it will not restart the engine if the driver’s seatbelt is undone, if the cabin door is open, or if engine stoppage time has exceeded a pre-set time-out value. The Auto Start-Stop feature is designed to reduce fuel consumption and CO2 emissions significant-ly, and will typically save 5–15% in fuel con-sumption, depending on operating condi-tions. It also reduces noise levels and driver fatigue, and extends engine service intervals based on running hours.
TRUCONNECT for lift trucks monitors the actual usage of machines through a remote connection and provides an online window to monitor efficiency and productivity. Condition monitoring units in trucks collect operating data and transmit it wirelessly to Konecranes’ Remote Data Center. The online views and reports provided to customers contain information that helps improve fleet efficiency, productivity, and safety: total fuel
consumption; average fuel consumption when a truck is running laden, empty or idling; average fuel consumption per load; top and average speed; load spectrum; trav-elling distance; and other parameters.
The new automated RTG (ARTG) system for the container handling industry provides RTG terminal operators with all the benefits of automation: operational cost savings, greater productivity, increased predictability, and better safety. The Konecranes ARTG sys-tem is built around Konecranes’ market-leading 16-wheel RTG, which has a unique ability to tolerate rough yard surfaces. The system includes a complete package of truck guidance infrastructure, a Remote Operating Station with a specially developed Graphical User Interface (GUI), and an IT system that interfaces with the customer’s Terminal Op-erating System (TOS).
In addition to new product launches, 2013 was also successful for Konecranes in terms of the recognition it received for the design of its products. In the spring, Konecranes received the Red Dot Award: Product Design 2013 for its multi-branded electric chain hoist series launched in 2012. The Red Dot Award is an international design award created by Design Zentrum Nordrhein-Westfalen in Germany. The technology plat-form underpinning these new chain hoists is modular and scalable, according to market needs and business targets, and includes identities for the Konecranes brand and the Group’s Verlinde, SWF Krantechnik, R&M, and STAHL CraneSystems power brands.
Fair play As we are a part of a complex business eco-system, we want to ensure that we act as transparently as possible and are fully ac-countable.
Our Code of Conduct is publicly available on the Konecranes website, and we also of-fer personnel and other stakeholders a con-fidential e-mail channel ([email protected]) for reporting misconduct. We take all reports of misconduct received through this and other channels seriously and initiate a prompt response wherever mis-conduct is found.
The rollout of online training covering Konecranes’ Code of Conduct continued and the completion rate was approximately 90% as of the end of 2013. Online training re-views the various aspects of the Code of Conduct and includes test questions that users must pass to complete the program.
Online training is mandatory for all Konecranes employees. An online invitation to take part in the program is sent out to personnel who have recently joined Konecranes every six months. Other work on improving people’s awareness of the Code of Conduct is also continuing. Using the anony-mous information generated by the online training database, we can target further cam-paigns addressing specific gaps or risks re-lated to the areas covered by the Code.
We pay special attention to cooperation with our suppliers. Beginning in 2013, our aim is to ensure that our top 250 suppliers have safety, environment, and quality man-agement systems in place by the end of 2015. We are actively tracking progress to-wards this target and have organized a num-ber of internal training courses for personnel responsible for supplier relationships
Konecranes understands that different customers and industries have different re-quirements, and aims to develop strong, long-term customer relationships. Our exist-ing customer partnerships, together with our service contract base, offer us an excellent foundation for growth, by expanding coopera-tion and selling additional services.
Please contact [email protected] on corporate responsibility matters.
31Konecranes 2013Corporate responsiBility

GRI content indexGlobal reporting initiative content index Page CommentProfile
1 strategy and analysis
1.1 CEO's statement 6–7
1.2 Key impacts, risks and opportunities 6–9, 12–13, 28, 44–49
2 organizational profile
2.1 Name of the organization 34
2.2 Primary brands, products and services 23–25
2.3 Operational structure 2, 34
2.4 Location of organization's headquarters 4
2.5 Number of countries and location of operations 3
2.6 Nature of ownership and legal form 3
2.7 Markets served 2, 17–19
2.8 Scale of the reporting organization 2–3, 5
2.9 Significant changes 4
2.10 Awards received in the reporting period 31
3 report parameters
3.1 Reporting period 27
3.2 Date of most recent report 27
3.3 Reporting cycle 27
3.4 Contact point for questions regarding report 31, 126–128
3.5 Process for defining report content 27
3.6 Boundary of the report 27
3.7 Limitations on the report's scope or boundary 27
3.8 Basis for reporting subsidiaries and joint ventures 27
3.9 Data measurement techniques and bases for calculations 27
3.10 Explanation of re-statements 27
3.11 Significant changes from previous reporting periods 4, 27, 30
3.12 GRI content index 32–33
4 governance, Commitments and engagement
4.1 Governance structure 34
4.2 Independence of the Chairman of the Board 36–37
4.3 Independence of the Board members 36–37
4.4 Mechanism for shareholder and employee consultation 27, 35–36
4.5 Executive compensation and linkage to organization's performance 40–43
4.6 Processes for avoiding conflicts of interest 34–38 Partly covered
4.7 Processes for determining expertise 36
4.8 Values, mission and business conduct principles 10, 31
4.9 Procedures of the Board for overseeing risk management 44
4.10 Processes for evaluating the Board's performance 37
4.12 External initiatives 26
4.14 List of stakeholder groups 27
4.15 Identification of stakeholders 27
4.16 Approaches to stakeholder engagement 27, 35–36
32 Konecranes 2013 gri
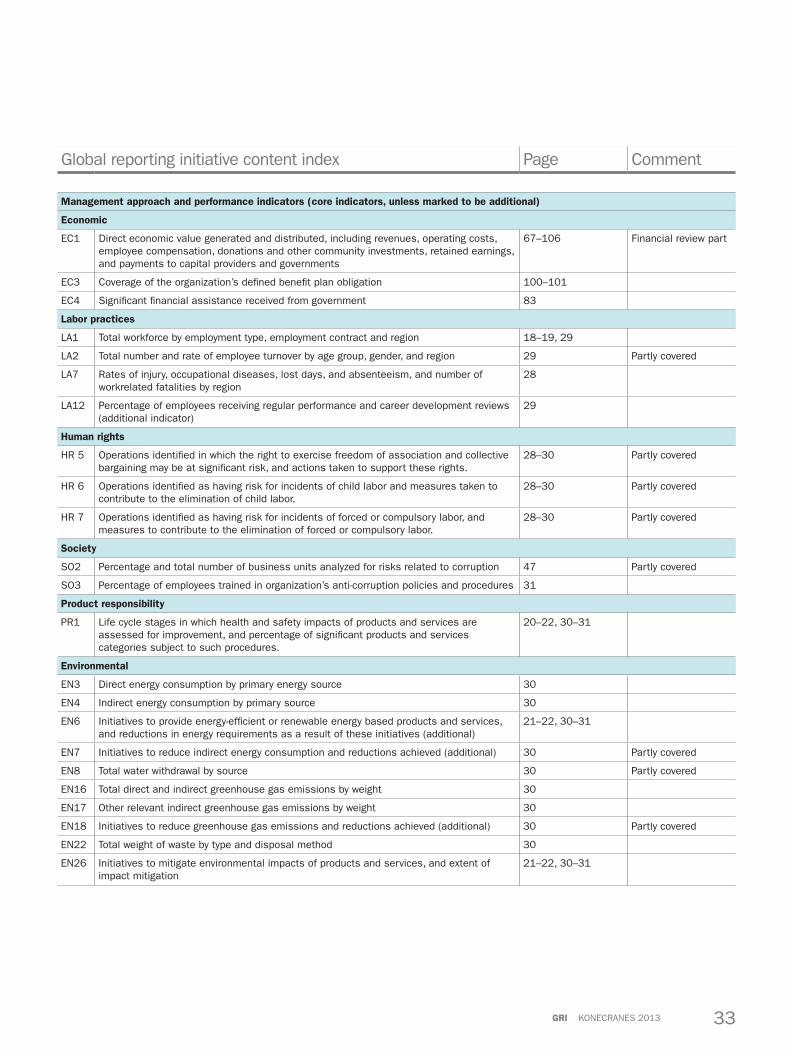
Global reporting initiative content index Page Comment
Management approach and performance indicators (core indicators, unless marked to be additional)
economic
EC1 Direct economic value generated and distributed, including revenues, operating costs, employee compensation, donations and other community investments, retained earnings, and payments to capital providers and governments
67–106 Financial review part
EC3 Coverage of the organization’s defined benefit plan obligation 100–101
EC4 Significant financial assistance received from government 83
labor practices
LA1 Total workforce by employment type, employment contract and region 18–19, 29
LA2 Total number and rate of employee turnover by age group, gender, and region 29 Partly covered
LA7 Rates of injury, occupational diseases, lost days, and absenteeism, and number of workrelated fatalities by region
28
LA12 Percentage of employees receiving regular performance and career development reviews (additional indicator)
29
human rights
HR 5 Operations identified in which the right to exercise freedom of association and collective bargaining may be at significant risk, and actions taken to support these rights.
28–30 Partly covered
HR 6 Operations identified as having risk for incidents of child labor and measures taken to contribute to the elimination of child labor.
28–30 Partly covered
HR 7 Operations identified as having risk for incidents of forced or compulsory labor, and measures to contribute to the elimination of forced or compulsory labor.
28–30 Partly covered
society
SO2 Percentage and total number of business units analyzed for risks related to corruption 47 Partly covered
SO3 Percentage of employees trained in organization’s anti-corruption policies and procedures 31
product responsibility
PR1 Life cycle stages in which health and safety impacts of products and services are assessed for improvement, and percentage of significant products and services categories subject to such procedures.
20–22, 30–31
environmental
EN3 Direct energy consumption by primary energy source 30
EN4 Indirect energy consumption by primary source 30
EN6 Initiatives to provide energy-efficient or renewable energy based products and services, and reductions in energy requirements as a result of these initiatives (additional)
21–22, 30–31
EN7 Initiatives to reduce indirect energy consumption and reductions achieved (additional) 30 Partly covered
EN8 Total water withdrawal by source 30 Partly covered
EN16 Total direct and indirect greenhouse gas emissions by weight 30
EN17 Other relevant indirect greenhouse gas emissions by weight 30
EN18 Initiatives to reduce greenhouse gas emissions and reductions achieved (additional) 30 Partly covered
EN22 Total weight of waste by type and disposal method 30
EN26 Initiatives to mitigate environmental impacts of products and services, and extent of impact mitigation
21–22, 30–31
33Konecranes 2013gri

Corporate governance structure of the Konecranes Group in 2013
Konecranes Plc (Konecranes, Company) is a Finnish public limited liability company, which complies with the Finnish Companies and Securities Market Acts, the rules of NASDAQ OMX Helsinki, and other regulations concern-ing public companies, as well as Konecranes’ Articles of Association, in its decision-making and administration.
KONECRANES GROUP
BA Equipment BA Service
Business units and regions
Business units and regions
Laws, rules and regulations
Articles of Association
Code of Conduct
Group’s internal rules, regulations and Group Policies
Group Administration and Support Functions
Component manufacturing and strategic sourcing
Senior Management Team
general Meeting(Shareholders)
Konecranes plc
Board of Directors
Audit Committee
president and Ceo
Nomination and Compensation Committee
Internal Audit
Auditor
group executive Board
Corporate governanceKonecranes complies with the Finnish
Corporate Governance Code 2010 that came into force on October 1, 2010 and was ap-proved by the Board of the Securities Mar-ket Association. The Code can be found at www.cgfinland.fi. Konecranes complies with all the recommendations of the Code with no exceptions. Konecranes has issued a
Corporate Governance Statement based on Recom mendation 54 of the Code and a Remuneration Statement based on Recom-mendation 47. See www.konecranes.com > Investors > Corporate Governance for de-tails.
34 Konecranes 2013 Corporate governanCe
General meetingThe General Meeting of Shareholders is the Company’s highest decision-making body, through which shareholders exercise their decision-making power and right of supervi-sion and control over the Company’s busi-ness.
An Annual General Meeting (AGM) must be held within six months after the end of a financial year. An Extraordinary General Meet-ing (EGM) must be held if shareholders with at least 10 percent of shares so demand in writing to consider a specific issue.
Matters to be discussed at the AGM are defined in Article 10 of Konecranes’ Articles of Association and in Chapter 5, Paragraph 3 of the Companies Act. These matters in-clude the adoption of the financial state-ments, the distribution of profits, discharging Board members and the Managing Director from personal liability, the election of Board members and auditors, and the fees payable to them. Konecranes’ Articles of Association can be consulted at the Company’s website at www.konecranes.com > Investors > Cor-porate Governance.
Information on General Meetings for shareholdersThe Board of Directors (Board) shall convene an AGM or EGM by publishing a notice on the Company’s website or in one or more na-tional newspapers or by sending a written notice to shareholders by mail no more than three (3) months and no less than three (3) weeks before a meeting. The notice shall include the proposed agenda.
The Company shall disclose on its web-site the date by which shareholders shall notify the Board of Directors of any issue that they wish included in the agenda.
The Company will publish the decisions made at General Meetings as stock ex-change releases and on the Company’s web-site without delay after meetings. The min-utes of the General Meeting, including those appendices of the minutes that are part of decisions made by the meeting, will be post-ed on the Company’s website within two weeks of a General Meeting.
Attendance of shareholdersHolders of nominee-registered shares are advised to request their custodian bank to provide them with instructions regarding reg-istration in the Company’s shareholders’ register, the issuing of proxy documents, and registration for the General Meeting well in advance of a meeting. Custodian banks’ ac-count management organization will register a holder of nominee-registered shares wish-ing to participate in the General Meeting to be temporarily entered in the Company’s shareholders’ register. In order to be entitled to attend an AGM or EGM, a shareholder must be registered as a shareholder in the Company’s shareholders’ register maintained by Euroclear Finland Ltd. on the record day for the meeting. A shareholder whose shares are registered in his/her personal Finnish book-entry account is registered in the Com-pany’s shareholders’ register. Changes in shareholdings that occur after the record date of a General Meeting do not affect a shareholder’s right to participate in a Gen-
eral Meeting or a shareholder’s number of votes.
A registered shareholder wishing to par-ticipate in a General Meeting must notify the Company of his/her intention in the order and during the period prescribed in the No-tice of the Shareholders’ Meeting. A notifica-tion by a holder of nominee-registered shares for temporary inclusion in the Company’s shareholders’ register is understood as prior notice of participation in a General Meeting.
Proxy representative and powers of attorneyA shareholder may participate in a General Meeting in person or through proxy represen-tation. A proxy representative shall produce a dated proxy document or otherwise dem-onstrate in a reliable manner his/her right to represent the shareholder at a meeting. When a shareholder participates in a Gen-eral Meeting through several proxy repre-sentatives representing the shareholder’s shares held in different securities accounts, the shares by which each proxy representa-tive represents the shareholder shall be iden-tified during registration.
Shareholders are requested to inform the Company of any proxies for a General Meet-ing when they notify their participation. A shareholder and his/her representative may bring an assistant to a meeting.
Shareholder’s right to ask questions and make proposals for resolutions Every shareholder at a General Meeting has the right to ask questions related to an item
35Konecranes 2013Corporate governanCe

on the agenda. A shareholder may send his or her question to be submitted to the meet-ing to the Company in advance. A sharehold-er also has the right to table draft resolu-tions at a meeting in matters that fall within the competence of the General Meeting and that are on the agenda.
Attendance of Board members, the Managing Director, and Auditors at a General MeetingThe President and CEO, holding the position of Managing Director under the Companies Act, the Chairman of the Board, and a suffi-cient number of directors shall attend Gen-eral Meetings. In addition, the Company’s Auditor shall be present at Annual General Meetings.
A person proposed as a director for the first time shall participate in the General Meeting that decides on his/her election un-less there is good reason for not attending.
The Annual General Meeting for 2013 was held on March 21, 2013 in Hyvinkää, Fin-land. A total of 371 shareholders represent-ing approximately 44.3 percent of votes par-ticipated either in person or by proxy.
Documents relating to General MeetingsThe Notice of a General Meeting, the docu-ments to be submitted, and draft resolutions will be available on the Company’s website at least three weeks before the meeting.
Board of directorsCharter of the Board of DirectorsThe Company’s Board of Directors has ap-proved a written Charter governing its work. This supplements the provisions of the Finn-ish Companies Act and the Company’s Arti-cles of Association. Information in the Char-ter is intended to enable shareholders to evaluate the operation of the Board. The Charter can be consulted on the Company’s website at www.konecranes.com > Investors > Corporate Governance.
ResponsibilitiesThe Board is responsible for the administra-tion and proper organization of the Compa-ny’s operations. The Board is vested with powers and duties to manage and supervise the Company’s administration and operations as set forth in the Companies Act, the Arti-cles of Association, and other applicable Finnish laws and regulations. The Company aims to comply with all applicable rules and regulations affecting the Company or its af-filiates (Group Companies) outside Finland, provided that such compliance does not con-stitute a violation of Finnish law.
The Board has a general obligation to pur-sue the best interests of the Company and all its shareholders, and is accountable to the Company’s shareholders. Board mem-bers shall act in good faith and with due care, exercising their business judgment on an informed basis in what they believe to be the best interests of the Company and its shareholder community as a whole.
The Board shall decide on the business strategy of the Company, the appointment and dismissal of the President and CEO, the deputy to the President and CEO, and other senior management, Group structure, acqui-sitions and divestments, financial matters, and investments. It shall also continuously review and monitor the operations and per-formance of Group Companies, risk manage-ment, and the Company’s compliance with applicable laws, as well as any other issues determined by the Board. The Board shall keep itself informed of issues and business activities of major strategic importance to the Company on an ongoing basis.
The Board shall appoint a secretary to be present at all Board meetings.
Election and term of officeThe AGM elects the Company’s Board of Di-rectors for a term of one (1) year. According to the Articles of Association, the Board shall have a minimum of five (5) and a maximum of eight (8) members. The Board elects a Chairman from among its members. There is
no provision in the Articles of Association to appoint Board members according to a spe-cific order.
Candidate Board members will be an-nounced in invitations to General Meetings, provided that the proposal has been made by the Nomination and Compensation Com-mittee, or if the candidate is supported by at least 10 percent of the total votes of all Company shares and the candidate has giv-en his/her consent. Any candidates pro-posed after the invitation has been sent out shall be announced separately. The Company will publish the biographical details of candi-dates on the Company’s website.
In 2013, the Board of Directors consisted of eight (8) members:•Mr. Svante Adde•Mr. Stig Gustavson (Chairman)•Mr. Tapani Järvinen•Mr. Matti Kavetvuo•Ms. Nina Kopola•Mr. Bertel Langenskiöld •Ms. Malin Persson•Mr. Mikael Silvennoinen
Biographical details of the Board of Directors are presented on pages 50–51 and can also be found at www.konecranes.com > Inves-tors > Corporate Governance.
Independence of the Board of DirectorsUnder the Finnish Corporate Governance Code 2010, the majority of directors shall be independent of the Company. In addition, at least two directors of this majority shall be independent of the Company’s major share-holders. The Board shall evaluate the inde-pendence of directors and report which direc-tors it determines to be independent of the Company and which directors it determines to be independent of major shareholders.
All other members elected to Konecranes’ Board of Directors, except Mr. Stig Gustavs-on, are deemed independent of the Compa-ny. Mr. Gustavson is deemed dependent on the Company based on the Board’s overall
36 Konecranes 2013 Corporate governanCe
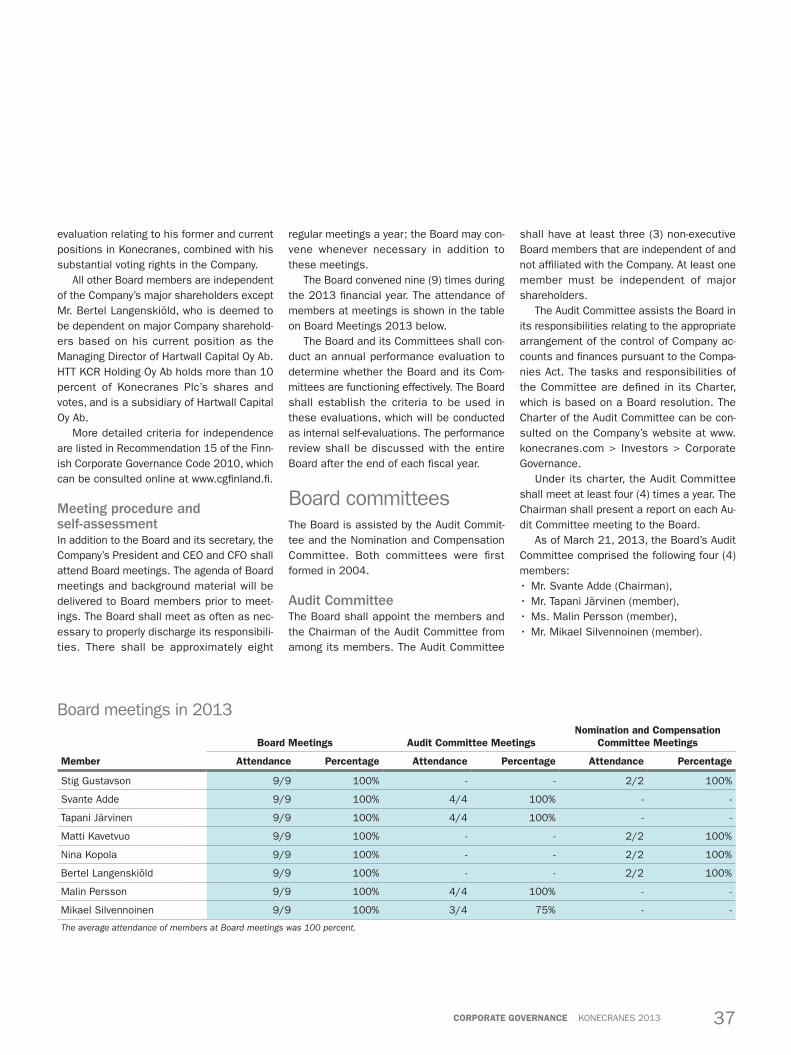
Board meetings in 2013
Board Meetings audit Committee Meetingsnomination and Compensation
Committee Meetings
Member attendance percentage attendance percentage attendance percentage
Stig Gustavson 9/9 100% - - 2/2 100%
Svante Adde 9/9 100% 4/4 100% - -
Tapani Järvinen 9/9 100% 4/4 100% - -
Matti Kavetvuo 9/9 100% - - 2/2 100%
Nina Kopola 9/9 100% - - 2/2 100%
Bertel Langenskiöld 9/9 100% - - 2/2 100%
Malin Persson 9/9 100% 4/4 100% - -
Mikael Silvennoinen 9/9 100% 3/4 75% - -
The average attendance of members at Board meetings was 100 percent.
evaluation relating to his former and current positions in Konecranes, combined with his substantial voting rights in the Company.
All other Board members are independent of the Company’s major shareholders except Mr. Bertel Langenskiöld, who is deemed to be dependent on major Company sharehold-ers based on his current position as the Managing Director of Hartwall Capital Oy Ab. HTT KCR Holding Oy Ab holds more than 10 percent of Konecranes Plc’s shares and votes, and is a subsidiary of Hartwall Capital Oy Ab.
More detailed criteria for independence are listed in Recommendation 15 of the Finn-ish Corporate Governance Code 2010, which can be consulted online at www.cgfinland.fi.
Meeting procedure and self-assessmentIn addition to the Board and its secretary, the Company’s President and CEO and CFO shall attend Board meetings. The agenda of Board meetings and background material will be delivered to Board members prior to meet-ings. The Board shall meet as often as nec-essary to properly discharge its responsibili-ties. There shall be approximately eight
regular meetings a year; the Board may con-vene whenever necessary in addition to these meetings.
The Board convened nine (9) times during the 2013 financial year. The attendance of members at meetings is shown in the table on Board Meetings 2013 below.
The Board and its Committees shall con-duct an annual performance evaluation to determine whether the Board and its Com-mittees are functioning effectively. The Board shall establish the criteria to be used in these evaluations, which will be conducted as internal self-evaluations. The performance review shall be discussed with the entire Board after the end of each fiscal year.
Board committeesThe Board is assisted by the Audit Commit-tee and the Nomination and Compensation Committee. Both committees were first formed in 2004.
Audit CommitteeThe Board shall appoint the members and the Chairman of the Audit Committee from among its members. The Audit Committee
shall have at least three (3) non-executive Board members that are independent of and not affiliated with the Company. At least one member must be independent of major shareholders.
The Audit Committee assists the Board in its responsibilities relating to the appropriate arrangement of the control of Company ac-counts and finances pursuant to the Compa-nies Act. The tasks and responsibilities of the Committee are defined in its Charter, which is based on a Board resolution. The Charter of the Audit Committee can be con-sulted on the Company’s website at www.konecranes.com > Investors > Corporate Governance.
Under its charter, the Audit Committee shall meet at least four (4) times a year. The Chairman shall present a report on each Au-dit Committee meeting to the Board.
As of March 21, 2013, the Board’s Audit Committee comprised the following four (4) members:•Mr. Svante Adde (Chairman),•Mr. Tapani Järvinen (member),•Ms. Malin Persson (member),•Mr. Mikael Silvennoinen (member).
37Konecranes 2013Corporate governanCe
All the members of the Audit Committee are deemed to be independent of the Com-pany and its significant shareholders. All members have sufficient corporate manage-ment expertise. In addition, Mr. Svante Adde and Mr. Mikael Silvennoinen have a degree in business administration and/or econom-ics.
The Audit Committee convened four (4) times in 2013, and the average attendance of members at meetings was 94 percent. Attendance is shown in the table on Board meetings on page 37.
Nomination and Compensation CommitteeThe Board shall appoint the members and the Chairman of the Nomination and Com-pensation Committee from among its mem-bers. The Nomination and Compensation Committee shall have 3–4 non-executive Board members, the majority of whom shall be independent of the Company.
The Committee shall prepare matters re-lated to things such as the appointment of the members of the Board of Directors, the President and CEO and other senior manage-ment, evaluate the President and CEO’s per-formance and remuneration, and make rec-ommendations on the Company’s incentive compensation plans. The Committee’s tasks and responsibilities are defined in its Char-ter, which is based on a Board resolution. The Charter of the Nomination and Compen-sation Committee can be consulted on the Company’s website at www.konecranes.com > Investors > Corporate Governance.
The Nomination and Compensation Com-mittee shall meet at least once a year. The Chairman shall present a report on each Nomination and Compensation Committee meeting to the Board.
As of March 21, 2013, the Board’s Nomi-nation and Compensation Committee com-prised the following four (4) members:•Mr. Bertel Langenskiöld (Chairman),•Mr. Stig Gustavson (member),•Mr. Matti Kavetvuo (member),•Ms. Nina Kopola (member).
Mr. Stig Gustavson is deemed to be depend-ent on the Company, while all other members are independent of the Company. All other members are deemed independent of the Company’s major shareholders, except Mr. Bertel Langenskiöld.
The Nomination and Compensation Com-mittee convened twice (2) in 2013, and the average attendance of members at meetings was 100 percent. Attendance is shown in the table on Board meetings on page 37.
Remuneration paid to the Board of DirectorsThe remuneration paid to Board members is resolved by the Annual General Meeting. More information on the Board’s remunera-tion can be found on page 40 under Remu-neration of the Board of Directors.
President and CEOKonecranes’ President and CEO holds the position of Managing Director under the Com-panies Act. The Board decides on the ap-pointment and dismissal of the President and CEO. The President and CEO may be a member of the Board of Directors, but may not act as its Chairman. The current Presi-dent and CEO, Mr. Pekka Lundmark, is not a member of the Board of Directors.
ResponsibilitiesUnder the Companies Act, the President and CEO is responsible for the day-to-day man-agement of the Company in accordance with instructions and orders given by the Board. The President and CEO may only undertake actions which, considering the scope and nature of the Company’s operations, are unusual or extensive with the authorization of the Board. The President and CEO shall ensure that the Company’s accounting prac-tices comply with the law and that its finan-cial affairs have been arranged in a reliable manner. The President and CEO is also re-sponsible for preparing matters presented to the Board and for the Company’s strategic
planning, finance, financial planning, report-ing, and risk management.
President and CEO’s contract of employmentThe terms and conditions of the President and CEO’s contract of employment are spec-ified in writing in a document approved by the Board.
The President and CEO’s contract of em-ployment may be terminated with six months’ notice at any time by either the President and CEO or the Company. In the event that the Company terminates the contract without due cause, the Company shall pay the Presi-dent and CEO compensation corresponding to 18 months’ salary and fringe benefits, in addition to the salary for the notice period. When the President and CEO reaches the age of 63 years, both he and the Company may request his retirement. The President and CEO participates in an additional defined contribution plan with an annual payment set at 18.6 per cent of his annual salary exclud-ing performance-based compensation (an-nual or long-term incentives).
Group ManagementKonecranes has a two-tier operative manage-ment structure consisting of the Group Ex-ecutive Board (GXB) and the Senior Manage-ment Team (SMT). The latter replaced the Extended Management Team (EMT) as of February 1, 2013.
Group Executive BoardThe Group Executive Board consists of the following members:•Mr. Pekka Lundmark, President and CEO
(Chairman of Group Executive Board)•Mr. Hannu Rusanen, Executive Vice Presi-
dent and Head of Business Area Equip-ment
•Mr. Fabio Fiorino, Executive Vice Presi-dent and Head of Business Area Service, Chief Customer Officer; as of June 1, 2013 acting Head of Region APAC (Asia-Pacific)
38 Konecranes 2013 Corporate governanCe
•Mr. Mikko Uhari, Executive Vice Presi-dent, Strategy and Technology
•Mr. Teo Ottola, Chief Financial Officer•Mr. Antti Koskelin, Chief Information Of-
ficer (GXB member as of January 1, 2013)
•Mr. Timo Leskinen, Senior Vice President, Human Resources (as of August 1, 2013)
•Mr. Ari Kiviniitty, acting Chief Technology Officer (GXB member until January 31, 2013).
The biographical details of Group Executive Board members can be found on pages 52–53.
The Group Executive Board assists the President and CEO, but has no official statu-tory position based on legislation or the Ar-ticles of Association. In practice, however, it plays a significant role in the Company’s management system, strategy preparation, and decision-making.
Senior Management TeamIn addition to Group Executive Board mem-bers, the members of the Senior Manage-ment Team include the Heads of Konecranes Regions; the Equipment Business Unit Heads and Heads of Business Lines Indus-trial Crane Products and Industrial Crane Solutions; the Heads of Customer and Ser-vice Technology, Business Unit Parts, Product Management & Engineering; the Vice Presi-dent, General Counsel; the Vice President, Marketing & Communications; the Director, Investor Relations; the Director, Business Analysis and Support; and the Chief Supply Chain Officer.
The Senior Management Team consists of the following members:•Mr. Pekka Lundmark, President and CEO•Mr. Hannu Rusanen, Executive Vice Presi-
dent and Head of Business Area Equip-ment
•Mr. Fabio Fiorino, Executive Vice Presi-dent and Head of Business Area Service, Chief Customer Officer; as of June 1,
2013 acting Head of Region APAC (Asia-Pacific)
•Mr. Mikko Uhari, Executive Vice Presi-dent, Strategy and Technology
•Mr. Teo Ottola, Chief Financial Officer•Mr. Antti Koskelin, Chief Information Of-
ficer•Mr. Timo Leskinen, Senior Vice President,
Human Resources (as of August 1, 2013)
•Mr. Ari Kiviniitty, Senior Vice President, Head of Product Management and Engi-neering (as of February 1, 2013)
•Mr. Pekka Lettijeff, Chief Supply Chain Officer, Head of Supply Chain Manage-ment (until August 31, 2013)
•Mr. Ilkka Ylänen, Chief Supply Chain Of-ficer, Head of Supply Chain Management (as of September 1, 2013)
•Mr. Aku Lehtinen, Senior Vice President and Head of Region IMEA (India, Middle East and Africa)
•Mr. Tomas Myntti, Senior Vice President and Head of Region EUR (Europe)
•Mr. Tom Sothard, Senior Vice President and Head of Region Americas
•Mr. Ryan Flynn, Senior Vice President and Head of Region Asia-Pacific (until May 31, 2013)
•Ms. Sirpa Poitsalo, Vice President, Gen-eral Counsel
•Ms. Jaana Rinne, Vice President, Human Resources (until April 30, 2013)
•Mr. Mikael Wegmüller, Vice President, Marketing and Communications
•Mr. Marko Äkräs, Vice President, Head of Customer and Service Technology, Depu-ty Head of Business Area Service
•Mr. Miikka Kinnunen, Director, Investor Relations (as of February 1, 2013)
•Mr. Tapani Tilus, Vice President, Head of Light Lifting (as of February 1, 2013)
•Mr. Kari Utriainen, Vice President, Head of Business Unit Alfa (as of February 1, 2013)
•Mr. Mika Mahlberg, Vice President, Head of Business Unit Port Cranes (as of Feb-ruary 1, 2013)
•Mr. Lars Fredin, Vice President, Head of Business Unit Lift Trucks (as of February 1, 2013)
•Mr. Jukka Paasonen, Vice President, Head of Industrial Crane Products (as of February 1, 2013)
•Mr. Marko Tulokas, Vice President, Head of Industrial Crane Solutions (as of Feb-ruary 1, 2013)
•Mr. Juha Pankakoski, Vice President, Head of Business Unit Parts (as of Febru-ary 1, 2013)
•Mr. Topi Tiitola, Director Business Analy-sis and Support (as of November 1, 2013).
The biographical details of Senior Manage-ment Team members can be found on pages 54–55.
The Senior Management Team focuses on a systematic review of the progress of strat-egy implementation.
Business Areas’ operations are inter-linked and synergy-driven. Business Area Executive Vice Presidents are responsible for the day-to-day management of their Business Areas, which are ultimately responsible for the Group’s financial performance.
Regional Senior Vice Presidents are re-sponsible for managing the Group’s activities in geographical areas. The Regional organiza-tion brings together Business Areas to form a uniform customer interface for the Group, with the primary goal of maximizing the Group’s position within each Region. Region-al Senior Vice Presidents have line responsi-bility for equipment sales and service, within the guidelines given by Business Areas. Ad-ditionally, they are responsible for coordinat-ing and providing administrative services for operations not directly reporting to them, such as manufacturing.
Group Staff forms a common resource for handling matters of importance for the entire Group.
Meeting PracticesThe GXB convenes as frequently as neces-sary, normally on a monthly basis. The SMT
39Konecranes 2013Corporate governanCe

Fees payable to the Board of DirectorseUr annual fee in 2013
Chairman of the Board 105,000.00
Vice Chairman 67,000.00
Board member 42,000.00
Fee per Board Committee meeting 1,500.00
Chairman of the Audit Committee per AC meeting 3,000.00
Board members are also reimbursed for their travel expenses.
Total compensation paid to the Board of Directors in 2013
Cash, eUr shares, eUr shares, #Committee
meetings, eUr total, eUr
Gustavson Stig, Chairman of the Board 52,523.22 52,476.78 1,873 3,000 108,000.00
Adde Svante, Board member 21,014.89 20,985.11 749 12,000 54,000.00
Järvinen Tapani, Board member 21,014.89 20,985.11 749 6,000 48,000.00
Kavetvuo Matti, Board member 21,014.89 20,985.11 749 3,000 45,000.00
Kopola Nina, Board member 21,014.89 20,985.11 749 3,000 45,000.00
Langenskiöld Bertel, Board member 21,014.89 20,985.11 749 3,000 45,000.00
Persson Malin, Board member 21,014.89 20,985.11 749 6,000 48,000.00
Silvennoinen Mikael, Board member 21,014.89 20,985.11 749 4,500 46,500.00
total 199,627.45 199,372.55 7,116 40,500 439,500.00
convenes regularly twice a year. In addition, Group-level results are reviewed monthly un-der the chairmanship of the President and CEO. Business Areas and Regions have their own management teams that convene on a regular basis.
Remuneration Principles applied to remuneration schemesAll Konecranes remuneration schemes are designed to promote high performance and emphasize focus and commitment to busi-ness targets. Remuneration schemes pro-mote competitiveness and the long-term fi-nancial success of the Company and contribute to the favorable development of shareholder value.
The objective is that all Konecranes em-ployees should have a variable component based on their performance as part of their overall remuneration. The size of this varia-ble component varies according to a person’s position in the organization. Typically, these variable components are based on the finan-cial results of the Group and/or the unit in question and personal achievements. Remu-neration schemes are drawn up in writing
and numerical evaluation is used whenever possible.
All remuneration schemes are designed to meet both global and local needs, and may differ between locations as a result.
Decision-making processThe Annual General Meeting adopts resolu-tions and decides the remuneration of the Board of Directors and the Board’s Commit-tees annually. The Nomination and Compen-sation Committee reviews the President and CEO’s performance. Based on the review and other relevant facts, the Board determines
the total remuneration package of the Presi-dent and CEO.
The Nomination and Compensation Com-mittee also evaluates and prepares for Board decision the remuneration packages of Group Executive Board members who report directly to the President and CEO. The remu-neration packages for other Senior Manage-ment Team members are decided on by the President and CEO.
All Konecranes remuneration issues are decided by the ’one above’ principle, i.e. a manager’s superior must always confirm the remuneration of an employee.
40 Konecranes 2013 Corporate governanCe
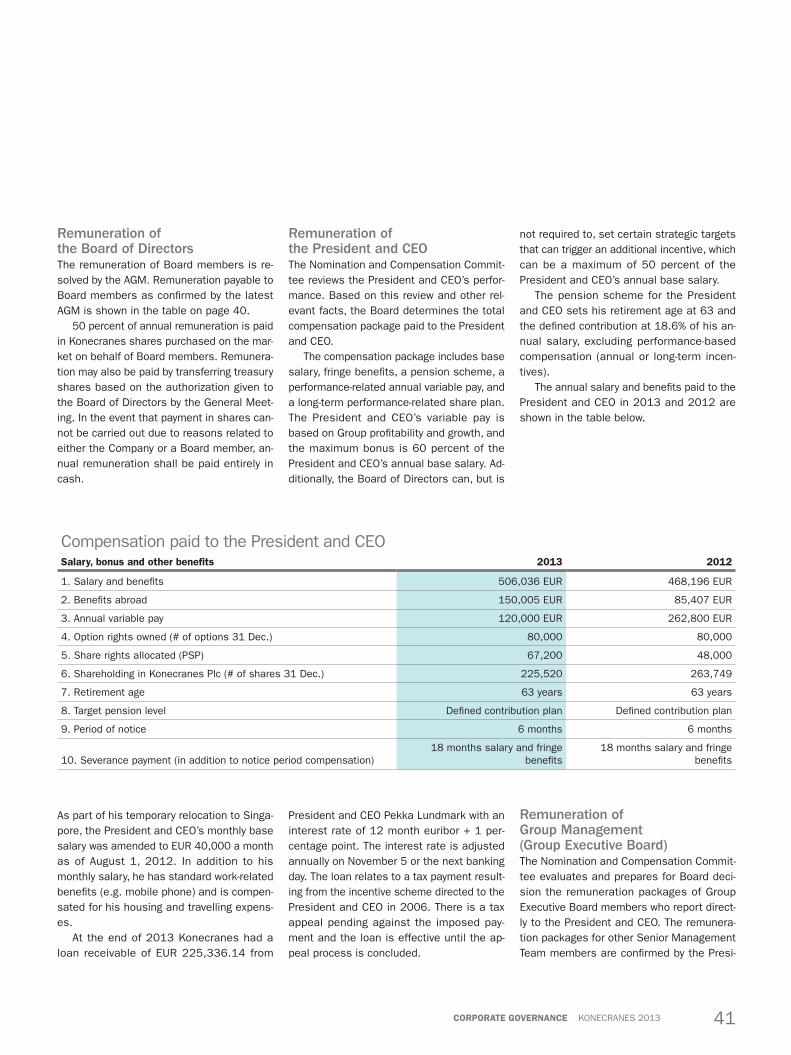
Compensation paid to the President and CEOsalary, bonus and other benefits 2013 2012
1. Salary and benefits 506,036 EUR 468,196 EUR
2. Benefits abroad 150,005 EUR 85,407 EUR
3. Annual variable pay 120,000 EUR 262,800 EUR
4.Optionrightsowned(#ofoptions31Dec.) 80,000 80,000
5. Share rights allocated (PSP) 67,200 48,000
6.ShareholdinginKonecranesPlc(#ofshares31Dec.) 225,520 263,749
7. Retirement age 63 years 63 years
8. Target pension level Defined contribution plan Defined contribution plan
9. Period of notice 6 months 6 months
10. Severance payment (in addition to notice period compensation)18 months salary and fringe
benefits18 months salary and fringe
benefits
Remuneration of the Board of DirectorsThe remuneration of Board members is re-solved by the AGM. Remuneration payable to Board members as confirmed by the latest AGM is shown in the table on page 40.
50 percent of annual remuneration is paid in Konecranes shares purchased on the mar-ket on behalf of Board members. Remunera-tion may also be paid by transferring treasury shares based on the authorization given to the Board of Directors by the General Meet-ing. In the event that payment in shares can-not be carried out due to reasons related to either the Company or a Board member, an-nual remuneration shall be paid entirely in cash.
Remuneration of the President and CEO The Nomination and Compensation Commit-tee reviews the President and CEO’s perfor-mance. Based on this review and other rel-evant facts, the Board determines the total compensation package paid to the President and CEO.
The compensation package includes base salary, fringe benefits, a pension scheme, a performance-related annual variable pay, and a long-term performance-related share plan. The President and CEO’s variable pay is based on Group profitability and growth, and the maximum bonus is 60 percent of the President and CEO’s annual base salary. Ad-ditionally, the Board of Directors can, but is
not required to, set certain strategic targets that can trigger an additional incentive, which can be a maximum of 50 percent of the President and CEO’s annual base salary.
The pension scheme for the President and CEO sets his retirement age at 63 and the defined contribution at 18.6% of his an-nual salary, excluding performance-based compensation (annual or long-term incen-tives).
The annual salary and benefits paid to the President and CEO in 2013 and 2012 are shown in the table below.
As part of his temporary relocation to Singa-pore, the President and CEO’s monthly base salary was amended to EUR 40,000 a month as of August 1, 2012. In addition to his monthly salary, he has standard work-related benefits (e.g. mobile phone) and is compen-sated for his housing and travelling expens-es.
At the end of 2013 Konecranes had a loan receivable of EUR 225,336.14 from
President and CEO Pekka Lundmark with an interest rate of 12 month euribor + 1 per-centage point. The interest rate is adjusted annually on November 5 or the next banking day. The loan relates to a tax payment result-ing from the incentive scheme directed to the President and CEO in 2006. There is a tax appeal pending against the imposed pay-ment and the loan is effective until the ap-peal process is concluded.
Remuneration of Group Management (Group Executive Board)The Nomination and Compensation Commit-tee evaluates and prepares for Board deci-sion the remuneration packages of Group Executive Board members who report direct-ly to the President and CEO. The remunera-tion packages for other Senior Management Team members are confirmed by the Presi-
41Konecranes 2013Corporate governanCe

dent and CEO. Compensation packages nor-mally include basic salary, fringe benefits (typically use of a company car and mobile phone), contribution-based pension schemes, annual performance-related incen-tive schemes and a long-term performance-related share plan.
Incentive schemes are always based on written contracts. Incentive criteria vary, but are usually based on the Group’s five Key Performance Areas: Safety, Customer, Peo-ple, Growth, and Profitability. Annual variable pay is related to an individual’s performance, to the Group’s performance and the perfor-mance of the unit that he/she belongs to. Numerical performance criteria are used rather than personal assessments, when-ever possible. The annual variable pay per-centage is based on an individual’s respon-sibilities and is a maximum of 50 percent of his or her annual base salary.
The Finnish members of the Group Execu-tive Board (GXB) participate in a defined contribution-based group pension insurance scheme, which can be withdrawn from the age of 60. However, the retirement age is set according to the Finnish Employees Pensions Act (TyEL). Finnish GXB members have life insurance and disability insurance cover. Non-Finnish members of the GXB participate in a defined contribution pension plan and have local insurance cover.
There were no loans issued by the Com-pany to the Group Executive Board (excluding the President and CEO) as of the end of De-cember 2013.
Performance Share Plan, 2012–2016As of the beginning of 2012, Konecranes launched a new long-term incentive plan for key employees and discontinued the use of stock option plans.
The purpose of the Performance Share Plan (PSP) is to motivate key personnel to contribute to the long-term success of the Company and to create shareholder value. It is also intended to create a joint sense of common ownership among managers, which is seen as valuable for a company like Konecranes with operations covering many countries, cultures, and customer industries.
The Board decides on the allocation of shares annually through a proposal made by the President and CEO. In allocating shares to the President and CEO, the Board acts independently.
Discretionary period, 2012–2014The 2012 Plan has one criterion for perfor-mance during fiscal 2012 and one for 2012–2014. Earned shares will be paid out in the first quarter of 2015. Under the 2012–2014 Plan, if the maximum performance level is achieved according to both criteria, the Pres-ident and CEO will be eligible for 48,000 shares and the Extended Management Team (EMT) of 2012 for a total of 240,000 shares (the maximums are gross numbers).
Discretionary period, 2013–2015The 2013 Plan has one criterion: cumulative EPS 2013–2015. Earned shares will be paid
out in the first quarter of 2016. Under the 2013–2015 Plan, if the maximum perfor-mance level is achieved, the President and CEO will be eligible for 48,000 shares and the other members of the Group Executive Board (GXB) for a total of 120,000 shares (the maximums are gross numbers).
The members of the Group Executive Board, including the President and CEO, have an obligation to continue owning at least 50% of the shares they earn annually through the Performance Share Plan until they own Company shares with a value equal to their annual salary including benefits.
Stock Option PlansIn the past, the Company has issued stock option plans for key employees, including top and middle management, and employees in certain expert positions. All these plans were adopted by the relevant General Meetings. The Board has decided to discontinue the use of these plans until further notice.
Konecranes Plc’s remaining outstanding stock option plans are Stock Options 2009A, 2009B, and 2009C.
The subscription periods for these plans are:•Stock Options 2009A:
1 April 2012 – 30 April 2014•Stock Options 2009B:
1 April 2013 – 30 April 2015•Stock Options 2009C:
1 April 2014 – 30 April 2016
Remuneration paid to managementgroup executive Board, excluding the president and Ceo 2013
1. Salary and benefits 1,283,773.08 EUR
2. Annual variable pay 246,130.80 EUR
3.Optionrightsowned(#ofoptions31Dec.) 141,500
4. Share rights allocated (PSP) 163,200
5.ShareholdinginKonecranesPlc(#ofshares31Dec.) 170,786
42 Konecranes 2013 Corporate governanCe

The terms and conditions of Konecranes’ stock option plans and the number of unsub-scribed stock options, based on outstanding stock option plans and the number of em-ployees concerned, can be consulted at the Company’s website at www.konecranes.com > Investors > Share information > Stock op-tion plans.
As of the end of 2013, approximately 180 employees were part of the Group’s stock option plans. More information on stock op-tions can be found in the Financial State-ments.
Employee Share Savings PlanKonecranes launched a new Employee Share Savings Plan on July 1, 2012 for all employ-ees except those in countries where the Plan could not be offered for legal or administra-tive reasons. A new plan period started on July 1, 2013.
The Plan also covers top management and the President and CEO. Participation is voluntary for all concerned.
Plan period 2012–2013Participants saved a monthly sum up to 5% of their gross salary, which was used to buy Konecranes shares from the market on be-half of participants. Savings were made from July 1, 2012 to June 30, 2013. If partici-pants are still in possession of these shares on February 15, 2016, they will receive one matching share for every two initially pur-chased.
Plan period 2013–2014The Plan allows participants to save a month-ly sum up to 5% of their gross salary, which is used to buy Konecranes shares from the market on behalf of participants. Savings will be made from July 1, 2013 to June 30, 2014. If participants are still in possession of these shares on February 15, 2017, they will receive one matching share for every two initially purchased.
Insider administrationThe Board has approved a set of Insider Rules for Konecranes based on the Finnish Securities Markets Act, standards issued by the Financial Supervision Authority, and the NASDAQ OMX Helsinki Guidelines for Insid-ers in force as of July 1, 2013.
Konecranes’ Public Insider Register in-cludes the members of the Board of Direc-tors, the President and CEO, the Secretary to the Board, the Auditor, the members of the Senior Management Team, as well as other persons holding a comparable position in the Group, as decided by the Company. In addi-tion, Konecranes’ Company-Specific Perma-nent Insiders include persons defined by the Company, who regularly possess inside infor-mation due to their position in the Company.
Persons registered in the Public Insider Register and the Permanent Insider Register are not allowed to trade in Konecranes secu-rities during a period commencing on the first day after the end of each calendar quarter and ending upon the publication of the Com-pany’s corresponding interim report or finan-cial statement bulletin. Trading is also not allowed during the entire day on which re-sults are announced. The Company main-tains Project-Specific Insider Registers for all insider projects. People listed in these regis-ters are prohibited from trading in Konecranes shares until termination of the project concerned.
The General Counsel maintains Konecranes’ register of insider holdings and is responsible for monitoring compliance with insider guidelines and declaration require-ments. The Company maintains its public insider register in Euroclear Finland Ltd.’s SIRE system.
The share and option holdings held by Konecranes’ public insiders can be consult-ed using the NetSire register.
AuditThe main function of statutory auditing is to verify that Konecranes’ financial statements represent a true and fair view of the Group’s performance and financial position for the financial year, which is the calendar year. The Auditor reports to the Board’s Audit Commit-tee on a regular basis and is obliged to audit the validity of the Company’s accounting and closing accounts for the financial year and to give the General Meeting an auditor’s report. Konecranes’ Auditors are elected by the AGM and hold office until further notice. The same auditor with principal responsibility may not serve for more than seven financial years. A proposal for the election of external auditors made by the Audit Committee shall be in-cluded in the invitation to the AGM. The Audit Committee strives to put the selection of the external auditor out to tender at regular in-tervals.
Ernst & Young Oy, Authorized Public Ac-countants, has been the Company’s external auditor since 2006. Mr. Heikki Ilkka served as Principal Auditor in 2013. Ernst & Young Oy and its affiliated audit companies re-ceived EUR 1,727,000 in fees for auditing Konecranes Group companies in 2013 and fees of EUR 820,000 for non-audit services.
43Konecranes 2013Corporate governanCe

Risk management, internal control, and internal auditing
Konecranes’ Board of Directors has defined and adopted a set of risk manage-ment principles based on widely accepted international good management practices. the audit Committee evaluates and reports on the adequacy and appropriateness of internal controls and risk management to the Board.
Risk management principlesRisk is anything that will clearly affect Konecranes’ ability to achieve its business objectives and execute its strategies. Risk management is part of Konecranes’ control system and is designed to ensure that any risks related to the company’s business op-erations are identified and managed ade-quately and appropriately to safeguard the continuity of Konecranes’ business at all times.
The Group’s risk management principles provide a basic framework for risk manage-ment across Konecranes, and each Group
company or operating unit is responsible for its own risk management. This approach guarantees the best possible knowledge of local conditions, experience, and relevance.
The Group’s risk management principles define risk management as a continuous and systematic activity aimed at protecting em-ployees from personal injury, safeguarding the assets of all Group companies and the Group as a whole, and ensuring stable and profitable financial performance. By minimiz-ing losses due to realized risks, and optimiz-ing the cost of risk management, Konecranes can safeguard its overall long-term competi-tiveness.
Significant risks for Konecranes Konecranes has assessed its strategic, op-erational, financial, and hazard risks. The list of risks below and the risk management methods described here are intended to be indicative only and should not be considered exhaustive.
Market risksDemand for Konecranes’ products and ser-vices is affected by the development of the local and global economy, regional and coun-try-specific political issues, as well as the business cycles of Konecranes’ customer
44 Konecranes 2013 risK ManageMent

industries. Capital expenditure on industrial cranes varies with the development of indus-trial production and production capacity, while demand for port equipment follows trends in global transportation and, over the shorter term, port investment cycles. The lift truck cycle follows other product segments. Demand for maintenance services is driven by customers’ capacity utilization rates. In addition to risks related to sales volumes, adverse changes in demand can also result in overcapacity and affect market prices, as can the actions of competitors.
Konecranes’ aim is to increase the pro-portion of service revenue in its total revenue stream and thereby reduce its exposure to economic cycles. In general, the demand for service is less volatile than that for equip-ment.
As part of its strategy, Konecranes strives to maintain a wide geographical presence to balance out economic trends in different market areas. Konecranes also aims to limit the risks resulting from changes in demand in different customer segments and demand for certain products by maintaining a diverse customer base and offering a wide range of products and services. By active product de-velopment, Konecranes also strives to dif-ferentiate itself from its competitors and re-duce the competitive pressures that it experiences.
In 2013, Konecranes continued controlled geographical expansion into long-term lucra-tive areas and maintained a broad industrial segment presence. Ongoing brand building continues to positively balance out possible
brand-specific business risks. In the product development area, particular emphasis was placed on developing an offering matching market-specific needs to ensure that the Group offers an appropriate mix of products suitable for local markets.
Customer credit risksChallenges with customer payments could adversely affect Konecranes’ financial situa-tion. To limit this risk, we apply a conserva-tive credit policy in respect of our customers. It is Konecranes practice to review custom-ers carefully before entering into a formal business relationship with them and to re-quire credit reports from new customers. The credit risks of our customers are mitigated with advance payments, letters of credit, pay-ment guarantees, and credit insurance where applicable. By using these tools and care-fully monitoring customer payments, we have successfully been able to limit our credit risks.
During 2013, Konecranes enhanced its receivables collection process. Development projects improved our potential to make more systematic use of customer credit data.
Technology risksKonecranes recognizes that there are various threats and opportunities related to the de-velopment of new products and services in its business. Active management of intellec-tual property rights is essential in the global marketplace.
Konecranes continuously monitors gen-eral market trends, technological develop-ments, competitors’ actions, customer be-havior, and developments in various industry segments in order to identify signs of poten-tial changes that could impact us.
Dedicated, process-driven product devel-opment operations have sustained Konecranes’ leadership in offering advanced technologies, products, and services to lift its customers’ businesses. Acquisitions can also be used to gain access to advanced technologies where appropriate. By working with outside research organizations and uni-versities, we secure both access to and awareness of technological development im-portant in our field of operations. Konecranes ensures that its innovations are protected by international patents wherever applicable, and protects its trademarks.
During 2013, Konecranes continued an internal project aimed at enhancing our offer-ing for emerging markets. As a part of this effort, special emphasis was put on develop-ing internal processes concerning intellec-tual property rights, reflecting our commit-ment to proactively protecting our rights in this area.
To secure our future market position, we continued to focus on developing solutions leveraging the benefits of the Industrial Inter-net. This will see the intelligence of our lifting devices increase further, as will that of our customer services offering based on intelli-gent data. This data also serves as an excel-lent source of information for future product development.
45Konecranes 2013risK ManageMent
Conducting business in emerging and developing marketsKonecranes sells in many developing coun-tries and has its own personnel and manu-facturing and supplier networks in these ar-eas. Sudden changes in the political environment, economic, or regulatory frame-work of these areas can have an adverse effect on Konecranes’ business. By having our own presence in some of these coun-tries, Konecranes gains direct information on changes affecting the local business environ-ment. Additionally, Konecranes conducts careful evaluations of the political, social, and economic environment in specific coun-tries to ensure that it is aware of develop-ments there.
The risks related to emerging and devel-oping markets are balanced by Konecranes’ strong global presence and stable service operations in developed countries in Europe and North America.
Emerging countries represent a significant and ongoing market opportunity, as econom-ic growth is expected to be faster there than the global average; and Konecranes will con-tinue its efforts to expand its presence in these areas both through organic growth and acquisitions.
In 2013, the focus was mainly on con-tinuing the development of existing opera-tions. Training personnel in our risk manage-ment processes, including Konecranes’ Code of Conduct, was also prioritized.
PersonnelKonecranes’ ability to operate is dependent on the availability, expertise, and compe-tence of professional personnel.
Konecranes is continuing to develop its employer brand, onboarding, recruiting, and resourcing practices to ensure that it has professional and engaged employees.
Economic uncertainty continued to be an issue in 2013 and also impacted Konecranes and its employees.
Despite uncertainty during the year, Konecranes continued to invest in training and developing its employees. Particular em-phasis was given to increasing technical training and starting the development of sales personnel. Employee engagement re-mained at a high level.
Effective management has been central to developing employee satisfaction in recent years and 2013 was no different. The recog-nition given to people for good work has proved successful and helps keep employee satisfaction at a high level. Employees’ per-ception of Konecranes’ overall leadership culture is also very good. Fairness in reward-ing and involving employees in decision-mak-ing continues to be a key priority.
Succession planning and talent manage-ment has been conducted to ensure that Konecranes has a solid pipeline of future leaders.
AcquisitionsUnsuccessful acquisitions or a failure to suc-cessfully integrate an acquired company could result in reduced profitability or hamper the implementation of corporate strategy. Konecranes reduces the risks associated with acquisitions by carrying out thorough due diligence analyses, using external advi-sors when needed.
The emphasis of acquisition process de-velopment work during 2013 focused on joint venture arrangements.
Production risksKonecranes’ strategy is to maintain in-house production of key components that have high added value and/or provide core competitive advantages. There are specific risks involved with different aspects of production, such as production capacity management, operation-al efficiency, continuity, and quality.
Efforts have continued to further develop production operations. Continuous replace-ment investments and enhanced mainte-nance of production equipment have been carried out. The capacity of acquired compa-nies has become an integral part of the global production network on a phased ba-sis. Risk management is an essential ele-ment of production strategy. The safety and security of key facilities continued to improve during 2013.
Material management and procurement risks Material management and procurement op-erations require a proactive approach and development to avoid risks related to issues such as pricing, quality, capacity, availability,
and inventory values. Inefficiencies in these areas could affect the performance of Konecranes adversely. Konecranes manages its purchases and the logistics of materials and components of substantial importance for its operations on a centralized basis. Contracts with key suppliers are designed to optimize these purchases globally.
During 2013, Konecranes continued to develop the quality and scope of supplier cooperation and its audit process. We have also continued to improve demand-supply monitoring, balancing, and forecasting to im-prove our ability to respond to customer needs rapidly. In addition, we are further de-veloping our use of cloud-based solutions to provide a real-time communication flow be-tween our supply base and manufacturing entities.
Quality risksHigh-quality products, business procedures, processes, and services play a key role in minimizing Konecranes’ business risks. Most companies in the Group and all major Group operations use certified quality procedures. Several existing quality certificates were up-dated and new ones received in 2013. De-termined certification work is continuing in line with Konecranes’ principles in this area.
During 2013, Konecranes continued de-veloping both its local and global quality im-provement processes. Lean Six Sigma train-ing has been boosted to ensure continuous competence development to carry out sys-tematic process and quality development, both locally and globally. Our product line-based factory acceptance test system has been further developed as part of continuous improvement. Supplier quality has been de-veloped in the same way.
Supplier risksKonecranes recognizes that price and conti-nuity risks are associated with some of its key suppliers, as they could be difficult to replace. In the event of major production problems, this could undermine Konecranes’ delivery capability. Quality risks and defects associated with subcontracted components are quality risks for Konecranes.
To reduce subcontracting risks, Konecranes constantly seeks competitive alternative suppliers while improving coop-
46 Konecranes 2013 risK ManageMent
eration with existing suppliers. When avail-able, alternative suppliers enhance price competition, increase production capacity, and reduce Konecranes’ risks of single sup-plier dependency.
During 2013, Konecranes continued to focus on ensuring the quality of cooperation to generate mutual benefits with critical sup-pliers. Improving Konecranes’ quality pro-cesses enhanced the links between supplier quality and our customers’ quality experi-ence.
IT risksKonecranes IT is responsible for all IT ser-vices, applications, and assets used by Group companies. Konecranes’ operations depend on the availability, reliability, quality, confidentiality, and integrity of information. Any and all information security risks and incidents may affect business performance adversely.
Konecranes uses reliable IT solutions and employs efficient information security man-agement to avoid data loss and prevent the confidentiality, availability, or integrity of data from being compromised. User care and sup-port is exercised with internal and out-sourced IT services to ensure the high avail-ability, resiliency, and continuity of services, and rapid recovery in the event of any tem-porary loss of key services.
During 2013, Konecranes continued im-plementing global IT applications, following the first pilots and business process harmo-nization work. Implementations of this type always include risks in terms of schedule, cost and content. Realization of schedule risk may lead to delays in business benefit realization. Content risk can be realized if a business model cannot be implemented as planned with selected applications. Delays in schedules and challenges with implemen-tations may lead to higher total project costs.
Konecranes IT operated as a business support function in 2013, with a presence in roughly 20 countries.
Contract and product liability risksKonecranes can be subject to various legal actions, claims, and other proceedings in various countries typical for a company in its industry and consistent with a global busi-ness that encompasses a wide range of
products and services. These may involve contractual disputes, warranty claims, prod-uct liability (including design defects, manu-facturing defects, failure to post appropriate warnings, and asbestos legacy), employment, auto liability, and other matters involving claims related to general liability. These risks are managed by continuously monitoring op-erations, improving product safety, training customers, and making use of detailed sales terms. Konecranes also issues written poli-cies in some cases to ensure compliance with legislation, regulations, and Konecranes’ own principles across the Konecranes Group. Particular emphasis is placed on training to ensure that employees are aware of and comply with the applicable legislation, regula-tions, and principles relating to their work. Konecranes’ Legal Department retains out-side experts to assist here when necessary.
Illegal activitiesKonecranes aims to comply with all applica-ble laws and regulations, but breaches of the company’s policies resulting in illegal activi-ties can threaten the company. Konecranes considers the potential risks involved to be limited, however, although it recognizes that even small-scale illegal activity could damage its reputation and affect its financial condi-tion and results adversely. Internal proce-dures, supervision, audits, and practical tools are used to reduce Konecranes’ expo-sure to these types of risks.
During 2013, Konecranes continued im-proving and deploying tools and processes related to good governance and management practices. Thanks to a concentrated effort, the vast majority of employees completed training on Konecranes’ Code of Conduct.
Damage risksDamage risks include business interruption risks, occupational health and safety-related risks, environmental risks, fire and other dis-asters, natural events, and premises secu-rity risks. Konecranes identifies and assess-es these risks continuously as part of its business processes. To mitigate these risks, we have adopted a number of occupational health and safety guidelines, certification principles, rescue planning, and premises security instructions. Konecranes has also sought to prepare for the materialization of
these risks through various insurance pro-grams and by continuously improving its pre-paredness to deal with various potential cri-sis situations.
During 2013, Konecranes continued har-monizing its global occupational safety re-quirements and instructions. Corporate minimum requirements of safety in electrical work, working at height, and using personal protective equipment were implemented fur-ther down in the organization and integrated into common safety training. Improving har-monization in these areas will continue over the next few years.
Financial risksKonecranes manages most of its financial risk on a centralized basis through its Group Treasury. Group Treasury operates through Konecranes Finance Corporation, which acts as a financial vehicle for the Group at Corpo-rate Headquarters. Konecranes Finance Cor-poration is not a profit center that strives to maximize its profits, but rather its role is to help the Group’s operating companies re-duce the financial risks associated with global business operations, such as market, credit, and liquidity risks. The most signifi-cant market risk relates to foreign currency transaction risk.
The responsibility for identifying, evaluat-ing, and controlling the financial risks arising from the Group’s global business operations is divided between business units and Konecranes Finance Corporation.
Units hedge their risks internally with Group Treasury. The majority of the Group’s financial risks are channeled through Konecranes Finance Corporation, where they can be evaluated and controlled efficiently.
Almost all funding, cash management, and foreign exchange transactions with banks and other external counterparties are carried out centrally by Konecranes Finance Corporation in accordance with the Group’s Treasury Policy. Only in a few special cases, where local central bank regulations prohibit the use of Group services for hedging and funding, is this done directly between an op-erating company and a bank under the super-vision of Group Treasury.
Konecranes Finance Corporation uses a treasury system that enables transactions to be processed in real time and provides in-
47Konecranes 2013risK ManageMent
depth records of activities and performance. Standard reporting is done on a weekly basis and covers Group-level commercial and finan-cial cash flows, foreign currency transaction exposure, debt positions, derivatives portfo-lios, and counterparty credit exposure for fi-nancial transactions. In addition, all Group companies participate in monthly managerial and statutory reporting.
See Note 3 to the Financial Statements and the Board of Directors’ Report for a de-tailed overview of financial risk management.
InsuranceThe Group reviews its insurance policies as part of its overall risk management on a con-tinuous basis. Insurance policies are used to cover all risks that are economically feasi-ble or otherwise reasonable to insure.
Internal Auditing Konecranes’ Internal Audit function is an in-dependent, objective assurance and consult-ing unit, which assists the organization in achieving its objectives. The unit evaluates the efficiency of risk management, control, and governance processes and investigates all reports of suspected incidents. The latter can be made in person or through a confiden-tial e-mail reporting channel.
Internal Audit operates according to an audit plan approved by the Board’s Audit Committee. The unit’s working methods are based on the professional standards laid down by the Institute of Internal Auditors (IIA) and focus on process-oriented engagement rather than solely entity-based auditing.
Administratively, Internal Audit reports to the Group CFO; and Internal Audit activities are reported to the Board’s Audit Committee on a regular basis.
Internal control and risk management related to financial reportingInternal control related to financial reporting is designed to provide reasonable assurance concerning the reliability of financial report-ing and the preparation of financial state-ments for external purposes in accordance with generally accepted accounting princi-ples, applicable laws and regulations, and
other requirements covering listed compa-nies. Risk management is considered an integral part of running the Konecranes busi-ness. Konecranes’ corporate risk manage-ment principles provide a basic framework for risk management, while each Group com-pany or operating unit is responsible for its own risk management. This principle is also followed in risk management related to finan-cial reporting.
Management of financial risks is de-scribed in Note 3 of Konecranes’ Financial Statements 2013.
Control environmentKonecranes simplified its operational model as from January 1, 2013 to further improve result accountability, clarity, speed, and cost efficiency. The main changes were as follows:
The Market Operations and Business Area Service organizations have been con-solidated under a single executive in the Group Executive Board (GXB), thus eliminat-ing the earlier matrix structure in Business Area Service and allowing it to be managed as a straightforward line organization accord-ing to the regional structure.
Business Area Equipment continues to operate as a matrix organization where Glob-al Business Units form one dimension and Geographical Regions the other dimension. Global Business Units have end-to-end result accountability.
The regional structure of Konecranes has been changed to give it a more natural geo-graphical alignment. The new internal region-al structure (Geographical Regions) includes newly configured Region Europe (EUR) and Region India, Middle East and Africa (IMEA). Regions Americas (AME) and Asia-Pacific (APAC) continue as before.
Financial targets are set and planning/follow-up activities are executed along both dimensions of the matrix organization in ac-cordance with the overall business targets of the Konecranes Group. The operations of the Service business are typically monitored based on profit-responsible service branches (345 in 2013), which are further consolidat-ed to country and region levels, and business units (6 in 2013). The Equipment business is mainly monitored via business units (5 in 2013), which are divided into business lines.
Corporate governance and business man-agement at Konecranes are based on the company’s values of trust in people, total service commitment, and sustained profita-bility. The control environment is the founda-tion for all the other components of internal control and for promoting employees’ aware-ness of key issues. It supports the execution of strategy and regulatory compliance. The Board of Directors and Group Management are responsible for defining the Konecranes Group’s control environment through corpo-rate policies, instructions, and financial re-porting frameworks. These include the Konecranes Code of Conduct and the Konecranes Controller’s Manual, which con-stitutes the main tool for accounting and fi-nancial reporting principles in respect of providing information, guidelines, and instruc-tions. The interpretation and application of accounting standards is the responsibility of the Global Finance function. Guidelines and instructions for reporting are updated when necessary and are reviewed at least once a year.
Control activitiesKonecranes Group management has opera-tional responsibility for internal controls. Fi-nancial control activities are integrated into the business processes of the Konecranes Group and management’s business supervi-sion and monitoring procedures. The Group has identified and documented the signifi-cant internal controls that relate to its finan-cial processes either directly or indirectly through other processes. The total number of identified financial internal controls is ap-proximately 120. All legal entities and busi-ness units have their own defined controller functions. Representatives from controller functions participate in planning and evaluat-ing unit performance, and ensure that month-ly and quarterly financial reporting follows the Group’s policies and instructions and that all financial reports are delivered on time in accordance with schedules set by the Group.
Management follow-up is carried out through monthly management reporting rou-tines and performance review meetings. These meetings are conducted by business units/business areas, on country and re-gional, as well as Group level, and cover a
48 Konecranes 2013 risK ManageMent

review of the competitive situation, market sentiment, order intake and order book, monthly financial performance, quarterly and rolling 12-month forecasts, as well as safety, people, and customer topics. Group manage-ment follows up separately most important development activities; for example major IT development activities are monitored by the Business Infrastructure Board and R&D pro-jects by the Product Board. These Manage-ment Boards convene typically on a quar-terly basis.
MonitoringThe Group conducts an annual self-assess-ment through its controllers to monitor the effectiveness of selected financial internal controls. The Group also has an Internal Au-dit function, which is responsible for monitor-ing and evaluating the effectiveness of Konecranes’ risk management and internal control system. Internal Audit plans its work in cooperation with the Audit Committee, which approves an annual internal audit plan. The Audit Committee receives direct reports from external auditors and discusses and follows up their viewpoints. External au-ditors are also represented at Audit Commit-tee meetings. The Group’s financial perfor-mance is reviewed at every Board meeting, and the Board of Directors and the Audit
Committee review all external financial re-ports before they are made public.
The Group has a confidential e-mail re-porting channel (Whistleblower channel) through which matters related to suspected misconduct can be reported. All notices of suspected incidents are investigated by In-ternal Audit and findings are reported to the Audit Committee. We received six reports of suspected misconduct via the Whistleblower channel in 2013; these cases did not have a material impact on the Group’s financial results.
CommunicationThe Controller’s Manual, together with report-ing instructions and policies, are stored in the Konecranes intranet for access by per-sonnel. The Group, Business Areas, and Re-gions also arrange meetings to share infor-mation on financial processes and practices. Information for the Group’s stakeholders is regularly communicated via the Konecranes Group’s website. To ensure that the informa-tion provided is comprehensive and accurate, the Group has established a set of external communications guidelines. These define how, by whom, and when information should be issued; and are designed to ensure that Konecranes meets all its information obliga-tions and to further strengthen internal con-trols related to financial reporting.
During 2013Konecranes continued its IT system project (ERP for both the Service and Equipment business areas, CRM and People system) to further develop and implement harmonized processes, increase operational visibility and improve decision-making, and reduce the overall number of various IT systems. The pilot unit of the ERP system was launched at the end of September 2011, roll-outs took place in several new units in 2013, and fur-ther roll-outs will continue in other units over the next few years. Konecranes continued the implementation and development of the Financial Shared Service Center (FSSC) con-cept to offer mainly transaction handling ser-vices, financial master data maintenance, and some financial accounting services from regional centers to individual Konecranes companies.
The internal control environment will be improved using common, unified processes and a common system platform. Monitoring the effectiveness of internal controls will be-come more transparent following the imple-mentation of the ERP system. Financial Shared Service Centers create a unified framework for transactional processing and provide an enhanced segregation of duties.
Konecranes financial reporting manual (Controller’s Manual)
Control EnvironmentMain features of Internal Control related to financial reporting
External Audit
Internal Audit
FUNCTION CONTROL ACTIVITIES
Board of Directors Review of financial performance
Audit Committee Overview of financial reporting process
CEO and Group managementBusiness supervision
and monitoring
Management teams inBusiness Areas and Regions
Business supervision and monitoring
Reporting units Business Controlling
Feedback
Feedback
49Konecranes 2013risK ManageMent
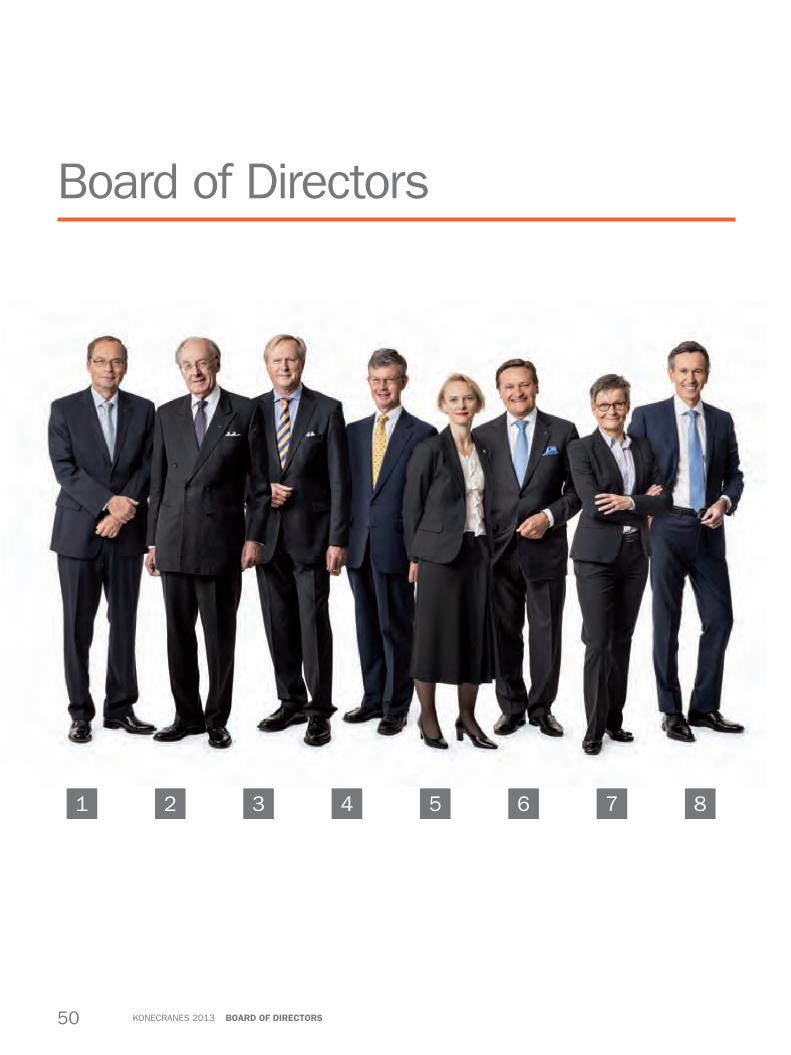
Board of Directors
1 2 3 4 5 6 7 8
50 Konecranes 2013 BoarD oF DireCtors
* Konecranes Plc received information on December 28, 2011 that the Chairman of the Board of Directors, Mr. Stig Gustavson, had donated all the shares he owned in Konecranes Plc at that time to his near relatives, while retaining the voting rights and right to a dividend attached to these shares for life. The donation encompasses a total of 2,069,778 shares.
Stig Gustavson 2b. 1945 Chairman of the Board since 2005. Board Member since 1994 and Member of the Nomination and Compensation Committee since 2006. M.Sc. (Eng.), Dr.Tech. (hon.) principal occupation: Board Professional primary working experience: KCI Konecranes Plc 1994–2005: President and CEO; KONE Cranes division 1988–1994: President; KONE Corporation 1982–1988, and prior to 1982: Holder of various executive positions in major Finnish corporations.Current key positions of trust: Ahlström Capital Oy: Chairman of the Board; Cramo Plc: Chairman of the Board; Dynea Oy: Vice Chairman of the Board; Handelsbanken Regional Bank Finland: Chairman of the Board; Oy Mercantile Ab: Vice Chairman of the Board; ÅR Packaging AB: Chairman of the Board; IK Investment Partners: Senior Regional Advisor; Technology Academy Foundation: Chairman of the Board; Mutual Pension Insurance Company Varma: Member of the Supervisory Board.Stig Gustavson is deemed to be dependent of the company based on the Board’s overall evaluation relating to his former and current positions in Konecranes combined with his substantial voting rights in the company. *) He is independent of any significant shareholder.shares: 4,149
Matti Kavetvuo 1b. 1944 Board Member since 2001. Chairman of the Nomination and Compensation Committee 2009–2011 and Member 2012. Member of the Audit Committee 2004 – 2008. M.Sc. (Eng.), B.Sc. (Econ.) principal occupation: Board Professionalprimary working experience: Pohjola Group Plc 2000 – 2001: CEO; Valio Ltd 1992 – 1999: CEO; Orion Corporation 1985 – 1991: CEO; Instrumentarium Corp. 1979 – 1984: President Current key positions of trust: No current key positions of trust.Independent of the company and its significant shareholders. shares: 10,749
Nina Kopola 7b. 1960 Board Member since 2011 and Member of the Nomination and Compensation Committee since 2011. M.Sc. (Chemical Eng.), Lic. Sc. (Tech.) principal occupation: President and CEO, Suominen Corporation primary working experience: Dynea Oy 2008 – 2011: Executive VP, President Europe; Dynea Oy 2006 – 2008: Executive VP, Global Market Applications; Dynea Oy 2005 – 2006: Group VP, Marketing; Dynea Oy 2000 – 2005: Various management positions in Marketing, Controlling and Business Analysis Current key position of trust: The Chemical Industry Federation of Finland: Board Member; The Finnish Plastics Industries
Federation: Board MemberIndependent of the company and its significant shareholders. shares: 2,375
Bertel Langenskiöld 3b. 1950 Board Member since 2012 and Chairman of the Nomination and Compensation Committee since 2012. M.Sc. (Eng.) principal occupation: Managing Director, Hartwall Capital Oy Ab primary working experience: Metso Paper and Fiber Technology 2009 – 2011: President; Metso Paper 2007 – 2008: President; Metso Paper’s Fiber Business Line 2006 – 2007: President; Metso Minerals 2003 – 2006: President; Fiskars Corporation 2001 – 2003: President and CEO; Tampella Power/Kvaerner Pulping, Power Division 1994 – 2000: PresidentCurrent key positions of trust: Karelia-Upofloor Oy: Board Member; Luvata Oy: Board Member; Inkerman International AB: Board MemberMr. Bertel Langenskiöld is independent of the Company. Mr. Langenskiöld is deemed to be dependent of significant shareholders of the Company based on his current position as the Managing Director of Hartwall Capital Oy Ab. HTT KCR Holding Oy Ab holds more than 10 percent of Konecranes Plc’s shares and votes. HTT KCR Holding Oy Ab is a subsidiary of Hartwall Capital Oy Ab. In addition, HTT KCR Holding Oy Ab, K. Hartwall Invest Oy Ab, Fyrklöver-Invest Oy Ab and Ronnas Invest AG will in practice co-operate in matters concerning their ownership in Konecranes Plc. shares: 1,659
Tapani Järvinen 6b. 1946 Board Member since 2009 and Member of the Audit Committee since 2009. M.Sc. (Eng), Lic. Sc. (Tech.) principal occupation: Board Professionalprimary working experience: Outotec Oyj 2006 – 2009: President and CEO; Outokumpu Technology, Finland 2003 – 2006: President and CEO; Outokumpu Oyj, Finland 2000 – 2005: Executive VP and Member of the Group Executive Committee; Compañía Minera Zaldívar, Chile 1994 – 2000: General Manager and CEO Current key positions of trust: Okmetic Oyj: Vice Chairman of the Board; Outotec Oyj: Board Member; Normet Oy: Board Member; Talvivaara Mining Company Plc: Chairman of the Board; Dragon Mining Ltd, Australia: Board Member; Finpro ry: Vice Chairman of the BoardIndependent of the company and its significant shareholders.shares: 4,263
Svante Adde 4b. 1956 Board Member since 2004, Member of the Audit Committee since 2004 and Chairman of the Audit Committee since 2008. B.Sc. (Econ. and Business Administration) principal occupation: Senior Adviser, Lincoln International, Board Professionalprimary working experience: Pöyry Capital Limited, London 2007–2013: Managing Director; Compass Advisers, London 2005 – 2007: Managing Director; Ahlstrom Corporation 2003 – 2005: Chief Financial Officer; Lazard London and Stockholm 2000 – 2003: Managing Director; Lazard London 1989 – 2000: Director; Citibank 1979 – 1989: Director Current key positions of trust: Meetoo AB: Chairman of the Board; Rörvik Timber AB: Board Member; Cambium Global Timberlands Ltd: Board MemberIndependent of the company and its significant shareholders. shares: 6,770
Malin Persson 5b. 1968 Board Member since 2005 and Member of the Audit Committee since 2012. Member of the Nomination and Compensation Committee 2005 – 2011.M.Sc. (Eng.) principal occupation: President & CEO, The Chalmers University Foundationprimary working experience: Volvo Group: Holder of various executive positions including: Volvo Technology Corporation: President and CEO; AB Volvo: VP, Corporate Strategy and Business Development; Volvo Transport Corporation: VP, Business & Logistics DevelopmentCurrent key positions of trust: Hexpol AB: Board Member; Becker Industrial Coatings: Board MemberIndependent of the company and its significant shareholders. shares: 5,918
Mikael Silvennoinen 8b. 1956 Board Member since 2008 and Member of the Audit Committee since 2008.M.Sc. (Econ.)principal occupation: Executive Chairman of the Board, IMS Talent Oyprimary working experience: Pohjola Group 1997 – 2013: President and CEO; 1989 – 1997: Holder of various executive positions; Wärtsilä Group 1983 – 1989: Group TreasurerCurrent key positions of trust: Unico Banking Group: Board Member; The Finnish Foundation for Share Promotion: Board MemberIndependent of the company and its significant shareholders.shares: 4,702
51Konecranes 2013BoarD oF DireCtors

Group Executive Board
1 2 3 4 5 6 7
52 Konecranes 2013 groUp eXeCUtive BoarD
Pekka Lundmark 4b. 1963president and CeoMember of the Group Executive Board since 2004Employed 2004M.Sc. (Eng.)primary working experience: KCI Konecranes 2004–2005: Group Executive Vice President; Hackman Abp 2002–2004: CEO; Startupfactory 2000–2002: Managing Partner; Nokia Corporation 1990–2000: various executive positionsCurrent key positions of trust: Marimekko Ltd.: Chairman of the Board; Federation of Finnish Technology Industries: Vice Chairman of the Board; Valmet Corporation: Board Member and Member of the Board’s Remuneration and HR Committee (since Dec. 31, 2013).shares: 225,520options to acquire: 80,000 shares
Teo Ottola 5b. 1968Chief Financial officerMember of the Group Executive Board since 2007Employed 2007M.Sc. (Econ.)primary working experience: Elcoteq SE 2004–2007: CFO; Elcoteq Network Oyj 1999–2004: Senior Vice President (Business Control and Accounting); Elcoteq Network Oyj 1998–1999: Group Business Controller; Elcoteq Lohja Oy 1996–1998: Business Controller; Rautaruukki Oy 1992–1996: Financial Plannershares: 24,385options to acquire: 32,500 shares
Hannu Rusanen 6b. 1957executive vice president, head of Business area equipmentMember of the Group Executive Board since 2004Employed 2003M.Sc. (Eng.)primary working experience: Konecranes 2007–2011: Executive Vice President, Head of Business Area Service; KCI Konecranes/Konecranes 2003–2006: Country Executive, Nordic; ABB Finland 1995–2002: Vice President, Service; Tampella Oy 1982–1995: Various management positions in Finland and in the USAshares: 45,508options to acquire: 25,000 shares
Fabio Fiorino 7b. 1967executive vice president, head of Business area service and Chief Customer officer; acting head of region apaC (asia-pacific) as of June 1, 2013Member of the Group Executive Board since 2012Employed 1995B. Eng. P.Eng. MBAprimary working experience: Konecranes Americas 2010–2011: Vice President, Head of Service, Region Americas; Morris Material Handling, Inc. 2006–2009: President; R&M Materials Handling, Inc. 1999–2006 / Drivecon, Inc. 2002–2006: President; Konecranes Americas 1998–1999: Vice President, Business Development, Latin America; Konecranes Canada, Inc. 1995–1998: Marketing Manager; AECL 1989–1994: Mechanical/Project Engineershares: -options to acquire: 9,000 shares
Mikko Uhari 3b. 1957executive vice president, strategy and technologyMember of the Group Executive Board since 1997Employed 1997Lic. Sc. (Eng.)primary working experience: KCI Konecranes/Konecranes 2011–2012: Executive Vice President, Head of Market Operations, 2010–2011: Executive Vice President, Head of Business Area Equipment, 2005–2009: President, New Equipment Business Areas; KCI Konecranes 2004–2005: President, Special Cranes (Heavy Lifting); KCI Konecranes 1997–2003: President, Harbor and Shipyard Cranes; KONE Corporation 1982–1997: Various managerial positions at Wood Handling Division (Andritz as of 1996–) in Finland, Sweden and in the USA, including: 1996–1997 Group Vice President, Marketing; 1992–1996: Group Vice President, Project Business; 1990–1992: Director, Wood Handling Unit, Finlandshares: 100,333options to acquire: 50,000 shares
Antti Koskelin 2b. 1970Chief information officer, CioMember of the Group Executive Board since 2013Member of the Extended Management Team 2009–2012Employed 2009B.Sc. (Information Technology)primary working experience: Nokia Corporation 1994–2008: Several global leadership positions in the USA and in Finland.shares: 560options to acquire: 15,000 shares
Timo Leskinen 1b. 1970senior vice president, human resources (as of august 1, 2013)Member of the Group Executive Board since 2013Employed 2013M.Sc. (Psy)primary working experience: Fiskars 2009–2013: Vice President, Human Resources; Nokia Services 2008–2009: Director HR; Nokia Customer and Market Operations 2006–2007: Director, HR; Nokia Ventures Organization 2004–2006: Head of Operations; MPS 1999–2000: HR Consultantshares: -options to acquire: 10,000 shares
53Konecranes 2013groUp eXeCUtive BoarD
Senior Management TeamRyan Flynnb. 1971senior vice president, head of region apaC (asia-pacific) (until May 31, 2013)Member of the Senior Management Team 2013; Member of the Extended Management Team 2009–2013Employed 2005–2013MBA, BComprimary working experience: Konecranes Plc., China 2005–2009: Director, Ports & Lift trucks; NFS Industrial Machinery, South Africa 2003–2005: General Manager; Afinta Motor Corporation, South Africa 1996–2000: Director; Standard Bank, South Africa 1990–1996: Business Managershares: 1,000options to acquire: 30,000 shares
Lars Fredinb. 1961vice president, head of Business Unit lift trucksMember of the Senior Management Team since 2013Employed 2009BSc, Small Business Managementprimary working experience: Bromma Conquip AB 2003–2009: Vice President Sales & Marketing; Metget AB 2000–2003: Business Consultant and Sales &Marketing Director (RFID technology); Kalmar AC 1998–2000: President; Kalmar Industries 1996–1998: Area Manager, East Asiashares: 142options to acquire: 22,500 shares
Miikka Kinnunenb. 1977Director, investor relationsMember of the Senior Management Team since 2013Employed 2009M.Sc. (Econ.)primary working experience: Carnegie Investment Bank AB 2001–2009: Financial Analystshares: -options to acquire: 5,000 shares
Ari Kiviniittyb. 1957senior vice president, product Management and engineering; acting Chief technology officer (until Jan 31, 2013)Member of the Senior Management Team since 2013; Member of the Extended Management Team 2012–2013; Member of the Executive Board 2005–Jan 31, 2013Employed 1983M.Sc. (Eng.)primary working experience: KCI Konecranes 2004–2005: Vice President, Standard Lifting
Equipment; 2002–2004: Managing Director, Hoist factory; 1999–2001: R&D Manager; 1996–1998: Technical Director, Components, SingaporeCurrent key positions of trust: Board member of FEM (The European Federation of Materials Handling Equipment Manufacturers); Member of Technology Industries of Finland Business and Technology Working Groupshares: 10,815options to acquire: 30,000 shares
Aku Lehtinenb. 1969senior vice president, head of region iMea (india, Middle-east & africa)Member of the Senior Management Team since 2013; Member of the Extended Management Team 2010–2013Employed 1994M.Sc. (Eng.)primary working experience: Konecranes 2011–2012: Senior Vice President, Head of Region WEMEA (Western Europe, Middle East and Africa); 2010–2011: Senior Vice President, Head of Region NEI (Nordic, East Europe and India); 2008–2010: Director, South East Europe; KCI Konecranes/Konecranes 2006–2008: Director, RTG Cranes; KCI Konecranes 2004–2006: Sales Director, Yard Cranes; 1994–2004: Sales, project & product management positions in Asia, Middle East and Europe.shares: 302options to acquire: 30,000 shares
Pekka Lettijeffb. 1961Chief supply Chain officer, head of supply Chain Management (until august 31, 2013)Member of the Senior Management Team 2013; Member of the Extended Management Team 2012–2013; Member of the Group Executive Board 2008–2011Employed 2008–2013University Degree in Business Administration, University of Växjö, Swedenprimary working experience: Nokia Siemens Networks 2007–2008: Head of Global Purchasing, Nokia Networks 2001–2008: Vice President, Supply Network Management and Vice President, Sourcing; Astra Zeneca 2000–2001: Vice President, Global Supply and Purchasing; 1986–1999: Various executive purchasing positions in automotive companies in the USA, Sweden and GermanyCurrent key positions of trust: Sanitec Corporation, Board membershares: -options to acquire: 15,000 shares
Mika Mahlbergb. 1963vice president, head of Business Unit port CranesMember of the Senior Management Team since 2013
Employed 1997M.Sc. (Eng.)primary working experience: KCI Konecranes/Konecranes 2006–2007: Director, VLC Cranes; KCI Konecranes 2000–2006: Director, STS Cranes; KCI Konecranes 1997–2000: Project Manager, Harbor and Shipyard Cranes; Crown Cork & Seal Company 1996–1997: World Class Manufacturing Manager; Partek Group 1990–1995: Various managerial positions in Business Area Precast Concrete in Finland and Belgiumshares: 2,169options to acquire: 30,000 shares
Tomas Mynttib. 1963senior vice president, head of region eUr (europe)Member of the Senior Management Team since 2013; Member of the Extended Management Team 2011–2013Employed 2008M.Sc. (Eng.)primary working experience: Konecranes 2011–2012: Senior Vice President, Head of Region NEI (Nordic, Eastern Europe and India); 2010–2011: Vice President, Head of Industrial Cranes, Region NEI; 2009: Director, Market Operations, Head of Global Key Account Management and Sales Development; 2008: Director, Business Development, Business Area New Equipment; TietoEnator Oyj 2007–2008: Chief Marketing Officer, Business Area Telecom and Media; Hantro Products Oy 2000–2007: Senior Vice President, Sales and Marketing; Cadence Design Systems 1996–2000: Global Account Director; Intel Corporation 1994–1996: Global Account Manager; Cap Gemini 1989–1994: Various management positions; Digital Equipment Corporation 1984–1989: Various positionsshares: 358options to acquire: 10,000 shares
Jukka Paasonenb. 1963vice president, head of Crane productsMember of the Senior Management Team since 2013Employed 1988B.Sc.primary working experience: KCI Konecranes/Konecranes 2011–2012: Vice President, Industrial Cranes, Standard Duty Cranes; 2008–2011: Director, Sales Support, Standard Lifting; 2006–2008: Director, Regional Sales Support, Standard Lifting; 2004–2006: Area Manager, West Europe and South America, Standard Lifting; KCI Konecranes 1997–2003: Sales Manager, Americas Component Center, Springfield, USA; 1990–1997: Various positions in Sales and Area Support as well as in Product Management, KCI Hoists; 1988–1990: Special Applications Engineer, Hoist Factory, Finlandshares: 90options to acquire: 5,000 shares
54 Konecranes 2013 senior ManageMent teaM
Juha Pankakoskib. 1967vice president, head of Business Unit partsMember of the Senior Management Team since 2013Employed 2004M.Sc. (Eng.), eMBAprimary working experience: Konecranes 2008–2010: Director, Corporate Business Process Development; 2004–2008: Director, Supply Operations; Tellabs 2003–2004: Vice President, Supply Chain Operations; 2002–2003: Regional Director, EMEA Operations; 2000–2002: Director, Operations; 1998–2000: Plant Manager; Philips Medical Systems 1997–1998: Operations Manager; FujitsuICL Computers 1993–1997: Various management positions in operations and business developmentshares: -options to acquire: 19,000 shares
Sirpa Poitsalo b. 1963vice president, general CounselMember of the Senior Management Team since 2013; Member of the Extended Management Team 2009–2013; Member of the Executive Board 1999–2009Employed 1988LL.M.primary working experience: KCI Konecranes 1997–1998: Assistant General Counsel; KONE Corporation/KCI Konecranes, 1988–1997: Legal Counselshares: 28,781options to acquire: 18,000 shares
Jaana Rinnev. 1962vice president, human resources (until april 30, 2013)Member of the Senior Management Team 2013; Member of the Extended Management Team 2009–2013; Member of the Group Executive Board 2007–2009Employed 1986–2013M.Sc. (Econ.)primary working experience: KCI Konecranes/Konecranes 2004–2006: Director, Human Resources for Service; KCI Konecranes 1997–2004: Different positions within human resources in Standard Lifting: KONE Corporation/KCI Konecranes 1986–1997: Different positions in financeshares: 3,072options to acquire: - shares
Tom Sothard b. 1957senior vice president, head of region americasMember of the Senior Management Team since 2013; Member of the Extended Management Team 2009–2013; Member of the Executive Board 1995–2009Employed 1983B.Sc. (Marketing)primary working experience: KCI Konecranes 2001–2006: President, Global Maintenance Services; 1995–2002: Group Vice President, North America; KONE Corporation/KCI
Konecranes 1989–2001: President, Maintenance Services, North America; KONE Corporation 1984–1988: Vice President, Maintenance Services, North America; Robbins and Myers 1980–1984: District Managershares: 16,184options to acquire: 30,000 shares
Topi Tiitolab. 1969Director, Business analysis and support (as of november 1, 2013)Member of the Senior Management Team since 2013Employed 1995M.Sc. (Econ)primary working experience: Konecranes Plc 2005–2013: Group Business Controller; Konecranes 2000–2005: Financial Director, Standard Lifting Equipment; 1995–2000: Several controller positionsshares: 506options to acquire: 3,500
Tapani Tilusb. 1974vice president, head of light liftingMember of the Senior Management Team since 2013Employed 1998M.Sc. (Eng.)primary working experience: Konecranes 2010–2011: Vice President, Marketing and new service products Business Area Service; KCI Konecranes/Konecranes 2006–2009: Director Parts, Business Area Service; KCI Konecranes 2003–2006: General manager, Crane Parts Center; 1998–2002: Various positions as Financial controller, system and process development & component salesshares: 2,974options to acquire: 12,000
Marko Tulokasb. 1972vice president, head of industrial Crane solutionsMember of the Senior Management Team since 2013Employed 2004M.Sc. (Eng), MBAprimary working experience: Konecranes 2010–2011: Director, Head of Business process management; Konecranes 2008–2010: Director, Delivery Process; Konecranes 2007–2008: Director, Strategy and Business Development, Process cranes; KCI Konecranes 2004–2007: Leadership positions in sourcing and supply chain management in China and Finland; Asko Appliances, Uponor Plc: 1998–2002: Several positions in supply chain managementshares: 274options to acquire: 2,501 shares
Kari Utriainenb. 1958vice president, head of Business Unit alfaMember of the Senior Management Team since 2013Employed 1981
School of Applied Science in Engineeringprimary working experience: Konecranes 2010–2011: Vice President, Head of Components; 2008–2010: Director, Branded Products, Standard lifting; KCI Konecranes/Konecranes 2002–2008: Director, Industrial Cranes & Components, Standard Lifting; KCI Konecranes 1981–2002: Various positions as Material controller, Purchaser, Purchasing Manager, Project Manager, Factory Manager, Operation Manager, Sales Manager and General Managershares: 3,382options to acquire: 12,000 shares
Mikael Wegmüllerb. 1966vice president, Marketing and CommunicationsMember of the Senior Management team since 2013Member of the Extended Management Team 2009–2013 Member of the Executive Board 2006–2009Employed 2006M.Sc.primary working experience: Publicis Helsinki Oy 2003–2006: Chief Operating Officer; SEK & GREY Oy 2000–2003: Planning Group Director; Publicis Törmä Oy 1997–2000: Planning GroupDirector; Finelor Oy (now L’Oreal Finland Oy) 1993–1997: Sales and Marketing Manager; Chips Abp 1991–1993: Product Group Managershares: 5,886options to acquire: 10,000 shares
Ilkka Ylänenb. 1960Chief supply Chain officer, head of supply Chain Management (as of september 1, 2013)Member of the Senior Management Team since 2013Employed 1985M.Sc (Eng.)primary working experience: KCI Konecranes/Konecranes 2003–2013: Various positions in engineering, production management and business related IT systems; KCI Konecranes 1985–2003: Different positions in manufacturing and supply chain management.shares: 2,295options to acquire: 2,500
Marko Äkräsb. 1967vice president, head of Customer and service technology. Deputy head of Ba service.Member of the Senior Management team since 2013; Member of the Extended Management Team 2012–2013Employed 1992M.Sc. (Eng.)primary working experience: Konecranes 2009–2011: Vice President, Head of Service West-Europe, Middle East and Africa; 2007–2009: Director, Head of Crane Service business unit; KCI Konecranes 2004–2007: Director, Crane Service Nordic; 2001–2004: General Manager, Global Parts Center; Kone Corporation/KCI Konecranes 1993–2001: Various positions in service and product managementshares: 469options to acquire: 13,000 shares
55Konecranes 2013senior ManageMent teaM
56 KONECRANES 2013
57Konecranes 2013Financial StatementS
Financial Statements contents
Financial Statements
58Report of the Board of Directors
67Consolidated statement of income – IFRS
68Consolidated balance sheet – IFRS
70Consolidated statement of changes in equity – IFRS
71Consolidated cash flow statement – IFRS
72Notes to the consolidated financial statements
107Konecranes Group 2009–2013
108Calculation of key figures
109Company list
112Parent company statement of income – FAS
113Parent company cash flow statement – FAS
114Parent company balance sheet – FAS
116Notes to the parent company financial statement
120Board of Director’s proposal to the AGM
121Auditor’s report
122Shares & shareholders
126Investor information
128Contact details

58 Konecranes 2013 RepoRt oF the BoaRd oF diRectoRS
Market review In terms of the macroeconomic development, 2013 was very much a repetition of 2012 as the U.S. outperformed most of the other regions. American economic activity in the manufacturing sector, measured by the purchasing managers’ index (PMI), expanded almost throughout the year. The momentum even improved in the second half of the year. The U.S. manufacturing capacity utilization rate was relatively stable compared with the previous year.
According to the PMI surveys, the Eurozone manufacturing activ-ity was downbeat January–June, but expanded slightly in the sec-ond half of the year. While the second-half increase was modest, it was generally interpreted as a potential turning point as it followed a contraction of activity that lasted for two years. The manufactur-ing capacity utilization in the European Union was below the previ-ous year on average. However, some signs of a small uptick could be observed towards the end of 2013.
Following a slowdown in 2012, the economic growth in emerg-ing markets was expected to accelerate and to provide an impetus to the global economy in 2013. Purchasing managers’ indexes in Brazil, Russia, India and China (BRIC countries) signaled expansion of the industrial output at the beginning of 2013. However, PMIs in the BRIC countries lost momentum by the end of first half of the year leading to downgrades in growth forecasts. The Chinese PMI data pointed again to a slow rise in manufacturing output towards the end of the year, but the signs of this in the real economy were still scarce.
Overall, the world’s manufacturing sector activity, according to the aggregated JPMorgan Global Manufacturing PMI, increased modestly in 2013, but gained steam towards the end of the year.
Compared to the previous year, the demand for lifting equip-ment decreased on a global basis among industrial customers in 2013. Demand for process cranes was particularly weak due to the reduced investments within the mining & metals and pulp & paper industries. Geographically, demand remained on a weak level in Western Europe, China, and India. In North America, demand for industrial cranes slumped after the solid progress in 2012, while the demand for crane components remained stable. The demand development was positive in the Middle East, while it softened in Australia and South East Asia.
The global container traffic grew by about 3 percent in 2013, and the project activity with container ports was satisfactory. The orders for new automated port solutions decreased from the previous year as several new automated container terminals were already under construction. Geographically, the most active markets were North America, South East Asia, Australia, and Africa. Demand was slug-gish in Europe. The demand for shipyard cranes continued to be concentrated in Brazil.
The demand for lifting equipment services was overall stable with the regional development reflecting the differences in indus-trial production growth rates. As for the largest markets, demand increased in North America whereas the European demand was stable.
The trend in steel and copper prices remained downward in 2013. After relatively stable development during the first half of the year, the EUR appreciated somewhat against the USD in the second half.
Note: Unless otherwise stated, the figures in brackets in the sections below refer to the same period in the previous year.
Orders received In 2013, the orders received fell by 2.5 percent to EUR 1,920.8 mil-lion (1,970.1). Orders received declined by 2.6 percent in Service and by 1.5 percent in Equipment. The decline in new orders was almost entirely attributable to negative currency changes. Orders received decreased in the Americas and EMEA regions, while they increased in Asia-Pacific mainly due to a large port crane order received from Indonesia in the first quarter. Acquisitions had an immaterial impact on the orders received in January–December.
Order bookThe value of the order book at year-end 2013 totaled EUR 893.5 million (942.7), which is 5.2 percent lower than at the end of 2012. The order book decreased by 12.3 percent from the third quarter when it stood at EUR 1,018.9 million. Service accounted for EUR 128.1 million (14 percent) and Equipment for EUR 765.3 million (86 percent) of the total end-December order book.
Sales Group sales in the full-year 2013 decreased by 3.3 percent and totaled EUR 2,099.6 million (2,171.5). Sales in Service increased by 0.6 percent but decreased in Equipment by 5.9 percent. Acqui-sitions had an immaterial impact on sales in January–December.
In 2013, the regional breakdown was as follows: EMEA 47 (48), Americas 36 (33) and APAC 17 (19) percent.
Currency rate effectIn a year-on-year comparison, the currency rates had a negative effect on the orders and sales in January–December. The reported order intake declined by 2.5 percent and by 0.1 percent at compa-rable currency rates. Reported sales decreased by 3.3 percent and by 1.0 percent at comparable currency rates.
In Service, the reported January–December order intake decreased by 2.6 percent but increased by 0.4 percent at compa-rable currencies. In Equipment, the orders decreased by 1.5 per-cent in reported terms, but increased by 0.5 percent at comparable currencies. Service sales grew by 0.6 percent in reported terms and by 3.6 percent at comparable currencies. In Equipment, the corresponding figures were -5.9 percent and -4.1 percent.
Report of the Board of Directors
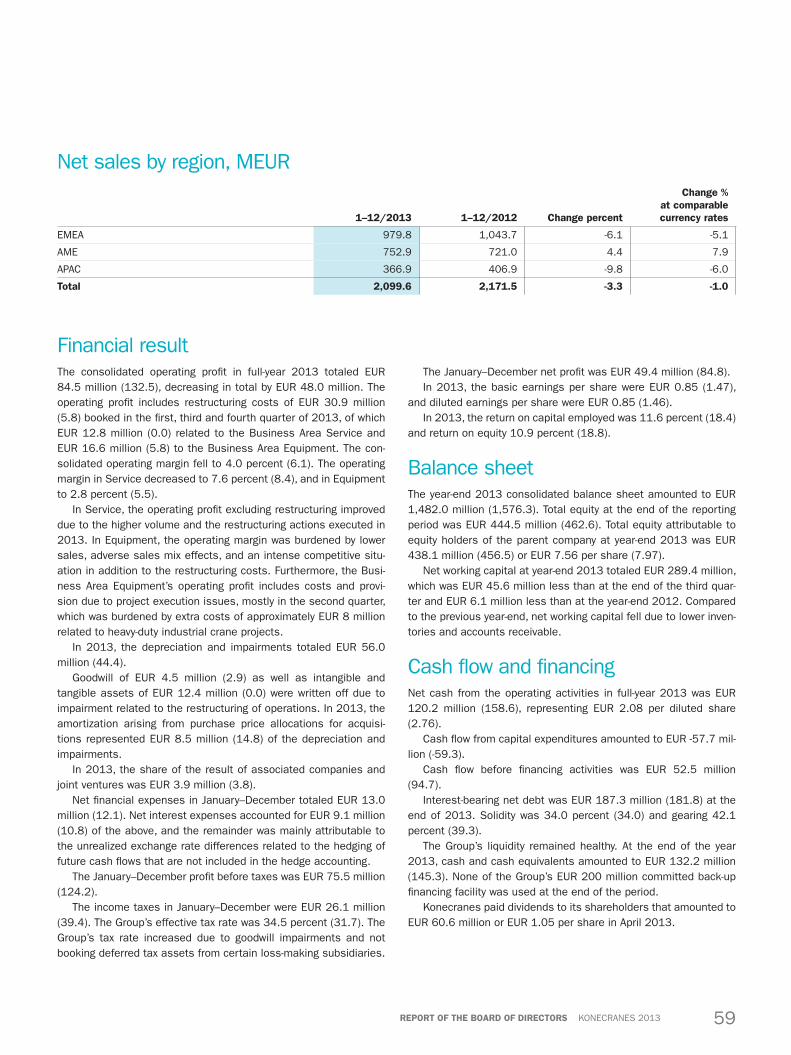
59Konecranes 2013RepoRt oF the BoaRd oF diRectoRS
Net sales by region, MEUR
1–12/2013 1–12/2012 change percent
change % at comparable currency rates
EMEA 979.8 1,043.7 -6.1 -5.1
AME 752.9 721.0 4.4 7.9
APAC 366.9 406.9 -9.8 -6.0
total 2,099.6 2,171.5 -3.3 -1.0
Financial result The consolidated operating profit in full-year 2013 totaled EUR 84.5 million (132.5), decreasing in total by EUR 48.0 million. The operating profit includes restructuring costs of EUR 30.9 million (5.8) booked in the first, third and fourth quarter of 2013, of which EUR 12.8 million (0.0) related to the Business Area Service and EUR 16.6 million (5.8) to the Business Area Equipment. The con-solidated operating margin fell to 4.0 percent (6.1). The operating margin in Service decreased to 7.6 percent (8.4), and in Equipment to 2.8 percent (5.5).
In Service, the operating profit excluding restructuring improved due to the higher volume and the restructuring actions executed in 2013. In Equipment, the operating margin was burdened by lower sales, adverse sales mix effects, and an intense competitive situ-ation in addition to the restructuring costs. Furthermore, the Busi-ness Area Equipment’s operating profit includes costs and provi-sion due to project execution issues, mostly in the second quarter, which was burdened by extra costs of approximately EUR 8 million related to heavy-duty industrial crane projects.
In 2013, the depreciation and impairments totaled EUR 56.0 million (44.4).
Goodwill of EUR 4.5 million (2.9) as well as intangible and tangible assets of EUR 12.4 million (0.0) were written off due to impairment related to the restructuring of operations. In 2013, the amortization arising from purchase price allocations for acquisi-tions represented EUR 8.5 million (14.8) of the depreciation and impairments.
In 2013, the share of the result of associated companies and joint ventures was EUR 3.9 million (3.8).
Net financial expenses in January–December totaled EUR 13.0 million (12.1). Net interest expenses accounted for EUR 9.1 million (10.8) of the above, and the remainder was mainly attributable to the unrealized exchange rate differences related to the hedging of future cash flows that are not included in the hedge accounting.
The January–December profit before taxes was EUR 75.5 million (124.2).
The income taxes in January–December were EUR 26.1 million (39.4). The Group’s effective tax rate was 34.5 percent (31.7). The Group’s tax rate increased due to goodwill impairments and not booking deferred tax assets from certain loss-making subsidiaries.
The January–December net profit was EUR 49.4 million (84.8).In 2013, the basic earnings per share were EUR 0.85 (1.47),
and diluted earnings per share were EUR 0.85 (1.46). In 2013, the return on capital employed was 11.6 percent (18.4)
and return on equity 10.9 percent (18.8).
Balance sheetThe year-end 2013 consolidated balance sheet amounted to EUR 1,482.0 million (1,576.3). Total equity at the end of the reporting period was EUR 444.5 million (462.6). Total equity attributable to equity holders of the parent company at year-end 2013 was EUR 438.1 million (456.5) or EUR 7.56 per share (7.97).
Net working capital at year-end 2013 totaled EUR 289.4 million, which was EUR 45.6 million less than at the end of the third quar-ter and EUR 6.1 million less than at the year-end 2012. Compared to the previous year-end, net working capital fell due to lower inven-tories and accounts receivable.
Cash flow and financing Net cash from the operating activities in full-year 2013 was EUR 120.2 million (158.6), representing EUR 2.08 per diluted share (2.76).
Cash flow from capital expenditures amounted to EUR -57.7 mil-lion (-59.3).
Cash flow before financing activities was EUR 52.5 million (94.7).
Interest-bearing net debt was EUR 187.3 million (181.8) at the end of 2013. Solidity was 34.0 percent (34.0) and gearing 42.1 percent (39.3).
The Group’s liquidity remained healthy. At the end of the year 2013, cash and cash equivalents amounted to EUR 132.2 million (145.3). None of the Group’s EUR 200 million committed back-up financing facility was used at the end of the period.
Konecranes paid dividends to its shareholders that amounted to EUR 60.6 million or EUR 1.05 per share in April 2013.

60 Konecranes 2013 RepoRt oF the BoaRd oF diRectoRS
Capital expenditureIn 2013, the capital expenditure, excluding acquisitions and joint arrangements, amounted to EUR 65.7 million (41.7). This amount consisted of investments in machinery, equipment, properties, and information technology. Capital expenditure including acquisitions and joint arrangements was EUR 80.1 million (43.3).
Most of the increase in capital expenditure is related to the new ERPs for both business areas for further development and imple-mentation of harmonized processes, for increasing operational transparency, and improving decision-making, as well as for reduc-ing the overall IT system fragmentation. The first installations have been made, and most parts are expected to be completed within the next 2 years.
A new crane manufacturing plant in Jejuri near Pune, India, was taken into use during the first quarter of 2013. Total investment amounted to approximately EUR 15 million. All manufacturing oper-ations in India were consolidated into the new facility during 2013.
AcquisitionsIn 2013, the capital expenditure on acquisitions and joint arrange-ments was EUR 14.5 million (1.6) of which the net assets of the acquisitions were recorded at EUR 10.5 million. Goodwill booked from the acquisitions was insignificant.
In the first quarter, Konecranes acquired a crane service com-pany in France.
In the second quarter, Konecranes closed the transaction on collaboration with the KION Group in the container handling lift truck business. Based on the collaboration agreement, Konecranes became a long-term supplier of the container handling lift trucks to the worldwide distribution network of Linde Material Handling, which is wholly owned by KION Group. In addition, Konecranes acquired certain assets from Linde Material Handling, including the product rights to container handling lift trucks.
In the third quarter, Konecranes acquired approximately 30.5 percent of the shares in Estonian Konesko A/S, whose main activ-ity is manufacturing of electric motors and whose key customer is Konecranes. Prior to the acquisition, Konecranes held 19 per-cent of the shares in the company. Furthermore, Konecranes sold a small machine tool service business unit in Heilbronn, Germany, to the management of the unit.
PersonnelIn January–December, the Group employed an average of 11,987 people (11,917). On December 31, the headcount was 11,832 (12,147). At year-end 2013, the number of personnel by Business Area was as follows: Service 6,151 employees (6,119), Equipment 5,626 employees (5,973) and Group staff 55 (55). The Group had 6,246 employees (6,269) working in EMEA, 2,711 (2,724) in the Americas and 2,875 (3,154) in the APAC region.
In 2013, the Group headcount decreased by 315 due to the restructuring programs. In January, Business Area Equipment announced restructuring actions, with targeted annual cost sav-ings of approximately EUR 10 million affecting approximately 140 employees globally. In July, Konecranes expanded actions to improve efficiency and reduce costs by approximately EUR 30 mil-lion annually. The considered actions are estimated to impact a maximum 600 people through redundancies, temporary lay-offs, and early retirement by the end of 2014.
As a company, Konecranes focuses on value-based leadership with entrepreneurial spirit. In practice, this means that well-imple-mented and understood values are the foundations of our opera-tions. Trust and entrepreneurship are not only encouraged, but demanded from our leaders.
Konecranes’ total service commitment is delivered by thou-sands of Konecranes employees around the world. To ensure the best in class service, Konecranes continued to invest, in 2013, sig-nificant financial and time resources to ensure that our employees have the best skills around the world.
As a company, we want to provide a great place to work. As proof of this, our employee satisfaction has remained on an indus-try high level, and participation in the employee satisfaction survey continued to be above the 85 percent level. Even in the uncertain economic environment, our employees appreciate the company cul-ture, values, and the entrepreneurial efficiency of our organization. In our company, everyone can be an owner trough the Employee Share Saving Plan.
In 2013, the Group’s personnel expenses totaled EUR 598.2 million (598.7).

61Konecranes 2013RepoRt oF the BoaRd oF diRectoRS
Business areas
ServiceThe orders in full-year 2013 totaled EUR 715.9 million (735.0), showing a decrease of 2.6 percent. However, at constant curren-cies, orders received grew by 0.4 percent. New orders declined in all regions. Orders in Crane Service and Parts business units grew from the previous year’s level. The order book fell to EUR 128.1 mil-lion (147.2) at year-end representing a decrease of 12.9 percent.
Sales rose by 0.6 percent to EUR 889.1 million (884.0). The operating profit, excluding restructuring costs of EUR 12.8 million (0.0), was EUR 80.6 million (74.6) and the operating margin 9.1 percent (8.4). Operating profit including restructuring costs was
EUR 67.8 million (74.6) and 7.6 percent of sales (8.4). The operat-ing profit excluding restructuring costs improved due to the higher volume and the restructuring actions executed in 2013.
The annual value of the contract base increased to EUR 178.2 million (177.9) at year-end 2013. At year-end 2013, the total num-ber of items of equipment included in the maintenance contract base was 433,501 (418,560).
The number of service technicians at year-end 2013 was 3,993 (3,935), which is 58 or 1.5 percent more than at the year-end 2012.
SeRvice 10–12/2013 10–12/2012 1–12/2013 1–12/2012change percent
Orders received, MEUR 165.5 181.3 715.9 735.0 -2.6
Order book, MEUR 128.1 147.2 128.1 147.2 -12.9
Contract base value, MEUR 178.2 177.9 178.2 177.9 0.2
Net sales, MEUR 247.6 239.0 889.1 884.0 0.6
EBITDA, MEUR 30.5 27.3 89.6 87.3 2.6
EBITDA, % 12.3% 11.4% 10.1% 9.9%
Depreciation and amortization, MEUR -3.3 -3.5 -14.6 -12.7 14.8
Impairments, MEUR -0.7 0.0 -7.2 0.0
Operating profit (EBIT), MEUR 26.6 23.8 67.8 74.6 -9.1
Operating profit (EBIT), % 10.7% 10.0% 7.6% 8.4%
Restructuring costs, MEUR -2.0 0.0 -12.8 0.0
Operating profit (EBIT) excluding restructuring costs, MEUR 28.6 23.8 80.6 74.6 8.0
Operating profit (EBIT) excluding restructuring costs, % 11.5% 10.0% 9.1% 8.4%
Capital employed, MEUR 187.5 166.6 187.5 166.6 12.6
ROCE% 38.3% 41.8%
Capital expenditure, MEUR 1.3 5.5 20.1 12.5 60.1
Personnel at the end of period 6,151 6,119 6,151 6,119 0.5
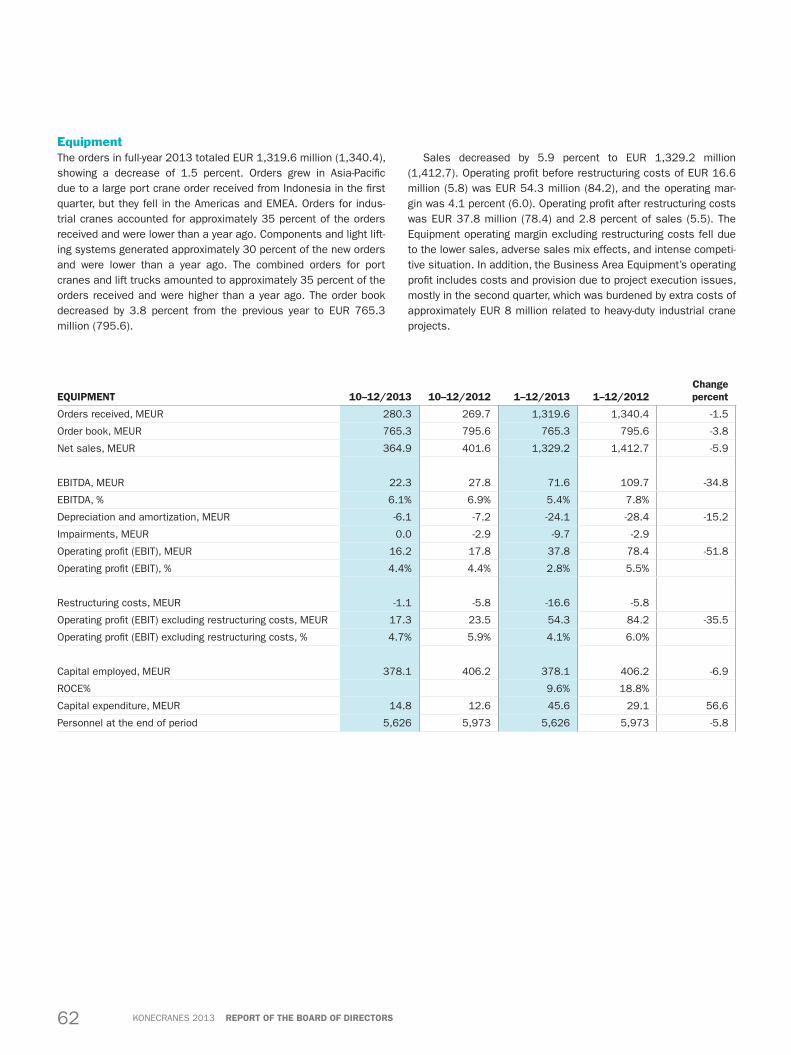
62 Konecranes 2013 RepoRt oF the BoaRd oF diRectoRS
equipment 10–12/2013 10–12/2012 1–12/2013 1–12/2012change percent
Orders received, MEUR 280.3 269.7 1,319.6 1,340.4 -1.5
Order book, MEUR 765.3 795.6 765.3 795.6 -3.8
Net sales, MEUR 364.9 401.6 1,329.2 1,412.7 -5.9
EBITDA, MEUR 22.3 27.8 71.6 109.7 -34.8
EBITDA, % 6.1% 6.9% 5.4% 7.8%
Depreciation and amortization, MEUR -6.1 -7.2 -24.1 -28.4 -15.2
Impairments, MEUR 0.0 -2.9 -9.7 -2.9
Operating profit (EBIT), MEUR 16.2 17.8 37.8 78.4 -51.8
Operating profit (EBIT), % 4.4% 4.4% 2.8% 5.5%
Restructuring costs, MEUR -1.1 -5.8 -16.6 -5.8
Operating profit (EBIT) excluding restructuring costs, MEUR 17.3 23.5 54.3 84.2 -35.5
Operating profit (EBIT) excluding restructuring costs, % 4.7% 5.9% 4.1% 6.0%
Capital employed, MEUR 378.1 406.2 378.1 406.2 -6.9
ROCE% 9.6% 18.8%
Capital expenditure, MEUR 14.8 12.6 45.6 29.1 56.6
Personnel at the end of period 5,626 5,973 5,626 5,973 -5.8
EquipmentThe orders in full-year 2013 totaled EUR 1,319.6 million (1,340.4), showing a decrease of 1.5 percent. Orders grew in Asia-Pacific due to a large port crane order received from Indonesia in the first quarter, but they fell in the Americas and EMEA. Orders for indus-trial cranes accounted for approximately 35 percent of the orders received and were lower than a year ago. Components and light lift-ing systems generated approximately 30 percent of the new orders and were lower than a year ago. The combined orders for port cranes and lift trucks amounted to approximately 35 percent of the orders received and were higher than a year ago. The order book decreased by 3.8 percent from the previous year to EUR 765.3 million (795.6).
Sales decreased by 5.9 percent to EUR 1,329.2 million (1,412.7). Operating profit before restructuring costs of EUR 16.6 million (5.8) was EUR 54.3 million (84.2), and the operating mar-gin was 4.1 percent (6.0). Operating profit after restructuring costs was EUR 37.8 million (78.4) and 2.8 percent of sales (5.5). The Equipment operating margin excluding restructuring costs fell due to the lower sales, adverse sales mix effects, and intense competi-tive situation. In addition, the Business Area Equipment’s operating profit includes costs and provision due to project execution issues, mostly in the second quarter, which was burdened by extra costs of approximately EUR 8 million related to heavy-duty industrial crane projects.

63Konecranes 2013RepoRt oF the BoaRd oF diRectoRS
Group overheadsUnallocated Group overhead costs in 2013 were EUR 19.4 million (20.5), representing 0.9 percent of sales (0.9).
Administration
Decisions of the Annual General MeetingThe Annual General Meeting of Konecranes Plc was held on March 21, 2013. The meeting approved the Company’s annual accounts for the fiscal year 2012 and discharged the members of the Board of Directors and Managing Director from liability. The AGM approved the Board’s proposal that a dividend of EUR 1.05 per share is paid from the distributable assets of the parent Company.
The AGM approved the proposal of the Nomination and Com-pensation Committee that the number of members of the Board of Directors shall be eight (8). The Board members elected at the AGM in 2013 were Mr. Svante Adde, Mr. Stig Gustavson, Mr. Tapani Järvinen, Mr. Matti Kavetvuo, Ms. Nina Kopola, Mr. Bertel Langen-skiöld, Ms. Malin Persson, and Mr. Mikael Silvennoinen.
The AGM confirmed the annual compensation to the Board members as per following:• Chairman of the Board: EUR 105,000• Vice Chairman of the Board: EUR 67,000• Other Board members EUR 42,000
In addition, a compensation of EUR 1,500 per meeting will be paid for attending Board Committee meetings. The Chairman of the Audit Committee is, however, entitled to a compensation of EUR 3,000 per attended Audit Committee meeting. Furthermore, the AGM approved that 50 percent of the annual remuneration will be paid in Konecranes shares.
The AGM confirmed that Ernst & Young Oy will continue as the Company’s external auditor.
The AGM authorized the Board of Directors to decide on the repurchase of the Company’s own shares and/or on the accep-tance as pledge of the Company’s own shares. The amount of own shares to be repurchased and/or accepted as pledge based on this authorization shall not exceed 6,000,000 shares in total, which corresponds to approximately 9.5 percent of all the shares in the Company. The authorization is effective until the end of the next Annual General Meeting, however, no longer than until September 21, 2014. The Board of Directors did not use this authorization in 2013.
The AGM authorized the Board of Directors to decide on the issuance of shares as well as the issuance of special rights enti-tling to shares referred to in Chapter 10 Section 1 of the Finn-ish Companies Act. The amount of shares to be issued based on this authorization shall not exceed 6,000,000 shares, which corresponds to approximately 9.5 percent of all the shares in the Company. The authorization can also be used for incentive arrange-ments, however, not more than 700,000 shares in total together with the authorization in the following paragraph. The authorization is effective until the end of the next Annual General Meeting, how-
ever, no longer than until September 21, 2014. However, the autho-rization for incentive arrangements is valid until March 21, 2018. This authorization revokes the authorization for incentive arrange-ments given by the Annual General Meeting 2012. The Board of Directors did not use this authorization in 2013.
The AGM authorized the Board of Directors to decide on the transfer of the Company’s own shares. The authorization is limited to a maximum of 6,000,000 shares, which corresponds to approxi-mately 9.5 percent of all the shares in the Company. The authori-zation can also be used for incentive arrangements, however, not more than 700,000 shares in total together with the authorization in the previous paragraph. This authorization is effective until the next Annual General Meeting of Shareholders, however, no longer than until September 21, 2014. However, the authorization for incentive arrangements is valid until March 21, 2018. This autho-rization revokes the authorization for incentive arrangements given by the Annual General Meeting 2012. The Board of Directors did not use this authorization in 2013.
The AGM authorized the Board of Directors to decide on a directed share issue without payment needed for the implementa-tion of the Share Savings Plan, which the Annual General Meeting 2012 decided to launch.
The Board of Directors is authorized to decide on the issue of new shares or on the transfer of own shares held by the Company to such participants in the Plan who, according to the terms and conditions of the Plan, are entitled to receive free shares, as well as to decide on the share issue without payment also to the Com-pany itself. The number of new shares to be issued or own shares held by the Company to be transferred may be a maximum total number of 500,000 shares, which corresponds to 0.8 percent of all of the Company’s shares. The authorization concerning the share issue is valid until March 21, 2018. This authorization is in addi-tion to the authorizations in the previous items. This authorization replaces the authorization for the Share Savings Plan given by the Annual General Meeting 2012. The Board of Directors did not use this authorization in 2013.
The decisions are explained in more detail in the release cover-ing the resolutions of the AGM, which is available on the company’s website at www.konecranes.com.
In its first meeting held after the Annual General Meeting, the Board of Directors elected Mr. Stig Gustavson to continue as Chair-man. Mr. Svante Adde was elected Chairman of the Audit Commit-tee, and Mr. Tapani Järvinen, Ms. Malin Persson and Mr. Mikael Silvennoinen as Committee members. Mr. Bertel Langenskiöld was elected Chairman of the Nomination and Compensation Com-mittee, and Mr. Stig Gustavson, Mr. Matti Kavetvuo and Ms. Nina Kopola were elected as Committee members.
With the exception of Mr. Stig Gustavson, the Board members are deemed to be independent of the company under the Finnish Corporate Governance Code. Mr. Gustavson is deemed dependent of the company based on the Board’s overall evaluation relating to his former and current positions in Konecranes combined with his substantial voting rights in the Company.

64 Konecranes 2013 RepoRt oF the BoaRd oF diRectoRS
With the exception of Mr. Bertel Langenskiöld, the Board mem-bers are independent of significant shareholders of the company. Mr. Langenskiöld is not independent of significant shareholders of the company based on his current position as the Managing Direc-tor of Hartwall Capital Oy Ab. HTT KCR Holding Oy Ab holds more than 10 percent of Konecranes Plc’s shares and votes. HTT KCR Holding Oy Ab is a subsidiary of Hartwall Capital Oy Ab. In addition, HTT KCR Holding Oy Ab, K. Hartwall Invest Oy Ab, Fyrklöver-Invest Oy Ab and Ronnas Invest AG will in practice co-operate in matters concerning their ownership in Konecranes Plc.
Changes in the Group ManagementMr. Timo Leskinen was appointed Senior Vice President, Human Resources, and a member of the Konecranes Group Executive Board as of August 1, 2013. He is responsible for all Human Resources (competence development and administration) and Cor-porate Responsibility (Health, Safety and Environment) matters for Konecranes.
In December, Konecranes announced that Mr. Hannu Rusanen, Executive Vice President and Head of Business Area Equipment, is leaving the Company. The recruitment process for the new Head of Business Area Equipment is ongoing.
Other issuesAt the end of the year 2013, Konecranes had a loan receivable of EUR 225,336 from the President & CEO Pekka Lundmark with the interest rate of 1.533 percent. The loan relates to a tax payment resulting from the incentive scheme directed to the President & CEO in 2006. There is a tax appeal pending against the imposed payment, and the loan is valid until the appeal is resolved.
Konecranes complies with the Finnish Corporate Governance Code 2010 approved by the Board of the Securities Market Asso-ciation. Konecranes has issued a Corporate Governance Statement based on recommendation 54 of the Code, which can be reviewed on the corporate website of Konecranes at www.konecranes.com.
Share capital and sharesThe company’s registered share capital totaled EUR 30.1 million on December 31, 2013 and the number of shares including treasury shares was 63,272,342.
On December 31, 2013, Konecranes Plc was in the possession of 5,444,262 own shares, which corresponds to 8.6 percent of the total number of shares having a market value of EUR 140.8 million on that date.
All shares carry one vote per share and equal rights to dividends.
Shares subscribed for under stock option rights
In January–December, 536,770 treasury shares were transferred to the subscribers, pursuant to the Konecranes Plc’s stock options 2009A and 2009B.
At end-December 2013, Konecranes Plc’s stock options 2009 entitled the holders to subscribe to a total of 1,486,891 shares. The option programs include approximately 200 key persons.
The terms and conditions of the stock option programs are avail-able on the Konecranes’ website at www.konecranes.com.
Performance share planThe Board of Directors resolved to amend the performance share plan launched in 2012 so that the two three-year discretionary peri-ods, 2013–2015 and 2014–2016, will follow the discretionary peri-ods started in 2012. The performance criterion for the discretion-ary period 2013–2015 is the cumulative Earnings per Share (EPS) of the fiscal years 2013–2015.
The target group of the plan consists of approximately 150 people during the discretionary period 2013–2015. The rewards to be paid on the basis of the discretionary period correspond to the value of an approximate maximum total number of 700,000 Konecranes Plc shares. If the targets determined by the Board of Directors are achieved, the reward payout may be a half of the maxi-mum reward. The maximum reward payout requires that the targets are clearly exceeded.
Employee share savings planBased on the interest shown by the Group employees, the Board decided to launch a new plan period. The new plan period began on July 1, 2013 and will end on June 30, 2014. The maximum savings amount per participant during one month is 5 percent of the gross salary and the minimum is EUR 10.
Each participant will receive one free matching share for every two acquired savings shares. Matching shares will be delivered to a participant if the participant holds the acquired shares from the plan period until the end of the designated holding period, February 15, 2017, and if his or her employment has not ended before this date for reasons related to the employee. The total amount of all savings of the commencing plan period may not exceed EUR 8.5 million.
Approximately 1,650 Konecranes employees signed up for the Plan commencing July 1, 2013, which represents an increase of approximately 150 employees from a year ago. The number of new shares to be issued or own shares held by the Company to be transferred under the terms and conditions of the Plan may be a maximum total number of 500,000 shares, which corresponds to 0.8 percent of all of the Company’s shares.

65Konecranes 2013RepoRt oF the BoaRd oF diRectoRS
Market capitalization and trading volume
The closing price for Konecranes Plc’s shares on the NASDAQ OMX Helsinki was EUR 25.86 on December 31, 2013. The vol-ume-weighted average share price in January–December was EUR 25.30, the highest price being EUR 28.89 in February and the low-est EUR 20.45 in June. In January–December, the trading volume on the NASDAQ OMX Helsinki totaled 51.6 million of Konecranes Plc’s shares, corresponding to a turnover of approximately EUR 1,305.6 million. The average daily trading volume was 206,413 shares, representing an average daily turnover of EUR 5.2 million.
In addition, approximately 53.5 million Konecranes’ shares were traded on other trading venues (e.g. multilateral trading facilities and bilateral OTC trades) in 2013 according to Fidessa.
On December 31, 2013, the total market capitalization of Konecranes Plc’s shares on the NASDAQ OMX Helsinki was EUR 1,636 million including treasury shares. The market capitalization was EUR 1,495 million excluding the treasury shares.
Flagging notifications and other announcements by shareholders
No flagging notifications or other disclosures concerning changes in holdings were received in 2013.
Research and developmentIn 2013, Konecranes’ research and product development expendi-ture totaled EUR 25.6 (25.8) million, representing 1.2 (1.2) percent of sales. R&D expenditure includes product development projects aimed at improving the quality and cost efficiency of both products and services.
In 2013, the main focus for the company’s R&D activities was developing its service and equipment offering to enable real-time visibility to equipment and advanced predictive maintenance. In addition, work on Konecranes’ offering for emerging markets con-tinued.
In 2013, the scope of TRUCONNECT Remote Services was broadened, and the equipment base under remote monitoring and service grew rapidly. Analysis of the data collected and making effi-cient use of it were important topics for further development.
Konecranes launched Agilon, an innovative solution for materi-als management in manufacturing. Agilon is a patented materials inventory and management system that quickly and automatically stores, picks, and replenishes items weighing up to 25 kg, with a robot handling both the components transfer and refill orders. Agilon is currently available in Finland.
The CXT NEO crane, a high-technology crane package developed especially for the developed markets, was introduced. The CXT NEO crane package includes various advanced features and TRUCON-NECT remote monitoring equipment as standard. The development of the CXT NEO crane’s intelligent features will continue, and it will
be brought from the current markets, Germany and Switzerland, into new geographical areas.
Konecranes introduced its Automated RTG system (ARTG) to the container handling industry. The system is built around Konecranes’ market-leading 16-wheel RTG, including a complete package of truck guidance infrastructure, a Remote Operating Sta-tion with a specially developed Graphical User Interface (GUI), and an IT system that interfaces with the customer’s Terminal Operat-ing System (TOS). The system provides RTG terminal operators an incremental opportunity towards automation by upgrading existing yard infrastructure.
Corporate responsibilityDuring 2013, Konecranes continued the improvement and harmo-nization of global occupational safety requirements and instruc-tions. Proactive safety management continued to show as a rise in the number of safety observations and near hit reports made by Konecranes’ personnel during 2013.
The response rate to Employee Satisfaction Survey 2013 stayed approximately at the previous year’s level at 85 percent. When com-pared to benchmark data, the results continued to be positive.
The roll-out of environmental e-learning that outlines the funda-mentals of Konecranes’ environmental aspects and how to manage the environmental impacts continued. Several Konecranes units continued or established energy efficiency programs which targeted lowering the use of different forms of energy.
The roll-out of the internal Code of Conduct online training con-tinued, and the completion rate at the end of 2013 was approxi-mately 90 percent.
Events after the end of the reporting period
On January 30, 29,441 treasury shares were transferred to the subscribers pursuant to the Konecranes Plc’s stock options 2009A. After the subscription and delivery of the shares, Konecranes Plc holds 5,414,821 treasury shares. Stock options issued under Konecranes Plc’s ongoing stock option plans entitle their holders to subscribe for a total of 1,457,450 shares.
Risks and uncertaintiesA significant share of Konecranes’ business is derived from the emerging markets. This has had a negative impact on the aging structure of accounts receivable, and may increase credit losses or the need for higher provisions for doubtful accounts.
Konecranes has made several acquisitions and expanded organically into new countries. A failure to integrate the acquired business or grow newly established operations may result in an impairment of goodwill and other assets.
One of the key strategic initiatives of Konecranes is oneKONE-CRANES. This involves major capital expenditure for informa-tion systems. A failure to extract business benefits from the new

66 Konecranes 2013 RepoRt oF the BoaRd oF diRectoRS
processes and systems may lead to an impairment of assets or decrease in profitability.
Konecranes delivers projects in its Industrial Crane Solutions and Port Cranes business units, which involve risks related to engineering and project execution, for example. A failure to plan or manage these projects may lead to higher-than-estimated costs or disputes with customers.
Challenges in financing may force customers to postpone proj-ects or even to cancel existing orders. Konecranes intends to avoid incurring costs of major projects under construction in excess of advance payments. However, it is possible that, in some projects, cost-related commitments may temporarily exceed the amount of advance payments.
The Group’s other risks are presented in the Annual Report.
LitigationVarious legal actions, claims, and other proceedings are pending against the Group in different countries. These actions, claims, and other proceedings are typical for this industry and are consistent with the global business offering that encompasses a wide range of products and services. These matters involve contractual disputes, warranty claims, product liability (including design defects, manufac-turing defects, failure to warn and asbestos legacy), employment, auto liability, and other matters involving general liability claims.
While the final outcome of these proceedings cannot be pre-dicted with certainty, Konecranes’ opinion is, based on the infor-mation available to date and considering the grounds presented for such claims, the available insurance coverage and the reserves made, that the outcome of such actions, claims, and other proceed-ings, if unfavorable, would not have a material adverse effect on the financial condition of the Group.
Market outlookThe growth in industrial production and container traffic is moder-ate and below the historical averages. The near-term investment outlook within manufacturing and process industries, as well as container handling, remains uncertain. However, there are certain positive macroeconomic signs in the developed world also outside the US.
Financial guidanceThe order book at year-end 2013 was below the previous year, which will affect the company’s sales and operating profit in the beginning of the year. Due to the market uncertainty, it is too early to estimate the full-year 2014 sales development. The ongoing restructuring actions and improving project execution are expected to have a positive impact on profitability.
Board of directors’ proposal for disposal of distributable funds
The parent company’s non-restricted equity is EUR 203,354,966.48, the net income of which for the year is EUR 61,701,102.44. The Group’s non-restricted equity is EUR 366,150,000.
According to the Finnish Companies Act, the distributable funds of the company are calculated based on the parent company’s non-restricted equity. For the purpose of determining the amount of the dividend, the Board of Directors has assessed the liquidity of the parent company and the economic circumstances subsequent to the end of fiscal year.
Based on such assessments the Board of Directors proposes to the Annual General Meeting that a dividend of EUR 1.05 be paid on each share and that the remaining non-restricted equity is retained in shareholders’ equity.
Helsinki, February 5, 2014Konecranes PlcBoard of Directors

67Konecranes 2013conSolidated Statement oF income – iFRS
Consolidated statement of income – IFRS (1,000 euR) 1 Jan–31 dec 2013 1 Jan–31 dec 2012 Note:4, 6, 7 Sales 2,099,583 2,171,492
8 Other operating income 1,566 2,26910 Depreciation and impairments -56,013 -44,36311–13 Other operating expenses -1,960,623 -1,996,913
operating profit 84,513 132,485
20 Share of associates' and joint ventures' result 3,946 3,84514 Financial income and expenses -12,959 -12,090
profit before taxes 75,500 124,240
15 Taxes -26,083 -39,423
pRoFit FoR the peRiod 49,417 84,817
profit for the period attributable to Shareholders of the parent company 49,091 84,154Non-controlling interest 326 663
16 Earnings per share, basic (EUR) 0.85 1.4716 Earnings per share, diluted (EUR) 0.85 1.46
Consolidated statement of other comprehensive income
(1,000 euR) 1 Jan–31 dec 2013 1 Jan–31 dec 2012
profit for the period 49,417 84,817
items that can be reclassified into profit or lossCash flow hedges 5,013 2,036Exchange differences on translating foreign operations -18,849 -1,056Income tax relating to items that can be reclassified into profit or loss -1,003 -499
items that cannot be reclassified into profit or lossRe-measurement gains (losses) on defined benefit plans -2,985 -11,710Income tax relating to items that cannot be reclassified into profit or loss 934 3,101
other comprehensive income for the period, net of tax -16,890 -8,128
total comprehensive income for the period 32,527 76,689
total comprehensive income attributable to:Shareholders of the parent company 32,312 76,081Non-controlling interest 215 608

68 Konecranes 2013 conSolidated Balance Sheet – iFRS
Consolidated balance sheet – IFRS(1,000 euR) aSSetS 31 dec 2013 31 dec 2012Note:
non-current assets17 Goodwill 101,609 112,80618 Other intangible assets 87,019 76,59719 Property, plant and equipment 144,544 138,715
Advance payments and construction in progress 48,172 57,58420 Investments accounted for using the equity method 40,376 37,51921 Available-for-sale investments 964 914
Long-term loans receivable 225 22832 Deferred tax assets 59,787 53,798
total non-current assets 482,696 478,161
current assets22 Inventories 325,520 369,84724 Accounts receivable 368,768 442,127
Loans receivable 11 7925 Other receivables 25,602 29,168
Current tax assets 10,675 11,33926 Deferred assets 136,563 100,21127 Cash and cash equivalents 132,214 145,318
total current assets 999,353 1,098,089
total aSSetS 1,482,049 1,576,250

69Konecranes 2013conSolidated Balance Sheet – iFRS
(1,000 euR) equitY and liaBilitieS 31 dec 2013 31 dec 2012Note:
equity attributable to equity holders of the parent companyShare capital 30,073 30,073Share premium account 39,307 39,307
38 Fair value reserves 2,611 -1,399Translation difference -16,258 2,480Paid in capital 50,998 44,787Retained earnings 282,319 257,072Net profit for the period 49,091 84,154
28 total equity attributable to equity holders of the parent company 438,141 456,47420 Non-controlling interest 6,365 6,150
total equity 444,506 462,624
liabilities
non-current liabilities30, 35 Interest-bearing liabilities 133,042 205,67831 Other long-term liabilities 80,315 75,15132 Deferred tax liabilities 18,080 22,326
total non-current liabilities 231,437 303,155
33 provisions 47,459 44,451
current liabilities30, 35 Interest-bearing liabilities 186,658 121,7797 Advance payments received 175,245 217,162
Progress billings 5,823 2,498Accounts payable 147,477 157,422
34 Other short-term liabilities (non-interest bearing) 28,698 30,233Current tax liabilities 14,696 21,076
34 Accruals 200,050 215,850total current liabilities 758,647 766,020
total liabilities 1,037,543 1,113,626
total equitY and liaBilitieS 1,482,049 1,576,250

70 Konecranes 2013 conSolidated Statement oF changeS in equitY – iFRS
Consolidated statement of changes in equity – IFRS
equity attributable to equity holders of the parent company
(1,000 euR)Share
capital
Share premium account
cash flow
hedges
trans-lation
differencepaid in capital
Retained earnings total
non-con-trolling
interesttotal
equityBalance at 1 January, 2013 30,073 39,307 -1,399 2,480 44,787 341,226 456,474 6,150 462,624Options exercised 6,211 6,211 6,211Dividends paid to equity holders -60,614 -60,614 -60,614Share based payments recognized against equity 3,301 3,301 3,301Acquisitions 457 457 457Total comprehensive income 4,010 -18,738 47,040 32,312 215 32,527Balance at 31 december, 2013 30,073 39,307 2,611 -16,258 50,998 331,410 438,141 6,365 444,506
Balance at 1 January, 2012 30,073 39,307 -2,936 3,481 43,711 316,244 429,880 5,542 435,422Changes in accounting principles (IFRS 11) 2,424 2,424 2,424Balance at 1 January, 2012 restated 30,073 39,307 -2,936 3,481 43,711 318,668 432,304 5,542 437,846Options exercised 1,076 1,076 1,076Dividends paid to equity holders -57,199 -57,199 -57,199Share based payments recognized against equity 4,296 4,296 4,296Acquisitions -84 -84 -84Total comprehensive income 1,537 -1,001 75,545 76,081 608 76,689Balance at 31 december, 2012 30,073 39,307 -1,399 2,480 44,787 341,226 456,474 6,150 462,624

71Konecranes 2013conSolidated caSh Flow Statement – iFRS
Consolidated cash flow statement – IFRS(1,000 euR)
1 Jan–31 dec 2013
1 Jan–31 dec 2012
Note:cash flow from operating activitiesNet income 49,417 84,817Adjustments to net profit for the period
Taxes 26,083 39,423Financial income and expenses 13,016 12,145Share of associates’ and joint ventures’ result -3,946 -3,845Dividends income -57 -58Depreciation and impairments 56,013 44,363Profits and losses on sale of fixed assets 1,920 -134Other adjustments 2,386 3,468
operating income before change in net working capital 144,832 180,179
Change in interest-free short-term receivables 16,546 -4,940Change in inventories 32,569 -19,255Change in interest-free short-term liabilities -21,110 52,431change in net working capital 28,005 28,236
cash flow from operations before financing items and taxes 172,837 208,41514 Interest received 3,699 5,88214 Interest paid -13,180 -15,06514 Other financial income and expenses 950 -5,43315 Income taxes paid -44,073 -35,231
Financing items and taxes -52,604 -49,847
net caSh FRom opeRating activitieS 120,233 158,568
cash flow from investing activities5 Acquisition of Group companies, net of cash -11,590 -7,097
Capital expenditures -57,733 -59,347Proceeds from sale of fixed assets 1,508 2,400
15 Dividends received 57 210net caSh uSed in inveSting activitieS -67,758 -63,834
cash flow before financing activities 52,475 94,734
cash flow from financing activities28.1 Proceeds from options exercised and share issues 6,211 1,076
Proceeds from long-term borrowings 5,030 79,829Proceeds from (+), payments of (-) short-term borrowings -9,757 -46,879Change in short-term receivables 65 272Dividends paid to equity holders of the parent -60,614 -57,199net caSh uSed in Financing activitieS -59,065 -22,901
Translation differences in cash -6,514 -9
change oF caSh and caSh equivalentS -13,104 71,824
Cash and cash equivalents at beginning of period 145,318 73,49427 Cash and cash equivalents at end of period 132,214 145,318
change oF caSh and caSh equivalentS -13,104 71,824
The effect of changes in exchange rates has been eliminated by converting the beginning balance at the rates current on the last day of the year.

72 Konecranes 2013 noteS to the conSolidated Financial StatementS
1. Corporate information Konecranes Plc (“Konecranes Group” or “the Group”) is a Finnish public limited company organized under the laws of Finland and domiciled in Hyvinkää. The company is listed on the NASDAQ OMX Helsinki.
2. Accounting policies2.1 Basis of preparationThe consolidated financial statements of Konecranes Plc have been prepared in accordance with International Financial Reporting Standards (IFRS) as adopted by the EU.
The consolidated financial statements have been prepared on a historical cost basis, except for derivative financial instruments and available-for-sale investments that have been measured at fair value. The carrying values of recognized assets and liabilities that are hedged items in fair value hedges, and are otherwise carried at cost, are adjusted to record changes in the fair values attributable to the risks that are being hedged.
The consolidated financial statements are presented in thou-sands of euros; notes to the financial statements in millions of euros and all values are rounded to the nearest thousand (€000) except when otherwise indicated.
PrinciPles of consolidation
The consolidated accounts include the parent company Konecranes Plc and those companies in which the parent company holds directly or indirectly more than 50 percent of the voting power at the end of the year. When Konecranes has less than a majority of the voting rights, it has power over the investee when the voting rights are sufficient to give the control to direct the relevant activities of the investee through rights arising from other contractual arrange-ments. See company list for further information.
An associated company is a company in which the Group holds 20–50 percent of the voting power and has significant influence over the company but not control over its financial and operating policies. Investments in Joint Arrangements are classified into Joint Operations and Joint Ventures. In Joint Operations the par-ties with joint control have rights to the assets and obligations for the liabilities of the arrangement. In Joint Ventures the parties with joint control have rights to the net assets of the arrangement. Joint control is the contractually agreed sharing of control of an arrangement, which exists only when decisions about the relevant activities require unanimous consent of the parties sharing control. Konecranes has analyzed the existing partner agreements and con-tent of the business in the companies to classify the Joint Arrange-ments accordingly.
Acquisitions of subsidiaries are accounted for using the pur-chase method according to which the acquired company’s identifi-able assets, liabilities and contingent liabilities are measured at fair value on the date of acquisition. The excess of the consider-
ation transferred (as measured according to IFRS3) for the busi-ness combination over the acquirer’s interest in the net fair value of the identifiable assets, liabilities and contingent liabilities is recorded as goodwill.
Investments in associated companies have been accounted for in the consolidated financial statements using the equity method. These interests are consolidated in accordance with the equity method, under which they are carried at cost plus post-acquisition changes in the Group’s share of the company’s net assets. Good-will arising on acquisition is included in the carrying amounts of the investments and tested for impairment as part of the investments. Goodwill is not amortized. The Group’s share of the results of oper-ations of the associated companies is shown in the consolidated statement of income as a separate item.
Joint Operations are accounted for showing each party’s inter-est in the assets, liabilities, revenues and expenses and / or its relative share of jointly controlled assets, liabilities, revenue and expense, if any. Joint Ventures are accounted for using the equity method as described above.
Non-controlling interest is presented separately under equity in the balance sheet.
Intracorporate transactions and internal margins in inventories have been eliminated in the consolidated financial statements.
2.2 Use of estimates and judgmentsThe preparation of the financial statements in accordance with IFRS requires management to make estimates and judgments that affect the valuation of reported assets and liabilities and other informa-tion, such as contingent liabilities and recognition of income and expenses in the statement of income. Although these estimates and judgments are based on the management’s best understand-ing of current events and circumstances, actual results may differ from the estimates.
2.3 Summary of significant accounting policies
foreign currency items and exchange rate differences
Assets and liabilities in foreign currencies have been valued at the rates of exchange at the balance sheet date. Realized exchange rate differences, as well as exchange rate gains or losses resulting from the valuation of receivables and liabilities, have been included in the Statement of income. Unrealized exchange rate differences relating to hedging of future cash flows, for which hedge accounting is applied and the hedge is determined to be effective, are recog-nized in other comprehensive income. In consolidation, the state-ments of income of foreign entities are translated into euros at the average exchange rate for the accounting period. The balance sheets of foreign entities are translated at the year-end exchange rate. Translation differences resulting from converting the share-holders’ equity of foreign subsidiaries have been included in equity.
Notes to the consolidated financial statements

73Konecranes 2013noteS to the conSolidated Financial StatementS
derivative financial instruments and hedge accounting
Global operations expose the Group to currency risk and to a less significant interest rate risk.
The Group uses derivative financial instruments (primarily for-ward contracts) to hedge its risks associated with foreign currency fluctuations relating to certain commitments and forecasted trans-actions.
Derivative financial instruments are used for hedging purposes in accordance with the Group’s hedging policy and not for specu-lative purposes. These instruments are initially measured at fair value at the contract date, and are re-measured to fair value based on the market value quoted at subsequent reporting dates.
For certain large crane projects the Group applies hedge account-ing compatible with IAS 39. Changes in the fair value of derivative financial instruments that are designated as effective hedges of future cash flows are recognized directly as other comprehensive income in cash flow hedges, while ineffective portion is recognized immediately in the income statement. The Group’s policy with respect to hedging the foreign currency risk of a firm commitment and highly probable forecasted transaction is to designate it as a cash flow hedge. If the cash flow hedge of a firm commitment or highly probable forecasted transaction results in the recognition of an asset or a liability, then, at the time the asset or liability is recognized, the associated gains or losses on the derivative that had previously been recognized in the equity will be recorded to the statement of income.
Hedge accounting is discontinued when the hedging instrument expires or is sold, terminated, or exercised, or no longer qualifies for hedge accounting. At that time, for forecasted transactions, any cumulative gain or loss on the hedging instrument recognized in the equity is retained in the equity until the forecasted transaction occurs. If a hedged transaction is no longer expected to occur, the net cumulative gain or loss recognized in the equity will be trans-ferred to profit or loss for the period.
Changes in the fair value of derivative financial instruments that do not qualify for hedge accounting are recognized in the statement of income as they arise.
revenue recognition
Revenue from the sale of goods is recognized after the risks and rewards connected with ownership of the goods sold have been transferred to the customer. Normally, revenue recognition takes place when the goods have been handed over to the customer according to the contractual terms. Revenues from services are recognized when the services have been rendered.
Large crane projects revenue is recognized according to the per-centage of the completion (POC) method. Most significant projects relate to harbor and shipyard cranes. The stage of completion of a contract is determined by the proportion that the contract costs incurred for the work performed to date bear to the estimated total contract costs.
research and develoPment costs
Research and development costs are charged as expenses during the year in which they are incurred, since future potential economic benefits of new products can only be proven after their introduction to the market.
government grants
Government grants are recognized when there is reasonable assur-ance that the grant will be received and all attaching conditions will be complied with. When the grant relates to an expense item, it is recognized as income over the period necessary to match the grant on a systematic basis to the costs that it is intended to compen-sate. When the grant relates to an asset, it is deducted from the acquisition cost of the asset.
emPloyee benefits (Pensions)
The Konecranes companies have various pension plans in accor-dance with local conditions and practices. Pensions are generally managed for the Group companies by outside pension insurance companies or by similar arrangements.
Under defined contribution plans, expenses are recognized for the period the contribution relates to. The Konecranes Group accounts for the Finnish system under the Employees’ Pensions Act (TyEL) within insurance system as a defined contribution plan.
Under defined benefit plans, a liability recognized in the balance sheet equals the net of the present value of the defined benefit obligation less the fair value of the plan assets at the balance sheet date. Actuarial gains and losses are recognized in the con-solidated statement of other comprehensive income as remeasure-ment items when they occur. Remeasurement recorded in other comprehensive income is not recycled. Past service cost is recog-nized in the statement of profit or loss in the period of plan amend-ment. Net-interest is calculated by applying the discount rate to the net defined liability or asset. The Group presents service cost, past-service cost, gains and losses on curtailments and settlements and net interest expense or income as employee benefit expense.
Independent actuaries calculate the defined benefit obligation by applying the Projected Unit Credit Method.
A liability for termination benefit is recognized at the earlier of when the entity can no longer withdraw the offer of the termination benefit and when the entity recognizes any related restructuring costs.
leases
Lease contracts, in which the Group assumes an essential part of risk and rewards of ownership, are classified as finance leases. In finance leases, the assets and accumulated depreciation are rec-ognized in fixed assets and the corresponding lease obligations are included in interest-bearing liabilities.
Other lease contracts are classified as operating leases and the lease payments of these leases are recognized as rental expenses in statement of income.
valuation of inventories
Raw materials and supplies are valued at the acquisition cost or, if lower, at the net realizable value. Semi-manufactured goods have been valued at variable production costs with addition of allocated variable and fixed overheads. Work in progress of uncompleted orders includes direct labor and material costs, as well as a propor-tion of overhead costs related to production and installation.
goodwill and other intangible assets
Goodwill arising from an acquisition represents the excess of the consideration transferred for the acquisition over the fair value of the identifiable net assets acquired. Goodwill is not amortized but is tested for impairment annually.

74 Konecranes 2013 noteS to the conSolidated Financial StatementS
Other intangible assets include service contracts, patents and trademarks and software licenses. They are stated at cost and amortized on the straight-line basis over expected useful lives, which may vary from 4 to 20 years.
Intangible assets with indefinite useful life are not amortized, but they are tested annually for impairment.
imPairment testing of goodwill
Goodwill acquired in a business combination is tested for impair-ment annually or whenever events or changes in circumstances indicate that the carrying amount may not be recoverable. For the purpose of impairment testing, goodwill is allocated to groups of cash-generating units (CGU) by using the Group’s management reporting structure. If the carrying amount for a CGU exceeds its recoverable amount, an impairment loss equal to the difference will be recognized.
ProPerty, Plant and equiPment
Property, plant and equipment are stated at cost less accumulated depreciation and any impairment losses. Depreciation is recorded on a straight-line basis over the estimated useful economic life of the assets as follows:• Buildings 5–40 years• Machinery and equipment 4–10 yearsNo depreciation is recorded for land.
borrowing costs
Borrowing costs that are directly attributable to the acquisition or construction of the asset are capitalized as a part of that asset. The capitalized interest expense is amortized over the estimated useful life of the underlying asset.
imPairment of assets subject to amortization and
dePreciation
The carrying values of intangible assets subject to amortization and property, plant and equipment is reviewed for impairment whenever events and changes in circumstances indicate that the carrying amount of an asset may not be recoverable.
If such an indication exists, the recoverable amount of the assets will be estimated. An impairment loss is recognized in the statement of income when the recoverable amount of an asset is less than its carrying amount.
account and other receivables
Account and other receivables are initially recorded at cost. Provi-sions are made for doubtful receivables on individual assessment of potential risks, and are recognized in the statement of income.
cash and cash equivalents
Cash and cash equivalents comprise cash balances and call deposits with banks and other liquid investments with maturities of less than three months. Bank overdrafts are included in short-term interest-bearing borrowings under current liabilities.
share-based Payments
The Konecranes Group has issued equity-settled stock options to its key personnel. The stock option holder is entitled to subscribe shares in Konecranes Plc in accordance with the terms of the stock
option programs. The fair value of the stock options is measured at the grant date and the options are recorded as expense in the statement of income during the vesting period in accordance with IFRS 2. The valuation of the options is based on the Black & Scholes formula. When the options are exercised, the equity is increased by the amount of the proceeds received.
The Group has issued also a performance share plan for its key personnel. The plan is treated partly as an equity-settled, and partly as a cash-settled share-based payment transaction. The equity-settled share rewards are valued based on the market price of the Konecranes share at the grant date, and recognized as per-sonnel expense over the vesting period with corresponding entry in retained earnings of the equity. The liability resulting from the cash-settled transactions is measured based on the market price of the Konecranes share at the balance sheet date and is recorded as an employee benefit with corresponding entry in non-current and current liabilities until the settlement date.
Market conditions, such as the total shareholder return upon which vesting is conditioned, is taken into account when estimat-ing the fair value of the equity instruments granted. The expense relating to the market condition of the equity settled share-based payment is recognized irrespective of whether that market condi-tioning is satisfied. Non-market vesting conditions such as EBIT margin and EPS are included in assumptions about the amount of share based payments that are expected to vest. At each balance sheet date Konecranes revises its estimates on the amount of share-based payments that are expected to vest. The impact of the revision to previous estimate is recognized through statement of income with corresponding adjustments to equity and non-current and current liabilities, as appropriate.
Group has launched an employee share savings plan in which each participant will receive one free matching share for every two acquired savings shares. Matching shares will be delivered to a participant if the participant holds the acquired shares from the plan period until the end of the designated holding period. The matching shares will be paid in Konecranes shares and partly in cash. The expenses of the plan are recognized over the vesting period based on the quarterly acquired savings share amounts and fair value of Konecranes share as of the closing date.
Provisions
Provisions are recognized in the balance sheet when the Group has a present legal or constructive obligation as a result of a past event and it is considered certain or likely to occur. Provisions arise from restructuring plans, onerous contracts, guarantee and claim works. Obligations arising from restructuring plans are recognized when the detailed and formal restructuring plans have been established, the personnel concerned have been informed and when there is a valid expectation that the plan will be implemented.
income tax
Taxes shown in the consolidated statement of income include income taxes to be paid on the basis of local tax legislations, tax adjustments from previous years as well as the effect of the annual change in the deferred tax liability and deferred tax assets.
Deferred tax liabilities and deferred tax assets are calculated on all temporary differences arising between the tax basis and the book value of assets and liabilities. Deferred tax is not recognized

75Konecranes 2013noteS to the conSolidated Financial StatementS
for non-deductible goodwill on initial recognition and temporary dif-ferences in investments in subsidiaries to the extent that they prob-ably will not reverse in the foreseeable future. The main temporary differences arise from unused tax losses, depreciation differences, provisions, defined benefit pension plans, inter-company inventory margin and fair valuation of derivative financial instruments. In connection with an acquisition, the Group records provisions for deferred taxes on the difference between the fair values of the net assets acquired and their tax bases. A deferred tax asset is recog-nized to the extent that it is probable that it can be utilized.
2.4 Application of new and amended IFRS standards and IFRIC interpretations The following new and amended standards and interpretations are effective in the year 2013:
• IAS19, Employee Benefits (Revised)• IFRS 10, Consolidated Financial Statements• IFRS 11, Joint Arrangements• IFRS 12, Disclosure of Interest in Other Entities• IFRS 13, Fair Value Measurement• Improvements to International Financial Reporting Standards –
2009–2011
The amendments to IAS 19 change the accounting for defined ben-efit plans and termination benefits. The most significant change relates to the accounting in defined benefit obligations and plan assets. The amendments require the recognition of changes in defined benefit obligations and in fair value of plan assets when they occur, and hence eliminate the “corridor approach” permitted under the previous version of IAS 19. All actuarial gains and losses are recognized immediately through other comprehensive income. Furthermore, the interest cost and expected return on plan assets used in the previous version of IAS 19 are replaced with a net-inter-est amount under revised IAS 19, which is calculated by applying the discount rate to the net defined benefit liability or asset. The revised IAS 19 introduces also certain changes in the presentation of the defined benefit cost and obligation including more extensive disclosures. The effect of the amended standard had immaterial impact on financial statements since Konecranes adopted the pos-sibility to recognize actuarial gains and losses in other comprehen-sive income already in 2012 (prior periods restated).
IFRS 11 uses the principle of control as described in IFRS 10 to define joint control. Joint Arrangements are classified into Joint Operations and Joint Ventures. In Joint Operations the parties with joint control have rights to the assets and obligations for the liabili-ties of the arrangement. Joint Operations are accounted for show-ing each party’s interest in the assets, liabilities, revenues and expenses and / or its relative share of jointly controlled assets, liabilities, revenue and expense, if any. In Joint Ventures the parties with joint control have rights to the net assets of the arrangement. Joint Ventures are accounted for using the equity method. The pro-portionate consolidation method is prohibited under IFRS 11. IFRS 12 requires extensive qualitative and quantitative disclosures of interests held in other entities and how control was determined. The introduction of IFRS 11 reclassified one company as joint oper-ation and did not have material impact on financial statements.
The other new and amended standards in 2013 had immaterial impact on future financial statements.
The following new and amended standards and interpretations are effective in the year 2014: • Amendment to IAS 32 Offsetting Financial Assets and Financial
Liabilities• Amendment to IFRS 10, IFRS 12 and IAS 27 – Investment enti-
ties
The amended standards in 2014 will have immaterial impact on future financial statements.
3. Management of financial risksThe Group uses an approach in which most of the management of financial risks is centralized to Konecranes Group Treasury. Group Treasury functions within the legal entity Konecranes Finance Cor-poration, operating as a financial vehicle for the Group in Corporate Headquarters. With centralization and netting of internal foreign currency cash flows, the external hedging needs can be minimized.
Konecranes Finance Corporation is not a profit center in the sense that it would pursue to maximize its profits. The company aims to serve the operative companies of the Group in reducing their financial risks.
The Group’s global business operations involve financial risks in the form of currency, interest rate, commodity, credit and liquidity risks. The Group’s objective is to increase the short-term stability of the financial environment for the business operations by reducing the negative effects caused by price fluctuations and other uncer-tainties in the financial markets.
The responsibility of identifying, evaluating and controlling the financial risks arising from the Group’s global business operations is divided between the business units and Konecranes Finance Cor-poration.
Units hedge their risks internally with Group Treasury. As a result of this, most of the financial risks of the Group are concentrated into one company, Konecranes Finance Corporation and can be evaluated and controlled in an efficient way.
Almost all funding, cash management and foreign exchange with banks and other external counterparties are centralized to Konecranes Finance Corporation in accordance with the Group’s Treasury Policy. Only in a few special cases, when the local central bank regulation prohibits using group services in hedging and fund-ing, this must be done directly between an operative company and a bank under the supervision of the Group Treasury.
Konecranes Finance Corporation uses a treasury system, which enables practically a real-time processing of transactions and in-depth records of activities and performance. The standard report-ing is done on a weekly basis and it covers group-level commercial and financial cash flows, foreign currency transaction exposure, debt positions, portfolio of derivatives and counterparty credit expo-sure for financial transactions. In addition, all group companies par-ticipate in the monthly managerial and statutory reporting.

76 Konecranes 2013 noteS to the conSolidated Financial StatementS
currency rate risk
The Group’s global business operations generate exchange rate risk. However, most of the business units only have transactions in their own currency, i.e. these units have their sales & costs as well as internal funding from Konecranes Finance Corporation in their local home currency. Only 21 out of some 100 Group companies operate regularly in a foreign currency. These companies hedge their currency rate risk with Group Treasury. Depending on the busi-ness area and the probability of the cash flows, the hedging covers operative cash flows for the next 1–24 months and is done by using internal foreign exchange forward contracts. This way, Konecranes Finance Corporation can manage the currency rate risk of the whole Group. The foreign currency funding of the other Group companies and possibly some external foreign currency funding can net some of these foreign currency items. The residual net exposure can be covered with commercial banks using foreign exchange forward contracts or currency options. Only the items belonging to hedge accounting cannot be netted out against other internal items. These instruments are used when the hedging effect cannot be obtained through internal netting and matching of cash flows within the Group.
The business units’ commercial bids in a foreign currency can be hedged by using currency options, but, in general, using currency clauses covers the risk.
For certain large crane projects, the Group applies hedge accounting compatible with IAS 39. Hedges are done by using for-eign exchange forward contracts. Currently, only USD denominated projects are included in the hedge accounting. The hedge account-ing portfolio comprises both USD sales and purchases. At the end of 2013, the hedge accounting net cash flows totaled USD 178 million (USD 100 million in 2012).
The following table shows the transaction exposure of Konecranes Finance Corporation as of December 31, 2013 and December 31, 2012 (in EUR millions):
2013 2012AUD 3 2CAD -1 -10CHF 2 5GBP 3 -2JPY 0 -1NOK 2 2SEK -47 -36SGD -11 0THB 1 0USD 165 126ZAR 1 0
The following table shows the translation exposure of the Group as of 31.12.2013 and 31.12.2012 (in EUR millions):
2013 2012AED 6 6AUD 6 5BRL -5 -2CAD 28 28CHF 4 0CLP 7 7CNY 84 102DKK 1 1GBP 3 -1HUF 3 4INR -1 8IDR -2 -1JPY -5 -3MAD -5 0MXN 2 2MYR 2 2NOK -4 -4PEN 1 1PLN 1 1RON 1 1RUB 7 6SAR 10 9SGD 55 20SEK -13 -17THB -1 -1TRY 2 4UAH -14 -14USD 42 61ZAR -1 0
Currently, none of the non-euro denominated shareholders’ equity of the Group’s foreign subsidiaries (i.e., the translation exposure) is hedged.
Please see Note 37 of the Consolidated Financial Statements for the notional and fair values of derivative financial instruments.
Changes in currency rates can affect the profitability and equity of the Group. The U.S. dollar has clearly the biggest impact, as many of large crane projects are denominated in USD and the Group has a lot of local business operations in the United States. A depreciation of the USD has a negative impact.
The following table shows the magnitude of the effects that changes in the EUR/USD exchange rate would have on the Group’s annual EBIT and equity. An appreciation of the average rate of US dollar against Euro for ten percent increases the operating profit by EUR 15.8 million (22.9 million in 2012) and equity by EUR 4.9 million (6.7 million in 2012). Table figures in EUR million, the USD effect simulated:
change in euR/uSd
Rate2013eBit
2013equity
2012eBit
2012equity
+10% - 12.9 - 4.0 - 20.8 - 6.1
- 10% +15.8 +4.9 +22.9 +6.7
The transaction position is estimated for the calendar year and the estimate of the effects is based on the assumption that the USD
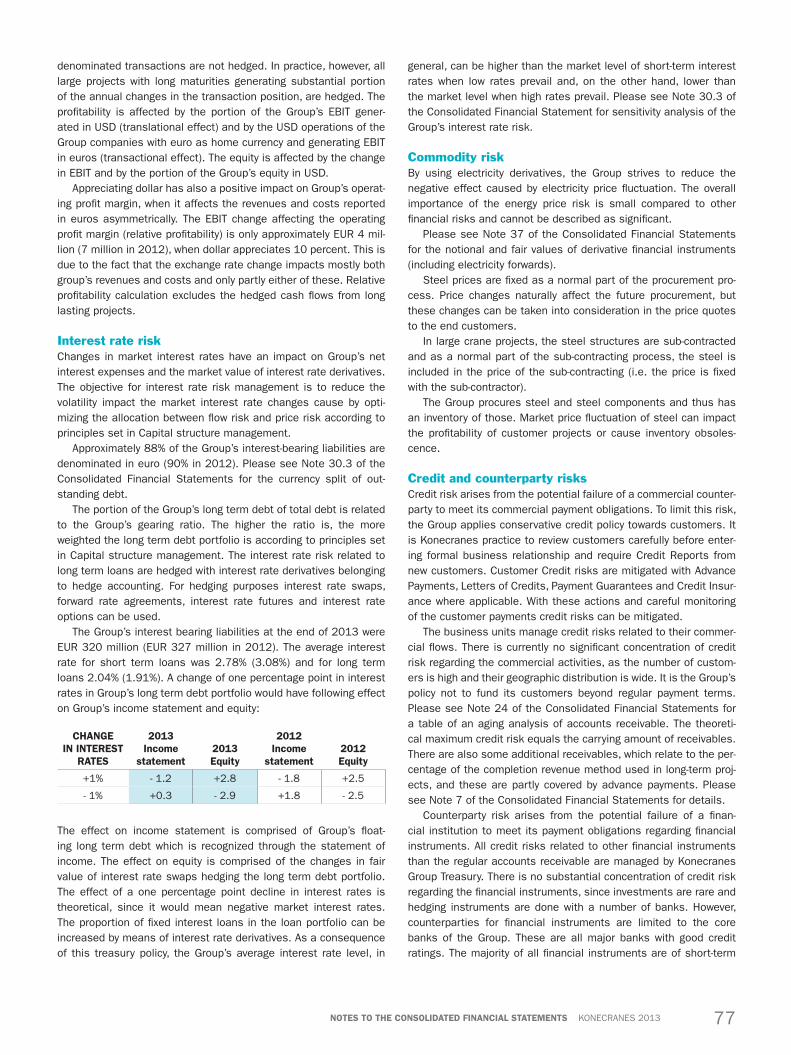
77Konecranes 2013noteS to the conSolidated Financial StatementS
denominated transactions are not hedged. In practice, however, all large projects with long maturities generating substantial portion of the annual changes in the transaction position, are hedged. The profitability is affected by the portion of the Group’s EBIT gener-ated in USD (translational effect) and by the USD operations of the Group companies with euro as home currency and generating EBIT in euros (transactional effect). The equity is affected by the change in EBIT and by the portion of the Group’s equity in USD.
Appreciating dollar has also a positive impact on Group’s operat-ing profit margin, when it affects the revenues and costs reported in euros asymmetrically. The EBIT change affecting the operating profit margin (relative profitability) is only approximately EUR 4 mil-lion (7 million in 2012), when dollar appreciates 10 percent. This is due to the fact that the exchange rate change impacts mostly both group’s revenues and costs and only partly either of these. Relative profitability calculation excludes the hedged cash flows from long lasting projects.
Interest rate riskChanges in market interest rates have an impact on Group’s net interest expenses and the market value of interest rate derivatives. The objective for interest rate risk management is to reduce the volatility impact the market interest rate changes cause by opti-mizing the allocation between flow risk and price risk according to principles set in Capital structure management.
Approximately 88% of the Group’s interest-bearing liabilities are denominated in euro (90% in 2012). Please see Note 30.3 of the Consolidated Financial Statements for the currency split of out-standing debt.
The portion of the Group’s long term debt of total debt is related to the Group’s gearing ratio. The higher the ratio is, the more weighted the long term debt portfolio is according to principles set in Capital structure management. The interest rate risk related to long term loans are hedged with interest rate derivatives belonging to hedge accounting. For hedging purposes interest rate swaps, forward rate agreements, interest rate futures and interest rate options can be used.
The Group’s interest bearing liabilities at the end of 2013 were EUR 320 million (EUR 327 million in 2012). The average interest rate for short term loans was 2.78% (3.08%) and for long term loans 2.04% (1.91%). A change of one percentage point in interest rates in Group’s long term debt portfolio would have following effect on Group’s income statement and equity:
change in inteReSt
RateS
2013income
statement2013equity
2012income
statement2012equity
+1% - 1.2 +2.8 - 1.8 +2.5
- 1% +0.3 - 2.9 +1.8 - 2.5
The effect on income statement is comprised of Group’s float-ing long term debt which is recognized through the statement of income. The effect on equity is comprised of the changes in fair value of interest rate swaps hedging the long term debt portfolio. The effect of a one percentage point decline in interest rates is theoretical, since it would mean negative market interest rates. The proportion of fixed interest loans in the loan portfolio can be increased by means of interest rate derivatives. As a consequence of this treasury policy, the Group’s average interest rate level, in
general, can be higher than the market level of short-term interest rates when low rates prevail and, on the other hand, lower than the market level when high rates prevail. Please see Note 30.3 of the Consolidated Financial Statement for sensitivity analysis of the Group’s interest rate risk.
Commodity riskBy using electricity derivatives, the Group strives to reduce the negative effect caused by electricity price fluctuation. The overall importance of the energy price risk is small compared to other financial risks and cannot be described as significant.
Please see Note 37 of the Consolidated Financial Statements for the notional and fair values of derivative financial instruments (including electricity forwards).
Steel prices are fixed as a normal part of the procurement pro-cess. Price changes naturally affect the future procurement, but these changes can be taken into consideration in the price quotes to the end customers.
In large crane projects, the steel structures are sub-contracted and as a normal part of the sub-contracting process, the steel is included in the price of the sub-contracting (i.e. the price is fixed with the sub-contractor).
The Group procures steel and steel components and thus has an inventory of those. Market price fluctuation of steel can impact the profitability of customer projects or cause inventory obsoles-cence.
Credit and counterparty risksCredit risk arises from the potential failure of a commercial counter-party to meet its commercial payment obligations. To limit this risk, the Group applies conservative credit policy towards customers. It is Konecranes practice to review customers carefully before enter-ing formal business relationship and require Credit Reports from new customers. Customer Credit risks are mitigated with Advance Payments, Letters of Credits, Payment Guarantees and Credit Insur-ance where applicable. With these actions and careful monitoring of the customer payments credit risks can be mitigated.
The business units manage credit risks related to their commer-cial flows. There is currently no significant concentration of credit risk regarding the commercial activities, as the number of custom-ers is high and their geographic distribution is wide. It is the Group’s policy not to fund its customers beyond regular payment terms. Please see Note 24 of the Consolidated Financial Statements for a table of an aging analysis of accounts receivable. The theoreti-cal maximum credit risk equals the carrying amount of receivables. There are also some additional receivables, which relate to the per-centage of the completion revenue method used in long-term proj-ects, and these are partly covered by advance payments. Please see Note 7 of the Consolidated Financial Statements for details.
Counterparty risk arises from the potential failure of a finan-cial institution to meet its payment obligations regarding financial instruments. All credit risks related to other financial instruments than the regular accounts receivable are managed by Konecranes Group Treasury. There is no substantial concentration of credit risk regarding the financial instruments, since investments are rare and hedging instruments are done with a number of banks. However, counterparties for financial instruments are limited to the core banks of the Group. These are all major banks with good credit ratings. The majority of all financial instruments are of short-term

78 Konecranes 2013 noteS to the conSolidated Financial StatementS
nature, with maturity of less than one year. There are no significant deposits or loans granted with external counterparties.
The Group has bank risk exposure in form of cash at bank accounts around the world. Despite the active cash management structures the Group has in place, some cash holdings globally with several banks are needed to ensure the liquidity of Group com-panies. Group Treasury follows closely the bank risk exposure in Group according to principles set in Treasury Policy and takes nec-essary actions for reducing the risk.
Liquidity risksLiquidity risks concern the availability of liquid assets or funding. Lack of funding might jeopardize normal business operations and eventually might endanger the ability to fulfill daily payment obliga-tions.
For managing the liquidity risks, the Group has established a EUR 200 million committed revolving credit facility with an inter-national loan syndication (2010–2015). To cover the short-term funding needs, Konecranes Finance Corporation can borrow from institutional investors through five domestic commercial paper programs (totaling EUR 480 million). In addition, business units around the world have overdraft facilities totaling some EUR 140 million to cover the day-to-day funding needs.
It is the Group’s policy to keep minimum amount of cash in the balance sheet as deposits or any other liquid assets to maximize the return of capital employed. Cash and cash equivalents totaled EUR 132.5 million at the end of 2013 (EUR 145.4 in 2012).
See Note 30.3 of the Consolidated Financial Statements for the maturity profile of the Group’s financial liabilities.
Capital structure managementThe primary objective of the Group’s capital structure manage-ment is to ensure that it maintains a good credit risk status and a healthy capital ratio to support its business operations. At the same time, the Group also aims to maximize shareholder value by effective use of capital.
The Group manages its capital structure and fine-tunes it to adjust to probable changes in economic conditions. These actions may include adjusting the dividend payment to shareholders, buying back own shares or issuing new shares.
The Group monitors its capital structure using gearing ratio. This is calculated as a ratio of interest-bearing liabilities less liquid assets less loans receivable to total equity. At the end of 2013, the gearing ratio was 42.1% (39.5% in 2012).
The Group has no quantitative targets for the capital structure but the optimal long-term gearing ratio is in the range of 50–80%. However, in the short term, the gearing can also be significantly higher or lower than this range.
The Group decides on the split between long-term and short-term debt in relation to the gearing ratio level. The following table shows the rough guidelines for the portion of long–term debt of total debt under different gearing ratio levels:
gearing ratio level
portion of long–termof total debt
Under 50% Under 1/3
Between 50–80% Between 1/3 and 2/3
Over 80% Over 2/3
The Group monitors the gearing ratio level on a weekly basis. Dur-ing 2013, no changes have been made in the objectives, policies or processes. The objectives of the Group’s capital management have been met in recent years.

79Konecranes 2013noteS to the conSolidated Financial StatementS
4. Segment informationFrom 2010 onwards Konecranes has reported two Business Areas: Service and Equipment as its primary business segments. The business areas are based on the Group’s management reporting and organizational structure. Konecranes Group’s highest operative decision maker is the President and CEO with the support of the Group Executive Board (GXB).
The assets and liabilities of the business areas include only items directly connected with the business as well as the goodwill related to them. Unallocated items, including Group Headquarters, include tax and financial income and expenses, which are managed on group level, as well as items which can not be allocated to the business areas.
As its secondary segments, Konecranes Group reports three geographical areas, which are the main market areas: EMEA (Europe, Middle East and Africa), AME (Americas) and APAC (Asia-Pacific). Sales are reported by the customer location and assets and capital expenditure by the location of the assets.
Intercorporate transfer prices are based primarily on the market prices.
4.1. Business segments
2013 Service equipmentunallocated
items eliminations total
Orders received 715.9 1,319.6 -114.7 1,920.8
Order book 128.1 765.3 893.5
Sales to external customers 844.2 1,255.4 2,099.6
Inter-segment sales 44.9 73.8 -118.7 0.0
Total net sales 889.1 1,329.2 -118.7 2,099.6
EBITDA 89.6 71.6 -21.1 0.5 140.5
EBITDA, % 10.1% 5.4% 6.7%
Depreciation and amortization 14.6 24.1 0.4 39.1
Impairment of assets 7.2 9.7 16.9
Operating profit excluding restructuring costs 80.6 54.3 -20.0 0.5 115.5
% of net sales 9.1% 4.1% 5.5%
Operating profit including restructuring costs 67.8 37.8 -21.6 0.5 84.5
% of net sales 7.6% 2.8% 4.0%
Assets 359.3 860.2 262.6 1,482.0
Liabilities 171.8 482.1 383.7 1,037.5
ROCE% 38.3% 9.6% 11.6%
Capital expenditure 20.1 45.6 65.7
Share of result of associates and joint ventures 0.0 3.9 3.9
Investment in associates and joint ventures 0.0 40.4 40.4
Personnel 6,151 5,626 55 11,832
All figures are in millions of euros unless otherwise indicated.
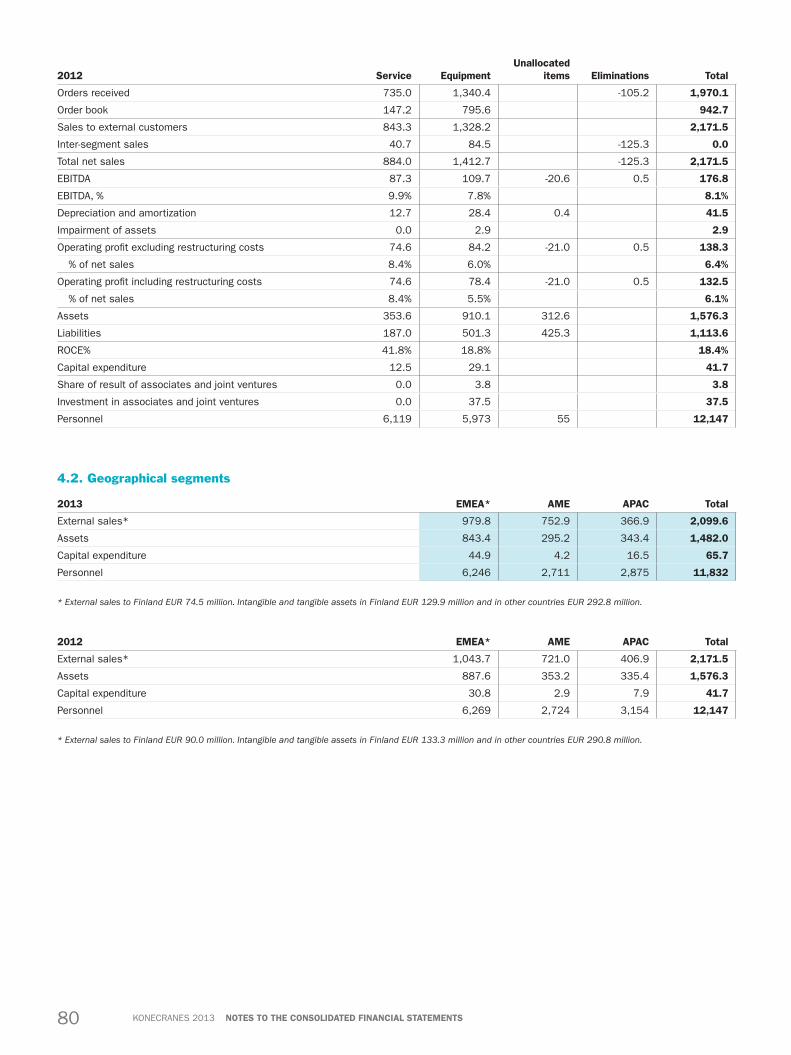
80 Konecranes 2013 noteS to the conSolidated Financial StatementS
2012 Service equipmentunallocated
items eliminations total
Orders received 735.0 1,340.4 -105.2 1,970.1
Order book 147.2 795.6 942.7
Sales to external customers 843.3 1,328.2 2,171.5
Inter-segment sales 40.7 84.5 -125.3 0.0
Total net sales 884.0 1,412.7 -125.3 2,171.5
EBITDA 87.3 109.7 -20.6 0.5 176.8
EBITDA, % 9.9% 7.8% 8.1%
Depreciation and amortization 12.7 28.4 0.4 41.5
Impairment of assets 0.0 2.9 2.9
Operating profit excluding restructuring costs 74.6 84.2 -21.0 0.5 138.3
% of net sales 8.4% 6.0% 6.4%
Operating profit including restructuring costs 74.6 78.4 -21.0 0.5 132.5
% of net sales 8.4% 5.5% 6.1%
Assets 353.6 910.1 312.6 1,576.3
Liabilities 187.0 501.3 425.3 1,113.6
ROCE% 41.8% 18.8% 18.4%
Capital expenditure 12.5 29.1 41.7
Share of result of associates and joint ventures 0.0 3.8 3.8
Investment in associates and joint ventures 0.0 37.5 37.5
Personnel 6,119 5,973 55 12,147
4.2. Geographical segments
2013 emea* ame apac total
External sales* 979.8 752.9 366.9 2,099.6
Assets 843.4 295.2 343.4 1,482.0
Capital expenditure 44.9 4.2 16.5 65.7
Personnel 6,246 2,711 2,875 11,832
* External sales to Finland EUR 74.5 million. Intangible and tangible assets in Finland EUR 129.9 million and in other countries EUR 292.8 million.
2012 emea* ame apac total
External sales* 1,043.7 721.0 406.9 2,171.5
Assets 887.6 353.2 335.4 1,576.3
Capital expenditure 30.8 2.9 7.9 41.7
Personnel 6,269 2,724 3,154 12,147
* External sales to Finland EUR 90.0 million. Intangible and tangible assets in Finland EUR 133.3 million and in other countries EUR 290.8 million.
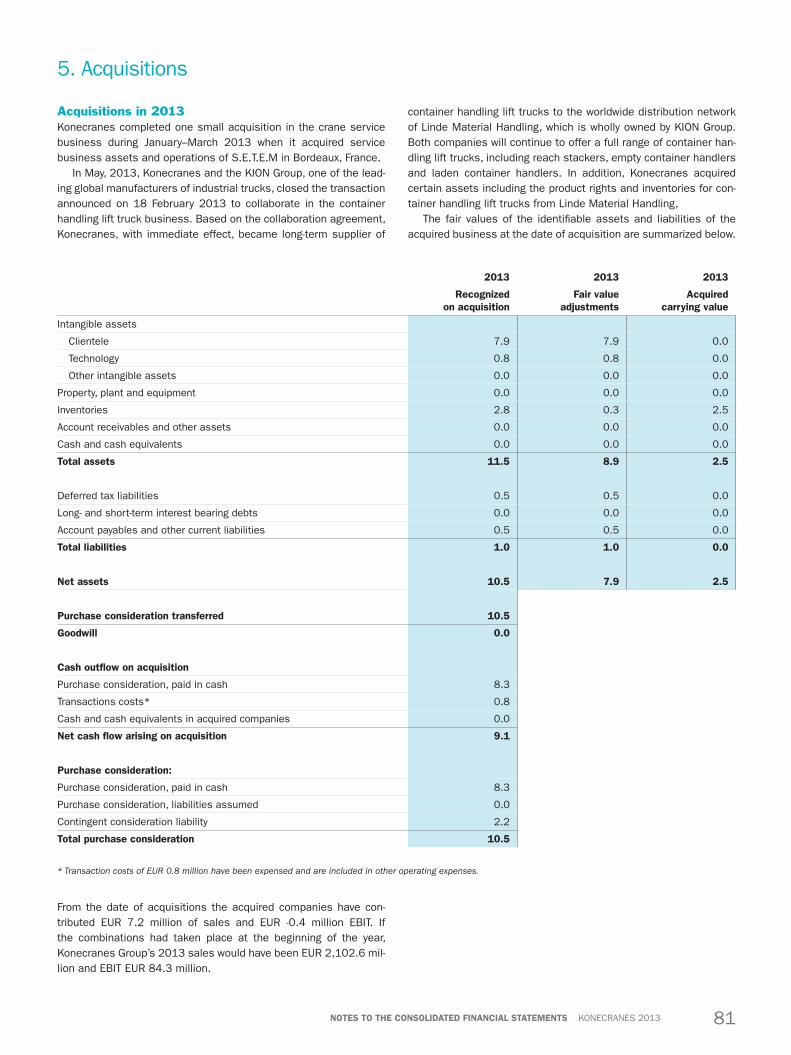
81Konecranes 2013noteS to the conSolidated Financial StatementS
5. Acquisitions
Acquisitions in 2013Konecranes completed one small acquisition in the crane service business during January–March 2013 when it acquired service business assets and operations of S.E.T.E.M in Bordeaux, France.
In May, 2013, Konecranes and the KION Group, one of the lead-ing global manufacturers of industrial trucks, closed the transaction announced on 18 February 2013 to collaborate in the container handling lift truck business. Based on the collaboration agreement, Konecranes, with immediate effect, became long-term supplier of
container handling lift trucks to the worldwide distribution network of Linde Material Handling, which is wholly owned by KION Group. Both companies will continue to offer a full range of container han-dling lift trucks, including reach stackers, empty container handlers and laden container handlers. In addition, Konecranes acquired certain assets including the product rights and inventories for con-tainer handling lift trucks from Linde Material Handling,
The fair values of the identifiable assets and liabilities of the acquired business at the date of acquisition are summarized below.
2013 2013 2013
Recognized on acquisition
Fair value adjustments
acquired carrying value
Intangible assets
Clientele 7.9 7.9 0.0
Technology 0.8 0.8 0.0
Other intangible assets 0.0 0.0 0.0
Property, plant and equipment 0.0 0.0 0.0
Inventories 2.8 0.3 2.5
Account receivables and other assets 0.0 0.0 0.0
Cash and cash equivalents 0.0 0.0 0.0
total assets 11.5 8.9 2.5
Deferred tax liabilities 0.5 0.5 0.0
Long- and short-term interest bearing debts 0.0 0.0 0.0
Account payables and other current liabilities 0.5 0.5 0.0
total liabilities 1.0 1.0 0.0
net assets 10.5 7.9 2.5
purchase consideration transferred 10.5
goodwill 0.0
cash outflow on acquisition
Purchase consideration, paid in cash 8.3
Transactions costs* 0.8
Cash and cash equivalents in acquired companies 0.0
net cash flow arising on acquisition 9.1
purchase consideration:
Purchase consideration, paid in cash 8.3
Purchase consideration, liabilities assumed 0.0
Contingent consideration liability 2.2
total purchase consideration 10.5
* Transaction costs of EUR 0.8 million have been expensed and are included in other operating expenses.
From the date of acquisitions the acquired companies have con-tributed EUR 7.2 million of sales and EUR -0.4 million EBIT. If the combinations had taken place at the beginning of the year, Konecranes Group’s 2013 sales would have been EUR 2,102.6 mil-lion and EBIT EUR 84.3 million.

82 Konecranes 2013 noteS to the conSolidated Financial StatementS
Divestments 2013During the third quarter of 2013, Konecranes sold small Machine Tool Service business unit in Heilbronn Germany to the manage-ment of the unit. The disposal resulted a loss of 0.9 M€ to the statement of income.
Acquisitions in 2012Konecranes completed two small acquisitions in crane service business during April–June 2012 when it acquired assets and oper-
ations of Deussen Andernach GmbH in Andernach, Germany and Ameritronic Industries, Inc in Indiana, USA.
During July–September Konecranes acquired the assets and operations of two small crane service companies: Re-Cranes, located in Prague, Czech Republic and Nea Lyfton, located in Öre-bro, Sweden.
The fair values of the identifiable assets and liabilities of the acquired business at the date of acquisition are summarized below.
2012 2012 2012
Recognized on acquisition
Fair value adjustments
acquired carrying value
Intangible assets
Clientele 1.6 1.6 0.0
Technology 0.0 0.0 0.0
Other intangible assets 0.0 0.0 0.0
Property, plant and equipment 0.3 0.0 0.3
Inventories 0.1 0.0 0.1
Account receivables and other assets 0.0 0.0 0.0
Cash and cash equivalents 0.0 0.0 0.0
total assets 2.0 1.6 0.4
Deferred tax liabilities 0.3 0.3 0.0
Long- and short-term interest bearing debts 0.0 0.0 0.0
Account payables and other current liabilities 0.1 0.0 0.1
total liabilities 0.4 0.3 0.1
net assets 1.6 1.3 0.3
purchase consideration transferred 1.6
goodwill 0.0
cash outflow on acquisition
Purchase consideration, paid in cash 1.5
Transactions costs* 0.2
Cash and cash equivalents in acquired companies 0.0
net cash flow arising on acquisition 1.7
purchase consideration:
Purchase consideration, paid in cash 1.5
Purchase consideration, liabilities assumed 0.1
Contingent consideration liability 0.0
total purchase consideration 1.6
* Transaction costs of EUR 0.2 million have been expensed and are included in other operating expenses.
From the date of acquisitions the acquired companies have con-tributed EUR 2.4 million of sales and EUR -0.1 million EBIT. If the combinations had taken place at the beginning of the year, Konecranes Group’s 2012 sales would have been EUR 2,172.7 mil-lion and EBIT EUR 132.4 million.

83Konecranes 2013noteS to the conSolidated Financial StatementS
6. Distribution of sales2013 2012
Sale of goods 1,444.1 1,528.3
Rendering of services 654.5 642.7
Leasing of own products 0.4 0.3
Royalties 0.6 0.2
total 2,099.6 2,171.5
7. Percentage of completion method and advances received7.1. peRcentage oF completion method 2013 2012
The cumulative revenues of non-delivered projects 297.5 309.6
Advance received from percentage of completion method 277.5 324.5
Receivables from the revenue recognition netted with the advances received 215.5 261.4
Net sales recognized under the percentage of completion method amounted EUR 389.9 million in 2013 (EUR 404.1 in 2012).
7.2. advance paYmentS Received 2013 2012
Advance received from percentage of completion method (netted) 62.0 63.1
Other advance received from customers 113.3 154.0
total 175.2 217.2
8. Other operating income2013 2012
Profit of disposal of fixed assets 0.3 0.2
Rental income 0.4 0.6
Indemnities 0.3 0.4
Other 0.6 1.0
total 1.6 2.3
9. Government grants2013 2012
Investment grants in building, machinery and employment grants 0.4 0.9
Grants for research and development 0.5 0.7
total 0.9 1.6
10. Depreciation, amortization and impairments10.1. depReciation and amoRtization 2013 2012
Intangible assets 16.2 19.9
Buildings 2.9 3.0
Machinery and equipment 19.9 18.6
total 39.1 41.5
10.2. impaiRmentS 2013 2012
Buildings, Machinery and equipment 1.7 0.0
Intangible rights 10.8 0.0
Goodwill 4.5 2.9
total 16.9 2.9
11. Other operating expenses2013 2012
Change in work in progress 11.6 -5.5
Production for own use -0.3 -1.2
Material and supplies 816.2 877.6
Subcontracting 196.5 193.6
Wages and salaries 476.6 478.9
Pension costs 38.0 38.1
Other personnel expenses 83.6 81.7
Other operating expenses 338.5 333.7
total 1,960.6 1,996.9
Research and developments costs recognized as an expense in other operating expenses amount to EUR 25.6 million in the year 2013 (EUR 25.8 million in 2012).
12. Personnel expenses and number of personnel12.1. peRSonnel expenSeS 2013 2012
Wages and salaries 476.6 478.9
Pension costs: Defined benefit plans 4.3 5.4
Pension costs: Defined contribution plans 33.7 32.8
Other personnel expenses 83.6 81.7
total 598.2 598.7
12.2. aveRage peRSonnel 2013 2012
The average number of personnel 11,987 11,917
Personnel 31 December, 11,832 12,147
of which in Finland 1,989 2,035
12.3. peRSonnel BY BuSineSS aRea at end oF peRiod 2013 2012
Service 6,151 6,119
Equipment 5,626 5,973
Group Staff 55 55
total 11,832 12,147

84 Konecranes 2013 noteS to the conSolidated Financial StatementS
13. Management compensationBoard of DirectorsThe remuneration packages for Board members are resolved by the Annual General Meeting on proposal by the Nomination and Com-pensation Committee. The AGM 2013 confirmed an annual fee of EUR 105,000 for the Chairman of the Board (2012: EUR 105,000), EUR 67,000 for the Vice Chairman of the Board (2012: EUR 67,000), and EUR 42,000 for other Board members (2012: EUR 42,000). In addition, compensation of EUR 1,500 was approved for attendance at Board committee meetings (2012: EUR 1,500). How-ever, the chairman of audit committee is entitled to a compensation of EUR 3,000 (2012: EUR 3,000) per meeting for attendance at audit committee meetings.
According to the proposal, 50% of the annual remuneration is to be used for acquiring shares in the company. The remuneration may also be paid by transferring treasury shares based on the authorization given to the board of directors by the general meet-ing. In case such purchase of shares cannot be carried out due to reasons related either to the company or to a board member, the annual remuneration shall be paid entirely in cash.
Travel expenses will be compensated against receipt.
2013 2013 2012 2012
total compenSation to the BoaRd oF diRectoRS
Total compen sation,
EUR
Number of shares as part of com pensation
Total compen sation,
EUR
Number of shares as part of com pensation
Chairman of the Board 108,000 1,873 111,840 2,276
Board members 331,500 5,243 342,845 6,370
total 439,500 7,116 454,685 8,646
President and CEOThe Nomination and Compensation Committee reviews the Presi-dent and CEO’s performance. Based on this review and relevant facts, the Board sets the total compensation package for the Presi-dent and CEO.
2013 2012
Salary and benefits, EUR 656,041 553,603
Annual variable pay, EUR 120,000 262,800
total 776,041 816,403
Expense of statutory pension plans 112,360 88,570
Expense of voluntary pension plans 94,123 87,084
total 206,483 175,654
Shareholding in Konecranes Plc (number of shares) 225,520 263,749
Option rights owned (number of options) 80,000 80,000
Performance share rights allocated 67,200 48,000
Share-based payments costs, EUR 281,727 248,693
Retirement age 63 years 63 years
Period of notice 6 months
Severance payment18 months salary and fringe benefits
The additional pension agreement of President and CEO Pekka Lundmark was reviewed and amended during 2012 to reinforce its defined contribution plan feature with an annual contribution of 18,6% from the salary. At the same time the retirement age was raised to 63 years.
At the end of year 2013, Konecranes had a loan receivable of EUR 225,336.14 from President & CEO Pekka Lundmark with the interest rate of 1.533%. (EUR 221,725.43 with the interest rate of 1.615% in 2012). The loan relates to a tax payment resulting from the incentive scheme directed to the President & CEO in 2006. There is a tax appeal pending against the imposed payment and the loan is effective until the appeal is concluded.
Group Executive Board & Senior Management TeamIn 2013 Konecranes had a two-tier operative management struc-ture consisting of the Group Executive Board (GXB) and the Senior Management Team (SMT).The GXB convenes as frequently as nec-essary, normally on a monthly basis. The SMT shall convene twice a year, in April–May and in December. Business Areas and Regions have their own management teams that convene on a regular basis. Only Group Executive Board is classified to key management personnel due to the decision making power.
The Group Executive Board comprises President and CEO, and Chairman of the Group Executive Board; Executive Vice President, Head of Business Area Service and Chief Customer Officer; Execu-tive Vice President and Head of Business Area Equipment; Execu-tive Vice President, Strategy and Technology; Chief Financial Offi-cer; Senior Vice President, Human Resources; and Chief Informa-tion Officer.

85Konecranes 2013noteS to the conSolidated Financial StatementS
The Nomination and Compensation Committee of the Board reviews Group compensation policies and issues guidelines for the same. In accordance with these guidelines, the Nomination and Compensation Committee confirms compensation packages for those Group Executive Board members who report directly to the President and CEO. For other Group Executive Board members, the compensation packages are confirmed by the President and CEO.
The retirement age of the Finnish members of the Group Execu-tive Board (excluding the President and CEO) is set according to the Employees Pensions Act (TyEL). The Finnish members of the Group Executive Board also participate in the contribution-based group pension insurance scheme offered to key personnel in Finland. The defined contribution payment by the company is 1% of annual salary excluding performance based compensation (annual or long term incentives). The Finnish Group Executive Board members also have life insurance and disability insurances. Non-Finnish members have local insurances.
gRoup executive BoaRd excluding the pReSident and ceo 2013 2012
Salary and benefits, EUR 1,283,773 1,112,489
Annual variable pay, EUR 246,131 206,755
total 1,529,904 1,319,244
Expense of statutory pension plans 218,645 194,646
Expense of voluntary pension plans 9,896 8,356
total 228,541 203,002
Shareholding in Konecranes Plc (number of shares)* 170,786 191,706
Option rights owned (number of options) 141,500 219,135
Performance share rewards allocated 163,200 108,000
Share-based payments costs, EUR 690,453 522,919
* The number of shares 2012 does not include 12,500 exercised option rights for which the transfer of treasury shares occurred in 2013.
There were no loans to the Group Executive Board (excluding the President and CEO) at end of the period 2013 and 2012.
There are no guarantees on behalf of the Group Executive Board in year 2013 and 2012.
The employee benefits to the key management personnel of the Group were in total EUR 4.2 million in year 2013 (3.7 million in year 2012).
14. Financial income and expenses14.1. Financial income 2013 2012
Dividend income on available-for-sale investments 0.1 0.1
Interest income on bank deposits and loans 4.8 3.3
Fair value gain on derivative financial instruments 9.9 3.5
Other financial income 2.7 0.1
total 17.5 6.9
14.2. Financial expenSeS 2013 2012
Interest expenses on liabilities 13.3 14.7
Exchange rate loss on interest bearing assets and liabilities 15.4 2.3
Other financial expenses 1.8 2.1
total 30.5 19.0
Financial income and expenses net -13.0 -12.1
The company applies hedge accounting on derivatives used to hedge cash flows in certain large crane projects. The cash flow hedges of the expected future cash flows are assessed to be highly effective and a net unrealized effect of EUR 2.6 million (2012: EUR -1.4 million) with deferred taxes of EUR -0.7 million (2012: EUR 0.5 million) relating to the hedging instruments is included in the equity. The hedged operative cash flows are expected to occur dur-ing the next 3–18 months.

86 Konecranes 2013 noteS to the conSolidated Financial StatementS
15. Income taxes15.1. taxeS in Statement oF income 2013 2012
Local income taxes of group companies 36.0 45.3
Taxes from previous years 2.4 1.1
Change in deferred taxes -12.3 -6.9
total 26.1 39.4
15.2. Reconciliation oF income BeFoRe taxeS with total income taxeS 2013 2012
Profit before taxes 75.5 124.2
Tax calculated at the domestic corpora-tion tax rate of 24.5% (2012: 24.5%) 18.5 30.4
Effect of different tax rates of foreign subsidiaries 1.2 3.8
Taxes from previous years 2.4 1.1
Tax effect of non-deductible expenses and tax-exempt income 2.1 1.4
Tax effect of unrecognized tax losses of the current year 3.5 4.5
Tax effect of utilization of previously unrecognized tax losses -0.3 -0.7
Tax effect of recognition of previously unrecognized tax losses -0.5 -0.7
Tax effect of recognizing the controlled temporary difference from investment in subsidiaries 0.1 0.0
Tax effect of tax rate change * -0.2 0.0
Other items -0.7 -0.3
total 26.1 39.4
Effective tax rate % 34.5% 31.7%
* The tax rate changes in Finland from January 1, 2014 are recognized in deferred taxes in 2013.
15.3. tax eFFectS oF componentS in otheR compRehenSive income 2013 2012
Cash flow hedges 1.0 0.5
Re-measurement gains (losses) on defined benefit plan -0.9 -3.1
total 0.1 -2.6
16. Earnings per shareBasic earnings per share are calculated by dividing the net income attributable to the shareholders of the parent company by the weighted average number of shares outstanding during the year. Diluted earnings per share are calculated by adjusting the weighted average number of shares with the stock options outstanding per December 31.
2013 2012
Net profit attributable to shareholders of the parent company 49.1 84.2
Weighted average number of shares outstanding (1,000 pcs) 57,684 57,228
Effect of issued share options (1,000 pcs) 193 289
Diluted weighted average number of shares outstanding (1,000 pcs) 57,877 57,517
Earnings per share, basic (EUR) 0.85 1.47
Earnings per share, diluted (EUR) 0.85 1.46
17. Goodwill and goodwill impairment testing
General principlesThe goodwill is allocated to cash-generating units (CGUs) being the lowest level of assets for which there are separately identifiable cash flows. These CGUs are then aggregated to the Business Unit (BU) level which is the lowest operative management reporting level at which goodwill is monitored and for which the impairment testing is primarily done.
The recoverable amounts of the BUs and CGU are determined based on value in use calculations (discounted cash flow method). In those cases where a CGU forms a stand alone business where synergies with the rest of the respective BU activities are difficult to assess, the goodwill is tested on the CGU level. The forecasting period of cash flows is five years and it is based on financial fore-casts of each BU’s management, adjusted by Group management if needed. The forecasts have been made based on BU specific historical data, order book, the current market situation and indus-try specific information of the future growth possibilities. The cal-culated cash flows after the five-year forecasting period are based on a zero percent growth estimate on sales and operating margin. Calculations are prepared during the fourth quarter of the year.
The discount rate applied to cash flow projections is the weighted average (pre-tax) cost of capital and is based on risk free long term government bond rates and market and industry specific risk premiums. These risk premiums are derived based on the busi-ness portfolio of companies which operate in a similar industry as the BUs. The average discount rate used in 2013 is 12,4 percent (a weighted average of a range from 10 to 20 percent). In 2012, the

87Konecranes 2013noteS to the conSolidated Financial StatementS
average pre-tax discount rate used was 11,7 percent (a weighted average of a range from 9 to 19 percent). The business risk distri-bution of the tested BUs were considered when determining the discount rates in use and the discount rates account for the aver-age cost of capital for all BUs.
Goodwill allocation to main cash-generating Units (CGUs), Business Units (BU) and business segments:The Group’s total goodwill is allocated to the Business Units (BU) as indicated in the table below. The table also shows separately the goodwill of those individual CGUs that represent stand alone businesses and thus are extracted from BU-level for goodwill impairment testing purposes (tested separately).
In Group’s assets, there is also included EUR 10.4 million intan-gible assets with indefinite useful life arising from the acquisition of R. Stahl AG’s material handling division, which consists of the trademark of the brand name ‘Stahl’. The carrying amount of this asset is tested on a yearly basis by using a similar kind of impair-ment testing method as the goodwill.
Sensitivity analysesIn addition to impairment testing using the base case assump-tions, three different sensitivity analyses were performed:• A discount rate analyses where the discount rate was
increased by 5 percentage points.• A Group management adjustment to the future profitability.
Each BU and stand alone CGU cash flow was analyzed by the Group management. Based on the BU specific historical data and future growth prospects the cash flows were decreased by -10%.
• A higher discount rate (+5% points) analyses combined with lower (-10%) cash flows as mentioned above.
Goodwill testing results:Restructuring actions and closure of certain parts of business units have lead to additional impairment testing in two business units: Port Service and Light Lifting, which includes 2012 tested CGU Suomen Teollisuusosa and CGU Konecranes Light Lifting. As a result of the testing a total of EUR 4.5 million of Goodwill was writ-ten off (Business Unit Port Service EUR 3.5 million and Business Unit Light Lifting EUR 1.0 million). As a result of the regular impair-ment test in 2013 there were no need for additional write offs.
In the regular impairment test 2013 the recoverable amount of Business Unit Port Service exceeded the balance value by EUR 0.9 million and in the Business Unit Light Lifting by EUR 0.9 mil-lion respectively. Sensitivity tests using both higher discount rate (+5% points) and lower cash flow estimates (-10%) indicated that BU Port Service Goodwill would have been impaired by additional EUR 6.6 million and BU Light Lifting Goodwill by EUR 5.8 million. The recoverable amount would be the same as balance value if the discount rate would be 0.5% points higher in BU Port Service and 0.3% points higher in BU Light Lifting or if the cash flows would be 4.9% lower in BU Port Service and 3.3% lower in BU Light Lifting. There was no indication of impairment for any other GCU Goodwill due to the sensitivity tests.
total goodwill in BuSineSS SegmentS aFteR impaiRmentS 2013 2012
BU Industrial Cranes 37.2 43.3
BU Lifttrucks 13.2 13.6
CGU STAHL Konecranes GmbH, Germany 20.4 20.4
BU Light Lifting* 5.8 6.8
goodwill in equipment total 76.5 84.0
BU Port Service 10.8 14.3
BU Crane Service 9.7 9.4
BU Machine Tool Service 4.5 5.1
goodwill in Service total 25.1 28.8
total goodwill in Business Segments as of december 31 101.6 112.8
* Includes Konecranes Lifting Systems and Suomen Teollisuusosa which were reported as separate CGU in 2012.
As a result of the impairment test in 2012 an EUR 2.9 million impairment need was identified for Konecranes Lifting Systems as the future discounted cash flows did not support the asset value tested due to the low volumes in tailor-made manipulator business.
goodwill 2013 2012
Acquisition costs as of January 1 123.1 122.7
Increase 0.0 0.0
Translation difference -6.7 0.4
Acquisition costs as of December 31 116.3 123.1
Accumulated impairments as of January 1 -10.2 -7.4
Impairments for the financial year -4.5 -2.9
total as of december 31 101.6 112.8
18. Other intangible assets18.1. patentS and tRademaRkS 2013 2012
Acquisition costs as of January 1 28.9 29.1
Translation difference -0.3 -0.2
Acquisition costs as of December 31 28.6 28.9
Accumulated amortization as of January 1 -12.9 -11.6
Amortization for financial year -0.3 -1.2
total as of december 31 15.4 16.1

88 Konecranes 2013 noteS to the conSolidated Financial StatementS
18.2. otheR (including SeRvice contRactS, SoFtwaRe) 2013 2012
Acquisition costs as of January 1 155.5 141.4
Increase 31.1 13.8
Decrease -1.7 -0.3
Company acquisitions 8.7 1.6
Transfer within assets 0.0 0.0
Impairment -10.8 0.0
Translation difference -1.6 -1.0
Acquisition costs as of December 31 181.2 155.5
Accumulated amortization as of January 1 -95.0 -76.9
Accumulated amortization relating to disposals 1.2 0.0
Amortization for financial year -15.9 -18.1
total as of december 31 71.6 60.5
18.3. otheR intangiBle aSSetS total 2013 2012
Acquisition costs as of January 1 184.4 170.5
Increase 31.1 13.8
Decrease -1.7 -0.3
Company acquisitions 8.7 1.6
Transfer within assets 0.0 0.0
Impairment -10.8 0.0
Translation difference -1.9 -1.2
Acquisition costs as of December 31 209.9 184.4
Accumulated amortization as of January 1 -107.8 -88.5
Accumulated amortization relating to disposals 1.2 0.0
Amortization for financial year -16.2 -19.3
total as of december 31 87.0 76.6
Other intangible assets include service contracts, patents and trademarks and software licenses. They are stated at cost and amortized on the straight-line basis over their expected useful lives. The normal amortization period varies from 4 to 20 years. Intangible assets having an indefinite useful life are tested for impairment annually. On December 31, 2013, the intangible assets having indefinite useful life consisted of the Stahl trademark, totally EUR 10.4 million. As there is no foreseeable limit on the period over which the asset is expected to generate net cash inflows for the entity, it is classified as intangible assets having indefinite use-ful life.
Due to the restructuring actions and closure of certain parts of business units during 2013 Intangible Assets (mainly customer relations and technology in India, Austria, UK and Morocco) were written off due to impairment by EUR 10.8 million.
19. Property, plant and equipment19.1. land 2013 2012
Acquisition costs as of January 1 6.6 5.7
Increase 0.5 0.9
Decrease -0.1 0.0
Company acquisitions 0.0 0.0
Translation difference -0.2 0.0
total as of december 31 6.8 6.6
19.2. BuildingS 2013 2012
Acquisition costs as of January 1 52.3 49.4
Increase 10.1 3.4
Decrease -0.1 -0.9
Company acquisitions 0.0 0.0
Transfer within assets 0.3 0.5
Impairment -0.3 0.0
Translation difference -1.5 0.0
Acquisition costs as of December 31 60.8 52.3
Accumulated depreciation as of January 1 -10.0 -7.3
Accumulated depreciation relating to disposals 0.1 0.3
Depreciation for financial year -2.9 -3.0
total as of december 31 47.9 42.2
There were no buildings which belong to finance lease at the end of year 2013 and 2012.
19.3. machineRY and equipment 2013 2012
Acquisition costs as of January 1 235.6 216.5
Increase 25.6 28.0
Decrease -15.0 -8.1
Company acquisitions 0.0 0.0
Transfer within assets -0.3 -0.5
Impairment -1.4 0.0
Translation difference -1.6 -0.3
Acquisition costs as of December 31 243.0 235.6
Accumulated depreciation as of January 1 -145.8 -133.7
Accumulated depreciation relating to disposals 12.5 5.7
Depreciation for financial year -19.9 -17.8
total as of december 31 89.8 89.8
The balance value of machinery and equipments which belong to finance lease is EUR 8.7 million in the year 2013 (EUR 9.6 million in 2012).

89Konecranes 2013noteS to the conSolidated Financial StatementS
19.4. pRopeRtY, plant and equipment total 2013 2012
Acquisition costs as of January 1 294.5 271.6
Increase 36.3 32.2
Decrease -15.2 -9.1
Company acquisitions 0.0 0.0
Impairment -1.7 0.0
Translation difference -3.3 -0.2
Acquisition costs as of December 31 310.6 294.5
Accumulated depreciation as of January 1 -155.8 -141.0
Accumulated depreciation relating to disposals 12.6 6.0
Depreciation for financial year -22.8 -20.7
total as of december 31 144.5 138.7
The amount of borrowing cost capitalized during 2013 was EUR 0.6 million (EUR 0.0 million in 2012). The interest is related to a loan which was specifically taken to the construction of the factory in India.
20. Interest in other entities and non controlling interests20.1. inveStmentS accounted FoR uSing the equitY method
aSSociated companieS 2013 2012
Acquisition costs as of January 1 32.2 30.3
Share of associated companies result after taxes* 2.8 2.5
Dividends received -0.5 -0.6
total as of december 31 34.5 32.2
* Including adjustments from purchase price allocation.
Joint ventuReS 2013 2012
Acquisition costs as of January 1 5.3 4.2
Share of Joint Ventures result after taxes 1.1 1.3
Dividends received -0.5 -0.3
total as of december 31 5.9 5.3
20.2. inveStmentS in aSSociated companieS and Joint ventuReS
2013
Carrying amount of the invest-
ment
Non-current
assets 1) Current assets 1)
Non-current
liabilities 1)
Current liabilities
1) Revenue
1)
Profit/loss after tax from
continuing opera-tions 1)
Total compre-hensive
income 1) Dividends
received
Guangzhou Technocranes Company Ltd. 2) 0.7 0.6 5.3 0.0 3.3 7.6 0.1 0.1 0.0
Jiangyin Dingli Shengsai High Tech Industrial Crane Company Ltd. 2) 0.6 0.5 6.1 0.0 4.7 6.5 0.5 0.5 0.0
Shanghai High Tech Industrial Company, Ltd. 2) 2.1 0.7 15.8 0.0 9.2 19.1 0.4 0.4 0.0
Boutonnier Adt Levage S.A. 0.4 0.2 1.9 0.0 0.6 3.4 0.1 0.1 0.0
Levelec S.A. 0.2 0.1 1.6 0.0 0.5 2.4 0.1 0.1 0.0
Manelec S.a.r.l. 0.1 0.0 0.4 0.0 0.1 0.7 0.0 0.0 0.0
Manulec S.A. 0.2 0.4 1.1 0.0 0.5 2.7 -0.1 -0.1 0.0
Sere Maintenance S.A. 0.1 0.1 1.0 0.0 0.9 2.6 -0.1 -0.1 0.0
Eastern Morris Cranes Limited 2) 1.4 0.3 8.8 0.0 6.6 13.4 0.7 0.7 0.2
Kito Corporation 33.6 84.8 166.8 42.0 74.4 286.7 11.5 11.5 0.5
Crane Industrial Services LLC 2) 1.2 0.2 4.1 0.2 1.9 7.9 0.5 0.5 0.3
Translation difference 0.0 0.0 0.0 0.0 0.0 0.0 0.0 0.0 0.0
total 40.4 87.8 213.0 42.3 102.7 353.2 13.8 13.8 1.1
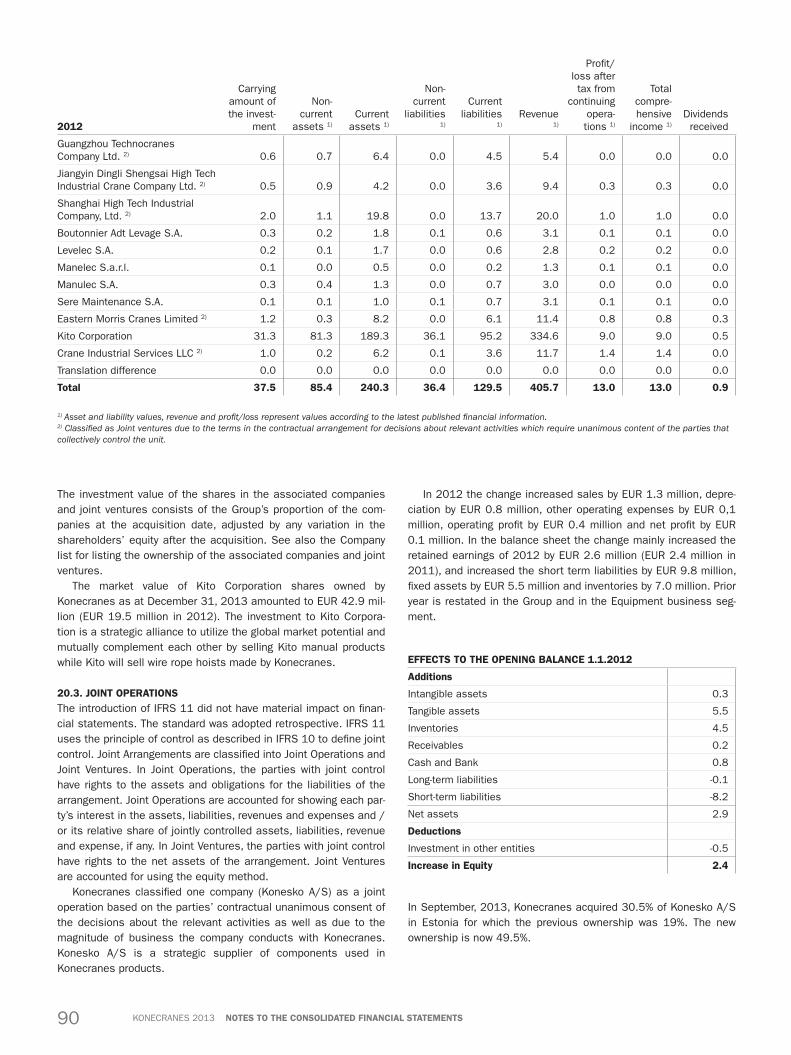
90 Konecranes 2013 noteS to the conSolidated Financial StatementS
The investment value of the shares in the associated companies and joint ventures consists of the Group’s proportion of the com-panies at the acquisition date, adjusted by any variation in the shareholders’ equity after the acquisition. See also the Company list for listing the ownership of the associated companies and joint ventures.
The market value of Kito Corporation shares owned by Konecranes as at December 31, 2013 amounted to EUR 42.9 mil-lion (EUR 19.5 million in 2012). The investment to Kito Corpora-tion is a strategic alliance to utilize the global market potential and mutually complement each other by selling Kito manual products while Kito will sell wire rope hoists made by Konecranes.
20.3. Joint opeRationSThe introduction of IFRS 11 did not have material impact on finan-cial statements. The standard was adopted retrospective. IFRS 11 uses the principle of control as described in IFRS 10 to define joint control. Joint Arrangements are classified into Joint Operations and Joint Ventures. In Joint Operations, the parties with joint control have rights to the assets and obligations for the liabilities of the arrangement. Joint Operations are accounted for showing each par-ty’s interest in the assets, liabilities, revenues and expenses and / or its relative share of jointly controlled assets, liabilities, revenue and expense, if any. In Joint Ventures, the parties with joint control have rights to the net assets of the arrangement. Joint Ventures are accounted for using the equity method.
Konecranes classified one company (Konesko A/S) as a joint operation based on the parties’ contractual unanimous consent of the decisions about the relevant activities as well as due to the magnitude of business the company conducts with Konecranes. Konesko A/S is a strategic supplier of components used in Konecranes products.
In 2012 the change increased sales by EUR 1.3 million, depre-ciation by EUR 0.8 million, other operating expenses by EUR 0,1 million, operating profit by EUR 0.4 million and net profit by EUR 0.1 million. In the balance sheet the change mainly increased the retained earnings of 2012 by EUR 2.6 million (EUR 2.4 million in 2011), and increased the short term liabilities by EUR 9.8 million, fixed assets by EUR 5.5 million and inventories by 7.0 million. Prior year is restated in the Group and in the Equipment business seg-ment.
eFFectS to the opening Balance 1.1.2012
additions
Intangible assets 0.3
Tangible assets 5.5
Inventories 4.5
Receivables 0.2
Cash and Bank 0.8
Long-term liabilities -0.1
Short-term liabilities -8.2
Net assets 2.9
deductions
Investment in other entities -0.5
increase in equity 2.4
In September, 2013, Konecranes acquired 30.5% of Konesko A/S in Estonia for which the previous ownership was 19%. The new ownership is now 49.5%.
2012
Carrying amount of the invest-
ment
Non-current
assets 1) Current assets 1)
Non-current
liabilities 1)
Current liabilities
1) Revenue
1)
Profit/loss after tax from
continuing opera-tions 1)
Total compre-hensive
income 1) Dividends
received
Guangzhou Technocranes Company Ltd. 2) 0.6 0.7 6.4 0.0 4.5 5.4 0.0 0.0 0.0
Jiangyin Dingli Shengsai High Tech Industrial Crane Company Ltd. 2) 0.5 0.9 4.2 0.0 3.6 9.4 0.3 0.3 0.0
Shanghai High Tech Industrial Company, Ltd. 2) 2.0 1.1 19.8 0.0 13.7 20.0 1.0 1.0 0.0
Boutonnier Adt Levage S.A. 0.3 0.2 1.8 0.1 0.6 3.1 0.1 0.1 0.0
Levelec S.A. 0.2 0.1 1.7 0.0 0.6 2.8 0.2 0.2 0.0
Manelec S.a.r.l. 0.1 0.0 0.5 0.0 0.2 1.3 0.1 0.1 0.0
Manulec S.A. 0.3 0.4 1.3 0.0 0.7 3.0 0.0 0.0 0.0
Sere Maintenance S.A. 0.1 0.1 1.0 0.1 0.7 3.1 0.1 0.1 0.0
Eastern Morris Cranes Limited 2) 1.2 0.3 8.2 0.0 6.1 11.4 0.8 0.8 0.3
Kito Corporation 31.3 81.3 189.3 36.1 95.2 334.6 9.0 9.0 0.5
Crane Industrial Services LLC 2) 1.0 0.2 6.2 0.1 3.6 11.7 1.4 1.4 0.0
Translation difference 0.0 0.0 0.0 0.0 0.0 0.0 0.0 0.0 0.0
total 37.5 85.4 240.3 36.4 129.5 405.7 13.0 13.0 0.9
1) Asset and liability values, revenue and profit/loss represent values according to the latest published financial information.2) Classified as Joint ventures due to the terms in the contractual arrangement for decisions about relevant activities which require unanimous content of the parties that collectively control the unit.
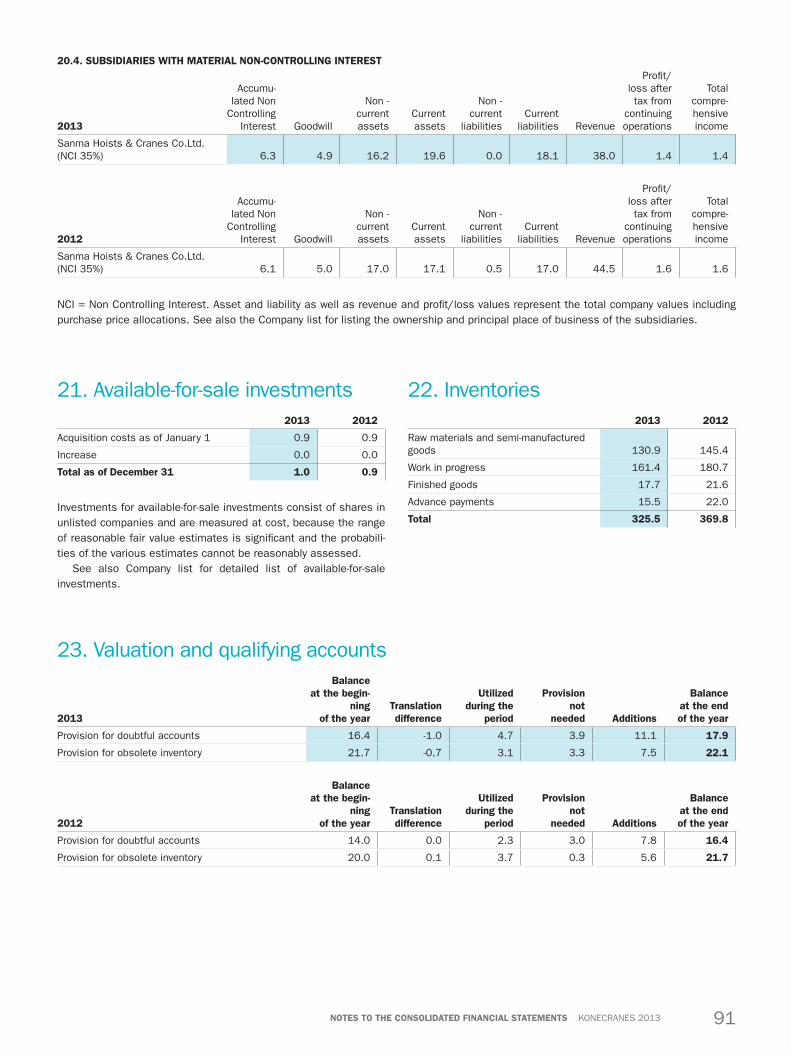
91Konecranes 2013noteS to the conSolidated Financial StatementS
20.4. SuBSidiaRieS with mateRial non-contRolling inteReSt
2013
Accumu-lated Non
Controlling Interest Goodwill
Non - current assets
Current assets
Non - current
liabilities Current
liabilities Revenue
Profit/loss after tax from
continuing operations
Total compre-hensive income
Sanma Hoists & Cranes Co.Ltd. (NCI 35%) 6.3 4.9 16.2 19.6 0.0 18.1 38.0 1.4 1.4
2012
Accumu-lated Non
Controlling Interest Goodwill
Non - current assets
Current assets
Non - current
liabilities Current
liabilities Revenue
Profit/loss after tax from
continuing operations
Total compre-hensive income
Sanma Hoists & Cranes Co.Ltd. (NCI 35%) 6.1 5.0 17.0 17.1 0.5 17.0 44.5 1.6 1.6
NCI = Non Controlling Interest. Asset and liability as well as revenue and profit/loss values represent the total company values including purchase price allocations. See also the Company list for listing the ownership and principal place of business of the subsidiaries.
21. Available-for-sale investments2013 2012
Acquisition costs as of January 1 0.9 0.9
Increase 0.0 0.0
total as of december 31 1.0 0.9
Investments for available-for-sale investments consist of shares in unlisted companies and are measured at cost, because the range of reasonable fair value estimates is significant and the probabili-ties of the various estimates cannot be reasonably assessed.
See also Company list for detailed list of available-for-sale investments.
22. Inventories2013 2012
Raw materials and semi-manufactured goods 130.9 145.4
Work in progress 161.4 180.7
Finished goods 17.7 21.6
Advance payments 15.5 22.0
total 325.5 369.8
23. Valuation and qualifying accounts
2013
Balance at the begin-
ning of the year
trans lation difference
utilized during the
period
provision not
needed additions
Balance at the end of the year
Provision for doubtful accounts 16.4 -1.0 4.7 3.9 11.1 17.9
Provision for obsolete inventory 21.7 -0.7 3.1 3.3 7.5 22.1
2012
Balance at the begin-
ning of the year
trans lation difference
utilized during the
period
provision not
needed additions
Balance at the end of the year
Provision for doubtful accounts 14.0 0.0 2.3 3.0 7.8 16.4
Provision for obsolete inventory 20.0 0.1 3.7 0.3 5.6 21.7

92 Konecranes 2013 noteS to the conSolidated Financial StatementS
24. Ageing analysis of accounts receivable
2013 2012
Undue accounts receivable 203.8 249.5
Accounts receivable 1–30 days overdue 65.5 89.3
Accounts receivable 31–60 days overdue 29.2 35.2
Accounts receivable 61–90 days overdue 20.8 23.3
Accounts receivable more than 91 days overdue 67.4 44.8
total 386.7 442.1
Accounts receivable are initially measured at cost (book values represent their fair values). Accounts receivable are subject to only minor credit risk concentrations due to the Group’s extensive customer portfolio. Credit losses recognized for the financial year totaled EUR 4.9 million (EUR 2.4 million in 2012).
25. Other receivables2013 2012
Bills receivable 7.5 7.2
Value added tax 18.1 22.0
total 25.6 29.2
26. Deferred assets2013 2012
Interest 0.3 0.1
Receivable arising from percentage of the completion method 79.1 42.6
Prepaid expenses 10.2 12.3
Other 47.0 45.2
total 136.6 100.2
27. Cash and cash equivalents2013 2012
Cash in hand and at bank 116.8 130.1
Short-term deposits 15.4 15.2
total 132.2 145.3
Short-term deposits are with a maturity of less than three months. Cash and cash equivalents are carried at nominal value, which cor-responds to their fair value.
28. Equity
28.1. ShaReholdeRS’ equitYnumber of
sharesShare
capital Share
premium paid in capital
As of January 1, 2012 57,198,971 30.1 39.3 43.7
Share subscriptions with options 92,339 0.0 0.0 1.1
as of december 31, 2012 57,291,310 30.1 39.3 44.8
Share subscriptions with options 536,770 0.0 0.0 6.2
as of december 31, 2013 57,828,080 30.1 39.3 51.0
The total shareholders’ equity consists of share capital, share premium account, share issue, fair value reserves, translation dif-ference, paid in capital and retained earnings. Konecranes’ share has no nominal value. The company has one series of shares. All issued shares are fully paid. The share premium account includes the value of shares, which exceeds the accounting par value of the shares, for shares issued before September 1, 2006. Fair value reserves include changes in the fair values of derivative financial instruments used to hedge operational cash flows. Translation differences comprise the differences arising from the elimination of net investments in non-euro foreign subsidiaries. The paid-in
capital includes the portion of shares’ subscription price, which is not recorded to share capital or according to IFRS to liabilities. The paid-in capital includes also other capital contributions to the Group, which are not recorded to some other reserve within the equity. The paid-in capital includes also the possible amount of share capital decrease, which is not netted against accumulated losses or is not distributed to shareholders.
28.2. diStRiButaBle eaRningS
See page 120 / Board of Director’s Proposal to the Annual General Meeting.
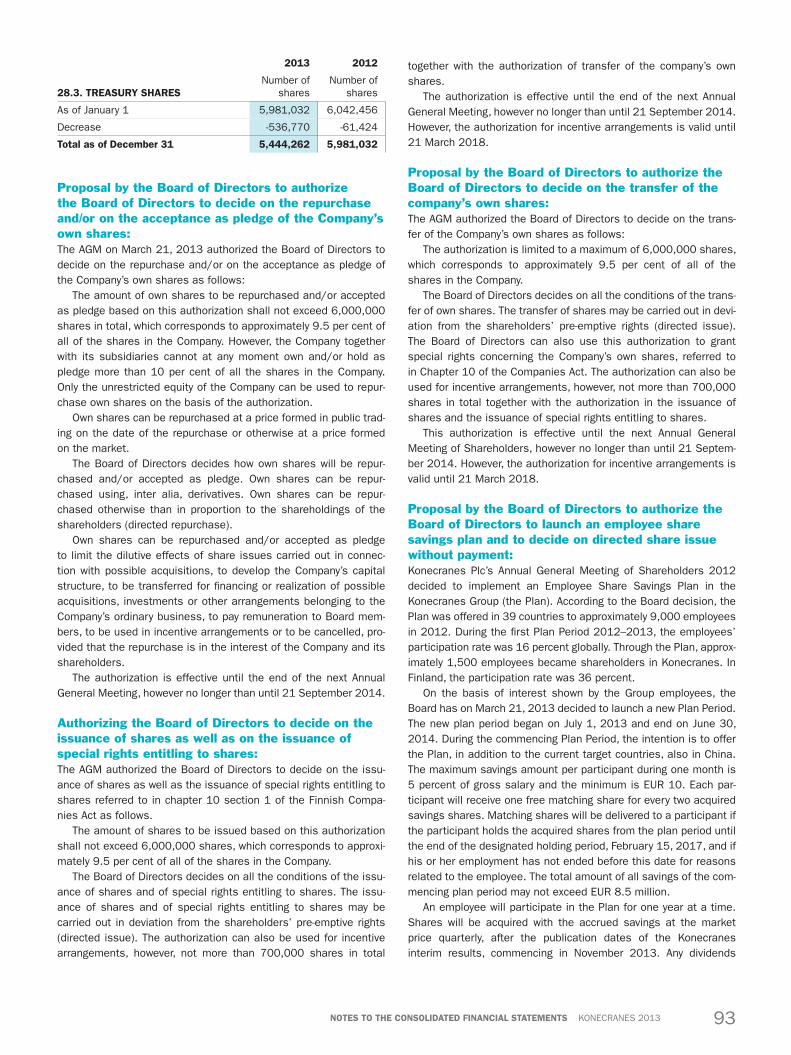
93Konecranes 2013noteS to the conSolidated Financial StatementS
2013 2012
28.3. tReaSuRY ShaReS Number of
shares Number of
shares
As of January 1 5,981,032 6,042,456
Decrease -536,770 -61,424
total as of december 31 5,444,262 5,981,032
Proposal by the Board of Directors to authorize the Board of Directors to decide on the repurchase and/or on the acceptance as pledge of the Company’s own shares:The AGM on March 21, 2013 authorized the Board of Directors to decide on the repurchase and/or on the acceptance as pledge of the Company’s own shares as follows:
The amount of own shares to be repurchased and/or accepted as pledge based on this authorization shall not exceed 6,000,000 shares in total, which corresponds to approximately 9.5 per cent of all of the shares in the Company. However, the Company together with its subsidiaries cannot at any moment own and/or hold as pledge more than 10 per cent of all the shares in the Company. Only the unrestricted equity of the Company can be used to repur-chase own shares on the basis of the authorization.
Own shares can be repurchased at a price formed in public trad-ing on the date of the repurchase or otherwise at a price formed on the market.
The Board of Directors decides how own shares will be repur-chased and/or accepted as pledge. Own shares can be repur-chased using, inter alia, derivatives. Own shares can be repur-chased otherwise than in proportion to the shareholdings of the shareholders (directed repurchase).
Own shares can be repurchased and/or accepted as pledge to limit the dilutive effects of share issues carried out in connec-tion with possible acquisitions, to develop the Company’s capital structure, to be transferred for financing or realization of possible acquisitions, investments or other arrangements belonging to the Company’s ordinary business, to pay remuneration to Board mem-bers, to be used in incentive arrangements or to be cancelled, pro-vided that the repurchase is in the interest of the Company and its shareholders.
The authorization is effective until the end of the next Annual General Meeting, however no longer than until 21 September 2014.
Authorizing the Board of Directors to decide on the issuance of shares as well as on the issuance of special rights entitling to shares:The AGM authorized the Board of Directors to decide on the issu-ance of shares as well as the issuance of special rights entitling to shares referred to in chapter 10 section 1 of the Finnish Compa-nies Act as follows.
The amount of shares to be issued based on this authorization shall not exceed 6,000,000 shares, which corresponds to approxi-mately 9.5 per cent of all of the shares in the Company.
The Board of Directors decides on all the conditions of the issu-ance of shares and of special rights entitling to shares. The issu-ance of shares and of special rights entitling to shares may be carried out in deviation from the shareholders’ pre-emptive rights (directed issue). The authorization can also be used for incentive arrangements, however, not more than 700,000 shares in total
together with the authorization of transfer of the company’s own shares.
The authorization is effective until the end of the next Annual General Meeting, however no longer than until 21 September 2014. However, the authorization for incentive arrangements is valid until 21 March 2018.
Proposal by the Board of Directors to authorize the Board of Directors to decide on the transfer of the company’s own shares:The AGM authorized the Board of Directors to decide on the trans-fer of the Company’s own shares as follows:
The authorization is limited to a maximum of 6,000,000 shares, which corresponds to approximately 9.5 per cent of all of the shares in the Company.
The Board of Directors decides on all the conditions of the trans-fer of own shares. The transfer of shares may be carried out in devi-ation from the shareholders’ pre-emptive rights (directed issue). The Board of Directors can also use this authorization to grant special rights concerning the Company’s own shares, referred to in Chapter 10 of the Companies Act. The authorization can also be used for incentive arrangements, however, not more than 700,000 shares in total together with the authorization in the issuance of shares and the issuance of special rights entitling to shares.
This authorization is effective until the next Annual General Meeting of Shareholders, however no longer than until 21 Septem-ber 2014. However, the authorization for incentive arrangements is valid until 21 March 2018.
Proposal by the Board of Directors to authorize the Board of Directors to launch an employee share savings plan and to decide on directed share issue without payment:Konecranes Plc’s Annual General Meeting of Shareholders 2012 decided to implement an Employee Share Savings Plan in the Konecranes Group (the Plan). According to the Board decision, the Plan was offered in 39 countries to approximately 9,000 employees in 2012. During the first Plan Period 2012–2013, the employees’ participation rate was 16 percent globally. Through the Plan, approx-imately 1,500 employees became shareholders in Konecranes. In Finland, the participation rate was 36 percent.
On the basis of interest shown by the Group employees, the Board has on March 21, 2013 decided to launch a new Plan Period. The new plan period began on July 1, 2013 and end on June 30, 2014. During the commencing Plan Period, the intention is to offer the Plan, in addition to the current target countries, also in China. The maximum savings amount per participant during one month is 5 percent of gross salary and the minimum is EUR 10. Each par-ticipant will receive one free matching share for every two acquired savings shares. Matching shares will be delivered to a participant if the participant holds the acquired shares from the plan period until the end of the designated holding period, February 15, 2017, and if his or her employment has not ended before this date for reasons related to the employee. The total amount of all savings of the com-mencing plan period may not exceed EUR 8.5 million.
An employee will participate in the Plan for one year at a time. Shares will be acquired with the accrued savings at the market price quarterly, after the publication dates of the Konecranes interim results, commencing in November 2013. Any dividends
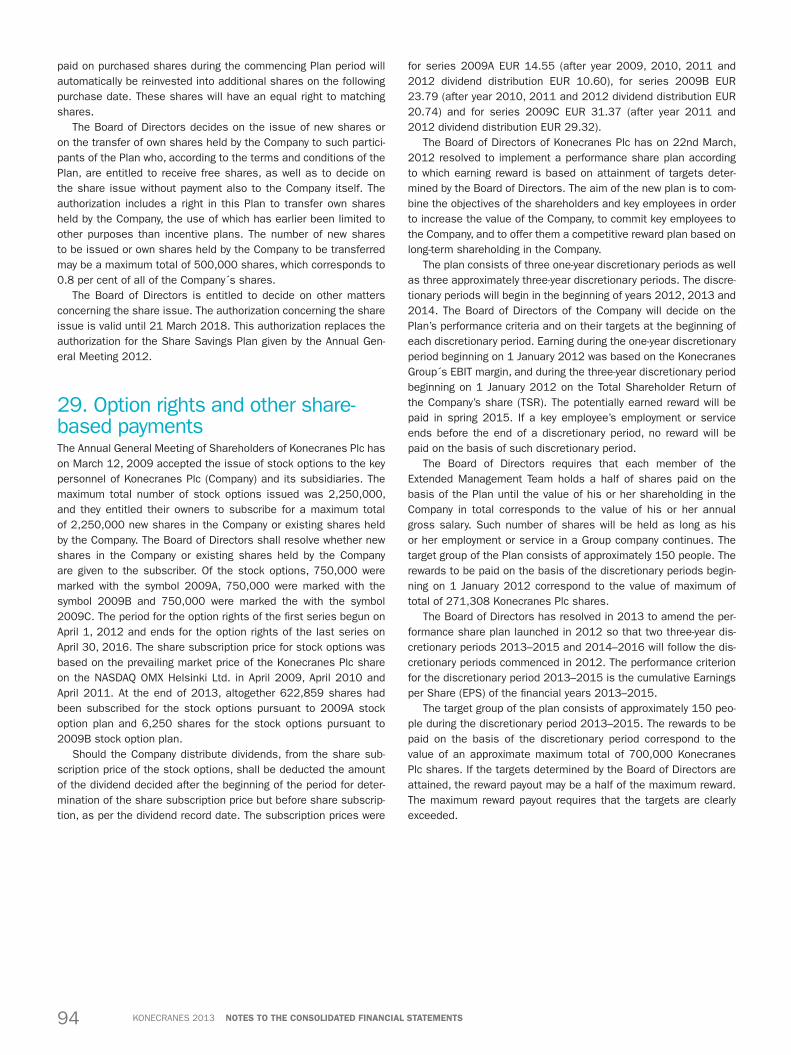
94 Konecranes 2013 noteS to the conSolidated Financial StatementS
paid on purchased shares during the commencing Plan period will automatically be reinvested into additional shares on the following purchase date. These shares will have an equal right to matching shares.
The Board of Directors decides on the issue of new shares or on the transfer of own shares held by the Company to such partici-pants of the Plan who, according to the terms and conditions of the Plan, are entitled to receive free shares, as well as to decide on the share issue without payment also to the Company itself. The authorization includes a right in this Plan to transfer own shares held by the Company, the use of which has earlier been limited to other purposes than incentive plans. The number of new shares to be issued or own shares held by the Company to be transferred may be a maximum total of 500,000 shares, which corresponds to 0.8 per cent of all of the Company´s shares.
The Board of Directors is entitled to decide on other matters concerning the share issue. The authorization concerning the share issue is valid until 21 March 2018. This authorization replaces the authorization for the Share Savings Plan given by the Annual Gen-eral Meeting 2012.
29. Option rights and other share-based paymentsThe Annual General Meeting of Shareholders of Konecranes Plc has on March 12, 2009 accepted the issue of stock options to the key personnel of Konecranes Plc (Company) and its subsidiaries. The maximum total number of stock options issued was 2,250,000, and they entitled their owners to subscribe for a maximum total of 2,250,000 new shares in the Company or existing shares held by the Company. The Board of Directors shall resolve whether new shares in the Company or existing shares held by the Company are given to the subscriber. Of the stock options, 750,000 were marked with the symbol 2009A, 750,000 were marked with the symbol 2009B and 750,000 were marked the with the symbol 2009C. The period for the option rights of the first series begun on April 1, 2012 and ends for the option rights of the last series on April 30, 2016. The share subscription price for stock options was based on the prevailing market price of the Konecranes Plc share on the NASDAQ OMX Helsinki Ltd. in April 2009, April 2010 and April 2011. At the end of 2013, altogether 622,859 shares had been subscribed for the stock options pursuant to 2009A stock option plan and 6,250 shares for the stock options pursuant to 2009B stock option plan.
Should the Company distribute dividends, from the share sub-scription price of the stock options, shall be deducted the amount of the dividend decided after the beginning of the period for deter-mination of the share subscription price but before share subscrip-tion, as per the dividend record date. The subscription prices were
for series 2009A EUR 14.55 (after year 2009, 2010, 2011 and 2012 dividend distribution EUR 10.60), for series 2009B EUR 23.79 (after year 2010, 2011 and 2012 dividend distribution EUR 20.74) and for series 2009C EUR 31.37 (after year 2011 and 2012 dividend distribution EUR 29.32).
The Board of Directors of Konecranes Plc has on 22nd March, 2012 resolved to implement a performance share plan according to which earning reward is based on attainment of targets deter-mined by the Board of Directors. The aim of the new plan is to com-bine the objectives of the shareholders and key employees in order to increase the value of the Company, to commit key employees to the Company, and to offer them a competitive reward plan based on long-term shareholding in the Company.
The plan consists of three one-year discretionary periods as well as three approximately three-year discretionary periods. The discre-tionary periods will begin in the beginning of years 2012, 2013 and 2014. The Board of Directors of the Company will decide on the Plan’s performance criteria and on their targets at the beginning of each discretionary period. Earning during the one-year discretionary period beginning on 1 January 2012 was based on the Konecranes Group´s EBIT margin, and during the three-year discretionary period beginning on 1 January 2012 on the Total Shareholder Return of the Company’s share (TSR). The potentially earned reward will be paid in spring 2015. If a key employee’s employment or service ends before the end of a discretionary period, no reward will be paid on the basis of such discretionary period.
The Board of Directors requires that each member of the Extended Management Team holds a half of shares paid on the basis of the Plan until the value of his or her shareholding in the Company in total corresponds to the value of his or her annual gross salary. Such number of shares will be held as long as his or her employment or service in a Group company continues. The target group of the Plan consists of approximately 150 people. The rewards to be paid on the basis of the discretionary periods begin-ning on 1 January 2012 correspond to the value of maximum of total of 271,308 Konecranes Plc shares.
The Board of Directors has resolved in 2013 to amend the per-formance share plan launched in 2012 so that two three-year dis-cretionary periods 2013–2015 and 2014–2016 will follow the dis-cretionary periods commenced in 2012. The performance criterion for the discretionary period 2013–2015 is the cumulative Earnings per Share (EPS) of the financial years 2013–2015.
The target group of the plan consists of approximately 150 peo-ple during the discretionary period 2013–2015. The rewards to be paid on the basis of the discretionary period correspond to the value of an approximate maximum total of 700,000 Konecranes Plc shares. If the targets determined by the Board of Directors are attained, the reward payout may be a half of the maximum reward. The maximum reward payout requires that the targets are clearly exceeded.

95Konecranes 2013noteS to the conSolidated Financial StatementS
29.1. SummaRY oF the konecRaneS plc’ option planS
Stock option
maximum number of shares the stock option plan entitles
to subscribe forSubscription
price/ share (euR)
maximum number of shares
that still can be subscribed
Share subscription
period
2009A 750,000 10.60* 112,141 1.4.2012–30.4.2014
2009B 750,000 20.74** 709,750 1.4.2013–30.4.2015
2009C 750,000 29.32*** 665,000 1.4.2014–30.4.2016
total 2,250,000 1,486,891
* The original subscription price was EUR 14.55** The original subscription price was EUR 23.79*** The original subscription price was EUR 31.37
29.2. changeS in the numBeR oF ShaReS FRom option RightS outStanding 2013 2012
Number of shares of option rights outstanding as of January 1 2,090,661 3,144,200
Granted during the year 10,000 2,000
Forfeited during the year -89,500 -15,000
Exercised during the year -524,270 -104,839
Expired during the year 0 -935,700
total number of shares from option rights outstanding as of 31 december 1,486,891 2,090,661
Exercised option rights in 2012 included 12,500 shares for which the transfer of treasury shares occurred in 2013.The total cost of the option programs for the financial year 2013 was EUR 2.4 million (2012: EUR 4.0 million). Option program costs are included in personnel expenses and credited to the shareholders’ equity.
29.3. aSSumptionS made in deteRmining the FaiR value oF Stock optionSThe fair values for the options have been determined using the Black & Scholes method.The fair values for stock options have been calculated on the basis of the following assumptions:
2009a 2009B 2009c
Subscription price of the share, EUR 10.60* 20.74** 29.32***
Fair market value of the share, EUR 17.65 24.22 32.30
Expected volatility, % 25% 23% 20%
Risk-free interest rate, % 3.27% 2.15% 2.82%
Expected contractual life in years 0.3 1.3 2.3
Grant date fair value of the stock options, EUR 6.52 6.19 8.17
The above calculations are based on the 4–6 year implied volatility of the Konecranes Plc share price estimated by a market participant who actively trades stock options.
* The original subscription price was EUR 14.55** The original subscription price was EUR 23.79*** The original subscription price was EUR 31.37
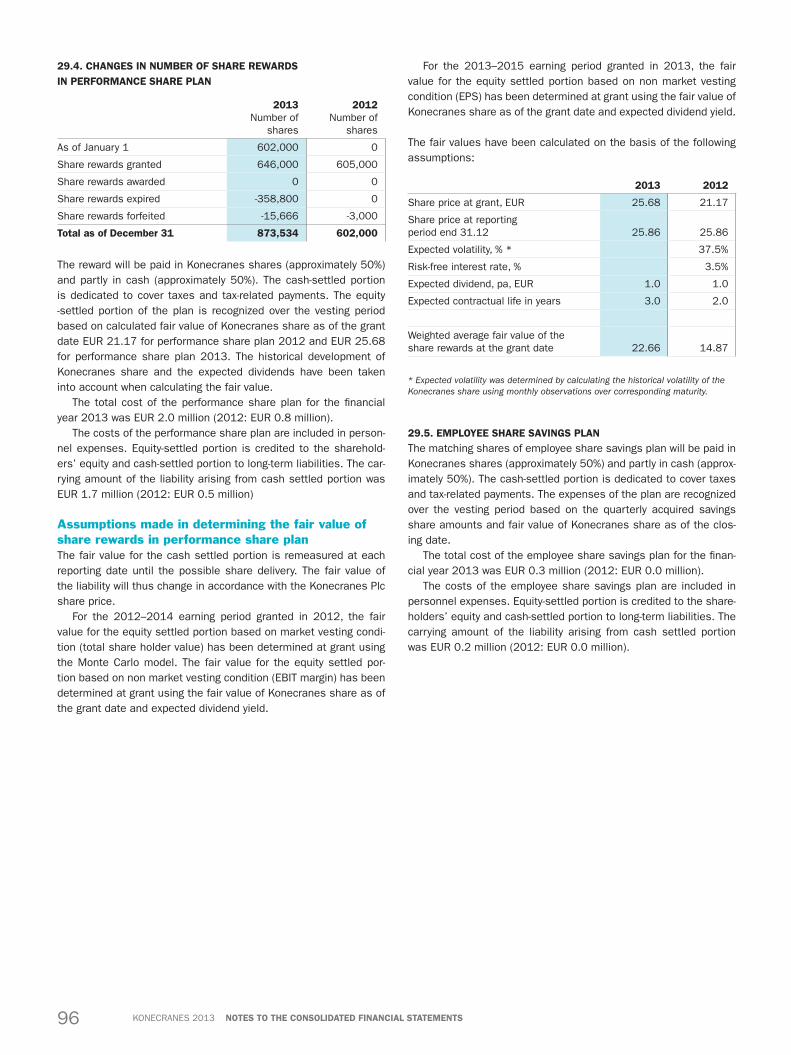
96 Konecranes 2013 noteS to the conSolidated Financial StatementS
29.4. changeS in numBeR oF ShaRe RewaRdS in peRFoRmance ShaRe plan
2013 Number of
shares
2012 Number of
shares
As of January 1 602,000 0
Share rewards granted 646,000 605,000
Share rewards awarded 0 0
Share rewards expired -358,800 0
Share rewards forfeited -15,666 -3,000
total as of december 31 873,534 602,000
The reward will be paid in Konecranes shares (approximately 50%) and partly in cash (approximately 50%). The cash-settled portion is dedicated to cover taxes and tax-related payments. The equity -settled portion of the plan is recognized over the vesting period based on calculated fair value of Konecranes share as of the grant date EUR 21.17 for performance share plan 2012 and EUR 25.68 for performance share plan 2013. The historical development of Konecranes share and the expected dividends have been taken into account when calculating the fair value.
The total cost of the performance share plan for the financial year 2013 was EUR 2.0 million (2012: EUR 0.8 million).
The costs of the performance share plan are included in person-nel expenses. Equity-settled portion is credited to the sharehold-ers’ equity and cash-settled portion to long-term liabilities. The car-rying amount of the liability arising from cash settled portion was EUR 1.7 million (2012: EUR 0.5 million)
Assumptions made in determining the fair value of share rewards in performance share planThe fair value for the cash settled portion is remeasured at each reporting date until the possible share delivery. The fair value of the liability will thus change in accordance with the Konecranes Plc share price.
For the 2012–2014 earning period granted in 2012, the fair value for the equity settled portion based on market vesting condi-tion (total share holder value) has been determined at grant using the Monte Carlo model. The fair value for the equity settled por-tion based on non market vesting condition (EBIT margin) has been determined at grant using the fair value of Konecranes share as of the grant date and expected dividend yield.
For the 2013–2015 earning period granted in 2013, the fair value for the equity settled portion based on non market vesting condition (EPS) has been determined at grant using the fair value of Konecranes share as of the grant date and expected dividend yield.
The fair values have been calculated on the basis of the following assumptions:
2013 2012
Share price at grant, EUR 25.68 21.17
Share price at reporting period end 31.12 25.86 25.86
Expected volatility, % * 37.5%
Risk-free interest rate, % 3.5%
Expected dividend, pa, EUR 1.0 1.0
Expected contractual life in years 3.0 2.0
Weighted average fair value of the share rewards at the grant date 22.66 14.87
* Expected volatility was determined by calculating the historical volatility of the Konecranes share using monthly observations over corresponding maturity.
29.5. emploYee ShaRe SavingS planThe matching shares of employee share savings plan will be paid in Konecranes shares (approximately 50%) and partly in cash (approx-imately 50%). The cash-settled portion is dedicated to cover taxes and tax-related payments. The expenses of the plan are recognized over the vesting period based on the quarterly acquired savings share amounts and fair value of Konecranes share as of the clos-ing date.
The total cost of the employee share savings plan for the finan-cial year 2013 was EUR 0.3 million (2012: EUR 0.0 million).
The costs of the employee share savings plan are included in personnel expenses. Equity-settled portion is credited to the share-holders’ equity and cash-settled portion to long-term liabilities. The carrying amount of the liability arising from cash settled portion was EUR 0.2 million (2012: EUR 0.0 million).

97Konecranes 2013noteS to the conSolidated Financial StatementS
30. Interest-bearing liabilities2013 2013 2012 2012
30.1. non-cuRRent Carrying amount Fair value Carrying amount Fair value
Loans from financial institutions 110.7 110.7 105.8 105.8
Bonds 0.0 0.0 74.9 74.9
Pension loans 7.6 7.6 11.4 11.4
Finance lease liabilities 5.8 5.8 6.1 6.1
Other long-term loans 8.9 8.9 7.6 7.6
total 133.0 133.0 205.7 205.7
2013 2013 2012 2012
30.2. cuRRent Carrying amount Fair value Carrying amount Fair value
Loans from financial institutions 0.0 0.0 0.0 0.0
Bonds 75.0 75.0 0.0 0.0
Pension loans 3.8 3.8 3.8 3.8
Finance lease liabilities 2.6 2.6 3.3 3.3
Commercial papers 74.9 74.9 88.7 88.7
Other short-term loans 0.5 0.5 0.5 0.5
Overdraft 30.0 30.0 25.5 25.5
total 186.7 186.7 121.8 121.8
The average interest rate of the non-current liabilities portfolio on December 31, 2013 was 2.04% (2012: 1.9%) and that of current liabili-ties was 2.78% (2012: 3.08%). The effective interest rate for EUR loans varied between 0.56%–5.06% (2012: 0.73%–5.05%).
30.3. cuRRencY Split and RepRicing Schedule oF outStanding deBt
2013 Debt repricing in period
cuRRencYamount
meuRavg
durationavg
rate %Rate
sensi tivity1) 2014 2015 2016 2017 2018-
EUR 282.8 1.5 years 1.38 2.8 158.4 16.9 105.2 2.3 0.0
INR 36.2 1.3 years 10.89 0.4 27.8 1.6 1.6 2.9 2.3
MAD 0.3 1.0 years 5.50 0.0 0.3 0.0 0.0 0.0 0.0
PLN 0.3 1.7 years 3.40 0.0 0.1 0.1 0.1 0.0 0.0
USD 0.0 2.0 years 3.34 0.0 0.0 0.0 0.0 0.0 0.0
SGD 0.1 1.9 years 4.96 0.0 0.0 0.0 0.0 0.0 0.0
total 319.7 2.46 3.2 186.7 18.6 106.9 5.3 2.3
2012 Debt repricing in period
cuRRencYamount
meuRavg
durationavg
rate %Rate
sensi tivity1) 2013 2014 2015 2016 2017-
EUR 296.1 1.9 years 1.43 3.0 98.2 85.4 6.5 105.4 0.6
CAD 0.3 1.0 years 2.42 0.0 0.3 0.0 0.0 0.0 0.0
INR 30.2 1.5 years 11.19 0.3 23.2 1.8 1.2 2.2 1.7
USD 0.8 2.0 years 2.80 0.0 0.0 0.8 0.0 0.0 0.0
SGD 0.1 1.9 years 4.97 0.0 0.0 0.0 0.0 0.0 0.1
total 327.5 2.33 3.3 121.8 88.0 7.7 107.6 2.4
1) Effect of one percent rise in market interest rates on the Group’s net interest expenses over the following 12 months. All other variables have been assumed constant.

98 Konecranes 2013 noteS to the conSolidated Financial StatementS
30.4. matuRitY pRoFile oF the gRoup’S Financial liaBilitieS
2013 Maturity of financial liabilities
deBt tYpeamount
drawn 2014 2015 2016 2017 2018 later
Committed revolving facilities 0.0 0.0 0.0 0.0 0.0 0.0 0.0
Loans from financial institutions 119.1 0.0 10.7 102.4 3.7 2.3 0.0
Bonds 75.0 75.0 0.0 0.0 0.0 0.0 0.0
Finance lease liabilities 9.6 2.6 3.7 1.7 1.6 0.0 0.0
Commercial paper program 74.9 74.9 0.0 0.0 0.0 0.0 0.0
Pension loans 10.2 3.8 3.8 2.6 0.0 0.0 0.0
Other long-term debt 2.9 0.4 2.3 0.2 0.0 0.0 0.0
Overdraft 30.0 30.0 0.0 0.0 0.0 0.0 0.0
Derivative financial instruments 7.7 5.9 1.8 0.0 0.0 0.0 0.0
Account and other payables 176.2 176.2 0.0 0.0 0.0 0.0 0.0
total 505.5 368.7 22.3 106.9 5.3 2.3 0.0
2012 Maturity of financial liabilities
deBt tYpeamount
drawn 2013 2014 2015 2016 2017 later
Committed revolving facilities 0.0 0.0 0.0 0.0 0.0 0.0 0.0
Loans from financial institutions 112.8 0.1 4.4 3.0 103.0 2.3 0.0
Bonds 74.9 0.0 74.9 0.0 0.0 0.0 0.0
Finance lease liabilities 9.4 3.3 4.6 0.7 0.7 0.0 0.0
Commercial paper program 88.7 88.7 0.0 0.0 0.0 0.0 0.0
Pension loans 15.1 3.8 3.8 3.8 3.8 0.0 0.0
Other long-term debt 1.0 0.4 0.3 0.2 0.2 0.0 0.0
Overdraft 25.5 25.5 0.0 0.0 0.0 0.0 0.0
Derivative financial instruments 6.9 3.7 3.2 0.0 0.0 0.0 0.0
Account and other payables 187.7 187.7 0.0 0.0 0.0 0.0 0.0
total 522.0 313.2 91.2 7.7 107.6 2.4 0.0

99Konecranes 2013noteS to the conSolidated Financial StatementS
30.5. caRRYing amountS oF Financial aSSetS and liaBilitieS claSSiFied BaSed on iaS 39
2013
Financial aSSetS
Financial assets/ liabilities at fair
value through income statement
Loans and
receivables
Available- for-sale
financial assets
Financial assets/
liabilities measured
at amortized cost
Carrying amounts
by balance sheet item
Fair value Note
non-current financial assetsLong-term interest-bearing receivables 0.0 0.2 0.0 0.0 0.2 0.2Other financial assets 0.0 0.0 1.0 0.0 1.0 1.0 21current financial assetsShort-term interest-bearing receivables 0.0 0.0 0.0 0.0 0.0 0.0Account and other receivables 0.0 394.4 0.0 0.0 394.4 394.4 24, 25Derivative financial instruments 12.1 0.0 0.0 0.0 12.1 12.1 37.2Cash and cash equivalents 0.0 132.2 0.0 0.0 132.2 132.2 27total 12.1 526.8 1.0 0.0 539.9 539.9
Financial liaBilitieSnon-current financial liabilitiesInterest-bearing liabilities 0.0 0.0 0.0 133.0 133.0 133.0 30.1Derivative financial instruments 1.8 0.0 0.0 0.0 1.8 1.8 37.2Other payables 0.0 0.0 0.0 2.0 2.0 2.0current financial liabilitiesInterest-bearing liabilities 0.0 0.0 0.0 186.7 186.7 186.7 30.2Derivative financial instruments 5.9 0.0 0.0 0.0 5.9 5.9 37.2Account and other payables 0.0 0.0 0.0 176.2 176.2 176.2 34.2total 7.7 0.0 0.0 497.8 505.5 505.5
2012
Financial aSSetS
Financial assets/ liabilities at fair
value through income statement
Loans and
receivables
Available- for-sale
financial assets
Financial assets/
liabilities measured
at amortized cost
Carrying amounts
by balance sheet item
Fair value Note
non-current financial assetsLong-term interest-bearing receivables 0.0 0.2 0.0 0.0 0.2 0.2Derivative financial instruments 0.6 0.0 0.0 0.0 0.6 0.6 37.2Other financial assets 0.0 0.0 1.4 0.0 1.4 1.4 21current financial assetsShort-term interest-bearing receivables 0.0 0.1 0.0 0.0 0.1 0.1Account and other receivables 0.0 471.3 0.0 0.0 471.3 471.3 24, 25Derivative financial instruments 6.6 0.0 0.0 0.0 6.6 6.6 37.2Cash and cash equivalents 0.0 145.3 0.0 0.0 145.3 145.3 27total 7.1 616.9 1.4 0.0 625.5 625.5
Financial liaBilitieSnon-current financial liabilitiesInterest-bearing liabilities 0.0 0.0 0.0 205.7 205.7 205.7 30.1Derivative financial instruments 3.2 0.0 0.0 0.0 3.2 3.2 37.2current financial liabilitiesInterest-bearing liabilities 0.0 0.0 0.0 121.8 121.8 121.8 30.2Derivative financial instruments 3.7 0.0 0.0 0.0 3.7 3.7 37.2Account and other payables 0.0 0.0 0.0 187.7 187.7 187.7 34.2total 6.9 0.0 0.0 515.1 522.0 522.0
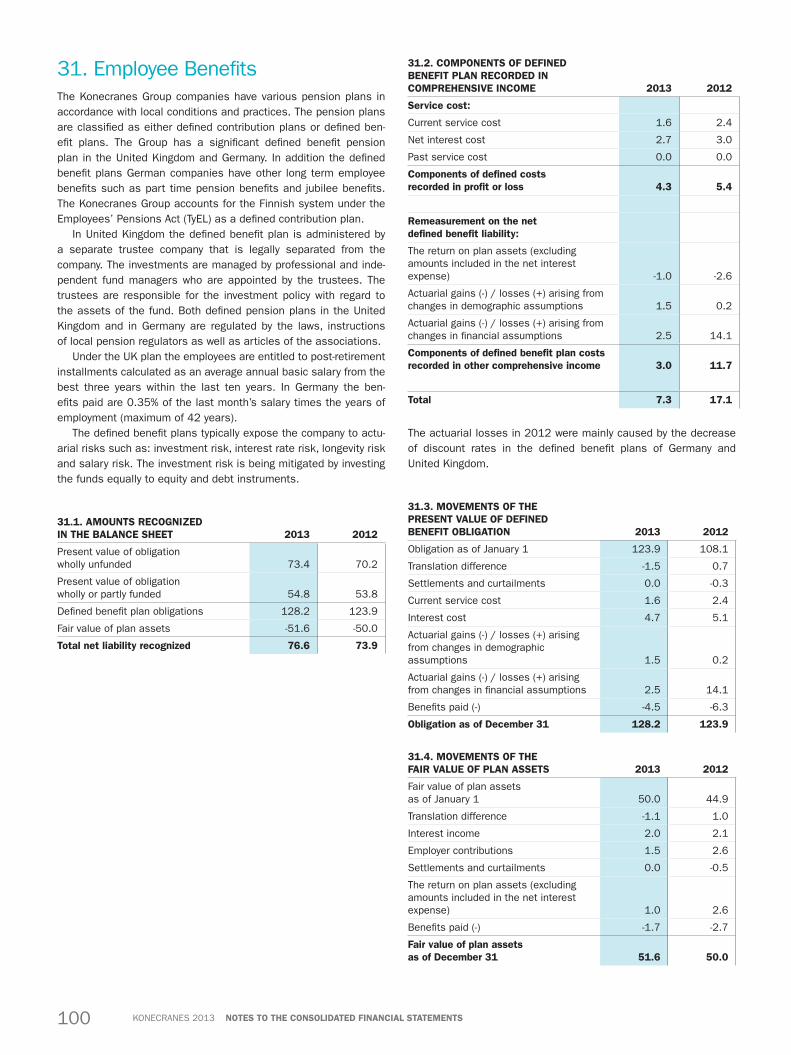
100 Konecranes 2013 noteS to the conSolidated Financial StatementS
31. Employee BenefitsThe Konecranes Group companies have various pension plans in accordance with local conditions and practices. The pension plans are classified as either defined contribution plans or defined ben-efit plans. The Group has a significant defined benefit pension plan in the United Kingdom and Germany. In addition the defined benefit plans German companies have other long term employee benefits such as part time pension benefits and jubilee benefits. The Konecranes Group accounts for the Finnish system under the Employees’ Pensions Act (TyEL) as a defined contribution plan.
In United Kingdom the defined benefit plan is administered by a separate trustee company that is legally separated from the company. The investments are managed by professional and inde-pendent fund managers who are appointed by the trustees. The trustees are responsible for the investment policy with regard to the assets of the fund. Both defined pension plans in the United Kingdom and in Germany are regulated by the laws, instructions of local pension regulators as well as articles of the associations.
Under the UK plan the employees are entitled to post-retirement installments calculated as an average annual basic salary from the best three years within the last ten years. In Germany the ben-efits paid are 0.35% of the last month’s salary times the years of employment (maximum of 42 years).
The defined benefit plans typically expose the company to actu-arial risks such as: investment risk, interest rate risk, longevity risk and salary risk. The investment risk is being mitigated by investing the funds equally to equity and debt instruments.
31.1. amountS Recognized in the Balance Sheet 2013 2012
Present value of obligation wholly unfunded 73.4 70.2
Present value of obligation wholly or partly funded 54.8 53.8
Defined benefit plan obligations 128.2 123.9
Fair value of plan assets -51.6 -50.0
total net liability recognized 76.6 73.9
31.2. componentS oF deFined BeneFit plan RecoRded in compRehenSive income 2013 2012
Service cost:
Current service cost 1.6 2.4
Net interest cost 2.7 3.0
Past service cost 0.0 0.0
components of defined costs recorded in profit or loss 4.3 5.4
Remeasurement on the net defined benefit liability:
The return on plan assets (excluding amounts included in the net interest expense) -1.0 -2.6
Actuarial gains (-) / losses (+) arising from changes in demographic assumptions 1.5 0.2
Actuarial gains (-) / losses (+) arising from changes in financial assumptions 2.5 14.1
components of defined benefit plan costs recorded in other comprehensive income 3.0 11.7
total 7.3 17.1
The actuarial losses in 2012 were mainly caused by the decrease of discount rates in the defined benefit plans of Germany and United Kingdom.
31.3. movementS oF the pReSent value oF deFined BeneFit oBligation 2013 2012
Obligation as of January 1 123.9 108.1
Translation difference -1.5 0.7
Settlements and curtailments 0.0 -0.3
Current service cost 1.6 2.4
Interest cost 4.7 5.1
Actuarial gains (-) / losses (+) arising from changes in demographic assumptions 1.5 0.2
Actuarial gains (-) / losses (+) arising from changes in financial assumptions 2.5 14.1
Benefits paid (-) -4.5 -6.3
obligation as of december 31 128.2 123.9
31.4. movementS oF the FaiR value oF plan aSSetS 2013 2012
Fair value of plan assets as of January 1 50.0 44.9
Translation difference -1.1 1.0
Interest income 2.0 2.1
Employer contributions 1.5 2.6
Settlements and curtailments 0.0 -0.5
The return on plan assets (excluding amounts included in the net interest expense) 1.0 2.6
Benefits paid (-) -1.7 -2.7
Fair value of plan assets as of december 31 51.6 50.0
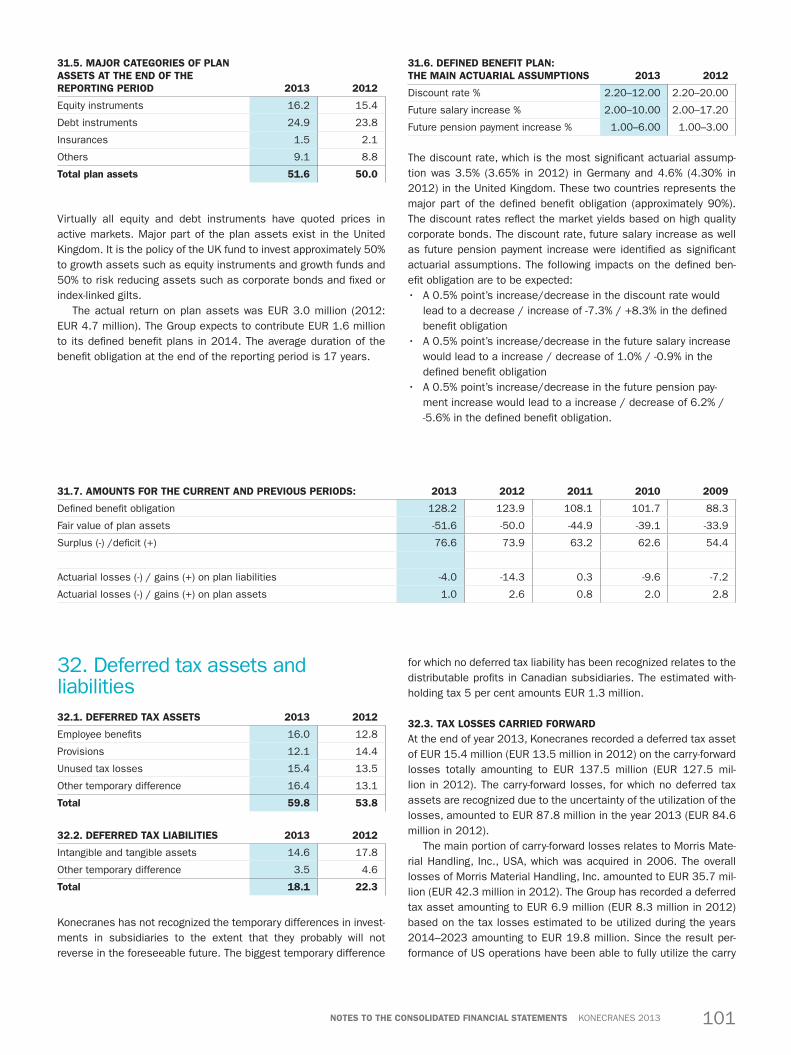
101Konecranes 2013noteS to the conSolidated Financial StatementS
31.5. maJoR categoRieS oF plan aSSetS at the end oF the RepoRting peRiod 2013 2012
Equity instruments 16.2 15.4
Debt instruments 24.9 23.8
Insurances 1.5 2.1
Others 9.1 8.8
total plan assets 51.6 50.0
Virtually all equity and debt instruments have quoted prices in active markets. Major part of the plan assets exist in the United Kingdom. It is the policy of the UK fund to invest approximately 50% to growth assets such as equity instruments and growth funds and 50% to risk reducing assets such as corporate bonds and fixed or index-linked gilts.
The actual return on plan assets was EUR 3.0 million (2012: EUR 4.7 million). The Group expects to contribute EUR 1.6 million to its defined benefit plans in 2014. The average duration of the benefit obligation at the end of the reporting period is 17 years.
31.6. deFined BeneFit plan: the main actuaRial aSSumptionS 2013 2012
Discount rate % 2.20–12.00 2.20–20.00
Future salary increase % 2.00–10.00 2.00–17.20
Future pension payment increase % 1.00–6.00 1.00–3.00
The discount rate, which is the most significant actuarial assump-tion was 3.5% (3.65% in 2012) in Germany and 4.6% (4.30% in 2012) in the United Kingdom. These two countries represents the major part of the defined benefit obligation (approximately 90%). The discount rates reflect the market yields based on high quality corporate bonds. The discount rate, future salary increase as well as future pension payment increase were identified as significant actuarial assumptions. The following impacts on the defined ben-efit obligation are to be expected:• A 0.5% point’s increase/decrease in the discount rate would
lead to a decrease / increase of -7.3% / +8.3% in the defined benefit obligation
• A 0.5% point’s increase/decrease in the future salary increase would lead to a increase / decrease of 1.0% / -0.9% in the defined benefit obligation
• A 0.5% point’s increase/decrease in the future pension pay-ment increase would lead to a increase / decrease of 6.2% / -5.6% in the defined benefit obligation.
31.7. amountS FoR the cuRRent and pReviouS peRiodS: 2013 2012 2011 2010 2009
Defined benefit obligation 128.2 123.9 108.1 101.7 88.3
Fair value of plan assets -51.6 -50.0 -44.9 -39.1 -33.9
Surplus (-) /deficit (+) 76.6 73.9 63.2 62.6 54.4
Actuarial losses (-) / gains (+) on plan liabilities -4.0 -14.3 0.3 -9.6 -7.2
Actuarial losses (-) / gains (+) on plan assets 1.0 2.6 0.8 2.0 2.8
32. Deferred tax assets and liabilities32.1. deFeRRed tax aSSetS 2013 2012
Employee benefits 16.0 12.8
Provisions 12.1 14.4
Unused tax losses 15.4 13.5
Other temporary difference 16.4 13.1
total 59.8 53.8
32.2. deFeRRed tax liaBilitieS 2013 2012
Intangible and tangible assets 14.6 17.8
Other temporary difference 3.5 4.6
total 18.1 22.3
Konecranes has not recognized the temporary differences in invest-ments in subsidiaries to the extent that they probably will not reverse in the foreseeable future. The biggest temporary difference
for which no deferred tax liability has been recognized relates to the distributable profits in Canadian subsidiaries. The estimated with-holding tax 5 per cent amounts EUR 1.3 million.
32.3. tax loSSeS caRRied FoRwaRdAt the end of year 2013, Konecranes recorded a deferred tax asset of EUR 15.4 million (EUR 13.5 million in 2012) on the carry-forward losses totally amounting to EUR 137.5 million (EUR 127.5 mil-lion in 2012). The carry-forward losses, for which no deferred tax assets are recognized due to the uncertainty of the utilization of the losses, amounted to EUR 87.8 million in the year 2013 (EUR 84.6 million in 2012).
The main portion of carry-forward losses relates to Morris Mate-rial Handling, Inc., USA, which was acquired in 2006. The overall losses of Morris Material Handling, Inc. amounted to EUR 35.7 mil-lion (EUR 42.3 million in 2012). The Group has recorded a deferred tax asset amounting to EUR 6.9 million (EUR 8.3 million in 2012) based on the tax losses estimated to be utilized during the years 2014–2023 amounting to EUR 19.8 million. Since the result per-formance of US operations have been able to fully utilize the carry

102 Konecranes 2013 noteS to the conSolidated Financial StatementS
2013 tax losses
carried forward
potential deferred
tax assets
deferred tax assets
not recorded deferred
tax assets USA 35.7 12.8 5.9 6.9 Austria 21.9 5.5 4.0 1.4 India 12.0 3.9 0.0 3.9 The Netherlands 11.0 2.7 1.5 1.2 Spain 9.1 2.7 2.7 0.0 Germany 7.7 2.3 2.3 0.0 Brazil 7.1 2.4 2.4 0.0 Japan 7.1 2.8 2.8 0.0 Finland 3.8 0.7 0.0 0.7 Italy 3.3 1.0 1.0 0.0 Other 18.9 4.8 3.7 1.1 total 137.5 41.8 26.4 15.4
2012 tax losses
carried forward
potential deferred
tax assets
deferred tax assets
not recorded deferred
tax assets USA 42.3 15.4 7.0 8.3 Austria 19.8 5.0 3.8 1.2 India 1.6 0.5 0.0 0.5 The Netherlands 9.8 2.5 1.1 1.3 Spain 9.4 2.8 2.8 0.0 Germany 7.7 2.3 2.3 0.0 Brazil 5.7 1.9 1.9 0.0 Japan 7.5 3.0 3.0 0.0 Finland 3.7 0.9 0.0 0.9 Italy 3.9 1.2 1.2 0.0 Other 16.0 4.1 2.9 1.2 total 127.5 39.6 26.1 13.5
33. Provisions
2013 warranty Restructuring pension
commitments other total Total provisions as of January 1 22.8 3.5 4.8 13.3 44.5Translation difference -0.5 0.0 -0.2 -0.7 -1.4Increase through business combination 0.0 0.0 0.0 0.0 0.0Additional provision in the period 12.5 5.2 2.8 7.5 28.1Utilization of provision 9.3 3.6 1.3 6.1 20.3Unused amounts reversed 1.2 0.1 0.0 2.1 3.4total provisions as of december 31 24.4 5.0 6.1 12.0 47.5
2012 warranty Restructuring pension
commitments other total Total provisions as of January 1 25.5 11.3 3.9 13.4 54.1Translation difference 0.0 0.1 -0.2 -0.2 -0.2Increase through business combination 0.0 0.0 0.0 0.0 0.0Additional provision in the period 7.4 2.9 3.1 6.6 20.0Utilization of provision 7.2 9.8 2.0 5.0 23.9Unused amounts reversed 3.0 1.0 0.0 1.6 5.5total provisions as of december 31 22.8 3.5 4.8 13.3 44.5
forward losses during the last five years Group decided to increase the valuation of deferred tax asset by calculating it from the next ten years’ carry forward losses. For the amount of EUR 15.9 million tax loss carry-forwards deductible over the period 2024–2031 no
deferred tax asset has been recognized due to uncertainties and limitations on deductible annual amounts.
Tax losses carried forward and related deferred tax assets on December 31 by the most significant countries as following:

103Konecranes 2013noteS to the conSolidated Financial StatementS
The provision for warranties covers the expenses due to the repair or replacement of products during their warranty period. The war-ranty liability is based on historical realized warranty costs for deliveries of standard products and services. The usual warranty period is 12 months. For more complex contracts, mainly including long-term projects, the warranty reserve is calculated contract by contract and the warranty period can be significantly longer. The restructuring provision is recognized when the Group has prepared a detailed reorganization plan and begun implementation of the plan or announced the matter. Pension commitments include provi-sions for local pension schemes. Other provisions include provi-sions for claims, litigations and loss contracts.
Restructuring costsKonecranes has recorded EUR 30.9 million restructuring costs dur-ing 2013 (EUR 5.8 million in 2012) of which EUR 16.9 million was impairment of assets (EUR 2.9 million in 2012).
34. Current liabilities34.1. accRualS 2013 2012
Wages, salaries and personnel expenses 66.1 72.7
Pension costs 4.5 7.1
Interest 0.9 0.8
Late cost reservations 83.9 94.1
Other items 44.6 41.3
total 200.1 215.9
34.2. otheR cuRRent liaBilitieS (non-inteReSt BeaRing) 2013 2012
Bills payable 0.3 0.7
Value added tax 14.8 12.5
Other short-term liabilities 13.7 17.0
total 28.7 30.2
35. Lease liabilities35.1. Finance leaSe 2013 2012
Minimum lease payments
within 1 year 2.7 3.4
1–5 years 6.1 6.6
over 5 years 0.0 0.1
total 8.8 10.1
Present value of finance lease
within 1 year 2.6 3.3
1–5 years 5.8 6.0
over 5 years 0.0 0.0
total 8.4 9.4
Konecranes Group has finance leases mainly for vehicles with an average of four years leasing time.
35.2. opeRating leaSeS 2013 2012
Minimum lease payments
within 1 year 30.5 33.0
1–5 years 62.1 63.1
over 5 years 8.0 5.7
total 100.6 101.7
Operative rental expenses during the year 31.7 33.1
The Konecranes Group has major operating lease agreements of factory and office buildings in Hyvinkää and Hämeenlinna, Finland. They are valid for 10–12 years, unless the lessee extends the lease period by five years. The lessee is entitled to exercise the 5-year extending option three consecutive times. The Group has various other operating leases for office equipments, vehicles and premises with varying terms and renewal rights.
36. Contingent liabilities and pledged assets
2013 2012
For own commercial obligations
Guarantees 377.6 349.5
Leasing liabilities 100.6 101.7
Other 1.7 1.4
total 479.8 452.6
Leasing contracts comply with normal practices in the countries concerned.
Contingent liabilities relating to litigationVarious legal actions, claims and other proceedings pend against the Group in various countries. These actions, claims and other proceedings are typical of this industry and consistent with a global business offering that encompasses a wide range of products and services. These matters involve contractual disputes, warranty claims, product liability (including design defects, manufacturing defects, failure to warn and asbestos legacy), employment, vehicles and other matters involving claims of general liability.
While the final outcome of these matters cannot be predicted with certainty, Konecranes has the opinion, based on the informa-tion available to date and considering the grounds presented for such claims, the available insurance coverage and the reserves made, that the outcome of such actions, claims and other proceed-ings, if unfavorable, would not have a material, adverse impact on the financial condition of the Group.

104 Konecranes 2013 noteS to the conSolidated Financial StatementS
37. Nominal and fair values of derivative financial instruments2013
nominal value 2013
Fair value 2012
nominal value 2012
Fair value
Foreign exchange forward contracts 625.9 6.7 504.8 3.4
Currency options 0.0 0.0 19.7 0.0
Interest rate swaps 100.0 -1.8 100.0 -3.0
Electricity forward contracts 2.9 -0.5 1.9 -0.2
total 728.8 4.4 626.5 0.3
37.1. BReakdown oF nominal valueS oF deRivative Financial inStRumentS
hedging deRivative Financial inStRumentS
Remaining maturities 2013 Remaining maturities 2012< 1 year 1–6 years total < 1 year 1–6 years total
Foreign exchange forward contracts 384.1 1.3 385.4 205.1 24.8 229.9
Currency options 0.0 0.0 0.0 0.0 0.0 0.0
Interest rate swaps 0.0 100.0 100.0 0.0 100.0 100.0
Electricity forward contracts 0.0 0.0 0.0 0.0 0.0 0.0
total 384.1 101.3 485.4 205.1 124.8 329.9
non-hedging deRivative Financial inStRumentS
Remaining maturities 2013 Remaining maturities 2012< 1 year 1–6 years total < 1 year 1–6 years total
Foreign exchange forward contracts 239.7 0.9 240.5 274.9 0.0 274.9
Currency options 0.0 0.0 0.0 19.7 0.0 19.7
Interest rate swaps 0.0 0.0 0.0 0.0 0.0 0.0
Electricity forward contracts 0.8 2.1 2.9 0.7 1.3 1.9
total 240.4 3.0 243.4 295.3 1.3 296.6
deRivative Financial inStRumentS total
Remaining maturities 2013 Remaining maturities 2012< 1 year 1–6 years total < 1 year 1–6 years total
Foreign exchange forward contracts 623.8 2.2 625.9 480.0 24.8 504.8
Currency options 0.0 0.0 0.0 19.7 0.0 19.7
Interest rate swaps 0.0 100.0 100.0 0.0 100.0 100.0
Electricity forward contracts 0.8 2.1 2.9 0.7 1.3 1.9
total 624.5 104.3 728.8 500.4 126.1 626.5
Derivatives are used for hedging currency and interest rate risks as well as risk of price fluctuation of electricity. Company applies hedge accounting on derivatives used to hedge cash flows in cer-tain large crane projects and to interest rates of certain long-term loans.
IFRS 7 requires that the classification of financial instruments at fair value be determined by reference to the source of inputs used to derive the fair value. This classification uses the following three-level hierarchy:
• Level 1 - quoted prices in active markets for identical financial instruments
• Level 2 - inputs other than quoted prices included within level 1 that are observable for the financial instrument, either directly (i.e. as prices) or indirectly (i.e. derived from prices)
• Level 3 - inputs for the financial instrument that are not based on observable market data (unobservable inputs)
Classification of financial instruments within the IFRS 7 fair value hierarchy: level 2 for all values as of 31 Dec 2013.
Derivatives are initially recorded in the balance sheet at fair value and subsequently measured at fair value at each balance sheet date. All derivatives are carried as assets when fair value is positive and liabilities when fair value is negative. Derivative instru-ments that are not designated as hedges (hedge accounting) are measured at fair value, and the change in fair value is recognized in the consolidated statement of income. When the derivative is designated as a hedge (hedge accounting) the effective part of the change in fair value is recognized in other comprehensive income. Any ineffective part is recognized in the consolidated statement of income. The foreign exchange forward contracts are measured based on the closing date’s observable spot exchange rates and the quoted yield curves of the respective currencies. Interest rate swaps are measured based on present value of the cash flows, which are discounted based on the quoted yield curves.

105Konecranes 2013noteS to the conSolidated Financial StatementS
37.2. BReakdown oF FaiR valueS oF deRivative Financial inStRumentS
2013positive fair values negative fair values net fair
valueshedging deRivative Financial inStRumentS < 1 year 1–6 years < 1 year 1–6 years
Foreign exchange forward contracts 8.6 0.0 -3.8 -0.1 4.7
Currency options 0.0 0.0 0.0 0.0 0.0
Interest rate swaps 0.0 0.0 0.0 -1.8 -1.8
Electricity forward contracts 0.0 0.0 0.0 0.0 0.0
total 8.6 0.0 -3.8 -1.8 2.9
positive fair values negative fair values net fair valuesnon-hedging deRivative Financial inStRumentS < 1 year 1–6 years < 1 year 1–6 years
Foreign exchange forward contracts 3.5 0.0 -1.5 -0.1 2.0
Currency options 0.0 0.0 0.0 0.0 0.0
Interest rate swaps 0.0 0.0 0.0 0.0 0.0
Electricity forward contracts 0.1 0.0 -0.3 -0.3 -0.5
total 3.6 0.0 -1.7 -0.4 1.5
positive fair values negative fair values net fair valuesdeRivative Financial inStRumentS total < 1 year 1–6 years < 1 year 1–6 years
Foreign exchange forward contracts 12.1 0.0 -5.3 -0.1 6.7
Currency options 0.0 0.0 0.0 0.0 0.0
Interest rate swaps 0.0 0.0 0.0 -1.8 -1.8
Electricity forward contracts 0.1 0.0 -0.3 -0.3 -0.5
total 12.2 0.0 -5.6 -2.2 4.4
2012
positive fair values negative fair values net fair valueshedging deRivative Financial inStRumentS < 1 year 1–6 years < 1 year 1–6 years
Foreign exchange forward contracts 2.9 0.6 -2.4 -0.1 0.9
Currency options 0.0 0.0 0.0 0.0 0.0
Interest rate swaps 0.0 0.0 0.0 -3.0 -3.0
Electricity forward contracts 0.0 0.0 0.0 0.0 0.0
total 2.9 0.6 -2.4 -3.1 -2.1
positive fair values negative fair values net fair valuesnon-hedging deRivative Financial inStRumentS < 1 year 1–6 years < 1 year 1–6 years
Foreign exchange forward contracts 3.7 0.0 -1.2 0.0 2.5
Currency options 0.0 0.0 0.0 0.0 0.0
Interest rate swaps 0.0 0.0 0.0 0.0 0.0
Electricity forward contracts 0.0 0.0 -0.1 -0.1 -0.2
total 3.7 0.0 -1.3 -0.1 2.3
positive fair values negative fair values net fair valuesdeRivative Financial inStRumentS total < 1 year 1–6 years < 1 year 1–6 years
Foreign exchange forward contracts 6.5 0.6 -3.6 -0.1 3.4
Currency options 0.0 0.0 0.0 0.0 0.0
Interest rate swaps 0.0 0.0 0.0 -3.0 -3.0
Electricity forward contracts 0.0 0.0 -0.1 -0.1 -0.2
total 6.6 0.6 -3.7 -3.2 0.3

106 Konecranes 2013 noteS to the conSolidated Financial StatementS
38. Hedge reserve of cash flow hedges
2013 2012
Balance as of January 1 -1.4 -2.9
Gains and losses deferred to equity (fair value reserve) 5.0 2.0
Change in deferred taxes -1.0 -0.5
Balance as of december 31 2.6 -1.4
The Group applies hedge accounting to certain large cranes proj-ects in which expected cash flows are highly probable and to inter-est rates of certain long-term loans.
39. Related party transactionsThe related parties of Konecranes are subsidiaries (see Company list), associated companies, joint ventures and joint operations, pension fund in the United Kingdom and the key management per-sonnel of the Group: the Board of Directors, the CEO and the Group Executive Board.
tRanSactionS with aSSociated companieS and Joint aRRangementS 2013 2012
Sales of goods and services with associated companies and joint arrangements 15.4 10.4
Receivables from associated companies and joint arrangements 4.1 2.2
Purchases of goods and services from associated companies and joint arrangements 39.1 40.8
Liabilities to associated companies and joint arrangements 3.5 2.4
Sales to and purchases from related parties are made at the nor-mal market price.
tRanSactionS with penSion Fund in the united kingdom 2013 2012
Employer contributions 1.6 2.3
Key management compensationThe Board of Directors, the CEO and Group Executive Team.
See Note 13. of the Consolidated Financial Statements.

107Konecranes 2013konecRaneS gRoup 2009–2013
Konecranes Group 2009–2013BuSineSS development 2013 2012 2011 2010 2009Orders received MEUR 1,920.8 1,970.1 1,896.1 1,536.0 1,348.9Order book MEUR 893.5 942.7 991.8 756.2 607.0Net sales MEUR 2,099.6 2,171.5 1,896.4 1,546.3 1,671.3
of which outside Finland MEUR 2,025.1 2,081.5 1,796.6 1,457.4 1,575.1Export from Finland MEUR 653.7 638.9 570.7 427.2 488.4Personnel on average 11,987 11,917 10,998 9,739 9,811Personnel on 31 December 11,832 12,147 11,651 10,042 9,782Capital expenditure MEUR 65.7 41.7 32.4 22.3 25.7
as a percentage of net sales % 3.1% 1.9% 1.7% 1.4% 1.5%Research and development costs MEUR 25.6 25.8 29.6 21.5 22.0
as % of Group net sales % 1.2% 1.2% 1.6% 1.4% 1.3%
pRoFitaBilitYNet sales MEUR 2,099.6 2,171.5 1,896.4 1,546.3 1,671.3Operating profit (including restructuring costs) MEUR 84.5 132.5 106.9 112.4 97.9
as percentage of net sales % 4.0% 6.1% 5.6% 7.3% 5.9%Income before taxes MEUR 75.5 124.2 95.8 111.3 88.6
as percentage of net sales % 3.6% 5.7% 5.1% 7.2% 5.3%Net income (incl. non-controlling interest) MEUR 49.4 84.8 64.9 78.2 62.5
as percentage of net sales % 2.4% 3.9% 3.4% 5.1% 3.7%
keY FiguReS and Balance SheetEquity (incl. non-controlling interest) MEUR 444.5 462.6 435.4 456.2 407.1Balance Sheet MEUR 1,482.0 1,576.3 1,447.5 1,175.5 1,060.4Return on equity % 10.9 18.8 14.6 18.1 15.5Return on capital employed % 11.6 18.4 17.1 24.2 19.3Current ratio 1.2 1.4 1.3 1.4 1.4Solidity % 34.0 34.0 34.2 44.7 45.1Gearing % 42.1 39.3 50.5 -3.8 -19.1
ShaReS in FiguReSEarnings per share, basic EUR 0.85 1.47 1.11 1.35 1.08Earnings per share, diluted EUR 0.85 1.46 1.10 1.34 1.08Equity per share EUR 7.56 7.97 7.52 7.64 6.84Cash flow per share EUR 2.08 2.77 -0.35 0.97 3.79Dividend per share EUR 1.05* 1.05 1.00 1.00 0.90Dividend / earnings % 123.4 71.4 90.1 74.1 83.3Effective dividend yield % 4.1 4.1 6.9 3.2 4.7Price / earnings 30.4 17.4 13.1 22.9 17.7Trading low / high** EUR 20.45/28.89 14.34/26.67 13.18/34.17 19.08/32.04 10.61/22.04Average share price** EUR 25.30 21.39 22.83 23.84 16.66Share price on 31 December** EUR 25.86 25.55 14.54 30.89 19.08Year-end market capitalization MEUR 1,495.4 1,463.8 831.7 1,821.3 1,122.1Number traded*** (1,000) 105,051 206,014 220,567 145,005 151,422Stock turnover % 181.7 359.6 385.6 245.9 257.5Average number of shares outstanding, basic (1,000) 57,684 57,228 58,982 58,922 58,922Average number of shares outstanding, diluted (1,000) 57,877 57,517 59,362 59,274 59,086Number of shares outstanding, at end of the period (1,000) 57,828 57,291 57,199 58,960 58,813
* The Board’s proposal to the AGM** Source: NASDAQ OMX Helsinki*** Source: Fidessa
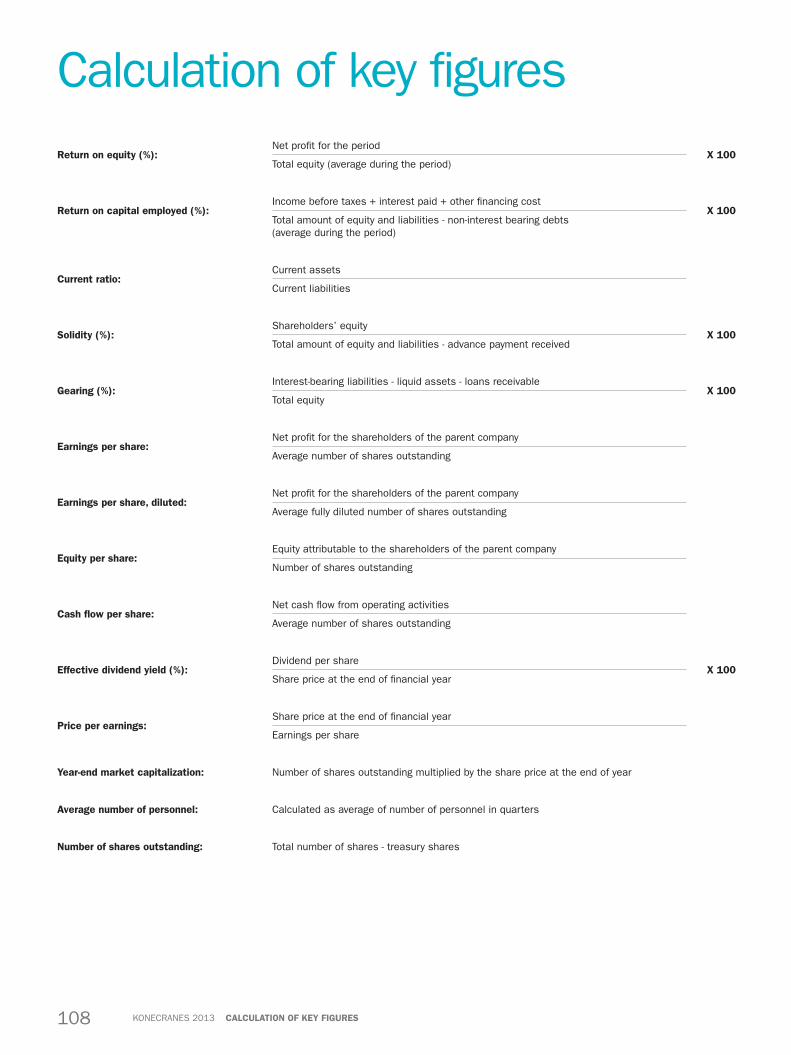
108 Konecranes 2013 calculation oF keY FiguReS
Calculation of key figuresReturn on equity (%):
Net profit for the periodx 100
Total equity (average during the period)
Return on capital employed (%): Income before taxes + interest paid + other financing cost
x 100 Total amount of equity and liabilities - non-interest bearing debts (average during the period)
current ratio:Current assets
Current liabilities
Solidity (%):Shareholders’ equity
x 100Total amount of equity and liabilities - advance payment received
gearing (%):Interest-bearing liabilities - liquid assets - loans receivable
x 100Total equity
earnings per share:Net profit for the shareholders of the parent company
Average number of shares outstanding
earnings per share, diluted:Net profit for the shareholders of the parent company
Average fully diluted number of shares outstanding
equity per share:Equity attributable to the shareholders of the parent company
Number of shares outstanding
cash flow per share:Net cash flow from operating activities
Average number of shares outstanding
effective dividend yield (%):Dividend per share
x 100Share price at the end of financial year
price per earnings:Share price at the end of financial year
Earnings per share
Year-end market capitalization: Number of shares outstanding multiplied by the share price at the end of year
average number of personnel: Calculated as average of number of personnel in quarters
number of shares outstanding: Total number of shares - treasury shares
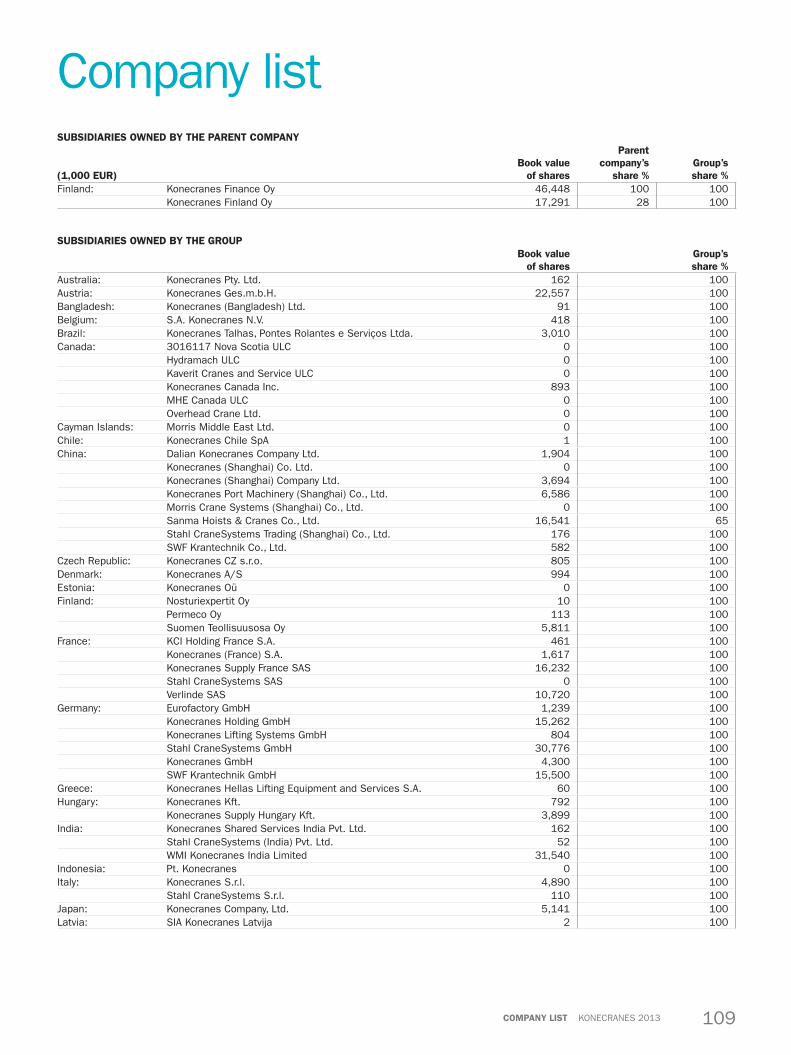
109Konecranes 2013companY liSt
SuBSidiaRieS owned BY the paRent companY
(1,000 euR)Book value
of shares
parent company’s
share %group’sshare %
Finland: Konecranes Finance Oy 46,448 100 100Konecranes Finland Oy 17,291 28 100
SuBSidiaRieS owned BY the gRoupBook value
of sharesgroup’sshare %
Australia: Konecranes Pty. Ltd. 162 100Austria: Konecranes Ges.m.b.H. 22,557 100Bangladesh: Konecranes (Bangladesh) Ltd. 91 100Belgium: S.A. Konecranes N.V. 418 100Brazil: Konecranes Talhas, Pontes Rolantes e Serviços Ltda. 3,010 100Canada: 3016117 Nova Scotia ULC 0 100
Hydramach ULC 0 100Kaverit Cranes and Service ULC 0 100Konecranes Canada Inc. 893 100MHE Canada ULC 0 100Overhead Crane Ltd. 0 100
Cayman Islands: Morris Middle East Ltd. 0 100Chile: Konecranes Chile SpA 1 100China: Dalian Konecranes Company Ltd. 1,904 100
Konecranes (Shanghai) Co. Ltd. 0 100Konecranes (Shanghai) Company Ltd. 3,694 100Konecranes Port Machinery (Shanghai) Co., Ltd. 6,586 100Morris Crane Systems (Shanghai) Co., Ltd. 0 100Sanma Hoists & Cranes Co., Ltd. 16,541 65Stahl CraneSystems Trading (Shanghai) Co., Ltd. 176 100SWF Krantechnik Co., Ltd. 582 100
Czech Republic: Konecranes CZ s.r.o. 805 100Denmark: Konecranes A/S 994 100Estonia: Konecranes Oü 0 100Finland: Nosturiexpertit Oy 10 100
Permeco Oy 113 100Suomen Teollisuusosa Oy 5,811 100
France: KCI Holding France S.A. 461 100Konecranes (France) S.A. 1,617 100Konecranes Supply France SAS 16,232 100Stahl CraneSystems SAS 0 100Verlinde SAS 10,720 100
Germany: Eurofactory GmbH 1,239 100Konecranes Holding GmbH 15,262 100Konecranes Lifting Systems GmbH 804 100Stahl CraneSystems GmbH 30,776 100Konecranes GmbH 4,300 100SWF Krantechnik GmbH 15,500 100
Greece: Konecranes Hellas Lifting Equipment and Services S.A. 60 100Hungary: Konecranes Kft. 792 100
Konecranes Supply Hungary Kft. 3,899 100India: Konecranes Shared Services India Pvt. Ltd. 162 100
Stahl CraneSystems (India) Pvt. Ltd. 52 100WMI Konecranes India Limited 31,540 100
Indonesia: Pt. Konecranes 0 100Italy: Konecranes S.r.l. 4,890 100
Stahl CraneSystems S.r.l. 110 100Japan: Konecranes Company, Ltd. 5,141 100Latvia: SIA Konecranes Latvija 2 100
Company list
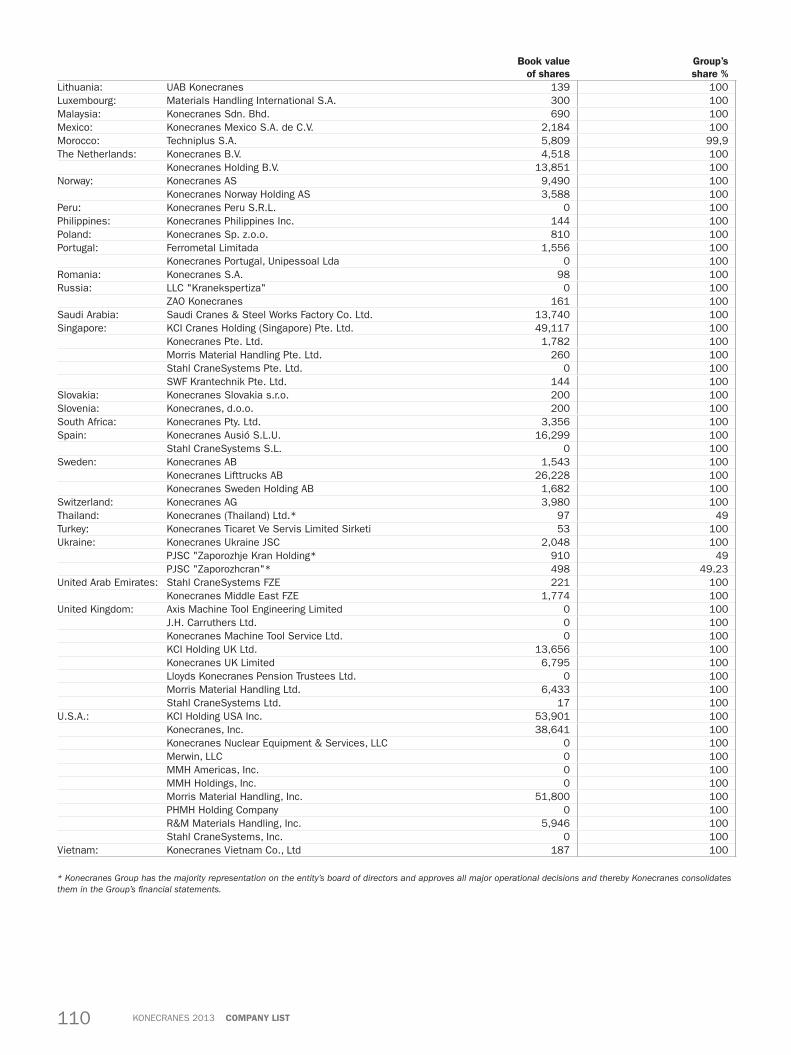
110 Konecranes 2013 companY liSt
Book value of shares
group’sshare %
Lithuania: UAB Konecranes 139 100Luxembourg: Materials Handling International S.A. 300 100Malaysia: Konecranes Sdn. Bhd. 690 100Mexico: Konecranes Mexico S.A. de C.V. 2,184 100Morocco: Techniplus S.A. 5,809 99,9The Netherlands: Konecranes B.V. 4,518 100
Konecranes Holding B.V. 13,851 100Norway: Konecranes AS 9,490 100
Konecranes Norway Holding AS 3,588 100Peru: Konecranes Peru S.R.L. 0 100Philippines: Konecranes Philippines Inc. 144 100Poland: Konecranes Sp. z.o.o. 810 100Portugal: Ferrometal Limitada 1,556 100
Konecranes Portugal, Unipessoal Lda 0 100Romania: Konecranes S.A. 98 100Russia: LLC "Kranekspertiza" 0 100
ZAO Konecranes 161 100Saudi Arabia: Saudi Cranes & Steel Works Factory Co. Ltd. 13,740 100Singapore: KCI Cranes Holding (Singapore) Pte. Ltd. 49,117 100
Konecranes Pte. Ltd. 1,782 100Morris Material Handling Pte. Ltd. 260 100Stahl CraneSystems Pte. Ltd. 0 100SWF Krantechnik Pte. Ltd. 144 100
Slovakia: Konecranes Slovakia s.r.o. 200 100Slovenia: Konecranes, d.o.o. 200 100South Africa: Konecranes Pty. Ltd. 3,356 100Spain: Konecranes Ausió S.L.U. 16,299 100
Stahl CraneSystems S.L. 0 100Sweden: Konecranes AB 1,543 100
Konecranes Lifttrucks AB 26,228 100Konecranes Sweden Holding AB 1,682 100
Switzerland: Konecranes AG 3,980 100Thailand: Konecranes (Thailand) Ltd.* 97 49Turkey: Konecranes Ticaret Ve Servis Limited Sirketi 53 100Ukraine: Konecranes Ukraine JSC 2,048 100
PJSC "Zaporozhje Kran Holding* 910 49PJSC "Zaporozhcran"* 498 49.23
United Arab Emirates: Stahl CraneSystems FZE 221 100Konecranes Middle East FZE 1,774 100
United Kingdom: Axis Machine Tool Engineering Limited 0 100J.H. Carruthers Ltd. 0 100Konecranes Machine Tool Service Ltd. 0 100KCI Holding UK Ltd. 13,656 100Konecranes UK Limited 6,795 100Lloyds Konecranes Pension Trustees Ltd. 0 100Morris Material Handling Ltd. 6,433 100Stahl CraneSystems Ltd. 17 100
U.S.A.: KCI Holding USA Inc. 53,901 100Konecranes, Inc. 38,641 100Konecranes Nuclear Equipment & Services, LLC 0 100Merwin, LLC 0 100MMH Americas, Inc. 0 100MMH Holdings, Inc. 0 100Morris Material Handling, Inc. 51,800 100PHMH Holding Company 0 100R&M Materials Handling, Inc. 5,946 100Stahl CraneSystems, Inc. 0 100
Vietnam: Konecranes Vietnam Co., Ltd 187 100
* Konecranes Group has the majority representation on the entity’s board of directors and approves all major operational decisions and thereby Konecranes consolidates them in the Group’s financial statements.
Company list
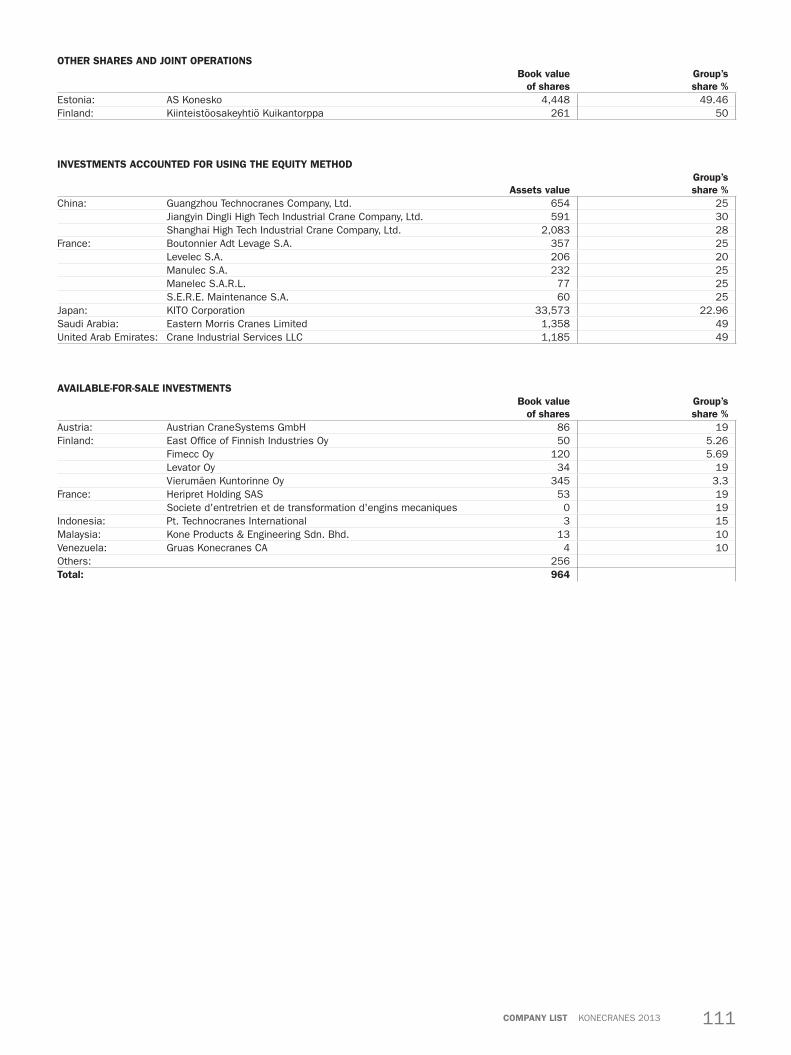
111Konecranes 2013companY liSt
otheR ShaReS and Joint opeRationSBook value
of sharesgroup’s share %
Estonia: AS Konesko 4,448 49.46Finland: Kiinteistöosakeyhtiö Kuikantorppa 261 50
inveStmentS accounted FoR uSing the equitY method
assets value group’s share %
China: Guangzhou Technocranes Company, Ltd. 654 25Jiangyin Dingli High Tech Industrial Crane Company, Ltd. 591 30Shanghai High Tech Industrial Crane Company, Ltd. 2,083 28
France: Boutonnier Adt Levage S.A. 357 25Levelec S.A. 206 20Manulec S.A. 232 25Manelec S.A.R.L. 77 25S.E.R.E. Maintenance S.A. 60 25
Japan: KITO Corporation 33,573 22.96Saudi Arabia: Eastern Morris Cranes Limited 1,358 49United Arab Emirates: Crane Industrial Services LLC 1,185 49
availaBle-FoR-Sale inveStmentSBook value
of sharesgroup’s share %
Austria: Austrian CraneSystems GmbH 86 19Finland: East Office of Finnish Industries Oy 50 5.26
Fimecc Oy 120 5.69Levator Oy 34 19Vierumäen Kuntorinne Oy 345 3.3
France: Heripret Holding SAS 53 19Societe d'entretrien et de transformation d'engins mecaniques 0 19
Indonesia: Pt. Technocranes International 3 15Malaysia: Kone Products & Engineering Sdn. Bhd. 13 10Venezuela: Gruas Konecranes CA 4 10Others: 256total: 964

112 Konecranes 2013 paRent companY Statement oF income – FaS
Parent company statement of income – FAS(1,000 euR) 1 Jan–31 dec 2013 1 Jan–31 dec 2012 Note: 4 Sales 84,957 91,971
Other operating income 0 0
5 Depreciation and impairments -6,701 -2,9226 Other operating expenses -79,251 -82,919
operating profit -995 6,129
7 Financial income and expenses 51,545 80,072
income before extraordinary items 50,550 86,202
8 Extraordinary items 14,740 35,555
income before appropriations and taxes 65,290 121,757
9 Income taxes -3,589 -10,459
net income 61,701 111,298
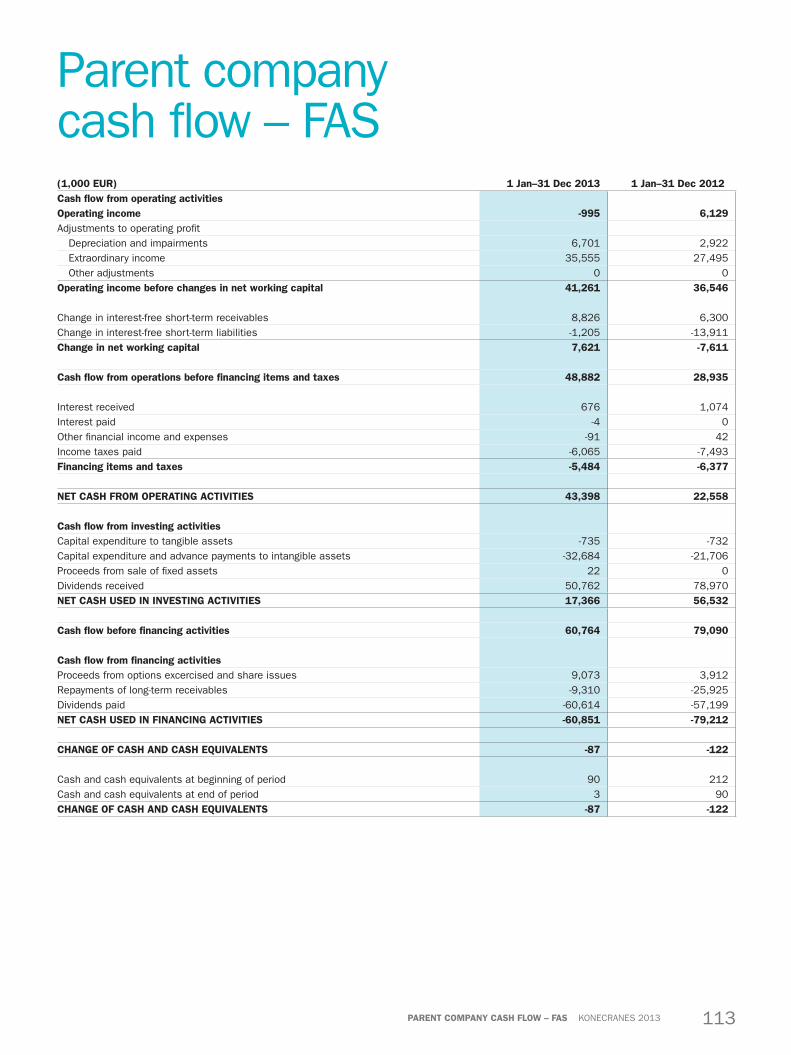
113Konecranes 2013paRent companY caSh Flow – FaS
Parent company cash flow – FAS(1,000 euR) 1 Jan–31 dec 2013 1 Jan–31 dec 2012 cash flow from operating activities operating income -995 6,129Adjustments to operating profit
Depreciation and impairments 6,701 2,922Extraordinary income 35,555 27,495Other adjustments 0 0
operating income before changes in net working capital 41,261 36,546
Change in interest-free short-term receivables 8,826 6,300Change in interest-free short-term liabilities -1,205 -13,911change in net working capital 7,621 -7,611
cash flow from operations before financing items and taxes 48,882 28,935
Interest received 676 1,074Interest paid -4 0Other financial income and expenses -91 42Income taxes paid -6,065 -7,493Financing items and taxes -5,484 -6,377
net caSh FRom opeRating activitieS 43,398 22,558
cash flow from investing activities Capital expenditure to tangible assets -735 -732Capital expenditure and advance payments to intangible assets -32,684 -21,706Proceeds from sale of fixed assets 22 0Dividends received 50,762 78,970net caSh uSed in inveSting activitieS 17,366 56,532
cash flow before financing activities 60,764 79,090
cash flow from financing activities Proceeds from options excercised and share issues 9,073 3,912Repayments of long-term receivables -9,310 -25,925Dividends paid -60,614 -57,199net caSh uSed in Financing activitieS -60,851 -79,212
change oF caSh and caSh equivalentS -87 -122
Cash and cash equivalents at beginning of period 90 212Cash and cash equivalents at end of period 3 90change oF caSh and caSh equivalentS -87 -122

114 Konecranes 2013 paRent companY Balance Sheet – FaS
Parent company balance sheet – FAS(1,000 euR) aSSetS 31 dec 2013 31 dec 2012Note:
non-cuRRent aSSetSintangible assets
10 Intangible rights 42,389 15,500Advance payments 40,576 40,935
82,964 56,435tangible assets
11 Machinery and equipment 2,173 2,0072,173 2,007
12 investmentsInvestments in Group companies 50,649 50,649Other shares and similar rights of ownership 515 515
51,164 51,164
total non-current assets 136,301 109,606
cuRRent aSSetSlong-term receivablesLoans receivable from Group companies 117,931 108,621
117,931 108,621Short-term receivablesAccounts receivable 105 106Amounts owed by Group companies
Accounts receivable 15,664 21,78414 Deferred assets 14,896 35,614
Other receivables 429 17614 Deferred assets 6,752 7,333
37,846 65,013
cash in hand and at banks 3 90
total current assets 155,779 173,724
total aSSetS 292,080 283,330

115Konecranes 2013paRent companY Balance Sheet – FaS
(1,000 euR) ShaReholdeRS’ equitY and liaBilitieS 31 dec 2013 31 dec 2012Note:15 equitY Share capital 30,073 30,073
Share premium account 39,307 39,307Paid in capital 48,105 39,033Retained earnings 93,549 42,864Net income for the period 61,701 111,298
272,734 262,574
liaBilitieS
non-current liabilitiesOther long-term liabilities 0 0
0 0
provisions 15 457
current liabilitiesAccounts payable 6,804 6,344Liabilities owed to Group companies
Accounts payable 3,971 3,78916 Accruals 0 1,458
Other short-term liabilities 609 57516 Accruals 7,947 8,133
19,331 20,299
total liabilities 19,346 20,756
total ShaReholdeRS’ equitY and liaBilitieS 292,080 283,330
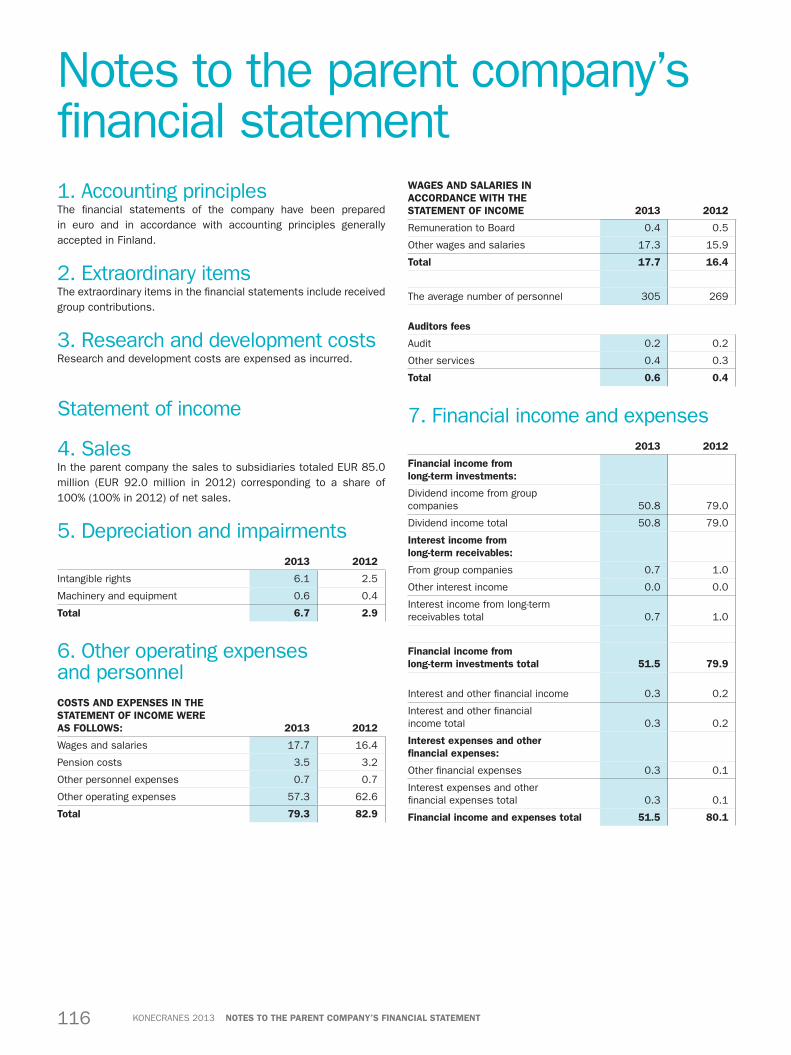
116 Konecranes 2013 noteS to the paRent companY’S Financial Statement
Notes to the parent company’s financial statement 1. Accounting principles The financial statements of the company have been prepared in euro and in accordance with accounting principles generally accepted in Finland.
2. Extraordinary items The extraordinary items in the financial statements include received group contributions.
3. Research and development costs Research and development costs are expensed as incurred.
Statement of income
4. Sales In the parent company the sales to subsidiaries totaled EUR 85.0 million (EUR 92.0 million in 2012) corresponding to a share of 100% (100% in 2012) of net sales.
5. Depreciation and impairments2013 2012
Intangible rights 6.1 2.5
Machinery and equipment 0.6 0.4
total 6.7 2.9
6. Other operating expenses and personnelcoStS and expenSeS in the Statement oF income weRe aS FollowS: 2013 2012
Wages and salaries 17.7 16.4
Pension costs 3.5 3.2
Other personnel expenses 0.7 0.7
Other operating expenses 57.3 62.6
total 79.3 82.9
wageS and SalaRieS in accoRdance with the Statement oF income 2013 2012
Remuneration to Board 0.4 0.5
Other wages and salaries 17.3 15.9
total 17.7 16.4
The average number of personnel 305 269
auditors fees
Audit 0.2 0.2
Other services 0.4 0.3
total 0.6 0.4
7. Financial income and expenses2013 2012
Financial income from long-term investments:
Dividend income from group companies 50.8 79.0
Dividend income total 50.8 79.0
interest income from long-term receivables:
From group companies 0.7 1.0
Other interest income 0.0 0.0
Interest income from long-term receivables total 0.7 1.0
Financial income from long-term investments total 51.5 79.9
Interest and other financial income 0.3 0.2
Interest and other financial income total 0.3 0.2
interest expenses and other financial expenses:
Other financial expenses 0.3 0.1
Interest expenses and other financial expenses total 0.3 0.1
Financial income and expenses total 51.5 80.1

117Konecranes 2013noteS to the paRent companY’S Financial Statement
8. Extraordinary items2013 2012
Group contributions received from subsidiaries 14.7 35.6
total 14.7 35.6
9. Income taxes2013 2012
Taxes on extraordinary items 3.6 8.7
Taxes on ordinary operations 0.0 1.7
Taxes from previous years 0.0 0.1
total 3.6 10.5
Balance sheet
10. Intangible rights2013 2012
Acquisition costs as of January 1 28.6 16.0
Increase 33.0 12.5
Decrease 0.0 0.0
Acquisition costs as of December 31 61.6 28.6
Accumulated depreciation 1 January -13.1 -10.6
Accumulated depreciation relating to disposals 0.0 0.0
Accumulated depreciation -6.1 -2.5
total as of december 31 42.4 15.5
11. Machinery and equipment2013 2012
Acquisition costs as of January 1 7.0 6.2
Increase 0.7 0.7
Decrease -0.1 0.0
Acquisition costs as of December 31 7.7 7.0
Accumulated depreciation 1 January -4.9 -4.5
Accumulated depreciation relating to disposals 0.0 0.0
Accumulated depreciation -0.6 -0.4
total as of december 31 2.2 2.0
12. Investments2013 2012
Acquisition costs as of January 1 51.2 51.2
total as of december 31 51.2 51.2
2013 2012
inveStmentS in gRoup companieS Domicile
Book value
Book value
Konecranes Finance Corp. Hyvinkää 46.4 46.4
Konecranes Finland Corp. Hyvinkää 4.2 4.2
total 50.6 50.6
other shares and similar rights of ownership 2013 2012
Vierumäen Kuntorinne Oy 0.3 0.3
Pärjä Oy 0.0 0.0
East Office of Finnish Industries Oy 0.1 0.1
Fimecc Oy 0.1 0.1
total 0.5 0.5
13. Treasury shares2013 2012
Number of shares as of January 1 5,981,032 6,042,456
Increase 0 0
Decrease -536,770 -61,424
number of shares as of december 31 5,444,262 5,981,032
Proposal by the Board of Directors to authorize the Board of Directors to decide on the repurchase and/or on the acceptance as pledge of the Company’s own shares:The AGM on March 21, 2013 authorized the Board of Directors to decide on the repurchase and/or on the acceptance as pledge of the Company’s own shares as follows:
The amount of own shares to be repurchased and/or accepted as pledge based on this authorization shall not exceed 6,000,000 shares in total, which corresponds to approximately 9.5 per cent of all of the shares in the Company. However, the Company together with its subsidiaries cannot at any moment own and/or hold as pledge more than 10 per cent of all the shares in the Company. Only the unrestricted equity of the Company can be used to repur-chase own shares on the basis of the authorization.
Own shares can be repurchased at a price formed in public trad-ing on the date of the repurchase or otherwise at a price formed on the market.
The Board of Directors decides how own shares will be repur-chased and/or accepted as pledge. Own shares can be repur-chased using, inter alia, derivatives. Own shares can be repur-chased otherwise than in proportion to the shareholdings of the shareholders (directed repurchase).
Own shares can be repurchased and/or accepted as pledge to limit the dilutive effects of share issues carried out in connec-tion with possible acquisitions, to develop the Company’s capital structure, to be transferred for financing or realization of possible acquisitions, investments or other arrangements belonging to the Company’s ordinary business, to pay remuneration to Board mem-

118 Konecranes 2013 noteS to the paRent companY’S Financial Statement
bers, to be used in incentive arrangements or to be cancelled, pro-vided that the repurchase is in the interest of the Company and its shareholders.
The authorization is effective until the end of the next Annual General Meeting, however no longer than until 21 September 2014.
Authorizing the Board of Directors to decide on the issuance of shares as well as on the issuance of special rights entitling to shares:The AGM authorized the Board of Directors to decide on the issu-ance of shares as well as the issuance of special rights entitling to shares referred to in chapter 10 section 1 of the Finnish Compa-nies Act as follows.
The amount of shares to be issued based on this authorization shall not exceed 6,000,000 shares, which corresponds to approxi-mately 9.5 per cent of all of the shares in the Company.
The Board of Directors decides on all the conditions of the issu-ance of shares and of special rights entitling to shares. The issu-ance of shares and of special rights entitling to shares may be carried out in deviation from the shareholders’ pre-emptive rights (directed issue). The authorization can also be used for incentive arrangements, however, not more than 700,000 shares in total together with the authorization of transfer of the company’s own shares.
The authorization is effective until the end of the next Annual General Meeting, however no longer than until 21 September 2014. However, the authorization for incentive arrangements is valid until 21 March 2018.
Proposal by the Board of Directors to authorize the Board of Directors to decide on the transfer of the company’s own shares:The AGM authorized the Board of Directors to decide on the trans-fer of the Company’s own shares as follows:
The authorization is limited to a maximum of 6,000,000 shares, which corresponds to approximately 9.5 per cent of all of the shares in the Company.
The Board of Directors decides on all the conditions of the trans-fer of own shares. The transfer of shares may be carried out in devi-ation from the shareholders’ pre-emptive rights (directed issue). The Board of Directors can also use this authorization to grant special rights concerning the Company’s own shares, referred to in Chapter 10 of the Companies Act. The authorization can also be used for incentive arrangements, however, not more than 700,000 shares in total together with the authorization in the issuance of shares and the issuance of special rights entitling to shares.
This authorization is effective until the next Annual General Meeting of Shareholders, however no longer than until 21 Septem-ber 2014. However, the authorization for incentive arrangements is valid until 21 March 2018.
Proposal by the Board of Directors to authorize the Board of Directors to launch an employee share savings plan and to decide on directed share issue without payment:Konecranes Plc’s Annual General Meeting of Shareholders 2012 decided to implement an Employee Share Savings Plan in the Konecranes Group (the Plan). According to the Board decision, the Plan was offered in 39 countries to approximately 9,000 employees in 2012. During the first Plan Period 2012–2013, the employees’ participation rate was 16 percent globally. Through the Plan, approx-imately 1,500 employees became shareholders in Konecranes. In Finland, the participation rate was 36 percent.
On the basis of interest shown by the Group employees, the Board has on March 21, 2013 decided to launch a new Plan Period. The new plan period began on July 1, 2013 and end on June 30, 2014. During the commencing Plan Period, the intention is to offer the Plan, in addition to the current target countries, also in China. The maximum savings amount per participant during one month is 5 percent of gross salary and the minimum is EUR 10. Each par-ticipant will receive one free matching share for every two acquired savings shares. Matching shares will be delivered to a participant if the participant holds the acquired shares from the plan period until the end of the designated holding period, February 15, 2017, and if his or her employment has not ended before this date for reasons related to the employee. The total amount of all savings of the com-mencing plan period may not exceed EUR 8.5 million.
An employee will participate in the Plan for one year at a time. Shares will be acquired with the accrued savings at the market price quarterly, after the publication dates of the Konecranes interim results, commencing in November 2013. Any dividends paid on purchased shares during the commencing Plan period will automatically be reinvested into additional shares on the following purchase date. These shares will have an equal right to matching shares.
The Board of Directors decides on the issue of new shares or on the transfer of own shares held by the Company to such partici-pants of the Plan who, according to the terms and conditions of the Plan, are entitled to receive free shares, as well as to decide on the share issue without payment also to the Company itself. The authorization includes a right in this Plan to transfer own shares held by the Company, the use of which has earlier been limited to other purposes than incentive plans. The number of new shares to be issued or own shares held by the Company to be transferred may be a maximum total of 500,000 shares, which corresponds to 0.8 per cent of all of the Company´s shares.
The Board of Directors is entitled to decide on other matters concerning the share issue. The authorization concerning the share issue is valid until 21 March 2018. This authorization replaces the authorization for the Share Savings Plan given by the Annual Gen-eral Meeting 2012.

119Konecranes 2013noteS to the paRent companY’S Financial Statement
14. Deferred assets 2013 2012
Group contributions 14.7 35.6
Income taxes 2.4 0.0
Payments which will be realized during the next financial year 4.4 7.3
Pension costs 0.0 0.0
Interest 0.1 0.1
total 21.6 42.9
15. Equity2013 2012
Share capital as of January 1 30.1 30.1
New issue 0.0 0.0
Share capital as of December 31 30.1 30.1
Share premium account 1 January 39.3 39.3
New issue 0.0 0.0
Share premium account as of December 31 39.3 39.3
Share issue 1 January 0.0 0.0
Increase 9.1 3.9
Decrease -9.1 -3.9
Share issue 31 December 0.0 0.0
Paid in capital 1 January 39.0 35.1
Increase 9.1 3.9
Decrease 0.0 0.0
Paid in capital as of December 31 48.1 39.0
Retained earnings as of January 1 154.2 100.1
Dividend paid -60.6 -57.2
Decrease 0.0 0.0
Retained earnings as of December 31 93.6 42.9
Net income for the period 61.7 111.3
Shareholders’ equity as of december 31 272.8 262.6
distributable equityPaid in capital as of December 31 48.1 39.0
Retained earnings as of December 31 93.5 42.9
Net income for the period 61.7 111.3
total 203.4 193.2
16. Accruals2013 2012
Income taxes 0.0 0.1
Wages, salaries and personnel expenses 5.1 5.7
Interest 0.0 0.0
Other items 2.8 3.8
total 7.9 9.6
17. Contingent liabilities and pledged assets
2013 2012
contingent liabilities
For obligations of subsidiaries
Group guarantees 386.4 357.4
other contingent and financial liabilities
leasing liabilities
Next year 0.9 1.1
Later on 1.4 1.4
Leasing contracts are valid in principle three years and they have no terms of redemption.
other liabilities 0.0 0.0
total by category
Guarantees 386.4 357.4
Other liabilities 2.3 2.5
total 388.7 359.9
18. Nominal and fair values of derivative financial instruments2013 2013 2012 2012
Fair value Nominal value Fair value Nominal value
Foreign exchange forward contracts 0.0 33.1 0.0 26.8
Derivatives are used for currency rate hedging only.
120 Konecranes 2013 BoaRd oF diRectoRS’ pRopoSal to the annual geneRal meeting
Board of Directors’ proposal to the annual general meetingThe parent company’s non-restricted equity is EUR 203,354,966.48 of which the net income for the year is EUR 61,701,102.44.
The Group’s non-restricted equity is EUR 366,150,000. According to the Finnish Companies Act, the distributable funds
of the company are calculated based on the parent company’s non-restricted equity. For the purpose of determining the amount of the dividend the Board of Directors has assessed the liquidity of the
parent company and the economic circumstances subsequent to the financial year-end.
Based on such assessments the Board of Directors proposes to the Annual General Meeting that a dividend of EUR 1.05 will be paid on each share and that the remaining non-restricted equity is retained in shareholders’ equity.
Stig GustavsonChairman of the Board
Svante AddeBoard member
Tapani JärvinenBoard member
Matti KavetvuoBoard member
Nina KopolaBoard member
Bertel LangenskiöldBoard member
Malin PerssonBoard member
Mikael SilvennoinenBoard member
Pekka LundmarkPresident and CEO
Helsinki, February 5, 2014
121Konecranes 2013auditoR’S RepoRt
Auditor’s report
To the Annual General Meeting of Konecranes Plc
We have audited the accounting records, the financial state-ments, the report of the Board of Directors, and the administra-tion of Konecranes Plc for the financial period 1.1.–31.12.2013. The financial statements comprise the consolidated statement of financial position, income statement, statement of comprehensive income, statement of changes in equity and statement of cash flows, and notes to the consolidated financial statements, as well as the parent company’s balance sheet, income statement, cash flow statement and notes to the financial statements.
Responsibility of the Board of Directors and the Managing Director
The Board of Directors and the Managing Director are responsible for the preparation of consolidated financial statements that give a true and fair view in accordance with International Financial Report-ing Standards (IFRS) as adopted by the EU, as well as for the prepa-ration of financial statements and the report of the Board of Direc-tors that give a true and fair view in accordance with the laws and regulations governing the preparation of the financial statements and the report of the Board of Directors in Finland. The Board of Directors is responsible for the appropriate arrangement of the con-trol of the company’s accounts and finances, and the Managing Director shall see to it that the accounts of the company are in compliance with the law and that its financial affairs have been arranged in a reliable manner.
Auditor’s ResponsibilityOur responsibility is to express an opinion on the financial state-ments, on the consolidated financial statements and on the report of the Board of Directors based on our audit. The Auditing Act requires that we comply with the requirements of professional eth-ics. We conducted our audit in accordance with good auditing prac-tice in Finland. Good auditing practice requires that we plan and perform the audit to obtain reasonable assurance about whether the financial statements and the report of the Board of Directors are free from material misstatement, and whether the members of the Board of Directors of the parent company or the Managing Director are guilty of an act or negligence which may result in liabil-ity in damages towards the company or have violated the Limited Liability Companies Act or the articles of association of the com-pany.
An audit involves performing procedures to obtain audit evi-dence about the amounts and disclosures in the financial state-ments and the report of the Board of Directors. The procedures selected depend on the auditor’s judgment, including the assess-ment of the risks of material misstatement, whether due to fraud or error. In making those risk assessments, the auditor considers
internal control relevant to the entity’s preparation of financial state-ments and report of the Board of Directors that give a true and fair view in order to design audit procedures that are appropriate in the circumstances, but not for the purpose of expressing an opinion on the effectiveness of the company’s internal control. An audit also includes evaluating the appropriateness of accounting policies used and the reasonableness of accounting estimates made by management, as well as evaluating the overall presentation of the financial statements and the report of the Board of Directors.
We believe that the audit evidence we have obtained is sufficient and appropriate to provide a basis for our audit opinion.
Opinion on the consolidated financial statements
In our opinion, the consolidated financial statements give a true and fair view of the financial position, financial performance, and cash flows of the group in accordance with International Financial Reporting Standards (IFRS) as adopted by the EU.
Opinion on the company’s financial statements and the report of the Board of DirectorsIn our opinion, the financial statements and the report of the Board of Directors give a true and fair view of both the consolidated and the parent company’s financial performance and financial position in accordance with the laws and regulations governing the prepa-ration of the financial statements and the report of the Board of Directors in Finland. The information in the report of the Board of Directors is consistent with the information in the financial state-ments.
Opinions based on assignment of the Audit Committee
We support that the financial statements should be adopted. The proposal by the Board of Directors regarding the use of the distrib-utable equity shown in the balance sheet for the parent company is in compliance with the Limited Liability Companies Act. We sup-port that the Members of the Board of Directors and the Managing Director of the parent company should be discharged from liability for the financial period audited by us.
Helsinki, February 5, 2014
Ernst & Young OyAuthorized Public Accountant Firm
Heikki IlkkaAuthorized Public Accountant

122 Konecranes 2013
09 10 11 12 13
40
0
5
10
15
20
25
30
35
0
5
10
15
25
20
ShaReS & ShaReholdeRS
Number of shares, millionEUR
Shares & shareholdersShares and share capitalAs of December 31, 2013, Konecranes Plc’s fully paid-up share capital entered in the Trade Register was EUR 30,072,660, divided into 63,272,342 shares (63,272,342 in 2012). Konecranes has one class of shares and each share entitles its holder to one vote at the Annual General Meeting and an equal dividend. Konecranes’ shares are registered in the Finnish book entry system.
On December 31, 2013, Konecranes Plc was in the possession of 5,444,262 own shares (5,981,032), which corresponds to 8.6 percent of the total number of shares having a market value of EUR 140.8 million on that date. In 2013, 536,770 treasury shares were transferred to the subscribers, pursuant to the Konecranes Plc’s stock options 2009A and 2009B.
Market capitalization and share tradingAs of the end of 2013, the total market capitalization of Konecranes Plc on NASDAQ OMX Helsinki was EUR 1,495 million (1,464), excluding treasury shares.
Konecranes’ shares closed the year at EUR 25.86 (25.55) on NASDAQ OMX Helsinki. The volume-weighted average trading price for the year was EUR 25.30. The highest quotation for the Konecranes share was EUR 28.89 in February and the lowest was EUR 20.45 in June.
The traded volume of Konecranes’ shares totaled some 51.6 million on NASDAQ OMX Helsinki. In monetary terms, this was val-ued at EUR 1,305.6 million. The daily average trading volume was 206,413 shares, representing a daily average turnover of EUR 5.2 million. In addition, approximately 53.5 million Konecranes’ shares were traded on other trading venues (e.g. multilateral trading facili-ties and bilateral OTC trades) in 2013 according to Fidessa.
Board authorizationsThe Annual General Meeting held on March 21, 2013, authorized the Board of Directors to decide on the repurchase of the Com-pany’s own shares and/or on the acceptance as pledge of the Com-pany’s own shares. The amount of own shares to be repurchased and/or accepted as pledge based on this authorization shall not exceed 6,000,000 shares in total, which corresponds to approxi-mately 9.5 per cent of all the shares in the Company. The authoriza-tion is effective until the end of the next Annual General Meeting, however, no longer than until September 21, 2014. The Board of Directors did not use this authorization in 2013.
The AGM authorized the Board of Directors to decide on the issuance of shares as well as the issuance of special rights enti-tling to shares referred to in Chapter 10 Section 1 of the Finn-ish Companies Act. The amount of shares to be issued based on this authorization shall not exceed 6,000,000 shares, which cor-responds to approximately 9.5 per cent of all the shares in the Company. The authorization can also be used for incentive arrange-ments, however, not more than 700,000 shares in total together with the authorization in the following paragraph. The authorization is effective until the end of the next Annual General Meeting, how-ever, no longer than until September 21, 2014. However, the autho-rization for incentive arrangements is valid until March 21, 2018. This authorization revokes the authorization for incentive arrange-ments given by the Annual General Meeting 2012. The Board of Directors did not use this authorization in 2013.
The AGM authorized the Board of Directors to decide on the transfer of the Company’s own shares. The authorization is limited to a maximum of 6,000,000 shares, which corresponds to approxi-mately 9.5 per cent of all the shares in the Company. The authori-
monthlY pRice and volume on the naSdaq omx helSinki 2009–2013
Konecranes OMX Helsinki Industrial Goods & Services Index OMX Helsinki Cap Index Monthly trading volume

123Konecranes 2013ShaReS & ShaReholdeRS
zation can also be used for incentive arrangements, however, not more than 700,000 shares in total together with the authorization in the previous paragraph. This authorization is effective until the next Annual General Meeting of Shareholders, however, no longer than until September 21, 2014. However, the authorization for incentive arrangements is valid until March 21, 2018. This autho-rization revokes the authorization for incentive arrangements given by the Annual General Meeting 2012. The Board of Directors did not use this authorization in 2013.
The AGM authorized the Board of Directors to decide on a directed share issue without payment needed for the implementa-tion of the Share Savings Plan, which the Annual General Meeting 2012 decided to launch.
The Board of Directors is authorized to decide on the issue of new shares or on the transfer of own shares held by the Company to such participants in the Plan who, according to the terms and conditions of the Plan, are entitled to receive free shares, as well as to decide on the share issue without payment also to the Com-pany itself. The number of new shares to be issued or own shares held by the Company to be transferred may be a maximum total number of 500,000 shares, which corresponds to 0.8 per cent of all of the Company’s shares. The authorization concerning the share issue is valid until March 21, 2018. This authorization is in addition to the authorizations in the previous items. This authoriza-
tion replaces the authorization for the Share Savings Plan given by the Annual General Meeting 2012. The Board of Directors did not use this authorization in 2013.
These authorizations are explained in more detail in the release covering the resolutions of the 2013 AGM, which can be consulted at the Company’s Web site at www.konecranes.com > Investors > Corporate governance > General meeting > 2013.
Stock option plansKonecranes has stock option plan 2009 for its key employees, including top and middle management, and employees in certain expert positions. In 2013, 536,770 treasury shares were trans-ferred to the subscribers, pursuant to the Konecranes Plc’s stock options 2009A and 2009B.
As of the end of 2013, the stock options issued under Konecranes Plc’s ongoing stock option plans entitle option holders to subscribe for a total of 1,486,891 shares, which corresponds to 2.3 percent of all of the Company’s shares. The option programs include approximately 200 key personnel.
For a more detailed description of the option plans, see Note 29 on Page 94 of the Financial Statements. The terms and conditions of the stock option plans can also be consulted at www.konecranes.com > Investors > Share information > Stock option plans.
changeS in the ShaRe capital and the numBeR oF ShaReS
change in number of shares
total number of shares
change in share capital
Share capital euR
1999 March 11, Conversion of share capital into EUR 15,000,000 30,000,000
2002 December 20, invalidation of shares held by the company and reduction of share capital -691,370 14,308,630 -1,382,740 28,617,260
2004 New shares subscribed for with the 1997 stock options 1,400 14,310,030 2,800 28,620,060
2005 New shares subscribed for with the 1997, 1999A, 1999B, 2001A and 2003A stock options 176,000 14,486,030 352,000 28,972,060
2006 pre-split
New shares subscribed for with 1997, 1999B, 2001A and 2003A stock options 286,700 14,772,730 573,400 29,545,460
2006 March 17, 2006 Share split 1:4 44,318,190 59,090,920 0 29,545,460
2006 post-split
New shares subscribed for with 1997, 1999B, 2001A, 2003A and 2003B series stock options 986,800 60,077,720 493,400 30,038,860
2007 February, new shares subscribed for with 2003B stock options 67,600 60,145,320 33,800 30,072,660
2007 March–December, new shares subscribed for with 1997, 1999B, 2001A, 2001B, 2003B and 2003C stock options 833,460 60,978,780 0 30,072,660
2008 February–December, new shares subscribed for with 1997, 1999B, 2001B, 2003B and 2003C stock options 633,540 61,612,320 0 30,072,660
2009 February–December, new shares subscribed for with 2001B and 2003C stock options 260,600 61,872,920 0 30,072,660
2010 February–May, new shares subscribed for with 2001B stock options 129,200 62,002,120 0 30,072,660
2011 January, share issue directed to the shareholders of KCR Management Oy 281,007 62,283,127 0 30,072,660
2011 February–May, new shares subscribed for with 2007A and 2007B stock options 958,300 63,241,427 0 30,072,660
2012 May–June, new shares subscribed for with 2009A stock options 30,915 63,272,342 0 30,072,660

124 Konecranes 2013 ShaReS & ShaReholdeRS
Performance share plan 2012In 2012, the Board of Directors resolved to implement a perfor-mance share plan according to which earning reward is based on attainment of targets determined by the Board of Directors. Earn-ing during the one-year discretionary period that began in 2012 will be based on the Konecranes Group´s EBIT margin, and during the three-year discretionary period that began in 2012 on the Total Shareholder Return of the Company’s share (TSR). The potentially earned reward will be paid in spring 2015. If a key employee’s employment or service ends before the end of a discretionary period, no reward will be paid on the basis of such discretionary period.
The target group of the plan consists of approximately 160 people. The rewards to be paid on the basis of the discretionary periods that began in 2012 correspond to the value of an approxi-mate maximum total of 271,308 Konecranes Plc shares, which cor-responds to 0.4 percent of all of the Company’s shares.
In 2013, the Board of Directors has resolved to amend the performance share plan launched in 2012 so that two three-year discretionary periods 2013–2015 and 2014–2016 will follow the discretionary periods commenced in 2012. The performance crite-rion for the discretionary periods 2013–2015 and 2014–2016 is the cumulative Earnings per Share (EPS) for the respective years.
The target group of the plan consists of approximately 185 peo-ple during the discretionary periods 2013–2015 and 2014–2016. The rewards to be paid on the basis of each discretionary period correspond to the value of an approximate maximum of 700,000 Konecranes Plc shares, which corresponds to 1.1 percent of all of the Company’s shares. If the targets determined by the Board of Directors are attained, the reward payout may be a half of the maxi-mum reward. The maximum reward payout requires that the targets are clearly exceeded.
For a more detailed description of the performance share plan, see Note 29 on Page 94 of the Financial Statements.
Employee share savings planKonecranes Plc’s AGM 2012 approved the Konecranes Employee Share Savings Plan. In April 2002, the Board of Directors approved the detailed terms and conditions of the plan and the first plan period. The first plan period began on July 1, 2012 and ended on June 30, 2013.
Each participant will receive one free matching share for every two acquired savings shares. Matching shares will be delivered to a participant if the participant holds the acquired shares from the plan period until the end of the designated holding period, February 15, 2016, and if his or her employment with the company has not been terminated on the last day of the holding period on bad leaver terms.
Approximately 1,500 Konecranes employees signed up for the Plan that commenced July 1, 2012. The number of new shares to be issued or own shares held by the Company to be transferred under the terms and conditions of the plan may be a maximum total of 42,602 shares, which corresponds to 0.1 percent of all of the Company’s shares.
In 2013, the Board decided to launch a new plan period. The new plan period began on July 1, 2013 and will end on June 30, 2014. The maximum savings amount per participant during one month is 5 percent of the gross salary and the minimum is EUR 10.
Each participant will receive one free matching share for every two acquired savings shares. Matching shares will be delivered to a participant if the participant holds the acquired shares from the plan period until the end of the designated holding period, February 15, 2017, and if his or her employment has not ended before this date for the reasons related to the employee. The total amount of all savings of the commencing plan period may not exceed EUR 8.5 million. Approximately 1,650 Konecranes employees signed up for the plan commencing July 1, 2013.
For a more detailed description of the employee share savings plan, see Note 29 on Page 94 of the Financial Statements.
Flagging notificationsNo flagging notifications or other shareholder announcements were received in 2013.
ShareholdersKonecranes had 18,655 (19,598) shareholders on December 31, 2013. At year-end 2013 43.3 (37.6) percent of the Company’s shares were nominee-registered. More information on the break-down of share ownership and Board and Management interests can be found in the Shares and Shareholders section on Page 125 of the Financial Statements.
Konecranes Plc share trading informationDate of listing on NASDAQ OMX Helsinki: March 27, 1996Segment: Large CapICB classification: Industrials, Industrial Goods & Services, Industrial Engineering, Commercial Vehicles & Trucks 2753ISIN code: FI0009005870Trading code: KCR1VReuters ticker: KCR1V.HEBloomberg ticker: KCR1V FH
Konecranes Plc’s stock option 2009A trading informationDate of listing on NASDAQ OMX Helsinki: April 2, 2012ISIN code: FI4000041488Trading code: KCR1VEW109
Konecranes Plc’s stock option 2009B trading informationDate of listing on NASDAQ OMX Helsinki: April 2, 2013ISIN code: FI4000041496Trading code: KCR1VEW209
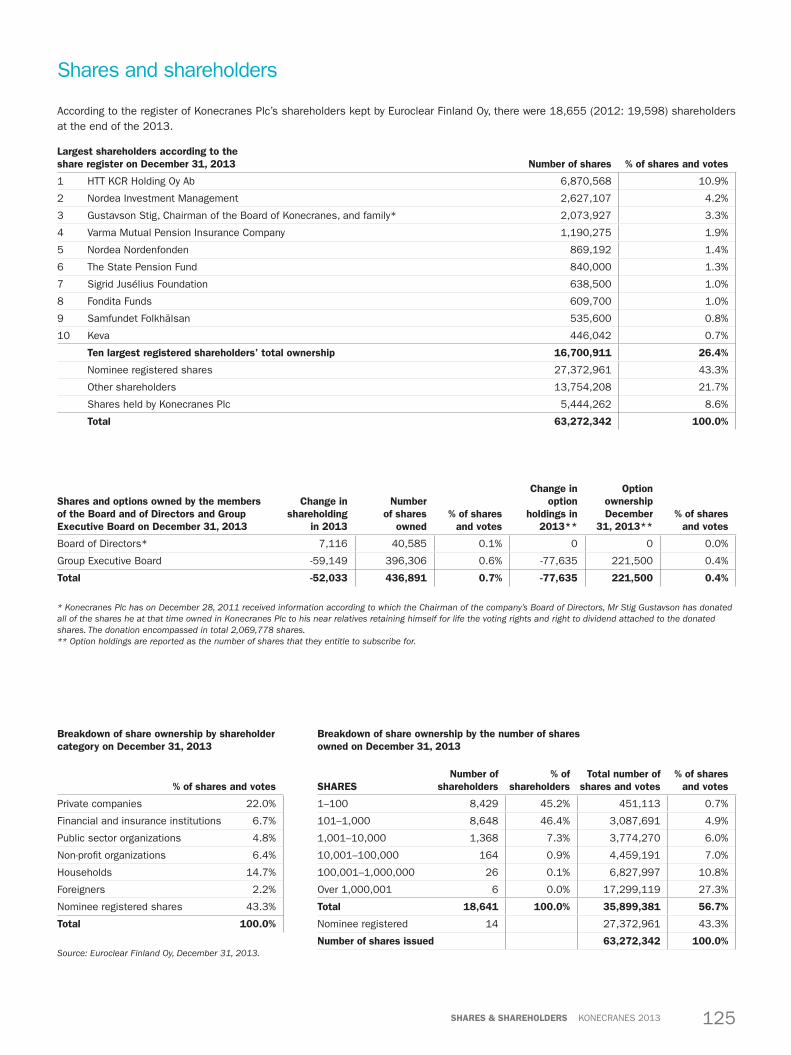
125Konecranes 2013ShaReS & ShaReholdeRS
Shares and shareholders
Shares and options owned by the members of the Board and of directors and group executive Board on december 31, 2013
change in shareholding
in 2013
number of shares
owned% of shares
and votes
change in option
holdings in 2013**
option ownership december
31, 2013**% of shares
and votes
Board of Directors* 7,116 40,585 0.1% 0 0 0.0%
Group Executive Board -59,149 396,306 0.6% -77,635 221,500 0.4%
total -52,033 436,891 0.7% -77,635 221,500 0.4%
* Konecranes Plc has on December 28, 2011 received information according to which the Chairman of the company’s Board of Directors, Mr Stig Gustavson has donated all of the shares he at that time owned in Konecranes Plc to his near relatives retaining himself for life the voting rights and right to dividend attached to the donated shares. The donation encompassed in total 2,069,778 shares.** Option holdings are reported as the number of shares that they entitle to subscribe for.
According to the register of Konecranes Plc’s shareholders kept by Euroclear Finland Oy, there were 18,655 (2012: 19,598) shareholders at the end of the 2013.
largest shareholders according to the share register on december 31, 2013 number of shares % of shares and votes
1 HTT KCR Holding Oy Ab 6,870,568 10.9%
2 Nordea Investment Management 2,627,107 4.2%
3 Gustavson Stig, Chairman of the Board of Konecranes, and family* 2,073,927 3.3%
4 Varma Mutual Pension Insurance Company 1,190,275 1.9%
5 Nordea Nordenfonden 869,192 1.4%
6 The State Pension Fund 840,000 1.3%
7 Sigrid Jusélius Foundation 638,500 1.0%
8 Fondita Funds 609,700 1.0%
9 Samfundet Folkhälsan 535,600 0.8%
10 Keva 446,042 0.7%
ten largest registered shareholders’ total ownership 16,700,911 26.4%
Nominee registered shares 27,372,961 43.3%
Other shareholders 13,754,208 21.7%
Shares held by Konecranes Plc 5,444,262 8.6%
total 63,272,342 100.0%
Breakdown of share ownership by the number of shares owned on december 31, 2013
ShaReSnumber of
shareholders% of
shareholderstotal number of
shares and votes% of shares
and votes
1–100 8,429 45.2% 451,113 0.7%
101–1,000 8,648 46.4% 3,087,691 4.9%
1,001–10,000 1,368 7.3% 3,774,270 6.0%
10,001–100,000 164 0.9% 4,459,191 7.0%
100,001–1,000,000 26 0.1% 6,827,997 10.8%
Over 1,000,001 6 0.0% 17,299,119 27.3%
total 18,641 100.0% 35,899,381 56.7%
Nominee registered 14 27,372,961 43.3%
number of shares issued 63,272,342 100.0%
Breakdown of share ownership by shareholder category on december 31, 2013
% of shares and votes
Private companies 22.0%
Financial and insurance institutions 6.7%
Public sector organizations 4.8%
Non-profit organizations 6.4%
Households 14.7%
Foreigners 2.2%
Nominee registered shares 43.3%
total 100.0%
Source: Euroclear Finland Oy, December 31, 2013.

126 Konecranes 2013 inveStoR inFoRmation
Investor Relations
IR principlesThe main objective of Konecranes’ Investor Relations is to assist in the correct valuation of the Company’s share by providing capi-tal markets with information regarding Konecranes’ operations and financial position. Konecranes pursues an open, reliable, and up-to-date disclosure policy, aimed at giving all market participants access to correct and consistent information regularly and equi-tably.
Konecranes’ Investor Relations is responsible for investor com-munications and daily contacts. The President and CEO, together with the Chief Financial Officer, participate in IR activities and are regularly available for meetings with capital market representatives. Konecranes Investor Relations regularly gathers and analyzes mar-ket information and investor feedback for use of top management and the Board of Directors.
Silent periodKonecranes observes a silent period prior to the publication of its financial statements and interim reports starting at the end of the quarter in question. During this time, Company representatives do not comment on Konecranes’ financial position.
Investor relations in 2013Konecranes participated in six investor seminars and held 23 road-show days. All in all, we took part in approximately 210 investor meetings in 2013 in Amsterdam, Chicago, Copenhagen, Edinburgh, Frankfurt, Geneva, Helsinki, London, Munich, New York, Oslo, Paris, San Francisco, Stockholm, Toronto, and Zurich.
Investor contactsMiikka Kinnunen, Director, Investor RelationsTel: +358 20 427 2050E-mail: [email protected]
Anna-Mari Kautto, Assistant, Investor RelationsTel: +358 20 427 2960E-mail: [email protected]
Equity researchThe following banks, investment banks and equity research provid-ers cover Konecranes:
ABG Sundal CollierCarnegie Investment BankDanske MarketsDNB MarketsEvli BankGoldman SachsHandelsbanken Capital MarketsHSBC Trinkhaus and BurkhardtInderesKepler CheuvreuxNordea BankPareto SecuritiesPohjola BankSEB EnskildaUBS
Konecranes takes no responsibility for the opinions expressed by analysts. More information on Konecranes as an investment can be found at www.konecranes.com > Investors.
Investor information

127Konecranes 2013inveStoR inFoRmation
Information for shareholders
Annual General MeetingKonecranes’ next Annual General Meeting will be held on Thursday, March 27, 2014 at 10 a.m. at Hyvinkääsali, Jussinkuja 1, 05800 Hyvinkää, Finland.
Shareholders registered no later than March 17, 2014 in the Company’s list of shareholders maintained by Euroclear Finland Ltd. are entitled to attend the AGM.
Holders of nominee-registered shares intending to participate in the AGM shall notify their custodian well in advance of their inten-tion and comply with the instructions provided by the custodian.
A shareholder wishing to participate in the AGM must notify the Company (Ms. Laura Kiiski) of his/her participation no later than March 24, 2014:
Internet: www.konecranes.com/agm2014E-mail: [email protected]: +358 20 427 2105 (from abroad)or 020 427 2105 (Finland)Phone: +358 20 427 2017 (from abroad) or020 427 2017 (Finland)Mail: Konecranes Plc, Laura Kiiski, P.O. Box 661,FI-05801 Hyvinkää, Finland
Shareholders are requested to inform the Company of any proxies for the AGM in connection with their registration. A sample proxy can be found at the Company’s Web site.
Payment of dividendThe Board of Directors will propose to the Annual General Meeting of Shareholders that a dividend of EUR 1.05 per share should be paid for 2013. The dividend will be paid to shareholders who are registered on the record date as shareholders in the Company’s shareholders’ register maintained by Euroclear Finland Ltd.
Record date of dividend payment: April 1, 2014Date of dividend payment: April 9, 2014
Financial reports in 2014Financial Statements for 2013: February 5, 2014Interim report, January–March: April 24, 2014Interim report, January–June: July 23, 2014Interim report, January–September: October 22, 2014
Konecranes’ annual and interim reports are published in English, Finnish, and Swedish. The Annual Report is available in pdf format on the Company Web site and in print form. Copies are mailed to shareholders on request; orders can be placed through the Com-pany Web site.
All press and stock exchange releases can be consulted at the Company’s Web site (www.konecranes.com) and can be received by e-mail by subscribing at www.konecranes.com > Investors > Releases > Order releases. The Annual Report can also be ordered from:
Konecranes PlcInvestor RelationsP.O. Box 661FI-05801 HyvinkääFinlandPhone: +358 20 427 2960Fax: +358 20 427 2089Web: www.konecranes.com > Investors > Reports and result pre-sentations > Order annual report
Shareholder registerKonecranes shares are covered by the Finnish Book Entry Securi-ties System. Shareholders should notify the relevant holder of their book entry account about changes in address or account numbers for the payment of dividends and other matters related to their holdings.
Important datesRecord date of the AGM: March 17, 2014Registration for the AGM closes: March 24, 2014The AGM: March 27, 2014Dividend ex-date: March 28, 2014Dividend record date: April 1, 2014Dividend payment date: April 9, 2014
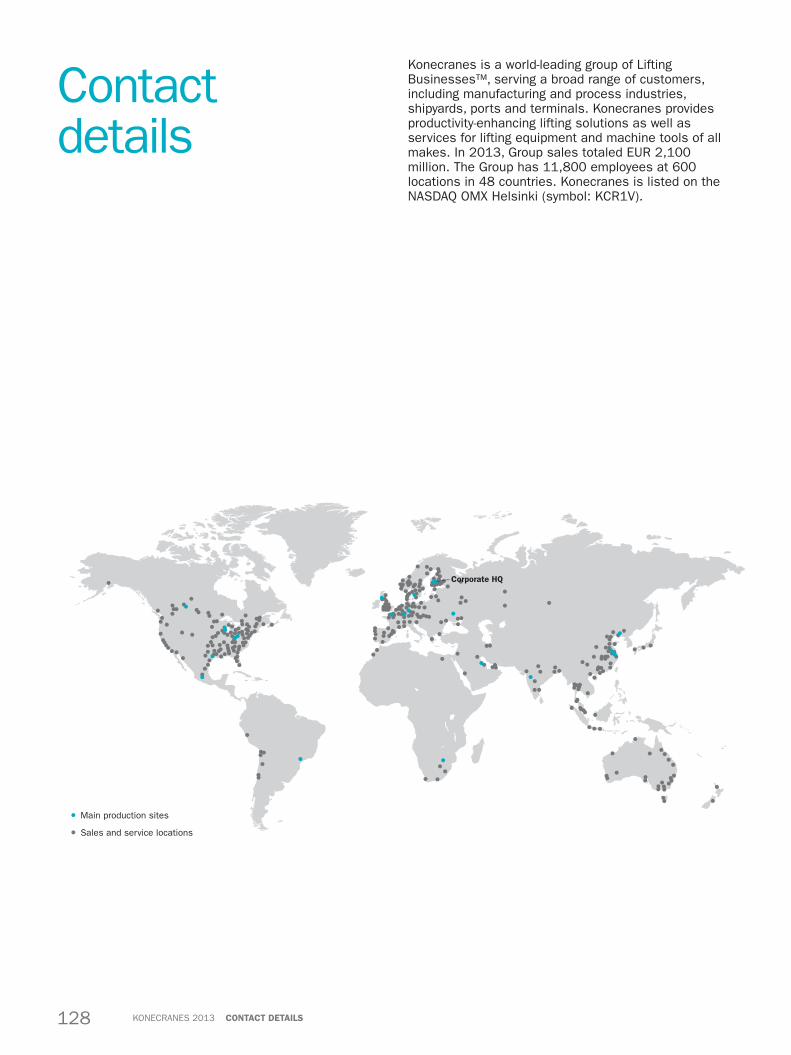
128 KONECRANES 2013 ContaCt details
Contact details
Konecranes is a world-leading group of Lifting Businesses™, serving a broad range of customers, including manufacturing and process industries, shipyards, ports and terminals. Konecranes provides productivity-enhancing lifting solutions as well as services for lifting equipment and machine tools of all makes. In 2013, Group sales totaled EUR 2,100 million. The Group has 11,800 employees at 600 locations in 48 countries. Konecranes is listed on the NASDAQ OMX Helsinki (symbol: KCR1V).
Main production sites
Sales and service locations
Corporate HQ
This publication is for general informational purposes only. Konecranes reserves the right at any time, without notice, to alter or discontinue the products and/or specifications referenced herein. This publication creates no warranty on the part of Konecranes, express or implied, including but not limited to any implied warranty or merchantability or fitness for a particular purpose.
© 2014 Konecranes. All rights reserved. 'Konecranes', 'Lifting Businesses', 'TRUCONNECT', 'Agilon', 'SMARTON' and are either registered trademarks or trademarks of Konecranes Plc.
Corporate responsibilityFor corporate responsibility matters please contact [email protected]
Corporate Headquarters
Konecranes PlcP.O. Box 661 (Koneenkatu 8)FI-05801 Hyvinkää, FinlandTel +358 20 427 11Fax +358 20 427 2099
Global Business Area Headquarters
ServiceKonecranes Finland CorporationP.O. Box 662 (Koneenkatu 8)FI-05801 Hyvinkää, FinlandTel +358 20 427 11Fax +358 20 427 4099
Asia-Pacific Konecranes (Shanghai) Co., Ltd.Building 4, No. 100, Lane 2891, South Qilianshan RoadShanghai, 200331, ChinaTel +86 21 2606 1000Fax +86 21 2606 1066
Equipment Konecranes Finland Corporation P.O. Box 662 (Koneenkatu 8)FI-05801 Hyvinkää, FinlandTel +358 20 427 11Fax +358 20 427 3009
Regional Headquarters
AmericasKonecranes, Inc.4401 Gateway Blvd.Springfield, OH 45502, USATel +1 937 525 5533Fax +1 937 322 2832
Europe, Middle East and Africa Konecranes Finland CorporationP.O. Box 662 (Koneenkatu 8)FI-05801 Hyvinkää, FinlandTel +358 20 427 11Fax +358 20 427 3009
Konecranes is an industry shaping, global group of dynamic Lifting Businesses™.We are committed to providing our customers with products and services of unrivaled quality, safety, and reliability – and helping improve the efficiency and performance of our customers' business-es. By leveraging our unique know-how and technology, we are able to develop innovative integrated lifting solutions. With our remote services, we can gather real-time information on how our customers’ equipment is performing and help improve operational safety, as well as provide maintenance when it is needed. With solutions that help increase customers’ safety performance and productivity, we are not just lifting things, but entire businesses.

www.konecranes.com
Annual report 2013
Ko
nec
ra
nes a
nn
ua
l rep
or
t 2
013