Annual Report 2011 Mail File - Crescent Textile
90
Annual Report 2011 The Crescent Textile Mills Limited
Transcript of Annual Report 2011 Mail File - Crescent Textile

Annual Report 2011
The Crescent Textile Mills Limited

Annual Report 2011 1

Annual Report 20112

Contents
Company Information
Notice of Annual General Meeting
Mission, Vision and Values
Performance Indicators
Graphical Representations
Director’s Report to the Shareholders
Key Operating and Financial Data
Statement of Compliance with best practices ofCode of Corporate Governance
Review Report to the Members on Statement of Compliancewith best practices of Code of Corporate Governance
Pattern of Shareholding
Auditor’s Report to the Members
Balance Sheet
Profit & Loss Account
Statement of Comprehensive Income
Cash Flow Statement
Statement of Changes in Equity
Notes to the Financial Statements
Proxy Form
4
5
7
20
8
10
19
21
23
24
27
28
30
31
32
33
34
87
Annual Report 2011 3

Company information
Al Baraka Bank Limited
Allied Bank Limited
Burj Bank Limited
Faysal Bank Limited
Habib Bank Limited
Meezan Bank Limited
MCB Bank Limited
National Bank of Pakistan
NIB Bank Limited
Standard Chartered Bank (Pakistan) Limited
United Bank Limited
Mr. Muhammad Anwar
Mr. Ahsan Mehanti
Mr. Khalid Bashir
Mr. Khurram Mazhar Karim
Mr. Muhammad Arshad
Mr. Muhammad Asif
(Nominee NIT)
Mr. Nasir Shafi
Mr. Zeshan Afzal
Chairman &
Chief Executive
Director
Director
Director
Director
Director
Director
Director
Audit Committee
Mr. Khalid Bashir
Mr. Nasir Shafi
Mr. Ahsan Mehanti
Chairman
Member
Member
Chief Financial Officer
Mr. Sadiq Saleem
Mr. Naseer Ahmad Chaudhary
Corporate Secretary
Mr. Muhammad Attiq ur Rehman
Head of Internal Audit
Riaz Ahmad & Company
Chartered Accountants
Auditors
Mujtaba Jamal Law Associates
Raza Abbas Chaudhary Advocate
Legal Advisor
The Crescent Textile Mills Limited is a listed Company
and its shares are traded on all three Stock Exchanges
in Pakistan.
Stock Exchange Listing
The Company's shares are quoted in leading dailies
under textile personal goods sector.
Sargodha Road,
Faisalabad, Pakistan
T: + 92-041-111-105-105
F: + 92-041-111-103-104
Mills & Head Office
Registered Office
40-A, Off: Zafar Ali Road, Gulberg-V,
Lahore, Pakistan
T: + 92-042-111-245-245
F: + 92-042-111-222-245
Share Registrar
Crescent Group Services (Pvt) Ltd,
306, 3rd Flr, Siddiq Trade Centre,
72-Main Boulevard, Gulberg,
Lahore, Pakistan
T: + 92-042-35787592
F: + 92-042-35787594
www.ctm.com.pk
Annual Report 20114

Notice of Annual General Meeting
1.
Registered Office:40-A, Off: Zafar Ali Road, Gulberg-V, Lahore:T: +92-042-111-245-245F: +92-042-111-222-245Dated: October 05, 2011
By Order of The Board
(Naseer Ahmad Chaudhary)Corporate Secretary
Notice is hereby given that the 62nd Annual General Meeting of the shareholders of the Company will be held on Monday, the October 31, 2011 at 9:30 a.m. at the registered office of the company at 40-A, Off: Zafar Ali Road, Gulberg-V, Lahore to transact the following business:-
To confirm the minutes of Extra Ordinary General Meeting of the shareholders held on May 16, 2011.
2. To receive, consider and approve the audited accounts of the company for the year ended June 30, 2011 together with the Directors' and Auditors' Reports thereon.
3. To appoint Auditors of the company and fix their remuneration for the year ending June 30, 2012. Present auditors M/s. Riaz Ahmed and Company, Chartered Accountants, retire and being eligible to offer themselves for re-appointment.
4. To transact any other business with permission of the Chairman.
Annual Report 2011 5

Notes
The Members' Register will remain closed from October 22, 2011 to October 31, 2011 (both days inclusive). Physical / CDC transfers received at the Registered Office of the Company by the close of business on October 21, 2011.
1.
A member eligible to attend and vote in this meeting may appoint another member as proxy to attend and vote in the meeting. Proxies in order to be effective must be received by the company at the Registered Office not later than 48 hours before the time for holding the meeting.
2.
Shareholders are requested to immediately notify the change in address, if any.3.
CDC account holders will further have to follow the guidelines as laid down in circular No.1 dated January 26, 2000 issued by the Securities and Exchange Commission of Pakistan:
4.
a.
i).
ii).
For attending the meeting:
In case of individuals, the account holder or sub-account holder and/or the person whose securities are in group account and their registration details are uploaded as per the Regulations, shall authenticate his/her identity by showing his original Computerized National Identity Card (CNIC) or original passport at the time of attending the meeting.
b. For Appointing Proxies
In case of individuals, the account holder or sub-account holder and/or the person whose securities are in group account and their registration details are uploaded as per the Regulations, shall submit the proxy form as per the above requirement.
i).
ii).
iii).
iv).
v).
In case of corporate entity, the Board of Directors' resolution/power of attorney with specimen signatures of the nominee shall be produced (unless it has been provided earlier) at the time of the Meeting.
The proxy form shall be witnessed by two persons whose names, addresses and CNIC numbers shall be mentioned on the form.
Attested copies of CNIC or the passport of the beneficial owners and the proxy shall be furnished with the proxy form.
The proxy shall produce his original CNIC or original passport at the time of the Meeting.
In case of corporate entity, the Board of Directors' resolution/power of attorney with specimen signatures shall be submitted (unless it has been provided earlier) along with proxy form to the company.
Annual Report 20116

Mission, Vision and Values
To be the 1st Choice of Customers and achieve a leading role in the economy through enhancement of quality of life style for Stakeholders.
Annual Report 2011 7

6%4%
Shareholder Equity andLiabilities - 2011
Share capital andreserves
Surplus on revaluationof operating fixed assets
Non current liabilities
Current liabilities
Shareholder Equity andLiabilities - 2010
Share capital andreserves
Surplus on revaluationof operating fixed assets
Non current liabilities
Current liabilities
Assets - 2011
Property, plantand equipment
Investments
Inventories
Trade debts
Other assets
Assets - 2010
Property, plantand equipment
Investments
Inventories
Trade debts
Other assets
Graphical Representations
Balance Sheet Composition
Annual Report 20118

Analysis of Profit and Loss Account
Analysis of Cash Flows
Sources of Earnings Utilization of Earnings
Utilization of Available /Generated Cash during the
Year 2011
OperatingActivities
InvestingActivities
Cash and CashEquipments
Utilization of Available /Generated Cash during the
Year 2010
InvestingActivities
FinancingActivities
Cash and CashEquipments
Ru
pe
es
inm
illi
on
Ru
pe
es
inm
illi
on
Admin, distribution & othersFinance costTaxationShare of associate (loss) / profitTransferred to retained earnings
Other operating incomeGross profit
Share of associate profit
Annual Report 2011 9

Directors' Report to the Shareholders
The Board of directors of your company is pleased to present the 62nd Annual Report and Audited Financial Statements of the company for the year ended June 30, 2011 together with the Auditors' Report thereon.
Following are the highlights of major events of the year:
Summary of financial results is as below:
Particulars 2011 2010 % Change
(Rupees in million)
Sales revenueGross profitOperating expensesOther operating incomeFinance costProfit before taxTaxation
14,759.2571,364.616 884.955179.043 527.172 131.532
99.465
10,863.386 1,456.742
731.247184.767566.793343.469118.821
35.86-6.3221.02-3.10-6.99
-61.70-16.29
Industry:
Consistent rise in cotton prices to historically high levels.Year- long bridled gas supply and extreme power cuts.Imposition of Fixed Sales Tax on sale of textiles to Un Registered Persons by FBR.
Company:
Growth in export sales revenues depicting increase of 46.32%.Slide in finance cost despite achieving higher sales growth and despite utilizing increased level of Bank borrowings. Use of LPG as an alternate to strengthen value added manufacturing.Steam generation from Rice Husk Boiler by eliminating use of HFO. Conversion of long term debt of the company in CBL to Preference Shares.
Net profit after tax 32.067 224.648 -85.72
The benchmark NYC which was trading $0.76/Lb in June 2010 touched $2.14 / Lb in March 2011. Main reasons behind this hike were damage to crop in Pakistan and China inflicted with floods and heavy rains besides inflammation given by hedged funds involvement. Over and above this, policy of the Indian Govt to ban export of surplus cotton aggravated the situation. Demand and supply gap in cotton availability forced industry to import costly cotton which required huge working capital funds at increased financial cost.
Later in 4th Qtr on news of bumper harvest of world cotton crop prices plummeted. This resulted into heavy pressure on selling prices and eroded margins along with colossal inventory losses due impairment in value of carrying cost of stocks held with the value added industry. Falling cotton prices coupled with prolonged gas outages curtailed business operations during last Qtr of the financial year. These circumstances forced most industrial units to opt for shutting down operational activities as heavy energy cost on alternate expensive fuel outpaced shutdown losses. Consequently these adverse business conditions in 4th Qtr affected negatively onto the performance of the entire Fy2011.
Influenced by rising cotton prices based on demand supply gap, PSF followed similar trend as higher demand, increase in fuel prices, speculative trading and supply constraints kept its prices higher.
On the other hand landscape of the country's macroeconomic performance reflected mixed trends as current account of FY2011 posted a positive close ($542 million surplus) after 07 years. This was achieved mainly on growth in textile exports due high cotton price impact, significant rise in home remittances, lower oil bill due subdued oil based energy generation, support of donors and last but not the least declining investment appetite due energy crises. Healthy build up of reserves helped PKR to maintain stable parity with US$ throughout the year but high interest rates on account of heavy Govt borrowings and energy crises, throughout the year, negatively affected Large Scale Manufacturing growth in general. In GDP composition the contribution of manufacturing sector remained weak and faced immense challenges due power and gas shortages, weak demand and high interest rates in the region.
Over view of industry and economy:
Financial year 2011 saw record breaking cotton prices which were the highest in 160 years of recorded history.
Annual Report 201110

Financial performance:
Your company recorded robust sales growth of 35.86% over previous year on the strength of higher sales volumes as well as higher selling prices. However, this improvement was not transformed into gross margins which fell down to 9.25% of sales revenues as against 13.41% in the previous financial year. Major reason for decline in margins was attributed to jump in cost of sales in particular the performance 4th Qtr which erased most of the gains accrued to the Co. till 3rd Qtr of the FY 2011.
In view of IMF conditions for disbursement of last SBA Tranche, FBR had detailed deliberations with the stakeholders for implementations of RGST across the board. After lots of negotiations a Fixed Sales TaxRegime was introduced in March 2011 by imposing 6% and 4% GST on sale of yarn and value added goods respectively by the Registered Persons of textile chain to the Unregistered Persons. Lack of budgetary allocations for incentives announced in the Textile Policy 2009 led to most claims being undisbursed and further dampened performance of industry. Similarly, on opposition of India GSP Plus status to Pakistan's textiles could not be achieved to give much needed impetus to exports into EU Countries
Amid rising input costs and constant increase in fuel prices industry faced major concerns to absorb in selling prices as foreign buyers either refused to accept up charge or evaded their commitments. Stable PKR parity with US $ also did not help to mitigate such losses and hammered selling margin of value added industry. In general the business sentiments were dampened due contracting margins and ongoing political and security environment.
The news on forecast of bumper cotton crop for new season played havoc and cotton prices fell drastically.This situation prompted local and foreign buyers to adopt wait and see strategy. Sluggish demand and unavailability of gas curtailed operations and there was no choice except to shut down operations as use of expensive alternate fuel source available with the company for energy generation could lead to colossal
Extra fuel cost incurred by the company forenergy generation and other processes(HFO, diesel and LPG use) during gasload sheddingShut downs cost during 4th Qtr due lackof gas and decline in selling margins againstsubdued salesImpairment of inventories, cotton andfabric during 4th Qtr on account decline incotton pricesGrand total
Million Rs.
417.058
122.880
154.068694.006
Selling and distribution cost was higher on increased rates of ocean freight due higher oil prices, enhanced volume of exports with rise foreign agents commission. Operating cost and income were slightly lower but controlled finance cost despite higher borrowing level neutralized the impact of 6.32% decline in gross margins on net profit of the company.
A summarized financial impact of all those un-favouable business conditions; which caused reduction in gross margin during FY 2011 particularly in Qtr 04 is as below:
Segmental performance:
Escalation in input cost of raw material, use of HFO, Diesel oil and LPG during gas load shedding along with adverse impact of 4th Qtr kept margins in all business segments of the company under pressure through out the FY 2011. Phenomenal increase in cotton prices helped to maintain margin in spinning but in the backdrop of mounted input costs the value added segments faced most of the brunt. Frequent gas curtailment schedules gave rise to production costs of these segments and put pressure on margins. All of these factors proved negative catalyst in dragging margins of the company downward and were also lower in comparison to last year's margin.
losses due uneconomical operations. During last Qtr of the financial year slowdown in demand further aggravated the situation as inventory carrying cost increased besides impairing values at the same time.
Annual Report 2011 11

Particulars
Spinning Weaving Processing andHome Textiles
SalesCost of SalesGross Profit
6,8386,056
Fig's in Million Rs.
2011 2010 2011 2010 2011 2010
5,0444,081
7,4797,251
5,0825,021
8,4868,259
7,0146,750
782 963 228 61 227 264
Distribution CostAdministrativeexpenses
64
81
65
72
102
16
42
14
472
93
364
84145 137 118 56 565 448
Profit/(loss) beforetaxation andunallocated incomeand expenses 637 826 110 5 (338) (184)
The aforesaid segmental results include intersegment sales but exclude trading and other processes like Power Generation and Cold Storage results.
Sales revenue2011
Million Rs. %
Local:YarnFabricOthers
2,774.118518.198331.554
1942
2010Million Rs. %
2,439.279506.740307.125
2253
3,623.871 25 3,253.144 30Export:YarnFabric- Own manufacturedFabric- Direct purchasesHome textiles
439.8572,832.6874,097.4643,765.379
3192825
394.0281,608.3052,347.5503,260.662
4152130
11,135.387 75 7,610.545 70
14,759.258 100 10,863.387 100
Sales revenue:
Over all net sales revenues of the company were higher by 35.86% over previous year with major thrust coming from exports which recorded growth of 46.32%. The up stick in exports was largely driven by higher cotton and polyester prices thereby giving higher push to yarn prices but witnessed steady rise in prices of value added exports. Earlier better margin in end product prices helped in improving volumes of fabric exports but remained lower in yarn and local fabric sales. Nonetheless these volumes were subdued in last Qtr of the financial year as buyer held back their demand amid falling cotton prices. A summarized statement of sales revenues is as below:
In the overall sales revenues export share was higher 5% from previous year's pie and improved to 75% as against 70% during last year. In exports the share of value added goods was steady but fabric showed massive growth of 105.55% with major contribution coming from greig exports on increased demand. On the local side yarn depicted marginal growth (13.72%) as most of volume was converted into in-house fabric manufacturing. The impetus given by cotton prices to sales volume in 09 months of the FY 2011 could not sustain in Qtr 04 as cotton prices crashed after witnessing a tremendous bull run till March 2011.
Despite very difficult business conditions during the year including energy crises, higher input costs, squeezed banking facilities to private sector, weak security and political environment, lesser off take in Europe, USA due recession, higher import duties and high cotton prices, very competitive international market and stable PKR the category wise export of the company remained strong in fabric and steady in value added and yarn. This trend along with past 05 years' data has been depicted as below:
Year Yarn Fabric Home Textiles Total
Million Rs. %
204
277
257
394
440
07
06
05
07
06
Million Rs. %
1,565
1,825
1,508
1,608
2,833
52
45
36
32
47
Million Rs. %
1,223
1,980
2,892
3,261
3,765
41
49
59
61
47
Million Rs. %
2,992
4,082
4,658
5,263
7,038
100
100
100
100
100
2007
2008
2009
2010
2011
Over all composition of sales revenue remained growth oriented and shot up in value added category particularly in fabric and generally in home textiles. Comparison of the total sales revenue composition with previous year is given as below:
Particulars2011 2010 Change
Million Rs. ( % )
Yarn
Fabric
Home Textile
Trading
Others
3,213
3,351
3,765
4,097
333
3,833
2,115
3,261
2,348
306
(16)
58
15
74
9
Million Rs.
Total sales revenue 14,759 10,863 36
A summarized performance of each of the segments is as below:
Annual Report 201112

Particulars2011 2010 Change
Million Rs. ( % )
Raw materialsCloth and yarn purchasedWeaving and processing chargesFuel and power
4,691.5991,558.574
544.0561,135.444
2,848.2551,204.721
376.585976.608
65294416
Million Rs.
Cost of sales:
Cost of sales of the company was up by 42.40% owing to increased input costs which increased by Rs.3,987.999 million from the last financial year (increased from Rs.9,406.644 million in 2010 to Rs.13,394.643 million during the year 2011). Main factors which were responsible for heightening of cost are as below:
Operational performance:
Cotton and polyester prices rose to record levels by setting new highs of Rs.14,000/ maund and Rs.196/ kg respectively as against Rs.4,800/ maund and Rs.139/ kg in last financial year. But over all consumption of both these inputs was lower as higher prices required increased investment in terms of enhanced short term borrowing at high rate of borrowing.
Yarn and fabric purchases were lower due heavy investment but quantum of weaved fabric jumped by 40.90% (from 16.178 million meters in last year to 22.795 million meters) and similar trend was witnessed in weaving charges which were higher by 23.54% during the year in comparison to previous year's rates.
Fuel cost increased on higher oil prices along with higher use of HFO, diesel along with consumption of LPG during gas load shedding. Unlike other competitors the company resorted to expensive fuel consumption for power generation due no WAPDA connection. In general average rates of fuels were also higher as detailed below:
Particulars2011 2010 Variance
(Rupees)
HFO rate- TonDiesel rate- TonGas rate- m3
50,09466,09012.91
40,55260,89011.48
9,5425,2001.43
( % )(Rupees) (Rupees)
249
13
Particulars2011 2010 Variance(Qty)
HFO- TonDiesel oil- TonGas- Million m3
8,1162,012
20,580
6,6021,184
30,989
1,514828
(10,409)
( % )
2370
(34)
Year long gas outages also increased consumption of expensive fuels as per below:
Particulars2011 2010 Change
Million Rs. ( % )
Sales revenueGross profitOperating costsOther operating incomeFinance costProfit before taxTaxationProfit after taxShare of profit/ (loss) associate
14,7591,365
88517952713210032
(151)
10,8631,457
731185567344119225120
36-621-3-762
-16-86
-226
Million Rs.
Summarized financial results for the year 2011 were as below:
Net after tax (loss) / profit (119) 345 -134
Moreover, unprecedented gas curtailments which persisted all along the year contrary to previous years when it was in winter only. Gas curtailment days during the year were increased to 126 days as against only 55 days during last year. These higher curtailments caused enormous loss not only by increasing energy and utilities cost by opting HFO, diesel and LPG use and also halted operations during last Qtr when shut down losses were rather preferred over use of expensive fuel; which would have additional burden along with decline in margins.
Other costs including stores consumption, maintenance and insurance increased due higher inflationary impact.
On increased working capital requirements due raw material prices the average use of borrowing level of the company increased by Rs. 962 million (from Rs. 6,114 million to Rs. 7,076 million) but average mark up rateswere down from 8.72% during last year to 7.45% in the FY 2011. This was the result of higher borrowing mix of use of US $ loans and finances provided by SBP under ERF and LTTF schemes. Almost whole of profit earned till March 2011 in 09 months of the FY 2011 was wiped out in 4th Qtr through very adverse business circumstances and company was able to close its FY at a very meager net after tax profit of Rs. 32.067 million as against Rs. 224.648 million in the last year; which was down by 85.72% over corresponding period of previous year.
(Qty) (Qty)
Annual Report 2011 13

Operational review:
Frequent and yearlong energy outages particularly in our case gas curtailments severally hampered the operational performance of the company. Despite using expensive fuels like HFO, Diesel oil and LPG to smooth out process the production results remained subdued and far below the levels achieved during last year.Company had to depend on outsourcing of processes of various products to fulfill its export commitments. This shift of trend not only increased order execution time but also put extra burden unabsorbed fixed costs for underutilizing its own processes.
Operational performance of different process of the company in comparison to previous year was as below:
Company has sizeable capacity available to utilize all of semi finished products in upstream processes but lack of WAPDA energy connection and unavailability of gas is hampering efficiency of these processes. Spinning capacity provides natural hedge for value added goods against swings in raw material prices and reduces dependence on outsourcing as well as extra cost. This fact is eminent from table of last 05 years data as given below:
Particulars2011 2010 Decrease
( % )
Spinning:Yarn converted into 20's (000 kgs) 31,521 36,281 13
( Qty ) ( Qty )
Weaving:Fabric converted into 50 picks(000 Sq Meters)
Processing:Fabric processed(000 in linear meters)
Home Textiles:Fabric stitched (000 in linear meters)
62,361 75,527 23
33,006 35,551 7
17,476 21,282 18
These processes were severally affected in 4th Qtr which was worst from all respects as decline in selling prices, depressed sales on sluggish demand, unavailability of gas and shutdowns deteriorated performance of FY 2011.
Year
a) Yarn (in '000' Kgs):
Available for useSold(%)Used in weaving(%)
Predominant factor in reduction of volumes in 2011 was mainly high raw material prices, constrained availability of Banking facilities and the major cause was enhanced as well as continued yearlong gas outages. Barring gas factor the company is fully equipped to manage sizeable growth in operational performance.
Compliance to good governance, laws,social and environmental requirements:
The company is committed to fulfill its responsibilities in adhering to governance, legal including local and international, social and environmental responsibilities and commitments. It has been pioneer to implementing the aforesaid requirements and maintains a transparent and sustainable corporate set up to exhibit and promotes this culture throughout the performance by its management and employees. These are demonstrated by giving clear way forward through the guidance in policies, rules and regulations framed and implemented in true letter and spirit.
b) Grey fabric (in '000' Mtrs):
Available for useSold(%)Used in processing(%)
c) Processed fabric (in '000' Mtrs):
Available for useSold(%)Used in home textile(%)
2007
23,82212,408
5211,414
48
16,3275,077
3111,249
69
29,29416,994
5812,301
42
2008
25,79811,974
4613,824
54
26,0048,214
3217,790
68
34,71914,539
4220,179
58
2009
24,99912,315
4912,684
51
27,234 7,348
2719,886
73
34,13511,234
3322,900
67
2010
25,06412,581
5012,483
50
24,1257,006
2817,119
72
35,47711,026
3124,451
69
2011
22,4919,205
4113,286
59
20,0904,788
2415,302
76
31,12211,011
3520,111
65
Annual Report 201114

Company places high priority to these standards which are internally and externally monitored through the teams of experts, internal and external audit teams consisting compliance experts appointed by customers, local and international legal bodies. To protect health and safety of employees and environment the company provides able conditions and means to ensure compliance.
The company has established, implemented, and maintained systems in compliance with the requirements of international standards and achieved and granted third party certifications through the accredited agencies for the following product, management and environmental systems standards:
ISO 9001:2008ISO 14001:2004C-TPAT/ GSVOE 100GOTSOeko-Tex 100Oeko-Tex 100SUPIMASA 8000BCISADEX
Quality Management SystemsEnvironment Management SystemsSecurity Management SystemsProduct Standards, Organic ExchangeProduct Standards, Global Organic TextilesProduct Standards for Fabric, Human EcologyProduct Standards for Home TextilesCertification for use SUPIMA CottonSocial accountabilityBetter Cotton InitiativeAudit Data Bank for sharing with customers
Contribution to national exchequer:
During the financial year, the company contributed Rs 199 million to the national exchequer in the shape of direct and indirect taxes and earned valuable foreign exchange of US $ 129 million through the export of its products.
Human resource and industrial relations:
The company provides a dignified and respectable work environment for all employees. This is demonstrated at all levels beyond any racism, cast, sex or religion criteria and respects human rights ethics and standards. Appropriate opportunity is provided to employees to participate in CBA activities and elect representatives of their choice under free and fair environment.
expenses Hajj for 06 employees each year with 15 paid holidays, allows maternity leaves to females employees, distributes cycle, fan, sewing machines on easy instalments and has arranged FP Shop/ Utility Stores, School Bus and Canteen facilities. To address grievances of employees a Work Council has established which conducts regular meetings. Company is also maintaining Workers Welfare Funds from where needy / distressed employees are helped besides it has full coverage of employees under the Group Insurance Scheme. It ensures on job health and safety protection measures for employees and also has arranged Frist Aid Facility and a Dispensary to tackle minor incidents along with Social Security Protection for all the work force as well as 24 hours Ambulance facility for handling emergent and serious cases of employees and their dependence.
Under the terms of agreement executed each year with CBA employees are provided financial aid for marriage of daughters and funeral expenses and also some kind of financial help to very needy cases. Company has been providing residential facilities to all its essential employment with free provision of utilities according to cadre and status. To perform religious and sports affairs the company has mosque, club and ground inside its mills colony. For leaning and growth of employees in-house and outside training courses are arranged while immediately on their hiring and then during the job.
To keep work friendly environment the company has set procedures, rules and regulations which regulate employment guidance. Harmonious working environment and cordial industrial relations prevailed during the year. The operations of the company were carried out keeping in view the dignity, respect, support, protection as per national and international standards set to meet the working environment. All workmen performed their duties and jobs at standard hours and if they were required to put extra workings to meet the exigencies and to fill man power shortage they were compensated and paid per the legal criteria. There were no such complaints of any work abuses or not fulfilling their requirements. They were provided usual working environment and work relations climate remained very cordial.
Under the agreement with CBA company pays incentive bonuses besides profit bonus, bears
Annual Report 2011 15

Information technology:
Company has in-house ERP set up to support and provide automated data based information for monitoring routine and overall performance of various segments of the organization. This is generated through LAN and OF (Oracle Financial) modules. The existing setup was enhanced with attachment of other modules like PIS (Purchase and Inventory System) Pay Roll & HR module. Professional teams are working on other modules to encompass with OF which will enhance capability of existing ERP set up. Meanwhile from next financial year company has already implement OF R12 which is of advance version with better options to work with by eliminating weaknesses observed in the earlier version.
To protect and preserve IT based data storage required servers have placed which are upgraded to accommodate increased data and flow of information. Company allocates sizeable funds on this account for soft and hard ware procurement in order to update its performance under current highly sophisticated business environment.
Corporate Social Responsibility (CSR):
The company is well aware of its corporate social responsibility and has been contributing and participating to this cause to improve quality of life of the people of country. Company regularly provides donations on annual basis to the reputable as well genuine institutions which are running charitable and welfare projects. Besides contributing for construction of extension Block of the school run by Citizen Foundation (CF) company has been providing annual running expenses of two schools of the foundation at Faisalabad and Chiniot. Company is equal opportunity employer for all classes of society and has engaged number of female employees in its various operational segments along with handicapped persons at appropriate positions.
Company also considers highly important to help distressed and disastrous affected people and always rose to such occasions. During the year it helped in kind and monetarily to flood affected people directly and indirectly through different people and institutions. On philanthropy services the contribution for year was Rs.13.962 million as against Rs.4.394 during last year.
internal control systems, policies and various regulations framed. This department is headed by qualified Head of Internal Audit Department reporting to the Chief Executive and Audit Committee of the Board of Directors.
This department functions directly under supervision of the Chief Executive and perform its functions under his guidance. The scope of work of the department is clearly defined as audit plan is put up to the committee for the next period to view business risk assessment to evaluate effectiveness and efficiency operations and various internal control systems. Audit reports and findings are regularly discussed in the Audit Committee meetings which are submitted to the Chief Executive after completion of audit for evaluation and taking required decisions in view of priority of the issues highlighted in the audit reports.
Changes in Board of Directors:
Upon election of Board on May 16, 2011 Mr. Ahsan Mehanti, Mr. Khurram Mazhar Karim and Mr. Zeshan Afzal have been elected for the next 03 years term starting from May 17, 2011 to May 16, 2014. New directors have been elected in place of Mr. Ahmad Shafi and Mr. Tariq Shafi.
The Board welcomes the new directors and places on record its appreciation for the valuable contribution made by outgoing directors during their tenure.
Future prospects and plans:
Business outlook is very challenging as energy crises, widening gap between demand and supply of gas has been badly affecting manufacturing sector. Unlike previous years when gas curtailments were restricted to winter seasons now these have been used throughout the year. Overall performance of the industry now hinges on improvement of energy situation as otherwise use of expensive fuel and LPG is not viable under current scenario. Cotton outlook is so far promising and effects of recent floods in Sind lack severity as per recent estimates of Food and Agriculture Department. In recent past prices of cotton have shown volatility due heavy rains and supply constraints. But currently cotton prices are showing stable trend as depreciating PKR is positive for exports. EU trade incentives will play positive role for industry if approved as India is likely to withdraw its opposition due improving trade relations with Pakistan.
Internal Audit and review system:
An Internal Audit Department functions in company independently for review and monitoring of various
Annual Report 201116

S#
01020304050607080910
Director's Name
Mr. Muhammad AnwarMr. Ahmad ShafiMr. Khalid BashirMr. Muhammad ArshadMr. Muhammad Asif- Nominee NITMr. Nasir ShafiMr. Tariq ShafiMr. Ahsan MehantiMr. Khurram Mazhar KarimMr. Zeshan Afzal
MeetingsAttended
535554-111
To stem gas shortage effects LPG arrangement has been made for export order processing which will help to some extent but makes our products in competitive so, future performance of the company will be influenced with gas issue. Company has also applied for WAPDA connection for electricity which is in process and will save high energy generation cost on HFO, when available.
Despite above limitation your company has shown resilience to perform in difficult times and endeavors to overcome these challenges through improved operational performance and cost saving efforts in future.
Appropriations:
In view low profitability and funds requirement for future commitment no dividend is being distributed this year. During the year company has negative earning Rs. 2.41 per share, mainly on account of share of loss from associate as against earning of Rs. 7.00 per share in year 2010.
Corporate Governance and Financial Frame work:
Board was actively involved in performing their duties including those required to be performed under the Companies Ordinance, 1984 and Memorandum and Articles of Association of the company with ultimate objective of safeguarding the interests of the shareholders, enhancing profitability of the company, increasing shareholders' wealth and promoting market confidence. As required under the Code of Corporate Governance dated March 28,2002, the Board is pleased to state that:
Financial statements prepared by the management represent fairly and accurately company's state of affairs, results of its operation, cash flows and changes in equity.Proper books of accounts have been maintained.Appropriate accounting policies have been consistently applied in preparation of financial statements and any changes in accounting policies have been disclosed in the financial statements. The accounting estimates are based on reasonable and prudent judgment.International Accounting Standards as applicable in Pakistan have been followed in preparation of financial statements and any departure there from has been adequately disclosed.
a.
b.
c.
d.
System of internal control is sound in design and has been effectively implemented and being monitored continuously. On-going review will continue in future for further improvement in controls.The company has sound potentials to continue as going concern.There has been no material departure from best practices of corporate governance.Information about outstanding taxes and levies is given in Notes to the Accounts.Transactions undertaken with related parties during the financial year have been ratified by the Audit Committee and approved by the Board.The value of investment in respect of Employees Provident Fund was Rs.671.299 million in 2010.During the year under review, five (05) meetings of the Board were held and following were in attendance:
e.
f.
g.
h.
i.
j.
k.
Leave of absence was granted to the directors who could not attend the Board meetings.
To the best our knowledge, Directors, CEO, CFO and Company Secretary, company's auditors, their spouses and minor children have not undertaken any trading of company's shares.
l.
Post balance Sheet Events:
There was no significant balance sheet event which warrants mention in the Directors' Report.
Audit Committee:
The committee comprises of three members, two of them are non-executive directors including Chairman and one is independent non executive director. The committee meets every quarter for review of audit reports, interim and annual financial results prior to the approval of the Board.
Annual Report 2011 17

Investment in 'Preference Shares' ofCrescent Bahuman Limited- CBL.
During the year long term loan of the company of Rs. 1,976 million to Crescent Bauman Limited, an associate of the company, has been converted into PreferenceShares of the investee company.
Pattern of shareholding:
A statement showing the pattern of shareholding of the company as at June 30,2011 is included in these financial statements.
The terms of Preference Shares as approved by the shareholders are 5%, unlisted, non- voting, cumulative, participatory and convertible preference shares of Rupees 10 each.
Auditors:
The auditors M/s. Riaz Ahmad & Co., Chartered Accountants, retire and offer themselves for re-appointment for the year 2011.
Key operating financial highlights:
Financial data of the last six (06) years is attached.
Acknowledgements
I take this opportunity to thank the Board of Directors, Management and employees of the company for their efforts and support of bankers, customers, vendors and all other stake holders for achieving this performance which faced many challenges under very difficult business conditions.
(Muhammad Anwar)Chief Executive Officer
For and on behalf of the Board of Directors
Annual Report 201118
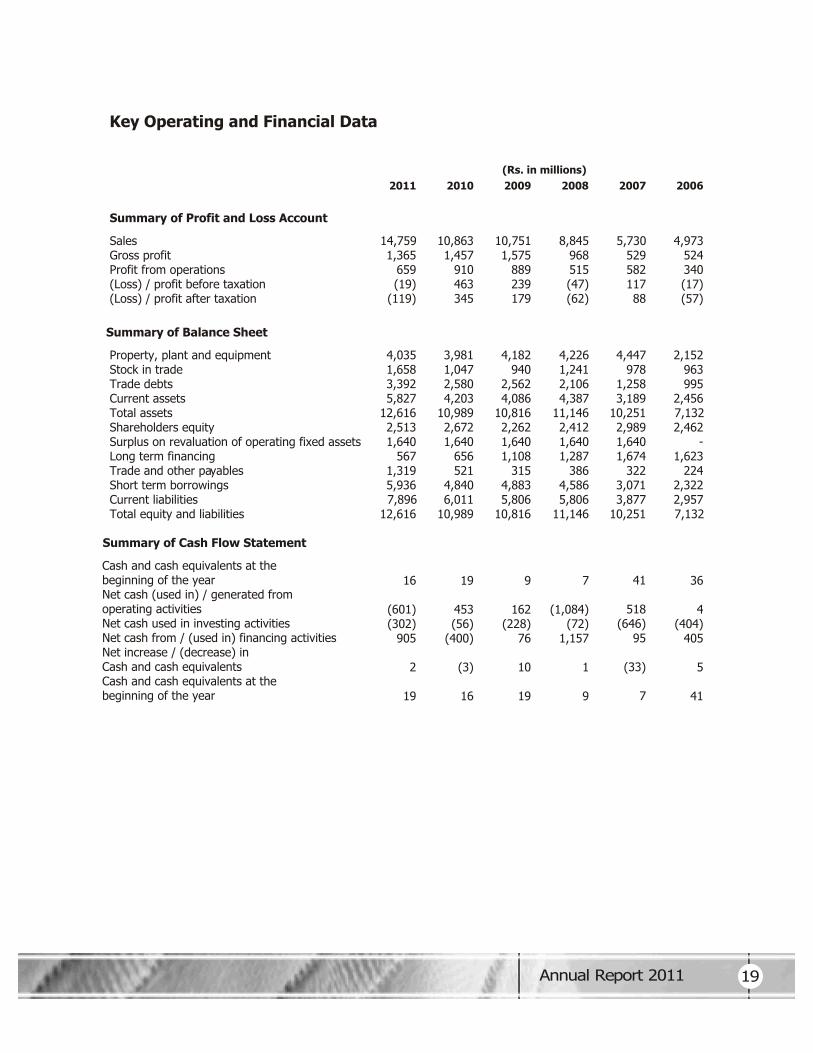
Key Operating and Financial Data
Summary of Profit and Loss Account
20062011 2010 2009 2008 2007
Sales Gross profit Profit from operations (Loss) / profit before taxation (Loss) / profit after taxation
14,759 1,365 659 (19) (119)
10,863 1,457 910 463 345
10,751 1,575 889 239 179
8,845 968 515 (47) (62)
5,730 529 582 117 88
4,973 524 340 (17) (57)
(Rs. in millions)
Summary of Balance Sheet
Property, plant and equipment Stock in trade Trade debts Current assets Total assets Shareholders equity Surplus on revaluation of operating fixed assets Long term financing Trade and other payables Short term borrowings Current liabilities Total equity and liabilities
4,035 1,658 3,392 5,827
12,6162,5131,640
567 1,319 5,936 7,896 12,616
3,981 1,047 2,580 4,203
10,9892,6721,640
656 521 4,840 6,011 10,989
4,182 940 2,562 4,086
10,8162,2621,6401,108
315 4,883 5,806 10,816
4,226 1,2412,106
4,387 11,1462,4121,6401,287
386 4,586 5,806 11,146
4,447 978
1,258 3,189
10,2512,9891,6401,674
322 3,071 3,877 10,251
2,152 963995
2,456 7,1322,462
-1,623
224 2,322 2,957 7,132
Summary of Cash Flow Statement
Cash and cash equivalents at the beginning of the yearNet cash (used in) / generated fromoperating activitiesNet cash used in investing activitiesNet cash from / (used in) financing activitiesNet increase / (decrease) inCash and cash equivalentsCash and cash equivalents at the beginning of the year
16
(601)(302)
905
2
19
19
453(56)
(400)
(3)
16
9
162(228)
76
10
19
7
(1,084)(72)
1,157
1
9
41
518(646)
95
(33)
7
36
4(404)
405
5
41
Annual Report 2011 19

2011
9.25 (0.80)
5.16(141)
(4.72) (1.32)
Profitability RatiosGross profit ratioNet profit to salesEBITDA margin to sales *Operating leverage ratioReturn on equityReturn on capital employed
Performance Indicators
%%%%%%
2010
13.413.17
11.90(218)
12.904.00
2009
14.651.67
12.37 4007.912.07
2008
10.95 (0.70)
9.77 (5)
(2.56) (0.74)
2007
9.241.53
14.71 4672.941.18
2006
10.54 (1.15) 10.71(138)
(2.32) (0.87)
0.740.510.230.98
Liquidity RatiosCurrent ratioQuick ratioCash to current liabilitiesCash flow from operations to sales
TimesTimes
%%
0.700.500.27
10.68
0.700.510.339.39
0.760.500.15
(4.62)
0.820.520.19
17.47
0.830.441.375.63
10 37 5
74 15 24
1.173.66 87
Activity / Turnover RatiosInventory turnoverNumber of days in inventoryDebtor turnoverNumber of days in receivablesCreditors turnoverNumber of days in payablesTotal assets turnoverProperty, plant and equipment turnoverOperating cycle
TimesDays
TimesDays
TimesDays
TimesTimesDays
9 39 4
86 23 16
0.992.73 109
8 43 5
79 27 14
0.992.57 109
7 51 5
69 23 16
0.792.09 105
5 68 5
72 19 19
0.561.29 121
5 80 5
75 15 25
0.702.31 131
(2.41) (6.59)
- - - - -
15.90 28.00 13.25 51.06 84.40
Investment / Market RatioBasic and diluted earning /(loss) per share **Price earning ratioDividend Yield ratio ***Dividend Payout ratio ***Dividend Cover ratio ***Cash dividend ***Stock dividend ***Market value per share- At the end of the year- Highest during the year- Lowest during the yearBreak up value w/o surplus on revaluationBreak up value with surplus on revaluation
RsTimes
%%
Times%%
RsRsRsRsRs
7.003.086.95
21.424.67
15.00 -
21.57 34.26 18.79 54.31 87.64
3.646.73
- - - - -
24.50 70.10 18.50 45.96 79.30
(1.25) (46.67)
- - - - -
58.52 75.00 48.75 49.02 82.35
1.78 38.67
1.45 56.04
1.78 -
10.00
69.00 70.90 16.60 60.74 94.08
(1.16) (19.42)
4.44 (86.30) (1.16)
- 10.00
22.50 54.80 21.70 50.03 50.03
2.738.24
22.550.96
Capital Structure RatiosFinancial leverage ratioWeighted average cost of debtLong term debt to Equity ratioInterest Cover ratio
Times%%
Times
2.239.22
24.561.82
2.81 12.93 48.99
1.29
2.60 10.77 53.37
0.92
1.719.90
55.991.25
1.738.68
65.930.95
* EBITDA stands for earning before interest, taxes, depreciation and amortization.** The basic and diluted earning / (loss) per share for the year 2006 and 2007 have been restated to take into account the
effect of issue of bonus share.*** This includes final dividend recommended by Board of Directors subsequent to year end.
Annual Report 201120

Statement of Compliance with Best Practices of Code of Corporate Governance
This statement is being presented to comply with the Code of Corporate Governance contained in Listing Regulations of Karachi, Lahore and Islamabad Stock Exchanges for the purpose of establishing a framework of good governance, whereby a listed company is managed in compliance with the best Practices of Corporate Governance.
1. The Company encourages representation of independent non-executive Directors and directors representing minority interests on its Board of Directors. At present the Board includes one executive Director, four non-executive Directors and three independent non executive Director but no Directors representing minority interest.
The Company has applied the principles contained in the Code in the following manner:
2. The Directors have confirmed that none of them is serving as a Director in more than ten listed companies.
3. All the resident Directors of the Company are registered as taxpayers and none of them has defaulted in payment of any loan to a banking company, a DFI or an NBFI or, being a member of a stock exchange, has been declared as a defaulter by that stock exchange.
4. No casual vacancy has occurred in the Board during the year ended 2011.
5. Statement of Ethics and Business Practices has been circulated to directors and employees.
6. The Board has developed a vision/mission statement, overall corporate strategy and significant policies. A complete record of particulars of significant policies along with the dates on which they were approved or amended has been maintained.
7. All the powers of the Board have been duly exercised and decisions on material transactions, including appointment and determination of remuneration, terms and conditions of employment of the CEO have been taken by the Board.
8. The meetings of the Board are presided over by the Chairman and the Board meets at least once in every quarter. Written notices of the Board meetings, along with agenda and working papers, are circulated at least seven days before the meetings. The minutes of the meetings are appropriately recorded and circulated.
9. Directors of the company have participated in Orientation Course at group level to apprise them of their duties and responsibilities. Director(s), who have not participated in these, have been apprised and adequately briefed.
10. The Board has approved the terms of appointment and remuneration of Chief Financial Officer (CFO), Corporate Secretary and Head of Internal Audit as determined by the CEO.
Annual Report 2011 21

(Muhammad Anwar)Chief Executive Officer
On behalf of the Board
11. The Directors' report for this year has been prepared in compliance with the requirements of the Code and fully describes the salient matters required to be disclosed.
12. The financial statements of the Company were duly endorsed by CEO and CFO before approval by the Board.
13. The Directors, CEO and Executives do not hold any interest in the shares of the Company other than that disclosed in the pattern of shareholding.
14. The Company has complied with all the corporate and financial reporting requirements of the Code.
15. The Board has formed an Audit Committee. It comprises three members, all of them are non-executive Directors including the Chairman of the Committee except one independent non-executive Director.
16. The meetings of the audit committee were held at least once in every quarter prior to approval of interim and final results of the Company and as required by the Code. The terms of reference of the Committee have been formed and advised to the Committee for compliance.
17. The Board has set-up an effective internal audit function manned by suitably qualified and experienced personnel who are conversant with the policies and procedures of the Company and they are involved in the internal audit function on a full time basis.
18. The statutory auditors of the Company have confirmed that they have been given a satisfactory rating under the Quality Control Review program of the Institute of Chartered Accountants of Pakistan, that they or any of the partners of the firm, their spouses and minor children do not hold shares of the Company and that the firm and all its partners are in compliance with International Federation of Accountants (IFAC) guidelines on code of ethics as adopted by the Institute of Chartered Accountants of Pakistan.
19. The statutory auditors or the persons associated with them have not been appointed to provide other services except in accordance with the listing regulations and the auditors have confirmed that they have observed IFAC guidelines in this regard.
20. The related party transactions have been placed before the audit committee and approved by the Board of Directors along with pricing method for transactions carried out on terms equivalent to those that prevail in the arm's length transaction.
21. We confirm that all other material principles contained in the Code have been complied with.
Annual Report 201122

Review Report to the Members on Statement of Compliancewith Best Practices of Code of Corporate Governance
We have reviewed the Statement of Compliance with the best practices contained in the Code of Corporate Governance prepared by the Board of Directors of THE CRESCENT TEXTILE MILLS LIMITED (“the Company”) for the year ended 30 June 2011 to comply with the Listing Regulations of the respective Stock Exchanges, where the Company is listed.
The responsibility for compliance with the Code of Corporate Governance is that of the Board of Directors of the Company. Our responsibility is to review, to the extent where such compliance can be objectively verified, whether the statement of compliance reflects the status of the Company's compliance with the provisions of the Code of Corporate Governance and report if it does not. A review is limited primarily to inquiries of the Company personnel and review of various documents prepared by the Company to comply with the Code.
As part of our audit of financial statements, we are required to obtain an understanding of the accounting and internal control systems sufficient to plan the audit and develop an effective audit approach. We are not required to consider whether the Board's statement on internal control covers all risks and controls, or to form an opinion on the effectiveness of such internal controls, the Company's corporate governance procedures and risks.
Further, Listing Regulations of the Karachi, Lahore and Islamabad Stock Exchanges require the Company to place before the Board of Directors for their consideration and approval related party transactions distinguishing between transactions carried out on terms equivalent to those that prevail in arm's length transactions and transactions which are not executed at arm's length price recording proper justification for using such alternate pricing mechanism. Further, all such transactions are also required to be separately placed before the audit committee. We are only required and have ensured compliance of requirement to the extent of approval of related party transactions by the Board of Directors and placement of such transactions before the audit committee. We have not carried out any procedures to determine whether the related party transactions were undertaken at arm's length price or not.
Based on our review, nothing has come to our attention, which causes us to believe that the Statement of Compliance does not appropriately reflect the Company's compliance, in all material respects, with the best practices contained in the Code of Corporate Governance as applicable to the Company for the year ended 30 June 2011.
Date: October 05, 2011Faisalabad
RIAZ AHMAD & COMPANYChartered Accountants
Name of engagement partner:Liaqat Ali Panwar
Annual Report 2011 23

No. ofShareholders
Shareholding
From To
TotalSharesHeld
No. ofShareholders
Shareholding
From To
TotalSharesHeld
1774 49,209,922
Categories of Shareholders
G. Total
Total
Number Shares Held Percentage
1,774
12
49,209,922 100.00
0.02
Financial InstitutationIndividualInsurance CompaniesJoint Stock CompaniesAssociated CompaniesMutual FundsModaraba & Modaraba CosExecutivesOthers
81,693
4418224
12
811,057 18,868,709 1,859,986 7,288,343
17,003,809 1,467,446
31,719 1,867,495 11,358
1.6538.343.78
14.8234.562.980.063.790.02
OthersAbondand PropertyAssociationNon ResidentTrust
3153
503 13
5,128 5,714
0.000.000.010.01
11,358
Pattern of Shareholding - (Form “34”)as at June 30, 2011
3111131211111111221111111111111111111
210,001215,001220,001230,001235,001240,001245,001260,001275,001295,001300,001305,001310,001320,001345,001375,001390,001405,001410,001415,001440,001450,001485,001510,001550,001675,001
1,030,0011,045,0011,080,0011,270,0011,295,0011,440,0011,445,0011,815,0012,060,0012,680,001
12,205,001
100500
1,0005,000
10,00015,00020,00025,00030,00035,00040,00045,00050,00055,00060,00070,00075,00080,00085,00090,00095,000
100,000110,000115,000120,000125,000140,000155,000160,000165,000170,000175,000185,000195,000200,000210,000
215,000220,000225,000235,000240,000245,000250,000265,000280,000300,000305,000310,000315,000325,000350,000380,000395,000410,000415,000420,000445,000455,000490,000515,000555,000680,000
1,035,0001,050,0001,085,0001,275,0001,300,0001,445,0001,450,0001,820,0002,065,0002,685,000
12,210,000
18,157120,962136,086760,730607,623412,538220,698294,457351,569160,174336,529341,425240,601157,094293,164266,663147,614227,969253,961264,768184,30297,312
214,171111,626235,844245,459137,973308,892314,490326,955169,484347,119183,967579,311
1,184,650418,003
635,540218,780221,981231,306239,473729,599247,570524,867276,157299,662300,027307,005313,122324,663347,862376,489789,452815,212414,675419,333440,811452,379488,951510,309552,245675,484
1,030,8611,049,7991,080,0771,271,6331,295,0311,442,0631,446,1291,819,9812,060,0682,681,875
12,207,111
5224671863198233131313598535423332121221222121362
1101501
1,0015,001
10,00115,00120,00125,00130,00135,00140,00145,00150,00155,00165,00170,00175,00180,00185,00190,00195,001
105,001110,001115,001120,001135,001150,001155,001160,001165,001170,001180,001190,001195,001205,001
Annual Report 201124

Categories of Shareholders
a) Directors, Chief Executive Officer, their Spouse and Minor Children
b) Associated Companies, Undertaking & Related Parties
c) NIT & ICP
Directors' Spouse
Chief Executive/Director
Directors
Muhammad Anwar
1,070,428
72,081
17,003,809
3,175,862
Number ofshares held
Pattern of Shareholding - (Form “34”)as at June 30, 2011
Nasir ShafiMuhammad ArshadKhurram Mazhar KarimKhalid BashirAhsan MehantiZeshan AfzalMuhammad Asif Nominee NIT
Tanveer Khalid BashirShaheen NasirAbida Anwar
Arif Habib Corporation LimitedCrescent Sugar Mills & Distillery Ltd.Crescent FoundationCrescent Steel and Allied Products Ltd.Trustees The Crescent Textile Mills Emp Provident Fund TrustPremier Insurance LimitedShakarganj Mills LimitedAhsan Associates (Pvt) Limited
National Bank of Pakistan-Trustee Department Ni(U)T FundNational Bank of PakistanNational Investment Trust LimitedInvestment Corporation of PakistanNational Bank of Pakistan Investor Accounts NdfcIdbp (Icp Unit)
510,309
239,473 212,011 83,999 24,336 200 100
-
58,802 8,157 5,122
12,207,1112,681,875
1,030,861 452,379 362,122 262,000
5,898 1,563
2,060,068 1,049,799 53,051 9,000 2,054 1,890
Annual Report 2011 25
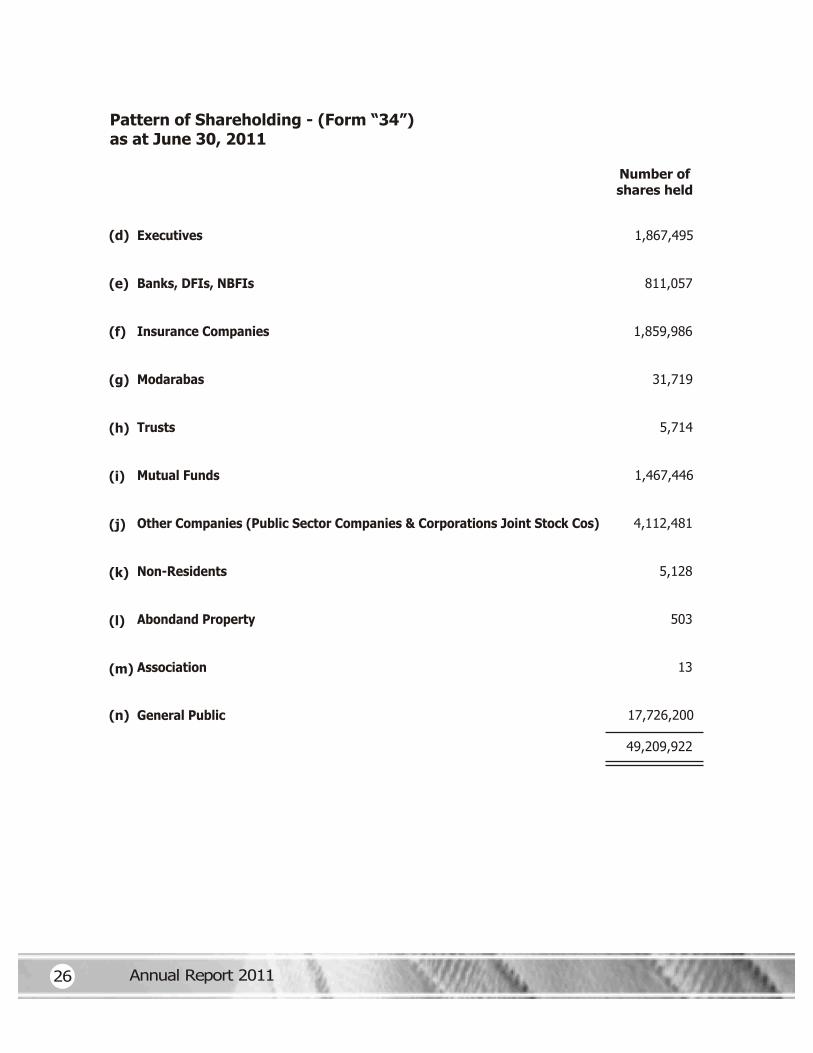
Number ofshares held
1,867,495
811,057
1,859,986
31,719
5,714
1,467,446
4,112,481
5,128
503
13
17,726,200
49,209,922
Pattern of Shareholding - (Form “34”)as at June 30, 2011
(d) Executives
Banks, DFIs, NBFIs
Insurance Companies
Modarabas
Trusts
Mutual Funds
Other Companies (Public Sector Companies & Corporations Joint Stock Cos)
Non-Residents
Abondand Property
Association
General Public
(e)
(f)
(g)
(h)
(i)
(j)
(k)
(l)
(m)
(n)
Annual Report 201126
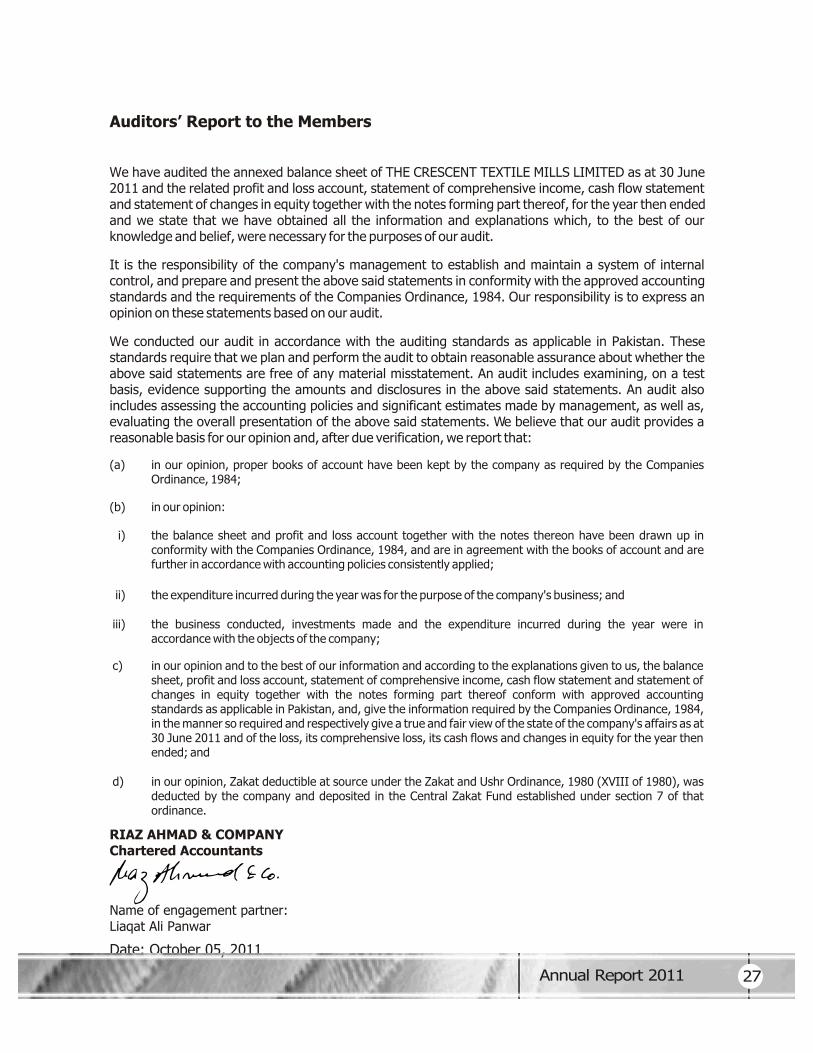
Auditors’ Report to the Members
We have audited the annexed balance sheet of THE CRESCENT TEXTILE MILLS LIMITED as at 30 June 2011 and the related profit and loss account, statement of comprehensive income, cash flow statement and statement of changes in equity together with the notes forming part thereof, for the year then ended and we state that we have obtained all the information and explanations which, to the best of our knowledge and belief, were necessary for the purposes of our audit.
(a) in our opinion, proper books of account have been kept by the company as required by the Companies Ordinance, 1984;
It is the responsibility of the company's management to establish and maintain a system of internal control, and prepare and present the above said statements in conformity with the approved accounting standards and the requirements of the Companies Ordinance, 1984. Our responsibility is to express an opinion on these statements based on our audit.
We conducted our audit in accordance with the auditing standards as applicable in Pakistan. These standards require that we plan and perform the audit to obtain reasonable assurance about whether the above said statements are free of any material misstatement. An audit includes examining, on a test basis, evidence supporting the amounts and disclosures in the above said statements. An audit also includes assessing the accounting policies and significant estimates made by management, as well as, evaluating the overall presentation of the above said statements. We believe that our audit provides a reasonable basis for our opinion and, after due verification, we report that:
(b) in our opinion:
i) the balance sheet and profit and loss account together with the notes thereon have been drawn up in conformity with the Companies Ordinance, 1984, and are in agreement with the books of account and are further in accordance with accounting policies consistently applied;
ii) the expenditure incurred during the year was for the purpose of the company's business; and
iii) the business conducted, investments made and the expenditure incurred during the year were in accordance with the objects of the company;
c) in our opinion and to the best of our information and according to the explanations given to us, the balance sheet, profit and loss account, statement of comprehensive income, cash flow statement and statement of changes in equity together with the notes forming part thereof conform with approved accounting standards as applicable in Pakistan, and, give the information required by the Companies Ordinance, 1984, in the manner so required and respectively give a true and fair view of the state of the company's affairs as at 30 June 2011 and of the loss, its comprehensive loss, its cash flows and changes in equity for the year then ended; and
d) in our opinion, Zakat deductible at source under the Zakat and Ushr Ordinance, 1980 (XVIII of 1980), was deducted by the company and deposited in the Central Zakat Fund established under section 7 of that ordinance.
Date: October 05, 2011Faisalabad
RIAZ AHMAD & COMPANYChartered Accountants
Name of engagement partner:Liaqat Ali Panwar
Annual Report 2011 27

Balance Sheet as at June 30, 2011
1,000,000
492,099
2,020,7862,512,885
1,640,388
512,086 54,621
- 566,707
1,318,565 140,717
5,935,690 350,401 151,068
12,616,421
1,000,000
492,099
1,640,407
521,393 106,719
4,840,018 451,668 90,890
10,988,698
2011 2010
Note
EQUITY AND LIABILITIES
Share capital and reserves
100 000 000 (2010: 100 000 000) ordinary shares of Rupees 10 each
Issued, subscribed and paid up share capital
ReservesTotal equity
Surplus on revaluation of operating fixed assets -net of deferred tax
Non-current liabilities
Long term financingLiabilities against assets subject to finance leaseDeferred income tax liability
Current liabilities
Trade and other payablesAccrued mark-upShort term borrowingsCurrent portion of non-current liabilitiesProvision for taxation
Total liabilities
Contingencies and commitments
The annexed notes form an integral part of these financial statements.
3
4
5
678
9101112
13
(Rupees in thousand)
(Muhammad Anwar)Chairman & Chief Executive
2,180,3402,672,439
656,351-
8,813 665,164
7,896,4418,463,148
6,010,6886,675,852
TOTAL EQUITY AND LIABILITIES
Authorised share capital
LIABILITIES
Annual Report 201128

4,034,955451,550
2,255,4342,7272,520
42,351 6,789,537
3,981,181617,870255,197
1,928,720 2,827
- 6,785,795
Note ASSETS
Non-current assets
Property, plant and equipmentInvestment in an associateLong term investmentsLong term loans and advancesLong term deposits and prepaymentsDeferred income tax - asset
141516171819
160,147 1,658,003 3,391,911
309,06267,1042,806
181,87637,44418,531
5,826,884
12,616,421
169,769 1,047,150 2,579,901
224,556 5,956
-109,44649,70616,419
4,202,903
10,988,698
Current assets
Stores, spare parts and loose toolsStock-in-tradeTrade debtsLoans and advancesShort term deposits and prepaymentsAccrued interestOther receivablesShort term investmentsCash and bank balances
TOTAL ASSETS
2021222324
252627
2011 2010(Rupees in thousand)
(Khalid Bashir)Director
Balance Sheet as at June 30, 2011
Annual Report 2011 29

Note
14,759,257
13,394,641
1,364,616
641,183
202,898
40,874
884,955
479,661
179,043
658,704
527,172
(150,712)
(19,180)
99,465
(118,645)
(2.41)
10,863,386
9,406,644
1,456,742
470,413
182,018
78,816
731,247
725,495
184,767
910,262
566,793
120,022
463,491
118,821
344,670
7.00
Sales
Cost of sales
Gross profit
Distribution cost
Administrative expenses
Other operating expenses
Other operating income
Profit from operations
Provision for taxation
(Loss) / profit after taxation
Finance cost
Share of (loss) / profit from associate
(Loss) / profit before taxation
(Loss) / earnings per share - basic and
diluted (Rupees)
The annexed notes form an integral part of these financial statements.
28
29
30
31
32
33
34
35
36
Profit and Loss Account for the Year Ended June 30, 2011
2011 2010
(Rupees in thousand)
(Muhammad Anwar)Chairman & Chief Executive
(Khalid Bashir)Director
Annual Report 201130

(118,645) 344,670(Loss) / profit after taxation
Other comprehensive income
Statement of Comprehensive Income for the Year Ended June 30, 2011
2011 2010
(Rupees in thousand)
(Muhammad Anwar)Chairman & Chief Executive
(Khalid Bashir)Director
28,123 54,658Surplus arising on remeasurement of available forsale investments to fair value
(90,522) 399,328Total comprehensive (loss) / income for the year
The annexed notes form an integral part of these financial statements.
Annual Report 2011 31

144,193 (491,388) (153,183) (73,043) (18,935) (8,496)
307 (600,545)
(317,170)16,261
(1,195) (302,104)
147,08563,680
(401,676) 1,095,672
904,761
2,112
16,419
18,531
1,159,785 (606,758) (94,909)
(7) (4,138)
-(610)
453,363
(63,383) 6,295 1,247
(55,841)
- -
(356,845) (43,189)
(400,034)
(2,512)
18,931
16,419
Note
CASH FLOWS FROM OPERATING ACTIVITIES
Cash generated from operationsFinance cost paidIncome tax paidDividend paidWorkers' profit participation fund paidWorkers' welfare fund paidNet decrease / (increase) in long term deposits and prepaymentsNet cash (used in) / generated from operating activities
CASH FLOWS FROM INVESTING ACTIVITIES
Capital expenditure on property, plant and equipmentProceeds from sale of property, plant and equipmentNet (increase) / decrease in long term loans and advancesNet cash used in investing activities
CASH FLOWS FROM FINANCING ACTIVITIES
Proceeds from long term financingProceeds from finance lease liabilitiesRepayment of long term financingShort term borrowings - net
Net cash from / (used in) financing activities
Net increase / (decrease) in cash and cash equivalents
Cash and cash equivalents at the beginning of the year
Cash and cash equivalents at the end of the year (Note 27)
The annexed notes form an integral part of these financial statements.
37
Cash Flow Statement for the Year Ended June 30, 2011
2011 2010
(Rupees in thousand)
(Muhammad Anwar)Chairman & Chief Executive
(Khalid Bashir)Director
Annual Report 201132

Balance as at June 30, 2009
Transfer from surplus on revaluation of operating
fixed assets on account of incremental
depreciation - net of deferred tax
Share of associate's items directly credited in equity
Total comprehensive income for the year
Balance as at June 30, 2010
Final dividend for the year ended June 30, 2010
at the rate of Rupees 1.50 per share
Transfer from surplus on revaluation of operating
fixed assets on account of incremental
depreciation - net of deferred tax
Share of associate's items directly credited in equity
Total comprehensive loss for the year
Balance as at June 30, 2011
The annexed notes form an integral part of these financial statements.
(Muhammad Anwar)Chairman & Chief Executive
(Khalid Bashir)Director
Statement of Changes in Equity for the Year Ended June 30, 2011
RESERVES
CAPITALRESERVE
GeneralDividend
equalization
492,099
-
-
-
-
492,099
21,131
103,912
1,773,643
1,773,643
30,000
30,000
(55,036)
113,231
1,748,607
1,916,874
1,769,738
2,020,786
2,261,837
11,262
399,328
2,512,885
(Rupees in thousand)
SHARECAPITAL
Fair value
REVENUE RESERVES
Unappropriatedprofit /
(accumulatedloss)
Sub totalTOTAL
TOTALEQUITY
-
-
-
54,658
-
-
-
-
11,262
344,670
11,262
344,670
11,262
399,328
492,099 75,789 1,773,643 30,000 300,908 2,104,551 2,180,340 2,672,439
-
-
-
28,123
-
-
-
-
-
-
-
-
22
4,761
(73,815)
(118,645)
22
4,761
(73,815)
(118,645)
22
4,761
(73,815)
(90,522)
22
4,761
(73,815)
(90,522)
12 - - - - 12 12 12
Annual Report 2011 33

Notes to the Financial Statements for the Year Ended June 30, 2011
1. THE COMPANY AND ITS ACTIVITIES
The Crescent Textile Mills Limited (the Company) is a public limited company incorporated in Pakistan under the Companies Ordinance, 1984. The registered office of the Company is located at 40-A, Off: Zafar Ali Road, Gulberg-V, Lahore. Its shares are quoted on all the Stock Exchanges in Pakistan. The Company is engaged in business of textile manufacturing comprising of spinning, combing, weaving, dyeing, bleaching, printing, stitching, buying, selling and otherwise dealing in yarn, cloth and other goods and fabrics made from raw cotton and synthetic fiber(s) and to generate, accumulate, distribute, supply and sale ofelectricity. The Company also operates a cold storage unit.
2. SUMMARY OF SIGNIFICANT ACCOUNTING POLICIES
The significant accounting policies applied in the preparation of these financial statements are set out below. These policies have been consistently applied to all years presented,unless otherwise stated:
2.1 Basis of preparation
These financial statements have been prepared in accordance with approved accounting standards as applicable in Pakistan. Approved accounting standards comprise of such International Financial Reporting Standards (IFRS) issued by the International Accounting Standards Board as are notified under the Companies Ordinance, 1984, provisions of and directives issued under the Companies Ordinance, 1984. In case requirements differ, theprovisions or directives of the Companies Ordinance, 1984 shall prevail.
Statement of compliancea)
These financial statements have been prepared under the historical cost convention, except freehold and leasehold land measured at revalued amounts and the financialinstruments which are carried at fair value.
Accounting conventionb)
The preparation of financial statements in conformity with the approved accounting standards requires the use of certain critical accounting estimates. It also requires the management to exercise its judgment in the process of applying the Company's accounting policies. Estimates and judgments are continually evaluated and are based on historical experience and other factors, including expectations of future events that are believed to be reasonable under the circumstances. The areas where various assumptions and estimates are significant to the Company's financial statements or where judgments wereexercised in application of accounting policies are as follows:
Critical accounting estimates and judgmentsc)
Annual Report 201134

Notes to the Financial Statements for the Year Ended June 30, 2011
Estimates with respect to residual values and useful lives and pattern of flow of economic benefits are based on the analysis of the management of the Company. Further, the Company reviews the value of assets for possible impairment on annual basis. Any change in the estimates in the future might affect the carrying amount of respective item of property, plant and equipment, with a corresponding effect on the depreciation charge andimpairment.
Useful lives, patterns of economic benefits and impairments
In making the estimates for income tax currently payable by the Company, the management takes into account the current income tax law and the decisions of appellateauthorities on certain issues in the past.
Taxation
The Company reviews its receivable balances against any provision required for any doubtful balances on an ongoing basis. The provision is made while taking intoconsideration expected recoveries, if any.
Provision for doubtful debts
Amendments to published approved standards that are effective in current year and are relevant to the Company
d)
The following amendments to published approved standards are mandatory for theCompany's accounting periods beginning on or after July 01, 2010:
Net realizable value of inventories is determined with reference to currently prevailingselling prices less estimated expenditure to make sales.
Inventories
International Accounting Standard (IAS) 1 (Amendment), ‘Presentation of Financial Statements’ (effective for annual periods beginning on or after January 01, 2010). The amendment provides clarification that the potential settlement of a liability by the issue of equity is not relevant to its classification as current or non-current. By amending the definition of current liability, the amendment permits a liability to be classified as non-current (provided that the entity has an unconditional right to defer settlement by transfer of cash or other assets for at least 12 months after the accounting period) notwithstanding the fact that the entity could be required by the counterparty to settle in shares at any time. The application of the amendment does not affect the results or net assets of the Companyas it is only concerned with presentation and disclosures.
In making an estimate of recoverable amount of the Company’s investment in equitymethod accounted associated company, the management considers future cashflows.
Impairment of investment in equity method accounted associated company
Annual Report 2011 35

Notes to the Financial Statements for the Year Ended June 30, 2011
IAS 7 (Amendment), ‘Statement of Cash Flows’ (effective for annual periods beginning on or after January 01, 2010). The amendment provides clarification that only expenditure that results in a recognized asset in the balance sheet can be classified as a cash flow from investing activity. The clarification results in an improvement in the alignment of the classification of cash flows from investing activities in the cash flow statement and the presentation of recognized assets in the balance sheet. The application of the amendment does not affect the results or net assets of the Company as it is only concerned withpresentation and disclosures.
Interpretations and amendments to published approved standards that areeffective in current year but not relevant to the Company
e)
There are other new interpretations and amendments to the published approved standards that are mandatory for accounting periods beginning on or after July 01, 2010 but are considered not to be relevant or do not have any significant impact on the Company's financial statements and are therefore not detailed in these financial statements.
Standards and amendments to published approved standards that are not yet effective but relevant to the Company
f)
Following standards and amendments to existing standards have been published and are mandatory for the Company's accounting periods beginning on or after July 01, 2011 orlater periods:
IFRS 8 (Amendment), ‘Operating Segments’ (effective for annual periods beginning on or after January 01, 2010). The amendment is part of the International Accounting Standards Board's (IASB) annual improvements project published in April 2009. The amendment provides clarification that the requirement for disclosing a measure of segment assets is only required when the Chief Operating Decision Maker (CODM) reviews that information. The application of the amendment does not affect the results or net assets of the Companyas it is only concerned with presentation and disclosures.
IFRS 9 'Financial Instruments' (effective for annual periods beginning on or after January 01, 2013). This standard is the first step in the process to replace IAS 39 'Financial Instruments: Recognition and Measurement'. IFRS 9 introduces new requirements for classifying and measuring financial assets and is likely to affect the Company’s accountingfor its financial assets.
IFRS 7 (Amendment), 'Financial Instruments: Disclosures' (effective for annual periods beginning on or after July 01, 2011). The new disclosure requirements apply to transfer of financial assets. An entity transfers a financial asset when it transfers the contractual rights to receive cash flows of the asset to another party. These amendments are part of the IASB's comprehensive review of off balance sheet activities. The amendments will promote transparency in the reporting of transfer transactions and improve users’ understanding of the risk exposures relating to transfers of financial assets and the effect of those risks on an entity’s financial position, particularly those involving securitization of financial asset. The management of the Company is in the process of evaluating the impacts of the aforesaidamendment on the Company's financial statements.
Annual Report 201136

Notes to the Financial Statements for the Year Ended June 30, 2011
IFRS 12 ‘Disclosure of Interests in Other Entities’ (effective for annual periods beginning on or after January 01, 2013). IFRS 12 applies to entities that have an interest in subsidiaries, joint arrangements, associates or unconsolidated structured entities. IFRS 12 establishes disclosure objectives and specifies minimum disclosures that an entity must provide to meet those objectives. IFRS 12 requires an entity to disclose information that helps users of its financial statements to evaluate the nature of and risks associated with its interests in other entities and the effects of those interests on its financial statements. The management of the Company is in the process of evaluating the impacts of the aforesaidstandard on the Company’s financial statements.
IFRS 13 ‘Fair Value Measurement’ (effective for annual periods beginning on or after January 01, 2013). IFRS 13 establishes a single framework for measuring fair value where that is required by other standards. IFRS 13 applies to both financial and non-financial items measured at fair value. Fair value is defined as the price that would be received to sell an asset or paid to transfer a liability in an orderly transaction between market participants at the measurement date. The management of the Company is in the process of evaluatingthe impacts of the aforesaid standard on the Company’s financial statements.
IAS 1 (Amendments), ‘Presentation of Financial Statements’ (effective for annual periods beginning on or after July 01, 2012). It clarifies that an entity will present an analysis of other comprehensive income for each component of equity, either in the statement ofchanges in equity or in the notes to the financial statements.
There are other amendments resulting from annual improvements project initiated by International Accounting Standards Board in May 2010, specifically in IFRS 7 'Financial Instruments: Disclosures', IAS 1 'Presentation of Financial Statements' and IAS 24 'Related Party Disclosures' that are considered relevant to the Company's financial statements. These amendments are unlikely to have a significant impact on the Company's financialstatements and have therefore not been analyzed in detail.
Standards, interpretations and amendments to published approved standardsthat are not yet effective and not considered relevant to the Company
g)
There are other standards, amendments to published approved standards and new interpretations that are mandatory for accounting periods beginning on or after July 01, 2011 but are considered not to be relevant or do not have any significant impact on the Company's financial statements and are therefore not detailed in these financialstatements.
Employees retirement benefits2.2
The Company operates a recognized provident fund for all its permanent employees. Equal monthly contributions are made to the fund both by the Company and the employees at the rate of 6.25 percent of the basic salary plus cost of living allowance. Obligation for contributions to defined contribution plan is recognized as an expense in the profit and loss account as and when incurred. Employees are eligible under the scheme on completion ofprescribed qualifying period of service.
Annual Report 2011 37

Liabilities against assets subject to finance lease2.3
Leases, where the Company has substantially all the risks and rewards of ownership of assets are classified as finance leases. At inception, finance leases are recorded at the lower of present value of minimum lease payments under the lease agreement and the fair value of the assets. The related rental obligations, net of finance cost, are included in liabilities against assets subject to finance lease. The liabilities are classified as current and non-current depending upon the timing of the payment. Each lease payment is allocated between the liability and finance cost so as to achieve a constant rate on the balance outstanding. The interest element of the rental is charged to profit over the leaseterm.
Notes to the Financial Statements for the Year Ended June 30, 2011
Provisions are recognized when the Company has a present obligation (legal or constructive) as a result of a past event, it is probable that an outflow of resources embodying economic benefits will be required to settle the obligation and a reliableestimate can be made of the amount of the obligation.
2.4 Provisions
Dividend distribution to the Company’s shareholders is recognized as a liability in the Company’s financial statements in the period in which the dividends are declared and other appropriations are recognized in the period in which these are approved by theBoard of Directors.
2.5 Dividend and other appropriations
2.6 Taxation
Provision for current tax is based on taxable income for the year determined in accordance with the prevailing law for taxation of income. The charge for current tax is calculated using prevailing current tax rates or tax rates after taking into account rebates and tax credits, if any. The charge for current tax also includes adjustments, where considered necessary, to provision for tax made in previous years arising fromassessments framed during the year for such years.
Current
Deferred tax is accounted for using the balance sheet liability method in respect of all temporary differences arising from differences between the carrying amount of assets and liabilities in the financial statements and the corresponding tax bases used in the computation of the taxable profit. Deferred tax liabilities are generally recognized for all taxable temporary differences and deferred tax assets to the extent that it is probable that taxable profits will be available against which the deductible temporary differences,unused tax losses and tax credits can be utilized.
Deferred
Deferred tax is calculated at the rates that are expected to apply to the period when the differences reverse based on tax rates that have been enacted or substantively enacted by the balance sheet date. Deferred tax is charged or credited in the profit and loss
Annual Report 201138

Notes to the Financial Statements for the Year Ended June 30, 2011
2.7 Property, plant and equipment
Operating fixed assets and depreciation
Cost / Revalued amounta)
2.7.1
Fixed assets are stated at cost less accumulated depreciation and any identified impairment loss, except freehold land which is stated at revalued amount less anyidentified impairment loss and leasehold land which is stated at revalued amount less accumulated depreciation and any identified impairment loss. Capital work-in-progress is stated at cost less any identified impairment loss. Cost of operating fixed assets consists of purchase cost, borrowing cost pertaining to the construction / erection period referred to Note 2.14 and directly attributablecost of bringing the assets to working condition.
account, except to the extent that it relates to items recognised in other comprehensive income or directly in equity. In this case the tax is also recognised in other comprehensiveincome or directly in equity, respectively.
Valuations are performed frequently enough to ensure that the fair value of arevalued asset does not differ materially from its carrying amount.
Subsequent costs are included in the asset's carrying amount or recognized as a separate asset, as appropriate, only when it is probable that future economic benefits associated with the item will flow to the Company and the cost of the item can be measured reliably. All other repair and maintenance costs are charged toprofit and loss account during the period in which they are incurred.
Any revaluation surplus is credited to surplus on revaluation of operating fixed assets except to the extent that it reverses a revaluation decrease of the same asset previously recognized in profit or loss, in which case the increase is recognized in profit or loss. A revaluation deficit is recognized in profit or loss, except to the extent that it offsets an existing surplus on the same assetrecognized in surplus on revaluation of operating fixed assets.
An annual transfer from surplus on revaluation of operating fixed assets to unappropriated profit is made for the difference between depreciation based on the revalued carrying amount of the assets and depreciation based on the assets original cost. Upon disposal, any revaluation reserve relating to the particular asset being sold is transferred to retained earnings. All transfers from surplus on revaluation of operating fixed assets are net of applicable deferredtaxation.
Annual Report 2011 39

Notes to the Financial Statements for the Year Ended June 30, 2011
Depreciationb)
Depreciation on assets is charged from the month in which an asset is acquired while no depreciation is charged for the month in which the asset is disposedof.
Depreciation is charged to income on reducing balance method, except leasehold land on which depreciation is charged on straight line method to write off the cost of operating fixed assets over their expected useful lives at the rates mentioned inNote 14.1.
Derecognitionc)
An item of property, plant and equipment is derecognized upon disposal or when no future economic benefits are expected from its use or disposal. Any gain or loss arising on derecognition of the asset (calculated as the difference between the net disposal proceeds and carrying amount of the asset) is included in profit and lossaccount in the year the asset is derecognized.
Assets subject to finance lease2.7.2
These are initially recognized at lower of present value of minimum lease payments under the lease agreements and fair value of assets. Subsequently, these assets are stated at cost less accumulated depreciation and any identified impairment loss. Assets so acquired are depreciated over their expected useful lives. Depreciation of leasedassets is charged to profit and loss account.
Depreciation on additions to leased assets is charged from the month in which an asset is acquired while no depreciation is charged for the month in which the asset is disposedof.
Assets subject to operating lease2.7.3
Leases, where a significant portion of the risks and rewards of ownership are retained by the lessor are classified as operating leases. Payments made under operating leases (net of any incentives received from the lessor) are charged to profit and loss account on astraight line basis over the lease term.
Investments2.8
Classification of an investment is made on the basis of intended purpose for holding such investment. Management determines the appropriate classification of its investments atthe time of purchase.
Investments are initially measured at fair value plus transaction costs directly attributable to acquisition, except for “Investment at fair value through profit or loss”which is measured initially at fair value.
Annual Report 201140

Notes to the Financial Statements for the Year Ended June 30, 2011
Investments at fair value through profit or loss2.8.1
Investments which are acquired principally for the purpose of generating profit from short term fluctuations in price or dealer’s margin are classified as held for trading. After initial recognition, these are stated at fair values with any resulting gains or losses recognized directly in the profit and loss account. Transaction costs are charged to profitand loss account when incurred.
Investments at fair value through profit or loss includes financial assets held for tradingdesignated upon initial recognition as at fair value through profit or loss.
The Company assesses at the end of each reporting period whether there is any objective evidence that investments are impaired. If any such evidence exists, the Company applies the provisions of IAS 39 'Financial Instruments: Recognition and Measurement' to all investments, except investment in an associate, which is tested forimpairment in accordance with the provisions of IAS 36 'Impairment of Assets'.
Investments with fixed or determinable payments and fixed maturity are classified as held-to-maturity when the Company has the positive intention and ability to hold to maturity. Investments intended to be held for an undefined period are not included in this classification. Other long-term investments that are intended to be held-to-maturity, are subsequently measured at amortised cost. This cost is computed as the amount initially recognised minus principal repayments, plus or minus the cumulative amortisation using the effective interest method of any difference between the initially recognised amount and the maturity amount. This calculation includes all fees and points paid or received between parties to the contract that are an integral part of the effective interest rate, transaction costs and all other premiums and discounts. For investments carried at amortized cost, gains and losses are recognised in profit and loss account when the investments are derecognised or impaired, as well as through the amortization process.
Held-to-maturity investments2.8.2
Investments intended to be held for an indefinite period of time, which may be sold in response to need for liquidity, or changes to interest rates or equity prices are classified asavailable for sale. These are sub-categorized as under:
Available for sale investments2.8.3
After initial recognition, investments which are classified as available for sale are measured at fair value. Gains or losses on available for sale investments are recognized directly in statement of other comprehensive income until the investment is sold, de-recognized or is determined to be impaired, at which time the cumulative gain or loss previously reported in statement of other comprehensive income is included in profit and loss account. Fair value is determined by reference to stock exchange quoted market bidsat the close of business on the balance sheet date.
Quoted
Annual Report 2011 41

Notes to the Financial Statements for the Year Ended June 30, 2011
The investments that do not have a quoted market price in an active market and whose fair value can not be reliably measured, subsequent to after initial recognition are carriedat cost less any identified impairment loss.
Unquoted
The Company’s investment in its associate is accounted for under the equity method of accounting. An associate is an entity in which the Company has significant influence and which is neither a subsidiary nor a joint venture. Under the equity method, the investment in the associate is carried in the balance sheet at cost plus post-acquisition changes in the Company’s share of net assets of the associate. Goodwill relating to an associate is included in the carrying amount of the investment and is not amortized. The profit and loss account reflects the share of the results of operations of the associate. Where there has been a change recognized directly in the equity of the associate, the Company recognizes its share of any changes and discloses this, when applicable, in thestatement of changes in equity.
Investment in an associate2.8.4
The reporting dates of the associate and the Company are identical and the associate’s accounting policies conform to those used by the Company for like transactions andevents in similar circumstances.
Inventories, except for stock in transit and waste materials, are stated at lower of cost and net realizable value. Net realizable value signifies the estimated selling price in the ordinary course of business less costs necessary to be incurred in order to make suchsale. Cost is determined as follows:
Inventories2.9
Usable stores, spare parts and loose tools are valued at moving average cost, while items considered obsolete are carried at nil value. Items-in-transit are stated at invoice amountplus other charges paid thereon.
Stores, spare parts and loose tools
Stock of raw materials, except for stock-in-transit, is valued principally at the lower ofweighted average cost and net realizable value.
Stock-in-trade
Raw materials-in-transit are valued at cost comprising invoice value plus other chargespaid thereon.
Cost of work-in-process and finished goods comprises of cost of direct materials, labourand appropriate manufacturing overheads.
Stock of waste materials is stated at net realizable value.
Annual Report 201142

Notes to the Financial Statements for the Year Ended June 30, 2011
Revenue is recognized to the extent that it is probable that the economic benefits will flow to the Company and the revenue can be reliably measured. The following specificrecognition criteria must also be met before revenue is recognized:
Revenue recognition2.11
Revenue from the sale of goods is recognized when the significant risks and rewards of ownership of the goods have passed to the buyer, usually on the delivery of the goods.Revenue from sale of electricity is recognized at the time of transmission.
Sale of goods and electricity
Cash and cash equivalents comprise cash in hand, cash at banks on current accounts and other short term highly liquid instruments that are readily convertible into knownamounts of cash and which are subject to insignificant risk of changes in values.
Cash and cash equivalents2.10
Revenue is recognized as interest accrues (using the effective interest method that is the rate that exactly discounts estimated future cash receipts through the expected life ofthe financial instrument to the net carrying amount of the financial asset).
Interest income
Dividends
Dividend income is recognized when right to receive the dividend is established.
Financial instruments carried on the balance sheet include investments, deposits, trade debts, loans and advances, interest accrued, other receivables, cash and bank balances, long term financing, liabilities against assets subject to finance lease, short termborrowings, accrued mark-up and trade and other payables etc.
Financial instruments2.12
Financial assets and liabilities are recognized at the time the Company becomes a partyto contractual provisions of the instruments.
Initial recognition is made at fair value plus transaction costs directly attributable to acquisition, except for "financial instruments at fair value through profit or loss" which ismeasured initially at fair value.
The particular measurement methods adopted are disclosed in the following individual policy statements associated with each item and in the accounting policy ofinvestments.
Annual Report 2011 43

Notes to the Financial Statements for the Year Ended June 30, 2011
Borrowingsa)
All loans and borrowings are initially recognized at the fair value of the consideration received less directly attributable transaction costs. After initial recognition, long term interest-bearing loans and borrowings are measured at amortized cost using the effective interest method while short term borrowings are measured at fair value. Gains and losses are recognized in net profit or loss when the liabilities are derecognized as well as through the amortization process.
Trade debtsb)
Trade debts originated by the Company are recognized and carried at original invoice amount less an allowance for any uncollectible amounts. Known bad debts are written off and provision is made against debts considered doubtful whencollection of the full amount is no longer probable.
Loans and receivablesc)
Loans and receivables are non-derivative financial assets with fixed or determinable payments that are not quoted in an active market. Such assets are carried at amortized cost using the effective interest method. Gains and losses are recognized in profit and loss account when the loans and receivables arederecognised or impaired, as well as through the amortization process.
Trade and other payablesd)
Liabilities for trade and other amounts payable are initially recognized at fair value,which is normally the transaction cost.
The Company uses derivative financial instruments such as forward currency contracts and forward currency swaps to hedge its risks associated with interest rate and foreign currency fluctuations. Such derivative financial instruments are initially recognized at fair value on the date on which a derivative contract is entered into and are subsequently remeasured at fair value. Derivatives are carried as assets when the fair value is positiveand as liabilities when the fair value is negative.
Derivative financial instruments2.13
The fair value of forward currency contracts is calculated by reference to current forwardexchange rates for contracts with similar maturity profiles. The fair value of cross currency swap contracts is determined by reference to market values for similarinstruments.
Any gains or losses arising from changes in fair value on derivatives during the year thatdo not qualify for hedge accounting are taken directly to profit or loss.
Annual Report 201144

Notes to the Financial Statements for the Year Ended June 30, 2011
If the forecast transaction or firm commitment is no longer expected to occur, amounts previously recognized in equity are transferred to profit or loss. If the hedging instrument expires or is sold, terminated or exercised without replacement or rollover, or if its designation as a hedge is revoked, amounts previously recognized in equity remain inequity until the forecast transaction or firm commitment occurs.
Interest, mark-up and other charges on long term finances are capitalized upto the date of commissioning of respective qualifying assets acquired out of the proceeds of such long term finances. All other interest, mark-up and other charges are charged to profitand loss account.
Borrowing cost2.14
Impairment2.15
Impairment of assets other than financial assetsa)
The carrying amounts of the assets other than financial assets are reviewed at each balance sheet date to determine whether there is any indication of impairment. If such indication exists, the recoverable amount of such asset is estimated. An impairment loss is recognized wherever the carrying amount of the asset exceeds its recoverable amount. Impairment losses are recognized in profit and loss account. A previously recognised impairment loss is reversed only if there has been a change in the estimates used to determine the asset's recoverable amount since the last impairment loss was recognized. If that is the case, the carrying amount of the asset is increased to its recoverable amount. That increased amount cannot exceed the carrying amount that would have been determined, net of depreciation, had no impairment loss been recognised for theasset in prior years. Such reversal is recognised in profit and loss account.
Impairment of financial assetsb)
Assets carried at amortized cost
If there is objective evidence that an impairment loss on loans and receivables carried at amortized cost has been incurred, the amount of the loss is measured as the difference between the asset’s carrying amount and the present value of estimated future cash flows (excluding future credit losses that have not been incurred) discounted at the financial asset’s original effective interest rate (i.e. the effective interest rate computed at initial recognition). The carrying amount of the asset is reduced either directly or through use of an allowance account. Theamount of the loss is recognized in profit and loss account.
The Company assesses at the end of each reporting period whether there is objective evidence that a financial asset or group of financial assets is impaired.
Annual Report 2011 45

Notes to the Financial Statements for the Year Ended June 30, 2011
Available for sale financial assets
If an available for sale asset is impaired, an amount comprising the difference between its cost and its current fair value, less any impairment loss previously recognized in profit or loss, is transferred from equity to the income statement. Reversals in respect of equity instruments classified as available for sale are not recognized in profit. Reversals of impairment losses on debt instruments are reversed through profit or loss, if the increase in fair value of the instrument can be objectively related to an event occurring after the impairment loss was recognizedin profit and loss account.
Derecognition of financial assets and liabilities2.16
Financial assets
A financial asset (or, where applicable a part of a financial asset or part of a group of similarfinancial assets) is derecognized where:
the rights to receive cash flows from the asset have expired;-
the Company retains the right to receive cash flows from the asset, but has assumed an obligation to pay them in full without material delay to a third partyunder a 'pass-through' arrangement; or
-
the Company has transferred its rights to receive cash flows from the asset and either (a) has transferred substantially all the risks and rewards of the asset or (b) has neither transferred nor retained substantially all the risks andrewards of the asset, but has transferred control of the asset.
-
Where the Company has transferred its rights to receive cash flows from an asset and has neither transferred nor retained substantially all the risks and rewards of the asset nor transferred control of the asset, the asset is recognised to the extent of the Company’s continuing involvement in the asset. Continuing involvement that takes the form of a guarantee over the transferred asset is measured at the lower of the original carrying amount of the asset and the maximum amount of consideration that the Company could be required to repay. Where continuing involvement takes the form of a written and/or purchased option (including a cash-settled option or similar provision) on the transferred asset, the extent of the Company’s continuing involvement is the amount of the transferred asset that the Company may repurchase, except that in the case of a written put option (including a cash-settled option or similar provision) on an asset measured at fair value, the extent of the Company’s continuing involvement is limited to the lower of the fair value of the transferred asset and the option exercise price.
Financial liabilities
A financial liability is derecognized when the obligation under the liability is discharged orcancelled or expired.
Where an existing financial liability is replaced by another from the same lender on substantially different terms, or the terms of an existing liability are substantially
Annual Report 201146

Notes to the Financial Statements for the Year Ended June 30, 2011
modified, such an exchange or modification is treated as a derecognition of the original liability and the recognition of a new liability, and the difference in the respective carryingamounts is recognized in profit or loss.
Related party transactions and transfer pricing2.17
Off setting2.18
Financial assets and financial liabilities are set off and the net amount is reported in the financial statements when there is legally enforceable right to set off and the Company intends either to settle on a net basis, or to realize the assets and to settle the liabilitiessimultaneously.
Foreign currencies2.19
These financial statements are presented in Pak Rupees, which is the Company's functional currency. Transactions in foreign currency during the year are initially recorded in the functional currency at the rate prevailing at the date of transaction. Monetary assets and liabilities denominated in foreign currencies are retranslated at functional currency using the rate of exchange prevailing at the balance sheet date. Alldifferences are taken to the profit and loss account.
Transactions and contracts with related parties are carried out at arm's length pricedetermined in accordance with comparable uncontrolled price method.
Segment reporting2.20
Segment reporting is based on the operating (business) segments of the Company. An operating segment is a component of the Company that engages in business activities from which it may earn revenues and incur expenses, including revenues and expenses that relate to the transactions with any of the Company's other components. An operating segment's operating results are reviewed regularly by the Chief Executive Officer to make decisions about resources to be allocated to the segment and assess itsperformance, and for which discrete financial information is available.
Segment results that are reported to the Chief Executive Officer include items directly attributable to a segment as well as those that can be allocated on a reasonable basis. Those income, expenses, assets, liabilities and other balances which can not be allocatedto a particular segment on a reasonable basis are reported as unallocated.
The Company has six reportable business segments. Spinning (Producing different quality of yarn using natural and artificial fibres), Weaving (Producing different quality of greige fabric using yarn), Processing and Home Textile (Processing greige fabric for production of printed and dyed fabric and manufacturing of home textile articles), Trading (Buying and selling of garments and home textile articles), Power Generation (Generating and distributing power) and Cold Storage (Making of ice and warehousing ofperishable goods).
Transactions among the business segments are recorded at arm's length prices using admissible valuation methods. Inter segment sales and purchases are eliminated fromthe total.
Annual Report 2011 47

Notes to the Financial Statements for the Year Ended June 30, 2011
ISSUED, SUBSCRIBED AND PAID UP SHARE CAPITAL3.
(Rupees in thousand)
2011 2010
(Number of Shares)
2011 2010
Ordinary shares of Rupees 10 eachfully paid in cash
Ordinary shares of Rupees 10 eachissued as fully paid bonus shares
19 781 136
49 209 923
19 781 136
49 209 923
197,811
492,099
197,811
29 428 787 29 428 787 294,288 294,288
492,099
3.1 Ordinary shares of the Company held by related parties as at year end are as follows:
2011 2010
(Number of Shares)
Arif Habib Corporation Limited (formerly Arif Habib Securities Limited) Crescent Sugar Mills and Distillery LimitedCrescent FoundationCrescent Steel and Allied Products LimitedThe Crescent Textile Mills Limited-Employees Provident Fund-TrusteePremier Insurance LimitedShakarganj Mills LimitedAhsan Associates (Private) LimitedJubilee Spinning and Weaving Mills Limited
12,207,1112,681,8751,030,861 452,379 362,122 262,000
5,898 1,563
-
12,207,1112,681,8751,030,861 452,379 313,122 262,000
5,898 1,563
827
17,003,809 16,955,636
RESERVES4.
Composition of reserves is as follows:CapitalFair value reserve (Note 4.1)
RevenueDividend equalizationGeneralUnappropriated profit
103,912
30,0001,773,643 113,231
1,916,874
2,020,786
75,789
30,0001,773,643 300,908
2,104,551
2,180,340
2011 2010
(Rupees in thousand)
Annual Report 201148

Notes to the Financial Statements for the Year Ended June 30, 2011
4.1 This represents the unrealized gain on remeasurement of investments at fair value and is not available for distribution. This will be transferred to profit and loss account onrealization. Reconciliation of fair value reserve is as under:
Balance as at July 01,
Add: Fair value adjustment during the year
Balance as at June 30,
75,789
28,123
103,912
21,131
54,658
75,789
SURPLUS ON REVALUATION OF OPERATINGFIXED ASSETS - NET OF DEFERRED TAX
5.
Transferred to unappropriated profit in respect of incrementaldepreciationRelated deferred income tax liability
222
241,640,502
121
131,640,526
Surplus on revaluation of operating fixed assets as at July 01, 1,640,526 1,640,539
Less:Deferred income tax liability as at July 01,Adjustment of deferred income tax liability due tore-assessment at year endIncremental depreciation charged during the yeartransferred to profit and loss account
119
(3)
(2)114
146
(26)
(1)119
1,640,388 1,640,407
5.1 This represents surplus resulting from revaluation of freehold land and leasehold land carried out on June 30, 2007 by Messrs Hamid Mukhtar and Company (Private) Limited, an independent valuer enrolled on panel of the State Bank of Pakistan (SBP) as per thebasis stated in Note 14.1.1 to the financial statements.
2011 2010
(Rupees in thousand)
LONG TERM FINANCING - SECURED6.
Financing from banking companies (Note 6.1)Term finance certificates (Note 6.2)
803,435 49,993
853,428
1,008,034 99,985
1,108,019
Less: Current portion shown under current liabilities (Note 12) 341,342
512,086
451,668
656,351
Annual Report 2011 49

Notes to the Financial Statements for the Year Ended June 30, 2011
Lender 2011 2010 Rate of interest
per annumNumber of
installments
Date of repaymentOf first installment
InterestPayable
Security
(Rupees in thousand)
National Bank of
Pakistan
33,318
37,546
70,864
99,955
62,576
162,531
6 months KIBOR
plus 2% without
any floor or cap
SBP refinance rate
for LTF-EOP plus
2%
12 equal half
yearly
installments
January 03, 2006 Half yearlyJoint pari passu charge over fixed
and current assets of the Company.
National Bank of
Pakistan
83,333 125,000 SBP refinance rate
for LTF-EOP plu
2%
12 equal half
yearly
installments
September 22, 2006 Quarterly Joint pari passu charge over fixed
and current assets of the Company.
Allied Bank
Limited
50,000 150,000 6 months KIBOR
plus 1.90% without
any floor or cap
10 equal half
yearly
installments
March 29, 2007 Half yearly
Allied Bank
Limited
69,500 92,667 SBP refinance rate
for LTF-EOP plus
2%
12 equal half
yearly
installments
December 29, 2007 Quarterly
Habib Bank
Limited
264,468 340,029 SBP refinance rate
for LTF-EOP plus
2%
10 equal half
yearly
installments
January 23, 2010 Quarterly
Allied Bank
Limited
41,351 50,541 SBP refinance rate
for LTF-EOP plus
2%
12 equal half
yearly
installments
February 23, 2010 Quarterly
Habib Bank
Limited
26,250 32,083 SBP refinance rate
for LTF-EOP plus
3%
12 equal half
yearly
installments
March 03, 2010 Quarterly
Habib Bank
Limited
50,584 55,183 SBP refinance rate
for LTF-EOP plus
3%
12 equal half
yearly
installments
June 08, 2011 Quarterly
803,435 1,008,034
Lender 2011 2010 Rate of interest
per annumNumber of
installments
Date of repaymentOf first installment
InterestPayable
Security
(Rupees in thousand)
United BankLimited
49,993 99,985 6 months KIBOR
plus 1.45% without
any floor or cap
11 equal half
yearly
installments
December 17, 2006 Half yearly
6.1
6.2
Joint pari passu charge over fixed
and current assets of the Company.
Joint pari passu charge over fixed
and current assets of the Company.
Joint pari passu charge over fixed
and current assets of the Company.
Joint pari passu charge over fixed
and current assets of the Company.
Joint pari passu charge over fixed
and current assets of the Company.
Joint pari passu charge over fixed
and current assets of the Company.
MCB Bank
Limited
147,085 - 6 months KIBOR
plus 2% without
any floor or cap
8 equal half
yearly
installments
January 27, 2012 Half yearly Joint pari passu charge over fixed
and current assets of the Company.
Joint pari passu charge over fixed
and current assets of the Company.
Annual Report 201150

Notes to the Financial Statements for the Year Ended June 30, 2011
6.2.1 Syndicated loan facility of Rupees 550 million (2010: Rupees 550 million) obtained from United Bank Limited for Balancing, Modernization and Replacement (BMR) of existing facilities of the Company was converted in financial year 2004 to privately placed term finance certificates having face value of Rupees 5,000 each. United Bank Limited has been appointed to act as trustee for the issue. The trust deed, dated March 27, 2004 between the Company and United Bank Limited, specifies the rights and obligations of the trustees. The deed requires that the trustees will ensure adherence to terms andconditions of the security documents.
LIABILITIES AGAINST ASSETS SUBJECTTO FINANCE LEASE
7.
Future minimum lease paymentsLess: Un-amortized finance charge
Present value of future minimum lease paymentsLess: Current portion shown under current liabilities (Note 12)
93,377 29,697
63,680 9,059
54,621
(Rupees in thousand)
2011 2010
- -
- - -
7.1 The minimum lease payments have been discounted at an implicit interest rate of six months KIBOR plus 2.75% per annum with floor of 13% per annum. The implicit interest rate used to arrive at the present value of minimum lease payments ranges from 16.32% to 16.54% per annum. Since the implicit interest rate is linked with KIBOR so the amount of minimum lease payments and finance charge may vary from period to period. Taxes,repairs and insurance costs are to be borne by the Company. These are secured againstthe leased assets.
Minimum lease payments and their present values are regrouped as under:7.2
Future minimum lease paymentsLess: Un-amortized finance charge
Present value of future minimumlease payments
2010
Not later thanone year
Later than oneyear and not later
than five years
18,8599,800
9,059
74,51819,897
54,621
2011
Not later thanone year
Later than oneyear and not later
than five years
--
-
--
-
--------------- (RUPEES IN THOUSAND) ---------------
Annual Report 2011 51

Notes to the Financial Statements for the Year Ended June 30, 2011
(Rupees in thousand)
2011 2010
DEFERRED INCOME TAX LIABILITY8.
Taxable temporary differencesTax depreciation allowanceTax on investment in associateSurplus on revaluation of operating fixed assets
Deductible temporary differencesUnused tax losses
118,107 34,861
119 153,087
(144,274) 8,813
- -- -
- -
TRADE AND OTHER PAYABLES9.
Creditors (Note 9.1)Accrued liabilitiesAdvances from customersRetention money due to contractorsIncome tax deducted at sourceUnclaimed dividendPayable to Employees Provident Fund TrustWorkers' profit participation fund (Note 9.2)Other payablesWorkers' welfare fund
986,966 242,000 69,180 1,359
26 6,728
310 7,389 1,923 2,684
1,318,565
286,972 169,293 26,204
455 2,472 5,956
943 17,380 3,222 8,496
521,393
9.1 This includes amounts in aggregate of Rupees 22.153 million (2010: Rupees 5.619million) due to related parties.
Workers' profit participation fund9.2
Balance as on July 01,Interest for the year (Note 34)Add: Provision for the year (Note 32)
Less: Payments during the year
17,380 1,786 7,158
26,324 18,935 7,389
3,932206
17,380 21,518 4,138
17,380
9.2.1 The Company retains workers' profit participation fund for its business operations till the date of allocation to workers. Interest is paid at prescribed rate under the Companies Profit (Workers' Participation) Act, 1968 on funds utilized by the Company till the date ofallocation to workers.
Annual Report 201152

Notes to the Financial Statements for the Year Ended June 30, 2011
ACCRUED MARK-UP10.
Long term financingShort term borrowingsLiabilities against assets subject to finance lease
29,503 110,821
393 140,717
(Rupees in thousand)
2011 2010
22,938 83,781
- 106,719
SHORT TERM BORROWINGS11.
From banking companies - secured
Short term finances (Note 11.1 and Note 11.4)State Bank of Pakistan (SBP) refinance (Note 11.2 and Note 11.4)Short term foreign currency finances (Note 11.3 and Note 11.4)
Others - unsecured (Note 11.5)
793,5612,158,6202,859,5095,811,690 124,000
5,935,690
11.1 The finances aggregating to Rupees 1,327 million (2010: Rupees 2,209 million) are obtained from banking companies under mark-up agreements and carry mark up ranging from KIBOR plus 1.50 to 3.00 percent (2010: KIBOR plus 1.50 to 2.90 percent)per annum.
11.2 Export refinances have been obtained from banking companies under SBP’s refinance scheme on which service charges at the rate of 8.00 to 11.00 percent (2010: 7.50 to 9.00 percent) per annum are payable. These form part of aggregate borrowing limits ofRupees 2,160 million (2010: Rupees 1,856 million).
11.3 Short term foreign currency finances amounting to Rupees 2,958 million (2010: Rupees 1,748 million) are available at mark up ranging from LIBOR plus 2.00 to 5.07 percent(2010: LIBOR plus 2.75 to 5.00 percent) per annum.
11.4 The aggregate short term finances from banking companies are secured by way of jointpari passu charge over fixed and current assets of the Company.
1,243,8021,847,6001,748,6164,840,018
-4,840,018
11.5 This represents loan obtained from Crescent Model Farm which is repayable on demand. It carries mark up at the rate of one month KIBOR plus 1.50 percent per annum (2010:Nil).
Annual Report 2011 53

Notes to the Financial Statements for the Year Ended June 30, 2011
13.
Letters of guarantee of Rupees 115.918 million (2010: Rupees 115.143 million) are given by the banks of the Company to Sui Northern Gas Pipeline Limitedagainst gas connection and Collector of Customs against import of raw materialand supplies.
PROPERTY, PLANT AND EQUIPMENT14.
Operating fixed assets (Note 14.1) -Owned -LeasedCapital work-in-progress (Note 14.2)
3,971,682 26,367 36,906
4,034,955
(Rupees in thousand)
2011 2010
3,948,372-
32,809 3,981,181
CONTINGENCIES AND COMMITMENTS
a) Contingencies
Commitments
CURRENT PORTION OF NON-CURRENT LIABILITIES 12.
Current portion of long term financing (Note 6)Current portion of liabilities against assets subjectto finance lease (Note 7)
341,342
9,059 350,401
(Rupees in thousand)
2011 2010
451,668
- 451,668
i)
Post dated cheques of Rupees 9.412 million (2010: Rupees 9.807 million) are issued to custom authorities in respect of duties on imported material availed on the basis of consumption and export plans. If documents of exports are notprovided on due dates, cheques issued as security shall be encashable.
ii)
The Company is contingently liable to the extent of Rupees 130.616 million (2010: Rupees 84.385 million) as its share of contingent liabilities of itsassociate.
iii)
b)
Contracts for capital expenditure amounting to Rupees 82.872 million (2010:Rupees 59.273 million).
i)
Letters of credit other than for capital expenditure amounting to Rupees 98.839million (2010: Rupees 190.297 million).
ii)
Annual Report 201154

Notes to the Financial Statements for the Year Ended June 30, 2011
14.1 Operating fixed assets
Land -Freehold
Land -Leasehold
Buildings onfreehold land
Buildings onleasehold
land
Plant andmachinery
Factory toolsand
equipment
Gas andelectric
InstallationsVehicles
Furnitureand
fixtures
Officeequipment
Total
------------------------------------------------------------------------- (RUPEES IN THOUSAND) --------------------------------------------------------------------------------
At July 01, 2009Cost / revalued amountAccumulated depreciationNet book value
6,000(874)5,126
306,905(183,218)
123,687
49,431(30,578)
18,853
4,253,376(1,943,007)
2,310,369
65,437(59,988)
5,449
55,385(45,371)
10,014
74,699(29,029)
45,670
7,697(4,333)
3,364
37,539(32,644)
4,895
6,509,169(2,329,042)
4,180,127
Year ended June 30, 2010Opening net book valueAdditionsDisposals:CostAccumulated depreciation
Depreciation chargeClosing net book value
5,126-
---
(61)5,065
123,687-
(626)489
(137)(10,505)113,045
18,853-
---
(1,850)17,003
2,310,36917,213
(1,907)1,788(119)
(232,200)2,095,263
5,4491,918
(15)13(2)
(1,350)6,015
10,014712
(2,602)2,394(208)
(2,147)8,371
45,67011,464
(6,242)4,435
(1,807)(10,542)
44,785
3,364-
(431)390(41)
(672)2,651
4,8951,527
(3,934)3,911
(23)(2,925)
3,474
4,180,12732,834
(15,757)13,420(2,337)
(262,252)3,948,372
At June 30, 2010Cost / revalued amountAccumulated depreciationNet book value
6,000(935)5,065
306,279(193,234)
113,045
49,431(32,428)
17,003
4,268,682(2,173,419)
2,095,263
67,340(61,325)
6,015
53,495(45,124)
8,371
79,921(35,136)
44,785
7,266(4,615)
2,651
35,132(31,658)
3,474
6,526,246(2,577,874)
3,948,372
Year ended June 30, 2011Opening net book valueAdditionsDisposalsCostAccumulated depreciation
Write off:CostAccumulated depreciation
Depreciation chargeClosing net book value
At June 30, 2011Cost / revalued amountAccumulated depreciationNet book value
1,652,700-
1,652,700
1,652,700-
----
1,652,700
1,652,700-
1,652,700
1,652,700-
---
----
1,652,700
Plant andMachinery
Owned Assets Leased Assets
---
--
-----
---
5,065-
---
---
(72)4,993
113,04520,237
---
---
(9,832)123,450
17,003-
---
---
(1,667)15,336
2,095,263235,769
(9,110)3,858
(5,252)
(3,718)3,187(531)
(224,310)2,100,939
6,0152,917
(48)46(2)
(51,542)50,829
(713)(1,245)
6,972
8,3717,886
---
(14,551)13,904
(647)(1,797)13,813
44,78515,632
(9,795)7,002
(2,793)
---
(10,830)46,794
2,651-
---
(1,162)1,068
(94)(522)2,035
3,4743,818
(3,030)3,020
(10)
(11,754)11,673
(81)(2,551)
4,650
3,948,372286,259
(21,983)13,926(8,057)
(82,727)80,661(2,066)
(252,826)3,971,682
-26,814
---
---
(447)26,367
1,652,700-
1,652,700
6,000(1,007)
4,993
326,516(203,066)
123,450
49,431(34,095)
15,336
4,491,623(2,390,684)
2,100,939
18,667(11,695)
6,972
46,830(33,017)
13,813
85,758(38,964)
46,794
6,104(4,069)
2,035
24,166(19,516)
4,650
6,707,795(2,736,113)
3,971,682
Annual rate of depreciation (%) - 1.01 5-10 5-10 10 20 20 20 20 50
26,814(447)
26,367
10
Annual Report 2011 55

Notes to the Financial Statements for the Year Ended June 30, 2011
14.1.1 The land of the Company, except the land situated at Faisalabad, had been revalued as on June 30, 2007 using the present market value at Rupees 62 million. Whereas the land situated at Faisalabad granted to the Company by the Government of Punjab in 1958 under Land Acquisition Act, 1894 for the specific purpose of using it as an industrial undertaking had been revalued at Rupees 1,597 million taking into account conditions specified under various directives of the Government by an independent valuer, Messrs Hamid Mukhtar and Company (Private) Limited. The Company hadrevalued this land based on the advice from its legal counsel.
Land - FreeholdLand - Leasehold
14.1.2 Fixed assets of the Company with carrying amount of Rupees 3,925 million (2010: Rupees 3,904 million) are subject to first pari passu charge to secured bankborrowings.
14.1.3 If the freehold and leasehold land were measured using the cost model, the carryingamount would be as follows:
2011
CostAccumulateddepreciation
Net bookvalue
(Rupees in thousand)
13,403
4,719
18,122
-
931
931
13,403
3,788
17,191
2010
CostAccumulateddepreciation
Net bookvalue
13,403
4,719
18,122
-833
833
13,403
3,836
17,239
14.1.4 Depreciation charge for the year has been allocated as follows:
Cost of sales (Note 29) -Owned assets -Leased assets
Administrative expenses (Note 31)
236,951 447
237,39815,875
253,273
(Rupees in thousand)
2011 2010
246,078-
246,07816,174
262,252
Annual Report 201156

Notes to the Financial Statements for the Year Ended June 30, 2011
14.1.5
Description
Plant and MachineryCentrifugal chiller
Comber, lapformer
1
5
Detail of operating fixed assets, exceeding the book value of Rupees 50,000 disposed of during the year is as follows:
Qty. CostAccumulateddepreciation
Net bookvalue
Saleproceeds
Mode ofdisposal
Particulars of purchasers
6,802
2,153
8,955
2,050
1,691
3,741
4,752
462
5,214
6,500
1,410
7,910
Negotiation
Negotiation
Crescent Bahuman Limited,Pindi Bhattian (Associate).Mr. Shahzad Haider Shah, 12/1 B,Peoples Colony, Faisalabad.
VehiclesHonda Civic
Toyota Corolla
Suzuki CultusSuzuki Cultus
Suzuki CultusMaster Truck
Mercedes Benz
1
1
11
11
1
1,335
1,209
674608
609850
4,510
9,795
988
900
415356
380500
3,463
7,002
347
309
259252
229350
1,047
2,793
945
950
625550
525850
1,500
5,945
Negotiation
Negotiation
NegotiationNegotiation
NegotiationNegotiation
Negotiation
Five Star Motors, Canal Road, Abdullahpur,Faisalabad.Mr. Nadeem Hussain, P-25, Muslim TownBlock B, Faisalabad.Mr. Raees Ahmed, Factory Area, Faisalabad.Mr. Ghulam Murtaza, Sangi Meera,Abbotabad.Mr. Habib Ahmed, Company Employee.Mr. Arfan Gulzar, House No. 32,Gulistan Colony Block A, Faisalabad.Oilco Trading Company, 32K/C-2,Oilco House, Gulberg II, Lahore.
Aggregate of other items of property,plant and equipment with individualbook values not exceedingRupees 50,000 3,233
21,983
3,183
13,926
50
8,057
2,406
16,261
(Rupees in thousand)
2011 2010
Capital work in progress14.2
BuildingPlant and machineryAdvances for purchase of vehicles
-34,4062,500
36,906
3,76227,2321,815
32,809
(Rupees in thousand)
Annual Report 2011 57

INVESTMENT IN AN ASSOCIATE15.
26 926 433 (2010: 26 926 433) ordinary shares ofRupees 10 each (Note 15.1)Share of post acquisition reserve:As at July 01,For the yearShare of associate’s items directly credited in equityElimination of inter company adjustmentAs at June 30,
269,264
348,606(150,712)
5,290(20,898)182,286
(Rupees in thousand)
2011 2010
269,264
216,071120,02212,513
-348,606
Notes to the Financial Statements for the Year Ended June 30, 2011
Crescent Bahuman Limited - unquoted
451,550 617,870
15.1 The Company holds 32.99% (2010: 32.99%) interest in Crescent Bahuman Limited (CBL), an unquoted public limited company involved in manufacturing of textileproducts. The summarized financial information of CBL is as follows:
Associate's balance sheet:Current assetsNon-current assetsCurrent liabilitiesNon-current liabilitiesNet assets
4,087,826 3,610,875
(4,052,726) (2,544,459)
1,101,516
Associate's revenue and profit:
Revenue
(Loss) / profit before taxation for the year
(Loss) / profit after taxation for the year
7,172,726
434,514
363,813
4,726,6754,068,192
(5,611,232)(1,002,677) 2,180,958
7,113,823
(387,298)
(456,842)
Annual Report 201158

LONG TERM INVESTMENTS16.
Crescent Jute Products Limited2 738 637 (2010: 2 738 637) fully paid ordinary shares ofRupees 10 each. Equity held 11.52% (2010: 11.52%)
Crescent Sugar Mills and Distillery Limited975 944 (2010: 975 944) fully paid ordinary shares ofRupees 10 each. Equity held 4.56% (2010: 4.56%)
Shams Textile Mills Limited812 160 (2010: 812 160) fully paid ordinary shares ofRupees 10 each. Equity held 9.40% (2010: 9.40%)
Premier Insurance Limited169 573 (2010: 169 573) fully paid ordinary shares ofRupees 5 each. Equity held 0.28% (2010: 0.28%)
Shakarganj Mills Limited5 427 488 (2010: 5 427 488) fully paid ordinary shares ofRupees 10 each. Equity held 7.81% (2010: 7.81%)2 746 050 (2010: 2 746 050) fully paid preference shares ofRupees 10 each. Equity held 7.94% (2010: 7.94%)
Jubilee Spinning and Weaving Mills LimitedNil (2010: 182 629) fully paid ordinary shares ofRupees 10 each. Equity held Nil (2010: 0.56%)
Crescent Steel and Allied Products Limited6 209 676 (2010: 6 209 676) fully paid ordinary shares ofRupees 10 each. Equity held 11% (2010: 11%)
Unquoted
Crescent Bahuman Limited197 600 000 (2010: Nil) fully paid preference shares ofRupees 10 each (Note 16.1)
2,738
5,124
4,629
35
20,624
-
91,625
1,976,000
(Rupees in thousand)
2011 2010
4,105
5,124
4,629
35
27,680
546
91,625
-
Notes to the Financial Statements for the Year Ended June 30, 2011
Available for sale
Related parties
Quoted
8,266 27,186
Cresox (Private) Limited(formerly Renfro Crescent (Private) Limited)Nil (2010: 4 317 252) fully paid ordinary shares ofRupees 10 each. Equity held Nil (2010: 11.98% ) - 43,159
Premier Financial Services (Private) Limited500 (2010: Nil) fully paid ordinary shares ofRupees 1,000 each. Equity held 2.22% (2010: Nil) 500 -
Annual Report 2011 59

Unquoted
(Rupees in thousand)
2011 2010
Notes to the Financial Statements for the Year Ended June 30, 2011
16.1 This includes 5 % unlisted, non-voting, cumulative, participatory and convertible preference shares issued by Crescent Bahuman Limited against the long term loansand advances given by the Company (Note 17.1).
LONG TERM LOANS AND ADVANCES
Considered good:Loan and advances to Crescent Bahuman Limited - associate (Note 17.1)Secured:Executives (Note 17.2)Other employees
Less: Current portion shown under current assets (Note 23)ExecutivesOther employees
-
4503,6854,1354,135
1,927,188
2,0501,9303,980
1,931,168
17.
Others
Quoted
Jubilee Spinning and Weaving Mills Limited182 629 (2010: Nil) fully paid ordinary shares ofRupees 10 each. Equity held 0.56% (2010: Nil)
Crescent Fibres Limited351 657 (2010: 351 657) fully paid ordinary shares ofRupees 10 each. Equity held 2.83% (2010: 2.83%)
546
2,162
-
2,162
Cresox (Private) Limited(formerly Renfro Crescent (Private) Limited)4 199 792 (2010: Nil) fully paid ordinary shares ofRupees 10 each. Equity held 11.66% (2010: Nil) 41,998 -
Premier Financial Services (Private) LimitedNil (2010: 500) fully paid ordinary shares ofRupees 1,000 each. Equity held Nil (2010: 2.22%)
Less: Impairment loss charged to profitand loss account (Note 32.2)Add: Fair value adjustment
2,154,247
(2,725)
103,912
2,255,434
206,751
(27,343)
75,789
255,197
- 500
450 958
1,4082,727
1,800 648
2,448 1,928,720
Annual Report 201160

(Rupees in thousand)
2011 2010
Notes to the Financial Statements for the Year Ended June 30, 2011
Reconciliation of loans and advances to CBL :Opening balance as at July 01,Mark up accrued and inter company adjustmentConverted into preference shares (Note 16.1)Closing balance as at June 30,
1,927,18848,812
(1,976,000) -
1,809,317117,871
- 1,927,188
17.1 This loan has been converted into preference shares of Crescent Bahuman Limited (CBL) in pursuance of resolution passed by the shareholders of the Company andapproval of regulatory authority.
17.2 Reconciliation of carrying amount of loans to executives:Opening balance as at July 01,Less: RepaymentsClosing balance as at June 30,
2,0501,600 450
3,6501,6002,050
17.2.1 Maximum aggregate balance due from executives at the end of any month during theyear was Rupees 1.900 million (2010: Rupees 3.650 million).
17.2.2 These represent Qarz-e-Hasna given to executives and employees and are securedagainst balance to the credit of employee in the provident fund trust. These arerecoverable in equal monthly installments.
17.2.3 The fair value adjustment in accordance with the requirements of IAS 39 'Financial Instruments: Recognition and Measurement' arising in respect of staff loans is notconsidered material and hence not recognized.
LONG TERM DEPOSITS AND PREPAYMENTS
Security depositsPrepayments
Less: Current portion shown under current assets (Note 24)
2,477 129
2,606 86
2,520
2,1381,4923,630 803
2,827
18.
Annual Report 2011 61

(Rupees in thousand)
2011 2010
Notes to the Financial Statements for the Year Ended June 30, 2011
DEFERRED INCOME TAX ASSET
Taxable temporary differencesTax depreciation allowanceTax on investment in associateSurplus on revaluation of operating fixed assets
Deductible temporary differencesUnused tax losses
(121,051)(18,229)
(114)(139,394)
181,74542,351
- - - -
- -
19.
STORES, SPARE PARTS AND LOOSE TOOLS
Stores (Note 20.1)Spare partsLoose tools
20.
136,32723,760
60160,147
155,14614,516
107169,769
20.1 This includes stores in transit amounting to Rupees Nil (2010: Rupees 16.103 million).
20.2 Stores and spare parts include items which may result in fixed capital expenditure butare not distinguishable at this stage.
STOCK-IN-TRADE
Raw materialsWork in processFinished goods (Note 21.2)Waste
356,554133,539
1,160,5417,369
1,658,003
178,67284,732
781,1452,601
1,047,150
21.
21.1 Stock-in-trade of Rupees 703.979 million (2010: Rupees 2.601 million) is being carried at net realizable value.
21.2 Finished goods include stock in transit of Rupees 40.541 million (2010: Rupees 13.381 million).
21.3 The aggregate amount of write-down of inventories to net realizable value recognizedduring the year was Rupees 154.068 million (2010: Rupees Nil).
Annual Report 201162

(Rupees in thousand)
2011 2010
Notes to the Financial Statements for the Year Ended June 30, 2011
22.1 As at June 30, 2011, trade debts of Rupees 118.856 million (2010 : Rupees 1,295.647 million) were past due but not impaired. These relate to a number of independent customers from whom there is no recent history of default. The ageing analysis of these trade debts is as follows:
TRADE DEBTS
Considered good:Secured (against letters of credit)Unsecured (Note 22.2)
365,938 3,025,973 3,391,911
189,715 2,390,186 2,579,901
22.
Upto 1 month1 to 6 monthsMore than 6 months
88,26723,1137,476
118,856
570,201703,75621,690
1,295,647
22.2 It includes amount receivable from the associate, Crescent Bahuman Limited,amounting to Rupees 238.588 million (2010: Rupees 4.610 million).
Considered doubtful:Others - unsecuredLess: Provision for doubtful debts
33,74733,747
-
33,74733,747
-
22.3 As at June 30, 2011, trade debts of Rupees 33.747 million (2010: Rupees 33.747 million) were impaired and provided for. The ageing of these trade debts was more than three years.
LOANS AND ADVANCES
Considered good:Employees - interest freeCurrent portion of long term loans (Note 17)Advances to suppliers (Note 23.1)Letters of creditIncome tax
621,408
61,734 987
244,871309,062
672,448
38,1811,195
182,665224,556
23.
Annual Report 2011 63

(Rupees in thousand)
2011 2010
Notes to the Financial Statements for the Year Ended June 30, 2011
23.1 It includes Rupees 0.331 million (2010: Rupees 0.329 million) receivable from arelated party, Crescent Sugar Mills and Distillery Limited.
SHORT TERM DEPOSITS AND PREPAYMENTS
Considered good:Margin depositShort term prepaymentsCurrent portion of long term prepayments (Note 18)
64,2972,721
8667,104
5,001 152 803
5,956
24.
OTHER RECEIVABLES
Considered good:Due from related partiesExport rebate and claimsSales tax and special excise duty refundableDividend receivable from related partiesMiscellaneous
77123,59674,46080,3102,739
181,876
33015,23989,645
-4,232
109,446
25.
Considered doubtful:Export rebate and sales tax refundableLess: Provision for doubtful debtsAs at June 30
12,95212,952
-181,876
12,95212,952
-109,446
SHORT TERM INVESTMENTS
Available for sale
Others - quotedSamba Bank Limited21 897 007 (2010: 21 897 007) fully paid ordinary sharesof Rupees 10 each. Equity held 1.53% (2010: 2.50%)
Less: Impairment loss charged to profit andloss account (Note 32.2)
49,706
(12,262)37,444
65,253
(15,547)49,706
26.
CASH AND BANK BALANCES
With banks:On current accountsIncluding US$ 24,895 (2010: US$ 70,975)Cash in hand
17,782 749
18,531
15,4021,017
16,419
27.
Annual Report 201164

(Rupees in thousand)
2011 2010
Notes to the Financial Statements for the Year Ended June 30, 2011
SALES
ExportLocal (Note 28.1)Cold storageExport rebateDuty drawback
11,062,882 3,610,889
12,98155,03817,467
14,759,257
7,555,046 3,241,217
11,92851,0374,158
10,863,386
28.
Local
3,292,316267,997
- 3,560,313
- 3,560,313
50,576 3,610,889
2,946,019166,061102,036
3,214,11614,074
3,200,04241,175
3,241,217
28.1
SalesWasteEnergy
Less: Sales tax
Processing income
28.2 Exchange gain due to currency rate fluctuations relating to export sales amounting to Rupees 32.874 million (2010: Rupees 115.525 million) has been included in export sales.
COST OF SALES
Raw material consumed (Note 29.1)Cloth and yarn purchasedStores, spare parts and loose tools consumedPacking materials consumedProcessing and weaving chargesSalaries, wages and other benefits (Note 29.2)Fuel and powerRepair and maintenanceInsuranceDepreciation (Note 14.1.4)Other factory overheads
4,691,600 1,558,574
630,550371,184544,056606,883
1,135,44363,90318,877
237,3989,551
9,868,019
2,848,2551,204,721 564,983 369,779 376,885 623,514 976,607 50,328 15,716
246,078 9,022
7,285,888
29.
Annual Report 2011 65

(Rupees in thousand)
2011 2010
Notes to the Financial Statements for the Year Ended June 30, 2011
Work-in-processOpening stockClosing stock
Cost of goods manufacturedFinished goodsOpening stockClosing stock
Cost of sales - purchased for resaleCost of sales
84,732(133,539)(48,807)
9,819,212
783,746 (1,167,910)
(384,164) 9,435,048 3,959,593
13,394,641
76,838 (84,732) (7,894)
7,277,994
684,570 (783,746) (99,176)7,178,8182,227,8269,406,644
Raw material consumed
Opening stockAdd: Purchased during the year
Less: Closing stock
178,672 4,869,482 5,048,154(356,554)
4,691,600
179,0132,847,9143,026,927 (178,672)2,848,255
29.1
29.2 Salaries, wages and other benefits include provident fund contribution of Rupees11.817 million (2010: Rupees 11.254 million) by the Company.
DISTRIBUTION COST
Salaries, wages and other benefits (Note 30.1)Freight and shipmentDistributionCommission to selling agentsAdvertisement
19,161 213,803 96,420
310,921878
641,183
16,071182,87770,162
201,101 202
470,413
30.
30.1 Salaries, wages and other benefits include provident fund contribution of Rupees0.720 million (2010: Rupees 0.577 million) by the Company.
Annual Report 201166

(Rupees in thousand)
2011 2010
Notes to the Financial Statements for the Year Ended June 30, 2011
31.1 Salaries, wages and other benefits include provident fund contribution of Rupees3.411 million (2010: Rupees 3.107 million) by the Company.
ADMINISTRATIVE EXPENSES
Salaries, wages and other benefits (Note 31.1)Meeting fee to non-executive directorsTraveling, conveyance and entertainmentRent, rates and taxesRepair and maintenanceInsurancePrinting and stationeryCommunicationSubscriptionLegal and professionalAuditors' remuneration (Note 31.2)Software maintenanceDepreciation (Note 14.1.4)Other charges
110,596245
14,986 2,040
28,582 2,578 2,695 4,068 3,318 6,650 1,188 6,032
15,875 4,045
202,898
97,367 105
11,2191,797
23,1943,2072,2804,5212,3254,3121,1868,568
16,1745,763
182,018
31.
Auditors' remuneration:
Riaz Ahmad and CompanyAudit feeHalf yearly reviewReimbursable expenses
1,00015038
1,188
1,000 150 36
1,186
31.2
OTHER OPERATING EXPENSES
Donations (Note 32.1)Impairment loss on investments (Note 32.2)Provision for doubtful debtsProperty, plant and equipment written offDebit balances written offWorkers' profit participation fundWorkers' welfare fund
13,963 14,987
- 2,066
16 7,158 2,684
40,874
4,39442,8907,115
- 35
17,3807,002
78,816
32.
Annual Report 2011 67

(Rupees in thousand)
2011 2010
Notes to the Financial Statements for the Year Ended June 30, 2011
32.1 The directors and their spouses have no interest in donations made by Companyduring the year.
Impairment loss on investments
Long term investments (Note 16)Short term investments (Note 26)
2,725 12,262 14,987
27,34315,54742,890
32.2
OTHER OPERATING INCOME
Income from financial assetsDividend Income (Note 33.1)Mark-up on loans and advances (Note 33.2)
Income from non-financial assetsSale of empties and scrapRental incomeGain on sale of property, plant and equipmentCredit balances added backResearch and development refundSundry receipts
94,917 55,098
150,015
17,562640
8,204 2,622
--
29,028 179,043
12,567131,358143,925
15,212 227
3,958 197
20,458 790
40,842184,767
33.
Dividend Income
From related parties:Crescent Bahuman Limited-Preference dividendPremier Insurance LimitedCrescent Steel and Allied Products LimitedShams Textile Mills Limited
From others:Crescent Fibres Limited
74,100212
18,629 1,624
94,565
352 94,917
- 148
12,419 -
12,567
-12,567
33.1
Mark-up on loans and advances
AssociateCrescent Bahuman LimitedMark-up on principal portion of short term convertedadvance and long term convertible subordinated loanMark-up on overdue receivables
29,152 25,946 55,098
117,87113,487
131,358
33.2
Annual Report 201168

(Rupees in thousand)
2011 2010
Notes to the Financial Statements for the Year Ended June 30, 2011
FINANCE COST
Mark up on:Long term financingLiabilities against assets subject to finance leaseShort term borrowingsWorkers' profit participation fund (Note 9.2)Bank charges and commission
107,718 1,076
409,702 1,786 6,890
527,172
125,111 -
434,803 206
6,673566,793
34.
PROVISION FOR TAXATION
Charge for the year:Current (Note 35.1)Prior year adjustment
Deferred (Note 35.2)
151,06887
151,155 (51,690)
99,465
90,890 -
90,89027,931
118,821
35.
35.1 Provision for current taxation represents the tax deducted against export sales, minimum tax on local sales and tax on different heads of other operating income under the relevant provisions of the Income Tax Ordinance, 2001. Tax losses available as at June 30, 2011 are Rupees 519.272 million (2010: Rupees 412.212 million). Reconciliation of tax expenses and product of accounting profit multiplied by theapplicable tax rate is not presented, being impracticable.
34.1 Net gain on fair value of derivative financial instruments amounting to Rupees160.472 million (2010: Rupees 27.533 million) is adjusted against finance cost.
34.2 Exchange loss on foreign currency loans of the Company amounting to Rupees15.347 million (2010: 58.056 million) is included in finance cost.
Deferred income tax effect due to :
Tax depreciation allowanceUnused tax lossesTax on investment in associateSurplus on revaluation of operating fixed assets
Opening balance as at July 01,Related to surplus on revaluation ofoperating fixed assets
121,051 (181,745)
18,229114
(42,351) (8,813)
(526) (51,690)
118,107(144,274)
34,861 119
8,81320,344
(1,226)27,931
35.2
Annual Report 2011 69

(Rupees in thousand)
2011 2010
Notes to the Financial Statements for the Year Ended June 30, 2011
(LOSS) / EARNINGS PER SHARE - BASICAND DILUTED (RUPEES)
(Loss) / profit for the year
Weighted average number of ordinary shares
(Loss) / earnings per share
(118,645) 344,670
36.
(Number of Shares)
49 209 923 49 209 923
(Rupees)
(2.41) 7.00
No figure for diluted earnings per share has been presented as the Company has not issued any instrument carrying options which would have an impact on earnings pershare when exercised.
CASH GENERATED FROM OPERATIONS
(Loss) / profit before taxation
Adjustments for non-cash charges and other items:
DepreciationGain on disposal of property, plant and equipmentProperty, plant and equipment written offDebit balances written offImpairment loss on investmentsCredit balances added backProvision for workers' profit participation fundProvision of workers' welfare fundShare of loss / (profit) from associateIncome from loans and advancesFinance costWorking capital changes (Note 37.1)
(19,180)
253,273 (8,204)
2,06616
14,987 (2,622)
7,158 2,684
150,712 (29,152) 527,172
(754,717) 144,193
463,491
262,252(3,958)
- 35
42,890 (197)17,3807,002
(120,022)(117,871)
536,27072,513
1,159,785
37.
36.1
2011 2010
2011 2010
(Rupees in thousand)
2011 2010
Annual Report 201170

(Rupees in thousand)
2011 2010
Notes to the Financial Statements for the Year Ended June 30, 2011
Working capital changes
Decrease / (increase) in current assets:- Stores, spare parts and loose tools- Stock-in-trade- Trade debts- Loans and advances- Short term deposits and prepayments- Interest accrued- Other receivables
Increase in trade and other payables
9,622 (610,853) (810,788) (21,139) (61,148) (2,806)
(72,430)(1,569,542)
814,825 (754,717)
4,347(106,729)(17,588)
36,185(4,534)22,081
(47,537)(113,775)
186,28872,513
37.1
REMUNERATION OF CHIEF EXECUTIVE OFFICER, DIRECTOR AND EXECUTIVES38.
The aggregate amount charged in the financial statements for the year for remuneration including all benefits to Chief Executive Officer, Director andExecutives of the Company is as follows:
Chief Executive Officer
2011 2010
Director
20102011
Executives
20102011
------------------------ (RUPEES IN THOUSAND) ---------------------------
Managerial remunerationAllowancesHouse rentUtilitiesServantMedicalSpecial allowanceReimbursable expensesCost of living allowanceContribution to provident fund
4,900
2,205490240
- -
976 -
3069,117
4,800
2,160 480 240
- -
624 -
3008,604
1,733
780 173 210
- - - -
1083,004
1,980
891 198 240
----
124 3,433
47,381
10,5454,636
4444,0364,309
332211
2,70574,599
39,498
8,883 3,860
444 3,272 3,505
628165
2,343 62,598
Number of persons 1 1 1 1 47 38
Annual Report 2011 71
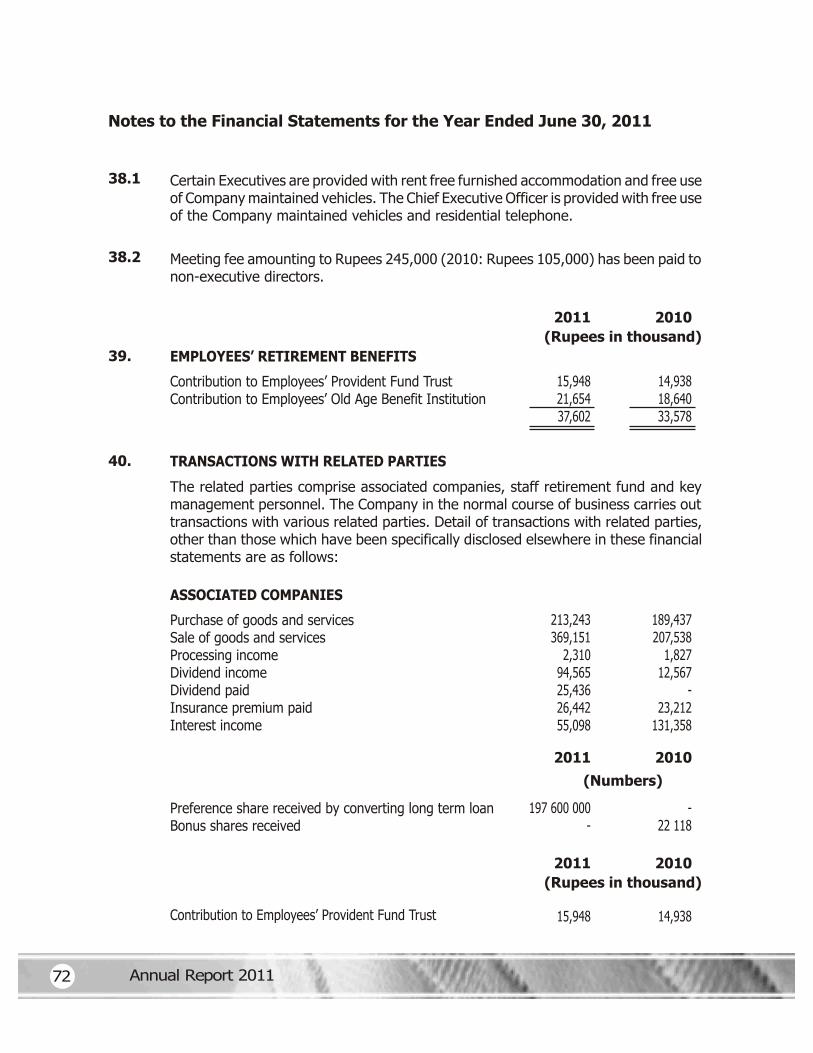
(Rupees in thousand)
2011 2010
Notes to the Financial Statements for the Year Ended June 30, 2011
EMPLOYEES’ RETIREMENT BENEFITS
Contribution to Employees’ Provident Fund TrustContribution to Employees’ Old Age Benefit Institution
15,94821,65437,602
14,938 18,640 33,578
39.
TRANSACTIONS WITH RELATED PARTIES40.
The related parties comprise associated companies, staff retirement fund and key management personnel. The Company in the normal course of business carries out transactions with various related parties. Detail of transactions with related parties, other than those which have been specifically disclosed elsewhere in these financialstatements are as follows:
38.1 Certain Executives are provided with rent free furnished accommodation and free use of Company maintained vehicles. The Chief Executive Officer is provided with free useof the Company maintained vehicles and residential telephone.
38.2 Meeting fee amounting to Rupees 245,000 (2010: Rupees 105,000) has been paid tonon-executive directors.
ASSOCIATED COMPANIES
Purchase of goods and servicesSale of goods and servicesProcessing incomeDividend incomeDividend paidInsurance premium paidInterest income
213,243369,151
2,31094,56525,43626,44255,098
189,437207,538
1,827 12,567
- 23,212131,358
(Numbers)
Preference share received by converting long term loanBonus shares received
197 600 000 -
- 22 118
(Rupees in thousand)
2011 2010
Contribution to Employees’ Provident Fund Trust 15,948 14,938
2011 2010
Annual Report 201172

(Figures in thousand)
2011 2010
Notes to the Financial Statements for the Year Ended June 30, 2011
PLANT CAPACITY AND ACTUAL PRODUCTION
Spinning
100 % plant capacity converted to 20s count basedon 3 shifts per day for 1 095 shifts (2010: 1 095 shifts)
Actual production converted to 20s count basedon 3 shifts per day for 921 shifts (2010: 1 095 shifts)
Weaving
100 % plant capacity at 50 picks based on 3 shiftsper day for 1 095 shifts (2010: 1 095 shifts)
Actual production converted to 50 picks basedon 3 shifts per day for 852 shifts (2010: 1 089 shifts)
Dyeing, Finishing and Home textile
38 562
31 521
97 078
62 361
38 562
36 281
97 078
75 527
41.
(Kgs.)
(Kgs.)
(Sq.Mt.)
(Sq.Mt.)
(Figures)
Power Plant
Generation capacity
Actual generation
257 544
112 311
257 544
138 413
(MWH)
(MWH)
REASON FOR LOW PRODUCTION41.1
Under utilization of available capacity of textile facilities is mainly due to Gas shutdowns. Power plant is operated according to the requirement of electricity.
The plant capacity of these divisions are indeterminable due to multi productplants involving varying processes of manufacturing.
Annual Report 2011 73

SEGMENT INFORMATION42.
SalesCost of salesGross profit
Distribution costAdministrative expenses
Processing & HomeTextile
WeavingSpinning
2011 2010 2010 20102011 2011
6,837,790(6,055,882)
781,908
(64,170)(81,168)
(145,338)
5,043,738(4,081,199)
962,539
(64,296)(72,254)
(136,550)
7,479,241(7,250,664)
228,577
(102,168)(15,934)
(118,102)
5,081,912(5,021,318)
60,594
(41,479)(14,256)(55,735)
8,486,373(8,259,261)
227,112
(471,572)(93,250)
(564,822)
7,013,678(6,749,754)
263,924
(363,506)(84,331)
(447,837)
Profit / (loss) before taxation andunallocated income and expenses
Unallocated income and expenses
Other operating expensesOther operating incomeFinance cost Share of (loss) / profit from associate Provision for taxation
(Loss) / profit after taxation
636,570 825,989 110,475 4,859 (337,710) (183,913)
Total assets for reportablesegments
Unallocated assets
All segment assets are allocated to reportable segments other than those directly relating
Total liabilities for reportablesegments
Unallocated liabilities
All segment liabilities are allocated to reportable segments other than trade and other
Processing & HomeTextile
WeavingSpinning
2011 2010 2010 20102011 2011
1,481,436
1,371,572
1,036,633
1,298,593
1,692,019
1,003,310
1,097,170
909,862
1,778,359
798,694
1,426,442
855,461
---------------------------- (RUPEES IN THOUSAND) -----------------------------
Reconciliation of reportable segment assets and liabilities:
---------------------------- (RUPEES IN THOUSAND) -----------------------------
Notes to the Financial Statements for the Year Ended June 30, 2011
42.1
42.2
Annual Report 201174

Notes to the Financial Statements for the Year Ended June 30, 2011
Trading
20102011
4,059,133(4,011,249)
47,884
(1,874)-
(1,874)
2,336,566(2,229,209)
107,357
---
46,010 107,357
to corporate and tax assets.
payables, corporate borrowings and current and deferred tax liabilities.
Trading
20102011
1,796,283
-
1,688,574
-
Power Generation
20102011
Cold Storage
20102011
Elimination of Inter-segment transactions
20102011
Total - Company
20102011
1,071,292(997,378)
73,914
(1,399)(11,870)(13,269)
941,059(884,107)
56,952
(1,132)(10,572)(11,704)
12,981(7,760)
5,221
-(676)(676)
11,928(6,552)
5,376
-(605)(605)
(13,187,553)13,187,553
-
---
(9,565,495)9,565,495
-
---
14,759,257(13,394,641)
1,364,616
(641,183)(202,898)(844,081)
10,863,386(9,406,644)
1,456,742
(470,413)(182,018)(652,431)
60,645 45,248 4,545 4,771 - - 520,535
(40,874)179,043
(527,172)(150,712)(99,465)
(118,645)
804,311
(78,816)184,767
(566,793)120,022
(118,821)
344,670
Power Generation
20102011
Cold Storage
20102011
444,015
277,585
502,164
321,658
11,832
827
11,471
1,183
Total - Company
20102011
7,203,944
5,412,47712,616,421
3,451,988
5,011,1608,463,148
5,762,454
5,226,24410,988,698
3,386,757
3,289,0956,675,852
------------------------------------------------------- (RUPEES IN THOUSAND) -------------------------------------------------------------
Annual Report 2011 75

(Rupees in thousand)
2011 2010
Notes to the Financial Statements for the Year Ended June 30, 2011
Geographical Information
EuropeAmericaAsia, Africa, AustraliaPakistan
3,987,0491,742,9415,405,3973,623,870
14,759,257
2,662,2671,640,0873,307,8873,253,145
10,863,386
42.3
The Company's revenue from external customers by geographical location is detailed below:42.3.1
42.3.2
Revenue from major customers42.4
Revenue from major customers of Company's trading segment represent Rupees 4,001 million (2010: Rupees 2,294 million). Revenue from other segments of theCompany does not include any major customer.
FINANCIAL RISK MANAGEMENT43.
Financial risk factors43.1
The Company's activities expose it to a variety of financial risks: market risk (including currency risk, other price risk and interest rate risk), credit risk and liquidity risk. The Company's overall risk management programme focuses on the unpredictability of financial markets and seeks to minimize potential adverse effects on the Company's financial performance. The Company uses derivative financial instruments to hedgecertain risk exposures.
Risk management is carried out by the Company's finance department under policies approved by the Board of Directors. The Company's finance department evaluates and hedges financial risks. The Board provides principles for overall risk management, as well as policies covering specific areas such as currency risk, other price risk, interest rate risk, credit risk, liquidity risk, use of derivative financial instruments and non derivative financial instruments and investment of excessliquidity.
All non-current assets of the Company as at reporting date are located and operatingin Pakistan.
Annual Report 201176

Notes to the Financial Statements for the Year Ended June 30, 2011
Market risk(a)
Currency risk(i)
Currency risk is the risk that the fair value or future cash flows of a financial instrument will fluctuate because of changes in foreign exchange rates. Currency risk arises mainly from future commercial transactions or receivablesand payables that exist due to transactions in foreign currencies.
The Company is exposed to currency risk arising from various currency exposures, primarily with respect to the United States Dollar (USD). Currently, the Company's foreign exchange risk exposure is restricted to bank balances, the amounts receivable / payable from / to the foreign entities. The Company uses forward exchange contracts to hedge its foreign currency risk, when considered appropriate. The Company's exposure to currency risk was asfollows:
2011 2010
Cash at banks - USDTrade debts - USDTrade and other payable - USDShort term borrowings - USDDerivative financial instruments - USDNet exposure - USD
24,89535,527,639(241,850)
(33,767,418)(18,399,973)(16,856,707)
70,975 28,094,676 (350,161)
(20,472,955) (9,929,196) (2,586,661)
The following significant exchange rates were applied during the year:
Average rateReporting date rate
85.4186.05
83.8485.60
Rupees per US Dollar
Sensitivity analysis
If the functional currency, at reporting date, had weakened / strengthened by 5% against the USD with all other variables held constant, the impact on (loss) / profit after taxation for the year would have been Rupees 72.526 million higher / lower (2010: Rupees 10.307 million lower / higher), mainly as a result of exchange losses / gains on translation of foreign exchange denominated financial instruments. Currency risk sensitivity to foreign exchange movements has beencalculated on a symmetric basis.
Annual Report 2011 77

Notes to the Financial Statements for the Year Ended June 30, 2011
Currency risk management
The Company manages its exposure to currency risk through continuous monitoring of expected / forecast committed and non-committed foreign currency payments and receipts. Reports on forecast foreign currency transactions, receipts and payments are prepared on monthly bases, exposure to currency risk is measured and appropriate steps are taken to ensure that such exposure is minimized while optimizing return. This includes matching of foreign currency liabilities / payments to assets / receipts, using source inputs in foreign currency and arranging cross currency swaps. The Company maintains foreign currency working capital lines in order to finance production of exportable goods. Proceeds from exports are used to repay / settle / rollover the Company's obligations under these working capital lines which substantially reduces exposure to currency risk in respect of such liabilities. Balances in foreign currency are also maintained in current accounts with bankingcompanies.
Other price risk(ii)
Other price risk represents the risk that the fair value or future cash flows of a financial instrument will fluctuate because of changes in market prices (other than those arising from interest rate risk or currency risk), whether those changes are caused by factors specific to the individual financial instrument or its issuer, or factors affecting all similar financial instruments traded in themarket. The Company is not exposed to commodity price risk.
Sensitivity analysis
The table below summarises the impact of increase / decrease in the Karachi Stock Exchange (KSE) Index on the Company's (loss) / profit after taxation for the year and on equity (fair value reserve). The analysis is based on the assumption that the equity index had increased / decreased by 5% with all other variables held constant and all the Company's equity instruments moved according to the historicalcorrelation with the index.
Index
2011
Impact on (loss) /profit after taxation
Impact on statement of othercomprehensive income (fair value reserve)
2010 2011 2010
----------------------- (Rupees in thousand) -------------------
KSE 100 (5% increase)
KSE 100 (5% decrease)
2,291
(2,291)
3,659
(3,738)
11,428
(11,428)
9,132
(9,047)
Fair value reserve would increase / decrease as a result of gains / losseson equity investments classified as available for sale.
Annual Report 201178

Notes to the Financial Statements for the Year Ended June 30, 2011
Interest rate risk(iii)
This represents the risk that the fair value or future cash flows of a financial instrumentwill fluctuate because of changes in market interest rates.
The Company has no significant interest bearing assets except for preference shares obtained from Crescent Bahuman Limited (CBL). The Company's interest rate risk arises from long term financing, liabilities against assets subject to finance lease and short term borrowings. Financial instruments obtained at variable rates expose the Company to cash flow interest rate risk. Financial instruments obtained at fixed rate expose the Company to fair valueInterest rate risk.
At the balance sheet date the interest rate profile of the Company’s interest bearingfinancial instruments was:
(Rupees in thousand)
2011 2010
Fixed rate instruments
Financial assets
Preference shares-CBLLong term loans and advances
Financial liabilities
Long term financingShort term borrowings
Floating rate instruments
Financial liabilities
Long term financingLiabilities against assets subject to finance leaseShort term borrowings
Fair value sensitivity analysis for fixed rate instruments
1,976,000 -
573,0322,158,620
280,39663,680
3,777,070
-770,400
758,0791,847,600
349,940-
2,992,418
The Company does not account for any fixed rate financial assets and liabilities at fair value through profit or loss. Therefore, a change in interest rate at the balance sheet date would not affect profit or loss of theCompany.
Annual Report 2011 79

Notes to the Financial Statements for the Year Ended June 30, 2011
Cash flow sensitivity analysis for variable rate instruments
If interest rates, at the year end date, fluctuates by 1% higher / lower with all other variables held constant, (loss) / profit after taxation for the year would have been Rupees 38.368 million higher / lower (2010: Rupees 31.117 million lower / higher), as a result of higher / lower interest expense on floating rate borrowings. This analysis is prepared assuming that amounts of liabilities outstanding at balance sheet dates were outstanding for the wholeyear.
Interest rate risk management
The Company manages interest rate risk by analyzing its interest rate exposure on dynamic basis. Cash flow interest rate risk is managed by simulating various scenarios taking into consideration refinancing, renewal of existing positions and alternative financing. Based on these scenarios, the Company calculates impact on profit after taxation and equity of defined interest rate shift, mostly 100 basis points. Cross currency swaps are alsoarranged to transfer exposure to more stable markets.
Credit risk(b)
Credit risk represents the risk that one party to a financial instrument will cause a financial loss for the other party by failing to discharge an obligation. The carrying amount of financial assets represents the maximum credit exposure. The maximumexposure to credit risk at the reporting date was as follows:
(Rupees in thousand)
2011 2010
InvestmentsLoans and advancesDepositsTrade debtsInterest accruedOther receivablesBank balances
2,292,8784,197
66,7743,391,911
2,80683,82017,782
5,860,168
304,903 1,931,235
7,139 2,579,901
- 4,562
15,402 4,843,142
The credit quality of financial assets that are neither past due nor impaired can be assessed by reference to external credit ratings (If available) or to historicalinformation about counterparty default rate:
Annual Report 201180

Notes to the Financial Statements for the Year Ended June 30, 2011
Banks
National Bank of PakistanAllied Bank LimitedBank Alfalah LimitedFaysal Bank LimitedHabib Bank LimitedHabib Metropolitan Bank LimitedMCB Bank LimitedNIB Bank LimitedSamba Bank LimitedSilkbank LimitedStandard Chartered Bank(Pakistan) LimitedUnited Bank LimitedAl-Baraka Bank (Pakistan) LimitedMeezan Bank Limited
Rating
Shortterm
Longterm
Agency (Rupees in thousand)
2011 2010
A-1+A1+A1+A1+A-1+A1+A1+A1+A-1A-2
A1+A-1+A2
A-1+
AAAAAAAAA
AA+AA+AA+AA -
AA -
AAAAA+
AAA-
JCR-VISPACRAPACRAPACRAJCR-VISPACRAPACRAPACRAJCR-VISJCR-VIS
PACRAJCR-VISPACRAJCR-VIS
11,93565415
1317738
4221411 -
1,662165174
2,48417,782
884 2,797
15100273
1,601 7,755
646 11104
240794 36146
15,402
The Company's exposure to credit risk and impairment losses related to trade debts is disclosedin Note 22.
Credit risk management
The Company's financial assets do not carry significant credit risk, with the exception of trade debts, which are exposed to losses arising from any non-performance by counterparties. In respect of trade debts, the Company manages credit risk by limiting significant exposure to any single customer.Formal policies and procedures of credit management and administration of receivables are established and executed. In monitoring customer credit risk, the ageing profile of total receivables and individually significant balances, along with collection activities are reviewed on a regular basis. High risk customers are identified and restrictions are placed on future trading, including suspending future shipments and administering dispatches on a prepaymentbasis or confirmed letters of credit.
Due to the Company's long standing business relationships with these counterparties and after giving due consideration to their strong financial standing, management does not expect non-performance by these counterparties on their obligations to the Company. Accordingly the credit riskis minimal.
Annual Report 2011 81

Notes to the Financial Statements for the Year Ended June 30, 2011
Liquidity risk(c)
Long term financingLiabilities against assetssubject to finance leaseTrade and other payablesAccrued mark-upShort term borrowings
The contractual cash flows relating to the above financial liabilities have been determined on the basis of interest rates / mark up rates effective as at June 30. The rates of interest / mark up have been disclosed in Note 6, 7 and 11 to these financialstatements.
Liquidity risk is the risk that an entity will encounter difficulty in meeting obligations associatedwith financial liabilities.
Contractual maturities of financial liabilities including interest payments as at June 30, 2011:
--------------------------------- (Rupees in thousand) ---------------------------------
CarryingAmount
ContractualCash Flows
6 month orless
6-12 month 1-2 YearMore than 2
Years
853,428
63,6801,238,976
140,7175,935,6908,232,491
997,363
93,3771,238,976
140,7176,276,5598,746,992
256,258
9,4301,238,976
140,7174,339,9405,985,321
142,671
9,430--
1,936,6192,088,720
258,151
18,859---
277,010
340,283
55,658---
395,941
The following are the contractual maturities of financial liabilities as at June 30, 2010:
Long term financingTrade and other payablesAccrued mark-upShort term borrowings
1,108,019465,898106,719
4,840,0186,520,654
1,289,789465,898106,719
5,070,6926,933,098
274,894465,898106,719
3,419,7914,267,302
268,151--
1,650,9011,919,052
317,910---
317,910
428,834---
428,834
The amounts disclosed in the table are undiscounted cash flows.
Liquidity risk management
The Company manages liquidity risk by maintaining sufficient cash and the availability of funding through an adequate amount of committed credit facilities. At June 30, 2011, the Company had Rupees 1,193 million (2010: Rupees 2,069 million) available borrowing limits from financial institutions and Rupees 18.531 million (2010: Rupees 16.419 million) cash and bank balances.Management believes the liquidity risk to be low.
Carrying amount of long term financing as at June 30, 2011 includes overdueinstallment of principal amounting to Rupees 49.993 million (2010: Rupees Nil).
Annual Report 201182
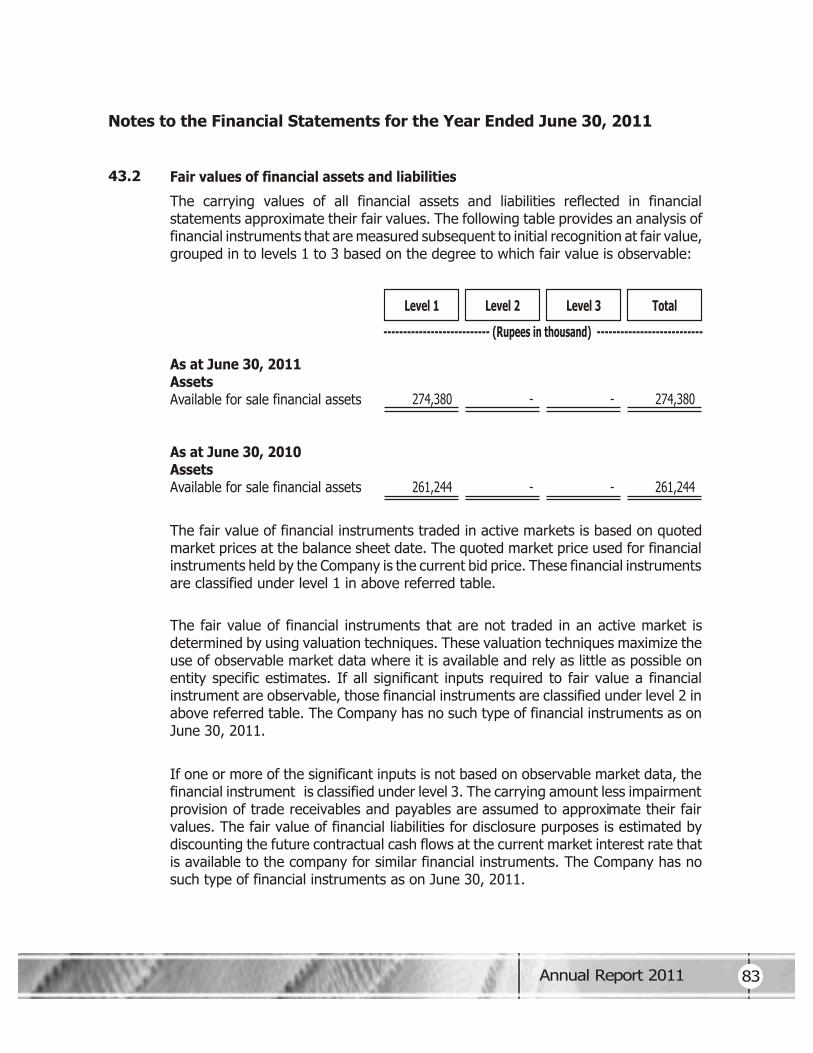
Notes to the Financial Statements for the Year Ended June 30, 2011
Fair values of financial assets and liabilities
The carrying values of all financial assets and liabilities reflected in financial statements approximate their fair values. The following table provides an analysis of financial instruments that are measured subsequent to initial recognition at fair value,grouped in to levels 1 to 3 based on the degree to which fair value is observable:
43.2
Level 1 Level 2 Level 3 Total
As at June 30, 2011AssetsAvailable for sale financial assets
As at June 30, 2010AssetsAvailable for sale financial assets
274,380
261,244
274,380
261,244
-
-
-
-
The fair value of financial instruments traded in active markets is based on quoted market prices at the balance sheet date. The quoted market price used for financial instruments held by the Company is the current bid price. These financial instrumentsare classified under level 1 in above referred table.
The fair value of financial instruments that are not traded in an active market is determined by using valuation techniques. These valuation techniques maximize the use of observable market data where it is available and rely as little as possible on entity specific estimates. If all significant inputs required to fair value a financial instrument are observable, those financial instruments are classified under level 2 in above referred table. The Company has no such type of financial instruments as onJune 30, 2011.
If one or more of the significant inputs is not based on observable market data, the financial instrument is classified under level 3. The carrying amount less impairment provision of trade receivables and payables are assumed to approximate their fair values. The fair value of financial liabilities for disclosure purposes is estimated by discounting the future contractual cash flows at the current market interest rate that is available to the company for similar financial instruments. The Company has nosuch type of financial instruments as on June 30, 2011.
--------------------------- (Rupees in thousand) ---------------------------
Annual Report 2011 83

Notes to the Financial Statements for the Year Ended June 30, 2011
Financial instruments by categories43.3
Loans andreceivables
Availablefor sale
Total
As at June 30, 2011Assets as per balance sheetInvestmentsLoans and advancesDepositsTrade debtsInterest accruedOther receivablesCash and bank balances
2,292,878 4,197
66,774 3,391,911
2,806 83,820 18,531
5,860,917
(Rupees in thousand)
2,292,878------
2,292,878
-4,197
66,7743,391,911
2,806 83,820 18,531
3,568,039
(Rupees in thousand)
Financial liabilities atamortized cost
Liabilities as per balance sheetLong term financingLiabilities against assets subject to finance leaseAccrued mark-upShort term borrowingsTrade and other payables
853,428 63,680140,717
5,935,690 1,238,976 8,232,491
Loans andreceivables
Availablefor sale
Total
As at June 30, 2010Assets as per balance sheetInvestmentsLoans and advancesDepositsTrade debtsOther receivablesCash and bank balances
304,903 1,931,235
7,139 2,579,901
4,562 16,419
4,844,159
(Rupees in thousand)
304,903-----
304,903
-1,931,235
7,1392,579,901
4,562 16,419
4,539,256
Annual Report 201184

(Rupees in thousand)
2011 2010
Notes to the Financial Statements for the Year Ended June 30, 2011
Capital risk management43.4
(Rupees in thousand)
Financial liabilitiesat amortized cost
Liabilities as per balance sheetLong term financingAccrued mark-upShort term borrowingsTrade and other payables
1,108,019106,719
4,840,018465,898
6,520,654
The Company's objectives when managing capital are to safeguard the Company's ability to continue as a going concern in order to provide returns for shareholders and benefits for other stakeholders and to maintain an optimal capital structure to reduce the cost of capital. In order to maintain or adjust the capital structure, the Company may adjust the amount of dividends paid to shareholders, issue new shares or sell assets to reduce debt. Consistent with others in the industry and the requirements of the lenders, the Company monitors the capital structure on the basis of gearing ratio. This ratio is calculated as borrowings divided by total capital employed. Borrowings represent long term financing, liabilities against assets subject to finance lease and short term borrowings obtained by the Company as referred to in Note 6, 7 and 11 respectively. Total capital employed includes 'total equity' as shown in the balance sheet plus 'borrowings'. The Company's strategy, which was unchanged from lastyear, was to maintain a gearing ratio of 60% debt and 40% equity.
BorrowingsTotal equity
Total capital employed
Gearing ratio
6,852,798 2,512,885
9,365,683
73.17
5,948,037 2,672,439
8,620,476
69.00
The increase in the gearing ratio resulted primarily from increase in borrowings fromthe banks and current year losses.
Percentage
Annual Report 2011 85

Notes to the Financial Statements for the Year Ended June 30, 2011
DATE OF AUTHORIZATION FOR ISSUE44.
CORRESPONDING FIGURES45.
Corresponding figures have been re-arranged, wherever necessary for the purpose of comparison. However, no significant re-arrangements have been made during theyear except for the following:
Net gain on fair value of derivative financial instruments is adjusted against finance cost instead of showing separately in other operatingincome.
-
Exchange loss on foreign currency loans is merged in finance cost instead ofshowing separately in other operating expenses.
-
GENERAL46.
Figures have been rounded off to the nearest thousand of Rupees unless otherwisestated.
(Muhammad Anwar)Chairman & Chief Executive
(Khalid Bashir)Director
These financial statements were authorized for issue on October 05, 2011 by the Board of Directors of the company.
Annual Report 201186

62nd Annual General Meeting
PROXY FORM
The Corporate Secretary,The Crescent Textile Mills Limited,40-A, Off: Zafar Ali Road, Gulberg-V,Lahore.
I/We
The Crescent Textile Mills Limited and holder of shares
as per Registered Folio # / CDC Participant ID # / Sub A/C # / Investor A/C #
do hereby appoint
of or failing him
of who is also member of the Company vide Registered Folio
# as my/our Proxy to attend, speak and vote for me/us and on my/our
behalf at the 62th Annual General Meeting of the Company to be held on Monday the
October 31, 2011 at 9:30 a.m. at Registered Office 40-A, Off: Zafar Ali Road, Guliberg V, Lahore
and at any adjournment thereof.
of Faisalabad a member/members of
As witness my hand this day of 2011.
Witness’s Signature
Name:
CNIC:
Address:
Witness’s Signature
Name:
CNIC:
Address:
Date:
Place: Lahore
Note:
1.
2.
Affix Revenue
Stamp of Rs. 5/-
Member’s Signature
Nic #
Cdc A/C #
The Form of Proxy should be deposited at the Registered Office of the Company not later
than 48 hours before the time for holding the meeting.
corporate members should bring the usual documents for such purpose.
CDC Shareholders, entitled to attend and vote at this meeting, must bring with them
their national Identity Cards/Passport in original to provide his/her identity, and in case
of Proxy, must enclosed an attested copy of his/her NIC or Passport. Representatives of
Annual Report 2011 87

Annual Report 20111

Mills & Head OfficeSargodha Road,Faisalabad, PakistanT: +92-041-111-105-105F: +92-041-111-103-104E: [email protected]
Registered Office40-A, Off: Zafar Ali Road, Gulberg-V,Lahore, PakistanT: +92-042-111-245-245F: +92-042-111-222-245E: [email protected]
Share RegistrarCrescent Group Services (Pvt) Ltd.,306, 3rd Flr, Siddiq Trade Centre,72-Main Boulevard, Gulberg,Lahore, PakistanT: +92-042-35787592F: +92-042-35787594E: [email protected]
w w w . c t m . c o m . p k


![The Pakistan Credit Rating Agency Limited · Cotton Mill in Faisalabad [formerly Lyallpur]3. ... Karachi, Kohinoor at Rawalpindi, Nishat, Crescent Textile in Faisalabad and Colony](https://static.fdocuments.us/doc/165x107/5ec112568147643b1241b7bd/the-pakistan-credit-rating-agency-cotton-mill-in-faisalabad-formerly-lyallpur3.jpg)