Annual Report 2011 - Hongkong Land · PB Hongkong Land Annual Report 2011 1 is one of Asia’s...
79
Annual Report 2011 Annual Report 2011 Hongkong Land Holdings Limited
-
Upload
trinhduong -
Category
Documents
-
view
213 -
download
0
Transcript of Annual Report 2011 - Hongkong Land · PB Hongkong Land Annual Report 2011 1 is one of Asia’s...

Ho
ng
kon
g Lan
d H
old
ing
s Limited A
nnual Report 2011
Annual Report 2011Hongkong Land Holdings Limited

Contents
Jardine House as seen from The Rotunda, Exchange Square. Both properties are part of Hongkong Land’s Central portfolio(front cover).
* This rendering is for reference only, subject to change and government approval
Corporate Overview 1
Corporate Information 2
Highlights 3
Chairman’s Statement 4
Chief Executive’s Review 6
Financial Review 12
Directors’ Profiles 18
Financial Statements 20
Independent Auditors’ Report 61
Five Year Summary 62
Responsibility Statement 63
Corporate Governance 64
Principal Risks and Uncertainties 68
Shareholder Information 69
Offices 70
Report of the Valuers 71
Major Property Portfolio 72
Hongkong LandPB Annual Report 2011 1
is one of Asia’s leading property investment, management and development groups. Founded in Hong Kong in 1889, Hongkong Land’s business is built on partnership, integrity and excellence.
In Hong Kong, the Group owns and manages some 450,000 sq. m. (five million sq. ft) of prime commercial space that defines the heart of the Central Business District. In Singapore, it has been instrumental in the creation of the city-state’s new Central Business District at Marina Bay with the expansion of its joint venture portfolio of new developments. Hongkong Land’s properties in these and other Asian centres are recognised as market leaders and house the world’s foremost financial, business and luxury retail names.
Hongkong Land develops premium residential properties in a number of cities in the region, principally in China and Singapore where its subsidiary, MCL Land, is a significant developer.
Hongkong Land Holdings Limited is incorporated in Bermuda. It has a premium listing on the London Stock Exchange, and secondary listings in Bermuda and Singapore. The Group’s assets and investments are managed from Hong Kong by Hongkong Land Limited. Hongkong Land is a member of the Jardine Matheson Group.

Hongkong Land2 Annual Report 2011 3
Corporate Information
Directors
Simon Keswick Chairman
Ben Keswick Managing Director
Y.K. Pang Chief Executive
Charles Allen-Jones
Mark Greenberg
Jenkin Hui
Adam Keswick
Sir Henry Keswick
Lord Leach of Fairford
Dr Richard Lee
A.J.L. Nightingale
Lord Powell of Bayswater KCMG
James Watkins
Percy Weatherall
John R. Witt
Company Secretary and Registered Office
John C. Lang
Jardine House
33–35 Reid Street
Hamilton
Bermuda
Hongkong Land Limited
Directors
Ben Keswick Chairman
Y.K. Pang Chief Executive
R.M.J. Chow
R. Garman
Mark Greenberg
Adam Keswick
D.P. Lamb
N. Leung
James Riley
J.A. Robinson
Giles White
John R. Witt Chief Financial Officer
R. Wong
Corporate Secretary
N.M. McNamara
Hongkong Land2
Hongkong Land2 Annual Report 2011 3
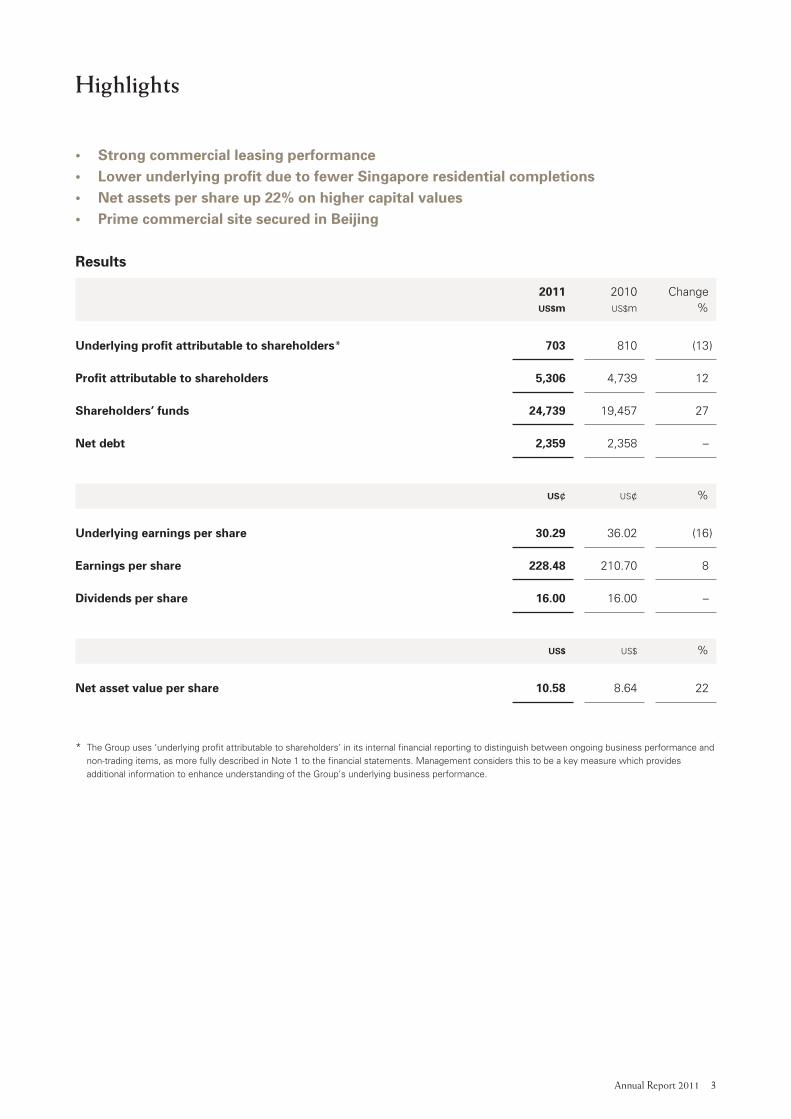
Highlights
• Strongcommercialleasingperformance• LowerunderlyingprofitduetofewerSingaporeresidentialcompletions• Netassetspershareup22%onhighercapitalvalues• PrimecommercialsitesecuredinBeijing
Results
2011 2010 Change US$m US$m %
Underlyingprofitattributabletoshareholders* 703 810 (13 )
Profitattributabletoshareholders 5,306 4,739 12
Shareholders’funds 24,739 19,457 27
Netdebt 2,359 2,358 –
US¢ US¢ %
Underlyingearningspershare 30.29 36.02 (16 )
Earningspershare 228.48 210.70 8
Dividendspershare 16.00 16.00 –
US$ US$ %
Netassetvaluepershare 10.58 8.64 22
* The Group uses ‘underlying profit attributable to shareholders’ in its internal financial reporting to distinguish between ongoing business performance and non-trading items, as more fully described in Note 1 to the financial statements. Management considers this to be a key measure which provides additional information to enhance understanding of the Group’s underlying business performance.

Hongkong Land4 Annual Report 2011 5
Chairman’s Statement
OverviewThe Group’s office and retail portfolio in Hong Kong
produced strong results, and its growing Singapore
portfolio made an increased contribution. This
improvement was, however, more than offset by
lower profits from its residential business with only one
Singapore project completed during the year compared
with three last year. Several new development sites
were secured in the year, including a prime commercial
site in central Beijing and residential sites in Chongqing
and Singapore.
PerformanceUnderlying profit attributable to shareholders for 2011
was US$703 million, 13% below the record result of
2010. Underlying earnings per share decreased by
16%, which also reflected the larger number of issued
shares due to the conversion of convertible bonds
during the year.
Taking into account the net gains resulting from higher
independent valuations of the Group’s investment
properties, including its share of properties in joint
ventures, the profit attributable to shareholders
for 2011 was US$5,306 million, compared with
US$4,739 million for 2010. Net asset value per share
was US$10.58, a 22% increase from the end of 2010.
The Directors are recommending a final dividend of
US¢10.00 per share for 2011, providing a total dividend
for the year of US¢16.00 per share, unchanged
from 2010.
Group ReviewIn Hong Kong, limited new supply of office space
underpinned the market in 2011 against a background
of increasing economic uncertainties. Rental reversions
were largely positive, particularly in the second half,
and vacancy stood at only 2.0% at the year end
compared with 2.9% at the end of 2010. The Group’s
luxury retail portfolio continued to enjoy full occupancy
with increasing rents.
In Singapore, where market conditions remained
stable, the Group benefited from its first full year’s
rental income from the initial two towers of Marina Bay
Financial Centre. The third tower of this development,
which will complete during 2012, is 65% pre-let. At the
Group’s joint venture office development in Jakarta
pre-letting of the fourth tower currently under
construction is now some 80%.
In August, a prime site was secured in Wangfujing,
Beijing which will be developed as a premier retail
centre including a small luxury hotel. The Group also
acquired a property portfolio in Cambodia including
two sites in Phnom Penh for future development.
On the residential side, a further 23 apartments in the
Serenade development in Hong Kong were handed
over to buyers in the year. In Macau, at the One
Central joint venture, 75 units of the project’s final
phase, The Residences & Apartments at Mandarin
Oriental, were handed over to buyers.
In Singapore, only one residential project, Peak@Balmeg
was completed, compared with three projects in 2010.
The three new projects launched for sale in 2011 were
well received and there was a US$44 million reversal
of writedowns previously made in respect of two
of the projects. A site for future development was
acquired in May.
In mainland China, continuing development profits
were earned from 50%-owned Bamboo Grove in
Chongqing and 90%-owned Maple Place in Beijing.
Mid-year sales launches in Chongqing and Shenyang
were well received despite difficult market conditions.
However, sales volumes across the market have
now decreased significantly in response to various
government measures. In December, a 52 hectare site
was secured in Chongqing for a premium residential
development which is adjacent to the Group’s existing
Yorkville project.

Hongkong Land4 Annual Report 2011 5
PeopleThe Group’s excellent reputation for the quality of its
commercial and residential projects and our ongoing
performance reflects the high level of professionalism,
commitment and diligence of our staff which is
much appreciated.
R.C. Kwok retired from the Board on 12th May 2011.
Anthony Nightingale will step down as Managing
Director at the end of March 2012, and will remain as a
non-executive Director. On behalf of the Board, I would
like to thank them for their significant contributions to
the Group. We also welcome Ben Keswick, who will
join the Board as Managing Director on 1st April 2012,
and Adam Keswick, who will become a Director on
the same date.
OutlookGeneral economic uncertainty is likely to have a
negative influence on the Group’s businesses. In
addition, in 2012 the Group has only one residential
project scheduled for completion in Singapore and
residential sales, particularly in China, may be more
challenging. Nevertheless, the Hong Kong portfolio
should continue to benefit from the limited supply of
new commercial space and the Group’s financial and
market position is strong.
Simon KeswickChairman
1st March 2012

Hongkong Land6 Annual Report 2011 7
Chief Executive’s Review
The Group’s well-positioned commercial property
portfolio produced an increased contribution in 2011
and significant capital appreciation, but underlying
profitability was lower than the previous two years
following a reduction in earnings from residential
developments which had made record results in
both these years.
Business Model and StrategyHong Kong’s Central PortfolioThe Group’s most important investment is its prime
portfolio in the heart of Hong Kong’s Central district
of some 450,000 sq. m. of Grade A office and luxury
retail space. The location of this portfolio and its
significant size provides a strong competitive position
to the Group. Continued focus on the returns from
this portfolio is fundamental to the ongoing success
of the Group. While demand for space depends on
overall economic conditions, the tenor of the lease
arrangements provides some protection against
market volatility.
We continue to manage our 12 Grade A office and
retail buildings as a large, integrated mixed-use
development and look for opportunities to improve
their value. In December 2011, we announced that one
of these buildings, The Forum in Exchange Square,
which was previously retail space, will be redeveloped
as a high quality office building. At the same time,
significant enhancements will be made to the
surrounding Exchange Square Plaza.
Retail space in the Central portfolio totals 55,000 sq. m.
and our objective is to ensure that this continues to
be viewed as the most exclusive shopping and dining
destination in Hong Kong. In turn, this contributes
significantly to the prestige and convenience of the
office space, which increases its attraction for premium
tenants. The restaurants across the portfolio, several
of which have been recognised with Michelin stars,
are performing well and are attracting customers to
Central throughout the day and in the evenings.
Our intention is to continue to upgrade the office space
throughout the portfolio, ensuring it remains the most
prestigious within Hong Kong. At the same time, we
will seek to grow our rental yields over the long term,
recognising the desirability of both the quality of space
and of service which it is Hongkong Land’s mandate
to provide to each of our tenants.
Central portfolio tenant profile by area occupied
2006 42% Banks and other financial services
22% Legal 4% Property
9% Accounting 3% Trading
6% Governments 14% Others
2011 39% Banks and other financial services
27% Legal
9% Accounting
5% Governments
5% Property
3% Trading
12% Others

Hongkong Land6 Annual Report 2011 7
Commercial Property Investments in AsiaOver the past few years, the Group has extended its
commercial property interests outside of Hong Kong.
Expansion has been based both on the Group’s strong
financial position and its reputation for quality. To date,
the principal focus has been in Singapore where the
Group now has attributable interests of 164,000 sq. m.
(including its share of properties held through joint
ventures). This is principally premium Grade A office
space and includes the third tower of Marina Bay
Financial Centre which is due for completion in 2012.
The intention is also to develop further the Group’s
portfolio of prime office space in Jakarta which is held
by a 50%-owned joint venture. Construction of a
fourth office tower of 61,000 sq. m. is on schedule
for completion in 2012. In general, our performance
in each of these markets depends on the levels
of demand for and supply of commercial space,
both of which are influenced by the overall
economic environment.
We continue to look for attractive high-quality
commercial projects throughout Asia which will
offer development profits as well as providing
investments to be held for long-term returns including
capital appreciation. In 2011, we secured an iconic
site in Wangfujing located in the heart of Beijing for
approximately US$450 million, which we will develop
and position as the most prestigious shopping and
dining destination in the city. This mixed-use project of
some 131,000 sq. m. will also include a small luxury
hotel and office component. A property portfolio
in Cambodia, principally in Phnom Penh, was also
acquired in 2011. Planning has already commenced
for development of one of these prime sites as a high
quality office and retail complex.
Residential DevelopmentsBased on the Group’s experience throughout Asia,
a strong and profitable residential business has been
established, focusing on premium properties. While
our investment in this activity is significantly smaller
than our commercial business, the residential projects
enhance the Group’s overall profits and returns
on capital.
Annual returns from residential developments
fluctuate due to the nature of the projects and the
accounting policy of only recognising profits on sales
at completion. Demand is also dependent on overall
economic conditions, which can be significantly
affected by government policies. While the Group’s
residential contribution decreased in 2011 compared
with the record levels achieved in 2010 and 2009, the
residential business remains an important contributor
to the Group’s overall profits. Ongoing land acquisitions
are necessary to continue to build this income stream
over the longer term, and in 2011 new sites were
acquired in Singapore and in Chongqing, China.
Top five office tenants (in alphabetical order) in 2011
BNP Paribas
Credit Suisse
JPMorgan
KPMG
PricewaterhouseCoopers
Top five retail tenants (in alphabetical order) in 2011
Dickson Concepts
Giorgio Armani
Gucci
Louis Vuitton
Richemont Group

Hongkong Land8 Annual Report 2011 9
Chief Executive’s Review
Review of Commercial PropertyHong KongWhile the overall level of demand for office space
softened in the final months of 2011, rents rose for
most of the year reflecting continuing demand and
the limited supply of Grade A office space throughout
Hong Kong and in the Central District specifically.
Rents reached record levels surpassing those achieved
in the last cycle which peaked in mid-2008. As a result,
rental reversions were generally positive across the
portfolio, particularly in the second half. The average
rent in 2011 was HK$87.0 per sq. ft compared with
HK$84.3 per sq. ft in 2010, while the office vacancy
at the end of 2011 was 2.0% compared with 2.9%
a year earlier. This vacancy level is unusually low
having been achieved only three times before over
the past 20 years. Financial institutions, law firms and
accounting firms continue to comprise approximately
75% of the office tenants in the Central portfolio.
Economic uncertainties may reduce demand for
office space in 2012 which could affect market rents.
Nevertheless, the Group’s objective of maintaining
positive, or at least neutral, rental reversions is helped
by the lower level of rents on existing leases which
are expiring or are subject to rent review over the next
year compared with current rents.
The Group’s retail portfolio in Hong Kong also
performed well with strong retail sales creating
continued demand for prime space. At the end of
2011, the portfolio was fully occupied, similar to
the end of last year. The average retail rent was
HK$148.3 per sq. ft, an 8% increase over the 2010
average of HK$137.1 per sq. ft.
Long-term capital appreciation also has an important
impact on the Group. During the year, the value of
the Group’s Hong Kong portfolio increased by 26%,
including 7% in the second half, based on independent
valuations performed at 31st December 2011. The total
value of the portfolio is now US$21.7 billion compared
with US$17.3 billion at the end of 2010. This was due
to rising rents as capitalisation rates or equivalent yields
remained stable from a year earlier.
SingaporeFollowing an active 2010, overall leasing activity in
the Singapore market was significantly lower in 2011
while rents were relatively stable. Nevertheless,
Hongkong Land’s improved performance benefited
from a full year’s rental contribution from its one-third
share in the first two towers of Marina Bay Financial
Centre which were completed in 2010. There is no
significant vacancy across the existing portfolio,
including the wholly-owned One Raffles Link and
the one-third owned One Raffles Quay.
Central portfolioat 31st December 2011
Office Retail
Capital value (US$m) 17,615 4,098 *
Gross revenue (US$m) 576 188 *
Equivalent yield (%)
– One and Two Exchange Square 4.50
– The Landmark Atrium 4.50
Average unexpired term
of leases (years) 4.1 2.3
Area subject to renewal/review
in 2012 (%) 20 35
* includes hotel

Hongkong Land8 Annual Report 2011 9
In 2012, the final office tower of Marina Bay
Financial Centre will be completed. This 122,000 sq. m.
tower has been 65% pre-let with DBS Bank as the
largest tenant.
Market conditions are expected to be challenging given
the relative weakness in demand for Grade A office
space, particularly from the financial services sector,
combined with the overall availability of office space
in the market. However, there are no significant leases
expiring in 2012 across the Group’s existing portfolio,
and its quality will enable it to maintain a strong
competitive position.
Other Commercial Property InvestmentsIn Macau, the retail centre at our 47%-owned joint
venture project, One Central, had a strong year
benefiting from growing retail sales. The retail mall
of some 20,000 sq. m. features the world’s leading
luxury brands and is considered the preeminent
shopping venue in the city. Overall occupancy at
the end of 2011 was 93%, including 7% of the space
for which contracts are signed but operations have
yet to begin. The hotel component of One Central,
Mandarin Oriental, Macau, is now firmly established
as the most exclusive hotel in the market.
In Jakarta, the Group’s 50%-owned joint venture
currently owns and manages some 80,000 sq. m.
of space in three buildings located prominently in
the city’s Central Business District. These are 99.7%
let. A fourth tower, which is under construction and
expected to complete in 2012, is nearly 80% pre-let.
Market conditions are generally encouraging, although
rental levels remain low compared with other major
Asian markets.
The Group has other commercial investment properties
in Hanoi, Bangkok and Bermuda, the overall results of
which continue to be satisfactory. The two buildings in
Hanoi, which are approximately 70% owned, remain
fully let at premium rates to the market. In Bangkok,
at the Group’s 49%-owned luxury retail and office
complex, Gaysorn Plaza, trading conditions for the
retailers remained challenging. In Bermuda, Jardine
Gibbons Property, in which Hongkong Land has a 40%
interest, owns four commercial buildings in the centre
of Hamilton.
Central portfolio average office effective rent (US$/sq. ft per month)
2011
11.18
2010
10.85
2009
10.84
2008
8.52
2007
6.33
2006
4.83
2005
3.78
2004
4.04
2003
4.69
2002
5.08

Hongkong Land10 Annual Report 2011 11
Review of Residential PropertyIn 2011, residential markets across the region were affected by both softening buyer sentiment and various government measures to dampen markets after a period of strong growth. The contribution from Hongkong Land’s residential business was significantly lower than the record years of 2010 and 2009 which had benefited from the completion of a number of major projects. Despite this, the year was active with eight new projects or phases being launched, comprising three in Singapore and five in mainland China. Two significant site acquisitions were also made to expand the business further.
Hong KongAt the Group’s 97-unit Serenade project, 23 additional units were handed over to buyers in 2011. At the end of the year, there were 41 units remaining which will be released for sale depending on market conditions.
MacauIn Macau, 75 units of the last residential phase of One Central were handed over to buyers. This phase, The Residences & Apartments at Mandarin Oriental, consists of 92 apartments of which 89% have been sold.
SingaporeIn 2011, only one project was completed in Singapore, the 180 units of the fully pre-sold Peak@Balmeg. In the previous year, three projects were completed, including the Group’s one-third owned project, Marina Bay Residences, which consisted of 428 luxury apartments.
During the year, three new projects were launched for sale by MCL Land, the Group’s wholly-owned Singapore-based residential developer. In May, Terrasse was launched and 80% of the 414 units had been sold by the end of the year. Uber 388 was launched at the end of July and 58% of the 95 units were sold in 2011. Both of these projects are scheduled for completion in 2014. In October, the 121 freehold townhouses of Este Villa were released for sale and 120 units had been sold by the end of the year. This project is scheduled for completion in 2013. In addition, construction continued at three other projects which have been fully pre-sold.
The only project which is due for completion in 2012 is Parvis, a 248-unit development held through a 50%-owned joint venture. In 2013, four projects are scheduled for completion. Three are MCL Land projects totalling 794 units, almost all of which have been pre-sold. The fourth is Marina Bay Suites, a one-third owned joint venture which consists of 221 luxury apartments which were 70% pre-sold at the end of 2011.
Planning continues at three other projects which have yet to be launched. This includes a residential site in Pasir Ris which was acquired in May 2011. In total, these projects will provide some 82,000 sq. m. of residential space.
Mainland ChinaThe Group is active in four cities across mainland China and continues to look for opportunities to expand further. Most of the current projects are in what are referred to as second tier cities, which we view as providing attractive long-term opportunities. However, current conditions throughout China are difficult, particularly due to various government measures to cool the residential property market.
In Chongqing, the largest city in western China, the Group now has four projects including a new site which was acquired in December 2011.
At the Group’s first project in the city, Bamboo Grove, a 50%-owned joint venture with Longfor Properties, three additional residential phases were completed during the year. Phase 3B consists of 143 townhouses which were 100% pre-sold. Phase 4A is 667 high-rise apartment units in four towers which were all sold and mostly handed over to buyers by the end of 2011. Phase 4B is 1,363 high-rise apartment units in eight towers. Of these, 579 units were handed over to buyers by the end of 2011, and of the remaining units which will be completed in the first quarter of 2012, 53% have been sold. These are the only units which are scheduled for completion in 2012.
Construction of the next phases is progressing well. Phase 5A consists of 624 garden apartments, while Phase 5B is 1,167 high-rise apartment units.
On completion, the Bamboo Grove development will comprise some 1.4 million sq. m. of mainly residential
Chief Executive’s Review

Hongkong Land10 Annual Report 2011 11
space, including villas, townhouses and apartments. Of this, 570,000 sq. m. have already been developed and sold while 320,000 sq. m. are now under construction.
The Group’s second project in Chongqing is Landmark Riverside at Dan Zishi, a 50%-owned joint venture with China Merchants Group established in late 2009. This project will consist of approximately 1.5 million sq. m. residential and some prime retail space built over the 34 hectare site in phases. During 2011, construction of Phase 1 commenced which consists of 1,253 high-rise apartments. Presale of a minor portion of Phase 1 began at the end of December 2011.
The Group’s third project is Yorkville at Zhaomushan, near the core area of the new Two-River New Area, which is in the vicinity of the Bamboo Grove development. This wholly-owned project consists of a site of almost 386,000 sq. m. for mainly residential development with a small portion of retail. The total developable area is approximately 880,000 sq. m., which is also being developed in a number of phases. During 2011, construction of the first phase commenced consisting of 324 townhouses.
In December 2011, the Group acquired a 52 hectare site adjacent to the Yorkville project at a cost of approximately US$600 million. The new site is to be developed in phases as a premium residential development, with a total gross floor area of some one million sq. m.
In Chengdu, at the 50%-owned joint venture with KWG Property Holding Group set-up in late 2010, planning is progressing well. The project consists of a site of approximately 190,000 sq. m. which will be used for the development of residential and commercial properties. The total developable area is approximately 900,000 sq. m. with 65% residential, including serviced apartments for strata-sale, and 35% commercial, including office and retail components and a hotel.
In Shenyang, construction continued at two of our 50%-owned residential projects in the city, which are located to the north and south of the Central Business District. At One Capitol, Phase 1A is under construction which consists of 236 townhouses and low-rise apartments of which approximately 51% had been pre-sold by the end of 2011. At Park Life, Phases 2A and 2B are under construction. These consist of 140 townhouses and 234 low-rise apartments, respectively.
These have been 53% pre-sold following their launch in mid-2011. Planning at our third project is underway with construction targeted to commence in 2012.
In Beijing, at the Group’s 90%-owned project, Maple Place, 20 additional units were handed over to buyers. A further 110 units are available for future sale. These consist of villas, townhouses and apartments with a total area of 26,000 sq. m. Most of the units are currently leased but our intention remains to refurbish and sell these units.
At Central Park, our 40%-owned joint venture with the Vantone Group continues to hold 72 apartments which are being operated as serviced apartments.
ConclusionThe Group is in a strong financial position to deal with the challenging economic conditions which are expected to continue in the foreseeable future. At the same time, given this strength, our extensive network throughout the region and our long experience, there may be significant opportunities for both our commercial and residential businesses.
The results in 2012 will continue to be affected by lower residential profits due to the scheduled timing of project completions. In 2013, however, the Group should see a rebound in residential profits as four projects in Singapore are due to complete. Beyond 2013, we also expect to see growing profits from our residential business in mainland China resulting from the significant investments we have made over the past three years. In the meantime, we continue to monitor market conditions and anticipate that this year will be challenging, particularly in the China residential sector.
Finally, we will continue to ensure that our existing investment properties, in particular the prime portfolio in Hong Kong’s Central District, are maintained at the highest standard both in terms of product and service quality for our tenants and customers alike. This is what will protect our strong competitive position over the long term.
Y.K. PangChief Executive
1st March 2012
Hongkong Land12 Annual Report 2011 13
Financial Review
Accounting PoliciesThe accounting policies are consistent with those of
the previous year. The Directors continue to review the
appropriateness of the accounting policies adopted by
the Group with regard to developments in International
Financial Reporting Standards.
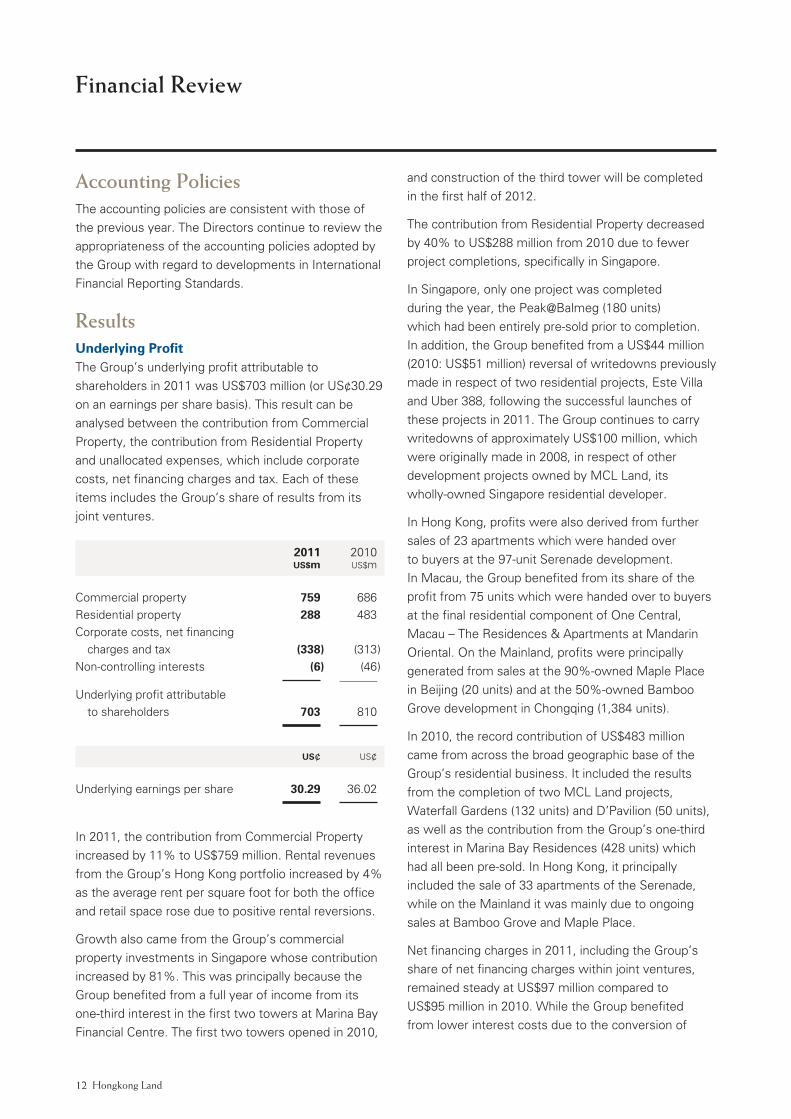
ResultsUnderlying ProfitThe Group’s underlying profit attributable to
shareholders in 2011 was US$703 million (or US¢30.29
on an earnings per share basis). This result can be
analysed between the contribution from Commercial
Property, the contribution from Residential Property
and unallocated expenses, which include corporate
costs, net financing charges and tax. Each of these
items includes the Group’s share of results from its
joint ventures.
2011 2010 US$m US$m
Commercial property 759 686
Residential property 288 483
Corporate costs, net financing
charges and tax (338 ) (313 )
Non-controlling interests (6 ) (46 )
Underlying profit attributable
to shareholders 703 810
US¢ US¢
Underlying earnings per share 30.29 36.02
In 2011, the contribution from Commercial Property
increased by 11% to US$759 million. Rental revenues
from the Group’s Hong Kong portfolio increased by 4%
as the average rent per square foot for both the office
and retail space rose due to positive rental reversions.
Growth also came from the Group’s commercial
property investments in Singapore whose contribution
increased by 81%. This was principally because the
Group benefited from a full year of income from its
one-third interest in the first two towers at Marina Bay
Financial Centre. The first two towers opened in 2010,
and construction of the third tower will be completed
in the first half of 2012.
The contribution from Residential Property decreased
by 40% to US$288 million from 2010 due to fewer
project completions, specifically in Singapore.
In Singapore, only one project was completed
during the year, the Peak@Balmeg (180 units)
which had been entirely pre-sold prior to completion.
In addition, the Group benefited from a US$44 million
(2010: US$51 million) reversal of writedowns previously
made in respect of two residential projects, Este Villa
and Uber 388, following the successful launches of
these projects in 2011. The Group continues to carry
writedowns of approximately US$100 million, which
were originally made in 2008, in respect of other
development projects owned by MCL Land, its
wholly-owned Singapore residential developer.
In Hong Kong, profits were also derived from further
sales of 23 apartments which were handed over
to buyers at the 97-unit Serenade development.
In Macau, the Group benefited from its share of the
profit from 75 units which were handed over to buyers
at the final residential component of One Central,
Macau – The Residences & Apartments at Mandarin
Oriental. On the Mainland, profits were principally
generated from sales at the 90%-owned Maple Place
in Beijing (20 units) and at the 50%-owned Bamboo
Grove development in Chongqing (1,384 units).
In 2010, the record contribution of US$483 million
came from across the broad geographic base of the
Group’s residential business. It included the results
from the completion of two MCL Land projects,
Waterfall Gardens (132 units) and D’Pavilion (50 units),
as well as the contribution from the Group’s one-third
interest in Marina Bay Residences (428 units) which
had all been pre-sold. In Hong Kong, it principally
included the sale of 33 apartments of the Serenade,
while on the Mainland it was mainly due to ongoing
sales at Bamboo Grove and Maple Place.
Net financing charges in 2011, including the Group’s
share of net financing charges within joint ventures,
remained steady at US$97 million compared to
US$95 million in 2010. While the Group benefited
from lower interest costs due to the conversion of
Hongkong Land12 Annual Report 2011 13
a significant number of convertible bonds, particularly
at the beginning of the year, this was offset by higher
facility fees and a higher interest cost at the joint
venture level due to the completion of the first phase
of Marina Bay Financial Centre. During construction,
interest costs had been capitalised.
The average interest rate on Group borrowings was
2.6% in 2011, compared to 2.8% in 2010. The average
interest rate on Group deposits was 0.5% in 2011,
compared with 0.7% in 2010.
The Group’s underlying tax charge, including the Group’s
share of joint ventures, increased to US$190 million
from US$163 million in 2010. The Group’s effective
tax rate was 16.8%, compared with 15.9% in 2010.
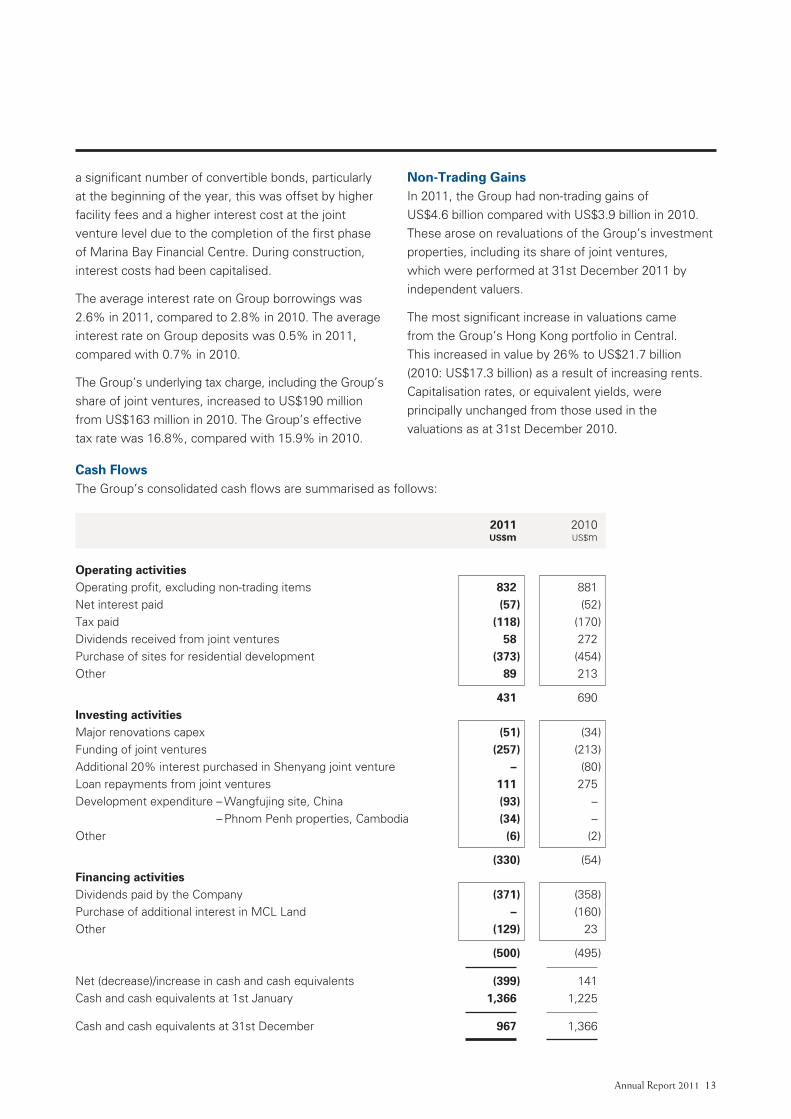
Cash FlowsThe Group’s consolidated cash flows are summarised as follows:
2011 2010 US$m US$m
Operating activitiesOperating profit, excluding non-trading items 832 881
Net interest paid (57 ) (52 )
Tax paid (118 ) (170 )
Dividends received from joint ventures 58 272
Purchase of sites for residential development (373 ) (454 )
Other 89 213
431 690
Investing activitiesMajor renovations capex (51 ) (34 )
Funding of joint ventures (257 ) (213 )
Additional 20% interest purchased in Shenyang joint venture – (80 )
Loan repayments from joint ventures 111 275
Development expenditure – Wangfujing site, China (93 ) –
– Phnom Penh properties, Cambodia (34 ) –
Other (6 ) (2 )
(330 ) (54 )
Financing activities Dividends paid by the Company (371 ) (358 )
Purchase of additional interest in MCL Land – (160 )
Other (129 ) 23
(500 ) (495 )
Net (decrease)/increase in cash and cash equivalents (399 ) 141
Cash and cash equivalents at 1st January 1,366 1,225
Cash and cash equivalents at 31st December 967 1,366
Non-Trading GainsIn 2011, the Group had non-trading gains of
US$4.6 billion compared with US$3.9 billion in 2010.
These arose on revaluations of the Group’s investment
properties, including its share of joint ventures,
which were performed at 31st December 2011 by
independent valuers.
The most significant increase in valuations came
from the Group’s Hong Kong portfolio in Central.
This increased in value by 26% to US$21.7 billion
(2010: US$17.3 billion) as a result of increasing rents.
Capitalisation rates, or equivalent yields, were
principally unchanged from those used in the
valuations as at 31st December 2010.

Hongkong Land14 Annual Report 2011 15
Financial Review
In 2011, cash flows from operating activities were
US$431 million, compared with US$690 million in
2010. While the Group’s operating profit, excluding
non-trading items was US$49 million lower than in
2010, the decrease in cash flows was primarily due
to lower dividends received from joint ventures.
In 2010, the Group benefited from significant dividends
following residential completions at One Central,
Macau and at Marina Bay Residences in Singapore.
In 2011, the Group’s subsidiaries paid US$373 million
in respect of the purchase of sites for future residential
development, compared with US$454 million in 2010.
This included MCL Land’s purchase of a site in Pasir
Ris, Singapore for US$210 million. Additional land
payments were also made for the Group’s residential
sites in mainland China.
Under investing activities in 2011, the Group had
outlays of US$330 million, up from US$54 million
in 2010. These included US$51 million of capital
expenditure related to major renovations, principally
in respect of the Hong Kong Central portfolio, and
US$257 million to fund construction at both the
Group’s one-third owned Marina Bay Financial Centre
project in Singapore and its various joint venture
projects in mainland China. Also, under investment
activities, the Group received US$111 million of
loan repayments from joint ventures, including
US$55 million from One Central, Macau and
US$46 million from Bamboo Grove, compared with
US$275 million in 2010. The repayments in 2010
resulted from the refinancing of One Raffles Quay
in Singapore.
The Group acquired several sites for the development
of commercial property for investment. A site in
Wangfujing, Beijing was secured and US$93 million
was paid in 2011 out of the total site cost of some
US$450 million. Four sites in Cambodia were
purchased for US$34 million and it is expected
that the purchase of a fifth site in Cambodia, in Siem
Reap, will be completed in 2012 for US$2 million.
In 2010, investing activities included US$213 million
to fund construction at various joint ventures
in Singapore, Macau and mainland China and
US$80 million to purchase an additional 20% interest
in the Group’s Shenyang joint venture.
Under financing activities, the Company paid dividends
of US$371 million, being the final 2010 dividend of
US¢10.00 and the 2011 interim dividend of US¢6.00.
In 2010, the Group spent US$160 million on purchasing
an additional 22.6% interest in MCL Land pursuant to
its privatisation and exit offer to the minorities. This
was completed in early 2011 and MCL Land is now a
wholly-owned subsidiary of Hongkong Land.
The Group’s year end cash and cash equivalents
totalled US$1.0 billion compared with US$1.4 billion
in 2010. At 31st December 2011, the Group’s net debt
was US$2.4 billion, unchanged from US$2.4 billion at
the beginning of the year.
DividendsThe Board is recommending an unchanged final
dividend of US¢10.00 per share for 2011 that will
maintain the full-year dividend at US¢16.00 per share.
The final dividend will be payable on 16th May 2012,
subject to approval at the Annual General Meeting
to be held on 9th May 2012, to shareholders on the
register of members at the close of business on
16th March 2012. No scrip alternative is being offered
in respect of the dividend.

Hongkong Land14 Annual Report 2011 15
Treasury PolicyThe Group manages its treasury activities within
established risk management objectives and policies
using a variety of techniques and instruments. The
main objectives are to manage exchange, interest rate
and liquidity risks and to provide a degree of certainty
in respect of costs. The investment of the Group’s
cash balances is managed so as to minimise risk
while seeking to enhance yield.
The Group’s Treasury operations are managed as
cost centres and are not permitted to undertake
speculative transactions unrelated to underlying
financial exposures. Appropriate credit guidelines
are in place to manage counterparty credit risk.
When economically sensible to do so, borrowings
are taken in local currencies to hedge foreign
currency exposures on investments. A portion of
borrowings is denominated in fixed rates. Adequate
headroom in committed facilities is maintained
to facilitate the Group’s capacity to pursue new
investment opportunities.
FundingThe Group is well financed with strong liquidity
and gearing of 10%, down from 12% in 2010.
The decrease in gearing was due to the higher
shareholders’ funds resulting from the increase in value
of investment properties. Interest cover, calculated as
the underlying operating profits, including the Group’s
share of joint ventures’ operating profits, divided by
net financing charges including the Group’s share of
joint ventures’ net financing charges, was strong at
10.3 times, compared with 11.7 times in 2010.
Net debt as a percentage of equity
2007 2011201020092008
Net debt Equity
17% 19% 16% 12% 10%
2011 2010 US$m US$m
US$ convertible bonds 57 373
US$ bonds/notes 1,151 1,707
US$ bank loans – 1
HK$ bonds/notes 609 530
HK$ bank loans 673 335
S$ bonds/notes 446 449
S$ bank loans 391 330
Gross debt 3,327 3,725
Cash 968 1,367
Net debt 2,359 2,358
* Before currency swaps
Year-end debt summary*

Hongkong Land16 Annual Report 2011 17
Financial Review
Both Moody’s and Standard & Poor’s have maintained
their credit ratings of Hongkong Land Holdings Limited
at A3 and A- respectively.
During the year, the Group refinanced a syndicated
facility of S$800 million with facilities from eight
relationship banks totalling S$1.12 billion. A term
of five years applies to S$870 million and a term of
seven years applies to the remaining S$250 million.
The Group also issued US$65 million of bonds under
its US$3.0 billion Medium Term Note programme,
with maturities ranging from 15 to 20 years. Also,
US$336 million of the Group’s 2.75% convertible
bonds due in December 2012 were converted
into equity leaving US$58 million outstanding at
31st December 2011.
The average tenor of the Group’s debt was 5.3 years
at 31st December 2011, compared with 5.2 years at
the end of 2010.
At the end of 2011, the Group had total committed
lines of approximately US$5.2 billion. Of these lines,
57% was sourced from banks with the remaining
43% from capital markets. The Group had drawn
US$3.3 billion from these lines leaving US$1.9 billion
of committed, but unused facilities. Adding the Group’s
year-end cash balances, the Group had overall liquidity
at 31st December 2011 of US$2.9 billion. This is in
line with the Group’s overall liquidity at 31st December
2010 of US$3.0 billion (after excluding the proceeds of
the early refinancing in 2010 of the US$600 million
bonds due in early May 2011).
Debt profile at 31st December 2011
52% Fixed
48% Floating
69% HK$
29% S$
2% US$
43% >5 years
35% 2-5 years
20% 1-2 years
2% <1 year
Interestrate
Currency* Maturity
Committed facility maturity at 31st December 2011 (US$m)
2016& beyond
2,218
20152012 20142013
369260
1,2501,101
* After currency swaps

Hongkong Land16 Annual Report 2011 17
Gross AssetsThe Group’s gross assets, including its share of joint
ventures, (excluding cash balances) is analysed below,
by activity and by location.
Principal Risks and UncertaintiesA review of the principal risks and uncertainties facing
the Group is set out on page 68.
John R. WittChief Financial Officer
1st March 2012
By activity
80% Hong Kong
14% Southeast Asia
5% Mainland China
1% Macau
92% Commercial
8% Residential
By location
80% Hong Kong
14% Southeast Asia
5% Mainland China
1% Macau
92% Commercial
8% Residential

Hongkong Land18 Annual Report 2011 19
Directors’ Profiles
Simon Keswick Chairman
Mr Simon Keswick has been a Director of the Group’s
holding company since 1983. He was Chairman from
1983 to 1988 and was subsequently re-appointed in 1989.
He joined the Jardine Matheson group in 1962 and is
also chairman of Dairy Farm and Mandarin Oriental, and
a director of Jardine Lloyd Thompson, Jardine Matheson
and Jardine Strategic.
Ben Keswick* Managing Director
Mr Ben Keswick joined the Board as Managing Director
in April 2012. He has held a number of executive
positions since joining the Jardine Matheson group in
1998, including finance director and then chief executive
officer of Jardine Pacific between 2003 and 2007 and,
thereafter, group managing director of Jardine Cycle &
Carriage until March 2012. He has an MBA from INSEAD.
Mr Keswick is chairman of Jardine Matheson Limited
and Jardine Cycle & Carriage, and a commissioner of
Astra and United Tractors. He is also managing director
of Dairy Farm, Jardine Matheson, Jardine Strategic and
Mandarin Oriental, and a director of Jardine Pacific and
Jardine Motors.
Y.K. Pang* Chief Executive
Mr Pang joined the Board and was appointed Chief
Executive of the Group in 2007. He previously held
a number of senior executive positions in the Jardine
Matheson group, which he joined in 1984. He is a director
of Jardine Matheson Limited, Jardine Matheson and
Jardine Matheson (China) Limited. He is also chairman
of the Employers’ Federation of Hong Kong and
vice chairman of the Hong Kong General Chamber
of Commerce.
John R. Witt* Chief Financial Officer
Mr Witt joined the Board as Chief Financial Officer in
2010. He is a Chartered Accountant and has an MBA from
INSEAD. He has been with the Jardine Matheson group
since 1993 during which time he has held a number of
senior finance positions. Most recently, he was the chief
financial officer of Mandarin Oriental.
Charles Allen-JonesMr Allen-Jones joined the Board in 2001. He was formerly
senior partner of Linklaters, where he had been a partner
for 33 years until 2001. Mr Allen-Jones is a non-executive
director of Jardine Strategic and Caledonia Investments
and vice chairman of the Council of the Royal College
of Art.
Mark GreenbergMr Greenberg joined the Board in 2006. He is group
strategy director of Jardine Matheson. He had previously
spent 16 years in investment banking with Dresdner
Kleinwort Wasserstein in London. He is also a director
of Jardine Matheson Limited, Dairy Farm, Jardine Cycle
& Carriage and Mandarin Oriental, and a commissioner
of Astra and Bank Permata.
Jenkin HuiMr Hui joined the Board in 1994 and is a director of
Jardine Matheson, Jardine Strategic, Central Development
and a number of property and investment companies.
Adam KeswickMr Adam Keswick joined the Board in April 2012. He is
deputy managing director of Jardine Matheson, chairman
of Jardine Pacific, and chairman and chief executive of
Jardine Motors. He has held a number of executive
positions since joining the Jardine Matheson group
from N M Rothschild & Sons in 2001, including group
strategy director and, thereafter, group managing director
of Jardine Cycle & Carriage between 2003 and 2007.
Mr Keswick is also deputy chairman of Jardine Matheson
Limited, and a director of Dairy Farm, Jardine Strategic,
Mandarin Oriental and Rothschilds Continuation.
Sir Henry KeswickSir Henry first served on the Board of the Group’s holding
company between 1970 and 1975 and was re-appointed
a Director in 1988. He is chairman of Jardine Matheson,
having first joined the group in 1961, and is also chairman
of Jardine Strategic. He is a director of Dairy Farm and
Mandarin Oriental. He is also vice chairman of the Hong
Kong Association.
* Executive Director

Hongkong Land18 Annual Report 2011 19
Lord Leach of FairfordLord Leach has been a Director of the Group’s holding
company since 1985. He is deputy chairman of
Jardine Lloyd Thompson, and a director of Dairy Farm,
Jardine Matheson, Jardine Strategic, Mandarin Oriental
and Rothschilds Continuation. He joined the Jardine
Matheson group in 1983 after a career in banking and
merchant banking.
Dr Richard LeeDr Lee joined the Board in 2003. Dr Lee’s principal
business interests are in the manufacturing of textiles
and apparel in Southeast Asia, and he is the chairman of
TAL Apparel. He is also a director of Jardine Matheson
and Mandarin Oriental.
A.J.L. NightingaleMr Nightingale joined the Board in 2006 and was
Managing Director of the Company from 2006 to March
2012. He held a number of senior positions since first
joining the Jardine Matheson group in 1969 until his
retirement from executive office in March 2012. He is also
a director of Dairy Farm, Jardine Cycle & Carriage, Jardine
Matheson, Jardine Strategic and Mandarin Oriental, and a
commissioner of Astra. Mr Nightingale is also a member
of the Commission on Strategic Development, a member
of the Committee on Strategic Enhancement of Hong
Kong as an International Financial Centre, a vice president
of The Real Estate Developers Association of Hong Kong,
a council member of the Employers’ Federation of Hong
Kong, a Hong Kong representative to the APEC Business
Advisory Council, a member of Chongqing Mayor’s
International Economic Advisory Council and a member
of the UK ASEAN Business Council Advisory Panel.
He is also chairman of The Sailors Home and Missions
to Seamen in Hong Kong.
Lord Powell of Bayswater KCMG
Lord Powell rejoined the Board in 2008, having first served
as a Director between 1992 and 2000. He was previously
Private Secretary and adviser on foreign affairs and
defence to British Prime Ministers, Baroness Thatcher
and Rt Hon John Major. He is a director of Caterpillar,
LVMH Moët Hennessy Louis Vuitton, Matheson & Co,
Mandarin Oriental, Capital Generation Partners, Textron
Corporation, Schindler Holding, Northern Trust Global
Services and Magna Holdings. He is co-chairman of the
UK Government’s Asia Task Force and was previously
president of the China-Britain Business Council and
chairman of the Singapore-British Business Council.
James WatkinsMr Watkins joined the Board in 2009. He was a director
and group general counsel of Jardine Matheson from
1997 to 2003. Mr Watkins qualified as a solicitor in 1969
and was formerly a partner of Linklaters. He is also a
director of Advanced Semiconductor Manufacturing
Corporation, Asia Satellite Telecommunications Holdings,
Global Sources, IL&FS India Realty Fund II, Jardine Cycle
& Carriage and Mandarin Oriental.
Percy WeatherallMr Weatherall joined the Board in 1994 and was
Managing Director from 2000 to 2006. He first joined
the Jardine Matheson group in 1976 and retired from
executive office in 2006. He is also a director of Dairy
Farm, Jardine Matheson, Jardine Strategic and Mandarin
Oriental. He is chairman of Corney and Barrow.
1st April 2012

Hongkong Land20 Annual Report 2011 21
2011 2010 Underlying Non- Underlying Non-
business trading business trading
performance items Total performance items Total
Note US$m US$m US$m US$m US$m US$m
Revenue 5 1,223.7 – 1,223.7 1,340.6 – 1,340.6
Net operating costs 6 (392.0 ) – (392.0 ) (459.2 ) – (459.2 )
831.7 – 831.7 881.4 – 881.4
Change in fair value of investment properties 11 – 4,382.7 4,382.7 – 3,197.6 3,197.6
Asset impairment provisions, reversals
and disposals 11 – – – – 0.1 0.1
Operating profit 831.7 4,382.7 5,214.4 881.4 3,197.7 4,079.1
Financing charges (99.7 ) – (99.7 ) (112.3 ) – (112.3 )
Financing income 33.2 – 33.2 35.2 – 35.2
Net financing charges 7 (66.5 ) – (66.5 ) (77.1 ) – (77.1 )
Share of results of associates and joint ventures 8 76.3 221.7 298.0 173.9 731.4 905.3
Profit before tax 841.5 4,604.4 5,445.9 978.2 3,929.1 4,907.3
Tax 9 (133.6 ) (0.9 ) (134.5 ) (122.8 ) 0.7 (122.1 )
Profit after tax 707.9 4,603.5 5,311.4 855.4 3,929.8 4,785.2
Attributable to:
Shareholders of the Company 703.4 4,603.0 5,306.4 810.2 3,929.2 4,739.4
Non-controlling interests 4.5 0.5 5.0 45.2 0.6 45.8
707.9 4,603.5 5,311.4 855.4 3,929.8 4,785.2
US¢ US¢
Earnings per share 10
– basic 228.48 210.70
– diluted 227.13 202.30
Consolidated Profit and Loss Accountfor the year ended 31st December 2011

Hongkong Land20 Annual Report 2011 21
Consolidated Statement of Comprehensive Income for the year ended 31st December 2011
2011 2010
Note US$m US$m
Profit for the year 5,311.4 4,785.2
Revaluation of other investments 14 (10.7 ) 11.0
Net actuarial (loss)/gain on employee benefit plans (4.6 ) 0.2
Net exchange translation differences 36.9 59.1
Cash flow hedges
– net loss arising during the year (1.2 ) (17.1 )
– transfer to profit and loss 5.8 7.2
4.6 (9.9 )
Share of other comprehensive income of associates and joint ventures 2.8 80.8
Tax relating to components of other comprehensive income 9 (0.2 ) 1.1
Other comprehensive income for the year 28.8 142.3
Total comprehensive income for the year 5,340.2 4,927.5 Attributable to:
Shareholders of the Company 5,335.2 4,870.4
Non-controlling interests 5.0 57.1
5,340.2 4,927.5

Hongkong Land22 Annual Report 2011 23
At 31st December
2011 2010
Note US$m US$m
Net operating assets Tangible assets 12
Investment properties 22,529.9 18,036.0
Others 5.3 4.2
22,535.2 18,040.2
Associates and joint ventures 13 3,551.8 3,177.7
Other investments 14 48.6 59.2
Deferred tax assets 15 5.5 7.1
Pension assets 16 6.4 10.6
Non-current debtors 18 72.0 51.5
Non-current assets 26,219.5 21,346.3
Properties for sale 17 1,521.2 1,184.4
Current debtors 18 313.5 245.1
Current tax assets 1.5 –
Bank balances 19 967.9 1,366.7
Current assets 2,804.1 2,796.2
Current creditors 20 (746.3 ) (723.4 )
Current borrowings 21 (58.0 ) (859.7 )
Current tax liabilities (82.5 ) (69.2 )
Current liabilities (886.8 ) (1,652.3 )
Net current assets 1,917.3 1,143.9
Long-term borrowings 21 (3,269.2 ) (2,864.8 )
Deferred tax liabilities 15 (59.4 ) (54.8 )
Non-current creditors 20 (44.4 ) (93.1 )
24,763.8 19,477.5
Total equity
Share capital 22 233.8 225.1
Revenue and other reserves 24,504.7 19,231.5
Shareholders’ funds 24,738.5 19,456.6
Non-controlling interests 25.3 20.9
24,763.8 19,477.5
Approved by the Board of Directors on 1st March 2012
A.J.L. NightingaleY.K. PangDirectors
Consolidated Balance Sheetat 31st December 2011

Hongkong Land22 Annual Report 2011 23
Attributable Attributable to shareholders of the Company to non- Share Share Revenue Capital Hedging Exchange controlling Total capital premium reserves reserves reserves reserves Total interests equity
Note US$m US$m US$m US$m US$m US$m US$m US$m US$m
2011
At 1st January 225.1 5.3 18,900.7 62.5 (16.2 ) 279.2 19,456.6 20.9 19,477.5Total comprehensive income – – 5,291.9 – 2.5 40.8 5,335.2 5.0 5,340.2Dividends paid by the
Company 23 – – (372.5 ) – – – (372.5 ) – (372.5 )Dividends paid to
non-controlling
shareholders – – – – – – – (0.6 ) (0.6 )Issue of shares 8.7 310.5 – – – – 319.2 – 319.2Transfer – – 61.0 (61.0 ) – – – – –
At 31st December 233.8 315.8 23,881.1 1.5 (13.7 ) 320.0 24,738.5 25.3 24,763.8
2010
At 1st January 224.9 – 14,504.6 63.4 (7.4 ) 150.6 14,936.1 135.4 15,071.5
Total comprehensive income – – 4,750.6 – (8.8 ) 128.6 4,870.4 57.1 4,927.5
Dividends paid by the
Company 23 – – (359.9 ) – – – (359.9 ) – (359.9 )
Dividends paid to
non-controlling
shareholders – – – – – – – (8.1 ) (8.1 )
Issue of shares 0.2 5.3 – – – – 5.5 – 5.5
Change in interests
in subsidiaries – – 4.5 – – – 4.5 (163.5 ) (159.0 )
Transfer – – 0.9 (0.9 ) – – – – –
At 31st December 225.1 5.3 18,900.7 62.5 (16.2 ) 279.2 19,456.6 20.9 19,477.5
The comprehensive income included in revenue reserves comprises profit attributable to shareholders of US$5,306.4 million
(2010: US$4,739.4 million), net fair value loss on other investments of US$10.7 million (2010: gain of US$11.0 million) and net
actuarial loss on employee benefit plans of US$3.8 million (2010: gain of US$0.2 million). Cumulative net fair value gain on other
investments and net actuarial loss on employee benefit plans amounted to US$8.8 million (2010: US$19.5 million) and US$3.0 million
(2010: gain of US$0.8 million), respectively.
Consolidated Statement of Changes in Equityfor the year ended 31st December 2011

Hongkong Land24 Annual Report 2011 PB
Consolidated Cash Flow Statementfor the year ended 31st December 2011
2011 2010
Note US$m US$m
Operating activities Operating profit 5,214.4 4,079.1
Depreciation 6 1.7 1.1
Reversal of writedowns on development properties held for sale 6 (44.2 ) (50.9 )
Change in fair value of investment properties (4,382.7 ) (3,197.6 )
Asset impairment provisions, reversals and disposals – (0.1 )
Increase in properties for sale (298.8 ) (296.6 )
(Increase)/decrease in debtors, prepayments and others (70.7 ) 79.3
Increase in creditors and accruals 33.2 26.1
Interest received 35.8 38.2
Interest and other financing charges paid (93.0 ) (90.2 )
Tax paid (117.4 ) (169.7 )
Dividends from associates and joint ventures 58.0 271.7
Cash flows from operating activities 336.3 690.4
Investing activities Major renovations expenditure (50.8 ) (34.6 )
Developments capital expenditure (38.3 ) (0.2 )
Investments in and loans to associates and joint ventures (146.2 ) (17.9 )
Purchase of other investments – (2.0 )
Cash flows from investing activities (235.3 ) (54.7 )
Financing activities Drawdown of borrowings 1,068.1 1,404.2
Repayment of borrowings (1,193.4 ) (1,380.6 )
Change in interests in subsidiaries 24 – (159.9 )
Repayment to non-controlling shareholders (6.1 ) (11.1 )
Dividends paid by the Company (370.9 ) (358.2 )
Dividends paid to non-controlling shareholders (0.6 ) (7.8 )
Cash flows from financing activities (502.9 ) (513.4 )
Effect of exchange rate changes 2.9 18.4
Net (decrease)/increase in cash and cash equivalents (399.0 ) 140.7
Cash and cash equivalents at 1st January 1,365.7 1,225.0
Cash and cash equivalents at 31st December 24 966.7 1,365.7

Notes to the Financial Statements
Hongkong LandPB Annual Report 2011 25
1 Principal Accounting Policies
Basis of preparation
The financial statements have been prepared in accordance with International Financial Reporting Standards, including
International Accounting Standards and Interpretations adopted by the International Accounting Standards Board. The financial
statements have been prepared under the historical cost convention except as disclosed in the accounting policies below.
Standards, amendments and interpretations effective in 2011 which are relevant to the Group’s operations
Revised IAS 24 Related Party Disclosures
Amendment to IAS 32 Classification of Rights Issues
Amendments to IFRIC 14 Prepayments of a Minimum Funding Requirement
IFRIC 19 Extinguishing Financial Liabilities with Equity Instruments
Improvements to IFRSs (2010)
The adoption of these standards, amendments and interpretations does not have a material impact on the Group’s
accounting policies.
Revised IAS 24 ‘Related Party Disclosures’ supersedes IAS 24 (as revised in 2003). It simplifies the disclosure requirements
for government-related entities and clarifies the definition of a related party.
Amendment to IAS 32 ‘Classification of Rights Issues’ clarifies that rights issues are equity instruments when they
are denominated in a currency other than the issuer’s functional currency and are issued pro-rata to an entity’s existing
shareholders for a fixed amount of currency.
Amendments to IFRIC 14 ‘Prepayments of a Minimum Funding Requirement’ require an entity to recognise an asset for
a prepayment that will reduce future minimum funding contributions required by the entity.
IFRIC 19 ‘Extinguishing Financial Liabilities with Equity Instruments’ provides guidance on the application of IAS 39 and IAS 32
when an entity issues its own equity instruments to extinguish all or part of a financial liability.
The Improvements to IFRSs (2010) comprise a number of non-urgent but necessary amendments to IFRSs. The amendments
which are relevant to the Group’s operations include IFRS 3 (amendments) ‘Business Combinations’, IFRS 7 (amendments)
‘Financial Instruments: Disclosures’, IAS 1 (amendments) ‘Presentation of Financial Statements’, IAS 34 (amendments) ‘Interim
Financial Reporting’ and IFRIC 13 (amendment) ‘Customer Loyalty Programmes’.
IFRS 3 (amendments) ‘Business Combinations’ clarify the transition requirements for contingent consideration from business
combination that occurred before the effective date of the revised IFRS, the measurement of non-controlling interests and
un-replaced and voluntarily replaced share-based payment awards.
IFRS 7 (amendments) ‘Financial Instruments: Disclosures’ emphasise the interaction between qualitative and quantitative
disclosures and the nature and extent of risks associated with financial instruments.
IAS 1 (amendments) ‘Presentation of Financial Statements’ clarify that entities may present the required reconciliations
for each component of other comprehensive income either in the statement of changes in equity or in the notes to the
financial statements.
IAS 34 (amendments) ‘Interim Financial Reporting’ provide guidance to illustrate how to apply disclosure principles in IAS 34 and
add disclosure requirements around the circumstances likely to affect fair values of financial instruments and their classification,
transfers of financial instruments between different levels of fair value hierarchy, changes in classification of financial assets and
changes in contingent liabilities and assets.
IFRIC 13 (amendment) ‘Customer Loyalty Programmes’ clarifies that when the fair value of award credits is measured on the
basis of the value of the awards for which they could be redeemed, the fair value of the award credits should take account of
expected forfeitures as well as the discounts or incentives that would otherwise be offered to customers who have not earned
award credits from an initial sale.

Notes to the Financial Statements
Hongkong Land26 Annual Report 2011 27
1 Principal Accounting Policies continued
Basis of preparation continued
Standards and amendments effective after 2011 which are relevant to the Group’s operations and yet to be adopted
Amendments to IFRS 7 Financial Instruments: Disclosures on Derecognition
IFRS 9 Financial Instruments
IFRS 10 Consolidated Financial Statements
IFRS 11 Joint Arrangements
IFRS 12 Disclosure of Interests in Other Entities
IFRS 13 Fair value Measurement
Amendments to IAS 1 Presentation of Items of Other Comprehensive Income
IAS 19 (amended 2011) Employee Benefits
IAS 27 (2011) Separate Financial Statements
IAS 28 (2011) Investments in Associates and Joint Ventures
Amendments to IFRS 7 ‘Financial Instruments: Disclosures on Derecognition’ (effective for annual period beginning 1st July 2011)
promotes transparency in the reporting of transfer transactions and improves users’ understanding of the risk exposures relating
to transfer of financial assets and the effect of those risks on an entity’s financial position particularly those involving securitisation
of financial assets.
IFRS 9 ‘Financial Instruments’ (effective from 1st January 2015) is the first standard issued as part of a wider project to replace
IAS 39. IFRS 9 retains but simplifies the mixed measurement model and establishes two primary measurement categories for
financial assets: amortised cost and fair value. The basis of classification depends on the entity’s business model and the
contractual cash flow characteristics of the financial asset. IFRS 9 is likely to affect the Group’s accounting for its financial
assets. The Group has yet to assess the full impact of IFRS 9 and will apply the standard from 1st January 2015.
IFRS 10 ‘Consolidated Financial Statements’ (effective 1st January 2013) replaces SIC Interpretation 12 ‘Consolidation –
Special Purpose Entities’ and most of IAS 27 ‘Consolidated and Separate Financial Statements’. It contains a new single
consolidation model that identifies control as the basis for consolidation for all types of entities. It provides a definition of control
that comprises the elements of power over an investee; exposure of rights to variable returns from an investees; and ability
to use power to affect the reporting entity’s returns. The Group has yet to assess the full impact of IFRS 10 and will apply
the standard from 1st January 2013.
IFRS 11 ‘Joint Arrangements’ (effective 1st January 2013) replaces IAS 31 ‘Interests in Joint Ventures’ and classifies joint
arrangements as either joint operations (whereby the parties that have joint control have rights to the assets and obligations for
the liabilities of the joint arrangements) or joint ventures (whereby the parties that have joint control have rights to the net assets
of the joint arrangements). It prescribes the accounting for interests in joint operations as its interest in the assets, liabilities,
revenues and expenses. The current option permitted by IAS 28 (amended) to proportionately consolidate for joint ventures is
no longer permitted. The Group has yet to assess the full impact of IFRS 11 and will apply the standard from 1st January 2013.
IFRS 12 ‘Disclosure of Interests in Other Entities’ (effective 1st January 2013) requires entities to disclose information that helps
financial statements readers to evaluate the nature, risks and financial effects associated with the entity’s interests in subsidiaries,
associates, joint arrangements and unconsolidated structured entities. Disclosure required includes significant judgements and
assumptions made in determining whether an entity controls, jointly controls, significantly influences or has some other interest
in other entities. The Group will apply the standard from 1st January 2013.
IFRS 13 ‘Fair Value Measurement’ (effective 1st January 2013) requires entities to disclose information about the valuation
techniques and inputs used to measure fair value, as well as information about the uncertainty inherent in fair value measurements.
The standard applies to both financial and non-financial items measured at fair value. Fair value is now defined as ‘the price that
would be received to sell an asset or paid to transfer a liability in an orderly transaction between market participants at the
measurement date’ (i.e. an exit price). The Group will apply the standard from 1st January 2013.
Amendments to IAS 1 ‘Presentation of Items of Other Comprehensive Income’ (effective from 1st July 2012) improves the
consistency and clarity of the presentation of items of other comprehensive income. The amendments require entities to separate
items presented in other comprehensive income into two groups, based on whether or not they may be recycled to profit or
loss in the future. Items that will not be recycled − such as actuarial gains or losses on defined benefit pension plans − will be
presented separately from items that may be recycled in the future − such as deferred gains and losses on cash flow hedges.
The amounts of tax related to the two groups are required to be allocated on the same basis. The Group will apply the standard
from 1st January 2013.

Hongkong Land26 Annual Report 2011 27
1 Principal Accounting Policies continued
Basis of preparation continued
Standards and amendments effective after 2011 which are relevant to the Group’s operations and yet to be adopted continued
IAS 19 (amended 2011) ‘Employee Benefits’ (effective 1st January 2013) requires the assumed return on plan assets recognised
in the profit and loss to be the same as the rate used to discount the defined benefit obligation. It also requires actuarial gains
and losses to be recognised immediately in other comprehensive income and past service costs immediately in profit or
loss. Additional disclosures are required to present the characteristics of benefit plans, the amount recognised in the financial
statements, and the risks arising from defined benefit plans and multi-employer plans. The Group will apply the standard from
1st January 2013.
IAS 27 (2011) ‘Separate Financial Statements’ (effective 1st January 2013) supersedes IAS 27 (2008) and prescribes the
accounting and disclosure requirements for investments in subsidiaries, joint ventures and associates when an entity prepares
separate financial statements. There will be no impact on the consolidated financial statements as the changes only affect the
separate financial statements of the investing entity.
IAS 28 (2011) ‘Investments in Associates and Joint Ventures’ (effective 1st January 2013) supersedes IAS 28 (2008) and
prescribes the accounting for investments in associates and joint ventures and sets out the requirements for the application
of the equity method when accounting for investments in associates and joint ventures. The adoption of this standard is not
expected to have any significant impact on the results of the Group as the Group is already following the standard.
In addition to the above, the IASB has also issued IFRS 9 ‘Financial Instruments’ (2009) and IFRS 9 (2010) which are effective
from 1st January 2013. However, in August 2011, the IASB issued an exposure draft that proposes to delay the effective date
of IFRS 9, ‘Financial instruments’, to annual periods beginning on or after 1st January 2015. The original effective date was for
annual periods beginning on or after from 1st January 2013. This proposal is a result of the extension of the IASB’s timeline
for completing the remaining phases (for example, impairment and hedge accounting) of its project to replace IAS 39 beyond
June 2011. IFRS 9 (2009) is the first standard issued as part of a wider project to replace IAS 39. It retains but simplifies the
mixed measurement model and establishes two primary measurement categories for financial assets: amortised cost and fair
value. The basis of classification depends on the entity’s business model and the contractual cash flow characteristics of the
financial asset. The guidance in IAS 39 on impairment of financial assets and hedge accounting continues to apply. IFRS 9 (2010)
adds the requirements related to the classification and measurement of financial liabilities, and derecognition of financial assets
and liabilities, to the version issued in November 2009. It also includes those paragraphs of IAS 39 dealing with how to measure
fair value and accounting for derivatives embedded in a contract that contains a host that is not a financial asset, as well as the
requirements of IFRIC 9 ‘Remeasurement of Embedded Derivatives’. The Group will apply the standard from 1st January 2015.
The principal operating subsidiaries, associates and joint ventures have different functional currencies in line with the economic
environments of the locations in which they operate. The functional currency of the Company is United States dollars. The consolidated
financial statements are presented in United States dollars.
The Group’s reportable segments are set out in Note 4.
Basis of consolidation
i) The consolidated financial statements include the financial statements of the Company, its subsidiaries, and its associates
and joint ventures.
ii) Subsidiaries are entities over which the Group has the power to govern the financial and operating policies. The purchase
method of accounting is used to account for the acquisition of subsidiaries by the Group. The cost of an acquisition includes
the fair value at the acquisition date of any contingent consideration. In a business combination achieved in stages, the Group
remeasures its previously held interest in the acquiree at its acquisition-date fair value and recognised the resulting gain or
loss in profit and loss. Changes in a parent’s ownership interest in a subsidiary that do not result in the loss of control are
accounted for as equity transactions. When control over a previous subsidiary is lost, any remaining interest in the entity
is remeasured at fair value and the resulting gain or loss is recognised in profit and loss.
All material intercompany transactions, balances and unrealised surpluses and deficits on transactions between Group
companies have been eliminated. The cost of and related income arising from shares held in the Company by subsidiaries
are eliminated from shareholders’ funds and non-controlling interests, and profit respectively.

Notes to the Financial Statements
Hongkong Land28 Annual Report 2011 29
1 Principal Accounting Policies continued
Basis of consolidation continued
iii) Associates are entities, not being subsidiaries or joint ventures, over which the Group exercises significant influence.
Joint ventures are entities which the Group jointly controls with one or more other venturers. Associates and joint ventures
are included on the equity basis of accounting.
iv) Non-controlling interests represent the proportion of the results and net assets of subsidiaries and their associates and
joint ventures not attributable to the Group.
v) The results of subsidiaries, associates and joint ventures are included or excluded from their effective dates of acquisition
or disposal respectively. The results of entities other than subsidiaries, associates and joint ventures are included to the
extent of dividends received when the right to receive such dividend is established.
Foreign currencies
Transactions in foreign currencies are accounted for at the exchange rates ruling at the transaction dates.
Assets and liabilities of subsidiaries, associates and joint ventures, together with all other monetary assets and liabilities
expressed in foreign currencies, are translated into United States dollars at the rates of exchange ruling at the year end. Results
expressed in foreign currencies are translated into United States dollars at the average rates of exchange ruling during the year,
which approximate the exchange rates at the dates of the transactions.
Exchange differences arising from the retranslation of the net investment in foreign subsidiaries, associates and joint ventures,
and of financial instruments which are designated as hedges of such investments, are recognised in other comprehensive income
and accumulated in equity under exchange reserves. On the disposal of these investments which results in the loss of control,
such exchange differences are recognised in profit and loss. Exchange differences on available-for-sale investments are recognised
in other comprehensive income as part of the gains and losses arising from changes in their fair value. Exchange differences
relating to changes in the amortised cost of monetary securities classified as available-for-sale and all other exchange differences
are recognised in profit and loss.
Goodwill and fair value adjustments arising on acquisition of a foreign entity after 1st January 2003 are treated as assets and
liabilities of the foreign entity and translated into United States dollars at the rate of exchange ruling at the year end.
Impairment
Assets that have indefinite useful lives are not subject to amortisation and are tested for impairment annually and whenever there
is an indication that the assets may be impaired. Assets that are subject to amortisation are reviewed for impairment whenever
events or changes in circumstances indicate that the carrying amount may not be recoverable. For the purpose of assessing
impairment, assets are grouped at the lowest level for which there is separately identifiable cash flows. Cash-generating units or
groups of cash-generating units to which goodwill has been allocated are tested for impairment annually and whenever there is
an indication that the units may be impaired. An impairment loss is recognised for the amount by which the carrying amount of
the asset exceeds its recoverable amount, which is the higher of an asset’s fair value less costs to sell and value in use.
Intangible assets
Goodwill represents the excess of the cost of an acquisition over the fair value of the Group’s share of the net identifiable assets
of the acquired subsidiary, associate or joint venture at the effective date of acquisition. Non-controlling interests are measured at
their proportionate share of the net identifiable assets at the acquisition date. If the cost of acquisition is less than the fair value of
the net assets acquired, the difference is recognised directly in profit and loss. Goodwill on acquisitions of subsidiaries is included
in intangible assets. Goodwill on acquisitions of associates and joint ventures is included in investment in associates and joint
ventures. Goodwill is allocated to cash-generating units or groups of cash-generating units for the purpose of impairment testing
and is carried at cost less accumulated impairment loss.
The profit or loss on disposal of subsidiaries, associates and joint ventures includes the carrying amount of goodwill relating to
entity sold.

Hongkong Land28 Annual Report 2011 29
1 Principal Accounting Policies continued
Tangible fixed assets and depreciation
Depreciation of tangible fixed assets is calculated on the straight line basis to allocate the cost or valuation of each asset to
its residual value over its estimated useful life. The residual values and useful lives are reviewed at each balance sheet date.
The estimated useful lives are as follows:
Furniture, equipment and motor vehicles 3 – 10 years
Where the carrying amount of a tangible fixed asset is greater than its estimated recoverable amount, it is written down
immediately to its recoverable amount.
The profit or loss on disposal of tangible fixed assets is recognised by reference to their carrying amount.
Investment properties
Properties including those under operating leases which are held for long-term rental yields or capital gains are classified and
accounted for as investment properties, but the business model does not necessarily envisage that the properties will be held
for their entire useful life. Investment properties are carried at fair value, representing estimated open market value determined
annually by independent qualified valuers who have recent experience in the location and category of the investment property
being valued. The market value of each property is calculated on the discounted net rental income allowing for reversionary
potential. Changes in fair value are recognised in profit and loss.
Investments
i) Investments are classified by management as available for sale or held to maturity on initial recognition. Available-for-sale
investments are shown at fair value. Gains and losses arising from changes in the fair value are recognised in other
comprehensive income. On the disposal of an investment or when an investment is determined to be impaired, the
cumulative gain or loss previously deferred in equity is recognised in profit and loss. Held-to-maturity investments are
shown at amortised cost. Investments are classified under non-current assets unless they are expected to be realised
within twelve months after the balance sheet date.
ii) At each balance sheet date, the Group assesses whether there is objective evidence that an investment is impaired.
In the case of equity securities classified as available for sale, a significant or prolonged decline in the fair value of the
security below its cost is considered as an indicator that the securities are impaired.
iii) All purchases and sales of investments are recognised on the trade date, which is the date that the Group commits to
purchase or sell the investment.
Leases
Leases are classified as finance leases when the terms of the lease transfer substantially all the risks and rewards of ownership
to the lessee. All other leases are classified as operating leases.
Properties for sale
Properties for sale, which comprise land and buildings held for resale, are stated at the lower of cost and net realisable value.
The cost of properties for sale comprises land cost, and construction and other development costs.
Debtors
Debtors, excluding derivative financial instruments, are measured at amortised cost except where the effect of discounting would
be immaterial. Provision for impairment is established when there is objective evidence that the outstanding amounts will not be
collected. Significant financial difficulties of the debtor, probability that the debtor will enter bankruptcy or financial reorganisation,
and default or delinquency in payments are considered indicators that the debtor is impaired. The carrying amount of the asset is
reduced through the use of an allowance account and the amount of the loss is recognised in arriving at operating profit. When
a debtor is uncollectible, it is written off against the allowance account. Subsequent recoveries of amount previously written off
are credited to profit and loss.
Debtors with maturities greater than twelve months after the balance sheet date are classified under non-current assets.

Notes to the Financial Statements
Hongkong Land30 Annual Report 2011 31
1 Principal Accounting Policies continued
Cash and cash equivalents
For the purposes of the cash flow statement, cash and cash equivalents comprise deposits with banks, and bank and cash
balances, net of bank overdrafts. In the balance sheet, bank overdrafts are included in current borrowings.
Provisions
Provisions are recognised when the Group has present legal or constructive obligations as a result of past events, it is probable
that an outflow of resources embodying economic benefits will be required to settle the obligations, and a reliable estimate of
the amount of the obligations can be made.
Borrowings and borrowing costs
Borrowings are initially recognised at fair value, net of transaction costs incurred. In subsequent periods, borrowings are stated
at amortised cost using the effective interest method.
On the issue of convertible bonds, the fair value of the liability portion is determined using a market interest rate for an
equivalent non-convertible bond; this amount is included in long-term borrowings on the amortised cost basis until extinguished
on conversion or maturity of the bond. The remainder of the proceeds is allocated to the conversion option which is recognised
and included in shareholders’ funds.
Borrowing costs relating to major development projects are capitalised until the asset is substantially completed. Capitalised
borrowing costs are included as part of the cost of the asset. All other borrowing costs are expensed as incurred.
Borrowings are classified under non-current liabilities unless they are due to be settled within twelve months after the balance
sheet date.
Deferred tax
Deferred tax is provided, using the liability method, for all temporary differences arising between the tax bases of assets and
liabilities and their carrying values. Deferred tax is determined using tax rates and laws that have been enacted or substantially
enacted by the balance sheet date and are expected to apply when the related deferred tax asset is realised or the deferred tax
liability is settled.
Provision for deferred tax is made on the revaluation of certain non-current assets and, in relation to acquisitions, on the difference
between the fair value of the net assets acquired and their tax base. Deferred tax is provided on temporary differences associated
with investments in subsidiaries, associates and joint ventures, except where the Group is able to control the reversal of the
temporary difference and it is probable that the temporary difference will not reverse in the foreseeable future. Deferred tax
assets relating to the carry forward of unused tax losses are recognised to the extent that it is probable that future taxable profit
will be available against which the unused tax losses can be utilised.
Pension obligations
The Group operates a number of defined benefit and defined contribution plans, the assets of which are held in trustee
administered funds.
Pension accounting costs for defined benefit plans are assessed using the projected unit credit method. Under this method,
the costs of providing pensions are charged to profit and loss spreading the regular cost over the service lives of employees in
accordance with the advice of qualified actuaries, who carry out a full valuation of major plans every year. The pension obligations
are measured as the present value of the estimated future cash outflows by reference to market yields on high quality corporate
bonds which have terms to maturity approximating the terms of the related liability. Plan assets are measured at fair value.
Actuarial gains and losses are recognised in other comprehensive income in the year in which they occur.
The Group’s total contributions relating to the defined contribution plans are charged to profit and loss in the year to which
they relate.
Non-current assets held for sale
Non-current assets are classified as assets held for sale and stated at the lower of carrying amount and fair value less costs to
sell if their carrying amount is recovered principally through a sale transaction rather than through continuing use.

Hongkong Land30 Annual Report 2011 31
1 Principal Accounting Policies continued
Derivative financial instruments
The Group only enters into derivative financial instruments in order to hedge underlying exposures. Derivative financial instruments
are initially recognised at fair value on the date a derivative contract is entered into and are subsequently remeasured at their fair
value. The method of recognising the resulting gain or loss is dependent on the nature of the item being hedged. The Group
designates certain derivatives as a hedge of the fair value of a recognised asset or liability (fair value hedge), or a hedge of a
forecast transaction or of the foreign currency risk on a firm commitment (cash flow hedge), or a hedge of a net investment in
a foreign entity.
Changes in the fair value of derivatives that are designated and qualify as fair value hedges and that are highly effective, are
recognised in profit and loss, along with any changes in the fair value of the hedged asset or liability that is attributable to the
hedged risk. When a hedging instrument expires or is sold, or when a hedge no longer meets the criteria for hedge accounting,
the cumulative adjustment to the carrying amount of a hedged item for which the effective interest method is used is amortised
to profit and loss over the residual period to maturity.
Changes in the fair value of derivatives that are designated and qualify as cash flow hedges and that are highly effective, are
recognised in other comprehensive income and accumulated in equity under hedging reserves. Where the forecast transaction
or firm commitment results in the recognition of a non-financial asset or of a non-financial liability, the gains and losses previously
deferred in hedging reserves are transferred from hedging reserves and included in the initial measurement of the cost of the
asset or liability. Otherwise, amounts deferred in hedging reserves are transferred to profit and loss in the same periods during
which the hedged firm commitment or forecast transaction affects profit and loss. When a hedging instrument expires or is sold,
or when a hedge no longer meets the criteria for hedge accounting, any cumulative gain or loss existing in hedging reserves at
that time remains in the hedging reserves and is recognised when the committed or forecast transaction ultimately is recognised
in profit and loss. When a committed or forecast transaction is no longer expected to occur, the cumulative gain or loss that was
reported in hedging reserves is immediately transferred to profit and loss.
Certain derivative transactions, while providing effective economic hedges under the Group’s risk management policies, do not
qualify for hedge accounting under the specific rules in IAS 39. Changes in the fair value of any derivative instruments that do not
qualify for hedge accounting under IAS 39 are recognised immediately in profit and loss.
Hedges of net investments in foreign entities are accounted for on a similar basis to that used for cash flow hedges. Any gain or
loss on the hedging instrument relating to the effective portion of the hedge is recognised in exchange reserves; the gain or loss
relating to the ineffective portion is recognised immediately in profit and loss.
The fair value of derivatives which are designated and qualify as effective hedges are classified as non-current assets or liabilities
if the remaining maturities of the hedged assets or liabilities are greater than twelve months after the balance sheet date.
Financial guarantee contracts
Financial guarantee contracts under which the Group accepts significant risk from a third party by agreeing to compensate
that party on the occurrence of a specified uncertain future event are accounted for in a manner similar to insurance contracts.
Provisions are recognised when it is probable that the Group has obligations under such guarantees and an outflow of resources
embodying economic benefits will be required to settle the obligations.
Non-trading items
Non-trading items are separately identified to provide greater understanding of the Group’s underlying business performance.
Items classified as non-trading items include fair value gains or losses on revaluation of investment properties; gains and losses
arising from the sale of businesses, investments and investment properties; impairment of non-depreciable intangible assets and
other investments; provisions for the closure of businesses; acquisition-related costs in business combinations; and other credits
and charges of a non-recurring nature that require inclusion in order to provide additional insight into underlying business
performance.
Earnings per share
Basic earnings per share are calculated on profit attributable to shareholders and on the weighted average number of shares in
issue during the year. For the purpose of calculating diluted earnings per share, profit attributable to shareholders is adjusted for
the effects of the conversion of dilutive potential ordinary shares, and the weighted average number of shares is adjusted for
the number of shares which are deemed to be issued on the conversion of convertible bonds into ordinary shares.

Notes to the Financial Statements
Hongkong Land32 Annual Report 2011 33
1 Principal Accounting Policies continued
Dividends
Dividends proposed or declared after the balance sheet date are not recognised as a liability at the balance sheet date.
Revenue recognition
Revenue is measured at the fair value of the consideration received and receivable and represents amounts receivable for goods
and services provided in the normal course of business, net of discounts and sales related taxes.
i) Revenue from sale of properties is recognised on the transfer of significant risks and rewards of ownership, which generally
coincides with the time when the properties are delivered to customers.
ii) Receipts under operating leases are accounted for on an accrual basis over the lease terms.
iii) Revenue from rendering of services is recognised when services are performed, provided that the amount can be
measured reliably.
iv) Dividend income is recognised when the right to receive payment is established.
2 Financial Risk Management
Financial risk factors
The Group’s activities expose it to a variety of financial risks: market risk (including foreign exchange risk, interest rate risk and
price risk), credit risk and liquidity risk.
The Group’s treasury function co-ordinates, under the directions of the Board of Hongkong Land Limited, financial risk management
policies and their implementation on a group-wide basis. The Group’s treasury policies are designed to manage the financial
impact of fluctuations in interest rates and foreign exchange rates and to minimise the Group’s financial risks. The Group uses
derivative financial instruments, principally interest rate swaps, cross-currency swaps and forward foreign exchange contracts as
appropriate for hedging transactions and managing the Group’s assets and liabilities in accordance with the Group’s financial risk
management policies. Financial derivative contracts are executed between third party banks and the Group entity that is directly
exposed to the risk being hedged. Certain derivative transactions, while providing effective economic hedges under the Group’s
risk management policies, do not qualify for hedge accounting under the specific rules in IAS 39. Changes in the fair value of any
derivative instruments that do not qualify for hedge accounting under IAS 39 are recognised immediately in profit and loss account.
It is the Group’s policy not to enter into derivative transactions for speculative purposes. The notional amounts and fair values of
derivative financial instruments at 31st December 2011 are disclosed in Note 25.
i) Market riskForeign exchange risk
Entities within the Group are exposed to foreign exchange risk from future commercial transactions, net investments in
foreign operations and net monetary assets and liabilities that are denominated in a currency that is not the entity’s
functional currency.
Entities in the Group use forward foreign exchange contracts in a consistent manner to hedge firm and anticipated foreign
exchange commitments and manage their foreign exchange risk arising from future commercial transactions. The Group does
not usually hedge its net investments in foreign operations except in circumstances where there is a material exposure arising
from a currency that is anticipated to be volatile and the hedging is cost effective. Group companies are required to manage
their foreign exchange risk against their functional currency. Foreign currency borrowings are swapped into the entity’s
functional currency using cross-currency swaps except where the foreign currency borrowings are repaid with cash flows
generated in the same foreign currency. The purpose of these hedges is to mitigate the impact of movements in foreign
exchange rates on assets and liabilities and the profit and loss account of the Group.
Currency risks as defined by IFRS 7 arise on account of monetary assets and liabilities being denominated in a currency that
is not the functional currency. At 31st December 2011, there are no significant monetary balances held by group companies
that are denominated in a non-functional currency. Differences resulting from the translation of financial statements into the
Group’s presentation currency are not taken into consideration.
Since the Group manages the interdependencies between foreign exchange risk and interest rate risk of foreign currency
borrowings using cross-currency swaps, the sensitivity analysis on financial impacts arising from cross-currency swaps is
included in the sensitivity assessment on interest rates under the interest rate risk section.
Hongkong Land32 Annual Report 2011 33
2 Financial Risk Management continued
Financial risk factors continued
i) Market risk continued
Interest rate risk
The Group is exposed to interest rate risk through the impact of rate changes on interest bearing liabilities and assets. These
exposures are managed partly by using natural hedges that arise from offsetting interest rate sensitive assets and liabilities,
and partly through the use of derivative financial instruments such as interest rate swaps. The Group monitors interest rate
exposure on a monthly basis by currency and business unit, taking into consideration proposed financing and hedging
arrangements. The Group’s guideline is to maintain 40% to 60% of its gross borrowings in fixed rate instruments with an
average tenor of two to three years. At 31st December 2011, the Group’s interest rate hedge was 52% (2010: 62%) with
an average tenor of nine years (2010: six years). The interest rate profile of the Group’s borrowings after taking into account
hedging transactions are set out in Note 21.
Cash flow interest rate risk is the risk that changes in market interest rates will impact cash flows arising from variable rate
financial instruments. Borrowings at floating rates therefore expose the Group to cash flow interest rate risk. The Group
manages this risk by using forward rate agreements to a maturity of one year, and by entering into interest rate swaps for
a maturity of up to five years. Forward rate agreements and interest rate swaps have the economic effect of converting
borrowings from floating rate to fixed rate.
Fair value interest rate risk is the risk that the value of a financial asset or liability and derivative financial instrument will
fluctuate because of changes in market interest rates. The Group manages its fair value interest rate risk by entering into
interest rate swaps which have the economic effect of converting borrowings from fixed rate to floating rate.
At 31st December 2011, if interest rates had been 100 basis points higher/lower with all other variables held constant,
the Group’s profit after tax would have been US$5 million (2010: US$7 million) higher/lower, and hedging reserve would
have been US$54 million (2010: US$45 million) higher/lower as a result of fair value changes to cash flow hedges. The
sensitivity analysis has been determined assuming that the change in interest rates had occurred at the balance sheet
date and had been applied to the exposure to interest rate risk for both derivative and non-derivative financial instruments
in existence at that date. The 100 basis point increase or decrease represents management’s assessment of a reasonably
possible change in those interest rates which have the most impact on the Group, specifically the United States, Hong Kong
and Singapore rates, over the period until the next annual balance sheet date. In the case of effective fair value hedges,
changes in fair value of the hedged item caused by interest rate movements balance out in profit and loss account against
changes in the fair value of the hedging instruments. Changes in market interest rates affect the interest income or expense
of non-derivative variable-interest financial instruments, the interest payments of which are not designated as hedged items
of cash flow hedges against interest rate risks. As a consequence, they are included in the calculation of profit after tax
sensitivities. Changes in the market interest rate of financial instruments that were designated as hedging instruments in
a cash flow hedge to hedge payment fluctuations resulting from interest rate movements affect the hedging reserves and
are therefore taken into consideration in the equity-related sensitivity calculations.
Price risk
The Group is exposed to securities price risk because of listed investments which are available for sale and held by the Group
at fair value. Gains and losses arising from changes in the fair value of available-for-sale investments are recognised in other
comprehensive income. The performance of the Group’s listed and unlisted available-for-sale investments are monitored
regularly, together with an assessment of their relevance to the Group’s long term strategic plans. Details of the Group’s
available-for-sale investments are contained in Note 14.
Available-for-sale investments are unhedged. At 31st December 2011, if the price of listed and unlisted available-for-sale
investments had been 25% higher/lower with all other variables held constant, total equity would have been US$12 million
(2010: US$15 million) higher/lower. The sensitivity analysis has been determined based on a reasonable expectation of
possible valuation volatility over the next twelve months.

Notes to the Financial Statements
Hongkong Land34 Annual Report 2011 35
2 Financial Risk Management continued
Financial risk factors continued
ii) Credit risk
The Group’s credit risk is primarily attributable to deposits with banks, credit exposures to customers and derivative financial
instruments with a positive fair value. The Group has credit policies in place and the exposures to these credit risks are
monitored on an ongoing basis.
The Group manages its deposits with banks and financial institutions and transactions involving derivative financial
instruments by monitoring credit ratings and capital adequacy ratios of counterparties, and limiting the aggregate risk to any
individual counterparty. The utilisation of credit limits is regularly monitored. At 31st December 2011, 90% (2010: 100%) of
deposits and balances with banks were made to institutions with credit ratings of no less than A3 and 10% with credit rating
at Baa3 (Moody’s). Similarly transactions involving derivative financial instruments are with banks with sound credit ratings
and capital adequacy ratios. In developing countries it may be necessary to deposit money with banks that have a lower credit
rating, however the Group only enters into derivative transactions with counterparties which have credit ratings of at least
investment grade. Management does not expect any counterparty to fail to meet its obligations.
In respect of credit exposures to customers, the Group has policies in place to ensure that investment properties are let
principally to corporate companies with appropriate credit history. Rental deposits in the form of cash or bank guarantee
are usually received from tenants. The Group receives progress payments from sales of residential properties to individual
customers prior to the completion of transactions. In the event of default by customers, Group companies undertake legal
proceedings to recover the property. Amounts due from associates and joint ventures are generally supported by the
underlying assets.
The maximum exposure to credit risk is represented by the carrying amount of each financial asset in the balance sheet after
deducting any impairment allowance.
iii) Liquidity risk
Prudent liquidity risk management includes managing the profile of debt maturities and funding sources, maintaining sufficient
cash and marketable securities, and ensuring the availability of funding from an adequate amount of committed credit facilities
and the ability to close out market positions. The Group’s ability to fund its existing and prospective debt requirements is
managed by maintaining diversified funding sources with adequate committed funding lines from high quality lenders, and by
monitoring rolling short-term forecasts of the Group’s cash and gross debt on the basis of expected cash flows. In addition
long-term cash flows are projected to assist with the Group’s long-term debt financing plans.
At 31st December 2011, total committed and uncommitted borrowing facilities amounted to US$5,459 million
(2010: US$6,184 million) of which US$3,327 million (2010: US$3,725 million) was drawn down. Undrawn committed
facilities, in the form of revolving credit and term loan facilities, totalled US$1,934 million (2010: US$2,262 million).
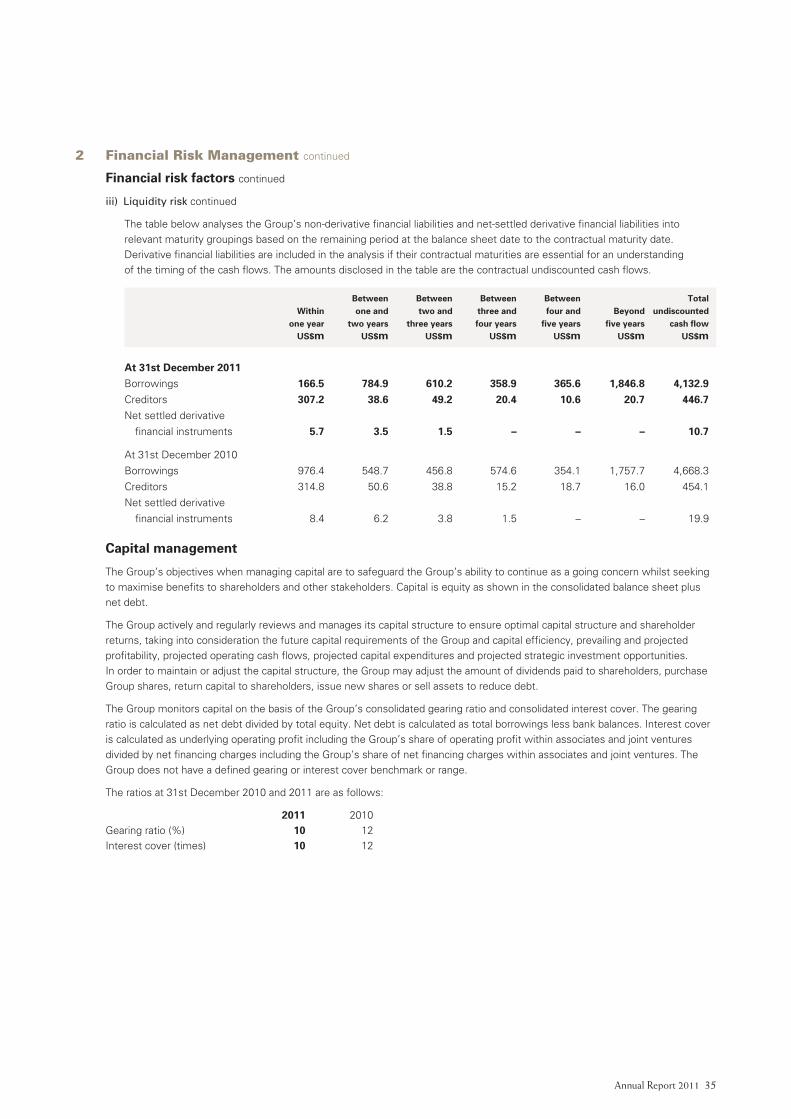
Hongkong Land34 Annual Report 2011 35
2 Financial Risk Management continued
Financial risk factors continued
iii) Liquidity risk continued
The table below analyses the Group’s non-derivative financial liabilities and net-settled derivative financial liabilities into
relevant maturity groupings based on the remaining period at the balance sheet date to the contractual maturity date.
Derivative financial liabilities are included in the analysis if their contractual maturities are essential for an understanding
of the timing of the cash flows. The amounts disclosed in the table are the contractual undiscounted cash flows.
Between Between Between Between Total Within one and two and three and four and Beyond undiscounted one year two years three years four years five years five years cash flow US$m US$m US$m US$m US$m US$m US$m
At 31st December 2011Borrowings 166.5 784.9 610.2 358.9 365.6 1,846.8 4,132.9Creditors 307.2 38.6 49.2 20.4 10.6 20.7 446.7Net settled derivative
financial instruments 5.7 3.5 1.5 – – – 10.7
At 31st December 2010
Borrowings 976.4 548.7 456.8 574.6 354.1 1,757.7 4,668.3
Creditors 314.8 50.6 38.8 15.2 18.7 16.0 454.1
Net settled derivative
financial instruments 8.4 6.2 3.8 1.5 – – 19.9
Capital management
The Group’s objectives when managing capital are to safeguard the Group’s ability to continue as a going concern whilst seeking
to maximise benefits to shareholders and other stakeholders. Capital is equity as shown in the consolidated balance sheet plus
net debt.
The Group actively and regularly reviews and manages its capital structure to ensure optimal capital structure and shareholder
returns, taking into consideration the future capital requirements of the Group and capital efficiency, prevailing and projected
profitability, projected operating cash flows, projected capital expenditures and projected strategic investment opportunities.
In order to maintain or adjust the capital structure, the Group may adjust the amount of dividends paid to shareholders, purchase
Group shares, return capital to shareholders, issue new shares or sell assets to reduce debt.
The Group monitors capital on the basis of the Group’s consolidated gearing ratio and consolidated interest cover. The gearing
ratio is calculated as net debt divided by total equity. Net debt is calculated as total borrowings less bank balances. Interest cover
is calculated as underlying operating profit including the Group’s share of operating profit within associates and joint ventures
divided by net financing charges including the Group’s share of net financing charges within associates and joint ventures. The
Group does not have a defined gearing or interest cover benchmark or range.
The ratios at 31st December 2010 and 2011 are as follows:
2011 2010
Gearing ratio (%) 10 12
Interest cover (times) 10 12

Notes to the Financial Statements
Hongkong Land36 Annual Report 2011 37
2 Financial Risk Management continued
Fair value estimation
i) Financial instruments that are measured at fair valueFor financial instruments that are measured at fair value in the balance sheet, the corresponding fair value measurements
are disclosed by level of the following fair value measurement hierarchy:
a) Quoted prices (unadjusted) in active markets for identical assets or liabilities (‘quoted prices in active markets’)
The fair value of listed securities, which are classified as available-for-sale, is based on quoted prices in active markets
at the balance sheet date. The quoted market price used for listed investments held by the Group is the current bid price.
b) Inputs other than quoted prices in active markets that are observable for the asset or liability, either directly or indirectly
(‘observable current market transactions’)
The fair values of interest rate swaps and forward foreign exchange contracts have been determined using rates quoted
by the Group’s bankers at the balance sheet date which are calculated by reference to the market interest rates and
foreign exchange rates.
c) Inputs for the asset or liability that are not based on observable market data (‘unobservable inputs’)
The fair value of unlisted securities, which are classified as available-for-sale, is determined using valuation techniques
by reference to observable current market transactions or the market prices of the underlying investments with certain
degree of entity specific estimates.
ii) Financial instruments that are not measured at fair valueThe fair values of current debtors, bank balances, current creditors and current borrowings are assumed to approximate
their carrying amounts due to the short-term maturities of these assets and liabilities.
The fair values of long-term borrowings are based on market prices or are estimated using the expected future payments
discounted at market interest rates.
3 Critical Accounting Estimates and Judgements
Estimates and judgements used in preparing the financial statements are continually evaluated and are based on historical
experience and other factors, including expectations of future events that are believed to be reasonable. The resulting accounting
estimates will, by definition, seldom equal the related actual results. The estimates and assumptions that have a significant effect
on the carrying amounts of assets and liabilities are discussed below.
Acquisition of subsidiaries, associates and joint ventures
The initial accounting on the acquisition of subsidiaries, associates and joint ventures involves identifying and determining the
fair values to be assigned to the identifiable assets, liabilities and contingent liabilities of the acquired entities. The fair values of
leasehold land, tangible assets and investment properties are determined by independent valuers by reference to market prices
or present value of expected net cash flows from the assets. Any changes in the assumptions used and estimates made in
determining the fair values, and management’s ability to measure reliably the contingent liabilities of the acquired entity will
impact the carrying amount of these assets and liabilities.
Investment properties
The fair values of investment properties are determined by independent valuers on an open market for existing use basis
calculated on the discounted net income allowing for reversionary potential.
In making the judgement, considerations have been given to assumptions that are mainly based on market conditions existing
at the balance sheet date and appropriate capitalisation rates. These estimates are regularly compared to actual market data and
actual transactions entered into by the Group.

Hongkong Land36 Annual Report 2011 37
3 Critical Accounting Estimates and Judgements continued
Impairment of assets
The Group tests annually whether goodwill and other assets that have indefinite useful lives suffered any impairment. Other
assets are reviewed for impairment whenever events or changes in circumstances indicate that the carrying amount of the asset
exceeds its recoverable amount. The recoverable amount of an asset or a cash generating unit is determined based on the higher
of its fair value less costs to sell and its value-in-use, calculated on the basis of management’s assumptions and estimates.
Changing the key assumptions, including the discount rates or the growth rate assumptions in the cash flow projections,
could materially affect the value-in-use calculations.
In determining when an available-for-sale equity investment is impaired, significant judgement is required. In making this
judgement, the Group evaluates, among other factors, the duration and extent to which the fair value of an investment is less
than its cost; and the financial health of and near-term business outlook for the investee, including factors such as industry and
sector performance, changes in technology and operational and financial cash flows.
Income taxes
The Group is subject to income taxes in numerous jurisdictions. Significant judgement is required in determining the worldwide
provision for income taxes. There are many transactions and calculations for which the ultimate tax determination is uncertain
during the ordinary course of business. Where the final tax outcome of these matters is different from the amounts that were
initially recorded, such differences will impact the income tax and deferred tax provisions in the period in which such determination
is made.
Provision of deferred tax follows the way management expects to recover or settle the carrying amount of the related assets or
liabilities, which the management may expect to recover through use, sale or combination of both. Accordingly, deferred tax will
be calculated at income tax rate, capital gains tax rate or combination of both. There is a rebuttable presumption in International
Financial Reporting Standards that investment properties measured at fair value are recovered through sale. Thus, deferred tax
on revaluation of investment properties held by the Group are calculated at the capital gains tax rate.
Recognition of deferred tax assets, which principally relate to tax losses, depends on the management’s expectation of future
taxable profit that will be available against which the tax losses can be utilised. The outcome of their actual utilisation may be
different.
Pension obligations
The present value of the pension obligations depends on a number of factors that are determined on an actuarial basis using
a number of assumptions. The assumptions used in determining the net cost/income for pensions include the expected long-term
rate of return on the relevant plan assets and the discount rate. Any changes in these assumptions will impact the carrying
amount of pension obligations.
The expected return on plan assets assumption is determined on a uniform basis, taking into consideration long-term historical
returns, asset allocation and future estimates of long-term investment returns.
The Group determines the appropriate discount rate at the end of each year. This is the interest rate that should be used to
determine the present value of estimated future cash outflows expected to be required to settle the pension obligations. In
determining the appropriate discount rate, the Group considers the interest rates of high-quality corporate bonds that are
denominated in the currency in which the benefits will be paid, and that have terms to maturity approximating the terms of
the related pension liability.
Other key assumptions for pension obligations are based in part on current market conditions.
Non-trading items
The Group uses underlying business performance in its internal financial reporting to distinguish between the underlying profits
and non-trading items. The identification of non-trading items requires judgement by management.

Notes to the Financial Statements
Hongkong Land38 Annual Report 2011 39
4 Segmental Information
Operating segments are identified on the basis of internal reports about components of the Group that are regularly reviewed
by the Board for the purpose of resource allocation and performance assessment. The Group operates in two operating
segments namely Commercial Property and Residential Property. No operating segments have been aggregated to form
the reportable segments.
Underlying profit Revenue Operating profit attributable to shareholders Segment assets Segment liabilities
2011 2010 2011 2010 2011 2010 2011 2010 2011 2010
US$m US$m US$m US$m US$m US$m US$m US$m US$m US$m
By businessCommercial property 804.2 775.3 673.1 649.0 755.9 684.5 22,596.6 18,047.7 (295.1 ) (309.2 )
Residential property 419.5 565.3 209.1 287.1 282.0 432.5 1,835.2 1,465.4 (426.0 ) (440.3 )
Corporate, net financing charges and tax – – (50.5 ) (54.7 ) (334.5 ) (306.8 ) – – – –
1,223.7 1,340.6 831.7 881.4 703.4 810.2 24,431.8 19,513.1 (721.1 ) (749.5 )
Change in fair value of investment properties – – 4,382.7 3,197.6 – – – – – –
Asset impairment provisions, reversals and disposals – – – 0.1 – – – – – –
1,223.7 1,340.6 5,214.4 4,079.1 703.4 810.2 24,431.8 19,513.1 (721.1 ) (749.5 )
By geographical locationGreater China 937.6 935.9 5,077.0 3,821.3 817.7 761.7 22,754.6 18,081.6 (334.0 ) (385.3 )
Southeast Asia and others 286.1 404.7 187.9 312.5 220.2 355.3 1,677.2 1,431.5 (387.1 ) (364.2 )
Corporate, net financing charges and tax – – (50.5 ) (54.7 ) (334.5 ) (306.8 ) – – – –
1,223.7 1,340.6 5,214.4 4,079.1 703.4 810.2 24,431.8 19,513.1 (721.1 ) (749.5 )
Operating profit 5,214.4 4,079.1 Segment assets and liabilities 24,431.8 19,513.1 (721.1 ) (749.5 )
Results of associates and joint ventures 298.0 905.3 Investments in associates and joint ventures 3,551.8 3,177.7 – –
Net financing charges and tax (201.0 ) (199.2 ) Unallocated assets and liabilities 1,040.0 1,451.7 (3,538.7 ) (3,915.5 )
Profit after tax 5,311.4 4,785.2 Total assets and liabilities 29,023.6 24,142.5 (4,259.8 ) (4,665.0 )
Greater China includes Hong Kong, Macau, mainland China and Taiwan.
Unallocated assets and liabilities include tax assets and liabilities, bank balances and borrowings.

Notes to the Financial Statements
Hongkong Land40 Annual Report 2011 41
5 Revenue
2011 2010
US$m US$m
Rental income 700.3 681.8
Service income 110.9 102.2
Sales of properties 412.5 556.6
1,223.7 1,340.6
Service income includes service and management charges and hospitality service income.
Total contingent rents included in rental income amounted to US$12.5 million (2010: US$9.9 million).
2011 2010
US$m US$m
The future minimum rental payments receivable under non-cancellable leases
are as follows:
Within one year 633.4 598.8
Between one and two years 481.5 376.3
Between two and five years 479.1 402.2
Beyond five years 79.1 76.3
1,673.1 1,453.6
Generally the Group’s operating leases are for terms of three years or more.
6 Net Operating Costs
2011 2010
US$m US$m
Cost of sales (320.2 ) (382.6 )
Other income 4.0 5.0
Administrative expenses (75.8 ) (81.6 )
(392.0 ) (459.2 )
The following credits/(charges) are included in net operating costs:
Cost of properties for sale recognised as expense (229.3 ) (309.4 )
Operating expenses arising from investment properties (135.1 ) (124.1 )
Reversal of writedowns on development properties held for sale 44.2 50.9
Depreciation of tangible assets (see Note 12) (1.7 ) (1.1 )
Staff costs
– salaries and benefits in kind (68.7 ) (73.9 )
– defined contribution pension plan (2.6 ) (2.3 )
– defined benefit pension plan (see Note 16) 0.1 –
(71.2 ) (76.2 )
Auditors’ remuneration
– audit (1.1 ) (1.1 )
– non-audit services (0.2 ) (0.1 )
(1.3 ) (1.2 )
The number of employees at 31st December 2011 was 1,257 (2010: 1,144).

Hongkong Land40 Annual Report 2011 41
7 Net Financing Charges
2011 2010
US$m US$m
Interest expenses
– bank loans and overdrafts (13.7 ) (24.1 )
– other borrowings (69.0 ) (80.4 )
Total interest expenses (82.7 ) (104.5 )
Interest capitalised 0.3 2.7
(82.4 ) (101.8 )
Commitment and other fees (17.3 ) (10.5 )
Financing charges (99.7 ) (112.3 )
Financing income 33.2 35.2
(66.5 ) (77.1 )
Financing charges and financing income are stated after taking into account hedging gains or losses.
8 Share of Results of Associates and Joint Ventures
2011 2010
US$m US$m
By businessCommercial Property
– operating profit 85.0 37.2
– net financing charges (27.8 ) (14.0 )
– tax (10.7 ) (2.6 )
– net profit 46.5 20.6
Residential Property
– operating profit 79.6 196.1
– net financing charges (2.6 ) (4.2 )
– tax (45.8 ) (37.8 )
– non-controlling interests (1.4 ) (0.8 )
– net profit 29.8 153.3
Underlying business performance 76.3 173.9
Non-trading items:
Change in fair value of investment properties (net of deferred tax)
– Commercial Property 235.8 722.4
– Residential Property 2.9 9.0
238.7 731.4
Asset impairment provisions, reversals and disposals (17.0 ) –
221.7 731.4
298.0 905.3
The share of revenue of associates and joint ventures was US$386.0 million (2010: US$555.6 million).

Notes to the Financial Statements
Hongkong Land42 Annual Report 2011 43
9 Tax
2011 2010
US$m US$m
Current tax (128.6 ) (115.4 )
Deferred tax
– changes in fair value of investment properties (0.9 ) 0.7
– other temporary differences (5.0 ) (7.4 )
(5.9 ) (6.7 )
(134.5 ) (122.1 )
Reconciliation between tax expense and tax at applicable tax rate:
Tax at applicable tax rate (851.5 ) (659.9 )
Change in fair value of investment properties not taxable in determining
taxable profit 722.2 528.7
Expenses not deductible in determining taxable profit (11.8 ) (11.8 )
Income not subject to tax 17.0 22.3
Utilisation of previously unrecognised tax losses 0.3 2.2
(Under)/overprovision in prior years (3.1 ) 0.9
Losses not recognised (0.8 ) (0.1 )
Deferred tax assets written off (1.2 ) (0.2 )
Deferred tax liabilities written back 0.3 –
Withholding tax (5.9 ) (4.2 )
(134.5 ) (122.1 )
Tax relating to components of other comprehensive income is analysed as follows:
Pension assets 0.8 –
Cash flow hedges (1.0 ) 1.1
(0.2 ) 1.1
The applicable tax rate for the year of 16.5% (2010: 16.8%) represents the weighted average of the rates of taxation prevailing in
the territories in which the Group operates. The decrease in the applicable tax rate is caused by a change in the profitability of the
Group’s subsidiaries in the respective territories.
The Group has no tax payable in the United Kingdom (2010: Nil).
Share of tax of associates and joint ventures of US$61.8 million (2010: US$62.0 million) is included in share of results of
associates and joint ventures.

Hongkong Land42 Annual Report 2011 43
10 Earnings per Share
Basic earnings per share is calculated on profit attributable to shareholders of US$5,306.4 million (2010: US$4,739.4 million) and
on the weighted average number of 2,322.5 million (2010: 2,249.4 million) shares in issue during the year.
Diluted earnings per share is calculated on profit attributable to shareholders of US$5,309.5 million (2010: US$4,760.6 million),
which is after adjusting for the effects of the conversion of convertible bonds, and on the weighted average number of
2,337.6 million (2010: 2,353.2 million) shares in issue during the year. The weighted average number of shares for basic
and diluted earnings per share is reconciled as follows:
Ordinary shares in millions
2011 2010
Weighted average number of shares in issue 2,322.5 2,249.4
Adjustment for shares to be issued on conversion of convertible bonds 15.1 103.8
Weighted average number of shares for diluted earnings per share calculation 2,337.6 2,353.2
Earnings per share is additionally calculated based on underlying profit attributable to shareholders. The difference between
underlying profit attributable to shareholders and profit attributable to shareholders is reconciled as follows:
2011 2010 Basic Diluted Basic Diluted
earnings earnings earnings earnings
per share per share per share per share
US$m US¢ US¢ US$m US¢ US¢
Underlying profit attributable to shareholders 703.4 30.29 30.22 810.2 36.02 35.33
Non-trading items (see Note 11) 4,603.0 3,929.2
Profit attributable to shareholders 5,306.4 228.48 4,739.4 210.70
Interest expense on convertible bonds (net of tax) 3.1 21.2
Profit for calculation of diluted earnings per share 5,309.5 227.13 4,760.6 202.30
11 Non-trading Items
An analysis of non-trading items after interest, tax and non-controlling interests attributable to shareholders of the Company is set
out below:
2011 2010
US$m US$m
Change in fair value of investment properties 4,382.7 3,197.6
Deferred tax on change in fair value of investment properties (0.9 ) 0.7
Share of change in fair value of investment properties of associates and
joint ventures (net of deferred tax) 238.7 731.4
Asset impairment provisions, reversals and disposals – 0.1
Share of asset impairment provisions, reversals and disposals of associates and
joint ventures (17.0 ) –
Non-controlling interests (0.5 ) (0.6 )
4,603.0 3,929.2

Notes to the Financial Statements
Hongkong Land44 Annual Report 2011 45
12 Tangible Assets
Investment Other properties assets Total
US$m US$m US$m
2011Cost or valuation 18,036.0 15.1 18,051.1Cumulative depreciation – (10.9 ) (10.9 )
Net book value at 1st January 18,036.0 4.2 18,040.2Exchange differences 28.1 – 28.1Additions 83.1 2.8 85.9Depreciation – (1.7 ) (1.7 )Net revaluation surplus 4,382.7 – 4,382.7
Net book value at 31st December 22,529.9 5.3 22,535.2
Cost or valuation 22,529.9 17.8 22,547.7Cumulative depreciation – (12.5 ) (12.5 )
22,529.9 5.3 22,535.2
2010
Cost or valuation 14,817.7 13.9 14,831.6
Cumulative depreciation – (10.0 ) (10.0 )
Net book value at 1st January 14,817.7 3.9 14,821.6
Exchange differences (6.9 ) 0.1 (6.8 )
Additions 27.6 1.3 28.9
Depreciation – (1.1 ) (1.1 )
Net revaluation surplus 3,197.6 – 3,197.6
Net book value at 31st December 18,036.0 4.2 18,040.2
Cost or valuation 18,036.0 15.1 18,051.1
Cumulative depreciation – (10.9 ) (10.9 )
18,036.0 4.2 18,040.2
The Group’s investment properties were revalued at 31st December 2011 by independent qualified valuers. The Group employed
Jones Lang LaSalle to value its commercial investment properties in Hong Kong, Singapore, Vietnam and Cambodia which
are either held under leases with unexpired lease terms of more than 20 years or freehold. The valuations, which conform to the
International Valuation Standards issued by the International Valuation Standards Committee and the HKIS Valuation Standards
on Properties issued by the Hong Kong Institute of Surveyors, were arrived at by reference to the net income allowing for
reversionary potential of each property. The Report of the valuers is set out on page 71.

Hongkong Land44 Annual Report 2011 45
13 Associates and Joint Ventures
2011 2010
US$m US$m
Share of unlisted associates and joint ventures’ net assets 3,551.8 3,132.2
Goodwill on acquisition – 45.5
3,551.8 3,177.7
The Group’s share of assets, liabilities, capital commitments and contingent
liabilities of associates and joint ventures are summarised below:
Non-current assets 3,306.2 2,986.1
Current assets 1,547.1 1,142.4
Current liabilities (592.5 ) (497.0 )
Non-current liabilities (660.6 ) (496.4 )
Non-controlling interests (48.4 ) (2.9 )
3,551.8 3,132.2
Capital commitments 55.6 112.4
Contingent liabilities 64.8 36.6
Movements of associates and joint ventures for the year:
At 1st January 3,177.7 2,352.2
Exchange differences (14.2 ) 89.9
Share of results after tax and non-controlling interests 298.0 905.3
Share of other comprehensive income after tax and non-controlling interests 2.8 80.8
Dividends received and receivable (56.3 ) (270.5 )
Net acquisitions and increases in attributable interests 146.2 17.9
Others (2.4 ) 2.1
At 31st December 3,551.8 3,177.7

Notes to the Financial Statements
Hongkong Land46 Annual Report 2011 47
14 Other Investments
2011 2010
US$m US$m
Listed securities 46.5 57.2
Unlisted securities 2.1 2.0
48.6 59.2
Movements for the year:
At 1st January 59.2 46.4
Exchange differences 0.1 (0.2 )
Additions – 2.0
Net revaluation (deficit)/surplus (10.7 ) 11.0
At 31st December 48.6 59.2
The fair value measurements of available-for-sale financial assets are based on
the following data:
Quoted prices in active markets 46.5 57.2
Unobservable inputs 2.1 2.0
48.6 59.2
15 Deferred Tax Assets and Liabilities
Revaluation Accelerated surpluses of Other capital investment temporary Tax losses allowances properties differences Total US$m US$m US$m US$m US$m
2011At 1st January 1.0 (46.2 ) (1.0 ) (1.5 ) (47.7 )Exchange differences – (0.1 ) – – (0.1 )(Charged)/credited to profit and loss 0.4 (4.2 ) (0.9 ) (1.2 ) (5.9 )Charged to other comprehensive income – – – (0.2 ) (0.2 )
At 31st December 1.4 (50.5 ) (1.9 ) (2.9 ) (53.9 )
Deferred tax assets 1.4 – – 4.1 5.5Deferred tax liabilities – (50.5 ) (1.9 ) (7.0 ) (59.4 )
1.4 (50.5 ) (1.9 ) (2.9 ) (53.9 )

Hongkong Land46 Annual Report 2011 47
15 Deferred Tax Assets and Liabilities continued
Revaluation
Accelerated surpluses of Other
capital investment temporary
Tax losses allowances properties differences Total
US$m US$m US$m US$m US$m
2010
At 1st January 0.5 (41.9 ) (1.7 ) 0.8 (42.3 )
Exchange differences 0.1 0.1 – – 0.2
(Charged)/credited to profit and loss 0.4 (4.4 ) 0.7 (3.4 ) (6.7 )
Credited to other comprehensive income – – – 1.1 1.1
At 31st December 1.0 (46.2 ) (1.0 ) (1.5 ) (47.7 )
Deferred tax assets 1.0 – – 6.1 7.1
Deferred tax liabilities – (46.2 ) (1.0 ) (7.6 ) (54.8 )
1.0 (46.2 ) (1.0 ) (1.5 ) (47.7 )
Deferred tax balances predominantly comprise non-current items. Deferred tax assets and liabilities are netted when the taxes
relate to the same taxation authority and where offsetting is allowed.
Deferred tax assets of US$1.3 million (2010: US$0.8 million) arising from unused tax losses of US$8.6 million
(2010: US$4.7 million) have not been recognised in the financial statements. Of the unused tax losses, US$5.0 million
(2010: US$4.4 million) have no expiry date and the balance will expire in 2015.
16 Pension Plans
The Group has a number of defined benefit pension plans, covering all the main territories in which it operates with the major
plans relating to employees in Hong Kong. Most of the pension plans are final salary defined benefit plans and are funded. The
assets of the funded plans are held independently of the Group’s assets in separate trustee administered funds. The Group’s
major plans are valued by independent actuaries annually using the projected unit credit method.
The principal actuarial assumptions used for accounting purposes at 31st December are as follows:
2011 2010 Weighted Weighted
average average
% %
Discount rate applied to pension obligations 4.50 4.85
Expected return on plan assets 7.50 7.50
Future salary increases 5.00 5.00
The expected return on plan assets is determined on the basis of long-term average returns on global equities of 3.8% to 11.4%
(2010: 4.3% to 11.4%) per annum and global bonds of 2.8% to 4.4% (2010: 3.6% to 5.2%) per annum, and the long-term
benchmark allocation of assets between equities and bonds in the plan.
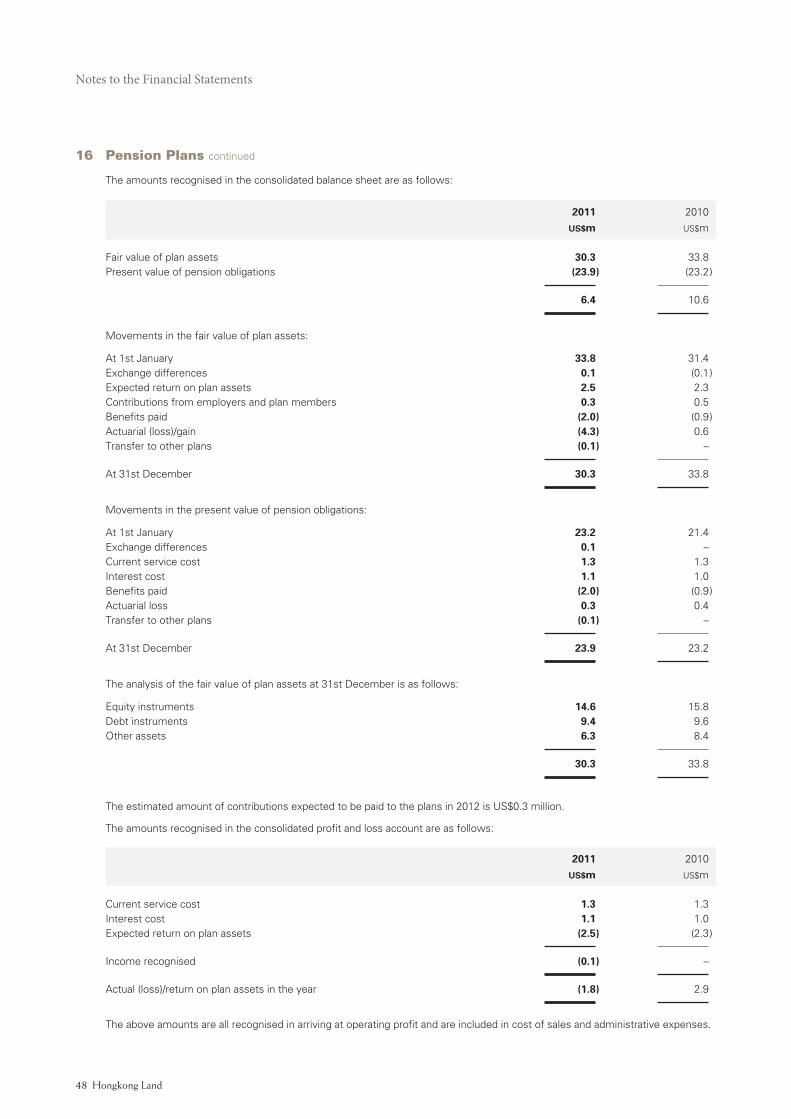
Notes to the Financial Statements
Hongkong Land48 Annual Report 2011 49
16 Pension Plans continued
The amounts recognised in the consolidated balance sheet are as follows:
2011 2010
US$m US$m
Fair value of plan assets 30.3 33.8Present value of pension obligations (23.9 ) (23.2 )
6.4 10.6
Movements in the fair value of plan assets:
At 1st January 33.8 31.4Exchange differences 0.1 (0.1 )Expected return on plan assets 2.5 2.3Contributions from employers and plan members 0.3 0.5Benefits paid (2.0 ) (0.9 )Actuarial (loss)/gain (4.3 ) 0.6Transfer to other plans (0.1 ) –
At 31st December 30.3 33.8
Movements in the present value of pension obligations:
At 1st January 23.2 21.4Exchange differences 0.1 –Current service cost 1.3 1.3Interest cost 1.1 1.0Benefits paid (2.0 ) (0.9 )Actuarial loss 0.3 0.4Transfer to other plans (0.1 ) –
At 31st December 23.9 23.2
The analysis of the fair value of plan assets at 31st December is as follows:
Equity instruments 14.6 15.8Debt instruments 9.4 9.6Other assets 6.3 8.4
30.3 33.8
The estimated amount of contributions expected to be paid to the plans in 2012 is US$0.3 million.
The amounts recognised in the consolidated profit and loss account are as follows:
2011 2010
US$m US$m
Current service cost 1.3 1.3Interest cost 1.1 1.0Expected return on plan assets (2.5 ) (2.3 )
Income recognised (0.1 ) –
Actual (loss)/return on plan assets in the year (1.8 ) 2.9
The above amounts are all recognised in arriving at operating profit and are included in cost of sales and administrative expenses.
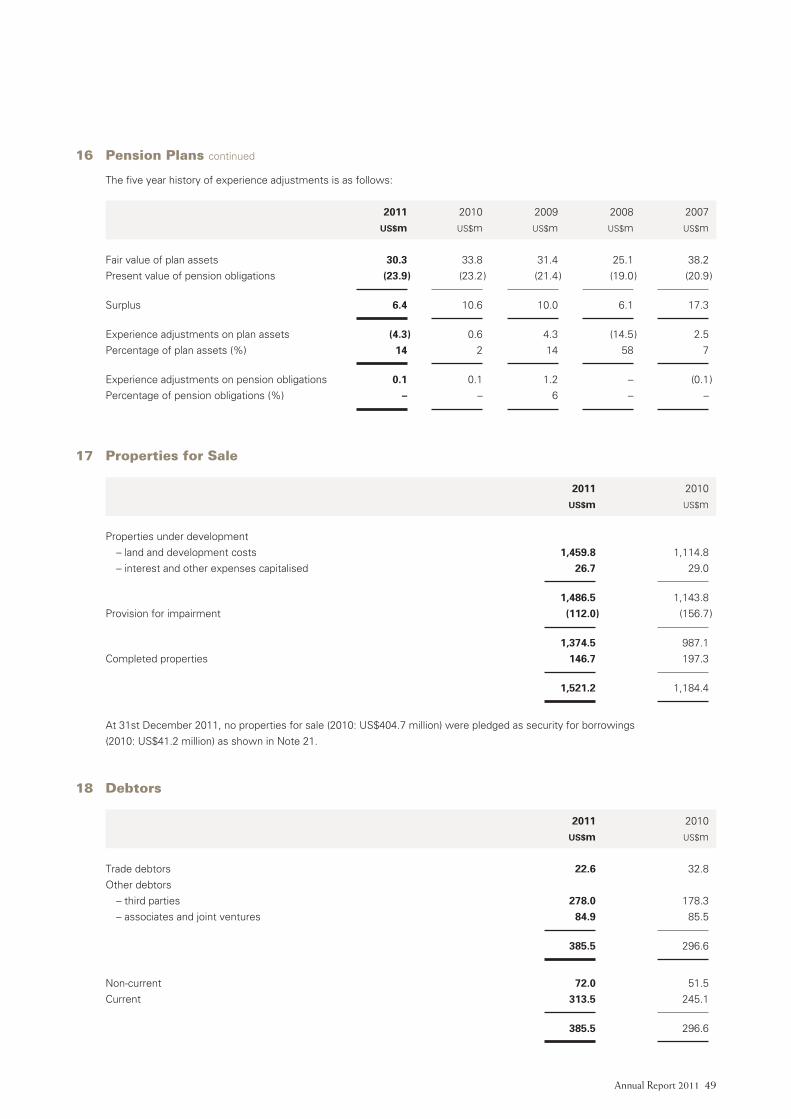
Hongkong Land48 Annual Report 2011 49
16 Pension Plans continued
The five year history of experience adjustments is as follows:
2011 2010 2009 2008 2007
US$m US$m US$m US$m US$m
Fair value of plan assets 30.3 33.8 31.4 25.1 38.2
Present value of pension obligations (23.9 ) (23.2 ) (21.4 ) (19.0 ) (20.9 )
Surplus 6.4 10.6 10.0 6.1 17.3
Experience adjustments on plan assets (4.3 ) 0.6 4.3 (14.5 ) 2.5
Percentage of plan assets (%) 14 2 14 58 7
Experience adjustments on pension obligations 0.1 0.1 1.2 – (0.1 )
Percentage of pension obligations (%) – – 6 – –
17 Properties for Sale
2011 2010
US$m US$m
Properties under development
– land and development costs 1,459.8 1,114.8
– interest and other expenses capitalised 26.7 29.0
1,486.5 1,143.8
Provision for impairment (112.0 ) (156.7 )
1,374.5 987.1
Completed properties 146.7 197.3
1,521.2 1,184.4
At 31st December 2011, no properties for sale (2010: US$404.7 million) were pledged as security for borrowings
(2010: US$41.2 million) as shown in Note 21.
18 Debtors
2011 2010
US$m US$m
Trade debtors 22.6 32.8
Other debtors
– third parties 278.0 178.3
– associates and joint ventures 84.9 85.5
385.5 296.6
Non-current 72.0 51.5
Current 313.5 245.1
385.5 296.6

Notes to the Financial Statements
Hongkong Land50 Annual Report 2011 51
18 Debtors continued
2011 2010
US$m US$m
By geographical area of operationGreater China 271.7 179.6
Southeast Asia and others 113.8 117.0
385.5 296.6
An allowance for impairment of trade debtors is made based on the estimated irrecoverable amount. Significant financial
difficulties of the debtor, probability that the debtor will enter bankruptcy or financial reorganisation, and default or delinquency
in payment are considered indicators that the debt is impaired.
At 31st December 2011, no trade debtors (2010: Nil) were impaired and fully provided.
At 31st December 2011, trade debtors of US$4.2 million (2010: US$4.4 million) were past due but not impaired. The ageing
analysis of these trade debtors is as follows:
2011 2010
US$m US$m
Below 30 days 3.8 3.2
Between 31 and 60 days 0.4 1.1
Between 61 and 90 days – 0.1
4.2 4.4
The risk of trade debtors that are neither past due nor impaired at 31st December 2011 becoming impaired is low as most of the
balances have been settled subsequent to the year end.
Other debtors are further analysed as follows:
2011 2010
US$m US$m
Prepayments 178.4 91.2
Derivative financial instruments 70.0 55.2
Amounts due from associates and joint ventures 84.9 85.5
Others 29.6 31.9
362.9 263.8
The fair value of debtors other than derivative financial instruments approximates their carrying amount, as the impact of
discounting is not significant. Derivative financial instruments are stated at fair value.

Hongkong Land50 Annual Report 2011 51
19 Bank Balances
Bank balances of certain subsidiaries amounting to US$92.9 million (2010: US$80.6 million) are held under the Housing
Developers (Project Account) Rules in Singapore, withdrawals from which are subject to the provision of these Rules.
The weighted average interest rate on bank balances of US$911.0 million (2010: US$1,309.9 million) is 0.6% (2010: 0.3%)
per annum.
20 Creditors
2011 2010
US$m US$m
Trade creditors 222.8 231.1
Tenants’ deposits 165.3 156.6
Other creditors 58.6 66.4
Derivative financial instruments 22.0 70.9
Financial liabilities 468.7 525.0
Rent received in advance 6.9 11.6
Proceeds from property for sale received in advance 315.1 279.9
790.7 816.5
Non-current 44.4 93.1
Current 746.3 723.4
790.7 816.5
By geographical area of operationGreater China 375.2 427.1
Southeast Asia and others 415.5 389.4
790.7 816.5
The remaining contractual maturities of financial liabilities other than
derivative financial instruments are analysed as follows:
Within one year 307.2 314.8
Between one and two years 38.6 50.6
Between two and five years 80.2 72.7
Beyond five years 20.7 16.0
446.7 454.1
Derivative financial instruments are stated at fair value. Other creditors are stated at amortised cost. The fair value of these
creditors approximates their carrying amounts.

Notes to the Financial Statements
Hongkong Land52 Annual Report 2011 53
21 Borrowings
2011 2010 Carrying Carrying
amount Fair value amount Fair value
US$m US$m US$m US$m
Current
Bank overdrafts 1.2 1.2 1.0 1.0
Current portion of long-term borrowings
– bank loans 0.3 0.3 253.8 253.8
– 7% United States dollar bonds due 2011 – – 604.9 609.0
– 2.75% United States dollar convertible bonds due 2012 56.5 53.3 – –
58.0 54.8 859.7 863.8
Long-term
Bank loans 1,062.7 1,062.7 410.7 410.7
5.5% United States dollar bonds due 2014 544.8 544.8 548.3 548.3
3.65% Singapore dollar notes due 2015 290.3 297.2 293.3 301.4
2.75% United States dollar convertible bonds due 2012 – – 372.8 395.1
Medium term notes
– due 2017 41.0 41.0 39.4 39.4
– due 2019 102.8 102.1 102.6 100.3
– due 2020 312.7 313.1 307.9 302.4
– due 2021 71.6 71.6 62.4 62.4
– due 2025 644.6 675.5 592.6 554.0
– due 2026 38.4 38.2 – –
– due 2030 103.0 102.7 102.8 102.8
– due 2031 25.3 25.6 – –
– due 2040 32.0 29.8 32.0 27.2
1,371.4 1,399.6 1,239.7 1,188.5
3,269.2 3,304.3 2,864.8 2,844.0
3,327.2 3,359.1 3,724.5 3,707.8
Secured – 41.2
Unsecured 3,327.2 3,683.3
3,327.2 3,724.5
The fair values are based on market prices or are estimated using the expected future payments discounted at market interest
rates ranging from 0.6% to 2.1% (2010: 0.4% to 3.5%) per annum. The fair values of current borrowings approximate their
carrying amount, as the impact of discounting is not significant.
Secured borrowings at 31st December 2010 were certain subsidiaries’ bank borrowings which were secured against its
properties for sale.
The 5.5% bonds with nominal value of US$500 million due on 28th April 2014 were issued by a wholly-owned subsidiary
and are listed on the Singapore Exchange.

Hongkong Land52 Annual Report 2011 53
21 Borrowings continued
The 3.65% notes due on 5th October 2015 with nominal value of S$375 million, were issued by a wholly-owned subsidiary and
are listed on the Singapore Exchange.
The 2.75% convertible bonds with nominal value of US$400 million due on 21st December 2012 are convertible up to and
including 11th December 2012 into fully paid ordinary shares of the Company at a conversion price of US$3.85 per ordinary share,
which is subject to adjustment for subdivision or consolidation of shares, bonus issues, right issues and other dilutive events.
The fair value of the liability component is calculated using a market interest rate for an equivalent non-convertible bond at the
time of issue, and is recorded as long-term borrowings on the amortised cost basis, until extinguished on conversion or maturity
of the bonds. The residual amount, representing the value of the equity conversion component determined on issue of the bonds,
is included in shareholders’ funds.
During the year, the Group issued the following notes under the US$3,000 million medium term note programme:
– 3.75% 15-year notes with nominal value of HK$302 million due on 25th November 2026
– 4.125% 20-year notes with nominal value of HK$200 million due on 22nd December 2031
The convertible bonds are recognised in the consolidated balance sheet as follows:
2011 2010
US$m US$m
Liability component at 1st January 372.8 368.1
Interest expense at effective interest rate 5.0 21.2
Interest accrued at coupon rate (2.1 ) (11.0 )
Conversion (319.2 ) (5.5 )
Liability component at 31st December 56.5 372.8
The borrowings are further summarised as follows:
Fixed rate borrowings
Weighted Weighted Floating average average period rate interest rates outstanding borrowings Total % Years US$m US$m US$m
By currency2011Hong Kong dollar 2.3 11.1 1,050.4 1,236.0 2,286.4Singapore dollar 2.6 4.7 609.8 374.0 983.8United States dollar 5.5 1.0 56.5 0.5 57.0
1,716.7 1,610.5 3,327.2
2010
Hong Kong dollar 2.8 8.2 1,234.6 1,196.5 2,431.1
Singapore dollar 2.7 5.0 699.1 220.7 919.8
United States dollar 5.5 2.0 372.8 0.8 373.6
2,306.5 1,418.0 3,724.5
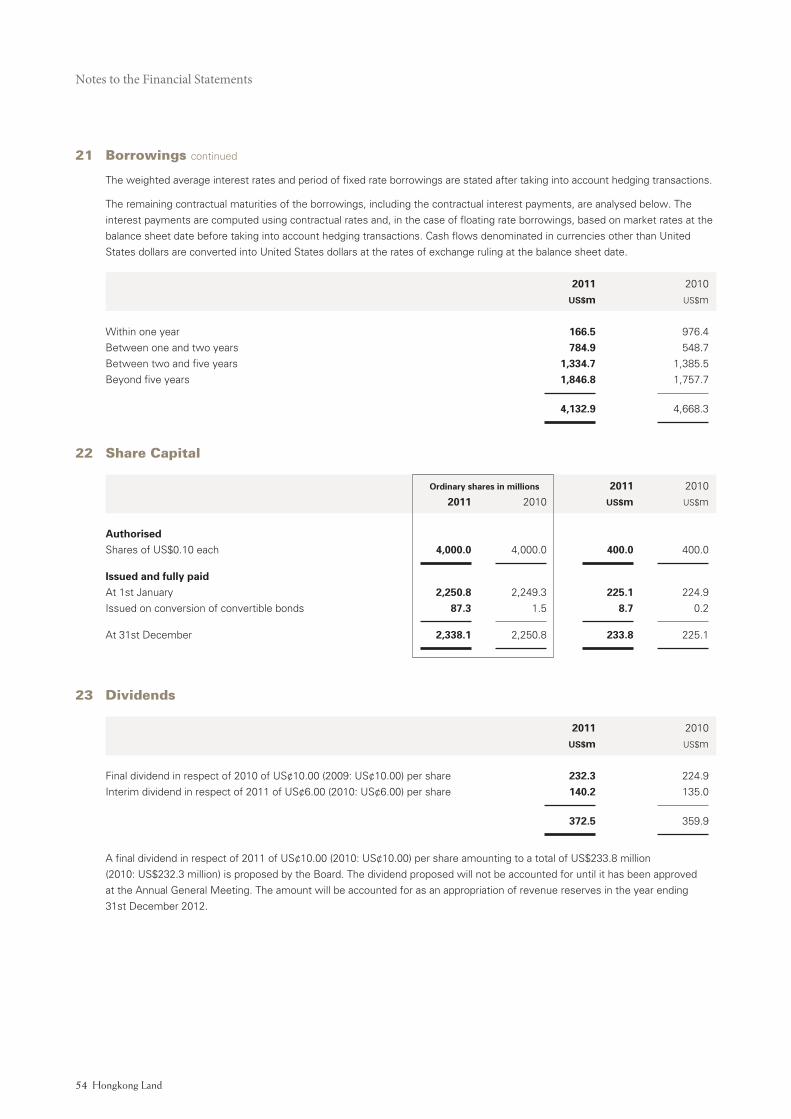
Notes to the Financial Statements
Hongkong Land54 Annual Report 2011 55
21 Borrowings continued
The weighted average interest rates and period of fixed rate borrowings are stated after taking into account hedging transactions.
The remaining contractual maturities of the borrowings, including the contractual interest payments, are analysed below. The
interest payments are computed using contractual rates and, in the case of floating rate borrowings, based on market rates at the
balance sheet date before taking into account hedging transactions. Cash flows denominated in currencies other than United
States dollars are converted into United States dollars at the rates of exchange ruling at the balance sheet date.
2011 2010
US$m US$m
Within one year 166.5 976.4
Between one and two years 784.9 548.7
Between two and five years 1,334.7 1,385.5
Beyond five years 1,846.8 1,757.7
4,132.9 4,668.3
22 Share Capital
Ordinary shares in millions 2011 2010
2011 2010 US$m US$m
Authorised
Shares of US$0.10 each 4,000.0 4,000.0 400.0 400.0
Issued and fully paid At 1st January 2,250.8 2,249.3 225.1 224.9
Issued on conversion of convertible bonds 87.3 1.5 8.7 0.2
At 31st December 2,338.1 2,250.8 233.8 225.1
23 Dividends
2011 2010
US$m US$m
Final dividend in respect of 2010 of US¢10.00 (2009: US¢10.00) per share 232.3 224.9
Interim dividend in respect of 2011 of US¢6.00 (2010: US¢6.00) per share 140.2 135.0
372.5 359.9
A final dividend in respect of 2011 of US¢10.00 (2010: US¢10.00) per share amounting to a total of US$233.8 million
(2010: US$232.3 million) is proposed by the Board. The dividend proposed will not be accounted for until it has been approved
at the Annual General Meeting. The amount will be accounted for as an appropriation of revenue reserves in the year ending
31st December 2012.

Hongkong Land54 Annual Report 2011 55
24 Notes to Consolidated Cash Flow Statement
a) Change in interests in subsidiaries
The increase in 2010 represented the Group’s increased attributable interests in MCL Land from 77.4% to 100%.
b) Cash and cash equivalents
2011 2010
US$m US$m
Bank balances 967.9 1,366.7
Bank overdrafts (see Note 21) (1.2 ) (1.0 )
966.7 1,365.7
25 Derivative Financial Instruments
The fair values of derivative financial instruments at 31st December are as follows:
2011 2010 Positive Negative Positive Negative
fair value fair value fair value fair value
US$m US$m US$m US$m
Designated as cash flow hedges
– interest rate swaps – 9.5 1.1 11.7
– cross currency swaps 0.2 12.5 0.2 15.4
Designated as fair value hedges
– interest rate swaps 9.8 – 0.6 1.8
– cross currency swaps 60.0 – 53.3 42.0
The remaining contractual maturities of derivative financial instruments, based on their undiscounted cash outflows, are analysed
as follows:
Within Between Between Beyond one one and two and five year two years five years years US$m US$m US$m US$m
2011Net settled
– interest rate swaps 5.7 3.5 1.5 –Gross settled
– cross currency swaps 29.3 29.3 575.0 936.2
35.0 32.8 576.5 936.2
2010
Net settled
– interest rate swaps 8.4 6.2 5.3 –
Gross settled
– cross currency swaps 635.5 26.2 571.4 935.2
643.9 32.4 576.7 935.2
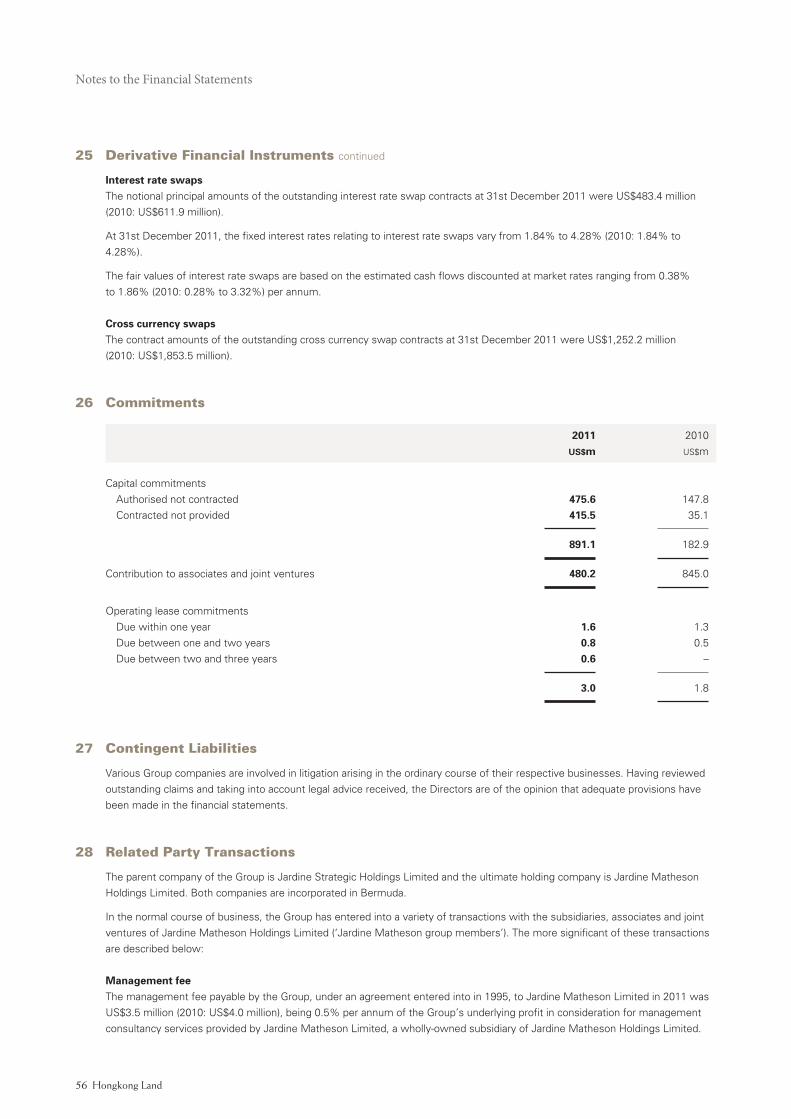
Notes to the Financial Statements
Hongkong Land56 Annual Report 2011 57
25 Derivative Financial Instruments continued
Interest rate swapsThe notional principal amounts of the outstanding interest rate swap contracts at 31st December 2011 were US$483.4 million
(2010: US$611.9 million).
At 31st December 2011, the fixed interest rates relating to interest rate swaps vary from 1.84% to 4.28% (2010: 1.84% to
4.28%).
The fair values of interest rate swaps are based on the estimated cash flows discounted at market rates ranging from 0.38%
to 1.86% (2010: 0.28% to 3.32%) per annum.
Cross currency swapsThe contract amounts of the outstanding cross currency swap contracts at 31st December 2011 were US$1,252.2 million
(2010: US$1,853.5 million).
26 Commitments
2011 2010
US$m US$m
Capital commitments
Authorised not contracted 475.6 147.8
Contracted not provided 415.5 35.1
891.1 182.9
Contribution to associates and joint ventures 480.2 845.0
Operating lease commitments
Due within one year 1.6 1.3
Due between one and two years 0.8 0.5
Due between two and three years 0.6 –
3.0 1.8
27 Contingent Liabilities
Various Group companies are involved in litigation arising in the ordinary course of their respective businesses. Having reviewed
outstanding claims and taking into account legal advice received, the Directors are of the opinion that adequate provisions have
been made in the financial statements.
28 Related Party Transactions
The parent company of the Group is Jardine Strategic Holdings Limited and the ultimate holding company is Jardine Matheson
Holdings Limited. Both companies are incorporated in Bermuda.
In the normal course of business, the Group has entered into a variety of transactions with the subsidiaries, associates and joint
ventures of Jardine Matheson Holdings Limited (‘Jardine Matheson group members’). The more significant of these transactions
are described below:
Management feeThe management fee payable by the Group, under an agreement entered into in 1995, to Jardine Matheson Limited in 2011 was
US$3.5 million (2010: US$4.0 million), being 0.5% per annum of the Group’s underlying profit in consideration for management
consultancy services provided by Jardine Matheson Limited, a wholly-owned subsidiary of Jardine Matheson Holdings Limited.

Hongkong Land56 Annual Report 2011 57
28 Related Party Transactions continued
Property and other servicesThe Group rented properties to Jardine Matheson group members. Gross rents on such properties in 2011 amounted to
US$20.6 million (2010: US$19.3 million).
Jardine Matheson group members provided property construction, maintenance and other services to the Group in 2011 in
aggregate amounting to US$30.0 million (2010: US$30.5 million).
The outstanding balances arising from the above services at 31st December 2011 are not material.
Hotel management servicesJardine Matheson group members provided hotel management services to the Group in 2011 amounting to US$1.9 million
(2010: US$1.4 million).
The outstanding balances arising from the above services at 31st December 2011 are not material.
Outstanding balances with associates and joint venturesAmounts of outstanding balances with associates and joint ventures are included in debtors and creditors as appropriate
(see Notes 18 and 20).
Directors’ emolumentsDetails of Directors’ emoluments (being the key management personnel compensation) are shown on page 65 under
the heading of ‘Directors’ Appointment, Retirement, Remuneration and Service Contracts’.
29 Summarised Balance Sheet of the Company
Included below is certain summarised balance sheet information of the Company disclosed in accordance with Bermuda law.
2011 2010
US$m US$m
Net operating assetsInvestments at cost
Unlisted shares in subsidiaries 4,481.7 4,481.7
Net amounts due from subsidiaries 499.2 213.7
4,980.9 4,695.4
Creditors and other accruals (21.1 ) (19.7 )
4,959.8 4,675.7
Total equityShare capital (see Note 22) 233.8 225.1
Revenue and other reserves
Contributed surplus 2,249.6 2,249.6
Share premium 331.9 5.3
Revenue reserves 2,144.5 2,195.7
4,726.0 4,450.6
Shareholders’ funds 4,959.8 4,675.7
Subsidiaries are shown at cost less amounts provided.
The contributed surplus was set up on the formation of the Company in 1989 and, under the Bye-laws of the Company,
is distributable.

Notes to the Financial Statements
Hongkong Land58 Annual Report 2011 59
30 Principal Subsidiaries, Associates and Joint Ventures
The principal subsidiaries, associates and joint ventures of the Group at 31st December 2011 are set out below.
Attributable interests % Country of
2011 2010 Issued share capital Main activities incorporation
Subsidiaries
Hongkong Land International 100 100 * USD 200,000,000 Investment holding Bermuda
Holdings Limited
Hongkong Land China Holdings 100 100 * USD 200,000,000 Investment holding Bermuda
Limited
Hongkong Land Limited 100 100 * USD 12,000 Group management Bermuda
The Hongkong Land Company, 100 100 HKD 1,293,180,006 Property investment Hong Kong
Limited
The Hongkong Land Property 100 100 HKD 200 Property investment Hong Kong
Company, Limited
Central Building Ltd. 71 71 USD 1,991,547 Property investment Vietnam
Doan Ket International Co. Ltd. 73.9 73.9 USD 7,291,500 Property investment Vietnam
HKL (Esplanade) Pte Limited 100 100 SGD 150,000,000 Property investment Singapore
HKL Treasury (Singapore) Pte Limited 100 100 SGD 2 Finance Singapore
Hongkong Land CB (2005) Limited 100 100 USD 2 Finance British Virgin
Islands
Hongkong Land Singapore (Pte) Ltd 100 100 SGD 100,000 Property management Singapore
The Hongkong Land Treasury Services 100 100 SGD 2 Finance Singapore
(Singapore) Pte Limited
MCL Land Limited (details are 100 100 SGD 369,985,977 Property development Singapore
shown on page 60)
Radiant Team Limited 100 – USD 2 Investment holding British Virgin
Islands
Reid Street Properties Limited 100 100 USD 400 Investment holding British Virgin
Islands
Ample Keen Limited 100 100 HKD 2 Property investment Hong Kong
HKL (Landmark Hotel) Limited 100 100 HKD 2 Hotel investment Hong Kong
King Kok Investment Limited 90 90 USD 10,000 Property investment Mauritius
Starsome Investments Limited 100 100 USD 2 Investment holding British Virgin
Islands
WFJ Development Limited 95 95 HKD 725,010,000 Property investment Hong Kong
Beijing Yee Zhi Real Estate 100 100 USD 150,000 Property consultancy Mainland China
Consultancy Co Ltd
* Owned directly

Hongkong Land58 Annual Report 2011 59
30 Principal Subsidiaries, Associates and Joint Ventures continued
Attributable interests % Country of
2011 2010 Issued share capital Main activities incorporation
Subsidiaries continued
Hongkong Land (Beijing) Management 100 100 USD 150,000 Property management Mainland China
Co Ltd
Hongkong Land (Chongqing) 100 100 USD 150,000 Property investment, Mainland China
Management Co Ltd development and
management
Hongkong Land (One Central) Retail 100 100 MOP 25,000 Management and Macau
Property Management Limited administration
services
Hongkong Land (Property Management) 100 100 HKD 20 Property management Hong Kong
Limited
HKL (Chater House) Limited 100 100 HKD 1,500,000 Property investment Hong Kong
HKL (Prince’s Building) Limited 100 100 HKD 200 Property investment Hong Kong
The Hongkong Land Finance 100 100 USD 2 Finance Cayman
(Cayman Islands) Company Limited Islands
The Hongkong Land Notes Company 100 100 USD 2 Finance British Virgin
Limited Islands
Mulberry Land Company Limited 100 100 HKD 200 Property investment Hong Kong
Tong Yan Development Co., Limited 100 100 HKD 400 Property development Hong Kong
HK Glory Properties Limited 100 100 USD 2 Property development British Virgin
Islands
Associates and joint ventures
Ampang Investments Pte Limited 40 40 SGD 10 Hotel investment Singapore
BFC Development Pte Limited 33.3 33.3 SGD 6 Property development Singapore
Central Boulevard Development 33.3 33.3 SGD 6 Property investment Singapore
Pte Limited
Gaysorn Land Company Limited 49 49 THB 61,250,000 Property investments Thailand
and operations
Jardine Gibbons Properties Limited 40 40 BD 600,000 ‘A’ Property holding Bermuda
400,000 ‘B’
NorthPine Land Inc 40 40 Peso 1,224,635,200 Property investment The Philippines
One Raffles Quay Pte Limited 33.3 33.3 SGD 6 Property development Singapore
P.T. Jakarta Land 50 50 IDR 3,320,000,000 Property development Indonesia
and asset
management
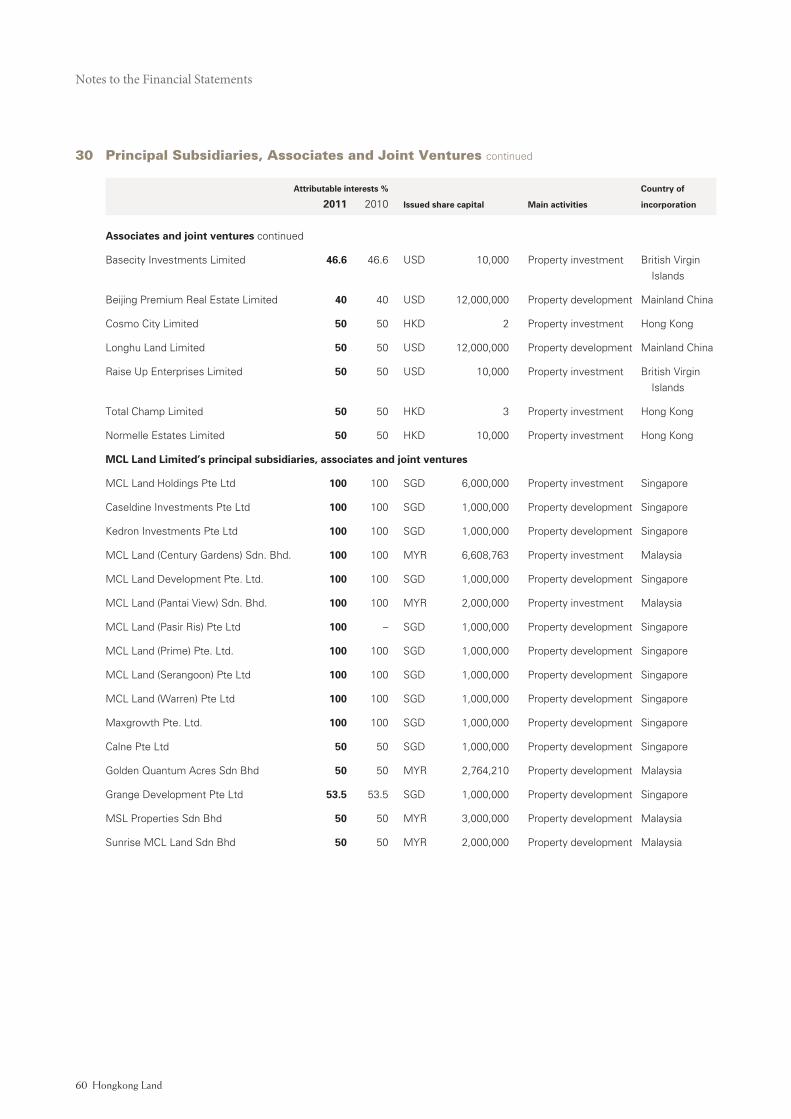
Notes to the Financial Statements
Hongkong Land60 Annual Report 2011 61
30 Principal Subsidiaries, Associates and Joint Ventures continued
Attributable interests % Country of
2011 2010 Issued share capital Main activities incorporation
Associates and joint ventures continued
Basecity Investments Limited 46.6 46.6 USD 10,000 Property investment British Virgin
Islands
Beijing Premium Real Estate Limited 40 40 USD 12,000,000 Property development Mainland China
Cosmo City Limited 50 50 HKD 2 Property investment Hong Kong
Longhu Land Limited 50 50 USD 12,000,000 Property development Mainland China
Raise Up Enterprises Limited 50 50 USD 10,000 Property investment British Virgin
Islands
Total Champ Limited 50 50 HKD 3 Property investment Hong Kong
Normelle Estates Limited 50 50 HKD 10,000 Property investment Hong Kong
MCL Land Limited’s principal subsidiaries, associates and joint ventures
MCL Land Holdings Pte Ltd 100 100 SGD 6,000,000 Property investment Singapore
Caseldine Investments Pte Ltd 100 100 SGD 1,000,000 Property development Singapore
Kedron Investments Pte Ltd 100 100 SGD 1,000,000 Property development Singapore
MCL Land (Century Gardens) Sdn. Bhd. 100 100 MYR 6,608,763 Property investment Malaysia
MCL Land Development Pte. Ltd. 100 100 SGD 1,000,000 Property development Singapore
MCL Land (Pantai View) Sdn. Bhd. 100 100 MYR 2,000,000 Property investment Malaysia
MCL Land (Pasir Ris) Pte Ltd 100 – SGD 1,000,000 Property development Singapore
MCL Land (Prime) Pte. Ltd. 100 100 SGD 1,000,000 Property development Singapore
MCL Land (Serangoon) Pte Ltd 100 100 SGD 1,000,000 Property development Singapore
MCL Land (Warren) Pte Ltd 100 100 SGD 1,000,000 Property development Singapore
Maxgrowth Pte. Ltd. 100 100 SGD 1,000,000 Property development Singapore
Calne Pte Ltd 50 50 SGD 1,000,000 Property development Singapore
Golden Quantum Acres Sdn Bhd 50 50 MYR 2,764,210 Property development Malaysia
Grange Development Pte Ltd 53.5 53.5 SGD 1,000,000 Property development Singapore
MSL Properties Sdn Bhd 50 50 MYR 3,000,000 Property development Malaysia
Sunrise MCL Land Sdn Bhd 50 50 MYR 2,000,000 Property development Malaysia

Hongkong Land60 Annual Report 2011 61
To the Members of Hongkong Land Holdings Limited
Report on the Financial Statements
We have audited the accompanying consolidated financial statements of Hongkong Land Holdings Limited and its subsidiaries
(the ‘Group’) which comprise the Consolidated Balance Sheet as at 31st December 2011 and the Consolidated Profit and Loss Account,
Consolidated Statement of Comprehensive Income, Consolidated Statement of Changes in Equity and Consolidated Cash Flow
Statement for the year then ended and a summary of significant accounting policies and other explanatory notes.
Directors’ Responsibility for the Financial Statements
The Company’s Directors are responsible for the preparation and fair presentation of these consolidated financial statements in
accordance with International Financial Reporting Standards and with the requirements of Section 90 of the Bermuda Companies Act.
This responsibility includes: designing, implementing and maintaining internal control relevant to the preparation and fair presentation
of financial statements that are free from material misstatement, whether due to fraud or error; selecting and applying appropriate
accounting policies; and making accounting estimates that are reasonable in the circumstances.
Auditors’ Responsibility
Our responsibility is to express an opinion on these consolidated financial statements based on our audit. We conducted our audit in
accordance with International Standards on Auditing. Those Standards require that we comply with ethical requirements and plan and
perform the audit to obtain reasonable assurance whether the financial statements are free from material misstatement.
An audit involves performing procedures to obtain audit evidence about the amounts and disclosures in the financial statements.
The procedures selected depend on the auditors’ judgement, including the assessment of the risks of material misstatement of the
financial statements, whether due to fraud or error. In making those risk assessments, the auditors consider internal control relevant
to the entity’s preparation and fair presentation of the financial statements in order to design audit procedures that are appropriate in
the circumstances, but not for the purpose of expressing an opinion on the effectiveness of the entity’s internal control. An audit also
includes evaluating the appropriateness of accounting policies used and the reasonableness of accounting estimates made by
management, as well as evaluating the overall presentation of the financial statements.
We believe that the audit evidence we have obtained is sufficient and appropriate to provide a basis for our audit opinion.
Opinion
In our opinion, the accompanying consolidated financial statements present fairly, in all material respects, the financial position of
the Group as at 31st December 2011, and its financial performance and its cash flows for the year then ended in accordance with
International Financial Reporting Standards and with the requirements of the Bermuda Companies Act.
Report on Legal and Regulatory Requirements
We have nothing to report in respect of the following matters that under the UK Listing Rules we are required to review:
• Directors’statementinrelationtogoingconcern;and
• thepartoftheCorporateGovernanceStatementrelatingtotheCompany’scompliancewiththeUKCorporateGovernanceCode
specified for our review.
Other Matters
This report, including the opinion, has been prepared for and only for the Company’s members as a body in accordance with Section 90
of the Bermuda Companies Act and for no other purpose. We do not, in giving this opinion, accept or assume responsibility for any other
purpose or to any other person to whom this report is shown or into whose hands it may come save where expressly agreed by our
prior consent in writing.
PricewaterhouseCoopers LLPChartered Accountants
London
United Kingdom
1st March 2012
Independent Auditors’ Report
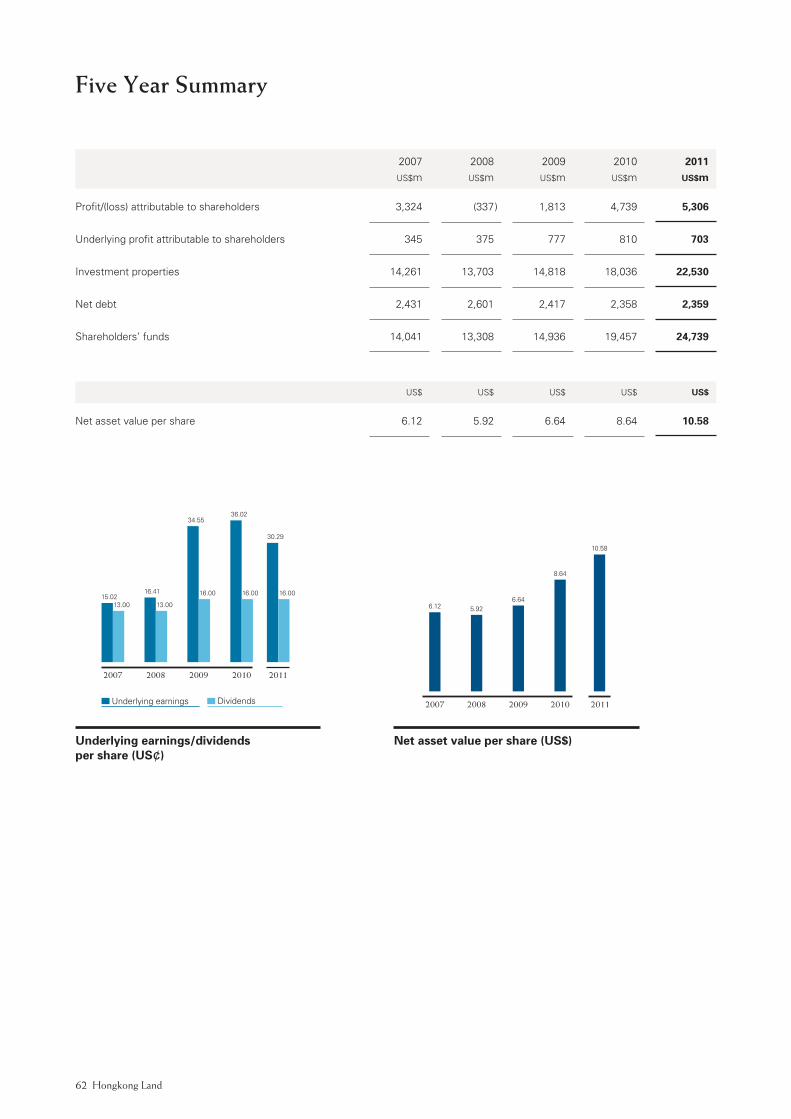
Hongkong Land62 Annual Report 2011 63
2007 2011201020092008
15.0213.00
Underlying earnings Dividends
16.41
34.5536.02
30.29
13.00
16.00 16.00 16.00
Five Year Summary
2007 2008 2009 2010 2011 US$m US$m US$m US$m US$m
Profit/(loss) attributable to shareholders 3,324 (337 ) 1,813 4,739 5,306
Underlying profit attributable to shareholders 345 375 777 810 703
Investment properties 14,261 13,703 14,818 18,036 22,530
Net debt 2,431 2,601 2,417 2,358 2,359
Shareholders’ funds 14,041 13,308 14,936 19,457 24,739
US$ US$ US$ US$ US$
Net asset value per share 6.12 5.92 6.64 8.64 10.58
Underlying earnings/dividends per share (US¢)
10.58
2011
0
2
4
6
8
10
12
8.64
2010
6.64
2009
5.92
20082007
6.12
Net asset value per share (US$)

Hongkong Land62 Annual Report 2011 63
Responsibility Statement
The Directors of the Company confirm to the best of their knowledge that:
a. the consolidated financial statements have been prepared in accordance with International Financial Reporting Standards,
including International Accounting Standards and Interpretations adopted by the International Accounting Standards Board; and
b. the sections of this Report, including the Chairman’s Statement, Chief Executive’s Review and Principal Risks and Uncertainties,
which constitute the management report include a fair review of all information required to be disclosed by the Disclosure and
Transparency Rules 4.1.8 to 4.1.11 issued by the Financial Services Authority of the United Kingdom.
For and on behalf of the Board
Y.K. PangJohn R. WittDirectors
1st March 2012

Hongkong Land64 Annual Report 2011 65
Corporate Governance
Hongkong Land Holdings Limited is incorporated in Bermuda. The Group’s property interests are almost entirely in Asia. The Company’s
equity shares have a premium listing on the London Stock Exchange, and secondary listings in Bermuda and Singapore. The Company
attaches importance to the corporate stability that is fundamental to the Group’s ability to pursue a long-term strategy in Asian markets.
It is committed to high standards of governance. Its approach, however, developed over many years, differs from that envisaged by
the UK Corporate Governance Code (the ‘UK Code’), which was originally introduced as a guide for United Kingdom incorporated
companies listed on the London Stock Exchange. As provided in the Listing Rules issued by the Financial Services Authority in the
United Kingdom, the Company’s premium listed status requires that this Report address how the main principles of the UK Code have
been applied by the Company, and explain the reasons for the different approach adopted by the Company as compared to the UK
Code’s provisions. The Company’s governance differs from that contemplated by provisions of the UK Code on board balance and
refreshment, director independence, board evaluation procedures, nomination and remuneration committees and the appointment
of a senior independent director.
The Management of the Group
The Company has its dedicated executive management under the Chief Executive. The Memorandum of Association of the Company,
however, provides for the chairman of Jardine Matheson Holdings Limited (‘Jardine Matheson’) to be, or to appoint, the Managing
Director of the Company. The managing director of Jardine Matheson has been so appointed. Reflecting this, and the 50% interest
of the Jardine Matheson group in the Company’s share capital, the Chief Executive and the Managing Director meet regularly. Similarly,
the board of the Hong Kong-based Group management company, Hongkong Land Limited (‘HKL’), and its finance committee are chaired
by the Managing Director and include Group executives as well as the deputy managing director, the group finance director, the group
strategy director and the group general counsel of Jardine Matheson.
The Board
The Company currently has a Board of 15 Directors: the Chief Executive and Chief Financial Officer; six executives of Jardine
Matheson; and seven non-executive Directors. Their names and brief biographies appear on pages 18 and 19 of this Report. The
Chairman has been appointed in accordance with the provisions of the Bye-laws of the Company, which provide that the chairman of
Jardine Matheson, or any Director nominated by him, shall be the Chairman of the Company. The composition and operation of the
Board reflect the Company’s commitment to its long-term strategy, shareholding structure and tiered approach to oversight and
management as described in this Report. These factors explain the balance on the Board between executive and non-executive
Directors, the stability of the Board, the absence of nomination and remuneration committees and the conduct of Board evaluation
procedures. The Board regards Asian business experience and relationships as more valuable attributes of its non-executive Directors
than formal independence criteria. Accordingly the Board has not designated a ‘senior independent director’ as set out in the UK Code.
Recommendations and decisions on remuneration result from consultations between the Chairman and the Managing Director and
other Directors as they consider appropriate.
Among the matters which the Board of the Company decides are the Group’s business strategy, its annual budget, dividends and major
corporate activities. Responsibility for implementing the Group’s strategy is delegated to the Company’s executive management, with
decision-making authority within designated financial parameters delegated to the HKL finance committee. In addition, as part of the
Company’s tiered approach to oversight and management, certain Directors of the Company who do not serve on the board of HKL and
who are based outside Asia make regular visits to Asia and Bermuda where they participate in four annual strategic reviews. All of these
reviews precede the Board meetings. These Directors are not directly involved in the operational management of the Group’s business
activities, but their knowledge and close oversight of the Group’s affairs reinforces the process by which business is reviewed before
consideration by the Board.
The Board is scheduled to hold four meetings in 2012 and ad hoc procedures are adopted to deal with urgent matters. In 2011 one
meeting was held in Bermuda and three were held in Asia. All current Directors who held office in 2011 attended all four Board
meetings, save that Jenkin Hui attended three meetings and Lord Powell of Bayswater attended two meetings. The Board receives
high quality, up to date information for each of its meetings, which has previously been considered and approved at meetings of the
board of HKL. This information is also the subject of a strategy review in a cycle of meetings (in Bermuda or Asia, as appropriate) prior
to consideration by the Board itself.
The division of responsibilities between the Chairman, the Managing Director and the Chief Executive is well established. The
Chairman’s role is to lead the Board as it oversees the Group’s strategic and financial direction. The Managing Director’s principal
role is to act as chairman of HKL and of its finance committee, while the responsibility for running the Group’s business and all the
executive matters affecting the Group rests with the Chief Executive.
Hongkong Land64 Annual Report 2011 65
Directors’ Appointment, Retirement, Remuneration and Service Contracts
Candidates for appointment as executive Directors of the Company, as executive directors of HKL or as senior executives elsewhere
in the Group may be sourced internally, from the Jardine Matheson group or externally using the services of specialist executive search
firms. The aim is to appoint individuals who combine international best practice with adaptability to Asian markets.
Each new Director is appointed by the Board and, in accordance with Bye-law 92 of the Company’s Bye-laws, each new Director is
subject to retirement at the first Annual General Meeting after appointment. Thereafter, the Director will be subject to retirement by
rotation pursuant to Bye-law 85 whereby one-third of the Directors retire at the Annual General Meeting each year. These provisions
apply to both executive and non-executive Directors, but the requirement to retire by rotation pursuant to Bye-law 85 does not extend
to the Chairman or Managing Director.
R.C. Kwok retired from the Board of the Company on 12th May 2011. On 1st April 2012, Ben Keswick succeeded A.J.L. Nightingale
as Managing Director and Adam Keswick was appointed as a Director of the Company. A.J.L. Nightingale remains as a non-executive
Director of the Company. In accordance with Bye-law 85, Mark Greenberg, A.J.L. Nightingale, James Watkins and Percy Weatherall
retire by rotation at the Annual General Meeting and, being eligible, offer themselves for re-election. In accordance with Bye-law 92,
Adam Keswick and Ben Keswick will also retire, and, being eligible, offer themselves for re-election. None of the Directors proposed
for re-election has a service contract with the Company or its subsidiaries.
The Company’s policy is to offer competitive remuneration packages to its senior executives. It is recognised that, due to the nature
of the Group and its diverse geographic base, a number of its senior executives are required to be offered international terms and
the nature of the remuneration packages is designed to reflect this.
Directors’ fees, which are payable to all Directors other than the Chief Executive and the Chief Financial Officer, are decided upon by
shareholders in general meeting as provided for by the Company’s Bye-laws. For the year ended 31st December 2011, the Directors
received US$5.2 million (2010: US$3.8 million) in Directors’ fees and employee benefits, being US$0.6 million (2010: US$0.6 million)
in Directors’ fees, US$4.5 million (2010: US$3.1 million) in short-term employee benefits including salary, bonuses, accommodation
and deemed benefits in kind and US$0.1 million (2010: US$0.1 million) in post-employment benefits. The information set out in this
paragraph forms part of the audited financial statements.
The Company has in place shadow share option schemes under which cash bonuses are paid based on the performance of the
Company’s share price over a period. The shadow schemes were established to provide longer-term incentives for executive Directors
and senior managers. Shadow share options are granted after consultation between the Chairman, the Managing Director and the
Chief Executive and other Directors as they consider appropriate.
The Company purchases insurance to cover its Directors against their costs in defending themselves in civil proceedings taken against
them in that capacity and in respect of damages resulting from the unsuccessful defence of any proceedings. To the extent permitted
by law, the Company also indemnifies its Directors. Neither the insurance nor the indemnity provides cover where the Director has
acted fraudulently or dishonestly.
Directors’ Responsibilities in respect of the Financial Statements
The Directors are required under the Bermuda Companies Act 1981 to prepare financial statements for each financial year and to
present them annually to the Company’s shareholders at the Annual General Meeting. The financial statements should present fairly
in accordance with International Financial Reporting Standards (‘IFRS’) the financial position of the Group at the end of the year and
the results of its operations and its cash flows for the year then ended. The Directors consider that applicable accounting policies
under IFRS, applied on a consistent basis and supported by prudent and reasonable judgements and estimates, have been followed
in preparing the financial statements.
Going Concern
The Directors are required to consider whether it is appropriate to prepare financial statements on the basis that the Company and the
Group are going concerns. The Group prepares comprehensive financial forecasts and, based on these forecasts, cash resources and
existing credit facilities, the Directors consider that the Company and the Group have adequate resources to continue in business for
the foreseeable future. For this reason, the Directors continue to adopt the going concern basis in preparing the financial statements.

Hongkong Land66 Annual Report 2011 67
Corporate Governance
Code of Conduct
The Group conducts business in a professional, ethical and even-handed manner. Its ethical standards are clearly set out in the Group’s
Code of Conduct, a set of guidelines to which every employee must adhere. The code requires that all Group companies comply with
all laws of general application, all rules and regulations that are industry specific and proper standards of business conduct. The code
prohibits the giving or receiving of illicit payments, and requires all employees to be treated fairly, impartially and with respect. It also
requires that all managers must be fully aware of their obligations under the Code of Conduct and establish procedures to ensure
compliance at all levels within their organisations. The Group has in place procedures by which employees can raise, in confidence,
matters of serious concern in areas such as financial reporting or compliance.
Risk Management and Internal Control
The Board has overall responsibility for the Group’s system of risk management and internal control. The system of internal control is
designed to manage, rather than eliminate, business risk; to help safeguard the Group’s assets against fraud and other irregularities;
and to give reasonable, but not absolute, assurance against material financial misstatement or loss.
The principal risks and uncertainties facing the Company are set out on page 68.
The Board has delegated to the audit committee of HKL responsibility for reviewing areas of risk and uncertainty, the operation and
effectiveness of the Group’s system of internal control and the procedures by which these are monitored. The audit committee
considers the system and procedures on a regular basis, and reports to the Board semi-annually. The members of the audit committee
of HKL are Ben Keswick, Mark Greenberg, Adam Keswick, James Riley and Giles White; they have extensive knowledge of the Group
while at the same time not being directly involved in operational management. Ben Keswick and Adam Keswick became members of
the HKL audit committee upon their appointment to the Board on 1st April 2012 and Ben Keswick succeeded A.J.L. Nightingale as
chairman of the audit committee on that date. The Board considers that the members of the audit committee of HKL have, collectively,
the requisite skills, knowledge and experience to enable it to discharge its responsibilities in a proper manner. All the then current
members of the audit committee attended both its meetings during the year. The chief executive and chief financial officer of HKL,
together with representatives of the internal and external auditors, also attend the audit committee meetings by invitation.
Executive management is responsible for the implementation of the system of internal control throughout the Group. The internal
audit function monitors the effectiveness of the system and the approach taken by the business units to risk. The internal audit function
is outside the operating businesses and reports its findings, and recommendations for any corrective action required, to the audit
committee of HKL. The audit committee of HKL also reviews the effectiveness of the internal audit function.
The Group has in place an organisational structure with defined lines of responsibility and delegation of authority. There are established
policies and procedures for financial planning and budgeting; for information and reporting systems; for assessment of risk; and for
monitoring the Group’s operations and performance. The information systems in place are designed to ensure that the financial
information reported is reliable and up to date.
The Company’s policy on commercial conduct underpins the Group’s internal control process, particularly in the area of compliance.
The policy, as set out in the Code of Conduct, is reinforced and monitored by an annual compliance certification process.
The audit committee of HKL has also been given the responsibility to oversee the effectiveness of the formal procedures for employees
to raise any matters of serious concern, and is required to review any reports made under those procedures that are referred to it by
the internal audit function.
Prior to completion and announcement of the half-year and year-end results, a review of the financial information and of any issues
raised in connection with the preparation of the results, including the adoption of new accounting policies, is undertaken by the audit
committee of HKL with the executive management and a report is received from the external auditors. The audit committee of HKL
also assesses any reports on frauds identified during the period under review. The external auditors also have access to the full Board,
in addition to the Chief Executive, Chief Financial Officer and other senior executives.
The audit committee of HKL keeps under review the nature, scope and results of the external audit and the audits conducted by the
internal audit function. The audit committee of HKL also keeps under review the independence and objectivity of the external auditors,
and as part of that process considers and approves the level and nature of non-audit work performed. The terms of reference of the
audit committee of HKL can be found on the Company’s website at www.hkland.com.

Hongkong Land66 Annual Report 2011 67
Directors’ Share Interests
The Directors of the Company in office on 1st April 2012 had interests (within the meaning of the Disclosure and Transparency
Rules (‘DTRs’) of the Financial Services Authority (the ‘FSA’) of the United Kingdom) in the ordinary share capital of the Company at
22nd March 2012 as set out below. These interests included those notified to the Company in respect of the Directors’ connected
persons (as that term is used in the DTRs in relation to companies incorporated outside the United Kingdom).
Simon Keswick 74,521
Y.K. Pang 38,000
Charles Allen-Jones 60,000
Dr Richard Lee 3,678,685
A.J.L. Nightingale 2,184
Substantial Shareholders
As a non-UK issuer, the Company is subject to the DTRs pursuant to which a person must in certain circumstances notify the Company
of the percentage of voting rights attaching to the share capital of the Company that he holds. The obligation to notify arises if that
person acquires or disposes of shares in the Company which results in the percentage of voting rights which he holds reaching,
exceeding or falling below 5%, 10%, 15%, 20%, 25%, 30%, 50% and 75%.
The Company has been informed of the holding of voting rights of 5% or more attaching to the Company’s issued ordinary share
capital by Jardine Strategic Holdings Limited (‘Jardine Strategic’), which is directly interested in 1,176,616,646 ordinary shares carrying
50.23% of the voting rights. By virtue of its interest in Jardine Strategic, Jardine Matheson is also interested in the same ordinary
shares. Apart from this shareholding, the Company is not aware of any holders of voting rights of 5% or more attaching to the issued
ordinary share capital of the Company as at 22nd March 2012.
There were no contracts of significance with corporate substantial shareholders during the year under review.
Relations with Shareholders
The 2012 Annual General Meeting will be held at The Fairmont Southampton, Bermuda on 9th May 2012. The full text of the resolutions
and explanatory notes in respect of the meeting are contained in the Notice of Meeting which accompanies this Report. All shareholders
are invited to attend the Annual General Meeting and participate in communicating with the Company. The Company holds regular
meetings with institutional shareholders. A corporate website is maintained containing a wide range of information of interest to
investors at www.hkland.com.
Securities Purchase Arrangements
At the Annual General Meeting held on 11th May 2011, shareholders renewed the approval of a general mandate authorising the
Directors to effect purchases by the Company or its subsidiaries of the Company’s own ordinary shares of less than 15% in aggregate
of its issued share capital.
Related Party Transactions
Details of transactions with related parties entered into by the Company during the course of the year are included in Note 28 to the
financial statements on pages 56 and 57. There were no transactions entered into by the Company during the course of the year to
which the related party transaction rules of the FSA in the United Kingdom apply.

Hongkong Land68 Annual Report 2011 69
Principal Risks and Uncertainties
The Board has overall responsibility for risk management and internal control. The process by which the Group identifies and manages
risk is set out in more detail on page 66 of the Corporate Governance section of this Report. The following are the principal risks and
uncertainties facing the Company as required to be disclosed pursuant to the Disclosure and Transparency Rules issued by the
Financial Services Authority in the United Kingdom and are in addition to the matters referred to in the Chairman’s Statement and
Chief Executive’s Review.
Economic Risk
The Group is exposed to the risk of negative developments in global and regional economies, and financial and property markets, either
directly or through the impact on the Group’s joint venture partners, bankers, suppliers or tenants. These developments can result in:
• recession,inflation,deflationandcurrencyfluctuations;
• restrictionsintheavailabilityofcredit,increasesinfinancingandconstructioncostsandbusinessfailures;and
• reductionsinofficeandretailrents,officeandretailoccupancyandsalespricesof,anddemandfor,residentialdevelopments.
Such developments might increase costs of sales and operating costs, reduce revenues, or result in reduced valuations of the Group’s
investment properties or in the Group being unable to meet in full its strategic objectives.
Commercial Risk and Financial Risk
Risks are an integral part of normal commercial practices, and where practicable steps are taken to mitigate such risks. These risks are
further pronounced when operating in volatile markets.
The Group makes significant investment decisions in respect of commercial and residential development projects that take time to
come to fruition and achieve the desired returns and are, therefore, subject to market risks. These risks are further pronounced when
operating in volatile markets.
The Group operates in areas that are highly competitive, and failure to compete effectively in terms of price, product specification or
levels of service can have an adverse effect on earnings as can construction risks in relation to new developments. Significant pressure
from such competition may lead to reduced margins. The quality and safety of the products and services provided by the Group are also
important and there is an associated risk if they are below standard.
The steps taken by the Group to manage its exposure to financial risk are set out in the Financial Review on page 15 and Note 2 to
the financial statements on pages 32 to 36.
Regulatory and Political Risk
The Group is subject to a number of regulatory environments in the territories in which it operates. Changes in the regulatory approach
to such matters as foreign ownership of assets and businesses, exchange controls, planning controls, tax rules and employment
legislation have the potential to impact the operations and profitability of the Group. Changes in the political environment in such
territories can also affect the Group.
Terrorism, Pandemic and Natural Disasters
A number of the Group’s interests are vulnerable to the effects of terrorism, either directly through the impact of an act of terrorism
or indirectly through the impact of generally reduced economic activity in response to the threat of or an actual act of terrorism.
The Group would be impacted by a global or regional pandemic which could be expected to seriously affect economic activity and the
ability of our business to operate smoothly. In addition, many of the territories in which the Group is active can experience from time
to time natural disasters such as earthquakes and typhoons.

Hongkong Land68 Annual Report 2011 69
Shareholder Information
Financial Calendar
2011 full-year results announced 1st March 2012
Share registers closed 19th to 23rd March 2012
Annual General Meeting to be held 9th May 2012
2011 final dividend payable 16th May 2012
2012 half-year results to be announced 26th July 2012 *
Share registers to be closed 20th to 24th August 2012 *
2012 interim dividend payable 10th October 2012 *
* Subject to change
Dividends
Shareholders will receive their dividends in United States dollars, unless they are registered on the Jersey branch register where they
will have the option to elect for sterling. These shareholders may make new currency elections for the 2011 final dividend by notifying
the United Kingdom transfer agent in writing by 20th April 2012. The sterling equivalent of dividends declared in United States dollars
will be calculated by reference to a rate prevailing on 2nd May 2012. Shareholders holding their shares through The Central Depository
(Pte) Limited (‘CDP’) in Singapore will receive United States dollars unless they elect, through CDP, to receive Singapore dollars.
Registrars and Transfer Agent
Shareholders should address all correspondence with regard to their shareholdings or dividends to the appropriate registrar or
transfer agent.
Principal RegistrarJardine Matheson International Services Limited
P.O. Box HM 1068
Hamilton HM EX
Bermuda
Jersey Branch Registrar Singapore Branch RegistrarCapita Registrars (Jersey) Limited M & C Services Private Limited
12 Castle Street 138 Robinson Road #17-00
St Helier, Jersey JE2 3RT The Corporate Office
Channel Islands Singapore 068906
United Kingdom Transfer AgentCapita Registrars
The Registry
34 Beckenham Road
Beckenham, Kent BR3 4TU
England
Press releases and other financial information can be accessed through the internet at www.hkland.com.
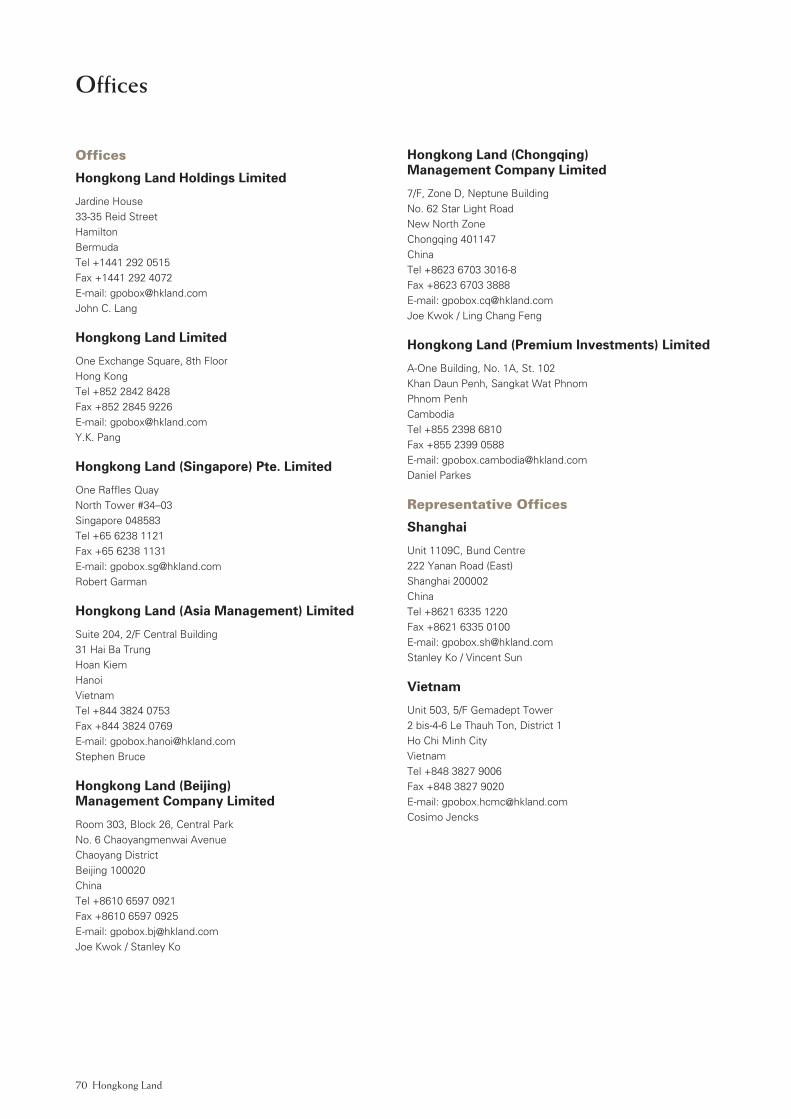
Hongkong Land70 Annual Report 2011 71
Offices
Offices
Hongkong Land Holdings Limited
Jardine House
33-35 Reid Street
Hamilton
Bermuda
Tel +1441 292 0515
Fax +1441 292 4072
E-mail: [email protected]
John C. Lang
Hongkong Land Limited
One Exchange Square, 8th Floor
Hong Kong
Tel +852 2842 8428
Fax +852 2845 9226
E-mail: [email protected]
Y.K. Pang
Hongkong Land (Singapore) Pte. Limited
One Raffles Quay
North Tower #34–03
Singapore 048583
Tel +65 6238 1121
Fax +65 6238 1131
E-mail: [email protected]
Robert Garman
Hongkong Land (Asia Management) Limited
Suite 204, 2/F Central Building
31 Hai Ba Trung
Hoan Kiem
Hanoi
Vietnam
Tel +844 3824 0753
Fax +844 3824 0769
E-mail: [email protected]
Stephen Bruce
Hongkong Land (Beijing) Management Company Limited
Room 303, Block 26, Central Park
No. 6 Chaoyangmenwai Avenue
Chaoyang District
Beijing 100020
China
Tel +8610 6597 0921
Fax +8610 6597 0925
E-mail: [email protected]
Joe Kwok / Stanley Ko
Hongkong Land (Chongqing) Management Company Limited
7/F, Zone D, Neptune Building
No. 62 Star Light Road
New North Zone
Chongqing 401147
China
Tel +8623 6703 3016-8
Fax +8623 6703 3888
E-mail: [email protected]
Joe Kwok / Ling Chang Feng
Hongkong Land (Premium Investments) Limited
A-One Building, No. 1A, St. 102
Khan Daun Penh, Sangkat Wat Phnom
Phnom Penh
Cambodia
Tel +855 2398 6810
Fax +855 2399 0588
E-mail: [email protected]
Daniel Parkes
Representative Offices
Shanghai
Unit 1109C, Bund Centre
222 Yanan Road (East)
Shanghai 200002
China
Tel +8621 6335 1220
Fax +8621 6335 0100
E-mail: [email protected]
Stanley Ko / Vincent Sun
Vietnam
Unit 503, 5/F Gemadept Tower
2 bis-4-6 Le Thauh Ton, District 1
Ho Chi Minh City
Vietnam
Tel +848 3827 9006
Fax +848 3827 9020
E-mail: [email protected]
Cosimo Jencks

Hongkong Land70 Annual Report 2011 71
To Hongkong Land Holdings Limited
Dear Sirs
Revaluation of Commercial Investment Properties Held under Freehold and Leasehold
Further to your instructions, we have valued in our capacity as external valuers the commercial investment properties held under
freehold and leasehold as described in Note 12 to the consolidated financial statements of Hongkong Land Holdings Limited. We are of
the opinion that the market value of the commercial investment properties held under freehold in Cambodia and leasehold in Hong
Kong, Singapore and Vietnam as at 31st December 2011, totalled US$22,391,500,000 (United States Dollars Twenty Two Billion Three
Hundred Ninety One Million and Five Hundred Thousand).
Our valuations are prepared in accordance with the International Valuation Standards by the International Valuation Standards Committee
and The HKIS Valuation Standards on Properties by The Hong Kong Institute of Surveyors.
We have inspected the properties without either making structural surveys or testing the services. We have been supplied with details
of tenure, tenancies and other relevant information.
In arriving at our opinion, each property was valued individually, on market value basis, calculated on the net income allowing for
reversionary potential, however no allowance has been made for expenses of realisation or for taxation which might arise in the event
of disposal.
Yours faithfully
Jones Lang LaSalle LimitedHong Kong, 1st March 2012
Report of the Valuers
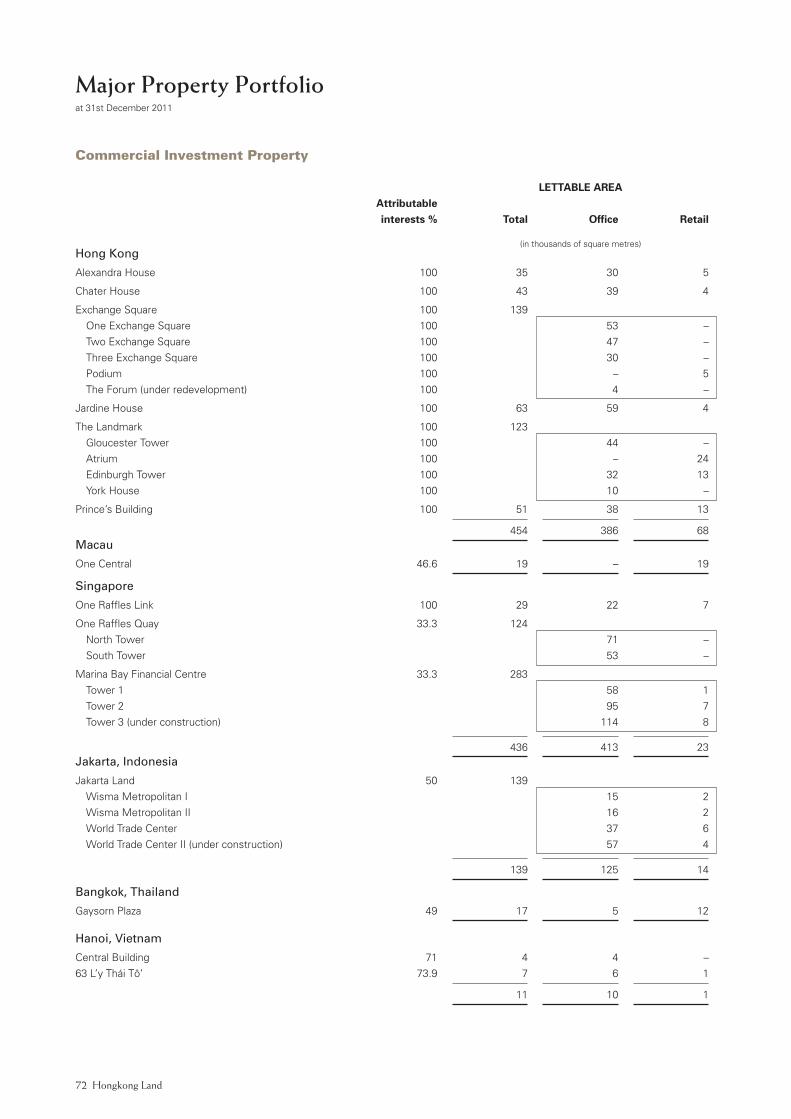
Hongkong Land72 Annual Report 2011 73
Major Property Portfolioat 31st December 2011
Commercial Investment Property
LETTABLE AREA Attributable interests % Total Office Retail
(in thousands of square metres)Hong Kong
Alexandra House 100 35 30 5
Chater House 100 43 39 4
Exchange Square 100 139
One Exchange Square 100 53 –
Two Exchange Square 100 47 –
Three Exchange Square 100 30 –
Podium 100 – 5
The Forum (under redevelopment) 100 4 –
Jardine House 100 63 59 4
The Landmark 100 123
Gloucester Tower 100 44 –
Atrium 100 – 24
Edinburgh Tower 100 32 13
York House 100 10 –
Prince’s Building 100 51 38 13 454 386 68 Macau
One Central 46.6 19 – 19
Singapore
One Raffles Link 100 29 22 7
One Raffles Quay 33.3 124
North Tower 71 –
South Tower 53 –
Marina Bay Financial Centre 33.3 283
Tower 1 58 1
Tower 2 95 7
Tower 3 (under construction) 114 8 436 413 23 Jakarta, Indonesia
Jakarta Land 50 139
Wisma Metropolitan I 15 2
Wisma Metropolitan II 16 2
World Trade Center 37 6
World Trade Center II (under construction) 57 4 139 125 14
Bangkok, Thailand
Gaysorn Plaza 49 17 5 12
Hanoi, Vietnam
Central Building 71 4 4 –
63 L’y Thái Tô’ 73.9 7 6 1 11 10 1

Hongkong Land72 Annual Report 2011 73
Residential Development Property for Sale
Attributable Available units at interests % Location 31st December 2011
Completed development
Hong Kong
The Sail at Victoria 100 Victoria Road 4
Serenade 100 Tai Hang Road 41
Mainland China
Maple Place 90 Beijing 113
Macau
One Central Residences 46.6 Avenida Dr Sun Yat Sen 8
The Residences & Apartments at Mandarin Oriental 46.6 Avenida Dr Sun Yat Sen 17
Attributable Approximate interests % Location site area
(in square metres)
Under development
Singapore
Parvis 50 Holland Hill 22,863
D’Mira 100 Boon Teck Road 2,588
The Estuary 100 Yishun Avenue 1/Avenue 2 26,949
A site at Ewe Boon Road 100 Ewe Boon Road 5,906
A site at Sixth Avenue 100 Sixth Avenue 6,412
Uber 388 100 Upper East Coast Road 6,103
Este Villa 100 Nim Road 17,955
Terrasse 100 Hougang Avenue 2 30,196
Ripple Bay 100 Jalan Loyang Besar/ 27,055
Pasir Ris Drive 4
Marina Bay Suites 33.3 Central Boulevard 5,290
Mainland China
Bamboo Grove 50 Chongqing 778,648
Landmark Riverside 50 Chongqing 336,600
Yorkville 100 Chongqing 385,943
A site in New North Zone 100 Chongqing 519,791
W.E. City 50 Chengdu 190,253
Park Life 50 Shenyang 572,419
One Capitol 50 Shenyang 346,721
A site in Shenbei District 50 Shenyang 356,624

Hongkong Land74 Annual Report 2011 PB
hong kong – central district
Mass transit railway access
Public car park
hongkong land properties
Pedestrian bridges
10
11
9 8
76
5
1 2
12
3
4
1 One Exchange Square2 Two Exchange Square3 Three Exchange Square
4 The Forum – under redevelopment5 Jardine House6 Chater House
7 Alexandra House8 Gloucester Tower9 Edinburgh Tower
10 York House11 Landmark Atrium12 Prince’s Building
CH
AT
ER
RO
AD
D E S VO E U X R OA D C E N T R A L
I C E H O U S E S T R E E T
Q U E E N ’ S R OA D C E N T R A L
ICE
HO
US
E S
TR
EE
T
PE
DD
ER
ST
RE
ET
MA
N Y I U
S T RE E T
L UN
G W
O R
OA
D
MAN C
HEUNG STREETH
A R B OU
R VI E
W S
T R E ET
MAN KAT STREET
J A C K S O N R O A D
C O N N A U G H T R OA D C E N T R A L
CO
NN
AU
GH
T R
OA
D C
EN
TR
ALQ
UE
EN
’ S R
OA
D C
EN
TR
AL
DES
VO
EUX
RO
AD
CEN
TRA
L
The LandmarkMandarin Oriental
StockExchange
10
11
9
76 1 2
4
3
5
12
8
StatueSquare
MandarinOriental
StatueSquare
GeneralPost Office
HSBC
StandardCharteredBank
Bank ofChina
Airpor
t Exp
ress S
tation
Major Property Portfolio
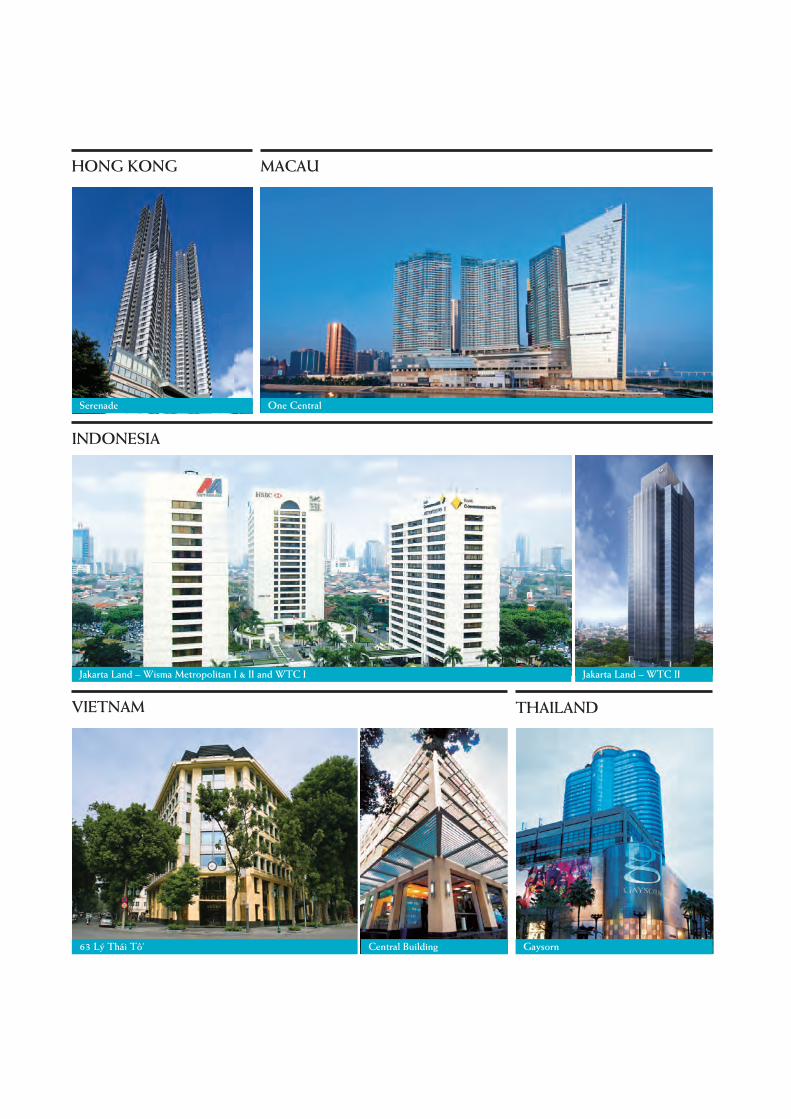
indonesia
Jakarta Land – Wisma Metropolitan i & ii and WTC i Jakarta Land – WTC ii
ThaiLand
Gaysorn
vieTnaM
63 Lý Thái Tô’ Central Building
MaCauhonG konG
serenade one Central
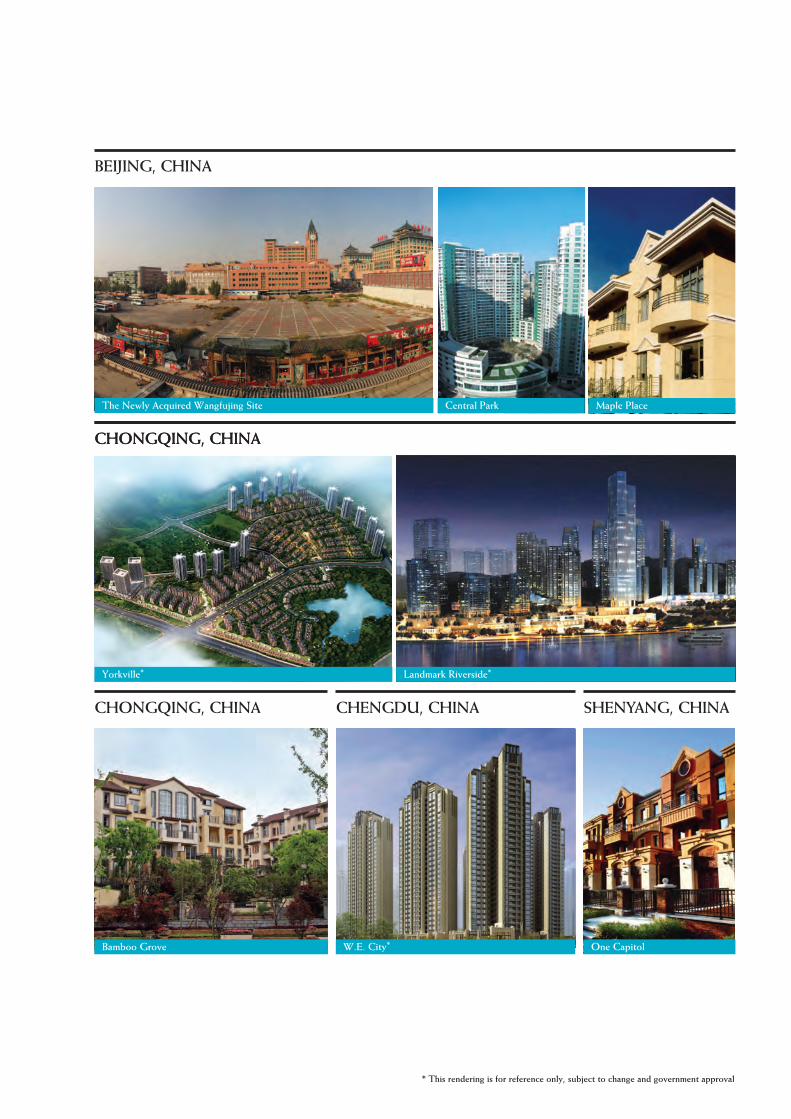
CHONGQING, CHINACHONGQING, CHINA
Landmark Riverside*Yorkville*
Bamboo Grove One Capitol
sHeNYANG, CHINACHeNGdu, CHINACHONGQING, CHINA
W.e. City*
BeIjING, CHINA
Central Park Maple Place
* This rendering is for reference only, subject to change and government approval
The Newly Acquired Wangfujing site
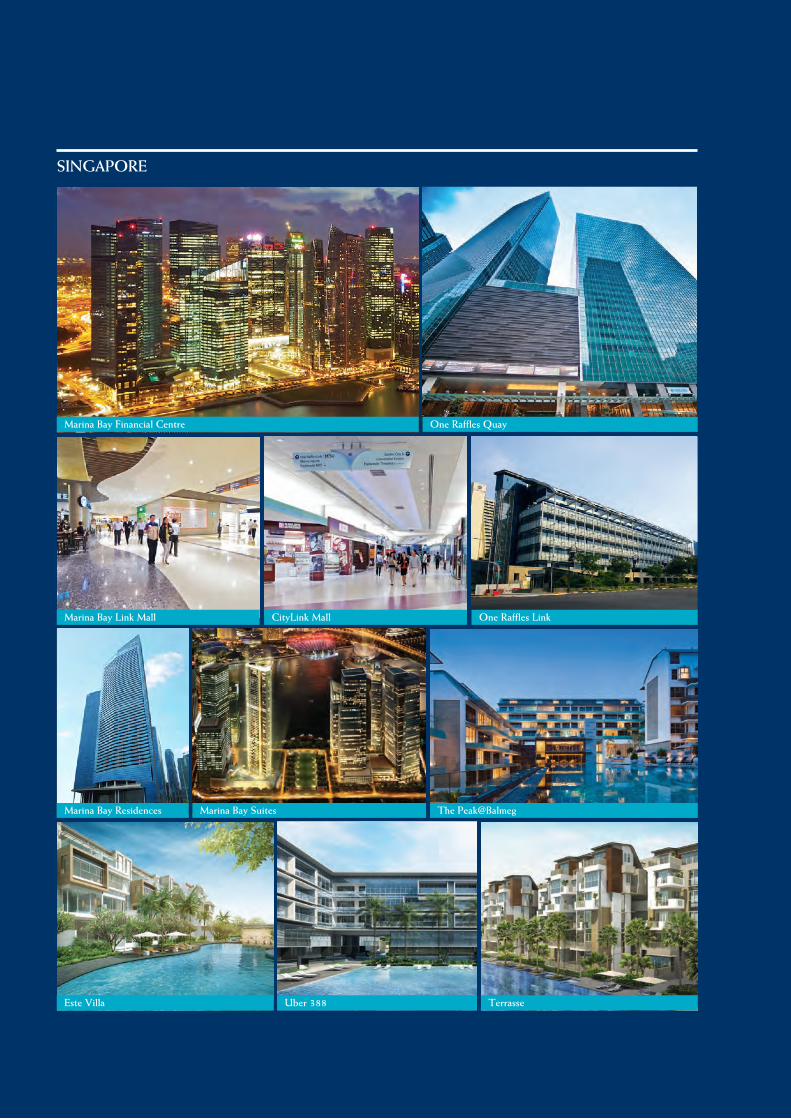
Ho
ng
kon
g Lan
d H
old
ing
s Limited A
nnual Report 2011
SINGAPORE
Uber 388
Marina Bay Residences
Marina Bay Financial Centre
Este Villa Terrasse
One Raffles Quay
The Peak@BalmegMarina Bay Suites
One Raffles LinkCityLink MallMarina Bay Link Mall

H
on
gko
ng
Land
Ho
ldin
gs Lim
ited Annual R
eport 2011
Jardine House Hamilton BermudaHongkong Land Holdings Limited
www.hkland.com