Annual Report 2010 - Adcock Ingramadcock.com/content/finreports/2010 2010 annual report (23).pdfand...
150
A d d i n g v a l u e t o l i f e Annual Report 2010
Transcript of Annual Report 2010 - Adcock Ingramadcock.com/content/finreports/2010 2010 annual report (23).pdfand...

Adding value to
life
Annual Report 2010
Our heritage
1 • Financial highlights
2 • Our heritage
Group overview
4 • Value added statement
5 • Segmental analysis
6 • Business overview
8 • Strategy overview
10 • Board of directors
12 • Executive committee
14 • Chairman’s report
18 • Chief Executive Offi cer’s report
22 • Chief Financial Offi cer’s report
26 • Operations overview – Pharmaceutical division
30 • Operations overview – Adcock Ingram Critical Care
32 • Operations overview – The Scientifi c Group
Sustainability
34 • Sustainability focus
36 • Corporate governance
42 • Our people
48 • Corporate social investment
50 • Remuneration
54 • Stakeholder engagement
56 • Environmental
58 • Risk Management
Annual fi nancial statements
62 • Directors’ responsibility for and approval of the annual fi nancial statements
62 • Certifi cate by Company Secretary
63 • Audit Committee report
65 • Report of the independent auditors
66 • Directors’ report
68 • Segment report
70 • Accounting policies
88 • Consolidated statements of comprehensive income
89 • Consolidated statements of changes in equity
90 • Consolidated statements of fi nancial position
91 • Consolidated statements of cash fl ows
92 • Notes to the group annual fi nancial statements
125 • Company statements of comprehensive income
126 • Company statements of changes in equity
127 • Company statements of fi nancial position
128 • Company statement of cash fl ows
129 • Notes to the company annual fi nancial statements
135 • Annexure A – interest in subsidiary companies, joint ventures and associates
Shareholder information
136 • Shareholder analysis
140 • Notice of Annual General Meeting
143 • Annual General Meeting – explanatory notes
144 • Glossary
Form of proxy – Inserted
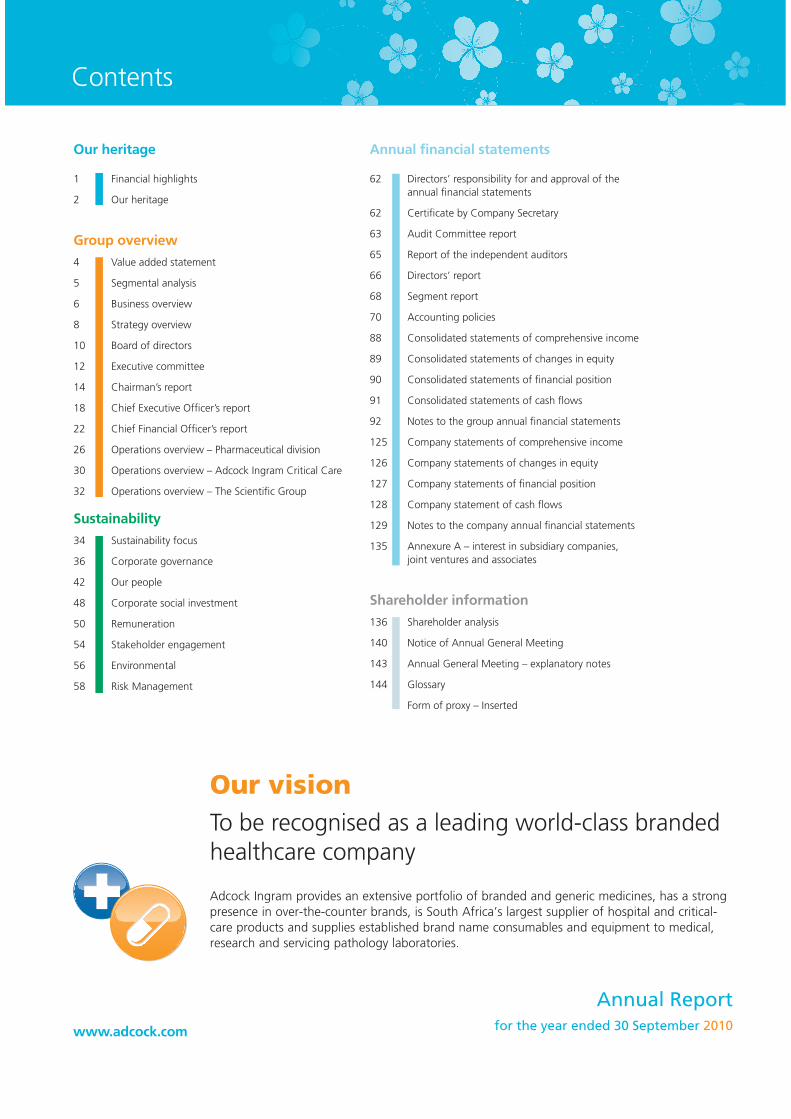
Adcock Ingram provides an extensive portfolio of branded and generic medicines, has a strong presence in over-the-counter brands, is South Africa’s largest supplier of hospital and critical-care products and supplies established brand name consumables and equipment to medical, research and servicing pathology laboratories.
Our visionTo be recognised as a leading world-class branded healthcare company
Annual Report for the year ended 30 September 2010www.adcock.com
Contents
A d c o c k I n g r a m A n n u a l R e p o r t 2 0 1 0 1
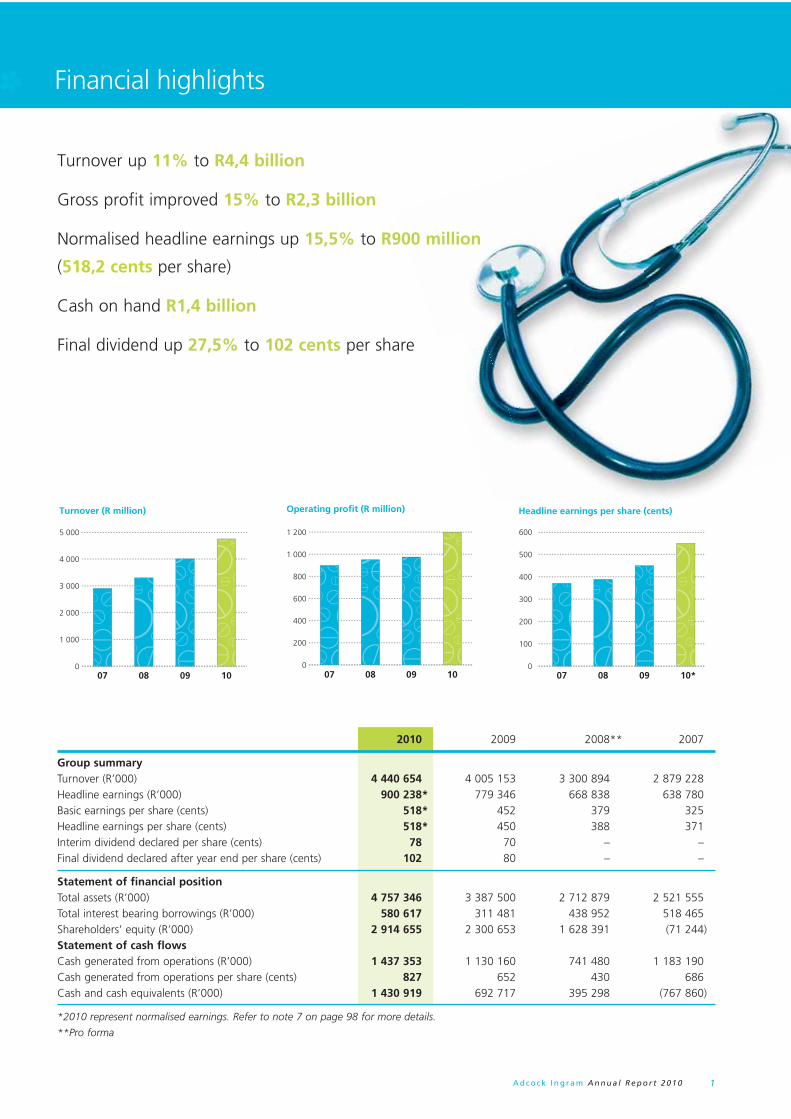
Financial highlights
2010 2009 2008** 2007
Group summaryTurnover (R’000) 4 440 654 4 005 153 3 300 894 2 879 228 Headline earnings (R’000) 900 238* 779 346 668 838 638 780Basic earnings per share (cents) 518* 452 379 325 Headline earnings per share (cents) 518* 450 388 371Interim dividend declared per share (cents) 78 70 – – Final dividend declared after year end per share (cents) 102 80 – –
Statement of financial positionTotal assets (R’000) 4 757 346 3 387 500 2 712 879 2 521 555 Total interest bearing borrowings (R’000) 580 617 311 481 438 952 518 465Shareholders’ equity (R’000) 2 914 655 2 300 653 1 628 391 (71 244)Statement of cash flowsCash generated from operations (R’000) 1 437 353 1 130 160 741 480 1 183 190Cash generated from operations per share (cents) 827 652 430 686Cash and cash equivalents (R’000) 1 430 919 692 717 395 298 (767 860)
*2010 represent normalised earnings. Refer to note 7 on page 98 for more details.
**Pro forma
Turnover (R million)
0
1 000
2 000
3 000
4 000
5 000
10090807
Headline earnings per share (cents)
0
100
200
300
400
500
600
10*090807
Operating profit (R million)
0
200
400
600
800
1 000
1 200
10090807
Turnover up 11% to R4,4 billion
Gross profit improved 15% to R2,3 billion
Normalised headline earnings up 15,5% to R900 million
(518,2 cents per share)
Cash on hand R1,4 billion
Final dividend up 27,5% to 102 cents per share
A d c o c k I n g r a m A n n u a l R e p o r t 2 0 1 02
Our heritage
Looking at our past ,
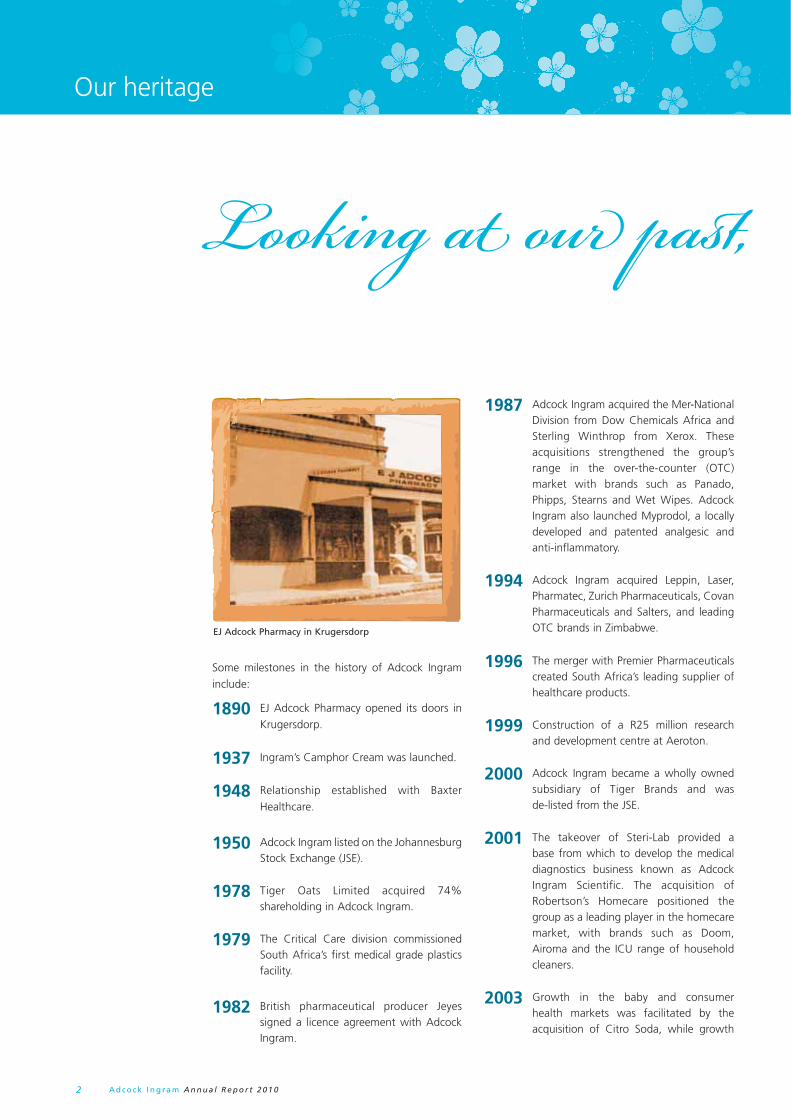
Some milestones in the history of Adcock Ingram
include:
1890 EJ Adcock Pharmacy opened its doors in
Krugersdorp.
1937 Ingram’s Camphor Cream was launched.
1948 Relationship established with Baxter
Healthcare.
1950 Adcock Ingram listed on the Johannesburg Stock Exchange (JSE).
1978 Tiger Oats Limited acquired 74% shareholding in Adcock Ingram.
1979 The Critical Care division commissioned South Africa’s first medical grade plastics facility.
1982 British pharmaceutical producer Jeyes signed a licence agreement with Adcock Ingram.
1987 Adcock Ingram acquired the Mer-National Division from Dow Chemicals Africa and Sterling Winthrop from Xerox. These acquisitions strengthened the group’s range in the over-the-counter (OTC) market with brands such as Panado, Phipps, Stearns and Wet Wipes. Adcock Ingram also launched Myprodol, a locally developed and patented analgesic and anti-inflammatory.
1994 Adcock Ingram acquired Leppin, Laser, Pharmatec, Zurich Pharmaceuticals, Covan Pharmaceuticals and Salters, and leading OTC brands in Zimbabwe.
1996 The merger with Premier Pharmaceuticals created South Africa’s leading supplier of healthcare products.
1999 Construction of a R25 million research and development centre at Aeroton.
2000 Adcock Ingram became a wholly owned subsidiary of Tiger Brands and was de-listed from the JSE.
2001 The takeover of Steri-Lab provided a base from which to develop the medical diagnostics business known as Adcock Ingram Scientific. The acquisition of Robertson’s Homecare positioned the group as a leading player in the homecare market, with brands such as Doom, Airoma and the ICU range of household cleaners.
2003 Growth in the baby and consumer health markets was facilitated by the acquisition of Citro Soda, while growth
EJ Adcock Pharmacy in Krugersdorp

A d c o c k I n g r a m A n n u a l R e p o r t 2 0 1 0 3
in the cardiovascular and central nervous system markets was supplemented with the purchase of Parke-Med from Pfizer Laboratories.
2005 The Adcock Ingram OTC Academy of Learning was launched to provide intensive and practical training to pharmacy personnel.
2005 Adcock Ingram Critical Care acquired 74% of The Scientific Group.
2007 Adcock Ingram launches its range of generic ARV products.
2008 Adcock Ingram unbundled from Tiger Brands and re-listed on the JSE.
2008 Joint venture with an Indian partner Ieads to formation of Adcock Ingram in Bangalore.
2009 Adcock Ingram acquired Dawanol in Kenya and purchased TLC, strengthening its position in the FMCG market.
2010 Concluded BEE equity transaction which has raised Adcock Ingram to a Level 4 empowerment contributor.
2010 Adcock Ingram purchased Unique Formulations and Indigenous Systems and acquired Ayrton in Ghana.
2010 Entered into strategic collaboration with various multinational companies.
Today Adcock Ingram has a 10% share of the private pharmaceutical market in South Africa. One third of all OTC healthcare products sold in South Africa is an Adcock Ingram product.
Adcock JSE listing Plaque
The original plaque from the prices board of the trading fl oor which closed on 7 June 1996
celebr ating our heritage
A d c o c k I n g r a m A n n u a l R e p o r t 2 0 1 04
Value added statement
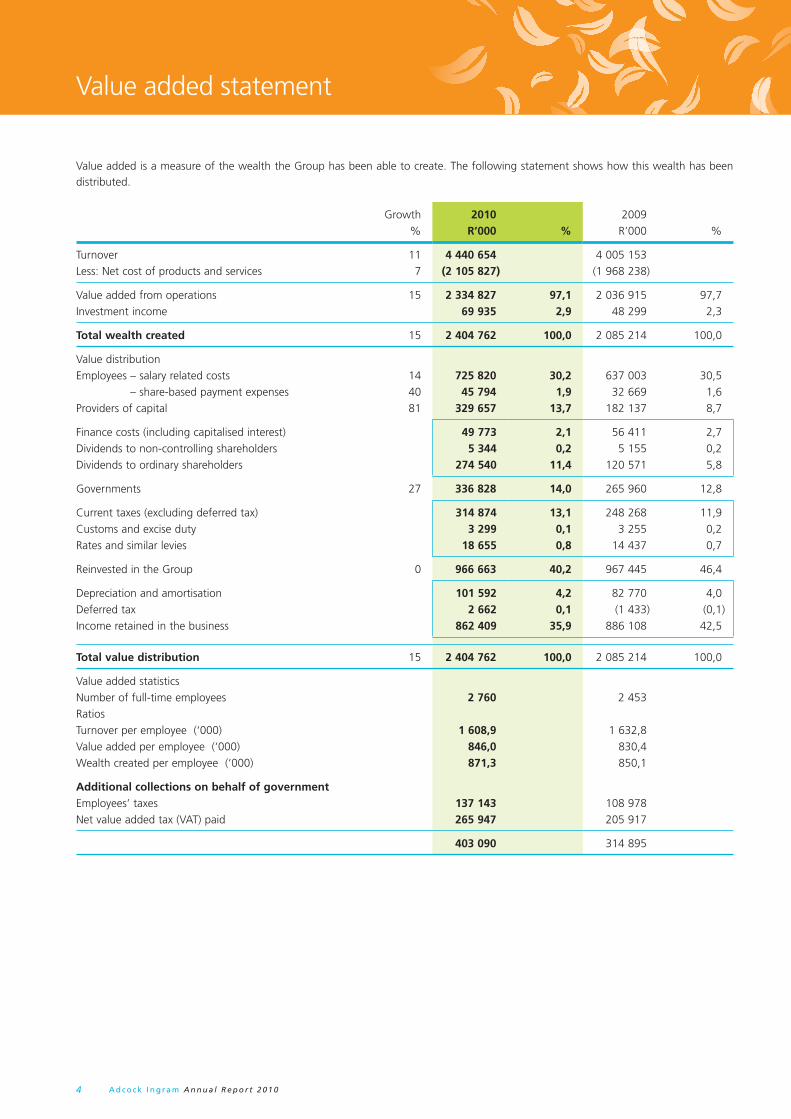
Value added is a measure of the wealth the Group has been able to create. The following statement shows how this wealth has been distributed.
Growth 2010 2009% R’000 % R’000 %
Turnover 11 4 440 654 4 005 153 Less: Net cost of products and services 7 (2 105 827) (1 968 238)
Value added from operations 15 2 334 827 97,1 2 036 915 97,7Investment income 69 935 2,9 48 299 2,3
Total wealth created 15 2 404 762 100,0 2 085 214 100,0
Value distributionEmployees – salary related costs 14 725 820 30,2 637 003 30,5
– share-based payment expenses 40 45 794 1,9 32 669 1,6Providers of capital 81 329 657 13,7 182 137 8,7
Finance costs (including capitalised interest) 49 773 2,1 56 411 2,7Dividends to non-controlling shareholders 5 344 0,2 5 155 0,2Dividends to ordinary shareholders 274 540 11,4 120 571 5,8
Governments 27 336 828 14,0 265 960 12,8
Current taxes (excluding deferred tax) 314 874 13,1 248 268 11,9Customs and excise duty 3 299 0,1 3 255 0,2Rates and similar levies 18 655 0,8 14 437 0,7
Reinvested in the Group 0 966 663 40,2 967 445 46,4
Depreciation and amortisation 101 592 4,2 82 770 4,0Deferred tax 2 662 0,1 (1 433) (0,1)Income retained in the business 862 409 35,9 886 108 42,5
Total value distribution 15 2 404 762 100,0 2 085 214 100,0
Value added statisticsNumber of full-time employees 2 760 2 453 RatiosTurnover per employee (‘000) 1 608,9 1 632,8 Value added per employee (‘000) 846,0 830,4 Wealth created per employee (‘000) 871,3 850,1
Additional collections on behalf of governmentEmployees’ taxes 137 143 108 978 Net value added tax (VAT) paid 265 947 205 917
403 090 314 895
A d c o c k I n g r a m A n n u a l R e p o r t 2 0 1 0 5
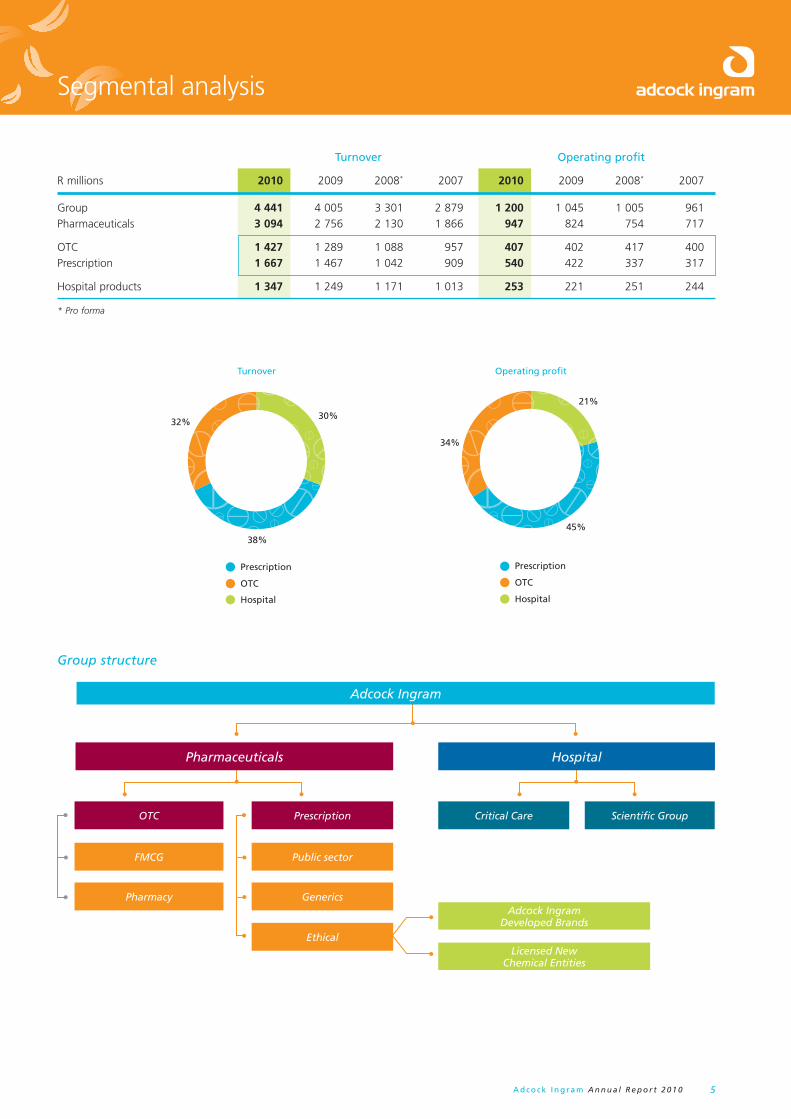
Turnover Operating profit
R millions 2010 2009 2008* 2007 2010 2009 2008* 2007
Group 4 441 4 005 3 301 2 879 1 200 1 045 1 005 961 Pharmaceuticals 3 094 2 756 2 130 1 866 947 824 754 717
OTC 1 427 1 289 1 088 957 407 402 417 400Prescription 1 667 1 467 1 042 909 540 422 337 317
Hospital products 1 347 1 249 1 171 1 013 253 221 251 244
* Pro forma
Group structure
Adcock Ingram
Pharmaceuticals
Prescription Scientifi c Group
Public sector
GenericsAdcock Ingram
Developed Brands
Licensed NewChemical Entities
OTC Critical Care
FMCG
Pharmacy
Hospital
Ethical
Segmental analysis
38%
30%32%
Turnover
Prescription
OTC
Hospital
45%
21%
34%
Operating profit
Prescription
OTC
Hospital

A d c o c k I n g r a m A n n u a l R e p o r t 2 0 1 06
Business overview
Adcock Ingram
PharmaceuticalsOTC
Adcock Ingram has two businesses; each delivering essential services to a wide customer base.
Key customers
• Government
• Pharmaceutical wholesalers
• Corporate pharmacy groups
• Private hospitals
• FMCG wholesale and retail
• Doctors and specialists
• Independent pharmacies
Key brands
Pain management• Syndol• Adco-Dol• Compral• Panado• Betapyn• Teejel• Fastum
Colds and flu• Corenza• Dilinct• Adco Sinal• LCC• Cepacol• Medi-Keel A
Allergy and nasal• Allergex• Nazene Z
Digestive wellbeing• Citro Soda• Freshen• Inteflora• Pectrolyte• Scopex
Supplements and energy• Vita-thion• Bioplus• Unique• Gummyvites
Personal care• TLC
Business focus • Enhance strategic alliances
• Geographic expansion
• Expansion into adjacent
categories
• Continue to build brands
Financial performance• Turnover
R3 094 million• Operating profit
R947 million
OTCThe market leader in branded OTC products across a
broad range of therapeutic categories. An extensive
distribution structure enabling the marketing and
distribution of products into pharmacy, mainstream
FMCG, wholesale and convenience channels.
Has developed a wide range of household brands.
Financial performance• Turnover
R1 427 million• Operating profit
R407 million
Critical CareHospital
Key brands
• Sabax intravenous fluids• Oliclinomel intravenous nutrition• Adco generic injectable drugs• Baxter Colleague infusion pumps• Amsino gravity sets• Baxter peritoneal dialysis• Gambro haemodialysis• One Alpha• Fosrenol• Aranesp• Fenwal blood bags• FEIBA (Factor VIII Inhibitor)• BBraun Ostomy and Wound Care
Critical CareCritical Care is a leading supplier of life saving products for the critical care and specialist hospital environment. The portfolio includes intravenous fluids, renal dialysis systems, products for the storage of blood and blood components, infusion systems and accessories, and a comprehensive range of wound care and ostomy products. Founded in 1948, the initial partnership with Baxter Healthcare established a platform for other partnerships with global leaders in hospital product development, supplying Adcock Ingram with quality, innovative products for a growing market.
Financial performance• Turnover
R1 036 million• Operating profit
R221 million
Business focus• Core business growth• Service excellence• PIC/S accreditation• Organic growth of core agencies • Increase revenue from medical
devices• Export into sub Saharan Africa• Niche acquisitions
Financial performance• Turnover
R1 347 million• Operating profit
R253 million

A d c o c k I n g r a m A n n u a l R e p o r t 2 0 1 0 7
Key brands
Women’s Health• Livifem• Mercilon• Betadine• Estalis• Evista• Forteo• Estradot• Estro-Pause
Respiratory• Prelone• Solphyllex• Uniphyl
Dermatology• Dovobet• Fucidin• Elidel• Adco-Sporazole• Fucidin H• Acnetane
Analgesics, anaesthetics, anti-inflammatory• Myprodol• Genpayne
Prescription
PrescriptionA comprehensive range of branded and
generic products in Schedules 3-6 and
holds a market leadership position in the
total private pharmaceutical market. In
generics, the company markets a broad
range of affordable products under the
corporate brand and in branded products
a variety of many well-recognised leading
brands.
Financial performance• Turnover
R1 667 million• Operating profit
R540 million
Scientifi c Group
Scientific GroupThe Scientific Group supplies leading brand in-vitro diagnostic, research and medical equipment, reagents and consumables to pathology laboratories, research laboratories and hospitals. Our laboratory product range includes chemistry and haematology, serology, immunology, flow cytometry and molecular biology. Within the hospital channel we focus on the theatre, ICU and high care environments supplying products covering ventilation and anaesthetics, cardiac perfusion, electro surgery, surgical instruments, suction, patient monitoring, infection control, point of care, general x-ray and ultrasound.
Financial performance• Turnover
R311 million• Operating profit
R32 million
Key brands
• Becton Dickinson • Biosciences• Horiba Medical• J & J Ortho Clinical • Diagnostics• Trinity
• Corning• Abbott Vysis• Terumo • Maquet• Criticare• Steelco
• IStat• Brandon• Erbe• Serres (Skin Tact)• Lawton
Contribution to turnover
30%
8%
14%
24%
24%Hospital
FMCG
Pharmacy
Generics
Branded
32%
7%
14%
22%
25%
09 10
• Macaine• Xylotox
Cardiovascular• Adco-Simvastatin• Adco-Zetomax• Adco-Vascard• Adco-Zildem• Adco-Zetomax Co
Ophthalmics• Gemini• Spersallerg• Spersadex Comp
• Zaditen• Fucithalmic• Efemoline
Central nervous system• Stresam
Urology• Urizone• Urispas
Anti-retrovirals• Adco-Efavirenz
A d c o c k I n g r a m A n n u a l R e p o r t 2 0 1 08
Strategy overview
In pursuit of Adcock Ingram’s vision to be recognised as a leading, world-class branded
healthcare company, the Group’s strategy emphasises five fundamental initiatives:
• Optimisation of the business portfolio to be the corporate brand of choice
• Pursuit of organic growth
• Acquisitions
• In the local South African market, for entry into new adjacent categories
• In other emerging markets to leverage the Group’s current pipeline of new products and
• Internationally, to secure vertical integration, intellectual property development and geographical diversification
• Development of exportable competence through leveraging world-class formulation and manufacturing expertise
• Transforming the organisation through diversity and BEE ownership
To implement the strategy Adcock Ingram will continue to focus on the following
core capabilities:
• Attract, retain, deploy and develop the best people
• Expertise in and reputation for partnership and innovation
• Operational excellence
• Customer focus underpinned by trusted brands
• Integrated service delivery
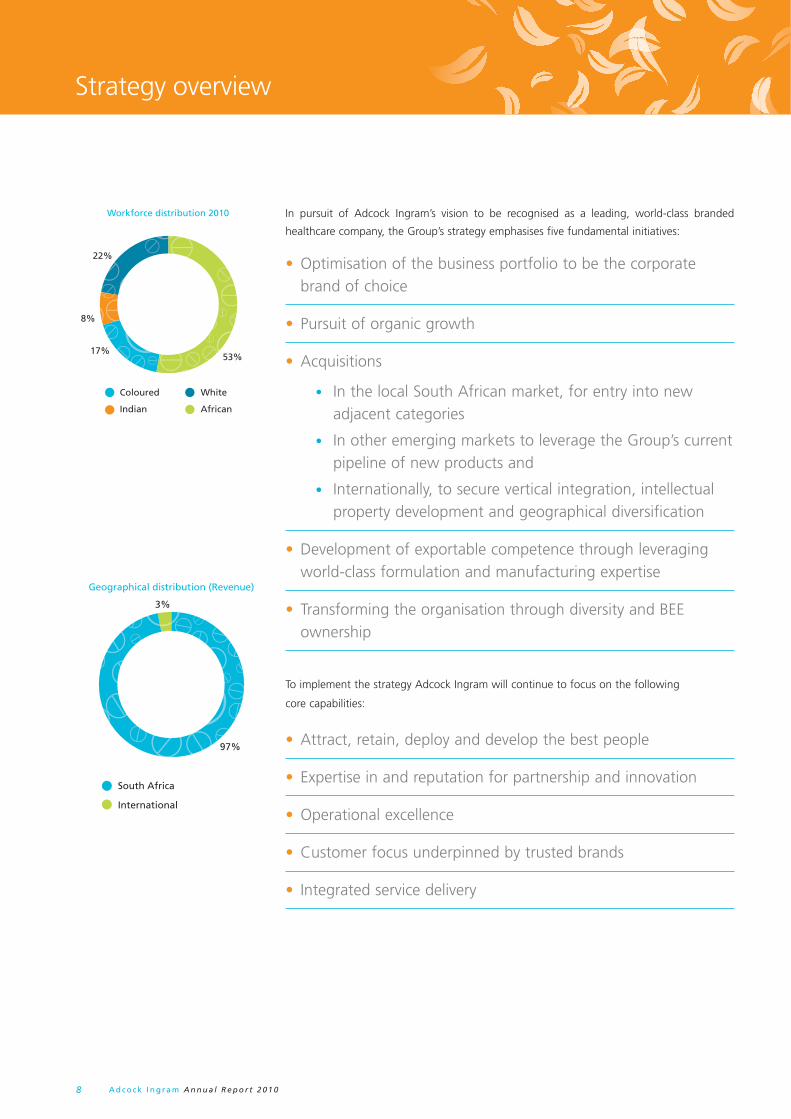
97%
3%
Geographical distribution (Revenue)
South Africa
International
53%17%
8%
22%
Workforce distribution 2010
Coloured
Indian
White
African

A d c o c k I n g r a m A n n u a l R e p o r t 2 0 1 0 9
Achievements during the year include the following:
• Numerous strategic distribution and promotional agreements signed with MSD, Roche, Lilly and Novartis
• Expansion into West Africa through the acquisition of Ayrton Drug Manufacturing Limited
• Previous acquisitions fully integrated
• Oncology sector entered
• Facilities upgrade continued and
• Completion of Black Economic Empowerment (BEE) ownership transaction
The Group strategy focuses on growth as illustrated below.
Profi
tab
le g
row
th
20102008 2012 2014
Horizon 1 – South Africa
Horizon 3 – Other emerging markets
Horizon 2 – Rest of Africa
• Tenders
• ARV, Tablets, Capsules
• Creams, Ointments
• IV Fluids, Renal
• Adjacent Categories
• TLC, Unique Formulations, Indigenous Systems
• Biotech
• Celltrion
• Multinational Partnerships
• MSD, Lilly, Novartis, Roche
• Adcock Ingram East Africa
• Kenya - Dawanol
• Ghana
• Ayrton
• Nigeria
• Leverage partnerships
• MSD
• Leo
• Leverage our internationally
accredited supply chain and
R&D competence
• Leverage partnerships with
multinational pharmaceutical
companiesShort-term
Medium-term
Long-term

A d c o c k I n g r a m A n n u a l R e p o r t 2 0 1 01 0
Board of directors
Front: AM Thompson, AG Hall, T Lesoli, JJ Louw Back: LE Schönknecht, CD Raphiri, RI Stewart, KDK Mokhele, EK Diack
Th e board compr ises two executive and seven non-executive directors , all of wh om are class ifi ed as indepe ndent.
All directors were app ointed on 15 July 2008. Th ere have been no changes to th e composition of the board during th e year.
A d c o c k I n g r a m A n n u a l R e p o r t 2 0 1 0 1 1
KDK Mokhele Chairman (55)PhD Microbiology, MSc Food Science, BSc Agriculture
Dr Khotso Mokhele held post-doctoral fellowships at the Johns Hopkins University in Baltimore, Maryland, and at the University of Pennsylvania in Philadelphia, after the completion of his studies. He also completed the Stanford Executive Programme in the Graduate School of Business at Stanford University in the USA. Dr Mokhele was the founder president of the National Research Foundation and served as its CEO from 1999-2006. He also served in a senior advisory capacity at numerous academic, scientific and professional bodies and institutions including as Chairman of the National Skills Authority. Dr Mokhele was recently appointed as the Chancellor of the University of the Free State. In addition to his non-executive chairmanship of Adcock Ingram, Dr Mokhele holds non-executive positions on the boards of several national companies, amongst others as the Chairman of Impala Platinum Holdings Limited and as a director on the boards of Tiger Brands Limited, Zimplats Holdings Limited and African Oxygen Limited. Dr Mokhele received the Lifetime Achievement Technology Top 100 award in 2009 for his vision and major contribution in securing the Southern African Large Telescope (SALT), constructed outside Sutherland in the Northern Cape as well as several honorary doctorates from institutions in South Africa and the USA.
EK Diack (53)BAcc, CA (SA), AMP (Harvard), AMP (UCT)
Eric Diack is a chartered accountant and has been the CEO of Anglo Industries and the CEO of Anglo American Ferrous and Industries Division. In addition to his directorship of Adcock Ingram, Mr Diack also serves as a non-executive director of Ayavuna Appliance Holdings, Ayavuna Appliance Investments and Deplian Investments. He has previously been a director on the boards of several listed companies including Dorbyl, Tongaat Hulett and ArcelorMittal, as well as numerous major unlisted companies. He is the Chairman of the Adcock Ingram Audit Committee.
T Lesoli (60)MB BS, Dip of Child Health
Tlalane Lesoli qualified as a medical doctor at the University of London and is a registered practitioner with the Health Professions Council of South Africa as well as the British General Medical Council. She has served as Research Fellow at John Radcliffe Hospital at Oxford University and as medical director for the Transmed Medical Fund. She co-founded and managed a health products company, Mother Earth Distributors, as well as a health education enterprise called Nature Plan. Dr Lesoli is a non-executive director on various other boards, including Woman Investment Africa Network and Global Africa Resources. She chairs the Transformation Committee of Adcock Ingram.
CD Raphiri (47)BSc Mechanical Engineering, Graduate Diploma in Engineering, MBA
Clifford Raphiri started his career as a consulting engineer with Andersen Consulting. After a stint at Metal Box (now Bevcan) as a project engineer and at BKS Inc as a design mechanical consulting engineer, he went on to join SA Breweries (SAB) as a quality assurance technologist and has served in various manufacturing leadership positions. He is currently employed as the manufacturing and technical director of SAB and serves on the boards of various SAB Limited subsidiaries.
LE Schönknecht (57)BCompt (Hons), CA (SA)
Leon Schönknecht qualified as a chartered accountant with Deloitte & Touche. He currently serves as the Managing Director of New Teltron (Pty) Limited. He previously held the position of CEO of United Pharmaceutical Distributors (UPD). He served as the non-executive chairman of UPD and as a director of the Premier Group. He is the Chairman of the Human Resources, Remuneration and Nominations Committee of Adcock Ingram.
RI Stewart (58)MB ChB, PhD (Med), Grad Dip Comp Dir, F Inst Dir
Roger Stewart served as associate professor of physiology at the University of Stellenbosch and a fellow of the American College of Chest Physicians. He was a group executive at the South African Medical Research Council. Dr Stewart was also responsible for local and international products and business development for the SA Druggists Group. He has served on the boards of a number of private companies in Southern Africa and Europe. He is the lead partner in a business consulting practice. He is the Chairman of Adcock Ingram’s Risk & Sustainability Committee.
AM Thompson (53)BSc (Civil Engineering), MBA
Andrew Thompson spent much of his career in the Mondi Group where he joined as Group Fibre Resources Manager in 1987. He rose quickly through the ranks to become Group CEO in 1999 and Executive Chairman in 2003. From 1996 to 2004, he represented the Mondi Group’s interests on the boards of some 20 subsidiary and associated companies and served on the board of Tongaat Hulett. Mr Thompson currently serves on the board of Mondi Packaging South Africa and is a Trustee of WWF (SA).
AG Hall (48)Chief Financial Officer, CA (SA), BPharm
Andy Hall joined Adcock Ingram in October 2007 as the chief financial officer from his previous position as chief financial officer of another listed pharmaceutical company in South Africa. Prior to that, Andy was the partner in charge of health sciences at Ernst & Young where he spent 13 years. Before joining Ernst & Young he was involved in retail pharmacy for two years and in sales and marketing with Pfizer for five years.
JJ Louw (41)Chief Executive Officer, MB ChB, MBA
Jonathan Louw practised as an anaesthetist at St. Mary’s Hospital in London in the 1990s before leaving full time medical practice to join the pharmaceutical industry in 1999. He initially worked for AstraZeneca in South Africa. In 2001 he joined Adcock Ingram as the new business development executive, overseeing geographic expansion and spearheading acquisitions and new product development. Jonathan took over the management of the pharmaceutical business in late 2002, restructuring the business and integrating various acquisitions. He is currently the chief executive officer of the Adcock Ingram Group.

A d c o c k I n g r a m A n n u a l R e p o r t 2 0 1 01 2
Executive committee
Jonathan LouwChief Executive Officer
CV on page 11
Andy HallChief Financial Officer
CV on page 11
Bill TweedieManaging Executive Pharmaceuticals, BCompt (Hons), CA (SA)
Bill Tweedie has held various financial positions within both Adcock Ingram and Tiger Brands over the past 18 years, including that of group financial executive of Tiger Brands. He was financial director of AICC and general manager of National Renal Care before moving on to Tiger Brands as financial director of Beacon Sweets. He spent three and a half years in a corporate role at Tiger Brands. In 2004 Bill embarked on a career change and re-joined Adcock Ingram in a sales and marketing executive position in charge of OTC. In December 2007, Bill was appointed managing executive of Pharmaceuticals and has been an executive of Adcock Ingram Healthcare since its unbundling from Tiger Brands in August 2008.
Kuben PillayExecutive – Strategic Trade, ARVs & Public Sector, BSc, NHD, PBL, MBA
Kuben Pillay graduated as an industrial chemist and has been in the industry for 28 years. He joined Adcock Ingram in 1994 as a process chemist in research and development. Kuben was appointed to the executive team in 2001 as drug management and development executive. In October 2006, Kuben was appointed to his current position which involves a focus on public sector business, ARVs, interaction with various government bodies and industry and trade organisations on strategic pharmaceutical and policy matters. Kuben was recently appointed to Government’s new advisory committee on the proposed National Health Insurance.
Basadi LetsoaloExecutive – Human Capital, Hons Psych, CLDP, MPsych, MLCP
A trained clinical psychologist, Basadi Letsoalo joined Adcock Ingram in January 2008. After a few career changes, she found herself drawn to the retail banking sector, initially with ABSA as head of HR information management and later with Standard Bank SA as head of transformation. Basadi spent a short stint with the Edcon Group as HR Strategist for special assignments prior to taking up her current role.

A d c o c k I n g r a m A n n u a l R e p o r t 2 0 1 0 1 3
Viral DesaiExecutive – New Business Development, BPharm, BCom
Viral Desai has been with the Group for over 10 years and had served the company in several technical and commercial roles. His current role covers group responsibility for corporate and business strategy development with a strong focus on acquisitive growth of products and companies inside and outside the borders of South Africa. From an organic growth perspective, Viral is also responsible for ensuring a sustainable product pipeline for each business through his department’s business development activities, which include licensing arrangements with new and existing multinational generic and innovator companies.
Shawn LandmanCEO – The Scientific Group, B.Com, BAcc, CA (SA)
Shawn Landman joined The Scientific Group in August 2001 as the commercial director. In October 2005 Adcock Ingram acquired 74% of the shareholding of The Scientific Group and Shawn was appointed as CEO. After completing his articles at KPMG, he held a financial management role within the listed engineering group, Dorbyl and was the financial director at Verimark.
Kym HamptonManaging Executive – Hospital Products, Dip General Nursing, Midwifery, Psychiatry, Intensive Care (Hons), IMM, MBA
Kym Hampton joined the Adcock Ingram Group in 2000, after a five year career at 3M, developing sales and marketing competencies and achieving global recognition in 1997 with the 3M sub-Saharan Marketing Award. Since joining the Hospital Products division, Kym has held various roles, including marketing, key accounts, tenders and customer services. In 2002 she became category executive for medicine delivery. Highlights include the consistent growth of core products through value-adding proposals, the successful launch of Infusion pumps to a 54% market share and double digit growth in the new product pipeline with generic injectable drugs. Kym was appointed managing executive of Adcock Ingram Critical Care in January 2008.
Abofele KhoeleMedical Executive – MB ChB
Abofele Khoele, a qualified medical practitioner, recently joined the Adcock Ingram Group, after serving for six years at Novartis South Africa where he held various positions in Medical Affairs and Clinical Operations before serving as Medical Director and Chief Scientific Officer for the last two years. Prior to joining the industry, Abofele was a clinician in the field of general surgery.
A d c o c k I n g r a m A n n u a l R e p o r t 2 0 1 01 4
Chairman’s report
In this section
• Ethics and governance
• Transformation
• Risk management
• Looking forward
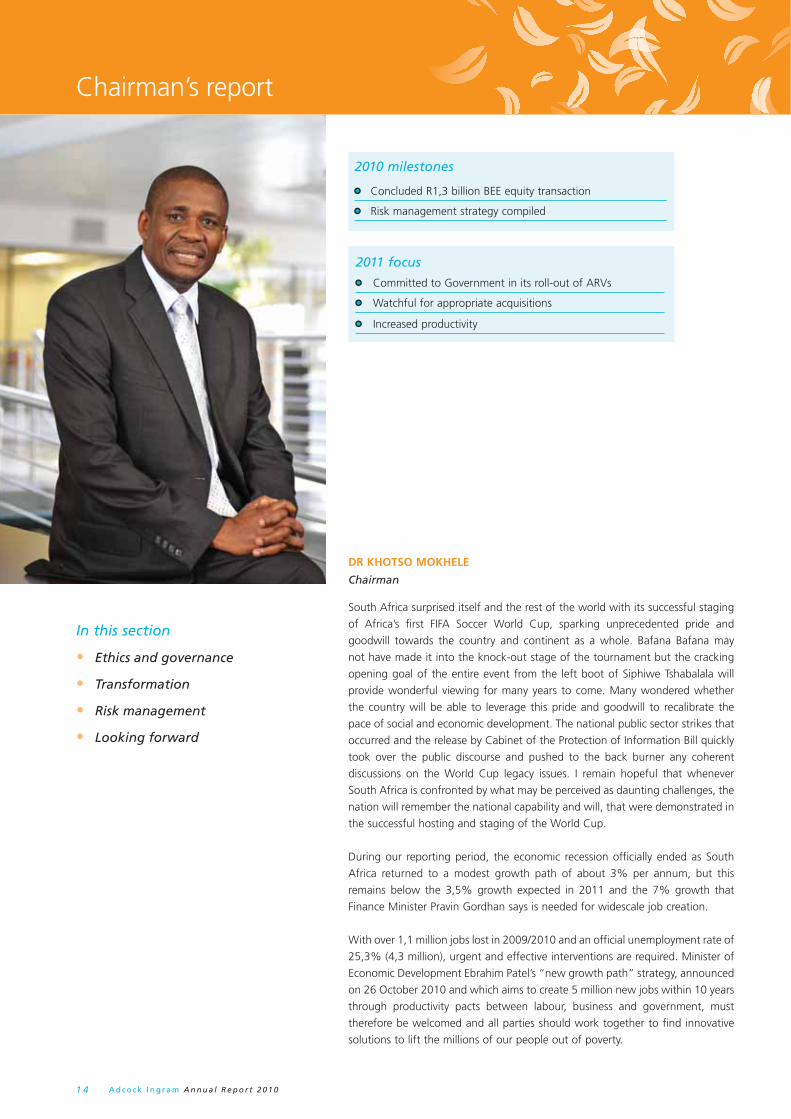
DR KHOTSO MOKHELE
Chairman
2010 milestones
•• Concluded R1,3 billion BEE equity transaction
•• Risk management strategy compiled
2011 focus
•• Committed to Government in its roll-out of ARVs
•• Watchful for appropriate acquisitions
•• Increased productivity
South Africa surprised itself and the rest of the world with its successful staging
of Africa’s first FIFA Soccer World Cup, sparking unprecedented pride and
goodwill towards the country and continent as a whole. Bafana Bafana may
not have made it into the knock-out stage of the tournament but the cracking
opening goal of the entire event from the left boot of Siphiwe Tshabalala will
provide wonderful viewing for many years to come. Many wondered whether
the country will be able to leverage this pride and goodwill to recalibrate the
pace of social and economic development. The national public sector strikes that
occurred and the release by Cabinet of the Protection of Information Bill quickly
took over the public discourse and pushed to the back burner any coherent
discussions on the World Cup legacy issues. I remain hopeful that whenever
South Africa is confronted by what may be perceived as daunting challenges, the
nation will remember the national capability and will, that were demonstrated in
the successful hosting and staging of the World Cup.
During our reporting period, the economic recession officially ended as South
Africa returned to a modest growth path of about 3% per annum, but this
remains below the 3,5% growth expected in 2011 and the 7% growth that
Finance Minister Pravin Gordhan says is needed for widescale job creation.
With over 1,1 million jobs lost in 2009/2010 and an official unemployment rate of
25,3% (4,3 million), urgent and effective interventions are required. Minister of
Economic Development Ebrahim Patel’s “new growth path” strategy, announced
on 26 October 2010 and which aims to create 5 million new jobs within 10 years
through productivity pacts between labour, business and government, must
therefore be welcomed and all parties should work together to find innovative
solutions to lift the millions of our people out of poverty.
A d c o c k I n g r a m A n n u a l R e p o r t 2 0 1 0 1 5
Adcock Ingram has a vast base of knowledge and intell ectual capital
A recent report by the Mail & Guardian online states that of the 17 million South Africans that service debt in the form of home and car loans or credit, 8 million or 47% are struggling to stay afloat and are more than three months in arrears. South Africans, like many throughout the world are learning the hard way, the value of careful spending of hard earned money and proper focus on managing debt. This trend is likely to have a negative impact on Adcock Ingram as consumers switch to cheaper brands. With this in mind Adcock Ingram is focusing on increasing productivity.
The Group hails the continued high prioritisation of HIV/AIDS by the Minister of Health, Dr Aaron Motsoaledi and his determined effort to ensure that the right kind of services and treatment are available to those afflicted by HIV/AIDS. Minister Gordhan has also indicated in his Medium Term Budget Policy Statement in Parliament in October 2010, that the South African Government is committed to implementing National Health Insurance (NHI) and that National Treasury was working to get a firm understanding of the cost implications of such a scheme, which seeks to provide free or low cost health cover for all South Africans. Adcock Ingram’s Executive – Strategic Trade, ARVs & Public Sector, Kuben Pillay, was appointed to the Ministerial Advisory Committee on the NHI, tasked to examine how the insurance would be brought into effect. It would be premature at this stage to speculate on the impact of the proposed NHI on the business of Adcock Ingram. We are monitoring the developments closely and we will engage where necessary as we live our mission of adding value to life.
Ethics and governanceThis annual report is materially aligned with the principles of the King III Report on Corporate
Governance, which became effective on 1 March 2010. In it, we recognise the interdependence of the various forms of capital that flow through Adcock Ingram or are influenced by our operations – these being financial, human, natural, social and technological.
By its nature as a healthcare-focused group, Adcock Ingram inherently adds value to the societies in which we operate. In supporting that responsibility, it is our duty to fulfil our mission by ensuring that Adcock Ingram operates sustainably and ethically.
TransformationAs a leading listed healthcare group in South Africa, Adcock Ingram fully embraces broad-based black economic empowerment (BEE) as a key transformation initiative. This commitment to transformation saw the Group conclude a R1,3 billion BEE equity transaction in April of this year – aptly named Mpho ea Bophelo (gift of life). The following key objectives guided us in structuring and implementing the transaction: • Position Adcock Ingram as South Africa’s leading
empowered healthcare group;• Support Adcock Ingram’s market position and
growth strategies in healthcare in South Africa;• Enhance Adcock Ingram’s commitment to broad-
based empowerment and transformation;• Enhance healthcare in South Africa;• Maximise Adcock Ingram’s equity ownership
scorecard; and• Satisfy regulatory requirements.
The equity transaction includes a share ownership scheme for all black employees which is being finalised. If mandated investments and foreign operations, as defined in the codes, are excluded from Adcock Ingram’s enlarged issued share capital, Adcock Ingram has effective black ownership of

A d c o c k I n g r a m A n n u a l R e p o r t 2 0 1 01 6
Chairman’s report continued
By its nature as a healthcare -focused group, Adcock Ingram inhere ntly add s value to th e societies in wh ich we ope rate. In supp ort ing that re sponsibi lity, it is our duty to fulfil our miss ion by ensuring that Adcock Ingram ope rates sustainabl y and eth icall y
more than 25%. The conclusion of the equity
transaction and steady improvements in other
elements of the BBBEE Scorecard saw the Group
significantly improve its rating within the course
of the past year from a Level 7 broad-based black
economic empowerment contributor to a Level 4
contributor.
Risk managementRisk management forms an integral part of the
requirements of King III. Adcock Ingram has compiled
a comprehensive risk management strategy that
focuses on the specific risks the business is exposed
to and on the risks that confront the healthcare
industry.
The key risks to Adcock Ingram are reported in the
Risk Management section on pages 58 to 60.
Responsibilities for management of specific risks have
been allocated appropriately and include executive
management and the board. External risks that have
been identified, but are directly out of our control,
have been approached by planned responses and
actions. The board is satisfied that Adcock Ingram’s
executive management conducts its business
prudently and within stipulated risk parameters.
Consequently, the group is confident that processes
in place will allow the Group to continue its critical
business processes in the event of a disastrous
incident impacting on its activities.
A d c o c k I n g r a m A n n u a l R e p o r t 2 0 1 0 1 7
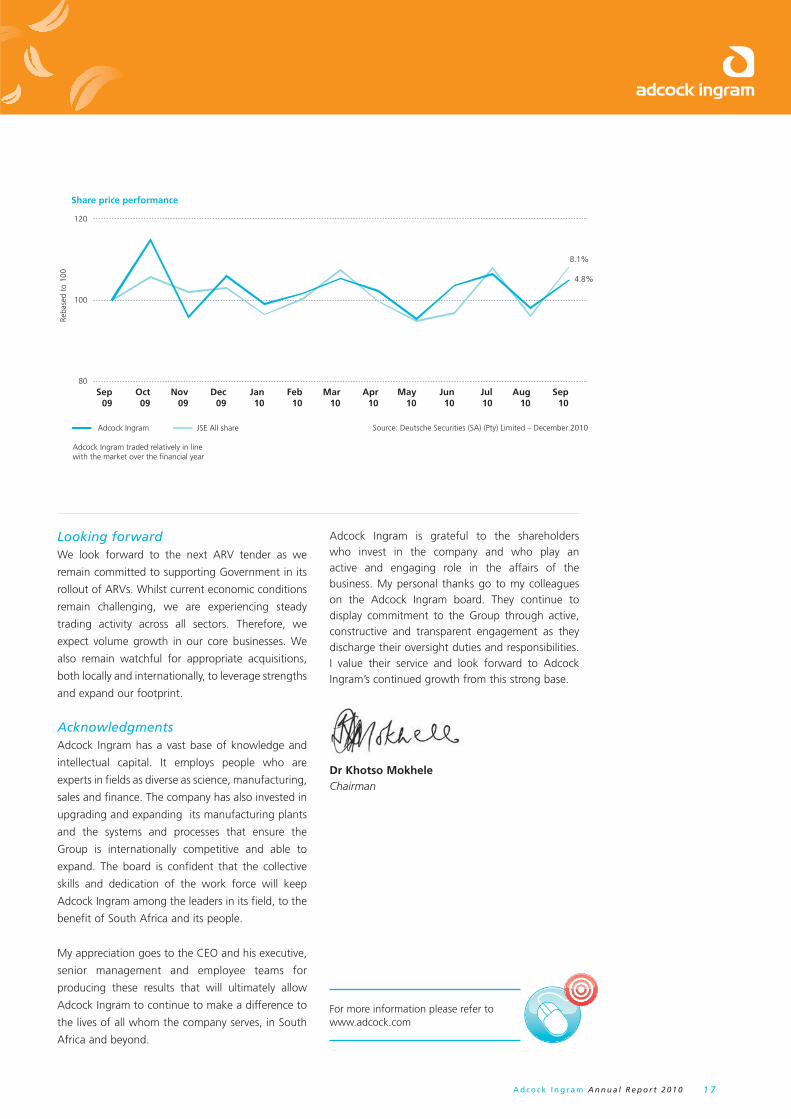
Share price performance
Adcock Ingram JSE All share
80
100
120
Sep10
Aug10
Jul10
Jun10
May10
Apr10
Mar10
Feb10
Jan10
Dec09
Nov09
Oct09
Sep09
Source: Deutsche Securities (SA) (Pty) Limited – December 2010
Adcock Ingram traded relatively in line with the market over the financial year
Reba
sed
to 1
00
8.1%
4.8%
Looking forwardWe look forward to the next ARV tender as we
remain committed to supporting Government in its
rollout of ARVs. Whilst current economic conditions
remain challenging, we are experiencing steady
trading activity across all sectors. Therefore, we
expect volume growth in our core businesses. We
also remain watchful for appropriate acquisitions,
both locally and internationally, to leverage strengths
and expand our footprint.
Acknowledgments Adcock Ingram has a vast base of knowledge and
intellectual capital. It employs people who are
experts in fields as diverse as science, manufacturing,
sales and finance. The company has also invested in
upgrading and expanding its manufacturing plants
and the systems and processes that ensure the
Group is internationally competitive and able to
expand. The board is confident that the collective
skills and dedication of the work force will keep
Adcock Ingram among the leaders in its field, to the
benefit of South Africa and its people.
My appreciation goes to the CEO and his executive,
senior management and employee teams for
producing these results that will ultimately allow
Adcock Ingram to continue to make a difference to
the lives of all whom the company serves, in South
Africa and beyond.
Adcock Ingram is grateful to the shareholders who invest in the company and who play an active and engaging role in the affairs of the business. My personal thanks go to my colleagues on the Adcock Ingram board. They continue to display commitment to the Group through active, constructive and transparent engagement as they discharge their oversight duties and responsibilities. I value their service and look forward to Adcock Ingram’s continued growth from this strong base.
Dr Khotso MokheleChairman
For more information please refer to www.adcock.com
A d c o c k I n g r a m A n n u a l R e p o r t 2 0 1 01 8
In this section• Fulfi lling Adcock Ingram’s strategic
imperatives
• Internationally accredited manufacturing facilities
• Sharing best practice across channels
• Partnership with Baxter
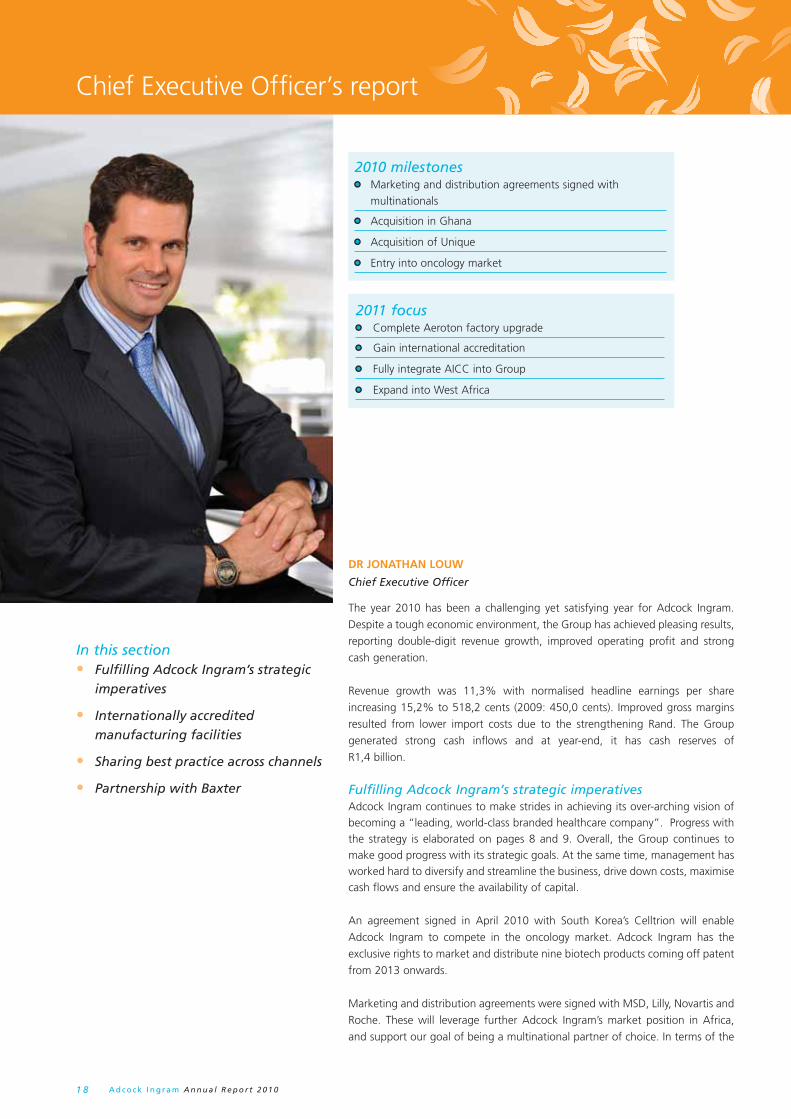
DR JONATHAN LOUW
Chief Executive Officer
2010 milestones•• Marketing and distribution agreements signed with
multinationals
•• Acquisition in Ghana
•• Acquisition of Unique
•• Entry into oncology market
2011 focus•• Complete Aeroton factory upgrade
•• Gain international accreditation
•• Fully integrate AICC into Group
•• Expand into West Africa
Chief Executive Offi cer’s report
The year 2010 has been a challenging yet satisfying year for Adcock Ingram.
Despite a tough economic environment, the Group has achieved pleasing results,
reporting double-digit revenue growth, improved operating profit and strong
cash generation.
Revenue growth was 11,3% with normalised headline earnings per share
increasing 15,2% to 518,2 cents (2009: 450,0 cents). Improved gross margins
resulted from lower import costs due to the strengthening Rand. The Group
generated strong cash inflows and at year-end, it has cash reserves of
R1,4 billion.
Fulfilling Adcock Ingram’s strategic imperatives Adcock Ingram continues to make strides in achieving its over-arching vision of becoming a “leading, world-class branded healthcare company”. Progress with the strategy is elaborated on pages 8 and 9. Overall, the Group continues to make good progress with its strategic goals. At the same time, management has worked hard to diversify and streamline the business, drive down costs, maximise cash flows and ensure the availability of capital.
An agreement signed in April 2010 with South Korea’s Celltrion will enable
Adcock Ingram to compete in the oncology market. Adcock Ingram has the
exclusive rights to market and distribute nine biotech products coming off patent
from 2013 onwards.
Marketing and distribution agreements were signed with MSD, Lilly, Novartis and
Roche. These will leverage further Adcock Ingram’s market position in Africa,
and support our goal of being a multinational partner of choice. In terms of the

A d c o c k I n g r a m A n n u a l R e p o r t 2 0 1 0 1 9
Th e Group generated strong cash infl ows and at year-end, it has cash re serves of R1,4 bi llion
agreement with Lilly South Africa, Adcock Ingram
has taken over sales and marketing of three leading
osteoporosis and septic shock treatment products
– Evista, Forteo and Xigris. The five-year strategic
collaboration with MSD South Africa, the local
subsidiary of US-based pharmaceutical giant Merck,
has been extended to sub-Saharan Africa. Jointly,
the companies will promote products that include all
of MSD’s consumer healthcare brands and selected
prescription brands.
With the acquisition of 66,2% of the well established
Ayrton Drug Manufacturing Limited in April 2010
Adcock Ingram now has an established business in
Ghana. From this base we will extend our geographic
footprint in West Africa. We have transferred a local
employee to join the management teams led by its
Managing Director, Mr Samuel Adjepong.
He has been of great assistance in the successful
conclusion of the acquisition and subsequent
integration of the business with Adcock Ingram.
A substantial Adcock Ingram pipeline of products
has been submitted to the Ghanaian Regulatory
Authorities and Adcock Ingram anticipates several
approvals in the coming months.
The acquisition of Unique Formulations in
November 2009 has further enabled the Group
to gain market share in the fast moving consumer
goods (FMCG) category, by moving into adjacent
categories and becoming more visible in the self-
medication segment. Adcock Ingram entered the
oncology sector this year and we also launched
several of our own new product innovations in the
over the counter (OTC) market segment. The Group
is optimistic that 2011 will deliver an exciting stream
of new products as the Medicines Control Council
approves the required registrations.
Internationally accredited manufacturing facilities Adcock Ingram has made rapid progress with the
upgrade of manufacturing and research facilities
in South Africa and India. This will allow the
Group to comply with the standards of the World
Health Organisation (WHO), the Food and Drug
Administration (FDA), a regulatory body in the United
States of America, the Medicines Health Regulatory
Agency of the United Kingdom and the Therapeutic
Goods Administration of Australia. Consequently,
Adcock Ingram will be able to compete on equal
terms with the world’s leading healthcare companies
operating in Africa and further afield. The Aeroton
factory upgrade is on schedule for completion
in November 2011. The Wadeville manufacturing
facility will be inspected soon by the FDA. Upgrade
of the Clayville factory and construction of the new
high-volume liquids plant are also progressing well.
Operational excellence is a top priority. The focus on
the supply chain will be to complete the upgrades,
increase efficiencies and gain international
accreditation, thus allowing for additional contract
manufacturing, as well as further market penetration
in both current and new territories. The investment
in infrastructure and human capital development
will ensure world class facilities, skills, systems and
processes.
Sharing best practice across channelsAdcock Ingram has continued with its comprehensive
continuous improvement process. With sharing of
lessons learnt across all business units, savings are
expected from increased productivity and more
stable quality products.
During the period under review, the Group’s
Regulatory Affairs and Quality Assurance units
also implemented continuous improvement
processes. As a result, regulatory inspections and
third party audits at facilities in South Africa and
India showed growing collaboration between Group
Regulatory Affairs, Group Quality Assurance unit,
manufacturing facilities’ management and their
audit teams.
Find out more
CORPORATE GOVERNANCE
(Page 36)
ANNUAL FINANCIAL
STATEMENTS (Page 61)
WWW.ADCOCK.COM/HERITAGE

A d c o c k I n g r a m A n n u a l R e p o r t 2 0 1 02 0
Chief Executive Offi cer’s report continued
Partnership with BaxterIn February 2010 Baxter Healthcare SA initiated a
call option process to acquire a controlling interest
in AICC. On 7 October 2010, after the financial
year end, for strategic reasons unrelated to the
business of AICC, Baxter elected not to proceed
with the exercise of the Call Option. Consequently,
the Call Option Agreement was cancelled by mutual
agreement of the parties, save for certain operative
clauses unrelated to the Call Option. The business
of AICC will continue under the control of Adcock
Ingram and will continue to benefit for the 13 years
remaining of the current licence, distribution and
raw materials supply agreements with Baxter.
ConclusionAdcock Ingram’s people have a 120 year track
record of rising above tough circumstances and
I look forward to working with them to make this
an even greater company. My sincere thanks go to
the Group’s Chairman Dr Khotso Mokhele for his
continued leadership, guidance and wise counsel.
We look forward to his ongoing contribution as
Chairman of our board. I also wish to extend my
appreciation to the entire board, for their solid
support, as well as to the executive management
team, employees, customers and business partners,
who have all played a fundamental role in Adcock
Ingram’s success.
Sincerely,
Dr Jonathan LouwChief Executive Officer
Turnover (R million)
0
1 000
2 000
3 000
4 000
5 000
10090807
Operating profit (R million)
0
200
400
600
800
1 000
1 200
10090807
* Normalised
A d c o c k I n g r a m A n n u a l R e p o r t 2 0 1 0 2 1
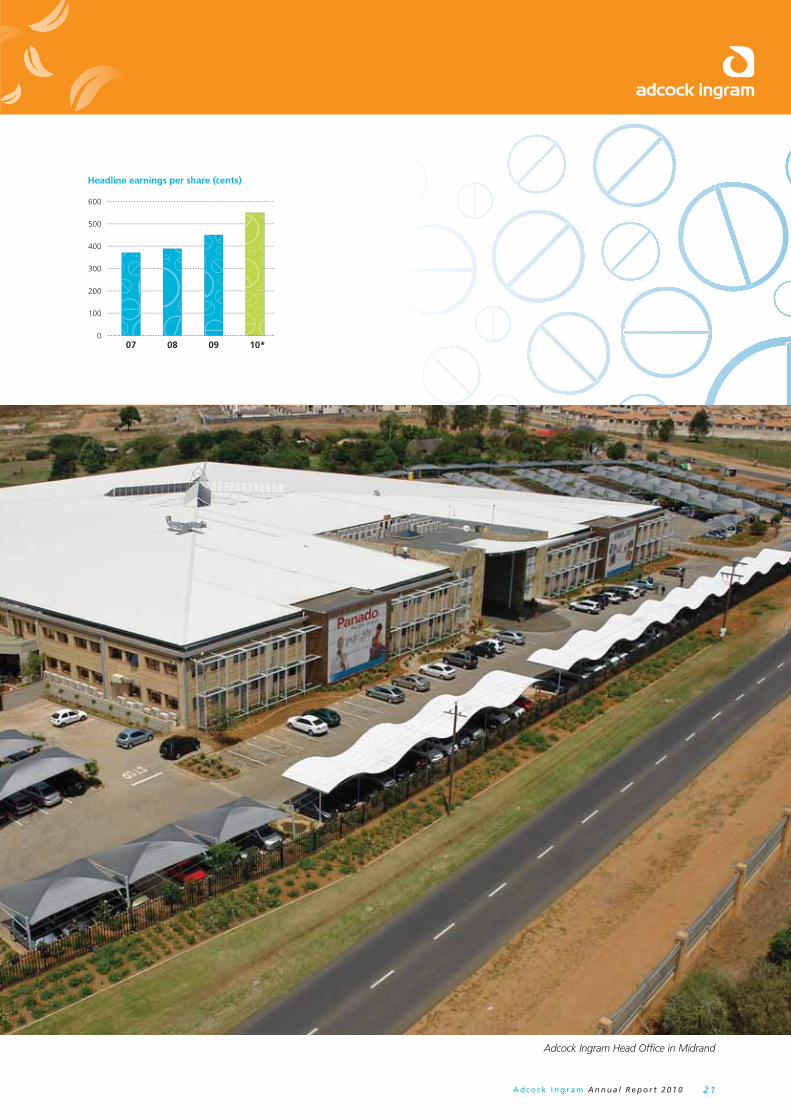
Headline earnings per share (cents)
0
100
200
300
400
500
600
10*090807
Adcock Ingram Head Office in Midrand
A d c o c k I n g r a m A n n u a l R e p o r t 2 0 1 02 2
Chief Financial Offi cer’s report
In this section• Impact of the BEE transaction
• Headline earnings
• Turnover
• Profi t margins
• Financial position
• Key fi nancial ratios
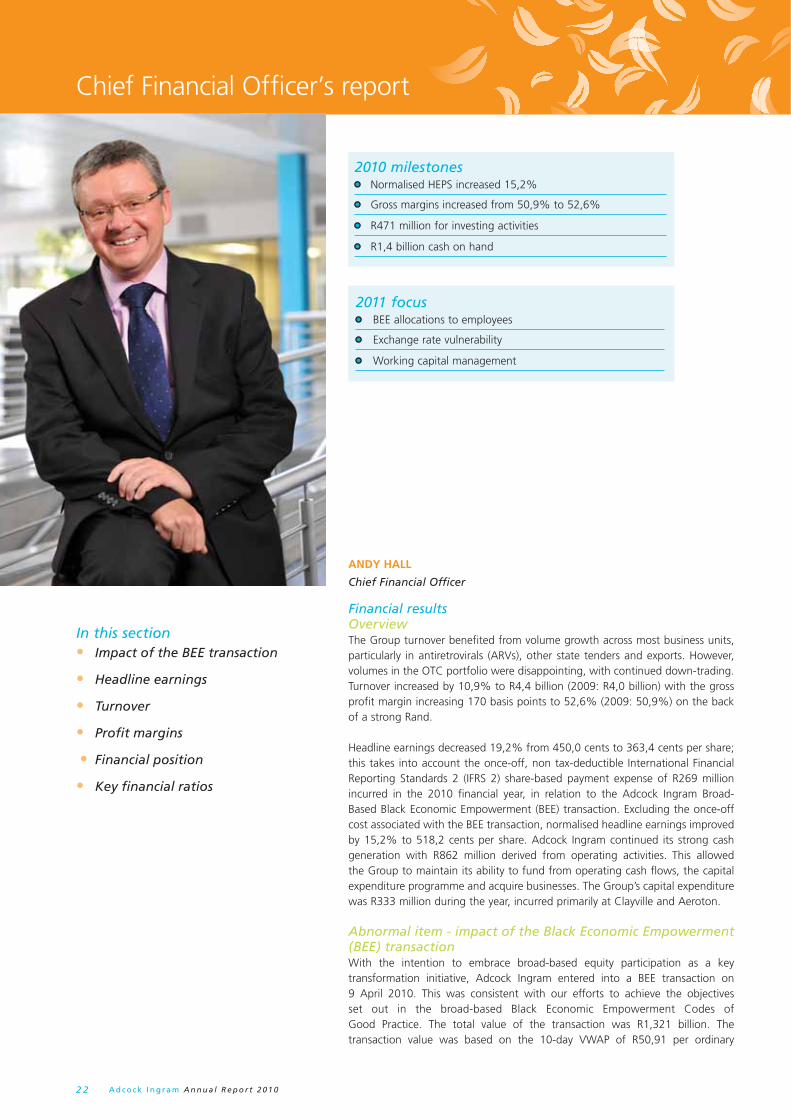
ANDY HALL
Chief Financial Officer
2010 milestones•• Normalised HEPS increased 15,2%
•• Gross margins increased from 50,9% to 52,6%
•• R471 million for investing activities
•• R1,4 billion cash on hand
2011 focus•• BEE allocations to employees
•• Exchange rate vulnerability
•• Working capital management
Financial resultsOverviewThe Group turnover benefited from volume growth across most business units, particularly in antiretrovirals (ARVs), other state tenders and exports. However, volumes in the OTC portfolio were disappointing, with continued down-trading. Turnover increased by 10,9% to R4,4 billion (2009: R4,0 billion) with the gross profit margin increasing 170 basis points to 52,6% (2009: 50,9%) on the back of a strong Rand.
Headline earnings decreased 19,2% from 450,0 cents to 363,4 cents per share; this takes into account the once-off, non tax-deductible International Financial Reporting Standards 2 (IFRS 2) share-based payment expense of R269 million incurred in the 2010 financial year, in relation to the Adcock Ingram Broad-Based Black Economic Empowerment (BEE) transaction. Excluding the once-off cost associated with the BEE transaction, normalised headline earnings improved by 15,2% to 518,2 cents per share. Adcock Ingram continued its strong cash generation with R862 million derived from operating activities. This allowed the Group to maintain its ability to fund from operating cash flows, the capital expenditure programme and acquire businesses. The Group’s capital expenditure was R333 million during the year, incurred primarily at Clayville and Aeroton.
Abnormal item - impact of the Black Economic Empowerment (BEE) transactionWith the intention to embrace broad-based equity participation as a key transformation initiative, Adcock Ingram entered into a BEE transaction on 9 April 2010. This was consistent with our efforts to achieve the objectives set out in the broad-based Black Economic Empowerment Codes of Good Practice. The total value of the transaction was R1,321 billion. The transaction value was based on the 10-day VWAP of R50,91 per ordinary

A d c o c k I n g r a m A n n u a l R e p o r t 2 0 1 0 2 3
We have a strong ungeared fi nancial position with signifi cant capacity to gear up
share on the JSE at the close of trade on Thursday, 19 November 2009, the date when the memorandum of understanding was signed. The economic cost of implementing the transaction is approximately R370 million. This figure was calculated with reference to the requirements of IFRS and includes transaction costs as well as the grant to the Mpho ea Bophelo Trust. The expense during the year of R269 million was recognised for the strategic partners, while no expense was recognised for employee services, since no allocations have been made to any Adcock Ingram employees. These allocations will be made during the next financial year, with an expected annualised IFRS 2 charge for the next five years of R18 million.
Headline earningsEarnings per share (EPS) decreased by 19,5% to 363,5 cents (2009: 451,7 cents), while normalised earnings per share increased by 14,8% to 518,4 cents (2009: 451,7 cents).
Headline earnings for the year ended 30 September 2010 of R631,2 million, adjusted for the R269 million impact of the BEE transaction, amount to R900,2 million on a normalised basis (2009: R779,4 million), reflecting an increase of 15,5% over the prior year. At the normalised headline earnings per share (HEPS) level, this translates into an increase of 15,2% to 518,2 cents (2009: 450,0 cents), based on 173,7 million (2009: 173,2 million) weighted average number of shares in issue for the year.
Shares issued in 2010 relate to the exercising of share options by current and former employees of Adcock Ingram and Tiger Brands Limited. Approximately 1,8 million options remain outstanding under these schemes, which are available for exercising before 1 October 2015, at offer prices ranging from R8,96 to R28,33. The increase in shares issued was partially offset by the ordinary shares purchased on the open market by the BEE participants, which together with the A and B ordinary shares issued to them in April 2010, are accounted for as treasury shares in terms of IFRS, as the entities holding these shares are deemed to be controlled by the Group.
Headline earnings in the current year exclude capital profits of R0,2 million. There are no impairments of intangible assets in the current or prior year. TurnoverTurnover rose 10,9% to R4,4 billion (2009: R4,0 billion) due to a 5% volume growth across the business, with mix (including acquisitions) making a contribution of 7%. Overall price accounted for a 1% decrease in turnover, primarily as a result of significant price decreases on ARVs sold to the state from June onwards, and also price deflation in the Critical Care portfolio. The Prescription segment showed a solid volume increase, primarily through ARVs, and the Hospital division experienced good volume growth. OTC volumes declined due to significant down-trading in this portfolio.
The turnover movement should be seen in the light of the following specific factors:
• A price increase of 7,4% granted by the Department of Health in June 2010. In the Pharmaceutical division approximately 62% of sales are subject to Single Exit Price (SEP) legislation with approximately 42% of sales in the Hospital division subject to SEP;
• Significant price erosion in Adco Simvastatin, the generic portfolio’s biggest non-ARV product by revenue;
• Sales from the acquisitions of Unique Formulations, Ayrton Drug Manufacturing Limited in Ghana and the office opened in Kenya in the Pharmaceutical segment, and Indigenous Systems in the Hospital segment which contributed approximately R95 million in aggregate; and
• Distribution and co-promotion agreements concluded with MSD, Novartis and Lilly which contributed approximately R100 million, albeit at lower gross margins.
For more information on the SEP list, please visit: www.adcock.com/OurBrands_SingleExitPrice

A d c o c k I n g r a m A n n u a l R e p o r t 2 0 1 02 4
Chief Financial Offi cer’s report continued
Profit marginsGross profit increased by 14,6% to R2,3 billion (2009: R2,0 billion), with the gross profit margin increasing from 50,9% in 2009 to 52,6% in 2010. Gross margins across all businesses benefited from the strong Rand, which affected imported raw materials and finished products, but this was partially offset by a higher proportion of low margin ARVs and continued pricing pressure in the generic portfolio. The effect of Rand strength and the price increase granted by the state was evident in the second half of the year as the gross margin improved from 51,8% in the first half of the year to 53,2% in the second half. The Group remains vulnerable to exchange rate fluctuations. More than R1,2 billion of foreign exchange was purchased in 2010, of which 54% was US Dollar-based and 37% Euro-based. In the Pharmaceutical division, 62% of imports are exposed to the US Dollar whereas in the Hospital division the exposure is predominantly (49%) to the Euro. Average contract rates in 2010 were R7,62:USD1 and R10:41:Euro1. However, with year-end inventory levels having been purchased at approximate forward rates of R7.42:USD1 and R9.71:Euro1, the gross margins are relatively well protected for the first half of 2011.
Operating income before abnormal items increased by 14,9% to R1,200 billion (2009: R1,045 billion), with margins increasing from 26,1% in 2009 to 27,0% in 2010, this gain in leverage being carried down from the gross profit line. Operating expenses increased by 14,4% to R1,135 billion (2009: R992 million). Selling and distribution expenses rose by 18,5% to R499,9 million (2009: R422,0 million), measured as a percentage of sales as 11,3% (2009: 10,5%), the primary drivers of this movement were increased distribution costs of an additional sortation facility and staff in Midrand. Other overheads, including marketing and R&D expenses increased 11,3% to R634,6 million (2009: R570,1 million), including additional IFRS 2 charges and expenditure of R45.8 million in acquired business which are not in the 2009 base comparative.
Operating profit after abnormal items declined 11% to R931,3 million (2009: R1,045 billion); this decline included the abovementioned once-off BEE share-based payment expense of R269 million.
Profit before tax declined by 7,3% to R960,8 million (2009: R1,037 billion). The effective tax rate is 33,1% (2009: 23,8%), the variance from the statutory rate being attributable to: • Strategic Industrial Programme (SIP) allowance
of R93 million, translated into a tax benefit of R26 million. It is expected that the bulk of the
remainder of the SIP allowance of R458 million granted in the 2009 financial year will be claimed in 2012;
• capital allowances and exempt income of R210 million;
offset by:• non-deductible expenditure of R334 million; and• secondary tax on companies (STC) of
R29,4 million.
This resulted in profit after tax declining by 18,6% to R643,2 million (2009: R789,9 million).
As a result of the inclusion of the Ghanaian minority shareholders, the share of profits attributable to minority interests increased to R11,8 million (2009: R7,5 million). Other minority shareholders in the Group are European-based multinational companies, certain of whose products are marketed and sold by the Pharmaceutical division, and Brimstone Investment Corporation.
Financial position Non-current assetsThe carrying value of property, plant and equipment increased by R257 million during the year. Capital expenditure of R333 million was both expansionary and regulatory in nature. This expenditure included: • R43 million at Wadeville for the efficient and
increased production of ARVs;• R118 million at Clayville. The Group’s effervescents
and powders product capacity has been increased to 1,15 million kg per annum and good progress has been made on the high-volume liquids plant which will take Adcock Ingram’s oral liquid capacity to 14 million litres per annum; and
• R123 million at Aeroton where the Critical Care facility is being upgraded to meet Baxter’s international standards, as required by the MCC and Baxter.
The balance of the capital expenditure relates to upgrading certain of the Group’s distribution facilities and the acquisition of computers, furniture and fittings across the business.
Intangible assets, net of amortisation of finite-life assets, increased by R120 million to R424 million mainly as a result of the customer-related and marketing-related intangibles, and goodwill acquired through new business combinations.
Working capitalInventory levels of R719 million at year-end are R135 million higher than the prior year. Days in inventory are 120, an increase of almost 15 days when compared to September 2009 and 17 days when compared to March 2010. This increase in inventory levels is entirely as a result of the

A d c o c k I n g r a m A n n u a l R e p o r t 2 0 1 0 2 5
recently acquired stock from the co-promotion companies.
Trade accounts receivable, net of provisions, are R1,004 billion at year-end and R66 million higher than the prior year. Whilst the absolute balance has increased, the days outstanding in debtors at year-end are 58, an improvement on the prior year figure of 62 days. Credit control across the Group remains excellent, with bad debt write-offs of less than R1 million in the year under review.
Trade accounts payable, including accrued expenses and provisions, increased by R343 million to R1,042 billion, with payment terms being utilised to the fullest extent possible. The current ratio remains healthy at 2,8 times (2009: 2,5 times).
Cash and gearingCash operating profit before working capital increased by 12,4% from R1,176 billion to R1,322 billion. With the increased inventory holding being acquired on favourable terms, working capital efficiencies released R115,4 million leaving cash generated from operations of R1,437 billion, a significant improvement over the prior year figure of R1,130 billion.
After interest, taxation and dividend outflows, there was a net cash inflow of R862 million (2009: R754 million).
The significant outflow in investing activities of R471 million (2009: R327 million) relates primarily to the acquisition of Ayrton and Unique Formulations, and the continued investment in the Group’s supply chain.
Financing activities accounted for net cash inflows of R348 million after two further payments were made to service the secured loan for which the final instalment was made in October 2010 and drawing down R430 million on the capex loan facility.
The Group is carrying interest-bearing debt of R581 million (2009: R311 million). R99 million (2009: R270 million) of this debt was owed to a South African financial institution and was settled in October 2010. The group has elected to fund the Clayville high-volume liquids facility and Aeroton upgrade through two capital expenditure loans amounting to R800 million (R430 million drawn-down at 30 September 2010) in aggregate. The remaining interest-bearing borrowings of R52 million (2009: R41 million) have been incurred in the group’s joint ventures; Adcock Ingram Limited India and National Renal Care (Pty) Limited.
The Group has adequate cash reserves of R1,431 billion at year-end (2009: R693 million) and is ungeared with a net cash position of R850 million (2009: R381 million). The group has R500 million of aggregate available unutilised short-term facilities with two South African financial institutions to service ongoing operational requirements, and has capacity for gearing in order to invest in its pipeline and product portfolios, and continue to implement its growth strategy. We have a strong ungeared financial position with significant capacity to gear up where necessary in order to bolster our portfolio and to continue to implement our growth strategy.
The Group has retained its investment grade status with the major South African financial institutions.
Key financial ratiosRatio analysis 2010 2009
Gross profit (%) 52,6 50,9
Operating profit (%) 27,0 26,1
Inventory days 120 105
Trade accounts receivable days 58 62
Trade accounts payable days 59 60
Working capital per
R1 turnover (cents) 29,5 30,0
RONA (%) 61,5 61,8
Net interest cover (times) n/a 59
Current ratio (times) 2,8 2,5
I am grateful to our shareholders, advisers, board members, and fellow employees with whom I am privileged to serve Adcock Ingram, for their support during the year.
Andy HallChief Financial Officer
For more information on Financial Reports, please visit: www.adcock.com/Investors_Financial Reports
A d c o c k I n g r a m A n n u a l R e p o r t 2 0 1 02 6
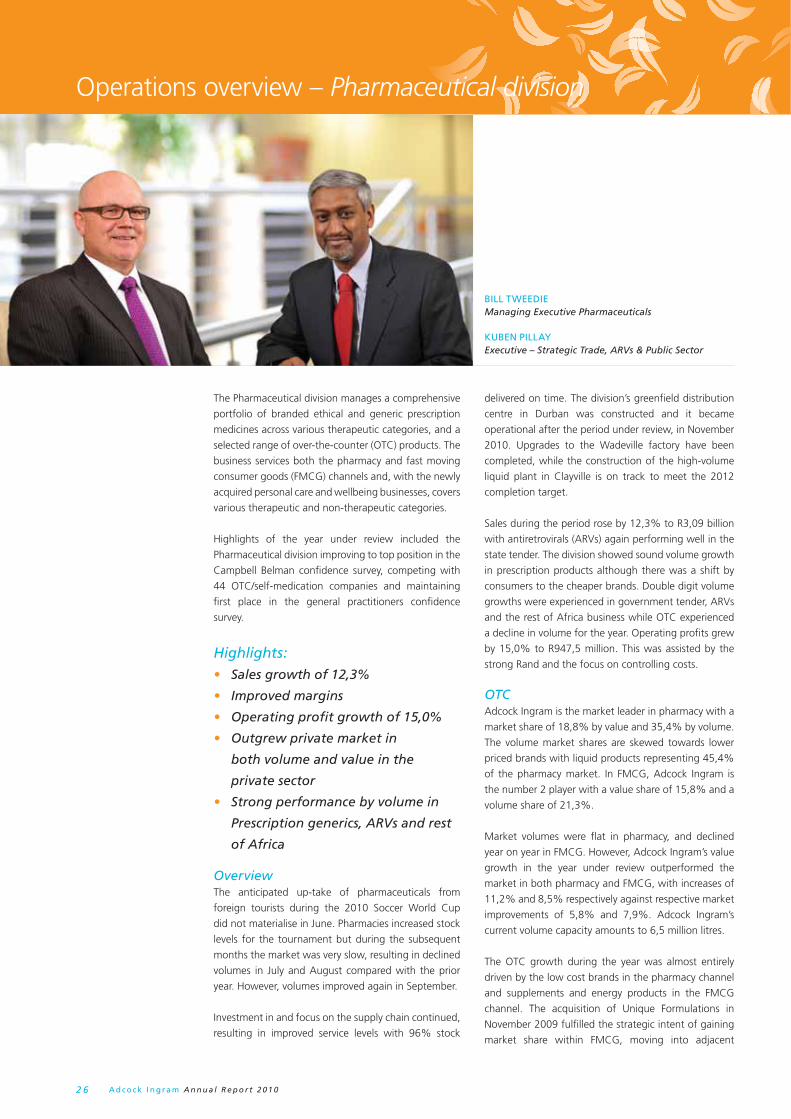
Operations overview – Pharmaceutical division
The Pharmaceutical division manages a comprehensive
portfolio of branded ethical and generic prescription
medicines across various therapeutic categories, and a
selected range of over-the-counter (OTC) products. The
business services both the pharmacy and fast moving
consumer goods (FMCG) channels and, with the newly
acquired personal care and wellbeing businesses, covers
various therapeutic and non-therapeutic categories.
Highlights of the year under review included the
Pharmaceutical division improving to top position in the
Campbell Belman confi dence survey, competing with
44 OTC/self-medication companies and maintaining
fi rst place in the general practitioners confi dence
survey.
Highlights:• Sales growth of 12,3%
• Improved margins
• Operating profi t growth of 15,0%
• Outgrew private market in
both volume and value in the
private sector
• Strong performance by volume in
Prescription generics, ARVs and rest
of Africa
OverviewThe anticipated up-take of pharmaceuticals from
foreign tourists during the 2010 Soccer World Cup
did not materialise in June. Pharmacies increased stock
levels for the tournament but during the subsequent
months the market was very slow, resulting in declined
volumes in July and August compared with the prior
year. However, volumes improved again in September.
Investment in and focus on the supply chain continued,
resulting in improved service levels with 96% stock
BILL TWEEDIEManaging Executive Pharmaceuticals
KUBEN PILLAYExecutive – Strategic Trade, ARVs & Public Sector
delivered on time. The division’s greenfi eld distribution
centre in Durban was constructed and it became
operational after the period under review, in November
2010. Upgrades to the Wadeville factory have been
completed, while the construction of the high-volume
liquid plant in Clayville is on track to meet the 2012
completion target.
Sales during the period rose by 12,3% to R3,09 billion
with antiretrovirals (ARVs) again performing well in the
state tender. The division showed sound volume growth
in prescription products although there was a shift by
consumers to the cheaper brands. Double digit volume
growths were experienced in government tender, ARVs
and the rest of Africa business while OTC experienced
a decline in volume for the year. Operating profi ts grew
by 15,0% to R947,5 million. This was assisted by the
strong Rand and the focus on controlling costs.
OTCAdcock Ingram is the market leader in pharmacy with a
market share of 18,8% by value and 35,4% by volume.
The volume market shares are skewed towards lower
priced brands with liquid products representing 45,4%
of the pharmacy market. In FMCG, Adcock Ingram is
the number 2 player with a value share of 15,8% and a
volume share of 21,3%.
Market volumes were fl at in pharmacy, and declined
year on year in FMCG. However, Adcock Ingram’s value
growth in the year under review outperformed the
market in both pharmacy and FMCG, with increases of
11,2% and 8,5% respectively against respective market
improvements of 5,8% and 7,9%. Adcock Ingram’s
current volume capacity amounts to 6,5 million litres.
The OTC growth during the year was almost entirely
driven by the low cost brands in the pharmacy channel
and supplements and energy products in the FMCG
channel. The acquisition of Unique Formulations in
November 2009 fulfi lled the strategic intent of gaining
market share within FMCG, moving into adjacent
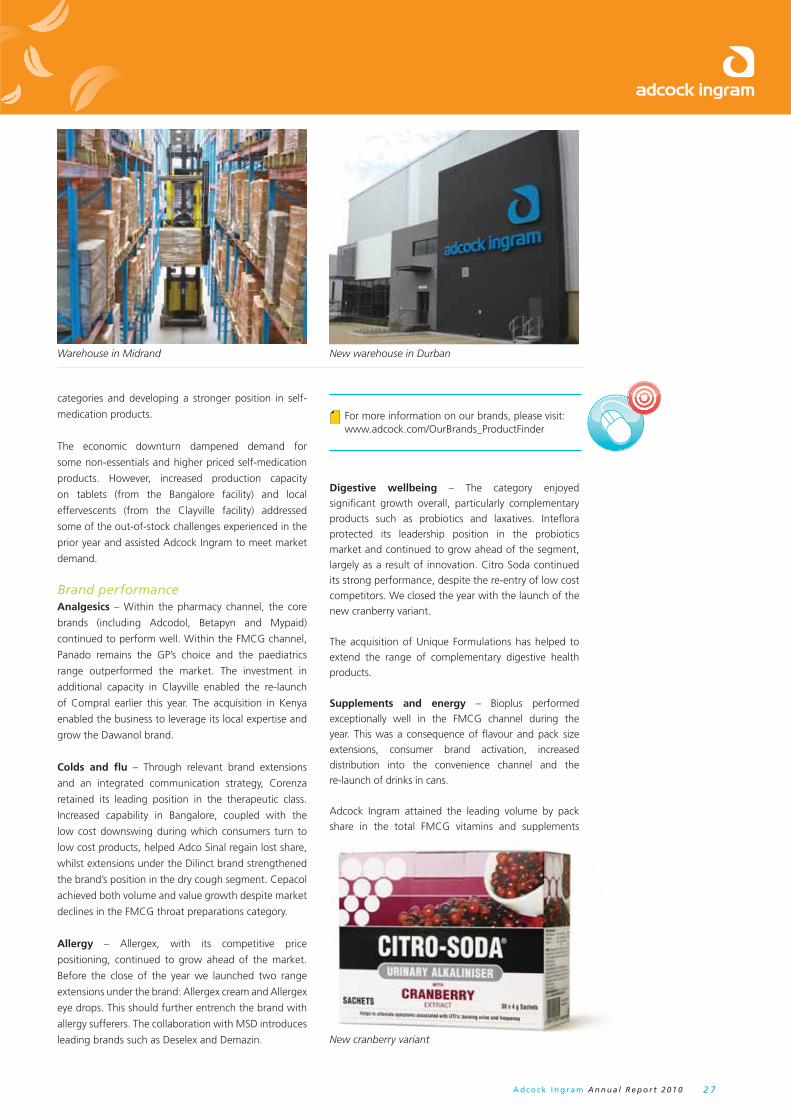
A d c o c k I n g r a m A n n u a l R e p o r t 2 0 1 0 2 7
For more information on our brands, please visit: www.adcock.com/OurBrands_ProductFinder
categories and developing a stronger position in self-
medication products.
The economic downturn dampened demand for
some non-essentials and higher priced self-medication
products. However, increased production capacity
on tablets (from the Bangalore facility) and local
effervescents (from the Clayville facility) addressed
some of the out-of-stock challenges experienced in the
prior year and assisted Adcock Ingram to meet market
demand.
Brand performanceAnalgesics – Within the pharmacy channel, the core
brands (including Adcodol, Betapyn and Mypaid)
continued to perform well. Within the FMCG channel,
Panado remains the GP’s choice and the paediatrics
range outperformed the market. The investment in
additional capacity in Clayville enabled the re-launch
of Compral earlier this year. The acquisition in Kenya
enabled the business to leverage its local expertise and
grow the Dawanol brand.
Colds and fl u – Through relevant brand extensions
and an integrated communication strategy, Corenza
retained its leading position in the therapeutic class.
Increased capability in Bangalore, coupled with the
low cost downswing during which consumers turn to
low cost products, helped Adco Sinal regain lost share,
whilst extensions under the Dilinct brand strengthened
the brand’s position in the dry cough segment. Cepacol
achieved both volume and value growth despite market
declines in the FMCG throat preparations category.
Allergy – Allergex, with its competitive price
positioning, continued to grow ahead of the market.
Before the close of the year we launched two range
extensions under the brand: Allergex cream and Allergex
eye drops. This should further entrench the brand with
allergy sufferers. The collaboration with MSD introduces
leading brands such as Deselex and Demazin.
Digestive wellbeing – The category enjoyed signifi cant growth overall, particularly complementary products such as probiotics and laxatives. Intefl ora protected its leadership position in the probiotics market and continued to grow ahead of the segment, largely as a result of innovation. Citro Soda continued its strong performance, despite the re-entry of low cost competitors. We closed the year with the launch of the new cranberry variant.
The acquisition of Unique Formulations has helped to extend the range of complementary digestive health products.
Supplements and energy – Bioplus performed exceptionally well in the FMCG channel during the year. This was a consequence of fl avour and pack size extensions, consumer brand activation, increased distribution into the convenience channel and the re-launch of drinks in cans.
Adcock Ingram attained the leading volume by pack share in the total FMCG vitamins and supplements
Warehouse in Midrand New warehouse in Durban
New cranberry variant

A d c o c k I n g r a m A n n u a l R e p o r t 2 0 1 02 8
Operations overview – Pharmaceutical division continued
Find out more
SUSTAINABILITY FOCUS (Page 34)
OUR PEOPLE (Page 42)
WWW.ADCOCK.COM
market at 21%, with 7% growth over the previous
year. This was achieved by the acquisition of Unique
Formulations at the start of the fi scal year, coupled with
a strong performance of other brands in the category
(Vita-thion, Bioplus and Gummyvites).
Personal care – The Tender Loving Care (TLC) portfolio
has grown revenue by 6%. A baby care and camphor
cream range of products was launched under the TLC
brand early in the fi scal year.
PrescriptionThe 2010 year was characterised with strategies to
grow private sector generics and securing co-promotion
rights on branded ethical products in collaboration with
multi-national companies including MSD, Lilly and
Novartis.
Adcock Ingram is the number 7 player in branded
prescription products, with a market share of 5,3% in
value and number 3 in the generics private market with
a market share of 10,1% in value.
In the current year the business outgrew the market in
branded ethical prescription products by value with an
increase of 10,2% (market value growth – 7,2%) and
the 10,8% increase in the volume of generics outgrew
the market (market volume growth – 7,8%).
Branded ethical portfolioDermatology – The dermatology portfolio showed
impressive sales growth of 51% compared with the
previous year. Dovobet (used for psoriasis), increased
36,4% and Fucidin (for conditions of mixed infection)
improved 18%. The recent inclusion of Elidel from
Novartis has contributed to the overall portfolio growth.
Sales refl ect Dovobet as the class leader with a market
share of 49,5% and consistent outperformance of the
category.
The more recent collaboration with MSD includes
dermatology brands and provides Adcock Ingram with
the widest range of brands across therapeutic areas.
This will enhance the Group’s leadership position in
dermatology.
Women’s health – Due in part to the collaborative
relationship with both Lilly and Novartis, the women’s
health portfolio rose 19%. The most impressive brand
performances include Estradot (+75%), Betadine
Douche (+18%) and Estalis (+101%). We expect
continued growth in this category.
Pain – Adcock Ingram has retained its signifi cant
leadership position within this portfolio, with solid
performances from established brands such as Synap
Forte, Lentogesic and Myprodol.
Generic competition continues to challenge the stalwart
Myprodol, but a more focused strategy together with
“fl anker brands” has minimised erosion and ensured
the brand retains the leadership position.
Generic portfolioThe strategy for this business remains focused on price,
range, supply, access and promotion. Competition
drove pricing down for Adco Simvastatin (the largest
generic in Adcock’s portfolio outside of ARVs) and this
adversely affected the division’s performance. Although
the price reduced margins, active strategies assisted
growth in volumes resulting in volume growth of 32%.
Other major generics within the portfolio continued to
perform well in value terms with Genpayne (+38,1%),
Adco Zolpidem (+59.3%) and Adco Omeprazole
(+23,5%) showing sound growth during the year.
Increased focus on our generics has seen a resurgence
of our generic brands and we are confi dent of further
gains in the new fi nancial year.
Subject to the MCC approving registration of our new
products, the division is planning to launch several new
generics into the market in 2011.
Public sector businessThe division continues to meet the requirements of the
public sector to meet its strategic intent to increase the
number of patients accessing healthcare in the public
sector hospitals. Consequently, in the past year, the
Adcock Ingram pharmaceuticals business has shown
good growth into the public sector channel, both for
antiretrovirals (ARVs) and other products. All medicine
tenders in the government are now two year contracts.
Adcock Ingram has won new contracts with a growth
of 43% by value and 22% by volume for the period
2009/2011.
New extensions to Bioplus range
A d c o c k I n g r a m A n n u a l R e p o r t 2 0 1 0 2 9
The current ARV tender has been extended to December 2010. Adcock Ingram has submitted its application to participate in the next ARV tender. It is likely that competitive forces will drive margins down. However, the Government‘s HIV Counselling and Testing (HCT) campaign is expected to yield a greater number of patients being enrolled onto the government’s ARV programme.
To date, Adcock Ingram’s ARV development was undertaken in our own R&D facilities. However, our latest products are based on new generation molecules licensed from international partners. These new molecules have been formulated into a range of new Adcock Ingram ARV products that are currently awaiting registration with the MCC.
Sub-Saharan AfricaAdcock Ingram has continued to expand into the sub-Saharan Africa region outside of Southern Africa.
With effect from 1 April 2010, the division successfully acquired 66,2% of Ayrton Drug Manufacturing Limited, a leading Ghanaian pharmaceutical company listed on the Ghana Stock Exchange. A range of Adcock Ingram products are in the process of being registered for this market. These brands will be launched via Ayrton’s infrastructure which includes a widespread distribution network in Ghana.
The East African operation based in Nairobi, Kenya, has shown positive growth, enhanced by the successful integration of the Dawanol brand acquired during 2009. Dawanol is a leading consumer analgesic brand in the Kenyan market that is distributed through the FMCG channel.
Exports into sub-Saharan Africa have grown due to an increased demand for certain of our OTC portfolio of products. Numerous dossiers have been submitted for registration of new products that are expected to be commercialised in 2011 in Kenya and Ghana. Recently we entered the Angolan market through an arrangement with a local distributor.
In line with the strategy of multinational partner of choice in the sub-Saharan region, Adcock Ingram has signed collaboration agreements with LEO Pharma and MSD in Kenya, and MSD in Ghana. We continue to pursue opportunities with multinational companies.
OutlookInvestment over the last two years in infrastructure, people, systems and processes positions the division well for 2011. Adcock Ingram will continue to acquire dossiers and seek new multinational collaborations to service sub-Saharan Africa. Several new launches and line extensions are planned for 2011, while acquisitions in the personal care and wellbeing categories have been integrated, and should perform well in 2011.
Product pipeline for rest of Africa: 2011 - 2015
Current registrations 183
Registrations anticipated in 2011 59
Projected registrations by 2015 500
• Collaboration with MSD adds to the above product mix
• Distribution agreement with Leo Pharma during 2010 adds a Dermatology range
of products for Adcock Ingram East Africa
Adcock Ingram ARV ’s add ing value to life.“ HI V is faceless , it knows no boundaries and has no economic st atus”
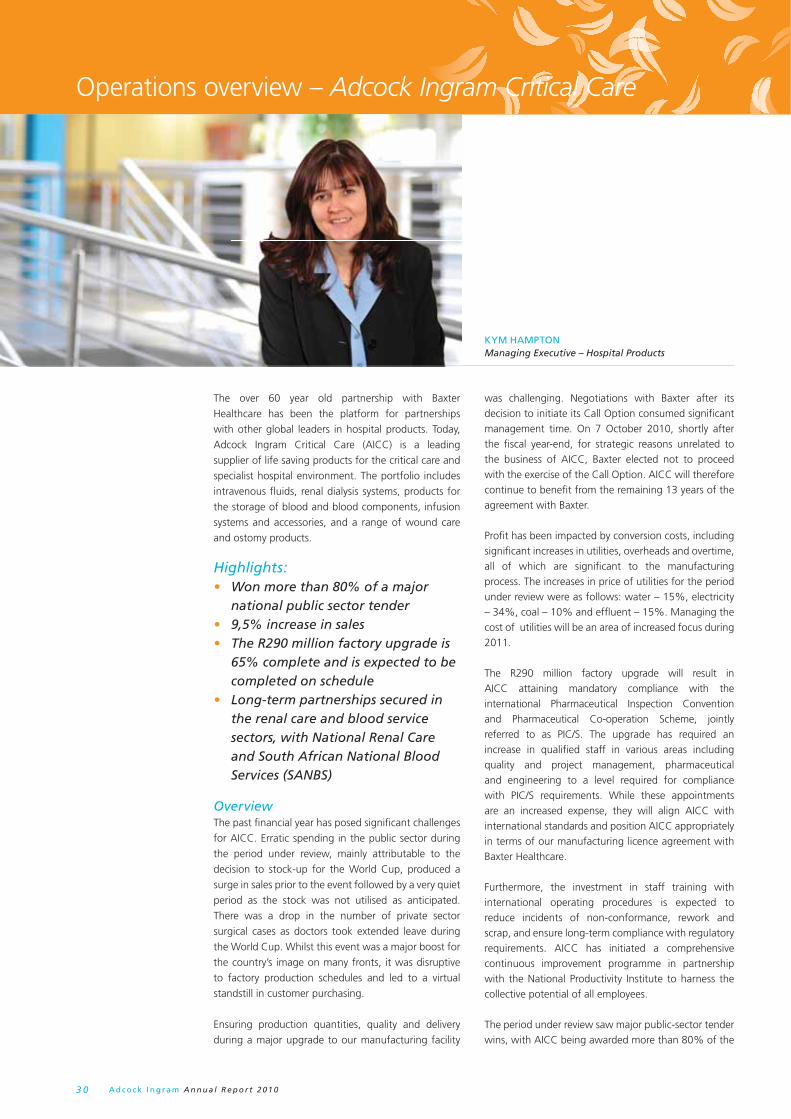
A d c o c k I n g r a m A n n u a l R e p o r t 2 0 1 03 0
Operations overview – Adcock Ingram Critical Care
KYM HAMPTONManaging Executive – Hospital Products
The over 60 year old partnership with Baxter
Healthcare has been the platform for partnerships
with other global leaders in hospital products. Today,
Adcock Ingram Critical Care (AICC) is a leading
supplier of life saving products for the critical care and
specialist hospital environment. The portfolio includes
intravenous fl uids, renal dialysis systems, products for
the storage of blood and blood components, infusion
systems and accessories, and a range of wound care
and ostomy products.
Highlights:• Won more than 80% of a major
national public sector tender• 9,5% increase in sales• The R290 million factory upgrade is
65% complete and is expected to be completed on schedule
• Long-term partnerships secured in the renal care and blood service sectors, with National Renal Care and South African National Blood Services (SANBS)
OverviewThe past fi nancial year has posed signifi cant challenges
for AICC. Erratic spending in the public sector during
the period under review, mainly attributable to the
decision to stock-up for the World Cup, produced a
surge in sales prior to the event followed by a very quiet
period as the stock was not utilised as anticipated.
There was a drop in the number of private sector
surgical cases as doctors took extended leave during
the World Cup. Whilst this event was a major boost for
the country’s image on many fronts, it was disruptive
to factory production schedules and led to a virtual
standstill in customer purchasing.
Ensuring production quantities, quality and delivery
during a major upgrade to our manufacturing facility
was challenging. Negotiations with Baxter after its decision to initiate its Call Option consumed signifi cant management time. On 7 October 2010, shortly after the fi scal year-end, for strategic reasons unrelated to the business of AICC, Baxter elected not to proceed with the exercise of the Call Option. AICC will therefore continue to benefi t from the remaining 13 years of the agreement with Baxter.
Profi t has been impacted by conversion costs, including signifi cant increases in utilities, overheads and overtime, all of which are signifi cant to the manufacturing process. The increases in price of utilities for the period under review were as follows: water – 15%, electricity – 34%, coal – 10% and effl uent – 15%. Managing the cost of utilities will be an area of increased focus during 2011.
The R290 million factory upgrade will result in AICC attaining mandatory compliance with the international Pharmaceutical Inspection Convention and Pharmaceutical Co-operation Scheme, jointly referred to as PIC/S. The upgrade has required an increase in qualifi ed staff in various areas including quality and project management, pharmaceutical and engineering to a level required for compliance with PIC/S requirements. While these appointments are an increased expense, they will align AICC with international standards and position AICC appropriately in terms of our manufacturing licence agreement with Baxter Healthcare.
Furthermore, the investment in staff training with international operating procedures is expected to reduce incidents of non-conformance, rework and scrap, and ensure long-term compliance with regulatory requirements. AICC has initiated a comprehensive continuous improvement programme in partnership with the National Productivity Institute to harness the collective potential of all employees.
The period under review saw major public-sector tender wins, with AICC being awarded more than 80% of the
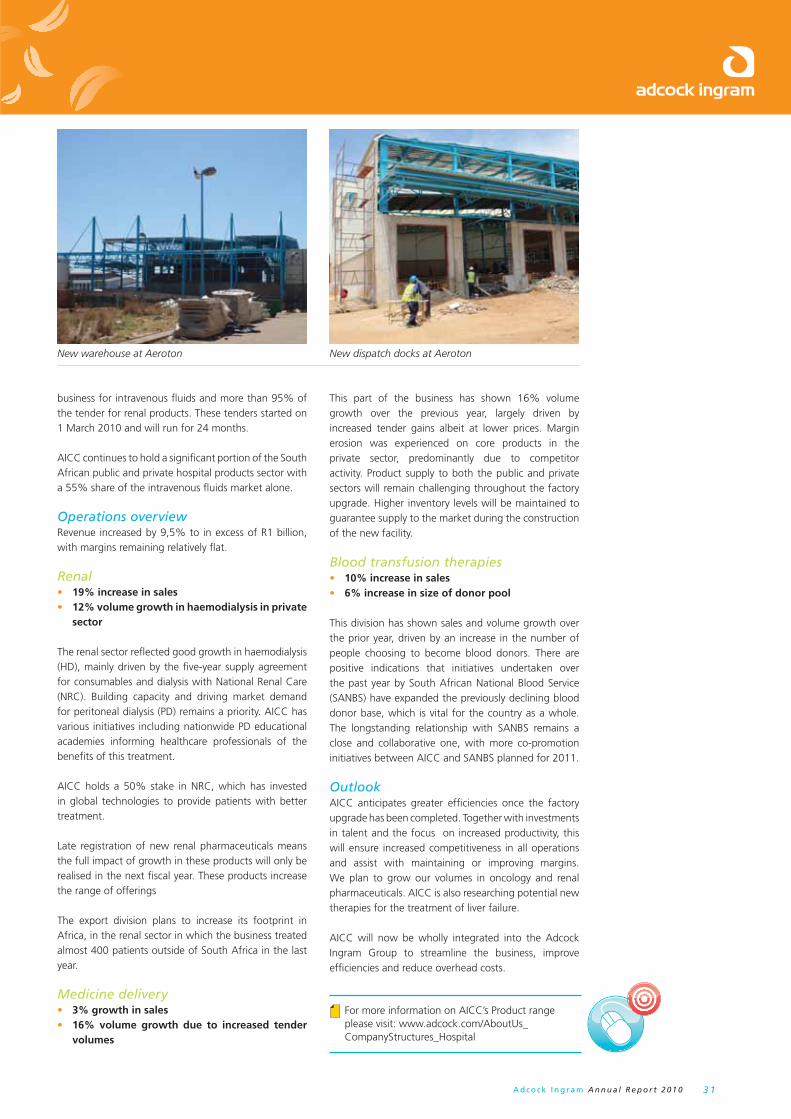
A d c o c k I n g r a m A n n u a l R e p o r t 2 0 1 0 3 1
business for intravenous fl uids and more than 95% of the tender for renal products. These tenders started on 1 March 2010 and will run for 24 months.
AICC continues to hold a signifi cant portion of the South African public and private hospital products sector with a 55% share of the intravenous fl uids market alone. Operations overviewRevenue increased by 9,5% to in excess of R1 billion, with margins remaining relatively fl at.
Renal• 19% increase in sales• 12% volume growth in haemodialysis in private
sector
The renal sector refl ected good growth in haemodialysis (HD), mainly driven by the fi ve-year supply agreement for consumables and dialysis with National Renal Care (NRC). Building capacity and driving market demand for peritoneal dialysis (PD) remains a priority. AICC has various initiatives including nationwide PD educational academies informing healthcare professionals of the benefi ts of this treatment.
AICC holds a 50% stake in NRC, which has invested in global technologies to provide patients with better treatment.
Late registration of new renal pharmaceuticals means the full impact of growth in these products will only be realised in the next fi scal year. These products increase the range of offerings
The export division plans to increase its footprint in Africa, in the renal sector in which the business treated almost 400 patients outside of South Africa in the last year.
Medicine delivery• 3% growth in sales • 16% volume growth due to increased tender
volumes
This part of the business has shown 16% volume growth over the previous year, largely driven by increased tender gains albeit at lower prices. Margin erosion was experienced on core products in the private sector, predominantly due to competitor activity. Product supply to both the public and private sectors will remain challenging throughout the factory upgrade. Higher inventory levels will be maintained to guarantee supply to the market during the construction of the new facility.
Blood transfusion therapies• 10% increase in sales• 6% increase in size of donor pool
This division has shown sales and volume growth over the prior year, driven by an increase in the number of people choosing to become blood donors. There are positive indications that initiatives undertaken over the past year by South African National Blood Service (SANBS) have expanded the previously declining blood donor base, which is vital for the country as a whole. The longstanding relationship with SANBS remains a close and collaborative one, with more co-promotion initiatives between AICC and SANBS planned for 2011.
OutlookAICC anticipates greater effi ciencies once the factory upgrade has been completed. Together with investments in talent and the focus on increased productivity, this will ensure increased competitiveness in all operations and assist with maintaining or improving margins. We plan to grow our volumes in oncology and renal pharmaceuticals. AICC is also researching potential new therapies for the treatment of liver failure. AICC will now be wholly integrated into the Adcock Ingram Group to streamline the business, improve effi ciencies and reduce overhead costs.
For more information on AICC’s Product range please visit: www.adcock.com/AboutUs_CompanyStructures_Hospital
New warehouse at Aeroton New dispatch docks at Aeroton
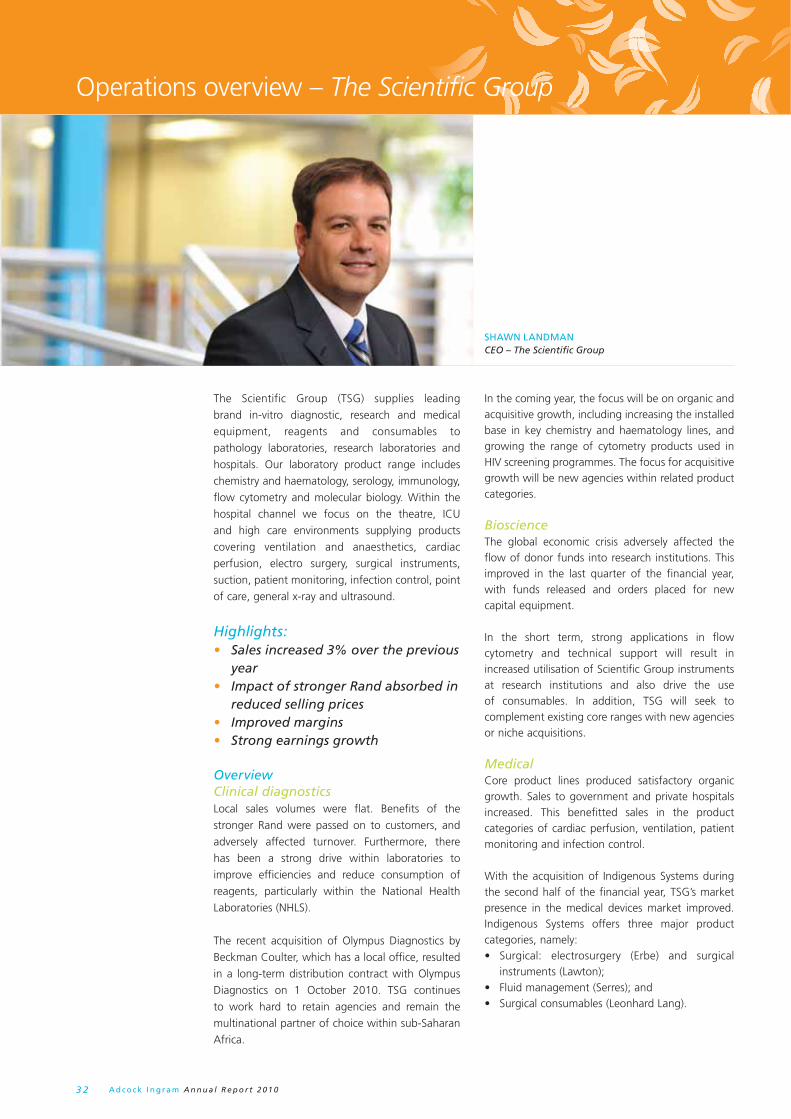
A d c o c k I n g r a m A n n u a l R e p o r t 2 0 1 03 2
SHAWN LANDMANCEO – The Scientifi c Group
The Scientific Group (TSG) supplies leading
brand in-vitro diagnostic, research and medical
equipment, reagents and consumables to
pathology laboratories, research laboratories and
hospitals. Our laboratory product range includes
chemistry and haematology, serology, immunology,
flow cytometry and molecular biology. Within the
hospital channel we focus on the theatre, ICU
and high care environments supplying products
covering ventilation and anaesthetics, cardiac
perfusion, electro surgery, surgical instruments,
suction, patient monitoring, infection control, point
of care, general x-ray and ultrasound.
Highlights:• Sales increased 3% over the previous
year• Impact of stronger Rand absorbed in
reduced selling prices• Improved margins• Strong earnings growth
OverviewClinical diagnosticsLocal sales volumes were flat. Benefits of the
stronger Rand were passed on to customers, and
adversely affected turnover. Furthermore, there
has been a strong drive within laboratories to
improve efficiencies and reduce consumption of
reagents, particularly within the National Health
Laboratories (NHLS).
The recent acquisition of Olympus Diagnostics by
Beckman Coulter, which has a local office, resulted
in a long-term distribution contract with Olympus
Diagnostics on 1 October 2010. TSG continues
to work hard to retain agencies and remain the
multinational partner of choice within sub-Saharan
Africa.
In the coming year, the focus will be on organic and acquisitive growth, including increasing the installed base in key chemistry and haematology lines, and growing the range of cytometry products used in HIV screening programmes. The focus for acquisitive growth will be new agencies within related product categories.
BioscienceThe global economic crisis adversely affected the flow of donor funds into research institutions. This improved in the last quarter of the financial year, with funds released and orders placed for new capital equipment.
In the short term, strong applications in flow cytometry and technical support will result in increased utilisation of Scientific Group instruments at research institutions and also drive the use of consumables. In addition, TSG will seek to complement existing core ranges with new agencies or niche acquisitions.
MedicalCore product lines produced satisfactory organic growth. Sales to government and private hospitals increased. This benefitted sales in the product categories of cardiac perfusion, ventilation, patient monitoring and infection control.
With the acquisition of Indigenous Systems during the second half of the financial year, TSG’s market presence in the medical devices market improved. Indigenous Systems offers three major product categories, namely:• Surgical: electrosurgery (Erbe) and surgical
instruments (Lawton);• Fluid management (Serres); and• Surgical consumables (Leonhard Lang).
Operations overview – The Scientifi c Group
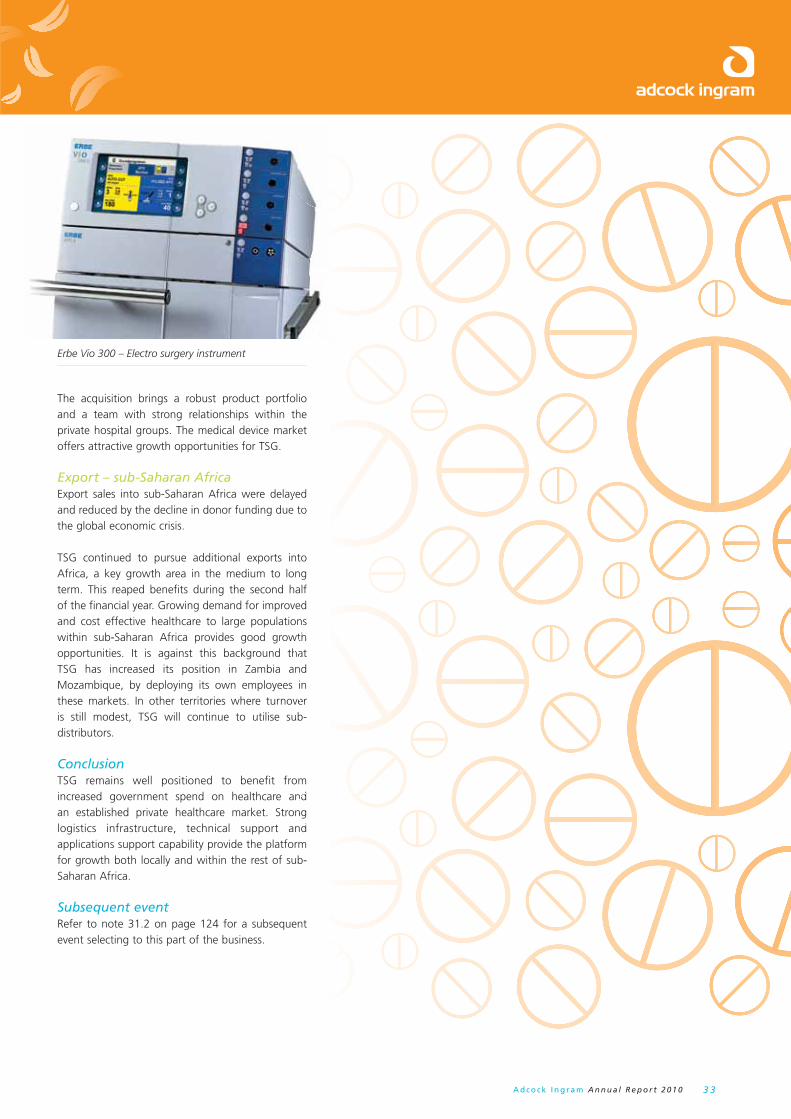
A d c o c k I n g r a m A n n u a l R e p o r t 2 0 1 0 3 3
The acquisition brings a robust product portfolio and a team with strong relationships within the private hospital groups. The medical device market offers attractive growth opportunities for TSG.
Export – sub-Saharan AfricaExport sales into sub-Saharan Africa were delayed and reduced by the decline in donor funding due to the global economic crisis.
TSG continued to pursue additional exports into Africa, a key growth area in the medium to long term. This reaped benefits during the second half of the financial year. Growing demand for improved and cost effective healthcare to large populations within sub-Saharan Africa provides good growth opportunities. It is against this background that TSG has increased its position in Zambia and Mozambique, by deploying its own employees in these markets. In other territories where turnover is still modest, TSG will continue to utilise sub-distributors.
ConclusionTSG remains well positioned to benefit from increased government spend on healthcare and an established private healthcare market. Strong logistics infrastructure, technical support and applications support capability provide the platform for growth both locally and within the rest of sub-Saharan Africa.
Subsequent eventRefer to note 31.2 on page 124 for a subsequent event selecting to this part of the business.
nd ng
d
th haan
iner
yeto
Erbe Vio 300 – Electro surgery instrument

A d c o c k I n g r a m A n n u a l R e p o r t 2 0 1 03 4
Sustainability focus
Focus area Scope Project/s
Ethics and Governance
Adcock Ingram is committed to incorporate the core governance principles of transparency, accountability, fairness and responsibility into all aspects of its operations.
• King III• Ethics programme
Competition Act training
Employees Adcock Ingram continues to invest in retention of key talent, continuous development of employees, employee wellness and transformation in the work place.
• Expatriate management • Succession planning• On-line performance management system• Leaderships competencies
Environment It is intended that Adcock Ingram’s environmental reporting scope will follow an equity share approach and will therefore account for environmental impacts from all operations.
• Various energy- and water-saving initiatives.
Communities Adcock Ingram is concerned with providing equitable, quality healthcare to those that need it most, particularly children and people living with HIV/AIDS.
• Groote Schuur • Delft Hospital• George Mukhari • Operation Smile• Smile foundation
Health and safety
Adcock Ingram is committed to implementing best operating practices at all its facilities and operations to ensure compliance with safety, health and environmental (SHE) legislation.
• SHE programmes designed and monitored• Risk control audits• Wellness programme
Education and training
To enhance our competitiveness in the industry a robust talent pipeline was developed. Study assistance, coaching and mentoring, job enlargement and international assignments are provided to enhance expertise and knowledge management in the workplace.
• 1 475 employees trained on compliance programmes
• Study assistance• Disabled learnership programmes• Graduates and internship programmes
HIV/AIDS Adcock Ingram has a comprehensive, voluntary and confi dential HIV/AIDS management programme in place. Adcock Ingram is particurlarly concerned with providing equitable, quality healthcare to those that need it most, particularly children and people living with HIV/Aids.
• Mbashe-Madwaleni HIV Programme• The Big Shoes Foundation• Pillsbury Child care centre
BEE As a leading listed healthcare company in South Africa, Adcock Ingram fully embraces Broad-based Black Economic Empowerment as a key transformation initiative.
• Mpho ea Bophelo with partners: *employees *Kagiso *Kurisani *Mookodi
HIV/AIDSHealth services in rural areas are less able to offer access to HIV screening and treatment because of lack of medical staff and facilities. It is estimated that the Mbashe area has 16 000 adults who are HIV positive. Adcock Ingram’s partnership with the Mbashe-Madwaleni HIV Programme is a comprehensive, integrated programme.
BEEAdcock Ingram has concluded a detailed transaction framework agreement that will facilitate the acquisition of an effective 13% of its issued share capital by broad-based BEE groups.
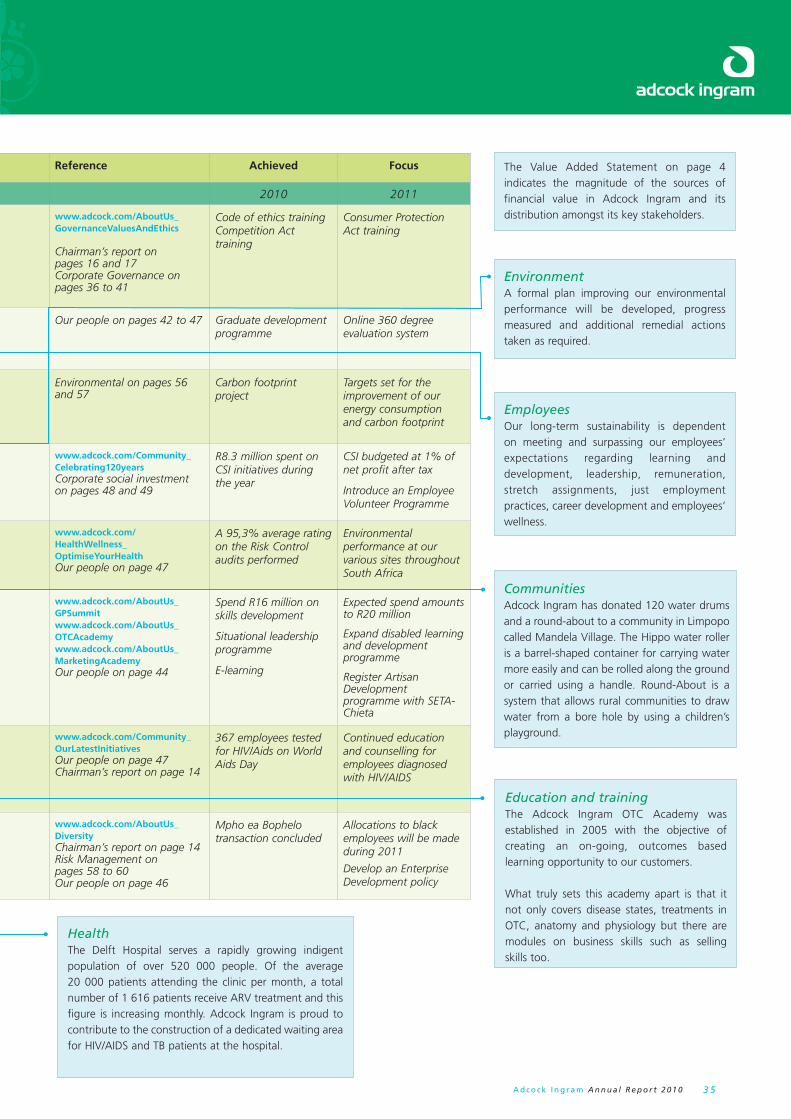
A d c o c k I n g r a m A n n u a l R e p o r t 2 0 1 0 3 5
Reference Achieved Focus
2010 2011
www.adcock.com/AboutUs_GovernanceValuesAndEthics
Chairman’s report on pages 16 and 17Corporate Governance on pages 36 to 41
Code of ethics training Competition Act training
Consumer Protection Act training
Our people on pages 42 to 47 Graduate development programme
Online 360 degree evaluation system
Environmental on pages 56 and 57
Carbon footprint project
Targets set for the improvement of our energy consumption and carbon footprint
www.adcock.com/Community_Celebrating120yearsCorporate social investment on pages 48 and 49
R8.3 million spent on CSI initiatives during the year
CSI budgeted at 1% of net profi t after tax
Introduce an Employee Volunteer Programme
www.adcock.com/HealthWellness_OptimiseYourHealthOur people on page 47
A 95,3% average rating on the Risk Control audits performed
Environmental performance at our various sites throughout South Africa
www.adcock.com/AboutUs_GPSummitwww.adcock.com/AboutUs_OTCAcademywww.adcock.com/AboutUs_MarketingAcademyOur people on page 44
Spend R16 million on skills development
Situational leadership programme
E-learning
Expected spend amounts to R20 million
Expand disabled learning and development programme
Register Artisan Development programme with SETA-Chieta
www.adcock.com/Community_OurLatestInitiativesOur people on page 47Chairman’s report on page 14
367 employees tested for HIV/Aids on World Aids Day
Continued education and counselling for employees diagnosed with HIV/AIDS
www.adcock.com/AboutUs_DiversityChairman’s report on page 14Risk Management on pages 58 to 60Our people on page 46
Mpho ea Bophelo transaction concluded
Allocations to black employees will be made during 2011
Develop an Enterprise Development policy
EmployeesOur long-term sustainability is dependent on meeting and surpassing our employees’ expectations regarding learning and development, leadership, remuneration, stretch assignments, just employment practices, career development and employees’ wellness.
CommunitiesAdcock Ingram has donated 120 water drums and a round-about to a community in Limpopo called Mandela Village. The Hippo water roller is a barrel-shaped container for carrying water more easily and can be rolled along the ground or carried using a handle. Round-About is a system that allows rural communities to draw water from a bore hole by using a children’s playground.
Education and trainingThe Adcock Ingram OTC Academy was established in 2005 with the objective of creating an on-going, outcomes based learning opportunity to our customers.
What truly sets this academy apart is that it not only covers disease states, treatments in OTC, anatomy and physiology but there are modules on business skills such as selling skills too.
HealthThe Delft Hospital serves a rapidly growing indigent population of over 520 000 people. Of the average 20 000 patients attending the clinic per month, a total number of 1 616 patients receive ARV treatment and this figure is increasing monthly. Adcock Ingram is proud to contribute to the construction of a dedicated waiting area for HIV/AIDS and TB patients at the hospital.
The Value Added Statement on page 4 indicates the magnitude of the sources of financial value in Adcock Ingram and its distribution amongst its key stakeholders.
EnvironmentA formal plan improving our environmental performance will be developed, progress measured and additional remedial actions taken as required.

A d c o c k I n g r a m A n n u a l R e p o r t 2 0 1 03 6
Corporate governance
• Achieving the highest standards of transparency, accountability and integrity in the running of its business and in its dealings with stakeholders and the community at large;
• Providing stakeholders and the financial investment community with clear, meaningful and timely information about Adcock Ingram’s operations and results;
• Conducting its business on the basis of fair commercial and competitive practices;
• Building business relationships with suppliers and customers who endorse ethical business practices;
• Actively pursuing transformation and ensuring employment practices which are non-discriminatory and which seek to maximise the potential of all its employees through training and skills development; and
• Proactively accepting responsibility for and managing the environmental and sustainability issues associated with its business.
Adcock Ingram’s corporate values are aimed at building and maintaining a culture which promotes teamwork, commitment, professionalism, integrity and a focus on business ethics, creative thinking and open and honest communication.
Adcock Ingram employs three of South Africa’s 84 trained ethics officers as of 15 November 2010. The board of Adcock Ingram is responsible for setting the ethical culture and monitors its implementation, including training of employees regarding the code of ethics to help ensure that business is conducted, at all levels in the Group, in a manner that is beyond reproach.
Adcock Ingram’s code of ethics provides clear guidance on acceptable business practices and ethical standards by which employees, suppliers and business partners are expected to conduct themselves in their business relationships with or on behalf of the Group. Employees have been trained in the revised code of ethics to foster respect for the Group’s values, standards and compliance procedures. The training in respect of the code happens once a year and the video of such training is posted on the intranet for ease of access by employees. Appropriate and consistent disciplinary action is taken in the event of any incidence of non-compliance with the Group’s code of ethics and related standards.
Employees are encouraged to report inappropriate, unethical or illegal activity through an independently-
Corporate governance includes the structures, processes and practices that the board uses to direct and manage operations of Adcock Ingram Holdings Limited and its subsidiaries. This is to ensure that decisions are taken in a transparent manner, within an ethical framework that promotes the responsible consideration of all stakeholders, while also ensuring that decision-makers are held appropriately accountable.
Adcock Ingram subscribes to the principles of good corporate governance as set out in the 2002 and 2009 King Reports on Corporate Governance for South Africa (King II and King III respectively), as well as in the JSE Listings Requirements. Adcock Ingram is committed to incorporate the core governance principles of transparency, accountability, fairness and responsibility into all aspects of its operations.
The directors are of the opinion that, save as specifically disclosed in this report, Adcock Ingram has complied with the principles of King II and strives to meet the principles contained in the updated codes of governance principles outlined in King III, which took effect on 1 March 2010.
Adcock Ingram has revised documents constituting its governance framework to include, where appropriate or applicable, the principles of King III and the new Companies Act, 2008; even though not yet required by law.
The principles underpinning the corporate governance of the Group and systems of control that form an integral part of corporate governance are set out in this report.
For example on King III the Group:• Has revised its governance documents, i.e. the
board charter and board committees’ terms of reference to be in line with the recommendations of King III;
• The mandate of the Risk and Sustainability Committee (previously known as the Risk Committee) was expanded from 1 October 2009 to include a specific focus on issues of sustainability;
• The Human Resources, Remuneration and Nominations Committee is chaired by an independent, non-executive director who is not the chairman of the board.
Values and ethicsIn line with the King II and III reports, Adcock Ingram
is committed to:

A d c o c k I n g r a m A n n u a l R e p o r t 2 0 1 0 3 7
As required by the holding company’s Articles of Association, at the annual general meeting held each year, not less than one-third of the independent non-executive directors will retire by rotation and, being eligible, may offer themselves for re-election by shareholders. Independent, non-executive directors are thus rotated at least once every three years. The next round for retiring directors shall be at the annual general meeting to be held in January 2011.
There is no term or age limit imposed in respect of a director’s appointment, however, tenure is informed by a regular, formal evaluation of the suitability, contribution and independence of each of the directors. The terms and conditions applicable to the appointment of directors are contained in a letter of appointment which, together with the board charter, forms the basis of each director’s appointment. The Nominations Committee plays an important role in the identification and removal of under-performing or unsuitable directors.
All directors are required to attend a formal, day-long annual governance session, which is scheduled in the board’s annual calendar, to ensure knowledge of governance remains relevant. In addition, all directors are provided with an induction file containing important legislation, the Group’s governance framework including the board/committee governance structure, the board charter, terms of reference of all board committees and key Group policies.
Ongoing director training sessions are held where changes in the governance, legislative, regulatory or business environment of the Group warrant specific focus. Finally, all directors are encouraged to attend external director development and training programmes at the cost of the Group. In the year under review Dr Lesoli, Dr Stewart and Mr Schönknecht each attended one of these programmes.
A profile of the current members of the board and brief curricula vitae of each of the directors appear on pages 10 and 11 of this report.
The former company secretary, Ramani Naidoo, resigned in September 2010, and the position remains vacant. The role is currently separated into administrative and legal functions. Daryl Kronson, a finance executive with 26 years’ experience at Adcock Ingram is currently responsible for the administrative function with Ntando Simelane, the
operated, 24-hour ethics hotline. This hotline can be accessed via a toll-free number, email, fax, SMS or letter. Reports are received in various official languages including English, Afrikaans, isiZulu, isiXhosa, seSotho and seTswana.
Since the establishment of the ethics line in January 2009, 19 reports have been received (five between January and September 2009, with another 14 from 1 October 2009). Eight reports are still under investigation. The allegations made in two of the reports received could not be substantiated or proven; three led to a disciplinary enquiry resulting in a final warning against the employee, and six resulted in the implementation of improved or stricter control measures.
Governance framework The governance framework of Adcock Ingram is consistent with the principles of the King III report and code of corporate governance. What follows is a précis of key elements of the governance of the Group. The board and its committees are guided by charters and documented terms of reference, which currently consist of the following: • A board charter which sets clear direction
regarding: the composition, purpose, role and responsibilities of the board of directors;
• Written terms of reference for the board committees which constitutes the committees and determines their role in relation to the board;
• A delegation of authority policy in terms of which the board formally delegates its authority in certain areas to the CEO and management, while reserving other issues to itself for decision;
• A code of ethics which provides direction on the ethical framework within which Adcock Ingram conducts its business; and
• A framework of policies and procedures which are reviewed regularly and approved by the Adcock Ingram executive committee and posted on the Group’s intranet.
Board of directors Adcock Ingram is led by a diverse board of nine directors, seven of whom, including the chairman, are independent non-executives. There is a formal process for the appointment of directors to the board. Criteria used in the selection include leadership qualities, depth of experience, skills, independence, personal integrity and business acumen. The directors collectively bring a wide range of skills and experience, including industry and business acumen. The board is led by an independent non-executive chairman. There is clear separation of powers between the chairman of the board and the chief executive officer.
Find out more
BOARD OF DIRECTORS (Page 10)
EXECUTIVE COMMITTEE
(Page 12)

A d c o c k I n g r a m A n n u a l R e p o r t 2 0 1 03 8
Group Legal and Compliance Manager responsible for all statutory functions.
The company secretary attends all board and committee meetings and provides the board and directors, collectively and individually, with guidance on the execution of their governance role and compliance with the required statutory procedures.
Board responsibilities and processesThe board provides strategic direction, approves and regularly reviews business plans, budgets and policies, appoints the Chief Executive Officer and the Chief Financial Officer, ensures that power and authorities delegated to management are clearly and comprehensively documented and regularly reviewed, and ensures that the governance framework of the Group remains appropriate and relevant. The board also monitors risk and oversees the implementation of approved strategies through a structured approach to reporting and accountability. The Adcock Ingram board is ultimately accountable to shareholders for performance of the Group.
The board is governed by a board charter which sets out, inter alia, the principles and processes in terms of which directors are appointed and the duties and responsibilities of the board and how issues such as dealing in the holding company’s securities and conflicts of interest are to be dealt with. The board charter now incorporates the principles of the King III report wherever appropriate.
Board and board committee meetings are scheduled annually in advance. In addition to regular consideration of the Group’s operational and financial performance at each of its meetings, the board’s annual work-plan aims to ensure that the board deals with each of the matters reserved for its consideration during the course of its annual meetings. The number of meetings held during the year under review (including meetings of board-appointed committees) and the attendance of each director are contained on pages 39 to 41 of this report. The board strives to ensure that non-attendance by directors at scheduled board meetings is the exception rather than the norm, and directors who are unable to attend meetings are required to communicate their reasons for non-attendance in advance to the company secretary for formal notification to the board.
Board papers are provided to directors in a timely manner in advance of meetings, and directors are afforded ample opportunity to study the material presented and to request additional information from management where necessary. All directors may propose further matters for inclusion on the agenda of board meetings. The board is given unrestricted access to all Group information, records, documents and facilities through the office of the company secretary. The company secretary is the secretary to all committees of the board and ensures that the committees operate within the limits of their respective mandates and in terms of an agreed annual work plan and ensures that a formal process of reporting is in place. The committees report formally to board meetings subsequent to any meeting of committee.
In terms of the board charter, directors may obtain independent professional advice at the Group’s expense should they deem it necessary for the proper execution of their directorial role. Directors are kept appropriately informed of key developments affecting the Group between board meetings.
Non-executive directors have full access to management and may meet separately with management, without the attendance of executive directors, where necessary. Where required, arrangements for such meetings are facilitated through the office of the company secretary. At least twice annually, the non-executive directors meet without the executive directors or other members of management being present to discuss issues relevant to the board and the Group.
The Risk and Sustainability and Audit Committees and the board monitor exercise of delegated authority above a pre-determined level on a regular basis.
With the exception of the delegation of authority policy, all documents constituting the government framework are revised annually to ensure alignment with King III, the new Companies Act, and local and international best practice.
Board meetingsThe following table sets out the attendance by directors at scheduled board meetings held during the year under review.
Corporate governance continued
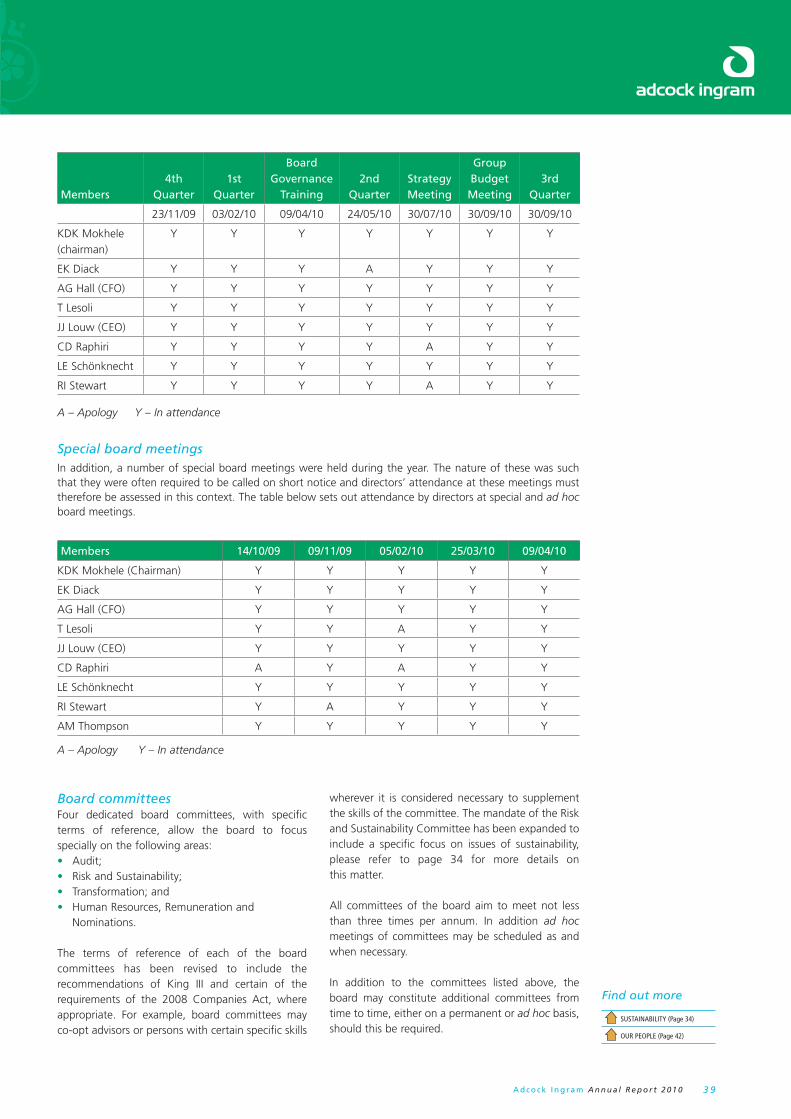
A d c o c k I n g r a m A n n u a l R e p o r t 2 0 1 0 3 9
Special board meetingsIn addition, a number of special board meetings were held during the year. The nature of these was such that they were often required to be called on short notice and directors’ attendance at these meetings must therefore be assessed in this context. The table below sets out attendance by directors at special and ad hoc board meetings.
Members 14/10/09 09/11/09 05/02/10 25/03/10 09/04/10
KDK Mokhele (Chairman) Y Y Y Y Y
EK Diack Y Y Y Y Y
AG Hall (CFO) Y Y Y Y Y
T Lesoli Y Y A Y Y
JJ Louw (CEO) Y Y Y Y Y
CD Raphiri A Y A Y Y
LE Schönknecht Y Y Y Y Y
RI Stewart Y A Y Y Y
AM Thompson Y Y Y Y Y
A – Apology Y – In attendance
Members 4th
Quarter1st
Quarter
Board Governance
Training2nd
QuarterStrategy Meeting
Group Budget
Meeting3rd
Quarter
23/11/09 03/02/10 09/04/10 24/05/10 30/07/10 30/09/10 30/09/10
KDK Mokhele (chairman)
Y Y Y Y Y Y Y
EK Diack Y Y Y A Y Y Y
AG Hall (CFO) Y Y Y Y Y Y Y
T Lesoli Y Y Y Y Y Y Y
JJ Louw (CEO) Y Y Y Y Y Y Y
CD Raphiri Y Y Y Y A Y Y
LE Schönknecht Y Y Y Y Y Y Y
RI Stewart Y Y Y Y A Y Y
A – Apology Y – In attendance
Board committeesFour dedicated board committees, with specific terms of reference, allow the board to focus specially on the following areas:• Audit;• Risk and Sustainability;• Transformation; and• Human Resources, Remuneration and
Nominations.
The terms of reference of each of the board committees has been revised to include the recommendations of King III and certain of the requirements of the 2008 Companies Act, where appropriate. For example, board committees may co-opt advisors or persons with certain specific skills
wherever it is considered necessary to supplement the skills of the committee. The mandate of the Risk and Sustainability Committee has been expanded to include a specific focus on issues of sustainability, please refer to page 34 for more details on this matter.
All committees of the board aim to meet not less than three times per annum. In addition ad hoc meetings of committees may be scheduled as and when necessary.
In addition to the committees listed above, the board may constitute additional committees from time to time, either on a permanent or ad hoc basis, should this be required.
Find out more
SUSTAINABILITY (Page 34)
OUR PEOPLE (Page 42)
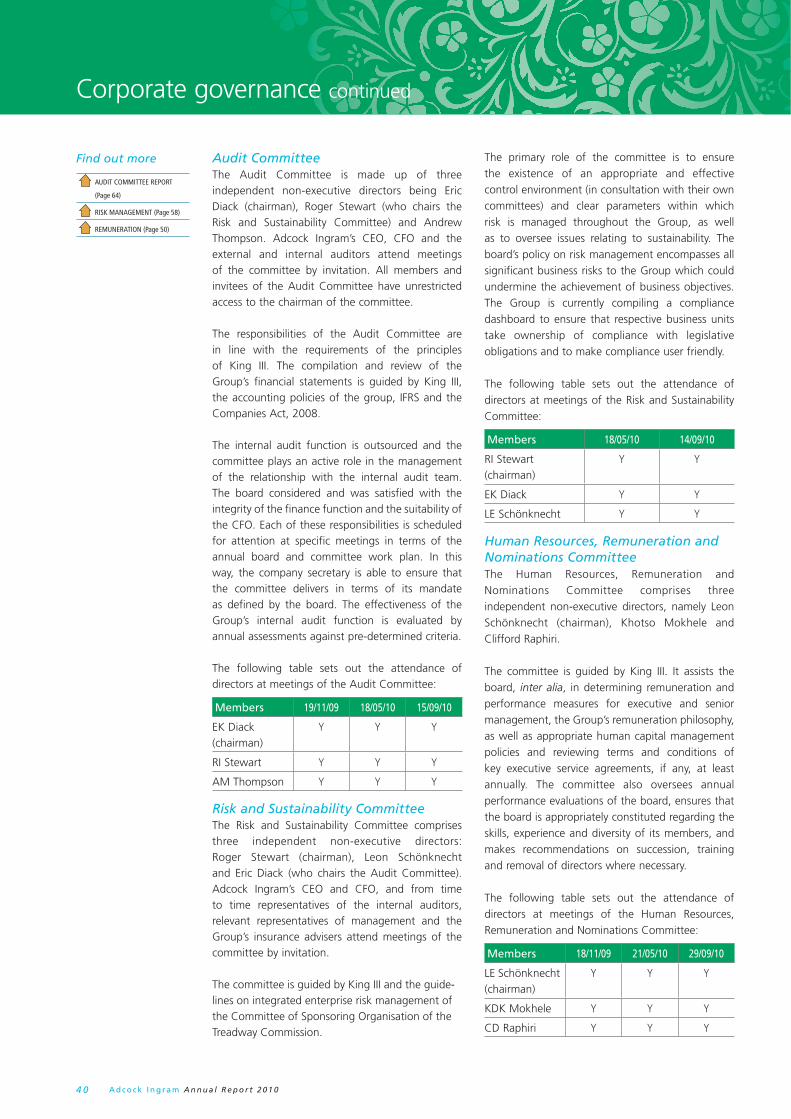
A d c o c k I n g r a m A n n u a l R e p o r t 2 0 1 04 0
Audit CommitteeThe Audit Committee is made up of three independent non-executive directors being Eric Diack (chairman), Roger Stewart (who chairs the Risk and Sustainability Committee) and Andrew Thompson. Adcock Ingram’s CEO, CFO and the external and internal auditors attend meetings of the committee by invitation. All members and invitees of the Audit Committee have unrestricted access to the chairman of the committee.
The responsibilities of the Audit Committee are in line with the requirements of the principles of King III. The compilation and review of the Group’s financial statements is guided by King III, the accounting policies of the group, IFRS and the Companies Act, 2008.
The internal audit function is outsourced and the committee plays an active role in the management of the relationship with the internal audit team.The board considered and was satisfied with the integrity of the finance function and the suitability of the CFO. Each of these responsibilities is scheduled for attention at specific meetings in terms of the annual board and committee work plan. In this way, the company secretary is able to ensure that the committee delivers in terms of its mandate as defined by the board. The effectiveness of the Group’s internal audit function is evaluated by annual assessments against pre-determined criteria.
The following table sets out the attendance of directors at meetings of the Audit Committee:
Members 19/11/09 18/05/10 15/09/10
EK Diack (chairman)
Y Y Y
RI Stewart Y Y Y
AM Thompson Y Y Y
Risk and Sustainability Committee The Risk and Sustainability Committee comprises three independent non-executive directors: Roger Stewart (chairman), Leon Schönknecht and Eric Diack (who chairs the Audit Committee). Adcock Ingram’s CEO and CFO, and from time to time representatives of the internal auditors, relevant representatives of management and the Group’s insurance advisers attend meetings of the committee by invitation.
The committee is guided by King III and the guide-lines on integrated enterprise risk management of the Committee of Sponsoring Organisation of the Treadway Commission.
The primary role of the committee is to ensure the existence of an appropriate and effective control environment (in consultation with their own committees) and clear parameters within which risk is managed throughout the Group, as well as to oversee issues relating to sustainability. The board’s policy on risk management encompasses all significant business risks to the Group which could undermine the achievement of business objectives. The Group is currently compiling a compliance dashboard to ensure that respective business units take ownership of compliance with legislative obligations and to make compliance user friendly.
The following table sets out the attendance of directors at meetings of the Risk and Sustainability Committee:
Members 18/05/10 14/09/10
RI Stewart (chairman)
Y Y
EK Diack Y Y
LE Schönknecht Y Y
Human Resources, Remuneration and Nominations CommitteeThe Human Resources, Remuneration and Nominations Committee comprises three independent non-executive directors, namely Leon Schönknecht (chairman), Khotso Mokhele and Clifford Raphiri.
The committee is guided by King III. It assists the board, inter alia, in determining remuneration and performance measures for executive and senior management, the Group’s remuneration philosophy, as well as appropriate human capital management policies and reviewing terms and conditions of key executive service agreements, if any, at least annually. The committee also oversees annual performance evaluations of the board, ensures that the board is appropriately constituted regarding the skills, experience and diversity of its members, and makes recommendations on succession, training and removal of directors where necessary.
The following table sets out the attendance of directors at meetings of the Human Resources, Remuneration and Nominations Committee:
Members 18/11/09 21/05/10 29/09/10
LE Schönknecht (chairman)
Y Y Y
KDK Mokhele Y Y Y
CD Raphiri Y Y Y
Corporate governance continued
Find out more
AUDIT COMMITTEE REPORT
(Page 64)
RISK MANAGEMENT (Page 58)
REMUNERATION (Page 50)

A d c o c k I n g r a m A n n u a l R e p o r t 2 0 1 0 4 1
Transformation CommitteeThe Transformation Committee consists of both non-executive and executive directors. Relevant members of management attend meetings by invitation. The committee is currently chaired by Tlalane Lesoli. Its members are Khotso Mokhele, Jonathan Louw (CEO), Andy Hall (CFO) and Andrew Thompson.
This committee is responsible for guiding, monitoring, reviewing and evaluating Adcock Ingram’s progress in transformation with the objectives which include ensuring that the Group’s equity ownership and the demographic profile of its employees is representative in the South African context. The committee is also responsible for the establishment and implementation of a measurement and monitoring framework and for the Group’s transformation plan. It reviews and monitors the Group’s procurement policies to encourage procurement practices that, wherever possible, are equitable and supportive of the objective of black economic empowerment. This committee played a critical role in guiding the board and management when the Group was concluding its black economic empowerment transaction in 2010.
The following table sets out the attendance of directors at meetings of the Transformation Committee:
Members 27/10/09 18/11/09 20/05/10 28/09/10
T Lesoli (chairman)
Y Y Y Y
AG Hall Y Y Y Y
KDK Mokhele
A A Y Y
JJ Louw Y Y Y Y
AM Thompson
Y Y Y Y
Conflict of interestThe board has adopted formal policies dealing with conflicts of interest and trading in securities. The purpose of the latter is to regulate trading in the holding company’s shares and to restrict trading during any period when an individual may be in possession of unpublished, potentially price sensitive information. These policies are applicable to all directors and employees and are posted on the Group’s intranet for ease of reference.
Board performance The performance of the board, the board committees, the individual directors, the CEO, CFO and the company secretary are assessed annually. The last assessment was done in December 2009 and expected performance was achieved.
Board remuneration Details of the Group’s remuneration policies and practices, and remuneration paid to directors are set out on pages 52 and 53 of this report. The increase in the remuneration of non-executive directors covering the period 1 October 2009 to 31 January 2011 was approved by the shareholders in August 2010.
Non-executive directors are remunerated by way of board fees only. Board remuneration previously consisted of a fixed annual fee regardless of the number of meetings attended. This has been reviewed following the shareholders’ approval to include a fixed retainer for scheduled board meetings to ensure alignment with governance best practice. Non-executive directors are also paid an additional set fee for every special meeting exceeding three hours in duration. In line with the recommendations of the King II and King III reports on corporate governance, non-executive directors’ remuneration is not linked in any way to the performance of the Group.
Going concernThe board of directors has concluded that the Group has sufficient resources to maintain the business for the foreseeable future and confirms that the business is a going concern. The board has minuted the facts and assumptions used in assessing the Group’s going-concern status at financial year-end.
For more information on Corporate Governance please visit: www.adcock.com/AboutUs_GovernanceValuesAndEthics.

A d c o c k I n g r a m A n n u a l R e p o r t 2 0 1 04 2
Our people
Adcock Ingram’s growth is dependent on motivated and skilled employees and therefore the Group is committed to providing:• Strong leadership to drive business performance and mobilise employees;• Tangible rewards to encourage and incentivise performance; • Learning, development and growth opportunities;• Fair and just employment practices; and• Increased productivity to sustain optimal business performance and shareholder value.
Workforce profile Head count in South Africa increased by 16% as a result of businesses acquired and organic growth as indicated per the table below.
2010 2009
Employees at the beginning of the year 1 802 1 798
Add:
Recruitment 453 470
Acquisitions 33 14
Less:
Exits (197) (480)
Voluntary (110) (136)
Involuntary (87) (344)
Employees at the end of the year 2 091 1 802
Human capital initiativesDuring the year under review the following internal targets were achieved:
Key objective 2010 performance Evaluation
Transformation
Diversity in the workplace Nine people with disabilities were employed during the year. In total Adcock Ingram employs 15 disabled people, representing 0,7% of the total workforce.
Aligning transformation targets with the DTI’s Codes of Good Practice
82% of staff employed during 2010 were black. Black employees represent more than 78% of the total workforce.
Exceeded target at both a junior (actual performance 92% as opposed to a target of 68%) and middle management level (79% achieved compared to the target of 63%) but under performed against the target set at senior management level.
Employee wellness
Implemented an integrated programme to address employee wellness holistically
65% of employees participated in the Wellness programme compared to a target of 50%.
Improved employee efficiencies and cost optimisation
Successfully implemented Employee Self Service (ESS) in the Pharmaceutical business with 807 employees utilising the system.
P.Net-Online Recruitment System implemented.
Broad-banding (grading within bands)
With the implementation of broad-banding at executive level, this philosophy is now being practised across the business ensuring consistency and uniformity.

A d c o c k I n g r a m A n n u a l R e p o r t 2 0 1 0 4 3
Key objective 2010 performance Evaluation
Governance 85% of the workforce benefitted from refresher training on policies and procedures conducted across the entire business.
Enhanced the study assistance policy with more detailed selection criteria, including length of service, performance rating, course relevance and plough back terms and conditions.
Updated performance management policy.
Rolled out an ethics programme to all staff members.
Strengthened the talent bank Established the Adcock Ingram Talent Forum which focuses on the quality of those in critical positions and potential successors.
Rolled out situational leadership programme. To date over 100 of our managers have completed this training.
Implemented graduate development programme.
Designed and implemented succession management framework.
Spent more than R16 million in skills development, of which 79% was for black employees.
Overall culture of performance
Robust performance management system in place.
Online 360 degree evaluation system will be implemented during the next financial year as the specifications are currently being revisited.
Achieved In progress Planned for 2011
Employee relationsAdcock Ingram has a satisfactory and entrenched
working relationship with three recognised trade
unions, namely SACWU, CEPPWAWU and GIWUSA,
which together represent 44% of all South
African permanent employees. Within the defined
bargaining units, 65% of Adcock Ingram’s South
African permanent employees are represented by
these unions.
The 2010 wage negotiations were concluded
amicably with the parties agreeing to an 8% increase
and minimum wage of R5 000 per month across
the board. Wage negotiations took place under
the auspices of the National Bargaining Council
for Chemical Industries within the Pharmaceutical
Sector where wage negotiations were concluded
between member employers and the referred to
unions. The agreed-to wage agreement is only
extended to member employers of the employers’
organisation LAAPI (Labour Affairs Association of
the Pharmaceutical Industry). On average, Adcock
Ingram’s minimum wage ranges from 8% to 20%
above the agreed minimum wage.
This year, employees were provided with refresher
training on the Group policies and procedures via
the intranet. Policies and procedures are regularly
reviewed and updated to ensure alignment to best
practice and legal compliance.
During the review period 76 disciplinary processes
were instituted, resulting in 16 dismissals due to
misconduct. Reasons for misconduct were evaluated
to seek corrective action and to enhance systems
applicable to behavioural change. Workplace
grievances are managed according to the Group’s
grievance procedure, with three grievances pending.
Performance managementPerformance management processes continue to
ensure that performance of business units’ and
individual employees are aligned with the Group’s
strategic and financial objectives. The quarterly
Individual Performance Agreements (IPA) process
ensures that there is constant feedback and
outcomes are continuously monitored and revised,
allowing for operational excellence and continuous
improvement targets to be monitored and for

A d c o c k I n g r a m A n n u a l R e p o r t 2 0 1 04 4
discussion around development needs. A talent
forum was introduced during the year under review
to ensure that development initiatives are peer
reviewed and supportive of business needs.
Adcock Ingram is customising its Oracle IT system to establish a user friendly, cost effective 360 degree performance management measure. This will enhance current feedback methods by allowing corporate values and identified behaviours to be measured.
Developing the global workforce Adcock Ingram piloted a programme to prepare expatriate staff and their families for relocation, while helping them understand and manage the dynamics and challenges inherent in working on international assignments. The repatriation programme is also aimed at debriefing and reintegrating returning employees. This programme is seen as a useful tool for Adcock Ingram’s long-term sustainability as it grows into new markets.
Education and trainingTalent managementAdcock Ingram relies on a combination of online recruitment, incentivised employee referrals and reputable agencies to find experienced and talented people.
This financial year Adcock Ingram spent R16,7 million on skills development, up from R7,7 million spent in 2009, of which R13,2 million was spent on formerly disadvantaged South Africans and R9,5 million on black women. Adcock Ingram achieved a skills development score of 12 out of 15. Succession managementManagers are tasked with identifying future leaders according to a set of criteria, such as cognitive ability, attitude, leadership potential and cultural fit. These employees are then developed through targeted mentoring and coaching programmes.
Leadership development: Situational LeadershipIn conjunction with Ken Blanchard, a reputable international leadership consulting business, originally from USA, Adcock Ingram developed a fast-track employee development and culture change programme to create a common leadership language and framework. This approach allows Adcock Ingram to improve leadership effectiveness, and speed up the employee development cycle and foundation for culture change. Leadership
effectiveness influences employee engagement, customer satisfaction and organisational sustainability. More than 100 managers have completed this training, with positive feedback received from the business units.
Mandatory programmesEmployees are regularly required to attend mandatory training courses to ensure they remain up to date on regulations and compliance standards. During the period under review, 1 475 employees (or 70,2% of the South African workforce) attended courses on the Good Manufacturing Practice (GMP), Good Laboratory Practice (GLP), Operators, Occupational Health & Safety (OHS) standards, competition law, product-related training, ethics and other programmes.
Operational excellenceAdcock Ingram is one of only a few companies in the local pharmaceutical industry to achieve full accreditation for its apprenticeship training facilities. Inspected by Chemical Industry Education and Training Authority (CHIETA), the facilities successfully met stringent requirements prescribed by legislation. As a result, Adcock Ingram now has the in-house capacity to develop artisans in both the fitter and electrical trades.
Talent retentionAt 7%, Adcock Ingram’s staff turnover is below the industry norm of 9,7%. The Group believes this is due to its use of mechanisms such as employee post-placement and “stay” (retention assessment) interviews, personal growth plans, mentorships, coaching, wellness programmes, appropriate rewards and recognition practices, and an overall collegial corporate culture.
Skills developmentAdcock Ingram spent almost R7 million during the period under review on a combination of skills development programmes (set out on page 45) that target growth of talent. The Group develops or procures programmes as needs arise to enable the workforce to deal with the short- and medium-term business challenges. The expenditure per programme ranges from 75% – 100% spend on previously disadvantaged groups (Africans, Coloureds and Indians).
Our people continued

A d c o c k I n g r a m A n n u a l R e p o r t 2 0 1 0 4 5
The pyramid below highlights elements of the skills development programme.
MBA &
Leadership development
Business acumen, leadership and strategic
direction
Study assistanceImprove skills set and propel career
progression in scarce and critical skills
Internships & graduate development programme
Talent pool for business sustainability
LearnershipsImprove and contribute learnership of skills in the market
Adult basic education and training (ABET)Improve the literacy level of employees
Building leaders today for future business performance
Study assistance/bursaries Adcock Ingram spent a total of R930 726 on the study assistance programme, in which 75 employees enrolled at various institutions of higher learning to pursue degrees (including master’s degrees), diplomas and certificates in different fields of study.
Adult Basic Education and Training (ABET)In line with one of the pharmaceutical sector’s National Skills Development Strategies for 2010 to 2015 and to improve employees’ literacy levels, Adcock Ingram offers employees ABET programmes. Enrolment was 98 employees in 2010 compared with 57 in 2009.
Learnerships, internships and Graduate Development ProgrammesDuring the year there were 64 graduates, learnerships and internships in the business representing 3,2% of the Group’s South African workforce. Most of these learners have been placed in permanent positions within the organisation. It is our goal to place at least 10% of these graduates in permanent positions.
Disabled Learnership ProgrammeIn diversifying the workforce, a learnership for disabled employees was introduced during the period. In total, nine previously unemployed, disabled learners were trained and employed across various fields such as regulatory affairs, IT, R&D, logistics and purchasing, finance and customer care.
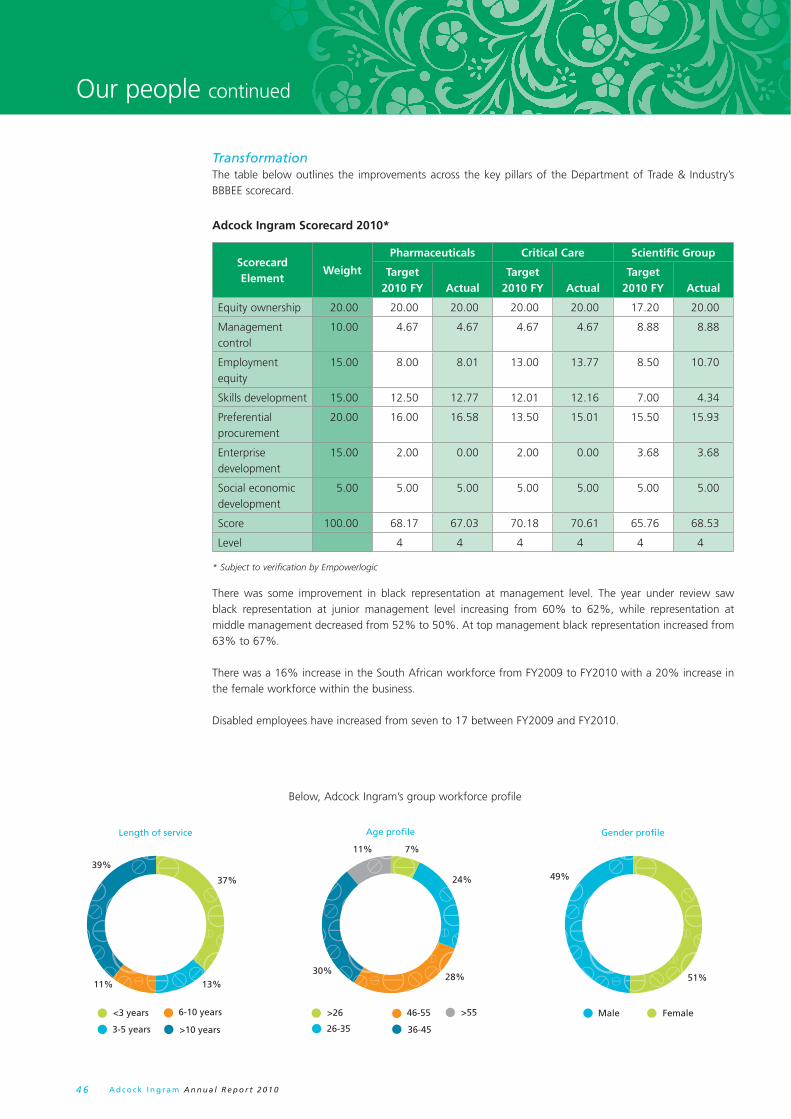
A d c o c k I n g r a m A n n u a l R e p o r t 2 0 1 04 6
TransformationThe table below outlines the improvements across the key pillars of the Department of Trade & Industry’s BBBEE scorecard.
Adcock Ingram Scorecard 2010*
Scorecard Element
Weight
Pharmaceuticals Critical Care Scientific Group
Target 2010 FY
Actual
Target 2010 FY Actual
Target 2010 FY
Actual
Equity ownership 20.00 20.00 20.00 20.00 20.00 17.20 20.00
Management control
10.00 4.67 4.67 4.67 4.67 8.88 8.88
Employment equity
15.00 8.00 8.01 13.00 13.77 8.50 10.70
Skills development 15.00 12.50 12.77 12.01 12.16 7.00 4.34
Preferential procurement
20.00 16.00 16.58 13.50 15.01 15.50 15.93
Enterprise development
15.00 2.00 0.00 2.00 0.00 3.68 3.68
Social economic development
5.00 5.00 5.00 5.00 5.00 5.00 5.00
Score 100.00 68.17 67.03 70.18 70.61 65.76 68.53
Level 4 4 4 4 4 4
* Subject to verification by Empowerlogic
Our people continued
There was some improvement in black representation at management level. The year under review saw black representation at junior management level increasing from 60% to 62%, while representation at middle management decreased from 52% to 50%. At top management black representation increased from 63% to 67%.
There was a 16% increase in the South African workforce from FY2009 to FY2010 with a 20% increase in the female workforce within the business.
Disabled employees have increased from seven to 17 between FY2009 and FY2010.
51%
49%
Gender profile
Male Female
28%
24%
30%
11% 7%
Age profile
26-35
46-55>26
36-45
>55
13%11%
37%
39%
Length of service
3-5 years
6-10 years<3 years
>10 years
Below, Adcock Ingram’s group workforce profile

A d c o c k I n g r a m A n n u a l R e p o r t 2 0 1 0 4 7
HIV/AIDSAdcock Ingram has a comprehensive, voluntary and
confidential HIV/AIDS management programme,
which among other things aims to identify
employees infected with HIV/AIDS by performing
free screening tests at various sites.
The programme educates and counsels employees
diagnosed with HIV/AIDS about their condition,
lifestyle and prevention of transmission of the virus.
It assists affected employees in managing their
condition, with the aim of ensuring that they can
live a healthy and productive lifestyle.
On World Aids Day (1 December 2009) Adcock
Ingram embarked on a group-wide voluntary
counselling and testing campaign (VCT), including
industrial theatre at various centres. This received
a positive response, with 367 employees tested
of which seven tested HIV positive, bringing the
total number of HIV positive employees to 67. As
this programme was initiated in the 2010 financial
year, no comparative data is available. Nevertheless,
the prevalance of HIV positive employees is low by
South African standards.
Safety, health and environmentAdcock Ingram is committed to implementing best
operating practices at all its facilities and operations
to ensure compliance with safety, health and
environmental (SHE) legislation. Besides fostering
close working relationships with government
agencies, business partners and other concerned
organisations, Adcock Ingram also has measures
in place to ensure that its SHE programmes are
effectively designed and monitored. SHE and risk
management policies are prominently displayed at
all Group facilities.
Statutory and internal compliance is monitored
annually through risk control audits by Alexander
Forbes Risk Services. Despite the disruption and
increased risk of non-compliance due to construction
and upgrades at various facilities during the period
under review, the South African operations achieved
an acceptable average compliance score of 95,3%.
Alexander Forbes Risk Services also performed
environmental audits at the Midrand, Aeroton,
Clayville and Wadeville facilities, which recorded
an 81% average compliance rate. Corrective action
and training programmes are being implemented in
underperforming areas. The Risk and Sustainability
Committee is monitoring the situation.
Inspections of facilities by trained safety inspectors
and meetings of the safety committees took place
in accordance with relevant legislation. A total
of 20 reportable incidents* (an average of two
reportable incidents per site taking into account
our 10 different Adcock Ingram operations across
South Africa) were investigated and addressed at
the relevant committee meetings, and corrective
and preventive measures were implemented. In
Gauteng, the Group has also engaged the services
of two qualified health and safety experts, Concept
Safety Systems CC and Alexander Forbes Risk
Services.
Employee wellness During the year, Adcock Ingram launched employee
wellness programmes.
In February, the Group partnered with Independent
Counselling Advisory Services (ICAS) to launch the
fully-funded Mpilo-nhle Adcock Ingram Employee
Wellness Programme. Mpilo-nhle (which means
wellness in isiXhosa) offers employees, their spouses
and dependants confidential and personalised
support. Facilitated by professional counsellors, they
provide multilingual telephonic and face-to-face
counselling, trauma counselling, as well as legal and
financial advice.
In August, the Adcock Ingram Executive Wellness
Programme was launched to executives and later
broadened to include key talent employees. The
programme consists of an annual medical assessment
to establish the risk to the business of chronic
diseases, lifestyle, high cholesterol, hypertension,
obesity, cancer, smoking and sedentary lifestyle. This
offering combines multidisciplinary, professional
and contemporary approaches to deliver executive
assessments and intervention plans.
Adcock Ingram will expand the wellness programmes
further to incorporate our offshore employees and
to add more offerings, while continuing to monitor
the current offering to identify and manage trends.
* A reportable incident is defined as each incident occurring
at work or arising out of or in connection with the activities
of persons at work, or in connection with the use of plant or
machinery, in which, or in consequence of which any person
dies, becomes unconscious, suffers the loss of a limb or part
of a limb or is otherwise injured or becomes ill to such a
degree that he is likely either to die or to suffer a permanent
physical defect or likely to be unable for a period of at least
14 days either to work or to continue with the activity for
which he was employed or is usually employed.

A d c o c k I n g r a m A n n u a l R e p o r t 2 0 1 04 8
Corporate social investment
IntroductionAll citizens have the right to access healthcare. Adcock Ingram embraces this challenge daily in every aspect of its business. In addition to the broad range of brands, products and services provided to patients, pharmacists, doctors, hospitals and laboratories, Adcock Ingram is particularly concerned with providing equitable, quality healthcare to those that need it most, particularly children and people living with HIV/AIDS. Adcock Ingram’s Corporate Social Investment (CSI) programme is about adding value to life and this is reflected throughout the business.
Social responsibilityAdcock Ingram has invested over R27 million in community development since re-listing on the JSE in 2008. In 2010, Adcock Ingram successfully implemented 120 CSI projects under the ‘120 Ways to Add Value to Life’ campaign, part of the Group’s 120th anniversary celebrations, and has partnered with employees to volunteer time and skills towards community development initiatives.
As illustrated in the diagram below, resources were directed at three key areas:• Flagship programmes – improvement of
health infrastructure within the public sector, including the building of clinics, renovating and upgrading paediatric and neonatal wards and the construction of world-class operating theatres.
• Healthcare and vulnerable groups programmes and associated projects – supporting the work currently done by non-governmental organisations. This year, for example, Adcock Ingram contributed to the Organ Donor Foundation’s educational programmes.
• CEO and Chairman’s discretionary fund
Flagship programmes: Healthcare infrastructure projectsDr George Mukhari Hospital – (Pretoria)Amount donated: R400 000George Mukhari is an academic hospital for students of the University of Limpopo (Medunsa Campus), with 1 550 beds and a staff complement of 3 029, serves patients from four provinces (Gauteng, Limpopo, Mpumalanga, North-West Province) and neighbouring states. The hospital has an outpatient paediatric ward that cannot handle high volumes. Overcrowding is a serious challenge, particularly for pregnant women and children. Working with the hospital management team and the Gauteng Provincial Department of Health, Adcock Ingram donated R400 000 to upgrade and increase the capacity of the outpatient paediatric ward to approximately 300 patients each day.
Beds of Hope Project – Universitas Academic Hospital (Free State) Amount donated: R2,25 millionConditions such as heart disease, cancer, cerebral palsy and muscular dystrophy are serious and life-threatening in adults. In children and babies, so much more is required in terms of care and treatment. The Department of Paediatrics and Child Health at the University of the Free State is the sole provider of this level of care in the central regions of South Africa and is responsible for treating more than one million children in the Free State, Northern Cape, North-West, Eastern Cape and Lesotho.
It is estimated that on average up to ten children are turned away every month due to a lack of ICU beds, while many newborn babies may die every
CSI Policy Framework
Flagship
Antiretroviral treatment
decentralisation
Improved Access Programme
Vulnerable groupsHIV/AIDS Programme
Rural & Informal Settlement project120 Ways to Add Value to Life
Ad-hoc project
Auxiliary
Discretionary
Other
Social andenvironmental
health
Primaryhealthcare
Health space Programmes

A d c o c k I n g r a m A n n u a l R e p o r t 2 0 1 0 4 9
year due to the unavailability of adequate facilities. Adcock Ingram donated R2,25 million towards Beds of Hope to increase neonatal ICU beds and upgrade old hospital equipment and technology. This has improved the healthcare environment for infants and children in need of specialised healthcare in the fields of oncology, cardiology, neurology, endocrinology, gastro-enterology, neonatology and infectious diseases. HIV/TB Clinic – Delft Hospital (Western Cape)Amount donated: R1,5 millionDelft Hospital in the Western Cape serves a rapidly growing population of over 520 000 people. Of the average 20 000 patients attending the clinic per month, 1 616 receive ARV treatment and this figure is increasing by 25 new cases monthly.
There has been no dedicated HIV/TB centre at the hospital. The ARV treatment of the patients is carried out in the maternity unit which means that women have to go to Tygerberg hospital to have their babies delivered, causing overcrowding of Tygerberg’s maternity unit.Adcock Ingram has invested in the building of a new clinic to facilitate the re-establishment of a dedicated maternity unit in Delft Hospital and create a world class clinic for the many ARV patients.
Healthcare and vulnerable groups programmeAction for the BlindAdcock Ingram has partnered with Action for the Blind and Disabled Children. Based in Gauteng this community-driven organisation is dedicated to IT training for blind and disabled young people, providing opportunities for employment.
ChildlineAdcock Ingram supports Childline which works to protect children from violence and to create a culture of children’s rights in South Africa. Programmes delivered through the provincial offices include crisis line, child rights; training of volunteers; training of other professionals who work in child protection and with children; therapy for abused and traumatised children and their families; court preparation for child witnesses; networking and coordination, and advocacy.
Groote Schuur Adcock Ingram has donated three new incubators to Groote Schuur Hospital’s Division of Neonatal Medicine for premature babies.
Chairman and CEO’s discretionary fundThe Chairman and CEO’s discretionary fund continued to support numerous worthy causes, including the 34th Annual Health Professionals Art Society exhibition for the ninth consecutive year; Sakhi Sizwe orphan care initiative; Netcare Nurses Trust, a cardiac mission to Mozambique; National Renal Care dialysis provider; Comrades Marathon, the SANBS Congress; and Operation Smile.
Benefi ciaries from our CSI projects
For more information on our various projects, please visit: www.adcock.com/Community_Celebrating120years
A d c o c k I n g r a m A n n u a l R e p o r t 2 0 1 05 0
Remuneration
Remuneration philosophy and policyWe recognise that we operate in a global environment and that performance depends on the quality of our people. Adcock Ingram wishes to provide a level of remuneration which attracts, retains and motivates employees of the highest calibre.
Key reward philosophies include:
• Alignment of performance conditions with the business strategy and maximisation of shareholder value;
• Equitable remuneration arrangements;• Integration of our total reward approach into people
management processes such as transformation, performance management, recognition, employee wellness and talent management;
• Setting of total rewards at levels that are relevant and competitive within the market;
• Fair and transparent behaviour; and• A focus on long-term sustained performance. General remunerationGeneral remuneration levels for the Group are determined by market surveys for the particular industry sector in which each subsidiary operates so as to maintain cost effective and competitive parity. These levels of basic remuneration are reviewed and revised annually.
Across the Group, employment positions are evaluated using recognised evaluation systems in order to ensure the remuneration of a job is aligned to the relative value as compared to other jobs. Salary scales are determined using a unified pay structure which identifies a minimum and maximum range for each position and are reviewed annually. Movement along the salary scale within a job grade is driven by individual performance.
Senior management remunerationThe executive and key employees’ remuneration is structured to include guaranteed remuneration, and short-term and long-term incentives to drive performance. It is guided by the principles of the King III report. The level of guaranteed remuneration aims to competitively attract high calibre leadership. The short-term incentive component rewards employees for achieving key performance targets as agreed upon at the start of each financial year. The long-term share incentive scheme is a retention mechanism for key employees only.
Remuneration consists of the following elements:
• Guaranteed remuneration The group has adopted a total remuneration
package (TRP) approach for salaried employees. The TRP is guaranteed and includes a travel allowance, retirement fund contributions and medical aid premiums. The guaranteed remuneration structure is reviewed in September of each year by the Remuneration Committee after receiving guidance from the human capital division regarding industry practice and market survey data.
• Annual incentive bonus An annual incentive bonus is paid if key
performance targets, including financial targets and transformation targets, are met.
All employees, excluding the bargaining units and sales staff, participate in the Group’s incentive bonus scheme. The bonus is contractual and is paid annually subject to the achievement of group and divisional targets combined with key performance indicators agreed to by the Chief Executive Officer and the Remuneration Committee.
• Cash-based phantom option scheme The Remuneration Committee recommends the
granting of share options in January of each year, for approval by the board of Adcock Ingram.
• Service contracts The Group policy is to employ each executive
director, senior manager and employees in critical positions under a service contract which is subject to a two months’ notice period. The contract provides for salary to be paid for any unexpired period of notice. All other employees are on a 30 day notice period.
• Deferred compensation plans There are no deferred compensation plans
applicable to senior management.
• Retention agreements As part of the Group’s strategy to retain highly
mobile and talented employees, the Group will selectively enter into agreements in terms of which retention payments are made. Retention payments have to be repaid should the individual concerned leave within a stipulated period. None of the executive directors are currently subject to a retention agreement.
Find out more
SHARE-BASED PAYMENT PLANS
(Page 120)
NON-EXECUTIVE
REMUNERATION (Page 143)
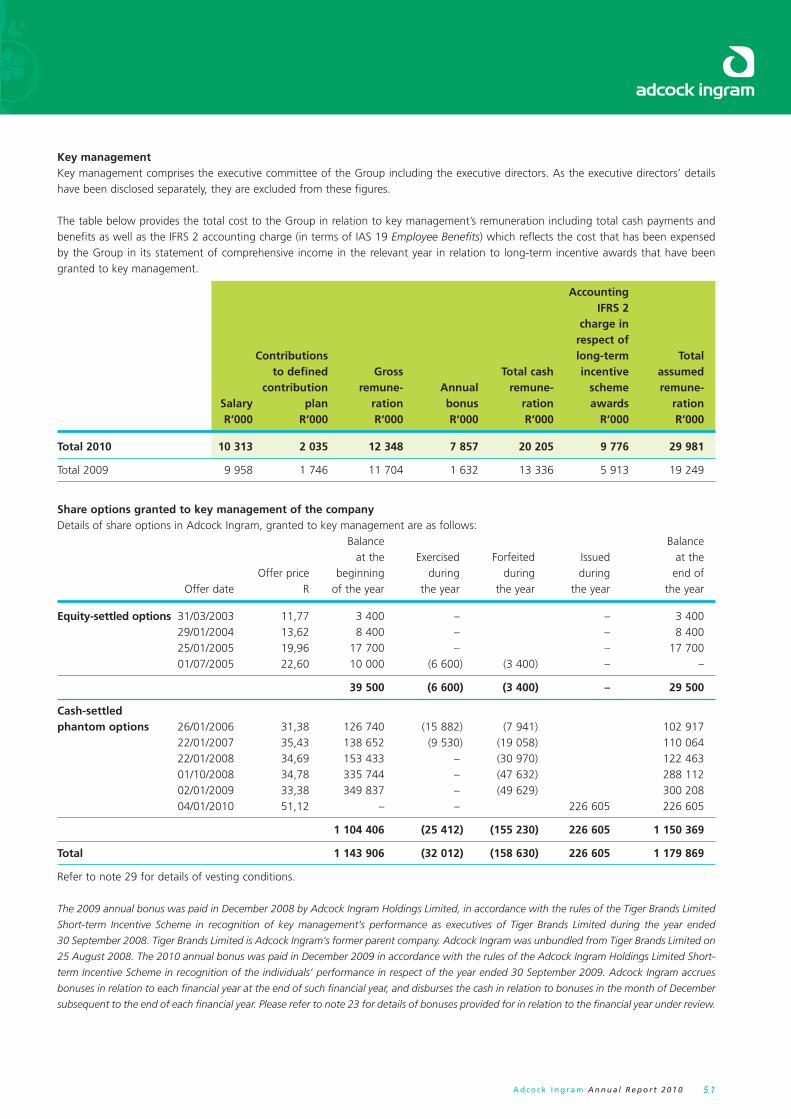
A d c o c k I n g r a m A n n u a l R e p o r t 2 0 1 0 5 1
Key managementKey management comprises the executive committee of the Group including the executive directors. As the executive directors’ details have been disclosed separately, they are excluded from these figures.
The table below provides the total cost to the Group in relation to key management’s remuneration including total cash payments and benefits as well as the IFRS 2 accounting charge (in terms of IAS 19 Employee Benefits) which reflects the cost that has been expensed by the Group in its statement of comprehensive income in the relevant year in relation to long-term incentive awards that have been granted to key management.
Accounting IFRS 2 charge in respect of Contributions long-term Total to defined Gross Total cash incentive assumed contribution remune- Annual remune- scheme remune- Salary plan ration bonus ration awards ration R‘000 R‘000 R‘000 R‘000 R‘000 R‘000 R‘000
Total 2010 10 313 2 035 12 348 7 857 20 205 9 776 29 981
Total 2009 9 958 1 746 11 704 1 632 13 336 5 913 19 249
Share options granted to key management of the companyDetails of share options in Adcock Ingram, granted to key management are as follows: Balance Balance at the Exercised Forfeited Issued at the Offer price beginning during during during end of Offer date R of the year the year the year the year the year
Equity-settled options 31/03/2003 11,77 3 400 – – 3 400 29/01/2004 13,62 8 400 – – 8 400 25/01/2005 19,96 17 700 – – 17 700 01/07/2005 22,60 10 000 (6 600) (3 400) – –
39 500 (6 600) (3 400) – 29 500
Cash-settled phantom options 26/01/2006 31,38 126 740 (15 882) (7 941) 102 917 22/01/2007 35,43 138 652 (9 530) (19 058) 110 064 22/01/2008 34,69 153 433 – (30 970) 122 463 01/10/2008 34,78 335 744 – (47 632) 288 112 02/01/2009 33,38 349 837 – (49 629) 300 208 04/01/2010 51,12 – – 226 605 226 605
1 104 406 (25 412) (155 230) 226 605 1 150 369
Total 1 143 906 (32 012) (158 630) 226 605 1 179 869
Refer to note 29 for details of vesting conditions.
The 2009 annual bonus was paid in December 2008 by Adcock Ingram Holdings Limited, in accordance with the rules of the Tiger Brands Limited
Short-term Incentive Scheme in recognition of key management’s performance as executives of Tiger Brands Limited during the year ended
30 September 2008. Tiger Brands Limited is Adcock Ingram’s former parent company. Adcock Ingram was unbundled from Tiger Brands Limited on
25 August 2008. The 2010 annual bonus was paid in December 2009 in accordance with the rules of the Adcock Ingram Holdings Limited Short-
term Incentive Scheme in recognition of the individuals’ performance in respect of the year ended 30 September 2009. Adcock Ingram accrues
bonuses in relation to each financial year at the end of such financial year, and disburses the cash in relation to bonuses in the month of December
subsequent to the end of each financial year. Please refer to note 23 for details of bonuses provided for in relation to the financial year under review.
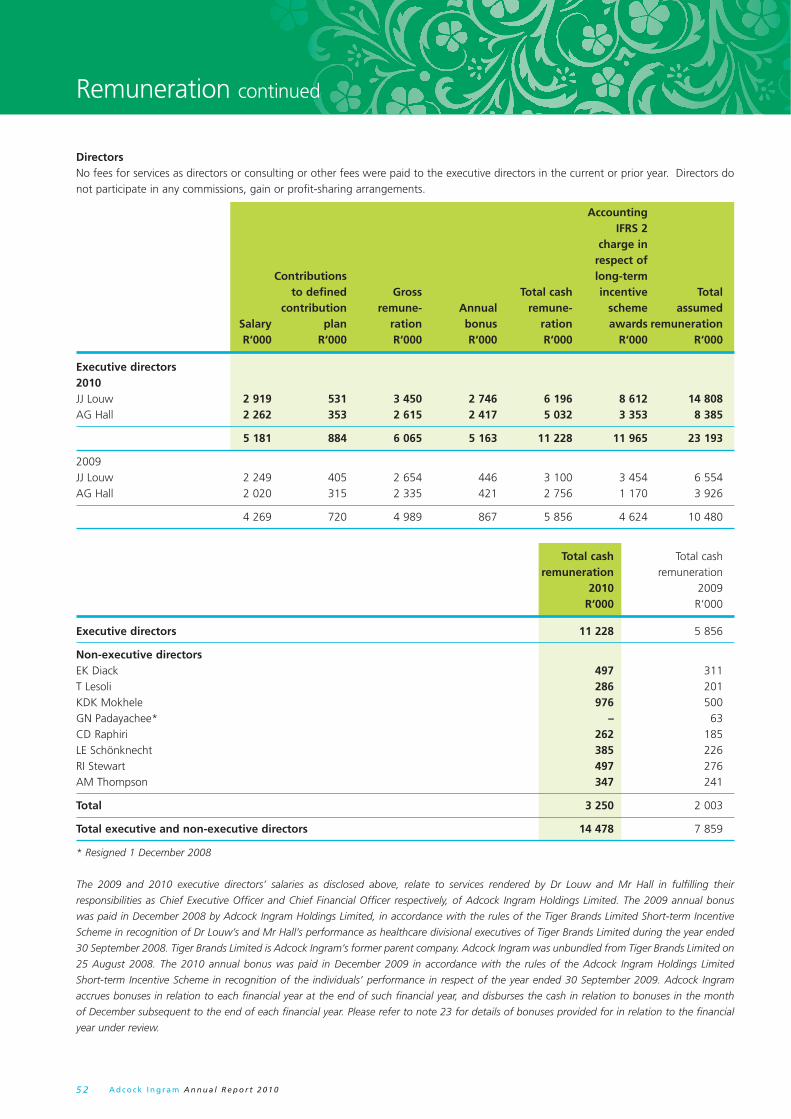
A d c o c k I n g r a m A n n u a l R e p o r t 2 0 1 05 2
Remuneration continued
DirectorsNo fees for services as directors or consulting or other fees were paid to the executive directors in the current or prior year. Directors do not participate in any commissions, gain or profit-sharing arrangements.
Accounting IFRS 2 charge in respect of Contributions long-term to defined Gross Total cash incentive Total contribution remune- Annual remune- scheme assumed Salary plan ration bonus ration awards remuneration R‘000 R‘000 R‘000 R‘000 R‘000 R‘000 R‘000
Executive directors2010 JJ Louw 2 919 531 3 450 2 746 6 196 8 612 14 808 AG Hall 2 262 353 2 615 2 417 5 032 3 353 8 385
5 181 884 6 065 5 163 11 228 11 965 23 193
2009JJ Louw 2 249 405 2 654 446 3 100 3 454 6 554 AG Hall 2 020 315 2 335 421 2 756 1 170 3 926
4 269 720 4 989 867 5 856 4 624 10 480
Total cash Total cash remuneration remuneration 2010 2009 R‘000 R‘000
Executive directors 11 228 5 856
Non-executive directorsEK Diack 497 311 T Lesoli 286 201 KDK Mokhele 976 500GN Padayachee* – 63CD Raphiri 262 185LE Schönknecht 385 226RI Stewart 497 276AM Thompson 347 241
Total 3 250 2 003
Total executive and non-executive directors 14 478 7 859
* Resigned 1 December 2008
The 2009 and 2010 executive directors’ salaries as disclosed above, relate to services rendered by Dr Louw and Mr Hall in fulfilling their
responsibilities as Chief Executive Officer and Chief Financial Officer respectively, of Adcock Ingram Holdings Limited. The 2009 annual bonus
was paid in December 2008 by Adcock Ingram Holdings Limited, in accordance with the rules of the Tiger Brands Limited Short-term Incentive
Scheme in recognition of Dr Louw’s and Mr Hall’s performance as healthcare divisional executives of Tiger Brands Limited during the year ended
30 September 2008. Tiger Brands Limited is Adcock Ingram’s former parent company. Adcock Ingram was unbundled from Tiger Brands Limited on
25 August 2008. The 2010 annual bonus was paid in December 2009 in accordance with the rules of the Adcock Ingram Holdings Limited
Short-term Incentive Scheme in recognition of the individuals’ performance in respect of the year ended 30 September 2009. Adcock Ingram
accrues bonuses in relation to each financial year at the end of such financial year, and disburses the cash in relation to bonuses in the month
of December subsequent to the end of each financial year. Please refer to note 23 for details of bonuses provided for in relation to the financial
year under review.

A d c o c k I n g r a m A n n u a l R e p o r t 2 0 1 0 5 3
Share options granted to directors of the companyDetails of share options in Adcock Ingram granted to executive directors are as follows:
Balance Balance at the Exercised Issued at the Offer price beginning during during end of Offer date R of the year the year the year the year
JJ LouwEquity-settled options 01/09/2001 10,47 33 – – 33 29/01/2004 13,62 7 700 – – 7 700 25/01/2005 19,96 11 400 – – 11 400
19 133 – – 19 133
Cash-settled phantom options 26/01/2006 31,38 64 323 – 64 323 22/01/2007 35,43 70 994 – 70 994 22/01/2008 34,69 77 188 – 77 188 01/04/2008 28,27 94 817 – 94 817 01/10/2008 34,78 152 599 – 152 599 02/01/2009 33,38 158 999 – 158 999 04/01/2010 51,21 – – 134 969 134 969
618 920 – 134 969 753 889
Total 638 053 – 134 969 773 022
AG HallCash-settled phantom options 22/01/2008 34,69 48 600 – 48 600 01/10/2008 34,78 100 714 – 100 714 02/01/2009 33,38 104 938 – 104 938 04/01/2010 51,21 – – 76 744 76 744
Total 254 252 – 76 744 330 996
Refer to note 29 for details of vesting conditions.
Non-executive directors’ remunerationThe level of fees paid to non-executive directors is reviewed by the Remuneration Committee on an annual basis.
The recommendations are submitted to the Adcock Ingram board for consideration and the fees are proposed at the annual general meeting in January of each year. Various market surveys are utilised to determine the remuneration levels and reference is made to the fees paid by comparable listed companies as well as years of experience of each director.
Non-executive directors do not participate in the Group’s incentive bonus plan or phantom share option scheme.
There were no direct beneficial holdings in shares of Adcock Ingram in the current or prior year by any non-executive director.

A d c o c k I n g r a m A n n u a l R e p o r t 2 0 1 05 4
Stakeholder engagement
When reporting to stakeholders, the board of directors recognises its duty to present a balanced and understandable assessment of the Group’s position. A policy of proactive communication is in place. This aims to deliver applicable information on material matters of significant interest to all stakeholders.
Key stakeholders include investors and analysts, customers, media, industry groups and staff.
Investors and analysts Adcock Ingram has a proactive stakeholder communication approach in place, with the Group recognising its duty to present timely, balanced and understandable assessments of the Group’s performance and position to shareholders, other stakeholders and the financial and investor community. We work to ensure that our communications to our stakeholder community are prompt, relevant, transparent and accurate. Information is disseminated in the form of investor road shows, presentations, official announcements through the media and regular one-on-one briefing sessions. We have a dedicated investor relations portal on our corporate website where our investor community and other stakeholders can interact with the Group more regularly on financial reports, financial indicators, SENS announcements, and media reports.
Shareholders’ diaryFinancial year-end September 30, 2010Annual General Meeting January 27, 2011
Dividends
Interim dividend Cents per share 78
Paid May 25, 2010
Final dividend Cents per share 102
Date declaredNovember 22, 2010
PayableJanuary 17, 2011
CustomersThe lifetime value of our customer base is a measure of the value of the customer to our business. To enhance this value, we have initiated platforms where the Group is able to interact directly with its customers through our well established Healthcare Summits for General Practitioners and recently initiated for Pharmacists that have proved to be hugely popular events, as well as our annual OTC Academy, the much-anticipated training programme for pharmacy assistants across the country.
Media Adcock Ingram has enjoyed significant and increased positive media coverage since its re-listing on the JSE in August 2008, as measured by the Media Perception Index (MPI) (see graph on page 55). Various milestones, as well as a healthy financial reputation due to consistently strong annual financial results, continue to drive strong media index gains.
Positive sentiment stemming from the Group’s Broad-based Black Economic Empowerment (B-BBEE) deal during 2009 lifted the media index substantially.
Various corporate social investments have helped to sustain the favourable coverage that the Group receives. This includes a partnership with The Smile Foundation to provide 20 children with surgery that will remedy cleft lip and palate anomalies, a donation of R100 000 into a children’s centre in Khayelitsha for renovation work, and R1,5 million sponsorship of the renovation of a new ARV Clinic at the Delft Community Health Centre.
As Adcock Ingram celebrated its 120th anniversary this year, it launched the ‘120 Ways to Add Value to Life’ programme where Group employees identified 120 deserving community programmes that would receive Adcock Ingram’s support.
A total of 921 media items were analysed for Adcock Ingram during the October 2009 to September 2010 analysis period. Favourable media coverage amounted to 43% while the Group received 4% unfavourable media coverage. Statement of Fact media items dominated Adcock Ingram’s coverage during this analysis period. Adcock Ingram received a Reputation Grade of 70% while the Average Grade was calculated at 59%.
Industry groups Adcock Ingram participates in key industry bodies through which it helps guide regulation and positively influences the development of legislation affecting the pharmaceuticals sector. Our Chief Executive Officer, Dr Jonathan Louw served as the President of the Pharmaceutical Industry Association of South Africa for the year under review and will now serve the Association as Deputy President in 2010/2011.
EmployeesAdcock Ingram is not just in the business of caring for people through its range of products and services; it also deeply involves itself in the welfare

A d c o c k I n g r a m A n n u a l R e p o r t 2 0 1 0 5 5
Adcock Ingram Media Perception Index
Dates highlighted refer to specific media reports
-1 000
0
1 000
2 000
3 000
4 000
5 000
Inde
x po
ints
6 000
5Aug
08
25Sep
08
15Nov
08
5Jan09
25Feb09
17Apr
09
7Jun09
28Jul09
17Sep
09
7Nov
09
28Dec
09
17Feb10
9Apr
10
30May
10
20Jul10
9Sep
10
30Oct10
of its employees. Adcock Ingram owes its continuing
successes to its top-class employees, many of
whom were developed through Group training
and development initiatives. Excellent performers
are attracted and retained through incentives and
an inspiring corporate culture. These incentives
include options, remuneration, career development,
just employment practices and employee wellness.
Adcock Ingram stands for a sense of PRIDE: passion,
respect, innovation, development and execution.
Adcock Ingram’s human capital team regularly
conducts ‘health check interviews’ to determine and assess employee push-and-pull factors. These interviews include exit interviews, post-placement interviews and retention discussions. A satisfied and continually upskilling workforce enables Adcock Ingram to be an output-driven organisation. Employee productivity is monitored through a robust performance management system that involves goal setting, and reviewing each quarter. Employees are appraised regularly against their individual goals and constructive feedback is given to aid future performance.
A happy benefi ciary of the Adcock Ingram Easter Campaign
An Adcock Ingram employee touches the live of a newly born at the George Mkhari Hospital in Ga-Rankuwa.

A d c o c k I n g r a m A n n u a l R e p o r t 2 0 1 05 6
Environmental
2010 highlightsAlthough a number of environmentally conscious initiatives have been implemented over the past few years, 2010 was the year that Adcock Ingram embarked on the beginning of a formalised environmental programme that will allow the Group to be able to report on a range of environmental issues and be in a position to set targets for the improvement of our energy consumption and carbon footprint.
Carbon Disclosure ProjectAdcock Ingram participated, for the first time, in the Carbon Disclosure Project (CDP). The CDP disclosures were developed for Adcock Ingram by the Global Carbon Exchange (GCX) auditing team for the period October 2008 to September 2009 for its South African operations. The focus was mainly on Scope 1 (mobile and stationary fuel) and Scope 2 (electricity) emissions although some Scope 3 (business travel and water) emissions have also been included.
ObjectivesThe following objectives were set out in undertaking this initial carbon footprint assessment:• To be able to respond to the Carbon Disclosure
Project 2010 for Scope 1 and 2, as well as limited Scope 3 emissions;
• To better understand the process as a precursor to embarking on a full carbon footprint assessment for the entire Group; and
• To introduce carbon management into Adcock Ingram’s way of operating and begin to shape the response to the threats and opportunities posed by a carbon-constrained world.
FindingsOnly the South African operations were assessed. For the period October 2008 to September 2009, Adcock Ingram was found to have a carbon footprint of 41 711.10 tonnes of carbon dioxide equivalent (CO2e).
Scope 1 emissions measured included combustion of fuels such as diesel, petrol, LPG, natural gas and coal. Fugitive emissions (coolant gas refills) were omitted, as these were not recorded in the year. Scope 1 made up 30% of total emissions and accounted for 12 615,86 tonnes of CO2e.
Electricity demand (Scope 2) was on average 2 194 990 kWh per month resulting in 27 130,08 tonnes of CO2e annually. Scope 2 emissions formed a significant part of the overall carbon footprint, accounting for 65% of total emissions.
The Scope 3 sources measured accounted for only 5% (1 965,16 tonnes of CO2e) of total emissions. It is important to note that a full Scope 3 assessment was not undertaken.
The following graph summarises the main findings.
Total emissions from Adcock Ingram (October 2008 to September 2009)
ConclusionAdcock Ingram provided both Scope 1 and 2 emissions with limited Scope 3 as it was the first time that the Group participated in the CDP programme. AICC contributes nearly 60% of the total emissions, with AIHC making up most of the remaining emissions. TSG has a relatively small contribution at close to 3%.
The futureAdcock Ingram has compiled all the information required to measure its carbon footprint for the 2010 financial year. This information, together with the CDP submission, will allow us to benchmark consumption of energy and water against other pharmaceutical companies and other industries, and measure levels of emission of carbon dioxide and other relevant gases. A formal plan improving our environmental performance will be developed, progress measured and additional remedial actions taken as required.
The commitment to a formalised environmental programme has been championed by the CEO and the responsibility for this programme has been assigned to senior executives within the supply chain and financial functions. Regular reports will be provided at executive, Risk and Sustainability Committee and board meetings. Progress will be measured against defined targets.
Several new manufacturing projects have been undertaken during 2010 and will continue into 2012. Inherent in each of these projects is a commitment to implement and utilise environmentally friendly initiatives in order to continue on the path to becoming a more environmentally aware and compliant organisation. Some of the initiatives that have been considered include the use of low energy lighting; use of borehole water to supplement or replace municipal water usage; reuse of packaging materials and recycling of waste.
65%
3%
2%
30%
Carbon footprint total: 41 711.10 tonnes CO2e
Water (Embedded CO2)
Business travel
Mobile and stationary fuels
Electricity

A d c o c k I n g r a m A n n u a l R e p o r t 2 0 1 0 5 7
A number of initiatives introduced during 2008 and 2009 have produced encouraging results and measures are already in place to ensure that savings can be accurately recorded against future targets. Following the completion of our carbon footprint, we will be able to set realistic and meaningful targets for the reduction of energy usage and emissions of carbon dioxide for the 2011 financial year. Active programmes will be implemented utilising the power of our employees to achieve the targets set. This will include reductions in energy and fuel utilised both by the Group at its various sites as well as by our employees in their personal capacities.
Scope and methodologyIt is intended that Adcock Ingram’s environmental reporting scope will follow an equity share approach and will therefore account for environmental impacts from all operations, even where Adcock Ingram has little or no control over operating policies.
Adcock Ingram will be guided by recognised best practice in terms of reporting and compliance with recognised industry organisations such as internal and external environmental audits, moving towards following ISO 14001 standards which monitor aspects such as water and air pollution, waste reduction and hazardous chemicals.
Achievement of environmental objectives and targetsGroup and business unit environmental objectives and targets will be set each year in line with the Group environmental policy and targets set by the Environmental Committee that will report to the Executive Committee and will be given the responsibility of driving environmental responsibility across the Group. It is anticipated that this committee will comprise senior executives of the
Group and will receive a mandate from the board to implement a policy range of environmental reforms across the Group.
These objectives and targets will be tracked and monitored as part of the external audit. Progress made in achieving these objectives and targets will be reported on annually as well as through the external audits that are undertaken. In addition to the establishment of targets for the Group operations, it is equally important for Adcock Ingram to promote a level of environmental awareness and responsibility among employees and suppliers.
Environmental information management and reporting2010 has been the first year that information on environmental reporting has been provided and through the participation in the CDP and the measurement of our carbon footprint, processes have been put in place so that the required information will be automatically generated for future submissions and for internal management reporting requirements. In addition, we will be able to report more comprehensively on subsidiaries or foreign entities, who were not fully able to provide the level of information reported on by the Group companies in the current period.
A summary breakdown of each business operation’s contribution to total emissions is given in the table below. The table shows the contributions from:• Adcock Ingram Critical Care (AICC)• Adcock Ingram Healthcare (AIHC) (i.e.
Pharmaceutical segment)• The Scientific Group (TSG)
Adcock Ingram Emissions and Intensity Overview
Type SourceAICC
59,6% AIHC
37,5% TSG2,9%
Total100%
Tonnes CO2e per
employee (*)
Tonnes CO2e per R’million turnover
(**)
Tonnes CO2e per m2 (***)
Scope 1 Mobile and stationary fuels 8 938,51 3 106,60 570,75 12 615,86 6,15 3,15 0,13
Scope 2 Electricity 15 146,05 11 346,47 637,56 27 130,08 13,23 6,77 0,27
Sub-total – Scope 1 and 2 only 24 084,56 14 453,07 1 208,32 39 745,94 19,38 9,92 0,40
Scope 3Business travel 287,03 1 093,75 11,76 1 392,54
Water (Embedded CO2) 467,53 105,09 0,00 572,62
Total 24 839,12 15 651,91 1 220,07 41 711,10
* Based on 2 051 full-time equivalent employees.
** Adcock Ingram had R4 billion turnover in 2008/2009 reporting year.
*** Adcock Ingram’s floor space is 99 858 m2.

A d c o c k I n g r a m A n n u a l R e p o r t 2 0 1 05 8
Risk Management
The Risk and Sustainability Committee of the board oversees the risk of the Group. The roles and responsibilities of the committee are guided by King III and COSO. Risks are identified and prioritised according to the restrictions they have on the business achieving its business objectives.
The Risk and Sustainability Committee reviews the Group’s risk on a quarterly basis and the Executive Committee reviews them more frequently. The schedule of top risks, their possible impact on the business, probability of occurrence and certain risk mitigation strategies in place are tabulated below.
Commercial
RiskImpact on the business
Probability of occurrence Management or control
Product portfolio and portfolio managementTo ensure sustainability, Adcock Ingram needs to invest in a productive and innovative new pipeline through in-house development, partnering and acquisitions. In addition, licensors and agencies account for a significant portion of revenue.
High High Adcock Ingram continues to source pipeline from and pursue collaborations with multinationals. The recent MSD co-promotion and distribution agreements concluded for South Africa and Ghana are evidence of achievements in 2010.
Agreements have been signed in 2010 with Lilly for some of its non-core products, with Novartis for Elidel, and with Norgine to extend Adcock Ingram’s influence in Southern Africa.
An agreement with Roche for two large products was signed after year-end.
The Group has a significant portion of ageing formulations.
Adcock Ingram continues to invest in new brands which are housed under the Adcock Ingram umbrella.
The expansion into Africa via the Kenyan and Ghanaian subsidiaries increases our footprint.
The OTC business continues extensions to the Unique Formulations and TLC ranges.
Ongoing focus is placed on identifying and assessing international acquisition opportunities.
Innovation remains one of our core values and new product development is a critical outcome for our R&D facilities.
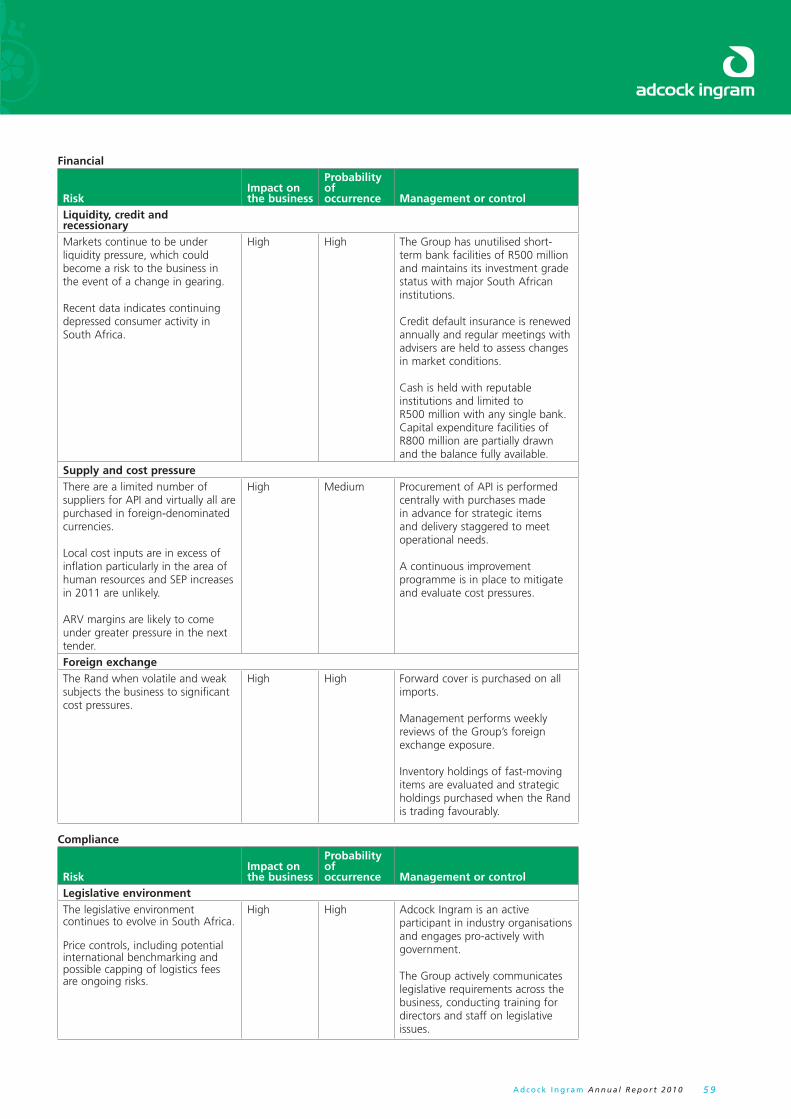
A d c o c k I n g r a m A n n u a l R e p o r t 2 0 1 0 5 9
Financial
RiskImpact on the business
Probability of occurrence Management or control
Liquidity, credit and recessionaryMarkets continue to be under liquidity pressure, which could become a risk to the business in the event of a change in gearing.
Recent data indicates continuing depressed consumer activity in South Africa.
High High The Group has unutilised short-term bank facilities of R500 million and maintains its investment grade status with major South African institutions.
Credit default insurance is renewed annually and regular meetings with advisers are held to assess changes in market conditions.
Cash is held with reputable institutions and limited to R500 million with any single bank.Capital expenditure facilities of R800 million are partially drawn and the balance fully available.
Supply and cost pressureThere are a limited number of suppliers for API and virtually all are purchased in foreign-denominated currencies.
Local cost inputs are in excess of inflation particularly in the area of human resources and SEP increases in 2011 are unlikely.
ARV margins are likely to come under greater pressure in the next tender.
High Medium Procurement of API is performed centrally with purchases made in advance for strategic items and delivery staggered to meet operational needs.
A continuous improvement programme is in place to mitigate and evaluate cost pressures.
Foreign exchangeThe Rand when volatile and weak subjects the business to significant cost pressures.
High High Forward cover is purchased on all imports.
Management performs weekly reviews of the Group’s foreign exchange exposure.
Inventory holdings of fast-moving items are evaluated and strategic holdings purchased when the Rand is trading favourably.
Compliance
RiskImpact on the business
Probability of occurrence Management or control
Legislative environmentThe legislative environment continues to evolve in South Africa.
Price controls, including potential international benchmarking and possible capping of logistics fees are ongoing risks.
High High Adcock Ingram is an active participant in industry organisations and engages pro-actively with government.
The Group actively communicates legislative requirements across the business, conducting training for directors and staff on legislative issues.

A d c o c k I n g r a m A n n u a l R e p o r t 2 0 1 06 0
Risk Management continued
Sustainability
RiskImpact on the business
Probability of occurrence Management or control
Manufacturing demandPressures associated with factory upgrades give rise to risks in the manufacturing environment.
High High Stock holding is built around upgrade activities.
Rigorous quality assurance standards are imposed.
Safety and securityCriminal activity involves monetary risk and the safety of employees and products.
Low Medium A dedicated internal head of safety and security has been appointed. Security systems have been installed across all operations and monitored from a central location.
An independently operated fraud hotline has been established.
The manufacturing of certain products containing codeine and ephedrine has been relocated offshore.
Competing for talentA skills shortage is evident in the manufacturing, regulatory, finance, information technology, sales and marketing functions, exacerbated by the drive to employ suitably qualified employment equity candidates.
Medium Medium Retention strategies have been implemented and an executive development programme has been completed by senior managers.
Mentorship and comprehensive wellness programmes have been implemented for all staff.
A graduate development programme has been implemented to fast-track and enhance management talent.
Pace of transformationPressure to do business with transformed companies is increasing in both the public and private sectors.
Medium Low Adcock Ingram’s BEE equity transaction was implemented in April 2010, whereby the Group obtained Level 4 BEE status.
The Transformation Committee of the board monitors all elements of the scorecard on a quarterly basis.
Medicine regulatoryThe pharmaceutical industry remains a highly regulated environment and Adcock Ingram must adhere to all relevant regulatory and quality standards.
High High All facilities are being upgraded or built to PIC/S standards and the Indian facility has been approved by SA, Australian and UK authorities.
Rigorous quality assurance standards are applied.
All outsourced manufacture not produced by internationally-accredited facilities is being transferred into Adcock Ingram’s facilities.

A d c o c k I n g r a m A n n u a l R e p o r t 2 0 1 0 6 1A d c o c k I n g r a m n n a l R e p o r t 2 0 1 0 6A c o c k I n g r a A n u a l e p o r tt 2 0 1 1
Contents
62 • Directors’ responsibility for and approval of the annual fi nancial statements
62 • Certifi cate by Company Secretary
63 • Audit Committee report
65 • Report of the independent auditors
66 • Directors’ report
68 • Segment report
70 • Accounting policies
88 • Consolidated statements of comprehensive income
89 • Consolidated statements of changes in equity
90 • Consolidated statements of fi nancial position
91 • Consolidated statements of cash fl ows
92 • Notes to the group annual fi nancial statements
125 • Company statements of comprehensive income
126 • Company statements of changes in equity
127 • Company statements of fi nancial position
128 • Company statement of cash fl ows
129 • Notes to the company annual fi nancial statements
135 • Annexure A – interest in subsidiary companies, joint ventures and associates
Shareholder information
136 • Shareholder analysis
140 • Notice of Annual General Meeting
143 • Annual General Meeting – explanatory notes
144 • Glossary
Form of proxy – Attached
Annual fi nancial statements

A d c o c k I n g r a m A n n u a l R e p o r t 2 0 1 06 2
Directors’ responsibility for and approval of the annual fi nancial statements
In terms of the South African Companies Act, 1973, as amended, the directors are required to prepare annual financial statements that fairly present the state of affairs and business of the Company and of the Group at the end of the financial year and of the profit for the year then ended.
The directors of Adcock Ingram Holdings Limited are responsible for the integrity of the annual financial statements of the Company and consolidated subsidiaries and the objectivity of other information presented in the annual report.
The fulfilment of this responsibility is discharged through the establishment and maintenance of sound management and accounting systems, the maintenance of an organisational structure which provides for the delegation of authority and clear established responsibility, together with the constant communication and review of operational performance measured against approved plans and budgets.
Management and employees operate in terms of a code of ethics approved by the board of directors. The code requires compliance with all applicable laws and maintenance of the highest levels of integrity in the conduct of all aspects of the business.
The annual financial statements, prepared in terms of International Financial Reporting Standards and the Companies Act, are examined by our auditors in conformity with International Standards of Auditing.
An audit committee of the board of directors, composed entirely of independent non-executive directors, meets regularly with our auditors and management to discuss internal accounting controls, auditing and financial reporting matters. The auditors have unrestricted access to the Audit Committee.
The annual financial statements for the year ended 30 September 2010, which appear on pages 66 to 135, which are in agreement with the books of account at that date, and the related Group annual financial statements, were approved by the board of directors on 22 November 2010 and signed on its behalf by:
KDK Mokhele JJ LouwChairman Chief Executive Officer
22 November 2010
Certifi cate by Company Secretary
I certify that the Company has lodged with the Registrar of Companies all such returns as are required of a public company in terms of section 268G(d) of the Companies Act, 1973, and that all such returns are true, correct and up to date.
NE SimelaneActing Company Secretary
22 November 2010
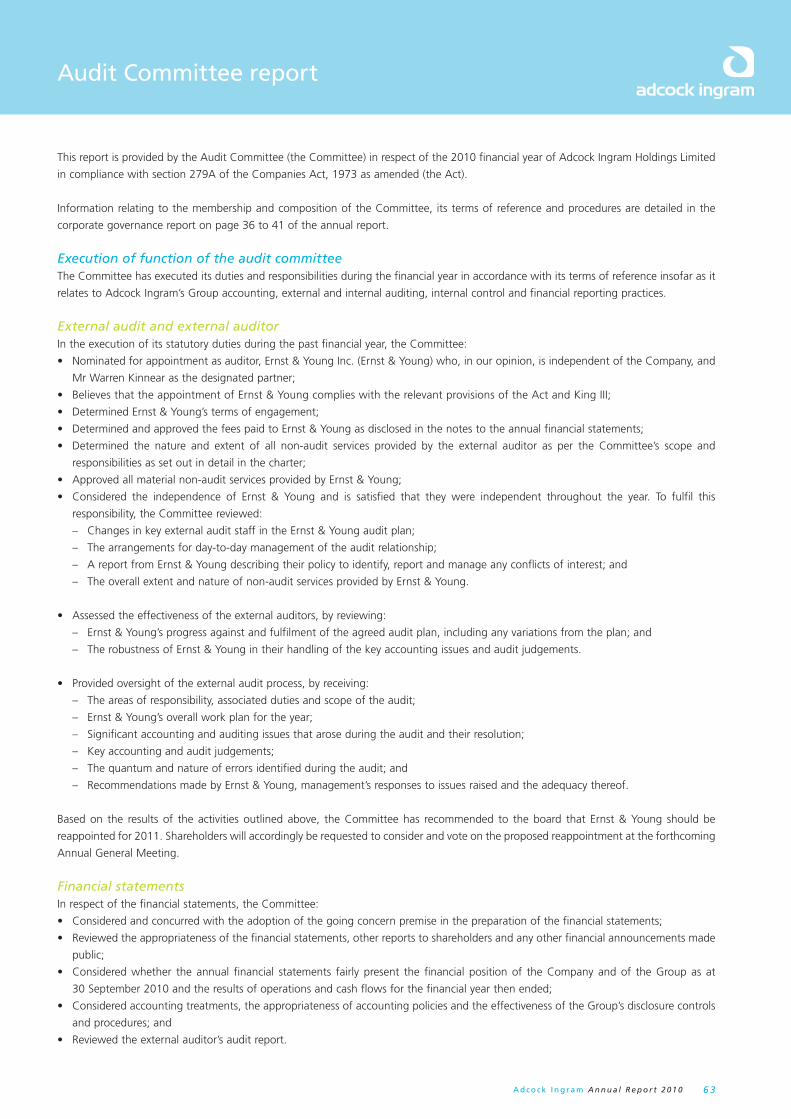
A d c o c k I n g r a m A n n u a l R e p o r t 2 0 1 0 6 3
Audit Committee report
This report is provided by the Audit Committee (the Committee) in respect of the 2010 financial year of Adcock Ingram Holdings Limited
in compliance with section 279A of the Companies Act, 1973 as amended (the Act).
Information relating to the membership and composition of the Committee, its terms of reference and procedures are detailed in the
corporate governance report on page 36 to 41 of the annual report.
Execution of function of the audit committeeThe Committee has executed its duties and responsibilities during the financial year in accordance with its terms of reference insofar as it
relates to Adcock Ingram’s Group accounting, external and internal auditing, internal control and financial reporting practices.
External audit and external auditorIn the execution of its statutory duties during the past financial year, the Committee:
• Nominated for appointment as auditor, Ernst & Young Inc. (Ernst & Young) who, in our opinion, is independent of the Company, and
Mr Warren Kinnear as the designated partner;
• Believes that the appointment of Ernst & Young complies with the relevant provisions of the Act and King III;
• Determined Ernst & Young’s terms of engagement;
• Determined and approved the fees paid to Ernst & Young as disclosed in the notes to the annual financial statements;
• Determined the nature and extent of all non-audit services provided by the external auditor as per the Committee’s scope and
responsibilities as set out in detail in the charter;
• Approved all material non-audit services provided by Ernst & Young;
• Considered the independence of Ernst & Young and is satisfied that they were independent throughout the year. To fulfil this
responsibility, the Committee reviewed:
– Changes in key external audit staff in the Ernst & Young audit plan;
– The arrangements for day-to-day management of the audit relationship;
– A report from Ernst & Young describing their policy to identify, report and manage any conflicts of interest; and
– The overall extent and nature of non-audit services provided by Ernst & Young.
• Assessed the effectiveness of the external auditors, by reviewing:
– Ernst & Young’s progress against and fulfilment of the agreed audit plan, including any variations from the plan; and
– The robustness of Ernst & Young in their handling of the key accounting issues and audit judgements.
• Provided oversight of the external audit process, by receiving:
– The areas of responsibility, associated duties and scope of the audit;
– Ernst & Young’s overall work plan for the year;
– Significant accounting and auditing issues that arose during the audit and their resolution;
– Key accounting and audit judgements;
– The quantum and nature of errors identified during the audit; and
– Recommendations made by Ernst & Young, management’s responses to issues raised and the adequacy thereof.
Based on the results of the activities outlined above, the Committee has recommended to the board that Ernst & Young should be
reappointed for 2011. Shareholders will accordingly be requested to consider and vote on the proposed reappointment at the forthcoming
Annual General Meeting.
Financial statementsIn respect of the financial statements, the Committee:
• Considered and concurred with the adoption of the going concern premise in the preparation of the financial statements;
• Reviewed the appropriateness of the financial statements, other reports to shareholders and any other financial announcements made
public;
• Considered whether the annual financial statements fairly present the financial position of the Company and of the Group as at
30 September 2010 and the results of operations and cash flows for the financial year then ended;
• Considered accounting treatments, the appropriateness of accounting policies and the effectiveness of the Group’s disclosure controls
and procedures; and
• Reviewed the external auditor’s audit report.

A d c o c k I n g r a m A n n u a l R e p o r t 2 0 1 06 4
Internal financial controls and internal auditThe Committee has:
• Evaluated the independence, effectiveness and performance of KPMG Services (KPMG), the outsourced internal audit function, and
compliance with its mandate;
• Reviewed the effectiveness of the Group’s system of internal financial control including receiving assurance from management, internal
audit and external audit;
• Reviewed significant issues raised by the internal audit process and the adequacy of the corrective action in response to significant
internal audit findings;
• Reviewed policies and procedures for preventing and detecting fraud; and
• Assessed the nature and quantum of material frauds detected by the Group.
Based on the processes outlined above and the assessments obtained from management and KPMG, the Committee believes that the
internal financial controls are effective and that there were no material breakdowns in internal controls.
Financial functionThe Committee has assessed the competence of Mr Andy Hall, the Chief Financial Officer, and believes that he possesses the appropriate
expertise and experience to meet his responsibilities in the position as required by the JSE. Our assessment included making enquiries with
the Chief Executive Officer, the independent non-executive directors, Ernst & Young and KPMG.
The Committee is satisfied that the financial function of the Group incorporates the necessary expertise, resources and experience to
adequately carry out its obligations.
ComplianceThe Committee in consultation with the Risk Committee and the Company Secretary, has considered the effectiveness of the system for
monitoring compliance with laws and regulations and for finding and investigating instances of non-compliances and is satisfied with
the effectiveness thereof.
Following our review of the annual financial statements for the year ended 30 September 2010, we are of the opinion that, in all
material respects, they comply with the relevant provisions of the Act and International Financial Reporting Standards, and present the
results of operations, cash flows and the financial position of the Company and the Group. The Committee therefore recommends
the consolidated and separate annual financial statements of Adcock Ingram Holdings Limited for approval to the board of directors.
Shareholders will accordingly be requested to consider and adopt the annual financial statements at the forthcoming Annual
General Meeting.
On behalf of the Committee
EK DiackChairman
Audit Committee report continued
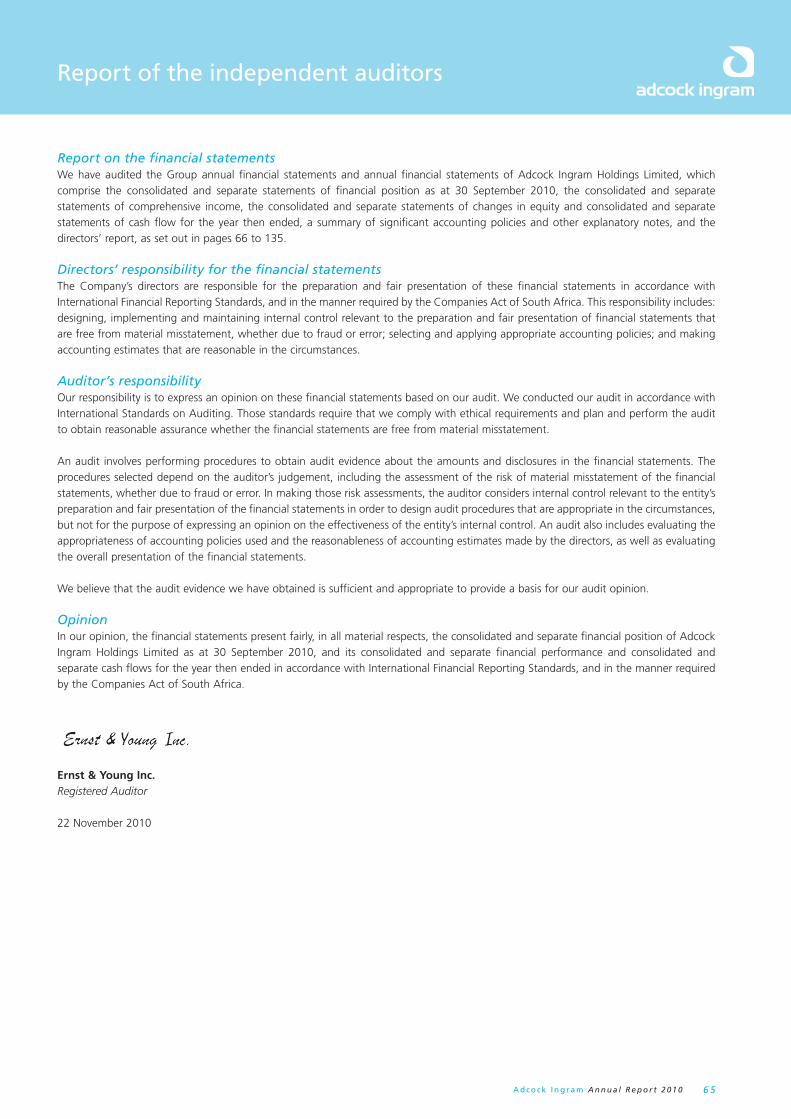
A d c o c k I n g r a m A n n u a l R e p o r t 2 0 1 0 6 5
Report of the independent auditors
Report on the financial statementsWe have audited the Group annual financial statements and annual financial statements of Adcock Ingram Holdings Limited, which comprise the consolidated and separate statements of financial position as at 30 September 2010, the consolidated and separate statements of comprehensive income, the consolidated and separate statements of changes in equity and consolidated and separate statements of cash flow for the year then ended, a summary of significant accounting policies and other explanatory notes, and the directors’ report, as set out in pages 66 to 135.
Directors’ responsibility for the financial statements The Company’s directors are responsible for the preparation and fair presentation of these financial statements in accordance with International Financial Reporting Standards, and in the manner required by the Companies Act of South Africa. This responsibility includes: designing, implementing and maintaining internal control relevant to the preparation and fair presentation of financial statements that are free from material misstatement, whether due to fraud or error; selecting and applying appropriate accounting policies; and making accounting estimates that are reasonable in the circumstances.
Auditor’s responsibility Our responsibility is to express an opinion on these financial statements based on our audit. We conducted our audit in accordance with International Standards on Auditing. Those standards require that we comply with ethical requirements and plan and perform the audit to obtain reasonable assurance whether the financial statements are free from material misstatement.
An audit involves performing procedures to obtain audit evidence about the amounts and disclosures in the financial statements. The procedures selected depend on the auditor’s judgement, including the assessment of the risk of material misstatement of the financial statements, whether due to fraud or error. In making those risk assessments, the auditor considers internal control relevant to the entity’s preparation and fair presentation of the financial statements in order to design audit procedures that are appropriate in the circumstances, but not for the purpose of expressing an opinion on the effectiveness of the entity’s internal control. An audit also includes evaluating the appropriateness of accounting policies used and the reasonableness of accounting estimates made by the directors, as well as evaluating the overall presentation of the financial statements.
We believe that the audit evidence we have obtained is sufficient and appropriate to provide a basis for our audit opinion.
Opinion In our opinion, the financial statements present fairly, in all material respects, the consolidated and separate financial position of Adcock Ingram Holdings Limited as at 30 September 2010, and its consolidated and separate financial performance and consolidated and separate cash flows for the year then ended in accordance with International Financial Reporting Standards, and in the manner required by the Companies Act of South Africa.
Ernst & Young Inc.Registered Auditor
22 November 2010

A d c o c k I n g r a m A n n u a l R e p o r t 2 0 1 06 6
Directors’ report
The directors have pleasure in submitting their report to shareholders, together with the audited annual financial statement for the year ended 30 September 2010.
Principal activities and business reviewThe Adcock Group is a leading South African healthcare group, operating two principal divisions, a pharmaceutical division selling a range of prescription and OTC products, and a hospital products and services division.
The Companies Act requires that the Company produce a fair review of the business of the Group including a description of the major risks, its development and performance during the year and the position of the Group at the end of the financial year. These are set out in the business commentaries on pages 26 to 33 of the annual report. Other key performance indicators and information relating to sustainability are set out on pages 34 to 60 of the annual report.
Acquisitions during the yearDuring the past year, the Group acquired the following businesses as detailed in the notes to the financial statements on pages 92 and 93:• The assets of Unique Formulations (note 1.1);• The assets of Indigenous Systems (Pty) Limited (note 1.2); and• 66,18% of Ayrton Drug Manufacturing Limited (note 1.3).
Subsequent eventsDetails about subsequent events are set out in note 31.
Share capitalDetails of the authorised and issued share capital are set out in note 17 of the annual financial statements and in the statement of changes in equity.
During the year under review the number of shares in issue increased by:• 334 240 ordinary shares as a result of options exercised in terms of the Adcock Ingram (2008) Share Option Scheme;• 19 458 196 A ordinary shares as a result of the implementation of Adcock Ingram’s Black Economic Empowerment transaction; and• 6 486 065 B ordinary shares as a result of the implementation of Adcock Ingram’s Black Economic Empowerment transaction.
DividendsThe Adcock board intends to declare a dividend on at least an annual basis, which it currently envisages will be covered not more than three times by headline earnings. The interim dividend of 78 cents per share was declared based upon the results of the six-month period ended 31 March 2010, and the final dividend of 102 cents per share payable in relation to the year ended 30 September 2010 is envisaged to be paid on 17 January 2011.
Going concernPage 62 sets out the directors’ responsibilities for preparing the consolidated financial statements. The directors are satisfied that Adcock Ingram Holdings Limited is a going concern.
Subsidiaries, joint ventures and investmentsFinancial information concerning the principal subsidiaries, joint ventures and investments of Adcock Ingram Holdings Limited is set out in Annexure A of the annual financial statements. Details of joint ventures are given in note 25.

A d c o c k I n g r a m A n n u a l R e p o r t 2 0 1 0 6 7
Directors’ report continued
Attributable interestThe attributable interest of the Company in the profits and losses of its subsidiaries and joint ventures is as follows:
2010 2009 R’000 R’000
SubsidiariesTotal income after taxation 581 071 643 583
Joint venturesTotal income after taxation 22 685 15 864
DirectorsThe names of the directors who presently hold office are set out on pages 10 and 11 of this report.
No director holds 1% or more of the ordinary shares of the Company. The directors beneficially hold, directly and indirectly, 39 400 ordinary shares in the Company. There has been no changes since the end of the financial period and the date of approval of the annual report.
Details of the directors’ shareholdings (direct and indirect) are reflected below. Number Number of shares of sharesDirector 2010 2009
JJ Louw* 39 300 39 300AG Hall 100 100Total 39 400 39 400
* These shares are subject to loans.
ResolutionsThe following special resolutions were passed during the year:
3 February 2010: Resolution nr 1: General repurchase of its ordinary shares subject to certain conditions
9 April 2010: Resolution nr 1: Amendment of authorised share capital. These changes were consequent to the implementation of the BEE transaction *.
Resolution nr 2: Amendment of articles. These changes were consequent to the implementation of the BEE transaction *.
Resolution nr 3: Authority for specific repurchases. These changes were consequent to the implementation of the BEE transaction *.
* These changes were consequent to the implementation of the BEE transaction.
Retirement fundsDetails in respect of the retirement funds of the Group are set out in note 21.
Directors’ and key management remunerationFull details regarding directors’ and key management remuneration are set out on pages 51 to 53, as part of the remuneration report.

A d c o c k I n g r a m A n n u a l R e p o r t 2 0 1 06 8
Segment report
Management monitors the operating results of its business units separately for the purpose of making decisions about resource allocation and performance assessment. For these purposes, the Group is organised into business units based on products, services and customer segments, and has the following three reportable operating segments for financial performance purposes:• Over the Counter, which comprises pharmaceutical products available without prescription as well as personal care products;• Prescription, which comprises products available on prescription only; and• Hospital Products.
No operating segments have been aggregated to form the above reportable operating segments.
Group financing (including finance costs and finance income) and income taxes are managed on a group basis and are not allocated to operating segments.
2010 2009 R’000 R’000
Statement of comprehensive incomeTurnoverOver the Counter 1 427 291 1 288 966Prescription 1 666 373 1 466 736
Pharmaceuticals 3 093 664 2 755 702Hospital Products 1 346 990 1 249 451
4 440 654 4 005 153
Operating profitOver the Counter 407 082 402 448Prescription 540 440 421 788
Pharmaceuticals 947 522 824 236Hospital Products 252 780 220 593
1 200 302 1 044 829
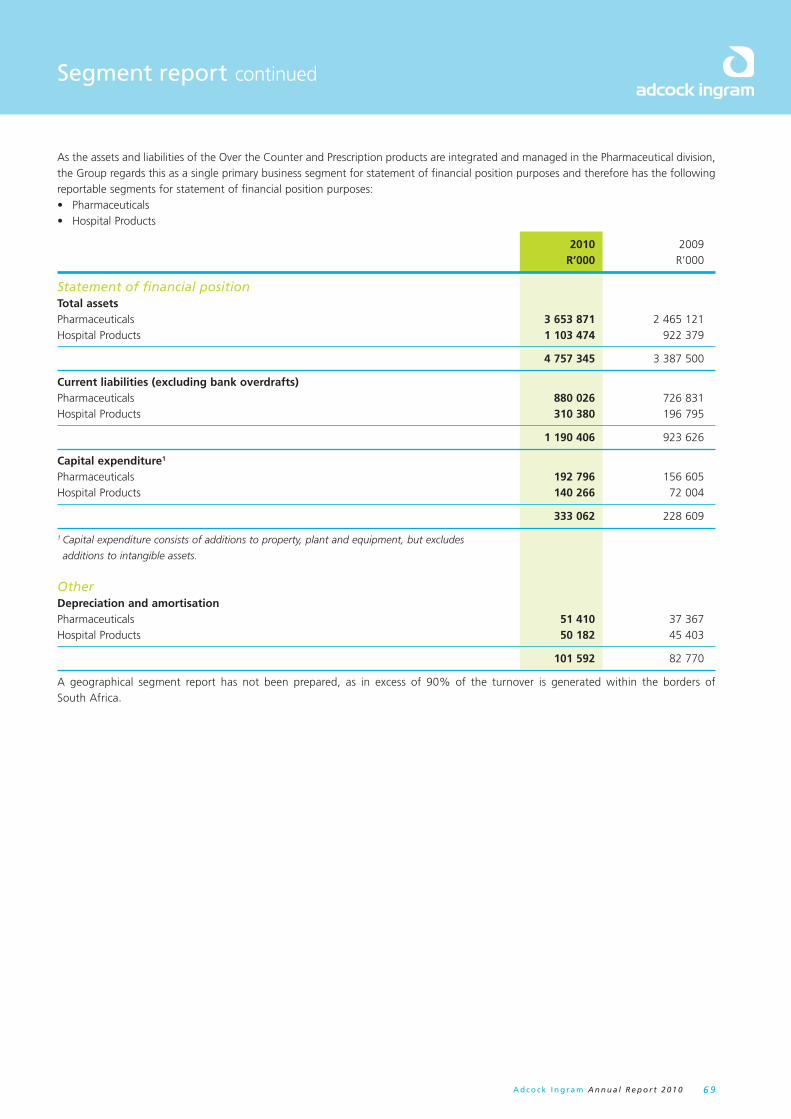
A d c o c k I n g r a m A n n u a l R e p o r t 2 0 1 0 6 9
Segment report continued
As the assets and liabilities of the Over the Counter and Prescription products are integrated and managed in the Pharmaceutical division, the Group regards this as a single primary business segment for statement of financial position purposes and therefore has the following reportable segments for statement of financial position purposes:• Pharmaceuticals• Hospital Products
2010 2009 R’000 R’000
Statement of financial positionTotal assetsPharmaceuticals 3 653 871 2 465 121Hospital Products 1 103 474 922 379
4 757 345 3 387 500
Current liabilities (excluding bank overdrafts)Pharmaceuticals 880 026 726 831Hospital Products 310 380 196 795
1 190 406 923 626
Capital expenditure1
Pharmaceuticals 192 796 156 605Hospital Products 140 266 72 004
333 062 228 609
1 Capital expenditure consists of additions to property, plant and equipment, but excludes
additions to intangible assets.
OtherDepreciation and amortisationPharmaceuticals 51 410 37 367Hospital Products 50 182 45 403
101 592 82 770
A geographical segment report has not been prepared, as in excess of 90% of the turnover is generated within the borders of South Africa.

A d c o c k I n g r a m A n n u a l R e p o r t 2 0 1 07 0
Accounting policies
Corporate informationThe consolidated financial statements of Adcock Ingram Holdings Limited (the Company) and Adcock Ingram Holdings Limited and its subsidiaries (the Group) for the year ended 30 September 2010 were authorised for issue in accordance with a resolution of the directors on 22 November 2010. Adcock Ingram Holdings Limited is incorporated and domiciled in South Africa, where its shares are publicly traded on the securities exchange of the JSE Limited.
Basis of preparationThe consolidated financial statements have been prepared on the historical cost basis, except as indicated below. The consolidated financial statements are presented in South African Rands and all values are rounded to the nearest thousand (R’000) except where otherwise indicated.
Statement of complianceThe annual financial statements of the Group and Company have been prepared in accordance with International Financial Reporting Standards (IFRS).
Basis of consolidation The consolidated financial statements include the financial statements of the Company and its subsidiaries (as well as special purpose entities deemed to be controlled by the Group). The financial statements of the subsidiaries are prepared for the same reporting period using consistent accounting policies.
The results of subsidiaries acquired are included in the consolidated financial statements from the date of acquisition, being the date on which the Group obtains control, and continue to be consolidated until the date that such control ceases.
Subsidiaries acquired with the intention of disposal within 12 months are consolidated in line with the principles of IFRS 5 Non-current Assets Held for Sale and Discontinued Operations and disclosed as held for sale. All intra-group transactions, balances, income and expenses are eliminated on consolidation. Non-controlling interests represent the equity in a subsidiary not attributable, directly or indirectly, to a parent. These interests are presented separately in the consolidated statement of comprehensive income, and in the consolidated statement of financial position, separately from own shareholders’ equity.
A change in the ownership interest of a subsidiary, without a change of control, is accounted for as an equity transaction.
Losses are attributed to any relevant non-controlling interest even if that results in a deficit balance.
If the Group loses control over a subsidiary, it:• Derecognises the assets (including goodwill) and liabilities of the subsidiary;• Derecognises the carrying amount of any non-controlling interest;• Derecognises the cumulative translation differences, recorded in equity;• Recognises the fair value of the consideration received;• Recognises the fair value of any investment retained;• Recognises any surplus or deficit in profit or loss; and• Reclassifies the parent’s share of components previously recognised in other comprehensive income to profit or loss.
Underlying conceptsThe financial statements are prepared on the going concern basis, which assumes that the Group will continue in operation for the foreseeable future.
The financial statements are prepared using accrual accounting whereby the effects of transactions and other events are recognised when they occur, rather than when the cash is received or paid.
Assets and liabilities and income and expenses are not offset unless specifically permitted by an accounting standard. Financial assets and financial liabilities are only offset when there is a legally enforceable right to offset, and the intention is either to settle on a net basis or to realise the asset and settle the liability simultaneously.
Accounting policies are the specific principles, bases, conventions, rules and practices applied in preparing and presenting financial statements. Changes in accounting policies are accounted for in accordance with the transitional provisions in the standard. If no such

A d c o c k I n g r a m A n n u a l R e p o r t 2 0 1 0 7 1
Accounting policies continued
guidance is given, they are applied retrospectively. If after making every reasonable effort to do so, it is impracticable to apply the change
retrospectively, it is applied prospectively from the beginning of the earliest period practicable.
Changes in accounting estimates are adjustments to assets or liabilities or the amounts of periodic consumption of assets that result from
new information or new developments. Such changes are recognised in profit or loss in the period they occur.
Prior period errors are omissions or misstatements in the financial statements of one or more prior periods. They may arise from a failure
to use, or misuse of reliable information that was available or could reasonably be expected to have been obtained. Where prior period
errors are material, they are retrospectively restated. If it is impracticable to do so, they are applied prospectively from the beginning of
the earliest period practicable.
Changes in accounting policiesThe accounting policies adopted are consistent with those of the previous financial year except where the Company and the Group
have adopted the following new and amended IFRS and IFRIC interpretations during the year. When the adoption of the standard or
interpretation is deemed to have an impact on the financial statements or performance of the Group, its impact is described below:
IFRS 2 Share-based Payment (Revised)The IASB issued an amendment to IFRS 2 which clarifies the definition of “vesting condition” and prescribes the treatment of an award
that is effectively cancelled because a non-vesting condition is not satisfied. Previously, IFRS 2 dealt only with situations where the entity
cancels an award. The Group adopted this amendment as of 1 October 2009. It did not have an impact on the financial position or
performance of the Group.
IFRS 3 Business Combinations (Revised) and IAS 27 Consolidated and Separate Financial Statements (Amended)The Group adopted the revised IFRS 3 and amended IAS 27 from 1 October 2009.
IFRS 3 (Revised) introduces significant changes in the accounting for business combinations occurring after this date. Changes affect
the valuation of non-controlling interest, the accounting of transaction costs, the initial recognition and subsequent measurement of a
contingent consideration and business combinations achieved in stages. These changes will impact the amount of goodwill recognised,
the reported results in the period that an acquisition occurs and future reported results.
IAS 27 (Amended) requires that a change in the ownership interest of a subsidiary without a change in control is accounted for as an
equity transaction. Therefore, such a change will have no impact on goodwill, nor will it give rise to a gain or loss. Furthermore, the
accounting treatment for losses incurred by the subsidiary as well as the loss of control of a subsidiary has been changed.
The changes introduced by IFRS 3 (Revised) and IAS 27 (Amended) must be applied prospectively. Acquisitions and transactions with non-
controlling interests in the current financial year were accounted for in accordance with the revised standards.
IFRS 7 Financial Instruments: DisclosuresThe amended standard requires additional disclosures about fair value measurement and liquidity risk. Fair value measurements related
to items recorded at fair value are to be disclosed by source of inputs using a three-level fair value hierarchy, by class, for all financial
instruments recognised at fair value. In addition, a reconciliation between the beginning and ending balance for level 3 fair value
measurements is now required, as well as significant transfers between levels in the fair value hierarchy. The amendments also clarify the
requirements for liquidity risk disclosures with respect to derivative transactions and assets used for liquidity management. The fair value
measurement disclosures are presented in note 26. The liquidity risk disclosures are not significantly impacted by the amendments and
are presented in note 26.
IAS 23 Borrowing CostsThe revised IAS 23 requires capitalisation of borrowing costs when such costs are directly attributable to the acquisition, construction
or production of a qualifying asset. A qualifying asset is an asset that necessarily takes a substantial period of time to get ready for
its intended use or sale. The Group’s previous policy was to expense borrowing costs as they were incurred. In accordance with the
transitional provisions of the amended IAS 23, the Group has adopted the standard on a prospective basis. Therefore, borrowing costs
are capitalised on qualifying assets with a commencement date on or after 1 October 2009. During the 12 months ended 30 September
2010, R9,3 million of borrowing costs have been capitalised on qualifying assets included in construction in progress (note 9).

A d c o c k I n g r a m A n n u a l R e p o r t 2 0 1 07 2
Accounting policies continued
IAS 32 Financial Instruments Presentation and IAS 1 Presentation of Financial StatementsAmendments to IAS 32 and IAS 1 were issued in February 2008 and became effective for annual periods beginning on or after 1 January 2009. The amendment to IAS 32 requires certain puttable financial instruments and obligations arising on liquidation to be classified as equity if certain criteria are met. The amendment to IAS 1 requires disclosure of certain information relating to puttable instruments classified as equity. The adoption of these amendments did not have any impact on the financial position or the performance of the Group.
IAS 39 Financial Instruments: Recognition and Measurement – Eligible Hedged ItemsThe amendment clarifies that an entity is permitted to designate a portion of the fair value changes or cash flow variability of a financial instrument as a hedged item. This also covers the designation of inflation as a hedged risk or portion in particular situations. The Group has concluded that the amendment will have no impact on the financial position or performance of the Group, as the Group has not entered into any such hedges where only a portion of the risk is hedged.
IFRIC 9 Reassessment of Embedded Derivatives and IAS 39 Financial Instruments: Recognition and MeasurementThis amendment to IFRIC 9 requires an entity to assess whether an embedded derivative must be separated from a host contract when the entity reclassifies a hybrid financial asset out of the fair value through profit or loss category. This assessment is to be made based on circumstances that existed on the later of the date the entity first became a party to the contract and the date of any contract amendments that significantly change the cash flows of the contract. IAS 39 now states that if an embedded derivative cannot be reliably measured, the entire hybrid instrument must remain classified as at fair value through profit or loss. This will not have an impact on the Group.
IFRIC 17 Distribution of Non-cash Assets to OwnersThis interpretation provides guidance on how to account for non-cash distributions to owners. The interpretation clarifies when to recognise a liability, how to measure it and the associated asset, and when to derecognise the asset and liability.
Improvements to IFRSIn May 2008 the IASB issued an omnibus of amendments to its standards, primarily with a view to remove inconsistencies and clarifying wording. There are separate transitional provisions for each standard. The adoption of these resulted in changes to accounting policies but did not have any impact on the financial position or performance of the Group.
Foreign currenciesForeign currency transactionsThe consolidated financial statements are presented in South African Rands, which is the Company’s functional and presentational currency. Each foreign entity in the Group determines its own functional currency. Transactions in foreign currencies are initially recorded by the Group entities at their respective functional currency prevailing at the date of the transaction.
Translation of foreign currency transactionsMonetary assets and liabilities denominated in foreign currencies are translated at the functional currency rate of exchange ruling at the date of the statement of financial position. Exchange differences are taken to profit or loss, except for differences arising on foreign currency borrowings that provide a hedge against a net investment in a foreign entity. These are taken directly to other comprehensive income until the disposal of the net investment, at which time they are recognised in profit and loss. Tax charges and credits attributable to such exchange differences are also accounted for in other comprehensive income.
If non-monetary items measured in a foreign currency are carried at historical cost, the exchange rate used is the rate applicable at the initial transaction date. If they are carried at fair value, the rate used is the rate at the date when the fair value was determined.
Foreign operationsAt the reporting date the assets and liabilities of the foreign operations are translated into the presentational currency of the Group (Rands) at the exchange rate ruling at the date of the statement of financial position. Items of profit or loss are translated at the weighted average exchange rate for the year. Exchange differences are taken directly to a separate component of other comprehensive income. On disposal of a foreign operation, the deferred cumulative amount recognised in other comprehensive income relating to that particular foreign operation is recognised in profit or loss.
Goodwill and fair value adjustments to the carrying amounts of assets and liabilities arising on the acquisition of a foreign operation are treated as assets and liabilities of that foreign operation, and are translated at the closing rate. The functional currencies of the foreign operations are as follows:• Joint venture, Adcock Ingram Limited in India, the Indian Rupee;• Subsidiary, Adcock Ingram East Africa in Kenya, the Kenyan Shilling; and• Subsidiary, Ayrton Drug Manufacturing Limited in Ghana, Ghanaian Cedis.
A d c o c k I n g r a m A n n u a l R e p o r t 2 0 1 0 7 3
Accounting policies continued
Interest in Group companiesBusiness combinationsBusiness combinations are accounted for using the acquisition method. The cost of an acquisition is measured as the aggregate of the consideration transferred, measured at acquisition date fair value and the amount of any non-controlling interest in the acquiree. For each business combination, the acquirer measures the non-controlling interest in the acquiree either at fair value or at the proportionate share of the acquiree’s identifiable net assets. Acquisition costs incurred are expensed.
When the Group acquires a business, it assesses the financial assets and liabilities assumed for appropriate classification and designation in accordance with the contractual terms, economic circumstances and pertinent conditions as at the acquisition date. This includes the separation of embedded derivatives in host contracts by the acquiree.
If the business combination is achieved in stages, the acquisition date fair value of the acquirer’s previously held equity interest in the acquiree is remeasured to fair value as at the acquisition date through profit and loss.
Any contingent consideration to be transferred by the acquirer will be recognised at fair value at the acquisition date. Subsequent changes to the fair value of the contingent consideration which is deemed to be an asset or liability will be recognised in accordance with IAS 39 either in profit or loss or as a change to other comprehensive income. If the contingent consideration is classified as equity, it shall not be remeasured until it is finally settled within equity.
Joint venturesA joint venture is a contractual arrangement whereby the Group and other parties undertake an economic activity that is subject to joint control. The strategic, financial and operating policy decisions of the joint venture require the unanimous consent of the parties sharing control.
The Company carries its investment in the joint ventures at cost less any impairment.
The Group reports its interests in joint ventures using the proportionate consolidation method. The Group’s share of the assets, liabilities, income and expenses of joint ventures are combined with the equivalent items in the consolidated financial statements on a line-by-line basis. Where the Group transacts with its joint ventures, unrealised profits and losses are eliminated to the extent of the Group’s interest in the joint venture.
Any goodwill arising on the acquisition of a joint venture is accounted for in accordance with the Group’s policy for goodwill. The financial statements of the joint venture are prepared for the same reporting period as the Group, using consistent accounting policies.
Where an investment in a joint venture is classified as held for sale in terms of IFRS 5, proportionate consolidation is discontinued, and the investment is held at the lower of its carrying value and fair value less costs to sell. The joint venture is proportionately consolidated until the date on which the Group ceases to have joint control over the joint venture.
Upon loss of joint control and provided the former jointly controlled entity does not become a subsidiary or associate, the Group measures and recognises its remaining investment at its fair value. Any difference between the carrying amount of the former joint controlled entity upon loss of joint control and the fair value of the remaining investment and proceeds from disposal is recognised in profit or loss. When the remaining investment constitutes significant influence, it is accounted for as investment in an associate.
AssociateAn associate is an entity over which the Group has significant influence through participation in the financial and operating policy decisions. The entity is neither a subsidiary nor a joint venture.
Associates are accounted for using the equity method of accounting. Under this method, investments in associates are carried in the statement of financial position at cost, plus post-acquisition changes in the Group’s share of the net assets of the associate. Goodwill relating to an associate is included in the carrying amount of the investment and is not tested separately for impairment.
The statement of comprehensive income reflects the Group’s share of the associate’s profit or loss. However, an associate’s losses in excess of the Group’s interest are not recognised. Where an associate recognises an entry directly in other comprehensive income, the Group in turn recognises its share as other comprehensive income in the consolidated statement of comprehensive income. Profits and losses resulting from transactions between the Group and associates are eliminated to the extent of the interest in the underlying associate.
A d c o c k I n g r a m A n n u a l R e p o r t 2 0 1 07 4
Accounting policies continued
After application of the equity method, each investment is assessed for indicators of impairment. If applicable, the impairment is calculated as the difference between the current carrying value and the higher of its value in use or fair value less costs to sell. Impairment losses are recognised in the statement of comprehensive income.
Where an investment in an associate is classified as held for sale in terms of IFRS 5, equity accounting is discontinued, and the investment is held at the lower of its carrying value and fair value less costs to sell.
Where an associate’s reporting date differs from the Group’s, the associate prepares financial statements as of the same date as the Group. If this is impracticable, financial statements are used where the date difference is no more than three months. Adjustments are made for significant transactions between the relevant dates. Where the associate’s accounting policies differ from those of the Group, appropriate adjustments are made to conform with the accounting policies of the Group.
Segment reportingThe principal segments of the Group have been identified by grouping similar-type products. The Group has three main reportable segments. The financial information of the Group’s reportable segments is reported to key management for purposes of making decisions about allocating resources to the segment and assessing its performance.
No geographical segments are reported as the Group operates mainly in South Africa and the international operations do not meet the thresholds for reportable segments in terms of IFRS 8 Operating Segments.
Segment numbers for management purposes equal the numbers reported in the segment report. For more details on the segment reporting refer to pages 68 and 69.
Property, plant and equipmentProperty, plant and equipment are stated at cost, excluding the costs of day-to-day servicing, less accumulated depreciation and accumulated impairment losses.
Where an item of property, plant and equipment comprises major components with different useful lives, the components are accounted for as separate assets. Expenditure incurred on major inspection and overhaul, or to replace an item is also accounted for separately if the recognition criteria are met. All other repairs and maintenance expenditures are charged to profit or loss during the financial period in which they are incurred. Each part of an item of property, plant and equipment with a cost that is significant is depreciated separately.
Depreciation is calculated on a straight-line basis, on the difference between the cost and residual value of an asset, over its useful life. Depreciation starts from when the asset is available for use. An asset’s residual value, useful life and depreciation methods are reviewed at least at each financial year-end. Any adjustments are accounted for prospectively.
The following useful lives have been estimated:Freehold land Not depreciatedFreehold buildings – general purpose 40 years – specialised 20 – 50 yearsLeasehold improvements The lease term or useful life, whichever is the shorter periodPlant and equipment 3 – 15 yearsFurniture and fittings 3 – 15 yearsComputer equipment 3 years
An item of property, plant and equipment is derecognised upon disposal or when no future economic benefits are expected from its use. Any gain or loss arising on derecognition of the asset (calculated as the difference between the net disposal proceeds and the carrying amount of the asset) is included in the statement of comprehensive income in the year the asset is derecognised.
Goodwill and intangible assetsGoodwillGoodwill is initially measured at cost being the excess of the consideration transferred over the Group’s net identifiable assets acquired and liabilities assumed. If this consideration is lower than the fair value of the net assets of the subsidiary acquired, the difference is recognised in profit or loss. Goodwill relating to subsidiaries and joint ventures is recognised as an asset and is subsequently measured at cost less accumulated impairment losses.

A d c o c k I n g r a m A n n u a l R e p o r t 2 0 1 0 7 5
Accounting policies continued
After initial recognition, goodwill is measured at cost less any accumulated impairment losses.
Goodwill is reviewed bi-annually for impairment or more frequently if there is an indicator of impairment. Goodwill is allocated to cash-generating units expected to benefit from the synergies of the combination. When the recoverable amount of a cash-generating unit is less than its carrying amount, an impairment loss is recognised. The impairment loss is allocated first to any goodwill assigned to the unit, and then to other assets of the unit pro rata on the basis of their carrying values. Impairment losses recognised for goodwill cannot be reversed in subsequent periods.
Where goodwill forms part of a cash-generating unit and part of the operation within that unit is disposed of, the goodwill associated with the operation disposed of is included in the carrying amount of the operation when determining the gain or loss on disposal of the operation. Goodwill disposed of in this circumstance is measured based on the relative values of the operation disposed of and the portion of the cash-generating unit retained.
Intangible assetsIntangible assets acquired separately are measured on initial recognition at cost. The cost of an intangible asset acquired in a business combination is the fair value at the date of acquisition. Subsequently intangible assets are carried at cost less any accumulated amortisation and accumulated impairment losses. Internally generated intangible assets, excluding capitalised development costs, are not capitalised and expenditure is charged to the statement of comprehensive income in the year in which the expense is incurred.
The useful lives of intangible assets are either finite or indefinite.
Intangible assets with finite lives are amortised over their useful life and assessed for impairment when there is an indication that the asset may be impaired. The amortisation period and the amortisation method are reviewed at each financial year-end. Changes in the expected useful life or the expected pattern of consumption of future economic benefits embodied in the asset are accounted for by changing the amortisation period or method, as appropriate, and are treated as changes in accounting estimates.
The following useful lives have been estimated:
Trademarks IndefiniteCustomer, supplier and licence related intangibles 1 – 15 years
Amortisation is recognised in the statement of comprehensive income in the expense category consistent with the function of the intangible asset.
Intangible assets with indefinite useful lives are not amortised but are tested bi-annually for impairment either individually or at the cash-generating level. The useful lives are also reviewed in each period to determine whether the indefinite life assessment continues to be supportable. If not, the change in the useful life assessment to a finite life is accounted for prospectively.
Certain trademarks have been assessed to have indefinite useful lives, as presently there is no foreseeable limit to the period over which the assets can be expected to generate cash flows for the Group.
An intangible asset is derecognised on disposal or when no future economic benefits are expected from its use or disposal.
Gains or losses arising from derecognition of an intangible asset are measured as the difference between the net disposal proceeds and the carrying amount of the asset and are recognised in the statement of comprehensive income when the asset is derecognised.
Research and development costsResearch costs, being the investigation undertaken with the prospect of gaining new knowledge and understanding, are recognised in profit or loss as they are incurred.
Development costs arise on the application of research findings to plan or design for the production of new or substantially improved materials, products or services, before the start of commercial production. Development costs are only capitalised when the Group can demonstrate the technical feasibility of completing the project, its intention and ability to complete the project and use or sell the materials, products or services flowing from the project, how the project will generate future economic benefits, the availability of sufficient resources and the ability to measure reliably the expenditure during development. Otherwise development costs are recognised in profit or loss.

A d c o c k I n g r a m A n n u a l R e p o r t 2 0 1 07 6
Accounting policies continued
During the period of development, the asset is tested annually for impairment. Following the initial recognition of the development costs,
the asset is carried at cost less accumulated amortisation and accumulated impairment losses. Amortisation begins when development is
complete and the asset is available for use. The development costs are amortised over the useful life of the intangible asset.
ImpairmentThe Group assesses tangible and intangible assets, including goodwill and indefinite life intangible assets, at each reporting date for an
indication that an asset may be impaired. If such an indication exists, the recoverable amount is estimated as the higher of the fair value
less costs to sell and the value in use. If the carrying value exceeds the recoverable amount, the asset is impaired and is written down to
the recoverable amount. Where it is not possible to estimate the recoverable amount of an individual asset, the recoverable amount of
the cash-generating unit to which the asset belongs is estimated.
In assessing value in use, the estimated future cash flows are discounted to their present value using a pre-tax discount rate that reflects
current market assessments of the time value of money and the risks specific to the asset. In determining fair value less costs to sell, the
hierarchy is firstly a binding arm’s length sale, then the market price if the asset is traded in an active market, and lastly recent transactions
for similar assets.
Impairment losses of continuing operations are recognised in the statement of comprehensive income in those expense categories
consistent with the function of the impaired asset.
For assets excluding goodwill, an assessment is made at each reporting date as to whether there is any indication that previously
recognised impairment losses may no longer exist or may have decreased. If such an indication exists, the Group estimates the asset’s or
cash-generating unit’s recoverable amount. A previously recognised impairment loss is reversed only if there has been a change in the
assumptions used to determine the asset’s recoverable amount since the last impairment loss was recognised. The reversal is limited so
that the carrying amount of the asset does not exceed its recoverable amount, nor exceed the carrying amount that would have been
determined, net of depreciation or amortisation, had no impairment loss been recognised for the asset in prior years. Such reversal is
recognised in the statement of comprehensive income unless the asset is carried at a revalued amount, in which case the reversal is treated
as a revaluation increase which is recognised as other comprehensive income.
Financial assetsInitial recognition and measurementFinancial assets within the scope of IAS 39 are classified as financial assets through profit or loss, loans and receivables, held-to-maturity
investments, available-for-sale financial assets, or as derivatives designated as hedging instruments in an effective hedge, as appropriate.
The Group determines the classification of its financial assets at initial recognition.
The Group’s classification of financial assets is as follows:
Description of asset ClassificationAmounts owing by/to Group companies Loans and receivables
Trade and other receivables Loans and receivables
Cash and cash equivalents Loans and receivables
Investments Available-for-sale
All financial assets are recognised initially at fair value plus, in the case of investments not at fair value through profit or loss, directly
attributable transaction costs.
Subsequent measurementThe subsequent measurement of financial assets depends on their classification as follows:
Loans and receivablesLoans and receivables are non-derivative financial assets with fixed or determinable payments that are not quoted in an active market.
After initial measurement, such financial assets are subsequently measured at amortised cost using the effective interest rate method,
less impairment. Amortised cost is calculated by taking into account any discount or premium on acquisition and fees or costs that are
an integral part of the effective interest rate. The effective interest rate amortisation is included in finance income in the statement of
comprehensive income. The losses arising from impairment are recognised in the statement of comprehensive income in finance costs.

A d c o c k I n g r a m A n n u a l R e p o r t 2 0 1 0 7 7
Accounting policies continued
Available-for-sale fi nancial assetsAvailable-for-sale financial assets could include equity and debt securities. Equity investments classified as available-for sale are those which are neither classified as held for trading nor designated at fair value through profit or loss. Debt securities in this category are those which are intended to be held for an indefinite period of time and which may be sold in response to needs for liquidity or in response to changes in the market conditions.
After initial measurement, available-for-sale financial assets are subsequently measured at fair value with unrealised gains and losses recognised as other comprehensive income until the investment is derecognised, at which time the cumulative gain or loss is recognised in other operating income, or determined to be impaired, at which time the cumulative loss is recognised in the statement of comprehensive income in finance costs and removed from the available-for-sale reserve.
Impairment losses on equity instruments are not reversed through the statement of comprehensive income.
DerecognitionFinancial assets or parts thereof are derecognised when:• the right to receive the cash flows has expired;• the right to receive the cash flows is retained, but an obligation to pay them to a third party under a ‘pass-through’ arrangement is
assumed; or• the Group transfers the right to receive the cash flows, and also transfers either all the risks and rewards, or control over the asset.
When the Group has transferred its rights to receive cash flows from an asset or has entered into a pass-through arrangement, and has neither transferred nor retained substantially all the risks and rewards of the asset nor transferred control of the asset, the asset is recognised to the extent of the Group’s continuing involvement in the asset. In that case, the Group also recognises an associated liability. The transferred asset and the associated liability are measured on a basis that reflects the rights and obligations that the Group has retained.
Impairment of financial assetsThe Group assesses at each reporting date whether there is any objective evidence that a financial asset or a group of financial assets is impaired.
A financial asset or a group of financial assets is deemed to be impaired if, and only if, there is objective evidence of impairment as a result of one or more events that has occurred after the initial recognition of the asset (an incurred ‘loss event’) and the loss event has an impact on the estimated future cash flows of the financial asset or the group of financial assets that can be reliably estimated. Evidence of impairment may include indications that the debtor or a group of debtors is experiencing significant financial difficulty, default or delinquency in interest or principal payments, the probability that they will enter bankruptcy or other financial reorganisation and where observable data indicates that there is a measurable decrease in the estimated future cash flows, such as changes in arrears or economic conditions that correlate with defaults.
Financial assets carried at amortised costFor financial assets carried at amortised cost the Group first assesses individually whether objective evidence of impairment exists individually for financial assets that are individually significant, or collectively for financial assets that are not individually significant. If the Group determines that no objective evidence of impairment exists for an individually assessed financial asset, whether significant or not, it includes the asset in a group of financial assets with similar credit risk characteristics and collectively assesses them for impairment. Assets that are individually assessed for impairment and for which an impairment loss is, or continues to be, recognised are not included in a collective assessment of impairment.
If there is objective evidence that impairment has occurred, the amount of the loss is measured as the difference between the asset’s carrying amount and the present value of estimated future cash flows (excluding future expected credit losses that have not yet been incurred). The present value of the estimated future cash flows is discounted at the financial asset’s original effective interest rate. If a loan has a variable interest rate, the discount rate for measuring any impairment loss is the current effective interest rate.
The carrying amount of the asset is reduced through the use of an allowance account and the amount of the loss is recognised in the income statement. Interest income continues to be accrued on the reduced carrying amount and is accrued using the rate of interest used to discount the future cash flows for the purpose of measuring the impairment loss. The interest income is recorded as part of finance income in the income statement. Loans together with the associated allowance are written off when there is no realistic prospect of future

A d c o c k I n g r a m A n n u a l R e p o r t 2 0 1 07 8
Accounting policies continued
recovery and all collateral has been realised or has ben transferred to the Group. If in a subsequent year, the amount of the estimated impairment loss increases or decreases because of an event occurring after the impairment was recognised, the previously recognised impairment loss is increased or reduced by adjusting the allowance account. If a future write-off is later recorded, the recovery is credited to finance costs in the income statement.
Available-for-sale fi nancial assetsFor available-for-sale financial investments, the Group assesses at each reporting date whether there is objective evidence that an investment or a group of investments is impaired.
In the case of equity investments classified as available-for-sale, objective evidence would include a significant or prolonged decline in the fair value of the investment below its cost. ‘Significant’ is to be evaluated against the original costs of the investment and ‘prolonged’ against the period in which the fair value has been below its original cost. Where there is evidence of impairment, the cumulative loss – measured as the difference between the acquisition cost and the current fair value, less impairment loss on that investment previously recognised in the statement of comprehensive income – is removed from other comprehensive income and recognised in profit or loss. Impairment losses on equity investments are not reversed through the statement of comprehensive income; increases in their fair value after impairment are recognised directly in other comprehensive income.
Financial liabilitiesInitial recognition and measurement Financial liabilities within the scope of IAS 39 are classified as financial liabilities at fair value through profit or loss, loans and borrowings, or as derivatives designated as hedging instruments in an effective hedge, as appropriate. The Group determines the classification of its financial liabilities at initial recognition.
All financial liabilities are recognised initially at fair value and in the case of loans and borrowings, plus directly attributable transaction costs.
The Group has classified financial liabilities as follows:
Description of liability ClassificationLoans payable and borrowings Loans and borrowings Trade and other payables Loans and borrowings Loans from subsidiaries Loans and borrowingsBank overdraft Loans and borrowings
Subsequent measurementLoans and borrowingsAfter initial recognition, interest bearing loans and borrowings are subsequently measured at amortised cost using the effective interest rate method. Gains and losses are recognised in the statement of comprehensive income when the liabilities are derecognised as well as through the effective interest rate method amortisation process.
Amortised cost is calculated by taking into account any discount or premium on acquisition and fees or costs that are an integral part of the effective interest rate. The effective interest rate amortisation is included in finance costs in the statement of comprehensive income.
DerecognitionA financial liability is derecognised when the obligation under the liability is discharged, cancelled or expires. When an existing financial liability is replaced by another from the same lender on substantially different terms, or the terms of an existing liability are substantially modified, such an exchange or modification is treated as a derecognition of an existing liability and as the recognition of a new financial liability. The difference in the respective carrying amounts is recognised in the statement of comprehensive income.
Fair value of financial instrumentsThe fair value of financial instruments that are traded in active markets at each reporting date is determined by reference to quoted market prices or dealer price quotations (bid price for long positions and offer price for short positions), without any deduction for transaction costs.
For financial instruments not traded in an active market, the fair value is determined using appropriate valuation techniques. Such techniques may include using recent arm’s length transactions, reference to the current fair value of another instrument that is substantially the same, discounted cash flow analysis or other valuation models.
A d c o c k I n g r a m A n n u a l R e p o r t 2 0 1 0 7 9
Accounting policies continued
Cash and cash equivalentsCash and cash equivalents consist of cash on hand and at banks, short-term deposits with an original maturity of three months or less
and highly liquid investments.
For the purpose of the statement of cash flows, cash and cash equivalents consist of cash and short-term deposits as detailed above, net
of outstanding bank overdrafts.
Derivative instrumentsDerivatives are financial instruments whose value changes in response to an underlying factor, require no initial or little net investment
and are settled at a future date. Derivatives, other than those arising on designated hedges, are measured at fair value with changes in
fair value being recognised in profit or loss.
Hedge accountingAt the inception of a hedge relationship, the Group formally designates and documents the hedge relationship to which the Group
wishes to apply hedge accounting and the risk management objective and strategy for undertaking the hedge. The documentation
includes identification of the hedging instrument, the hedged item or transaction, the nature of the risk being hedged and how the
entity will assess the hedging instrument’s effectiveness in offsetting the exposure to changes in the hedged item’s fair value or cash
flows attributable to the hedged risk. Such hedges are expected to be highly effective in achieving offsetting changes in fair value or cash
flows and are assessed on an ongoing basis to determine that they actually have been highly effective throughout the financial reporting
periods for which they were designated.
Fair value hedgesFair value hedges cover the exposure to changes in the fair value of a recognised asset or liability, or an unrecognised firm commitment
(except for foreign currency risk). Foreign currency risk of an unrecognised firm commitment is accounted for as a cash flow hedge.
The gain or loss on the hedged item adjusts the carrying amount of the hedged item and is recognised immediately in profit and loss.
The gain or loss from remeasuring the hedging instrument at fair value is also recognised in profit or loss.
When an unrecognised firm commitment is designated as a hedged item, the change in the fair value of the firm commitment is
recognised as an asset or liability with a corresponding gain or loss recognised in profit or loss. The change in the fair value of the hedging
instrument is also recognised in profit or loss.
The Group discontinues fair value hedge accounting if the hedging instrument expires or is sold, terminated or exercised, the hedge no
longer meets the criteria for hedge accounting or the Group revokes the designation.
Cash flow hedgesCash flow hedges cover the exposure to variability in cash flows that are attributable to a particular risk associated with:
• a recognised asset or liability,
• a highly probable forecast transaction, or
• the foreign currency risk in an unrecognised firm commitment.
The portion of the gain or loss on the hedging instrument that is determined to be an effective hedge is recognised directly in other
comprehensive income, while any ineffective portion is recognised in profit or loss.
Amounts taken to other comprehensive income are transferred to profit or loss when the hedged transaction affects profit or loss, such
as when the hedged income or financial asset or liability is recognised or when the forecast sale or purchase occurs. Where the hedged
item is the cost of a non-financial asset or liability, the amount deferred in other comprehensive income is transferred to the initial carrying
amount of the non-financial asset or liability.
If the forecast transaction is no longer expected to occur, amounts previously recognised in other comprehensive income are transferred
to profit or loss. If the hedging instrument expires or is sold, terminated or exercised without replacement or rollover, or if its designation
is revoked, amounts previously recognised in equity remain in equity until the forecast transaction occurs. If the related transaction is not
expected to occur, the amount is taken to profit or loss.

A d c o c k I n g r a m A n n u a l R e p o r t 2 0 1 08 0
Accounting policies continued
Hedges of a net investmentHedges of a net investment in a foreign operation, including a hedge of a monetary item that is accounted for as part of the net investment, are accounted for similarly to cash flow hedges. Gains or losses on the hedging instrument relating to the effective portion of the hedge are recognised in other comprehensive income, while any gains or losses relating to the ineffective portion are recognised in profit or loss. On disposal of the foreign operation, the cumulative gain or loss recognised in other comprehensive income is transferred to profit or loss.
Current versus non-current classificationDerivative instruments that are not designated and effective hedging instruments are classified as current or non-current or separated into a current and non-current portion based on an assessment of the facts and circumstances (i.e., the underlying contracted cash flows).• Where the Group will hold a derivative as an economic hedge (and does not apply hedge accounting) for a period beyond 12 months
after the reporting date, the derivative is classified as non-current (or separated into current and non-current portions) consistent with the classification of the underlying item.
• Embedded derivates that are not closely related to the host contract are classified consistent with the cash flows of the host contract.• Derivative instruments that are designated as, and are effective hedging instruments, are classified consistently with the classification of
the underlying hedged item. The derivative instrument is separated into a current and non-current portion only if a reliable allocation can be made.
Non-current assets held for sale and discontinued operationsAn item is classified as held for sale if its carrying amount will be recovered principally through a sale transaction rather than through continuing use. This condition is regarded as met only when the sale is highly probable and the asset or disposal group is available for immediate sale in its present condition. Management must be committed to the sale, which should be expected to qualify for recognition as a completed sale within one year from the date of classification.
Assets classified as held for sale are not subsequently depreciated and are held at the lower of their carrying value and fair value less costs to sell.
A discontinued operation is a separate major line of business or geographical area of operation that has been disposed of, or classified as held for sale, as part of a single co-ordinated plan. Alternatively, it could be a subsidiary acquired exclusively with a view to resell.
In the consolidated statement of comprehensive income of the reporting period, and of the comparable period of the previous year, income and expenses from discontinued operations are reported separate from income and expenses from continuing activities, down to the level of profit after taxes, even when the Group retains a non-controlling interest in the subsidiary after the sale. The resulting profit or loss (after taxes) is reported separately in profit or loss.
InventoriesInventories are stated at the lower of cost or net realisable value. Costs incurred in bringing each product to its present location and condition are accounted for as follows:
Raw materials Purchase cost on a first-in, first-out basis.
Finished goods and work in progress Cost of direct material and labour and a proportion of manufacturing overheads based on normal operating capacity but excluding borrowing costs and are carried at standard cost.
Consumables are written down with regard to their age, condition and utility.
Costs of inventories include the transfer from other comprehensive income of gains and losses on qualifying cash flow hedges in respect of the purchases of raw materials.
Net realisable value is the estimated selling price in the ordinary course of business, less estimated completion and selling costs.
ProvisionsProvisions are recognised when the Group has a present legal or constructive obligation, as a result of past events, for which it is probable that an outflow of economic benefits will be required to settle the obligation, and a reliable estimate can be made of the amount of the obligation.

A d c o c k I n g r a m A n n u a l R e p o r t 2 0 1 0 8 1
Accounting policies continued
Where the Group expects some or all of a provision to be reimbursed, for example under an insurance contract, the reimbursement is recognised as a separate asset, but only when the reimbursement is virtually certain. The expense relating to any provision is presented in the statement of comprehensive income net of any reimbursement.
If the effect of the time value of money is material, provisions are discounted using a current pre-tax rate that reflects the risks specific to the liability. Where discounting is used, the increase in the provision due to the passage of time is recognised as a finance cost.
LeasesAt inception date an arrangement is assessed to determine whether it is, or contains, a lease. An arrangement is accounted for as a lease where it is dependent on the use of a specific asset and it conveys the right to use that asset.
Leases are classified as finance leases where substantially all the risks and rewards associated with ownership of an asset are transferred from the lessor to the Group as lessee. Finance lease assets and liabilities are recognised at the lower of the fair value of the leased property or the present value of the minimum lease payments. Finance lease payments are allocated, using the effective interest rate method, between the lease finance cost, which is included in financing costs, and the capital repayment, which reduces the liability to the lessor.
Capitalised lease assets are depreciated in line with the Group’s stated depreciation policy. If there is no reasonable certainty that the Group will obtain ownership by the end of the lease term, the asset is depreciated over the shorter of its estimated useful life and lease term.
Operating leases are those leases which do not fall within the scope of the above definition. Operating lease rentals are charged against trading profit on a straight-line basis over the lease term.
RevenueRevenue comprises turnover, dividend income and interest income. Revenue is recognised to the extent that it is probable that the economic benefits will flow to the Group and the revenue can be reliably measured. Revenue is measured at fair value of the consideration received/receivable excluding value added tax, normal discounts, rebates, settlement discounts, promotional allowances, and internal revenue which is eliminated on consolidation.
The Group assesses its revenue arrangements against specific criteria in order to determine if it is acting as principal or agent. The Group has concluded that it is acting as a principal in all of its revenue arrangements.
Turnover from the sale of goods is recognised when the significant risks and rewards of ownership have passed to the buyer.
Dividend income is recognised when the Group’s right to receive payment is established.
Interest income is accrued on a time basis recognising the effective rate applicable on the underlying assets.
Borrowing costsBorrowing costs directly attributable to the acquisition, construction or production of an asset that necessarily takes a substantial period of time to get ready for its intended use or sale are capitalised as part of the cost of the respective assets. All other borrowing costs are expensed in the period they occur. Borrowing costs consist of interest and other costs that an entity incurs in connection with the borrowing of funds.
Income taxesThe income tax expense represents the sum of current tax, deferred tax, and secondary taxation on companies.
Current income taxCurrent income tax assets and liabilities for the current and prior periods are measured at the amount expected to be recovered from or paid to the taxation authorities. The current tax is based on taxable profit for the year. Taxable profit differs from profit as reported in the statement of comprehensive income because it excludes items of income or expense that are taxable or deductible in other years, and it further excludes items that are never taxable or deductible. The Group’s liability for current tax is calculated using tax rates that have been enacted or substantively enacted by the date of the statement of financial position.
Current tax relating to items recognised outside profit or loss is recognised in other comprehensive income and not in profit or loss. Current tax items are recognised in correlation to the underlying transaction either in comprehensive income or directly in equity.

A d c o c k I n g r a m A n n u a l R e p o r t 2 0 1 08 2
Accounting policies continued
Deferred income taxDeferred tax is provided using the liability method on all temporary differences at the reporting date. Temporary differences are differences between the carrying amounts of assets and liabilities for financial reporting purposes and their tax base.
Deferred tax liabilities are recognised for taxable temporary differences:• except where the liability arises from the initial recognition of goodwill or an asset or liability in a transaction that is not a business
combination and, at the time of the transaction, affects neither the accounting profit nor taxable profit or loss; and• except in respect of taxable temporary differences associated with investments in subsidiaries, associates and interests in joint ventures,
where the timing of the reversal of the temporary differences can be controlled, and it is probable that the temporary differences will not reverse in the foreseeable future.
Deferred tax assets are recognised for all deductible temporary differences, carry forward of unused tax credits and unused tax losses, where it is probable that the asset will be utilised in the foreseeable future:• except where the asset arises from the initial recognition of an asset or liability in a transaction that is not a business combination and,
at the time of the transaction, affects neither the accounting profit nor taxable profit or loss; and• except in respect of deductible temporary differences associated with investments in subsidiaries, associates and interests in joint
ventures, only to the extent that it is probable that the differences will reverse in the foreseeable future, and taxable profit will be available against which these differences can be utilised.
The carrying amount of deferred tax assets is reviewed at each statement of financial position date and reduced to the extent that it is no longer probable that sufficient taxable profits will be available to allow all or part of the asset to be recovered. Unrecognised deferred tax assets are reassessed at each statement of financial position date and recognised to the extent it has become probable that future taxable profit will allow the asset to be utilised.
Deferred tax is calculated at the tax rates that are expected to apply in the period when the liability is settled or the asset realised based on tax rates/laws that have been enacted or substantively enacted by the statement of financial position date.
Deferred tax is charged to profit or loss except to the extent that it relates to a transaction that is recognised outside profit or loss or a business combination that is an acquisition. In this case the deferred tax items are recognised in correlation to the underlying transaction either in profit or loss or directly in equity.
Deferred tax assets and liabilities are offset when there is a legally enforceable right to offset and they relate to income taxes levied by the same taxation authority and the Group intends to settle its current tax assets and liabilities on a net basis.
Secondary tax on companiesSecondary taxation on companies (STC) on dividends declared is accrued in the period in which the dividend is declared. Non-resident shareholders’ taxation is provided in respect of foreign dividends receivable, where applicable.
Value added taxRevenues, expenses and assets are recognised net of the amount of value added tax except:• where the value added tax incurred on a purchase of assets or services is not recoverable from the taxation authority, in which case
the value added tax is recognised as part of the cost of acquisition of the asset or as part of the expense item as applicable; and• receivables and payables are stated with the amount of value added tax included.
The net amount of value added tax recoverable from, or payable to, the taxation authority is included as part of receivables or payables in the statement of financial position.
Employee benefitsShort-term employee benefitsAll short-term benefits, including leave pay, are fully provided in the period in which the related service is rendered by the employees.
A liability is recognised when an employee has rendered services for benefits to be paid in the future, and an expense when the entity consumes the economic benefit arising from the service provided by the employee.
Defined contribution plansIn respect of defined contribution plans, the contribution paid by the Company is recognised as an expense. If the employee has rendered the service, but the contribution has not yet been paid, the amount payable is recognised as a liability.
A d c o c k I n g r a m A n n u a l R e p o r t 2 0 1 0 8 3
Accounting policies continued
Defined benefit plansIn respect of defined benefit plans, the Company’s contributions are based on the recommendations of independent actuaries as determined using the projected unit credit actuarial valuation method.
Actuarial gains and losses are recognised in the statement of comprehensive income when the net cumulative unrecognised actuarial gains and losses for each individual plan at the end of the previous reporting period exceed 10% of the higher of the defined benefit obligation and the fair value of plan assets at that date. These gains or losses are recognised over the expected average remaining working lives of the employees participating in the plans.
Past service costs are recognised as an expense on a straight-line basis over the average period until the benefits become vested. If the benefits vest immediately following the introduction of, or changes to, a defined benefit plan, the past service cost is recognised immediately.
The defined benefit asset or liability recognised in the statement of financial position date comprises the present value of the defined benefit obligation, plus any unrecognised actuarial gains (minus losses), less unrecognised past service costs net actuarial losses and the fair value of plan assets out of which the obligations are to be settled. The value of an asset recognised is restricted to the sum of the unrecognised past service costs and unrecognised actuarial gain or loss and the present value of any economic benefits available in the form of refunds from the plan or reductions in the future contributions.
Post-retirement medical obligationsThe Group provides post-retirement healthcare benefits to certain of its retirees based on the qualifying employee remaining in service up to retirement age. The expected costs of these benefits are accrued over the period of employment, using the projected unit credit method. Valuations are based on assumptions which include employee turnover, mortality rates, discount rate based on current bond yields of appropriate terms, healthcare inflation costs and rates of increase in salary costs. Valuations of these obligations are carried out by independent qualified actuaries.
Actuarial gains or losses are recognised in the same manner as those of pension obligations.
Share-based paymentsCertain employees (including senior executives) of the Group receive remuneration in the form of share-based payment transactions, whereby employees render services as consideration for equity instruments (equity-settled transactions) or share appreciation rights (cash-settled transactions).
Equity-settled share options granted before 7 November 2002No expense is recognised in the statement of comprehensive income for such awards.
The Group has taken advantage of the voluntary exemption provision of IFRS 1 First-time Adoption of International Financial Reporting Standards in respect of equity-settled awards and has applied IFRS 2 Share-based Payment only to equity-settled awards granted after 7 November 2002 that had not vested on 1 January 2005.
Equity-settled and cash-settled share options granted after 7 November 2002Equity-settled transactionsThe cost of equity-settled transactions with employees is measured by reference to the fair value at the date on which they are granted. The fair value is determined by an external valuer using a modified version of the Black-Scholes model, further details of which are given in note 29.
The cost of equity-settled transactions is recognised, together with a corresponding increase in equity, over the period in which the service conditions are fulfilled, ending on the date on which the relevant employees become fully entitled to the award (the vesting date). The cumulative expense recognised reflects the extent to which the vesting period has expired and the Group’s best estimate of the number of equity instruments that will ultimately vest. The charge in the statement of comprehensive income for a period represents the movement in the cumulative expense at the beginning and end of that period.
No expense is recognised for awards that do not ultimately vest, except for equity-settled transactions where vesting is conditional upon a market or non-vesting condition, which are treated as vesting irrespective of whether or not the market or non-vesting condition is satisfied, provided that all other performance and/or service conditions are satisfied.

A d c o c k I n g r a m A n n u a l R e p o r t 2 0 1 08 4
Accounting policies continued
Where the terms of an equity-settled transaction award are modified, the minimum expense recognised is the expense as if the terms
had not been modified, if the original terms of the award are met. If at the date of modification, the total fair value of the share-based
payment is increased, or is otherwise beneficial to the employee, the difference is recognised as an additional expense.
Where an equity-settled award is cancelled (other than forfeiture), it is treated as if it had vested on the date of cancellation, and any
unrecognised expense recognised immediately. This includes any award where non-vesting conditions within the control of either the
entity or the employee are not met. However, if a new award is substituted and designated as a replacement for the cancelled award,
the cancelled and new awards are treated as if they were a modification of the original award, as described above. All cancellations are
always treated equally.
The dilutive effect of outstanding equity-settled options is reflected as additional share dilution in the computation of diluted earnings
and diluted headline earnings per share.
Cash-settled transactionsThe cost of cash-settled transactions is measured initially at fair value at the grant date using a modified version of the Black-Scholes
model, taking into account the terms and conditions upon which the instruments were granted (see note 29). This fair value is expensed
over the period until vesting with recognition of a corresponding liability. The liability is remeasured at each statement of financial position
date up to and including the settlement date with changes in fair value recognised in profit or loss.
Accounting for BEE transactionsWhere equity instruments are issued to a Black Economic Empowerment (BEE) party at less than fair value, the instruments are accounted
for as share-based payments in terms of the stated accounting policy.
Any difference between the fair value of the equity instrument issued and the consideration received is accounted for as an expense in
the statement of comprehensive income.
A restriction on the BEE party to transfer the equity instrument subsequent to its vesting is not treated as a vesting condition, but is
factored into the fair value determination of the instrument.
BEE transactions are accounted for as equity-settled share-based payments and are treated the same as equity-settled transactions.
Treasury sharesShares in Adcock Ingram Holdings Limited held by the Group, including shares held by special purpose entities, are classified within total
equity as treasury shares. Treasury shares are treated as a deduction from the issued and weighted average numbers of shares for earnings
per share and headline earnings per share purposes and the cost price of the shares is reflected as a separate component of capital and
reserves in the statement of financial position. Dividends received on treasury shares are eliminated on consolidation. No gain or loss is
recognised in the statement of comprehensive income on the purchase, sale, issue or cancellation of treasury shares. The consideration
paid or received with regard to treasury shares is recognised in equity.
Contingent assets and contingent liabilitiesA contingent asset is a possible asset that arises from past events and whose existence will be confirmed by the occurrence or
non-occurrence of one or more uncertain future events not wholly within the control of the Company. Contingent assets are not
recognised as assets.
A contingent liability is a possible obligation that arises from past events and whose existence will be confirmed by the occurrence or
non-occurrence of one or more uncertain future events not wholly within the control of the Company. Alternatively it may be a present
obligation that arises from past events but is not recognised because an outflow of economic benefits to settle the obligation is not
probable, or the amount of the obligation cannot be measured with sufficient reliability. Contingent liabilities are not recognised as
liabilities unless they are acquired as part of a business combination.
Subsequent eventsRecognised amounts in the financial statements are adjusted to reflect significant events arising after the date of the statement of
financial position, but before the financial statements are authorised for issue, provided there is evidence of the conditions existing at
30 September. Events after 30 September that are indicative of conditions that arose after 30 September are dealt with by way of a note.

A d c o c k I n g r a m A n n u a l R e p o r t 2 0 1 0 8 5
Accounting policies continued
Consolidation of special purpose entitiesThe special purpose entities established in terms of the share options schemes and Black Economic Empowerment (BEE) transaction have
been consolidated in the Group results.
The substance of the relationship between the Company and these entities has been assessed, and the decision made is that they are
deemed to be controlled entities.
Consolidation of Blue Falcon Trading 69 (Pty) Limited and the Mpho ea Bophelo Trust as special-purpose entitiesBlue Falcon Trading 69 (Pty) Limited and the Mpho ea Bophelo Trust are entities incorporated for the purpose of facilitating the Adcock
Ingram Holdings Limited BEE transaction and are consolidated into the Group in accordance with SIC 12 Consolidation – Special Purpose
Entity. In substance, the activities of these entities are being conducted on behalf of the Group according to its specific business needs so
that the Group obtains benefits from these entities’ operations. In addition, the Group retains the majority of the residual or ownership
risks and rewards related to these entities or their assets in order to obtain benefits from their activities in the form of BEE credentials.
Estimates and assumptionsThe key assumptions concerning the future and other key sources of estimation uncertainty at the statement of financial position date,
that have a significant risk of causing a material adjustment to the carrying amounts of assets and liabilities within the next financial year
are discussed below.
Carrying value of goodwill, tangible and intangible assetsGoodwill and indefinite life intangible assets are tested for impairment bi-annually, while tangible assets and finite life intangible assets
are tested annually or when there is an indicator of impairment. The calculation of the recoverable amount requires the use of estimates
and assumptions concerning the future cash flows which are inherently uncertain and could change over time. In addition, changes in
economic factors such as discount rates could also impact this calculation.
Residual values and useful lives of tangible and intangible assetsResidual values and useful lives of tangible and intangible assets are assessed on an annual basis. Estimates and judgements in this regard
are based on historical experience and expectations of the manner in which assets are to be used, together with expected proceeds likely
to be realised when assets are disposed of at the end of their useful lives. Such expectations could change over time and therefore impact
both depreciation charges and carrying values of tangible and intangible assets in the future.
Fair value of BEE share allocationsIn calculating the amount to be expensed as a share-based payment, the Group was required to calculate the fair value of the equity
instruments granted to the BEE participants in terms of the staff empowerment transaction implemented in October 2005 by Tiger Brands,
when Adcock was still part of the Tiger Brands Group.
Share-based paymentsThe Group measures the cost of equity-settled transactions with employees by reference to the fair value of the equity instruments at the
date at which they are granted. Estimating fair value requires determining the most appropriate valuation model for a grant of equity
instruments, which is dependent on the terms and conditions of the grant. This also requires determining the most appropriate inputs
to the valuation model including the expected life of the option, volatility and dividend yield and making assumptions about them. The
assumptions and models used are disclosed in note 29.
Share appreciation rights granted to employees for services rendered or to be rendered are raised as a liability and recognised in profit
or loss over the vesting period. The liability is remeasured annually until settled and any changes in value are recognised in profit or loss.
Fair value is measured using a Black-Scholes option pricing model.
Deferred tax assetsDeferred tax assets are recognised for all unused tax losses to the extent that it is probable that taxable profit will be available against
which the losses can be utilised. Significant management judgement is required to determine the amount of deferred tax assets that can
be recognised, based upon the likely timing and level of future taxable profits together with future tax planning strategies.
A d c o c k I n g r a m A n n u a l R e p o r t 2 0 1 08 6
Accounting policies continued
Pension and other post-employment benefitsThe cost of defined benefit pension plans and post-employment medical benefits is determined using actuarial valuations. The actuarial valuation involves making assumptions about discount rates, expected rates of return on assets, future salary increases, mortality rates and future pension increases. Due to the long-term nature of these plans, such estimates are subject to significant uncertainty.
ProvisionsThe establishment and review of the provisions requires significant judgement by management as to whether or not a reliable estimate can be made of the amount of the obligation. Best estimates, being the amount that the Group would rationally pay to settle the obligation, are recognised as provisions at the date of the statement of financial position.
Standards and interpretations not yet effectiveThe Group has not applied the following IFRS and IFRIC Interpretations that have been issued but are not yet effective and will be adopted by the Group when they become effective. These are as follows:
IFRS 9 Financial InstrumentsIFRS 9 specifies how an entity should classify and measure financial assets, including some hybrid contracts. They require all financial assets to be:(a) classified on the basis of the entity’s business model for managing the financial assets and the contractual cash flow characteristics
of the financial asset;(b) initially measured at fair value plus, in the case of a financial asset not at fair value through profit or loss, particular transaction costs;
and(c) subsequently measured at amortised cost or fair value.
The revised standard is effective for financial periods beginning on or after 1 January 2013. It will have an impact on the classification and measurement of financial assets.
IAS 24 Related Party DisclosureThis standard clarifies and simplifies the definition of a related party. The revised standard also provides some relief for government-related entities (to disclose details of all transactions with other government-related entities, as well as with the government itself). This standard prescribes additional disclosure in certain circumstances. The revised standard is effective for financial periods beginning on or after 1 January 2011. It may have an impact on the disclosure of related parties.
IFRIC 19 Extinguishing Financial Liabilities with Equity InstrumentsIFRIC 19 addresses the accounting by an entity when the terms of a financial liability are renegotiated and result in the entity issuing equity instruments to a creditor of the entity to extinguish all or part of the financial liability. This interpretation is effective for periods beginning on or after 1 July 2010 and is unlikely to have a significant impact on the Group.
IAS 32 Classifi cation of Rights Issues – Amendment to IAS 32This amendment provides relief to entities that issue rights in a currency other than their functional currency, from treating the rights as derivatives with fair value changes recorded in profit or loss. Such rights will now be classified as equity instruments when certain conditions are met. The amendment is effective for financial periods beginning on or after 1 February 2010. The standard is unlikely to have a significant impact on the Group.
Amendments to IFRS 2 Share-based Payments – Group Cash-settled Share-based Payment ArrangementsThis amendment provides guidance on accounting for cash-settled transactions in a group. The standard is effective for financial periods beginning on or after 1 January 2010 and could have an impact on the Group if cash-settled share-based payments are issued.
Amendments to IFRIC 14 Prepayments of a Minimum Funding Requirement The requirements of IFRIC 14 meant that some entities that were subject to minimum funding requirements could not treat any surplus in a defined benefit pension plan as an economic benefit. This amendment will allow these entities to recognise a prepayment of pension contributions as an asset rather than an expense. This amendment is effective for financial periods beginning on or after 1 January 2011 and will not have an impact on the Group.
A d c o c k I n g r a m A n n u a l R e p o r t 2 0 1 0 8 7
Amendments to IFRS 7 Financial Instruments: Disclosure – Transfers of Financial AssetsThis amendment will assist users to understand the implications of transfers of financial assets and the potential risks that may remain with the transferor. The amendment will require additional disclosure where there are transfers of financial assets. The amendment is effective for annual periods beginning on or after 1 July 2011 and comparative disclosures are not required for any period beginning before that date.
Amendment to the Conceptual Framework: Objectives and qualitative characteristicsTo provide the best foundation for developing principle-based standards, the Boards undertook the project to establish an improved Conceptual Framework (the revised Framework or the Conceptual Framework). Phase A encompasses Chapter 1 The Objectives of Financial Reporting, and Chapter 3 Qualitative Characteristics of Useful Financial Information. No specific transition requirements apply, the revised chapters replace existing elements of the existing Framework.
The objective of general purpose financial reporting is to provide financial information about the reporting entity that is useful to existing and potential investors, lenders and other creditors in making decisions about providing resources to the entity. Moreover, it is directed at users who provide resources to a reporting entity, but lack the ability to compel the entity to provide them with the information they need to make decisions about their investments.
The revised Framework distinguishes between two types of qualitative characteristics that are necessary to provide useful financial information:• Fundamental qualitative characteristics (relevance and faithful representation); and • Enhancing qualitative characteristics (comparability, timeliness, verifiability and understandability).
Improvements to IFRS standards and IFRIC interpretations not yet effective: In April 2009, the IASB issued the second omnibus of amendments to its standards. There are separate transitional provisions for each standard but the majority of these standards have an effective date for financial periods beginning on or after 1 January 2010. These improvements are not expected to have a significant impact on the Group other than additional disclosures.
Improvements to IFRS standards and IFRIC interpretations not yet effective: In May 2010, the IASB issued the third omnibus of amendments to its standards. There are separate transitional provisions for each standard but the majority of these standards have an effective date of 1 January 2011. These improvements are not expected to have a significant impact on the Group other than additional disclosures.
The following amendment has also been issued but will not have an impact:• IFRS 1 – Limited Exemption from Comparative IFRS 7 Disclosures for First-time Adopters
Accounting policies continued
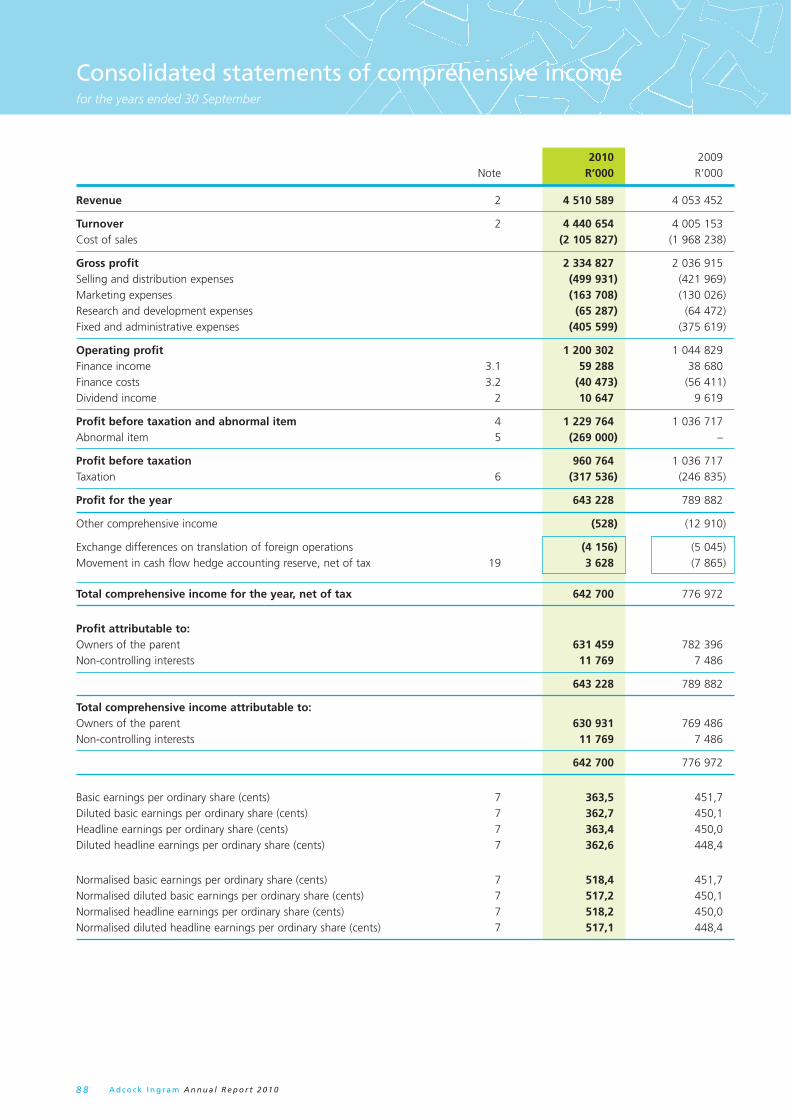
A d c o c k I n g r a m A n n u a l R e p o r t 2 0 1 08 8
Consolidated statements of comprehensive incomefor the years ended 30 September
2010 2009 Note R’000 R’000
Revenue 2 4 510 589 4 053 452
Turnover 2 4 440 654 4 005 153Cost of sales (2 105 827) (1 968 238)
Gross profit 2 334 827 2 036 915Selling and distribution expenses (499 931) (421 969)Marketing expenses (163 708) (130 026)Research and development expenses (65 287) (64 472)Fixed and administrative expenses (405 599) (375 619)
Operating profit 1 200 302 1 044 829Finance income 3.1 59 288 38 680Finance costs 3.2 (40 473) (56 411)Dividend income 2 10 647 9 619
Profit before taxation and abnormal item 4 1 229 764 1 036 717Abnormal item 5 (269 000) –
Profit before taxation 960 764 1 036 717Taxation 6 (317 536) (246 835)
Profit for the year 643 228 789 882
Other comprehensive income (528) (12 910)
Exchange differences on translation of foreign operations (4 156) (5 045)Movement in cash flow hedge accounting reserve, net of tax 19 3 628 (7 865)
Total comprehensive income for the year, net of tax 642 700 776 972
Profit attributable to: Owners of the parent 631 459 782 396Non-controlling interests 11 769 7 486
643 228 789 882
Total comprehensive income attributable to: Owners of the parent 630 931 769 486Non-controlling interests 11 769 7 486
642 700 776 972
Basic earnings per ordinary share (cents) 7 363,5 451,7Diluted basic earnings per ordinary share (cents) 7 362,7 450,1Headline earnings per ordinary share (cents) 7 363,4 450,0Diluted headline earnings per ordinary share (cents) 7 362,6 448,4
Normalised basic earnings per ordinary share (cents) 7 518,4 451,7Normalised diluted basic earnings per ordinary share (cents) 7 517,2 450,1Normalised headline earnings per ordinary share (cents) 7 518,2 450,0Normalised diluted headline earnings per ordinary share (cents) 7 517,1 448,4

A d c o c k I n g r a m A n n u a l R e p o r t 2 0 1 0 8 9
Consolidated statement of changes in equityfor the years ended 30 September
Attributable to owners of the parent
Total attribu- Non- table to Issued distribu- ordinary Non- share Share Retained table share- controlling capital premium income reserves holders interests Total Note R’000 R’000 R’000 R’000 R’000 R’000 R’000
As at 1 October 2008 17 306 1 193 662 340 117 77 306 1 628 391 22 612 1 651 003Share issue 17, 18 57 10 192 10 249 10 249Share-based payment expense 19 13 098 13 098 13 098Total comprehensive income 782 396 (12 910) 769 486 7 486 776 972
Profit for the year 782 396 782 396 7 486 789 882 Other comprehensive income 19 (12 910) (12 910) (12 910)
Dividends 8 (120 571) (120 571) (5 155) (125 726)
Balance at 30 September 2009 17 363 1 203 854 1 001 942 77 494 2 300 653 24 943 2 325 596
Share issue 17, 18 33 4 364 4 397 4 397Movement in treasury shares 17, 18 (31) (17 928) (17 959) (17 959)Share-based payment expense 19 272 095 272 095 272 095Acquisition of A ordinary shares by Blue Falcon Trading 69
(Pty) Limited – non-controlling interest 93 750 93 750
Acquisition through business combination: Ayrton Drug
Manufacturing Limited 1.3 33 636 33 636Subsequent acquisition of non-controlling interests in
Ayrton Drug Manufacturing Limited 1.3 (922) (922) (69) (991)
Total comprehensive income 631 459 (528) 630 931 11 769 642 700
Profit for the year 631 459 631 459 11 769 643 228 Other comprehensive income 19 (528) (528) (528)
Dividends 8 (274 540) (274 540) (5 344) (279 884)
Balance at 30 September 2010 17 365 1 190 290 1 357 939 349 061 2 914 655 158 685 3 073 340
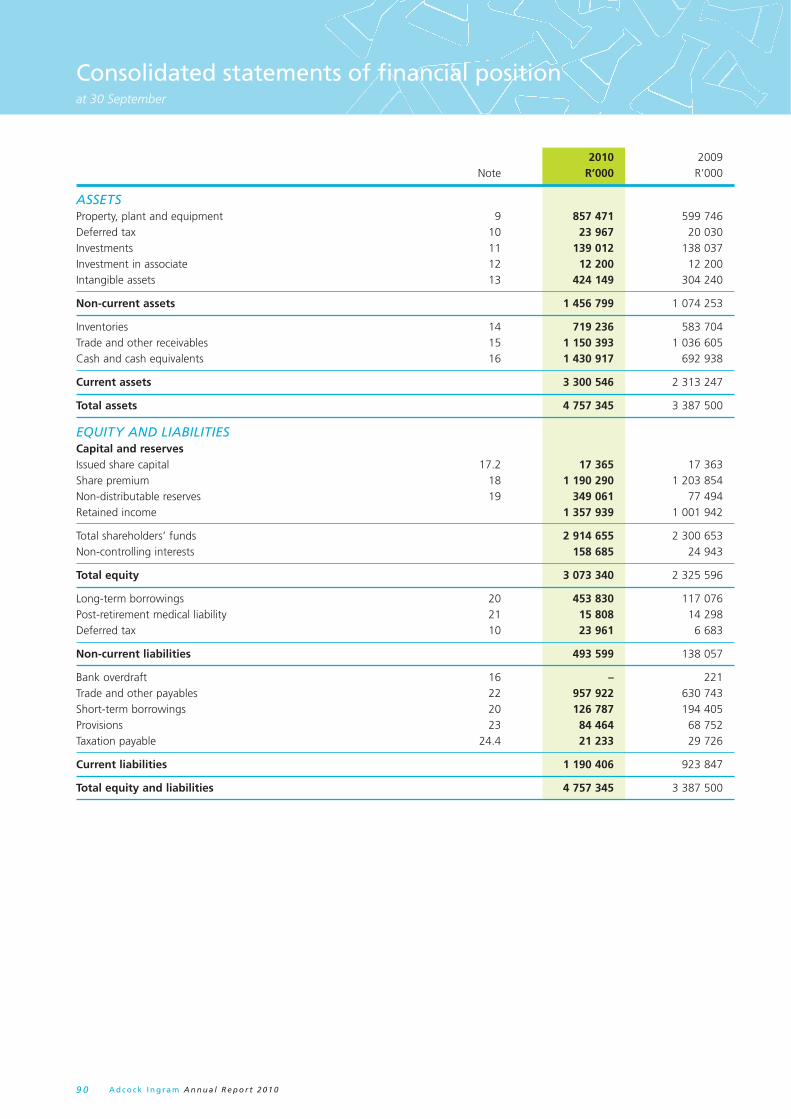
A d c o c k I n g r a m A n n u a l R e p o r t 2 0 1 09 0
Consolidated statements of fi nancial positionat 30 September
2010 2009 Note R’000 R’000
ASSETSProperty, plant and equipment 9 857 471 599 746Deferred tax 10 23 967 20 030Investments 11 139 012 138 037Investment in associate 12 12 200 12 200Intangible assets 13 424 149 304 240
Non-current assets 1 456 799 1 074 253
Inventories 14 719 236 583 704Trade and other receivables 15 1 150 393 1 036 605Cash and cash equivalents 16 1 430 917 692 938
Current assets 3 300 546 2 313 247
Total assets 4 757 345 3 387 500
EQUITY AND LIABILITIESCapital and reservesIssued share capital 17.2 17 365 17 363Share premium 18 1 190 290 1 203 854Non-distributable reserves 19 349 061 77 494Retained income 1 357 939 1 001 942
Total shareholders’ funds 2 914 655 2 300 653Non-controlling interests 158 685 24 943
Total equity 3 073 340 2 325 596
Long-term borrowings 20 453 830 117 076Post-retirement medical liability 21 15 808 14 298Deferred tax 10 23 961 6 683
Non-current liabilities 493 599 138 057
Bank overdraft 16 – 221Trade and other payables 22 957 922 630 743Short-term borrowings 20 126 787 194 405Provisions 23 84 464 68 752Taxation payable 24.4 21 233 29 726
Current liabilities 1 190 406 923 847
Total equity and liabilities 4 757 345 3 387 500
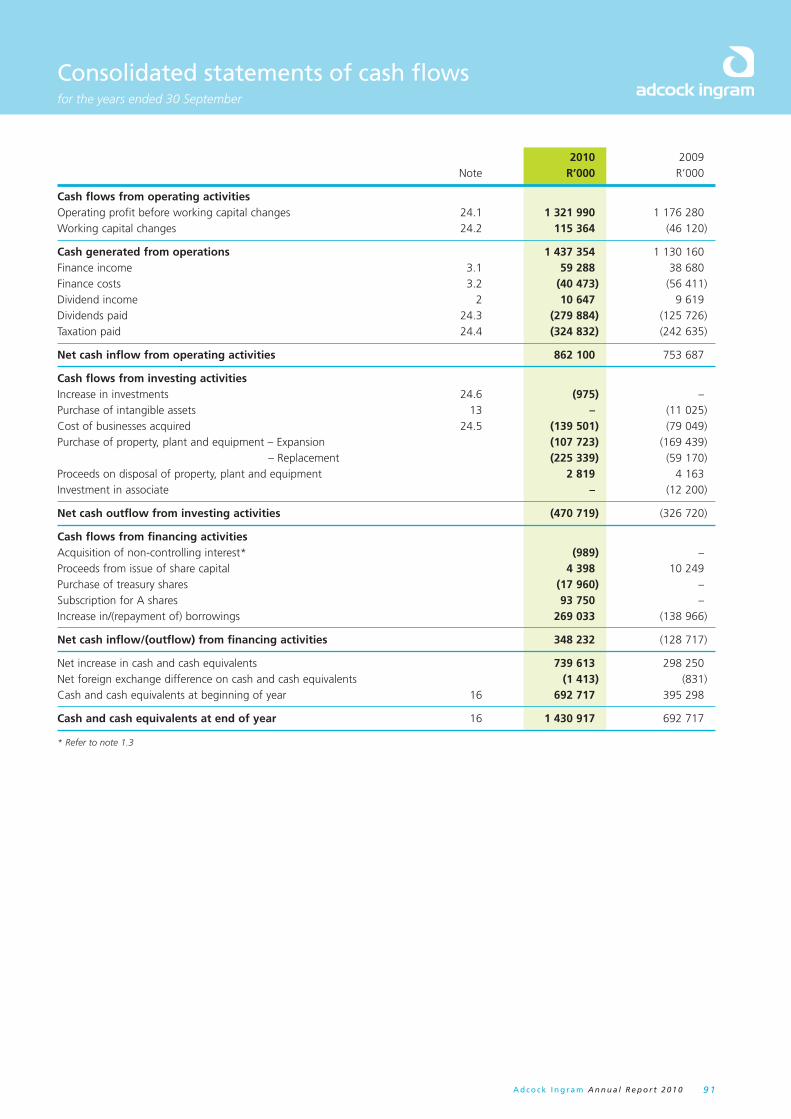
A d c o c k I n g r a m A n n u a l R e p o r t 2 0 1 0 9 1
Consolidated statements of cash fl owsfor the years ended 30 September
2010 2009 Note R’000 R’000
Cash flows from operating activitiesOperating profit before working capital changes 24.1 1 321 990 1 176 280Working capital changes 24.2 115 364 (46 120)
Cash generated from operations 1 437 354 1 130 160Finance income 3.1 59 288 38 680Finance costs 3.2 (40 473) (56 411)Dividend income 2 10 647 9 619 Dividends paid 24.3 (279 884) (125 726)Taxation paid 24.4 (324 832) (242 635)
Net cash inflow from operating activities 862 100 753 687
Cash flows from investing activitiesIncrease in investments 24.6 (975) – Purchase of intangible assets 13 – (11 025)Cost of businesses acquired 24.5 (139 501) (79 049)Purchase of property, plant and equipment – Expansion (107 723) (169 439) – Replacement (225 339) (59 170)Proceeds on disposal of property, plant and equipment 2 819 4 163 Investment in associate – (12 200)
Net cash outflow from investing activities (470 719) (326 720)
Cash flows from financing activitiesAcquisition of non-controlling interest* (989) – Proceeds from issue of share capital 4 398 10 249 Purchase of treasury shares (17 960) –Subscription for A shares 93 750 –Increase in/(repayment of) borrowings 269 033 (138 966)
Net cash inflow/(outflow) from financing activities 348 232 (128 717)
Net increase in cash and cash equivalents 739 613 298 250Net foreign exchange difference on cash and cash equivalents (1 413) (831)Cash and cash equivalents at beginning of year 16 692 717 395 298
Cash and cash equivalents at end of year 16 1 430 917 692 717
* Refer to note 1.3
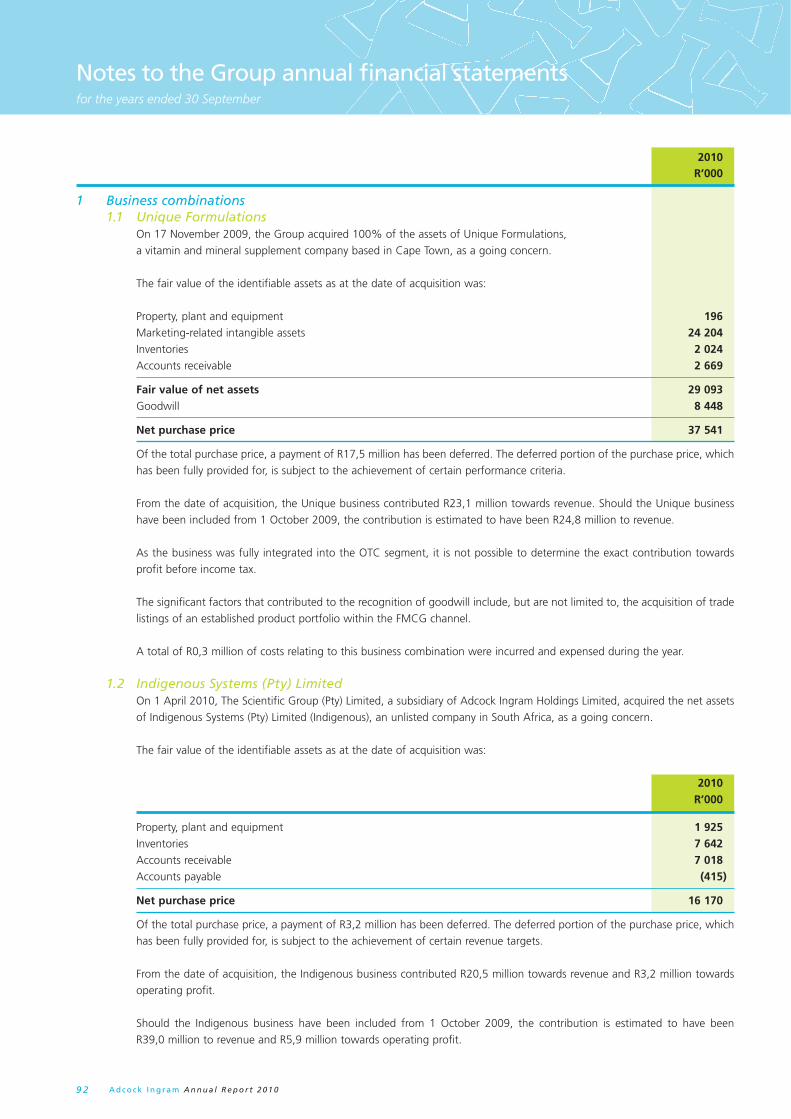
A d c o c k I n g r a m A n n u a l R e p o r t 2 0 1 09 2
Notes to the Group annual fi nancial statementsfor the years ended 30 September
2010 R’000
1 Business combinations 1.1 Unique Formulations On 17 November 2009, the Group acquired 100% of the assets of Unique Formulations,
a vitamin and mineral supplement company based in Cape Town, as a going concern.
The fair value of the identifiable assets as at the date of acquisition was:
Property, plant and equipment 196 Marketing-related intangible assets 24 204 Inventories 2 024 Accounts receivable 2 669
Fair value of net assets 29 093 Goodwill 8 448
Net purchase price 37 541
Of the total purchase price, a payment of R17,5 million has been deferred. The deferred portion of the purchase price, which
has been fully provided for, is subject to the achievement of certain performance criteria.
From the date of acquisition, the Unique business contributed R23,1 million towards revenue. Should the Unique business
have been included from 1 October 2009, the contribution is estimated to have been R24,8 million to revenue.
As the business was fully integrated into the OTC segment, it is not possible to determine the exact contribution towards
profit before income tax.
The significant factors that contributed to the recognition of goodwill include, but are not limited to, the acquisition of trade
listings of an established product portfolio within the FMCG channel.
A total of R0,3 million of costs relating to this business combination were incurred and expensed during the year.
1.2 Indigenous Systems (Pty) Limited On 1 April 2010, The Scientific Group (Pty) Limited, a subsidiary of Adcock Ingram Holdings Limited, acquired the net assets
of Indigenous Systems (Pty) Limited (Indigenous), an unlisted company in South Africa, as a going concern.
The fair value of the identifiable assets as at the date of acquisition was:
2010 R’000
Property, plant and equipment 1 925 Inventories 7 642 Accounts receivable 7 018 Accounts payable (415)
Net purchase price 16 170
Of the total purchase price, a payment of R3,2 million has been deferred. The deferred portion of the purchase price, which
has been fully provided for, is subject to the achievement of certain revenue targets.
From the date of acquisition, the Indigenous business contributed R20,5 million towards revenue and R3,2 million towards
operating profit.
Should the Indigenous business have been included from 1 October 2009, the contribution is estimated to have been
R39,0 million to revenue and R5,9 million towards operating profit.

A d c o c k I n g r a m A n n u a l R e p o r t 2 0 1 0 9 3
Notes to the Group annual fi nancial statements continuedfor the years ended 30 September
2010 R’000
1. Business combinations continued 1.3 Ayrton Drug Manufacturing Limited On 1 April 2010, Adcock Ingram International (Pty) Limited, a wholly owned subsidiary of
Adcock Ingram Holdings Limited, acquired a 65,59% stake in a leading listed Ghanaian pharmaceutical company, Ayrton Drug Manufacturing Limited (Ayrton) for R121 million.
The fair value of the identifiable assets as at the date of acquisition was:
Property, plant and equipment 20 355 Marketing-related intangible assets 28 295 Customer-related intangible assets 9 141 Other intangibles 1 211 Cash and cash equivalents 14 417 Inventories 20 299 Accounts receivable 23 778 Accounts payable (10 028) Receiver of Revenue (1 465) Deferred tax (9 359) Non-controlling interests (33 636)
Fair value of net assets 63 008 Cash and cash equivalents (14 417) Goodwill 57 869
Net purchase price 106 460
Following the initial transaction, Adcock Ingram International (Pty) Limited acquired an additional 0,59% of the shares of Ayrton for R1 million, increasing its ownership to 66,18% at 30 September 2010. Adcock has placed an order on the Ghanaian stock exchange to purchase additional shares at GH¢0,16.
From the date of acquisition, the Ayrton business contributed R44,3 million towards revenue and R9,7 million towards operating profit.
Should the Ayrton business have been included from 1 October 2009, the contribution is estimated to have been R85,7 million to revenue and R19,4 million towards operating profit.
Goodwill represents the difference between the purchase consideration and the fair value of the net assets acquired as there are no further separately identifiable intangible assets. The significant factors that contributed to the recognition of goodwill include, but are not limited to, the establishment of a presence within the Western African markets, with local management and distribution capabilities to drive the Group’s product sales into the various channels and customers that exist within those markets.
A total of R1,9 million of costs relating to this business combination were incurred and expensed during the year.

A d c o c k I n g r a m A n n u a l R e p o r t 2 0 1 09 4
Notes to the Group annual fi nancial statements continuedfor the years ended 30 September
2009 R’000
1. Business combinations continued
1.4 Tender Loving Care – Hygienic, Cosmetic and Baby Products (Pty) Limited (TLC)
On 2 April 2009, Adcock Ingram Holdings Limited acquired 100% of the shareholding in TLC,
an unlisted company in South Africa.
The fair value of the identifiable assets as at the date of acquisition was:
Property, plant and equipment 817
Other intangibles 65 248
Cash and cash equivalents 1 346
Inventories 11 707
Accounts receivable 12 746
Short-term borrowings (16 151)
Accounts payable (7 335)
Deferred tax (21)
Receiver of Revenue (3 284)
Long-term borrowings (73)
Fair value of net assets 65 000
Cash and cash equivalents (1 346)
Goodwill 15 395
Net purchase price 79 049
Of the total purchase price, a payment of R30 million was deferred. The deferred portion of the purchase price, which was
fully provided for, was subject to the achievement of certain performance criteria.
From the date of acquisition, TLC contributed R26,9 million towards revenue and R4,9 million towards operating profit.
Should the TLC business have been included from 1 October 2008, the contribution is estimated to have been R46,0 million
to revenue and R8,3 million towards operating profit.
The significant factors that contributed to the recognition of goodwill include, but are not limited to, the acquisition of trade
listings of an established product portfolio within the FMCG channel.
Of the deferred amount of R30 million, a total of R28,1 million was paid during 2010 and the balance was forfeited by the
sellers. Refer to note 13.
1.5 Batswadi Biotech (Pty) Limited On 1 April 2009, Adcock Ingram Limited acquired 45% of Batswadi Biotech (Pty) Limited, an unlisted company in
South Africa.
2009 R’000
Net cash purchase price 12 200
Of the total purchase price, a payment of R10,2 million was deferred. The deferred portion of the purchase price, was fully
provided for at 30 September 2009, subject to the achievement of certain performance criteria, and was subsequently paid
at the end of October 2009.
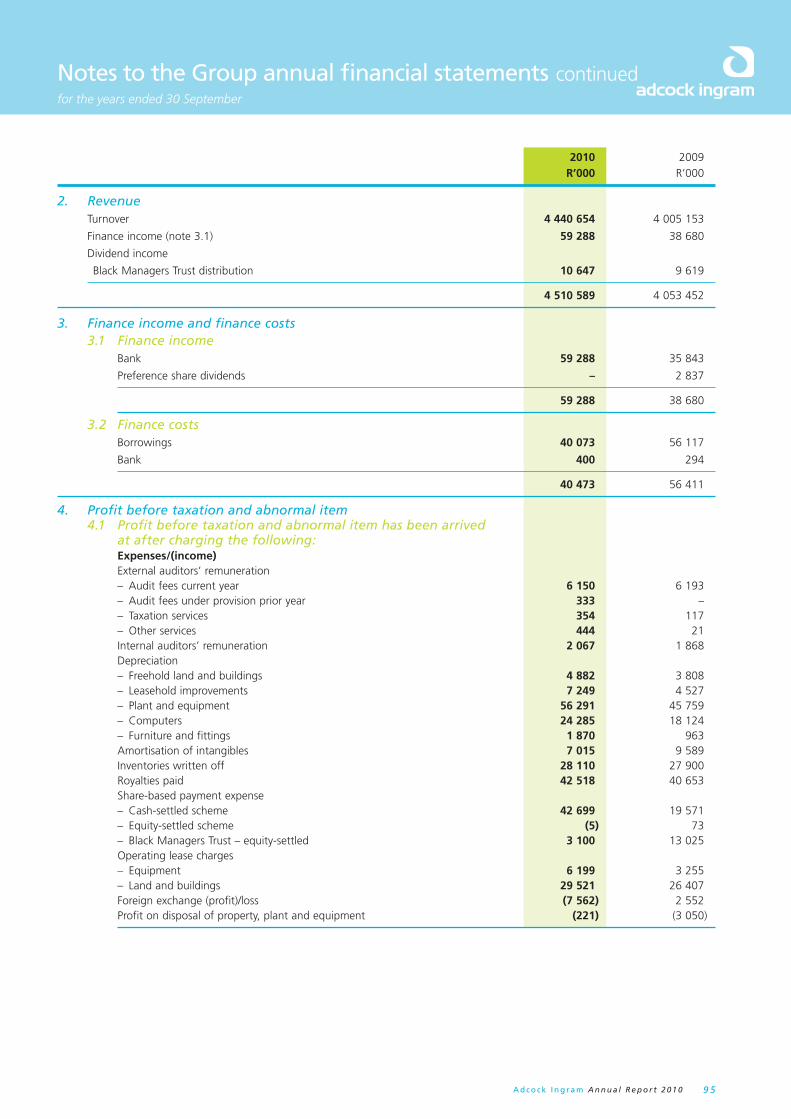
A d c o c k I n g r a m A n n u a l R e p o r t 2 0 1 0 9 5
Notes to the Group annual fi nancial statements continuedfor the years ended 30 September
2010 2009 R’000 R’000
2. Revenue Turnover 4 440 654 4 005 153
Finance income (note 3.1) 59 288 38 680
Dividend income
Black Managers Trust distribution 10 647 9 619
4 510 589 4 053 452
3. Finance income and finance costs 3.1 Finance income Bank 59 288 35 843
Preference share dividends – 2 837
59 288 38 680
3.2 Finance costs Borrowings 40 073 56 117
Bank 400 294
40 473 56 411
4. Profit before taxation and abnormal item 4.1 Profit before taxation and abnormal item has been arrived
at after charging the following: Expenses/(income) External auditors’ remuneration – Audit fees current year 6 150 6 193 – Audit fees under provision prior year 333 – – Taxation services 354 117 – Other services 444 21 Internal auditors’ remuneration 2 067 1 868 Depreciation – Freehold land and buildings 4 882 3 808 – Leasehold improvements 7 249 4 527 – Plant and equipment 56 291 45 759 – Computers 24 285 18 124 – Furniture and fittings 1 870 963 Amortisation of intangibles 7 015 9 589 Inventories written off 28 110 27 900 Royalties paid 42 518 40 653 Share-based payment expense – Cash-settled scheme 42 699 19 571 – Equity-settled scheme (5) 73 – Black Managers Trust – equity-settled 3 100 13 025 Operating lease charges – Equipment 6 199 3 255 – Land and buildings 29 521 26 407 Foreign exchange (profit)/loss (7 562) 2 552 Profit on disposal of property, plant and equipment (221) (3 050)
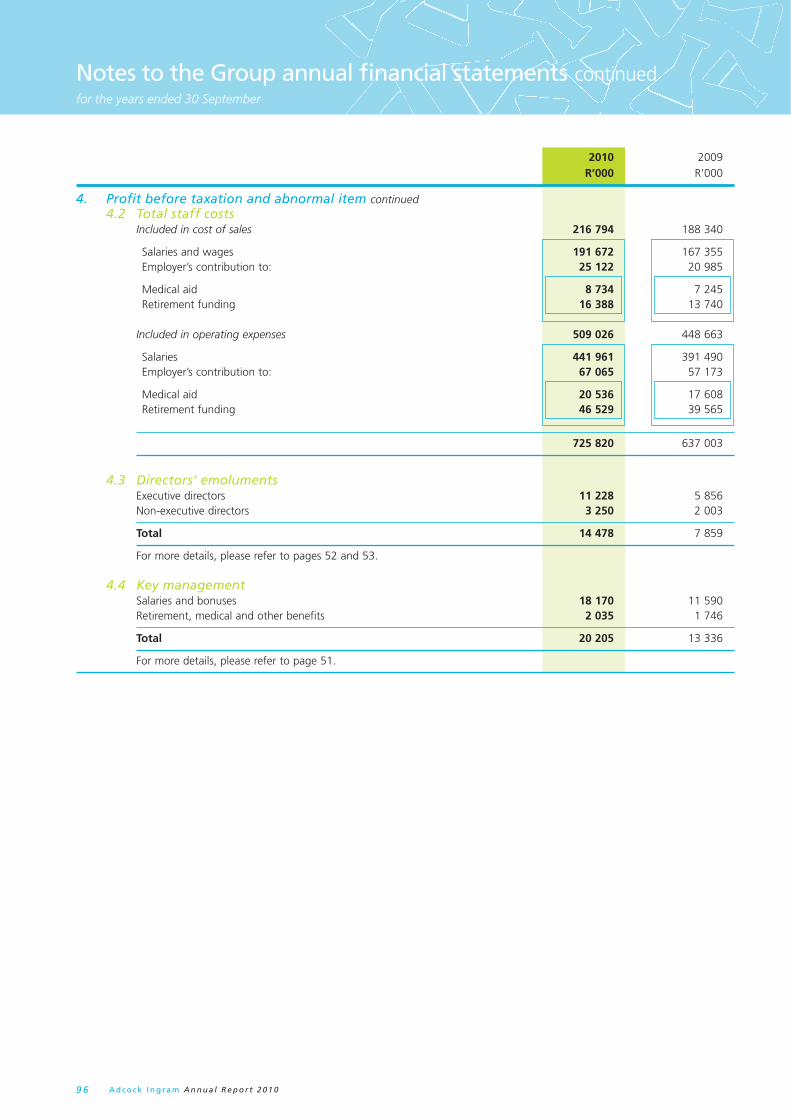
A d c o c k I n g r a m A n n u a l R e p o r t 2 0 1 09 6
Notes to the Group annual fi nancial statements continuedfor the years ended 30 September
2010 2009 R’000 R’000
4. Profit before taxation and abnormal item continued 4.2 Total staff costs Included in cost of sales 216 794 188 340
Salaries and wages 191 672 167 355 Employer’s contribution to: 25 122 20 985
Medical aid 8 734 7 245 Retirement funding 16 388 13 740
Included in operating expenses 509 026 448 663
Salaries 441 961 391 490 Employer’s contribution to: 67 065 57 173
Medical aid 20 536 17 608 Retirement funding 46 529 39 565
725 820 637 003
4.3 Directors’ emoluments Executive directors 11 228 5 856 Non-executive directors 3 250 2 003
Total 14 478 7 859
For more details, please refer to pages 52 and 53.
4.4 Key management Salaries and bonuses 18 170 11 590 Retirement, medical and other benefits 2 035 1 746
Total 20 205 13 336
For more details, please refer to page 51.
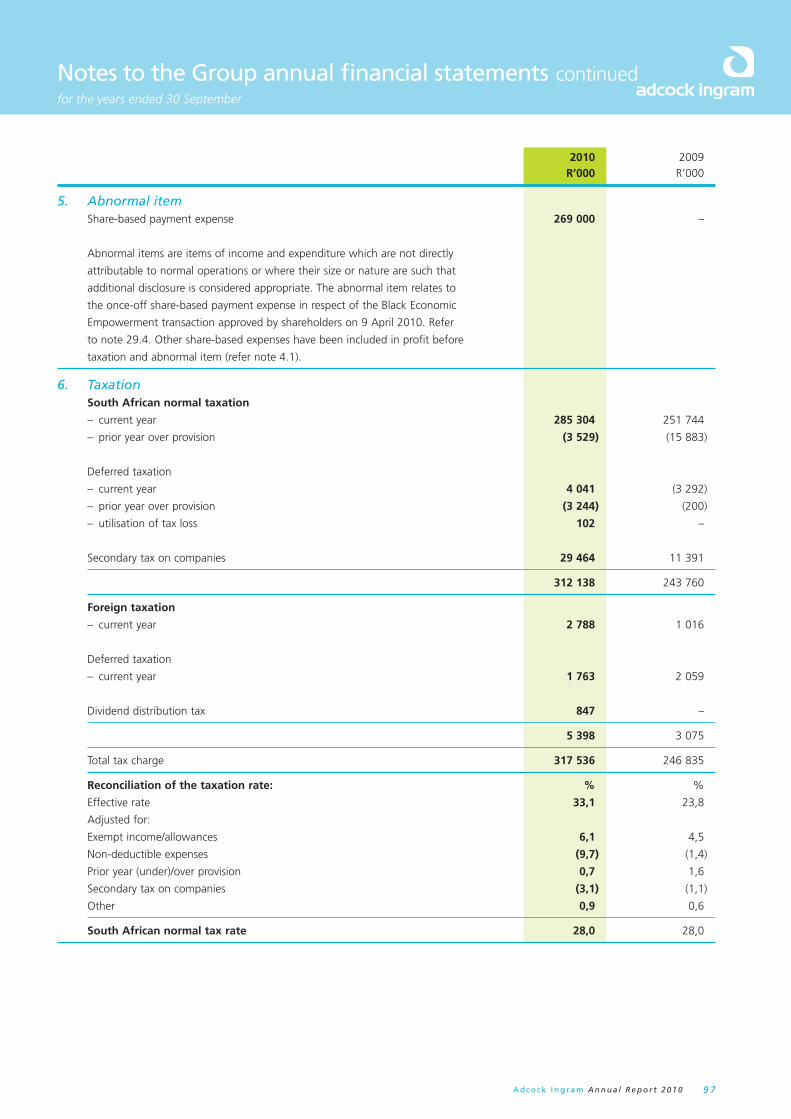
A d c o c k I n g r a m A n n u a l R e p o r t 2 0 1 0 9 7
Notes to the Group annual fi nancial statements continuedfor the years ended 30 September
2010 2009 R’000 R’000
5. Abnormal item Share-based payment expense 269 000 –
Abnormal items are items of income and expenditure which are not directly
attributable to normal operations or where their size or nature are such that
additional disclosure is considered appropriate. The abnormal item relates to
the once-off share-based payment expense in respect of the Black Economic
Empowerment transaction approved by shareholders on 9 April 2010. Refer
to note 29.4. Other share-based expenses have been included in profit before
taxation and abnormal item (refer note 4.1).
6. Taxation South African normal taxation
– current year 285 304 251 744
– prior year over provision (3 529) (15 883)
Deferred taxation
– current year 4 041 (3 292)
– prior year over provision (3 244) (200)
– utilisation of tax loss 102 –
Secondary tax on companies 29 464 11 391
312 138 243 760
Foreign taxation
– current year 2 788 1 016
Deferred taxation
– current year 1 763 2 059
Dividend distribution tax 847 –
5 398 3 075
Total tax charge 317 536 246 835
Reconciliation of the taxation rate: % %
Effective rate 33,1 23,8
Adjusted for:
Exempt income/allowances 6,1 4,5
Non-deductible expenses (9,7) (1,4)
Prior year (under)/over provision 0,7 1,6
Secondary tax on companies (3,1) (1,1)
Other 0,9 0,6
South African normal tax rate 28,0 28,0

A d c o c k I n g r a m A n n u a l R e p o r t 2 0 1 09 8
Notes to the Group annual fi nancial statements continuedfor the years ended 30 September
7. Earnings per share Earnings per share is derived by dividing earnings attributable to owners of Adcock Ingram for the year by the weighted average
number of shares in issue.
Diluted earnings per share is derived by dividing earnings attributable to owners of Adcock Ingram for the year by the diluted
weighted average number of shares in issue. Diluted earnings per share reflect the potential dilution that could occur if all of the
Group’s outstanding share options were exercised and the effects of all dilutive potential shares resulting from the BEE transaction
are accounted for.
Number of shares
2010 2009
Reconciliation of diluted weighted average number of shares:
Weighted average number of ordinary shares in issue:
– Issued shares at the beginning of the year 173 625 578 173 055 168
– Effect of ordinary shares issued during the year 164 254 151 127
– Effect of ordinary treasury shares acquired during the year (77 367) –
Weighted average number of ordinary shares outstanding 173 712 465 173 206 295
Potential dilutive effect of outstanding share options 388 835 603 703
Diluted weighted average number of shares outstanding 174 101 300 173 809 998
Headline earnings per share is derived by dividing earnings attributable to owners of Adcock Ingram for the year, after appropriate
adjustments are made, by the weighted average number of shares in issue.
Headline earnings is determined as follows: R’000 R’000
Earnings attributable to owners of Adcock Ingram 631 459 782 396
Adjusted for:
Profit on disposal of property, plant and equipment (221) (3 050)
Headline earnings 631 238 779 346
NORMALISED EARNINGS PER SHARE
Normalised earnings and normalised headline earnings per share are derived by
adjusting earnings and headline earnings disclosed above by the abnormal item as
detailed in note 5 to derive a comparable number, divided by the weighted average
number of shares in issue.
Normalised earnings per share
Earnings as reported 631 459 782 396
Adjusted for:
Abnormal item 269 000 –
Normalised earnings before abnormal item 900 459 782 396
Normalised headline earnings per share
Headline earnings as reported 631 238 779 346
Adjusted for:
Abnormal item 269 000 –
Normalised headline earnings before abnormal item 900 238 779 346

A d c o c k I n g r a m A n n u a l R e p o r t 2 0 1 0 9 9
Notes to the Group annual fi nancial statements continuedfor the years ended 30 September
2010 2009
Cents Cents
7. Earnings per share continued
Earnings
Basic earnings per share 363,5 451,7
Diluted basic earnings per share 362,7 450,1
Headline earnings
Headline earnings per share 363,4 450,0
Diluted headline earnings per share 362,6 448,4
Normalised earnings
Normalised basic earnings per share 518,4 451,7
Normalised diluted basic earnings per share 517,2 450,1
Normalised headline earnings per share
Normalised headline earnings per share 518,2 450,0
Normalised diluted headline earnings per share 517,1 448,4
Dividends per share
Interim 78 70
Final* 102 80
* Declared subsequent to 30 September and has been presented for information purposes only. No liability regarding the final dividend has thus been recognised at 30 September.
2010 2009
R’000 R’000
8. Dividends paid and proposed Declared and paid during the year
Dividends on ordinary shares
Final dividend for 2009: 80 cents 139 112 –
Interim dividend for 2010: 78 cents (2009: 70 cents) 155 664 120 571
Total paid to equity holders of parent Company 294 776 120 571
Less: Dividends relating to treasury shares (20 236) –
Total dividends declared and paid to the public 274 540 120 571
Dividends paid to non-controlling shareholders 5 344 5 155
279 884 125 726
Proposed for approval at the Annual General Meeting
Dividends on ordinary shares
Final dividend for 2010: 102 cents per share (2009: 80 cents per share) 203 902 138 900
In terms of current legislation, the proposed dividend would result in a secondary tax on companies liability of R20,4 million.

A d c o c k I n g r a m A n n u a l R e p o r t 2 0 1 01 0 0
Freehold Leasehold Furniture
land and improve- Plant and Computer and Work in
buildings ments equipment equipment fittings progress Total
R’000 R’000 R’000 R’000 R’000 R’000 R’000
9. Property, plant and equipment
2010
Carrying value at beginning
of year
Cost 169 054 68 845 444 418 71 015 15 219 117 809 886 360
Accumulated depreciation (26 074) (7 772) (203 926) (38 008) (10 834) – (286 614)
Net book value at
beginning of year 142 980 61 073 240 492 33 007 4 385 117 809 599 746
Current year movements
– cost
Transfer 3 465 7 088 29 583 380 – (40 516) –
Additions through business
combinations (note 1) 11 074 2 216 9 010 176 – – 22 476
Additions1 57 488 936 94 204 20 125 4 752 155 557 333 062
Exchange adjustments (571) (116) (790) (28) (3) – (1 508)
Disposals – (17) (28 555) (281) (1 290) – (30 143)
Cost movement for
current year 71 456 10 107 103 452 20 372 3 459 115 041 323 887
Current year movements
– accumulated depreciation
Depreciation (4 882) (7 249) (56 291) (24 285) (1 870) – (94 577)
Exchange adjustments 162 3 679 21 5 – 870
Disposals – – 26 618 279 648 – 27 545
Depreciation movement
for current year (4 720) (7 246) (28 994) (23 985) (1 217) – (66 162)
Carrying value at end of year
Cost 240 510 78 952 547 870 91 387 18 678 232 850 1 210 247
Accumulated depreciation (30 794) (15 018) (232 920) (61 993) (12 051) – (352 776)
Net book value at end
of year 209 716 63 934 314 950 29 394 6 627 232 850 857 471
1 Additions include interest capitalised in accordance with IAS 23, of R9,3 million. Refer to note 20.
Property, plant and equipment to the value of R69,3 million (2009: R67,5 million) in the Indian operations has been pledged as
security for the long-term borrowings of the Indian operations. Refer to note 20.
Notes to the Group annual fi nancial statements continuedfor the years ended 30 September

A d c o c k I n g r a m A n n u a l R e p o r t 2 0 1 0 1 0 1
Notes to the Group annual fi nancial statements continuedfor the years ended 30 September
Freehold Leasehold Furniture land and improve- Plant and Computer and Work in buildings ments equipment equipment fittings progress* Total R’000 R’000 R’000 R’000 R’000 R’000 R’000
9. Property, plant and equipment continued
2009 Carrying value at beginning
of year Cost 150 851 37 986 334 971 51 018 12 599 86 222 673 647 Accumulated depreciation (22 421) (3 276) (162 195) (21 927) (11 809) – (221 628 )
Net book value at beginning of year 128 430 34 710 172 776 29 091 790 86 222 452 019
Current year movements – cost Transfers (6 005) 8 139 (2 134) – – – – Additions through business
combinations (note 1) – – 299 30 488 – 817 Additions 31 080 24 975 114 869 22 010 4 088 31 587 228 609 Exchange adjustments (6 872) – (938) 7 6 – (7 797) Disposals – (2 255) (2 649) (2 050) (1 962) – (8 916)
Cost movement for current year 18 203 30 859 109 447 19 997 2 620 31 587 212 713
Current year movements – accumulated depreciation
Transfers – (2 115) 2 115 – – – – Depreciation (3 808) (4 527) (45 759) (18 124) (963) – (73 181) Exchange adjustments 155 – 213 16 8 – 392 Disposals – 2 146 1 700 2 027 1 930 – 7 803
Depreciation movement for current year (3 653) (4 496) (41 731) (16 081) 975 – (64 986)
Carrying value at end of year Cost 169 054 68 845 444 418 71 015 15 219 117 809 886 360 Accumulated depreciation (26 074) (7 772) (203 926) (38 008) (10 834) – (286 614)
Net book value at end of year 142 980 61 073 240 492 33 007 4 385 117 809 599 746
The information required by Schedule 4 of the Companies Act in respect of land and buildings and details of valuations are contained in the register of fixed property which is available for inspection by members or their duly authorised agents at the Group’s registered office.
The land and buildings were independently valued at 30 September 2009 by The Property Partnership. The basis used for the valuation was depreciated replacement cost. There was no indication of impairment. Land and buildings are carried at cost less accumulated depreciation and accumulated impairment. It is the policy of the Group to perform revaluation of land and buildings every four years.
* In the prior year, work in progress was allocated to the various categories of assets, as follows:
Opening Closing balance balance cost Additions cost R’000 R’000 R’000
Freehold land and buildings 45 234 10 582 55 816 Leasehold improvements 5 885 1 622 7 507 Plant and equipment 35 103 18 764 53 867 Computer equipment – 619 619
86 222 31 587 117 809

A d c o c k I n g r a m A n n u a l R e p o r t 2 0 1 01 0 2
Notes to the Group annual fi nancial statements continuedfor the years ended 30 September
2010 2009 R’000 R’000
10. Deferred tax Balance at beginning of year 13 347 8 434 Additions through business combinations (note 1) (9 359) (21) Comprehensive income statement movement (2 662) 1 433 Deferred tax adjustment on foreign exchange differences taken to other
comprehensive income 91 408 Revaluations of foreign currency contracts (cash flow hedges) to fair value (1 411) 3 058 Other – 35
Balance at end of year 6 13 347
Analysis of deferred tax This balance comprises the following temporary differences: Trademarks (8 617) – Pension fund surplus receivable – (1 443) Property, plant and equipment (27 117) (11 668) Prepayments (1 946) (440) Provision for impairment of accounts receivable 726 723 Provisions 35 151 22 785 Revaluations of foreign currency contracts (cash flow hedges) to fair value 1 647 3 058 Other 162 332
6 13 347
Disclosed as follows: Deferred tax asset 23 967 20 030 Deferred tax liability (23 961) (6 683)
11. Investments Black Managers Trust 137 430 138 037 Group Risk Holdings (Pty) Limited 1 582 –
Directors’ valuation of unlisted investments 139 012 138 037
12. Investment in associate Cost of investment 12 200 12 200 Share of post acquisition profit net of dividend received * *
12 200 12 200
* Less than R1 000.
Goodwill Other intangibles Total R’000 R’000 R’000
13. Intangible assets 2010 Net balance at beginning of year 29 106 275 134 304 240 Business combinations (note 1) 66 317 62 851 129 168 Adjustment to goodwill* (1 940) – (1 940) Exchange adjustment 3 (307) (304) Amortisation – (7 015) (7 015)
Net balance at end of year 93 486 330 663 424 149
2009 Net balance at beginning of year 13 736 208 450 222 186 Business combinations (note 1) 15 395 65 248 80 643 Additions – 11 025 11 025 Exchange adjustment (25) – (25) Amortisation – (9 589) (9 589)
Net balance at end of year 29 106 275 134 304 240
* An accrual was raised during the prior year for the deferred portion of the acquisition price for the TLC business combination which was unpaid at September
2009. Subsequently, a portion of the deferred amount was not paid and reversed against goodwill. Refer to note 1.4.
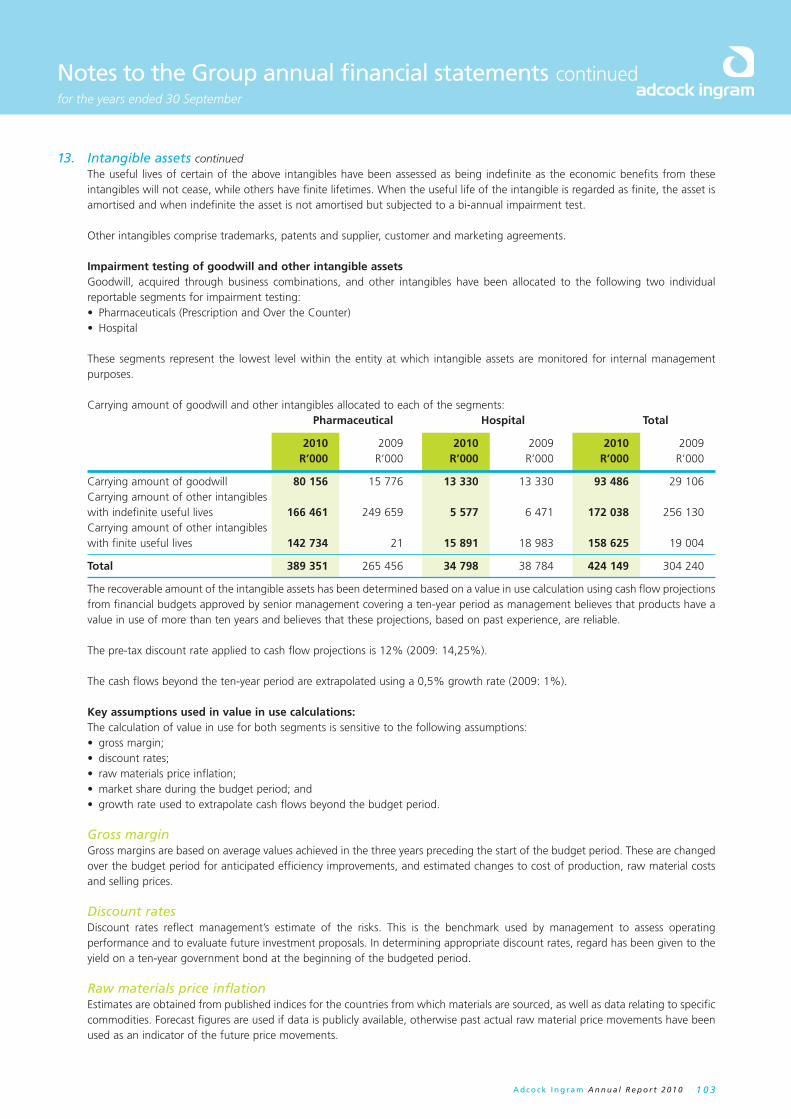
A d c o c k I n g r a m A n n u a l R e p o r t 2 0 1 0 1 0 3
Notes to the Group annual fi nancial statements continuedfor the years ended 30 September
13. Intangible assets continued The useful lives of certain of the above intangibles have been assessed as being indefinite as the economic benefits from these
intangibles will not cease, while others have finite lifetimes. When the useful life of the intangible is regarded as finite, the asset is amortised and when indefinite the asset is not amortised but subjected to a bi-annual impairment test.
Other intangibles comprise trademarks, patents and supplier, customer and marketing agreements.
Impairment testing of goodwill and other intangible assets Goodwill, acquired through business combinations, and other intangibles have been allocated to the following two individual
reportable segments for impairment testing: • Pharmaceuticals (Prescription and Over the Counter) • Hospital
These segments represent the lowest level within the entity at which intangible assets are monitored for internal management purposes.
Carrying amount of goodwill and other intangibles allocated to each of the segments: Pharmaceutical Hospital Total
2010 2009 2010 2009 2010 2009 R’000 R’000 R’000 R’000 R’000 R’000
Carrying amount of goodwill 80 156 15 776 13 330 13 330 93 486 29 106 Carrying amount of other intangibles
with indefinite useful lives 166 461 249 659 5 577 6 471 172 038 256 130 Carrying amount of other intangibles
with finite useful lives 142 734 21 15 891 18 983 158 625 19 004
Total 389 351 265 456 34 798 38 784 424 149 304 240
The recoverable amount of the intangible assets has been determined based on a value in use calculation using cash flow projections from financial budgets approved by senior management covering a ten-year period as management believes that products have a value in use of more than ten years and believes that these projections, based on past experience, are reliable.
The pre-tax discount rate applied to cash flow projections is 12% (2009: 14,25%).
The cash flows beyond the ten-year period are extrapolated using a 0,5% growth rate (2009: 1%).
Key assumptions used in value in use calculations: The calculation of value in use for both segments is sensitive to the following assumptions: • gross margin; • discount rates; • raw materials price inflation; • market share during the budget period; and • growth rate used to extrapolate cash flows beyond the budget period.
Gross margin Gross margins are based on average values achieved in the three years preceding the start of the budget period. These are changed
over the budget period for anticipated efficiency improvements, and estimated changes to cost of production, raw material costs and selling prices.
Discount rates Discount rates reflect management’s estimate of the risks. This is the benchmark used by management to assess operating
performance and to evaluate future investment proposals. In determining appropriate discount rates, regard has been given to the yield on a ten-year government bond at the beginning of the budgeted period.
Raw materials price inflation Estimates are obtained from published indices for the countries from which materials are sourced, as well as data relating to specific
commodities. Forecast figures are used if data is publicly available, otherwise past actual raw material price movements have been used as an indicator of the future price movements.

A d c o c k I n g r a m A n n u a l R e p o r t 2 0 1 01 0 4
Notes to the Group annual fi nancial statements continuedfor the years ended 30 September
13. Intangible assets continued Market share assumptions These assumptions are important because, as well as using industry data for growth rates, management assesses how the unit’s
position, relative to its competitors, might change over the budget period. Management expects the Group’s share of the market to be relatively stable over the budget period.
Growth rate estimates The growth rate used beyond the next ten-year period is management’s best estimate taking market conditions into account.
Sensitivity to changes in assumptions With regard to the assessment of value in use, management believes that no reasonably foreseeable change in any of the above
key assumptions would cause the carrying value of the intangibles to materially exceed their recoverable amounts.
2010 2009 R’000 R’000
14. Inventories Raw materials 105 776 143 456 Work-in-progress 50 841 24 278 Finished goods 562 619 415 970
719 236 583 704
The amount of inventories written down and recognised as an expense in cost of inventories is: 28 110 27 900
15. Trade and other receivables Trade receivables 1 012 635 956 516 Less: Provision for credit notes (5 866) (16 117) Less: Provision for impairment (2 871) (2 863)
1 003 898 937 536 Pension fund surplus – 5 153 Prepayments 51 020 52 482 Other receivables 95 475 41 434
VAT recoverable 8 849 8 332 Bank interest receivable 1 683 6 958 Sundry receivables 84 943 26 144
The maximum exposure to credit risk in relation to trade and other receivables 1 150 393 1 036 605
Details in respect of the Group’s credit risk management policies are set out in note 26. The directors consider that the carrying amount of the trade and other receivables approximate their fair value.
Trade receivables are non-interest bearing and are generally on 30 – 90 days terms.
As at 30 September 2010, trade receivables at a nominal value of R0,77 million (2009: R0,75 million) were impaired and fully recognised as an expense. Trade receivables are impaired when the event of recoverability is highly unlikely.
Movements in the provision for impairment and credit notes were as follows: Individually Collectively Credit impaired impaired notes Total R’000 R’000 R’000 R’000
Balance at 1 October 2008 (4 930) (2 308) (5 185) (12 423) Charge for the year – – (10 932) (10 932) Utilised during the year – (6) – (6) Unused amounts reversed 4 381 – – 4 381
At 30 September 2009 (549) (2 314) (16 117) (18 980) Charge for the year (2 681) – (2 565) (5 246) Utilised during the year 230 6 6 819 7 055 Unused amounts reversed 129 2 308 5 997 8 434
At 30 September 2010 (2 871) – (5 866) (8 737)

A d c o c k I n g r a m A n n u a l R e p o r t 2 0 1 0 1 0 5
Notes to the Group annual fi nancial statements continuedfor the years ended 30 September
2010 2009 R’000 R’000
15. Trade and other receivables continued At 30 September, the age analysis of trade receivables is as follows: Neither past due nor impaired <30 days 690 916 581 172 31 – 60 days 260 587 287 287 61 – 90 days 38 461 38 287 Past due but not impaired 91 – 180 days 9 283 24 007 >180 days 13 388 25 763 Provision for impairment and credit notes (8 737) (18 980)
Total 1 003 898 937 536
16. Cash and cash equivalents Cash at banks 1 430 917 692 938 Bank overdraft – (221)
1 430 917 692 717
Cash at banks earns interest at floating rates based on daily bank deposit rates.
The fair value of cash is R1 431 million (2009: R693 million).
There are no restrictions over any of the cash balances and all balances are available for use.
17. Share capital 17.1 Authorised1
Ordinary share capital 250 000 000 ordinary shares of 10 cents each 25 000 25 000 19 458 196 A shares of 10 cents each 1 946 6 486 065 B shares of 10 cents each 649
17.2 Issued2
Ordinary share capital Opening balance of 173 625 578 shares (2009: 173 055 168) of 10 cents each 17 363 17 306 Issue of 334 240 ordinary shares (2009: 570 410) of 10 cents each 33 57 Issue of 19 458 196 A shares of 10 cents each 1 946 Issue of 6 486 065 B shares of 10 cents each 649 Movement in A and B treasury shares (2 595) Movement in ordinary treasury shares (31)
17 365 17 363
Number of shares 17.3 Treasury shares4
Shares held by the BEE participants – number of A shares 19 458 196 – number of B shares 6 486 065 – number of ordinary shares 308 903
26 253 164
17.4 Reconciliation of issued shares Number of shares in issue 199 904 079 173 625 578 Number of A and B shares held by the BEE participants (25 944 261) Number of ordinary shares held by the BEE participants (308 903)
Net shares in issue 173 650 915 173 625 578

A d c o c k I n g r a m A n n u a l R e p o r t 2 0 1 01 0 6
Notes to the Group annual fi nancial statements continuedfor the years ended 30 September
17. Share capital continued 17.4 Reconciliation of issued shares continued (1) Authorised share capital The authorised share capital was increased during the current year in terms of article 8.1 of the Articles of Association
of the Company, with the creation of: (i) 19 458 196 automatically convertible A ordinary shares with a par value of 10 cents each; and (ii) 6 486 065 automatically convertible B ordinary shares with a par value of 10 cents each.
having the rights and privileges and being subject to terms and conditions as set out in note 29.4.
(2) Issued share capital The following ordinary shares were issued during the year: (i) In various tranches, 334 240 ordinary shares were issued to meet the obligations of the Adcock Ingram (2008) Share
Option Scheme, refer to note 29.2; (ii) On 5 May 2010, A ordinary shares were issued to Blue Falcon Trading 69 (Pty) Limited, a company through which
the Strategic Partners participating in the BEE transaction hold their equity interest in Adcock Ingram; (iii) On 5 May 2010, B ordinary shares were issued in terms of the BEE transaction, to the Mpho ea Bophelo Trust for
the benefit of qualifying employees.
Terms and conditions of the A and B ordinary shares as per sections 43 and 44 of the Articles of Association:
A and B ordinary shares rank pari passu with the ordinary shares, save that: (i) these A and B ordinary shareholders shall not participate in any special dividends declared or paid by the Company,
unless the respective notional outstanding loan balances become zero at any time prior to the respective release dates, in which event these A and B ordinary shares shall be entitled to participate in all special dividends declared or paid by the Company;
(ii) A and B ordinary shares shall remain certificated and shall not be listed on any stock exchange; (iii) for so long as the ordinary shares are listed on the JSE, the rights attaching to these A and B ordinary shares may
not be amended in any material respect without the prior written approval of the JSE; and (iv) these terms and conditions may only be amended as prescribed by article 43 and 44 of the Articles of Association
of the Company.
(3) Unissued shares The unissued shares are under the control of the directors subject to a limit of 10% of issued ordinary share capital, in
terms of a general authority to allot and issue them on such terms and conditions and at such times as they deem fit. This authority expires at the forthcoming annual general meeting of the Company.
The Group has a share incentive trust in terms of which shares are issued and share options are granted. Refer to note 29.4. As required by IFRS and the JSE Limited, the share incentive trust has been consolidated into the Group’s annual financial statements.
(4) Treasury shares As required by IFRS, both Blue Falcon Trading 69 (Pty) Limited and the Mpho ea Bophelo Trust have been consolidated
into the Group’s annual financial statements and all A, B and ordinary shares held by them have been accounted for as treasury shares.
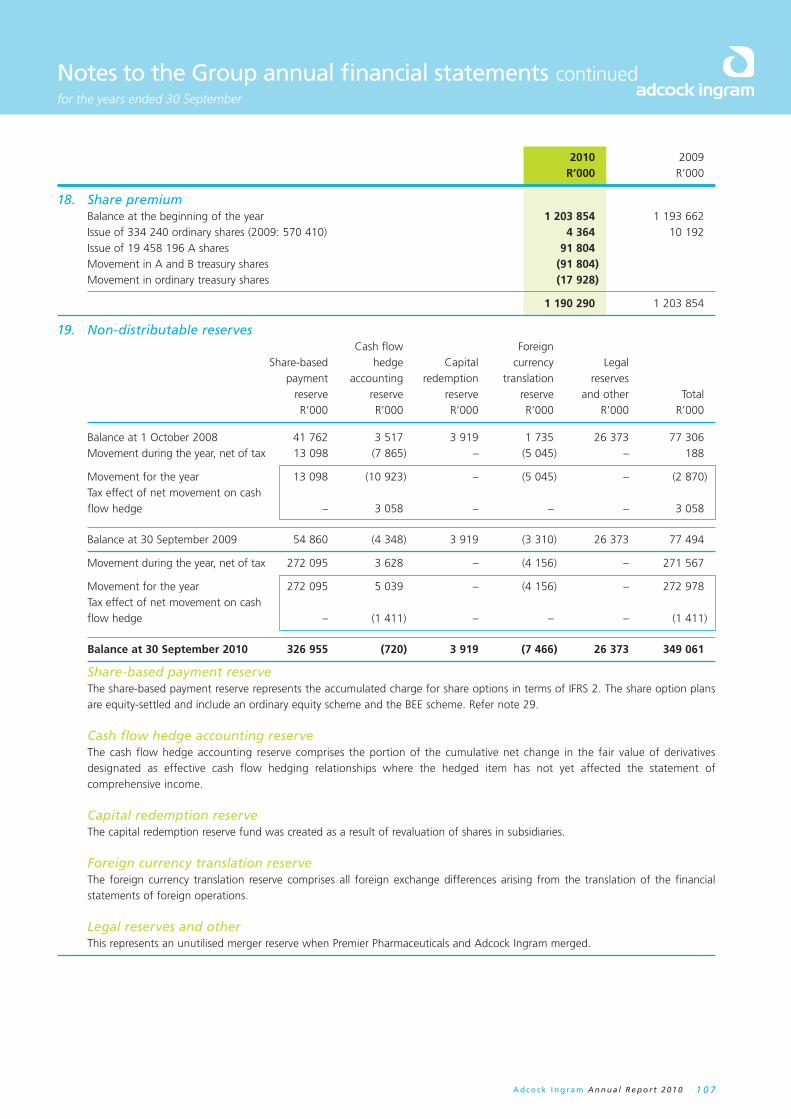
A d c o c k I n g r a m A n n u a l R e p o r t 2 0 1 0 1 0 7
Notes to the Group annual fi nancial statements continuedfor the years ended 30 September
2010 2009 R’000 R’000
18. Share premium Balance at the beginning of the year 1 203 854 1 193 662 Issue of 334 240 ordinary shares (2009: 570 410) 4 364 10 192 Issue of 19 458 196 A shares 91 804 Movement in A and B treasury shares (91 804) Movement in ordinary treasury shares (17 928)
1 190 290 1 203 854
19. Non-distributable reserves Cash flow Foreign Share-based hedge Capital currency Legal payment accounting redemption translation reserves reserve reserve reserve reserve and other Total R’000 R’000 R’000 R’000 R’000 R’000
Balance at 1 October 2008 41 762 3 517 3 919 1 735 26 373 77 306 Movement during the year, net of tax 13 098 (7 865) – (5 045) – 188
Movement for the year 13 098 (10 923) – (5 045) – (2 870) Tax effect of net movement on cash
flow hedge – 3 058 – – – 3 058
Balance at 30 September 2009 54 860 (4 348) 3 919 (3 310) 26 373 77 494
Movement during the year, net of tax 272 095 3 628 – (4 156) – 271 567
Movement for the year 272 095 5 039 – (4 156) – 272 978 Tax effect of net movement on cash
flow hedge – (1 411) – – – (1 411)
Balance at 30 September 2010 326 955 (720) 3 919 (7 466) 26 373 349 061
Share-based payment reserve The share-based payment reserve represents the accumulated charge for share options in terms of IFRS 2. The share option plans
are equity-settled and include an ordinary equity scheme and the BEE scheme. Refer note 29.
Cash flow hedge accounting reserve The cash flow hedge accounting reserve comprises the portion of the cumulative net change in the fair value of derivatives
designated as effective cash flow hedging relationships where the hedged item has not yet affected the statement of comprehensive income.
Capital redemption reserve The capital redemption reserve fund was created as a result of revaluation of shares in subsidiaries.
Foreign currency translation reserve The foreign currency translation reserve comprises all foreign exchange differences arising from the translation of the financial
statements of foreign operations.
Legal reserves and other This represents an unutilised merger reserve when Premier Pharmaceuticals and Adcock Ingram merged.
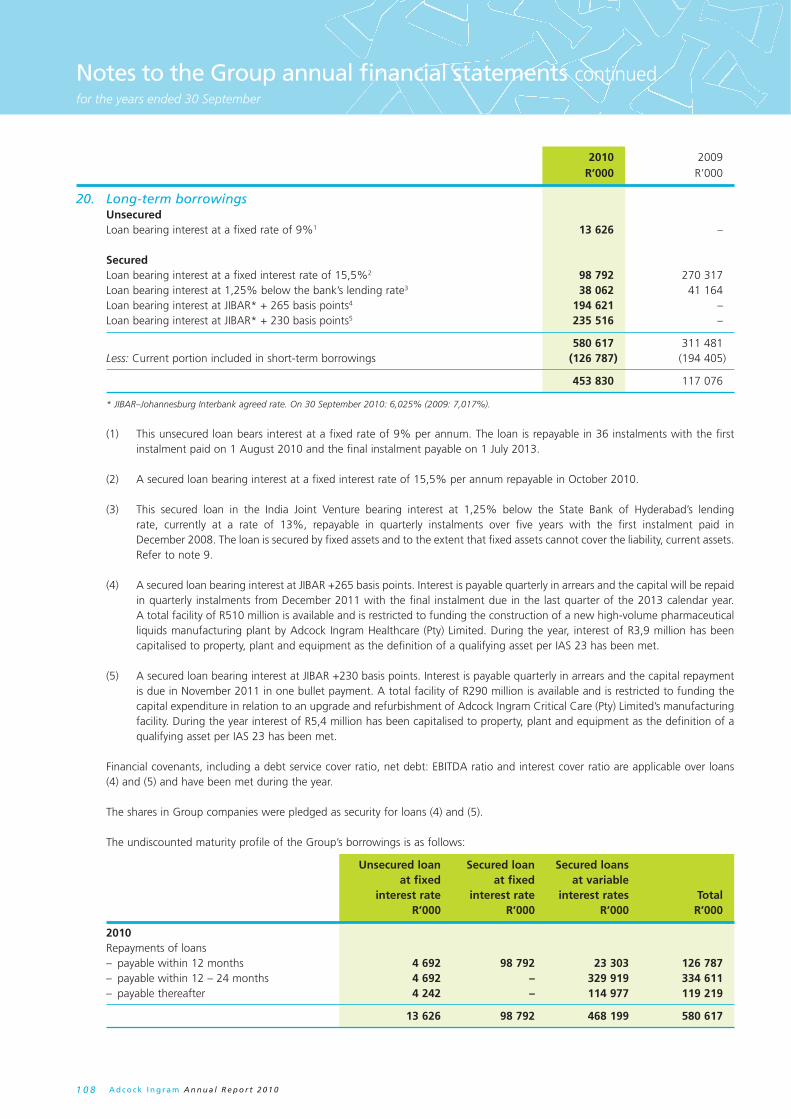
A d c o c k I n g r a m A n n u a l R e p o r t 2 0 1 01 0 8
Notes to the Group annual fi nancial statements continuedfor the years ended 30 September
2010 2009 R’000 R’000
20. Long-term borrowings Unsecured Loan bearing interest at a fixed rate of 9%1 13 626 –
Secured Loan bearing interest at a fixed interest rate of 15,5%2 98 792 270 317 Loan bearing interest at 1,25% below the bank’s lending rate3 38 062 41 164 Loan bearing interest at JIBAR* + 265 basis points4 194 621 – Loan bearing interest at JIBAR* + 230 basis points5 235 516 –
580 617 311 481 Less: Current portion included in short-term borrowings (126 787) (194 405)
453 830 117 076
* JIBAR–Johannesburg Interbank agreed rate. On 30 September 2010: 6,025% (2009: 7,017%).
(1) This unsecured loan bears interest at a fixed rate of 9% per annum. The loan is repayable in 36 instalments with the first instalment paid on 1 August 2010 and the final instalment payable on 1 July 2013.
(2) A secured loan bearing interest at a fixed interest rate of 15,5% per annum repayable in October 2010.
(3) This secured loan in the India Joint Venture bearing interest at 1,25% below the State Bank of Hyderabad’s lending rate, currently at a rate of 13%, repayable in quarterly instalments over five years with the first instalment paid in December 2008. The loan is secured by fixed assets and to the extent that fixed assets cannot cover the liability, current assets. Refer to note 9.
(4) A secured loan bearing interest at JIBAR +265 basis points. Interest is payable quarterly in arrears and the capital will be repaid in quarterly instalments from December 2011 with the final instalment due in the last quarter of the 2013 calendar year. A total facility of R510 million is available and is restricted to funding the construction of a new high-volume pharmaceutical liquids manufacturing plant by Adcock Ingram Healthcare (Pty) Limited. During the year, interest of R3,9 million has been capitalised to property, plant and equipment as the definition of a qualifying asset per IAS 23 has been met.
(5) A secured loan bearing interest at JIBAR +230 basis points. Interest is payable quarterly in arrears and the capital repayment is due in November 2011 in one bullet payment. A total facility of R290 million is available and is restricted to funding the capital expenditure in relation to an upgrade and refurbishment of Adcock Ingram Critical Care (Pty) Limited’s manufacturing facility. During the year interest of R5,4 million has been capitalised to property, plant and equipment as the definition of a qualifying asset per IAS 23 has been met.
Financial covenants, including a debt service cover ratio, net debt: EBITDA ratio and interest cover ratio are applicable over loans (4) and (5) and have been met during the year.
The shares in Group companies were pledged as security for loans (4) and (5).
The undiscounted maturity profile of the Group’s borrowings is as follows:
Unsecured loan Secured loan Secured loans at fixed at fixed at variable interest rate interest rate interest rates Total R’000 R’000 R’000 R’000
2010 Repayments of loans – payable within 12 months 4 692 98 792 23 303 126 787 – payable within 12 – 24 months 4 692 – 329 919 334 611 – payable thereafter 4 242 – 114 977 119 219
13 626 98 792 468 199 580 617

A d c o c k I n g r a m A n n u a l R e p o r t 2 0 1 0 1 0 9
Notes to the Group annual fi nancial statements continuedfor the years ended 30 September
20. Long-term borrowings continued
Unsecured loan Secured loan Secured loans
at fixed at fixed at variable
interest rate interest rate interest rates Total
R’000 R’000 R’000 R’000
2009
Repayments of loans
– payable within 12 months – 177 682 16 723 194 405
– payable within 12 – 24 months – 92 635 7 643 100 278
– payable thereafter – – 16 798 16 798
– 270 317 41 164 311 481
21. Retirement and post-retirement benefit plans Pension obligations The Company and its subsidiaries contribute to a retirement contribution plan for all employees. These contributions are expensed.
In addition, the Company and its subsidiaries contribute to a retirement benefit fund in respect of certain retirees. The defined
benefit plans are funded. The assets of the funds are held in independent trustee administered funds, administered in terms of the
Pension Funds Act of 1956 (Act 24), as amended. Funds must, in terms of the Pension Funds Act, be valued at least every three
years. The last full actuarial valuation was done on 30 September 2009.
For purposes of production of these disclosures, and in order to comply with the requirements of IAS 19, valuations have been
performed by independent actuaries, using the projected unit credit method. Where valuations were not possible due to the limited
availability of complete data, roll forward projections of prior completed actuarial valuations were used, taking account of actual
subsequent experience.
The disclosure of the funded status is for accounting purposes only, and does not necessarily indicate any assets available to
the Group.
Post-retirement medical obligations The Company and its subsidiaries operate post-employment medical benefit schemes that cover certain of their employees and
retirees who were originally employed prior to certain cut off dates. The liabilities are valued annually using the projected unit credit
method. The latest full actuarial valuation was performed on 30 September 2010.
The following table summarises the components of net benefit expense recognised in the statement of comprehensive income and
the funded status and amounts recognised in the statement of financial position for the respective plans:
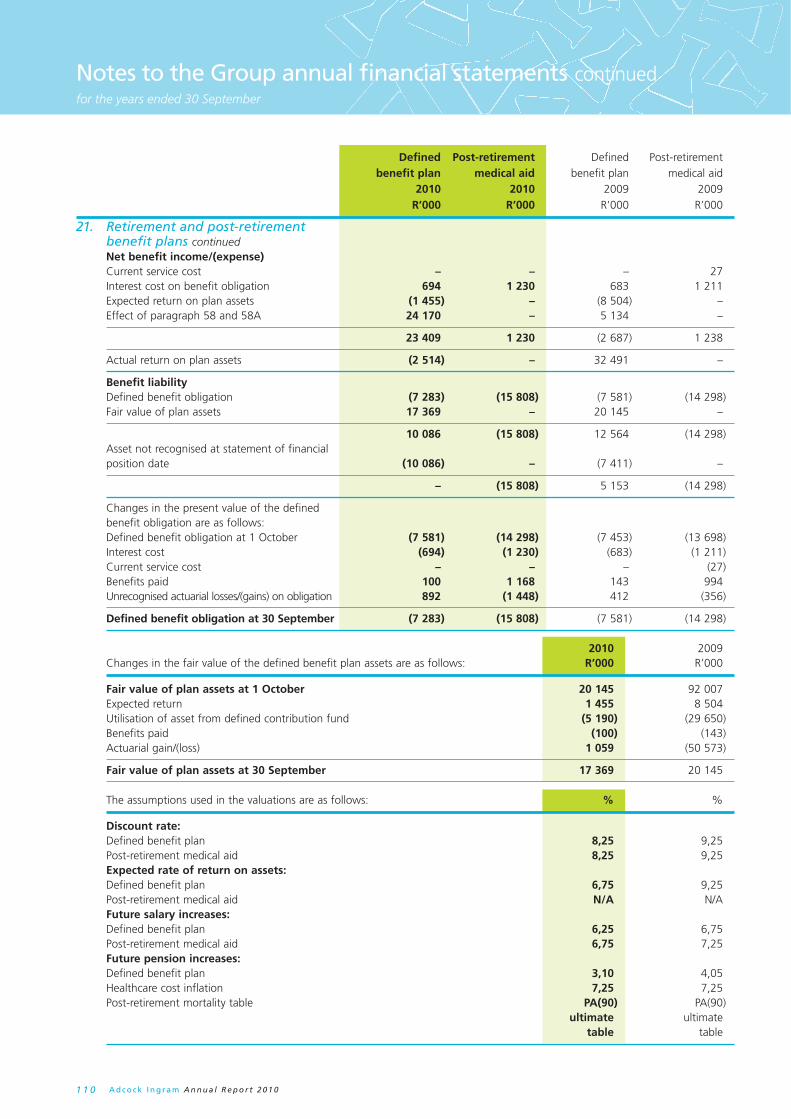
A d c o c k I n g r a m A n n u a l R e p o r t 2 0 1 01 1 0
Notes to the Group annual fi nancial statements continuedfor the years ended 30 September
Defined Post-retirement Defined Post-retirement benefit plan medical aid benefit plan medical aid 2010 2010 2009 2009 R’000 R’000 R’000 R’000
21. Retirement and post-retirement benefit plans continued
Net benefit income/(expense) Current service cost – – – 27 Interest cost on benefit obligation 694 1 230 683 1 211 Expected return on plan assets (1 455) – (8 504) – Effect of paragraph 58 and 58A 24 170 – 5 134 –
23 409 1 230 (2 687) 1 238
Actual return on plan assets (2 514) – 32 491 –
Benefit liability Defined benefit obligation (7 283) (15 808) (7 581) (14 298) Fair value of plan assets 17 369 – 20 145 –
10 086 (15 808) 12 564 (14 298) Asset not recognised at statement of financial
position date (10 086) – (7 411) –
– (15 808) 5 153 (14 298)
Changes in the present value of the defined benefit obligation are as follows:
Defined benefit obligation at 1 October (7 581) (14 298) (7 453) (13 698) Interest cost (694) (1 230) (683) (1 211) Current service cost – – – (27) Benefits paid 100 1 168 143 994 Unrecognised actuarial losses/(gains) on obligation 892 (1 448) 412 (356)
Defined benefit obligation at 30 September (7 283) (15 808) (7 581) (14 298)
2010 2009 Changes in the fair value of the defined benefit plan assets are as follows: R’000 R’000
Fair value of plan assets at 1 October 20 145 92 007 Expected return 1 455 8 504 Utilisation of asset from defined contribution fund (5 190) (29 650) Benefits paid (100) (143) Actuarial gain/(loss) 1 059 (50 573)
Fair value of plan assets at 30 September 17 369 20 145
The assumptions used in the valuations are as follows: % %
Discount rate: Defined benefit plan 8,25 9,25 Post-retirement medical aid 8,25 9,25 Expected rate of return on assets: Defined benefit plan 6,75 9,25 Post-retirement medical aid N/A N/A Future salary increases: Defined benefit plan 6,25 6,75 Post-retirement medical aid 6,75 7,25 Future pension increases: Defined benefit plan 3,10 4,05 Healthcare cost inflation 7,25 7,25 Post-retirement mortality table PA(90) PA(90) ultimate ultimate table table

A d c o c k I n g r a m A n n u a l R e p o r t 2 0 1 0 1 1 1
Notes to the Group annual fi nancial statements continuedfor the years ended 30 September
21. Retirement and post-retirement benefit plans continued
A one percentage point change, in the assumed rate of increase, in healthcare costs would have the following effects on the
post-retirement medical aid liability:
Increase Decrease Increase Decrease
2010 2010 2009 2009
R’000 R’000 R’000 R’000
Effect on the interest cost 121 (105) 120 (102)
Effect on the liability 1 474 (1 268) 1 320 (1 142)
2010 2009
R’000 R’000
22. Trade and other payables Trade accounts payable 411 983 320 388
Other payables 545 939 310 355
Accrued expenses 280 987 106 668
Cash-settled options 68 760 26 750
VAT payable 38 358 30 259
Deferred portion of purchase price of business combinations (note 1) 20 670 40 200
Sundry payables 137 164 106 478
957 922 630 743
The directors consider the carrying amount of the trade and other payables to
approximate their fair value.
Trade accounts payables are non-interest bearing and are normally settled on average
45 day terms.
At 30 September 2010, the undiscounted cash flows of trade accounts payables
are as follows:
<30 days 344 752 219 157
31 – 60 days 50 562 44 376
61 – 90 days 10 579 27 113
>90 days 6 090 29 742
411 983 320 388

A d c o c k I n g r a m A n n u a l R e p o r t 2 0 1 01 1 2
Notes to the Group annual fi nancial statements continuedfor the years ended 30 September
2010 2009 R’000 R’000
23. Provisions Leave pay 43 229 35 195
Bonus and incentive scheme 41 235 33 557
84 464 68 752
Made up as follows:
Leave pay provision
Balance at beginning of year 35 195 30 719
Arising during the year 26 508 8 179
Utilised during the year (15 576) (2 013)
Unused amounts reversed (2 898) (1 690)
Balance at end of year 43 229 35 195
Bonus and incentive scheme
Balance at beginning of year 33 557 –
Arising during the year 41 235 33 557
Utilised during the year (27 977) –
Unused amounts reversed (5 580) –
Balance at end of year 41 235 33 557
Leave pay provision In terms of the Group policy, employees are entitled to accumulated leave benefits
not taken within a leave cycle, up to a maximum of three times the employee’s
annual leave allocation. The obligation is reviewed annually. The timing of the
cash flow, if any, is uncertain.
Bonus and incentive provision The majority of the employees in service of the Group participate in a performance-based
incentive scheme and provision is made for the estimated liability in terms of
set performance criteria. These incentives are paid in December of each year.
24. Notes to the cash flow statement 24.1 Operating profit before working capital changes Profit before taxation 960 764 1 036 717
Adjusted for:
– amortisation of intangibles 7 015 9 589
– depreciation 94 577 73 181
– profit on disposal of property, plant and equipment (221) (3 050)
– dividend income (10 647) (9 619)
– net finance (income)/costs (18 815) 17 731
– equity share-based payment expenses 272 095 13 098
– increase in provisions 17 222 38 633
1 321 990 1 176 280
24.2 Working capital changes Increase in inventories (106 540) (6 421)
Increase in trade and other receivables (81 455) (111 870)
Increase in trade and other payables 303 359 72 171
115 364 (46 120)
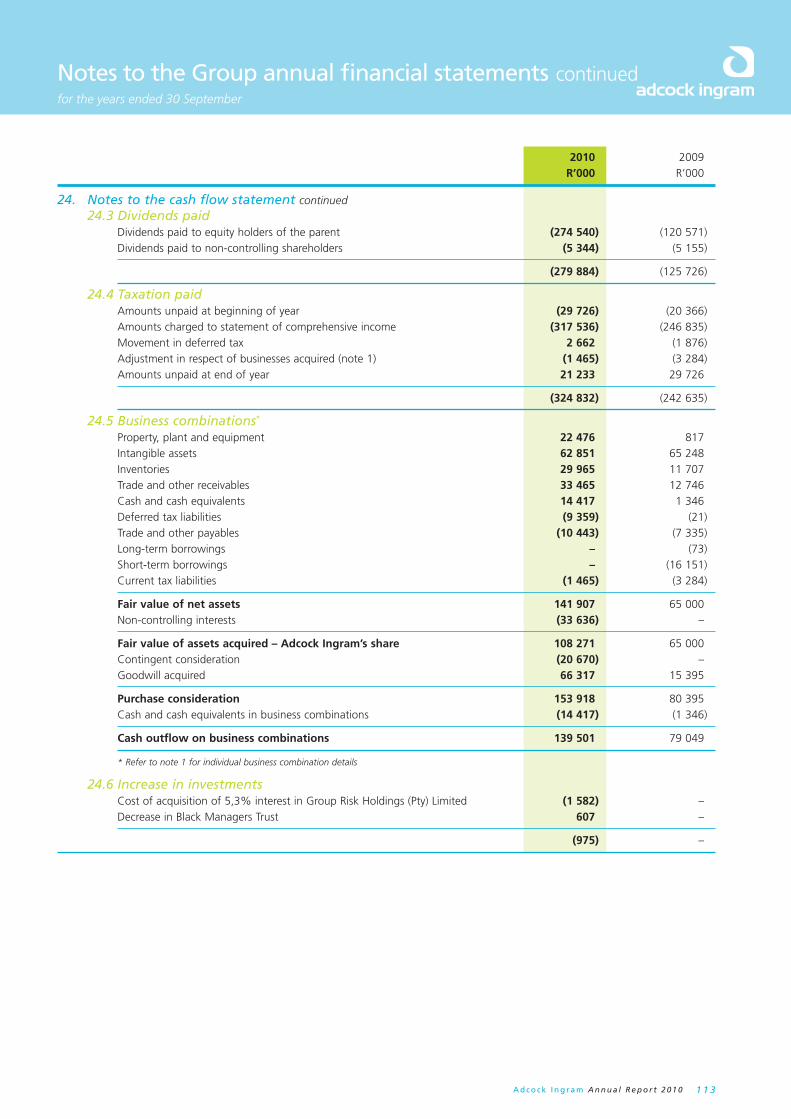
A d c o c k I n g r a m A n n u a l R e p o r t 2 0 1 0 1 1 3
Notes to the Group annual fi nancial statements continuedfor the years ended 30 September
2010 2009 R’000 R’000
24. Notes to the cash flow statement continued 24.3 Dividends paid Dividends paid to equity holders of the parent (274 540) (120 571) Dividends paid to non-controlling shareholders (5 344) (5 155)
(279 884) (125 726)
24.4 Taxation paid Amounts unpaid at beginning of year (29 726) (20 366) Amounts charged to statement of comprehensive income (317 536) (246 835) Movement in deferred tax 2 662 (1 876) Adjustment in respect of businesses acquired (note 1) (1 465) (3 284) Amounts unpaid at end of year 21 233 29 726
(324 832) (242 635)
24.5 Business combinations*
Property, plant and equipment 22 476 817 Intangible assets 62 851 65 248 Inventories 29 965 11 707 Trade and other receivables 33 465 12 746 Cash and cash equivalents 14 417 1 346 Deferred tax liabilities (9 359) (21) Trade and other payables (10 443) (7 335) Long-term borrowings – (73) Short-term borrowings – (16 151) Current tax liabilities (1 465) (3 284)
Fair value of net assets 141 907 65 000 Non-controlling interests (33 636) –
Fair value of assets acquired – Adcock Ingram’s share 108 271 65 000 Contingent consideration (20 670) – Goodwill acquired 66 317 15 395
Purchase consideration 153 918 80 395 Cash and cash equivalents in business combinations (14 417) (1 346)
Cash outflow on business combinations 139 501 79 049
* Refer to note 1 for individual business combination details
24.6 Increase in investments Cost of acquisition of 5,3% interest in Group Risk Holdings (Pty) Limited (1 582) – Decrease in Black Managers Trust 607 –
(975) –
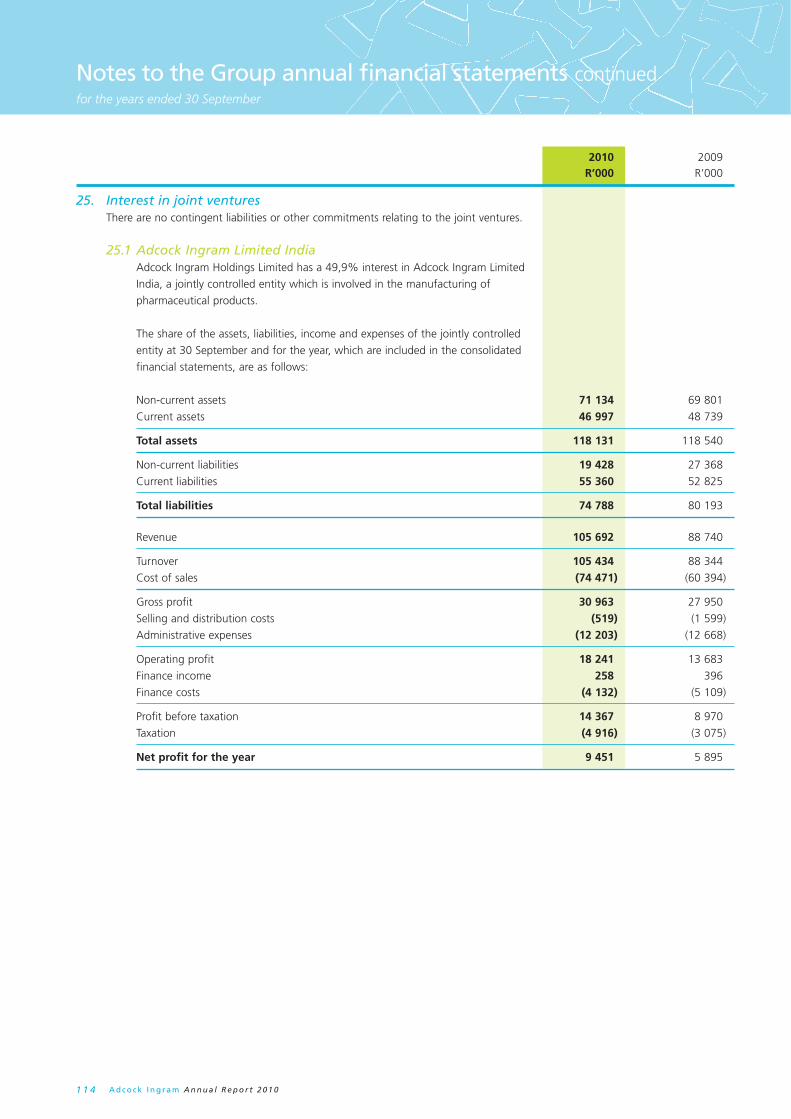
A d c o c k I n g r a m A n n u a l R e p o r t 2 0 1 01 1 4
Notes to the Group annual fi nancial statements continuedfor the years ended 30 September
2010 2009 R’000 R’000
25. Interest in joint ventures There are no contingent liabilities or other commitments relating to the joint ventures.
25.1 Adcock Ingram Limited India Adcock Ingram Holdings Limited has a 49,9% interest in Adcock Ingram Limited
India, a jointly controlled entity which is involved in the manufacturing of
pharmaceutical products.
The share of the assets, liabilities, income and expenses of the jointly controlled
entity at 30 September and for the year, which are included in the consolidated
financial statements, are as follows:
Non-current assets 71 134 69 801
Current assets 46 997 48 739
Total assets 118 131 118 540
Non-current liabilities 19 428 27 368
Current liabilities 55 360 52 825
Total liabilities 74 788 80 193
Revenue 105 692 88 740
Turnover 105 434 88 344
Cost of sales (74 471) (60 394)
Gross profit 30 963 27 950
Selling and distribution costs (519) (1 599)
Administrative expenses (12 203) (12 668)
Operating profit 18 241 13 683
Finance income 258 396
Finance costs (4 132) (5 109)
Profit before taxation 14 367 8 970
Taxation (4 916) (3 075)
Net profit for the year 9 451 5 895
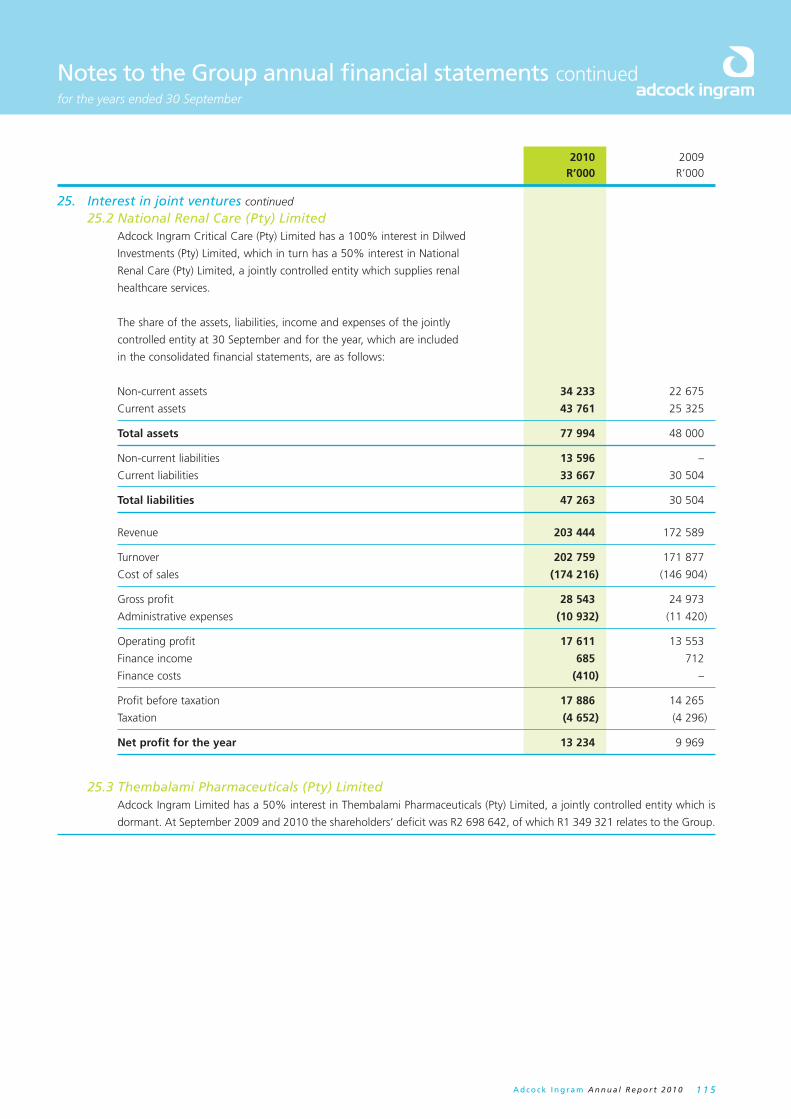
A d c o c k I n g r a m A n n u a l R e p o r t 2 0 1 0 1 1 5
Notes to the Group annual fi nancial statements continuedfor the years ended 30 September
2010 2009 R’000 R’000
25. Interest in joint ventures continued
25.2 National Renal Care (Pty) Limited Adcock Ingram Critical Care (Pty) Limited has a 100% interest in Dilwed
Investments (Pty) Limited, which in turn has a 50% interest in National
Renal Care (Pty) Limited, a jointly controlled entity which supplies renal
healthcare services.
The share of the assets, liabilities, income and expenses of the jointly
controlled entity at 30 September and for the year, which are included
in the consolidated financial statements, are as follows:
Non-current assets 34 233 22 675
Current assets 43 761 25 325
Total assets 77 994 48 000
Non-current liabilities 13 596 –
Current liabilities 33 667 30 504
Total liabilities 47 263 30 504
Revenue 203 444 172 589
Turnover 202 759 171 877
Cost of sales (174 216) (146 904)
Gross profit 28 543 24 973
Administrative expenses (10 932) (11 420)
Operating profit 17 611 13 553
Finance income 685 712
Finance costs (410) –
Profit before taxation 17 886 14 265
Taxation (4 652) (4 296)
Net profit for the year 13 234 9 969
25.3 Thembalami Pharmaceuticals (Pty) Limited Adcock Ingram Limited has a 50% interest in Thembalami Pharmaceuticals (Pty) Limited, a jointly controlled entity which is
dormant. At September 2009 and 2010 the shareholders’ deficit was R2 698 642, of which R1 349 321 relates to the Group.

A d c o c k I n g r a m A n n u a l R e p o r t 2 0 1 01 1 6
Notes to the Group annual fi nancial statements continuedfor the years ended 30 September
26. Financial instruments Fair value hierarchy The Group used the following hierarchy for determining and disclosing the fair value of financial instruments by valuation technique: Level 1: quoted prices for similar instruments Level 2: other techniques for which all inputs which have a significant effect on the recorded fair value are observable, either
directly or indirectly Level 3: techniques which use inputs which have a significant effect on the recorded fair value that are not based on observable
market data
The Group held the following financial instruments measured at fair value: 2010 2009 R’000 R’000
Assets measured at fair value Available for sale financial assets (Level 3) 139 012 138 037
Liabilities measured at fair value Foreign exchange contracts – hedged (Level 2) (207 881) (260 659)
Financial risk management objectives and policies The Group’s principal financial liabilities comprise borrowings and trade payables. The main purpose of these financial liabilities is to
raise finance for the Group’s operations. The Group has various financial assets such as trade and other receivables and cash which arise directly from its operations. The Group also enters into derivative transactions via forward currency contracts. The purpose is to manage the currency risks arising from the Group’s operations and its sources of finance.
It is, and has been throughout 2010, the Group’s policy that no trading in other derivatives shall be undertaken.
The main risks arising from the Group’s financial instruments are interest rate, credit, liquidity and foreign currency. The board of directors reviews and agrees policies for managing each of these risks which are summarised below.
Interest rate risk The Group is exposed to interest rate risk as the following assets and liabilities carry interest at rates that vary in response to the
lending rates in South Africa and India: • Cash balances which are subject to movements in the bank deposit rates; and • Long-term and short-term debt obligations with floating interest rates linked to the Johannesburg Interbank agreed rate, the
South African prime and Indian bank lending rates.
The Group’s policy is to manage its interest rate risk through both fixed and variable, long-term and short-term instruments at various approved financial institutions.
No financial instruments are entered into to mitigate the risk of interest rates.
Interest rate risk table The following table demonstrates the sensitivity to a reasonably possible change in interest rates, with all other variables held
constant, of the Group’s profit before tax, through the impact on balances subject to floating rates. There is no impact on the Group’s equity.
(Decrease)/increase in profit before tax
Change in rate 2010 2009 % R’000 R’000
Liabilities Indian rupee loan +1 (381) (412) South African loans at variable rates1 +1 – –
Cash balances Cash and cash equivalents +1 14 309 6 929 Bank overdraft +1 – (2)
(1) No sensitivity analyses are performed on the South African loans as: (i) some have fixed rates and are thus not sensitive to the movement in the interest rate; and (ii) the loans with variable rates are subject to the application of IAS 23 Borrowing Costs, and are not expected to have a
material impact on profits. Refer to note 20.

A d c o c k I n g r a m A n n u a l R e p o r t 2 0 1 0 1 1 7
Notes to the Group annual fi nancial statements continuedfor the years ended 30 September
26. Financial instruments continued Credit risk Financial assets of the Group which are subject to credit risk consist mainly of cash resources and trade receivables. The maximum
exposure to credit risk is set out in the respective cash and accounts receivable notes. The Group’s exposure to credit risk arises from default of the counter party, with a maximum exposure equal to the carrying amount of these instruments.
Cash resources are placed with various approved financial institutions subject to approved limits. All these institutions are credit worthy.
The Group trades only with recognised, credit worthy third parties. It is the Group’s policy that all customers who wish to trade on credit terms are subject to credit verification procedures. In addition, receivable balances are monitored on an ongoing basis with the result that the Group’s exposure to bad debts is not significant. For transactions that do not occur in the country of the relevant operating unit, the Group does not offer credit terms without the approval of the corporate office. There is no significant concentration of credit risk within the Group arising from the financial assets of the Group.
Substantially all debtors are non-interest bearing and repayable within 30 – 60 days.
Debtors are disclosed net of a provision for impairment.
Liquidity risk As a result of the net cash position of the Group, the Group currently has limited exposure to liquidity risk as all obligations in the
foreseeable future will be met.
The Group manages its risk to a shortage of funds using planning mechanisms. This considers the maturity of both its financial liabilities and financial assets and projected cash flows from operations. The Group’s objective is to maintain a balance between continuity of funding and flexibility through the use of bank overdrafts and bank loans.
The maturity profile of the Group’s long-term financial liabilities at 30 September 2010, based on contractual undiscounted payments, is shown in note 20 and the maturity profile of the trade and other payables in note 22.
Foreign currency risk As the Group operates in various countries and undertakes transactions denominated in foreign currencies, exposures to foreign
currency fluctuations arise. Exchange rate exposures on transactions are managed within approved policy parameters utilising forward exchange contracts or other derivative financial instruments in conjunction with external consultants who provide financial services to Group companies as well as contributing to the management of the financial risks relating to the Group’s operations.
Foreign operations In converting the foreign operations at 30 September 2010, the following exchange rates were used:
Income/expenses Assets/liabilities Average (Rand) Spot (Rand)
Kenya 0,0954 0,0865 Ghana 5,1968 4,8662 India 0,1622 0.1568
Foreign assets/liabilities In converting foreign denominated assets and liabilities, the following exchange rates were used:
Assets Liabilities Average
2010 US Dollar 6,99 6,97 6,98 Euro 9,53 9,50 9,52
2009 US Dollar 7,52 7,57 7,54 Euro 10,92 11,07 11,00
Cash fl ow hedges The Group’s current policy for the management of foreign exchange is to cover 100% of foreign currency commitments with
forward exchange contracts when a firm commitment for the order of inventory is in place. As a result all material foreign liabilities were covered by forward exchange contracts at year-end.

A d c o c k I n g r a m A n n u a l R e p o r t 2 0 1 01 1 8
Notes to the Group annual fi nancial statements continuedfor the years ended 30 September
26. Financial instruments continued
Cash fl ow hedges continued
The forward currency contracts must be in the same currency as the hedged item. It is the Group’s policy to fix the terms of the
hedge derivatives to match the terms of the hedged item to maximise hedge effectiveness. Forward exchange contracts are mainly
entered into to cover net import exposures. The fair value is determined using the applicable foreign exchange spot rates at
reporting dates.
At 30 September 2010, the Group held no foreign exchange contracts designated as hedges of expected future sales to customers
outside South Africa for which the Group has firm commitments. The Group had foreign exchange contracts outstanding at
30 September 2010 designated as hedges of expected future purchases from suppliers outside South Africa for which the Group
has firm commitments. All foreign exchange contracts will mature within 12 months. The cash flow hedges of expected future
purchases were assessed to be effective.
A summary of the material contracts outstanding at 30 September 2010:
Foreign Average
currency ‘000 forward rate R’000
2010
US Dollar 6 645 7,36 48 967
Euro 14 277 9,71 138 646
2009
US Dollar 18 252 8,06 147 166
Euro 8 680 11,47 99 571
The maturity analysis for the outstanding contracts at 30 September 2010 are as follows:
US Dollar Rands Euro Rands
‘000 ‘000 ‘000 ‘000
2010
Within 30 days 4 230 30 839 4 640 44 865
31 – 60 days 1 388 10 253 3 583 34 443
61 – 90 days 451 3 656 1 837 17 972
> 90 days 576 4 219 4 217 41 366
Total 2010 6 645 48 967 14 277 138 646
2009
Within 30 days 6 355 50 240 4 378 50 050
31 – 60 days 2 487 19 975 2 207 25 197
61 – 90 days 3 002 23 881 967 11 378
> 90 days 6 408 53 070 1 128 12 946
Total 2009 18 252 147 166 8 680 99 571
A summary of the material contracts bought during the year ended 30 September:
Foreign Average
currency ‘000 forward rate R’000
2010
US Dollar 87 522 7,6236 667 235
Euro 44 092 10,4084 458 926
2009
US Dollar 58 679 9,4575 554 958
Euro 25 043 12,6221 316 094

A d c o c k I n g r a m A n n u a l R e p o r t 2 0 1 0 1 1 9
Notes to the Group annual fi nancial statements continuedfor the years ended 30 September
26. Financial instruments continued
Cash fl ow hedges continued
The following table demonstrates the sensitivity to change in foreign currencies, with all other variables held constant, of the
Group’s profit before taxation, due to changes in the fair value of monetary assets and liabilities and the Group’s equity, due to
changes in the fair value of open forward exchange contracts and net investment hedges.
Increase/ (decrease) in Increase/ profit before (decrease) in Change in rate tax equity % R’000 R’000
2010 US Dollar
+10 (493) 2 278 -10 498 (6 990) Euro
+10 (3 388) 12 004 -10 3 388 (15 086)
2009
US Dollar
+10 919 6 810
-10 (919) (20 726)
Euro
+10 2 180 6 467
-10 (2 180) (12 660)
Capital management The primary objective of the Group’s capital management is to ensure that it maintains a strong credit rating and healthy capital
ratios, in order to support its business and maximise shareholder value. The Group manages its capital structure and makes
adjustments to it, in light of changes in economic conditions. To maintain or adjust the capital structure, the Group may adjust the
dividend payment to shareholders, return capital to shareholders, issue new shares or repurchase shares.
The Group monitors its capital using gearing and interest cover ratios. The primary methods of measurement used are interest
bearing debt to total equity and annualised EBITDA, and interest cover. The Group is currently well within acceptable industry norms
on all of these measures as it has no gearing.
2010 2009
R’000 R’000
Interest bearing borrowings 580 617 311 481
Less: Cash and short-term deposits (1 430 917) (692 717)
Net cash (850 300) (381 236)
Equity 3 073 340 2 325 596
Gearing ratio (%) (28) (16)
27. Contingent liabilities The Group provides surety for the obligations of Adcock Ingram Healthcare (Pty) Limited and Adcock Ingram Critical Care
(Pty) Limited.
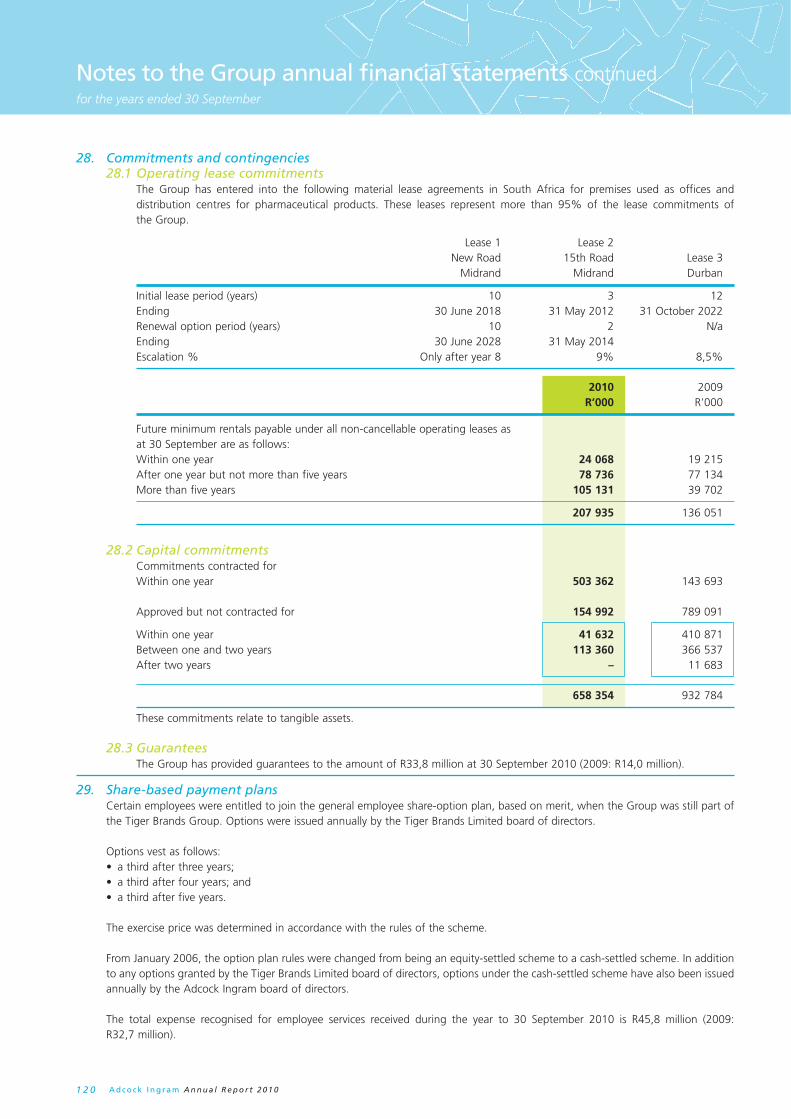
A d c o c k I n g r a m A n n u a l R e p o r t 2 0 1 01 2 0
Notes to the Group annual fi nancial statements continuedfor the years ended 30 September
28. Commitments and contingencies 28.1 Operating lease commitments The Group has entered into the following material lease agreements in South Africa for premises used as offices and
distribution centres for pharmaceutical products. These leases represent more than 95% of the lease commitments of the Group.
Lease 1 Lease 2 New Road 15th Road Lease 3 Midrand Midrand Durban
Initial lease period (years) 10 3 12 Ending 30 June 2018 31 May 2012 31 October 2022 Renewal option period (years) 10 2 N/a Ending 30 June 2028 31 May 2014 Escalation % Only after year 8 9% 8,5%
2010 2009 R’000 R’000
Future minimum rentals payable under all non-cancellable operating leases as at 30 September are as follows:
Within one year 24 068 19 215 After one year but not more than five years 78 736 77 134 More than five years 105 131 39 702
207 935 136 051
28.2 Capital commitments Commitments contracted for Within one year 503 362 143 693
Approved but not contracted for 154 992 789 091
Within one year 41 632 410 871 Between one and two years 113 360 366 537 After two years – 11 683
658 354 932 784
These commitments relate to tangible assets.
28.3 Guarantees The Group has provided guarantees to the amount of R33,8 million at 30 September 2010 (2009: R14,0 million).
29. Share-based payment plans Certain employees were entitled to join the general employee share-option plan, based on merit, when the Group was still part of
the Tiger Brands Group. Options were issued annually by the Tiger Brands Limited board of directors.
Options vest as follows: • a third after three years; • a third after four years; and • a third after five years.
The exercise price was determined in accordance with the rules of the scheme.
From January 2006, the option plan rules were changed from being an equity-settled scheme to a cash-settled scheme. In addition to any options granted by the Tiger Brands Limited board of directors, options under the cash-settled scheme have also been issued annually by the Adcock Ingram board of directors.
The total expense recognised for employee services received during the year to 30 September 2010 is R45,8 million (2009: R32,7 million).

A d c o c k I n g r a m A n n u a l R e p o r t 2 0 1 0 1 2 1
Notes to the Group annual fi nancial statements continuedfor the years ended 30 September
29. Share-based payment plans continued
29.1 Cash-settled The following table illustrates the number and weighted average offer prices (WAOP) of and movements in Adcock Ingram
share options during the year.
2010 2009
Number WAOP Number WAOP
Outstanding at beginning of year 3 703 049 33,85 1 548 518 33,49
Granted during the year 860 713 51,12 2 262 651 34,11
Forfeited during the year (345 967) 35,93 (102 085) 39,06
Exercised during the year (87 212) 32,64 (6 035) 31,38
Outstanding at end of year 4 130 583 37,30 3 703 049 33,85
Vested and exercisable at end of year 378 620 32,68 153 740 31,38
2010 2009
The weighted average remaining contractual life for the share options
outstanding at year-end is: 3,83 years 4,44 years
The range of offer prices for options outstanding at the end of the year was: R28,27 – R51,12 R28,27 – R36,26
The carrying amount of the liability relating to the cash-settled options
at year-end is (R million) 68,75 26,75
Share options were valued based on the historical volatility of the share price of companies in the same sector over the
expected lifetime of each option, as the Company had a short trading history. The valuation is measured at fair value
(excluding any non-market vesting conditions) and is the sum of the intrinsic value plus optionality. The fair value of each
option is estimated using an explicit finite-difference option pricing model. All options are valued with a European expiry
profile, i.e. with a single exercise date at maturity.
29.2 Equity-settled The following table illustrates the number and weighted average offer prices (WAOP) of and movements in Adcock Ingram
share options during the year. No additional equity share options were granted during this year.
2010 2009
Number WAOP Number WAOP
Outstanding at the beginning of the year 2 115 370 13,70 2 706 670 13,59
Exercised and paid in full1 (334 240) 13,16 (570 410) 12,90
Forfeited (3 400) 22,60 (20 890) 19,81
Outstanding at the end of the year 1 777 730 13,80 2 115 370 13,70
Exercisable at the end of the year 1 774 330 13,78 1 943 070 13,10
(1) The weighted average share price at the date of exercise, for the options exercised is R56,30 (2009: R41,26).
Included within this balance are options over 384 866 shares (2009: 480 032 shares) that have not been recognised
in accordance with IFRS 2 as the options were granted on or before 7 November 2002. These options have not been
subsequently modified and therefore do not need to be accounted for in accordance with IFRS 2.
2010 2009
The weighted average remaining contractual life for the share options
outstanding at year-end is: 2,88 years 3,82 years
The range of offer prices for options outstanding at the end of the
year was: R8,96 – R28,33 R8,96 – R28,33
Share options were fair valued using a modified Black-Scholes method. The observable volatility in the market was the basis
upon which the options were valued.

A d c o c k I n g r a m A n n u a l R e p o r t 2 0 1 01 2 2
Notes to the Group annual fi nancial statements continuedfor the years ended 30 September
29. Share-based payment plans continued 29.2 Equity-settled continued Loans to the amount of R931 763 relating to Adcock Ingram employees were outstanding at the end of the year
(2009: R1 022 616).
29.3 Black Managers share option scheme In terms of the Tiger Brands Limited BEE transaction implemented on 17 October 2005, 4 381 831 Tiger Brands shares
were acquired by the Tiger Brands Black Managers Trust. Allocation of vested rights to these shares was made to 435 black managers of the Tiger Brands Group (including the Adcock Ingram Group). The allocation of vested rights entitles beneficiaries to receive Tiger Brands shares (after making capital contributions to the Black Managers Trust) at any time after the defined lock-in period, i.e. from 1 January 2015. These vested rights are non-transferable.
From 1 January 2015, the beneficiaries may exercise their vested rights, in which event the beneficiary may: • instruct the trustees to sell all of their shares and distribute the proceeds to them, net of the funds required to pay the
capital contributions, taxation (including employees’ tax), costs and expenses; • instruct the trustees to sell sufficient shares to fund the capital contributions, pay the taxation (including employees’ tax),
costs and expenses and distribute to them the remaining shares to which they are entitled; or • fund the capital contributions, taxation (including employees’ tax), costs and expenses themselves and receive the shares
to which they are entitled.
2010 2009
The expense recognised for employee services received during the year is (R million): 3,10 13,03 Number of participation rights allocated to Adcock Ingram employees at year-end: 998 100 1 153 200 The weighted average remaining contractual life for the share options
outstanding at year end is: 4,25 years 5,25 years
No weighted average exercise price has been calculated as there were no options exercised.
Participation rights were valued using the Monte-Carlo simulation approach to estimate the average, optimal pay-off of the participation rights using 5 000 permutations. The pay-off of each random path was based on:
• the projected Tiger Brands share price; • outstanding debt projections; and • optimal early exercise conditions.
29.4 Black Economic Empowerment (BEE) transaction Adcock Ingram entered into a BEE transaction on 9 April 2010, as part of its committed efforts to achieve the objectives set
out in the broad-based Black Economic Empowerment Codes of Good Practice with the intention to embrace broad-based equity participation as a key transformation initiative.
BEE participants The entities which participated in the transaction are: • the strategic partners, who collectively participate through a single investment vehicle, namely Blue Falcon Trading 69 (Pty)
Limited (Blue Falcon); and • qualifying employees, who will participate through the Mpho ea Bophelo Trust (Bophelo).
Blue Falcon’s shareholders are as follows: • Kagiso Strategic Investments III (Pty) Limited (62,9%); • Kurisani Youth Development Trust (26,6%); and • Mookodi Pharma Trust (10,5%).
Estimated economic costs The total value of the transaction was R1,321 billion, based on the 10-day VWAP of R50,91 per ordinary share on the JSE as
at the close of trade on Thursday, 19 November 2009, being the date when the memorandum of understanding was signed.
The economic cost of implementing the transaction is approximately R370 million. This figure was calculated with reference to the requirements of IFRS and includes transaction costs as well as the grant to the Bophelo Trust.

A d c o c k I n g r a m A n n u a l R e p o r t 2 0 1 0 1 2 3
Notes to the Group annual fi nancial statements continuedfor the years ended 30 September
29. Share-based payment plans continued 29.4 Black Economic Empowerment (BEE) transaction continued IFRS 2 sets out the basis for calculating the economic cost shown above and the valuation uses the following key inputs
or assumptions: • the Black-Scholes model for valuing options; • the actual or likely conversion dates attached to the A and B ordinary shares; and • using available open-market data, estimated expected future ordinary share prices as determined using option pricing
models and an estimation of the future dividends at given dates.
These calculations derive an expected future cost associated with the transaction that is then discounted to the present.
The expense recognised for the strategic partners during the year amounts to R269 million (refer note 5). The expense to be recognised in future after the allocations to employees and over the vesting period, amounts to R89 million.
No expense was recognised for employee services during the year as no allocations have been made to any Adcock Ingram employees. These rights are to be allocated during the next financial year.
Transaction funding The transaction was implemented through a specific issue of A and B ordinary shares (refer note 17), which constitute 13%
of Adcock Ingram’s total issued shares after their issue and was financed by way of: • an equity contribution of R93,75 million by Blue Falcon; • an upfront discount of R66 million to the BEE participants; • a grant of R0,65 million by Adcock Ingram to the Bophelo Trust; and • notional vendor funding of R1,161 billion provided by Adcock Ingram. which has the following salient characteristics: • no recourse to Adcock Ingram; • no impact on Adcock Ingram’s credit facilities nor any requirement for the approval of Adcock Ingram’s existing
financiers; and • no cash flow implications for Adcock Ingram.
The notional value of each A and B ordinary share was deemed to be R48,36, being the 10-day VWAP less a 5% discount.
The mechanics of the notional vendor fi nance structure The mechanics of the notional vendor finance structure essentially result in the following: • the specific issue of the A and B ordinary shares will equate to 13% of Adcock Ingram’s issued share capital; • the repurchase at par value of repurchase shares from the BEE participants; • the A and B ordinary shares shall automatically convert into ordinary shares at the end of 10 years for Blue Falcon and
seven years for the Bophelo trust; • upon conversion of the A and B ordinary shares into ordinary shares in accordance with their terms, Adcock Ingram will
procure that those ordinary shares that are not repurchased by Adcock Ingram are listed on the JSE.
Key terms and contractual obligations The key terms of the A and B ordinary shares and the key contractual obligations of the holders of A and B ordinary shares
are as follows: • Adcock Ingram will have the right to repurchase all or some of these shares at the end of the respective transaction terms
in accordance with the call option formula; • These shares will not be listed but will be considered in determining a quorum and will be entitled to vote on any or all
resolutions proposed at general/annual general meetings; • The shares will automatically convert into ordinary shares at the end of the respective transaction terms; • The shares will be entitled to ordinary dividends and dividends in specie pari passu with the ordinary shares; • During the lock-in period, Blue Falcon will be entitled to retain 15% of the ordinary dividends received by it in respect of
the A ordinary shares. The Bophelo trust will not be entitled to retain any of the ordinary dividends received in respect of the B ordinary shares;
• The balance of the ordinary dividends received by Blue Falcon and all ordinary dividends received by the Bophelo Trust, will on a compulsory basis be used, within a period of 30 business days after receipt, to purchase ordinary shares;
• 100% of the dividends received on the ordinary shares compulsorily acquired by Blue Falcon and the Bophelo trust must likewise be utilised to purchase ordinary shares;

A d c o c k I n g r a m A n n u a l R e p o r t 2 0 1 01 2 4
Notes to the Group annual fi nancial statements continuedfor the years ended 30 September
29. Share-based payment plans continued 29.4 Black Economic Empowerment (BEE) transaction continued Key terms and contractual obligations continued • All such ordinary shares compulsorily acquired will also be subject to the call option, to the extent required; • Blue Falcon may deal with any dividends in specie received as it deems fit while the Bophelo Trust will hold any in specie
dividends received for the benefit of the beneficiaries; • A and B ordinary shares and compulsorily acquired ordinary shares will not be entitled to receive special dividends until
such time as the notional loan outstanding has reduced to zero; • However, an equivalent amount of the special dividends which would otherwise have been received by the BEE participants
shall be offset against the notional outstanding loan with effect from the date on which such special dividends are paid to ordinary shareholders.
30. Related parties Related party transactions exist between the Company, fellow subsidiaries and the holding company. All purchasing and selling
transactions with related parties are concluded at arm’s length and are eliminated for group purposes.
Payments to directors and key management are disclosed in notes 4.2 and 4.3.
31. Subsequent events 31.1 Call option process by Baxter Healthcare SA (Baxter) in respect of Adcock Ingram Critical Care
(Pty) Limited (AICC) For strategic reasons unrelated to the business of AICC, Baxter elected not to proceed with the exercise of its call option
over 50% plus 1 share of the AICC business. The option agreement has been cancelled by mutual agreement of the parties. The business of AICC will continue under the control of Adcock Ingram and will continue to benefit from the existing 15-year licence, distribution and raw materials supply agreements with Baxter.
31.2 The Scientific Group (Pty) Limited (TSG) On 5 November 2010, the Group entered into a formal sale agreement in respect of its 74% holding in The Scientific Group
(Pty) Limited (TSG). The sale agreement is subject to various conditions including Competition Commission approval.
31.3 Roche Products (Pty) Limited (Roche) On 18 November 2010, Adcock Ingram and Roche, the world’s largest biotechnology company, established a five-year
strategic partnership whereby Adcock Ingram will sell, promote and distribute two well established Roche products in South Africa.
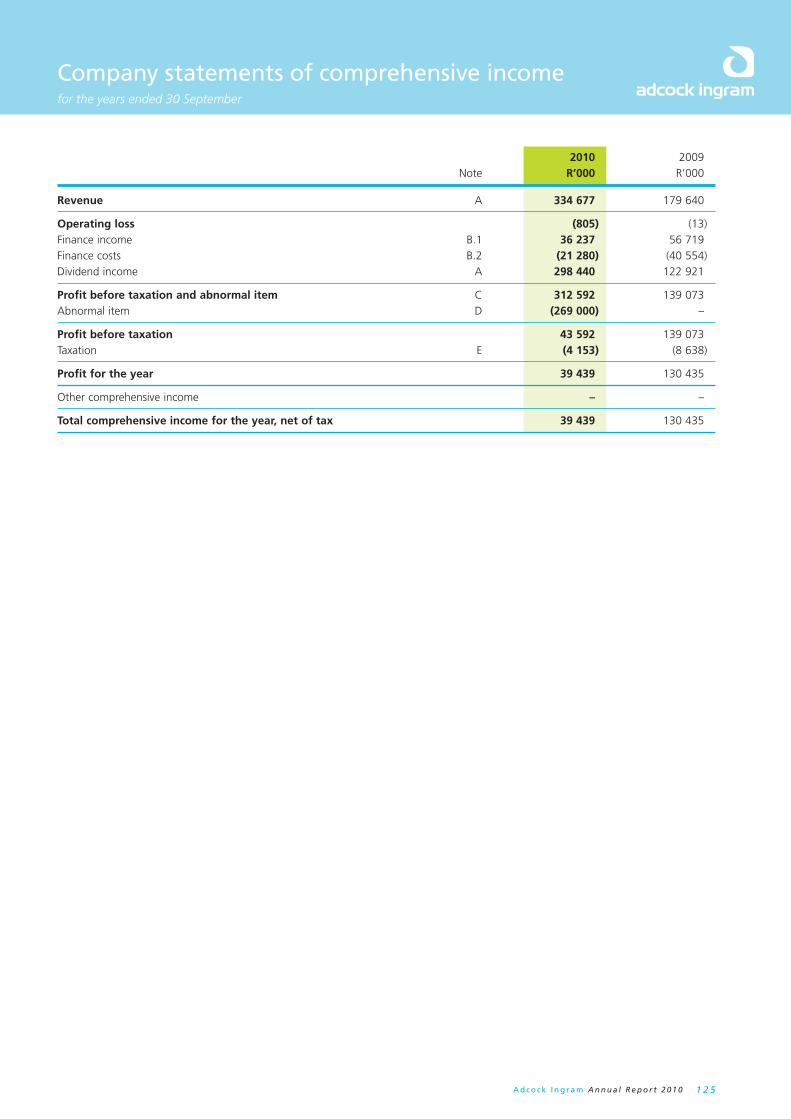
A d c o c k I n g r a m A n n u a l R e p o r t 2 0 1 0 1 2 5
Company statements of comprehensive incomefor the years ended 30 September
2010 2009 Note R’000 R’000
Revenue A 334 677 179 640
Operating loss (805) (13)Finance income B.1 36 237 56 719 Finance costs B.2 (21 280) (40 554)Dividend income A 298 440 122 921
Profit before taxation and abnormal item C 312 592 139 073 Abnormal item D (269 000) –
Profit before taxation 43 592 139 073 Taxation E (4 153) (8 638)
Profit for the year 39 439 130 435
Other comprehensive income – –
Total comprehensive income for the year, net of tax 39 439 130 435
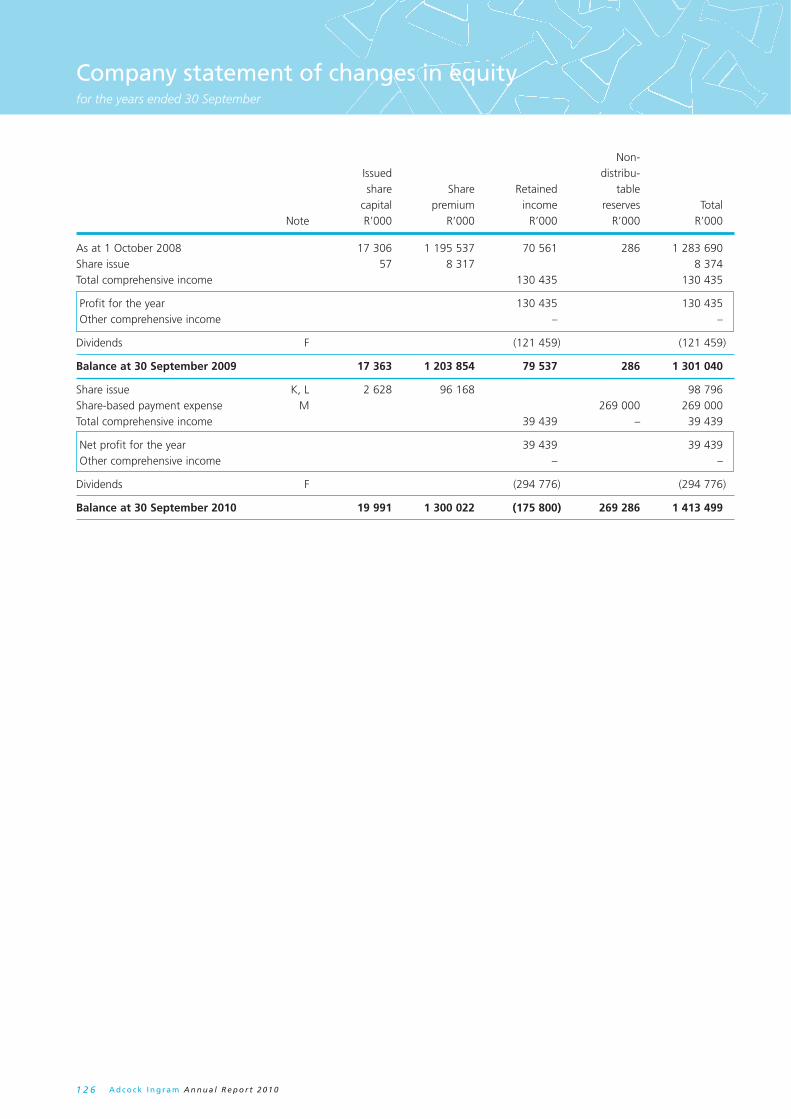
A d c o c k I n g r a m A n n u a l R e p o r t 2 0 1 01 2 6
Company statement of changes in equityfor the years ended 30 September
Non- Issued distribu- share Share Retained table capital premium income reserves Total Note R’000 R’000 R’000 R’000 R’000
As at 1 October 2008 17 306 1 195 537 70 561 286 1 283 690 Share issue 57 8 317 8 374 Total comprehensive income 130 435 130 435
Profit for the year 130 435 130 435 Other comprehensive income – –
Dividends F (121 459) (121 459)
Balance at 30 September 2009 17 363 1 203 854 79 537 286 1 301 040
Share issue K, L 2 628 96 168 98 796 Share-based payment expense M 269 000 269 000 Total comprehensive income 39 439 – 39 439
Net profit for the year 39 439 39 439 Other comprehensive income – –
Dividends F (294 776) (294 776)
Balance at 30 September 2010 19 991 1 300 022 (175 800) 269 286 1 413 499

A d c o c k I n g r a m A n n u a l R e p o r t 2 0 1 0 1 2 7
Company statements of fi nancial positionat 30 September
2010 2009 Note R’000 R’000
ASSETSInvestments G 3 399 923 3 478 736 Amounts owing by Group companies I.1 430 137 –
Non-current assets 3 830 060 3 478 736
Cash and cash equivalents H 1 295 242 594 319 Amounts owing by Group companies I.1 58 033 55 588 Other receivables J 382 1 868 Taxation receivable P.4 – 2 766
Current assets 1 353 657 654 541
Total assets 5 183 717 4 133 277
EQUITY AND LIABILITIESCapital and reservesIssued share capital K 19 991 17 363 Share premium L 1 300 022 1 203 854 Non-distributable reserves M 269 286 286 Retained income (175 800) 79 537
Total equity 1 413 499 1 301 040
Long-term borrowings N 430 137 –
Non-current liabilities 430 137 –
Bank overdraft H 1 177 127 641 277 Other payables O 6 680 35 043 Taxation payable P.4 352 – Amounts owing to Group companies I.2 2 155 922 2 155 917
Current liabilities 3 340 081 2 832 237
Total equity and liabilities 5 183 717 4 133 277
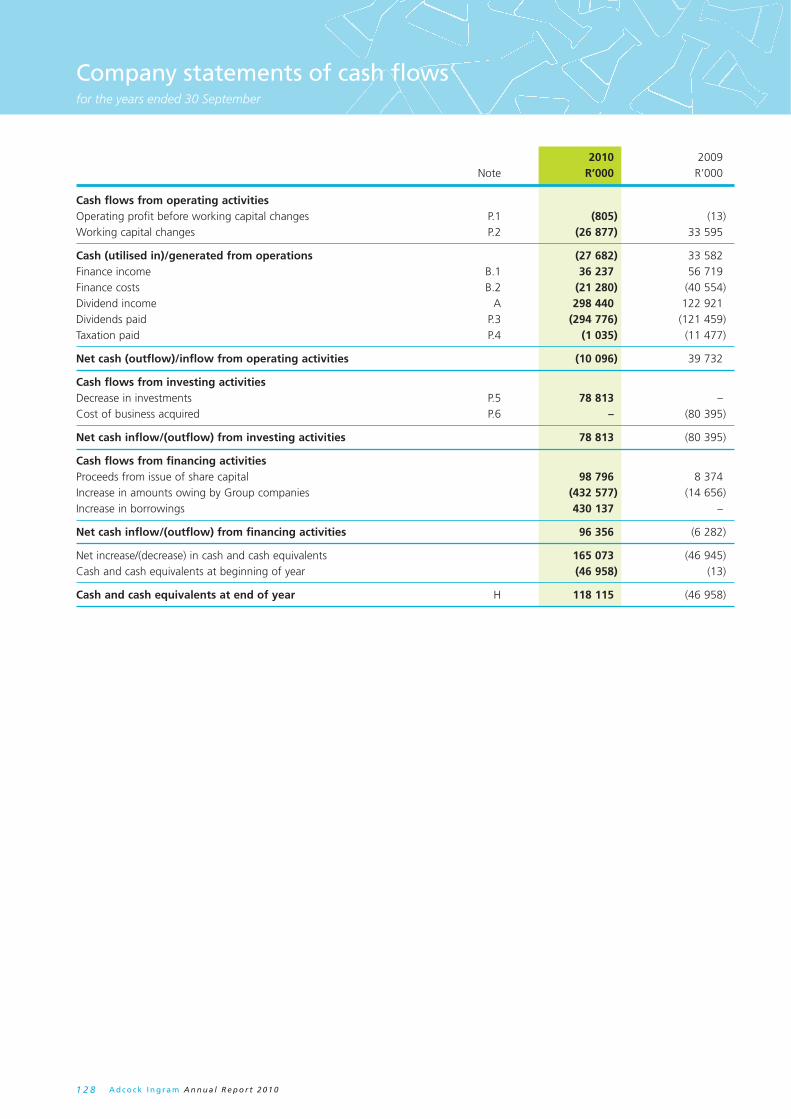
A d c o c k I n g r a m A n n u a l R e p o r t 2 0 1 01 2 8
Company statements of cash fl owsfor the years ended 30 September
2010 2009 Note R’000 R’000
Cash flows from operating activitiesOperating profit before working capital changes P.1 (805) (13)Working capital changes P.2 (26 877) 33 595
Cash (utilised in)/generated from operations (27 682) 33 582 Finance income B.1 36 237 56 719 Finance costs B.2 (21 280) (40 554)Dividend income A 298 440 122 921 Dividends paid P.3 (294 776) (121 459) Taxation paid P.4 (1 035) (11 477)
Net cash (outflow)/inflow from operating activities (10 096) 39 732
Cash flows from investing activitiesDecrease in investments P.5 78 813 – Cost of business acquired P.6 – (80 395)
Net cash inflow/(outflow) from investing activities 78 813 (80 395)
Cash flows from financing activitiesProceeds from issue of share capital 98 796 8 374 Increase in amounts owing by Group companies (432 577) (14 656)Increase in borrowings 430 137 –
Net cash inflow/(outflow) from financing activities 96 356 (6 282)
Net increase/(decrease) in cash and cash equivalents 165 073 (46 945)Cash and cash equivalents at beginning of year (46 958) (13)
Cash and cash equivalents at end of year H 118 115 (46 958)

A d c o c k I n g r a m A n n u a l R e p o r t 2 0 1 0 1 2 9
Notes to the Company annual fi nancial statementsfor the years ended 30 September
2010 2009 R’000 R’000
A Revenue Finance income 36 237 56 719 Dividend income 298 440 122 921
334 677 179 640
B Finance income and finance costs B.1 Finance income Bank 12 410 53 254 Inter group interest 23 827 3 465
36 237 56 719
B.2 Finance costs Borrowings 21 280 – Bank – 40 554
21 280 40 554
C Profit before taxation and abnormal item C.1 Profit before taxation and abnormal item has been arrived at,
after charging the following: Expenses Foreign exchange loss – 72
D Abnormal item Share-based payment charge 269 000 –
Abnormal items are items of income and expenditure which are not directly attributable to normal operations or where their size or nature are such that additional disclosure is considered appropriate. The abnormal item is the once-off share-based payment charge relating to the Strategic Partners of the Black Economic Empowerment transaction approved by shareholders on 9 April 2010.
E Taxation South African normal taxation – current year (4 153) (4 523) Secondary tax on companies – (4 115)
Total tax charge (4 153) (8 638)
Reconciliation of the taxation rate: % % Effective rate 9,5 6,2 Adjusted for: Exempt income 191,5 24,8 Non-deductible expenses (173,0) – Secondary tax on companies – (3,0)
South African normal tax rate 28,0 28,0

A d c o c k I n g r a m A n n u a l R e p o r t 2 0 1 01 3 0
Notes to the Company annual fi nancial statementsfor the years ended 30 September
2010 2009 R’000 R’000
F Dividends paid and proposed Declared and paid during the year Dividends on ordinary shares Final dividend for 2009: 80 cents 139 112 – Interim dividend for 2010: 78 cents (2009: 70 cents) 155 664 121 459
Total paid to equity holders of parent company 294 776 121 459
Proposed for approval at the Annual General Meeting Dividends on ordinary shares Final dividend for 2010: 102 cents per share (2009: 80 cents per share) 203 902 138 900
In terms of current legislation, the proposed dividend would result in a secondary tax on companies liability of R20,4 million.
2010 2009 Effective Effective 2010 2009 holding % holding % R’000 R’000
G Investments Adcock Ingram Limited 100 100 2 130 587 2 130 587 Adcock Ingram Healthcare (Pty) Limited 100 100 815 390 815 390 Adcock Ingram Intellectual Property (Pty) Limited 100 100 104 000 104 000 Adcock Ingram Critical Care (Pty) Limited 100 100 284 979 284 979 The Scientific Group (Pty) Limited 74 74 31 455 31 455 Adcock Ingram Limited India 49,9 49,9 31 930 31 930 Adcock Ingram International (Pty) Limited 100 100 * * Thembalami Pharmaceuticals (Pty) Limited 50 50 * * Tender Loving Care – Hygienic, Cosmetic
and Baby Products (Pty) Limited – 1 100 – 80 395 Group Risk Holdings (Pty) Limited 5,3 – 1 582 –
3 399 923 3 478 736
1 This investment was sold within the Group
* Less than R1 000
H Cash and cash equivalents Cash at banks and on hand 1 295 242 594 319 Bank overdraft (1 177 127) (641 277)
118 115 (46 958)
Cash at banks earns interest at floating rates based on daily bank deposit rates.
The fair value approximates the carrying value.
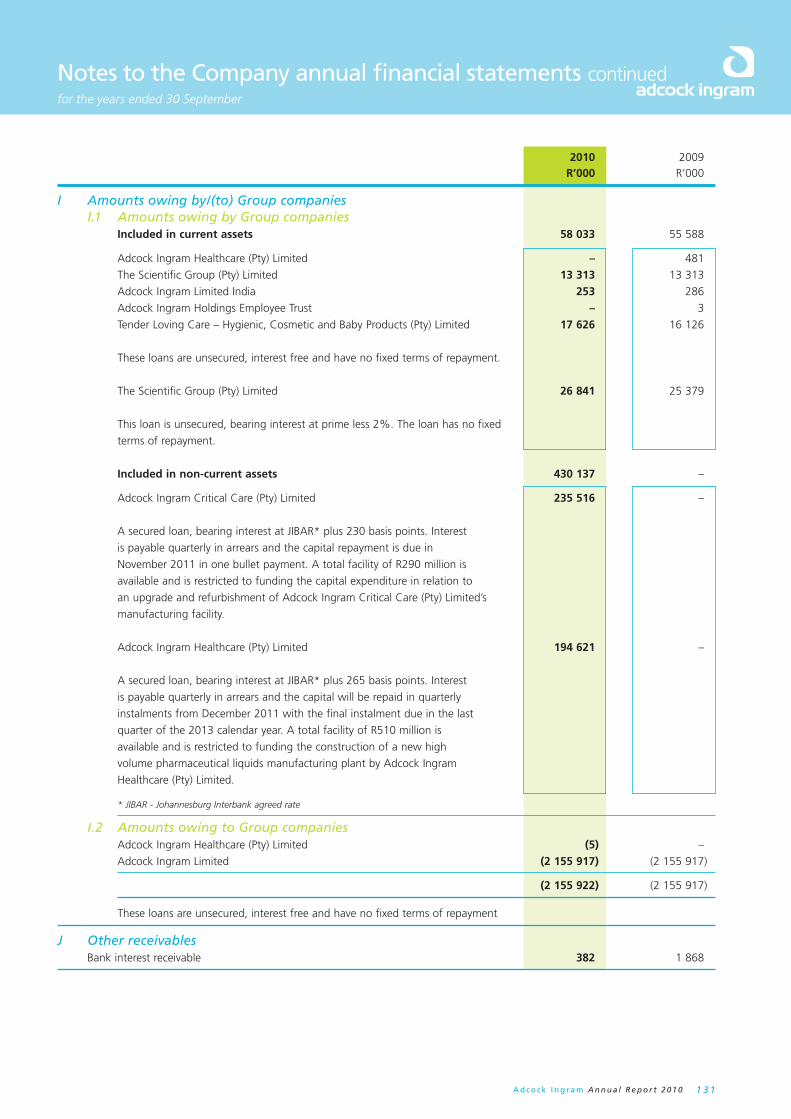
A d c o c k I n g r a m A n n u a l R e p o r t 2 0 1 0 1 3 1
Notes to the Company annual fi nancial statements continuedfor the years ended 30 September
2010 2009 R’000 R’000
I Amounts owing by/(to) Group companies I.1 Amounts owing by Group companies Included in current assets 58 033 55 588
Adcock Ingram Healthcare (Pty) Limited – 481
The Scientific Group (Pty) Limited 13 313 13 313
Adcock Ingram Limited India 253 286
Adcock Ingram Holdings Employee Trust – 3
Tender Loving Care – Hygienic, Cosmetic and Baby Products (Pty) Limited 17 626 16 126
These loans are unsecured, interest free and have no fixed terms of repayment.
The Scientific Group (Pty) Limited 26 841 25 379
This loan is unsecured, bearing interest at prime less 2%. The loan has no fixed
terms of repayment.
Included in non-current assets 430 137 –
Adcock Ingram Critical Care (Pty) Limited 235 516 –
A secured loan, bearing interest at JIBAR* plus 230 basis points. Interest
is payable quarterly in arrears and the capital repayment is due in
November 2011 in one bullet payment. A total facility of R290 million is
available and is restricted to funding the capital expenditure in relation to
an upgrade and refurbishment of Adcock Ingram Critical Care (Pty) Limited’s
manufacturing facility.
Adcock Ingram Healthcare (Pty) Limited 194 621 –
A secured loan, bearing interest at JIBAR* plus 265 basis points. Interest
is payable quarterly in arrears and the capital will be repaid in quarterly
instalments from December 2011 with the final instalment due in the last
quarter of the 2013 calendar year. A total facility of R510 million is
available and is restricted to funding the construction of a new high
volume pharmaceutical liquids manufacturing plant by Adcock Ingram
Healthcare (Pty) Limited.
* JIBAR - Johannesburg Interbank agreed rate
I.2 Amounts owing to Group companies Adcock Ingram Healthcare (Pty) Limited (5) –
Adcock Ingram Limited (2 155 917) (2 155 917)
(2 155 922) (2 155 917)
These loans are unsecured, interest free and have no fixed terms of repayment
J Other receivables Bank interest receivable 382 1 868

A d c o c k I n g r a m A n n u a l R e p o r t 2 0 1 01 3 2
Notes to the Company annual fi nancial statements continuedfor the years ended 30 September
2010 2009 R’000 R’000
K Share capital continued
K.1 Authorised(1)
Ordinary share capital 250 000 000 ordinary shares of 10 cents each 25 000 25 000
19 458 196 A shares of 10 cents each 1 946 –
6 486 065 B shares of 10 cents each 649 –
K.2 Issued(2)
Ordinary share capital Opening balance of 173 625 578 shares (2009: 173 055 168) of 10 cents each 17 363 17 306
Issue of 334 240 ordinary shares (2009: 570 410) of 10 cents each 33 57
Issue of 19 458 196 A shares of 10 cents each 1 946 –
Issue of 6 486 065 B shares of 10 cents each 649 –
19 991 17 363
(1) Authorised share capital The authorised share capital was increased during the current year in terms of article 8.1 of the Articles of Association of
the Company, with the creation of:
(i) 19 458 196 automatically convertible A ordinary shares with a par value of 10 cents each; and
(ii) 6 486 065 automatically convertible B ordinary shares with a par value of 10 cents each.
(2) Issued share capital The following ordinary shares were issued during the year:
(i) In various tranches, 334 240 ordinary shares were issued to meet the obligations of the Adcock Ingram Holdings
Limited Employees Share Trust;
(ii) On 5 May 2010, A ordinary shares were issued to Blue Falcon Trading 69 (Pty) Limited, a company through which
the Strategic Partners participating in the BEE transaction hold their equity interest in Adcock Ingram; and
(iii) On 5 May 2010, B ordinary shares were issued in terms of the BEE transaction, to the Mpho ea Bophelo Trust for
the benefit of qualifying employees.
Terms and conditions of the A and B ordinary shares as per sections 43 and 44 of the Articles of Association:
A and B ordinary shares rank pari passu with the ordinary shares, save that:
(i) these A and B ordinary shareholders shall not participate in any special dividends declared or paid by the Company,
unless the respective notional outstanding loan balances become zero at any time prior to the respective release
dates, in which event these A and B ordinary shares shall be entitled to participate in all special dividends declared
or paid by the Company;
(ii) A and B ordinary shares shall remain certificated and shall not be listed on any stock exchange;
(iii) for so long as the ordinary shares are listed on the JSE, the rights attaching to these A and B ordinary shares may
not be amended in any material respect without the prior written approval of the JSE; and
(iv) these terms and conditions may only be amended as prescribed by article 43 and 44 of the Articles of Association
of the Company.
(3) Unissued shares The unissued shares are under the control of the directors subject to a limit of 10% of issued ordinary share capital, in
terms of a general authority to allot and issue them on such terms and conditions and at such times as they deem fit.
This authority expires at the forthcoming annual general meeting of the Company.

A d c o c k I n g r a m A n n u a l R e p o r t 2 0 1 0 1 3 3
Notes to the Company annual fi nancial statements continuedfor the years ended 30 September
2010 2009 R’000 R’000
L Share premium Balance at the beginning of the year 1 203 854 1 195 537 Issue of 334 240 ordinary shares (2009: 570 410) 4 364 8 317 Issue of 19 458 196 A shares 91 804 –
1 300 022 1 203 854
Share-based payment Other reserve reserves Total R’000 R’000 R’000
M Non-distributable reserves Balance at 1 October 2008 – – – Movement during the year – 286 286
Balance at 30 September 2009 – 286 286
Movement during the year 269 000 – 269 000
Balance at 30 September 2010 269 000 286 269 286
Share-based payment reserve The share-based payment reserve relates to the once-off share-based payment expense in respect of the Black Economic
Empowerment transaction approved by shareholders on 9 April 2010.
2010 2009 R’000 R’000
N Long-term borrowings A secured loan bearing interest at JIBAR plus 230 basis points. Interest is payable
quarterly in arrears and the capital repayment is due in November 2011 in one bullet payment. A total facility of R290 million is available. 235 516 –
A secured loan bearing interest at JIBAR plus 265 basis points. Interest is payable
quarterly in arrears and the capital will be repaid in quarterly instalments from December 2011 with the final instalment due in the last quarter of the 2013 calendar year. A total facility of R510 million is available. 194 621 –
430 137 – Less: Current portion included in short-term borrowings – –
430 137 –
Repayments of secured loans – payable within 12 months – – – payable within 12 – 24 months 322 014 – – payable thereafter 108 123 –
430 137 –
O Other payables Interest accrued 6 451 4 947 Final payment for TLC acquisition – 30 000 Other 229 96
6 680 35 043

A d c o c k I n g r a m A n n u a l R e p o r t 2 0 1 01 3 4
Notes to the Company annual fi nancial statements continuedfor the year ended 30 September 2010
2010 2009 R’000 R’000
P Notes to the cash flow statement P.1 Operating profit before working capital changes Profit before taxation 43 592 139 073 Adjusted for: – dividend income (298 440) (122 921) – net finance income (14 957) (16 165) – equity share-based expenses 269 000 –
(805) (13)
P.2 Working capital changes Decrease/(increase) in trade and other receivables 1 486 (1 448) (Decrease)/Increase in trade and other payables (28 363) 35 043
(26 877) 33 595
P.3 Dividends paid Dividends paid to equity holders of the parent (294 776) (121 459)
P.4 Taxation paid Amounts overpaid/(unpaid) at beginning of year 2 766 (73) Amounts charged to income statement (4 153) (8 638) Amounts unpaid/(overpaid) at end of year 352 (2 766)
(1 035) (11 477)
P.5 Decrease in investments Cost of acquisition of 5,3% interest in Group Risk Holdings (Pty) Limited (1 582) – Disposal of TLC within the Group 80 395 –
78 813 –
P.6 Business combinations Tender Loving Care – Hygienic, Cosmetic and Baby Products
(Pty) Limited Net cash purchase price – (80 395)
R Related parties Related party transactions exist between the Company and other subsidiaries within
the Adcock Ingram Group. All transactions with related parties are concluded at arm’s length.
The following related party transactions occurred during the years ended 30 September
Interest received Adcock Ingram Healthcare (Pty) Limited 8 003 – Adcock Ingram Critical Care (Pty) Limited 13 277 – The Scientific Group (Pty) Limited 2 547 3 465 Dividends received Adcock Ingram Limited 6 995 10 313 Adcock Ingram Critical Care (Pty) Limited 139 112 70 000 Adcock Ingram Intellectual Property (Pty) Limited 148 670 42 000 Adcock Ingram Limited India 3 663 608

A d c o c k I n g r a m A n n u a l R e p o r t 2 0 1 0 1 3 5
Annexure AInterest in subsidiary companies, joint ventures and associates
Share- Share- holding holding 2010 2009 % %
SubsidiariesAdcock Ingram Limited 100 100Adcock Ingram Healthcare (Pty) Limited 100 100Adcock Ingram Intellectual Property (Pty) Limited 100 100The Scientific Group (Pty) Limited 74 74Adcock Ingram Critical Care (Pty) Limited 100 100Adcock Ingram International (Pty) Limited 100 100Tender Loving Care – Hygienic, Cosmetic and Baby Products (Pty) Limited 100 100 Joint ventures Thembalami Pharmaceuticals (Pty) Limited 50 50Adcock Ingram Limited India 49,9 49,9 Indirect holdings Adcock Ingram Pharmaceuticals (Pty) Limited 100 100Premier Pharmaceutical Company (Pty) Limited 100 100Metamorphosa (Pty) Limited 50 50Menarini SA (Pty) Limited 49 49Novartis Ophthalmics (Pty) Limited 49 49Batswadi Biotech (Pty) Limited 45 45Addclin Research (Pty) Limited 51 51Adcock Ingram Intellectual Property No 1 (Pty) Limited 100 100Scientific Group Finance (Pty) Limited 100 100South African Scientific Pharmaceuticals (Pty) Limited 100 100H Investments No 161 (Pty) Limited 40 40Scientific Group Holdings (Pty) Limited 100 100Scientific Group Investments (Pty) Limited 100 100Dilwed Investments (Pty) Limited 100 100Adcock Ingram Namibia (Pty) Limited 100 100National Renal Care (Pty) Limited 50 50Adcock Ingram East Africa Limited 100 100Ayrton Drug Manufacturing Limited (Ghana) 66,2 N/A Trusts and special purpose entitiesAdcock Ingram Holdings Employees Trust Mpho ea Bophelo Trust Blue Falcon Trading 69 (Pty) Limited

A d c o c k I n g r a m A n n u a l R e p o r t 2 0 1 01 3 6
Shareholder analysis
1. Registered shareholder spread In accordance with the JSE Listing Requirements, the following table confirms the spread of registered shareholders as detailed in
the Annual Report and Accounts dated 30 September 2010:
Number of % of total Number of % of issued Shareholder spread holders shareholders shares capital
1 – 1 000 shares 9 170 70,12 3 415 216 1,71 1 001 – 10 000 shares 3 154 24,12 9 696 458 4,86 10 001 – 100 000 shares 542 4,14 17 088 263 8,56 100 001 – 1 000 000 shares 182 1,39 55 781 592 27,82 1 000 001 shares and above 29 0,23 113 922 550 57,05
Total 13 077 100,00 199 904 079 100,00
2. Public and non-public shareholdings Within the shareholder base, we are able to confirm the split between public shareholdings and directors/company related schemes
as being:
Number of % of total Number of % of issued Shareholder type holders shareholders shares capital
Non-public shareholders 7 0,07 26 353 261 13,17
Adcock Ingram HoldingsEmployees Trust 1 0,01 60 700 0,03
Blue Falcon Trading 69 (Pty) Limited (A shares) 1 0,01 19 458 196 9,73
Blue Falcon Trading 69 (Pty) Limited (ordinary shares) 1 0,01 221 897 0,11
Mpho ea Bophelo Trust (B shares) 1 0,01 6 486 065 3,24 Mpho ea Bophelo Trust (ordinary shares) 1 0,01 87 003 0,04 Directors 2 0,02 39 400 0,02
Public shareholders 13 070 99,93 173 550 818 86,83
Total 13 077 100,00 199 904 079 100,00
3. Substantial investment management and beneficial interests above 3% Through regular analysis of STRATE registered holdings, and pursuant to the provisions of Section 140a of the Companies Act, the
following shareholders held directly and indirectly equal to or in excess of 3% of the issued share capital as at 30 September 2010:
Investment manager Total shareholding %
PIC 21 560 345 10,79 Blue Falcon Trading 69 (Pty) Limited (A & Ord Shares) 19 680 093 9,84 RMB Asset Management 14 385 056 7,20 Prudential Portfolio Managers 12 113 879 6,06 Abax Investments 9 687 358 4,85 Old Mutual Investment Group SA 8 240 312 4,12 Wellington Management Company 7 236 276 3,62 Dodge & Cox 7 047 217 3,53 Allan Gray Investment Council 6 834 232 3,42 Mpho ea Bophelo Trust (B & Ord Shares) 6 573 068 3,29
Total 113 357 836 56,72

A d c o c k I n g r a m A n n u a l R e p o r t 2 0 1 0 1 3 7
Shareholder analysis continued
3. Substantial investment management & beneficial interests above 3% continued Beneficial shareholdings Total shareholding %
Government Employees Pension Fund 26 455 780 13,23 Blue Falcon Trading 69 (Pty) Limited (A & Ord Shares) 19 680 093 9,84 Dodge & Cox International Stock Fund 7 047 217 3,53 Mpho ea Bophelo Trust (B & Ord Shares) 6 573 068 3,29 Momentum Group Limited 6 354 310 3,18
Total 66 110 468 33,07
4. Geographic split of shareholders Total % of issued Region shareholding capital
South Africa 163 706 267 81,89 United States of America & Canada 15 795 038 7,90 United Kingdom 3 713 171 1,86 Rest of Europe 7 186 277 3,59 Rest of World¹ 9 503 326 4,76
Total 199 904 079 100,00
¹ Represents all shareholdings except those in the above regions
Geographic split of beneficial shareholders
Rest of the world – 95%
Ireland 17%
Europe 5%
Rest of the world – 97%
Asia/Pacific 3%
United Kingdom34%
Norway 22%
Remainder 27%
Namibia 1%
Remainder 16%
Singapore 70%
Hong Kong7%
Australia7%
Total Asia/Pacific holding Split of beneficial shares
Total European holding Split of beneficial shares
Total North American holding
Rest of the world – 92% USA – 97%
North America 8%
Canada 3%
Split of beneficial shares
Rest of the world – 18%
Africa 82%
Swaziland1%
South Africa 98%
Total African holding Split of beneficial shares
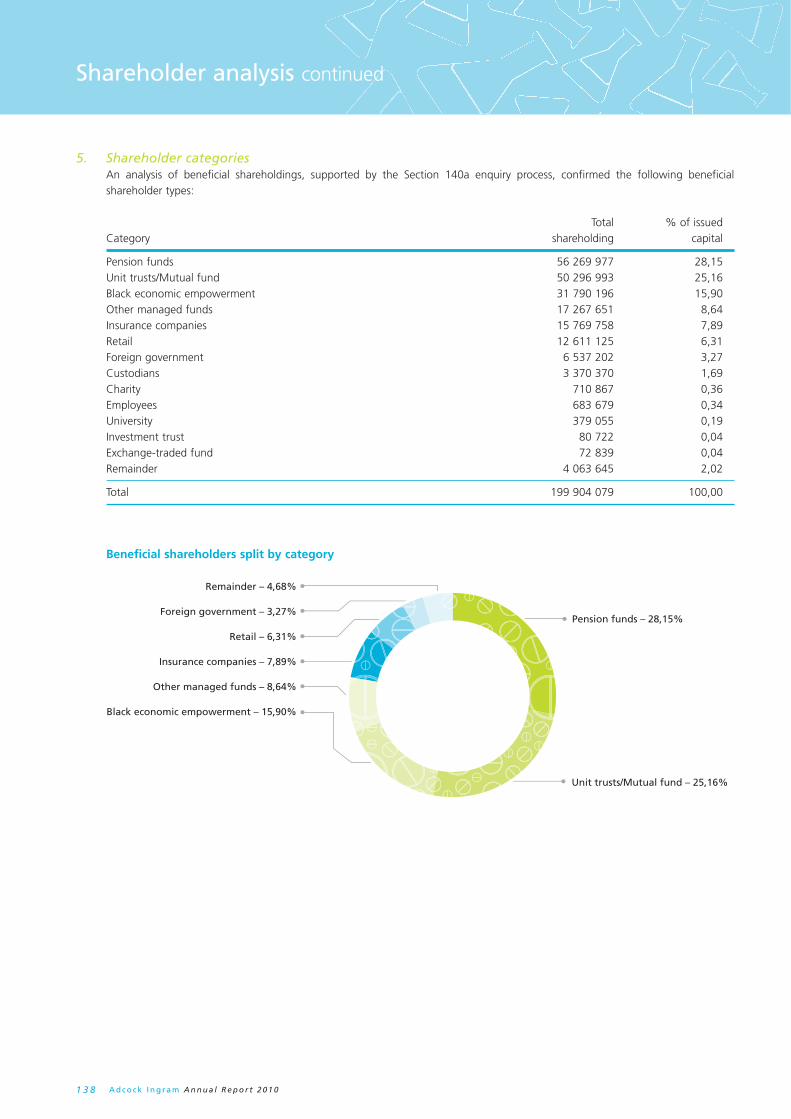
A d c o c k I n g r a m A n n u a l R e p o r t 2 0 1 01 3 8
Shareholder analysis continued
5. Shareholder categories An analysis of beneficial shareholdings, supported by the Section 140a enquiry process, confirmed the following beneficial
shareholder types:
Total % of issued Category shareholding capital
Pension funds 56 269 977 28,15 Unit trusts/Mutual fund 50 296 993 25,16 Black economic empowerment 31 790 196 15,90 Other managed funds 17 267 651 8,64 Insurance companies 15 769 758 7,89 Retail 12 611 125 6,31 Foreign government 6 537 202 3,27 Custodians 3 370 370 1,69 Charity 710 867 0,36 Employees 683 679 0,34 University 379 055 0,19 Investment trust 80 722 0,04 Exchange-traded fund 72 839 0,04 Remainder 4 063 645 2,02
Total 199 904 079 100,00
Beneficial shareholders split by category
Unit trusts/Mutual fund – 25,16%
Pension funds – 28,15%
Retail – 6,31%
Insurance companies – 7,89%
Other managed funds – 8,64%
Black economic empowerment – 15,90%
Remainder – 4,68%
Foreign government – 3,27%
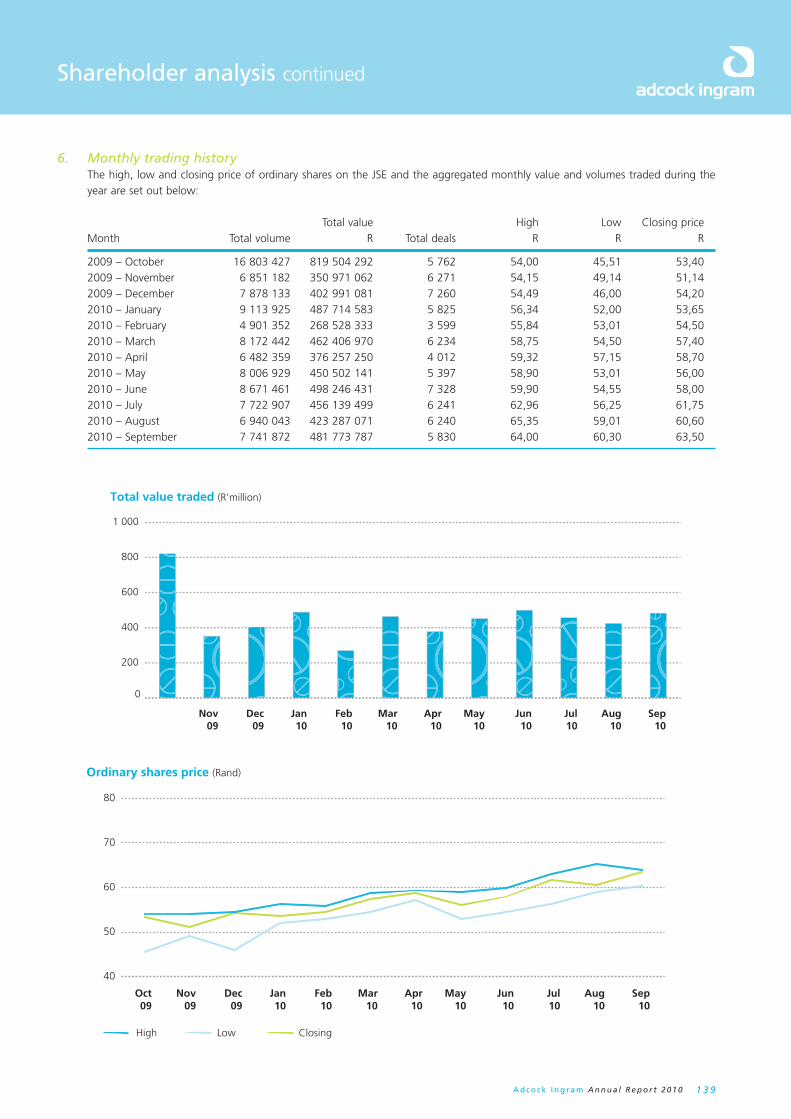
A d c o c k I n g r a m A n n u a l R e p o r t 2 0 1 0 1 3 9
Shareholder analysis continued
6. Monthly trading history The high, low and closing price of ordinary shares on the JSE and the aggregated monthly value and volumes traded during the
year are set out below: Total value High Low Closing price Month Total volume R Total deals R R R
2009 – October 16 803 427 819 504 292 5 762 54,00 45,51 53,40 2009 – November 6 851 182 350 971 062 6 271 54,15 49,14 51,14 2009 – December 7 878 133 402 991 081 7 260 54,49 46,00 54,20 2010 – January 9 113 925 487 714 583 5 825 56,34 52,00 53,65 2010 – February 4 901 352 268 528 333 3 599 55,84 53,01 54,50 2010 – March 8 172 442 462 406 970 6 234 58,75 54,50 57,40 2010 – April 6 482 359 376 257 250 4 012 59,32 57,15 58,70 2010 – May 8 006 929 450 502 141 5 397 58,90 53,01 56,00 2010 – June 8 671 461 498 246 431 7 328 59,90 54,55 58,00 2010 – July 7 722 907 456 139 499 6 241 62,96 56,25 61,75 2010 – August 6 940 043 423 287 071 6 240 65,35 59,01 60,60 2010 – September 7 741 872 481 773 787 5 830 64,00 60,30 63,50
Total value traded (R’million)
0
200
400
600
800
1 000
Nov09
Dec09
Jan10
Feb10
Mar10
Apr10
May10
Jun10
Jul10
Aug10
Sep10
Ordinary shares price (Rand)
High Low Closing
40
50
60
70
80
Oct09
Nov09
Dec09
Jan10
Feb10
Mar10
Apr10
May10
Jun10
Jul10
Aug10
Sep10

A d c o c k I n g r a m A n n u a l R e p o r t 2 0 1 01 4 0
Notice of Annual General Meeting
ADCOCK INGRAM HOLDINGS LIMITED(Incorporated in the Republic of South Africa)
Registration number 2007/016236/06ISIN: ZAE000123436 JSE Share Code: AIP
Board of directors: KDK Mokhele (Chairman), EK Diack, AG Hall (CFO), T Lesoli, JJ Louw (CEO), CD Raphiri, LE Schönknecht, RI Stewart, AM Thompson
Notice is hereby given that the third Annual General Meeting of members of Adcock Ingram Holdings Limited (the Company) will be held at the Company’s premises, 1 New Road, Midrand, Gauteng on Thursday, 27 January 2011 at 14h00 to conduct the following business:
Ordinary resolution 1To receive, consider and adopt the audited annual financial statements of the Group and the Company, incorporating the reports of the auditors, the Audit Committee and the directors for the year ended 30 September 2010.
Ordinary resolution 2To elect by way of separate resolutions the directors who retire by rotation in accordance with the Company’s Articles of Association. The directors retiring are listed below, all of whom being eligible and available offer themselves for re-election.
2.1 CD Raphiri;2.2 LE Schönknecht; 2.3 RI Stewart; and2.4 AM Thompson
An abbreviated curriculum vitae in respect of each director offering himself for re-election is contained on page 11 of the Annual Report.
Ordinary resolution 3To re-appoint Ernst & Young as independent external auditors of the Company for the ensuing year (the designated auditor being Mr W Kinnear) and to note the remuneration of the independent external auditors as determined by the Audit Committee of the board for the past year’s audit as reflected in note 4 to the annual financial statements.
Ordinary resolution 4To consider and if deemed appropriate, sanction the proposed remuneration payable to non-executive directors with effect from 1 February 2011 until the next Annual General Meeting, as set out in the table contained in the explanatory notes to this notice.
Special businessSpecial resolution 1To consider and, if deemed fit, to pass, with or without modification, the following special resolution:
“RESOLVED that the directors be and are hereby authorised to approve and implement the acquisition by the Company (or by a subsidiary of the Company up to a maximum of 10% (ten percent) of the number of issued ordinary shares of the Company) of ordinary shares issued by the Company by way of a general authority, which shall only be valid until the Company’s next annual general meeting, unless it is then renewed, provided that it shall not extend beyond 15 (fifteen) months from the date of the passing of the special resolution, whichever period is the shorter, in terms of the Companies Act 61 of 1973, as amended or replaced, and the JSE Limited (JSE) Listings Requirements (Listings Requirements) which provide, inter alia, that the Company may only make a general repurchase of its ordinary shares subject to:– the repurchase being implemented through the order book operated by the JSE trading system, without prior understanding or
arrangement between the Company and the counter party;– the Company being authorised thereto by its Articles of Association;– repurchases not being made at a price greater than 10% (ten percent) above the weighted average of the market value of the ordinary
shares for the 5 (five) business days immediately preceding the date on which the transaction was effected;– an announcement being published as soon as the Company has repurchased ordinary shares constituting, on a cumulative basis, 3%
(three percent) of the initial number of ordinary shares, and for each 3% (three percent) in aggregate of the initial number of ordinary shares repurchased thereafter, containing full details of such repurchases;

A d c o c k I n g r a m A n n u a l R e p o r t 2 0 1 0 1 4 1
Notice of Annual General Meeting continued
– repurchases not exceeding 20% (twenty percent) in aggregate of the Company’s issued ordinary share capital in any one financial year;– the Company’s sponsor reporting to the JSE that it has discharged its responsibilities in terms of Schedule 25 of the Listings
Requirements relating to the Company’s working capital for the purposes of undertaking the repurchase of ordinary shares prior to entering the market to proceed with the repurchase;
– the Company and/or its subsidiaries not repurchasing securities during a prohibited period as defined in paragraph 3.67 of the Listings Requirements, unless it has in place a repurchase programme where the dates and quantities of securities to be traded during the relevant period are fixed and full details of the programme have been disclosed in an announcement published on SENS prior to the commencement of the prohibited period; and
– the Company only appointing one agent at any point in time to effect any repurchases on its behalf.”
The directors undertake that, to the extent it is still required by the Listings Requirements and the Companies Act, they will not implement the repurchase as contemplated in this special resolution while this general authority is valid, unless:– the Company and the Company and its subsidiaries (the Group) will be able, in the ordinary course of business, to pay its debts for a
period of 12 months after the date of such repurchase;– the working capital of the Company and the Group will be adequate for ordinary business purposes for a period of 12 months after
the date of such repurchase;– the assets of the Company and the Group, measured in accordance with the accounting policies used in the latest audited annual
Group financial statements, will exceed the liabilities of the Company and the Group for a period of 12 months after the date of such repurchase; and
– the Company’s and the Group’s ordinary share capital and reserves will be adequate for ordinary business purposes for a period of 12 months after the date of such repurchase.
The following additional information, some of which may appear elsewhere in the Annual Report, is provided in terms of the Listings Requirements for purposes of this general authority:
– directors and management – pages 10 to 13;– major shareholders – pages 136 and 137;– directors’ interests in securities – page 67; and – share capital of the Company – page 132.
The directors in office whose names appear on pages 10 and 11 of the Annual Report, are not aware of any legal or arbitration proceedings, including proceedings that are pending or threatened, that may have or have had in the recent past, being at least the previous 12 (twelve) months, a material effect on the Group’s financial position, save for the one published on the SENS.
Directors’ responsibility statementThe directors in office, whose names appear on pages 10 and 11 of the Annual Report, collectively and individually accept full responsibility for the accuracy of the information pertaining to this special resolution and certify that, to the best of their knowledge and belief, there are no facts that have been omitted which would make any statement false or misleading, and that all reasonable enquiries to ascertain such facts have been made and that the special resolution contains all information required by law and the Listings Requirements.
Material changesOther than the facts and developments reported on in the Annual Report, there have been no material changes in the financial or trading position of the Company and its subsidiaries since the date of signature of the audit report and up to the date of this notice.
Reason for and effect of special resolution 1The reason for and effect of the special resolution is to grant the directors of the Company a general authority in terms of the Companies Act 61 of 1973, as amended or replaced, and the JSE Listings Requirements for the repurchase by the Company (or by a subsidiary of the Company) of the Company’s shares.
Ordinary resolution 5To authorise any one director and/or the secretary of the Company or equivalent to do all such things and sign all such documents as are deemed necessary to implement the resolutions set out in the notice convening the Annual General Meeting at which these resolutions will be considered.
Any shareholder holding shares in certificated form or recorded on the Company’s sub-register in electronic dematerialised form in “own name” and entitled to attend, speak and vote at the meeting is entitled to appoint a proxy to attend, speak and on a poll vote in his stead. A proxy need not be a member of the Company.

A d c o c k I n g r a m A n n u a l R e p o r t 2 0 1 01 4 2
Notice of Annual General Meeting continued
Proxy forms must be lodged in person or posted to the Company’s transfer secretaries, Computershare Investor Services (Proprietary) Limited (70 Marshall Street, Corner Sauer Street, Johannesburg; P O Box 61051, Marshalltown, 2107), by no later than 14h00 on Tuesday, 25 January 2011.
All beneficial owners whose shares have been dematerialised through a Central Securities Depository Participant (CSDP) or broker other than with “own name” registration, must provide the CSDP or broker with their voting instructions in terms of their custody agreement should they wish to vote at the Annual General Meeting. Alternatively, they may request the CSDP or broker to provide them with a letter of representation, in terms of their custody agreements, should they wish to attend the Annual General Meeting.
In terms of the JSE Listings Requirements Adcock ordinary shares held by The Adcock Ingram Holdings Limited Employee Share Trust will not have their votes at the Annual General Meeting taken into account for JSE Listings Requirements resolution approval purposes. Mpho ea Bophelo Trust will also not be eligible to vote until its beneficiaries join the scheme.
By order of the board
NE Simelane Acting Company Secretary
Midrand24 December 2010

A d c o c k I n g r a m A n n u a l R e p o r t 2 0 1 0 1 4 3
Annual General Meeting – explanatory notes
Ordinary resolution 1 – Adoption of annual financial statementsAt the Annual General Meeting, the directors must present the annual financial statements for the year ended 30 September 2010 to shareholders, together with the reports of the directors, the audit committee and the auditors. These are contained within the Annual Report.
Ordinary resolution 2 – Re-election of directorsIn accordance with the Company’s Articles of Association, one third of the directors are required to retire at each Annual General Meeting and may offer themselves for re-election. In addition, any person appointed to the board of directors of the Company following the previous Annual General Meeting is similarly required to retire and is eligible for re-election at the next Annual General Meeting.
The following directors retire by rotation, and having been evaluated and had their suitability for reappointment confirmed by the nominations committee, are eligible for re-election:
CD Raphiri;LE Schönknecht; RI Stewart; andAM Thompson.
Brief biographical details of each of the above directors and the remaining members of the board are set out on page 12 of the Annual Report.
Ordinary resolution 3 – AuditorsErnst & Young has indicated its willingness to continue in office and ordinary resolution 3 proposes the re-appointment of that firm as the Company’s auditors with effect from 28 January 2011 until the next Annual General Meeting. As required in terms of s274(3) of the Companies Act 61 of 1973, as amended or replaced, the name of the designated auditor, Mr W Kinnear, forms part of the resolution. The resolution also notes the remuneration of the independent external auditors as determined by the audit committee of the board.
Ordinary resolution 4 – Proposed remuneration of non-executive directors payable with effect from 1 January 2011Shareholders are requested to consider and if deemed appropriate, sanction the proposed fees payable to non-executive directors with effect from 1 February 2011 until the next Annual General Meeting as set out in the table hereunder. Full particulars of all fees and remuneration for the past financial year are contained on page 52 of the Annual Report.
Current fees Fees:Designation R % increase 1 February 2011
Chairman (Group board) 875 000 5 918 750
Member (Group board) 200 200 5 210 210
Chairman (Audit and Risk and Sustainability Committee) 190 000 5 199 500
Member (Audit and Risk and Sustainability Committee) 95 000 5 99 750
Chairman (Remuneration Committee) 78 000 5 81 900
Member (Remuneration Committee) 49 500 5 51 975
Chairman (Transformation Committee) 73 200 5 76 860
Member (Transformation Committee) 39 600 5 41 580
Special resolution 1 – Share repurchase The board of directors believe that it may be prudent to obtain a general authority to repurchase the Company’s shares should the opportunity arise and as a result require shareholders’ consent by way of a special resolution for a repurchase of the Company’s shares, subject to the provisions of the JSE Listings Requirements as set out in the proposed resolution.
Ordinary resolution 5 – Director or secretary of the Company authorisationAny one director or the secretary of the Company be authorised to do all such things and sign all documents and take all such action as they consider necessary to implement the resolutions set out in the notice convening the Annual General Meeting at which this ordinary resolution will be considered.
A d c o c k I n g r a m A n n u a l R e p o r t 2 0 1 01 4 4
Glossary
The following terms and abbreviations, used in this Annual Report, mean:
Adcock Ingram Adcock Ingram Holdings Limited or the Group
AICC Adcock Ingram Critical Care (Pty) Limited
A ordinary share A share with a par value of 10 cents in the Company, which carries the same voting rights as an ordinary share, and which is automatically convertible into an ordinary share on a one-for-one basis
API Active Pharmaceutical Ingredient(s) used in the manufacturing of products
ARV Antiretrovirals, used in the treatment of HIV and AIDs
BBBEE Broad based black economic empowerment, as defined by the codes of BEE good practice
BEE Black Economic Empowerment, as envisaged in the BEE legislation
BEE-Co Blue Falcon 69 Trading (Proprietary) Limited (Registration number 2009/016091/07, a private company through which the Strategic Partners will hold their equity interests in Adcock
BEE Participants Bee-Co and the Employee Trust
Blue Falcon Trading 69 (Pty) Limited BEE-Co owned by Kagiso 62.9%, Kurisani 26.6% and Mookodi 10.5%
B ordinary share A share with a par value of 10 cents in the Company, which carries the same voting rights as an ordinary share, and which is automatically convertible into an ordinary share on a one-for-one basis
cents South Africa cents in the official currency of South Africa
CO2 Carbon dioxide
CO2e Carbon dioxide equivalent
Companies Act The Companies Act (Act 61 of 1973), as amended or replaced from time to time
Companies Act 2008 The Companies Act (Act 71 of 2008)
Employee Trust The Mpho ea Bophelo Trust (Master’s reference number IT330/2010)
FDA The Food and Drug Administration, a regulatory body in the United States
Flow cytometry A technique for the optical analysis and separation of cells
FMCG Fast moving consumer goods
Group Adcock and its direct and indirect subsidiaries and associates from time to time
HVL High-volume liquids, used in the context of the plant currently being developed by Adcock Ingram
IFRS International Financial Reporting Standards
IT Information Technology
JIBAR Johannesburg interbank agreed rate
JSE JSE Limited, the securities exchange on which the shares of Adcock Ingram are listed
Kagiso Kagiso Strategic Investments III (Proprietary) Limited (Registration number 2007/023000/07)
Kurisani Kurisani Youth Development Trust (Master’s reference number IT8979/04), a trust set up in accordance with the laws of South Africa to benefit historically disadvantaged South African youth through loveLife’s Programmes
kWh Kilowatt hour
MCC Medicines Control Council, the regulatory body responsible for evaluation of and monitoring the quality, safety and efficacy of medicines on the South African market
Mookodi The Mookodi Pharma Trust (Master’s reference number IT314/2010), a trust set up in accordance with the laws of South Africa and for the benefit of black medical doctors and/or health professionals
OTC Over-the-counter products, available without prescription
PIC/S Pharmaceutical Inspection Convention and Pharmaceutical Co-operation Scheme
R&D Research and Development
Reagent A substance used in a chemical reaction to detect, measure, examine or produce another
RONA Return on net assets
SEP Single exit price, the price determined by regulation, at which medicines may be offered for sale on the South African private market
SIP Strategic Industrial Programme
TLC Tender Loving Care (Pty) Limited
TSG The Scientific Group (Pty) Limited
WHO World Health Organisation
ZAR South African Rand
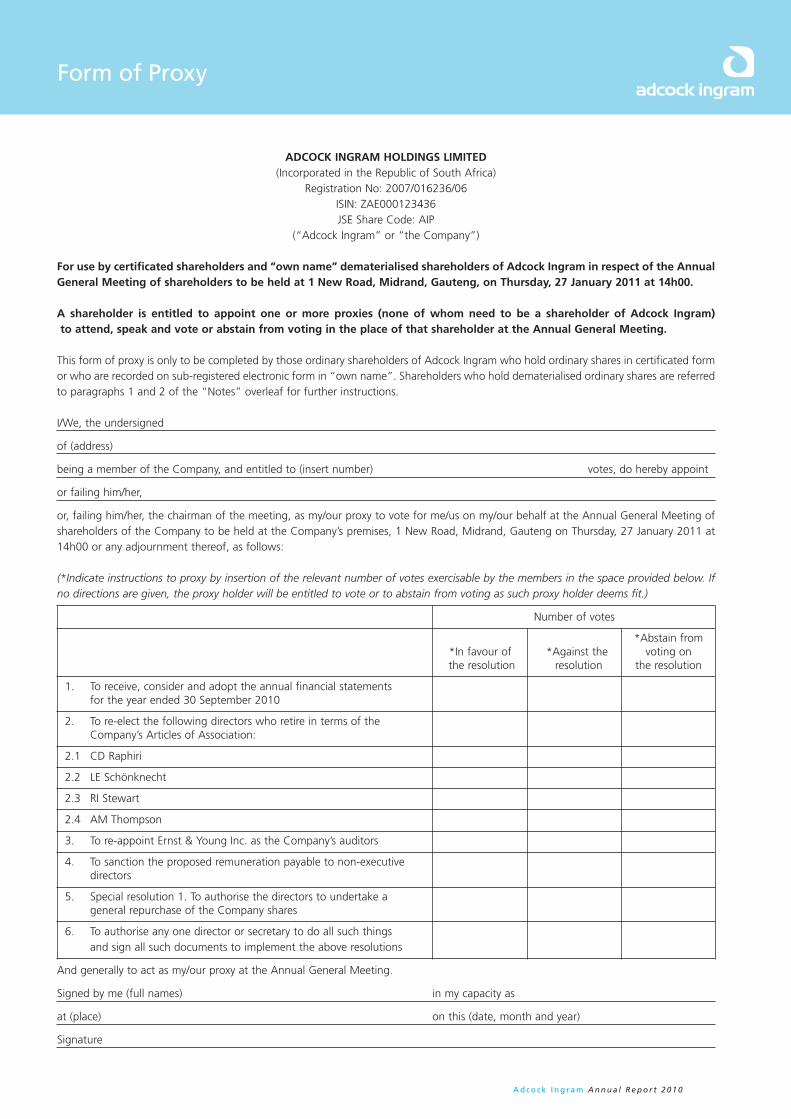
A d c o c k I n g r a m A n n u a l R e p o r t 2 0 1 0
Form of Proxy
ADCOCK INGRAM HOLDINGS LIMITED(Incorporated in the Republic of South Africa)
Registration No: 2007/016236/06ISIN: ZAE000123436JSE Share Code: AIP
(“Adcock Ingram” or “the Company”)
For use by certificated shareholders and “own name” dematerialised shareholders of Adcock Ingram in respect of the Annual General Meeting of shareholders to be held at 1 New Road, Midrand, Gauteng, on Thursday, 27 January 2011 at 14h00.
A shareholder is entitled to appoint one or more proxies (none of whom need to be a shareholder of Adcock Ingram) to attend, speak and vote or abstain from voting in the place of that shareholder at the Annual General Meeting.
This form of proxy is only to be completed by those ordinary shareholders of Adcock Ingram who hold ordinary shares in certificated form or who are recorded on sub-registered electronic form in “own name”. Shareholders who hold dematerialised ordinary shares are referred to paragraphs 1 and 2 of the “Notes” overleaf for further instructions.
I/We, the undersigned
of (address)
being a member of the Company, and entitled to (insert number) votes, do hereby appoint
or failing him/her,
or, failing him/her, the chairman of the meeting, as my/our proxy to vote for me/us on my/our behalf at the Annual General Meeting of shareholders of the Company to be held at the Company’s premises, 1 New Road, Midrand, Gauteng on Thursday, 27 January 2011 at 14h00 or any adjournment thereof, as follows:
(*Indicate instructions to proxy by insertion of the relevant number of votes exercisable by the members in the space provided below. If no directions are given, the proxy holder will be entitled to vote or to abstain from voting as such proxy holder deems fit.)
Number of votes
*Abstain from *In favour of *Against the voting on the resolution resolution the resolution
1. To receive, consider and adopt the annual financial statements for the year ended 30 September 2010
2. To re-elect the following directors who retire in terms of the Company’s Articles of Association:
2.1 CD Raphiri
2.2 LE Schönknecht
2.3 RI Stewart
2.4 AM Thompson
3. To re-appoint Ernst & Young Inc. as the Company’s auditors
4. To sanction the proposed remuneration payable to non-executive directors
5. Special resolution 1. To authorise the directors to undertake a general repurchase of the Company shares
6. To authorise any one director or secretary to do all such things and sign all such documents to implement the above resolutions
And generally to act as my/our proxy at the Annual General Meeting.
Signed by me (full names) in my capacity as
at (place) on this (date, month and year)
Signature

A d c o c k I n g r a m A n n u a l R e p o r t 2 0 1 0
Notes to proxy form
1. A form of proxy is only to be completed by those ordinary shareholders who are: 1.1 holding ordinary shares in certificated form; or 1.2 recorded on sub-register electronic form in “own name”.
2. If you have already dematerialised your ordinary shares through a Central Securities Depository Participant (CSDP) or broker and wish to attend the Annual General Meeting, you must request your CSDP or broker to provide you with a Letter of Representation or you must instruct your CSDP or broker to vote by proxy on your behalf in terms of the agreement entered into between yourself and your CSDP or broker.
3. A member may insert the name of a proxy or the names of two alternative proxies of the member’s choice in the space provided. The person whose name stands first on the form of proxy and who is present at the Annual General Meeting of shareholders will be entitled to act as proxy to the exclusion of those whose names follow.
4. On a show of hands a member of the Company present in person or by proxy shall have 1 (one) vote irrespective of the number of shares he/she holds or represents, provided that a proxy shall irrespective of the number of members he/she represents have only 1 (one) vote. On a poll a member who is present in person or represented by proxy shall be entitled to that proportion of the total votes in the Company which the aggregate amount of the nominal value of the shares held by him/her bears to the aggregate amount of the nominal value of all the shares issued by the Company (excluding treasury shares).
5. A member’s instructions to the proxy must be indicated by the insertion of the relevant numbers of votes exercisable by the member in the appropriate box provided. Failure to comply with the above will be deemed to authorise the proxy to vote or to abstain from voting at the Annual General Meeting as he/she deems fit in respect of all the member’s votes exercisable thereat. A member on the proxy is not obliged to use all the votes exercisable by the member or by the proxy, but the total of the votes cast and in respect of which abstention is recorded may not exceed the total of the votes exercisable by the member or by the proxy.
6. Forms of proxy must be received by the Company’s transfer secretaries by no later than 14h00 on Tuesday, 25 January 2011. The transfer secretaries’ address is: Computershare Investor Services (Pty) Limited, 70 Marshall Street, Johannesburg, 2001, (PO Box 61051, Marshalltown, 2107). The Company may at its sole discretion and in exceptional circumstances accept late forms of proxy.
7. The completion and lodging of this form of proxy will not preclude the relevant member from attending the Annual General Meeting and speaking and voting in person thereat to the exclusion of any proxy appointed in terms hereof.
8. Documentary evidence establishing the authority of a person signing this form of proxy in a representative capacity or other legal capacity must be attached to this form of proxy, unless previously recorded by the transfer secretaries or waived by the chairman of the Annual General Meeting.
9. Any alteration or correction made to this form or proxy must be initialled by the signatory/ies.
10. Notwithstanding the aforegoing, the chairman of the Annual General Meeting may waive any formalities that would otherwise be a prerequisite for a valid proxy.
11. If any shares are jointly held, this form of proxy must be signed by all joint members. If more than one of those members is present at the Annual General Meeting either in person or by proxy, the person whose name first appears in the register shall be entitled to vote.


for more information please visit www.adcock.com