Annual Report 2009 Aspire Lead Grow - Home - Renata … Report 2009 Aspire Lead Grow Directors’...
63
Annual Report 2009 Aspire Lead Grow
Transcript of Annual Report 2009 Aspire Lead Grow - Home - Renata … Report 2009 Aspire Lead Grow Directors’...

Annual Report 2009
AspireLeadGrow

Directors’Report

TO THE MEMBERSThe Directors of the Company are pleased to present their Report together with the Audited Accounts of the Company for the year ended December 31, 2009.
BUSINESS ACTIVITIESTurnover during 2009 was Taka 3,900.7 million registering a growth of 26.2% over last year’s turnover of Taka 3,089.7 million. Profit after tax was Taka 603.5 million – a growth of 39.3%. Earnings per Share (EPS) stood at Taka 417.38 against Taka 299.55 of 2008.
DIVIDENDRenata continues to have a very aggressive investment strategy. During 2009 investments made for upgrading the General Facility at Mirpur, and the Cephalosporin and Penicillin Facilities at Rajendrapur amounted to Taka 642.57 million. The entire amount was financed through internal cash generation. Investments of this magnitude are to be expected every year for the foreseeable future. Hence the Directors deem it necessary to retain adequate funds for financing capital expenditures.
The Board of Directors is pleased to recommend a cash dividend of Taka 60/- per ordinary share of Taka 100 each. This dividend will entail a payment of Taka 86,759,040/-. The Board of Directors also recommend for declaration of Stock Dividend (Bonus Shares) in the ratio of one Bonus Share for every four shares held (4:1B) for which an amount of Taka 36,149,600/- will have to be transferred to Share Capital Account. The appropriation, if approved by the shareholders at the Annual General Meeting.
Taka in Millions
Freehold Land 71.84
Factory Building 68.30
Plant and Machinery 269.93
Office Equipment, Furniture & Fixtures 12.43
Automobile 53.39
Cephalosporin & Penicillin Facilities 166.68
642.57
The entire investment was made from internally generated funds.
DIRECTORSThe Directors retiring by rotation under Articles 109, 115 and 116 of the Articles of Association of the Company are Mr. S. H. Kabir and Dr. Sarwar Ali who, being eligible, offer themselves for re-election.
CONTRIBUTION TONATIONAL EXCHEQUERDuring the year under review your Company paid Taka. 862.10 million to the National Exchequer in the form of Corporate Income Tax, Import Duties and Value Added Tax (VAT).
AUDITORSThe Company’s Auditor Messrs Rahman Rahman Huq, Chartered Accountants retire at the thirty seventh Annual General Meeting 2009. As per order of Securities and Exchange Commission the issuer company shall not appoint any firm of chartered accountants as its statutory auditors for a consecutive period exceeding three years. As such they are not eligible for reappointment. Therefore the Board of Directors is pleased to recommend Messrs S. F. Ahmed & Co. Chartered Accountants as Auditor of the Company for the year 2010 and fix their remuneration.
CAPITAL EXPENDITUREThe following capital expenditure made by the Company during the year amounted to Taka 642.57 million.

Profit before tax 823,030,095 609,919,968
Less: Provision for tax 219,505,643 176,774,164
Net Profit after tax 603,524,452 433,145,804
Add: Un-appropriated profit
brought forward 1,251,697,632 911,310,878
Less : Tax holiday reserve (30,484,122) (6,000,000)
1,824,737,962 1,338,456,682
APPROPRIATION RECOMMENDED:Dividend proposed:
a) Cash dividend @ Taka 60/-per Share 86,759,040 57,839,350
b) Stock dividend (Bonus Share)in the ratio of bonus share forevery four (4:1B) Shares held 36,149,600 28,919,700
122,908,640 86,759,050Balance Un-appropriated profit carried forward 1,701,829,322 1,251,697,632
1,824,737,962 1,338,456,682
2009TAKA
2008TAKA
FINANCIAL RESULTSThe Directors take pleasure in reporting the following
financial results of the Company for the year 2009
CONSOLIDATION OF ACCOUNTSThe Company is consistently following the code of International Accounting Standard as adopted by the Institute of Chartered Accountants of Bangladesh. According to Bangladesh Accounting Standard-27, (BAS-27) the Company has presented all the relevant consolidated financial statements with those of its subsidiaries.
ADDITIONAL STATEMENTThe Directors are pleased to recount the following additional statements in respect of Report prepared under section 184 of the companies Act 1994.
In our opinion,
a) The financial statements prepared by the management for the year 2009 give a true and fair view of the state of the company about the results of its operations, cash flows and changes in equity.
b) Proper books of accounts have been maintained by the company as required by applicable Laws, Rules and Standards.
c) Appropriate accounting policies have been consistently applied in preparation of the financial statements and that accounting estimates are based on reasonable and prudent judgments.
d) In preparation of the financial statement, the International Accounting Standards, as applicable in Bangladesh have been followed and there has been no departure from the policies.
e) The system of internal control and internal check are in effect andmonitored properly.
f) The company has sound and strong operational strengths and ability to continue as a going concern. As such, there is no doubt of its continuity.
g) There is no significant deviation from last year in operating results.
h) The key operating and financial data for
preceding five years have been shown in the Financial Highlights. (Annexure III)
i) The Directors, have recommended a cash dividend of TK. 60 per share of TK. 100 each and stock dividend (bonus share) in the ratio of one share for every four shares are held (4:1B).
PHARMACEUTICAL PRODUCTSThe following products were introduced during the year 2009:
TRADE NAME Therapeutic Class
1.DELTASONE 1 mg. Tablet Steroid
2.MAGSUM 5 ml. Injection Electrolyte Sol
3.MEF-Q 250 mg. Tablet Antimalarial
4.THYROX 100 mcg. Tablet Hormonal
43 •renata annual report 09

j) During the year four Board Meetings were held and attendance by each Director are given below:
1. Mr. Syed Humayun Kabir CHAIRMAN OF THE BOARD 4 times2. Mr. Kaiser Kabir CEO & MANAGING DIRECTOR 4 times3. Mrs. Sajida Humayun Kabir DIRECTOR 4 times4. Dr. Sarwar Ali DIRECTOR 4 times5. Mr. Md. Ziaul Haque Khondker DIRECTOR (upto 09/06/2009) 2 times6. Mr. Md. Humayun KabirDIRECTOR (from 10/06/2009) 2 times7. Mr. A. Hasanat KhanDIRECTOR 4 times8. Mr. Manzoor HasanINDEPENDENT DIRECTOR 4.timesk) The pattern of Shareholding(i) Parent/ Subsidiary / Associated companies:The Shareholding information as on 31st December 2009 and other related information are set out in note- 4. (ii) Directors:1. Mr. Syed Humayun Kabir: 633 Shares2. Mr. Kaiser Kabir: 1,233 Shares3. Mr. Sajida Humayun Kabir: 0 Shares 4. Dr. Sarwar Ali: 80 Shares5. Mr. Md. Humayun Kabir: 0 Shares6. Mr. A. Hasanat Khan: 0 SharesCFO & Company SecretaryMr. Md. Shafiul Alam: 3,175 Shares(iii) Head of Internal Audit: 0 Shares(iv) Executives:1. Mr. M. Alamgir Hossain: 32 Shares2. Mr. Manzur Aziz: 137 Shares3. Dr. Sayma Ali: 0 Shares4. Mr. Khalil Musaddeq: 0 Shares5. Dr. Md. Iqbal Hossain: 0 Shares (vi) Shareholders holding 10% or more voting interest:1. Sajida Foundation: 737,447 Shares2. Business Research InternationalCorp.: 366,221 Shares
STATUS OFCOMPLIANCEStatus of compliance as stated in SEC order dated 20th February 2006 – (Annexure-I.)
PERSONNELThe Directors record their appreciation for the contribution made by the employees to the operation of the Company.
ACKNOWLEDGEMENTThe Board wishes to thank the Shareholders, Officials of the Drug Administration and other Government officials, Doctors, Chemists, Medical Institutions, Bankers, the Securities and Exchange Commission, the Dhaka Stock Exchange Limited and all well-wishers for their continued support. The year 2010 is expected to be challenging for the Company. By the grace of Almighty, we hope to successfully counter the difficulties that lie ahead.
On behalf of the Board of Directors
Kaiser KabirManaging Director
April 24, 2010

RENATA LIMITED FINANCIAL HIGHLIGHTS Figures in Taka. 000
Particulars 2009 2008 2007 2006 2005 SUMMARY BALANCE SHEETShareholders’ EquityShare Capital 115,679 96,399 80,332 66,944Proposed stock dividend 28,920 19,280 16,067 13,389Proposed cash dividend 57,839 48,199 40,166 33,472Revaluation surplus 155,075 155,554 156,018 156,482Tax holiday reserve 52,862 46,862 47,451 46,863Unappropriated profit 1,251,698 911,311 642,278 456,968Shareholders’ Fund 1,662,073 1,277,605 982,312 774,117Long term & deferred liabilities 186,767 160,319 135,318 116,300Total 1,848,840 1,437,924 1,117,630 890,417Application of FundsProperty, plant and equipment -WDV 1,584,714 1,102,830 733,187 539,132Investment & Non-current assets 71,448 64,070 64,070 63,070Current Assets 1,506,071 988,093 979,255 672,355Current Liabilities (1,313,393) (717,069) (658,882) (384,140)Total 1,848,840 1,437,924 1,117,630 890,417
FINANCIAL RESULTSTurnover (Gross) 3,536,667 2,884,122 2,192,638 1,852,675Turnover (Net) 3,089,746 2,534,175 1,927,732 1,608,556Gross profit 1,578,652 1,246,998 982,210 796,316EBITDA 764,811 572,035 417,730 328,484Profit before taxation 609,920 466,619 347,222 279,388Profit after taxation 433,146 335,923 242,132 192,568Dividend 86,759 67,479 56,233 46,861
FINANCIAL PERFORMANCENumber of shares 1,156,787 963,989 803,324 669,437Earning per share (Taka) 299.55 232.31 167.45 133.17Dividend per Share adjusted (Taka) 75.00 70.00 70.00 70.00Dividend payout % 20.03 20.09 23.22 24.33Effective Dividend Rate % 0.96 0.93 2.26 2.33Price Earning Ratio - (PER) 20.80 25.80 14.81 18.02Market price per share on 31 December 7,789.25 7,491.25 3,099.25 3,000.00Price/Equity Ratio (Times) 77.9 74.9 31.0 30.0Return on Shareholders’ Fund % 26.06 26.29 24.65 24.88Current Ratio-(Times) 1.15 1.38 1.49 1.75Net operating cash flow per share (Taka) 188.00 449.33 86.13 315.87Net assets value per share (Taka) 1,436.80 1,325.33 1,222.82 1,156.37
Number of employees 2,213 1,726 1,596 1,267
ANNEXURE-III
144,598 36,150 86,759
154,597 83,347
1,701,829 2,207,280
234,362 2,441,642
2,133,261 75,001
1,643,107 (1,409,727)
2,441,642
4,476,976 3,900,732 2,088,286 1,016,462
823,030 603,524 122,909
1,445,984
417.38 85.00 20.37
0.71 28.87
12,051.50 120.52
27.34 1.17
519.43 1,526.49
2,667

Renata LimitedAuditors’ Report andFinancial Statements
as at and for the year ended 31 December, 2009

We have audited the accompanying balance sheet of Renata Limited as at 31 December 2009 and the related profit and loss account, statement of changes in equity, cash flow statement and notes to the financial statements for the year then ended. We have also audited the attached consolidated balance sheet, profit and loss account, statement of changes in equity, cash flow statement and notes to the consolidated financial statements of Renata Limited and its subsidiaries viz Renata Agro Industries Limited and Purnava Limited, not audited by us, (collectively referred to as “Renata group”) as of 31 December 2009. The preparation of these financial statements is the responsibility of the company’s management. Our responsibility is to express an opinion on these financial statements based on our audit.
ScopeWe conducted our audit in accordance with Bangladesh Standards on Auditing (BSA). Those standards require that we plan and perform the audit to obtain reasonable assurance about whether the financial statements are free of material misstatement. An audit includes examining, on a test basis, evidence supporting the amounts and disclosures in the financial statements. An audit also includes assessing the accounting principles used and significant estimates made by management, as well as evaluating the overall financial statement presentation. We believe that our audit provides a reasonable basis for our opinion.
The financial statements of the company’s subsidiaries-Renata Agro Industries Limited and Purnava Limited, reflect total assets of Tk. 274,718,645 and Tk 13,676,203 respectively as at 31 December 2009 and total revenue of Tk 216,045,658 and Tk 69,983,052 respectively for the year then ended. These financial statements have been audited by other auditors whose reports have been furnished to us and our opinoin, in so far as it relates to the amounts included in respect of the company's subsidiaries, is based solely on the reports of the other auditors.
OpinionIn our opinion, the financial statements of the company along with the notes thereon and the consolidated financial statements, drawn up on the consideration of the separate audit reports of the subsidiaries as at 31 December 2009, prepared in accordance with Bangladesh Accounting Standards (BASs), and Bangladesh Financial Reporting Standards (BFRSs), give a true and fair view of the state of the company’s affairs and of its subsidiaries, and of the results of their operations and cash flows for the year then ended and comply with the Companies Act 1994, the Securities and Exchange Rules1987 and other applicable laws and regulations.
We also report that:a) we have obtained all the information and explanations which to the best of our knowledge and belief were necessary for the purpose of our audit and made due verification thereof;
b) in our opinion, proper books of account as required by law have been kept by the company so far as it appeared from our examination of these books;
c) the company’s balance sheet and profit and loss account dealt with by the report are in agreement with the books of account; and
d) the expenditure incurred was for the purposes of the company’s business.
Without qualifying our opinion we draw attention to Note- 27.2 to the consolidated financial statements. The company applied for tax holiday for Unit-4 (Potent Product Facility) for a period of four years from September 2006, which is still under review by NBR.
Rahman Rahman Huq Chartered AccountantsDhaka, 24 April 2010
Auditors’ Report tothe Shareholdersof Renata Limited

RENATA LIMITEDBALANCE SHEET AS AT 31 DECEMBER 2009
ASSETS
Notes 2009 2008 Non-current assetsProperty, plant and equipment 4 1,396,300,867 1,014,435,834Capital work-in-progress 5 736,960,533 570,277,998Investment in subsidiary 6 63,070,376 63,070,376Other investment 7 11,931,079 8,377,754Total non-current assets 2,208,262,855 1,656,161,962
Current assetsInventories 8 1,075,310,581 959,414,590Trade and other receivables 9 343,870,341 344,226,933Advances, deposits and prepayments 10 80,677,337 79,281,411Cash and cash equivalents 11 143,248,172 123,148,038Total current assets 1,643,106,431 1,506,070,972Total assets 3,851,369,286 3,162,232,934
EQUITY AND LIABILITIESShare capital 12 144,598,400 115,678,700Revaluation surplus 13 154,596,958 155,075,461Tax holiday reserve 83,346,636 52,862,514Retained earnings 14 1,824,737,962 1,338,456,682Total equity attributable to equity holders of the company 2,207,279,956 1,662,073,357
Non-current liabilities Deferred liability-staff gratuity 15 124,183,595 105,224,160Deferred tax liabilities 16 110,179,135 81,542,581Total non-current liabilities 234,362,730 186,766,741
Current liabilities Bank overdraft 17 794,424,620 823,163,615Creditors for goods 27,896,925 127,107,689Accrued expenses 171,928,847 133,013,604Other payables 18 237,310,646 79,902,838Unclaimed dividend 3,961,604 3,173,467Provision for taxation 19 174,203,958 147,031,623Total current liabilities 1,409,726,600 1,313,392,836Total liabilities 1,644,089,330 1,500,159,577Total equity and liabilities 3,851,369,286 3,162,232,934 The annexed notes 1 to 34 form an integral part of these financial statements.
CEO & Managing Director Director Company Secretary As per our annexed report of same date.
Dhaka, 24 April 2010 Auditors
Figures in Taka

RENATA LIMITEDPROFIT AND LOSS ACCOUNT FORTHE YEAR ENDED 31 DECEMBER 2009
2009 2008 Non-tax holiday Tax holiday Note Unit 1 2 & 3 Unit 4 Total Total
Turnover 20 3,675,744,434 224,987,880 3,900,732,314 3,089,746,417Cost of sales 21 (1,751,040,817) (69,455,960) (1,820,496,777) (1,526,514,685)Gross profit 1,924,703,617 155,531,920 2,080,235,537 1,563,231,732Other income 22 8,050,515 - 8,050,515 15,420,344 1,932,754,132 155,531,920 2,088,286,052 1,578,652,076 Operating expenses: Administrative, selling and distribution expenses 23 (1,049,389,251) (69,379,544) (1,118,768,795) (845,169,923)Operating profit 883,364,881 86,152,376 969,517,257 733,482,153Gain on disposal of property,plant and equipment 4.5 930,500 - 930,500 118,000Interest on over draft (93,771,701) (5,741,937) (99,513,638) (87,270,665)Other expenses (6,362,900) (389,620) (6,752,520) (5,913,520)Contribution to WPPF (37,340,989) (3,810,515) (41,151,504) (30,496,000)Profit before tax 746,819,791 76,210,304 823,030,095 609,919,968 Tax expensesCurrent tax 19 (190,711,707) - (190,711,707) (166,444,936)Deferred tax 16 (28,793,936) - (28,793,936) (10,329,228) (219,505,643) - (219,505,643) (176,774,164)Net Profit after tax for the year 527,314,148 76,210,304 603,524,452 433,145,804
Basic earnings per share(par value of Tk 100) 24 417.38 299.55
The annexed notes 1 to 34 form an integral part of these financial statements.
CEO & Managing Director Director Company Secretary
As per our annexed report of same date.
Dhaka, 24 April 2010 Auditors
Figures in Taka

RENATA LIMITEDSTATEMENT OF CHANGES IN EQUITY FORTHE YEAR ENDED 31 DECEMBER 2009
Balance as at 1 January 2008 96,398,900 155,553,964 46,862,514 978,790,128 1,277,605,506
Stock dividend issued 19,279,800 - - (19,279,800) -
Cash dividend - - - (48,199,450) (48,199,450)
Deferred tax on revaluation surplus - 157,382 - - 157,382
Depreciation adjustment on revaluation surplus - (635,885) - - (635,885)
Net profit after tax for the year - - - 433,145,804 433,145,804)
Tax holiday reserve - - 6,000,000 (6,000,000) -
Balance at 31 December 2008 115,678,700 155,075,461 52,862,514 1,338,456,682 1,662,073,357
Balance as at 1 January 2009 115,678,700 155,075,461 52,862,514 1,338,456,682 1,662,073,357
Stock dividend issued 28,919,700 - - (28,919,700) -
Cash dividend - - - (57,839,350) (57,839,350)
Deferred tax on revaluation surplus - 157,382 - - 157,382
Depreciation adjustment on revaluation surplus - (635,885) - - (635,885)
Net profit after tax for the year - - - 603,524,452 603,524,452
Tax holiday reserve - - 30,484,122 (30,484,122) -
Balance at 31 December 2009 144,598,400 154,596,958 83,346,636 1,824,737,962 2,207,279,956
The annexed notes 1 to 34 form an integral part of these financial statements.
Share Revaluation Tax holiday Retained Total capital surplus reserve earnings equity
Figures in Taka

2009 2008 A. Cash flow from operating activities:
Collection from customers and other income 4,524,734,599 3,464,026,571Payment of VAT (576,244,068) (446,920,865)Payment to suppliers and employees (2,934,353,785) (2,598,987,823)Cash generated from operation 1,014,136,746 418,117,883Financing cost (99,513,638) (87,270,665)Payment of tax (163,539,372) (113,369,101)Net cash from operating activities 751,083,736 217,478,117
B. Cash flow from investing activities: Purchase of property, plant and equipment (642,570,569) (549,504,472)Investment in shares (3,553,325) (7,377,754)Sale proceeds of property, plant and equipment 930,500 118,000Net cash used in investing activities (645,193,394) (556,764,226)
C. Cash flow from financing activities: Medium term loan (repaid)/received (net) (28,738,995) 461,688,600
Dividend paid (57,051,213) (47,511,431)Net cash from/(used in) financing activities (85,790,208) 414,177,169
D. Net cash increase (decrease) for the year (A+B+C) 20,100,134 74,891,060 E. Opening cash and cash equivalent 123,148,038 48,256,978 F. Closing cash and cash equivalent (D+E) 143,248,172 123,148,038
The annexed notes 1 to 34 form an integral part of these financial statements.
RENATA LIMITED CASH FLOW STATEMENT FOR THE YEAR ENDED 31 DECEMBER 2009
Figures in Taka

RENATA LIMITEDNOTES TO THE CONSOLIDATED FINANCIAL STATEMENTSAS AT AND FOR THE YEAR ENDED 31 DECEMBER 2009
1. Reporting entity
1.1 Company profile
Renata Limited (“the Company”) is a public limited company incorporated in Bangladesh in 1972 as Pfizer Laboratories (Bangladesh), under the Companies Act 1913. In 1993, the Company was renamed as “Renata Limited”. The authorised capital of the Company is Tk 500,000,000 divided into 5,000,000 ordinary shares of Tk 100 each with a paid up capital of Tk 144,598,400 divided into 1,445,984 ordinary shares of taka 100 each. The address of the registered office of the company is Road no # 31, House no # 450, Mohakhali DOHS, Dhaka. The shares of the company are publicly traded on the floor of Dhaka Stock Exchange Limited.
The Company manufactures, markets and sells various pharmaceutical, animal health, animal nutritional, oral saline, hormone and other medical products in the local market. The Company exports a few of its pharmaceutical products to some foreign markets.
1.2 Subsidiary companies
1.2.1 Renata Agro Industries Limited
Renata Agro Industries Limited, a wholly owned subsidiary company of Renata Limited, was incorporated on 7 September 1997 as a private limited company under the Companies Act 1994 with authorised share capital of Tk 150,000,000 divided into 1,500,000 ordinary shares of Tk 100 each. The company commenced its commercial operation from October 1998. The principal activities of the company are to carry on business for producing and sale of various agro based products, poultry breeding and hatching and sale of poultry products.
1.2.2 Purnava Limited
Purnava Limited, another wholly owned subsidiary company of Renata Limited, was incorporated on 17 August 2004 as a private limited company under the Companies Act 1994 with authorised share capital of Tk 200,000,000 divided into 2,000,000 ordinary shares of Tk 100 each. The company commenced its commercial operation in 2009. The principal activities of the company are to carry on business of manufacturing, marketing and distribution of all kinds of consumer goods, consumer durables, food items, edible oils etc. and to engage in the business as traders, importers, exporters, commission agents of all kinds of goods and services including pharmaceutical products.
2. Basis of preparation and significant accounting policies
2.1 Statement of compliance
These financial statements have been prepared in accordance with applicable International Accounting Standards (IASs) and International Financial Reporting Standards (IFRSs) as adopted by the Institute of Chartered Accountants of Bangladesh as Bangladesh Accounting Standards (BASs) and Bangladesh Financial Reporting Standards (BFRSs), Companies Act 1994, the Securities & Exchange Rules 1987 and other laws and regulations applicable in Bangladesh.
2.2 Date of authorisation for issue of the financial statements
On 24 April 2010, the Board of Directors reviewed the financial statements and authorised them for issue.
2.3 Basis of measurement
The financial statements have been prepared under the historical cost convention as modified to include revaluation of certain property, plant and equipment. No adjustment has been made for inflationary factors affecting the financial statements. The accounting policies, unless otherwise stated, have been consistently applied by the Company and are consistent with those of the previous year.

2.4 Functional and presentation currency
These financial statements are prepared in Bangladesh Taka (Taka/Tk), which is the Company's functional currency. All financial information presented in Taka has been rounded off to the nearest integer.
2.5 Use of estimates and judgments
The preparation of financial statements requires management to make judgments, estimates and assumptions that affect the reported amount of assets, liabilities, income and expenses. The estimates and associated assumptions are based on historical experience and various other factors that are believed to be reasonable under the circumstances, the result of which forms the basis of making the judgments about the carrying values of assets and liabilities that are not readily apparent from other sources. Actual results may differ from these estimates. However, the estimates and underlying assumptions are reviewed on an ongoing basis and the revision is recognised in the period in which the estimates are revised. No such revision however was carried out during the year under report.
2.6 Going concern
The Company has adequate resources to continue in operation for foreseeable future. For this reason the directors continue to adopt going concern basis in preparing the accounts. The current credit facilities and resources of the Company provide sufficient funds to meet the present requirements of its existing businesses and operations
2.7 Basis of consolidation of operations of subsidiary
The financial statements of the Company and its subsidiaries, as mentioned in note-1.2, have been consolidated in accordance with Bangladesh Accounting Standard (BASs) 27 “Consolidated and Separate Financial Statements”. Figures used in the consolidated financial statements are based on the audited financial statements of Renata Agro Industries Ltd. and Purnava Limited audited by other auditors. Intra-group balances and unrealised income and expenses arising from intra-group transactions, have been eliminated in preparing the consolidated financial statements.
2.8 Foreign currency
Transactions in foreign currencies are translated to Bangladesh Taka at the foreign exchange rate prevailing on the date of the transaction. Monetary assets and liabilities are converted at the rates prevailing at the balance sheet date. Non-monetary assets and liabilities are reported using the exchange rate on the date of transaction. Differences arising on conversion are charged or credited to the profit and loss account.
2.9 Financial instrument
Non-derivative financial instrument comprising accounts and other receivables, cash and cash equivalents, loans and borrowings, and other payables are shown at transaction cost.
2.10 Property Plant and equipment
2.10.1 Recognition and measurement
Property, plant and equipment are stated at cost or revaluation less accumulated depreciation. Freehold land and buildings were revalued during the year ended 31 December 1995 by a firm of professional valuers.
Costs include expenditures that are directly attributable to the acquisition of the property, plant and equipments.
2.10.2 Subsequent costs
The cost of replacing part of an item of property, plant and equipment is recognised in the carrying amount of an item if it is probable that the future economic benefits embodied within the part will flow to the Company and its cost can be measured reliably. The costs of the day-to-day servicing of property, plant and equipment are recognised in the profit and loss account as incurred.

2.10.3 Depreciation
Depreciation is charged on all fixed assets on straight-line basis and over the following periods except freehold land: 2009 2008 Building 33.03 33.03 Machinery and equipments 5-20 5-20 Automobiles and trucks 4 4 Office equipment 8-10 8-10 Furniture and fixtures 20 20
Gains and losses on disposal or retirement of assets are credited or charged to the results of operation.
2.10.4 Capital work-in-progress
Property, plant and equipment under construction/acquisition have been accounted for as capital work-in-progress until construction/acquisition is completed and measured at cost.
2.11 Inventories
Stocks are valued at lower of cost and net realisable value except for goods in transit which are valued at cost.
Cost of active materials, raw materials and packing materials are valued by using FIFO formula.
Cost of work-in-progress and finished stocks are determined by using FIFO cost formula including allocation of manufacturing overheads related to bringing the inventories to their present condition. The Company uses standard cost method for measurement of cost of finished goods.
2.12 Impairment
The carrying amount of non-financial assets, other than inventories, is reviewed at each reporting date to determine whether there is any indication of impairment. If any such indication exists then the property, plant and equipment recoverable amount is estimated. For tangible assets that have indefinite lives or that are not yet available for use, recoverable amount is estimated at each reporting date.
2.13 Workers’ Profit Participation Fund (WPPF)
The Company provides 5% of its profit before tax as WPPF in accordance with the Bangladesh Labour Act, 2006.
2.14 Income tax
Income tax expense comprises current and deferred tax. Income tax expense is recognised in the profit and loss account.
2.14.1 Current tax
The Company qualifies as a “Publicly Traded Company” and the effective rate of taxation is 24.75% considering 10% tax rebate for declaring dividend of more than 20% of the paid up capital.
2.14.2 Deferred tax
Deferred tax is recognised using the balance sheet liability method, providing for temporary differences between the carrying amounts of assets and liabilities for financial reporting purposes and amounts used for taxation purposes. Deferred tax is measured at the tax rate that is expected to be applied to the temporary differences when they reverse, based on the laws that have been enacted or substantively enacted by the reporting date.
2.15 Employees benefit obligation

2.15.1 Defined contribution plan
The Company operates a contributory provident fund scheme, duly recognised by NBR, for its permanent employees. Provident fund is administered by a Board of Trustees and is funded by equal contributions both by the employees and the Company at a predetermined rate.
2.15.2 Defined benefit plan (Gratuity scheme)
The Company also operates an unfunded gratuity scheme. Employees are entitled to gratuity benefit after the completion of a minimum of seven years of service with the Company. The gratuity is calculated on the last basic pay and is payable at the rate of one month's basic pay for every completed year of service up to ten years of service, and one and half months basic pay for more than ten years of service. Provision for which has been made as per gratuity rules of the Company. Actuarial valuation of the scheme is made by a professional valuer/actuary once in every 2 years.
2.15.3 Other employees benefit obligation
The Company operates a group insurance scheme for its permanent employees.
2.16 Provisions
Provisions and accrued expenses are recognised in the financial statements in line with the Bangladesh Accounting Standard (BAS) 37 “ Provisions, Contingent Liabilities and Contingent Assets” when
- the company has a legal or constructive obligation as a result of past event.- it is probable that an outflow of economic benefit will be required to settle the obligation.- a reliable estimate can be made of the amount of the obligation.
2.17 Revenue
Revenue from the sale of goods is measured at fair value of the consideration received or receivable, net of returns and allowances, trade discounts and volume rebates.
Revenue from the sale of goods is recognised when the significant risks and rewards of ownership have been transferred to the buyer, the company has no managerial involvement in ownership of the goods, the amount of revenue and the cost of the transaction can be measured reliably and it is probable that the economic benefit associated with the transactions will flow to the company.
2.18 Reporting period
The financial period of the Company covers one year from 1 January to 31 December consistently.
2.19 Cash and cash equivalents
Cash and cash equivalents are comprised of cash in hand, cash at bank and term deposits that are readily convertible to known amount of cash and that are subject to an insignificant risk of change in value.
2.19.1 Cash flow statement
Cash flow statement has been prepared in accordance with the Bangladesh Accounting Standards (BAS) 7, “Cash flow statement” under direct method.
2.20 Events after the reporting period
Events after the reporting period that provide additional information about the Company‘s positions at the balance sheetdate are reflected in the financial statements. Events after the reporting period that are non-adjusting events are disclosedin note-33 when material.
3. Directors’ responsibility statement
The Board of Directors takes the responsibility for the preparation and presentation of these financial statements.
Freehold land:At cost
On revaluation
Building:At cost
On revaluation
Plant and machinery
Automobile and trucks
Office equipments
Furniture and fixtures
Total 2009
Total 2008
At1 Jan 2009
Taka Taka Taka Taka Taka Taka Taka Taka Taka%
Additions during the year
Disposal/adjustment
during the year
At 31 Dec 2009
Rate At31 Dec 2009
Written down value at
31 Dec 2009
At1 Jan 2009
Charge during
the year
Disposal/adjustment
during the year
COST/REVALUATIONS DEPRECIATION
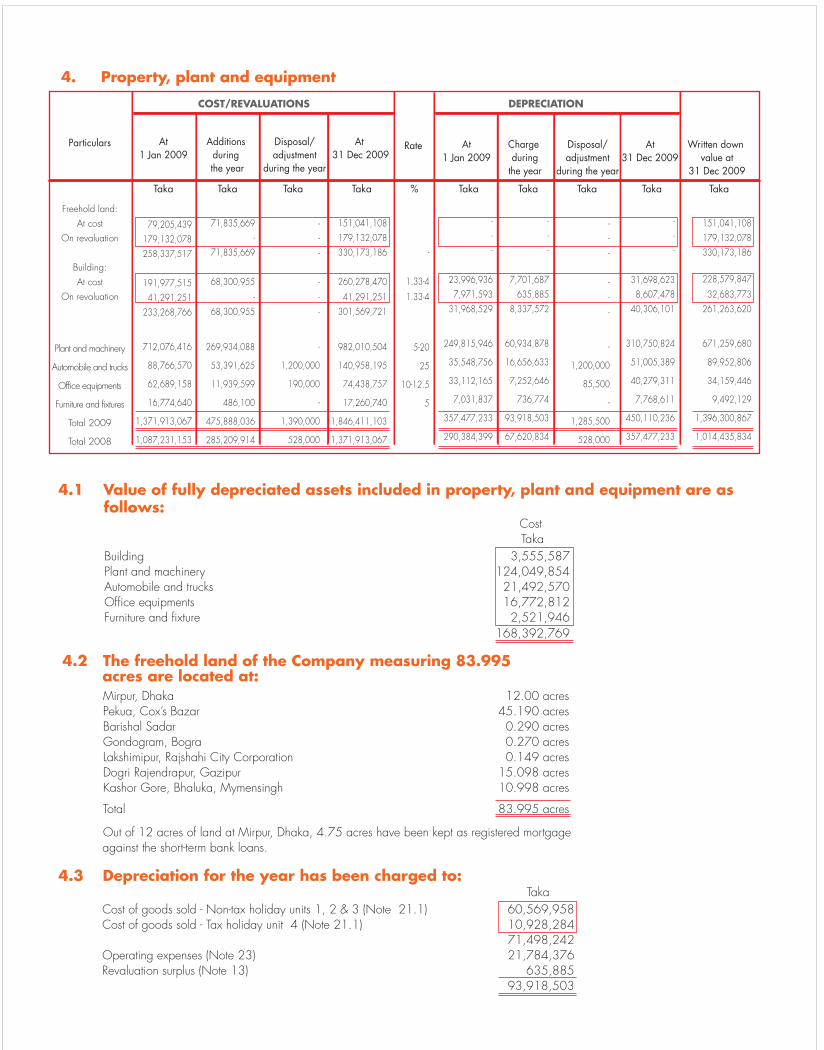
4. Property, plant and equipment
71,835,669-
71,835,669
68,300,955
-68,300,955
269,934,088
53,391,625
11,939,599
486,100
475,888,036
285,209,914
151,041,108179,132,078330,173,186
260,278,470
41,291,251301,569,721
982,010,504
140,958,195
74,438,757
17,260,740
1,846,411,103
1,371,913,067
151,041,108179,132,078330,173,186
228,579,847
32,683,773261,263,620
671,259,680
89,952,806
34,159,446
9,492,129
1,396,300,867
1,014,435,834
79,205,439179,132,078258,337,517
191,977,51541,291,251
233,268,766
712,076,416
88,766,570
62,689,158
16,774,640
1,371,913,067
1,087,231,153
---
-
--
-
1,200,000
190,000
-
1,390,000
528,000
---
-
--
-
1,200,000
85,500
-
1,285,500
528,000
-
1.33-4
1.33-4
5-20
25
10-12.5
5
---
23,996,9367,971,593
31,968,529
249,815,946
35,548,756
33,112,165
7,031,837
357,477,233
290,384,399
---
31,698,6238,607,478
40,306,101
310,750,824
51,005,389
40,279,311
7,768,611
450,110,236
357,477,233
---
7,701,687635,885
8,337,572
60,934,878
16,656,633
7,252,646
736,774
93,918,503
67,620,834
Particulars
4.1 Value of fully depreciated assets included in property, plant and equipment are as follows:
Cost Taka Building 3,555,587Plant and machinery 124,049,854Automobile and trucks 21,492,570Office equipments 16,772,812Furniture and fixture 2,521,946 168,392,769
4.2 The freehold land of the Company measuring 83.995 acres are located at: Mirpur, Dhaka 12.00 acres Pekua, Cox’s Bazar 45.190 acres Barishal Sadar 0.290 acres Gondogram, Bogra 0.270 acres Lakshimipur, Rajshahi City Corporation 0.149 acres Dogri Rajendrapur, Gazipur 15.098 acres Kashor Gore, Bhaluka, Mymensingh 10.998 acres
Total 83.995 acres Out of 12 acres of land at Mirpur, Dhaka, 4.75 acres have been kept as registered mortgage
against the short-term bank loans.
4.3 Depreciation for the year has been charged to: TakaCost of goods sold - Non-tax holiday units 1, 2 & 3 (Note 21.1) 60,569,958Cost of goods sold - Tax holiday unit 4 (Note 21.1) 10,928,284 71,498,242 Operating expenses (Note 23) 21,784,376Revaluation surplus (Note 13) 635,885 93,918,503
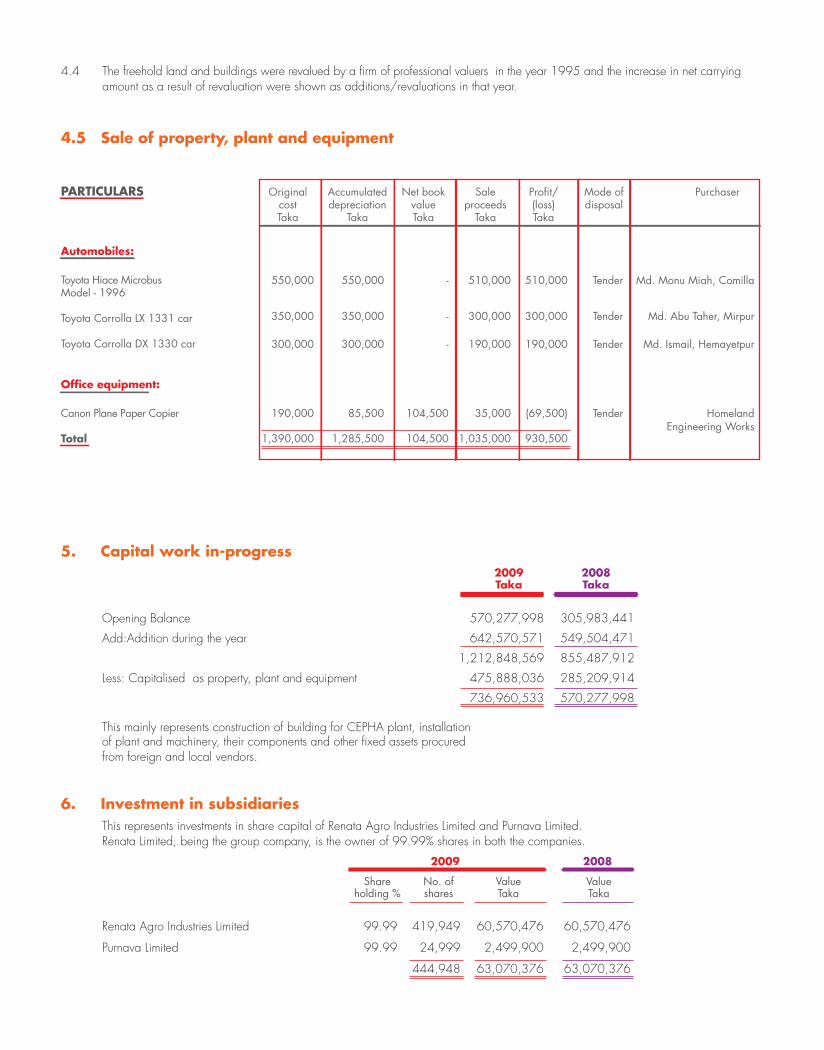
4.4 The freehold land and buildings were revalued by a firm of professional valuers in the year 1995 and the increase in net carrying amount as a result of revaluation were shown as additions/revaluations in that year.
4.5 Sale of property, plant and equipment
OriginalcostTaka
Accumulateddepreciation
Taka
Saleproceeds
Taka
Profit/(loss)Taka
Mode ofdisposal
PurchaserNet bookvalueTaka
PARTICULARS
Automobiles:
Toyota Hiace MicrobusModel - 1996
Toyota Corrolla LX 1331 car
Toyota Corrolla DX 1330 car
Office equipment:
Canon Plane Paper Copier
Total
5. Capital work in-progress
Opening Balance 570,277,998 305,983,441
Add:Addition during the year 642,570,571 549,504,471
1,212,848,569 855,487,912
Less: Capitalised as property, plant and equipment 475,888,036 285,209,914
736,960,533 570,277,998
This mainly represents construction of building for CEPHA plant, installation of plant and machinery, their components and other fixed assets procured from foreign and local vendors.
6. Investment in subsidiariesThis represents investments in share capital of Renata Agro Industries Limited and Purnava Limited.Renata Limited, being the group company, is the owner of 99.99% shares in both the companies.
2009 2008
Share No. of Value Value holding % shares Taka Taka Renata Agro Industries Limited 99.99 419,949 60,570,476 60,570,476
Purnava Limited 99.99 24,999 2,499,900 2,499,900
444,948 63,070,376 63,070,376
2009Taka
2008Taka
550,000
350,000
300,000
190,000
1,390,000
550,000
350,000
300,000
85,500
1,285,500
510,000
300,000
190,000
35,000
1,035,000
510,000
300,000
190,000
(69,500)
930,500
Tender
Tender
Tender
Tender
Md. Monu Miah, Comilla
Md. Abu Taher, Mirpur
Md. Ismail, Hemayetpur
HomelandEngineering Works
-
-
-
104,500
104,500
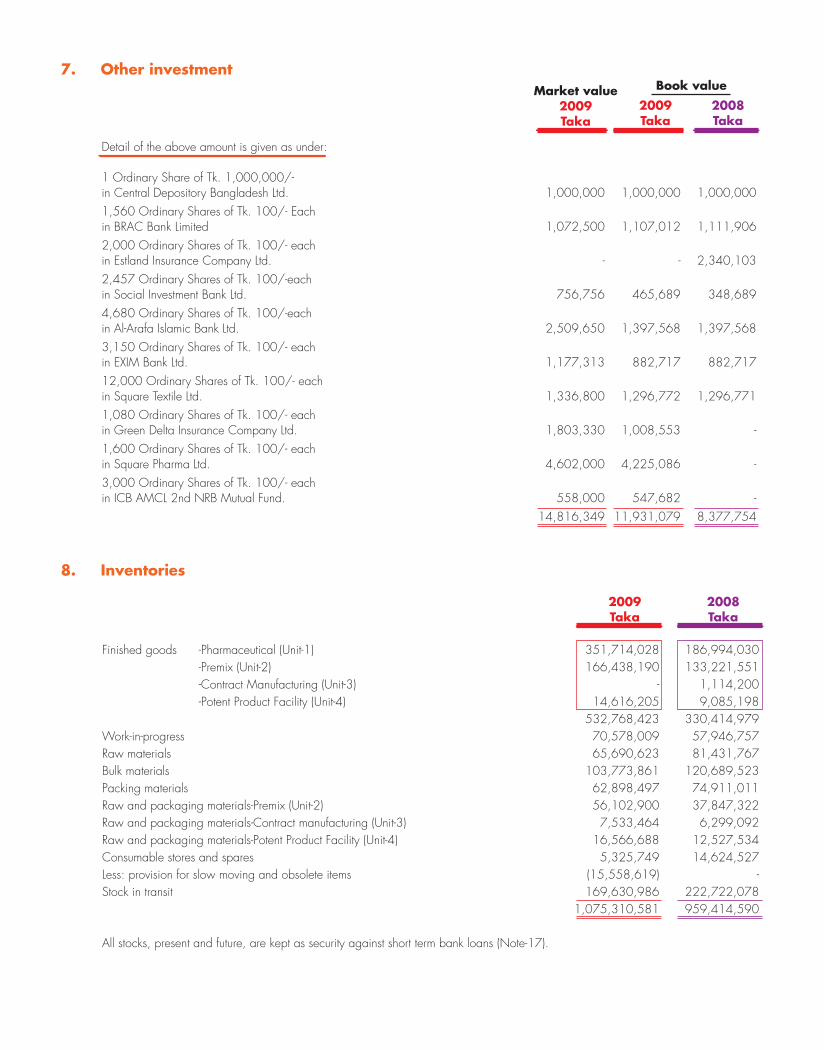
7. Other investment
Detail of the above amount is given as under:
1 Ordinary Share of Tk. 1,000,000/- in Central Depository Bangladesh Ltd. 1,000,000 1,000,000 1,000,000 1,560 Ordinary Shares of Tk. 100/- Each in BRAC Bank Limited 1,072,500 1,107,012 1,111,906 2,000 Ordinary Shares of Tk. 100/- each in Estland Insurance Company Ltd. - - 2,340,103 2,457 Ordinary Shares of Tk. 100/-each in Social Investment Bank Ltd. 756,756 465,689 348,689 4,680 Ordinary Shares of Tk. 100/-each in Al-Arafa Islamic Bank Ltd. 2,509,650 1,397,568 1,397,568 3,150 Ordinary Shares of Tk. 100/- each in EXIM Bank Ltd. 1,177,313 882,717 882,717 12,000 Ordinary Shares of Tk. 100/- each in Square Textile Ltd. 1,336,800 1,296,772 1,296,771 1,080 Ordinary Shares of Tk. 100/- each in Green Delta Insurance Company Ltd. 1,803,330 1,008,553 - 1,600 Ordinary Shares of Tk. 100/- each in Square Pharma Ltd. 4,602,000 4,225,086 - 3,000 Ordinary Shares of Tk. 100/- each in ICB AMCL 2nd NRB Mutual Fund. 558,000 547,682 - 14,816,349 11,931,079 8,377,754
8. Inventories
2009 2008 Taka Taka
Finished goods -Pharmaceutical (Unit-1) 351,714,028 186,994,030 -Premix (Unit-2) 166,438,190 133,221,551 -Contract Manufacturing (Unit-3) - 1,114,200 -Potent Product Facility (Unit-4) 14,616,205 9,085,198 532,768,423 330,414,979Work-in-progress 70,578,009 57,946,757Raw materials 65,690,623 81,431,767Bulk materials 103,773,861 120,689,523Packing materials 62,898,497 74,911,011Raw and packaging materials-Premix (Unit-2) 56,102,900 37,847,322Raw and packaging materials-Contract manufacturing (Unit-3) 7,533,464 6,299,092Raw and packaging materials-Potent Product Facility (Unit-4) 16,566,688 12,527,534Consumable stores and spares 5,325,749 14,624,527Less: provision for slow moving and obsolete items (15,558,619) -Stock in transit 169,630,986 222,722,078 1,075,310,581 959,414,590
All stocks, present and future, are kept as security against short term bank loans (Note-17).
Market value2009Taka
2009Taka
Book value2008Taka

9. Trade and other receivables 2009 2008 Taka Taka
Trade debtors-unsecured (Notes-9.1) 188,061,402 227,769,104Less: Provision for doubtful debts 7,468,662 7,468,662Trade debtors considered good 180,592,740 220,300,442Sundry debtors - unsecured considered good 76,580,355 68,691,213Value Added Tax (VAT) recoverable 86,697,246 55,235,278 343,870,341 344,226,933
All present and future debtors are kept as security against short term bank loans (Note-17).
9.1 Trade debtors
Debts due below six months 104,547,004 88,997,255Debts due over six months 83,514,398 138,771,849 188,061,402 227,769,104
a) Trade debtors includes Tk 2,420,270 due from Renata Agro Industries Limited
b) Sundry debtors includes Tk 10,568,907 due from Purnava Limited for advance payment. Details are given in Note-32. “Related Party Disclosure”
10. Advances, deposits and prepayments
Advances:For inventories 2,612,482 7,285,613To employees 58,702,293 49,773,143
61,314,775 57,058,756Deposits and prepayments:
Security deposits 9,690,858 9,809,595Prepaid expenses 9,671,704 12,413,060
19,362,562 22,222,655 80,677,337 79,281,411
The following amount included in advances and pre-payments are due for repayment after twelve months from the date of balance sheet.
Advance to employees 15,291,916 4,115,032Prepaid expenses 2,252,205 6,783,419 17,544,121 10,898,451
a) Advance to employees and prepayments includes Tk 56,293,323 and Tk 47,065,436 due from the officers at 31 December 2009 and 2008 respectively.
b) No amount was due by the Directors (including Managing Director) or associated parties.
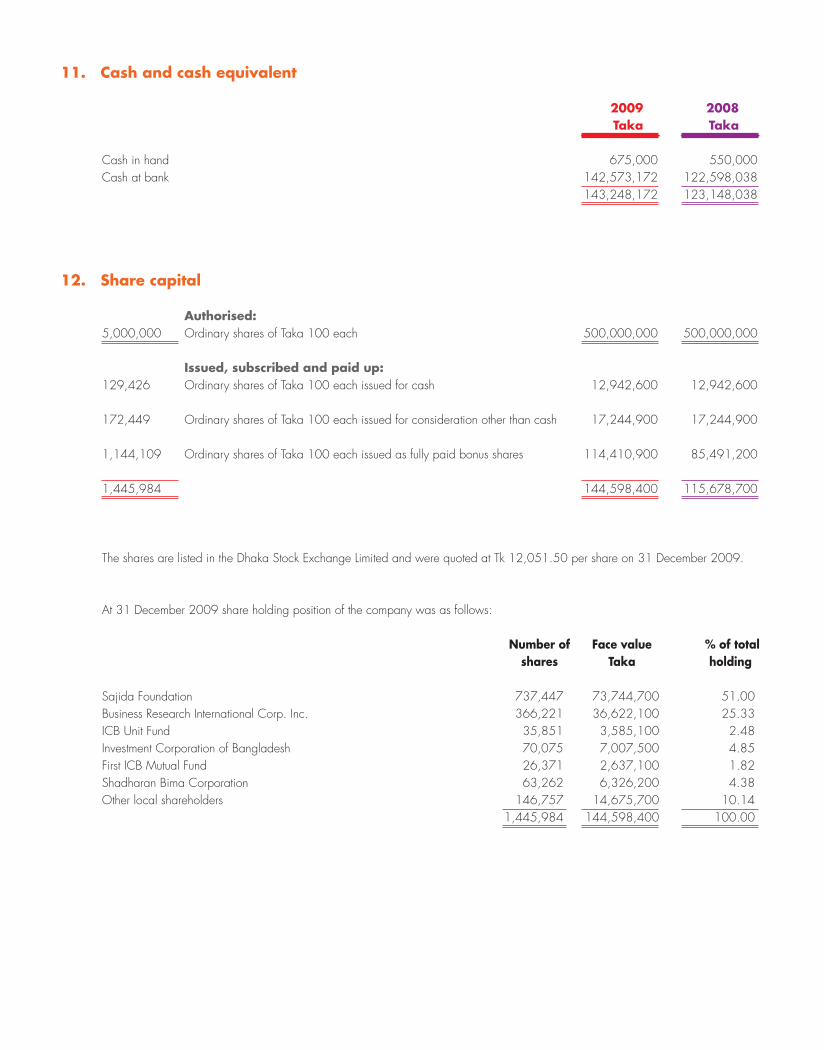
11. Cash and cash equivalent
2009 2008 Taka Taka Cash in hand 675,000 550,000Cash at bank 142,573,172 122,598,038 143,248,172 123,148,038
12. Share capital
Authorised: 5,000,000 Ordinary shares of Taka 100 each 500,000,000 500,000,000
Issued, subscribed and paid up: 129,426 Ordinary shares of Taka 100 each issued for cash 12,942,600 12,942,600 172,449 Ordinary shares of Taka 100 each issued for consideration other than cash 17,244,900 17,244,900 1,144,109 Ordinary shares of Taka 100 each issued as fully paid bonus shares 114,410,900 85,491,200
1,445,984 144,598,400 115,678,700
The shares are listed in the Dhaka Stock Exchange Limited and were quoted at Tk 12,051.50 per share on 31 December 2009.
At 31 December 2009 share holding position of the company was as follows: Number of Face value % of total shares Taka holding
Sajida Foundation 737,447 73,744,700 51.00Business Research International Corp. Inc. 366,221 36,622,100 25.33ICB Unit Fund 35,851 3,585,100 2.48Investment Corporation of Bangladesh 70,075 7,007,500 4.85First ICB Mutual Fund 26,371 2,637,100 1.82Shadharan Bima Corporation 63,262 6,326,200 4.38Other local shareholders 146,757 14,675,700 10.14 1,445,984 144,598,400 100.00

Classification of shareholders by holdings: 2009
No. of holders No. of holders Number of No. of total % of total Holdings as per folio as per BOID total holders share holdings holdings Less than 500 shares 464 1,104 1,568 49,481 3,42%501 to 5,000 shares 31 37 68 87,560 6.06%5,001 to 10,000 shares - 1 1 8,476 0.59%10,001 to 20,000 shares - 1 1 10,081 0.70%20,001 to 30,000 shares - 2 2 47,339 3.27%30,001 to 40,000 shares - 1 1 30,950 2.14%40,001 to 50,000 shares - - - - 0.00%50,001 to 100,000 shares 1 1 2 129,982 8.99%100,001 to 1,000,000 shares 2 - 2 1,082,115 74.84%Over 1,000,000 shares - - - - 0.00% 498 1,147 1,645 1,445,984 100.00%
12.1 Share holding position in Renata Agro Industries Limited
2009 2008
Number of Face value % of total Number of % of total shares Taka holding shares holding Group company:Renata Limited 419,949 41,994,900 99.99% 419,949 99.99%
Minority/outside group company:Mr. Syed S. Kaiser Kabir 51 5,100 0.01% 51 0.01% 420,000 42,000,000 100.00% 420,000 100.00%
12.2 Share holding position in Purnava Limited
2009 2008
Number of Face value % of total Number of % of total shares Taka holding shares holding
Group company:Renata Limited 24,999 2,499,900 99.996% 24,999 99.996%
Minority/outside group company: Mr. Syed S. Kaiser Kabir 1 100 0.004% 1 0.004% 25,000 2,500,000 100.000% 25,000 100.000%

13. Revaluation surplus The freehold land and buildings have been revalued from an effective date of 31 December 1995 by professional valuers and resulting increase in value of Tk 220,423,329 has been shown as revaluation surplus. The breakup of revaluation is as follows:
2009 2008 Taka Taka Land 179,132,078 179,132,078Building 33,319,658 33,955,543 212,451,736 213,087,621
Less:Depreciation charged during the year on revaluation of building (Note 4) 635,885 635,885 211,815,851 212,451,736Less:Adjustment of deferred tax thereon (Note 16) 57,218,893 57,376,275 154,596,958 155,075,461
14. Retained earnings Details are as under: Opening balance 1,338,456,682 978,790,128 Net Profit after tax for the year 603,524,452 433,145,804 Tax holiday reserve (30,484,122) (6,000,000) Stock dividend issued (28,919,700) (19,279,800) Cash dividend (57,839,350) (48,199,450) Closing Balance 1,824,737,962 1,338,456,682
15. Deferred liability-staff gratuity
The Company operates an unfunded gratuity scheme for its employees. Provision for gratuity is charged to profits annually to cover obligations under the scheme on the basis of estimate made by the management of the company to maintain full provision at the balance sheet date. The break-up of accumulated provision for gratuity is as follows: Opening balance 105,224,160 88,948,500
Add: Provision made during the year 35,192,899 26,545,000 140,417,059 115,493,500
Less: Paid during the year 16,233,464 10,269,340 Closing balance 124,183,595 105,224,160

16. Deferred tax liabilities Deferred tax liability is recognized in accordance with the provision of BAS-12 “Income Taxes”, is arrived as follows:
2009 2008 Taka Taka Opening balance 81,542,581 71,370,735 Provision made during the year for deferred tax expense 28,793,936 10,329,228 110,336,517 81,699,963
Reduction of deferred tax on revaluation surplus (Note 13) (157,382) (157,382) Closing balance 110,179,135 81,542,581
Carrying Taxable/ amount on (deductible) balance sheet temporary date Tax base difference Taka Taka Taka
At 31 December 2009 Property, plant and equipment (excluding land):At cost less accumulated depreciation 885,516,395 520,511,767 365,004,628 Revaluation surplus 211,815,851 - 211,815,851 1,097,332,246 520,511,767 576,820,479
Provision for staff gratuity (net of payment) (124,183,595) - (124,183,595) Provision for doubtful debts (7,468,662) - (7,468,662) Net temporary difference 445,168,222 Applicable tax rate 24.75% Deferred tax liability/(asset) 110,179,135
At 31 December 2008 Property, plant and equipment (excluding land): At cost less accumulated depreciation 568,031,532 338,325,471 229,706,061Revaluation surplus 212,451,736 - 212,451,736 780,483,268 338,325,471 442,157,797
Provision for staff gratuity (net of payment) (105,224,160) - (105,224,160) Provision for doubtful debts (7,468,662) - (7,468,662)Net temporary difference 329,464,975 Applicable tax rate 24.75% Deferred tax liability/(asset) 81,542,581

17. Bank overdraft
Limit 2009 2008 Taka Taka TakaOverdraft accounts with: Eastern Bank Limited, Dhaka 375,000,000 224,935,217 145,122,154The Hongkong and Shanghai Banking Corporation Ltd., Dhaka 680,000,000 86,474,899 301,489,000Standard Chartered Bank, Dhaka 625,000,000 332,160,761 205,473,714Citibank, N.A., Dhaka 270,000,000 150,853,743 171,078,747 1,950,000,000 794,424,620 823,163,615
Securityi) First charge over all present and future stocks and book debts of Renata Limited jointly with Eastern Bank Limited, The Hongkong and Shanghai Banking Corporation Limited, Citibank, N.A. and Standard Chartered Bank under pari-passu security sharing agreement.
ii) First charge over all present and future plant and machinery of Renata Limited jointly as above.
iii) Equitable mortgage over land and building thereon, of the factory premises of Renata Limited at Mirpur measuring 4.75 acres approximately as above.
Others: Not availed of Total facilities at balance available sheet date Taka Taka
Letters of credit 1,240,000,000 936,714,482
(including 180 days revolving time loan for import finance)
18. Other payables
2009 2008 Taka Taka
Workers’ profit participation fund 96,243,044 71,096,287Others (Note-18.1) 141,067,602 8,806,551 237,310,646 79,902,838
18.1 Others
Advance received from Directorate of Family Planning (against sales) 85,591,760 -PF Trustee 2,341,953 8,316,905Accounts Current-Global Alliance for Improved Nutrition* 52,883,851 -Tax deduction at source 250,038 489,646 141,067,602 8,806,551
*Renata limited received this amount as advance as per the marketing support agreement made on 30 June 2009 with “The Global Alliance for Improved Nutrition” (”GAIN”) for participation in Infant and Young Child Nutrition (IYCN) Program. The program is yet to be started. “The Global Alliance for Improved Nutrition” (”GAIN”) is a not-for-profit foundation organized and existing under the laws of Switzerland with its offices at 37-39, Rue de Vermont, P.O. Box 55, 1211 Geneva 20, Switzerland.
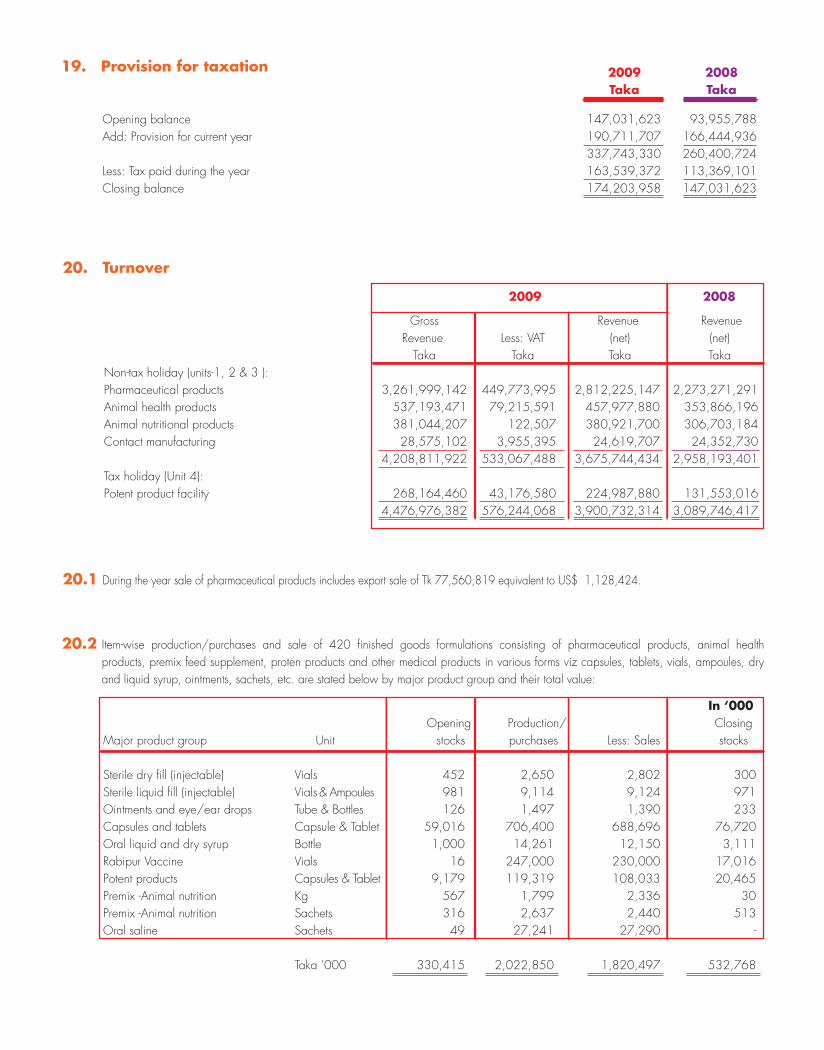
20. Turnover
2009 2008
Gross Revenue Revenue Revenue Less: VAT (net) (net) Taka Taka Taka TakaNon-tax holiday (units-1, 2 & 3 ):Pharmaceutical products 3,261,999,142 449,773,995 2,812,225,147 2,273,271,291Animal health products 537,193,471 79,215,591 457,977,880 353,866,196Animal nutritional products 381,044,207 122,507 380,921,700 306,703,184Contact manufacturing 28,575,102 3,955,395 24,619,707 24,352,730 4,208,811,922 533,067,488 3,675,744,434 2,958,193,401Tax holiday (Unit 4):Potent product facility 268,164,460 43,176,580 224,987,880 131,553,016 4,476,976,382 576,244,068 3,900,732,314 3,089,746,417
20.1 During the year sale of pharmaceutical products includes export sale of Tk 77,560,819 equivalent to US$ 1,128,424.
20.2 Item-wise production/purchases and sale of 420 finished goods formulations consisting of pharmaceutical products, animal health products, premix feed supplement, proten products and other medical products in various forms viz capsules, tablets, vials, ampoules, dry and liquid syrup, ointments, sachets, etc. are stated below by major product group and their total value:
In ‘000 Opening Production/ ClosingMajor product group Unit stocks purchases Less: Sales stocks
Sterile dry fill (injectable) Vials 452 2,650 2,802 300Sterile liquid fill (injectable) Vials & Ampoules 981 9,114 9,124 971Ointments and eye/ear drops Tube & Bottles 126 1,497 1,390 233Capsules and tablets Capsule & Tablet 59,016 706,400 688,696 76,720Oral liquid and dry syrup Bottle 1,000 14,261 12,150 3,111Rabipur Vaccine Vials 16 247,000 230,000 17,016Potent products Capsules & Tablet 9,179 119,319 108,033 20,465Premix -Animal nutrition Kg 567 1,799 2,336 30Premix -Animal nutrition Sachets 316 2,637 2,440 513Oral saline Sachets 49 27,241 27,290 -
Taka ’000 330,415 2,022,850 1,820,497 532,768
19. Provision for taxation 2009 2008 Taka Taka
Opening balance 147,031,623 93,955,788Add: Provision for current year 190,711,707 166,444,936 337,743,330 260,400,724Less: Tax paid during the year 163,539,372 113,369,101Closing balance 174,203,958 147,031,623

21. Cost of sales 2009 2008
Non-tax holiday Tax holiday Unit-1 , 2 & 3 Unit-4 Total Total Taka Taka Taka Taka
Opening stock of finished goods 321,329,781 9,085,198 330,414,979 222,699,701Add: Cost of goods manufactured (Note 21.1) 1,835,155,945 74,986,967 1,910,142,912 1,579,403,063Cost of finished goods purchased 112,707,309 - 112,707,309 54,826,900 2,269,193,035 84,072,165 2,353,265,200 1,856,929,664Less:Closing stock of finished goods (Note 8) 518,152,218 14,616,205 532,768,423 330,414,979 1,751,040,817 69,455,960 1,820,496,777 1,526,514,685
21.1 Cost of goods manufactured 2009 2008 Non-tax holiday Tax holiday Unit-1 , 2 & 3 Unit-4 Total Total Taka Taka Taka Taka
Cost of materials: Opening work-in-process 57,946,757 - 57,946,757 34,031,511Add:Cost of raw materials consumed (Note 21.2) 1,531,266,319 53,608,818 1,584,875,137 1,342,055,067 1,589,213,076 53,608,818 1,642,821,894 1,376,086,578Less: Closing work-in-process 70,578,009 - 70,578,009 57,946,757Total cost of materials 1,518,635,067 53,608,818 1,572,243,885 1,318,139,821 Manufacturing overhead: Salaries, wages and other benefits 92,692,522 5,806,798 98,499,320 87,875,737Company's contribution to provident fund 1,284,802 210,726 1,495,528 1,241,110Net periodic cost for gratuity 16,081,894 498,605 16,580,499 12,865,000Electricity and fuel 22,564,678 2,866,066 25,430,744 19,395,013Consumable stores,supplies and manufacturing expenses 52,614,563 180,688 52,795,251 28,130,872Insurance 4,154,935 121,500 4,276,435 2,305,225Land revenue and taxes 1,359,848 - 1,359,848 417,700Rental and leases 1,454,424 - 1,454,424 1,751,379Automobile expenses 3,760,360 180,000 3,940,360 3,260,867Postage and telephone 1,433,567 21,821 1,455,388 1,305,206Printing and stationery 3,103,495 13,779 3,117,274 1,995,999Uniforms for workers 3,218,995 36,094 3,255,089 2,148,916Travelling, moving and entertainment 12,121,775 - 12,121,775 11,643,460Repair and maintenance 15,874,563 49,688 15,924,251 14,335,823Lunch, Snacks and Tea expenses 23,436,141 464,100 23,900,241 20,544,361Depreciation 60,569,958 10,928,284 71,498,242 50,703,435Other overhead expenses 794,358 - 794,358 1,343,139 316,520,878 21,378,149 337,899,027 261,263,242Total cost of goods manufactured 1,835,155,945 74,986,967 1,910,142,912 1,579,403,063
21.2 Cost of raw materials consumed
Opening stock 321,178,715 12,527,534 333,706,249 286,937,536Add: Purchase 1,506,086,949 57,647,972 1,563,734,921 1,388,823,780 1,827,265,664 70,175,506 1,897,441,170 1,675,761,316Less: Closing stock (Note 21.3) 295,999,345 16,566,688 312,566,033 333,706,249 1,531,266,319 53,608,818 1,584,875,137 1,342,055,067
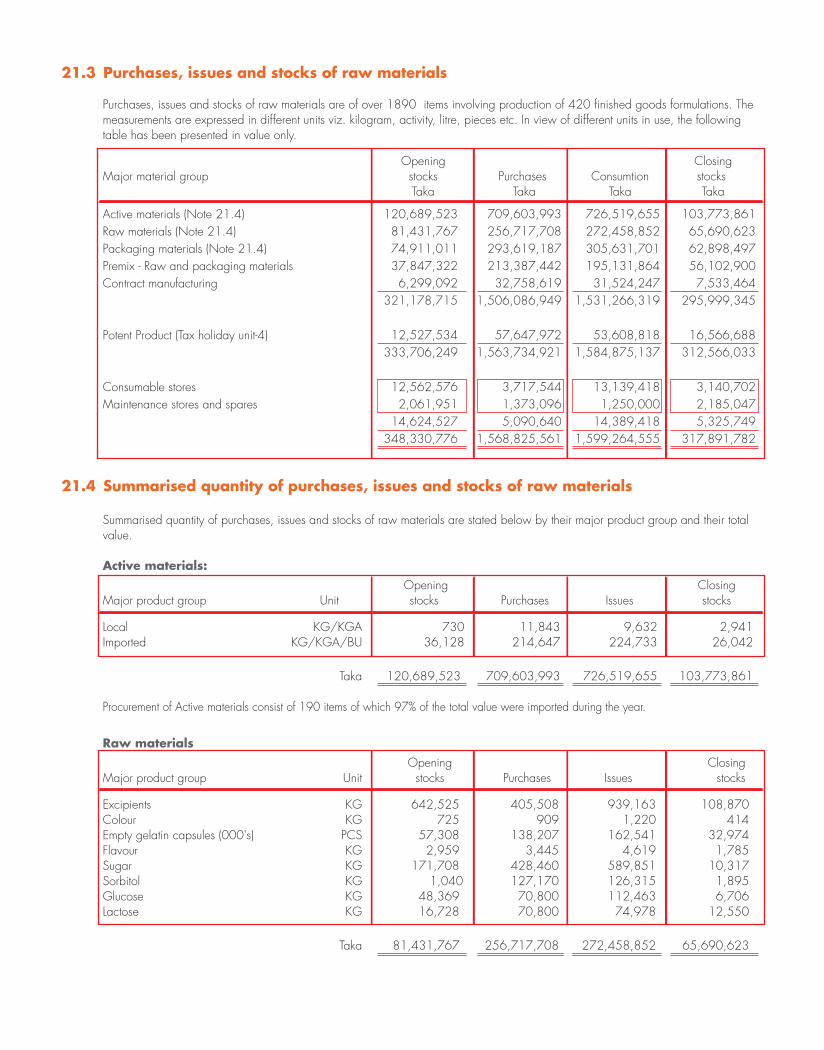
21.3 Purchases, issues and stocks of raw materials Purchases, issues and stocks of raw materials are of over 1890 items involving production of 420 finished goods formulations. The measurements are expressed in different units viz. kilogram, activity, litre, pieces etc. In view of different units in use, the following table has been presented in value only. Opening Closing Major material group stocks Purchases Consumtion stocks Taka Taka Taka Taka
Active materials (Note 21.4) 120,689,523 709,603,993 726,519,655 103,773,861Raw materials (Note 21.4) 81,431,767 256,717,708 272,458,852 65,690,623Packaging materials (Note 21.4) 74,911,011 293,619,187 305,631,701 62,898,497Premix - Raw and packaging materials 37,847,322 213,387,442 195,131,864 56,102,900Contract manufacturing 6,299,092 32,758,619 31,524,247 7,533,464 321,178,715 1,506,086,949 1,531,266,319 295,999,345
Potent Product (Tax holiday unit-4) 12,527,534 57,647,972 53,608,818 16,566,688 333,706,249 1,563,734,921 1,584,875,137 312,566,033
Consumable stores 12,562,576 3,717,544 13,139,418 3,140,702Maintenance stores and spares 2,061,951 1,373,096 1,250,000 2,185,047 14,624,527 5,090,640 14,389,418 5,325,749 348,330,776 1,568,825,561 1,599,264,555 317,891,782
21.4 Summarised quantity of purchases, issues and stocks of raw materials
Summarised quantity of purchases, issues and stocks of raw materials are stated below by their major product group and their total value.
Active materials: Opening Closing Major product group Unit stocks Purchases Issues stocks Local KG/KGA 730 11,843 9,632 2,941Imported KG/KGA/BU 36,128 214,647 224,733 26,042
Taka 120,689,523 709,603,993 726,519,655 103,773,861 Procurement of Active materials consist of 190 items of which 97% of the total value were imported during the year.
Raw materials Opening Closing Major product group Unit stocks Purchases Issues stocks Excipients KG 642,525 405,508 939,163 108,870Colour KG 725 909 1,220 414Empty gelatin capsules (000's) PCS 57,308 138,207 162,541 32,974Flavour KG 2,959 3,445 4,619 1,785Sugar KG 171,708 428,460 589,851 10,317Sorbitol KG 1,040 127,170 126,315 1,895Glucose KG 48,369 70,800 112,463 6,706Lactose KG 16,728 70,800 74,978 12,550
Taka 81,431,767 256,717,708 272,458,852 65,690,623
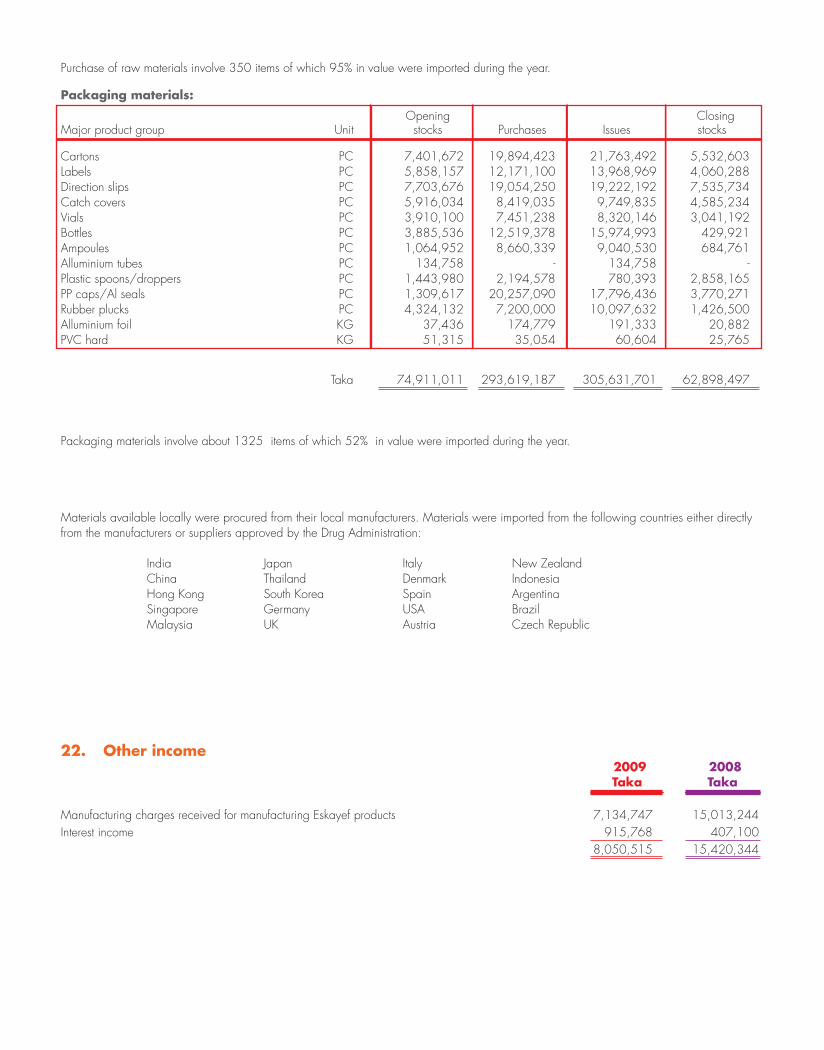
Purchase of raw materials involve 350 items of which 95% in value were imported during the year. Packaging materials:
Opening ClosingMajor product group Unit stocks Purchases Issues stocks
Cartons PC 7,401,672 19,894,423 21,763,492 5,532,603Labels PC 5,858,157 12,171,100 13,968,969 4,060,288Direction slips PC 7,703,676 19,054,250 19,222,192 7,535,734Catch covers PC 5,916,034 8,419,035 9,749,835 4,585,234Vials PC 3,910,100 7,451,238 8,320,146 3,041,192Bottles PC 3,885,536 12,519,378 15,974,993 429,921Ampoules PC 1,064,952 8,660,339 9,040,530 684,761Alluminium tubes PC 134,758 - 134,758 -Plastic spoons/droppers PC 1,443,980 2,194,578 780,393 2,858,165PP caps/Al seals PC 1,309,617 20,257,090 17,796,436 3,770,271Rubber plucks PC 4,324,132 7,200,000 10,097,632 1,426,500Alluminium foil KG 37,436 174,779 191,333 20,882PVC hard KG 51,315 35,054 60,604 25,765
Taka 74,911,011 293,619,187 305,631,701 62,898,497
Packaging materials involve about 1325 items of which 52% in value were imported during the year.
Materials available locally were procured from their local manufacturers. Materials were imported from the following countries either directly from the manufacturers or suppliers approved by the Drug Administration:
India Japan Italy New Zealand China Thailand Denmark Indonesia Hong Kong South Korea Spain Argentina Singapore Germany USA Brazil Malaysia UK Austria Czech Republic
22. Other income 2009 2008 Taka Taka
Manufacturing charges received for manufacturing Eskayef products 7,134,747 15,013,244Interest income 915,768 407,100 8,050,515 15,420,344
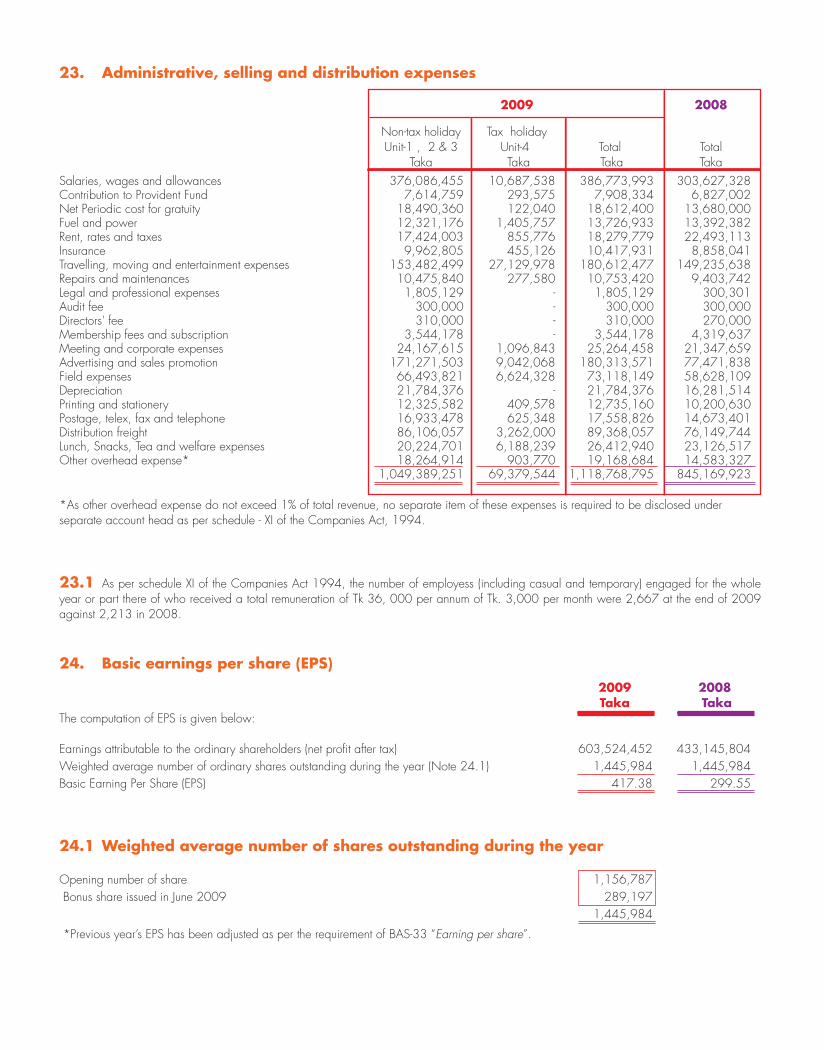
23. Administrative, selling and distribution expenses
2009 2008
Non-tax holiday Tax holiday Unit-1 , 2 & 3 Unit-4 Total Total Taka Taka Taka TakaSalaries, wages and allowances 376,086,455 10,687,538 386,773,993 303,627,328Contribution to Provident Fund 7,614,759 293,575 7,908,334 6,827,002Net Periodic cost for gratuity 18,490,360 122,040 18,612,400 13,680,000Fuel and power 12,321,176 1,405,757 13,726,933 13,392,382Rent, rates and taxes 17,424,003 855,776 18,279,779 22,493,113Insurance 9,962,805 455,126 10,417,931 8,858,041Travelling, moving and entertainment expenses 153,482,499 27,129,978 180,612,477 149,235,638Repairs and maintenances 10,475,840 277,580 10,753,420 9,403,742Legal and professional expenses 1,805,129 - 1,805,129 300,301Audit fee 300,000 - 300,000 300,000Directors' fee 310,000 - 310,000 270,000Membership fees and subscription 3,544,178 - 3,544,178 4,319,637Meeting and corporate expenses 24,167,615 1,096,843 25,264,458 21,347,659Advertising and sales promotion 171,271,503 9,042,068 180,313,571 77,471,838Field expenses 66,493,821 6,624,328 73,118,149 58,628,109Depreciation 21,784,376 - 21,784,376 16,281,514Printing and stationery 12,325,582 409,578 12,735,160 10,200,630Postage, telex, fax and telephone 16,933,478 625,348 17,558,826 14,673,401Distribution freight 86,106,057 3,262,000 89,368,057 76,149,744Lunch, Snacks, Tea and welfare expenses 20,224,701 6,188,239 26,412,940 23,126,517Other overhead expense* 18,264,914 903,770 19,168,684 14,583,327 1,049,389,251 69,379,544 1,118,768,795 845,169,923
*As other overhead expense do not exceed 1% of total revenue, no separate item of these expenses is required to be disclosed under separate account head as per schedule - XI of the Companies Act, 1994.
23.1 As per schedule XI of the Companies Act 1994, the number of employess (including casual and temporary) engaged for the whole year or part there of who received a total remuneration of Tk 36, 000 per annum of Tk. 3,000 per month were 2,667 at the end of 2009 against 2,213 in 2008.
24. Basic earnings per share (EPS) 2009 2008 Taka TakaThe computation of EPS is given below:
Earnings attributable to the ordinary shareholders (net profit after tax) 603,524,452 433,145,804Weighted average number of ordinary shares outstanding during the year (Note 24.1) 1,445,984 1,445,984Basic Earning Per Share (EPS) 417.38 299.55 24.1 Weighted average number of shares outstanding during the year Opening number of share 1,156,787 Bonus share issued in June 2009 289,197 1,445,984
*Previous year’s EPS has been adjusted as per the requirement of BAS-33 “Earning per share”.

25. Payments to directors and officers The aggregate amount paid (except directors’ fee for attending board meeting in note-23) during the year to directors and officers of the Company are disclosed below as required by the Securities and Exchange Rules 1987. Directors Officers Taka Taka
Remuneration 2,503,402 109,594,793House rent 1,715,700 121,395,631Bonus 1,115,859 30,863,841Contribution to provident fund 253,402 8,883,736Gratuity 334,756 20,352,264Medical expenses 48,463 14,544,066Conveyance allowance and transport 300,000 73,822,675Other welfare expenses 394,169 21,896,352 6,665,751 401,353,358
25.1 During the year no payment has been made to any non-executive director for any special services rendered.
26. Capacity utilisation - single shift basis
The Company operates multi-products plant. As a result plant utilisation is not comparable with capacity due to variation of product mix. However, actual production and utilisation for major products group are as follows: 2009 2008
Actual Actual Major product group Unit Capacity production Utilisation production Utilisation (In ’000) (In ’000) % (In ‘000) %
Sterile dry fill (injectable) Vials 5,000 2,650 53.00% 4,140 46.00%Sterile liquid (injectable) Vials & ampoules 8,000 9,114 113.93% 8,156 101.95%Ointments & eye/ear drops Tubes & bottles 1,440 1,497 103.96% 1,055 73.26%Capsules and tablets Cap/Tab 400,000 706,400 176.60% 518,382 148.11%Oral liquid & dry syrup Bottles 8,000 14,261 178.26% 10,500 153.51%Water for injection Ampoules 2,000 1,728 86.40% 1,200 60.00%Premix feed supplement Kg 2,500 2,637 105.48% 1,765 88.25%Premix feed supplement Sachet 1,300 1,799 138.38% 1,878 156.50%ORAL saline Sachet 24,400 27,241 111.64% 34,318 140.65%Potent Products Tablets 250,000 119,319 47.73% 64,039 25.62%
26.1 Capacity for Sterile dry fill (injectable) was built on the basis of high volume of Pronapen injection. The demand for Pronapen is declining. The Company is planning to introduce other injectables to utilise the excess capacity.
27. Contingent liabilities
27.1 There are contingent liabilities on account of unresolved disputed corporate income tax assessments involving tax claims by the tax authority amounting to Tk 25,266,780, for which appeals are pending with the High Court. However, in the event the High Court maintains the decision of the Appellate Tribunal, tax paid and provided for the relevant years are adequate to meet the demanded tax.

27.2 The Company applied on 18 February 2007 to the National Board of Revenue (NBR) for tax holiday for its Unit-4 (Potent Product Facility) under section 46A of the Income Tax Ordinance (ITO) 1984. After statutory proceedings as per ITO 1984, the NBR rejected the tax holiday application on 27 March 2007 on certain grounds. The Company filed appeal on 22 April 2007 to review the application but after statutory proceedings the NBR kept its previous order intact on 11 February 2009. The Company again filed appeal on 23 March 2009 for fresh review of the application. The ultimate outcome of the matter cannot presently be determined. However, adequate provision for any tax liability that may arise due to the rejection has been made in the financial statements from September 2006 as the Company has shown Unit-4 as tax holiday unit in the financial statements from the year 2006
27.3 Additional contingent liabilities exist in respect of the following: 2009 2008 Taka Taka
Outstanding letters of credit (Note-27.3.1) 303,285,518 257,516,212Outstanding guarantees issued by the banks 41,230,233 13,400,524 344,515,751 270,916,736
27.3.1 Outstanding letters of credit Limit 2009 2008 Taka Taka Taka
The Hongkong and Shanghai Banking Corporation Ltd. 400,000,000 92,690,273 93,641,417Standard Chartered Bank 400,000,000 91,102,679 28,359,814Eastern Bank Limited 300,000,000 73,690,983 55,623,818Citibank, N.A 140,000,000 45,801,583 79,891,163 1,240,000,000 303,285,518 257,516,212
28. Capital expenditure commitment
There was no unprovided committed capital expenditure as at 31 December 2009.
29. Dividend paid to non-resident shareholders Dividend paid to non-resident shareholder, Business Research International Corp. Inc. during theyear 2009 was Tk 11,719,080 equivalent to US$ 168,862.82 against their 366,221 shares. 30. Claims against the company not acknowledged as debt None at 31 December 2009
31. Payments/receipts in foreign currency
31.1 During the year the following payments were made in foreign currency for imports calculated on CIF basis of: Foreign Local currency currency US$ Taka
Active, raw and packaging materials 18,657,947 1,296,727,282Machinery and spares 4,453,213 309,498,280 23,111,160 1,606,225,562

31.2 The following expenses were incurred during the year in foreign exchange on account of:
Professional consultation fee for ISO 9001 US$ 53,372.13Export promotional expenses US$ 169,708.58Subscription for IMS and Medical Journal US$ 44,123.55Products registration US$ 87,889.02Conference and Trade Show US$ 19,281.01
31.3 Foreign exchange was earned in respect of the following:
Export of goods on FOB US$ 1,128,424
32. Related party disclosure: During the year the Company carried out a number of transactions with related parties in the normal course of business on arm’s length basis. Name of those related parties, nature of those transactions and their total value have been shown below in accordance with the provisions of BAS-24 “Related Party Disclosure”.
33. Subsequent events (disclosures under BAS-10 “Events after the reporting period”)
The Board of Directors at the 158th Board Meeting held on 24 April 2010, recommended to the shareholders a cash dividend of Tk. 60 per share of Tk.100 each (amounting Tk. 86,759,040) and a stock dividend (bonus shares) in the ratio of one bonus share for every four fully paid shares (4:1B) of Tk.100 each (amounting Tk. 36,149,600). This will be considered for approval by the shareholders at the 37th Annual General Meeting (AGM). 34. General 34.1 Comparative information has been disclosed in respect of 2008 for all numerical information in the financial statements and also the narrative and descriptive information as found relevant for understanding of the current year’s financial statements.
34.2 To facilitate comparison, certain relevant balances pertaining to the previous year have been rearranged or reclassified whenever consisdere necessary to conform to current year’s presentation.
Transaction Opening ClosingName of the party Relationship Nature of transaction balance Addition Adjustment balance Taka Taka Taka Taka
Renata Agro Industries Ltd. Subsidiary Sale of goods 2,175,142 12,143,413 11,898,285 2,420,270
Purnava Ltd. Subsidiary Purchase of goods - 69,983,052 69,983,052 - Advance payment 25,732,445 - 15,163,538 10,568,907 Total 25,732,445 69,983,052 85,146,590 10,568,907

RenataAgro Industries Limited
REPORT AND FINANCIAL STATEMENTS
Board of Directors • Mr. Kaiser Kabir, Chairman
• Mr. Md. Shafiul Alam, Director
• Dr. Manzur Aziz, Director

Directors’Report
2009 was a year of mixed blessings for Renata Agro Industries Limited. Although Day-Old-Chick (DOC) production increased by 67% relative to the low production levels of 2008, it was still 33% below our standard yearly average. The supply and availability of DOCs in 2009 was significantly lower than the demand; countrywide lower production of DOCs in breeder farms was possibly the after effect of the acute Avian Influenza (AI) problems that affected many farms in 2008. However, in spite of the AI issue, the demand for chicken meat and consequently for DOCs increased slightly as a result of natural growth.
The combination of low production and supply of DOCs with increased demand exerted upward pressure on DOC prices, which on average were 19% higher than 2008 levels. This price increase coupled with significantly higher production levels compared to 2008 resulted in a 90% increase in sales revenue. On average our DOC prices were 5% higher than that of our competitors. Consequently profits as a percentage of sales increased five folds from 5% in 2008 to 26% in 2009. Since 2005, the company has earned a net profit every year and average annual profit margin over the last five years has been approximately 20%. However, the cyclical nature of our industry is evident from the volatility in our profit levels year-to-year. The equity of the company increased 37% on average annually from 2005 to 2009, while liabilities decreased 24% on average annually over the same period resulting in steady improvement of our balance sheet.
In 2009, we completed construction of an additional 16,000 sft space house in the Hazimarket farm. Also, two additional pairs of setter and hatcher machines were imported from the UK and installed in the hatchery. This is expected to increase the setting and hatching capacity of the hatchery by 50% and DOC production annually by 10%. However, given the general uncertainty surrounding the overall regulatory and business environment of the poultry industry, we will take a wait-and-see approach on decisions related to further expansion and product diversification.
In response to the extensive AI outbreaks in the country in 2008, we further strengthened our
bio-security in 2009 by implementing several measures in our three farms. Technical experts from the USA and New Zealand visited these farms and gave us high marks on farm management and bio-security.
The government on several occasions attempted to introduce voluntary price controls on DOC prices in 2009. The move was strongly opposed by the poultry association and breeder farms. Artificial price controls in a free market environment, although politically popular, generally do not achieve the stated objectives of providing low priced DOCs to primary producers or farmers. This is because price controls generally result in windfall profits for the middleman with negligible benefits to DOC producers, breeder farms and poultry farmers. Thankfully the government did not force price controls on breeder farms in 2009.
High pathogenic avian influenza or HPAI still poses a serious threat to the Bangladeshi poultry industry. In spite of the demand from breeder farms and poultry associations, the government has not reversed its policy prohibiting AI vaccination of PS DOCs. It is our view that the anti-vaccination policy needs to be thoroughly reviewed and possibly rescinded taking into consideration the extent and pervasiveness of AI in Bangladesh and neighboring India. Otherwise many farms may be tempted to undertake poorly managed and poorly coordinated covert AI vaccination programs using low quality vaccines of doubtful effectiveness to save their flocks.
Although the Company is in a position to declare dividends, the Directors deem it prudent to build up reserves for uncertain times ahead.
On behalf of the Board of Directors
Kaiser KabirChairman
April 22, 2010

Independent Auditors’Report of Renata Agro
Industries Limited
We have audited the accompanying balance sheet of Renata Agro Industries Limited as of 31 December 2009, and the related profit and loss account and the cash flow statement for the year then ended. The preparation of these financial statements is the responsibility of the Company’s management. Our responsibility is to express an independent opinion on these financial statements based on our audit.
We conducted our audit in accordance with Bangladesh Standards on Auditing (BSA). Those Standards require that we plan and perform the audit to obtain reasonable assurance about whether the financial statements are free of material misstatement. An audit includes examining on a test basis, evidence supporting the amounts and disclosures in the financial statements. An audit also includes assessing the accounting principles used and significant estimates made by management as well as evaluating the overall financial statement presentation. We believe that our audit provides a reasonable basis for our opinion.
In our opinion, the financial statements, prepared in accordance with BAS, give a true and fair view of the state of the company's affairs as of 31 December 2009 and of the results of its operation and its cash flow for the year then ended and comply with the Companies Act 1994 and other applicable laws and regulations.
We also report that:
(a) we have obtained all the information and explanations which to the best of our knowledge and belief were necessary for the purposes of our audit and made due verification thereof;
(b) in our opinion, proper books of account as required by law have been kept by the company so far as it appeared from our examination of those books;
(c) the company’s balance sheet and profit and loss account dealt with by the report are in agreement with the books of account.
K.M. HASAN & CO.Chartered Accountants
Dated, Dhaka7 April 2010
RenataAgro Industries Limited
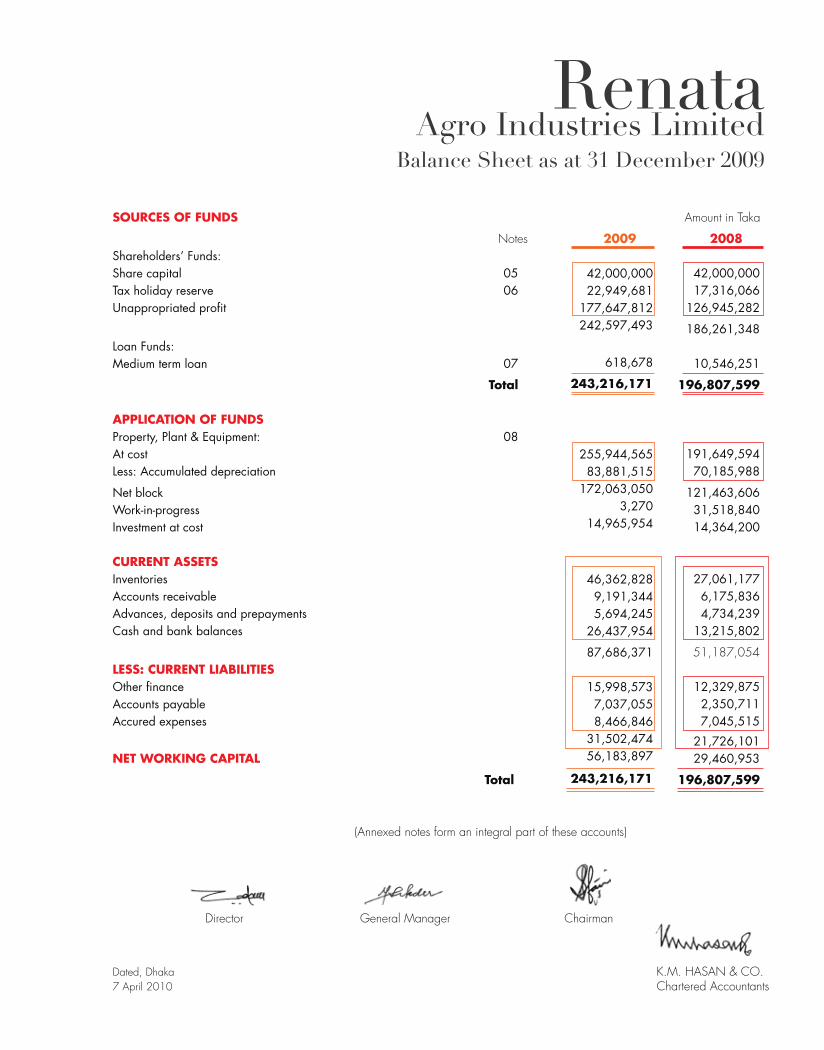
Balance Sheet as at 31 December 2009
SOURCES OF FUNDS Amount in Taka
Notes 2009 2008Shareholders’ Funds: Share capital 05 42,000,000Tax holiday reserve 06 17,316,066Unappropriated profit 126,945,282
186,261,348Loan Funds:Medium term loan 07 10,546,251
Total 196,807,599
APPLICATION OF FUNDSProperty, Plant & Equipment: 08At cost 191,649,594Less: Accumulated depreciation 70,185,988
Net block 121,463,606Work-in-progress 31,518,840Investment at cost 14,364,200
CURRENT ASSETS Inventories 27,061,177Accounts receivable 6,175,836Advances, deposits and prepayments 4,734,239Cash and bank balances 13,215,802
51,187,054LESS: CURRENT LIABILITIES Other finance 12,329,875Accounts payable 2,350,711Accured expenses 7,045,515 21,726,101NET WORKING CAPITAL 29,460,953
Total 196,807,599
(Annexed notes form an integral part of these accounts)
Director General Manager Chairman
Dated, Dhaka K.M. HASAN & CO. 7 April 2010 Chartered Accountants
42,000,000 22,949,681
177,647,812 242,597,493
618,678
243,216,171
255,944,565 83,881,515
172,063,050 3,270
14,965,954
46,362,828 9,191,344 5,694,245
26,437,954
87,686,371
15,998,573 7,037,055 8,466,846
31,502,474 56,183,897
243,216,171

Amount in Taka Notes 2009 2008
Turnover 113,482,663Cost of goods sold (94,993,286)Gross Profit 18,489,377Other Income 3,896,167 22,385,544Operating Expenses:Administrative expenses (5,447,138)Marketing expenses (3,864,821)Distribution expenses (5,582,336) (14,894,295)Operating Profit 7,491,249Financial expenses (1,694,480) 5,796,769Contribution to WPPF (276,037)Net Profit for the year 5,520,732Unappropriated profit brought forward 121,976,623
Profit available for appropriation 127,497,355Appropriation:Transfer to tax holiday reserve 552,073Proposed dividend - (552,073)Unappropriated Profit carried forward 126,945,282
Basic earnings per share (Par value Tk. 100) 13.14
(Annexed notes form an integral part of these accounts)
Director General Manager Chairman
Signed in terms of our report of even date annexed.
Dated, Dhaka K.M. HASAN & CO.7 April 2010 Chartered Accountants
RenataAgro Industries LimitedProfit And Loss Account for the year ended 31 December 2009
214,005,874 (139,336,354)
74,669,520 2,039,784
76,709,304
(6,471,064) (3,668,184) (6,488,093)
(16,627,341) 60,081,963
929,011 59,152,952 (2,816,807)
56,336,145 126,945,282
183,281,427
5,633,615 -
(5,633,615) 177,647,812
134.13

Amount in Taka
2009 2008
A. CASH FLOWS FROM OPERATING ACTIVITIESCollections from customers and other income 113,053,619Payment to suppliers and employees (98,263,006)Cash generated from operation 14,790,613Financing cost (1,694,480)Net cash from operating activities 13,096,133
B. CASH FLOWS FROM INVESTING ACTIVITIESPurchase of property, plant and equipment (31,280,584)Investment in share 298,000Net cash used in investing activities (30,982,584)
C. CASH FLOWS FROM FINANCING ACTIVITIESMedium term loan received / (repaid) (11,900,120)Bank overdraft -Net cash from financing activities (11,900,120)
D. Net cash inflows/(outflows) for the year (A+B+C) (29,786,571)Add: Opening cash and cash equivalents 43,002,373Closing cash and cash equivalents 13,215,802
* CLOSING CASH AND CASH EQUIVALENTS Cash in hand 805,840Cash at banks 12,409,962Closing cash and cash equivalents 13,215,802
Director General Manager Chairman
Signed in terms of our report of even date annexed.
Dated, Dhaka K.M. HASAN & CO.7 April 2010 Chartered Accountants
RenataAgro Industries Limited
Cash Flow Statement for the year ended 31 December 2009
214,044,330 (156,584,439)
57,459,891 (929,011)
56,530,880
(32,779,401) (601,754)
(33,381,155)
(9,927,573) -
(9,927,573)
13,222,152 13,215,802
26,437,954
1,765,210 24,672,744
26,437,954

RenataAgro Industries LimitedStatement of Changes in Equity for theyear ended 31 December 2009
Balance at 31 December 2007 42,000,000Net Profit/(Loss) for the year 2008 -Tax holiday reserve -
BALANCE AT 31 DECEMBER 2008 42,000,000
Net Profit/(Loss) for the year 2009 -Tax holiday reserve -
BALANCE AT 31 DECEMBER 2009 42,000,000
Share Tax holiday UnappropriatedPARTICULARS Capital Reserve Profit Total
16,763,993 -
552,073
17,316,066
- 5,633,615
22,949,681
121,976,623 5,520,732
(552,073)
126,945,282
56,336,145 (5,633,615)
177,647,812
180,740,616 5,520,732
-
186,261,348
56,336,145 -
242,597,493
Amount in Taka

RenataAgro Industries Limited
Notes to the Accounts For theYear Ended 31 December 2009
1. STRUCTURE OF THE COMPANY 1.1 Renata Agro Industries Limited is a private company limited by shares incorporated on 7 September1997 in Bangladesh under the Companies Act. 1994. The shares of the company shall be under the control of the Directors of the company.
1.2 Registered Office and Principal Place of Business: The registered office of the Company is situated at Dhaka. The farm is located at Barakashar, Bhaluka, Mymensingh.
2. NATURE OF BUSINESS ACTIVITIES The principal activities of the company are to carry on business for producing and sale of various agro based products, and poultry breeding & hatching and sale of poultry products. The company commenced its commercial operation from October 1998.
3. PRINCIPAL ACCOUNTING POLICIES 3.1 Basis of Accounting: The financial statements are prepared under historical cost convention in accordance with Generally Accepted Accounting Principles (GAAP).
3.2 Compliance with Local Laws: The financial statements have been prepared in compliance with requirements of Companies Act, 1994 and other relevant local laws and rules.
3.3 Component of the Financial Statements: According to the Bangladesh Accounting Standard “BAS-1”, “Presentation of Financial Statements” to complete set of Financial Statements include the following components: (a) Balance Sheet as of 31 December 2009 (b) Profit and Loss Account for the year ended 31 December 2009 (c) Cash Flow Statement for the year ended 31 December 2009 (d) Statement of Changes in Equity (e) Accounting Policies and Explanatory Notes
3.4 Risk and uncertainities for use of estimates in preparation of Financial Statements:
The preparation of financial statements in conformity with the Bangladesh Accounting Standards require management to make estimates and assumptions that affect the reported amounts of assets and liabilities and disclosure of contingent assets and liabilities at the date of financial statements, and revenues and expenses during the reported period. Actual results could differ from those estimates. Estimates are used for Accounting of certain items such as provision for doubtful accounts, depreciation, taxes, reserves and contingencies.
3.5 Transaction with related parties: The Company has carried on transaction with related parties in the normal course of business.
3.6 Reporting Period: Financial statements of the Company cover on financial year from 01 January 2009 to 31 December 2009.
3.7 Recognition of Property, Plant & Equipment and Depreciation: Property, Plant & Equipment are stated at cost less accumulated depreciation in accordance with BAS 16 “Property, Plant and Equipment.” Cost represents cost of acquisition.

No depreciation is charged on land and land development. Depreciation on all other fixed assets is charged on straight line method in amount sufficient to write off depreciable assets over their estimated useful life. Depreciation is charged for the full year on assets acquisitioned during the first half of the year while half year depreciation is charged on assets acquired during the second half of the year. The rates of depreciation are indicated in Note-8. Physical inventory of fixed assets are not undertaken by the management. The management should take physical inventory of fixed assets other than land and land development at regular basis preferably at the close of the each year to be determined by the management to ascertain the existance and present working condition of the fixed assets.
Depreciation has been charged on farm overhead and administrative, marketing and distribution expenses proportionately.
3.8 Inventories: Inventories comprise of parent stock, feed stock, medicine, feed ingredient, litter, generator fuel and spare parts. All these are stated at cost and considered realisable value. No due allowance for any obsolete or slow moving items have been accounted for.
3.9 Accounts Receivable: These are carried at original invoice amount. This is considered good and collectible. However, an amount of Tk. 314,726 have been provided for reserve for bad debt.
3.10 Current Account with Associates: These represent day-to-day transaction with Associates concerns. These are not long-term transaction. However, interest income is earned from such transactions.
3.11 Cash and Cash Equivalents: According to BAS-7 “Cash flow statement”, Cash comprises cash in hand and demand deposits and, cash equivalents are short term, highly liquid investments that are readily convertible to known amounts of cash and which are subject to an insignificant risk of changes in value. BAS-1 “Presentation of Financial Statements” provides that Cash and Cash equivalents are not restricted in use. Considering the provisions of BAS-I & BAS-7, cash in hand and bank balance have been considered as cash and cash equivalents.
Cash flow statement is prepared principally in accordance with BAS-7 “Cash flow statements” and the cash flow from operating activities has been presented under direct method.
3.12 Accounts Payable: Liabilities are recognised for amounts to be paid in future for goods and services received, whether or not billed by the suppliers and service provider.
3.13 Foreign Currency Translation: Transaction denominated in foreign currencies are translated into Bangladesh Taka and recorded at the exchange rates ruling on the date of transaction in accordance with BAS-21 “The Effects of Changes in Foreign Currency Rates.” 3.14 Turnover from Net Sales: Net sales comprise the invoice value of goods supplied by the company and consists of local sales of products.
3.15 Revenue Recognition: The revenue are recognised under satisfying all the conditions for revenue recognition as provided in BAS-18 “Revenue Recognition”. * Sales are recognized at the time of delivery of products from farm whether or not billed. * Other sales are recognized at the time of delivery from farm.
3.16 Earnings Per Share (EPS): The company calculates Earning per Share (EPS) in accordance with BAS-33 “Earning per Share”.
4. General
4.1 Figures have been rounded off to the nearest taka.
4.2 Previous year’s figures have been re-arranged where necessary to conform to current year’s presentation.

5. SHARE CAPITAL: TAKA 42,000,000
Authorized Capital:
1,500,000 ordinary share of Tk. 100 each 150,000,000 150,000,000
Issued and Paid-up Capital:
420,000 ordinary shares of Tk. 100 each 42,000,000 42,000,000
At 31 December 2009, shareholding position of the company was as follows:
Shareholders No. of share Face Value % of total holdings
Renata Limited 419,949 41,994,900 99.988% Mr. Kaiser Kabir 51 5,100 0.012% Total 420,000 42,000,000 100.00%
6. TAX HOLIDAY RESERVE: TAKA 22,949,681
Opening balance 17,316,066 16,763,993 Add: Provided during the year 5,633,615 552,073
Total 22,949,681 17,316,066
7. MEDIUM TERM LOAN: TAKA 618,678
This represents five years loans provided by: Term loan - 3 from EBL 618,678 7,990,693 IIDFCL - 2,555,558
Total 618,678 10,546,251
Amount in Taka
2009 2008

RenataAgro Industries LimitedFixed Assets as at 31 December 2009
8. PROPERTY, PLANT AND EQUIPMENT: TAKA 172,063,050 Amount in Taka
Cost Depreciation Written
Particulars Balance Addition Disposal/ Balance Rate Balance Charge Disposal/ Balance down value
as on during adjustment as on as on during adjustment as on as on
01.01.09 the year 31.12.09 (%) 01.01.09 the year 31.12.09 31.12.09
Freehold Land & land
development - At cost
Buildings at cost : Building on freehold land
Semi pucca building on freehold land
Plant and Machinery
Office Equipments
Automobiles and Trucks
Furniture & fixture
Total
Allocation of depreciation:
Farm overhead
Administrative expenses
Marketing expenses
Distribution expenses
Hatchery expenses
Feed expenses
Laboratory expenses
Total
10,050,290
65,820,996
1,741,817 67,562,813
100,876,681
1,630,470
9,474,719
2,054,621
191,649,594
10,031,253
1,115,371
255,095
556,845
1,887,437
322,458
78,068
14,246,527
759,500
38,133,048
- 38,133,048
22,820,209
560,035
2,462,307
110,872
64,845,971
-
-
- -
-
-
(551,000)
-
(551,000)
10,809,790
103,954,044
1,741,817 105,695,861
123,696,890
2,190,505
11,386,026
2,165,493
255,944,565
-
5.07-6.59
12.5
5
12.5
20
5
-
22,221,921
888,812 23,110,733
40,682,305
477,358
5,076,554
839,038
70,185,988
-
5,977,610
217,727 6,195,337
5,739,101
248,723
1,955,678
107,688
14,246,527
-
-
- -
(3,042)
3,042
(551,000)
-
(551,000)
28,199,531
1,106,539 29,306,070
46,418,364
729,123
6,481,232
946,726
83,881,515
10,809,790
75,754,513
635,278 76,389,791
77,278,526
1,461,382
4,904,794
1,218,767
172,063,050

PurnavaLimited
REPORT AND FINANCIAL STATEMENTS
Board of Directors • Mr. Kaiser Kabir, Chairman
• Mr. Md. Shafiul Alam, Director• Dr. Manzur Aziz, Director

Directors’Report
A new Company named Purnava Limited was incorporated in August 2004 to explore the prospects of entering into Fast Moving Consumer Goods (FMCG). There has been no development in the FMCG area; however, the Company imported certain animal health and nutrition products during the latter part of 2009. In 2010, we will begin full-scale commercial activity with at least three new products.
On behalf of the Board of Directors
Kaiser KabirChairman
April 22, 2010

Independent Auditors’ Reportto the Shareholders of Purnava LimitedWe have audited the accompanying balance sheet of PURNAVA LIMITED as at 31 December 2009 and the related profit & loss account and cash flow statement for the year then ended. The preparation of these financial statements is the responsibility of the Company’s management. Our responsibility is to express an independent opinion on these financial statements based on our audit.
We conducted our audit in accordance with Bangladesh Standards on Auditing (BSA). Those Standards require that we plan and perform the audit to obtain reasonable assurance about whether the financial statements are free of material misstatements. An audit includes examining, on a test basis, evidence supporting the amounts and disclosures in the financial statements. An audit also includes assessing the accounting principles used and significant estimates made by management, as well as evaluating the overall financial statement presentation. We believe that our audit provides a reasonable basis for our opinion.
In our opinion, the financial statements, prepared in accordance with Bangladesh Accounting Standards (BAS), give a true and fair view of the state of the company’s affairs as at 31 December 2009 and of the resutls of its operations and its cash flow statement for the year then ended and comply with the Companies Act, 1994 and other applicable laws and regulations. We also report that:(a) we have obtained all the information and explanations which to the best of our knowledge and belief, were necessary for the purposes of our audit and made due verification thereof;
(b) in our opinion, proper books of account as required by law have been kept by the company so far as it appeared from our examination of those books; and
(c) the company’s balance sheet, profit & loss account and the cash flow statement dealt with by the report are in agreement with the books of account.
K.M. HASAN & CO. Chartered AccountantsDated, Dhaka
29 March, 2010

Notes 2009 2008
SOURCES OF FUNDS
Shareholders’ Fund Share capital 3 2,500,000 2,500,000Reserve & surplus 255,891 -
Total 2,755,891 2,500,000APPLICATION OF FUNDS
Fixed Assets 4
Gross block 1,539,028 -Less: Depreciation 364,591 -Net block 1,174,437 -
Current AssetsInventories 11,752,432 21,806,568Advance income tax 172,135 -Cash and cash equivalents 577,199 6,425,877 12,501,766 28,232,445Less: Current LiabilitiesOther finance (Renata Limited) 10,568,907 25,732,445 Accured expenses 197,270 -Provision for corportae tax 154,135 - 10,920,312 25,732,445 1,581,454 2,500,000
Total 2,755,891 2,500,000
(The annexed notes form an integral part of these accounts.)
Director Director Chairman
(Signed in terms of our report of even date annexed.)
Dated, Dhaka K.M. HASAN & CO. 29 March 2010 Chartered Accountants
PurnavaLimited
Balance Sheet As at 31 December 2009
Figures in Taka

Purnava LimitedProfit And Loss Account For theyear ended 31 December 2009
Amount in Taka
2009
Notes
Sales 69,983,052
Less: Cost of goods sold 5 68,444,763
1,538,289
Less: Administrative expenses
Salaries and allowances 582,911
Travelling & conveyance 123,434
Donation 16,000
Utilities 21,572
Trade licence 4,755
Audit fee 15,000
Depreciation 364,591
1,128,263
Net profit before tax 410,026
Less: Provision for corporate tax 154,135
NET PROFIT AFTER TAX TRANSFERRED TO RESERVE AND SURPLUS ACCOUNT 255,891
(The annexed notes form an integral part of these accounts.)
Director Director Chairman
(Signed in terms of our report of even date annexed.)
Dated, Dhaka K.M. HASAN & CO. 29 March 2010 Chartered Accountants

PurnavaLimited
Cash Flow Statement For the year ended 31 December 2009
Amount in Taka
2009 2008
A. CASH FLOWS FROM OPERATING ACTIVITIESCollections from customers and other income -
Payment to suppliers, employees and others (8,164,139)
Cash generated from operation (8,164,139)Financing cost -
Payment of tax -
Net cash from operating activities (8,164,139)
B. CASH FLOWS FROM INVESTING ACTIVITIESPurchase of property, plant and equipment -
Investment in shares -
Sale proceeds of property, plant and equipment -
Net cash used in investing activities -
C. CASH FLOWS FROM FINANCING ACTIVITIESMedium term loan received / (repaid)
Loan paid 10,057,875
Dividend paid -
Net cash from financing activities 10,057,875
D. Net cash inflows/(outflows) for the year (A+B+C) 1,893,736
Add: Opening cash and cash equivalents 4,532,141
Closing cash and cash equivalents 6,425,877
* CLOSING CASH AND CASH EQUIVALENTSCash in hand 100
Cash at banks 6,425,777
Closing cash and cash equivalents 6,425,877
Director Director Chairman
(Signed in terms of our report of even date annexed.)
Dated, Dhaka K.M. HASAN & CO. 29 March 2010 Chartered Accountants
69,983,052
(58,957,029)
11,026,023
-
172,135
10,853,888
(1,539,028)
-
-
(1,539,028)
-
(15,163,538)
-
(15,163,538)
(5,848,678)
6,425,877
577,199
-
577,199
577,199

Purnava LimitedNotes to the Accounts for theyear ended 31 December 2009
1. ORGANISATION AND ITS ACTIVITIES 1.1 Company Profile: PURNAVA LIMITED is a private limited company incorporated in Bangladesh on 17 August 2004 under the Companies Act 1994. The company has started commercial operation during the period.
1.2 Principal Activities: The principal activities of the company are to carry on the business of manufacturing, marketing and distribution of all kinds of consumer goods, consumer durables, food items, sugar confectioneries, edible oils, beverages etc. raw materials, semi-finished items, producers, goods and various other products of local or foreign origin and to engage in the business as traders, importers, exporters, commission agents of all kinds of goods and services including pharmaceutical drugs and medicines. 2. SIGNIFICANT ACCOUNTING POLICIES 2.1 Basis of Preparation of Accounts: The accounts of the company have been prepared under historical cost convention in accordance with the Generally Accepted Accounting Principles. 2.2 Reporting Period: The accounts have been prepared for the period from 1 January 2009 to 31 December 2009. 2.3 General: Previous year’s figures and phrases have been rearranged where necessary to conform to the current year's presentation.
Figures have been rounded off to the nearest taka.
Amount in Taka
20093. SHARE CAPITAL: TAKA 2,500,000 Authorised Capital: 2,000,000 ordinary shares of Tk. 100 each 200,000,000 Issued, Subscribed, Called up & Paid up Capital 25,000 ordinary shares of Tk. 100 each 2,500,000 The paid up capital of the company has been contributed by the following persons. Name of the shareholders No. of Face Shares Value Renata Limited 24,999 100 2,499,900 Mr. Kaiser Kabir 1 100 100 25,000 2,500,000

4. FIXED ASSETS: TAKA 1,174,437 Amount in Taka ORIGINAL COST DEPRECIATION
Written
Opening Addition Total Rate Opening Charged Total Down Value
PARTICULARS as on during as on as on during as on as on
01.01.09 the year 31.12.09 (%) 01.01.09 the year 31.12.09 31.12.09
Vehicle - 1,398,000 1,398,000 25 - 349,500 349,500 1,048,500
Furniture & fixture - 33,828 33,828 5 - 1,691 1,691 32,137
Computer - 107,200 107,200 12.5 - 13,400 13,400 93,800
Total - 1,539,028 1,539,028 - 364,591 364,591 1,174,437
5. COST OF GOODS SOLD: TAKA 68,444,763
2009
Opening inventories 21,806,568
Add: Purchase (Annexure- A) 58,390,627
Goods available for sales 80,197,195
Less: Closing inventories 11,752,432
68,444,763

ConsolidatedAccounts of
Renata Limitedand its Subsidiaries

RENATA LIMITEDCONSOLIDATED BALANCE SHEET AS AT 31 DECEMBER 2009 ASSETS Notes 2009 2008Non-current assets Property, plant and equipment 4.a 1,569,538,354 1,135,899,440Capital work-in-progress 5.a 736,963,803 601,796,838Investment 7.a 26,897,033 22,741,954Total non-current assets 2,333,399,190 1,760,438,232
Current assets Inventories 8.a 1,133,425,841 1,008,282,335Trade and other receivables 9.a 340,072,508 322,495,182Advances, deposits and prepayments 10.a 86,371,582 84,015,650Cash and cash equivalents 11.a 170,263,325 142,789,717Total current assets 1,730,133,256 1,557,582,884Total assets 4,063,532,446 3,318,021,116 EQUITY & LIABILITIES Share capital 12 144,598,400 115,678,700Revaluation surplus 13 154,596,958 155,075,461Capital reserve 535,560 535,560Tax holiday reserve 106,295,813 70,178,076Retained earnings 1,983,506,664 1,446,273,815Total equity attributable to equity holders of the group company 2,389,533,395 1,787,741,612Minority interest 29,569 22,717Total equity 2,389,562,964 1,787,764,329 Non-current liabilities Loans and borrowings 618,678 10,546,251Deferred liability-staff gratuity 15 124,183,595 105,224,160Deferred tax liabilities 16.a 110,179,135 81,542,581Total non-current liabilities 234,981,408 197,312,992Current liabilities Bank overdraft 17.a 794,424,620 823,163,615Creditors for goods 32,513,710 127,283,258Accrued expenses 180,592,963 140,059,119Other payables 18.a 253,309,219 92,232,713Unclaimed dividend 3,961,604 3,173,467Provision for taxation 19.a 174,185,958 147,031,623Total current liabilities 1,438,988,074 1,332,943,795Total liabilities 1,673,969,482 1,530,256,787Total equity and liabilities 4,063,532,446 3,318,021,116
The annexed notes 1 to 34 form an integral part of these financial statements.
CEO & Managing Director Director Company Secretary
As per our annexed report of same date.
Dhaka, 20 April 2010 Auditors
Figures in Taka

RENATA LIMITEDCONSOLIDATED PROFIT AND LOSS ACCOUNTFOR THE YEAR ENDED 31 DECEMBER 2009
Notes 2009 2008
Turnover 20.a 4,102,594,775 3,203,229,080Cost of sales 21.a (1,946,151,429) (1,621,507,971)Gross profit 2,156,443,346 1,581,721,109Other income 10,090,299 19,316,511 2,166,533,645 1,601,037,620 Operating expenses:Administrative, selling and distribution expenses 23.a (1,136,524,399) (860,064,218)Operating profit 1,030,009,246 740,973,402Gain on disposal of property, plant and equipment 4.5 930,500 118,000Interest on overdraft (100,442,649) (88,965,145)Other expenses (6,752,520) (5,913,520)Contribution to WPPF (43,968,311) (30,772,037)Profit before tax 879,776,266 615,440,700
Tax expensesCurrent tax 19.a (190,865,842) (166,444,936)Deferred tax 16 (28,793,936) (10,329,228) (219,659,778) (176,774,164)Net profit after tax for the year 660,116,488 438,666,536 Basic earnings per share (par value of Tk 100) 24.a 456.52 303.37
The annexed notes 1 to 34 form an integral part of these financial statements.
CEO & Managing Director Director Company Secretary
As per our annexed report of same date.
Dhaka, 20 April 2010 Auditors
Figures in Taka

RENATA LIMITEDCONSOLIDATED STATEMENT OF CHANGES IN EQUITY FOR THE YEAR ENDED 31 DECEMBER 2009
Equity attributable to group company shareholders
Share Revaluation Tax holiday Capital Retained Minority Total Particulars capital surplus reserve reserve earnings Total interest equity
Balance as at 1 January 2008 96,398,900 155,553,964 63,626,003 535,560 1,081,639,272 1,397,753,699 22,047 1,397,775,746Stock dividend issued 19,279,800 - - - (19,279,800) - - -
Cash dividend - - - - (48,199,450) (48,199,450) - (48,199,450)
Deferred tax on revaluation surplus - 157,382 - - - 157,382 - 157,382
Depreciation adjustment - (635,885) - - - (635,885) - (635,885)
Net profit after tax for the year - - - - 438,665,866 438,665,866 670 438,666,536
Transferred to tax holiday reserve - - 6,552,073 - (6,552,073) - - -
Balance at 31 December 2008 115,678,700 155,075,461 70,178,076 535,560 1,446,273,815 1,787,741,612 22,717 1,787,764,329
Balance as at 1 January 2009 115,678,700 155,075,461 70,178,076 535,560 1,446,273,815 1,787,741,612 22,717 1,787,764,329
Stock dividend issued 28,919,700 - - - (28,919,700) - - -
Cash dividend - - - - (57,839,350) (57,839,350) - (57,839,350)
Deferred tax on revaluation surplus - 157,382 - - - 157,382 - 157,382
Depreciation adjustment - (635,885) - - - (635,885) - (635,885)
Net profit after tax for the year - - - - 660,109,636 660,109,636 6,852 660,116,488
Transferred to tax holiday reserve - - 36,117,737 - (36,117,737) - - -
Balance at 31 December 2009 144,598,400 154,596,958 106,295,813 535,560 1,983,506,664 2,389,533,395 29,569 2,389,562,964
The annexed notes 1 to 34 form an integral part of these financial statements.
Figures in Taka

RENATA LIMITEDCONSOLIDATED CASH FLOW STATEMENTFOR THE YEAR ENDED 31 DECEMBER 2009
2009 2008 A. Cash flows from operating activities Collection from customers and other income 4,808,761,981 3,577,080,190 Payment of VAT (576,244,068) (446,920,865) Payment to suppliers and employees (3,149,895,253) (2,705,414,968) Cash generated from operation 1,082,622,660 424,744,357 Financing cost (100,442,649) (88,965,145) Payment of tax (163,711,507) (113,369,101) Net cash from operating activities 818,468,504 222,410,111 B. Cash flows from investing activities Purchase of property, plant and equipment (676,888,998) (580,785,056) Investment in shares (4,155,079) (7,079,754) Sale proceeds of property, plant and equipment 930,500 118,000 Net cash from/(used in) investing activities (680,113,577) (587,746,810)
C. Cash flows from financing activities Medium term loan (repaid)/ received (net) (53,830,106) 459,846,355 Dividend paid (57,051,213) (47,511,431) Net cash from/(used in) financing activities (110,881,319) 412,334,924 D. Net cash increase (decrease) for the year (A+B+C) 27,473,608 46,998,225 E. Opening cash and cash equivalent 142,789,717 95,791,492 F. Closing cash and cash equivalent (D+E) 170,263,325 142,789,717
The annexed notes 1 to 34 form an integral part of these financial statements.
Figures in Taka

4.a.1 Value of fully depreciated assets included in property, plant and equipment are as follows
Cost Taka
Building 3,555,587Plant and machinery 114,733,104Automobiles and trucks 21,492,570Office equipments 14,216,362Furniture and fixture 2,326,305 156,323,928
4.a.2 The land of the Company measuring 12 acres freehold is located at Mirpur, Dhaka and is 9 feet above the highest flood level recorded in 1988. Out of 12 acres of land, 4.75 acres has been kept as security against short-term bank loans by registered mortgage.
4.a.3 Depreciation for the year has been charged to
Taka
Cost of goods sold - Non-tax holiday units 1, 2 &3 (Note 21.1) 60,569,958Cost of goods sold - Tax holiday unit 4 (Note 21.1) 10,928,284 71,498,242Renata Agro Industries Limited 14,246,527Purnava Limited 364,591Operating expenses (Note 23) 21,784,376Revaluation surplus (Note 13) 635,885 108,529,621
4.a Consolidated property, plant and equipment
Cost/revaluation Depreciation
Disposal/ Disposal/ Written Particulars At Additions adjustment At Rate At Charged adjustment At down value at 1 January during during 31 December 1 January during during 31December 31 December 2009 the year the year 2009 2009 the year the year 2009 2009 Taka Taka Taka Taka % Taka Taka Taka Taka Taka
Freehold land: At cost 89,255,729 72,595,169 - 161,850,898 - - - - 161,850,898On revaluation 179,132,078 - - 179,132,078 - - - - 179,132,078 268,387,807 72,595,169 - 340,982,976 - - - - - 340,982,976Building: At cost on freehold land 259,540,328 106,434,003 - 365,974,331 1.33-4 46,258,599 13,897,024 - 60,155,623 305,818,708On revaluation 41,291,251 - - 41,291,251 1.33-4 8,820,663 635,885 - 9,456,548 31,834,703 300,831,579 106,434,003 - 407,265,582 55,079,262 14,532,909 - 69,612,171 337,653,411Plant and machinery 812,953,097 292,754,297 - 1,105,707,394 5-20 290,498,251 66,673,979 3,042 357,169,188 748,538,206
Automobiles and trucks 95,646,079 57,251,932 1,751,000 151,147,011 25-20 38,229,108 18,961,811 1,751,000 55,439,919 95,707,092
Office equipment 66,914,838 12,606,834 190,000 79,331,672 10-12.5 35,985,725 7,514,769 82,458 43,418,036 35,913,636Furniture and fixtures 18,829,261 630,800 - 19,460,061 5 7,870,875 846,153 - 8,717,028 10,743,033Total 2009 1,563,562,661 542,273,035 1,941,000 2,103,894,696 427,663,221 108,529,621 1,836,500 534,356,342 1,569,538,354
Total 2008 1,277,046,077 287,044,584 528,000 1,563,562,661 349,217,326 78,973,895 528,000 427,663,221 1,135,899,440

4.a.4 The freehold land and buildings have been revalued by a firm of professional valuers and the increase in net carrying amount as a result of revaluation has been shown as additions/revaluations in the year 1995.
7.a Consolidated Investment Detail of the above amount is given as under:
1 Ordinary Share of Tk. 1,000,000/- in Central Depository Bangladesh Ltd. 1,000,000 1,000,000 1,000,000 1,560 Ordinary Shares of Tk. 100/- Each in BRAC Bank Limited 1,072,500 1,107,012 1,111,906 2,000 Ordinary Shares of Tk. 100/- each in Eastland Insurance Company Ltd. - - 2,340,103 2,457 Ordinary Shares of Tk. 100/-each in Social Investment Bank Ltd. 756,756 465,689 348,689 4,680 Ordinary Shares of Tk. 100/-each in Al-Arafa Islamic Bank Ltd. 2,509,650 1,397,568 1,397,568 3,150 Ordinary Shares of Tk. 100/- each in EXIM Bank Ltd. 1,177,313 882,717 882,717 12,000 Ordinary Shares of Tk. 10/- each in Square Textile Ltd. 1,336,800 1,296,772 1,296,771 1,080 Ordinary Shares of Tk. 100/- each in Green Delta Insurance Company Ltd. 1,803,330 1,008,553 - 3,000 Ordinary Shares of Tk. 100/- each in ICB AMCL 2nd NRB Mutual Fund. 558,000 547,682 - 1,257 Ordinary Shares of Tk. 100/- each in United Leasing Company Ltd. 1,668,700 578,923 578,923 2,000 Ordinary Shares of Tk. 10/- each in Bata Shoe Company Bangladesh Ltd. 1,056,600 264,500 264,500 2,666 Ordinary Shares of Tk. 10/- each in Atlas Bangladesh Ltd. 1,045,072 396,529 396,529 13,935 Ordinary Shares of Tk. 100/- each in Square Pharmaceuticals Ltd. 40,080,544 15,744,088 10,917,248 4,350 Ordinary Shares of Tk. 100/- each in Laferge Surma Cement Ltd. 2,196,750 2,207,000 2,207,000
56,262,015 26,897,033 22,741,954
Market value2009 2009
Book value2008
5.a Consolidated capital work in-progress 2009 2008
Opening Balance 601,796,838 308,056,367Add:Addition during the year 677,440,000 580,785,055 1,279,236,838 888,841,422Less: Capitalised as property, plant and equipment 542,273,035 287,044,584 736,963,803 601,796,838
Figures in Taka
Figures in Taka

8.a Consolidated inventories 2009 2008
Finished goods -Pharmaceutical (Unit-1) 351,714,028 186,994,030 -Premix (Unit-2) 166,438,190 133,221,551 -Contract Manufacturing (Unit-3) - 1,114,200 -Potent Product Facility (Unit-4) 14,616,205 9,085,198 532,768,423 330,414,979Work-in-progress 70,578,009 57,946,757Raw materials 65,690,623 81,431,767Bulk materials 103,773,861 120,689,523Packing materials 62,898,497 74,911,011Raw and packaging materials-Premix (Unit-2) 56,102,900 37,847,322Raw and packaging materials-Contract-manufacturing (Unit-3) 7,533,464 6,299,092Raw and packaging materials-Potent products (Unit-4) 16,566,688 12,527,534Consumable stores and spares 5,325,749 14,624,527Less: Provision for slow moving and obsolete items (15,558,619) -Stock-in transit 169,630,986 222,722,078Stock - Purnava Limited 11,752,432 21,806,568Stock - Renata Agro Industries Limited 46,362,828 27,061,177 1,133,425,841 1,008,282,335
All present and future stocks of Renata Limited are kept as security against short term bank loan (Note-17).
9.a Consolidated trade and other receivables 2009 2008
Trade debtors (Notes-9.a.1) 197,567,472 234,544,940Less: Provision for doubtful debts 7,783,388 8,068,662Trade debtors considered good 189,784,084 226,476,278Sundry debtors - considered good 63,591,178 40,783,626Value Added Tax (VAT) recoverable 86,697,246 55,235,278 340,072,508 322,495,182
All present and future debtors of Renata Limited are kept as security against short term bank loan (Note-17).
9.a.1 Trade debtors Debts due below six months 110,250,646 91,300,090Debts due over six months 87,316,826 143,244,850 197,567,472 234,544,940
Figures in Taka
Figures in Taka

16.a Consolidated deferred tax liability
Renata Agro Industries Limited, subsidiary of Renata limited, is enjoying tax exemption; as such no deferred tax adjustments has been considered.
Since Purnava Limited just started trial operation, no deferred tax adjustment has been considered.
17.a Consolidated short term bank loans Limit 2009 2008
Overdraft accounts with: Eastern Bank Limited, Dhaka 375,000,000 224,935,217 145,122,154The Hongkong and Shanghai Banking Corporation Ltd., Dhaka 680,000,000 86,474,899 301,489,000Standard Chartered Bank, Dhaka 625,000,000 332,160,761 205,473,714Citibank, N.A., Dhaka 270,000,000 150,853,743 171,078,747 1,950,000,000 794,424,620 823,163,615
18.a Consolidated other payables
Workers’ profit participation fund 101,784,623 73,983,348Others 151,524,596 18,249,365 253,309,219 92,232,713
10.a Consolidated advances, deposits and prepayments
2009 2008
Advances:For inventories 2,612,482 7,285,613To employees 59,556,707 50,402,007 62,169,189 57,687,620
Deposits and prepayments:Security deposits 9,690,858 9,809,595Prepaid expenses 10,220,851 12,830,044Other advances 4,290,684 3,688,391 24,202,393 26,328,030 86,371,582 84,015,650
11.a Consolidated cash and cash equivalent
Cash in hand 2,440,210 1,355,840Cash at bank 167,823,115 141,433,877 170,263,325 142,789,717
Figures in Taka
Figures in Taka

20.a Consolidated turnover 2009 2008
Non-tax holiday (unit 1, 2 & 3) Pharmaceutical products 2,812,225,147 2,273,271,291 Animal health products 445,834,466 353,866,196 Animal nutritional products (Premix) 380,921,700 306,703,184 Contact manufacturing 24,619,708 24,352,730 3,663,601,021 2,958,193,401Tax holiday (Unit-4): Potent product facility 224,987,880 131,553,016 3,88,588,901 3,089,746,417Renata Agro Industries Limited-Products 214,005,874 113,482,663 4,102,594,775 3,203,229,080
21.a Consolidated cost of goods sold 2009 2008
Opening stock of finished goods 330,414,979 222,699,701Add: Cost of goods manufactured 2,035,797,564 1,674,396,349Cost of finished goods purchased 112,707,309 54,826,900 2,478,919,852 1,951,922,950Less: Closing stock of finished goods 532,768,423 330,414,979 1,946,151,429 1,621,507,971
19.a Consolidated Provision for taxation
2009 2008
Opening balance 147,031,623 93,955,788Add: Provision for current year 190,865,842 166,444,936 337,897,465 260,400,724Less: Tax paid during the year 163,711,507 113,369,101Closing balance 174,185,958 147,031,623
Renata Agro Industries Limited, a subsidiary of Renata Limited, is enjoying tax exemption hence no tax provision has been made on its profit.
Figures in Taka
Figures in Taka
Figures in Taka

24.a Consolidated basic earnings per share (EPS)
2009 2008 The computation of EPS is given below
Earnings attributable to the ordinary shareholders (Group profit for the year) 660,116,488 438,666,536Weighted average number of ordinary shares outstanding during the year 1,445,984 1,445,984Basic Earning Per Share (EPS) 456.52 303.37
23.a Consolidated administrative, selling and distribution expenses
2009 2008
Salaries, wages and allowances 393,785,455 309,137,629Contribution to Provident Fund 7,908,334 6,827,002Gratuity 18,612,400 13,680,000Fuel and power 14,747,692 14,514,843Rent, rates and taxes 18,697,443 22,786,777Insurance 10,444,646 8,880,847Travelling, moving and entertainment expenses 181,855,707 150,494,890Repairs and maintenances 12,171,853 10,361,902Legal and professional expenses 1,901,105 321,743Audit fee 390,000 330,000Directors' fee 310,000 870,000Membership fees and subscription 4,216,288 4,870,107Meeting and corporate expenses 25,548,324 21,524,659Advertising and sales promotion 180,313,571 77,757,338Field expenses 73,118,149 58,628,109Depreciation 24,076,278 18,136,075Printing and stationery 12,904,617 10,289,978Postage, telex, fax and telephone 17,972,164 15,018,557Distribution freight 89,368,057 77,815,719Lunch, Snacks, Tea and Welfare expenses 26,601,479 23,128,217Other overhead expenses 21,580,837 14,689,826 1,136,524,399 860,064,218
Figures in Taka
Figures in Taka