Annual Report 2008-09 - ICICI Prulife
200
Annual Report 2008-09 l e a r n • a d a p t • s t r e n g t h e n e a r n • d a • s t r n h n
Transcript of Annual Report 2008-09 - ICICI Prulife

ICICI PRUDENTIAL LIFE INSURANCE COMPANY LIMITEDRegistered Office: ICICI PruLife Towers, 1089 Appasaheb Marathe Marg, Prabhadevi, Mumbai 400 025.
Tel: +91-22-4039 1600 or visit us at www.iciciprulife.com
Annual Report 2008-09
learn • adapt • strengthenearn• da •str nh
n
An
nu
al Rep
ort 2008-09
ICICI PRUDENTIAL LIFE IN
SURANCE COM
PANY LIM
ITED
ICICI PRU AR09_COVER.indd 1ICICI PRU AR09_COVER.indd 1 11/7/09 11:43:10 AM11/7/09 11:43:10 AM

VISION
To be the dominant Life, Health & Pensions player
built on trust by world-class people & service.
Awards & Accolades
Life Insurance Company of the Year
ICICI Prudential Life was awarded the Life Insurance Company of the Year at the
12th Asia Insurance Industry Awards 2008.
Brand Equity Most Trusted Brands 2009
ICICI Prudential Life ranked as the Most Trusted Pvt Life Insurance brand in The Economic Times - Brand Equity Most Trusted Brands 2009 survey.
Best Life Insurer-Runner Up
ICICI Prudential Life Insurance was declared Runner Up in the Best Life Insurer category at the
Outlook Money & NDTV Profit Awards 2008.
ICAI Award for Excellence in Financial Reporting
ICICI Prudential Life Insurance was awarded with the coveted ICAI Award for Excellence in Financial Reporting under the Insurance
sector category by the Institute of Chartered Accountants of India (ICAI) for the financial year ended March 31, 2008.
UK Trade & Investment India Business Awards 2008
ICICI Prudential Life won the UK Trade & Investment India Business Awards 2008 in the Business Partnership
Award-Large Company category
Bronze Effies in the Sevices Catgeory
ICICI Prudential Life won two Bronze Effies for advertising effectiveness in the sevices category.
Brand Excellence in Banking and Financial services
ICICI Prudential Life won the Award for Brand Excellence in the Banking and Financial Services category at
the Asia Brand Congress 2008.
HR Excellence Award 2008
Confederation of Indian Industry (CII) - Western Region awarded ICICI Prudential Life a Commendation for Strong
Commitment to HR Excellence 2008
SAP-ACE 2008 Award for Best Business Objects Implementation
ICICI Prudential Life was awarded the SAP-ACE 2008 Best Business Objects Award for its IT practices.
ICICI PRU AR09_COVER.indd 2ICICI PRU AR09_COVER.indd 2 11/7/09 11:43:12 AM11/7/09 11:43:12 AM

CONTENTS
CORPORATE REPORT
From the CEO’s Desk............................................................02
Board of Directors .................................................................04
Board Committees ................................................................06
Towards Continuous Excellence ...........................................10
• Retaining Trust ................................................................10
• Customer First ................................................................13
• Managing Risks ...............................................................16
BUSINESS REPORT
Adapting to Change ..............................................................20
Empowering People .............................................................23
FINANCIAL REPORT
Directors’ Report ...................................................................28
Management Report .............................................................33
Corporate Governance ..........................................................39
Management Discussion & Analysis .....................................50
Auditors’ Report ....................................................................60
Financial Statements .............................................................62
New Business Profit............................................................193
What sets a leader apart, is its innate ability
and willingness to rise to the opportunities the
environment presents. Over the years, ICICI Prudential
Life has been able to stand strong, learn from
changes in its environment and adopt the learnings
to strengthen its fundamentals. Its intrinsic culture of
learning, adapting and strengthening has enabled the
company to translate the changes into opportunities
leading to a more sustainable future. learn • adapt • strengthen
ICICI PRU AR09_Final Pg01-28.indd Sec1:1ICICI PRU AR09_Final Pg01-28.indd Sec1:1 10/28/09 5:58:57 PM10/28/09 5:58:57 PM

CORPORATE REPORT
I 2 I
From the CEO’s Desk
The foundations of the company are strong: excellent people, robust systems and quality customer service. This will form the bedrock for growth in the future.
It is fair to expect such an excellent franchise to deliver profitability…we will not hesitate to do all that is required to quickly move to the path to profitability.
V. Vaidyanathan › Managing Director & CEO
Dear Shareholders,The fi nancial year 2009 will no doubt go down in our memories as one of the most eventful years we have experienced in our lifetime. What started as a fi nancial crisis in the US turned into an economic crisis and a spiral began that buffeted markets across the globe. India too felt the impact, as exports slowed, and the fl ow of dollars abated. Fortunately, the Indian fi nancial system held up quite well. If anything, the Indian stock market settlement systems and the fi nancial system as a whole got stress- tested, and came out in
good shape.
Yet, the volatile economic scenario and the fl uctuating markets took consumers by surprise, who in turn became
apprehensive about their investments. Though insurance is about protection, a large part of insurance sales is tied to investments, i.e. these are unit linked. We faced a few challenges in the bumpy markets–basically weak customer sentiments and low confi dence levels. We responded by adopting a strategy comprising of high engagement with our customers. We were among the very few insurance companies in India to go out and meet customers and distributors, alike during this period, and advised them to stay committed to a long term plan. To our surprise, we received their appreciation for meeting them when the markets were rough.
We recognise we are in the business of trust. Our ability to deliver our promise to customers, partners and stakeholders has been richly rewarded, as reflected in our
ICICI PRU AR09_Final Pg01-28.indd Sec4:2ICICI PRU AR09_Final Pg01-28.indd Sec4:2 10/28/09 5:58:58 PM10/28/09 5:58:58 PM

I 3 I
ANNUAL REPORT 2008-09ICICI PRUDENTIAL LIFE INSURANCE
strong renewal infl ows. We were also the fi rst Indian life insurance company to receive the ‘Life Insurance Company of the Year’ award at the Asia Insurance Industry Awards 2008. Our customer service standards are among the fi nest in the industry. We are a strong brand built on trust and quality customer service, and we are committed to keep it this way.
Looking ahead, the future looks brighter. Global issues are ebbing as we speak, and India looks to resume its long term growth path. As India grows, so will the need for protection. India is very short on long-term social security, and this is a big opportunity in itself. With increasing private sector job opportunities, coupled with the increase in number of self-employed, the need for pensions will only increase. Health in the best of times is an uncertainty, kids’ education is increasingly expensive, and hence these present large opportunities for insurance. Insurance is a latent need, but a need it is for sure. We will work out innovative ways of making people discover this need, and we believe this will be the key to opening up the market.
The foundations of the company are strong: excellent people, robust systems and quality customer service. This will form the bedrock for growth in the future.
It is fair to expect such an excellent franchise to deliver profi tability, and to be self-sustaining. The expense structure of the industry and for our company will require some rethink, and we will not hesitate to
do all that is required to quickly move to the path to profi tability, while eliminating expense overruns. While we will continue to focus on growth, such opportunities will be put to test against minimum boundary conditions of profitability and control. Interestingly, it is possible to increase customer service and reduce costs at the same time as demonstrated by the banking world as they moved from physical to electronic to mobile banking.
We also recognise we have to think long term at every stage, whether it is our market practices, people practices, or our core business model. Every decision we make on these counts will necessarily pass through the “long-term sustainability” fi lter. We will continue to keep our consumers’ interest in the forefront while designing these practices. After all, only if our customers are happy will we be able to grow from strength to strength.
I look forward to developing a strong, stable and profi table franchise in the years to come, and to celebrating many more milestones with you. I look forward to your support.
With warm regards,
V. Vaidyanathan
Managing Director & CEO
ICICI PRU AR09_Final Pg01-28.indd Sec4:3ICICI PRU AR09_Final Pg01-28.indd Sec4:3 10/28/09 5:59:00 PM10/28/09 5:59:00 PM

CORPORATE REPORT
I 4 I
Ms. Chanda D. KochharChairperson
Mr. Barry StoweDirector
Board of Directors
Mr. N. S. KannanDirector
Mr. K. RamkumarDirector
Mr. Adrian O’ConnorDirector
ICICI PRU AR09_Final Pg01-28.indd Sec4:4ICICI PRU AR09_Final Pg01-28.indd Sec4:4 10/28/09 5:59:00 PM10/28/09 5:59:00 PM

I 5 I
ANNUAL REPORT 2008-09ICICI PRUDENTIAL LIFE INSURANCE
Mr. V. VaidyanathanManaging Director & CEO
Mr. Vinod Kumar DhallIndependent Director
Ms. Rama BijapurkarIndependent Director
Mr. Keki DadisethIndependent Director
Prof. Marti G. Subrahmanyam Independent Director
ICICI PRU AR09_Final Pg01-28.indd Sec4:5ICICI PRU AR09_Final Pg01-28.indd Sec4:5 10/28/09 5:59:02 PM10/28/09 5:59:02 PM

CORPORATE REPORT
I 6 I
Board Committees
Mr. Keki Dadiseth Chairman
Mr. K. Ramkumar
Mr. Adrian O’Connor
BOARD INVESTMENT COMMITTEE:
BOARD RISK MANAGEMENT & AUDIT COMMITTEE:
Prof. Marti G. SubrahmanyamChairman
Mr. N. S. Kannan
Mr. Adrian O’Connor
Mr. V. Vaidyanathan
Mr. Puneet Nanda
Dr. Avijit Chatterjee
Mr. Manish Kumar
ICICI PRU AR09_Final Pg01-28.indd Sec4:6ICICI PRU AR09_Final Pg01-28.indd Sec4:6 10/28/09 5:59:04 PM10/28/09 5:59:04 PM

I 7 I
ANNUAL REPORT 2008-09ICICI PRUDENTIAL LIFE INSURANCE
BOARD COMPENSATION & NOMINATIONS COMMITTEE:
SHARE TRANSFER COMMITTEE:
Ms. Rama Bijapurkar Chairperson
Prof. Marti G. Subrahmanyam
Mr. Vinod Kumar Dhall
Mr. K. Ramkumar
Mr. Adrian O’Connor
Mr. Vinod Kumar Dhall Chairman
Mr. Keki Dadiseth
Mr. V. Vaidyanathan
ICICI PRU AR09_Final Pg01-28.indd Sec4:7ICICI PRU AR09_Final Pg01-28.indd Sec4:7 10/28/09 5:59:04 PM10/28/09 5:59:04 PM

CORPORATE REPORT
I 8 I
is
CORPORATE REPORT
Learning
ICICI PRU AR09_Final Pg01-28.indd Sec4:8ICICI PRU AR09_Final Pg01-28.indd Sec4:8 10/28/09 5:59:04 PM10/28/09 5:59:04 PM

continuousaprocess...
ICICI Prudential Life has been able to anticipate, prepare and learn from changes in the business environment. The company has successfully translated these changes into avenues of learning, which has helped it move from strength to strength.
ICICI PRU AR09_Final Pg01-28.indd Sec4:9ICICI PRU AR09_Final Pg01-28.indd Sec4:9 10/28/09 5:59:06 PM10/28/09 5:59:06 PM

I 10 I
CORPORATE REPORT
Puneet Nanda › Executive Vice President
Towards Continuous Excellence
Success goes to the company that is able to build a bond of trust with its customers; trust that emerges from being in close proximity with the consumers, from being transparent in its interactions with customers, from being financially solid and above all being a known and credible brand.
Retaining TrustWhile fi nancial strength and a powerful brand attract customers to ICICI Prudential Life, it is trust that keeps them with the company. And hence, success goes to the company that is able to build a bond of trust with its customers; trust that emerges from being in close proximity with the consumers, from being transparent in its interactions with customers, from being fi nancially solid and above all being a known and credible brand.
An adaptive & proactive DNAFinancial year 2009 presented a paradigm which tested the company’s mettle. It presented a challenging environment for sure, but the company has a DNA which is adaptive and more importantly proactive. The volatility in the Indian equity markets affected the sentiments
of the retail consumers who either withdrew or withheld
their investments in life insurance plans. ICICI Prudential Life realised the need to address its customers’ concerns and hence proactively set out to empower them with the right knowledge, thereby enabling them to ride over the volatility. The company was quick to learn from the challenges and designed specifi c products and services to enable consumers continue their investments towards their long-term fi nancial needs. Further, the company also enhanced its engagement with its distribution partners and invested signifi cantly towards training and re-skilling its partners to cope with the changed consumer mindset.
Strong & stable financial baseWhile it is critical to be in close proximity with the consumers, it is equally important to have a solid financial infrastructure that emerges from being fundamentally strong and stable. With continuous support from ICICI Bank and Prudential
ICICI PRU AR09_Final Pg01-28.indd Sec4:10ICICI PRU AR09_Final Pg01-28.indd Sec4:10 10/28/09 5:59:07 PM10/28/09 5:59:07 PM

I 11 I
ANNUAL REPORT 2008-09ICICI PRUDENTIAL LIFE INSURANCE
plc, the company remained one of the highest capitalised life insurers in India with an infused capital of Rs 47.80 billion. For consumers, this large capital base is another measure of the strength of the company. Today, ICICI Prudential Life is also one of the top managers of retail wealth with a strong asset base.
Its investment philosophy of safety, stability & long-term returns to the policyholders, has consistently resulted in the company’s funds outperforming their benchmark indices, by signifi cant margins both during bullish and volatile phases.
Strong consumer commitmentIts sustained competitive edge can be seen through a continued consumer commitment to the brand and its various achievements through the year.
• The company’s renewal premiums, one of the key indicators of customers’ loyalty towards the brand, have shown a robust growth of 61%
• Customers’ trust in the brand was also refl ected with a market share of over 10% – testimony to the company’s leadership
Fund Performance
BenchmarkFund
0%
4%
8%
12%
16%
20%
Preserver Protector Balancer Maximiser
6.39
% 7.56
%
5.96
% 6.96
%
9.68
% 11.9
3%
14.8
6%19
.06%
Benchmarks:Preserver Fund – CRISIL Liquid Fund Index
Protector Fund – CRISIL Composite Bond Index
Balancer Fund – 65% CRISIL Composite Bond Index + 35% BSE 100
Maximiser Fund – BSE 100
Inception Dates:Preserver Fund – May 17, 2004
Protector Fund – April 2, 2002
Balancer Fund – April 2, 2002
Maximiser Fund – November 16, 2001Retail life funds: since inception for period ended March 31, 2009
Renewal Premium
Strong growth in renewal premiums
FY09FY04 FY05 FY06
Rs. i
n bi
llion
FY07 FY080
15
30
45
60
75
90
5 Yea
rs CAGR –
106%
88.72
55.26
27.51
16.59
7.792.38
ICICI PRU AR09_Final Pg01-28.indd Sec4:11ICICI PRU AR09_Final Pg01-28.indd Sec4:11 10/28/09 5:59:08 PM10/28/09 5:59:08 PM

CORPORATE REPORT
I 12 I
• A strong asset base of over Rs 327 billion makes ICICI Prudential Life one of the top retail asset managers in the country
• Research shows that the company also has the highest recall value and consideration to buy among private insurance players
Since ICICI Prudential Life started its business in 2000, the company has built a strong foundation and rapidly scaled up its product portfolio, distribution, service and fund management capabilities which have helped the company sustain leadership in the industry, since inception. As the environment evolves, we will continue to build and enhance all the capabilities needed to achieve our aspiration of focussing on growth with effi ciency. We are confi dent that this will enable us to outperform in the years to come and we look forward to the future with excitement.
Towards Continuous Excellence
Figur
es in
%
0
21
42
63
84
105 10095
99
37
9797
30
92
12
91
11
89
14
82
10
81
5
LIC ICICI Prudential HDFC Standard Bajaj Allianz Reliance Life SBI Life Birla Sun Life Aviva Life Max New York Life Metlife
Total AwarnessConsideration
53
91
31
Brand Saliency and Purchase Consideration
Consumer mindshare on brand awareness and consideration
Rs in
billi
on
FY09FY04 FY05 FY06 FY07 FY080
70
140
210
280
350EquityDebt
13.283.35 27.8310.48
42.5
245
.69
63.1
095
.09
92.3
6 166.
50
193.
42
161.
38
16.6338.31
88.21
158.18
285.78
327.88
Assets Held
Strong renewal flow leading to an expanding asset base
Source: IMRB / Millward Brown Dynamic Tracking
ICICI PRU AR09_Final Pg01-28.indd Sec4:12ICICI PRU AR09_Final Pg01-28.indd Sec4:12 10/28/09 5:59:09 PM10/28/09 5:59:09 PM

I 13 I
ANNUAL REPORT 2008-09ICICI PRUDENTIAL LIFE INSURANCE
Customer FirstICICI Prudential Life’s journey of growth and leadership is one that has been built not on trust alone but also on customer centricity. The company’s philosophy of customer-centricity continues to guide it, while introducing effective insurance solutions or while launching simple yet effective services for its customers.
Convenience: a key to world class service experienceThe company’s philosophy of customer centricity led it to continuously invest towards providing its customers with easy access, convenience of transaction and set new standards of customer service.
• ICICI Prudentia l Life leveraged technology to provide services that enhance the consumer’s experience with the brand – be it offering services through the internet, mobile networks or other self service options
• Partnered with various organizations to offer over 10,000 customer touch points, a 24x7 helpline and a wellness program for its health insurance customers
When the Indian fi nancial sector began to feel the effects of the overseas fi nancial crisis, the company quickly adopted a strong two-pronged strategy to ride over the volatility.
Reassure consumers with relevant productsThe primary challenge the company faced during the volatile times, was to convince the retail investor of the safety of their savings invested in life insurance, thereby protecting their long term fi nancial goals. Understanding the underlying need for security, the company was quick to respond to the situation.
• Introduced various return guarantee options, to cushion the investor’s savings and enable them to continue to invest
Anita Pai › Executive Vice President
ICICI Prudential Life’s journey of growth and
leadership is one that has been built not on
trust alone but also on customer centricity ...a
philosophy of customer centricity that has led it
to set new standards of customer service.
ICICI PRU AR09_Final Pg01-28.indd Sec4:13ICICI PRU AR09_Final Pg01-28.indd Sec4:13 10/28/09 5:59:09 PM10/28/09 5:59:09 PM

CORPORATE REPORT
I 14 I
towards their long-term fi nancial goals, without the risk of a downside
Educating during the changing economic scenarioRealising that weak sentiment was resulting in investors becoming hesitant to save through market-linked life insurance products, the company directed its efforts towards reassuring its customers. To ensure consumers were well informed, the company adopted various routes to communicate to its consumers.
• Organised various interactive customer education forums bringing together the company’s high net-worth customers and its senior management, to effectively deal with weak customer sentiments, by assuring and advising them of the safety of their investments
• Communicated effectively through personalised letters to its customers. Imparted appropriate training to all relevant customer touchpoints – partners and advisors alike, on how to handle sensitive customer queries
• The changed environment meant that consumers were seeking re-assurance and the right guidance to tide over the volatile equity markets. This clearly refl ected in the advertisement campaigns and the mass media initiatives that ICICI Prudential Life launched in the year
All these clearly held ICICI Prudential Life in a good stead with its customers and today the company has the recognition of having the highest brand awareness and consideration amongst private life insurers.
Product range that addresses needs across life stages
• Savings for Wealth creation.
Age 25 - 30
Young and single Married Married with young children
Married with grown up children Retired
Age 30 - 35 Age 35 - 40 Age 40 - 55 Age 55+
• Insurance against liabilities
• Pure protection (health + life)
• Savings for wealth creation
• Insurance against liabilities
• Children’s education
• Savings for child’s marriage
• Retirement planning
• Health insurance
• Children’s higher studies
• Mortgage insurance
• Health insurance
• Retirement planning
• Post-retirement living expenses - Annuities
• Medical expenses
Towards Continuous Excellence
ICICI PRU AR09_Final Pg01-28.indd Sec4:14ICICI PRU AR09_Final Pg01-28.indd Sec4:14 10/28/09 5:59:09 PM10/28/09 5:59:09 PM

I 15 I
ANNUAL REPORT 2008-09ICICI PRUDENTIAL LIFE INSURANCE
Effective services in rural IndiaWith an established presence in rural India, it was essential to offer this consumer segment effective service options at par with their urban counterparts, services that they could relate to.
• To empower its rural customers and offer them various premium payment gateways, ICICI Prudential Life partnered with relevant local institutions
• It regionalised all communication for this consumer segment, including call centre assistance, sales literature, etc.
• Launched exclusive service camps in rural areas
All these initiatives clearly translated into building a superior brand, creating great products, simplifying processes and providing the customer with multiple access points to be in close proximity with the company. It further strengthened ICICI
Prudential Life’s consumer base and their trust in the brand.
Today, the company has successfully issued over 9 million policies to customers across the country and has been recognized as the Most Trusted Brand amongst private life insurers by The Economic Times - Brand Equity Most Trusted Brands 2009 survey - a testimony to the success of ICICI Prudential Life’s customer centric initiatives.
Mar2009
Mar2005
Mar2006
In m
illion
sMar2007
Mar2008
0
2
4
6
8
10 9.6
4.2
2.21.7
7.0
Exponential increase in policy base re-affirming consumer trust
Policies
ICICI PRU AR09_Final Pg01-28.indd Sec4:15ICICI PRU AR09_Final Pg01-28.indd Sec4:15 10/28/09 5:59:10 PM10/28/09 5:59:10 PM

CORPORATE REPORT
I 16 I
Towards Continuous Excellence
Managing RisksAs ICICI Prudential Life drives itself to generate prof i table growth, the company has also set out to implement a comprehensive risk management process over the course of the year. An Executive Risk Committee was set up to identify and implement best practices in the area of risk management. The risks faced by the company are classified into three categories – investments risks, insurance risks and operational risks. The Executive Risk Committee’s function is to identify, monitor, manage and control the risks in each of these categories.
For the purpose of measuring and monitoring of the insurance and investment risks, the company has developed a risk dashboard for its management committee. The dashboard provides a single view of the
exposure of the different lines of business to the various risks. The dashboard quantifi es risks to its statutory and economic balance sheets
by applying shocks to the assets and liabilities. The shocks to the economic balance sheet are based on the standard model shocks as advised by the CEIOPS as part of the ongoing consultation process for Solvency II. The shocks to the statutory balance sheet are derived from the shocks applied to the economic balance sheet.
During the fi nancial year 2009, signifi cant attention was paid to identifying, measuring and reporting operational risks. Operational risks are based on identifying ‘those things that can go wrong’. Key operational risks are reported to the management committee through the dashboard on a monthly basis. Key business practice risks are further consolidated into a sourcing channel-wise operational risk score to track risk trends at a channel and company level.
Financial highlights• The company experienced significant
reduction in its expense ratio, which dropped from 14.9% in the fi nancial year 2008 to 11.8% in fi nancial year 2009
As ICICI Prudential Life drives itself to generate profitable growth, the company has also set out to implement a comprehensive risk management process over the course of the year.
Dr. Avijit Chatterjee › Appointed Actuary
ICICI PRU AR09_Final Pg01-28.indd Sec4:16ICICI PRU AR09_Final Pg01-28.indd Sec4:16 10/28/09 5:59:10 PM10/28/09 5:59:10 PM

I 17 I
ANNUAL REPORT 2008-09ICICI PRUDENTIAL LIFE INSURANCE
Significant decline in expense ratio
Expense Ratio
FY09FY04 FY05 FY06 FY07 FY0810
14
18
22
26
30
26.0
17.3
13.8
14.0
11.8
14.9
Figu
res
in %
• ICICI Prudential Life’s statutory losses also saw a decrease from Rs 13.95 billion in fi nancial year 2008 to Rs 7.80 billion in fi nancial year 2009
• The company’s New Business Profit (NBP) stood at Rs 10.04 billion for fi nancial year 2009, resulting in a stable new business margin of 18.9%
While ICICI Prudential Life continued to stay ahead of competition, there were peaks and troughs. With policyholders turning risk averse, new business premium fl ows slowed down and for the fi rst time in the history of the company, the APE declined by 19%. However, the company was quick to adapt and implemented strategies conducive to the changed environment.
Product developmentOne particular response to the fi nancial turbulence was to launch the Return Guarantee Fund. This fund offers a guaranteed return after fi ve years and is available across a wide range of group
and retail products, and to both new and existing policyholders.
Another move was to continue to develop the company’s health insurance portfolio. The company launched Health Saver, a unique product proposition: it combines regular savings in a unit linked platform with long-term health insurance on a reimbursement basis, all covered under section 80D of the Income Tax Act.
Annualised Premium Equivalent
Marginal decline in new business
Rs in
billi
on
FY09FY04 FY05 FY06 FY07 FY080
14
28
42
56
70
53.02
65.19
43.81
21.63
12.56
7.06
10.04
12.54
8.81
5.28
3.122.04
FY09FY04 FY05 FY06 FY07 FY080
3
6
9
12
15
Rs in
billi
on
FY 2009 NBP margin at 18.9%
Continued focus on stable margins
New Business Profit
ICICI PRU AR09_Final Pg01-28.indd Sec4:17ICICI PRU AR09_Final Pg01-28.indd Sec4:17 10/28/09 5:59:11 PM10/28/09 5:59:11 PM

BUSINESS REPORT
I 18 I
SuccessThe key to
ICICI PRU AR09_Final Pg01-28.indd Sec4:18ICICI PRU AR09_Final Pg01-28.indd Sec4:18 10/28/09 5:59:11 PM10/28/09 5:59:11 PM

Being adaptive is a part of ICICI Prudential Life’s DNA. The company has been able to adopt its learnings and respond to change by translating its experience into actionable initiatives, thereby taking the company ahead in its journey towards excellence. The company’s ability to adapt and capitalize on the opportunities is the hallmark of its success.
is the ability to
Adaptto change
ICICI PRU AR09_Final Pg01-28.indd Sec4:19ICICI PRU AR09_Final Pg01-28.indd Sec4:19 10/28/09 5:59:13 PM10/28/09 5:59:13 PM

BUSINESS REPORT
I 20 I
markets at that time. Next, understanding the underlying need of security, especially during volatility, the company introduced various return guarantee options. Further, ICICI Prudential Life initiated consumer engagement programs to empower its customers with the right knowledge about the company, investment options and the markets.
While a return guarantee product such as LifeStage Assure was a boon for new customers, the company felt the need to go beyond and protect the investments of its existing policyholders, thereby leading to the launch of Return Guarantee Fund (RGF). ICICI Prudential Life became the only life insurance company to launch a fund that benefi ted both the new and the old customers alike by giving them a choice of guarantee across all product categories, be it retirement, child or wealth products. RGF proved to be a huge success and garnered over Rs 8 billion, in less than 3 months of its launch.
Adapting to Change
The uncertainty in the world’s financial markets in the fi nancial year 2009, touched the shores of nearly every country, and India with its increasing global linkages certainly felt the effects. Customers turned risk averse and their preferences changed as they started looking for assured returns. ICICI Prudential Life immediately responded by adopting a strategy that offered relevant products and high consumer engagement, to retain and strengthen the confi dence consumers’ had in the brand.
Responding to the changing environmentWith markets becoming volatile, consumers felt safe holding on to cash rather than investing it. In fact, many consumers were even apprehensive to pay towards their existing policies, thereby damaging the long-term benefi ts they offered. Keeping in mind the ability of life insurance to help consumers meet their long-term financial goals, ICICI Prudential Life began by informing consumers on the benefi ts of investing in the
Securing lives through a comprehensive product portfolio
ICICI PRU AR09_Final Pg01-28.indd Sec4:20ICICI PRU AR09_Final Pg01-28.indd Sec4:20 10/28/09 5:59:14 PM10/28/09 5:59:14 PM

I 21 I
ANNUAL REPORT 2008-09ICICI PRUDENTIAL LIFE INSURANCE
Keeping in mind the need to communicate continuously with its consumers and distributors alike, ICICI Prudential Life:
• Launched Winning Moves, where the senior management met key customers, across India to respond to all the queries they may have on their investments with the company
Winning Moves was further extended to a larger base of customers through teleconference calls
• Leveraged its existing partnership with a leading business television channel through, ‘Forever Young’ to advice consumers on fi nancial planning, especially during volatile times
• Focused on communicat ing the benefi ts of long term goal based savings through its specific advertisement campaigns
• The company invested in training and re-skilling its sales force and distribution partners to empower them to handle customer queries effectively
Stronger product portfolio and effective services While the company’s ability to respond to the changed environment was clearly established through its strategic approach, it continued to build its product portfolio and service infrastructure for consumers across India. A Winning Moves forum in progress
Leveraging consumer insights to strengthen health portfolioThe company continued to offer consumers products to cover them at every stage of their lives. It invested in extending the benefi ts of health insurance to consumers. ICICI Prudential Life played on its ability to understand consumers’ pulse and strengthen its already existing world class health insurance portfolio.
• Became the fi rst company to launch a heal th insurance product that combined the benefi ts of hospitalization reimbursement and fund accumulation. Health Saver changed the entire landscape of the health insurance industry in India
• Introduced Health Active, a unique wellness program to guide and help customers lead a healthy life
ICICI PRU AR09_Final Pg01-28.indd Sec4:21ICICI PRU AR09_Final Pg01-28.indd Sec4:21 10/28/09 5:59:15 PM10/28/09 5:59:15 PM

BUSINESS REPORT
I 22 I
Enhancing consumer experienceTechnology-enabled services continued to differentiate ICICI Prudential Life from its competitors. The company effectively util ized mobile and web technology to offer simple yet effective services to its consumers.
• Launched iCLAIM, a fi rst-of-its kind service in the industry, which provides consumers the option to reach out for assistance from the company offi cials and get a prompt resolution, while making claim through a simple SMS
• Launched webchat services and provided premium payment facilities through IVR
• Introduced E-Portfolio statements, a first of its kind service in the life insurance industry, to provide customized e-statement with complete investment details
The success of the deployment of technology, to provide easy access to the customers, can be gauged through t h e h i g h p r e m i u m g a r n e r e d b y the company through its website - www.iciciprulife.com. Over Rs 4.40 billion premium was garnered during FY2009 through its website.
Empowering rural IndiaFinancial year 2009 saw ICICI Prudential Life strengthen its presence and infrastructure in rural India through various unique initiatives. This led to the company to sell over 2 million policies in rural India and become a preferred brand for life insurance in these areas.
• Offered customers an option to pay their premiums in cash, a mode they are most comfortable in
Tied-up with local institutions such as India Post, Suvidha Infoserve, rural banks etc. that enjoy strong equity amongst the rural community
• Organised service camps in key rural locations, to enable consumers get responses to any queries on their policies/investments
• Designed and developed unique marketing initiatives, which rural India could relate to. This included participation in fairs, conducting street plays across various locations, conducting road shows, van activities and wall paintingsReaching out to consumers through service camp
Adapting to Change
ICICI PRU AR09_Final Pg01-28.indd Sec4:22ICICI PRU AR09_Final Pg01-28.indd Sec4:22 10/28/09 5:59:16 PM10/28/09 5:59:16 PM

I 23 I
ANNUAL REPORT 2008-09ICICI PRUDENTIAL LIFE INSURANCE
An interactive session with employees Fun at work
Regular communication through multiple platformsTo address various issues arising out of the changed environment, multiple communication platforms were leveraged to build perspective amongst employees at frequent intervals. Broadly the initiatives maybe categorized as interactive Q&A sessions, face to face meeting with the senior management and circulation of standardized communication packs from top management that reinforced positive messages and recommended strategies to deal with the market reality.
To cascade the key messages and address employee queries, video conferencing and tele-conferencing were arranged between the sales leadership and their teams. This multi pronged communication strategy ensured reach and served a long way in assuaging apprehensions and boosting morale.
Investing in re-skillingpeopleWith the external environment undergoing extensive change, it was critical for employees to adapt to the change with agility and fl exibility. This demanded that the company learn new ways of working and proactively embracing the change itself. ICICI Prudential Life has exemplifi ed the spirit of leadership by embracing change with vigour.
Culture of growth & efficiencyAligning employees to the culture of growth and effi ciency were imperatives for sustaining dominance and ICICI Prudential Life proactively pursued effi ciency improvements in its operations. This necessitated a shift in mind-set. Whilst this was reinforced through communication sessions, employees were also exhorted to identify opportunities to eliminate waste and support in building a sustainable, profi table organization.
Empowering People
ICICI PRU AR09_Final Pg01-28.indd Sec4:23ICICI PRU AR09_Final Pg01-28.indd Sec4:23 10/28/09 5:59:17 PM10/28/09 5:59:17 PM

BUSINESS REPORT
I 24 I
Leadership developmentICICI Prudential Life also invested signifi cantly to re-skill its managers, sales force and advisors with selling strategies in the context of a changed market scenario and convert it into opportunities for business growth and success. Further, there is a robust functional training and certifi cation architecture for building domain competence using face to face and e-learning platforms and over 15,500 employees were certifi ed in the last year.
Over the past eight years, ICICI Prudential Life has striven to hire, train and retain the best talent – passionate, entrepreneurial individuals who have the courage to take bold steps, to challenge status quo, ensuring that the vitality of the organization is never compromised. This effort is testimony of ICICI Prudential Life’s ability to lead through change and script its success story for the future.
Building leaders for tomorrow
Empowering People
Towards communitydevelopmentICICI Prudential Life is also committed to strengthening the community around it by leveraging its resources and expertise for self sustaining activities for the communities it serves. This is achieved through community initiatives, or working within focus areas that are in line with its overall business objectives.
Financial year 2009 saw ICICI Prudential Life develop exclusive life insurance solutions, especially for the lower income segment in India.
• Launched Anmol Nivesh and Sarva Jana Suraksha to help consumers in the lower income group to meet their savings and protection needs, effectively
• The company became the fi rst Indian life insurance company to be offered a special grant by the International Labour Organisation’s Micro Insurance Innovation Facility for Anmol Nivesh, a product designed exclusively for the tea plantation workers in Assam
Keeping in mind that ICICI Prudential Life’s strengths lie in providing fi nancial solutions in the retirement space, the company realised the need to enable holistic post retirement planning.
• Carried the partnership with Dignity Foundation forward through ActivAge.
ICICI PRU AR09_Final Pg01-28.indd Sec4:24ICICI PRU AR09_Final Pg01-28.indd Sec4:24 10/28/09 5:59:19 PM10/28/09 5:59:19 PM

I 25 I
ANNUAL REPORT 2008-09ICICI PRUDENTIAL LIFE INSURANCE
Dignity Foundation is a non profit organization dedicated to the cause of productive ageing. ActivAge is designed to enable senior citizens to lead a more active, wholesome life and age productively
• In sync with the company’s core proposition that life after retirement should be spent meaningfully, it launched www.dignitysecondcareers.org, the fi rst exclusive job portal for senior citizens to commence their second careers
Further, the company also channelized funds towards natural calamities as part of its CSR (Corporate Social Responsibility) initiatives. At ICICI Prudential Life, employees were encouraged to contribute to the cause of rehabilitation for the Bihar fl ood-affected victims. The internal fund raising campaign garnered over Rs 17 million through employee donations and the company matched this collection with an equal contribution, thereby taking the funds to Rs 35.56 million.
Committment towards community development
ICICI PRU AR09_Final Pg01-28.indd Sec4:25ICICI PRU AR09_Final Pg01-28.indd Sec4:25 10/28/09 5:59:19 PM10/28/09 5:59:19 PM

FINANCIAL REPORT
Strengthtomorrow is
Theof
ICICI Prudential Life has been successful in translating present challenges into opportunities. Over the years, it has built an infrastructure for growth and strengthened its foundation for a sustainable future. Today, the company’s brand value is testimony to the fact.
established
ICICI PRU AR09_Final Pg01-28.indd Sec4:26ICICI PRU AR09_Final Pg01-28.indd Sec4:26 10/28/09 5:59:20 PM10/28/09 5:59:20 PM

action of todayon the
ICICI PRU AR09_Final Pg01-28.indd Sec4:27ICICI PRU AR09_Final Pg01-28.indd Sec4:27 10/28/09 5:59:21 PM10/28/09 5:59:21 PM

FINANCIAL REPORT
DIRECTORS’ REPORTYour Directors have pleasure in presenting the Ninth Annual Report of ICICI Prudential Life Insurance Company Limited (the Company) with the audited statement of accounts for the year ended March 31, 2009.
OPERATIONS REVIEW & OUTLOOK
The performance for fiscal 2009 is summarised below:(Rs. in billion)
Particulars Fiscal 2009 Fiscal 2008
Number of new Policies (in 000’s) 2,637 2,913Financials:Premium income of which 153.56 135.61• New business premium (including single premium) 64.84 80.35• Renewal premium 88.72 55.26Profit/(Loss) before taxation (8.81) (15.43)Provision for taxation (deferred tax) 1.01 1.48Profit/Loss after taxation (7.80) (13.96)Sum assured in force –• Basic policy 1,654.35 1,350.73• Total (Basic + Riders) 1,879.02 1,599.95Annualized premium equivalent (APE) 53.02 65.19Assets held 327.88 285.78Expense ratio* 11.8% 14.9%Sales & Distribution Strength:Geographical spread –• Number of offices 2,104 1,956• Number of locations 1,804 1,669Number of advisors (in 000’s) 277 291
* Expense ratio = All expenses (excluding commission and front line sales cost)/(Total premium income - 90% of single premium - 50% of limited pay premium)
During the year ended March 31, 2009, the Company registered total premium income of Rs. 153.56 billion, showing an increase of 13.2% over the earlier year. The Company’s new business premium income stood at Rs. 64.84 billion down by 19.3% over the earlier year. The renewal premiums continue to grow and stood at Rs. 88.72 billion for the year, showing a healthy growth of 60.6% over the earlier year. During the year, the Company crossed the milestone of issuing 9 million policies since inception, with about 2.64 million policy issuances during the year.
OUR REACH
The Company reaches its customers through 2,104 offices in 1,804 locations at March 31, 2009. In addition to this, customers have access to 2,900 offices of our distribution partners. At March 31, 2009, the Company had over 24,400 employees and over 277,000 advisors and is thus well-equipped to cater to the needs of customers.
PRODUCTS
The Company has launched innovative and unique products during the year.
Among these are the Health Saver, a unit linked health insurance policy which is unique in the Indian market. The policyholder pays regular premiums, which qualify under Section 80D of the Income Tax Act, into a unit linked savings policy on which risk charges are levied to cover the cost of hospitalisation on a reimbursement basis. The unit linked fund may also be drawn down to reimburse the policyholder for proven incurred health expenses. The Company has also launched the Return Guarantee Fund (RGF), which consists of a series of closed-ended tranches in each of which
ICICI PRU AR09_Final Pg01-28.indd Sec4:28ICICI PRU AR09_Final Pg01-28.indd Sec4:28 10/28/09 5:59:22 PM10/28/09 5:59:22 PM

I 29 I
ANNUAL REPORT 2008-09ICICI PRUDENTIAL LIFE INSURANCE
the unit price at date of termination is guaranteed. Each tranche is backed with a suitable portfolio of high quality bonds. The RGF is available on retail and group unit linked products.
DIVIDEND
The financial operations have resulted in a loss (after tax) of Rs. 7.80 billion down from Rs. 13.95 billion over the earlier year. The losses are due to new business strain and the setting up of infrastructure that will take time to reach peak production. In view of the loss incurred, the Directors are unable to recommend any dividend.
CLAIMS
The Company believes that every claim is a fulfillment of promise that we have made to our policyholders and we aim to process the claims in the quickest and most transparent manner. The processes are designed to ensure efficient service and the performance metrics are monitored regularly.
During the year, the Company has settled over 10,000 mortality claims. The average time taken from the date of submission of final requirement by the claimant to the dispatch of claim payment was around 7 days.
GOVERNANCE
As a good corporate citizen reflecting the parentage of the shareholders, the Company has institutionalised its governance framework, brief details of which are as follows:
A. BOARD OF DIRECTORS
The Board comprises 12 Directors – three nominated by ICICI Bank Limited, two nominated by Prudential Plc, four Independent Directors, a Managing Director and two Whole Time Directors. Except the Managing Director and the two Whole Time Directors, all other Directors including the Chairman of the Board are Non-Executive Directors. There is a clear segregation of responsibility and authority between the Chairman and the Managing Director. The Board of Directors is responsible for overall corporate strategy and other Board related matters. The Managing Director oversees implementation of strategy, achievement of the business plan and day-to-day activities and operations related issues. There is an appropriate mix of Executive, Non-Executive and Independent Directors to maintain the professionalism and independence of the Board. The Independent Directors are eminent personalities with significant expertise in the fields of finance, law, strategy, marketing and insurance. None of the Directors is related to any other Director or employee of the Company.
B. BOARD COMMITTEES
The Board has 4 Committees, details of which are as follows:
Board Risk Management and Audit Committee
Board Investment Committee
Board Compensation & Nominations
Committee
Share Transfer Committee
Scope & Term of Reference
Responsible for oversight of risk management, financial reporting and internal control systems. Key terms of reference of this Committee include directing and overseeing the audit plan, review of financial statements, review of findings of internal and statutory auditors, recommendation for appointment of statutory auditors, fixing their remuneration, and review of quarterly compliance certificate
Recommend and review investment policy and changes thereto, review investments and oversee the risk management framework for investments
Nominating Directors to the Board, fixing their remuneration and approving executive compensation program
Approval of transfer of shares in physical form
Approval of requests for split of share certificates
Approval of issue of duplicate share certificates etc.
ICICI PRU AR09_Final Pg29-197 (Ac).indd Sec1:29ICICI PRU AR09_Final Pg29-197 (Ac).indd Sec1:29 10/28/09 6:00:05 PM10/28/09 6:00:05 PM

I 30 I
FINANCIAL REPORT
Board Risk Management and Audit Committee
Board Investment Committee
Board Compensation & Nominations
Committee
Share Transfer Committee
Members Keki Dadiseth (Chairman)Adrian O‘ConnorK. Ramkumar
Marti G. Subrahmanyam (Chairman)Chanda D. KochharAdrian O‘ConnorShikha Sharma N. S. KannanPuneet Nanda (Executive Vice President)Avijit Chatterjee (Appointed Actuary)
Rama Bijapurkar(Chairperson)K. RamkumarAdrian O‘ConnorMarti G. Subrahmanyam w.e.f. April 21, 2009Vinod Kumar Dhall w.e.f April 21, 2009
Shikha SharmaN. S. KannanBhargav Dasgupta
No. of times met during the year
4 4 3 7
C. GRIEVANCE REDRESSAL COMMITTEE
The Grievance Redressal Committee is chaired by Mr. R. Narayanan, with three other members from senior management. The Committee’s objective is to provide accessible machinery to the policyholders for settlement of their grievances. The Committee ensures a fair and expeditious complaint handling system. It also provides feedback to management for systems review, where required.
D. INTERNAL AUDIT FRAMEWORK
The Company has in place an internal audit framework with a risk based audit approach. The internal audit covers auditing of processes as well as transactions. Key audit observations and recommendations made are reported to the Board Risk Management & Audit Committee. Implementation of the recommendations is actively monitored.
E. RISK MANAGEMENT FRAMEWORK
Investment Risk: The Company measures Investment Risk through resilience testing of the assets and liabilities on the Balance Sheet. This metric is a key driver in determining the investment strategies. The assets under management for the linked portfolio, in respect of which there is minimal investment risk on the regulatory Balance Sheet, amount to over 87.3% of the policyholders funds. All linked funds are benchmarked against appropriate external indices. For the non-linked portfolio, the Company manages the interest rate risk on the single premium non-participating portfolio by duration matching, rebalanced monthly. On the participating portfolio, the Company’s asset allocation strategy, which includes investments in equities, is designed to achieve the twin objectives of managing risks arising from guarantees and optimising returns, subject to regulatory constraints. In addition, there are exposure limits to companies, groups and industries. The credit risk is managed by restricting investments only in government bonds and highly rated corporate securities above and constant monitoring of the credit portfolio. The Executive Investment Committee, consisting of the CEO and key members of the executive management team reviews investment strategy, performance and provides guidance for managing investment related risks.
Operational Risks: The Risk Management & Audit Committee supervises the audit, operational risk and compliance related aspects. It assesses and rates the various operational risks including in the areas of information security and availability risk and sales related risks and prepares a mitigating plan. The Internal Audit Department carries
ICICI PRU AR09_Final Pg29-197 (Ac).indd Sec1:30ICICI PRU AR09_Final Pg29-197 (Ac).indd Sec1:30 10/28/09 6:00:05 PM10/28/09 6:00:05 PM

I 31 I
ANNUAL REPORT 2008-09ICICI PRUDENTIAL LIFE INSURANCE
out audits according to the risk based audit plan and reports the key findings to the Risk Management & Audit Committee on quarterly basis. The Company has also constituted an Internal Controls Committee (‘ICC’) consisting of key members from the management team. The ICC meets on a quarterly basis to discuss key findings made by Internal Audit and to review the status of implementation of recommendations made. This has helped in expediting the time required for mitigation of these risks.
WHISTLE BLOWER POLICY
The Company has a Whistle Blower Policy which is designed to provide its employees a channel for communicating any issues in the areas of breaches of the code of conduct, legal violation and irregularities in accounting policies and procedures.
RURAL AND SOCIAL BUSINESS
More than 774,700 policies were issued in rural areas, constituting over 29% of total policy issuances. The Company also covered more than 132,600 lives falling within the norm of ‘social sector’ business.
DIRECTORS
During the year under review, Mr. H. T. Phong, Ms. Kalpana Morparia, and Mr. M. P. Modi stepped down from the Board with effect from July 23, 2008, August 29, 2008, and January 15, 2009 respectively. The Board places on record its appreciation for their valuable contribution during this tenure.
The Board appointed Mr. Adrian O’Connor, Mr. K. Ramkumar and Mr. Vinod Kumar Dhall as Additional Directors on July 23, 2008, October 13, 2008 and March 5, 2009 respectively till the ensuing Annual General Meeting and are proposed to be appointed as Directors retiring by rotation at the ensuing Annual General Meeting. Notice has been received from a Member proposing them as Directors as required under Section 257 of the Companies Act, 1956.
Mr. Keki Dadiseth, Prof. Marti G. Subrahmanyam and Ms. Rama Bijapurkar will retire by rotation at the above Annual General Meeting and are eligible for re-appointment.
Mr. K. V. Kamath stepped down from the Board effective closure of the Board meeting held on April 21, 2009. Ms. Chanda D. Kochhar was appointed as the Chairperson of the Board effective closure of the Board meeting held on April 21, 2009. Ms. Shikha Sharma tendered her resignation as Managing Director & CEO of the Company, and the same was accepted by the Board effective close of business hours on April 30, 2009. Mr. N. S. Kannan was appointed as the Executive Director & CFO of ICICI Bank and stepped down from the Board of the Company as an Executive Director effective May 1, 2009. In view of his appointment as the Managing Director of ICICI Lombard General Insurance Company Limited, Mr. Bhargav Dasgupta, Executive Director, resigned from the Board effective from the end of day on April 30, 2009. The Board places on record its appreciation for their valuable contribution during the tenure.
At the Board meeting held on April 21, 2009, Mr. N. S. Kannan was nominated by ICICI Bank as a Director on the Board of the Company. The Board appointed him as an Additional Director effective May 1, 2009 till the ensuing Annual General Meeting and proposed to appoint him as a Director retiring by rotation at the ensuing Annual General Meeting. Notice has been received from a Member proposing him as a Director as required under Section 257 of the Companies Act, 1956. At the Board Meeting held on April 25, 2009, Mr. V. Vaidyanathan was appointed as the Managing Director & CEO of the Company effective May 1, 2009 subject to the approval of the Members of the Company and the Insurance Regulatory and Development Authority.
DETAILS AS PER SECTION 217(2A)
As required by the provisions of Section 217 (2A) of the Companies Act, 1956, read with the Companies (Particulars of Employees) Rules, 1975, as amended, the names and relevant particulars of the employees are set out in Annexure to the Directors’ Report.
INCREASE IN SHARE CAPITAL
The paid-up capital of the Company was increased by Rs. 0.26 billion (face value) contributed by the parent organisations, ICICI Bank Limited and Prudential Plc, UK and the members of the Employee Stock Option Scheme taking the paid-up capital to Rs. 14.27 billion (face value) at March 31, 2009.
ICICI PRU AR09_Final Pg29-197 (Ac).indd Sec1:31ICICI PRU AR09_Final Pg29-197 (Ac).indd Sec1:31 10/28/09 6:00:05 PM10/28/09 6:00:05 PM

I 32 I
FINANCIAL REPORT
PUBLIC DEPOSITS
During the year under review, the Company has not accepted any deposits under Section 58A of the Companies Act, 1956.
AUDITORS
M/s. Walker, Chandiok & Co, and M/s. B S R & Co., Chartered Accountants were re-appointed as joint statutory auditors of the Company at the last Annual General Meeting. They are retiring at the ensuing Annual General Meeting and are eligible for re-appointment.
ADDITIONAL INFORMATION
In view of the nature of business activity of the Company, the information relating to the conservation of energy and technology absorption, as required under Companies (Disclosure of Particulars in the Report of Board of Directors) Rules, 1988, is not required to be given. Details of foreign exchange earnings and outgo required under above Rules are as under:
(Rs. in million)
Particulars Fiscal 2009 Fiscal 2008
Foreign Exchange Earnings & Outgo
– Earnings — —
– Outgo 425.08 332.50
DIRECTORS’ RESPONSIBILITY STATEMENT
The Directors confirm that:
1. in the preparation of the annual accounts, the applicable accounting standards have been followed;
2. the Directors have selected such accounting policies and applied them consistently and made judgements and estimates that are reasonable and prudent so as to give a true and fair view of the state of affairs of the Company at the end of the financial year and of the loss of the Company for that period;
3. the Directors have taken proper and sufficient care for the maintenance of adequate accounting records in accordance with the provisions of the Companies Act, 1956 for safeguarding the assets of the Company and for preventing and detecting fraud and other irregularities; and
4. the Directors have prepared the annual accounts on a going concern basis.
ACKNOWLEDGEMENTS
The Directors are grateful to the Insurance Regulatory & Development Authority, Reserve Bank of India and Government of India for their continued co-operation, support and advice.
The Directors would also like to take this opportunity to express sincere thanks to its valued customers for their continued patronage.
The Directors express their gratitude for the valuable advice, guidance and support received from time to time, from the auditors and the statutory authorities. The Directors express their deep sense of appreciation to all employees and distributors, who continue to display outstanding professionalism and commitment, enabling the organisation to retain market leadership in its business operations. Finally, the Directors wish to express their gratitude to ICICI Bank Limited and Prudential Corporation Holdings Limited for their continued trust and support.
For and on behalf of the Board
Mumbai, CHANDA D. KOCHHARMay 11, 2009 Chairperson
ICICI PRU AR09_Final Pg29-197 (Ac).indd Sec1:32ICICI PRU AR09_Final Pg29-197 (Ac).indd Sec1:32 10/28/09 6:00:05 PM10/28/09 6:00:05 PM

I 33 I
ANNUAL REPORT 2008-09ICICI PRUDENTIAL LIFE INSURANCE
MANAGEMENT REPORTIn accordance with the provisions of the Insurance Regulatory and Development Authority (‘IRDA’) (Preparation of
Financial Statements and Auditors’ Report of Insurance Companies) Regulations, 2002, the following Management
Report is submitted for the financial year ended March 31, 2009:
1. Certificate of Registration
The Certificate of Registration under Section 3 of the Insurance Act, 1938 was granted by IRDA on November 24,
2000. The Company has obtained renewal of registration certificate from IRDA for the financial year ended March
31, 2010 as required under Section 3A of the Insurance Act, 1938.
2. Statutory liabilities
We hereby certify that all dues payable to the statutory authorities have been duly paid except those under dispute
or disclosed under contingent liabilities in the notes to accounts forming part of the financial statements.
3. Shareholding pattern
We hereby confirm that the shareholding pattern of the Company during the year under review was in accordance
with the statutory requirements.
During the year, the Company issued additional 25,000 thousand equity shares of Rs. 10 each to ICICI Bank Limited
and Prudential Corporation Holdings Ltd. UK in the ratio of 74:26 at a premium of Rs. 390. The total capital infusion
by promoters during the year (at face value) amounted to Rs. 250,000 thousand.
The Company has an approved Employees Stock Option Scheme under which 1,143,570 shares have been allotted
during the year under review.
The shareholding pattern of the Company at March 31, 2009 was as follows:
1. ICICI Bank Limited – 73.93%
2. Prudential Corporation Holdings Limited – 25.97%
3. Others – 0.10%
4. Investments outside India
We hereby declare that no investments, directly or indirectly have been made outside India of the funds of the
holders of policies issued in India.
5. Solvency margin
We hereby confirm that the Company has adequate assets to cover both its liabilities and required solvency margin
under Section 64VA of the Insurance Act, 1938, the IRDA (Assets, Liabilities and Solvency Margin of Insurers)
Regulations, 2000.
6. Valuation of Assets in the Balance Sheet
We certify that the values of all the assets have been reviewed on the date of Balance Sheet and that to the best
of our belief the assets set forth in the Balance Sheet are shown in aggregate at amounts not exceeding their
realisable or market value.
Market value of fixed income investments made in shareholders fund and non-linked funds, which are valued at
amortised cost as per IRDA guidelines, is higher by Rs. 485,362 thousand as at March 31, 2009. As at the same
date, unrealised gains on equity and mutual fund investments in shareholders fund and non-linked funds amounts
to Rs. 211,700 thousand. The value of real estate has been subjected to revaluation during the year ended March
31, 2007 and the change in the carrying amount thereby amounting to Rs. 316,319 thousand has been taken to
the Revaluation Reserve under the policyholders’ funds in the Balance Sheet.
ICICI PRU AR09_Final Pg29-197 (Ac).indd Sec1:33ICICI PRU AR09_Final Pg29-197 (Ac).indd Sec1:33 10/28/09 6:00:05 PM10/28/09 6:00:05 PM

I 34 I
FINANCIAL REPORT
7. Application and Investments of Life Insurance Funds
We certify that no part of the life insurance fund has been directly or indirectly applied in contravention of the provisions of the Insurance Act, 1938.
8. Overall risk exposure and strategy adopted to mitigate the same
The mitigation strategy in respect of various risks is as under:
1. Investment risk – The Company measures Investment Risk by resilience testing of the assets and liabilities on the Balance Sheet. This metric is a key driver in determining the investment strategies. The assets under management for the linked portfolio, in respect of which there is minimal investment risk on the regulatory Balance Sheet, amount to over 87% of the policyholders funds. For the non-linked portfolio, the Company manages the interest rate risk on the single premium non-participating portfolio by duration matching, rebalanced monthly. On the participating portfolio, the Company’s asset allocation strategy, which includes investments in equities, is designed to achieve the twin objectives of managing risks arising from guarantees and optimising returns, subject to regulatory constraints. The equity portfolio is benchmarked against BSE 100. In addition, there are exposure limits to companies, groups and industries. The credit risk is managed by restricting investments only in securities rated AA and above and constant monitoring of the credit portfolio.
2. Unit-linked products with guarantees – Some guarantees are provided in some of the individual and group unit-linked products, for which the risk management framework is as follows:
For individual products: There are three types of guarantees that are provided. For a category of products, the guarantee is on the amounts invested in the unit funds. This guarantee reduces by the amount of charges made and is increased at the end of each year by a declared amount based on the investment performance during the year of the underlying fund. For another category of products, the guarantee is on the entire premium paid. For both these categories, the guarantee is applicable only on death or maturity and not on surrender of the policy. A cost for providing the guarantee has been priced into the product and a reserve is held on this account while the asset portfolio is prudently set as a mix between risky and non-risky assets. The third type of guarantee is offered on the return guarantee funds (‘RGF’) that were launched this year. These are tranches of closed-ended bond funds where the NAV at maturity is guaranteed. The guaranteed NAV is set with reference to the market yields available at the time of launch of each tranche and after making allowances for any mismatch and credit risk. The assets backing the fund are duration matched to manage the interest rate risk. The credit risk is managed by choice of bonds and diversification. Appropriate reserves are also set up for the RGF.
For the Group Gratuity product: The guarantee is only applicable on withdrawal of the scheme and is only to the extent of contributions made to the fund less any withdrawals from the fund. A charge is levied in respect of the guarantee; the Company does not expect this guarantee to be onerous as it is applicable only after three years whilst investments are confined to short term debt securities and money market instruments.
For the Group Superannuation product: The guarantee is applicable when a member of the group leaves the scheme due to retirement, death or resignation and is to the extent of contributions made to the fund. A charge is levied in respect of the guarantee and a reserve is held on this account whilst the asset portfolio is prudently set as a mix between risky and non-risky assets.
3. Operational risks – The Risk Management and Audit Committee supervises the audit, operational risk and compliance related aspects. It assesses and rates the various operational risks including in the areas of Information Security and Availability risk and Sales related risks and prepares a mitigating plan. The Internal Audit Department carries out audits according to the Risk Based Audit Plan and reports the findings to the Risk Management and Audit Committee on quarterly basis. It also holds quarterly meetings of Internal Controls Committee to highlight the key findings and seek faster and total mitigation of these risks.
ICICI PRU AR09_Final Pg29-197 (Ac).indd Sec1:34ICICI PRU AR09_Final Pg29-197 (Ac).indd Sec1:34 10/28/09 6:00:05 PM10/28/09 6:00:05 PM

I 35 I
ANNUAL REPORT 2008-09ICICI PRUDENTIAL LIFE INSURANCE
4. Persistency – The Company actively monitors its persistency experience, which is then fed back into new
product pricing as well as management reporting. The Company also runs various service initiatives to manage
persistency better.
5. Morbidity and Mortality risk – Mortality experience continues to be favourable, exhibiting the characteristics
of a select portfolio. However these are early years and a better picture of development of ultimate rates
will emerge over the next few years. The morbidity risk taken by the Company is increasing steadily with
increasing health insurance sales. It is too early to conclude regarding the emerging morbidity experience
based on the experience.
6. Reinsurance – Reinsurance is a key to the risk management strategy. The Company has re-insurance
agreements with Swiss Re, RGA Re, Gen Re and Munich Re. The insurance retention limits have, at a product
level, been derived from the Company’s assessment of optimal level of profitability and risk sharing. The
Company also has a catastrophe treaty to manage risks arising out of catastrophic events.
9. Operations abroad
The Company has set up representative offices in the Kingdom of Bahrain and the United Arab Emirates.
10. Claims
In respect of mortality claims, the average time taken by the Company from the date of submission of the final
requirement by the claimant to despatch of claim payment was as follows:
Period Average claim settlement time (in days)
2008-09 72007-08 62006-07 72005-06 72004-05 82003-04 92002-03 11
The ageing of claims registered and not settled as of March 31, 2009 has been detailed herein below:
Linked business: (Rs. in ‘000s)
Period Number of Claims Amount
Upto 30 days 270 48,708Greater than 30 days and upto 6 months 315 43,252Greater than 6 months and upto 1 year 66 15,002Greater than 1 year and upto 5 years 49 9,883Greater than 5 years — —
Non-Linked business: (Rs. in ‘000s)
Period Number of Claims Amount
Upto 30 days 34 19,957Greater than 30 days and upto 6 months 56 16,822Greater than 6 months and upto 1 year 27 1,920Greater than 1 year and upto 5 years 13 4,542Greater than 5 years — —-
Claims remain unpaid for greater than 6 months for want of proof of title or the cause of death or pending other
necessary documentation, to determine the claim liability.
ICICI PRU AR09_Final Pg29-197 (Ac).indd Sec1:35ICICI PRU AR09_Final Pg29-197 (Ac).indd Sec1:35 10/28/09 6:00:05 PM10/28/09 6:00:05 PM

I 36 I
FINANCIAL REPORT
11. Valuation of investments
We hereby certify that the investments in debt securities except for linked business are stated at historical cost
subject to amortisation of premium or accretion of discount in the revenue account or the profit and loss account
over the period of maturity/holding on a straight line basis. The equity and mutual fund investments are valued
at fair value as on the balance sheet date. Investments in venture funds and secured loans from policyholders’
funds are valued at cost. Investment in real estate is valued at historical cost, subject to revaluation (done at least
once in every three years) and provision for impairment, if any.
The investments of linked business are valued as per the terms of the respective schemes at mark-to-market basis,
as follows:
Equity Shares: All traded equity shares are valued at closing price on the National Stock Exchange (NSE) on
valuation day (in case of securities not listed on NSE, the last quoted closing price on the Bombay Stock
Exchange (‘BSE’) is used).
Government Securities: All traded Government of India Securities are valued as per CRISIL Gilt Valuer.
Debt Securities: All debt securities are valued as per CRISIL Bond Valuer.
Mutual Fund Units: Units of the Mutual Fund are valued at the NAV of the immediate previous day of the
valuation day.
Others: As per market practice and the approved valuation policy.
12. Review of Asset Quality
Investments are made in accordance with the Insurance Regulatory and Development Authority (Investments)
(4th Amendment) Regulations, 2008. The portfolio mix of funds under management of the Company as on
March 31, 2009 is as under:
Portfolio % of Total Investments *
Government of India securities 9.82%Debentures and Bonds 18.25%Money market instruments 13.93%Fixed deposits 2.91%Equity 48.85%Mutual funds and Venture funds 3.78%Net current assets and other securities 2.46%Total 100.00%
* Funds under management are valued considering the amortized cost and the mark-to-market (gains/losses)
for non-linked funds and linked funds, respectively.
Returns generated by major portfolios during the year are given below:
FundAssets Held
(Rs. in ‘000s)
1 year (Annualized) 2 year (Annualized) 3 year (Annualized)
Fund Benchmark Fund Benchmark Fund Benchmark
Maximiser 76,066,373 (33.88%) (39.97%) (9.16%) (13.36%) (3.90%) (5.75%)
Balancer 21,685,530 (8.73%) (10.69%) 3.07% 1.40% 4.25% 3.35%
Protector 14,783,473 9.77% 7.35% 9.39% 7.78% 8.11% 6.42%
Pension Maximiser 21,569,264 (34.99%) (39.97%) (10.09%) (13.36%) (4.03%) (5.75%)
Pension Balancer 9,248,930 (6.68%) (10.69%) 4.11% 1.40% 5.26% 3.35%
Pension Protector 8,697,844 9.79% 7.35% 9.50% 7.78% 8.21% 6.42%
Flexi Growth 32,066,307 (34.18%) (40.02%) (9.49%) (14.56%) NA NA
Pension Flexi Growth 23,004,006 (36.06%) (40.02%) (11.73%) (14.56%) NA NA
ICICI PRU AR09_Final Pg29-197 (Ac).indd Sec1:36ICICI PRU AR09_Final Pg29-197 (Ac).indd Sec1:36 10/28/09 6:00:05 PM10/28/09 6:00:05 PM

I 37 I
ANNUAL REPORT 2008-09ICICI PRUDENTIAL LIFE INSURANCE
The Company maintains a balance of sovereign and corporate bonds in its debt portfolio. Most of the corporate
bonds held in the portfolio are in the highest rating category. Within corporate bonds, the Company has a well-
diversified portfolio across issuers and industries. Similarly, the Company has an equity portfolio which is well-
diversified and investments are primarily made in blue-chip stocks, spread across issuers and industries. In view
of the foregoing, the Company has high quality of assets at all points in time.
13. Payments made to parties in which Directors are interested
The details of such payments for the year ended March 31, 2009 are given below: (Rs. in ‘000s)
Sr. No.
Name of Director Entity in which Director is interested Interested as Amount paid
1 K. V. Kamath ICICI Bank LimitedManaging Director & CEO
2,836,338
ICICI Lombard General Insurance Company Limited
Chairman 127,134
ICICI Prudential Asset Management Company Limited
Chairman 351
ICICI Securities Limited Chairman 152,211
ICICI Foundation for Inclusive GrowthChairman – Governing Council
67,720
Indian Institute of Management – Ahmedabad
Director 252
2. Shikha Sharma Firstsource Solutions Limited Director 226,810
ICICI Foundation for Inclusive GrowthMember – Governing Council
67,720
3. Bhargav Dasgupta Tech Process Solutions Limited Director 81,781
4. Rama Bijapurkar CRISIL Limited Director 1,798
Infosys Technologies Limited Director 11,709
5. Keki B. Dadiseth Siemens Limited Director 440
The Indian Hotels Company Limited Director 2,978
6. Chanda D. Kochhar ICICI Bank LimitedJoint Managing Director & CFO
2,836,338
ICICI Lombard General Insurance Company Limited
Director 127,134
ICICI Prudential Asset Management Company Limited
Director 351
ICICI Securities Limited Director 152,211
ICICI Foundation for Inclusive GrowthMember – Governing Council
67,720
7. K. Ramkumar ICICI Bank Limited Director 2,836,338
8. Barry StoweICICI Prudential Asset Management Company Limited
Director 351
9.Marti G. Subrahmanyam
ICICI Bank Limited Director 2,836,338
ICICI PRU AR09_Final Pg29-197 (Ac).indd Sec1:37ICICI PRU AR09_Final Pg29-197 (Ac).indd Sec1:37 10/28/09 6:00:06 PM10/28/09 6:00:06 PM

I 38 I
FINANCIAL REPORT
14. Management Responsibility Statement
The Management confirms that:
(i) in the preparation of financial statements, the applicable accounting standards, principles and policies have
been followed along with proper explanations relating to material departures, if any;
(ii) the management has adopted accounting policies and applied them consistently and made judgements
and estimates that are reasonable and prudent so as to give a true and fair view of the state of affairs of
the Company at the end of the financial year and of the operating loss and of the loss of the Company for
the year;
(iii) the management has taken proper and sufficient care for the maintenance of adequate accounting records
in accordance with the applicable provisions of the Insurance Act, 1938 and the Companies Act, 1956, for
safeguarding the assets of the Company and for preventing and detecting fraud and other irregularities;
(iv) the management has prepared the financial statements on a going concern basis;
(v) the management has ensured that an internal audit system commensurate with the size and nature of the
business exists and is operating effectively.
For & on behalf of the Board of Directors
____________________ ____________________ ____________________
Avijit Chatterjee K. V. Kamath Keki Dadiseth
Appointed Actuary Chairman Director
____________________ ____________________
Shikha Sharma Barry Stowe
Managing Director Director
____________________
N. S. Kannan
Executive Director
Place: Mumbai
Date: April 21, 2009
ICICI PRU AR09_Final Pg29-197 (Ac).indd Sec1:38ICICI PRU AR09_Final Pg29-197 (Ac).indd Sec1:38 10/28/09 6:00:06 PM10/28/09 6:00:06 PM

I 39 I
ANNUAL REPORT 2008-09ICICI PRUDENTIAL LIFE INSURANCE
CORPORATE GOVERNANCEAs a good corporate citizen reflecting the parentage of the stakeholders, the Company continues to institutionalise
its governance framework. The Company’s governance framework encompasses not only regulatory and legal
requirements but also several voluntary practices aimed to ensure maximising shareholder value legally, ethically
and on a sustainable basis, while ensuring fairness to every stakeholder; customers, employees, investors and
regulators.
Following are the brief details of the Company’s corporate governance framework :
Board Structure
During the financial year 2009 the Board comprised of 12 Directors – three nominated by ICICI Bank Limited, two
nominated by Prudential Plc, four Independent Directors, a Managing Director and two Whole Time Directors. Except
the Managing Director and the two Whole Time Directors, all other Directors including the Chairman of the Board
are Non-Executive Directors. There is a clear segregation of responsibility and authority between the Chairman and
the Managing Director. The Board of Directors is responsible for overall corporate strategy and other Board related
matters. The Managing Director oversees implementation of strategy, achievement of the business plan and day-to-
day activities and operations related issues. There is an appropriate mix of Executive, Non-Executive and Independent
Directors to maintain the professionalism and independence of the Board. The Independent Directors are eminent
personalities with significant expertise in the fields of finance, law, strategy and insurance. None of the Directors is
related to any other Director or employee of the Company.
Recent Management Changes
During the year under review, Mr. H. T. Phong, Ms. Kalpana Morparia, and Mr. M. P. Modi stepped down from the
Board with effect from July 23, 2008, August 29, 2008, and January 15, 2009 respectively. The Board places on record
its appreciation for their valuable contribution during their tenure.
The Board appointed Mr. Adrian O’Connor, Mr. K. Ramkumar and Mr. Vinod Kumar Dhall as Additional Directors on
July 23, 2008, October 13, 2008 and March 5, 2009 respectively till the ensuing Annual General Meeting and are
proposed to be appointed as Directors retiring by rotation at the ensuing Annual General Meeting.
Mr. Keki Dadiseth, Prof. Marti G. Subrahmanyam and Ms. Rama Bijapurkar will retire by rotation at the above Annual
General Meeting and are eligible for re-appointment.
Mr. K. V. Kamath stepped down from the Board effective closure of the Board meeting held on April 21, 2009.
Ms. Chanda D. Kochhar was appointed as the Chairperson of the Board effective closure of the Board meeting held
on April 21, 2009. Ms. Shikha Sharma tendered her resignation as Managing Director and CEO of the Company,
and the same was accepted by the Board effective close of business hours on April 30, 2009. Mr. N. S. Kannan was
appointed as the Executive Director and CFO of ICICI Bank and stepped down from the Board of the Company as
an Executive Director effective May 1, 2009. In view of his appointment as the Managing Director of ICICI Lombard
General Insurance Company Limited, Mr. Bhargav Dasgupta, Executive Director, resigned from the Board effective
from the end of day on April 30, 2009. The Board places on record its appreciation for their valuable contribution
during the tenure.
At the Board meeting held on April 21, 2009, Mr. N. S. Kannan was nominated by ICICI Bank as a Director on the
Board of the Company. The Board appointed him as an Additional Director effective May 1, 2009 till the ensuing
Annual General Meeting and proposed to appoint him as a Director retiring by rotation at the ensuing Annual General
Meeting. At the Board Meeting held on April 25, 2009, Mr. V. Vaidyanathan was appointed as the Managing Director
and CEO of the Company effective May 1, 2009 subject to the approval of the Members of the Company and the
Insurance Regulatory and Development Authority.
ICICI PRU AR09_Final Pg29-197 (Ac).indd Sec1:39ICICI PRU AR09_Final Pg29-197 (Ac).indd Sec1:39 10/28/09 6:00:06 PM10/28/09 6:00:06 PM

I 40 I
FINANCIAL REPORT
Information on Directors
Ms. Chanda D. Kochhar – Chairperson
Ms. Chanda D. Kochhar is the Managing Director and Chief Executive Officer of ICICI Bank Limited. She began her
career with ICICI as a Management Trainee in 1984 and has thereon successfully risen through the ranks by handling
multidimensional assignments and heading all the major functions in the Bank at various points in time. In 1993 when
ICICI decided to enter commercial banking, she was deputed to ICICI Bank as a part of the core team to set up the
bank.
In July 2000, she was chosen to head the Retail finance division of ICICI and has been instrumental in scaling up the
business. In April 2001, she was promoted as an Executive Director, heading the retail business in the Bank.
In April 2006, she was appointed as the Deputy Managing Director with responsibility for both Corporate and Retail
banking business of ICICI Bank and from October 2006 to October 2007, she handled the International and Corporate
businesses of ICICI Bank. In October 2007, she was appointed as the Joint Managing Director & CFO. She was
heading the Corporate Centre, was the Chief Financial Officer (CFO) and was also the official spokesperson for ICICI
Bank.
Ms. Kochhar holds Bachelors Degree in Arts and is an MBA and an ICWA. She did her Masters in Management
Studies (Finance) from the Jamnalal Bajaj Institute of Management Studies, Mumbai.
Ms. Kochhar has been appointed as a Director of ICICI Prudential in May 2002.
Mr. N. S. Kannan – Director
Mr. N. S. Kannan is the Executive Director and Chief Financial Officer of ICICI Bank Limited. In addition to Finance,
Taxation and Communications, his responsibilities include Compliance, Internal Audit, Corporate Legal and Global
Treasury operations.
Prior to the current assignment, Mr. Kannan was the Executive Director of ICICI Prudential Life Insurance Company. He
looked after the Corporate Centre including the finance and accounts functions, Investor/analyst relations, Investment
Management, Corporate Strategy, Corporate Communications, Human Resources and Business Intelligence.
Prior to shifting to ICICI Prudential, Mr. Kannan was the Chief Financial Officer and Treasurer of ICICI Bank.
Mr. Kannan has been with the ICICI group for over 18 years. He joined the ICICI group in 1991 as a project officer. During
his tenure at ICICI group, he has handled project finance operations, infrastructure financing, structured finance and
treasury operations.
Mr. Kannan is a postgraduate in management from the Indian Institute of Management, Bangalore with a gold medal
for best all-round performance. He is also a Chartered Financial Analyst from the Institute of Chartered Financial
Analysts of India and an Honours graduate in Mechanical Engineering.
Mr. Kannan has been appointed as a Director of ICICI Prudential in May 2009.
Mr. K. Ramkumar – Director
Mr. Ramkumar is the Executive Director on the Board of ICICI Bank effective February 1, 2009 and is responsible for
Operations & Credit, Treasury Middle-Office and Human Resource functions.
Prior to joining ICICI Bank in 2001 Mr. Ramkumar had over 16 years of experience in companies such as Hindustan
Aeronautics, Brookebond Lipton India Limited (now Hindustan Unilever Limited) and ICI India Ltd. His work in these
companies has mainly been in the areas of Human Resources Management and Production Management.
At ICICI Bank Mr. Ramkumar has been responsible for Human Resource function, initially for the Bank and then for all
the companies in the ICICI Group.
ICICI PRU AR09_Final Pg29-197 (Ac).indd Sec1:40ICICI PRU AR09_Final Pg29-197 (Ac).indd Sec1:40 10/28/09 6:00:06 PM10/28/09 6:00:06 PM

I 41 I
ANNUAL REPORT 2008-09ICICI PRUDENTIAL LIFE INSURANCE
He has worked extensively in the areas of recruitment, competency design, succession management, learning and
development and Leadership Development. Under his guidance, ICICI Bank has implemented cutting edge practices
and methodologies in the domain of leadership development, learning, creation and use of psychometric tools.
Mr. Ramkumar also has extensive experience in the areas of process design and quality management to create scale
and efficiency. At ICICI Bank, he has driven cost productivity across the organisation through work methodisation &
norming, and process & structure optimisation.
Mr. Ramkumar has completed his PGDM from Madras School of Social Work in 1984 and BSc. Chemistry in 1982.
Mr. Ramkumar has been appointed as a Director of ICICI Prudential in October 2008.
Mr. Barry Stowe – Director
Mr. Barry Stowe is the Chief Executive of Prudential Corporation Asia, one of the leading life insurers in Asia. He
joined Prudential in October 2006 where he is responsible for an extensive network of over 30 life insurance and fund
management operations spanning 12 diverse markets.
Mr. Barry Stowe has considerable experience in the Asian market, having spent three years as the Regional Head
for AIG Accident and Health in Southeast Asia before his appointment to the Hong Kong-based role of President,
Accident and Health Worldwide.
Mr. Barry Stowe has been appointed as a Director of ICICI Prudential in November 2006.
Mr. Adrian O’Connor – Director
Mr. Adrian O’Connor is a Fellow of the Institute of Actuaries and a Fellow of the Society of Actuaries.
Mr. O’Connor is the Chief Financial Officer at Prudential Corporation Asia. He is responsible for all aspects of financial
management as well as the strategic planning process. He is also responsible for monitoring the ongoing delivery of
key initiatives for Prudential’s insurance business across the Asia region, including defining and measuring successes
in all key markets. He is also responsible for driving insurance product strategy as well as overseeing the secretarial
functions for Prudential Corporation Asia. Mr. O’Connor is also a member of Prudential Corporation Asia’s Board of
Directors.
Mr. O’Connor has over 25 years of experience in the life insurance industry in Europe, USA and Asia. Prior to his
appointment at Prudential, Mr. O’Connor was Senior Vice President and Chief Actuary of New York Life International. He
has also held senior management positions at AIG including Chief Financial Officer of their Worldwide Accident and
Health Business and a number of actuarial roles.
Mr. O’Connor has been appointed as a Director of ICICI Prudential in July 2008.
Mr. Keki Dadiseth – Independent Director
Mr. Keki Dadiseth holds a Bachelor’s degree in Commerce from Bombay University and is a Fellow Member of the
Institute of Chartered Accountants of England and Wales. Mr. Dadiseth retired as the Chairman of Hindustan Lever
Limited, India’s largest fast moving consumer goods company, in May 2000. Prior to this, as a Board member of HLL,
he headed several businesses of the group such as Detergents and Personal Products and was also responsible for
the acquisitions and mergers by the group.
Mr. Dadiseth has been appointed as an Independent Director of ICICI Prudential in April 2006.
Prof. Marti G. Subrahmanyam – Independent Director
Prof. Marti G. Subrahmanyam holds a degree in mechanical engineering from the Indian Institute of Technology,
Chennai, a post-graduate diploma in business administration from the Indian Institute of Management, Ahmedabad
and a doctorate in finance and economics from the Massachusetts Institute of Technology.
ICICI PRU AR09_Final Pg29-197 (Ac).indd Sec1:41ICICI PRU AR09_Final Pg29-197 (Ac).indd Sec1:41 10/28/09 6:00:06 PM10/28/09 6:00:06 PM

I 42 I
FINANCIAL REPORT
Prof. Marti Subrahmanyam has served as a consultant to several corporations, industrial groups and financial institutions
in the US, Europe, Asia and Latin America. He has published numerous articles and books in the areas of corporate
finance, capital markets and international finance. He has been a visiting professor at leading academic institutions in
Australia, UK, France, Germany, India, Italy and Singapore including the University of Melbourne, INSEAD, France and
Churchill College, Cambridge University. He has taught extensively on executive programs in over 20 countries across
the world. Prof. Marti Subrahmanyam is a recipient of several teaching awards, including New York University’s
distinguished teaching medal in 2003. He is Charles E. Merrill Professor of Finance and Economics in the Stern School
of Business at New York University since 1991.
Prof. Marti G. Subrahmanyam has been appointed as an Independent Director of ICICI Prudential in July 2007.
Ms. Rama Bijapurkar – Independent Director
Ms. Rama Bijapurkar holds a Bachelor’s degree in Science (B.Sc. (Hons.) Physics) and PGDBM from IIM,
Ahmedabad.
She is one of the most respected thought leaders on market strategy and consumer related issues in India. She is also
a keen commentator on social and cultural changes. She runs her own market strategy consulting practice and works
with leading Indian and global companies, guiding the development of their business-market strategies.
Ms. Rama Bijapurkar has been appointed as an Independent Director of ICICI Prudential in January 2008.
Mr. Vinod Kumar Dhall – Independent Director
Mr. Vinod Kumar Dhall has a Law degree from the University of Delhi and a Masters degree in Mathematics from
the University of Allahabad.
Mr. Dhall entered the Indian Administrative Service in 1966 and retired as Secretary, Government of India. Subsequently,
he was Member and acting Chairman of the Competition Commission of India for 5 years till he resigned from the
position in July, 2008.
During his career, he specialised in the fields of Corporate Affairs, Industry, Commerce and Finance, in which his total
experience has been for about 27 years. Mr. Dhall has handled matters like Corporate Governance, Competition Law
and Policy, Industrial Development and Investment Promotion, Foreign Investment, Industrial Financing, Business
Management, Corporate Law Reforms, Economic Reforms, and Budget and Expenditure Management.
Currently, Mr. Dhall has set up a law firm, specialising in competition law and connected corporate law areas. He also
advises/lectures on corporate governance issues.
Mr. Dhall has been appointed as an Independent Director of ICICI Prudential Life Insurance in March 2009.
Mr. V. Vaidyanathan – Managing Director and CEO w.e.f. May 1, 2009
Mr. V. Vaidyanathan is the Managing Director and Chief Executive Officer of ICICI Prudential (with effect from May
1, 2009). Currently, he is also on the Board of ICICI Prudential Pension Funds Management Company Limited, a 100%
subsidiary of the Company. Mr. Vaidyanathan was earlier an Executive Director of ICICI Bank and brings with him
nearly two decades of experience in the financial services domain. He was also the chairman of ICICI Home Finance
Company, and has served on the Boards of ICICI Lombard General Insurance, and CIBIL.
Since joining the ICICI group in the year 2000, he has built a strong retail banking business which includes 1400 ICICI
bank branches in 800 cities, 25 million customers, USD 30 bn in assets, a strong liability base, and a team of 26000
employees. His contribution has won him many awards in the banking industry, and is well recognized in the ICICI
Group. He was recently profiled among ‘India’s Top 25 executives’ by a leading business magazine in India. He is an
alumnus of Birla Institute of Technology and Harvard Business School, AMP.
ICICI PRU AR09_Final Pg29-197 (Ac).indd Sec1:42ICICI PRU AR09_Final Pg29-197 (Ac).indd Sec1:42 10/28/09 6:00:06 PM10/28/09 6:00:06 PM

I 43 I
ANNUAL REPORT 2008-09ICICI PRUDENTIAL LIFE INSURANCE
Board membership criteria
The Board of Directors had adopted following norms at their meeting held on April 24, 2007:
All Directors to sign Deed of Covenants and the Board Compensation and Nominations Committee or the Board
(in respect of members of the Board Compensation and Nominations Committee) shall evaluate the declarations
submitted by the Directors to meet the fit and proper criteria annually
Disclosure of interest, annual disclosure and change in Board/Committee memberships shall be placed before
the Board and taken on record as required by the Companies Act, 1956
Minimum age at the time of first appointment of Directors shall be 35 years and maximum age 70 years
A non-executive Director (other than nominee Directors) shall hold office for a maximum period of 8 consecutive
years.
If a Director remains absent for 4 consecutive meetings of the Board even with leave of absence, he/she shall
vacate office.
Availability of information to the members of the Board
At the meetings, the Board welcomes managers who can provide additional insights into the items being
discussed.
The information regularly supplied to the Board includes:
Quarterly and annual operations plans and updates.
Minutes of Board Risk Management and Audit Committee, Board Investment Committee, Board Compensation
and Nominations Committee (formerly called as the Board Governance Committee) and Share Transfer Committee
as well as abstracts of circular resolutions passed.
General notices of interest.
Information of appointment of Company Secretary and Appointed Actuaries.
Investment made in category of `other investments’.
Approval of opening of offices in India and abroad.
Approval of Employee Stock Options Scheme and the yearly grant of options under the said scheme.
Policies for review.
Financial statements for the period.
Remuneration of Director
(In Rs. ‘000)
Ms. Shikha Sharma Mr. N. S. Kannan Mr. Bhargav Dasgupta
Gross salary 12,021 8,770 8,578
Performance bonus 6,724 3,780 3,780
Perquisites 699 253 554
Contribution to provident fund 900 648 648
Contribution to superannuation fund 100 100 92
Stock options granted (numbers)
Fiscal 2005 200,000 — —
Fiscal 2006 300,000 — —
Fiscal 2007 400,000 200,000 —
Fiscal 2008 400,000 200,000 200,000
Fiscal 2009 250,000 165,000 165,000
ICICI PRU AR09_Final Pg29-197 (Ac).indd Sec1:43ICICI PRU AR09_Final Pg29-197 (Ac).indd Sec1:43 10/28/09 6:00:06 PM10/28/09 6:00:06 PM

I 44 I
FINANCIAL REPORT
Sitting fees paid to Independent Directors during the year ended March 31, 2009:
Name of the DirectorAmount
(in Rs.)
Mr. M. P. Modi 1,60,000
Mr. Keki Dadiseth 1,00,000
Prof. Marti G. Subrahmanyam 1,40,000
Ms. Rama Bijapurkar 1,00,000
Mr. Vinod Kumar Dhall –
Attendance record of the Directors:
Name of the DirectorNumber of Board meetings
Held Attended
Mr. K. V. Kamath (upto April 21, 2009) 5 5
Ms. Kalpana Morparia (upto August 29, 2008) 5 2
Ms. Chanda D. Kochhar 5 4
Mr. K. Ramkumar (effective October 13, 2008) 5 2
Mr. Barry Stowe 5 2
Mr. H. T. Phong (upto July 23, 2008) 5 2
Mr. Adrian O’Connor (effective July 23, 2008) 5 2
Mr. M. P. Modi (upto January 15, 2009) 5 4
Mr. Keki Dadiseth 5 5
Prof. Marti G. Subrahmanyam 5 4
Ms. Rama Bijapurkar 5 3
Mr. Vinod Kumar Dhall (effective March 5, 2009) 5 0
Ms. Shikha Sharma (upto April 30, 2009) 5 5
Mr. N. S. Kannan 5 5
Mr. Bhargav Dasgupta (Upto April 30, 2009) 5 4
General body meetings
Details of the last three Annual General Meetings are given below:
Financial Year ended Date Start time Venue
March 31, 2006 April 26, 2006 5.30 p.m. ICICI Bank Towers, Bandra-Kurla Complex, Bandra
(East) Mumbai 400 051.
March 31, 2007 July 6, 2007 3.00 p.m. ICICI PruLife Towers, 1089 Appasaheb Marathe
Marg, Prabhadevi, Mumbai 400 025.
March 31, 2008 May 28, 2008 3.00 p.m. ICICI PruLife Towers, 1089 Appasaheb Marathe
Marg, Prabhadevi, Mumbai 400 025.
The following special resolutions were passed by the members during the last three Annual General Meetings:
Annual General Meeting held on April 26, 2006
Alteration of Articles of Association
Further issue of shares
ICICI PRU AR09_Final Pg29-197 (Ac).indd Sec1:44ICICI PRU AR09_Final Pg29-197 (Ac).indd Sec1:44 10/28/09 6:00:06 PM10/28/09 6:00:06 PM

I 45 I
ANNUAL REPORT 2008-09ICICI PRUDENTIAL LIFE INSURANCE
Board Committees
The Board has 4 Committees, details of which are as follows:
(a) Board Risk Management & Audit Committee
The Board Risk Management & Audit Committee currently comprises of:
Mr. Keki Dadiseth - Chairman
Mr. K. Ramkumar
Mr. Adrian O’Connor
Scope and terms of reference:
The primary objective of the Audit Committee of ICICI Prudential Life Insurance Company Limited is to oversee
the risk management, financial reporting and internal control systems with a view to ensure accurate, timely and
proper disclosures, and transparency, integrity and quality of financial reporting. The Committee oversees the
work carried out in the process of financial reporting by the management, the internal auditors and the statutory
auditor. Key terms of reference of this Committee include:
directing and overseeing the audit plan,
provide an assurance on the independence of the statutory auditor and objectivity of the internal auditor,
review and oversee the integrity of financial statements,
review of findings of internal and statutory auditors,
review the adequacy of internal controls including information system controls and security,
recommend the appointment of statutory auditors and fixing their remuneration,
review of quarterly compliance certificate,
monitoring the resolution of whistle-blowing complaints,
consider and, if deemed fit, pre-approve all non-auditing services to be provided by the statutory auditor to
the Company,
approve valuation report and financial condition report and
approve the SGL reconciliation statement
Attendance during the financial year 2008-09:
Name of the DirectorNumber of meetings
Held Attended
Mr. M.P. Modi – Chairman (upto January 15, 2009) 4 4
Mr. Keki Dadiseth – Chairman (effective April 21, 2009) 4 –
Mr. H. T. Phong (upto July 23, 2008) 4 2
Mr. Adrian O’Connor (effective October 13, 2008) 4 2
Ms. Chanda D. Kochhar (upto December 26, 2008) 4 1
Mr. K. Ramkumar (effective January 15, 2009) 4 1
(b) Board Investment Committee
As per IRDA (Investment) Regulations, 2000, every insurer has to constitute an Investment Committee which shall
consist of minimum two non-executive Directors, principal officers, chief of finance and investment decisions
and Appointed Actuary.
ICICI PRU AR09_Final Pg29-197 (Ac).indd Sec1:45ICICI PRU AR09_Final Pg29-197 (Ac).indd Sec1:45 10/28/09 6:00:06 PM10/28/09 6:00:06 PM

I 46 I
FINANCIAL REPORT
During financial year 2009, the Board Investment Committee comprised of:
Prof. Marti G. Subrahmanyam – Chairman
Ms. Chanda D. Kochhar
Ms. Shikha Sharma*
Mr. N. S. Kannan*
Mr. Adrian O’Connor
Dr. Avijit Chatterjee
Mr. Puneet Nanda
* ceased to be a member consequent to their stepping down from the Board effective from the close of business hours on April 30, 2009
Scope and terms of reference:
Recommend and review investment policy and changes thereto, review investments and oversee the risk management framework for investments. Key terms of reference of this Committee include:
half yearly review of Investment Policy.
approve investments in other investments category.
directing and monitoring investment decision and returns.
It shall also decide large value investments.
Attendance during the financial year 2008-09:
Name of the DirectorNumber of meetings
Held Attended
Ms. Kalpana Morparia – Chairperson (upto August 29, 2008) 4 2
Prof. Marti G. Subrahmanyam – Chairman (effective December 26, 2008) 4 3
Mr. H. T. Phong (upto July 23, 2008) 4 2
Mr. Adrian O’Connor (effective October 13, 2008) 4 2
Ms. Chanda D. Kochhar (effective December 26, 2008) 4 1
Ms. Shikha Sharma (upto April 30, 2009) 4 4
Mr. N. S. Kannan (upto April 30, 2009) 4 4
Mr. Puneet Nanda 4 4
Dr. Avijit Chatterjee 4 4
(c) Board Compensation & Nominations Committee
The Board Governance Committee was renamed as the Board Compensation & Nominations Committee effective January 15, 2009. The Committee currently comprises of:
Ms. Rama Bijapurkar – Chairperson
Mr. K. Ramkumar
Mr. Adrian O’Connor
Scope and terms of reference:
Nominating Directors to the Board, fixing their remuneration and approving executive compensation program. Key terms of reference of this Committee include:
grant of Employee stock options
determining PF interest rate
determine Directors’ remuneration
approve the executive compensation program
ICICI PRU AR09_Final Pg29-197 (Ac).indd Sec1:46ICICI PRU AR09_Final Pg29-197 (Ac).indd Sec1:46 10/28/09 6:00:06 PM10/28/09 6:00:06 PM

I 47 I
ANNUAL REPORT 2008-09ICICI PRUDENTIAL LIFE INSURANCE
Attendance during the financial year 2008-09:
Name of the DirectorNumber of meetings
Held Attended
Ms. Kalpana Morparia – Chairperson (upto August 29, 2008) 3 2Ms. Rama Bijapurkar – Chairperson (effective December 26, 2008) 3 2Mr. H. T. Phong (upto July 23, 2008) 3 2Mr. Adrian O’Connor (effective October 13, 2008) 3 1Ms. Shikha Sharma (upto January 6, 2009) 3 2Mr. K. Ramkumar (effective December 26, 2008) 3 1
(d) Share Transfer Committee
The Board of Directors had, at their meeting held on July 23, 2008, constituted a Share Transfer Committee comprising the following Directors:
Ms. Shikha Sharma Mr. N. S. Kannan Mr. Bhargav Dasgupta
Scope and terms of reference: approval of transfer of shares held in the form of physical share certificates approval of requests for split of share certificates approval of issue of duplicate share certificates any other activities which are incidental or ancillary thereto
Attendance during the financial year 2008-09:
Name of the Director Number of meetings held Number of meetings attendedMs. Shikha Sharma 7 2Mr. N. S. Kannan 7 7Mr. Bhargav Dasgupta 7 7
Grievance Redressal Committee
The Grievance Redressal Committee is chaired by Mr. R. Narayanan, with three other members from senior management. The Committee’s objective is to provide accessible machinery to the policyholders for settlement of their grievances. The Committee ensures a fair and expeditious complaint handling system. It also provides feedback to management for systems review, where required.
Internal Audit Framework
The Company has in place an internal audit framework with a risk based audit approach. The internal audit covers auditing of processes as well as transactions.
The company has designed its internal control framework to provide reasonable (not absolute) assurance to ensure compliance with internal policies and procedures, regulatory matters and to safeguard reliability of the financial reporting and its disclosures. The Board considers that the internal control framework is appropriate to the business.
Risks assessments are conducted for assessing the risks emerging from it and are classified into the following:
1. Operational risk
2. Regulatory risk
3. Financial risk
Risk classification assists in evaluating the likelihood and the impact of this along with the efforts required to mitigate the risk.
Key audit observations and recommendations made are reported to the Board Risk Management and Audit Committee. Implementation of the recommendations is actively monitored.
ICICI PRU AR09_Final Pg29-197 (Ac).indd Sec1:47ICICI PRU AR09_Final Pg29-197 (Ac).indd Sec1:47 10/28/09 6:00:06 PM10/28/09 6:00:06 PM

I 48 I
FINANCIAL REPORT
Risk Management framework
(a) Investment risk – The Company measures Investment Risk by resilience testing of the assets and liabilities on the Balance Sheet. This metric is a key driver in determining the investment strategies. The assets under management for the linked portfolio, in respect of which there is minimal investment risk on the regulatory Balance Sheet, amount to over 87% of the policyholders funds. For the non-linked portfolio, the Company manages the interest rate risk on the single premium non-participating portfolio by duration matching, rebalanced monthly. On the participating portfolio, the Company’s asset allocation strategy, which includes investments in equities, is designed to achieve the twin objectives of managing risks arising from guarantees and optimising returns, subject to regulatory constraints. The equity portfolio is benchmarked against BSE 100. In addition, there are exposure limits to companies, groups and industries. The credit risk is managed by restricting investments only in securities rated AA and above and constant monitoring of the credit portfolio.
(b) Unit-linked products with guarantees – Some guarantees are provided in some of the individual and group unit-linked products, for which the risk management framework is as follows:
For individual products: There are three types of guarantees that are provided. For a category of products, the guarantee is on the amounts invested in the unit funds. This guarantee reduces by the amount of charges made and is increased at the end of each year by a declared amount based on the investment performance during the year of the underlying fund. For another category of products, the guarantee is on the entire premium paid. For both these categories, the guarantee is applicable only on death or maturity and not on surrender of the policy. A cost for providing the guarantee has been priced into the product and a reserve is held on this account while the asset portfolio is prudently set as a mix between risky and non-risky assets. The third type of guarantee is offered on the return guarantee funds (‘RGF’) that were launched this year. These are tranches of closed-ended bond funds where the NAV at maturity is guaranteed. The guaranteed NAV is set with reference to the market yields available at the time of launch of each tranche and after making allowances for any mismatch and credit risk. The assets backing the fund are duration matched to manage the interest rate risk. The credit risk is managed by choice of bonds and diversification. Appropriate reserves are also set up for the RGF.
For the Group Gratuity product: The guarantee is only applicable on withdrawal of the scheme and is only to the extent of contributions made to the fund less any withdrawals from the fund. A charge is levied in respect of the guarantee; the Company does not expect this guarantee to be onerous as it is applicable only after three years whilst investments are confined to short term debt securities and money market instruments.
For the Group Superannuation product: The guarantee is applicable when a member of the group leaves the scheme due to retirement, death or resignation and is to the extent of contributions made to the fund. A charge is levied in respect of the guarantee and a reserve is held on this account whilst the asset portfolio is prudently set as a mix between risky and non-risky assets.
(c) Operational risks – The Risk Management and Audit Committee supervises the audit, operational risk and compliance related aspects. It assesses and rates the various operational risks including in the areas of Information Security and Availability risk and Sales related risks and prepares a mitigating plan. The Internal Audit Department carries out audits according to the Risk Based Audit Plan and reports the findings to the Risk Management and Audit Committee on quarterly basis. It also holds quarterly meetings of Internal Controls Committee to highlight the key findings and seek faster and total mitigation of these risks.
(d) Insurance risks –
Persistency – The Company actively monitors its persistency experience, which is then fed back into new product pricing as well as management reporting. The Company also runs various service initiatives to manage persistency better.
Morbidity and Mortality risk – Mortality experience continues to be favourable, exhibiting the characteristics of a select portfolio. However these are early years and a better picture of development of ultimate rates will emerge over the next few years. The morbidity risk taken by the Company is increasing steadily with increasing health insurance sales. It is too early to conclude regarding the emerging morbidity experience.
ICICI PRU AR09_Final Pg29-197 (Ac).indd Sec1:48ICICI PRU AR09_Final Pg29-197 (Ac).indd Sec1:48 10/28/09 6:00:06 PM10/28/09 6:00:06 PM

I 49 I
ANNUAL REPORT 2008-09ICICI PRUDENTIAL LIFE INSURANCE
Reinsurance - Reinsurance is a key to the risk management strategy. The Company has re-insurance agreements with Swiss Re, RGA Re, Gen Re and Munich Re. The insurance retention limits have, at a product level, been derived from the Company’s assessment of optimal level of profitability and risk sharing. The Company also has a catastrophe treaty to manage risks arising out of catastrophic events.
(e) Expense risks – Arises on account of probability of actual expense exceeding the priced expenses. Annual plan provides the glide path towards meeting the priced expenses.
Analysis of actual expenses on a periodic basis vis-à-vis plan is a key lead indicator of expense risk.
There are teams at both senior leadership & middle management driving cost efficiency measures with cost owners.
Company has following mechanism for managing expense risks:
Quarterly plan reset: The resource requirements are adjudged & reset quarterly basis revised business forecast for the year.
Contingent plans: Unforeseen developments are met through contingent budgets after critical evaluation on a case to case basis.
Overall cap: Increase in spend in one area is managed through saves generated in other areas. Overall increase in permitted only in exceptional circumstances with prior approval from senior leadership
Code of business conduct and ethics
We can continue to build on the trust and respect we have earned, only if all employees act with integrity, responsibility, in accordance with the highest possible standards of professional and ethical conduct and respect for the laws of the country. To meet this objective we have laid down the Code of Conduct highlighting the basic ethical standards that are required to be met by all employees acting on behalf of the Company. All employees must conduct themselves in a manner aligned with the language and spirit of this Code and seek to avoid even the appearance of improper behaviour.
The Code lays down the broad framework of general guiding principles, covering mainly:
General employment conduct Conflict of interest Confidentiality of information Compliance to laws, rules and regulations Insider trading policy Health, safety and environment Whistle blowing policy Prevention of workplace harassment policy Sales governance policy IT security policy
The company’s Whistle Blowing policy facilitates employees to report any breaches to the code of conduct, any legal violation in relation to work related issues and any non-adherence to accounting policies and procedures adopted to present true and fair view of the operations and financial position of the Company.
The mechanism also provides for adequate safeguards against victimisation of employees who avail of the mechanism and also provide for direct access to the Chairman of the Audit Committee. The Company further affirms that during fiscal 2009, no employee has been denied access to the audit committee.
Company has a policy of communicating the Code of Conduct including the Whistle Blowing policy on a regular basis. Management makes every effort to talk about the commitment to ethical behaviour in memos, newsletters, and speeches to company personnel.
As per the process, employees are encouraged to report to their supervisor/HR/Compliance any suspected violations of internal policies, code of conduct, external legal and regulatory requirements etc. Prompt and thorough investigation of alleged violation is conducted by an independent authority, reporting directly to the Head – Internal Audit, and appropriate corrective action is then taken by HR, if needed.
ICICI PRU AR09_Final Pg29-197 (Ac).indd Sec1:49ICICI PRU AR09_Final Pg29-197 (Ac).indd Sec1:49 10/28/09 6:00:06 PM10/28/09 6:00:06 PM

I 50 I
FINANCIAL REPORT
MANAGEMENT DISCUSSION AND ANALYSIS1. Industry and competitive dynamics India is one of the fastest growing emerging insurance markets globally. Until the year 2000, the Indian Insurance
market was a monopoly of the Life Insurance Corporation of India (LIC). Since liberalisation, the Indian insurance market has grown rapidly with insurance penetration rising from 1.2% in fiscal 2000 to ~4.4% in fiscal 2009.
The Indian economic fundamentals, such as structural shift of the economy towards the service sector, favourable demographic profile, rising income and higher orientation towards savings by households gave a conducive environment for the insurance industry to record unprecedented growth between 2000 to 2008. The growth has been led by the private life insurance companies, which have expanded the market by developing new and innovative distribution channels, geographical expansion and innovative products for the consumer. The new business premium registered a CAGR of 30% in the period from fiscal 2000 to fiscal 2008, with the private players garnering 50% of the market share by fiscal 2008. The table below depicts the multifold growth of the life insurance sector post liberalisation:
Particulars Fiscal 2000 Fiscal 2005 Fiscal 2008 Fiscal 2009
Number of Players 1 14 18 22New Business Premium (Rs. bn) 64 253 930 871Total Premium (Rs. bn) 270 786 1,950 ~2,170Penetration as a % of GDP 1.2% 2.6% 4.4% ~4.4%Insurance Premium per capita (Rs) 280 700 ~1,700 ~1,903
Fiscal 2009 presented a paradigm which tested the industry’s ability to adapt. The external environment changed dramatically with the financial turmoil. These unprecedented events had a far reaching impact on the industry as a whole. With investors turning risk averse, new business premium flows slowed down and the total industry reported a negative growth of 10% for the first time since liberalisation while private industry grew by 1%.
The Company proved its agility by quickly responding to the environment by adopting a multi-pronged strategy around products, customer communication and distributor engagement.
Products – With customers being risk averse their preference shifted to products with gaurantee. The Company adapted to the environment and accordingly launched products with assured returns.
Customer communication – The communication was geared to provide comfort to customers on the financial stability of the sector and the Company as well as to communicate that given the long term objectives that are being saved towards, the shorter term volatility has less impact.
Distributor engagement / communication – It was imperative to engage with the distributors and facilitate them in handling customers in a volatile market environment while reiterating the message of long term savings.
As a result of our strategy we sustained our private market leadership for ninth year in succession. The market share of the company for fiscal 2009 stood at 10.9%. Our strategy also helped affirm customer confidence and trust which was corroborated by the growth in the Company’s renewal premium by 61% in fiscal 2009 and an increase in funds under management from Rs. 285.78 bn in fiscal 2008 to Rs. 327.88 bn in fiscal 2009.
The Company, in addition to maintaining its market leadership in private space, continued its focus towards the path of achieving break-even over the next few years through extensive initiatives around cost management, launch of innovative products with higher profitability and improved customer servicing for business retention
The company is well positioned to take advantage of the economic turnaround with one of the largest distribution franchises including over 277,000 agents; 2,099 branches and over 200 corporate tie-ups. The focus towards achieving a balanced distribution mix continues with alternate channels contributing 44% of APE for fiscal 2009. Further, the company has an employee base of 24,000 to cater to the needs of its large customer base.
2. Financial statements Financial statements of the Company have been prepared and presented under the historical cost convention,
on the accrual basis of accounting, in accordance with accounting principles generally accepted in India, in compliance with the accounting standards (`AS`) prescribed in the Companies (Accounting Standards) Rules, 2006, to the extent applicable, and in accordance with the provisions of the Insurance Act, 1938, Insurance Regulatory and Development Authority Act, 1999, and the regulations framed there-under, the Companies Act, 1956, to the extent applicable, various circulars issued by IRDA and the practices prevailing within the insurance industry in India.
ICICI PRU AR09_Final Pg29-197 (Ac).indd Sec1:50ICICI PRU AR09_Final Pg29-197 (Ac).indd Sec1:50 10/28/09 6:00:06 PM10/28/09 6:00:06 PM

I 51 I
ANNUAL REPORT 2008-09ICICI PRUDENTIAL LIFE INSURANCE
The management evaluates all recently issued or revised accounting pronouncements on an ongoing basis. The estimates and assumptions used in the financial statements are based upon management’s evaluation of the relevant facts and circumstances as on the date of the financial statements. Such estimates and assumptions have been made on a prudent and reasonable basis, in order that the financial statements reflect in true and fair manner the form and substance of transactions, and reasonably present our state of affairs and financial position for the year.
3. Results from Operations
Key highlights for fiscal 2009 The Company’s extensive focus on efficiencies helped in net loss after tax being reduced by 44% from Rs.
13.95 bn in fiscal 2008 to Rs. 7.80 bn in fiscal 2009. This was supported by a decline in expense ratio from 14.9% in fiscal 2008 to 11.8% in fiscal 2009 (Expense ratio = All expenses (including commission and front line sales cost) / (Total premium income – 90%of single premium))
The Company’s continued focus on customer retention was reflected in policy surrenders which came down from 8.4% of average assets in fiscal 2008 to 6.5% in fiscal 2009. This affirmed the customer confidence and trust in the Company which was further corroborated by the growth in the Company’s renewal premium by 61% in fiscal 2009 and an increase in funds under management from Rs. 285.78 in fiscal 2008. to Rs. 327.88 bn in fiscal 2009.
Total premium grew by 13% in fiscal 2009. New Business Profit (NBP) is a metric for the economic value of the new business written during the period
and is measured as the present value of the profits for the shareholders on account of new business sales on assumptions of various parameters such as investment returns, inflation, mortality, persistency and expenses. NBP for fiscal 2009 stood at Rs. 10.04 bn with margin at 18.9% of the APE.
Statement below summarises the company’s profit and loss account:(Rs. in bn)
Particulars Fiscal 2009 Fiscal 2008Premium Income 153.18 135.37Income from investments (61.12) 29.85Fees and Charges 0.02 0.03Commission (7.00) (8.11)Operating expenses (27.69) (30.11)Benefits paid (22.07) (20.15)Change in valuation of liability in respect of life policies (43.92) (122.03)Taxes 0.80 1.19Surplus/(Deficit) (7.80) (13.95)
Indian accounting principles do not allow for amortisation of the up-fronted costs over the life of the policy. In the life insurance business while the expenses are incurred upfront, the revenue and profit streams emerge over time. As a result, the business tends to incur losses in the initial years on account of new business strain.
The second driver for losses in the initial years is costs to set up infrastructure that will yield new business over a period of time. The expenses assumed in pricing of products are on the basis of stable state assumption while a lot of cost is incurred upfront on setting up new branches and the additional fixed costs until they operate at a mature sales capacity. These costs include rental costs, branch management costs and other support costs.
During fiscal 2009 the Company through extensive focus on efficiencies, amongst other measures, has been able reduce net loss after tax by 44% on a 13% increase in premium income.
a. Premium income
The total premium income increased from Rs 135.37 bn for the year ended March 31, 2008 to Rs. 153.18 bn for the year ended March 31, 2009, a growth of 13%. Similarly renewal business premium grew by Rs. 33.46 bn, a growth of 61% up from Rs. 55.26 bn for the year ended March 31, 2008 to Rs. 88.72 bn for the year ended March 31, 2009. New business premium for the year ended March 31, 2009 was at Rs. 64.84 bn arising from 2.64 million policies added in fiscal 2009, down from Rs 80.35 bn for the year ended March 31, 2008. Decline in new business premium is primarily attributable to the turmoil faced globally as well as in India in the financial services sector.
Linked business constituted 94.45% of the total new business premium for the Company for fiscal 2009 compared to 93.91% for fiscal 2008.
Total policies issued till the end of fiscal 2009 stood at 9.56 million policies.
ICICI PRU AR09_Final Pg29-197 (Ac).indd Sec1:51ICICI PRU AR09_Final Pg29-197 (Ac).indd Sec1:51 10/28/09 6:00:06 PM10/28/09 6:00:06 PM

I 52 I
FINANCIAL REPORT
b. Income from Investments Details on income from Investments are given in the table below:
(Rs. in bn)
Particulars Fiscal 2009 Fiscal 2008Interest, dividend and rent 11.69 6.47 Profit / (loss) on sale of Investments* (net) (17.03) 17.06 Unrealised gain/loss (55.78) 6.32
Total income / (loss) on Investments (61.12) 29.85 * includes appropriation/expropriation adjustment account
Fiscal 2009 was a year of extreme and unprecedented events. Global financial markets felt the full impact of sub-prime crisis and thus, exhibited extreme volatility and risk aversion. This had an impact on Indian markets as well. BSE Sensex fluctuated between 8,160 and 17,600 during the year accompanied by significant volatility. Similarly, yield on 10 year benchmark government security swung between 9.47% at its peak due to poor liquidity conditions and the low of 5.10% on account of huge monetary easing by the central bank, before closing the year at 7.01%.
It must be noted that as per IRDA regulations on preparation of financial statements the revenue account must include income from investments for shareholders’ and policyholders’ (for non-unit linked and unit linked business). Income on investments for policyholders’ – unit linked business, although disclosed in revenue account, does not get transferred to the shareholders’ as it belongs to the linked policyholders and any increase or decrease in income on investments for unit linked business is offset in the revenue account by a corresponding effect in the linked liabilities.
The total income / (loss) on investments includes loss from Policyholders’ unit linked business of Rs. 64.32 bn for the year ended March 31, 2009 and income of Rs. 27.24 bn for the year ended March 31, 2008. As discussed above, such income / (loss) does not belong to shareholders and has no impact on the revenue account. Excluding income / (loss) attributable to policyholders’ unit linked component, the income / (loss) on investments for the company would be as follows:
(Rs. in bn)
Particulars Fiscal 2009 Fiscal 2008Interest, dividend and rent 2.76 1.88Profit / (loss) on sale of Investments (net) 0.45 0.74Total income / (loss) on Investments 3.21 2.62
Interest, dividend and rent: During the year ending March 31, 2009, interest income, dividend and rent increased by over 80% due to
higher interest income on account of increased interest rates along with increase in investment in debt securities during the year. The table set forth indicates average investments and average yield earned.
(Rs. in bn)
Particulars Fiscal 2009 Fiscal 2008Average interest earning assets 106.89 68.62Average yield 8.67% 7.95%
Profit and Loss on sale of investments: Profit and losses are realised as we realign our portfolio based on market conditions and expected relative
attractiveness of securities and sectors going forward.
Unrealised gain/loss (linked portfolio): Unrealised gains or losses result from pure marked-to-market valuation of assets held in linked portfolios.
The overall income from investments (including policyholders unit linked component) is lower on account of unrealised loss recognised in the linked portfolios whose value eroded on account of the decline witnessed in the equity markets during the fiscal 2009. Equity as an asset class is volatile over short term and therefore, can lead to marked-to-market losses over shorter time periods. However, as an asset class, it delivers healthy positive returns over the long term. We manage our equity funds with a long-term focus and aim to deliver superior risk-adjusted returns over the long term.
We continue to manage our portfolio with a long-term focus in this volatile market scenario. We evaluate the long term performance for all our unit linked funds by tracking their performance against benchmark for all such funds that have been in existence for more than three years. We are pleased to report that as on March 31, 2009 all the unit linked funds that have been outstanding for more than three years have outperformed their respective benchmarks.
ICICI PRU AR09_Final Pg29-197 (Ac).indd Sec1:52ICICI PRU AR09_Final Pg29-197 (Ac).indd Sec1:52 10/28/09 6:00:06 PM10/28/09 6:00:06 PM

I 53 I
ANNUAL REPORT 2008-09ICICI PRUDENTIAL LIFE INSURANCE
Retail life funds: since inception for period ended March 31, 2009
20.00%
16.00%
12.00%
8.00%
4.00%
0.00%Preserver
Benchmark Fund
Protector Balancer Maximiser
6.39% 5.96%
9.68%
14.86%
7.56%6.96%
11.93%
19.06%
Benchmarks : Preserver Fund – CRISIL Liquid Fund Index Protector Fund – CRISIL Composite Bond Index Balancer Fund – 65% CRISIL Composite Bond Index + 35% BSE 100 Maximiser Fund – BSE 100
Inception Dates: Preserver Fund – May 17, 2004 Protector Fund – April 2, 2002 Balancer Fund – April 2, 2002 Maximiser Fund – November 16, 2001
c. Commission
Commission paid during the year is analysed as follows:(Rs. in bn)
Particulars Fiscal 2009 Fiscal 2008
Total Commission 7.00 8.11Total Premium (net of reinsurance premium) 153.18 135.37Commission as a % of Premium 4.6% 6.0%Renewal premium as a % of Total premium 58% 41%Pension mix in new business premium 45% 37%
There is a reduction in commission by 14% vis-à-vis the increase in premium by 13%. This is primarily due to increase in proportion of renewal premium and increase in proportion of pension business in new business premium, where commission rates are lower compared to the new life business.
d. Operating expenses(Rs. in bn)
Particulars Fiscal 2009 Fiscal 2008 Growth
Acquisition costs 8.35 10.84 (23%)Operating expenses - Semi variable expenses 4.70 7.74 (39%) - Fixed expenses 12.88 10.71 20% - Others 1.76 0.82 115%Total Expenses 27.69 30.11 (8%)New business premium 64.84 80.35 (19%)Total Premium 153.18 135.37 (13%)
Operating expenses as a % of Premium 18.1% 22.2%
ICICI PRU AR09_Final Pg29-197 (Ac).indd Sec1:53ICICI PRU AR09_Final Pg29-197 (Ac).indd Sec1:53 10/28/09 6:00:07 PM10/28/09 6:00:07 PM

I 54 I
FINANCIAL REPORT
The total operating expenses of the Company has been broken into acquisition costs, semi variable expenses, fixed expenses and others.
Acquisition costs mainly include frontline sales staff cost; the reduction in acquisition costs of 23% is in line with fall in new business premium.
Details of semi variable and fixed expenses are given below:
Semi variable expenses, which mainly includes advertising costs, policy related variable costs, sales incentives and meets and employee training, etc, on an aggregate basis have decreased more than proportionate when compared with decrease in new business premium, mainly due to significant focus on cost efficiencies driven by the Company during fiscal 2009.
While fixed expenses have increased when compared to the expense for fiscal 2008, there is actually a saving if the annaulised cost for employee and infrastructure cost for Q4-2008 is considered as the base. Employee and infrastructure costs account for about 75% of fixed expenses. At the run rate of Q4-2008 for these costs, the Company has achieved a saving of approximately 15% when Q4-2008 expenses are annualised and taken as the base for fiscal 2009 and compared with the actual expenses.
Other expenses mainly include service tax expenses incurred by unit linked funds on linked charges debited to funds which have corresponding reversal under unit reserve and hence it is profit and loss neutral.
e. Benefits paid
A summary of benefits paid is given in the table below:
(Rs. in bn)
Particulars Fiscal 2009 Fiscal 2008
Death Claims 1.37 0.80 Maturity Claims 0.57 0.55 Surrenders 19.74 18.55 Survival Benefits 0.58 0.33 Amount recovered from reinsurer (0.19) (0.08)
Total Claims 22.07 20.15
Death claim per Rs. 1000 sum assured 0.063 0.050
Surrender claims % of assets held 6.54% 8.44%
Benefits paid represents amount paid back to policyholders or their legal heirs, on occurrence of an insured event as per the contractual terms of an Insurance Contract. The Company’s claim experience continues to remain favourable.
f. Change in valuation of liability in respect of life policies
(Rs. in bn)
Particulars March 31, 2009 March 31, 2008
Non-unit reserves - Participating 3.52 2.33 - Non-participating 2.92 3.56Change in unit reserves 37.48 116.14
Total 43.92 122.03
Policy liabilities for non-linked business represent actuarial liability set up in respect of life policies in force and for policies in respect of which premium has been discontinued but a liability still exists. Reserves on both participating and non-participating policies are calculated using the gross premium method, using assumptions for interest, mortality, expense and inflation, and in the case of participating policies, future bonuses together with allowance for taxation and allocation of profits to shareholders. Change in reserves charged to the revenue account is the difference between policy liabilities as on two balance sheet dates.
For linked business the unit reserve is number of units held by the policyholder multiplied by the NAV at the valuation date. Change in unit reserves is the difference between policy liabilities as on two balance sheet dates.
ICICI PRU AR09_Final Pg29-197 (Ac).indd Sec1:54ICICI PRU AR09_Final Pg29-197 (Ac).indd Sec1:54 10/28/09 6:00:07 PM10/28/09 6:00:07 PM

I 55 I
ANNUAL REPORT 2008-09ICICI PRUDENTIAL LIFE INSURANCE
g. Taxes paid(Rs. in bn)
Particulars March 31, 2009 March 31, 2008Deferred tax asset 1.01 1.48Fringe benefit tax (0.21) (0.29)Total 0.80 1.19
The Company has created deferred tax asset on eligible tax losses to the extent it is virtually certain of realisability. Deferred tax asset has been created on the basis of the profit on the existing book of contracts which is virtually certain of arising, incorporating projected incomes.
4. Financial Condition The following table sets forth, for the periods indicated, the summarised balance sheet.
(Rs. in bn)
Particulars March 31, 2009 March 31, 2008
Sources of Funds:Equity capital and reserves 47.81 37.75Policyholders’ Funds 311.07 270.21Funds for Future Appropriations 7.17 5.38Current liabilities and provisions 12.50 18.09
Total 378.55 331.43
Application of Funds:Investments - Shareholders’ 6.62 2.11 - Policyholders’ 34.31 34.49Asset held to cover linked liabilities 286.14 248.66Fixed assets 3.31 3.28Deferred tax asset 3.18 2.17Current assets, loans and advances 7.23 10.75Debit balance in Profit and loss account 37.76 29.97
Total 378.55 331.43
Sources of Funds
a. Equity capital and reserves
Equity capital Company’s issued and subscribed share capital comprises of 1,427,257,293 equity shares of face value of
Rs. 10 each. Of the above 99.90% equity shares is held by the Promoters and balance 0.10% equity shares is issued to employees’ under Company’s employee stock option plan.
The table below summarises shareholding pattern:
ShareholderAs at March 31, 2009
Number of Shares % of Holding
Promoters - ICICI Bank Limited 1,055,162,900 73.93 - Prudential Corporation Holdings Limited 370,732,884 25.97
Others 1,361,509 0.10
Total 1,427,527,293 100.00
Reserves
A summary of reserves and surplus is provided in the table below:(Rs. in bn)
Particulars March 31, 2009 March 31, 2008
Share premium 33.53 23.71
Others 0.01 0.03
Total 33.54 23.74
ICICI PRU AR09_Final Pg29-197 (Ac).indd Sec1:55ICICI PRU AR09_Final Pg29-197 (Ac).indd Sec1:55 10/28/09 6:00:07 PM10/28/09 6:00:07 PM

I 56 I
FINANCIAL REPORT
The total capital infusion by the promoters during the year amounted to Rs. 10.00 bn, which was issued at a share premium of Rs. 390 per share amounting to Rs. 9.75 bn. Under Company’s approved Employees Stock Option Scheme 1,143,570 shares were allotted during year. Balance addition to the share premium is on account of shares issued under Employee stock option scheme. The Company is subject to the minimum solvency requirements prescribed by IRDA – Insurance Regulatory and Development Authority (Assets, Liabilities and Solvency Margin of Insurers) Regulations, 2000 which mandates a minimum solvency margin (i.e. excess of value of assets over value of insurance liabilities) of 150%. As at March 31, 2009 the company was well capitalised with a total capital base of Rs. 47.80 bn (Share capital plus share premium) and a solvency margin of 231%.
b. Policyholders’ funds
A summary of policyholders’ funds is provided in the table below:
(Rs. in bn)
Particulars March 31, 2009 March 31, 2008
Reserves
- Fair value change account 0.21 1.77
- Revaluation reserve 0.32 0.32
Policy liabilities 29.99 23.55
Provision for linked liabilities 280.55 244.57
Total 311.07 270.21
Fair value change account represents unrealised gain (net) on equity and mutual fund securities outstanding in policyholders’ investments as on the balance sheet date. Such marked to market of securities is as on the reporting date in line with requirements of IRDA regulations on Investments valuation. Movement in fair value change account is a function of performance of equity stock market and mix of equity and mutual fund securities in total investment portfolio.
The Company has an Investment property which was re-valued in fiscal 2007 based on valuation done by an independent valuer and as per the requirements of IRDA regulations. The value of investment property is disclosed at revalued amount and the change in carrying amount is classified under Revaluation Reserve. The value of the investment property in accordance with the independent valuation is Rs. 501,840 thousand (Historical cost: Rs. 185,521 thousand). Company on each Balance Sheet date assess whether any impairment of Investment property has occurred.
c. Funds for future appropriations (FFA)
Summary of funds for future appropriations is provided in the table below:
(Rs. in bn)
Particulars March 31, 2009 March 31, 2008
Funds for future appropriations – Linked 5.59 4.09
Funds for future appropriations – Non-linked 1.58 1.28
Total 7.17 5.37
Funds for future appropriations (FFA) – Linked
It represents amounts that are identified by the Appointed Actuary in respect of lapsed policies which are entitled to be revived but not likely to be revived. As per IRDA stipulations, no reserve is required to be held for such policies however, since the revival period has not expired, the reserves released as above are required to be disclosed as a separate item under the head “Funds for Future Appropriations” in the Balance Sheet and corresponding entries are required to be made in the Revenue Account (Policyholders Account) under Appropriations. Such reserves are required to be held as an earmarked reserve until the expiry of the revival period, after which the same can be released in the P&L statement.
Rs. 5.59 bn shown under the head FFA – Linked, represents reserves in respect of lapsed linked policies, net of amount transferred to Shareholder’s P&L, which are entitled to be revived but in the opinion of the Appointed Actuary not likely to be revived.
ICICI PRU AR09_Final Pg29-197 (Ac).indd Sec1:56ICICI PRU AR09_Final Pg29-197 (Ac).indd Sec1:56 10/28/09 6:00:07 PM10/28/09 6:00:07 PM

I 57 I
ANNUAL REPORT 2008-09ICICI PRUDENTIAL LIFE INSURANCE
Funds for future appropriations (FFA) – Non-linked
Insurance regulations require minimum 90% of the surplus under Participating Line of business to be distributed to the policyholders. And hence until the time bonus is declared and distributed by the Company, entire surplus under the participating line of business is appropriated via Policyholders’ Revenue account as Funds for Future Appropriation - Non linked. On declaration of Bonus, the said amount would get appropriated from Funds for Future Appropriation for its distribution to the policyholders and a maximum of 1/9th the cost of new bonus declared can be transferred to Shareholders’ Profit & Loss account. Amount of Rs. 1.58 bn shown under the head FFA – Non linked, represents accumulated surplus available for distribution post recommendation from the Appointed Actuary.
Amount transferred to the Shareholders’ Profit & Loss account by way of bonus distribution (1/9th) for the year ended March 31, 2009 was Rs. 0.04 bn (previous year ended March 31, 2008: Rs. 0.02 bn).
d. Current liabilities and Provisions
Current liabilities
A summary of Current liabilities is provided in the table below.
(Rs. in bn)
Particulars March 31, 2009 March 31, 2008
Sundry creditors 4.01 5.74
Unallocated premium 1.69 2.15
Agents balances 0.38 0.58
Taxes payable 0.28 0.47
Policyholders’ claims payable 0.19 0.08
Deposits 0.01 0.01
Reinsurance premium payable 0.06 0.11
Other liabilities 4.68 6.94
Total 11.30 16.08
Sundry creditors represents amount payable for various goods and services availed by the Company, it also includes amount provisioned for expenses at the year end. This has decreased mainly due to limited expansion carried out by the Company during the year and reduction in overall business volumes in fiscal 2009 vis-à-vis fiscal 2008.
Unallocated premium mainly includes premium deposit received which is pending to be allocated for issuance of an insurance policy. It also includes amount of Rs. 0.77 bn (previous year: Rs. 1.05 bn) as premium received in advance which will be recognised as premium income on the due date of the policy. There is also certain money included in unallocated premium which needs to be refunded back to the policyholders on freelook or cancellation of policy and is outstanding in the normal process of refund.
Agents’ balances represents amount payable to Advisors towards commission as on the balance sheet date. Amount outstanding is mainly attributable to business sourced during the last month of the financial year.
Taxes payable represent tax deducted and payable under Income tax regulations, such taxes will be paid in due course within their due dates.
Policyholders’ claims payable represents amount payable to the policyholders for all the claims intimation viz. Death, Survival etc. that are received by the Company and are outstanding due to pending investigation as a part of the normal claims process or are pending due to incomplete documentation from the Policyholders.
Other liabilities mainly include amount payable to Unit linked funds towards premium collections which had happened during the last few days of the financial year. Such amounts are transferred subsequently. Amount payable as on March 31, 2009 is Rs. 4.00 bn (previous year: Rs. 6.44 bn). It also includes amounts for all those cheques that are issued but their validity period has got expired, monies withheld on contractor payments pending final acceptance of their work, all statutory deductions from salaries paid to the employees and other sundry payables.
ICICI PRU AR09_Final Pg29-197 (Ac).indd Sec1:57ICICI PRU AR09_Final Pg29-197 (Ac).indd Sec1:57 10/28/09 6:00:08 PM10/28/09 6:00:08 PM

I 58 I
FINANCIAL REPORT
Provisions
A summary of provisions is provided in the table below:
(Rs. in bn)
Particulars March 31, 2009 March 31, 2008
Provision for Service Tax un-utilised credit 0.86 1.80
Provision for Leave Encashment and Gratuity 0.28 0.15
Taxation – fringe benefit tax 0.06 0.06
Total 1.20 2.01
The Company has created a provision for Service tax un-utilised credit for an amount equivalent to Service tax un-utilised credit shown under current assets, the rationale behind creating such provision comes from existing cenvat credit rules which do not require maintenance of separate register, as records maintained in financial accounts are accepted for the purpose of availing credit. Further, as per the provisions of Accounting Standard, Insurance Company should carry forward excess credit only if it can determine with certainty that the balance would be utilised in near future.
Company’s liability towards leave encashment and Gratuity is actuarially valued and is as per the requirements of revised Accounting Standard 15 on Employee benefits and it also includes amount provided as at March 31, 2009 for leaves which can be encashed by the employees.
Application of Funds
a. Investments
Our primary objective is the safety of our investments and the stability of returns. We ensure that our investment portfolio is adequately diversified and adhere to high standards to quality.
A statement of investments is given below:
(Rs. in bn)
Particulars March 31, 2009 March 31, 2008
Application of Funds:
Investments - Shareholders’ 6.62 2.11 - Policyholders’ 34.31 34.49
Asset held to cover linked liabilities 286.14 248.66
Total 327.07 285.26
As per table given above total investment assets grew from a base of Rs. 285.26 bn by 14.7% to Rs. 327.07 bn during the year. The increase, despite volatile markets, was on account of strong growth in total premiums.
87.3% of total investment assets were held in unit linked funds as on March 31, 2009 up from 87.0% as on March 31, 2008.
The share of debt in investment portfolio has increased from 32% on March 31, 2008 to 51% on March 31, 2009 on account of the mark-to-market impact on equities and a greater allocation of policyholder funds in debt.
Our investment policy is based on prudence, with significant focus on generating returns with limited risk in our assessment. We ensure compliance with IRDA Investment regulations which focusses on the safety of the investor’s money by having a well-diversified quality investment portfolio and transparency in terms of adequate disclosures about the portfolio.
ICICI PRU AR09_Final Pg29-197 (Ac).indd Sec1:58ICICI PRU AR09_Final Pg29-197 (Ac).indd Sec1:58 10/28/09 6:00:08 PM10/28/09 6:00:08 PM

I 59 I
ANNUAL REPORT 2008-09ICICI PRUDENTIAL LIFE INSURANCE
b. Fixed Assets A statement of movement of fixed assets is given below:
(Rs. in bn)
Particulars March 31, 2009 March 31, 2008
Gross block 4.76 3.90Less: Accumulated depreciation 1.56 1.04Net block 3.20 2.86Add: Capital work-in-progress 0.11 0.42
Net fixed assets 3.31 3.28
There was no significant expansion carried out by Company during the year which is reflected in the marginal increase in net fixed assets in fiscal 2009. During the year Company’s number of branches increased from 1,956 to 2,099.
c. Deferred tax asset The Company recorded deferred tax assets of Rs. 3.18 bn as of March 31, 2009 (as of March 31, 2008:
Rs. 2.17 bn). Deferred tax assets represent timing differences in the financial and tax books arising from brought forward tax losses. Company assesses the likelihood that deferred tax assets will be recovered from future taxable income. Company believes it is more likely than not that the benefits of these deductible differences will realise.
d. Current assets, loans and advances A summary of Current assets, loans and advances is provided in the table below:
(Rs. in bn)
Particulars March 31, 2009 March 31, 2008
Cash and bank balances 3.56 6.16Deposits 1.08 0.76Service Tax un-utilised credit 0.86 1.80Income accrued on investments 0.86 0.67Outstanding premium 0.27 0.18Prepayments 0.17 0.23Loans 0.05 0.04Advance taxes paid 0.01 0.01
Other advances 0.37 0.90
Total 7.23 10.75
The Cash and bank balances represent amount collected during last few days of the financial year and it also includes Cheques on hand and Cheques deposited but not cleared. Substantial decline in cash and bank balance is mainly on account of reduced business in fiscal 2009 vis-à-vis fiscal 2008. The bank balances in overseas current accounts (Rs. 0.04 bn as at March 31, 2009) are maintained to meet the expenditure of the representative offices in Dubai and Bahrain.
Deposits represent deposits placed for premises taken on lease for setting up branches as well as for leased accommodations for employees. It also includes electricity deposits, telephone and other utility deposits. Increase in deposits placed as compared to previous year is mainly on account deposits placed for new offices opened during the current year.
Service tax unutilised credit represents cenvat credit asset created from service tax paid to government on commission and on expenses. Such asset is after netting off Company’s service tax liability on premium income. There is no limit on time for which such asset can be carried forward and it can be utilised for payment of service tax liability on taxable services rendered by the Company. However Company on conservative basis creates a provision for an amount equivalent to Service tax unutilised credit.
Income accrued on investments is mainly on fixed deposits, Government securities and Debentures.
Other advances mainly includes amount paid in advance for services to be received in future.
ICICI PRU AR09_Final Pg29-197 (Ac).indd Sec1:59ICICI PRU AR09_Final Pg29-197 (Ac).indd Sec1:59 10/28/09 6:00:08 PM10/28/09 6:00:08 PM

I 60 I
FINANCIAL REPORT
AUDITORS’ REPORTTo the Members of ICICI Prudential Life Insurance Company Limited
1. We have audited the attached Balance Sheet of ICICI Prudential Life Insurance Company Limited (‘the Company’) as at March 31, 2009, the related Revenue Account, the Profit & Loss Account and the Receipts and Payments Account for the year ended on that date annexed thereto, which we have signed under reference to this report. These financial statements are the responsibility of the Company’s management. Our responsibility is to express an opinion on these financial statements based on our audit.
2. We conducted our audit in accordance with auditing standards generally accepted in India. Those standards require that we plan and perform the audit to obtain reasonable assurance about whether the financial statements are free of material misstatement. An audit includes examining, on a test basis, evidence supporting the amounts and disclosures in the financial statements. An audit also includes assessing the accounting principles used and significant estimates made by management, as well as evaluating the overall financial statement presentation. We believe that our audit provides a reasonable basis for our opinion.
3. We report that:
(a) We have obtained all the information and explanations, which to the best of our knowledge and belief were necessary for the purposes of the audit and have found them to be satisfactory;
(b) In our opinion and to the best of our information and according to the explanations given to us, proper books of account as required by law have been maintained by the Company, so far as appears from our examination of those books;
(c) As the Company’s financial accounting system is centralised, no returns for the purposes of our audit are prepared at the branches of the Company;
(d) The Balance Sheet, the Revenue Account, the Profit and Loss Account and the Receipts and Payments Account referred to in this report are in agreement with the books of account;
(e) The actuarial valuation of liabilities for life policies in force is the responsibility of the Company’s Appointed Actuary (‘the Appointed Actuary’). The actuarial valuation of these liabilities as at March 31, 2009 has been duly certified by the Appointed Actuary and in his opinion, the assumptions for such valuation are in accordance with the guidelines and norms issued by the Insurance Regulatory Development Authority (‘IRDA’) (‘Authority’) and the Actuarial Society of India in concurrence with the Authority. We have relied upon Appointed Actuary’s certificate in this regard for forming our opinion on the financial statements of the Company;
(f) On the basis of written representations received from the Directors of the Company, as on March 31, 2009 and taken on record by the Board of Directors, none of the Directors is disqualified as on March 31, 2009 from being appointed as a Director in terms of clause (g) of sub-section (1) of Section 274 of the Companies Act, 1956.
4. In our opinion and to the best of our information and according to the explanations given to us, we further report that:
(a) The Investments have been valued in accordance with the provisions of the Insurance Act, 1938, the Regulations and/or orders/directions issued by IRDA in this behalf;
(b) The accounting policies selected by the Company are appropriate and are in compliance with the applicable Accounting Standards referred to in sub-section (3C) of Section 211 of the Companies Act, 1956 and the Rules framed there under and with the accounting principles as prescribed in the Insurance Regulatory and Development Authority (Preparation of Financial Statements and Auditor’s Report of Insurance Companies) Regulations, 2002, (‘the Regulations’) and orders/directions issued by IRDA in this behalf;
(c) The Balance Sheet, the Revenue Account, the Profit & Loss Account and the Receipts and Payments Accounts dealt with by this report comply with the Accounting Standards referred to in sub-section (3C) of Section 211 of the Companies Act, 1956 and the Rules framed there under to the extent they are not inconsistent with the accounting principles prescribed in the Regulations and orders/directions issued by IRDA in this behalf;
(d) The Balance Sheet, the Revenue Account, the Profit and Loss Account and the Receipts and Payments Account together with the notes thereon and attached thereto are prepared in accordance with the requirements of
ICICI PRU AR09_Final Pg29-197 (Ac).indd Sec1:60ICICI PRU AR09_Final Pg29-197 (Ac).indd Sec1:60 10/28/09 6:00:08 PM10/28/09 6:00:08 PM

I 61 I
ANNUAL REPORT 2008-09ICICI PRUDENTIAL LIFE INSURANCE
the Regulations, the Insurance Act, 1938, the Insurance Regulatory and Development Authority Act, 1999 and the Companies Act, 1956, to the extent applicable and in the manner so required and give a true and fair view in conformity with the accounting principles generally accepted in India:
i. in the case of the Balance Sheet, of the state of affairs of the Company as at March 31, 2009; ii. in the case of Revenue Account, of the net surplus for the year ended on that date; iii. in the case of Profit and Loss Account, of the loss for the year ended on that date; and iv. in the case of the Receipts and Payments Account, of the receipts and payments for the year ended
on that date.
5. Further, on the basis of our examination of books and records of the Company and according to the information and explanations given to us, we certify to the best of our knowledge and belief that:
(a) We have reviewed the Management Report attached to the financial statements for the year ended March 31, 2009, and have found no apparent mistake or material inconsistencies with the financial statements; and
(b) Based on management representations and compliance certificates noted by the Risk Management and Audit Committee, nothing has come to our attention which causes us to believe that the Company has not complied with the terms and conditions of registration stipulated by IRDA.
For Walker, Chandiok & Co For B S R & Co.Chartered Accountants Chartered Accountants
per Khushroo B. Panthaky Akeel MasterPartner PartnerMembership No. 042423 Membership No. 046768
Mumbai, Mumbai,April 21, 2009 April 21, 2009
AUDITORS’ CERTIFICATEIn accordance with the information and explanations given to us and to the best of our knowledge and belief and based on our examination of the books of account and other records maintained by ICICI Prudential Life Insurance Company Limited (‘the Company’) for the year ended March 31, 2009, we certify that:
1. We have verified the cash balances, to the extent considered necessary, and securities relating to the Company’s loans and investments as at March 31, 2009, by actual inspection or on the basis of certificates/confirmations received from the Custodian appointed by the Company, as the case may be. As at March 31, 2009, the Company does not have reversions and life interests;
2. The Company is not a trustee of any trust; and
3. No part of the assets of the Policyholders’ Funds has been directly or indirectly applied in contravention to the provisions of the Insurance Act, 1938, relating to the application and investments of the Policyholders’ Funds.
This certificate is issued to comply with Schedule C of the Insurance Regulatory and Development Authority (Preparation of Financial Statements and Auditor’s Report of Insurance Companies) Regulations 2002, (‘the Regulations’) read with Regulation 3 of the Regulations and may not be suitable for any other purpose.
For Walker, Chandiok & Co For B S R & Co.Chartered Accountants Chartered Accountants
per Khushroo B. Panthaky Akeel MasterPartner PartnerMembership No. 042423 Membership No. 046768
Mumbai, Mumbai,April 21, 2009 April 21, 2009
ICICI PRU AR09_Final Pg29-197 (Ac).indd Sec1:61ICICI PRU AR09_Final Pg29-197 (Ac).indd Sec1:61 10/28/09 6:00:08 PM10/28/09 6:00:08 PM

I 62 I
FINANCIAL REPORT
FORM A-RA
Name of the Insurer: ICICI PRUDENTIAL LIFE INSURANCE COMPANY LIMITEDRegistration number and date of registration with the IRDA : Regn. No. 105 dated 24.11.2000
REVENUE ACCOUNT FOR THE YEAR ENDED MARCH 31, 2009
Policyholders’ Account (Technical Account) (Rs. ‘000)
Particulars Sch Par Life Par Pension Non-Par Annuity
Non-Par Health Linked Life Linked Pension
Linked Health
Linked Group Total
Premiums earned – net
(a) Premium 1 3,631,213 473,182 1,995,922 1,521,027 907,778 78,667,938 53,674,372 445,146 12,245,630 153,562,208
(b) Reinsurance ceded (1,690) (43) (197,902) — (113,106) (42,637) (674) (10,915) (13,305) (380,272)
Income from Investments
(a) Interest, Dividend & Rent - Gross 955,049 269,048 350,259 424,502 26,285 5,600,370 2,225,358 1,960 1,588,519 11,441,350
(b) Profit on sale/redemption of investments 124,825 34,493 60,179 335,086 6,317 11,771,146 2,768,356 1,158 688,727 15,790,287
(c) Loss on sale/redemption of investments (151,533) (30,358) (621) (63,611) (1,592) (22,842,184) (9,006,056) (347) (840,438) (32,936,740)
(d) Unrealised gain/(loss) — — — — — (40,924,861) (14,483,619) 5,740 (379,384) (55,782,124)
(e) Appropriation/Expropriation Adjustment Account — — — — — (14,420) 38,601 176 (8,350) 16,007
Other income:
Contribution from the Shareholders’ Account — — 40,072 64,410 544,089 5,647,655 2,927,194 189,159 73,109 9,485,688
Fees and charges 2,610 — 89 — — 15,610 1,105 — — 19,414
Total (A) 4,560,474 746,322 2,247,998 2,281,414 1,369,771 37,878,617 38,144,637 632,077 13,354,508 101,215,818
Commission 2 209,951 7,595 212,727 581 184,508 4,132,329 2,189,943 62,104 157 6,999,895
Operating expenses related to Insurance business 3 546,329 30,984 1,066,533 5,062 1,117,990 16,986,273 7,220,101 232,705 181,279 27,387,256
Provision for taxation (Fringe benefit tax) 5,540 587 2,051 13 1,785 143,540 57,380 484 — 211,380
Total (B) 761,820 39,166 1,281,311 5,656 1,304,283 21,262,142 9,467,424 295,293 181,436 34,598,531
Benefits paid (Net) 4 454,948 192,753 410,644 408,970 116,990 12,988,759 2,049,332 438 5,442,748 22,065,582
Interim Bonus Paid 425 94 — — — — — — — 519
Change in valuation of liability in respect of life policies 3,065,741 452,808 364,277 1,765,584 (51,502) 2,846,931 25,911,407 336,346 7,730,324 42,421,916
Total (C) 3,521,114 645,655 774,921 2,174,554 65,488 15,835,690 27,960,739 336,784 13,173,072 64,488,017
Surplus/(Deficit) (D) =(A)-(B)-(C) 277,540 61,501 191,766 101,204 — 780,785 716,474 — — 2,129,270
Appropriations
Transfer to Shareholders’ account 31,656 9,814 191,766 101,204 — — — — — 334,440
Balance being funds for future appropriations 245,884 51,687 — — — 780,785 716,474 — — 1,794,830
Total (D) 277,540 61,501 191,766 101,204 — 780,785 716,474 — — 2,129,270
Funds for Future Appropriation
Opening Balance as at April 1, 2008 1,013,279 271,876 — — — 3,304,917 788,435 — — 5,378,507
Add: Current year appropriations 245,884 51,687 — — — 780,785 716,474 — — 1,794,830
Balance Carried forward to Balance Sheet 1,259,163 323,563 — — — 4,085,702 1,504,909 — — 7,173,337
Significant Accounting Policies & Notes to Accounts 16
Details of Total Surplus Par Life Par Pension
(a) Interim bonuses paid 425 94
(b) Allocation of bonus to policyholders’ 284,475 88,236
(c) Surplus shown in the Revenue Account 277,540 61,501
Total Surplus 562,440 149,831
As required by Section 40-B(4) of the Insurance Act, 1938 we certify that all expenses of Management in respect of life insurance business in India by the Company have been fully debited to the Policyholder’s Revenue Account as expenses.
Schedules referred to herein form an integral part of the Policyholders’ Revenue Account.
As per our report of even date attached
For Walker, Chandiok & Co For B S R & Co. For and on behalf of the Board of DirectorsChartered Accountants Chartered Accountants
Khushroo B. Panthaky Akeel Master Avijit Chatterjee K. V. Kamath Keki Dadiseth Barry StowePartner Partner Appointed Actuary Chairman Director DirectorMembership No. 042423 Membership No. 046768
Sanaulla Khan Shikha Sharma N. S. Kannan Company Secretary Managing Director Executive Director Place : Mumbai Date : April 21, 2009
ICICI PRU AR09_Final Pg29-197 (Ac).indd Sec1:62ICICI PRU AR09_Final Pg29-197 (Ac).indd Sec1:62 10/28/09 6:00:08 PM10/28/09 6:00:08 PM

I 63 I
ANNUAL REPORT 2008-09ICICI PRUDENTIAL LIFE INSURANCE
FORM A-RA
Name of the Insurer: ICICI PRUDENTIAL LIFE INSURANCE COMPANY LIMITEDRegistration number and date of registration with the IRDA : Regn. No. 105 dated 24.11.2000
Schedules referred to herein form an integral part of the Policyholders’ Revenue Account.
As per our report of even date attached
For Walker, Chandiok & Co For B S R & Co. For and on behalf of the Board of DirectorsChartered Accountants Chartered Accountants
Khushroo B. Panthaky Akeel Master Avijit Chatterjee K. V. Kamath Keki Dadiseth Barry StowePartner Partner Appointed Actuary Chairman Director DirectorMembership No. 042423 Membership No. 046768
Sanaulla Khan Shikha Sharma N. S. Kannan Company Secretary Managing Director Executive Director Place : Mumbai Date : April 21, 2009
REVENUE ACCOUNT FOR THE YEAR ENDED MARCH 31, 2008
Policyholders’ Account (Technical Account) (Rs. ‘000)
Particulars Sch Par Life Par Pension Non-Par Annuity
Non-Par Health Linked Life
Linked Pension
Linked Group Total
Premiums earned – net
(a) Premium 1 3,516,968 509,135 1,900,922 1,617,470 710,298 77,990,453 39,389,371 9,975,995 135,610,612
(b) Reinsurance ceded (2,088) (82) (172,302) — (29,194) (32,023) (180) (7,088) (242,957)
Income from Investments
(a) Interest, Dividend & Rent - Gross 697,082 216,548 211,388 229,440 25,896 3,292,045 988,291 696,487 6,357,177
(b) Profit on sale/redemption of investments 103,642 67,059 12,127 18,022 4,077 14,668,017 3,437,114 723,265 19,033,323
(c) Loss on sale/redemption of investments (100) — (2,028) (298) (323) (1,945,180) (602,698) (67,079) (2,617,706)
(d) Unrealised gain/(loss) — — — — — 6,356,230 (151,790) 120,429 6,324,869
(e) Appropriation/Expropriation Adjustment Account — — — — — 60,670 65,818 7,601 134,089
Other income:
Contribution from the Shareholders’ Account — — 1,106,478 251,860 775,776 8,544,845 5,131,904 252,632 16,063,495
Fees and charges 1,621 — 173 — 1 28,930 531 70 31,326
Total (A) 4,317,125 792,660 3,056,758 2,116,494 1,486,531 108,963,987 48,258,361 11,702,312 180,694,228
Commission 2 213,611 10,209 136,096 405 167,948 5,519,639 2,060,773 1,002 8,109,683
Operating expenses related to Insurance business 3 964,371 129,014 1,312,197 26,818 1,255,283 17,688,319 7,603,230 220,143 29,199,375
Provision for taxation (Fringe benefit tax) 8,656 1,193 3,222 53 3,209 199,161 74,100 — 289,594
Total (B) 1,186,638 140,416 1,451,515 27,276 1,426,440 23,407,119 9,738,103 221,145 37,598,652
Benefits paid (Net) 4 368,198 170,861 370,914 249,881 26,878 13,626,379 2,855,731 2,479,817 20,148,659
Interim Bonus Paid 429 167 — — — — — — 596
Change in valuation of liability in respect of life policies 1,999,374 325,464 1,234,329 1,839,337 33,213 69,975,459 35,286,642 9,001,350 119,695,168
Total (C) 2,368,001 496,492 1,605,243 2,089,218 60,091 83,601,838 38,142,373 11,481,167 139,844,423
Surplus/(Deficit) (D) =(A)-(B)-(C) 762,486 155,752 — — — 1,955,030 377,885 — 3,251,153
Appropriations
Transfer to Shareholders’ Account 16,633 4,535 — — — — — — 21,168
Balance being funds for future appropriations 745,853 151,217 — — — 1,955,030 377,885 — 3,229,985
Total (D) 762,486 155,752 — — — 1,955,030 377,885 — 3,251,153
Funds for Future Appropriation
Opening Balance as at April 1, 2007 267,426 120,659 — — — 1,349,887 410,550 — 2,148,522
Add: Current year appropriations 745,853 151,217 — — — 1,955,030 377,885 — 3,229,985
Balance Carried forward to Balance Sheet 1,013,279 271,876 — — — 3,304,917 788,435 — 5,378,507
Significant Accounting Policies & Notes to Accounts 16
Details of Total Surplus Par Life Par Pension
(a) Interim bonuses paid 429 167
(b) Allocation of bonus to policyholders’ 149,266 40,648
(c) Surplus shown in the Revenue Account 762,486 155,752
Total Surplus 912,181 196,567
As required by Section 40-B(4) of the Insurance Act, 1938 we certify that all expenses of Management in respect of life insurance business in India by the Company have been fully debited to the Policyholder’s Revenue Account as expenses.
ICICI PRU AR09_Final Pg29-197 (Ac).indd Sec1:63ICICI PRU AR09_Final Pg29-197 (Ac).indd Sec1:63 10/28/09 6:00:08 PM10/28/09 6:00:08 PM

I 64 I
FINANCIAL REPORT
PROFIT & LOSS ACCOUNT FOR THE YEAR ENDED MARCH 31, 2009
Shareholders’ Account (Non-Technical Account)(Rs. ‘000)
Particulars Schedule March 31, 2009 March 31, 2008
Amounts transferred from Policyholders’ account (Technical account) 334,440 21,168
Income from investments
(a) Interest, Dividend & Rent - Gross 256,924 117,134
(b) Profit on sale/redemption of investments 120,860 535,320
(c) Loss on sale/redemption of investments (25,060) (29,892)
Other income — —
Total (A) 687,164 643,730
Expenses other than those directly related to the insurance business 3A 8,472 11,632
Bad debts written-off — —
Amounts transferred to Policyholders’ account (Technical account) 9,485,688 16,063,495
Provisions (other than taxation)
(a) For diminution in value of investments (net) — —
(b) Provision for doubtful debts — —
Total (B) 9,494,160 16,075,127
(Loss) before Tax (8,806,996) (15,431,397)
Provision for Taxation
– Deferred tax (Refer note 3.14 of Schedule 16) 1,010,000 1,480,770
Profit/(Loss) after Tax (7,796,996) (13,950,627)
APPROPRIATIONS
(a) Balance at the beginning of the year (29,967,607) (16,016,980)
(b) Interim dividends paid during the year — —
(c) Proposed final dividend — —
(d) Dividend distribution tax — —
(e) Transfer to reserves/other accounts — —
Profit/(loss) carried to Balance Sheet (37,764,603) (29,967,607)
Significant Accounting Policies and Notes to Accounts 16
Earnings per equity share (Refer note 3.25 of Schedule 16)
Basic earnings per equity share (Rs.) (5.50) (10.28)
Diluted earnings per equity share (Rs.) (5.50) (10.28)
Nominal value per equity share (Rs.) 10.00 10.00
Schedules referred to herein form an integral part of the Shareholders’ Account.
As per our report of even date attached.
For Walker, Chandiok & Co For B S R & Co. For and on behalf of the Board of DirectorsChartered Accountants Chartered Accountants
Khushroo B. Panthaky Akeel Master Avijit Chatterjee K. V. Kamath Keki Dadiseth Barry StowePartner Partner Appointed Actuary Chairman Director DirectorMembership No. 042423 Membership No. 046768
Sanaulla Khan Shikha Sharma N. S. Kannan Company Secretary Managing Director Executive Director Place : Mumbai Date : April 21, 2009
FORM A-PL
Name of the Insurer: ICICI PRUDENTIAL LIFE INSURANCE COMPANY LIMITEDRegistration number and date of registration with the IRDA : Regn. No. 105 dated 24.11.2000
ICICI PRU AR09_Final Pg29-197 (Ac).indd Sec1:64ICICI PRU AR09_Final Pg29-197 (Ac).indd Sec1:64 10/28/09 6:00:09 PM10/28/09 6:00:09 PM

I 65 I
ANNUAL REPORT 2008-09ICICI PRUDENTIAL LIFE INSURANCE
As per our report of even date attached.
For Walker, Chandiok & Co For B S R & Co. For and on behalf of the Board of DirectorsChartered Accountants Chartered Accountants
Khushroo B. Panthaky Akeel Master Avijit Chatterjee K. V. Kamath Keki Dadiseth Barry StowePartner Partner Appointed Actuary Chairman Director DirectorMembership No. 042423 Membership No. 046768
Sanaulla Khan Shikha Sharma N. S. Kannan Company Secretary Managing Director Executive Director Place : Mumbai Date : April 21, 2009
BALANCE SHEET AS AT MARCH 31, 2009
(Rs. ‘000)
Particulars Schedule March 31, 2009 March 31, 2008
SOURCES OF FUNDS
Shareholders’ Funds :
Share capital 5 14,272,573 14,011,137
Share application money 2,282 1,104
Employees stock option outstanding 8,495 19,161
Reserve and surplus 6 33,529,185 23,713,076
Fair Value Change Account - Net (1,461) 9,819
Sub-Total 47,811,074 37,754,297
Borrowings 7 — —
Policyholders’ Funds :
Fair Value Change Account - Net 213,161 1,775,187
Revaluation reserve - Investment Property 316,319 316,319
Policy liabilities 29,987,086 23,545,894
Provision for linked liabilities 280,548,906 244,568,182
Sub-Total 311,065,472 270,205,582
Funds for Future Appropriations
– Linked (Refer note 3.26 of Schedule 16) 5,590,611 4,093,352
– Non linked 1,582,726 1,285,155
Total 366,049,883 313,338,386
APPLICATION OF FUNDS
Investments
– Shareholders’ 8 6,620,077 2,110,191
– Policyholders’ 8A 34,306,152 34,493,049
Asset held to cover linked liabilities 8B 286,139,517 248,661,534
Loans 9 54,035 37,935
Fixed assets 10 3,312,117 3,277,369
Deferred tax asset (Refer note 3.14 of Schedule 16) 3,180,774 2,170,774
Current assets
– Cash and Bank balances 11 3,558,761 6,165,080
– Advances and Other assets 12 3,615,504 4,546,582
Sub-Total (A) 7,174,265 10,711,662
Current liabilities 13 11,303,713 16,081,873
Provisions 14 1,197,944 2,009,862
Sub-Total (B) 12,501,657 18,091,735
Net Current Assets (C) = (A–B) (5,327,392) (7,380,073)
Miscellaneous expenditure (to the extent not written-off or adjusted) 15 — —
Debit Balance in Profit & Loss Account (Shareholders’ account) 37,764,603 29,967,607
Total 366,049,883 313,338,386
Significant Accounting Policies and Notes to Accounts 16
Schedules referred to herein form an integral part of the Balance Sheet
FORM A-BS
Name of the Insurer: ICICI PRUDENTIAL LIFE INSURANCE COMPANY LIMITEDRegistration number and date of registration with the IRDA : Regn. No. 105 dated 24.11.2000
ICICI PRU AR09_Final Pg29-197 (Ac).indd Sec1:65ICICI PRU AR09_Final Pg29-197 (Ac).indd Sec1:65 10/28/09 6:00:09 PM10/28/09 6:00:09 PM

I 66 I
FINANCIAL REPORT
ICICI PRUDENTIAL LIFE INSURANCE COMPANY LIMITED SCHEDULES FORMING PART OF FINANCIAL STATEMENTS
SCHEDULE – 1PREMIUM
For the year ended March 31, 2009 (Rs. ‘000)
Particulars Par Life Par Pension
Non-Par Annuity Non-Par
Health Linked Life
Linked Pension
Linked Health
Linked Group
Total
First year premiums 463,185 2,202 747,883 — 612,924 20,608,416 28,327,840 445,146 8,966,516 60,174,112
Renewal premiums 3,168,028 470,980 432,150 — 294,854 56,487,484 24,590,368 — 3,279,114 88,722,978
Single premiums — — 815,889 1,521,027 — 1,572,038 756,164 — — 4,665,118
Total Premium 3,631,213 473,182 1,995,922 1,521,027 907,778 78,667,938 53,674,372 445,146 12,245,630 153,562,208
Premium Income from business written : In India 3,631,213 473,182 1,995,922 1,521,027 907,778 78,667,938 53,674,372 445,146 12,245,630 153,562,208
Total Premium 3,631,213 473,182 1,995,922 1,521,027 907,778 78,667,938 53,674,372 445,146 12,245,630 153,562,208
For the year ended March 31, 2008 (Rs. ‘000)
Particulars Par Life Par Pension
Non-Par Annuity Non-Par
Health Linked Life
Linked Pension
Linked Health
Linked Group
Total
First year premiums 471,197 2,688 510,806 — 636,551 36,247,767 28,578,189 — 7,272,250 73,719,448
Renewal premiums 3,045,771 506,447 261,477 — 73,747 38,699,031 9,972,879 — 2,703,745 55,263,097
Single premiums — — 1,128,639 1,617,470 — 3,043,655 838,303 — — 6,628,067
Total Premium 3,516,968 509,135 1,900,922 1,617,470 710,298 77,990,453 39,389,371 — 9,975,995 135,610,612
Premium Income from business written : In India 3,516,968 509,135 1,900,922 1,617,470 710,298 77,990,453 39,389,371 — 9,975,995 135,610,612
Total Premium 3,516,968 509,135 1,900,922 1,617,470 710,298 77,990,453 39,389,371 — 9,975,995 135,610,612
SCHEDULE – 2COMMISSION EXPENSES
For the year ended March 31, 2009 (Rs. ‘000)
Particulars Par Life Par Pension
Non-Par Annuity Non-Par
Health Linked Life
Linked Pension
Linked Health
Linked Group
Total
Commission *
Direct – First year premiums 113,944 159 197,371 — 171,561 2,667,757 1,886,016 62,104 157 5,099,069
– Renewal premiums 96,007 7,436 13,577 — 12,947 1,439,639 289,848 — — 1,859,454
– Single premiums — — 1,779 581 — 24,933 14,079 — — 41,372
Total 209,951 7,595 212,727 581 184,508 4,132,329 2,189,943 62,104 157 6,999,895
Add: Commission on re-insurance accepted
— — — — — — — — — —
Less: Commission on re-insurance ceded
— — — — — — — — — —
Net Commission 209,951 7,595 212,727 581 184,508 4,132,329 2,189,943 62,104 157 6,999,895
Break-up of the expenses (Gross) incurred to procure business
Tied Agency 162,799 5,886 129,934 353 100,481 2,484,676 1,186,409 51,926 157 4,122,621
Corporate Agency 28,174 1,290 39,772 89 44,379 1,306,345 780,599 5,857 — 2,206,505
Brokers 2,981 12 1,411 6 1,820 98,719 58,097 1,729 — 164,775
Referral 15,997 407 41,610 133 37,828 242,589 164,838 2,592 — 505,994
Total Commission 209,951 7,595 212,727 581 184,508 4,132,329 2,189,943 62,104 157 6,999,895
* Commission includes referral payments
ICICI PRU AR09_Final Pg29-197 (Ac).indd Sec1:66ICICI PRU AR09_Final Pg29-197 (Ac).indd Sec1:66 10/28/09 6:00:09 PM10/28/09 6:00:09 PM

I 67 I
ANNUAL REPORT 2008-09ICICI PRUDENTIAL LIFE INSURANCE
SCHEDULE – 2COMMISSION EXPENSES (Contd.)
For the year ended March 31, 2008 (Rs. ‘000)
Particulars Par LifePar
PensionNon-Par
Annuity Non-Par
HealthLinked
LifeLinked
PensionLinked Health
Linked Group
Total
Commission *
Direct – First year premiums 101,097 197 115,795 — 165,515 4,377,773 1,924,453 — 661 6,685,491
– Renewal premiums 112,514 10,012 9,584 — 2,433 1,087,166 121,051 — — 1,342,760
– Single premiums — — 10,717 405 — 54,700 15,269 — 341 81,432
Total 213,611 10,209 136,096 405 167,948 5,519,639 2,060,773 — 1,002 8,109,683
Add: Commission on re-insurance accepted
— — — — — — — — — —
Less: Commission on re-insurance ceded
— — — — — — — — — —
Net Commission 213,611 10,209 136,096 405 167,948 5,519,639 2,060,773 — 1,002 8,109,683
Break-up of the expenses (Gross) incurred to procure business
Tied Agency 168,727 7,930 78,015 310 103,508 3,701,524 1,083,751 — 880 5,144,645
Corporate Agency 31,326 1,828 31,195 63 47,825 1,421,578 743,519 — 65 2,277,399
Brokers 1,406 16 691 4 776 50,560 33,783 — — 87,236
Referral 12,152 435 26,195 28 15,839 345,977 199,720 — 57 600,403
Total Commission 213,611 10,209 136,096 405 167,948 5,519,639 2,060,773 — 1,002 8,109,683
* Commission includes referral payments
SCHEDULE – 3OPERATING EXPENSES RELATED TO INSURANCE BUSINESS
For the year ended March 31, 2009 (Rs. ‘000)
Particulars Par LifePar
PensionNon-Par
Annuity Non-Par
HealthLinked
LifeLinked
PensionLinked Health
Linked Group
Total
Employees’ remuneration and welfare benefits 202,297 9,345 338,698 2,097 645,885 6,573,552 3,027,809 89,977 20,875 10,910,535
Travel, conveyance and vehicle running expenses 17,511 1,271 18,470 178 37,698 529,250 244,801 7,239 14,503 870,921
Rents, rates and taxes 58,827 3,154 98,346 510 55,594 1,770,713 788,802 25,644 — 2,801,590
Repairs 25,488 3,959 26,992 121 16,235 486,476 207,808 6,106 — 773,185
Printing and stationery 20,025 1,505 32,864 73 22,352 239,493 80,544 4,562 110,967 512,385
Communication expenses 50,745 3,885 96,789 301 53,616 740,552 287,778 13,224 1,101 1,247,991
Legal and professional charges 11,866 1,177 7,646 110 34,766 332,477 142,156 4,405 3,441 538,044
Medical fees 1,690 12 23,272 — 17,466 23,219 3,431 11,306 — 80,396
Auditors’ fees :
(a) as auditor 217 26 60 — 47 5,442 1,972 27 — 7,791
(b) as advisor or in any other capacity, in respect of Taxation matters 4 1 1 — 1 108 39 1 — 155
Advertisement and publicity 13,707 960 41,546 115 17,216 817,847 218,751 5,709 1,193 1,117,044
Interest and bank charges 14,532 271 40,505 318 25,282 185,816 44,977 5,454 1,715 318,870
Agents training, recruitment and incentives 20,152 14 24,750 317 31,551 1,046,565 495,496 17,495 2 1,636,342
Depreciation 22,805 2,515 20,759 101 12,753 346,844 143,576 4,672 65 554,090
Service tax on premium absorbed 353 19 589 3 333 — — — — 1,297
Information technology cost 14,563 1,133 41,682 107 15,949 138,749 49,636 2,657 — 264,476
Administration support expenses 23,866 50 189,375 223 29,796 1,358,973 593,051 6,403 — 2,201,737
Others 47,681 1,687 64,189 488 101,450 2,390,197 889,474 27,824 27,417 3,550,407
Total 546,329 30,984 1,066,533 5,062 1,117,990 16,986,273 7,220,101 232,705 181,279 27,387,256
ICICI PRU AR09_Final Pg29-197 (Ac).indd Sec1:67ICICI PRU AR09_Final Pg29-197 (Ac).indd Sec1:67 10/28/09 6:00:09 PM10/28/09 6:00:09 PM

I 68 I
FINANCIAL REPORT
SCHEDULE – 3OPERATING EXPENSES RELATED TO INSURANCE BUSINESS (Contd.)
For the year ended March 31, 2008 (Rs. ‘000)
Particulars Par LifePar
PensionNon-Par
Annuity Non-Par
HealthLinked
LifeLinked
PensionLinked Health
Linked Group
Total
Employees’ remuneration and welfare benefits
240,859 26,710 198,291 13,935 605,014 6,635,188 3,028,409 — 134,079 10,882,485
Travel, conveyance and vehicle running expenses 23,234 2,837 20,810 727 40,850 526,697 226,857 — 32,922 874,934
Rents, rates and taxes 202,021 33,574 128,390 550 50,498 1,447,864 591,423 — 68 2,454,388
Repairs 42,019 9,107 23,725 65 9,186 245,583 95,785 — 2 425,472
Printing and stationery 25,027 2,923 71,177 237 28,394 282,444 96,583 — 11,463 518,248
Communication expenses 107,752 16,657 126,564 549 51,062 774,878 292,504 — 1,702 1,371,668
Legal and professional charges 10,751 1,224 8,485 440 9,685 339,321 145,001 — 4,194 519,101
Medical fees 1,696 17 16,298 12 32,013 69,852 6,588 — 50 126,526
Auditors’ fees :
(a) as auditor 255 33 69 3 74 5,465 1,993 — — 7,892
(b) as advisor or in any other capacity, in respect of Taxation matters 5 1 2 — 2 118 43 — — 171
Advertisement and publicity 31,148 2,629 31,373 2,472 62,805 1,134,098 525,446 — 465 1,790,436
Interest and bank charges 9,377 380 62,492 435 25,427 178,608 57,417 — 1,607 335,743
Agents training, recruitment and incentives 89,311 11,428 79,692 3,741 55,832 1,998,117 905,844
— 396 3,144,361
Depreciation 29,195 4,903 18,178 88 6,094 158,429 61,324 — 48 278,259
Service tax on premium absorbed 1,018 169 647 3 254 7,297 2,981 — — 12,369
Information technology cost 45,780 7,850 27,719 275 8,261 214,037 85,911 — 117 389,950
Administration support expenses 25,289 83 280,909 2,106 48,101 1,993,894 921,776 — 2,124 3,274,282
Others 79,634 8,489 217,376 1,180 221,731 1,676,429 557,345 — 30,906 2,793,090
Total 964,371 129,014 1,312,197 26,818 1,255,283 17,688,319 7,603,230 — 220,143 29,199,375
SCHEDULE – 3AEXPENSES OTHER THAN THOSE DIRECTLY RELATED TO THE INSURANCE BUSINESS (Rs. ‘000)
Particulars March 31, 2009 March 31, 2008
Employees remuneration and welfare benefits 361 681
Travel, conveyance and vehicle running expenses 39 819
Legal and professional fees 31 34
Printing and stationery — 38
Communication expenses 7 31
Interest and bank charges 215 298
Depreciation 12 12
Information technology cost — 26
Others 7,807 9,693
Total 8,472 11,632
ICICI PRU AR09_Final Pg29-197 (Ac).indd Sec1:68ICICI PRU AR09_Final Pg29-197 (Ac).indd Sec1:68 10/28/09 6:00:09 PM10/28/09 6:00:09 PM

I 69 I
ANNUAL REPORT 2008-09ICICI PRUDENTIAL LIFE INSURANCE
SCHEDULE – 4BENEFITS PAID [NET]
For the year ended March 31, 2009 (Rs. ‘000)
Particulars Par LifePar
PensionNon-Par
Annuity Non-Par
HealthLinked
LifeLinked
PensionLinked Health
Linked Group
Total
1. Insurance claims
(a) Claims by death 64,516 10,438 318,204 9,008 — 753,110 157,990 308 54,982 1,368,556
(b) Claims by maturity — 102,761 66,530 — — — — — — 169,291
(c) Annuities/Pension payment — — — 399,962 — — — — — 399,962
(d) Other benefits
– Surrender 102,281 79,100 88,991 — — 12,192,580 1,888,020 — 5,393,129 19,744,101
– Survival 274,008 — 2,146 — — — — — — 276,154
– Rider 14,143 454 15,522 — — 64,275 3,322 — — 97,716
– Health — — 19,565 — 187,443 — — 130 — 207,138
Sub-Total (A) 454,948 192,753 510,958 408,970 187,443 13,009,965 2,049,332 438 5,448,111 22,262,918
2. Amount ceded in reinsurance
(a) Claims by death — — (100,314) — — (21,206) — — (5,363) (126,883)
(b) Claims by maturity — — — — — — — — — —
(c) Annuities/Pension payment — — — — — — — — — —
(d) Other benefits
– Surrender — — — — — — — — — —
– Survival — — — — — — — — — —
– Rider — — — — — — — — — —
– Health — — — — (70,453) — — — — (70,453)
Sub-Total (B) — — (100,314) — (70,453) (21,206) — — (5,363) (197,336)
Total (A) + (B) 454,948 192,753 410,644 408,970 116,990 12,988,759 2,049,332 438 5,442,748 22,065,582
Benefits paid to claimants: In India 454,948 192,753 510,958 408,970 187,443 13,009,965 2,049,332 438 5,448,111 22,262,918
Total 454,948 192,753 510,958 408,970 187,443 13,009,965 2,049,332 438 5,448,111 22,262,918
For the year ended March 31, 2008 (Rs. ‘000)
Particulars Par LifePar
PensionNon-Par
Annuity Non-Par
HealthLinked
LifeLinked
PensionLinked Health
Linked Group
Total
1. Insurance claims
(a) Claims by death 62,474 12,706 150,881 7,092 — 458,816 90,710 — 16,582 799,261
(b) Claims by maturity 3 94,816 209,220 — — — — — — 304,039
(c) Annuities/Pension payment — — — 242,789 — — — — — 242,789
(d) Other benefits
– Surrender 69,805 62,386 69,641 — — 13,119,401 2,763,360 — 2,466,470 18,551,063
– Survival 225,774 — 4,084 — — — — — — 229,858
– Rider 13,511 1,062 2,885 — — 48,162 1,661 — — 67,281
– Health — — 1,144 — 35,504 — — — — 36,648
Sub-Total (A) 371,567 170,970 437,855 249,881 35,504 13,626,379 2,855,731 — 2,483,052 20,230,939
2. Amount ceded in reinsurance
(a) Claims by death (3,369) (109) (66,941) — — — — — (3,235) (73,654)
(b) Claims by maturity — — — — — — — — — —
(c) Annuities/Pension payment — — — — — — — — — —
(d) Other benefits
– Surrender — — — — — — — — — —
– Survival — — — — — — — — — —
– Rider — — — — — — — — — —
– Health — — — — (8,626) — — — — (8,626)
Sub-Total (B) (3,369) (109) (66,941) — (8,626) — — — (3,235) (82,280)
Total (A) + (B) 368,198 170,861 370,914 249,881 26,878 13,626,379 2,855,731 — 2,479,817 20,148,659
Benefits paid to claimants: In India 371,567 170,970 437,855 249,881 35,504 13,626,379 2,855,731 — 2,483,052 20,230,939
Total 371,567 170,970 437,855 249,881 35,504 13,626,379 2,855,731 — 2,483,052 20,230,939
ICICI PRU AR09_Final Pg29-197 (Ac).indd Sec1:69ICICI PRU AR09_Final Pg29-197 (Ac).indd Sec1:69 10/28/09 6:00:09 PM10/28/09 6:00:09 PM

I 70 I
FINANCIAL REPORT
SCHEDULE – 5SHARE CAPITAL (Rs. ‘000)
Particulars March 31, 2009 March 31, 2008
Authorised capital
Equity shares of Rs. 10/- each 15,000,000 15,000,000
Issued, subscribed & called up capital
Equity shares of Rs. 10/- each fully paid up 14,272,573 14,011,137
Total 14,272,573 14,011,137
Of the total share capital, 1,055,162,900 shares (Previous Year: 1,034,958,845 ) of Rs. 10 each are held by the holding company, ICICI Bank Limited and its nominees.
SCHEDULE – 5APATTERN OF SHAREHOLDING [As certified by the Management] (Rs. ‘000)
Shareholder March 31, 2009 March 31, 2008
Number of Shares % of Holding Number of Shares % of Holding
Promoters
Indian (ICICI Bank Limited) 1,055,162,900 73.93 1,034,958,845 73.87
Foreign (Prudential Corporation Holdings Limited) 370,732,884 25.97 363,634,188 25.95
Others 1,361,509 0.10 2,520,690 0.18
Total 1,427,257,293 100.00 1,401,113,723 100.00
SCHEDULE – 6RESERVES AND SURPLUS (Rs. ‘000)
Particulars March 31, 2009 March 31, 2008
Capital reserves — —
Capital redemption reserve — —
Share premium 33,529,185 23,713,076
Revaluation reserve — —
General reserves — —
Less: Debit balance in Profit and Loss Account, if any — —
Less: Amount utilized for buy-back — —
Catastrophe reserve — —
Other reserves — —
Balance of profit in Profit and Loss Account — —
Total 33,529,185 23,713,076
SCHEDULE – 7BORROWINGS (Rs. ‘000)
Particulars March 31, 2009 March 31, 2008
Debentures/Bonds — —
Banks — —
Financial Institutions — —
Others — —
Total — —
ICICI PRU AR09_Final Pg29-197 (Ac).indd Sec1:70ICICI PRU AR09_Final Pg29-197 (Ac).indd Sec1:70 10/28/09 6:00:10 PM10/28/09 6:00:10 PM

I 71 I
ANNUAL REPORT 2008-09ICICI PRUDENTIAL LIFE INSURANCE
SCHEDULE – 8INVESTMENTS – SHAREHOLDERS (Rs. ‘000)
Particulars March 31, 2009 March 31, 2008
LONG TERM INVESTMENT
Government Securities* 632,868 444,302(Market Value of Current Year : Rs. 652,206 thousands)(Market Value of Previous Year : Rs. 437,362 thousands)Other Approved Securities 150,616 7,169(Market Value of Current Year : Rs. 152,165 thousands)(Market Value of Previous Year : Rs. 7,169 thousands)Other Approved InvestmentsEquity 1,896 35,530(Historical Value of Current Year : Rs. 3,357 thousands)(Historical Value of Previous Year : Rs. 27,459 thousands)Debentures/Bonds 20,000 — (Market Value of Current Year : Rs. 21,761 thousands)(Market Value of Previous Year :Rs. 0.00)CCIL Deposit 59,296 3,991(Market Value of Current Year : Rs. 59,296 thousands)(Market Value of Previous Year : Rs. 3,991 thousands)Investments in Infrastructure/Housing/Social SectorDebentures/Bonds 23,824 — (Market Value of Current Year : Rs. 23,455 thousands)(Market Value Previous Year : Rs. 0.00)Other InvestmentsEquity — 2,611(Historical Value of Current Year : Rs. 0.00)(Historical Value Previous Year: 862 thousands)Debentures/Bonds — 37,166 (Market Value of Current Year : Rs. 0.00)(Market Value of Previous Year : Rs. 35,750 thousands)
SHORT TERM INVESTMENT
Government Securities 4,040,751 639,837(Market Value of Current Year : Rs. 4,042,892 thousands)(Market Value of Previous Year : Rs. 639,922 thousands)Other Approved InvestmentsFixed Deposits 130,000 15,000(Market Value of Current Year : Rs. 130,000 thousands)(Market Value of Previous Year : Rs. 15,000 thousands)Certificate of Deposits — 85,000 (Market Value of Current Year : Rs. 0.00)(Market Value of Previous Year : Rs. 85,000 thousands)Reverse Repo 1,108,057 79,498(Market Value of Current Year : Rs.1,108,057 thousands)(Market Value of Previous Year : Rs. 79,498 thousands)Mutual Fund 246,293 — (Historical Value of Current Year : Rs. 246,293 thousands)(Historical Value of Previous Year : Rs. 0.00)Investments in Infrastructure/Housing/Social SectorDebentures/Bonds 99,713 49,975(Market Value of Current Year : Rs. 99,806 thousands)(Market Value of Previous Year : Rs. 49,955 thousands)Certificate of Deposits 47,002 — (Market Value of Current Year : Rs. 47,002 thousands)(Market Value of Previous Year : Rs. 0.00)Other InvestmentsDebentures/Bonds — 50,000(Market Value of Current Year : Rs. 0.00)(Market Value of Previous Year : Rs. 49,993 thousands)Mutual Fund 59,761 660,112(Historical Value of Current Year : Rs. 59,761 thousands)(Historical Value of Previous Year : Rs. 660,112 thousands)
Total 6,620,077 2,110,191
In India 6,620,077 2,110,191
Total 6,620,077 2,110,191
* Includes Rs. 100,050 thousands of Securities under Section 7 of Insurance Act, 1938 (Previous Year : Rs.100,050 thousands) (Refer 3.9 of Schedule 16)
ICICI PRU AR09_Final Pg29-197 (Ac).indd Sec1:71ICICI PRU AR09_Final Pg29-197 (Ac).indd Sec1:71 10/28/09 6:00:10 PM10/28/09 6:00:10 PM

I 72 I
FINANCIAL REPORT
SCHEDULE – 8AINVESTMENTS – POLICYHOLDERS (Rs. ‘000)
ParticularsMarch 31, 2009
Par LifePar
PensionNon-Par
Annuity Non-Par
HealthLinked
LifeLinked
PensionLinked Health
Linked Group
Total
LONG TERM INVESTMENT
Government Securities 5,168,867 1,289,918 278,387 2,201,431 — 606,521 246,895 — — 9,792,019(Market Value: Rs. 9,834,585 thousands)
Other Approved Securities 3,397,336 815,488 962,101 1,399,330 19,701 286,352 94,496 — 1,388 6,976,192(Market Value: Rs. 7,254,811 thousands)
Other Approved Investments
Equity 1,523,602 540,165 — — — — — — — 2,063,767(Historical Value: Rs. 1,860,286 thousands)
Preference Shares — 2,995 — — — — — — — 2,995(Market Value: Rs. 993 thousands)
Debentures/Bonds 1,212,187 254,330 528,173 334,192 4,000 316,883 80,449 — 14,915 2,745,129(Market Value: Rs. 2,800,978 thousands)
Property 251,260 250,580 — — — — — — — 501,840(Market Value: Rs. 501,840 thousands)
CCIL Deposit — — — — — 101,607 35,211 — 3,986 140,804(Market Value: Rs. 1,40,805 thousands)
Fixed Deposits — — 250,100 — — — — — — 250,100(Market Value: Rs. 250,100 thousands)
Investments in Infrastructure/Housing/Social Sector
Equities 40,389 17,383 — — — — — — — 57,772(Historical Value: Rs. 33,264 thousands)
Debentures/Bonds 2,530,553 879,471 1,175,318 1,539,539 72,185 467,894 183,710 — 13,992 6,862,662(Market Value: Rs. 6,940,516 thousands)
Other Investments
Equity 211,088 — — — — — — — — 211,088(Historical Value: Rs. 225,915 thousands)
Debentures/Bonds 126,630 — 50,000 — — — — — — 176,630(Market Value: Rs. 176,630 thousands)
Venture Fund 725,800 — — — — — — — — 725,800(Market Value: Rs. 724,550 thousands)
SHORT TERM INVESTMENT
Government Securities 250,023 — 250,130 — — 209,601 186,593 — — 896,347(Market Value: Rs. 903,304 thousands)
Other Approved Investments
Debentures/Bonds — — 66,166 — — 100,942 15,008 — — 182,116(Market Value: Rs. 181,523 thousands)
Fixed Deposits — — 170,000 — — 215,000 205,000 — 5,000 595,000(Market Value: Rs. 595,000 thousands)
Reverse Repo — 95,717 — 144,565 — — — — — 240,282(Market Value: Rs. 240,282 thousands)
Mutual Fund 64,635 — 674,612 — 9,084 92,852 27,327 50,676 92,141 1,011,327(Historical Value: Rs. 1,011,328 thousands)
Investments in Infrastructure/Housing/Social Sector
Debentures/Bonds 108,531 — 120,354 — 5,984 178,722 23,592 — 2,713 439,896(Market Value: Rs. 440,741 thousands)
Term Loans — — 2,000 — 10,001 100,008 30,002 — — 142,011(Market Value: Rs. 142,011 thousands)
Certificate of Deposits — — 47,002 — — — — — — 47,002(Market Value: Rs. 47,002 thousands)
Other Investments
Mutual Fund 15,682 — 163,680 — 2,204 22,527 6,628 12,296 22,356 245,373(Historical Value: Rs. 245,372 thousands)
Total 15,626,583 4,146,047 4,738,023 5,619,057 123,159 2,698,909 1,134,911 62,972 156,491 34,306,152
In India 15,626,583 4,146,047 4,738,023 5,619,057 123,159 2,698,909 1,134,911 62,972 156,491 34,306,152
Total 15,626,583 4,146,047 4,738,023 5,619,057 123,159 2,698,909 1,134,911 62,972 156,491 34,306,152
ICICI PRU AR09_Final Pg29-197 (Ac).indd Sec1:72ICICI PRU AR09_Final Pg29-197 (Ac).indd Sec1:72 10/28/09 6:00:10 PM10/28/09 6:00:10 PM

I 73 I
ANNUAL REPORT 2008-09ICICI PRUDENTIAL LIFE INSURANCE
SCHEDULE – 8AINVESTMENTS – POLICYHOLDERS (Rs. ‘000)
ParticularsMarch 31, 2008
Par Life Par
PensionNon-Par
Annuity Non-Par
Health Linked LifeLinked
PensionLinked Group
Total
LONG TERM INVESTMENT
Government Securities 6,040,035 1,926,692 850,331 1,129,582 79,304 2,459,388 970,150 21,839 13,477,321(Market value: Rs. 12,941,006 thousands)
Other Approved Securities 698,535 332,263 586,435 526,404 50,988 63,110 20,660 3,279 2,281,674(Market Value : Rs. 2,264,071 thousands)
Other Approved Investments
Equity 2,541,775 893,610 — 455,249 — — — — 3,890,634(Historical value: Rs. 2,447,415 thousands)
Preference Shares — 2,995 — — — — — — 2,995(Market value: Rs. 3,184 thousands)
Debentures/Bonds 941,470 136,447 199,708 264,929 4,000 410,694 95,634 14,924 2,067,806(Market value: Rs. 2,074,043 thousands)
Property 251,260 250,580 — — — — — — 501,840(Historical value: Rs. 185,521 thousands)
CCIL Deposit — — — — — 5,797 1,758 1,053 8,608(Market value: Rs. 8,609 thousands)
Fixed Deposits — — 250,100 — — 85,000 85,000 5,000 425,100(Market value: Rs. 425,100 thousands)
Investments in Infrastructure/Social Sector Investments
Equities 68,061 34,574 — 11,855 — — — — 114,490(Historical value: Rs. 46,574 thousands)
Debentures/Bonds 1,946,208 319,294 694,798 1,366,061 144,811 630,500 302,424 24,027 5,428,123(Market value: Rs. 5,370,883 thousands)
Term Loans — — 2,001 — 10,007 100,066 30,020 — 142,094(Market value: Rs. 142,093 thousands)
Other Investments
Equity 525,267 — — — — — — — 525,267(Historical value: Rs. 261,214 thousands)
Venture Fund 685,000 — — — — — — — 685,000(Market value: Rs. 686,418 thousands)
Debentures/Bonds 202,513 — 392,000 — — 50,000 50,000 — 694,513(Market value: Rs. 691,237 thousands)
SHORT TERM INVESTMENT
Government Securities — — 90,531 — 28,380 980,350 150,404 22,546 1,272,211(Market value: Rs. 1,268,879 thousands)
Other Approved investment
Debentures/Bonds — — 51,672 — — 46,819 — — 98,491(Market value: Rs. 98,192 thousands)
Fixed Deposits — — 151,250 — 23,250 383,300 252,600 14,600 825,000(Market value: Rs. 825,000 thousands)
Certificate of Deposits — — — 115,436 — — — — 115,436(Market value: Rs. 115,436 thousands)
Commercial Papers — — — — — — 48,979 — 48,979(Market value: Rs. 48,645 thousands)
Reverse Repo — 153,700 — 36,305 — — — 190,005
Investments in Infrastructure/Social Sector Investments
Debentures/Bonds 120,652 — 52,286 — 35,650 186,852 169,363 1,490 566,293(Market value: Rs. 563,588 thousands)
Other Investments
Debentures/Bonds — — 49,997 — — — — — 49,997(Market value: Rs. 49,449 thousands)
Mutual Fund 111,260 — 220,432 — 2,752 505,360 216,188 25,180 1,081,172(Market value: Rs. 1,081,172 thousands)
Total 14,132,036 4,050,155 3,591,541 3,905,821 379,142 5,907,236 2,393,180 133,938 34,493,049
In India 14,132,036 4,050,155 3,591,541 3,905,821 379,142 5,907,236 2,393,180 133,938 34,493,049
Total 14,132,036 4,050,155 3,591,541 3,905,821 379,142 5,907,236 2,393,180 133,938 34,493,049
ICICI PRU AR09_Final Pg29-197 (Ac).indd Sec1:73ICICI PRU AR09_Final Pg29-197 (Ac).indd Sec1:73 10/28/09 6:00:10 PM10/28/09 6:00:10 PM

I 74 I
FINANCIAL REPORT
SCHEDULE – 8BASSETS HELD TO COVER LINKED LIABILITIES (Rs. ‘000)
ParticularsMarch 31, 2009
Linked Life Funds
Linked Pension Funds
Linked Health Funds
Linked Group Funds Total
LONG TERM INVESTMENTSGovernment securities 5,413,413 2,358,705 1,798 1,625,566 9,399,482(Historic value : Rs. 9,722,147 thousands)Other Approved Securities — — — 150,683 150,683(Historic value : Rs. 151,298 thousands)Other Approved InvestmentsEquity 88,455,456 42,078,631 51,419 1,825,057 132,410,563(Historic value : Rs. 156,904,986 thousands)Preference Shares 80,190 3,022 — 743 83,955(Historic value : Rs. 298,514 thousands)Debentures/Bonds 8,743,113 6,258,832 84,039 5,102,175 20,188,159(Historic value : Rs. 19,656,310 thousands)Fixed deposit 498,961 622,235 21,316 157,488 1,300,000(Historic value : Rs. 1.300,000 thousands)Investments in Infrastructure/Housing/Social SectorEquity 2,677,734 1,785,810 4,724 139,821 4,608,089(Historic value : Rs. 6,418,787 thousands)Debenture/Bonds 8,531,494 5,517,746 67,512 4,453,875 18,570,627(Historic value : Rs. 18,117,531 thousands)Other Investments Equity 13,574,207 6,841,913 8,933 280,042 20,705,095(Historic value : Rs. 31,314,319 thousands)Debentures/Bonds 263,634 65,092 — 306,565 635,291(Historic value : Rs. 649,175 thousands)Venture Fund 21,979 — — — 21,979(Historic value : Rs. 22,200 thousands)
SHORT TERM INVESTMENTSGovernment Securities 12,344,505 2,980,923 — — 15,325,428(Historic value : Rs. 15,246,967 thousands)Other Approved Securities 945 — — — 945(Historic value : Rs. 960 thousands)Other Approved InvestmentsDebentures/Bonds 1,589,380 978,648 — 835,888 3,403,916(Historic value : Rs. 3,385,608 thousands)Certificate of Deposit 8,288,982 3,048,435 7,327 3,063,031 14,407,775(Historic value : Rs. 14,312,324 thousands)Commercial Papers — — — — —(Historic value : Rs. 0.00)Fixed Deposits 3,322,026 1,977,850 11,154 1,963,970 7,275,000(Historic value : Rs. 7.275,000 thousands)Reverse Repo 5,408,164 4,633,207 3,435 89,853 10,134,659(Historic value : Rs. 10,134,659 thousands)CBLO 1,419,807 799,891 — — 2,219,698(Historic value : Rs. 2,219,396)Mutual Fund 3,947,813 2,438,684 8,305 538,155 6,932,957(Historic value : Rs. 6,932,956 thousands)Investments in Infrastructure/Housing/Social SectorDebentures/Bonds 1,955,171 916,589 1,033 1,567,050 4,439,843(Historic value : Rs. 4,388,674 thousands)Term Loans 260,921 97,108 — — 358,029(Historic value : Rs. 358,192 thousands)Commercial Papers 922,091 381,994 221 444,654 1,748,960(Historic value : Rs. 1,678,729 thousands)Certificate of Deposit 170,356 14,101 608 380,616 565,681(Historic value : Rs. 542,138 thousands)Other Investments Debentures/Bonds 1,162,272 192,128 — 706,789 2,061,189(Historic value : Rs. 2,016,276 thousands)Mutual Fund 1,816,403 1,156,434 6,547 174,905 3,154,289(Historic value : Rs. 3,154,290 thousands)Net Current Asset 2,706,932 1,629,952 44,758 1,655,583 6,037,225
Total 173,575,949 86,777,930 323,129 25,462,509 286,139,517
In India 173,575,949 86,777,930 323,129 25,462,509 286,139,517
Total 173,575,949 86,777,930 323,129 25,462,509 286,139,517
ICICI PRU AR09_Final Pg29-197 (Ac).indd Sec1:74ICICI PRU AR09_Final Pg29-197 (Ac).indd Sec1:74 10/28/09 6:00:11 PM10/28/09 6:00:11 PM

I 75 I
ANNUAL REPORT 2008-09ICICI PRUDENTIAL LIFE INSURANCE
SCHEDULE – 8BASSETS HELD TO COVER LINKED LIABILITIES (Rs. ‘000)
ParticularsMarch 31, 2008
Linked Life Funds
Linked Pension Funds
Linked Group Funds Total
LONG TERM INVESTMENTS
Government securities 2,832,333 972,430 785,782 4,590,545(Historical value: Rs. 4,770,292 thousands)Other Approved Securities 203,737 74,237 55,882 333,856(Historical value: Rs. 333,846 thousands)Other Approved InvestmentsEquity 112,459,205 36,829,675 2,078,165 151,367,045(Historical value: Rs. 133,238,997 thousands)Preference Shares 87,210 24,731 178 112,119(Historical value: Rs. 105,475 thousands)Debentures/Bonds 5,489,652 1,644,186 2,250,851 9,384,689(Historical value: Rs. 9,333,699 thousands)Fixed deposit 674,545 264,370 386,085 1,325,000(Historical value: Rs. 1,325,000 thousands)Investments in Infrastructure and Social SectorEquity 3,012,443 1,593,709 28,673 4,634,825(Historical value: Rs. 4,805,634 thousands)Debenture/Bonds 6,353,775 2,014,430 2,672,858 11,041,063(Historical value: Rs. 11,046,416 thousands)Term Loans 175,015 40,026 143,194 358,235(Historical value: Rs. 358,308 thousands)Other InvestmentsEquity 19,691,602 8,426,504 375,873 28,493,979(Historical value: Rs. 26,945,119 thousands)Venture Fund 15,250 — — 15,250(Historical value: Rs. 15,000 thousands)Debentures/Bonds 974,273 363,951 348,191 1,686,415(Historical value: Rs. 1,671,126 thousands)
SHORT TERM INVESTMENTSGovernment Securities 25,122 11,346 — 36,468(Historical value: Rs. 42,596 thousands)Other Approved Securities — — 25 25(Historical value: Rs. 25 thousands)Other Approved InvestmentsDebentures/Bonds 1,560,986 514,046 787,051 2,862,083(Historical value: Rs. 2,870,292 thousands)Certificate of Deposit 4,079,966 1,581,165 2,384,916 8,046,047(Historical value: Rs. 7,970,319 thousands)Commercial Papers 1,116,956 291,462 801,514 2,209,932(Historical value: Rs. 2,163,744 thousands)Fixed Deposits 2,623,602 717,237 1,284,159 4,624,998(Historical value: Rs. 4,625,000 thousands)Reverse Repo 1,503,717 1,373,798 — 2,877,515(Historical value: Rs. 2,877,515 thousands)Investment in Infrastructure and social sectorDebentures/Bonds 949,960 303,882 496,238 1,750,080(Historical value: Rs. 1,733,474 thousands)Other InvestmentsDebentures/Bonds 523,934 141,053 195,805 860,792(Historical value: Rs. 844,664 thousands)Mutual Fund 4,059,200 1,137,756 878,160 6,075,116(Historical value: Rs. 6,075,116 thousands)
Net Current Asset 2,524,323 1,666,888 1,784,246 5,975,457
Total 170,936,806 59,986,882 17,737,846 248,661,534
In India 170,936,806 59,986,882 17,737,846 248,661,534
Total 170,936,806 59,986,882 17,737,846 248,661,534
ICICI PRU AR09_Final Pg29-197 (Ac).indd Sec1:75ICICI PRU AR09_Final Pg29-197 (Ac).indd Sec1:75 10/28/09 6:00:11 PM10/28/09 6:00:11 PM

I 76 I
FINANCIAL REPORT
SCHEDULE – 9LOANS
Particulars March 31, 2009 March 31, 2008
1. SECURITY-WISE CLASSIFICATION Secured (a) On mortgage of property (aa) In India 1,752 6,315 (bb) Outside India — — (b) On Shares, Bonds, Govt. Securities, etc. — — (c) Loans against policy 52,283 31,620 (d) Others — — Unsecured — —
Total 54,035 37,935
2. BORROWER WISE CLASSIFICATION (a) Central and State Governments — — (b) Banks and Financial Institutions — — (c) Subsidiaries — — (d) Companies 1,752 6,315 (e) Loans against policies 52,283 31,620 (f) Loans to employees — —
Total 54,035 37,935
3. PERFORMANCE-WISE CLASSIFICATION (a) Loans classified as standard (aa) In India 54,035 37,935 (bb) Outside India — — (b) Non-standard loans less provisions (aa) In India — — (bb) Outside India — —
Total 54,035 37,935
4. MATURITY-WISE CLASSIFICATION (a) Short-Term 1,752 4,058 (b) Long-Term 52,283 33,877
Total 54,035 37,935
SCHEDULE – 10FIXED ASSETS (Rs. ‘000)
Particulars
Gross Block (at cost) Depreciation Net Block
As at March 31,
2008Additions Deductions
As at March 31,
2009
UptoMarch 31,
2008
For the year
DeductionsUpto
March 31, 2009
As at March 31,
2009
As at March 31,
2008
Freehold Land 903,280 — — 903,280 — — — — 903,280 903,280
Office Buildings on Freehold Land 89,000 — — 89,000 1,459 1,451 — 2,910 86,090 87,541
Improvements to Leasehold Property 2,241,952 846,515 187,498 2,900,969 497,001 448,828 42,387 903,442 1,997,527 1,744,951
Furniture and Fixtures 103,375 70,620 6,005 167,990 89,060 32,016 2,948 118,128 49,862 14,315
Office Equipments 208,737 23,194 517 231,414 184,631 18,930 506 203,055 28,359 24,106
Information Technology Equipment 122,660 5,068 360 127,368 120,020 3,901 346 123,575 3,793 2,640
Communication Networks 38,468 21,836 — 60,304 36,235 6,330 — 42,565 17,739 2,233
Motor Vehicles 7,840 — — 7,840 2,222 1,769 — 3,991 3,849 5,618
Software 188,508 82,034 — 270,542 112,030 40,877 — 152,907 117,635 76,478
Total 3,903,820 1,049,267 194,380 4,758,707 1,042,658 554,102 46,187 1,550,573 3,208,134 2,861,162
Capital work–in progress including capital advances 103,983 416,207
Total 3,312,117 3,277,369
Previous year 2,817,630 1,169,144 82,954 3,903,820 809,962 278,272 45,576 1,042,658
ICICI PRU AR09_Final Pg29-197 (Ac).indd Sec1:76ICICI PRU AR09_Final Pg29-197 (Ac).indd Sec1:76 10/28/09 6:00:11 PM10/28/09 6:00:11 PM

I 77 I
ANNUAL REPORT 2008-09ICICI PRUDENTIAL LIFE INSURANCE
SCHEDULE – 11CASH AND BANK BALANCES (Rs. ‘000)
Particulars March 31, 2009 March 31, 2008
Cash (including cheques, drafts and stamps) 2,474,405 2,986,791 Bank Balance(a) Deposit Account: (aa) Short-term (due within 12 months of the date of balance sheet) — — (bb) Others — —(b) Current Accounts 1,084,356 3,178,289 Money at call and short notice — —Others — —
Total 3,558,761 6,165,080
CASH & BANK BALANCESIn India 3,523,712 6,125,453 Outside India 35,049 39,627
Total 3,558,761 6,165,080
SCHEDULE – 12ADVANCES AND OTHER ASSETS (Rs. ‘000)
Particulars March 31, 2009 March 31, 2008
ADVANCESPrepayments 171,546 230,952 Advance tax paid and taxes deducted at source 12,868 6,905 Deposits 1,084,623 756,216 Other advances 294,286 783,574 Other receivables 67,781 19,235
Total (A) 1,631,104 1,796,882
OTHER ASSETSIncome accrued on investments & deposits 861,068 673,457 Outstanding premiums 266,465 176,725 Service Tax un-utilised credit 856,867 1,799,518 Application money for investments — 100,000
Total (B) 1,984,400 2,749,700
Total (A+B) 3,615,504 4,546,582
SCHEDULE – 13CURRENT LIABILITIES (Rs. ‘000)
Particulars March 31, 2009 March 31, 2008
Agents’ balances (net) 380,537 579,617
Sundry creditors 173,949 205,132
Deposits 5,981 5,981
Expenses payable 3,560,092 4,972,409
Reinsurance premium payable 57,389 110,271
Due to holding company 280,007 562,844
TDS payable 277,054 467,758
Claims outstanding 192,459 80,468
Unallocated premium 921,495 1,101,915
Premium received in advance 773,272 1,047,158
Payable towards investments purchased 286,956 212,120
Other liabilities 4,394,522 6,736,200
Total 11,303,713 16,081,873
ICICI PRU AR09_Final Pg29-197 (Ac).indd Sec1:77ICICI PRU AR09_Final Pg29-197 (Ac).indd Sec1:77 10/28/09 6:00:11 PM10/28/09 6:00:11 PM

I 78 I
FINANCIAL REPORT
SCHEDULE – 14PROVISIONS
Particulars March 31, 2009 March 31, 2008
For taxation - Fringe benefit tax 65,000 58,254For proposed dividends — —For dividend distribution tax — —Provision for Service Tax un-utilised credit 856,867 1,799,518Provision for Leave Encashment and Gratuity 276,077 152,090
Total 1,197,944 2,009,862
SCHEDULE – 15MISCELLANEOUS EXPENDITURE(To the extent not written off or adjusted)
Particulars March 31, 2009 March 31, 2008
Discount allowed in issue of shares/debentures — —Others — —
Total — —
SCHEDULE – 16
Significant accounting policies and notes forming part of the accounts for the year ended March 31, 2009
1. Background
ICICI Prudential Life Insurance Company Limited (‘the Company’) a joint venture between ICICI Bank Limited and Prudential Corporation Holdings Limited was incorporated on July 20, 2000 as a company under the Companies Act, 1956 (‘the Act’). The Company is licensed by the Insurance Regulatory and Development Authority (‘IRDA’) for carrying life insurance business in India.
The Company carries on business in the areas of life, pensions and health insurance. This business spans across individual and group products and covers participating, non-participating and unit linked lines of business. Riders covering additional benefits are offered under these products. These products are distributed through individual agents, corporate agents, banks, brokers and the direct marketing channel.
2. Summary of significant accounting policies
2.1 Basis of preparation
The accompanying financial statements have been prepared and presented under the historical cost convention, on the accrual basis of accounting, in accordance with accounting principles generally accepted in India, in compliance with the accounting standards (`AS`) prescribed in the Companies Act, 1956 and rules thereunder, to the extent applicable, and in accordance with the provisions of the Insurance Act, 1938, Insurance Regulatory and Development Authority Act, 1999, and the regulations framed thereunder, the Act to the extent applicable, various circulars issued by IRDA and the practices prevailing within the insurance industry in India. Accounting policies applied have been consistent with previous year except where different treatment is required as per new pronouncements made by the regulatory authorities.
The management evaluates all recently issued or revised accounting pronouncements on an ongoing basis.
2.2 Use of estimates
The preparation of financial statements in conformity with generally accepted accounting principles requires management to make estimates and assumptions that affect the reported amount of assets, liabilities, revenues and expenses and disclosure of contingent liabilities as on the date of the financial statements. The estimates and assumptions used in the accompanying financial statements are based upon management’s evaluation of the relevant facts and circumstances as on the date of the financial statements. Actual results could differ from those estimates. Any revision to accounting estimates is recognised prospectively.
ICICI PRU AR09_Final Pg29-197 (Ac).indd Sec1:78ICICI PRU AR09_Final Pg29-197 (Ac).indd Sec1:78 10/28/09 6:00:11 PM10/28/09 6:00:11 PM

I 79 I
ANNUAL REPORT 2008-09ICICI PRUDENTIAL LIFE INSURANCE
2.3 Revenue recognition
2.3.1. Premium income
Premium is recognised as income when due. Premium on lapsed policies is recognised as income
when such policies are reinstated.
Top up premiums are considered as single premium.
For linked business, premium is recognised as income when the associated units are created.
2.3.2. Income from linked fund
Income from linked funds which includes fund management charges, policy administration charges,
mortality charges, etc. are recovered from the linked fund in accordance with terms and conditions of
policy and are recognized when due.
2.3.3. Income earned on investments
Interest income on investments is recognised on accrual basis. Accretion of discount and amortisation
of premium relating to debt securities is recognised over the holding/maturity period on a straight-line
basis.
Dividend income is recognised when the right to receive dividend is established.
Realised gain/loss on debt securities for other than linked business is the difference between the sale
consideration net of expenses and the amortised cost, which is computed on a weighted average
basis, as on the date of sale.
Realised gain/loss on debt securities for linked business is the difference between the sale consideration
net of expenses and the book cost, which is computed on weighted average basis, as on the date of
sale.
Profit or loss on sale of equity shares/mutual fund units is the difference between the sale consideration
net of expenses and the book cost computed on weighted average basis. In respect of non-linked
business the profit or loss includes the accumulated changes in the fair value previously recognised
under “Fair Value Change Account”.
2.3.4. Income earned on loans
Interest income on loans is recognised on an accrual basis.
2.3.5. Income from operating leases
Leases where the lessor effectively retains substantially all the risks and benefits of ownership over
the lease term are classified as operating leases. Operating lease rentals are recognised as income,
on a straight line basis, over the lease term.
2.4 Reinsurance premium
Cost of reinsurance ceded is accounted for at the time of recognition of premium income in accordance with
the treaty or in-principle arrangement with the reinsurer. Profit commission on reinsurance ceded is netted off
against premium ceded on reinsurance.
2.5 Benefits Paid
Benefits paid comprise of policy benefits and claim settlement costs, if any.
Death, rider and surrender claims are accounted for on receipt of intimation. Survival benefit claims and maturity claims are accounted when due. Withdrawals and surrenders under linked policies are accounted in the respective schemes when the associated units are cancelled/redeemed. Reinsurance recoveries on claims are accounted for, in the same period as the related claims.
ICICI PRU AR09_Final Pg29-197 (Ac).indd Sec1:79ICICI PRU AR09_Final Pg29-197 (Ac).indd Sec1:79 10/28/09 6:00:11 PM10/28/09 6:00:11 PM

I 80 I
FINANCIAL REPORT
2.6 Acquisition Costs
Acquisition costs are costs that vary with and are primarily related to acquisition of insurance contracts and are expensed in the period in which they are incurred.
2.7 Actuarial liability valuation
Actuarial liability for life policies in force and for policies in respect of which premium has been discontinued but a liability exists, is determined by the Appointed Actuary using the gross premium method, in accordance with accepted actuarial practice, requirements of Insurance Act, 1938, IRDA regulations and the stipulations of Actuarial Society of India.
2.8 Investments
Investments are made in accordance with the Insurance Act, 1938, the IRDA (Investment) Regulations, 2000, and various other circulars/notifications issued by the IRDA in this context from time to time.
Investments are recorded at cost on the date of purchase, which includes brokerage and taxes, if any, and excludes accrued interest.
Bonus entitlements are recognised as investments on the ‘ex-bonus date’.
Rights entitlements are recognised as investments on the ‘ex-rights date’.
Any front end discount on privately placed investments is reduced from the cost of such investments.
Broken period interest paid/received is debited/credited to Interest Receivable account and is not included in the cost of purchase/sale value.
2.8.1 Classification
Investments maturing within twelve months from the balance sheet date and investments made with the specific intention to dispose them off within twelve months from the balance sheet date are classified as short-term investments.
Investments other than short-term investments are classified as long-term investments.
2.8.2 Valuation – shareholders’ investments and non-linked policyholders’ investments
All debt securities are considered as ‘held to maturity’ and accordingly stated at historical cost, subject to amortisation of premium or accretion of discount in the revenue account or the profit and loss account over the period of maturity/holding on a straight line basis.
Listed equity shares as at the balance sheet date are stated at fair value being the last quoted closing price on the National Stock Exchange (‘NSE’) (In case of securities not listed on NSE, the last quoted closing price on the Bombay Stock Exchange (‘BSE’) is used). Mutual fund units as at the balance sheet date are valued at the previous day’s net asset values. Equity shares awaiting listing are stated at historical cost subject to provision for diminution, if any, in the value of such investment determined separately for each individual investment.
Unrealised gains/losses arising due to changes in the fair value of listed equity shares and mutual fund units are taken to “Fair Value Change Account” and carried forward in the balance sheet.
Investment in real estate is valued at historical cost, subject to revaluation (done at least once in every three years) and provision for impairment, if any. Change in carrying amount of investments in real estate is taken to Revaluation Reserve under Policyholders’ Funds in the balance sheet.
2.8.3 Valuation – linked business
Debt securities other than Government securities with a residual maturity over 182 days are valued on a yield to maturity basis, by using spreads over the benchmark rate to arrive at the yield for pricing the security.
ICICI PRU AR09_Final Pg29-197 (Ac).indd Sec1:80ICICI PRU AR09_Final Pg29-197 (Ac).indd Sec1:80 10/28/09 6:00:12 PM10/28/09 6:00:12 PM

I 81 I
ANNUAL REPORT 2008-09ICICI PRUDENTIAL LIFE INSURANCE
Debt securities with a residual maturity upto 182 days are valued at cost/last valuation price (including accrued interest till the beginning of the day) plus the difference between the redemption value (inclusive of interest) and cost/last valuation price, spread uniformly over the remaining maturity period of the instrument.
Securities issued by Government of India are valued at prices obtained from Credit Rating Information Services of India Ltd. (‘CRISIL’).
State Government securities with residual maturity over 182 days are valued at cost. However such securities with residual maturity upto 182 days are valued at historical cost subject to amortisation of premium or accretion of discount.
Money market instruments are valued at historical cost, subject to amortisation of premium or accretion of discount over the period of maturity/holding on a straight-line basis.
Listed equity shares are valued at market value, being the last quoted closing price on the NSE (In case of securities not listed on NSE, the last quoted closing price on the BSE is used). Equity shares awaiting listing are stated at historical cost subject to provision for diminution, if any, in the value of such investment determined separately for each individual investment.
Mutual fund units are valued at the previous day’s net asset values.
Venture fund units are valued at the latest available net asset values.
Securities with call option are valued at the lower of the value as obtained by valuing the security to final maturity and valuing the security to call option. In case there are multiple call options, the lowest value obtained by valuing to the various call dates and valuing to the maturity date is taken as the value of the instrument.
Securities with put option are valued at the higher of the value as obtained by valuing the security to final maturity and valuing the security to put option. In case there are multiple put options, the highest value obtained by valuing to the various put dates and valuing to the maturity date is taken as the value of the instrument.
The securities with both put and call option on the same day would be deemed to mature on the put/call day and would be valued at the prevailing market price.
Instruments bought on ‘repo’ basis are valued at the resale price after deduction of applicable interest upto date of resale.
Unrealised gains and losses are recognised in the respective fund’s revenue account.
2.8.4 Transfer of investments
Transfer of investments from Shareholders’ Fund to the Policyholders’ Fund is at cost or market price, whichever is lower. However, in case of debt securities all transfers are carried out at the net amortised cost. Transfer of investments between unit linked funds is done at market price.
2.9 Loans
Loans are stated at historical cost, subject to provision for impairment, if any.
2.10 Fixed assets, Intangibles and Impairment
2.10.1 Fixed assets and depreciation
Fixed assets are stated at cost less accumulated depreciation. Cost includes the purchase price and any cost directly attributable to bring the asset to its working condition for its intended use. Subsequent expenditure incurred on fixed assets are expensed out except where such expenditure increases the future benefits from the existing assets. Assets costing upto Rs. 5,000 (Rupees five thousand) are fully depreciated in the year of acquisition. The rate of depreciation is higher of the managements estimate
ICICI PRU AR09_Final Pg29-197 (Ac).indd Sec1:81ICICI PRU AR09_Final Pg29-197 (Ac).indd Sec1:81 10/28/09 6:00:12 PM10/28/09 6:00:12 PM

I 82 I
FINANCIAL REPORT
based on useful life or the rates prescribed under the Act. Depreciation is provided using Straight-Line Method (‘SLM’) prorated from the date of acquisition/upto the date of sale, based on estimated useful life for each class of asset, as stated below:
Asset Depreciation rates
Office Buildings 1.63%Leasehold improvements Over the lease period, subject to a maximum of 9 yearsFurniture & Fixtures 15%Office Equipment 25%Information technology equipment 33.33%Communication networks and servers 25%Motor Vehicles 20%
2.10.2. Intangibles
Intangible assets comprising software are stated at cost less amortisation. Significant improvements to software are capitalised and amortised over the remaining useful life of original software. Software expenses are amortised using Straight–Line Method over a period of 4 years from the date of being put to use.
2.10.3. Impairment of assets
Management periodically assesses, using external and internal sources, whether there is any indication that an asset may be impaired. Impairment occurs where the carrying value exceeds the present value of future cash flows expected to arise from the continuing use of the asset and its eventual disposal. The impairment loss to be expensed is determined as the excess of the carrying amount over the higher of the asset’s net sales price or present value as determined above. If at the balance sheet date there is an indication that a previously assessed impairment loss no longer exists, the recoverable amount is reassessed and the asset is reflected at the recoverable amount, subject to a maximum of depreciable historical cost.
2.11 Operating leases
Leases where the lessor effectively retains substantially all the risks and benefits of ownership over the leased term are classified as operating leases. Operating lease rentals including escalations are recognised as an expense, on a straight-line basis, over the lease term.
2.12 Staff benefits
All short term employee benefits are accounted on undiscounted basis during the accounting period based on services rendered by employees.
The Company has incorporated a Provident Fund Trust to which it pays a fixed contribution at the rate specified in the trust deed. The trust deed also provides for the Company to indemnify to the trust, interest at the rates prescribed by the Central Government, in case the fund does not hold sufficient assets. The Guidance issued by the Institute of Chartered Accountants of India (ICAI) on implementing AS 15, Employee Benefits (revised 2005) states that the provident funds set up by employers, which requires interest shortfall to be met by the employer, needs to be treated as defined benefit plan. Pending the issuance of the Guidance Note in this respect by the Actuarial Society of India, the Company’s consulting actuary has expressed his inability to reliably measure the provident fund liability. Accordingly, the Company is unable to exhibit the related disclosures.
The Company’s liability towards gratuity and leave encashment being defined benefit plans is accounted for on the basis of an independent actuarial valuation done at the year end and actuarial gains/losses are charged to the revenue account and the profit and loss account as applicable.
Superannuation is a defined contribution plan. The Company has accrued for superannuation liability based on a percentage of basic salary payable to eligible employees for the period of service.
ICICI PRU AR09_Final Pg29-197 (Ac).indd Sec1:82ICICI PRU AR09_Final Pg29-197 (Ac).indd Sec1:82 10/28/09 6:00:12 PM10/28/09 6:00:12 PM

I 83 I
ANNUAL REPORT 2008-09ICICI PRUDENTIAL LIFE INSURANCE
2.13 Foreign exchange transactions
Transactions in foreign currencies are recorded at the exchange rates prevailing at the date of the transaction. Monetary assets and liabilities in foreign currency, if any, are translated at the year end closing rates. The resulting exchange gain or loss arising either on settlement or on translation, if any, are reflected in the revenue account and the profit and loss account as applicable.
2.14 Segment reporting policies
Based on the primary segments identified under (IRDA) (Preparation of Financial Statements and Auditors’ Report of Insurance Companies) Regulations 2002 (‘the Regulations’) read with AS 17 on “Segmental Reporting” prescribed in the Companies Act, 1956 and rules thereunder, the Company has classified and disclosed segmental information into Shareholder and Policyholder - Participating, Non-Participating, Pension, Linked (Life, Pension and Group), Health and Annuity businesses.
There are no reportable geographical segments, since all business is written in India.
Allocation of expenses
Operating expenses relating to insurance business are allocated to specific business segments in the following manner, which is applied on a consistent basis.
Expenses that are directly identifiable to the segment are allocated on actual basis.
Other expenses (including depreciation and amortisation), that are not directly identifiable to a business segment, are allocated on either of the following basis:
• Number of policies • Weighted annualised first year premium income • Sum assured • Total premium income • Medical cases • Funds under management
The method of allocation has been decided based on the nature of the expense and its logical co-relation with various business segments.
2.15 Taxation
Income tax expense comprises of current tax (i.e. amount of tax for the period determined in accordance with the income tax law), deferred tax charge or credit (reflecting the tax effects of timing differences between accounting income and taxable income for the period) and fringe benefit tax (computed in accordance with the relevant provisions of the Income Tax Act, 1961.
Provision for current income tax is made based on the estimated tax liability computed after taking credit for allowances and exemptions in accordance with the Income Tax Act, 1961.
The deferred tax charge or credit and the corresponding deferred tax liabilities or assets are recognised using the tax rates that have been enacted or substantively enacted by the balance sheet date. Deferred tax assets are recognised only to the extent there is reasonable certainty that the assets can be realised in future; however, where there is unabsorbed depreciation or carried forward loss under taxation law, deferred tax assets are recognised only if there is a virtual certainty of realization of such assets. Deferred tax assets are reviewed as at each balance sheet date and written down or written up to reflect the amount that is reasonable/virtual certain (as the case may be) to be realised.
Provision for fringe benefit tax (‘FBT’) has been recognised on the basis of harmonious contextual interpretation of the provision of Income Tax Act, 1961 and in accordance with the guidance note on accounting for fringe benefits tax issued by the Institute of Chartered Accountants of India.
2.16 Service tax unutilised credit
Service Tax liability on life insurance service is set-off against the service tax credits available from tax paid on input services. Unutilised credits, if any, are carried forward for future set-off. A provision is created based on estimated realisation of such unutilised credit.
ICICI PRU AR09_Final Pg29-197 (Ac).indd Sec1:83ICICI PRU AR09_Final Pg29-197 (Ac).indd Sec1:83 10/28/09 6:00:12 PM10/28/09 6:00:12 PM

I 84 I
FINANCIAL REPORT
2.17 Employee Stock Option Scheme
The Company has formulated an Employee Stock Option Scheme (‘the Scheme’). The Scheme provides that eligible employees are granted options to acquire equity shares of the Company that vest in graded manner. The vested options may be exercised within a specified period. The exercise price of the option is diluted when there is a subsequent issue of shares at a price lower than the grant price. The options are accounted on intrinsic value basis and accordingly the intrinsic value of options, if any, is amortised over the vesting period. Incremental intrinsic value of options, arising from modification of exercise price, if any, is amortised over the remainder of the vesting period.
2.18 Provisions and contingencies
The Company makes a provision when there is a present obligation as a result of a past event that probably requires an outflow of resources and a reliable estimate can be made of the amount of the obligation. A disclosure of a contingent liability is made when there is a possible obligation or present obligations that may, but probably will not, require an outflow of resources or it cannot be reliably estimated. When there is a possible obligation or a present obligation in respect of which the likelihood of outflow of resources is remote, no provision or disclosure is made.
Loss contingencies arising from claims, litigation, assessment, fines, penalties, etc. are recorded when it is possible that a liability has been incurred and the amount can be reasonably estimated.
2.19 Earnings per share
Basic earnings per share are calculated by dividing the net profit or loss for the period attributable to equity shareholders by the weighted average number of equity shares outstanding during the period. For the purpose of calculating diluted earnings per share, the net profit or loss for the period attributable to equity shareholders and the weighted average number of shares outstanding during the period are adjusted for the effects of all dilutive potential equity shares.
2.20 Appropriation/Expropriation
In accordance with the Unit Linked guidelines issued by IRDA effective July 1, 2006, the Company has followed the Appropriation/Expropriation method for calculating the Net Asset Value (‘NAV’). This method provides for adjusting the NAV on account of the ‘Dealing Costs’. The accounting for dealing costs is disclosed in the Revenue Account as an adjustment with corresponding changes to the Change in Valuation of Policy Liability Account. Corresponding adjustments are also made in the Assets Held to cover Policy Liabilities and the Provisions for Linked Liabilities in the Balance Sheet.
2.21 Funds for Future Appropriations – Linked
Amounts estimated by Appointed Actuary as Funds for Future Appropriations (‘FFA’) – Linked are required to be set aside in the balance sheet and are not available for distribution to shareholders until the expiry of the revival period. The Company appropriates FFA from the Revenue Account.
ICICI PRU AR09_Final Pg29-197 (Ac).indd Sec1:84ICICI PRU AR09_Final Pg29-197 (Ac).indd Sec1:84 10/28/09 6:00:12 PM10/28/09 6:00:12 PM

I 85 I
ANNUAL REPORT 2008-09ICICI PRUDENTIAL LIFE INSURANCE
3. Notes to accounts
3.1 Contingent liabilities
(Rs. ‘000)
ParticularsAs at
March 31, 2009As at
March 31, 2008
Partly-paid up investments — —Underwriting commitments outstanding — —Claims, other than those under policies, not acknowledged as debts 3,619 2,196Guarantees given by or on behalf of the company — —Statutory demands/liabilities in dispute, not provided for — 1,669Reinsurance obligations to the extent not provided for in accounts — —Others – Policy related claims under litigation 55,110 30,379
3.2 Actuarial method and assumptions
The actuarial liability on both participating and non-participating policies is calculated using the gross premium
method, using assumptions for interest, mortality, expense and inflation, and in the case of participating
policies, future bonuses together with allowance for taxation and allocation of profits to shareholders. These
assumptions are determined as prudent estimates at the date of valuation with allowances for adverse
deviations. No allowance is made for expected lapses.
The interest rates used for valuing the liabilities are in the range of 5.1% to 6.8% per annum (Previous year:
4.7% to 10% per annum).
Mortality rates used are based on the published LIC (1994 - 96) Ultimate Mortality Table for assurances and
LIC 96-98 table for annuities, adjusted to reflect expected experience. Morbidity rates used are based on CIBT
93 table, adjusted for expected experience, or on risk rates supplied by reinsurers.
Expenses are provided for at current levels, in respect of renewal expenses, with no allowance for future
improvements. Per policy renewal expenses for regular premium policies are assumed to inflate at 4.14%
(Previous year: 5.50%).
The greater of a liability calculated using discounted cash flows and unearned premium reserves are held
for the unexpired portion of the risk for the general fund liabilities of linked business and attached riders. An
unearned premium reserve is held for one year renewable group term insurance.
The unit liability in respect of linked business has been taken as the value of the units standing to the credit of
policyholders, using the net asset value (‘NAV’) prevailing at the valuation date. The adequacy of charges under
unit linked policies to meet future expenses has been tested and provision made as appropriate. Provision has
also been made for the cost of guarantee under unit linked products that carry a guarantee. The units held
in respect of lapsed policies are divided into a revival reserve, which contributes to liabilities, and a fund for
future appropriation, which contributes to regulatory capital.
3.3 Encumbrances of assets
The assets of the Company are free from all encumbrances as at March 31, 2009 (Previous year:
Rs. Nil).
3.4 Assets to be deposited under local laws
There are no assets required to be deposited by the Company under any local laws or otherwise encumbered
in or outside India as of March 31, 2009 except investments to be held under Section 7 of the Insurance Act,
1938 as disclosed under 3.9 below. (Previous year: Rs. Nil).
ICICI PRU AR09_Final Pg29-197 (Ac).indd Sec1:85ICICI PRU AR09_Final Pg29-197 (Ac).indd Sec1:85 10/28/09 6:00:12 PM10/28/09 6:00:12 PM

I 86 I
FINANCIAL REPORT
3.5 Restructured Assets
There are no assets including loans subject to re-structuring (Previous year: Rs. Nil).
3.6 Commitments
Commitments made and outstanding for loans and investment is Rs. Nil (Previous year: Rs. Nil).
Estimated amount of contracts remaining to be executed on fixed assets to the extent not provided for
(net of advance) is Rs. 27,768 thousand (Previous year: Rs. 312,072 thousand).
3.7 Claims
Claims settled and remaining unpaid for a period of more than six months as at March 31, 2009 amount to
Rs. 31,347 thousand (Previous year: Rs. 11,888 thousand).
3.8 Managerial Remuneration
The details of the Managing and Executive Directors’ remuneration included in employee remuneration and
welfare benefits are as follows:
(Rs. ‘000)
Particulars March 31, 2009 March 31, 2008
Salary, perquisites and bonus 45,451 55,760
Contribution to Provident Fund 2,196 1,800
Expenses towards gratuity and leave encashment provision are determined actuarially for the company as a
whole on an annual basis and accordingly have not been considered in the above information.
The managerial remuneration is in accordance with the requirements of Section 34A of the Insurance Act,
1938 and as approved by IRDA.
3.9 Investments
• The investments are effected from the respective funds of the policyholders or shareholders and income
thereon has been accounted accordingly.
• All investments are performing investments.
• Investments under Section 7 of the Insurance Act, 1938 are as follows:
(Rs. ‘000)
Particulars March 31, 2009 March 31, 2008
7.40% Govt. of India Securities* 90,050 90,050
12.32% Govt. of India Securities* 10,000 10,000
Total 100,050 100,050
* This investment is held by the custodian in Constituent Subsidiary General Ledger Account under
intimation to IRDA.
3.10 Value of investment contracts where settlement or delivery is pending is as follows:
(Rs. ‘000)
Particulars
March 31, 2009 March 31, 2008
Linked business
Non–linked business
Linked business
Non–linked business
Purchases where deliveries are pending 5,113,830 254,316 7,624,260 212,120
Sales where receipts are pending 42,31,933 — 5,061,149 —
ICICI PRU AR09_Final Pg29-197 (Ac).indd Sec1:86ICICI PRU AR09_Final Pg29-197 (Ac).indd Sec1:86 10/28/09 6:00:12 PM10/28/09 6:00:12 PM

I 87 I
ANNUAL REPORT 2008-09ICICI PRUDENTIAL LIFE INSURANCE
3.11 Real Estate – Investment Property
In accordance with the IRDA Regulations, 2002 (Preparation of Financial Statements & Auditors Report of
Insurance Companies), the value of Investments in real estate property are subject to revaluation at least once
in three years. As a result, the Company’s real estate investments have been revalued by an independent
valuer as of March 27, 2007. The value of real estate investment based on the valuation report is disclosed
at revalued amount and the change in carrying amount is classified under Revaluation Reserve. The value of
the investment property in accordance with the independent valuation dated March 27, 2007 is Rs. 501,840
thousand (Historical cost: Rs. 185,521 thousand).
3.12 Sector-wise percentage of business
Sector-wise break-up of policies issued during the year is as follows:
Sector March 31, 2009 March 31, 2008
Rural – Number of policies 774,725 637,867 – Percentage of total policies 29% 22%
Social – Number of policies 24 6 – Percentage of total policies 0.0009% 0.0002% – Number of lives 132,625 35,491 – Percentage of group lives 10% 3% – Gross premium (Rs. ‘000) 6,453 1,565 – Percentage of total premium 0.01% 0.002%
Total – Number of policies 2,638,238 2,913,606 – Number of group lives 1,348,063 1,067,087 – Gross premium (Rs. ‘000) 64,839,230 80,347,511
3.13 Risks retained and reinsured
Extent of risk retained and reinsured based on sum at risk, is as follows:
Particulars March 31, 2009 March 31, 2008
Individual business
Risk retained 78% 82%
Risk reinsured 22% 18%
Group business
Risk retained 34% 30%
Risk reinsured 66% 70%
3.14 Deferred taxes
Deferred tax asset is recognized on carry forward of eligible tax losses which can be set off against future
taxable income. Deferred tax assets are reviewed as at each balance sheet date and written down or written
up to reflect the amount that is virtually certain to be realised.
Deferred tax asset is created on the Company’s eligible tax losses to the extent that there is virtual certainty
supported by convincing evidence that sufficient future taxable income will be available against which such
deferred tax can be realised. As at March 31, 2009, Rs. 3,180,774 thousand represents deferred tax asset on
carry forward unabsorbed losses (Previous year: Rs. 2,170,774 thousand).
Deferred tax asset has been created on the basis of certainty of the profit of the business, subject to some
amount of lapsation determined by the Appointed Actuary.
ICICI PRU AR09_Final Pg29-197 (Ac).indd Sec1:87ICICI PRU AR09_Final Pg29-197 (Ac).indd Sec1:87 10/28/09 6:00:12 PM10/28/09 6:00:12 PM

I 88 I
FINANCIAL REPORT
3.15 Operating lease commitments
The Company takes premises (both commercial and residential), office equipments, computers, servers &
modular furniture on lease. Certain lease arrangements provide for cancellation by either party and also contain
a clause for renewal of the lease agreement. Lease payments on cancellable and non-cancellable operating
lease arrangements are charged to the revenue account and the profit and loss account over the lease term
on a straight line basis. The future minimum lease payments in respect of non-cancellable operating leases as
at the balance sheet date are summarised below:
(Rs. ‘000)
Particulars March 31, 2009 March 31, 2008
Not later than one year 808,647 571,149
Later than one year but not later than five year 1,365,132 1,580,872
Later than five year — —
The total operating lease rentals charged to Revenue account in the current year is Rs. 990,879 thousand
(Previous year: Rs. 587,168 thousand).
3.16 Details of related parties and transactions with related parties
Related parties and nature of relationship
Nature of relationship Name of the related party
Holding Company ICICI Bank LimitedSubstantial Interest Prudential Corporation Holding LimitedFellow Subsidiaries ICICI Securities Limited
ICICI Venture Funds Management Company LimitedICICI Home Finance Company LimitedICICI Lombard General Insurance Company LimitedICICI Trusteeship Services LimitedICICI Securities Primary Dealership LimitedICICI Securities Inc.ICICI Securities Holding Inc.ICICI Investment Management Company LimitedICICI International LimitedICICI Bank UK PLCICICI Bank CanadaICICI Wealth Management Inc.ICICI Bank Eurasia Limited Liability CompanyICICI Prudential Asset Management Company LimitedICICI Prudential Trust LimitedICICI Eco-net Internet and Technology FundICICI Equity FundICICI Emerging Sectors FundICICI Strategic Investments FundTCW/ICICI Investment Partners Limited Liability CompanyICICI Kinfra Limited
Key management personnel Shikha Sharma, Managing DirectorN. S. Kannan, Executive DirectorBhargav Dasgupta, Executive Director
Significant influence ICICI Prudential Life Insurance Company Limited Employees’ Group Gratuity Cum Life Insurance SchemeICICI Prudential Life Insurance Company Limited Employees’ Provident FundICICI Prudential Life Insurance Company Limited Superannuation Scheme
ICICI PRU AR09_Final Pg29-197 (Ac).indd Sec1:88ICICI PRU AR09_Final Pg29-197 (Ac).indd Sec1:88 10/28/09 6:00:12 PM10/28/09 6:00:12 PM

I 89 I
ANNUAL REPORT 2008-09ICICI PRUDENTIAL LIFE INSURANCE
The following represents significant transactions between the Company and its related parties.
Transactions for the year ended March 31, 2009: (Rs. ‘000)
ParticularsHolding
companyFellow
subsidiaries
Companies having
Substantial Interest
Key Management
Personnel
Entities having
Significant Influence
IncomePremium income 85,549 20,482 — 5,637 18,533Interest income 426,688 1265,315 — — —
ExpensesEstablishment & other expenditure 2,794,338 2385,212 — 47,647 —Provident fund, Superannuation and Gratuity contribution — — — — 328,433Claims 42,000 8,651 — — —
OthersShare capital issued during the year
185,000 — 65,000 — —
Share Premium 7,215,000 — 2,535,000 — —Purchase of securities 16,614,759 329,714,679 — — —Sale of securities 13,472,913 422,856,700 — — —Repo transactions 245,987,994 5289,122,081 — — —
1 Includes transactions with ICICI Home Finance Company Limited of Rs. 114,122 thousand and ICICI Securities Primary Dealership Limited of Rs. 151,193 thousand.
2 Establishment & other expenditure include expenses for sharing of common services and facilities, consultancy fees, insurance commission, insurance premium, brokerage, business support and managerial remuneration. Expense also includes Rs. 31,827 thousand for brokerage paid to ICICI Securities Limited which is included in the cost of Investments.
3 Includes transactions with ICICI Securities Primary Dealership Limited of Rs. 27,864,600 thousand. 4 Includes transactions with ICICI Securities Primary Dealership Limited of Rs. 22,856,700 thousand. 5 Includes transactions with ICICI Securities Primary Dealership Limited of Rs. 289,122,081 thousand.
Balances of Related parties as at March 31, 2009: (Rs. ‘000)
ParticularsHolding
companyFellow
subsidiaries
Companies having
Substantial Interest
Key Management
Personnel
Entities having
Significant Influence
AssetsLong term fixed deposits & Corporate bonds/deposits
9,780,969 1 2,195,602 — — —
Cash & Bank balances 1,378,578 — — — —Income accrued on investments 98,565 9,319 — — —Other assets 14,878 2 80,834 — — —
LiabilitiesShare capital 10,551,629 — 3,707,329 — —Share premium 24,684,412 — 8,672,901 — —Other liabilities 283,708 29,395 — — —
1 Includes investment in debentures of Rs. 1,012,950 thousand and commercial paper of Rs. 478,125 of ICICI Home Finance Company Limited.
2 Includes advance premium of Rs. 75,328 thousand paid to ICICI Lombard General Insurance Company Limited.
ICICI PRU AR09_Final Pg29-197 (Ac).indd Sec1:89ICICI PRU AR09_Final Pg29-197 (Ac).indd Sec1:89 10/28/09 6:00:12 PM10/28/09 6:00:12 PM

I 90 I
FINANCIAL REPORT
Transactions for the year ended March 31, 2008: (Rs. ‘000)
ParticularsHolding
company
Fellow subsidiaries/
Other entities
Companies having
Substantial Interest
Key Management
Personnel
Companies having
Significant Influence
IncomePremium income 90,449 15,302 — 468 8,350Interest income 335,036 7,927 — — —
ExpensesEstablishment & other expenditure 3,466,228 1246,599 — 57,560 —Provident fund, Superannuation and Gratuity contribution — — — — 264,580Claims 25,000 3,325 — — —
OthersShare capital issued during the year 656,303 — 230,593 — —Share Premium 11,923,697 — 4,189,407 — —Purchase of securities 6,915,954 26,001,905 — — —Sale of securities 2,996,315 32,397,217 — — —Repo transactions 400,681 46,066,191 — — —Purchase of Fixed Asset 23,475 — — — —
1 Establishment & other expenditure include expenses for sharing of common services and facilities, consultancy fees, insurance commission, insurance premium, brokerage, business support and managerial remuneration. Expense also includes Rs. 37,995 thousand for brokerage paid to ICICI Securities Limited which is included in the cost of Investments.
2 Includes transactions with ICICI Securities Primary Dealership Limited of Rs. 4,444,208 thousand. 3 Includes transactions with ICICI Securities Primary Dealership Limited & ICICI Securities Limited of
Rs. 1,494,140 thousand & Rs. 653,590 thousand respectively. 4 Transacted with ICICI Securities Primary Dealership Limited.
Balances of Related parties as at March 31, 2008: (Rs. ‘000)
ParticularsHolding
company
Fellow subsidiaries/
Other entities
Companies having
Substantial Interest
Key Management
Personnel
Companies having
Significant Influence
AssetsLong term fixed Deposits & Corporate bonds/deposits
3,474,398 1957,905 — — —
Cash & Bank balances 2,653,098 — — — —Income accrued on investments
73,218 6,127 — — —
Other assets 26,196 244,853 — — —
LiabilitiesShare capital 10,349,588 — 3,636,342 — —Share premium 17,469,412 — 6,137,901 — —Other liabilities 564,647 20,165 — — —
1 Includes investment in debentures of ICICI Home Finance Company Limited of Rs. 756,368 thousand. 2 Includes advance premium of Rs. 39,347 thousand paid to ICICI Lombard General Insurance Company.
ICICI PRU AR09_Final Pg29-197 (Ac).indd Sec1:90ICICI PRU AR09_Final Pg29-197 (Ac).indd Sec1:90 10/28/09 6:00:12 PM10/28/09 6:00:12 PM

I 91 I
ANNUAL REPORT 2008-09ICICI PRUDENTIAL LIFE INSURANCE
3.17 Segmental Reporting
Income and expenses directly attributable or allocable to the segments are recorded and disclosed under the
respective segments in the revenue account and profit and loss account, as applicable.
Investments and policy liabilities are disclosed in the balance sheet under the respective segments. Net
fixed assets of Rs. 3,312,117 thousand (Previous year Rs. 3,277,369 thousand) are disclosed in shareholders
segment. Depreciation expense has been allocated as disclosed in Note 2.14.
Segment wise information of current assets, loans, deferred tax asset and current liabilities and provisions to
the extent identifiable are given below:
(Rs. ‘000)
Business Segments
Current Assets, Loans & Deferred Tax Asset
Current Liabilities & Provisions
March 31, 2009
March 31, 2008
March 31, 2009
March 31, 2008
Shareholders 4,123,038 10,687,330 4,008,761* 8,289,301*Par Life 1,054,245 519,903 234,765 320,894Par Pension 185,128 134,807 29,053 63,365Non-Par 319,216 456,571 1,363,161 718,306Annuity Non-Par 191,609 302,228 1,560 123,075Health 217,227 75,590 263,645 326,490Linked Life 3,367,470 522,885 4,509,318 5,861,634Linked Pension 836,456 213,813 1,791,968 2,264,430Linked Health 100,011 — 149,768 —Linked Group 14,674 7,245 149,658 125,343
Total 10,409,074 12,920,372 12,501,657 18,092,838
* Includes amounts subsequently transferred to the respective schemes under linked business.
Segment-wise information of non-cash items being amortisation of premium included in interest income on
debt instruments is tabled below:
(Rs. ‘000)
Business Segments March 31, 2009 March 31, 2008
Shareholders (94,848) (61,413)Par Life 12,924 25,042Par Pension 3,312 10,493Non-Par (16,255) (2,585)Annuity Non-Par (12,233) (2,595)Health (3,587) (8,592)Linked Life (2,367) (39,749)Linked Pension (3,220) (30,014)Linked Group (587) (1,505)
Total (116,861) (110,918)
ICICI PRU AR09_Final Pg29-197 (Ac).indd Sec1:91ICICI PRU AR09_Final Pg29-197 (Ac).indd Sec1:91 10/28/09 6:00:12 PM10/28/09 6:00:12 PM

I 92 I
FINANCIAL REPORT
3.18
FU
ND
BA
LAN
CE
SH
EE
T A
S A
T M
AR
CH
31,
200
9
Form
A-B
S (
UL)
(R
s. ‘0
00)
Part
icul
ars
Sche
dule
Link
ed L
ife F
unds
Bala
ncer
Prot
ecto
rM
axim
iser
Cash
Pl
usSe
cure
Pl
usPr
eser
ver
Inve
st
Shie
ld
Life
New
In
vest
Sh
ield
Ba
lanc
ed
Flex
i G
row
thFl
exi
Bala
nced
R.I.C
.H.
Fund
Mul
tiplie
rRe
turn
G
uara
ntee
Retu
rn
Gua
rant
ee II
Retu
rn
Gua
rant
ee
III
Retu
rn
Gua
rant
ee
IV
Tota
l
SOU
RCES
OF
FUN
DS
Polic
yhol
ders
’ Fun
ds:
Polic
yhol
der c
ontri
butio
nF-
116
,549
,516
12,3
34,9
4387
,459
,330
3,37
0,35
724
4,27
42,
473,
995
1,14
3,68
01,
560,
710
44,9
16,0
851,
545,
201
9,12
4,16
511
,696
,969
671,
366
729,
134
754,
090
211,
145
194,
784,
960
Reve
nue
Acco
unt
5,13
6,01
42,
448,
530
(11,
392,
957)
79,5
0230
,822
418,
981
(8,8
13)
(116
,434
)(1
2,84
9,77
8)(1
89,0
78)
(2,0
31,2
20)
(2,7
01,4
65)
(9,4
74)
(8,2
06)
(10,
584)
(4,8
51)
(21,
209,
011)
Tota
l21
,685
,530
14,7
83,4
7376
,066
,373
3,44
9,85
927
5,09
62,
892,
976
1,13
4,86
71,
444,
276
32,0
66,3
071,
356,
123
7,09
2,94
58,
995,
504
661,
892
720,
928
743,
506
206,
294
173,
575,
949
APPL
ICAT
ION
OF
FUN
DS
Inve
stm
ents
F-2
21,1
20,4
7814
,177
,057
75,7
17,5
463,
304,
013
263,
633
2,82
4,13
11,
095,
434
1,41
7,12
231
,571
,174
1,28
7,89
17,
138,
229
8,98
2,85
564
2,12
469
6,84
663
0,48
4—
170,
869,
017
Curre
nt A
sset
sF-
369
0,66
760
6,95
01,
711,
151
145,
968
11,4
7268
,904
39,4
7258
,257
1,43
1,62
968
,300
256,
800
253,
845
19,7
9724
,113
125,
469
206,
294
5,71
9,08
8
Less
: Cur
rent
Lia
bilit
ies
and
Prov
ision
sF-
412
5,61
553
41,
362,
324
122
959
3931
,103
936,
496
6830
2,08
424
1,19
629
3112
,447
—3,
012,
156
Net
cur
rent
ass
ets
565,
052
606,
416
348,
827
145,
846
11,4
6368
,845
39,4
3327
,154
495,
133
68,2
32(4
5,28
4)12
,649
19,7
6824
,082
113,
022
206,
294
2,70
6,93
2
Tota
l21
,685
,530
14,7
83,4
7376
,066
,373
3,44
9,85
927
5,09
62,
892,
976
1,13
4,86
71,
444,
276
32,0
66,3
071,
356,
123
7,09
2,94
58,
995,
504
661,
892
720,
928
743,
506
206,
294
173,
575,
949
(a)
Net A
sset
as
per B
alan
ce
Shee
t (To
tal A
sset
s le
ss
Curre
nt L
iabi
litie
s an
d Pr
ovisi
ons)
(Rs.
‘000
)21
,685
,530
14,7
83,4
7376
,066
,373
3,44
9,85
927
5,09
62,
892,
976
1,13
4,86
71,
444,
276
32,0
66,3
071,
356,
123
7,09
2,94
58,
995,
504
661,
892
720,
928
743,
506
206,
294
173,
575,
949
(b)
Num
ber o
f Uni
ts
outs
tand
ing
(Rs.
‘000
)1,
000,
280
937,
125
2,70
1,80
825
0,13
819
,647
204,
014
78,1
3112
2,63
63,
941,
221
139,
491
939,
166
1,55
1,15
562
,592
70,1
5073
,297
20,6
2912
,111
,480
(c)
NAV
per U
nit (
a)/(b
) (Rs
.)21
.68
15.7
828
.15
13.7
914
.00
14.1
814
.53
11.7
88.
149.
727.
555.
8010
.57
10.2
810
.14
10.0
0
ICICI PRU AR09_Final Pg29-197 (Ac).indd Sec1:92ICICI PRU AR09_Final Pg29-197 (Ac).indd Sec1:92 10/28/09 6:00:13 PM10/28/09 6:00:13 PM

I 93 I
ANNUAL REPORT 2008-09ICICI PRUDENTIAL LIFE INSURANCE
3.18
FU
ND
BA
LAN
CE
SH
EE
T A
S A
T M
AR
CH
31,
200
9 (C
ont
d.)
Form
A-B
S(U
L)
(Rs.
‘000
)
Part
icul
ars
Sche
dule
Link
ed P
ensi
on F
unds
Bala
ncer
Prot
ecto
r In
com
eM
axim
iser
Fu
nd
Gro
wth
Secu
re
Plus
Pe
nsio
n
Pres
erve
rIn
vest
Sh
ield
Pe
nsio
n
Flex
i G
row
thFl
exi
Bala
nced
Pens
ion
R.I.C
.H.
Fund
Pens
ion
Mul
tiplie
rPe
nsio
n Re
turn
G
uara
ntee
Pens
ion
Retu
rn
Gua
rant
ee II
Pens
ion
Retu
rn
Gua
rant
ee
III
Pens
ion
Retu
rn
Gua
rant
ee
IV
Tota
l
SOU
RCES
OF
FUN
DS
Polic
yhol
ders
’ Fun
ds:
Polic
yhol
der c
ontri
butio
nF-
17,
413,
645
7,58
1,27
525
,913
,587
102,
587
957,
023
211,
702
32,0
18,4
241,
049,
155
14,4
71,0
445,
126,
740
2,12
1,49
01,
977,
682
2,08
2,98
162
4,95
810
1,65
2,29
3
Reve
nue
Acco
unt
1,83
5,28
51,
116,
569
(4,3
44,3
23)
20,4
3549
,170
14,3
61(9
,014
,418
)(1
08,0
28)
(3,2
06,4
60)
(1,2
62,8
15)
18,2
4616
,238
(1,5
92)
(7,0
31)
(14,
874,
363)
Tota
l9,
248,
930
8,69
7,84
421
,569
,264
123,
022
1,00
6,19
322
6,06
323
,004
,006
941,
127
11,2
64,5
843,
863,
925
2,13
9,73
61,
993,
920
2,08
1,38
961
7,92
786
,777
,930
APPL
ICAT
ION
OF
FUN
DS
Inve
stm
ents
F-2
9,07
5,53
88,
336,
530
21,6
04,0
5611
7,55
897
1,83
721
8,72
422
,711
,600
902,
301
11,2
84,4
873,
850,
821
2,07
8,40
11,
948,
942
2,04
7,18
3—
85,1
47,9
78
Curre
nt A
sset
sF-
332
3,84
536
1,60
543
0,98
85,
468
34,3
767,
347
729,
285
38,8
5947
8,54
416
3,72
961
,430
53,6
8866
,346
617,
927
3,37
3,43
7
Less
: Cur
rent
Lia
bilit
ies
and
Prov
ision
sF-
415
0,45
329
146
5,78
04
208
436,
879
3349
8,44
715
0,62
595
8,71
032
,140
—1,
743,
485
Net
cur
rent
ass
ets
173,
392
361,
314
(34,
792)
5,46
434
,356
7,33
929
2,40
638
,826
(19,
903)
13,1
0461
,335
44,9
7834
,206
617,
927
1,62
9,95
2
Tota
l9,
248,
930
8,69
7,84
421
,569
,264
123,
022
1,00
6,19
322
6,06
323
,004
,006
941,
127
11,2
64,5
843,
863,
925
2,13
9,73
61,
993,
920
2,08
1,38
961
7,92
786
,777
,930
(a) N
et A
sset
as
per B
alan
ce S
heet
(Tot
al A
sset
s le
ss
Curre
nt L
iabi
litie
s an
d Pr
ovisi
ons)
(Rs.
‘000
)9,
248,
930
8,69
7,84
421
,569
,264
123,
022
1,00
6,19
322
6,06
323
,004
,006
941,
127
11,2
64,5
843,
863,
925
2,13
9,73
61,
993,
920
2,08
1,38
961
7,92
786
,777
,930
(b) N
umbe
r of U
nits
out
stan
ding
(in
000’
s)48
9,58
858
7,15
698
1,81
98,
930
70,7
4815
,549
2,85
7,31
692
,364
1,51
1,00
761
2,88
520
2,19
819
3,92
520
5,24
361
,793
7,89
0,51
9
(c) N
AV p
er U
nit (
a)/(b
) (Rs
.)18
.89
14.8
121
.97
13.7
814
.22
14.5
48.
0510
.19
7.46
6.30
10.5
810
.28
10.1
410
.00
ICICI PRU AR09_Final Pg29-197 (Ac).indd Sec1:93ICICI PRU AR09_Final Pg29-197 (Ac).indd Sec1:93 10/28/09 6:00:13 PM10/28/09 6:00:13 PM

I 94 I
FINANCIAL REPORT
3.18
FU
ND
BA
LAN
CE
SH
EE
T A
S A
T M
AR
CH
31,
200
9 (C
ont
d.)
Form
A-B
S(U
L)
(Rs.
‘000
)
Part
icul
ars
Sche
dule
Link
ed H
ealth
Fun
ds
Heal
th S
aver
Ba
lanc
erHe
alth
Sav
er
Prot
ecto
r
Heal
th
Save
r Fle
xi
Bala
nced
Heal
th S
aver
Fl
exi G
row
th
Heal
th S
aver
Pr
eser
ver
Heal
th S
aver
M
ultip
lier
Heal
th S
aver
Re
turn
G
uara
ntee
Heal
th S
aver
Re
turn
G
uara
ntee
II
Heal
th S
aver
Re
turn
G
uara
ntee
III
Heal
th R
etur
n G
uara
ntee
IVTo
tal
SOU
RCES
OF
FUN
DS
Polic
yhol
ders
’ Fun
ds:
Polic
yhol
der c
ontri
butio
nF-
14,
125
22,8
013,
610
76,1
021,
388
12,1
5968
,682
74,3
8170
,447
22,5
4735
6,24
2
Reve
nue
Acco
unt
(388
)(2
,353
)(3
01)
(4,8
98)
(121
)(8
30)
(9,6
59)
(7,9
98)
(5,0
15)
(1,5
50)
(33,
113)
Tota
l3,
737
20,4
483,
309
71,2
041,
267
11,3
2959
,023
66,3
8365
,432
20,9
9732
3,12
9
APPL
ICAT
ION
OF
FUN
DS
Inve
stm
ents
F-2
3,06
116
,611
2,78
364
,965
957
11,0
2756
,671
62,5
3059
,766
—27
8,37
1
Curre
nt A
sset
sF-
374
73,
837
613
13,2
1531
01,
656
2,35
53,
856
6,80
820
,997
54,3
94
Less
: Cur
rent
Lia
bilit
ies
and
Prov
ision
sF-
471
—87
6,97
6—
1,35
43
31,
142
—9,
636
Net
cur
rent
ass
ets
676
3,83
752
66,
239
310
302
2,35
23,
853
5,66
620
,997
44,7
58
Tota
l3,
737
20,4
483,
309
71,2
041,
267
11,3
2959
,023
66,3
8365
,432
20,9
9732
3,12
9
(a)
Net A
sset
as
per B
alan
ce S
heet
(T
otal
Ass
ets
less
Cur
rent
Lia
bilit
ies
and
Prov
ision
s) (R
s. ‘0
00)
3,73
720
,448
3,30
971
,204
1,26
711
,329
59,0
2366
,383
65,4
3220
,997
323,
129
(b)
Num
ber o
f Uni
ts o
utst
andi
ng (i
n ‘0
00)
365
1,99
032
06,
656
124
1,07
55,
771
6,47
36,
451
2,10
031
,326
(c)
NAV
per U
nit (
a)/(b
) (Rs
.)10
.23
10.2
810
.34
10.7
010
.19
10.5
410
.23
10.2
610
.14
10.0
0
ICICI PRU AR09_Final Pg29-197 (Ac).indd Sec1:94ICICI PRU AR09_Final Pg29-197 (Ac).indd Sec1:94 10/28/09 6:00:13 PM10/28/09 6:00:13 PM

I 95 I
ANNUAL REPORT 2008-09ICICI PRUDENTIAL LIFE INSURANCE
3.18
FU
ND
BA
LAN
CE
SH
EE
T A
S A
T M
AR
CH
31,
200
9 (C
ont
d.)
Form
A-B
S(U
L)
(Rs.
‘000
)
Part
icul
ars
Sche
dule
Link
ed G
roup
Fun
ds
Bala
nced
Inco
me
Shor
t-Te
rm
Debt
Capi
tal
Gua
rant
ee
Shor
t De
bt
Capi
tal
Gua
rant
ee
Bala
nced
Fu
nd
Capi
tal
Gua
rant
ee
Debt
Fun
d
Gro
wth
Capi
tal
Gua
rant
ee
Gro
wth
Leav
e En
cash
men
t Ba
lanc
ed
Fund
Leav
e En
cash
men
t De
bt F
und
Leav
e En
cash
men
t Sh
ort T
erm
De
bt F
und
Gro
up
Retu
rn
Gua
rant
ee
Gro
up
Retu
rn
Gua
rant
ee II
Tota
lG
rand
Tot
al
SOU
RCES
OF
FUN
DS
Polic
yhol
ders
’ Fun
ds:
Polic
yhol
der c
ontri
butio
nF-
14,
607,
215
3,07
9,99
04,
656,
176
2,87
1,19
259
2,66
51,
744,
613
2,39
5,35
963
,454
292,
546
6145
,367
2,26
9,45
46,
275
22,6
24,3
6731
9,41
7,86
2
Reve
nue
Acco
unt
1,26
4,88
531
1,96
872
2,47
925
8,78
455
,581
254,
985
(87,
315)
(1,8
15)
9,64
456
22,
366
46,0
18—
2,83
8,14
2(3
3,27
8,34
5)
Tota
l5,
872,
100
3,39
1,95
85,
378,
655
3,12
9,97
664
8,24
61,
999,
598
2,30
8,04
461
,639
302,
190
623
47,7
332,
315,
472
6,27
525
,462
,509
286,
139,
517
APPL
ICAT
ION
OF
FUN
DS
Inve
stm
ents
F-2
5,63
0,42
43,
276,
821
4,63
9,16
72,
858,
740
623,
493
1,91
4,95
92,
227,
109
60,1
5628
9,61
052
826
,825
2,25
9,09
4—
23,8
06,9
2628
0,10
2,29
2
Curre
nt A
sset
sF-
324
1,90
211
5,25
873
9,66
627
1,36
124
,788
84,7
3081
,023
1,48
712
,591
9520
,909
56,5
006,
275
1,65
6,58
510
,803
,504
Less
: Cur
rent
Lia
bilit
ies
and
Prov
ision
sF-
422
612
117
812
535
9188
411
—1
122
—1,
002
4,76
6,27
9
Net
cur
rent
ass
ets
241,
676
115,
137
739,
488
271,
236
24,7
5384
,639
80,9
351,
483
12,5
8095
20,9
0856
,378
6,27
51,
655,
583
6,03
7,22
5
Tota
l5,
872,
100
3,39
1,95
85,
378,
655
3,12
9,97
664
8,24
61,
999,
598
2,30
8,04
461
,639
302,
190
623
47,7
332,
315,
472
6,27
525
,462
,509
286,
139,
517
(a)
Net A
sset
as
per B
alan
ce S
heet
(T
otal
Ass
ets
less
Cur
rent
Lia
bilit
ies
and
Prov
ision
s) (R
s. ‘0
00)
5,87
2,10
03,
391,
958
5,37
8,65
53,
129,
976
648,
246
1,99
9,59
82,
308,
044
61,6
3930
2,19
062
347
,733
2,31
5,47
26,
275
25,4
62,5
0928
6,13
9,51
7
(b)
Num
ber o
f Uni
ts o
utst
andi
ng (i
n ‘0
00)
328,
067
225,
106
369,
684
258,
408
54,9
8415
3,72
911
6,11
86,
295
29,2
6156
4,36
322
5,33
462
81,
772,
031
21,8
05,3
56
(c)
NAV
per U
nit (
a)/(b
) (Rs
.)17
.90
15.0
714
.55
12.1
111
.79
13.0
119
.88
9.79
10.3
311
.19
10.9
410
.28
10.0
0
ICICI PRU AR09_Final Pg29-197 (Ac).indd Sec1:95ICICI PRU AR09_Final Pg29-197 (Ac).indd Sec1:95 10/28/09 6:00:13 PM10/28/09 6:00:13 PM

I 96 I
FINANCIAL REPORTS
ched
ule:
F-1
PO
LIC
YH
OLD
ER
S’ C
ON
TR
IBU
TIO
N A
S A
T M
AR
CH
31,
200
9 (R
s. ‘0
00)
Part
icul
ars
Link
ed L
ife F
unds
Bala
ncer
Prot
ecto
rM
axim
iser
Cash
Plu
sSe
cure
Pl
usPr
eser
ver
Inve
st
Shie
ld
Life
New
In
vest
Sh
ield
Ba
lanc
ed
Flex
i G
row
thFl
exi
Bala
nced
R.I.C
.H.
Fund
Mul
tiplie
rRe
turn
G
uara
ntee
Retu
rn
Gua
rant
ee II
Retu
rn
Gua
rant
ee III
Retu
rn
Gua
rant
ee IV
Tota
l
Ope
ning
bal
ance
16
,395
,721
7,80
8,12
472
,538
,052
1,93
6,63
519
5,61
81,
092,
233
869,
645
920,
356
27,9
87,6
8490
2,58
11,
492,
801
5,99
4,62
8—
——
—13
8,13
4,07
8
Add:
Add
ition
s du
ring
the
year
*4,
741,
253
7,54
7,90
123
,955
,703
1,46
2,49
955
,289
1,92
9,44
832
0,58
264
1,64
518
,906
,276
682,
657
7,64
1,22
65,
831,
203
672,
399
729,
195
754,
138
211,
145
76,0
82,5
59
Less
: Ded
uctio
ns d
urin
g th
e ye
ar**
4,58
7,45
83,
021,
082
9,03
4,42
528
,777
6,63
354
7,68
646
,547
1,29
11,
977,
875
40,0
379,
862
128,
862
1,03
361
48—
19,4
31,6
77
Clos
ing
bala
nce
16,5
49,5
1612
,334
,943
87,4
59,3
303,
370,
357
244,
274
2,47
3,99
51,
143,
680
1,56
0,71
044
,916
,085
1,54
5,20
19,
124,
165
11,6
96,9
6967
1,36
672
9,13
475
4,09
021
1,14
519
4,78
4,96
0
(R
s. ‘0
00)
Part
icul
ars
Link
ed P
ensi
on fu
nds
Bala
ncer
Prot
ecto
r In
com
eM
axim
iser
Fu
nd
Gro
wth
Secu
re
Plus
Pe
nsio
n
Pres
erve
rIn
vest
Sh
ield
Pe
nsio
n
Flex
i G
row
thFl
exi
Bala
nced
Pens
ion
R.I.C
.H.
Fund
Pens
ion
Mul
tiplie
rPe
nsio
n Re
turn
G
uara
ntee
Pens
ion
Retu
rn
Gua
rant
ee II
Pens
ion
Retu
rn
Gua
ran-
tee
III
Pens
ion
Retu
rn
Gua
rant
ee
IV
Tota
l
Ope
ning
bal
ance
5,
871,
885
3,31
7,72
119
,266
,618
86,2
5713
8,99
016
6,44
418
,383
,855
505,
707
3,17
3,82
32,
644,
803
——
——
53,5
56,1
03
Add:
Add
ition
s du
ring
the
year
*2,
468,
742
4,73
9,85
28,
109,
575
18,8
6184
8,88
754
,966
14,7
32,5
5256
4,81
111
,434
,086
2,66
6,89
52,
121,
958
1,97
8,52
02,
083,
224
624,
958
52,4
47,8
87
Less
: Ded
uctio
ns d
urin
g th
e ye
ar**
926,
982
476,
298
1,46
2,60
62,
531
30,8
549,
708
1,09
7,98
321
,363
136,
865
184,
958
468
838
243
—4,
351,
697
Clos
ing
bala
nce
7,41
3,64
57,
581,
275
25,9
13,5
8710
2,58
795
7,02
321
1,70
232
,018
,424
1,04
9,15
514
,471
,044
5,12
6,74
02,
121,
490
1,97
7,68
22,
082,
981
624,
958
101,
652,
293
(R
s. ‘0
00)
Part
icul
ars
Link
ed H
ealth
Fun
ds
Heal
th S
aver
Ba
lanc
erHe
alth
Sav
er
Prot
ecto
r He
alth
Sav
er
Flex
i Bal
ance
d He
alth
Sav
er
Flex
i Gro
wth
He
alth
Sav
er
Pres
erve
r He
alth
Sav
er
Mul
tiplie
r He
alth
Sav
er
Retu
rn
Gua
rant
ee
Heal
th S
aver
Re
turn
G
uara
ntee
II
Heal
th S
aver
Re
turn
G
uara
ntee
III
Heal
th R
etur
n G
uara
ntee
IVTo
tal
Ope
ning
bal
ance
—
——
——
——
——
——
Add:
Add
ition
s du
ring
the
year
*4,
134
22,8
413,
610
76,1
031,
388
12,1
5968
,752
74,3
9470
,465
22,5
4735
6,39
3
Less
: Ded
uctio
ns d
urin
g th
e ye
ar**
940
—1
——
7013
18—
151
Clos
ing
bala
nce
4,12
522
,801
3,61
076
,102
1,38
812
,159
68,6
8274
,381
70,4
4722
,547
356,
242
(R
s. ‘0
00)
Part
icul
ars
Link
ed G
roup
Fun
ds
Gra
nd T
otal
Bala
nced
Inco
me
Shor
t-Te
rm
Debt
Capi
tal G
uar-
ante
e Sh
ort
Debt
Capi
tal
Gua
rant
ee
Bala
nced
Fu
nd
Capi
tal
Gua
rant
ee
Debt
Fun
d
Gro
wth
Capi
tal
Gua
rant
ee
Gro
wth
Leav
e En
cash
men
t Ba
lanc
ed
Fund
Leav
e En
cash
men
t De
bt F
und
Leav
e En
cash
men
t Sh
ort T
erm
De
bt F
und
Gro
up
Retu
rn G
uar-
ante
e
Gro
up
Retu
rn
Gua
rant
ee II
Tota
l
Ope
ning
bal
ance
4,
651,
569
1,46
4,98
85,
498,
722
1,00
6,17
621
3,03
73,
701
2,51
2,56
611
,577
249,
982
20,0
0125
,182
——
15,6
57,5
0120
7,34
7,68
2
Add:
Add
ition
s du
ring
the
year
*1,
067,
287
2,79
8,38
44,
753,
483
2,72
1,71
451
0,45
71,
741,
484
987,
252
57,4
1042
,564
6020
,185
2,26
9,52
96,
275
16,9
76,0
8414
5,86
2,92
3
Less
: Ded
uctio
ns d
urin
g th
e ye
ar**
1,11
1,64
11,
183,
382
5,59
6,02
985
6,69
813
0,82
957
21,
104,
459
5,53
3—
20,0
00—
75—
10,0
09,2
1833
,792
,743
Clos
ing
bala
nce
4,60
7,21
53,
079,
990
4,65
6,17
62,
871,
192
592,
665
1,74
4,61
32,
395,
359
63,4
5429
2,54
661
45,3
672,
269,
454
6,27
522
,624
,367
319,
417,
862
* Re
pres
ents
uni
t cre
atio
n**
Rep
rese
nts
unit
canc
ella
tions
ICICI PRU AR09_Final Pg29-197 (Ac).indd Sec1:96ICICI PRU AR09_Final Pg29-197 (Ac).indd Sec1:96 10/28/09 6:00:13 PM10/28/09 6:00:13 PM

I 97 I
ANNUAL REPORT 2008-09ICICI PRUDENTIAL LIFE INSURANCE
Sch
edul
e: F
-2IN
VE
ST
ME
NT
S A
S A
T M
AR
CH
31,
200
9
(R
s. ‘0
00)
Part
icul
ars
Link
ed L
ife F
unds
Bala
ncer
Prot
ecto
rM
axim
iser
Cash
Plu
sSe
cure
Pl
usPr
eser
ver
Inve
st
Shie
ld
Life
New
In
vest
Sh
ield
Bal
-an
ced
Flex
i G
row
thFl
exi
Bala
nced
R.I.C
.H.
Fund
Mul
tiplie
rRe
turn
G
uara
ntee
Retu
rn
Gua
rant
ee II
Retu
rn
Gua
rant
e III
Retu
rn
Gua
rant
ee IV
Tota
l
Appr
oved
Inve
stm
ents
Gove
rnm
ent B
onds
2,44
6,34
62,
061,
127
2,00
0,39
047
3,49
637
,590
—12
9,84
314
9,94
3—
116,
131
——
——
——
7,41
4,86
6
Corp
orat
e Bo
nds
3,91
1,16
03,
555,
854
64,4
6793
1,40
372
,597
—21
4,16
823
8,05
2—
193,
371
200,
000
—31
2,91
335
4,30
828
4,20
0—
10,3
32,4
93
Infra
stru
ctur
e Bo
nds
4,10
4,01
93,
188,
103
626,
136
625,
152
49,0
4639
5,37
020
3,35
818
4,73
0—
146,
837
—45
8,27
321
2,22
330
6,42
424
7,91
3—
10,7
47,5
84
Equi
ty*
5,37
8,39
9—
51,1
68,8
70—
409
—18
6,82
433
9,19
622
,301
,431
453,
265
5,16
2,47
46,
222,
512
——
——
91,2
13,3
80
Mon
ey M
arke
t2,
985,
756
2,26
6,71
312
,585
,311
635,
615
54,6
861,
531,
253
132,
224
189,
652
4,79
9,14
412
8,14
167
4,70
056
8,64
8—
—1,
554
—26
,553
,397
Mut
ual F
unds
858,
010
586,
171
664,
892
136,
839
10,9
1711
4,32
244
,982
57,0
0174
8,28
252
,633
271,
643
349,
344
25,5
9727
,069
112
—3,
947,
814
Depo
sit w
ith B
anks
254,
273
1,29
5,06
566
6,93
342
6,53
815
,675
479,
456
88,8
5895
,243
158,
816
29,0
8911
3,90
0—
91,3
919,
045
96,7
05—
3,82
0,98
7
Tota
l 19
,937
,963
12,9
53,0
3367
,776
,999
3,22
9,04
324
0,92
02,
520,
401
1,00
0,25
71,
253,
817
28,0
07,6
731,
119,
467
6,42
2,71
77,
598,
777
642,
124
696,
846
630,
484
—15
4,03
0,52
1
Oth
er In
vest
men
ts
Corp
orat
e Bo
nds
345,
399
310,
625
538,
088
20,6
385,
586
172,
099
15,7
429,
586
—8,
144
——
——
——
1,42
5,90
7
Infra
stru
ctur
e Bo
nds
——
——
——
——
——
——
——
——
—
Equi
ty76
5,69
0—
7,40
2,45
9—
——
31,2
8049
,732
3,56
3,50
172
,875
574,
460
1,11
4,21
0—
——
—13
,574
,207
Mon
ey M
arke
t—
——
——
——
——
——
——
——
——
Mut
ual F
unds
71,4
2691
3,39
9—
54,3
3217
,127
131,
631
48,1
5582
,008
—87
,405
141,
052
269,
868
——
——
1,81
6,40
3
Vent
ure
Fund
——
——
——
—21
,979
——
——
——
——
21,9
79
Tota
l1,
182,
515
1,22
4,02
47,
940,
547
74,9
7022
,713
303,
730
95,1
7716
3,30
53,
563,
501
168,
424
715,
512
1,38
4,07
8—
——
—16
,838
,496
GRA
ND
TOTA
L21
,120
,478
14,1
77,0
5775
,717
,546
3,30
4,01
326
3,63
32,
824,
131
1,09
5,43
41,
417,
122
31,5
71,1
741,
287,
891
7,13
8,22
98,
982,
855
642,
124
696,
846
630,
484
—17
0,86
9,01
7
% o
f App
rove
d In
vest
men
ts to
Tot
al94
%91
%90
%98
%91
%89
%91
%88
%89
%87
%90
%85
%10
0%10
0%10
0%0%
90%
% o
f Oth
er In
vest
men
ts to
Tot
al6%
9%10
%2%
9%11
%9%
12%
11%
13%
10%
15%
0%0%
0%0%
10%
* In
clud
es in
vest
men
ts in
pre
fere
nce
shar
es a
mou
ntin
g to
Rs.
83,
955
(thou
sand
)
ICICI PRU AR09_Final Pg29-197 (Ac).indd Sec1:97ICICI PRU AR09_Final Pg29-197 (Ac).indd Sec1:97 10/28/09 6:00:14 PM10/28/09 6:00:14 PM

I 98 I
FINANCIAL REPORT
Sch
edul
e: F
-2IN
VE
ST
ME
NT
S A
S A
T M
AR
CH
31,
200
9 (C
ont
d.)
(R
s. ‘0
00)
Part
icul
ars
Link
ed P
ensi
on F
unds
Bala
ncer
Prot
ecto
r In
com
eM
axim
iser
Fu
nd
Gro
wth
Secu
re P
lus
Pens
ion
Pres
erve
rIn
vest
Sh
ield
Pen
-si
on
Flex
i G
row
thFl
exi
Bala
nced
Pens
ion
R.I.C
.H.
Fund
Pens
ion
Mul
tiplie
rPe
nsio
n Re
turn
G
uara
ntee
Pens
ion
Retu
rn
Gua
rant
ee II
Pens
ion
Retu
rn
Gua
ran-
tee
III
Pens
ion
Retu
rn
Gua
rant
ee
IV
Tota
l
Appr
oved
Inve
stm
ents
Gove
rnm
ent B
onds
1,0
17,7
49
1,2
14,3
25
—
16,
375
—
25,
812
—
84,
445
—
—
—
—
—
—
2,3
58,7
06
Corp
orat
e Bo
nds
1,6
77,4
99
1,9
25,8
51
—
27,
397
268
4
0,78
1 —
1
07,4
53
300
,000
—
1
,190
,702
1
,002
,231
9
65,2
96
—
7,2
37,4
78
Infra
stru
ctur
e Bo
nds
1,6
99,2
33
1,7
77,0
83
245
,901
2
4,82
7 1
29,4
58
30,
829
—
82,
960
—
—
815
,258
8
79,3
60
846
,536
—
6
,531
,445
Equi
ty*
2,1
59,0
54
—
14,
558,
289
—
—
38,
330
16,
093,
553
314
,788
8
,161
,975
2
,541
,474
—
—
—
—
4
3,86
7,46
3
Mon
ey M
arke
t 1
,393
,247
1
,198
,137
3
,919
,023
2
0,02
1 5
26,6
93
52,
053
3,3
60,6
68
175
,181
6
16,7
54
596
,774
—
—
—
—
1
1,85
8,55
1
Mut
ual F
unds
365
,340
3
43,6
97
596
,573
4
,885
3
9,18
2 8
,967
4
12,1
00
36,
821
432
,700
1
06,0
77
47,
656
44,
048
636
—
2
,438
,682
Depo
sit w
ith B
anks
85,
535
1,5
22,3
04
241
,714
1
9,07
0 1
73,6
97
9,7
47
—
15,
733
199
,782
4
9,70
0 2
4,78
5 2
3,30
3 2
34,7
15
—
2,6
00,0
85
Tota
l 8
,397
,657
7
,981
,397
1
9,56
1,50
0 1
12,5
75
869
,298
2
06,5
19
19,
866,
321
817
,381
9
,711
,211
3
,294
,025
2
,078
,401
1
,948
,942
2
,047
,183
—
7
6,89
2,41
0
Oth
er In
vest
men
ts
Corp
orat
e Bo
nds
112
,938
8
8,31
0 —
2
,922
4
2,66
5 3
,077
3
,971
3
,338
—
—
—
—
—
—
2
57,2
21
Infra
stru
ctur
e Bo
nds
—
—
—
—
—
—
—
—
—
—
—
—
—
—
—
Equi
ty 2
97,6
18
—
2,0
42,5
56
—
—
6,4
64
2,8
41,3
08
60,
659
1,0
36,5
12
556
,796
—
—
—
—
6
,841
,913
Mon
ey M
arke
t —
—
—
—
—
—
—
—
—
—
—
—
—
—
—
Mut
ual F
unds
267
,325
2
66,8
23
—
2,0
61
59,
874
2,6
64
—
20,
923
536
,764
—
—
—
—
—
1
,156
,434
Vent
ure
Fund
—
—
—
—
—
—
—
—
—
—
—
—
—
—
—
Tota
l 6
77,8
81
355
,133
2
,042
,556
4
,983
1
02,5
39
12,
205
2,8
45,2
79
84,
920
1,5
73,2
76
556
,796
—
—
—
—
8
,255
,568
GRA
ND
TOTA
L 9
,075
,538
8
,336
,530
2
1,60
4,05
6 1
17,5
58
971
,837
2
18,7
24
22,
711,
600
902
,301
1
1,28
4,48
7 3
,850
,821
2
,078
,401
1
,948
,942
2
,047
,183
—
8
5,14
7,97
8
% o
f App
rove
d In
vest
men
ts to
Tot
al93
%96
%91
%96
%89
%94
%87
%91
%86
%86
%10
0%10
0%10
0%0%
90%
% o
f Oth
er In
vest
men
ts to
Tot
al7%
4%9%
4%11
%6%
13%
9%14
%14
%0%
0%0%
0%10
%
* In
clud
es in
vest
men
ts in
pre
fere
nce
shar
es a
mou
ntin
g to
Rs.
83,
955
(thou
sand
)
ICICI PRU AR09_Final Pg29-197 (Ac).indd Sec1:98ICICI PRU AR09_Final Pg29-197 (Ac).indd Sec1:98 10/28/09 6:00:14 PM10/28/09 6:00:14 PM
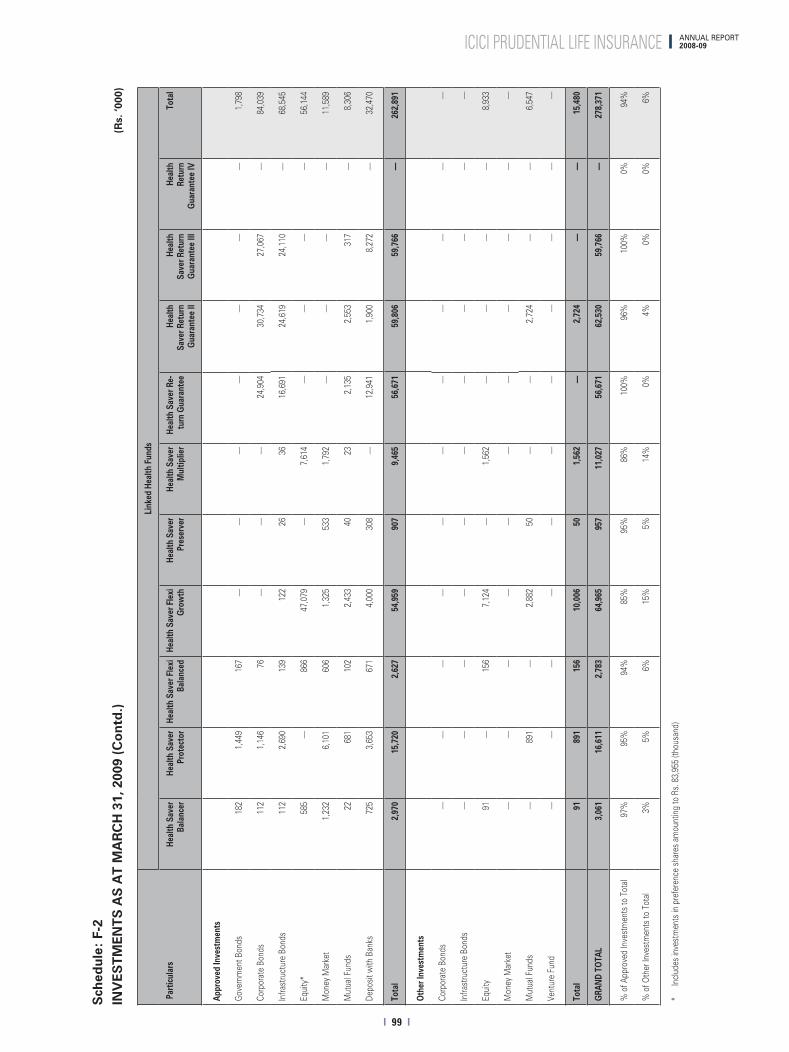
I 99 I
ANNUAL REPORT 2008-09ICICI PRUDENTIAL LIFE INSURANCE
Sch
edul
e: F
-2IN
VE
ST
ME
NT
S A
S A
T M
AR
CH
31,
200
9 (C
ont
d.)
(R
s. ‘0
00)
Par
ticul
ars
Link
ed H
ealth
Fun
ds
Heal
th S
aver
Ba
lanc
erHe
alth
Sav
er
Prot
ecto
r He
alth
Sav
er F
lexi
Ba
lanc
ed
Heal
th S
aver
Fle
xi
Gro
wth
He
alth
Sav
er
Pres
erve
r He
alth
Sav
er
Mul
tiplie
r He
alth
Sav
er R
e-tu
rn G
uara
ntee
He
alth
Sa
ver R
etur
n G
uara
ntee
II
Heal
th
Save
r Ret
urn
Gua
rant
ee II
I
Heal
th
Retu
rn
Gua
rant
ee IV
Tota
l
Appr
oved
Inve
stm
ents
Gove
rnm
ent B
onds
182
1,44
916
7—
——
——
——
1,79
8
Corp
orat
e Bo
nds
112
1,14
676
——
—24
,904
30,7
3427
,067
—84
,039
Infra
stru
ctur
e Bo
nds
112
2,69
013
912
226
3616
,691
24,6
1924
,110
—68
,545
Equi
ty*
585
—86
647
,079
—7,
614
——
——
56,1
44
Mon
ey M
arke
t1,
232
6,10
160
61,
325
533
1,79
2—
——
—11
,589
Mut
ual F
unds
2268
110
22,
433
4023
2,13
52,
553
317
—8,
306
Depo
sit w
ith B
anks
725
3,65
367
14,
000
308
—12
,941
1,90
08,
272
—32
,470
Tota
l 2,
970
15,7
202,
627
54,9
5990
79,
465
56,6
7159
,806
59,7
66—
262,
891
Oth
er In
vest
men
ts
Corp
orat
e Bo
nds
——
——
——
——
——
—
Infra
stru
ctur
e Bo
nds
——
——
——
——
——
—
Equi
ty91
—15
67,
124
—1,
562
——
——
8,93
3
Mon
ey M
arke
t—
——
——
——
——
——
Mut
ual F
unds
—89
1—
2,88
250
——
2,72
4—
—6,
547
Vent
ure
Fund
——
——
——
——
——
—
Tota
l91
891
156
10,0
0650
1,56
2—
2,72
4—
—15
,480
GRA
ND
TOTA
L3,
061
16,6
112,
783
64,9
6595
711
,027
56,6
7162
,530
59,7
66—
278,
371
% o
f App
rove
d In
vest
men
ts to
Tot
al97
%95
%94
%85
%95
%86
%10
0%96
%10
0%0%
94%
% o
f Oth
er In
vest
men
ts to
Tot
al3%
5%6%
15%
5%14
%0%
4%0%
0%6%
* In
clud
es in
vest
men
ts in
pre
fere
nce
shar
es a
mou
ntin
g to
Rs.
83,
955
(thou
sand
)
ICICI PRU AR09_Final Pg29-197 (Ac).indd Sec1:99ICICI PRU AR09_Final Pg29-197 (Ac).indd Sec1:99 10/28/09 6:00:14 PM10/28/09 6:00:14 PM

I 100 I
FINANCIAL REPORT
Sch
edul
e: F
-2IN
VE
ST
ME
NT
S A
S A
T M
AR
CH
31,
200
9 (C
ont
d.)
(R
s. ‘0
00)
Part
icul
ars
Link
ed G
roup
Fun
ds
Bala
nced
Inco
me
Shor
t-Ter
m
Debt
Capi
tal
Gua
rant
ee
Shor
t Deb
t
Capi
tal
Gua
rant
ee
Bala
nced
Fu
nd
Capi
tal
Gua
rant
ee
Debt
Fun
d
Gro
wth
Capi
tal
Gua
rant
ee
Gro
wth
Leav
e En
cash
men
t Ba
lanc
ed
Fund
Leav
e En
cash
men
t De
bt F
und
Leav
e En
cash
men
t Sh
ort T
erm
De
bt F
und
Gro
up
Retu
rn
Gua
rant
ee
Gro
up
Retu
rn
Gua
rant
ee II
Tota
lG
rand
Tot
al
Appr
oved
Inve
stm
ents
Gove
rnm
ent B
onds
911
,331
5
52,9
81
—
—
76,
933
—
191
,953
6
,196
3
6,78
9 6
5 —
—
—
1
,776
,248
11
,551
,618
Corp
orat
e Bo
nds
1,6
98,4
10
1,0
83,7
00
373
,306
2
54,9
31
104
,314
9
77,3
21
313
,719
7
,259
5
2,89
4 1
70
1,4
28
1,0
70,6
09
—
5,9
38,0
61
23,5
92,0
71
Infra
stru
ctur
e Bo
nds
1,2
82,2
32
824
,245
9
25,0
23
770
,597
6
6,02
1 7
34,5
78
308
,748
5
,967
3
9,10
8 6
2 4
,433
1
,059
,911
—
6
,020
,925
23
,368
,499
Equi
ty*
741
,654
—
—
—
7
2,81
7 —
1
,096
,600
1
7,33
1 3
7,21
9 —
—
—
—
1
,965
,621
13
7,10
2,60
8
Mon
ey M
arke
t 7
53,8
58
382
,383
1
,619
,650
8
92,4
58
158
,395
—
1
02,2
84
17,
637
42,
203
56
9,2
30
—
—
3,9
78,1
54
42,4
01,6
91
Mut
ual F
unds
61,
958
134
,580
1
88,5
09
37,
395
—
44,
818
43,
824
879
1
1,93
1 2
2 1
,101
1
3,13
8 —
5
38,1
55
6,93
2,95
7
Depo
sit w
ith B
anks
28,
387
128
,049
1
,011
,857
6
51,6
77
126
,561
—
—
1
,502
4
9,04
0 1
37
8,8
14
115
,436
—
2
,121
,460
8,
575,
002
Oth
er In
vest
men
ts5,
477,
830
3,10
5,93
84,
118,
345
2,60
7,05
860
5,04
11,
756,
717
2,05
7,12
856
,771
269,
184
512
25,0
062,
259,
094
—22
,338
,624
253,
524,
446
Corp
orat
e Bo
nds
51,
358
16,
592
516
,803
2
51,6
82
6,2
04
158
,242
1
2,28
6 1
87
—
—
—
—
—
1,0
13,3
54
2,69
6,48
2
Infra
stru
ctur
e Bo
nds
—
—
—
—
—
—
—
—
—
—
—
—
—
—
—
Equi
ty 1
01,2
36
—
—
—
12,
248
—
157
,695
3
,198
5
,666
—
—
—
—
2
80,0
43
20,7
05,0
96
Mon
ey M
arke
t —
—
—
—
—
—
—
—
—
—
—
—
—
—
—
Mut
ual F
unds
—
154
,291
4
,019
—
—
—
—
—
1
4,76
0 1
6 1
,819
—
—
1
74,9
05
3,15
4,28
9
Vent
ure
Fund
—
—
—
—
—
—
—
—
—
—
—
—
—
—
21,9
79
Tota
l 1
52,5
94
170
,883
5
20,8
22
251
,682
1
8,45
2 1
58,2
42
169
,981
3
,385
2
0,42
6 1
6 1
,819
—
—
1
,468
,302
26
,577
,846
GRA
ND
TOTA
L 5
,630
,424
3
,276
,821
4
,639
,167
2
,858
,740
6
23,4
93
1,9
14,9
59
2,2
27,1
09
60,
156
289
,610
5
28
26,
825
2,2
59,0
94
—
23,
806,
926
280,
102,
292
% o
f App
rove
d In
vest
men
ts to
Tot
al97
%95
%89
%91
%97
%92
%92
%94
%93
%97
%93
%10
0%0%
94%
% o
f Oth
er In
vest
men
ts to
Tot
al3%
5%11
%9%
3%8%
8%6%
7%3%
7%0%
0%6%
* In
clud
es in
vest
men
ts in
pre
fere
nce
shar
es a
mou
ntin
g to
Rs.
83,
955
(thou
sand
)
ICICI PRU AR09_Final Pg29-197 (Ac).indd Sec1:100ICICI PRU AR09_Final Pg29-197 (Ac).indd Sec1:100 10/28/09 6:00:14 PM10/28/09 6:00:14 PM

I 101 I
ANNUAL REPORT 2008-09ICICI PRUDENTIAL LIFE INSURANCE
Sch
edul
e: F
-3C
UR
RE
NT
AS
SE
TS
AS
AT
MA
RC
H 3
1, 2
009
(Rs.
‘000
)
Part
icul
ars
Link
ed L
ife F
unds
Bala
ncer
Prot
ecto
rM
axim
iser
Cash
Plu
sSe
cure
Pl
usPr
eser
ver
Inve
st
Shie
ld
Life
New
In
vest
Sh
ield
Ba
lanc
ed
Flex
i G
row
thFl
exi
Bala
nced
R.I.C
.H.
Fund
Mul
tiplie
rRe
turn
G
uara
ntee
Retu
rn
Gua
rant
ee II
Retu
rn
Gua
rant
ee
III
Retu
rn
Gua
rant
ee
IV
Tota
l
Accr
ued
Inte
rest
32
9,92
335
0,56
710
2,27
786
,531
6,49
834
,956
21,7
6024
,523
801
14,1
001,
922
9,03
218
,623
19,7
0117
,884
—1,
039,
098
Cash
& B
ank
Bala
nce
96
7,90
910
1010
910
1010
99
910
9—
8,03
9
Divid
end
Rece
ivabl
e 2,
311
—17
,368
——
——
809,
349
160
1,25
03,
487
——
——
34,0
05
Rece
ivabl
e fo
r Sal
e of
Inve
stm
ents
33
8,30
216
6,87
31,
105,
206
41,3
453,
388
—13
,912
23,5
2794
3,09
325
,776
55,0
6610
7,26
0—
——
—2,
823,
748
Unit
Colle
ctio
n A/
c 44
,603
88,7
6927
0,50
417
,910
1,41
533
,795
2,81
88,
496
408,
563
26,0
3617
9,59
210
9,68
71,
132
4,36
610
7,54
420
6,29
41,
511,
524
Oth
er C
urre
nt A
sset
s (fo
r Inv
estm
ents
) 2
—7
——
——
——
——
——
——
—9
Appr
opria
tion/
Expr
opria
tion
(Ass
et)
(24,
483)
735
207,
880
172
161
143
973
1,62
169
,813
2,21
818
,961
24,3
7033
3632
—30
2,66
5
Tota
l69
0,66
760
6,95
01,
711,
151
145,
968
11,4
7268
,904
39,4
7258
,257
1,43
1,62
968
,300
256,
800
253,
845
19,7
9724
,113
125,
469
206,
294
5,71
9,08
8
(Rs.
‘000
)
Part
icul
ars
Link
ed P
ensi
on F
unds
Bala
ncer
Prot
ecto
r In
com
eM
axim
iser
Fu
nd
Gro
wth
Secu
re
Plus
Pe
nsio
n
Pres
erve
rIn
vest
Sh
ield
Pe
nsio
n
Flex
i G
row
thFl
exi
Bala
nced
Pens
ion
R.I.C
.H.
Fund
Pens
ion
Mul
tiplie
rPe
nsio
n Re
turn
G
uara
ntee
Pens
ion
Retu
rn
Gua
rant
ee II
Pens
ion
Retu
rn
Gua
rant
ee
III
Pens
ion
Retu
rn
Gua
rant
ee
IV
Tota
l
Accr
ued
Inte
rest
12
6,52
618
7,26
94,
002
3,33
38,
102
3,96
567
57,
904
1,25
838
761
,910
54,2
0950
,618
—51
0,15
8
Cash
& B
ank
Bala
nce
910
1110
109
1010
1010
1013
10—
132
Divid
end
Rece
ivabl
e —
—5,
199
——
48,
233
127
2,24
11,
345
——
——
17,1
49
Rece
ivabl
e fo
r Sal
e of
Inve
stm
ents
14
5,33
491
,361
278,
681
1,48
3—
2,79
244
9,08
318
,784
203,
481
68,6
98—
——
—1,
259,
697
Unit
Colle
ctio
n A/
c 41
,582
82,5
3484
,169
570
26,2
1538
322
1,04
210
,482
241,
322
82,9
19(5
97)
(634
)15
,615
617,
927
1,42
3,52
9
Oth
er C
urre
nt A
sset
s (fo
r Inv
estm
ents
) 1
—1
——
——
——
——
——
—2
Appr
opria
tion/
Expr
opria
tion
(Ass
et)
10,3
9343
158
,925
7249
194
50,2
421,
552
30,2
3210
,370
107
100
103
—16
2,77
0
Tota
l32
3,84
536
1,60
543
0,98
85,
468
34,3
767,
347
729,
285
38,8
5947
8,54
416
3,72
961
,430
53,6
8866
,346
617,
927
3,37
3,43
7
ICICI PRU AR09_Final Pg29-197 (Ac).indd Sec1:101ICICI PRU AR09_Final Pg29-197 (Ac).indd Sec1:101 10/28/09 6:00:14 PM10/28/09 6:00:14 PM

I 102 I
FINANCIAL REPORT
Sch
edul
e: F
-3C
UR
RE
NT
AS
SE
TS
AS
AT
MA
RC
H 3
1, 2
009
(Co
ntd
.)
(Rs.
‘000
)
Part
icul
ars
Link
ed H
ealth
Fun
ds
Heal
th
Save
r Ba
lanc
er
Heal
th
Save
r Pr
otec
tor
Heal
th
Save
r Fle
xi
Bala
nced
Heal
th
Save
r Fle
xi
Gro
wth
Heal
th
Save
r Pr
eser
ver
Heal
th
Save
r M
ultip
lier
Heal
th S
aver
Re
turn
G
uara
ntee
Heal
th S
aver
Re
turn
G
uara
ntee
II
Heal
th S
aver
Re
turn
G
uara
ntee
III
Heal
th
Retu
rn
Gua
rant
ee IV
Tota
l
Accr
ued
Inte
rest
62
328
3715
21—
1,56
51,
644
1,81
0—
5,48
2
Cash
& B
ank
Bala
nce
1011
1010
1010
1010
10—
91
Divid
end
Rece
ivabl
e —
——
——
——
——
——
Rece
ivabl
e fo
r Sal
e of
Inve
stm
ents
19
102
163,
630
—25
8—
——
—4,
025
Unit
Colle
ctio
n A/
c 65
33,
395
545
9,42
427
91,
366
777
2,19
94,
985
20,9
9744
,620
Oth
er C
urre
nt A
sset
s (fo
r Inv
estm
ents
) —
——
——
——
——
——
Appr
opria
tion/
Expr
opria
tion
(Ass
et)
31
513
6—
223
33
—17
6
Tota
l74
73,
837
613
13,2
1531
01,
656
2,35
53,
856
6,80
820
,997
54,3
94
(Rs.
‘000
)
Part
icul
ars
Link
ed G
roup
Fun
ds
Bala
nced
Inco
me
Shor
t-Te
rm
Debt
Capi
tal
Gua
rant
ee
Shor
t Deb
t
Capi
tal
Gua
rant
ee
Bala
nced
Fu
nd
Capi
tal
Gua
rant
ee
Debt
Fun
d
Gro
wth
Capi
tal
Gua
rant
ee
Gro
wth
Leav
e En
cash
men
t Ba
lanc
ed
Fund
Leav
e En
cash
men
t De
bt F
und
Leav
e En
cash
men
t Sh
ort T
erm
De
bt F
und
Gro
up
Retu
rn
Gua
rant
ee
Gro
up
Retu
rn
Gua
rant
ee II
Tota
lG
rand
Tot
al
Accr
ued
Inte
rest
12
0,72
062
,207
78,0
5656
,493
10,8
0480
,676
23,3
1059
85,
863
2271
255
,730
—49
5,19
12,
049,
929
Cash
& B
ank
Bala
nce
910
1010
149
1111
99
1111
—12
48,
386
Divid
end
Rece
ivabl
e 42
0—
——
38—
528
920
——
——
1,01
552
,169
Rece
ivabl
e fo
r Sal
e of
Inve
stm
ents
60
,298
38,3
69—
—9,
061
—32
,097
483
4,15
44
——
—14
4,46
64,
231,
936
Unit
Colle
ctio
n A/
c 63
,884
14,5
0366
1,83
621
4,71
24,
491
3,94
528
,890
317
2,36
860
20,1
8564
36,
275
1,02
2,10
94,
001,
782
Oth
er C
urre
nt A
sset
s (fo
r Inv
estm
ents
) —
——
——
——
——
——
——
—11
Appr
opria
tion/
Expr
opria
tion
(Ass
et)
(3,4
29)
169
(236
)14
638
010
0(3
,813
)69
177
—1
116
—(6
,320
)45
9,29
1
Tota
l24
1,90
211
5,25
873
9,66
627
1,36
124
,788
84,7
3081
,023
1,48
712
,591
9520
,909
56,5
006,
275
1,65
6,58
510
,803
,504
ICICI PRU AR09_Final Pg29-197 (Ac).indd Sec1:102ICICI PRU AR09_Final Pg29-197 (Ac).indd Sec1:102 10/28/09 6:00:14 PM10/28/09 6:00:14 PM

I 103 I
ANNUAL REPORT 2008-09ICICI PRUDENTIAL LIFE INSURANCE
Sch
edul
e: F
-4C
UR
RE
NT
LIA
BIL
ITIE
S A
S A
T M
AR
CH
31,
200
9 (R
s. ‘0
00)
Part
icul
ars
Link
ed L
ife F
unds
Bala
ncer
Prot
ecto
rM
axim
iser
Cash
Plu
sSe
cure
Pl
usPr
eser
ver
Inve
st
Shie
ld
Life
New
In
vest
Sh
ield
Ba
lanc
ed
Flex
i G
row
thFl
exi
Bala
nced
R.I.C
.H.
Fund
Mul
tiplie
rRe
turn
G
uara
ntee
Retu
rn
Gua
rant
ee II
Retu
rn
Gua
rant
ee
III
Retu
rn
Gua
rant
ee
IV
Tota
l
Paya
ble
for P
urch
ase
of In
vest
men
ts
124
,344
—
1
,357
,502
—
—
—
—
3
1,05
4 9
34,6
29
—
301
,710
2
40,6
56
—
—
12,
417
—
3,0
02,3
12
Oth
er C
urre
nt L
iabi
litie
s 1
,271
5
34
4,8
22
122
9
5
9 3
9 4
9 1
,867
6
8 3
74
540
2
9 3
1 3
0 —
9
,844
Unit
Paya
ble
a/c
#
—
—
—
—
—
—
—
—
—
—
—
—
—
—
—
—
—
Tota
l 1
25,6
15
534
1
,362
,324
1
22
9
59
39
31,
103
936
,496
6
8 3
02,0
84
241
,196
2
9 3
1 1
2,44
7 —
3
,012
,156
(R
s. ‘0
00)
Part
icul
ars
Link
ed P
ensi
on F
unds
Bala
ncer
Prot
ecto
r In
com
eM
axim
iser
Fu
nd
Gro
wth
Secu
re
Plus
Pe
nsio
n
Pres
erve
rIn
vest
Sh
ield
Pe
nsio
n
Flex
i G
row
thFl
exi
Bala
nced
Pens
ion
R.I.C
.H.
Fund
Pens
ion
Mul
tiplie
rPe
nsio
n Re
turn
G
uara
ntee
Pens
ion
Retu
rn
Gua
rant
ee II
Pens
ion
Retu
rn
Gua
rant
ee
III
Pens
ion
Retu
rn
Gua
rant
ee
IV
Tota
l
Paya
ble
for P
urch
ase
of In
vest
men
ts
150
,080
—
4
64,7
50
—
—
—
435
,711
—
4
97,8
80
150
,409
—
8
,621
3
2,04
5 —
1
,739
,496
Oth
er C
urre
nt L
iabi
litie
s 3
73
291
1
,030
4
2
0 8
1
,168
3
3 5
67
216
9
5 8
9 9
5 —
3
,989
Unit
Paya
ble
a/c
#
—
—
—
—
—
—
—
—
—
—
—
—
—
—
—
Tota
l 1
50,4
53
291
4
65,7
80
4
20
8
436
,879
3
3 4
98,4
47
150
,625
9
5 8
,710
3
2,14
0 —
1
,743
,485
(R
s. ‘0
00)
Part
icul
ars
Link
ed H
ealth
Fun
ds
Heal
th
Save
r Ba
lanc
er
Heal
th
Save
r Pr
otec
tor
Heal
th
Save
r Fle
xi
Bala
nced
Heal
th
Save
r Fle
xi
Gro
wth
Heal
th
Save
r Pr
eser
ver
Heal
th
Save
r M
ultip
lier
Heal
th
Save
r Ret
urn
Gua
rant
ee
Heal
th
Save
r Ret
urn
Gua
rant
ee II
Heal
th
Save
r Ret
urn
Gua
rant
ee II
I
Heal
th
Retu
rn
Gua
rant
ee IV
Tota
l
Paya
ble
for P
urch
ase
of In
vest
men
ts
71
—
87
6,9
73
—
1,3
54
—
—
1,1
39
—
9,6
24
Oth
er C
urre
nt L
iabi
litie
s —
—
—
3
—
—
3
3
3
—
1
2
Unit
Paya
ble
a/c
#
—
—
—
—
—
—
—
—
—
—
—
Tota
l 7
1 —
8
7 6
,976
—
1
,354
3
3
1
,142
—
9
,636
(R
s. ‘0
00)
Part
icul
ars
Link
ed G
roup
Fun
ds
Bala
nced
Inco
me
Shor
t-Te
rm
Debt
Capi
tal
Gua
rant
ee
Shor
t De
bt
Capi
tal
Gua
rant
ee
Bala
nced
Fu
nd
Capi
tal
Gua
rant
ee
Debt
Fu
nd
Gro
wth
Capi
tal
Gua
rant
ee
Gro
wth
Leav
e En
cash
men
t Ba
lanc
ed
Fund
Leav
e En
cash
men
t De
bt F
und
Leav
e En
cash
men
t Sh
ort T
erm
De
bt F
und
Gro
up
Retu
rn
Gua
rant
ee
Gro
up
Retu
rn
Gua
rant
ee II
Tota
lG
rand
Tot
al
Paya
ble
for P
urch
ase
of In
vest
men
ts
—
—
—
—
—
—
—
—
—
—
—
—
—
—
4,7
51,4
32
Oth
er C
urre
nt L
iabi
litie
s 2
26
121
1
78
125
3
5 9
1 8
8 4
1
1 —
1
1
22
—
1,0
02
14,
847
Unit
Paya
ble
a/c
#
—
—
—
—
—
—
—
—
—
—
—
—
—
—
—
Tota
l 2
26
121
1
78
125
3
5 9
1 8
8 4
1
1 —
1
1
22
—
1,0
02
4,7
66,2
79
#
Repr
esen
ts in
ter f
und
rece
ivab
les
or p
ayab
les,
if a
ny
ICICI PRU AR09_Final Pg29-197 (Ac).indd Sec1:103ICICI PRU AR09_Final Pg29-197 (Ac).indd Sec1:103 10/28/09 6:00:15 PM10/28/09 6:00:15 PM

I 104 I
FINANCIAL REPORT
FUN
D B
ALA
NC
E S
HE
ET
AS
AT
MA
RC
H 3
1, 2
008
Form
A-B
S(U
L)
(Rs.
‘000
)
Part
icul
ars
Sche
dule
Link
ed L
ife F
unds
Bala
ncer
Pr
otec
tor
Max
imis
er
Cash
Plu
s Se
cure
Pl
usPr
eser
ver
Inve
st
Shie
ld
Life
New
Inve
st
Shie
ldBa
lanc
ed
Flex
i G
row
th
Flex
iBa
lanc
edR.
I.C.H
. Fu
ndM
ultip
lier
Tota
l
SOU
RCES
OF
FUN
DS
Polic
yhol
ders
’ Fun
ds:
Polic
yhol
der c
ontri
butio
nF-
116
,395
,721
7,80
8,12
472
,538
,052
1,93
6,63
519
5,61
81,
092,
233
869,
645
920,
346
27,9
87,6
8490
2,58
11,
492,
801
5,99
4.62
813
8,13
4,06
8
Reve
nue
Acco
unt
7,35
3,79
21,
489,
577
24,7
22,7
66(5
,489
)12
,577
260,
349
64,2
9020
,207
(415
,549
)27
,081
33,8
96(7
60,7
59)
32,8
02,7
38
Tota
l23
,749
,513
9,29
7,70
197
,260
,818
1,93
1,14
620
8,19
51,
352,
582
933,
935
940,
553
27,5
72,1
3592
9,66
21,
526,
697
5,23
3,86
917
0,93
6,80
6
APPL
ICAT
ION
OF
FUN
DS
Inve
stm
ents
F-2
22,8
95,6
098,
900,
068
97,2
09,0
311,
808,
956
194,
757
1,34
0,56
492
5,45
398
2,19
027
,170
,517
916,
632
1,12
1,33
74,
947,
369
168,
412,
483
Curre
nt A
sset
sF-
31,
154,
757
494,
772
2,90
7,92
514
2,11
015
,584
26,3
2439
,823
38,0
261,
265,
605
60,5
5958
9,04
164
6,55
37,
381,
079
Less
: Cur
rent
Lia
bilit
ies
and
Prov
ision
sF-
430
0,85
397
,139
2,85
6,13
819
,920
2,14
614
,306
31,3
4179
,663
863,
986
47,5
2918
3,68
136
0,05
44,
856,
756
Net
cur
rent
ass
ets
853,
904
397,
633
51,7
871,
22,1
9013
,438
12,0
188,
482
(41,
637)
401,
619
13,0
3040
5,36
028
6,49
92,
524,
323
Tota
l23
,749
,513
9,29
7,70
197
,260
,818
1,93
1,14
620
8,19
51,
352,
582
933,
935
940,
553
27,5
72,1
3692
9,66
21,
526,
697
5,23
3,86
817
0,93
6.80
6
(a)
Net A
sset
as
per B
alan
ce S
heet
(T
otal
Ass
ets
less
Cur
rent
Lia
bilit
ies
and
Prov
ision
s) (R
s. ‘0
00)
23,7
49,5
139,
297,
701
97,2
60,8
181,
931,
146
208,
195
1,35
2,58
293
3,93
594
0,55
327
,572
,136
929,
662
1,52
6,69
75,
233,
868
170,
936,
806
(b)
Num
ber o
f Uni
ts o
utst
andi
ng (i
n ‘0
00)
1,01
0,78
564
4,52
02,
365,
395
153,
930
16,3
9810
5,10
162
,041
73,5
652,
216,
959
79,7
5814
4,40
462
0,63
17,
493,
487
(c)
NAV
per U
nit (
a)/(b
) (Rs
.)23
.50
14.4
341
.12
12.5
512
.70
12.8
715
.05
12.7
912
.44
11.6
610
.57
8.43
ICICI PRU AR09_Final Pg29-197 (Ac).indd Sec1:104ICICI PRU AR09_Final Pg29-197 (Ac).indd Sec1:104 10/28/09 6:00:15 PM10/28/09 6:00:15 PM

I 105 I
ANNUAL REPORT 2008-09ICICI PRUDENTIAL LIFE INSURANCE
FUN
D B
ALA
NC
E S
HE
ET
AS
AT
MA
RC
H 3
1, 2
008
(Co
ntd
.)
Form
A-B
S(U
L)
(Rs.
‘000
)
Part
icul
ars
Sche
dule
Link
ed P
ensi
on F
unds
Bala
ncer
Pr
otec
tor
Inco
me
Max
imis
e Fu
nd
Gro
wth
Secu
re P
lus
Pens
ion
Pres
erve
r In
vest
Shi
eld
Pens
ion
Flex
iG
row
thFl
exi
Bala
nced
Pens
ion
R.I.C
.H.
Fund
Pens
ion
Mul
tiplie
rTo
tal
SOU
RCES
OF
FUN
DS
Polic
yhol
ders
’ Fun
ds:
Polic
yhol
der c
ontri
butio
nF-
15,
871,
885
3,31
7,72
1 19
,266
,618
86,2
5713
8,99
016
6,44
418
,383
,855
505,
707
3,17
3,82
32,
644,
803
53,
556,
103
Reve
nue
Acco
unt
2,35
7,15
860
4,85
4 4,
631,
049
10,6
5518
,325
25,1
50(1
,174
,127
)15
,792
66,6
54(1
24,7
31)
6,43
0,77
9
Tota
l8,
229,
043
3,92
2.57
5 23
,897
,667
96
,912
157,
315
191,
594
17,2
09,7
2852
1,49
93,
240,
477
2,52
0,07
259
,986
,882
APPL
ICAT
ION
OF
FUN
DS
Inve
stm
ents
F-2
7,96
0,17
3 3,
693,
204
23,5
97,2
8590
,828
155
,583
19
1,34
417
,522
,923
493,
241
2,32
0,11
82,
295,
295
58,3
19,9
94
Curre
nt A
sset
sF-
342
4,43
1 26
9,82
5 1,
035,
064
7,08
53,
379
6,93
771
1,25
130
,566
1,19
8,69
533
5,39
44,
022,
627
Less
: Cur
rent
Lia
bilit
ies
and
Prov
ision
sF-
415
5,56
140
,454
73
4,68
21,
001
1,64
76,
687
1,02
4,44
62,
308
278,
336
110,
617
2,35
5,73
9
Net
cur
rent
ass
ets
268,
870
229,
371
300,
382
6,08
41,
732
250
(313
,195
)28
,258
920,
359
224,
777
1,66
6,88
8
Tota
l8,
229,
043
3,92
2,57
523
,897
,667
96,9
1215
7,31
519
1,59
417
,209
,728
521,
499
3,24
0,47
72,
520,
072
59,9
86,8
82
(a)
Net A
sset
as
per B
alan
ce S
heet
(T
otal
Ass
ets
less
Cur
rent
Lia
bilit
ies
and
Prov
ision
s) (R
s. ‘0
00)
8,22
9,04
33,
922,
575
23,8
97,6
6796
,912
157,
315
191,
594
17,2
09,7
2852
1,49
93,
240,
477
2,52
0,07
259
,986
,882
(b)
Num
ber o
f Uni
ts o
utst
andi
ng (i
n ‘0
00)
407,
170
284,
682
700,
108
7,79
212
,233
12,6
751,
374,
063
42,6
1030
9,21
227
1,13
63,
421,
682
(c)
NAV
per U
nit (
a)/(b
) (Rs
.)20
.21
13.7
8 3
4.13
12
.44
12.8
615
.12
12.5
212
.24
10.4
89.
29
ICICI PRU AR09_Final Pg29-197 (Ac).indd Sec1:105ICICI PRU AR09_Final Pg29-197 (Ac).indd Sec1:105 10/28/09 6:00:15 PM10/28/09 6:00:15 PM

I 106 I
FINANCIAL REPORT
FUN
D B
ALA
NC
E S
HE
ET
AS
AT
MA
RC
H 3
1, 2
008
(Co
ntd
.)
Form
A-B
S(U
L)
(Rs.
‘000
)
Part
icul
ars
Sche
dule
Link
ed G
roup
Fun
ds
Bala
nced
In
com
e Sh
ort-T
erm
De
btCa
pita
l G
uara
ntee
Sh
ort D
ebt
Capi
tal
Gua
rant
ee
Bala
nced
Fu
nd
Capi
tal
Gua
rant
ee
Debt
Fund
Gro
wth
Capi
tal
Gua
rant
ee
Gro
wth
Leav
e En
cash
men
t Ba
lanc
ed
Fund
Leav
e En
cash
men
t De
bt F
und
Leav
e En
cash
men
t Sh
ort T
erm
De
bt F
und
Tota
l G
rand
Tot
al
SOU
RCES
OF
FUN
DS
Polic
yhol
ders
’ Fun
ds:
Polic
yhol
der c
ontri
butio
nF-
14,
651,
569
1,46
4,98
85,
498,
722
1,00
6,17
621
3,03
73,
701
2,51
2,56
611
,577
249,
982
20,0
0125
,182
15,6
57,5
0120
7,34
7,67
2
Reve
nue
Acco
unt
1,15
3,66
693
,488
343,
776
49,6
2744
,282
419
392,
569
2,51
8—
——
2,08
0,34
541
,313
,862
Tota
l5,
805,
235
1,55
8,47
65,
842,
498
1,05
5,80
325
7,31
94,
120
2,90
5,13
514
,095
249,
982
20,0
0125
,182
17,7
37,8
4624
8,66
1,53
4
APPL
ICAT
ION
OF
FUN
DS
Inve
stm
ents
F-2
5,27
7,39
51,
453,
614
4,97
2,36
986
1,52
524
0,95
93,
823
2,83
4,83
113
,919
249,
982
20,0
0125
,182
15,9
53,6
0024
2,68
6,07
7
Curre
nt A
sset
sF-
358
0,24
412
1,32
487
0,29
719
4,30
918
,465
339
127,
265
670
249,
982
20,0
0125
,182
2,20
8,07
813
,611
,784
Less
: Cur
rent
Lia
bilit
ies
and
Prov
ision
sF-
452
,404
16,4
6216
831
2,10
542
56,9
6149
424
9,98
220
,001
25,1
8242
3,83
27,
636,
327
Net
cur
rent
ass
ets
527,
840
104,
862
870,
129
194,
278
16,3
6029
770
,304
176
——
—1,
784,
246
5,97
5,45
7
Tota
l5,
805,
235
1,55
8,47
65,
842,
498
1,05
5,80
325
7,31
94,
120
2,90
5,13
514
,095
249,
982
20,0
0125
,182
17,7
37,8
4624
8,66
1,53
4
(a)
Net A
sset
as
per B
alan
ce S
heet
(T
otal
Ass
ets
less
Cur
rent
Lia
bilit
ies
and
Prov
ision
s) (R
s. ‘0
00)
5,80
5,23
51,
558,
476
5,84
2,49
81,
055,
803
257,
319
4,12
02,
905,
135
14,0
9524
9,98
220
,001
25,1
8217
,737
,846
248,
661,
534
(b)
Num
ber o
f Uni
ts o
utst
andi
ng (i
n ‘0
00)
329,
804
115,
396
434,
339
90,4
8120
,542
359
121,
784
1,21
524
,998
2,00
02,
518
1,14
3,43
712
,058
,606
(c)
NAV
per U
nit (
a)/(b
) (Rs
.)17
.60
13.5
113
.45
11.6
712
.53
11.4
723
.85
11.6
010
.00
10.0
010
.00
ICICI PRU AR09_Final Pg29-197 (Ac).indd Sec1:106ICICI PRU AR09_Final Pg29-197 (Ac).indd Sec1:106 10/28/09 6:00:15 PM10/28/09 6:00:15 PM

I 107 I
ANNUAL REPORT 2008-09ICICI PRUDENTIAL LIFE INSURANCE
Sch
edul
e: F
-1P
OLI
CY
HO
LDE
RS
’ CO
NT
RIB
UT
ION
AS
AT
MA
RC
H 3
1, 2
008
(Rs.
‘000
)
Part
icul
ars
Link
ed L
ife F
unds
Bala
ncer
Pr
otec
tor
Max
imis
er
Cash
Plu
s Se
cure
Plu
s Pr
eser
ver
Inve
st S
hiel
d Li
fe
New
Inve
st
Shie
ld
Bala
nced
Flex
i Gro
wth
Fl
exi B
alan
ced
R.I.C
.H.
Fund
M
ultip
lier
Tota
l
Ope
ning
bal
ance
18
,018
,615
6,
885,
489
52,6
80,1
1685
5,52
013
7,05
9 1,
138,
820
543,
197
375,
760
2,75
1,42
814
0,54
9 —
—
83,5
26,5
53
Add:
Add
ition
s du
ring
the
year
*7,
136,
876
3,14
7,35
929
,904
,947
1,08
6,82
562
,149
440,
080
329,
823
545,
429
25,
666,
431
792,
516
1,4
92,9
03
5,9
94,6
28
76,5
99,9
66
Less
: Ded
uctio
ns d
urin
g th
e ye
ar*
8,75
9,77
02,
224,
724
10,0
47,0
115,
710
3,5
90
486,
667
3,37
5 8
43
430,
175
30,4
84 1
02
—
21,9
92,4
51
Clos
ing
bala
nce
16,3
95,7
217,
808,
124
72,5
38,0
521,
936,
635
195,
618
1,09
2,23
386
9,64
592
0,35
627
,987
,684
902,
581
1,49
2,80
15,
994,
628
138,
134,
068
(R
s. ‘0
00)
Part
icul
ars
Link
ed P
ensi
on F
unds
Bala
ncer
Pr
otec
tor I
ncom
eM
axim
iser
Fun
d G
row
thSe
cure
Plu
s Pe
nsio
n Pr
eser
ver
Inve
st S
hiel
d Pe
nsio
n Fl
exi G
row
th
Flex
i Bal
ance
d Pe
nsio
n R.
I.C.H
. Fu
ndPe
nsio
n M
ultip
lier
Tota
l
Ope
ning
bal
ance
5
,536
,341
2,
907,
104
10,8
56,5
4169
,812
76,9
1510
8,61
41,
203,
846
51,5
89
—
—
20,8
10,7
62
Add:
Add
ition
s du
ring
the
year
*2,
354,
005
1,31
7,97
09,
718,
863
20,2
9812
0,43
559
,625
17,2
60,5
4949
3,31
3 3
,174
,298
2,
644,
803
37,1
64,1
59
Less
: Ded
uctio
ns d
urin
g th
e ye
ar**
2,01
8,46
190
7,35
31,
308,
786
3,8
53
58,3
601,
795
80,5
40 3
9,19
5 4
75
—
4,41
8,81
8
Clos
ing
bala
nce
5,87
1,88
53,
317,
721
19,2
66,6
1886
,257
138,
990
166,
444
18,3
83,8
5550
5,70
73,
173,
823
2,64
4,80
353
,556
,103
(R
s. ‘0
00)
Part
icul
ars
Link
ed G
roup
Fun
ds
Gra
nd T
otal
Bala
nced
In
com
eSh
ort-T
erm
De
bt
Capi
tal
Gua
rant
ee
Shor
t Deb
t
Capi
tal
Gua
rant
ee
Bala
nced
Fun
d
Capi
tal
Gua
rant
ee
Debt
Fu
nd
Gro
wth
Ca
pita
l G
uara
ntee
G
row
th
Leav
e En
cash
men
t Ba
lanc
ed F
und
Leav
e En
cash
men
t De
bt F
und
Leav
e En
cash
men
t Sh
ort T
erm
De
bt F
und
Tota
l
Ope
ning
bal
ance
3,
935,
925
408
,953
1,94
4,78
335
9,50
920
2,04
8 2
,566
1,
193,
325
13,8
89
—
—
—
8,0
60,9
98
112,
398,
313
Add:
Add
ition
s du
ring
the
year
* 2
,754
,323
1
,875
,729
6,
517,
310
721,
605
46,1
811,
706
1,91
1,54
75,
046
249,
982
20,0
0125
,182
14,
128,
612
127,
892,
736
Less
: Ded
uctio
ns d
urin
g th
e ye
ar**
2,03
8,67
9 8
19,6
94
2,96
3,37
174
,938
35,1
9257
159
2,30
67,
358
——
—6,
532,
109
32,9
43,3
78
Clos
ing
bala
nce
4,65
1,56
9 1,
464,
988
5,49
8,72
21,
006,
176
213,
037
3,70
12,
512,
566
11,5
7724
9,98
220
,001
25,1
8215
,657
,501
207,
347,
671
* Re
pres
ents
uni
ts c
reat
ion.
** R
epre
sent
s un
its c
ance
llatio
ns.
ICICI PRU AR09_Final Pg29-197 (Ac).indd Sec1:107ICICI PRU AR09_Final Pg29-197 (Ac).indd Sec1:107 10/28/09 6:00:15 PM10/28/09 6:00:15 PM

I 108 I
FINANCIAL REPORT
Sch
edul
e: F
-2IN
VE
ST
ME
NT
S A
S A
T M
AR
CH
31,
200
8
(R
s. ‘0
00)
Part
icul
ars
Link
ed L
ife F
unds
Bala
ncer
Prot
ecto
rM
axim
iser
Cash
Plus
Secu
rePl
usPr
eser
ver
Inve
stSh
ield
Life
New
Inve
stSh
ield
Bala
nced
Flex
iG
row
thFl
exi
Bala
nced
R.I.C
.H.
Fund
Mul
tiplie
rTo
tal
Appr
oved
Inve
stm
ents
Gove
rnm
ent B
onds
1,69
4,82
41,
023,
039
—19
2,09
418
,681
—51
,498
42,3
74—
38,6
82—
—3,
061,
192
Corp
orat
e Bo
nds
3,76
3,46
72,
303,
401
37,3
3139
8,17
253
,398
31,9
2518
4,39
615
4,48
924
,618
99,4
45—
—7,
050,
642
Infra
stru
ctur
e Bo
nds
4,04
0,73
02,
538,
884
6745
6,49
047
,265
5,16
316
2,55
911
0,75
613
,004
103,
831
——
7,47
8,74
9
Equi
ty *
7,37
1,63
5—
82,7
69,2
35—
813
—19
5,39
827
8,47
219
,793
,379
352,
111
705,
740
4,09
2,07
511
5,55
8,85
8
Mon
ey M
arke
t3,
402,
572
2,20
5,74
942
,256
636,
140
60,6
751,
202,
677
197,
115
231,
947
1,67
2,03
613
5,05
221
2,56
3—
9,99
8,78
2
Mut
ual F
unds
——
——
——
——
——
——
—
Tota
l 20
,273
,228
8,07
1,07
382
,848
,889
1,68
2,89
618
0,83
21,
239,
765
790,
966
818,
038
21,5
03,0
3772
9,12
191
8,30
34,
092,
075
143,
148,
223
Oth
er In
vest
men
ts—
Corp
orat
e Bo
nds
786,
363
477,
449
—63
,192
6,84
510
0,75
122
,627
30,3
9715
,566
10,2
68—
—1,
513,
458
Infra
stru
ctur
e Bo
nds
——
——
——
——
——
——
—
Equi
ty1,
153,
650
—11
,903
,392
——
—66
,734
87,1
055,
357,
518
133,
137
202,
476
787,
590
19,6
91,6
02
Mon
ey M
arke
t—
——
——
——
——
——
——
Mut
ual F
unds
682,
368
351,
546
2,45
6,75
062
,868
7,08
048
45,1
2646
,650
294,
396
44,1
0655
867
,704
4,05
9,20
0
Tota
l2,
622,
381
828,
995
14,3
60,1
4212
6,06
013
,925
100,
799
134,
487
164,
152
5,66
7,48
018
7,51
120
3,03
485
5,29
425
,264
,260
Gra
nd T
otal
22,8
95,6
098,
900,
068
97,2
09,0
311,
808,
956
194,
757
1,34
0,56
492
5,45
398
2,19
027
,170
,517
916,
632
1,12
1,33
74,
947,
369
168,
412,
483
% o
f App
rove
d In
vest
men
ts to
Tot
al89
%91
%85
%93
%93
%92
%85
%83
%79
%80
%82
%83
%
% o
f Oth
er In
vest
men
ts to
Tot
al11
%9%
15%
7%7%
8%15
%17
%21
%20
%18
%17
%
* In
clud
es in
vest
men
ts in
pre
fere
nce
shar
es a
mou
ntin
g to
Rs.
112
,119
(tho
usan
d).
ICICI PRU AR09_Final Pg29-197 (Ac).indd Sec1:108ICICI PRU AR09_Final Pg29-197 (Ac).indd Sec1:108 10/28/09 6:00:16 PM10/28/09 6:00:16 PM

I 109 I
ANNUAL REPORT 2008-09ICICI PRUDENTIAL LIFE INSURANCE
Sch
edul
e: F
-2IN
VE
ST
ME
NT
S A
S A
T M
AR
CH
31,
200
8 (C
ont
d.)
(R
s. ‘0
00)
Part
icul
ars
Link
ed P
ensi
on F
unds
Bala
ncer
Prot
ecto
rIn
com
eM
axim
iser
Fund
Gro
wth
Secu
rePl
usPe
nsio
n
Pres
erve
rIn
vest
Shie
ldPe
nsio
n
Flex
iG
row
thFl
exi
Bala
nced
Pens
ion
R.I.C
.H.
Fund
Pens
ion
Mul
tiplie
rTo
tal
Appr
oved
Inve
stm
ents
Gove
rnm
ent B
onds
594
,007
4
24,4
46
—
9,1
66
—
9,8
09
—
20,
586
—
—
1,0
58,0
14
Corp
orat
e Bo
nds
1,1
77,7
36
836
,969
—
2
3,97
0 1
3,10
8 3
6,48
1 2
8,53
0 4
1,43
7 —
—
2
,158
,231
Infra
stru
ctur
e Bo
nds
1,3
56,4
86
907
,024
—
2
0,10
2 5
41
27,
177
—
47,
008
—
—
2,3
58,3
38
Equi
ty *
2,4
71,4
42
—
19,
953,
061
—
—
41,
287
12,
422,
560
181
,236
1
,515
,121
1
,863
,407
3
8,44
8,11
4
Mon
ey M
arke
t 1
,262
,625
1
,151
,297
—
3
1,25
1 1
25,0
51
51,
897
1,0
87,3
72
94,
615
404
,188
1
9,73
8 4
,228
,034
Mut
ual F
unds
—
—
—
—
—
—
—
—
—
—
—
Tota
l 6
,862
,296
3
,319
,736
1
9,95
3,06
1 8
4,48
9 1
38,7
00
166
,651
1
3,53
8,46
2 3
84,8
82
1,9
19,3
09
1,8
83,1
45
48,
250,
731
Oth
er In
vest
men
ts
Corp
orat
e Bo
nds
269
,511
2
07,9
70
—
3,1
23
13,
499
4,0
32
—
6,8
68
—
—
505
,003
Infra
stru
ctur
e Bo
nds
—
—
—
—
—
—
—
—
—
—
—
Equi
ty 3
87,4
80
—
3,2
43,5
62
—
—
12,
555
3,9
43,6
49
84,
505
399
,885
3
54,8
68
8,4
26,5
04
Mon
ey M
arke
t —
—
—
—
—
—
—
—
—
—
—
Mut
ual F
unds
440
,886
1
65,4
98
400
,662
3
,216
3
,384
8
,106
4
0,81
2 1
6,98
6 9
24
57,
282
1,1
37,7
56
Tota
l 1
,097
,877
3
73,4
68
3,6
44,2
24
6,3
39
16,
883
24,
693
3,9
84,4
61
108
,359
4
00,8
09
412
,150
1
0,06
9,26
3
Gra
nd T
otal
7,9
60,1
73
3,6
93,2
04
23,
597,
285
90,
828
155
,583
1
91,3
44
17,
522,
923
493
,241
2
,320
,118
2
,295
,295
5
8,31
9,99
4
% o
f App
rove
d In
vest
men
ts to
Tot
al86
%90
%85
%93
%89
%87
%77
%78
%83
%82
%
% o
f Oth
er In
vest
men
ts to
Tot
al14
%10
%15
%7%
11%
13%
23%
22%
17%
18%
* In
clud
es in
vest
men
ts in
pre
fere
nce
shar
es t
o R
s. 1
12,1
19 (t
hous
and)
.
ICICI PRU AR09_Final Pg29-197 (Ac).indd Sec1:109ICICI PRU AR09_Final Pg29-197 (Ac).indd Sec1:109 10/28/09 6:00:16 PM10/28/09 6:00:16 PM

I 110 I
FINANCIAL REPORT
Sch
edul
e: F
-2IN
VE
ST
ME
NT
S A
S A
T M
AR
CH
31,
200
8 (C
ont
d.)
(R
s. ‘0
00)
Part
icul
ars
Link
ed G
roup
Fun
ds
Bala
nced
In
com
e Sh
ort T
erm
De
bt
Capi
tal
Gua
rant
ee
Shor
t Deb
t
Capi
tal
Gua
rant
ee
Bala
nced
Fun
d
Capi
tal
Gua
rant
ee
Debt
Fun
d
Gro
wth
Capi
tal
Gua
rant
ee
Gro
wth
Leav
e En
cash
men
t Ba
lanc
ed F
und
Leav
e En
cash
men
t De
bt F
und
Leav
e En
cash
men
t Sh
ort-T
erm
De
bt F
und
Tota
lG
rand
Tot
al
Appr
oved
Inve
stm
ents
Gove
rnm
ent B
onds
504,
358
179,
550
—
—19
,478
287
13
7,46
155
5—
——
841,
689
4,96
0,89
5
Corp
orat
e Bo
nds
1,08
4,05
527
4,68
41,
072,
272
224,
052
81,3
041,
153
297,
092
3,29
2—
——
3,03
7,90
412
,246
,777
Infra
stru
ctur
e Bo
nds
1,10
0,31
341
9,51
51,
140,
186
233,
839
41,6
211,
035
373,
870
1,91
1 —
—
—
3,
312,
290
13,1
49,3
77
Equi
ty*
787,
572
— —
—
41,5
49—
1,27
3,38
34,
512
——
—2,
107,
016
156,
113,
988
Mon
ey M
arke
t1,
297,
471
495,
975
2,08
4,09
931
2,00
939
,595
1,04
332
9,63
91,
676
249,
982
20,0
0125
,182
4,85
6,67
219
,083
,488
Mut
ual F
unds
——
——
——
——
——
——
—
Tota
l 4,
773,
769
1,36
9,72
44,
296,
557
769,
900
223,
547
3,51
82,
411,
445
11,9
4624
9,98
220
,001
25,1
8214
,155
,571
205,
554,
525
Oth
er In
vest
men
ts
Corp
orat
e Bo
nds
177,
777
42,6
2227
1,14
221
,833
4,52
011
925
,707
276
——
—54
3,99
62,
562,
457
Infra
stru
ctur
e Bo
nds
——
——
——
——
——
——
—
Equi
ty12
6,54
7—
—
— 6
,736
—
241,
631
959
——
—37
5,87
328
,493
,979
Mon
ey M
arke
t—
——
——
——
——
——
——
Mut
ual F
unds
199,
302
41,2
6840
4,67
069
,792
6,15
618
615
6,04
873
8—
——
878,
160
6,07
5,11
6
Tota
l50
3,62
683
,890
675,
812
91,6
2517
,412
305
423,
386
1,97
3—
——
1,79
8,02
937
,131
,552
Gra
nd T
otal
5,27
7,39
51,
453,
614
4,97
2,36
986
1,52
524
0,95
93,
823
2,83
4,83
113
,919
249,
982
20,0
0125
,182
15,9
53,6
0024
2,68
6,07
7
% o
f App
rove
d In
vest
men
ts to
Tot
al90
%94
%86
%89
%93
%92
%85
%86
%10
0%10
0%10
0%
% o
f Oth
er In
vest
men
ts to
Tot
al10
%6%
14%
11%
7%8%
15%
14%
0%0%
0%
* In
clud
es in
vest
men
ts in
pre
fere
nce
shar
es a
mou
ntin
g to
Rs
112,
119
(thou
sand
).
ICICI PRU AR09_Final Pg29-197 (Ac).indd Sec1:110ICICI PRU AR09_Final Pg29-197 (Ac).indd Sec1:110 10/28/09 6:00:16 PM10/28/09 6:00:16 PM

I 111 I
ANNUAL REPORT 2008-09ICICI PRUDENTIAL LIFE INSURANCE
Sch
edul
e: F
-3C
UR
RE
NT
AS
SE
TS
AS
AT
MA
RC
H 3
1, 2
008
(Rs.
‘000
)
Part
icul
ars
Link
ed L
ife F
unds
Bala
ncer
Pr
otec
tor
Max
imis
erCa
sh P
lus
Secu
re P
lus
Pres
erve
rIn
vest
Shie
ldLi
fe
New
Inve
st
Shie
ldBa
lanc
ed
Flex
iG
row
thFl
exi
Bala
nced
R.I.C
.H.
Fund
Mul
tiplie
rTo
tal
Accr
ued
Inte
rest
400,
878
257,
067
1,84
047
,535
5,04
534
,562
16,7
9013
,251
3,6
10
12,
340
49
—79
2,96
7Ca
sh &
Ban
k Ba
lanc
e2
7
3,5
29
8
10
11
8 8
1
1 8
1
1 11
3,62
4
Divid
end
Rece
ivabl
e1,
397
—10
,271
——
—19
40 3
,367
88
—
1,
308
16,4
90
Rece
ivabl
e fo
r Sal
e of
Inve
stm
ents
481,
304
169,
174
1,71
1,57
959
,006
6,
433
—
15,9
6111
,267
48
4,17
29,
440
11,7
7139
7,15
83,
357,
265
Unit
Colle
ctio
n A/
c21
2,94
725
,089
916,
479
27,8
462,
791
(8,1
81)
6,24
712
,410
715,
222
37,1
9457
4,59
923
4,36
52,
757,
008
Oth
er C
urre
nt A
sset
s (fo
r Inv
estm
ents
)84
,855
42,9
717
7,62
01,
184
—1
2 —
1
—
—13
6,64
1Ap
prop
riatio
n/Ex
prop
riatio
n (A
sset
)(2
6,62
6)46
426
4,22
095
121
(68)
797
1,04
859
,223
1,48
82,
611
13,7
1131
7,08
4
Tota
l1,
154,
757
494,
772
2,90
7,92
514
2,11
015
,584
26,3
2439
,823
38,0
261,
265,
605
60,5
5958
9,04
164
6,55
37,
381,
079
(Rs.
‘000
)
Part
icul
ars
Link
ed P
ensi
on F
unds
Bala
ncer
Pr
otec
tor
Inco
me
Max
imis
erFu
nd G
row
thSe
cure
Plu
sPe
nsio
nPr
eser
ver
Inve
st S
hiel
dPe
nsio
nFl
exi
Gro
wth
Flex
iBa
lanc
edPe
nsio
n R.
I.C.H
.Fu
ndPe
nsio
n M
ultip
lier
Tota
l
Accr
ued
Inte
rest
127,
036
88,7
01
372,
179
3,20
73,
154
2,0
23
5,1
83
93
523
1,61
8Ca
sh &
Ban
k Ba
lanc
e9
6
8
12
11
10 1
2 1
2 1
1 8
99
Div
iden
d Re
ceiv
able
261
—2,
840
——
6 3
,204
13
0 —
47
06,
911
Rece
ivab
le fo
r Sal
e of
Inve
stm
ents
176,
064
90,0
9979
2,99
32,
995
—
2,73
023
1,31
86,
593
25,3
0713
4,19
51,
462,
294
Uni
t Col
lect
ion
A/c.
77,9
7966
,773
174,
124
1,31
916
987
343
7,71
017
,570
1,16
7,59
919
4,33
82,
138,
454
Oth
er C
urre
nt A
sset
s (fo
r Inv
estm
ents
)33
,882
24,4
391
524
——
—
238
—
—59
,084
Appr
opria
tion/
Expr
opria
tion
(Ass
et)
9,20
0(1
93)
65,0
6156
(8)
164
36,9
8484
05,
685
6,37
812
4,16
7
Tota
l42
4,43
126
9,82
5 1,
035,
064
7,08
53,
379
6,93
771
1,25
130
,566
1,19
8,69
533
5,39
44,
022,
627
(Rs.
‘000
)
Part
icul
ars
Link
ed G
roup
Fun
ds
Bala
nced
In
com
e Sh
ort T
erm
Debt
Ca
pita
l G
uara
ntee
Sh
ort D
ebt
Capi
tal
Gua
rant
ee
Bala
nced
Capi
tal
Gua
rant
ee
Debt
Fun
d
Gro
wth
Capi
tal
Gua
rant
ee
Gro
wth
Leav
e En
cash
men
t Ba
lanc
ed
Fund
Leav
e En
cash
men
t De
bt F
und
Leav
e En
cash
men
t Sh
ort T
erm
De
bt F
und
Tota
lG
rand
Tot
al
Accr
ued
Inte
rest
113,
457
38,6
20
105,
979
18,7
586,
046
112
28,8
9124
3 —
—
—
31
2,10
61,
336,
691
Cash
& B
ank
Bala
nce
10 1
0 8
1
1 1
3 1
2 8
13
—
—
—
853,
808
Divid
end
Rece
ivabl
e66
——
—11
—97
1 —
—
—
17
523
,576
Rece
ivabl
e fo
r Sal
e of
Inve
stm
ents
138,
495
57,8
78—
—
7,50
6 70
37
,497
14
4 —
——
241,
590
5,06
1,14
9
Unit
Colle
ctio
n Ac
coun
t31
3,92
918
,575
700,
907
163,
568
4,45
613
050
,797
248
249,
982
20,0
0125
,182
1,54
7,77
56,
443,
237
Oth
er C
urre
nt A
sset
s (fo
r Inv
estm
ents
)17
,529
6,16
463
,146
11,9
2728
415
5,21
637
—
—
—
104,
318
300,
043
Appr
opria
tion/
Expr
opria
tion
(Ass
et)
(3,2
42)
7725
745
149
—4,
759
(16)
——
—2,
029
443,
280
Tota
l58
0,24
4 1
21,3
24
870,
297
194,
309
18,4
6533
912
7,26
567
024
9,98
220
,001
25,1
822,
208,
078
13,6
11,7
84
ICICI PRU AR09_Final Pg29-197 (Ac).indd Sec1:111ICICI PRU AR09_Final Pg29-197 (Ac).indd Sec1:111 10/28/09 6:00:16 PM10/28/09 6:00:16 PM

I 112 I
FINANCIAL REPORT
Sch
edul
e: F
- 4
CU
RR
EN
T L
IAB
ILIT
IES
AS
AT
MA
RC
H 3
1, 2
008
(Rs.
‘000
)
Part
icul
ars
Link
ed L
ife F
unds
Bala
ncer
Pr
otec
tor
Max
imis
er
Cash
Plu
sSe
cure
Plus
Pres
erve
rIn
vest
Shie
ldLi
fe
New
Inve
stSh
ield
Bala
nced
Flex
iG
row
thFl
exi
Bala
nced
R.I.C
.H.
Fund
Mul
tiplie
rTo
tal
Paya
ble
for P
urch
ase
of In
vest
men
ts29
9,60
396
,822
2,85
0,70
819
,857
2,13
914
,278
31,3
1179
,633
862,
519
47,4
8518
3,63
035
9,76
24,
847,
747
Oth
er C
urre
nt L
iabi
litie
s 1,
250
317
5,43
0 6
3 7
2
8 30
30
1,46
7 4
4 5
1 29
29,
009
Unit
Paya
ble
A/c#
——
—
——
——
——
——
——
Tota
l30
0,85
397
,139
2,85
6,13
819
,920
2,14
6 14
,306
31,3
4179
,663
863,
986
47,5
2918
3,68
136
0,05
44,
856,
756
(Rs.
‘000
)
Part
icul
ars
Link
ed P
ensi
on F
unds
Bala
ncer
Pr
otec
tor
Inco
me
Max
imis
erFu
nd G
row
th
Secu
rePl
us P
ensi
onPr
eser
ver
Inve
st S
hiel
dPe
nsio
nFl
exi G
row
thFl
exi
Bala
nced
Pens
ion
R.I.C
.H. F
und
Pens
ion
Mul
tiplie
rTo
tal
Paya
ble
for P
urch
ase
of In
vest
men
ts15
5,25
140
,322
733,
628
998
1,64
46,
681
1,02
3,68
52,
292
278,
225
110,
497
2,35
3,22
3
Oth
er C
urre
nt L
iabi
litie
s 31
013
21,
054
3
3
676
1 16
1
11
120
2,51
6
Unit
Paya
ble
A/c#
——
—
——
——
——
——
Tota
l15
5,56
140
,454
734,
682
1,00
1 1,
647
6,68
71,
024,
446
2,30
827
8,33
611
0,61
72,
355,
739
(Rs.
‘000
)
Part
icul
ars
Link
ed G
roup
Fun
ds
Bala
nced
In
com
e Sh
ort
Term
Deb
t Ca
pita
l G
uara
ntee
Sh
ort D
ebt
Capi
tal
Gua
rant
ee
Bala
nced
Fu
nd
Capi
tal
Gua
rant
ee
Debt
Fun
d
Gro
wth
Capi
tal
Gua
rant
ee
Gro
wth
Leav
e En
cash
men
t Ba
lanc
ed
Fund
Leav
e En
cash
men
t De
bt F
und
Leav
e En
cash
men
t Sh
ort T
erm
De
bt F
und
Tota
lG
rand
Tot
al
Paya
ble
for P
urch
ase
of In
vest
men
ts 5
2,21
5 16
,408
——
2,09
142
56,8
6549
324
9,98
220
,001
25,1
8242
3,27
97,
624,
249
Oth
er C
urre
nt L
iabi
litie
s 18
954
168
31
14
—
961
—
—
—
553
12,0
78
Unit
Paya
ble
A/c#
——
—
——
——
——
——
——
Tota
l52
,404
16,4
6216
831
2,1
05
4256
,961
494
249,
982
20,0
0125
,182
423,
832
7,63
6,32
7
# R
epre
sent
s in
ter
fund
rec
eiva
bles
or
paya
bles
, if
any.
ICICI PRU AR09_Final Pg29-197 (Ac).indd Sec1:112ICICI PRU AR09_Final Pg29-197 (Ac).indd Sec1:112 10/28/09 6:00:16 PM10/28/09 6:00:16 PM

I 113 I
ANNUAL REPORT 2008-09ICICI PRUDENTIAL LIFE INSURANCE
3.19
FU
ND
INC
OM
E &
EX
PE
ND
ITU
RE
AC
CO
UN
T F
OR
TH
E Y
EA
R E
ND
ED
MA
RC
H 3
1, 2
009
Form
A-R
A(U
L)
(Rs.
‘000
)
Part
icul
ars
Sche
dule
Link
ed L
ife F
unds
Bala
ncer
Prot
ecto
rM
axim
iser
Cash
Pl
usSe
cure
Pl
usPr
eser
ver
Inve
st
Shie
ld
Life
New
In
vest
Sh
ield
Ba
lanc
ed
Flex
i G
row
thFl
exi
Bala
nced
R.I.C
.H.
Fund
Mul
tiplie
rRe
turn
G
uara
ntee
Retu
rn
Gua
rant
ee II
Retu
rn
Gua
rant
ee
III
Retu
rn
Gua
rant
ee
IV
Tota
l
Inco
me
from
inve
stm
ents
Inte
rest
inco
me
1,29
4,73
997
8,98
648
4,92
422
8,50
720
,932
167,
246
68,6
9166
,235
199,
007
48,4
0528
,675
28,3
1012
,681
7,56
22,
255
—3,
637,
155
Divid
end
inco
me
91,6
00—
1,01
1,90
6—
9—
3,18
04,
861
385,
734
7,54
055
,865
69,9
72—
——
—1,
630,
667
Prof
it/lo
ss o
n sa
le o
f inv
estm
ent
360,
317
181,
766
(7,3
42,7
77)
44,9
003,
750
10,7
3512
0(3
3,76
2)(2
,911
,785
)(8
3,62
1)(3
76,3
25)
(624
,404
)27
203
122
—(1
0,77
0,73
4)
Prof
it/lo
ss o
n in
ter f
und
trans
fer/
sale
of i
nves
tmen
t24
,754
23,0
13(4
7,46
0)1,
220
(62)
2,22
5(1
8,69
0)(1
3,53
0)(2
33,7
44)
(31,
481)
(3,1
25)
(26,
396)
103
66—
—(3
23,1
07)
Unre
alise
d Ga
in/lo
ss*
(3,2
89,3
92)
110,
367
(27,
176,
220)
29,2
712,
314
11,7
44(7
2,28
3)(8
8,80
9)(8
,133
,158
)(1
01,3
51)
(1,2
47,9
77)
(988
,948
)6,
252
8,56
94,
764
—(4
0,92
4,85
7)
Appr
opria
tion/
Expr
opria
tion
(Inco
me/
Expe
nditu
re)
2,14
327
1(5
6,34
0)76
4021
117
657
310
,589
730
16,3
5010
,660
3336
32—
(14,
420)
Tota
l Inc
ome
(A)
(1,5
15,8
39)
1,29
4,40
3(3
3,12
5,96
7)30
3,97
426
,983
192,
161
(18,
806)
(64,
432)
(10,
683,
357)
(159
,778
)(1
,526
,537
)(1
,530
,806
)19
,096
16,4
367,
173
—(4
6,76
5,29
6)
Fund
man
agem
ent c
harg
es #
237,
852
54,3
1099
8,51
634
,009
3,09
314
,385
13,1
5814
,689
578,
958
21,2
1791
,077
127,
598
2,22
61,
353
420
—2,
192,
861
Fund
adm
inist
ratio
n ex
pens
es #
230,
996
96,7
9987
8,85
3—
——
——
——
——
——
——
1,20
6,64
8
Oth
er c
harg
esF–
523
3,09
118
4,34
11,
112,
387
184,
974
5,64
519
,144
41,1
3957
,520
1,17
1,91
435
,164
447,
502
282,
302
26,3
4423
,289
17,3
374,
851
3,84
6,94
4
Tota
l Exp
endi
ture
(B)
701,
939
335,
450
2,98
9,75
621
8,98
38,
738
33,5
2954
,297
72,2
091,
750,
872
56,3
8153
8,57
940
9,90
028
,570
24,6
4217
,757
4,85
17,
246,
453
Exce
ss o
f Inc
ome
over
Ex
pend
iture
/(Ex
pend
iture
ove
r In
com
e) (A
-B)
(2,2
17,7
78)
958,
953
(36,
115,
723)
84,9
9118
,245
158,
632
(73,
103)
(136
,641
)(1
2,43
4,22
9)(2
16,1
59)
(2,0
65,1
16)
(1,9
40,7
06)
(9,4
74)
(8,2
06)
(10,
584)
(4,8
51)
(54,
011,
749)
Bala
nce
at th
e be
ginn
ing
of th
e ye
ar7,
353,
792
1,48
9,57
724
,722
,766
(5,4
89)
12,5
7726
0,34
964
,290
20,2
07(4
15,5
49)
27,0
8133
,896
(760
,759
)—
——
—32
,802
,738
Bala
nce
at th
e en
d of
the
year
5,13
6,01
42,
448,
530
(11,
392,
957)
79,5
0230
,822
418,
981
(8,8
13)
(116
,434
)(1
2,84
9,77
8)(1
89,0
78)
(2,0
31,2
20)
(2,7
01,4
65)
(9,4
74)
(8,2
06)
(10,
584)
(4,8
51)
(21,
209,
011)
* N
et c
hang
e in
mar
k-to
-mar
ket v
alue
of i
nves
tmen
ts.
# G
ross
of s
ervic
e ta
x
ICICI PRU AR09_Final Pg29-197 (Ac).indd Sec1:113ICICI PRU AR09_Final Pg29-197 (Ac).indd Sec1:113 10/28/09 6:00:16 PM10/28/09 6:00:16 PM

I 114 I
FINANCIAL REPORT
3.19
FU
ND
INC
OM
E &
EX
PE
ND
ITU
RE
AC
CO
UN
T F
OR
TH
E Y
EA
R E
ND
ED
MA
RC
H 3
1, 2
009
Form
A-R
A(U
L)
(Rs.
‘000
)
Part
icul
ars
Sche
dule
Link
ed P
ensi
on F
unds
Bala
ncer
Prot
ecto
r In
com
eM
axim
iser
Fu
nd
Gro
wth
Secu
re P
lus
Pens
ion
Pres
erve
rIn
vest
Sh
ield
Pe
nsio
n
Flex
i G
row
thFl
exi
Bala
nced
Pens
ion
R.I.C
.H.
Fund
Pens
ion
Mul
tiplie
rPe
nsio
n Re
turn
G
uara
ntee
Pens
ion
Retu
rn
Gua
rant
ee II
Pens
ion
Retu
rn
Gua
rant
ee
III
Pens
ion
Retu
rn
Gua
rant
ee IV
Tota
l
Inco
me
from
inve
stm
ents
Inte
rest
inco
me
484,
477
496,
283
101,
003
9,33
431
,304
13,8
8910
3,53
731
,198
36,1
0911
,936
45,1
2123
,430
8,17
6—
1,39
5,79
7
Divid
end
inco
me
35,0
36—
257,
582
——
630
264,
465
4,36
910
1,69
433
,292
——
——
697,
068
Prof
it/lo
ss o
n sa
le o
f inv
estm
ent
(5,1
99)
110,
307
(2,2
18,6
09)
1,81
63,
730
1,40
4(2
,703
,795
)(5
0,63
7)(6
54,1
78)
(382
,001
)(6
50)
658
510
—(5
,896
,644
)
Prof
it/lo
ss o
n in
ter f
und
trans
fer/
sale
of i
nves
tmen
t(9
,475
)9,
272
(99)
(42)
438
(2,7
63)
(309
,686
)(1
1,56
1)(1
0,90
3)(2
2,44
5)31
662
6(8
)—
(356
,330
)
Unre
alise
d Ga
in/lo
ss*
(845
,432
)56
,287
(6,5
36,6
77)
1,06
93,
365
(17,
758)
(4,3
24,7
40)
(75,
652)
(2,2
14,4
73)
(597
,151
)24
,371
27,2
7015
,901
—(1
4,48
3,62
0)
Appr
opria
tion/
Expr
opria
tion
(Inco
me/
Expe
nditu
re)
1,19
362
3(6
,136
)16
5730
13,2
5771
124
,548
3,99
210
710
010
3—
38,6
01
Tota
l Inc
ome
(A)
(339
,400
)67
2,77
2(8
,402
,936
)12
,193
38,8
94(4
,568
)(6
,956
,962
)(1
01,5
72)
(2,7
17,2
03)
(952
,377
)69
,265
52,0
8424
,682
—(1
8,60
5,12
8)
Fund
man
agem
ent c
harg
es #
85,6
7726
,817
301,
740
1,38
12,
771
2,64
731
2,20
88,
659
150,
869
55,4
647,
896
4,18
21,
534
—96
1,84
5
Fund
adm
inist
ratio
n ex
pens
es #
38,9
3446
,758
53,9
67—
——
——
——
——
——
139,
659
Oth
er c
harg
es
F–
557
,862
87,4
8221
6,72
91,
032
5,27
83,
574
571,
121
13,5
8940
5,04
213
0,24
343
,123
31,6
6424
,740
7,03
11,
598,
510
Tota
l Exp
endi
ture
(B)
182,
473
161,
057
572,
436
2,41
38,
049
6,22
188
3,32
922
,248
555,
911
185,
707
51,0
1935
,846
26,2
747,
031
2,70
0,01
4
Exce
ss o
f Inc
ome
over
Ex
pend
iture
/(Ex
pend
iture
ove
r In
com
e) (A
–B)
(521
,873
)51
1,71
5(8
,975
,372
)9,
780
30,8
45(1
0,78
9)(7
,840
,291
)(1
23,8
20)
(3,2
73,1
14)
(1,1
38,0
84)
18,2
4616
,238
(1,5
92)
(7,0
31)
(21,
305,
142)
Bala
nce
at th
e be
ginn
ing
of th
e ye
ar2,
357,
158
604,
854
4,63
1,04
910
,655
18,3
2525
,150
(1,1
74,1
27)
15,7
9266
,654
(124
,731
)—
——
—6,
430,
779
Bala
nce
at th
e en
d of
the
year
1,83
5,28
51,
116,
569
(4,3
44,3
23)
20,4
3549
,170
14,3
61(9
,014
,418
)(1
08,0
28)
(3,2
06,4
60)
(1,2
62,8
15)
18,2
4616
,238
(1,5
92)
(7,0
31)
(14,
874,
363)
* Ne
t cha
nge
in m
ark-
to-m
arke
t val
ue o
f inv
estm
ents
#
Gros
s of
ser
vice
tax
ICICI PRU AR09_Final Pg29-197 (Ac).indd Sec1:114ICICI PRU AR09_Final Pg29-197 (Ac).indd Sec1:114 10/28/09 6:00:17 PM10/28/09 6:00:17 PM

I 115 I
ANNUAL REPORT 2008-09ICICI PRUDENTIAL LIFE INSURANCE
3.19
FU
ND
INC
OM
E &
EX
PE
ND
ITU
RE
AC
CO
UN
T F
OR
TH
E Y
EA
R E
ND
ED
MA
RC
H 3
1, 2
009
(Co
ntd
.)Fo
rm A
-RA
(UL)
(Rs.
‘000
)
Part
icul
ars
Sche
dule
Link
ed H
ealth
Fun
ds
Heal
th S
aver
Ba
lanc
erHe
alth
Sav
er
Prot
ecto
r He
alth
Sav
er
Flex
i Bal
ance
d He
alth
Sav
er
Flex
i Gro
wth
He
alth
Sav
er
Pres
erve
r He
alth
Sav
er
Mul
tiplie
r He
alth
Sav
er
Retu
rn
Gua
rant
ee
Heal
th S
aver
Re
turn
G
uara
ntee
II
Heal
th S
aver
Re
turn
G
uara
ntee
III
Heal
th R
etur
n G
uara
ntee
IVTo
tal
Inco
me
from
inve
stm
ents
Inte
rest
inco
me
16
127
1
2 1
9 7
3
8
81
640
2
17
—
1,9
22
Divid
end
inco
me
—
—
1
32
—
5
—
—
—
—
38
Prof
it/lo
ss o
n sa
le o
f inv
estm
ent
7
86
5
419
1
6
2 4
8 3
4 1
2 —
6
74
Prof
it/lo
ss o
n in
ter f
und
trans
fer/s
ale
of in
vest
men
t 1
(1
) —
3
9 —
—
1
—
—
—
4
0
Unre
alise
d Ga
in/lo
ss*
49
41
70
3,5
70
—
519
3
16
721
4
52
—
5,7
38
Appr
opria
tion/
Expr
opria
tion
(Inco
me/
Expe
nditu
re)
3
1
5
136
—
2
2 3
3
3
—
1
76
Tota
l Inc
ome
(A)
76
254
9
3 4
,215
8
6
11
1,2
49
1,3
98
684
—
8
,588
Fund
man
agem
ent c
harg
es #
3
13
3
94
1
16
156
1
14
41
—
441
Fund
adm
inist
ratio
n ex
pens
es #
—
—
—
—
—
—
—
—
—
—
—
Oth
er c
harg
esF–
5 4
61
2,5
94
391
9
,019
1
28
1,4
25
10,
752
9,2
82
5,6
58
1,5
50
41,
260
Tota
l Exp
endi
ture
(B)
464
2
,607
3
94
9,1
13
129
1
,441
1
0,90
8 9
,396
5
,699
1
,550
4
1,70
1
Exce
ss o
f Inc
ome
over
Exp
endi
ture
/(E
xpen
ditu
re o
ver I
ncom
e) (A
–B)
(388
) (2
,353
) (3
01)
(4,8
98)
(121
) (8
30)
(9,6
59)
(7,9
98)
(5,0
15)
(1,5
50)
(33,
113)
Bala
nce
at th
e be
ginn
ing
of th
e ye
ar —
—
—
—
—
—
—
—
—
—
—
Bala
nce
at th
e en
d of
the
year
(388
) (2
,353
) (3
01)
(4,8
98)
(121
) (8
30)
(9,6
59)
(7,9
98)
(5,0
15)
(1,5
50)
(33,
113)
*
Net c
hang
e in
mar
k-to
-mar
ket v
alue
of i
nves
tmen
ts#
Gr
oss
of s
ervic
e ta
x
ICICI PRU AR09_Final Pg29-197 (Ac).indd Sec1:115ICICI PRU AR09_Final Pg29-197 (Ac).indd Sec1:115 10/28/09 6:00:17 PM10/28/09 6:00:17 PM

I 116 I
FINANCIAL REPORT
3.19
FU
ND
INC
OM
E &
EX
PE
ND
ITU
RE
AC
CO
UN
T F
OR
TH
E Y
EA
R E
ND
ED
MA
RC
H 3
1, 2
009
(Co
ntd
.)Fo
rm A
-RA
(UL)
(Rs.
‘000
)
Part
icul
ars
Sche
dule
Link
ed G
roup
Fun
ds
Bala
nced
Inco
me
Shor
t-Te
rm
Debt
Capi
tal
Gua
rant
ee
Shor
t Deb
t
Capi
tal
Gua
rant
ee
Bala
nced
Fu
nd
Capi
tal
Gua
rant
ee
Debt
Fun
d
Gro
wth
Capi
tal
Gua
rant
ee
Gro
wth
Leav
e En
cash
men
t Ba
lanc
ed
Fund
Leav
e En
cash
men
t De
bt F
und
Leav
e En
cash
men
t Sh
ort T
erm
De
bt F
und
Gro
up
Retu
rn
Gua
rant
ee
Gro
up
Retu
rn
Gua
rant
ee II
Tota
lG
rand
Tot
al
Inco
me
from
inve
stm
ents
Inte
rest
inco
me
438
,714
1
90,8
40
423
,243
2
06,8
75
32,
219
94,
144
114
,636
2
,589
2
1,42
3 7
46
2,4
99
19,
205
—
1,5
47,1
33
6,5
82,0
07
Divid
end
inco
me
11,
595
—
—
—
702
—
1
9,58
3 1
81
522
—
—
—
—
3
2,58
3 2
,360
,356
Prof
it/lo
ss o
n sa
le o
f inv
estm
ent
(35,
422)
13,
138
25,
821
16,
060
5,2
89
20,
994
(193
,493
) (2
,183
) (1
,587
) 1
20
176
4
53
—
(150
,634
) (1
6,81
7,33
8)
Prof
it/lo
ss o
n in
ter f
und
trans
fer/s
ale
of in
vest
men
t 2
2,75
0 5
,767
(2
8,74
3) (1
49)
(123
) 1
,261
(4
,805
) 1
16
166
(1
95)
(4)
418
—
(3
,541
) (6
82,9
38)
Unre
alise
d Ga
in/lo
ss*
(245
,736
) 3
8,55
9 2
3,22
1 2
0,80
7 (1
8,52
4) 1
54,6
37
(3
71,0
07)
(4,1
15)
(7,2
83)
6
53
30,
002
—
(379
,380
) (5
5,78
2,11
9)
Appr
opria
tion/
Expr
opria
tion
(Inco
me/
Expe
nditu
re)
(187
) 9
2 (4
93)
101
2
31
100
(8
,573
) 8
5 1
77
—
1
116
—
(8
,350
) 1
6,00
7
Tota
l Inc
ome
(A)
191
,714
2
48,3
96
443
,049
2
43,6
94
19,
794
271
,136
(443
,659
) (3
,327
) 1
3,41
8 6
77
2,7
25
50,
194
—
1,0
37,8
11
(64,
324,
025)
Fund
man
agem
ent c
harg
es #
80,
495
29,
916
64,
346
34,
537
8,4
95
16,
570
36,
225
1,0
06
3,7
74
115
3
59
4,1
76
—
280
,014
3
,435
,161
Fund
adm
inist
ratio
n ex
pens
es #
—
—
—
—
—
—
—
—
—
—
—
—
—
—
1,3
46,3
07
Oth
er c
harg
esF–
5 —
—
—
—
—
—
—
—
—
—
—
—
—
—
5
,486
,714
Tota
l Exp
endi
ture
(B)
80,
495
29,
916
64,
346
34,
537
8,4
95
16,
570
36,
225
1,0
06
3,7
74
115
3
59
4,1
76
—
280
,014
1
0,26
8,18
2
Exce
ss o
f Inc
ome
over
Exp
endi
ture
/(Ex
pend
iture
ov
er In
com
e) (A
–B)
111
,219
2
18,4
80
378
,703
2
09,1
57
11,
299
254
,566
(479
,884
) (4
,333
) 9
,644
5
62
2,3
66
46,
018
—
757
,797
(7
4,59
2,20
7)
Bala
nce
at th
e be
ginn
ing
of th
e ye
ar
1,15
3,66
6 9
3,48
8 3
43,7
76
49,
627
44,
282
419
3
92,5
69
2,5
18
—
—
—
—
—
2,0
80,3
45
41,
313,
862
Bala
nce
at th
e en
d of
the
year
1,26
4,88
5 3
11,9
68
722
,479
2
58,7
84
55,
581
254
,985
(8
7,31
5) (1
,815
) 9
,644
5
62
2,3
66
46,
018
—
2,8
38,1
42
(33,
278,
345)
* Ne
t cha
nge
in m
ark-
to-m
arke
t val
ue o
f inv
estm
ents
#
Gros
s of
ser
vice
tax
ICICI PRU AR09_Final Pg29-197 (Ac).indd Sec1:116ICICI PRU AR09_Final Pg29-197 (Ac).indd Sec1:116 10/28/09 6:00:17 PM10/28/09 6:00:17 PM

I 117 I
ANNUAL REPORT 2008-09ICICI PRUDENTIAL LIFE INSURANCE
BR
EA
K U
P O
F O
TH
ER
EX
PE
NS
ES
UN
DE
R U
LIP
Sch
edul
e: F
- 5
OT
HE
R E
XP
EN
SE
S*
(R
s. ‘0
00)
Part
icul
ars
Link
ed L
ife F
unds
Bala
ncer
Prot
ecto
rM
axim
iser
Cash
Pl
usSe
cure
Pl
usPr
eser
ver
Inve
st
Shie
ld
Life
New
Inve
st
Shie
ld
Bala
nced
Flex
i G
row
thFl
exi
Bala
nced
R.I.C
.H.
Fund
Mul
tiplie
rRe
turn
G
uara
ntee
Retu
rn
Gua
rant
ee II
Retu
rn
Gua
rant
ee III
Retu
rn
Gua
rant
ee
IV
Tota
l
Polic
y Ad
min
istra
tion
char
ge20
,047
30,6
9414
0,59
166
,841
2,34
01,
248
18,0
7532
,842
311,
198
6,01
212
4,19
932
,173
2,84
42,
761
1,57
837
379
3,81
6
Surre
nder
cha
rge
——
——
——
——
——
——
——
——
—
Switc
hing
cha
rge
——
——
——
——
——
——
——
——
—
Mor
talit
y ch
arge
180,
679
135,
470
808,
265
117,
855
3,30
516
,376
20,5
5324
,678
709,
925
24,1
2925
4,23
322
0,97
122
,378
19,0
4614
,920
4,28
82,
577,
071
Ride
r Pre
miu
m c
harg
e32
,365
18,1
7716
3,53
127
8—
1,52
02,
511
—15
0,79
15,
023
69,0
7029
,158
1,12
21,
482
839
190
476,
057
Parti
al w
ithdr
awal
cha
rge
——
——
——
——
——
——
——
——
—
Misc
ella
neou
s ch
arge
——
——
——
——
——
——
——
——
—
Tota
l23
3,09
118
4,34
11,
112,
387
184,
974
5,64
519
,144
41,1
3957
,520
1,17
1,91
435
,164
447,
502
282,
302
26,3
4423
,289
17,3
374,
851
3,84
6,94
4
(R
s. ‘0
00)
Part
icul
ars
Link
ed P
ensi
on F
unds
Bala
ncer
Prot
ecto
r In
com
eM
axim
iser
Fu
nd
Gro
wth
Secu
re
Plus
Pe
nsio
n
Pres
erve
rIn
vest
Sh
ield
Pe
nsio
n
Flex
i G
row
thFl
exi
Bala
nced
Pens
ion
R.I.C
.H.
Fund
Pens
ion
Mul
tiplie
rPe
nsio
n Re
turn
G
uara
ntee
Pens
ion
Retu
rn
Gua
rant
ee II
Pens
ion
Retu
rn
Gua
rant
ee
III
Pens
ion
Retu
rn
Gua
rant
ee
IV
Tota
l
Polic
y Ad
min
istra
tion
char
ge36
,016
58,0
6615
0,42
555
92,
818
2,33
143
3,98
88,
703
311,
830
108,
390
21,1
398,
171
4,74
41,
422
1,14
8,60
2
Surre
nder
cha
rge
——
——
——
——
——
——
——
—
Switc
hing
cha
rge
——
——
——
——
——
——
——
—
Mor
talit
y ch
arge
20,0
4228
,198
60,5
0747
32,
416
1,09
913
1,60
64,
749
90,7
9721
,201
21,8
1123
,430
19,9
625,
600
431,
891
Ride
r Pre
miu
m c
harg
e1,
804
1,21
85,
797
—44
144
5,52
713
72,
415
652
173
6334
918
,017
Parti
al w
ithdr
awal
cha
rge
——
——
——
——
——
——
——
—
Misc
ella
neou
s ch
arge
——
——
——
——
——
——
——
—
Tota
l57
,862
87,4
8221
6,72
91,
032
5,27
83,
574
571,
121
13,5
8940
5,04
213
0,24
343
,123
31,6
6424
,740
7,03
11,
598,
510
* S
urre
nder
& s
witc
h ch
arge
s as
not
ava
ilabl
e at
fund
leve
l hav
e be
en s
how
n un
der S
ched
ule
(F-1
) Pol
icyh
olde
rs c
ontri
butio
n.
ICICI PRU AR09_Final Pg29-197 (Ac).indd Sec1:117ICICI PRU AR09_Final Pg29-197 (Ac).indd Sec1:117 10/28/09 6:00:17 PM10/28/09 6:00:17 PM

I 118 I
FINANCIAL REPORT
BR
EA
K U
P O
F O
TH
ER
EX
PE
NS
ES
UN
DE
R U
LIP
Sch
edul
e: F
- 5
OT
HE
R E
XP
EN
SE
S*
(Co
ntd
.)
(Rs.
‘000
)
Part
icul
ars
Link
ed H
ealth
Fun
ds
Heal
th S
aver
Ba
lanc
erHe
alth
Sav
er
Prot
ecto
r He
alth
Sav
er F
lexi
Ba
lanc
ed
Heal
th S
aver
Fle
xi
Gro
wth
He
alth
Sav
er
Pres
erve
r He
alth
Sav
er
Mul
tiplie
r He
alth
Sav
er
Retu
rn
Gua
rant
ee
Heal
th S
aver
Re
turn
G
uara
ntee
II
Heal
th S
aver
Re
turn
G
uara
ntee
III
Heal
th
Retu
rn
Gua
rant
ee IV
Tota
l
Polic
y Ad
min
istra
tion
char
ge 4
5 2
69
39
998
1
2 1
45
1,2
75
948
4
81
125
4
,337
Surre
nder
cha
rge
—
—
—
—
—
—
—
—
—
—
—
Switc
hing
cha
rge
—
—
—
—
—
—
—
—
—
—
—
Mor
talit
y ch
arge
416
2
,325
3
52
8,0
21
116
1
,280
9
,477
8
,334
5
,177
1
,425
3
6,92
3
Ride
r Pre
miu
m c
harg
e —
—
—
—
—
—
—
—
—
—
—
Parti
al w
ithdr
awal
cha
rge
—
—
—
—
—
—
—
—
—
—
—
Misc
ella
neou
s ch
arge
—
—
—
—
—
—
—
—
—
—
—
Tota
l 4
61
2,5
94
391
9
,019
1
28
1,4
25
10,
752
9,2
82
5,6
58
1,5
50
41,
260
(R
s. ‘0
00)
Part
icul
ars
Link
ed G
roup
Fun
ds
Bala
nced
Inco
me
Shor
t-Ter
m
Debt
Capi
tal
Gua
rant
ee
Shor
t Deb
t
Capi
tal
Gua
rant
ee
Bala
nced
Fu
nd
Capi
tal
Gua
rant
ee
Debt
Fun
d
Gro
wth
Capi
tal
Gua
rant
ee
Gro
wth
Leav
e En
cash
men
t Ba
lanc
ed
Fund
Leav
e En
cash
men
t De
bt F
und
Leav
e En
cash
men
t Sh
ort T
erm
De
bt F
und
Gro
up R
etur
n G
uara
ntee
Gro
up R
etur
n G
uara
ntee
IITo
tal
Gra
nd T
otal
Polic
y Ad
min
istra
tion
char
ge —
—
—
—
—
—
—
—
—
—
—
—
—
—
1
,946
,755
Surre
nder
cha
rge
—
—
—
—
—
—
—
—
—
—
—
—
—
—
—
Switc
hing
cha
rge
—
—
—
—
—
—
—
—
—
—
—
—
—
—
—
Mor
talit
y ch
arge
—
—
—
—
—
—
—
—
—
—
—
—
—
—
3,0
45,8
85
Ride
r Pre
miu
m c
harg
e —
—
—
—
—
—
—
—
—
—
—
—
—
—
4
94,0
74
Parti
al w
ithdr
awal
cha
rge
—
—
—
—
—
—
—
—
—
—
—
—
—
—
—
Misc
ella
neou
s ch
arge
—
—
—
—
—
—
—
—
—
—
—
—
—
—
—
Tota
l —
—
—
—
—
—
—
—
—
—
—
—
—
—
5,4
86,7
14
* S
urre
nder
& s
witc
h ch
arge
s as
not
ava
ilabl
e at
fund
leve
l hav
e be
en s
how
n un
der S
ched
ule
(F-1
) Pol
icyh
olde
rs c
ontri
butio
n.
ICICI PRU AR09_Final Pg29-197 (Ac).indd Sec1:118ICICI PRU AR09_Final Pg29-197 (Ac).indd Sec1:118 10/28/09 6:00:17 PM10/28/09 6:00:17 PM

I 119 I
ANNUAL REPORT 2008-09ICICI PRUDENTIAL LIFE INSURANCE
FUN
D IN
CO
ME
& E
XP
EN
DIT
UR
E A
CC
OU
NT
FO
R T
HE
YE
AR
EN
DE
D M
AR
CH
31,
200
8Fo
rm A
-RA
(UL)
(R
s. ‘0
00)
Part
icul
ars
Sche
dule
Link
ed L
ife F
unds
Bala
ncer
Pr
otec
tor
Max
imis
er
Cash
Pl
us
Secu
re P
lus
Pres
erve
r In
vest
Shi
eld
Life
N
ew In
vest
Sh
ield
Ba
lanc
ed
Flex
i Gro
wth
Fl
exi
Bala
nced
R.
I.C.H
. Fun
dM
ultip
lier
Tota
l
Inco
me
from
inve
stm
ents
Inte
rest
inco
me
1,1
86,9
61
750,
830
20,9
5499
,883
13,3
1080
,181
42,6
4128
,576
32,3
57 1
7,60
7 72
497
02,
274,
994
Divid
end
inco
me
65,4
14 —
54
6,39
1—
7
—
1,52
9 1
,804
1
06,9
30
3,2
08
—
7,6
11
732,
894
Prof
it/lo
ss o
n sa
le o
f inv
estm
ent
2,29
3,06
114
4,31
28,
852,
239
27,3
683,
466
54,5
7520
,102
19,5
9584
2,89
0 3
0,94
9 2
(1
03,6
81)
12,1
84,8
78
Prof
it/lo
ss o
n in
ter f
und
trans
fer/s
ale
of in
vest
men
t14
6,81
0 2
1,13
7 20
0,63
7 5
89
8
21,0
806,
462
8,9
57
109,
570
4,77
3—
—52
0,02
3
Unre
alise
d Ga
in/lo
ss*
570,
022
76,4
376,
931,
334
335
625
275
25,1
4920
,139
(688
,682
) (4
47)
37,5
60(6
16,5
17)
6,35
6,23
0
Appr
opria
tion/
Expr
opria
tion
(Inco
me/
Expe
nditu
re)
(69,
858)
840
60,5
16 (1
,556
) (1
55)
(5)
(318
)34
553
,219
1,3
20
2,6
11
13,7
1160
,670
Tota
l Inc
ome
(A)
4,19
2,41
099
3,55
616
,612
,071
126,
619
17,2
6115
6,10
695
,565
79,4
1645
6,28
4 5
7,41
0 40
,897
(697
,906
)22
,129
,689
Fund
man
agem
ent c
harg
es
244
,127
40
,267
981,
533
15,4
922,
038
11,6
589,
031
7,51
330
1,30
1 1
1,42
0 4
43
21,
330
1,64
6,15
3
Fund
adm
inist
ratio
n ex
pens
es22
5,59
379
,868
798,
486
——
——
——
——
—1,
103,
947
Oth
er c
harg
esF-
523
7,27
910
9,02
21,
026,
211
102,
618
5,74
011
,576
40,3
6646
,458
575,
046
18,
973
6,5
58
41,5
232,
221,
370
Tota
l Exp
endi
ture
(B)
706,
999
229,
157
2,80
6,23
011
8,11
07,
778
23,2
3449
,397
53,9
7187
6,34
7 3
0,39
3 7,
001
62,8
534,
971,
470
Exce
ss o
f Inc
ome
over
Exp
endi
ture
/(Ex
pend
iture
ov
er In
com
e) (A
-B)
3,48
5,41
176
4,39
913
,805
,841
8,50
99,
483
132,
872
46,1
6825
,445
(420
,063
) 2
7,01
7 33
,896
(760
,759
)17
,158
,219
Bala
nce
at th
e be
ginn
ing
of th
e ye
ar3,
868,
381
725,
178
10,9
16,9
25(1
3,99
8)3,
094
127,
477
18,1
22(5
,238
)4,
514
64—
—15
,644
,519
Bala
nce
at th
e en
d of
the
year
7,35
3,79
21,
489,
577
24,7
22,7
66(5
,489
)12
,577
260,
349
64,2
9020
,207
(415
,549
) 2
7,08
1 33
,896
(760
,759
)32
,802
,738
* Ne
t cha
nge
in m
ark-
to-m
arke
t val
ue o
f inv
estm
ents
.
ICICI PRU AR09_Final Pg29-197 (Ac).indd Sec1:119ICICI PRU AR09_Final Pg29-197 (Ac).indd Sec1:119 10/28/09 6:00:17 PM10/28/09 6:00:17 PM

I 120 I
FINANCIAL REPORT
FUN
D IN
CO
ME
& E
XP
EN
DIT
UR
E A
CC
OU
NT
FO
R T
HE
YE
AR
EN
DE
D M
AR
CH
31,
200
8 (C
ont
d.)
Form
A-R
A(U
L)
(Rs.
‘000
)
Part
icul
ars
Sche
dule
Link
ed P
ensi
on F
unds
Bala
ncer
Pr
otec
tor
Inco
me
Max
imis
er
Fund
Gro
wth
Secu
re P
lus
Pens
ion
Pres
erve
r In
vest
Shi
eld
Pens
ion
Flex
i Gro
wth
Fl
exi B
alan
ced
Pens
ion
R.I.C
.H.
Fund
Pens
ion
Mul
tiplie
rTo
tal
Inco
me
from
inve
stm
ents
Inte
rest
inco
me
370,
811
272,
639
4,76
46,
460
6,96
58,
870
21,0
53 8
,195
1,
590
1,11
470
2,46
1
Divid
end
inco
me
20,3
59—
12
4,59
6—
— 3
34
47,
438
1,3
26
—
470
194,
533
Prof
it/lo
ss o
n sa
le o
f inv
estm
ent
692,
665
49,3
821,
724,
261
1,6
43
3,47
94,
203
198
,956
1
5,10
2 7
(8
,042
) 2,
681,
656
Prof
it/lo
ss o
n in
ter f
und
trans
fer/
sale
of i
nves
tmen
t35
,491
7,29
871
,697
110
1
,563
1,
197
30,2
12(3
,154
) —
—14
4,41
4
Unre
alise
d Ga
in/lo
ss*
122,
534
26,3
3795
2,51
4 2
11
42
5,4
46
(1,2
19,6
44)
(296
) 70
,052
(108
,986
)(1
51,7
90)
Appr
opria
tion/
Expr
opria
tion
(Inco
me/
Expe
nditu
re)
(4,2
89)
(33)
23,2
12 (9
0)
(12)
(7
3) 3
4,27
3 7
67
5,6
85
6,37
865
,818
Tota
l Inc
ome
(A)
1,23
7,57
135
5,62
32,
901,
044
8,33
412
,037
19,9
87(8
87,7
12)
21,
940
77,3
34(1
09,0
66)
3,63
7,09
2
Fund
man
agem
ent e
xpen
ses
73,4
3912
,884
251,
703
976
8
73
1,9
00
113
,529
2
,764
9
51
3,1
29
462,
148
Fund
adm
inist
ratio
n ex
pens
es37
,261
31,3
3757
,263
——
——
——
—12
5,86
1
Oth
er c
harg
esF-
543
,212
15,4
1216
4,57
593
5 5
69
3,41
417
6,02
5 3
,640
9,
729
12,5
3643
0,04
7
Tota
l Exp
endi
ture
(B)
153,
912
59,6
3347
3,54
11,
911
1,4
42
5,31
428
9,55
4 6
,404
10
,680
15,6
651,
018,
056
Exce
ss o
f Inc
ome
over
Exp
endi
ture
/(Ex
pend
iture
ov
er In
com
e) (A
-B)
1,08
3,65
929
5,99
02,
427,
503
6,42
310
,595
14,6
73(1
,177
,266
) 1
5,53
6 66
,654
(124
,731
)2,
619,
036
Bala
nce
at th
e be
ginn
ing
of th
e ye
ar1,
273,
499
308,
864
2,20
3,54
64,
232
7,73
010
,477
3,13
925
6 —
—3,
811,
743
Bala
nce
at th
e en
d of
the
year
2,35
7,15
860
4,85
44,
631,
049
10,6
5518
,325
25,1
50(1
,174
,127
)15
,792
66,6
54(1
24,7
31)
6,43
0,77
9
* Ne
t cha
nge
in m
ark-
to-m
arke
t val
ue o
f inv
estm
ents
.
ICICI PRU AR09_Final Pg29-197 (Ac).indd Sec1:120ICICI PRU AR09_Final Pg29-197 (Ac).indd Sec1:120 10/28/09 6:00:18 PM10/28/09 6:00:18 PM

I 121 I
ANNUAL REPORT 2008-09ICICI PRUDENTIAL LIFE INSURANCE
FUN
D IN
CO
ME
& E
XP
EN
DIT
UR
E A
CC
OU
NT
FO
R T
HE
YE
AR
EN
DE
D M
AR
CH
31,
200
8 (C
ont
d.)
Form
A-R
A(U
L)
(R
s. ‘0
00)
Part
icul
ars
Sche
dule
Link
ed G
roup
Fun
ds
Gra
ndTo
tal
Bala
nced
In
com
eSh
ort-t
erm
De
bt
Capi
tal
Gua
rant
ee
Shor
t Deb
t
Capi
tal
Gua
rant
ee
Bala
nced
Fu
nd
Capi
tal
Gua
rant
ee
Debt
Fun
d
Gro
wth
Ca
pita
l G
uara
ntee
G
row
th
Leav
e En
cash
men
t Ba
lanc
ed
Fund
Leav
e En
cash
men
t De
bt F
und
Leav
e En
cash
men
t Sh
ort–
term
De
bt F
und
Tota
l
Inco
me
from
inve
stm
ents
Inte
rest
inco
me
332,
577
68,9
0516
0,74
131
,869
15,8
80 2
76
63,0
07 8
33
——
—67
4,08
83,
651,
543
Divid
end
inco
me
6,64
4—
—
— 4
30
—7,
044
50
——
—14
,168
941,
595
Prof
it/lo
ss o
n sa
le o
f inv
estm
ent
329,
986
16,
530
63,5
70 1
3,57
5 7,
352
102
13
7,64
7 8
99
——
—56
9,66
115
,436
,195
Prof
it/lo
ss o
n in
ter f
und
trans
fer/
sale
of i
nves
tmen
t31
,543
3,37
247
,441
126
5
27
7
781
47
2—
——
84,2
6974
8,70
6
Unre
alise
d Ga
in/lo
ss*
21,5
33 (4
,571
) 8
,776
7
82
6,9
05
—
86,7
17 2
87
——
—12
0,42
96,
324,
869
Appr
opria
tion/
Expr
opria
tion
(Inco
me/
Expe
nditu
re)
5,57
756
164
26
(278
)—
2,10
0(4
4)—
——
7,60
113
4,08
9
Tota
l Inc
ome
(A)
727,
860
84,2
9228
0,69
246
,378
30,8
16 3
85
297,
296
2,4
97
——
—1,
470,
216
27,2
36,9
97
Fund
man
agem
ent e
xpen
ses
23,3
304,
247
16,4
56 1
,243
1,
957
23
11,0
21 1
89
——
—58
,466
2,16
6,76
7
Fund
adm
inist
ratio
n ex
pens
es—
——
——
——
——
——
—1,
229,
808
Oth
er c
harg
esF-
52,
651,
417
Tota
l Exp
endi
ture
(B)
23,3
304,
247
16,4
561,
243
1,95
723
11,0
21 1
89
——
—58
,466
6,04
7,99
1
Exce
ss o
f Inc
ome
over
Exp
endi
ture
/(E
xpen
ditu
re o
ver I
ncom
e) (A
-B)
704,
530
80,0
4526
4,23
645
,135
28,8
59 3
62
286,
275
2,3
08
——
—1,
411,
750
21,1
89,0
05
Bala
nce
at th
e be
ginn
ing
of th
e ye
ar44
9,13
613
,443
79,5
40 4
,492
15
,423
57
106,
294
210
——
—66
8,59
520
,124
,857
Bala
nce
at th
e en
d of
the
year
1,15
3,66
693
,488
343,
776
49,6
2744
,282
419
39
2,56
9 2
,518
—
2,08
0,34
541
,313
,862
* N
et c
hang
e in
mar
k-to
-mar
ket
valu
e of
inve
stm
ents
.
ICICI PRU AR09_Final Pg29-197 (Ac).indd Sec1:121ICICI PRU AR09_Final Pg29-197 (Ac).indd Sec1:121 10/28/09 6:00:18 PM10/28/09 6:00:18 PM

I 122 I
FINANCIAL REPORTB
RE
AK
UP
OF
OT
HE
R E
XP
EN
SE
S U
ND
ER
ULI
PS
ched
ule:
F -
5O
TH
ER
EX
PE
NS
ES
*
(Rs.
‘000
)
Part
icul
ars
Link
ed L
ife F
unds
Bala
ncer
Pr
otec
tor
Max
imis
er
Cash
Plu
s Se
cure
Plu
s Pr
eser
ver
Inve
st S
hiel
d Li
fe
New
Inve
st
Shie
ld
Bala
nced
Flex
i Gro
wth
Fl
exi B
alan
ced
R.I.C
.H. F
und
Mul
tiplie
rTo
tal
Polic
y Ad
min
istra
tion
char
ge 1
9,26
6 1
4,08
5 1
33,6
27
45,
104
2,6
65
705
1
8,08
5 3
0,92
7 1
58,9
84
3,2
45
2,34
73,
057
432
,097
Surre
nder
cha
rge
—
—
—
—
—
—
—
—
—
—
——
—
Switc
hing
cha
rge
—
—
—
—
—
—
—
—
—
—
——
—
Mor
talit
y ch
arge
1
82,7
31
81,
409
721
,903
5
7,21
6 3
,075
9
,936
1
9,66
1 1
5,53
1 3
25,9
46
12,
706
4,21
034
,407
1,46
8,73
1
Ride
r Pre
miu
m c
harg
e 3
5,28
2 1
3,52
8 1
70,6
81
298
—
9
35
2,6
20
—
90,
116
3,0
22
14,
059
320
,542
Parti
al w
ithdr
awal
cha
rge
—
—
—
—
—
—
—
—
—
—
——
—
Misc
ella
neou
s ch
arge
—
—
—
—
—
—
—
—
—
—
——
—
Tota
l 2
37,2
79
109
,022
1,
026,
211
102,
618
5,7
40
11,
576
40,
366
46,4
58
575,
046
18,
973
6,55
841
,523
2,22
1,37
0
* Su
rrend
er &
Sw
itch
char
ges,
as
not a
vaila
ble
at fu
nd le
vel,
have
bee
n sh
own
unde
r the
Sch
edul
e (F
-1) f
or P
olic
yhol
ders
’ con
tribu
tion.
(R
s. ‘0
00)
Part
icul
ars
Link
ed P
ensi
on F
unds
Bala
ncer
Pr
otec
tor
Inco
me
Max
imis
er F
und
Gro
wth
Se
cure
Plu
s Pe
nsio
n Pr
eser
ver
Inve
st S
hiel
d Pe
nsio
n Fl
exi G
row
thFl
exi B
alan
ced
Pens
ion
R.I.C
.H.
Fund
Pe
nsio
n M
ultip
lier
Tota
l
Pol
icy
Adm
inis
trat
ion
char
ge 3
0,96
4 8
,511
1
27,1
38
621
4
03
2,3
56
149
,954
2
,952
9
,370
12
,035
344
,303
Sur
rend
er c
harg
e —
—
—
—
—
—
—
—
—
—
—
Sw
itchi
ng c
harg
e —
—
—
—
—
—
—
—
—
—
—
Mor
talit
y ch
arge
1
0,16
6 5
,597
3
1,03
8 3
14
135
9
09
22,
405
596
3
59
465
71,
983
Rid
er P
rem
ium
cha
rge
2,0
82
1,3
04
6,3
99
—
31
149
3,6
66
92
—
36 1
3,75
9
Par
tial w
ithdr
awal
cha
rge
—
—
—
—
—
—
—
—
—
— —
Mis
cella
neou
s ch
arge
—
—
—
—
—
—
—
—
—
— —
To
tal
43,
212
15,
412
164
,575
9
35
569
3,41
4 17
6,02
5 3
,640
9
,729
12
,536
430
,047
* S
urre
nder
& S
witc
h ch
arge
s, a
s no
t av
aila
ble
at f
und
leve
l, ha
ve b
een
show
n un
der
the
Sch
edul
e (F
-1) f
or P
olic
yhol
ders
’ con
trib
utio
n.
(Rs.
‘000
)
Part
icul
ars
Link
ed G
roup
Fun
ds
Bala
nced
In
com
eSh
ort T
erm
De
btCa
pita
l G
uara
ntee
Sh
ort D
ebt
Capi
tal
Gua
rant
ee
Bala
nced
Fun
d
Capi
tal
Gua
rant
ee
Debt
Fun
d
Gro
wth
Capi
tal
Gua
rant
ee
Gro
wth
Leav
e En
cash
men
t Ba
lanc
ed F
und
Leav
e En
cash
men
t De
bt F
und
Leav
e En
cash
men
t Sh
ort T
erm
De
bt F
und
Tota
lG
rand
Tot
al
Polic
y Ad
min
istra
tion
char
ge —
—
—
—
—
—
—
—
—
—
—
—
77
6,40
1
Surre
nder
cha
rge
—
—
—
—
—
—
—
—
—
—
—
—
—
Switc
hing
cha
rge
—
—
—
—
—
—
—
—
—
—
—
—
—
Mor
talit
y ch
arge
—
——
—
—
——
—
—
—
—
—
1,54
0,71
4
Ride
r Pre
miu
m c
harg
e —
——
—
—
—
—
—
—
—
—
—
334,
302
Parti
al w
ithdr
awal
cha
rge
—
—
—
—
—
—
—
—
—
—
—
—
—
Misc
ella
neou
s ch
arge
—
—
—
—
—
—
—
—
—
—
—
—
—
Tota
l—
——
——
— —
—
—
—
—
—
2,
651,
417
* S
urre
nder
& S
witc
h ch
arge
s, a
s no
t av
aila
ble
at f
und
leve
l, ha
ve b
een
show
n un
der
the
Sch
edul
e (F
-1) f
or P
olic
yhol
ders
’ con
trib
utio
n.
ICICI PRU AR09_Final Pg29-197 (Ac).indd Sec1:122ICICI PRU AR09_Final Pg29-197 (Ac).indd Sec1:122 10/28/09 6:00:18 PM10/28/09 6:00:18 PM

I 123 I
ANNUAL REPORT 2008-09ICICI PRUDENTIAL LIFE INSURANCE
3.20 DISCLOSURE FOR ULIP BUSINESS1. ANNEXURE TO THE REVENUE ACCOUNT FOR THE YEAR ENDED MARCH 31, 2009Policyholders’ Account (Technical Account) for the year ended March 31, 2009 (Rs. ‘000)
Particulars Sch
Linked Life Linked Pension Linked Health Linked Group
Non-Unit Unit Total Non-Unit Unit Total Non-Unit Unit Total Non-Unit Unit Total Total Unit Linked
(1) (2) (3)=(1)+(2) (4) (5) (6)=(4)+(5) (7) (8) (9)=(7)+(8) (10) (11) (12)=(10)+(11) (13)=(3)+(6)+(9)+(12)
Premiums earned – net
(a) Premium 9,567,048 69,100,890 78,667,938 3,559,447 50,114,925 53,674,372 89,030 356,116 445,146 57,218 12,188,412 12,245,630 145,033,086
(b) Reinsurance ceded (42,637) — (42,637) (674) — (674) (10,915) — (10,915) (13,305) — (13,305) (67,531)
Income from Investments
(a) Interest, Dividend & Rent – Gross 332,549 5,267,821 5,600,370 132,494 2,092,864 2,225,358 — 1,960 1,960 8,803 1,579,716 1,588,519 9,416,207
(b) Profit on sale/redemption of investments 31,813 11,739,333 11,771,146 18,009 2,750,347 2,768,356 99 1,059 1,158 2,783 685,944 688,727 15,229,387
(c) Loss on sale/redemption of investments (9,012) (22,833,172) (22,842,184) (2,735) (9,003,321) (9,006,056) — (347) (347) (318) (840,120) (840,438) (32,689,025)
(d) Unrealised gain/(loss) — (40,924,861) (40,924,861) — (14,483,619) (14,483,619) — 5,740 5,740 — (379,384) (379,384) (55,782,124)
(e) Appropriation/Expropriation Adjustment Account — (14,420) (14,420) — 38,601 38,601 — 176 176 — (8,350) (8,350) 16,007
Other income:
(a) Linked income UL1 6,182,632 (6,182,632) — 2,296,976 (2,296,976) — 29,013 (29,013) — 113,709 (113,709) — —
(b) Fees & charges 15,610 — 15,610 1,105 — 1,105 — — — — — — 16,715
(c ) Contribution from the Shareholders’ a/c 5,647,655 — 5,647,655 2,927,194 — 2,927,194 189,159 — 189,159 73,109 — 73,109 8,837,117
TOTAL (A) 21,725,658 16,152,959 37,878,617 8,931,816 29,212,821 38,144,637 296,386 335,691 632,077 241,999 13,112,509 13,354,508 90,009,839
Commission 4,132,329 — 4,132,329 2,189,943 — 2,189,943 62,104 — 62,104 157 — 157 6,384,533
Operating expenses related to insurance business * 15,858,922 1,127,351 16,986,273 6,804,443 415,658 7,220,101 220,160 12,545 232,705 217,079 (35,800) 181,279 24,620,358
Provision for taxation (Fringe benefit tax) 143,540 — 143,540 57,380 — 57,380 484 484 — — — 201,404
TOTAL (B) 20,134,791 1,127,351 21,262,142 9,051,766 415,658 9,467,424 282,748 12,545 295,293 217,236 (35,800) 181,436 31,206,295
Benefits paid (Net) UL2 602,293 12,386,466 12,988,759 43,214 2,006,118 2,049,332 423 15 438 19,096 5,423,652 5,442,748 20,481,277
Change in valuation of liability in respect of life policies 988,574 1,858,357 2,846,931 (163,164) 26,074,571 25,911,407 13,215 323,131 336,346 5,667 7,724,657 7,730,324 36,825,008
TOTAL (C) 1,590,867 14,244,823 15,835,690 (119,950) 28,080,689 27,960,739 13,638 323,146 336,784 24,763 13,148,309 13,173,072 57,306,285
Surplus/(Deficit) (D) = (A)—(B)—(C) — 780,785 780,785 — 716,474 716,474 — — — — — — 1,497,259
APPROPRIATIONS
Transfer to Shareholders’ a/c — — — — — — — — — — — — —
Balance being funds for future appropriations — 780,785 780,785 — 716,474 716,474 — — — — — — 1,497,259
TOTAL (D) — 780,785 780,785 — 716,474 716,474 — — — — — — 1,497,259
* For unit component, includes service tax, cost of any additional units granted to Policyholders for service lapses and freelook payouts (over and above the initial contribution)
ICICI PRU AR09_Final Pg29-197 (Ac).indd Sec1:123ICICI PRU AR09_Final Pg29-197 (Ac).indd Sec1:123 10/28/09 6:00:18 PM10/28/09 6:00:18 PM

I 124 I
FINANCIAL REPORT
Policyholders’ Account (Technical Account) for the year ended March 31, 2008 (Rs. ‘000)
Particulars Sch.
Linked Life Linked Pension Linked Group
Total Unit Linked(10)=(3)+(6)+(9)Non-Unit Unit Total Non-Unit Unit Total Non-Unit Unit Total
(1) (2) (3)=(1)+(2) (4) (5) (6)=(4)+(5) (7) (8) (9)= (7)+(8)
Premiums earned – net
(a) Premium 10,073,891 67,916,562 77,990,453 3,769,453 35,619,918 39,389,371 47,527 9,928,468 9,975,995 127,355,819
(b) Reinsurance ceded (32,023) — (32,023) (180) — (180) (7,088) — (7,088) (39,291)
Income from Investments
(a) Interest, Dividend & Rent – Gross 284,157 3,007,888 3,292,045 91,297 896,994 988,291 8,231 688,256 696,487 4,976,823
(b) Profit on sale/redemption of investments 18,977 14,649,040 14,668,017 8,423 3,428,691 3,437,114 2,257 721,008 723,265 18,828,396
(c) Loss on sale/redemption of investments (1,041) (1,944,139) (1,945,180) (76) (602,622) (602,698) (1) (67,078) (67,079) (2,614,957)
(d) Unrealised gain/(loss) — 6,356,230 6,356,230 — (151,790) (151,790) — 120,429 120,429 6,324,869
(e) Appropriation/Expropriation Adjustment Account — 60,670 60,670 — 65,818 65,818 7,601 7,601 134,089
Other income:
(a) Linked income UL1 4,803,802 (4,803,802) — 1,030,119 (1,030,119) — 59,211 (59,211) — —
(b) Fees & charges 28,930 28,930 531 — 531 70 70 29,531
(c) Contribution from the Shareholders’ a/c 8,544,845 8,544,845 5,131,904 — 5,131,904 252,632 252,632 13,929,381
TOTAL (A) 23,721,538 85,242,449 108,963,987 10,031,471 38,226,890 48,258,361 362,839 11,339,473 11,702,312 168,924,660
Commission 5,519,639 — 5,519,639 2,060,773 — 2,060,773 1,002 — 1,002 7,581,414
Operating expenses related to insurance business* 17,492,546 195,773 17,688,319 7,578,999 24,231 7,603,230 355,393 (135,250) 220,143 25,511,692
Provision for taxation (Fringe benefit tax) 199,161 — 199,161 74,100 — 74,100 — — 273,261
TOTAL (B) 23,211,346 195,773 23,407,119 9,713,872 24,231 9,738,103 356,395 (135,250) 221,145 33,366,367
Benefits paid (Net) UL2 345,438 13,280,941 13,626,379 17,447 2,838,283 2,855,730 13,347 2,466,470 2,479,817 18,961,926
Change in valuation of liability in respect of life policies 164,754 69,810,705 69,975,459 300,152 34,986,491 35,286,643 (6,903) 9,008,253 9,001,350 114,263,452
TOTAL (C) 510,192 83,091,646 83,601,838 317,599 37,824,774 38,142,373 6,444 11,474,723 11,481,167 133,225,378
Surplus/(Deficit) (D) = (A)–(B)–(C) — 1,955,030 1,955,030 — 377,885 377,885 — — — 2,332,915
APPROPRIATIONS
Transfer to Shareholders’ a/c — — — — — — — — — —
Balance being funds for future appropriations — 1,955,030 1,955,030 — 377,885 377,885 — — — 2,332,915
Total (D) — 1,955,030 1,955,030 — 377,885 377,885 — — — 2,332,915
* For unit component, includes service tax, cost of any additional units granted to Policyholders for service lapses and freelook payouts (over and above the initial contribution).
ICICI PRU AR09_Final Pg29-197 (Ac).indd Sec1:124ICICI PRU AR09_Final Pg29-197 (Ac).indd Sec1:124 10/28/09 6:00:18 PM10/28/09 6:00:18 PM

I 125 I
ANNUAL REPORT 2008-09ICICI PRUDENTIAL LIFE INSURANCE
SCHEDULE-UL1Linked Income (recovered from linked funds)* for the year ended March 31, 2009
(Rs. ‘000)
ParticularsLife Linked Unit
(1)Pension Linked Unit
(2)Linked Health Unit
(3)Linked Group Unit
(4)Total
(5) = (1)+(2)+(3)+(4)
Fund administration charges 1,092,380 126,314 — — 1,218,694
Fund management charge 1,983,814 869,014 396 109,482 2,962,706
Policy administration charge 803,524 1,149,806 4,341 — 1,957,671
Surrender charge 18,722 14,187 — 3,855 36,764
Switching charge 5,606 2,003 — — 7,609
Mortality charge 1,805,973 93,199 24,276 372 1,923,820
Rider premium charge 431,653 16,069 — — 447,722
Partial withdrawal charge — — — — —
Policy foreclosure 40,960 26,384 — — 67,344
Miscellaneous charge — — — — —
TOTAL (UL-1) 6,182,632 2,296,976 29,013 113,709 8,622,330
* net of service tax, if any
Linked Income (recovered from linked funds)* for the year ended March 31, 2008
(Rs. ‘000)
ParticularsLife Linked Unit
(1)Pension Linked Unit
(2)Linked Group Unit
(3)Total
(4) = (1)+(2)+(3)
Fund administration charges 1,103,947 125,861 — 1,229,808
Fund management charge 1,646,153 462,148 58,466 2,166,767
Policy administration charge 432,097 344,304 — 776,401
Surrender charge 13,075 18,762 745 32,582
Switching charge 5,812 1,266 — 7,078
Mortality charge 1,312,485 64,541 — 1,377,026
Rider premium charge 286,631 12,276 — 298,907
Partial withdrawal charge — — — —
Policy foreclosure 3,602 961 — 4,563
Miscellaneous charge — — — —
Total (UL-1) 4,803,802 1,030,119 59,211 5,893,132
* net of service tax, if any
ICICI PRU AR09_Final Pg29-197 (Ac).indd Sec1:125ICICI PRU AR09_Final Pg29-197 (Ac).indd Sec1:125 10/28/09 6:00:19 PM10/28/09 6:00:19 PM

I 126 I
FINANCIAL REPORT
SCHEDULE – UL2Benefits Paid (Net) for the year ended March 31, 2009
(Rs. ‘000)
Sl. No. Particulars
Linked Life Linked Pension Linked Health Linked Group
Total Unit LinkedNon-Unit Unit Linked Life Non-Unit Unit Linked Pension
Non-Unit Unit Linked Health
Non-Unit Unit Linked Group
(1) (2) (3)=(1)+(2) (4) (5) (6)=(4)+(5) (7) (8) (9)=(7)+(8) (10) (11) (12)=(10)+(11) (13)=(3)+(6)+(9)+(12)
1 Insurance claims
(a) Claims by death 559,150 193,960 753,110 39,892 118,098 157,990 293 15 308 24,459 30,523 54,982 966,390
(b) Claims by maturity — — — — — — — — ——(c) Annuities/Pension payment — — — — — — — —
(d) Other benefits — —
- Surrender 74 12,192,506 12,192,580 — 1,888,020 1,888,020 — — — 5,393,129 5,393,129 19,473,729
- Survival — — — — — — — — —
- Rider 64,275 64,275 3,322 3,322 — — — — 67,597
- Health — — — — 130 130 — — 130
Sub–Total (A) 623,499 12,386,466 13,009,965 43,214 2,006,118 2,049,332 423 15 438 24,459 5,423,652 5,448,111 20,507,846
2 Amount ceded in reinsurance
(a) Claims by death (21,206) — (21,206) — — — — — — (5,363) — (5,363) (26,569)
(b) Claims by maturity — — — — — — — — — — — — —
(c) Annuities/Pension payment — — — — — — — — — — — — —
(d) Other benefits —
- Surrender — — — — — — — — — — — — —
- Survival — — — — — — — — — — — — —
- Rider — — — — — — — — — — — — —
- Health — — — — — — — — — — — — —
Sub–Total (B) (21,206) — (21,206) — — — — — — (5,363) — (5,363) (26,569)
TOTAL (A) + (B) 602,293 12,386,466 12,988,759 43,214 2,006,118 2,049,332 423 15 438 19,096 5,423,652 5,442,748 20,481,277
Benefits paid to claimants: In India 623,499 12,386,466 13,009,965 43,214 2,006,118 2,049,332 423 15 438 24,459 5,423,652 5,448,111 20,507,846
TOTAL (UL2) 623,499 12,386,466 13,009,965 43,214 2,006,118 2,049,332 423 15 438 24,459 5,423,652 5,448,111 20,507,846
Benefits Paid (Net) for the year ended March 31, 2008(Rs. ‘000)
Sr. No. Particulars
Linked Life Linked Pension Linked Group
Total Unit LinkedNon–Unit Unit Linked Life Non-Unit Unit Linked Pension
Non-Unit Unit Linked Group
(1) (2) (3)=(1)+(2) (4) (5) (6)=(4)+(5) (7) (8) (9)=(7)+(8) (10)=(3)+(6)+(9)
1. Insurance claims
(a) Claims by death 297,276 161,540 458,816 15,786 74,923 90,709 16,582 — 16,582 566,107
(b) Claims by maturity — — — — — — — — — —
(c) Annuities/Pension payment — — — — — — — — — —
(d) Other benefits
– Surrender — 13,119,401 13,119,401 — 2,763,360 2,763,360 — 2,466,470 2,466,470 18,349,231
– Survival — — — — — — — — — —
– Rider 48,162 — 48,162 1,661 — 1,661 — — — 49,823
– Health — — — — — — — — — —
Sub-Total (A) 345,438 13,280,941 13,626,379 17,447 2,838,283 2,855,730 16,582 2,466,470 2,483,052 18,965,161
2. Amount ceded in reinsurance
(a) Claims by death — — — — — — (3,235) — (3,235) (3,235)
(b) Claims by maturity — — — — — — — — — —
(c) Annuities/Pension payment — — — — — — — — — —
(d) Other benefits
– Surrender — — — — — — — — — —
– Survival — — — — — — — — — —
– Rider — — — — — — — — — —
– Health — — — — — — — — — —
Sub-Total (B) — — — — — — (3,235) — (3,235) (3,235)
Total (A) + (B) 345,438 13,280,941 13,626,379 17,447 2,838,283 2,855,730 13,347 2,466,470 2,479,817 18,961,926
Benefits paid to claimants: In India 345,438 13,280,941 13,626,379 17,447 2,838,283 2,855,730 16,582 2,466,470 2,483,052 18,965,161
Total (UL2) 345,438 13,280,941 13,626,379 17,447 2,838,283 2,855,730 13,347 2,466,470 2,479,817 18,961,926
ICICI PRU AR09_Final Pg29-197 (Ac).indd Sec1:126ICICI PRU AR09_Final Pg29-197 (Ac).indd Sec1:126 10/28/09 6:00:19 PM10/28/09 6:00:19 PM

I 127 I
ANNUAL REPORT 2008-09ICICI PRUDENTIAL LIFE INSURANCE
2. Performance of the Fund (Absolute Growth %): For the year 2008-09:
Fund Name Year of Inception
YearSince inception
Current Year (X) (X – 1) (X – 2)
In percentage (%)
Balancer Fund 2002 -8.73 16.41 6.66 146.70Protector Fund 2002 9.77 9.04 5.60 79.04Maximiser Fund 2001 -33.88 24.77 7.55 262.10Preserver Fund 2004 10.37 9.27 7.41 42.68Multiplier Fund 2007 -31.25 -16.80* NA -42.80Pension Multiplier Fund 2008 -32.58 -7.00* NA -37.30Multiplier Fund II 2008 -30.57 -8.40* NA -36.40Pension Multiplier Fund II 2008 -31.57 -7.20* NA -36.50Multiplier Fund III 2008 -30.96 -8.60* NA -36.90Multiplier Fund IV 2008 -30.56 -8.70* NA -36.60R.I.C.H. Fund 2008 -28.79 5.60* NA -24.80R.I.C.H. Fund II 2008 -28.19 5.70* NA -24.10R.I.C.H. Fund III 2008 -28.73 5.80* NA -24.60R.I.C.H. Fund IV 2008 -28.29 5.70* NA -24.20Pension R.I.C.H. Fund 2008 -29.04 4.70* NA -25.70Pension R.I.C.H. Fund II 2008 -28.63 4.80* NA -25.20Balancer Fund II 2004 -7.43 17.76 8.00 63.30Protector Fund II 2004 10.82 9.87 6.40 35.54Maximiser Fund II 2004 -33.27 25.68 8.47 98.60Balancer Fund III 2006 -8.65 15.86 6.10 14.10Protector Fund III 2006 9.79 9.08 5.26 26.39Maximiser Fund III 2006 -33.86 24.44 6.61 -8.40Preserver Fund III 2006 10.20 9.18 6.92 28.95Balancer Fund IV 2007 -7.44 6.20* NA -1.70Protector Fund IV 2007 10.59 5.46* NA 16.63Maximiser Fund IV 2007 -33.36 6.10* NA -29.30Preserver Fund IV 2007 10.29 4.57* NA 15.34Pension Balancer Fund 2002 -6.68 16.15 7.61 137.60Pension Protector Fund 2002 9.79 9.23 5.68 61.06Pension Maximiser Fund 2002 -34.99 24.30 9.37 257.50Pension Preserver Fund 2004 10.59 9.28 7.31 42.22Pension Balancer Fund II 2004 -5.34 17.63 8.97 71.80Pension Protector Fund II 2004 10.94 9.84 6.40 35.69Pension Maximiser Fund II 2004 -34.41 25.40 9.73 104.00Group Balanced Fund 2003 2.11 14.05 6.66 79.00Group Debt Fund 2003 12.27 9.45 6.37 50.68Group Growth Fund 2003 -15.94 21.03 12.95 98.80Group Short Term Debt Fund 2003 8.44 9.58 6.89 45.49Group Capital Guarantee Balanced Fund 2005 1.18 11.40 6.44 28.50Group Capital Guarantee Debt Fund 2005 17.73 9.62 6.24 39.68Group Capital Guarantee Growth Fund 2006 -11.02 14.67 2.90* 5.00Group Capital Guarantee Short Term Debt Fund II 2007 9.13 9.88 0.47* 20.48Group Capital Guarantee Balanced Fund II 2007 1.68 11.98 1.00* 15.00Group Capital Guarantee Debt Fund II 2007 18.01 9.84 0.33* 30.05Group Capital Guarantee Growth Fund II 2007 -10.56 8.00* NA -3.40Group Capital Guarantee Short Term Debt Fund 2004 9.49 10.10 6.75 40.39Group Leave Encashment Balance Fund 2008 3.30* NA NA 3.30Group Leave Encashment Short Term Fund 2008 9.40* NA NA 9.40Group Leave Encashment Income Fund 2008 11.90* NA NA 11.90Invest Shield Cash Fund 2005 10.45 9.41 6.53 35.27Invest Shield Life Fund 2005 -3.46 14.19 11.32 45.30Invest Shield Pension Fund 2005 -3.84 14.37 10.72 45.40New Invest Shield Balanced Fund 2006 -7.90 16.70 9.60* 17.80Cash Plus Fund 2003 10.42 9.42 6.53 41.50Secure Plus Fund 2003 10.24 9.48 6.32 40.00Secure Plus Pension Fund 2003 10.78 9.51 6.47 37.77Flexi Growth Fund 2007 -34.18 24.43 1.10* -17.20Flexi Growth Fund II 2007 -33.88 25.27 1.30* -16.10Flexi Growth Fund III 2007 -34.18 24.01 1.20* -17.40Flexi Growth Fund IV 2007 -33.73 8.20* NA -28.30Pension Flexi Growth Fund 2007 -36.06 21.82 2.20* -20.40Pension Flexi Growth Fund II 2007 -35.54 24.38 0.90* -19.10Flexi Balanced Fund 2007 -17.01 15.25 1.00* -3.40Flexi Balanced Fund II 2007 -15.47 16.90 1.20* 0.00Flexi Balanced Fund III 2007 -16.65 14.38 0.80* -3.90Flexi Balanced Fund IV 2007 -15.83 5.50* NA -11.20Pension Flexi Balanced Fund 2007 -17.61 19.96 2.70* 1.50Pension Flexi Balanced Fund II 2007 -16.53 20.63 1.30* 2.00Health Saver Balancer Fund 2009 2.30* NA NA 2.30Health Saver Protector Fund 2009 2.78* NA NA 2.78Health Saver Flexi Balanced Fund 2009 3.40* NA NA 3.40Health Saver Flexi Growth Fund 2009 7.00* NA NA 7.00Health Saver Multiplier Fund 2009 5.40* NA NA 5.40Health Saver Preserver Fund 2009 1.98* NA NA 1.98Return Guarantee Fund 2009 5.75* NA NA 5.75Pension Return Guarantee Fund 2009 5.82* NA NA 5.82Group Return Guarantee Fund 2009 2.76* NA NA 2.76Return Guarantee Fund II 2009 2.77* NA NA 2.77Pension Return Guarantee Fund II 2009 2.82* NA NA 2.82Health Saver Return Guarantee Fund 2009 2.27* NA NA 2.27Health Saver Return Guarantee Fund II 2009 2.55* NA NA 2.55Return Guarantee Fund III 2009 1.44* NA NA 1.44Pension Return Guarantee Fund III 2009 1.41* NA NA 1.41Health Saver Return Guarantee Fund III 2009 1.43* NA NA 1.43
ICICI PRU AR09_Final Pg29-197 (Ac).indd Sec1:127ICICI PRU AR09_Final Pg29-197 (Ac).indd Sec1:127 10/28/09 6:00:19 PM10/28/09 6:00:19 PM

I 128 I
FINANCIAL REPORT
For the year 2007-08:
Fund Name Year of Inception
YearSince inception
Current Year (X) (X – 1) (X – 2)
In percentage (%)
Balancer Fund 2002 16.41 6.66 23.83 170.30Protector Fund 2002 9.04 5.60 3.24 63.11Maximiser Fund 2001 24.77 7.55 68.15 447.60Preserver Fund 2004 9.27 7.41 5.58 29.27Multiplier Fund 2007 -16.80* NA NA -16.80Pension Multiplier Fund 2008 -7.00* NA NA -7.00Multiplier Fund II 2008 -8.40* NA NA -8.40Pension Multiplier Fund II 2008 -7.20* NA NA -7.20Multiplier Fund III 2008 -8.60* NA NA -8.60Multiplier Fund IV 2008 -8.70* NA NA -8.70R.I.C.H. Fund 2008 5.60* NA NA 5.60R.I.C.H. Fund II 2008 5.70* NA NA 5.70R.I.C.H. Fund III 2008 5.80* NA NA 5.80R.I.C.H. Fund IV 2008 5.70* NA NA 5.70Pension R.I.C.H. Fund 2008 4.70* NA NA 4.70Pension R.I.C.H. Fund II 2008 4.80* NA NA 4.80Balancer Fund II 2004 17.76 8.00 25.41 76.40Protector Fund II 2004 9.87 6.40 4.05 22.31Maximiser Fund II 2004 25.68 8.47 69.22 197.60Balancer Fund III 2006 15.86 6.10 1.60* 24.90Protector Fund III 2006 9.08 5.26 0.26* 15.12Maximiser Fund III 2006 24.44 6.61 4.40* 38.50Preserver Fund III 2006 9.18 6.92 0.24* 17.01Balancer Fund IV 2007 6.20* NA NA 6.20Protector Fund IV 2007 5.46* NA NA 5.46Maximiser Fund IV 2007 6.10* NA NA 6.10Preserver Fund IV 2007 4.57* NA NA 4.57Pension Balancer Fund 2002 16.15 7.61 24.36 154.60Pension Protector Fund 2002 9.23 5.68 3.25 46.70Pension Maximiser Fund 2002 24.30 9.37 68.47 449.90Pension Preserver Fund 2004 9.28 7.31 5.60 28.60Pension Balancer Fund II 2004 17.63 8.97 25.87 81.50Pension Protector Fund II 2004 9.84 6.40 4.01 22.31Pension Maximiser Fund II 2004 25.40 9.73 69.54 211.00Group Balanced Fund 2003 14.05 6.66 13.46 75.30Group Debt Fund 2003 9.45 6.37 3.61 34.22Group Growth Fund 2003 21.03 12.95 38.62 136.50Group Short Term Debt Fund 2003 9.58 6.89 4.45 34.17Group Capital Guarantee Balanced Fund 2005 11.40 6.44 7.10* 27.00Group Capital Guarantee Debt Fund 2005 9.62 6.24 1.87* 18.64Group Capital Guarantee Growth Fund 2006 14.67 2.90* NA 18.00Group Capital Guarantee Short Term Debt Fund II 2007 9.88 0.47* NA 10.40Group Capital Guarantee Balanced Fund II 2007 11.98 1.00* NA 13.10Group Capital Guarantee Debt Fund II 2007 9.84 0.33* NA 10.21Group Capital Guarantee Growth Fund II 2007 8.00* NA NA 8.00Group Capital Guarantee Short Term Debt Fund 2004 10.10 6.75 4.43 28.22Invest Shield Cash Fund 2005 9.41 6.53 4.19 22.48Invest Shield Life Fund 2005 14.19 11.32 18.40 50.50Invest Shield Pension Fund 2005 14.37 10.72 19.52 51.20New Invest Shield Balanced Fund 2006 16.70 9.60* NA 27.90Cash Plus Fund 2003 9.42 6.53 4.35 28.15Secure Plus Fund 2003 9.48 6.32 4.67 27.00Secure Plus Pension Fund 2003 9.51 6.47 3.93 24.37Flexi Growth Fund 2007 24.43 1.10* NA 25.80Flexi Growth Fund II 2007 25.27 1.30* NA 26.90Flexi Growth Fund III 2007 24.01 1.20* NA 25.50Flexi Growth Fund IV 2007 8.20* NA NA 8.20Pension Flexi Growth Fund 2007 21.82 2.20* NA 24.50Pension Flexi Growth Fund II 2007 24.38 0.90* NA 25.50Flexi Balanced Fund 2007 15.25 1.00* NA 16.40Flexi Balanced Fund II 2007 16.90 1.20* NA 18.30Flexi Balanced Fund III 2007 14.38 0.80* NA 15.30Flexi Balanced Fund IV 2007 5.50* NA NA 5.50Pension Flexi Balanced Fund 2007 19.96 2.70* NA 23.20Pension Flexi Balanced Fund II 2007 20.63 1.30* NA 22.20
Notes: (i) NA - refers to schemes not existing during the relevant year (ii) * denotes scheme/plan launched during the year
3. Investment management activities outsourced:
Activities outsourced Basis of payment of fees Payment made
2008-09
Nil — —
2007-08
Nil — —
ICICI PRU AR09_Final Pg29-197 (Ac).indd Sec1:128ICICI PRU AR09_Final Pg29-197 (Ac).indd Sec1:128 10/28/09 6:00:19 PM10/28/09 6:00:19 PM

I 129 I
ANNUAL REPORT 2008-09ICICI PRUDENTIAL LIFE INSURANCE
4. Related party transactions : (i) Brokerage, custodial fee or any other payments and receipts made to / from related parties (as
defined in AS 18 issued by ICAI): (a) Brokerage: For the year 2008-09: (Rs. ‘000)
Fund Name Broker Name Brokerage Deal Value
Flexi Balanced Fund ICICI Securities Limited 257 94,114Flexi Growth Fund ICICI Securities Limited 1,925 706,623Group Capital Guarantee Balanced Fund ICICI Securities Limited 42 15,231Group Capital Guarantee Growth Fund ICICI Securities Limited 12 4,416Group Balanced Fund ICICI Securities Limited 352 128,364Group Leave Encashment Balance Fund ICICI Securities Limited 8 3,005Group Growth Fund ICICI Securities Limited 610 222,937Health Saver Balancer Fund ICICI Securities Limited 1 459Health Saver Flexi Balanced Fund ICICI Securities Limited 2 725Health Saver Flexi Growth Fund ICICI Securities Limited 107 39,013Health Saver Multiplier Fund ICICI Securities Limited 20 7,274Invest Shield Life Fund ICICI Securities Limited 258 93,988Balancer Fund ICICI Securities Limited 1,360 498,192Maximiser Fund ICICI Securities Limited 13,240 4,959,757Multiplier Fund ICICI Securities Limited 1,700 621,273New Invest Shield Balanced Fund ICICI Securities Limited 45 16,252Pension R.I.C.H. Fund ICICI Securities Limited 1,255 459,411Pension Flexi Balanced ICICI Securities Limited 151 55,371Pension Flexi Growth Fund ICICI Securities Limited 4,355 1,593,501Invest Shield Pension Fund ICICI Securities Limited 8 3,047Pension Balancer Fund ICICI Securities Limited 557 203,802Pension Maximiser Fund ICICI Securities Limited 2,470 908,208Pension Multiplier Fund ICICI Securities Limited 2,095 765,286R.I.C.H. Fund ICICI Securities Limited 330 121,174Secure Plus Fund ICICI Securities Limited 0 11
Total 31,160 11,521,432
For the year 2007-08: (Rs. ‘000)
Fund Name Broker Name Brokerage Deal Value
Group Balanced Fund ICICI Securities Limited 227 83,072 Group Growth Fund ICICI Securities Limited 338 124,163 Invest Shield Life Fund ICICI Securities Limited 4 1,535 Balancer Fund ICICI Securities Limited 1,364 506,258 Maximiser Fund ICICI Securities Limited 15,878 5,890,563 New Invest Shield Balanced Fund ICICI Securities Limited 5 1,689 Invest Shield Pension Fund ICICI Securities Limited 1 307 Pension Balancer Fund ICICI Securities Limited 471 173,829 Pension Maximiser Fund ICICI Securities Limited 4,616 1,697,980 Flexi Balanced Fund ICICI Securities Limited 177 64,579 Flexi Growth Fund ICICI Securities Limited 6,960 2,584,768 Pension Flexi Balanced Fund ICICI Securities Limited 89 32,699 Pension Flexi Growth Fund ICICI Securities Limited 3,481 1,335,318 Multiplier Fund ICICI Securities Limited 1,940 707,552 Pension Multiplier Fund ICICI Securities Limited 712 260,000 R.I.C.H. Fund ICICI Securities Limited 195 71,927 Pension R.I.C.H. Fund ICICI Securities Limited 458 169,268
Total 36,917 13,705,506
(b) Purchases: For the year 2008-09: (Rs. ‘000)
Fund Name ICICI Bank Ltd. ICICI
Home Finance Company Ltd.
ICICI Lombard General
Insurance Co. Ltd.
ICICI Securities
Limited
ICICI Securities Primary
Dealership Ltd. Total
Flexi Balanced Fund 52,785 3,537 3,149 628 13,243 73,342Flexi Growth Fund — — — — 379,300 379,300Group Capital Guarantee Balanced Fund 33,481 4,939 2,023 380 92,821 133,644Group Capital Guarantee Debt Fund 90,310 98 — — 806,099 896,507Group Capital Guarantee Short Term Debt Fund 117,630 88,341 — — 875,837 1,081,808Group Capital Guarantee Growth Fund 2,962 438 189 33 11,976 15,598Group Balanced Fund 381,274 38,150 18,020 4,770 254,942 697,156Group Debt Fund 172,299 13,151 69,215 1,525 251,713 507,903Group Short Term Debt Fund 105,198 157,228 — — 467,610 730,036Group Leave Encashment Balance Fund 36,539 3,224 933 242 71,600 112,538Group Leave Encashment Income Fund 2,132 138 2 — 1,653 3,925Group Leave Encashment Short Term Fund 1,133 1,017 — — 3,096 5,246Group Return Guarantee Fund 101,855 — — — 132,389 234,244Group Growth Fund 105,657 8,516 4,612 1,250 557,112 677,147Health Saver Balancer Fund 48 — 6 — — 54Health Saver Protector Fund 322 — 47 — — 369Health Saver Flexi Balanced Fund 31 — 5 — — 36Health Saver Preserver Fund 17 — — — — 17Health Saver Return Guarantee Fund II 10,515 1,960 3,616 — 4,492 20,583
ICICI PRU AR09_Final Pg29-197 (Ac).indd Sec1:129ICICI PRU AR09_Final Pg29-197 (Ac).indd Sec1:129 10/28/09 6:00:20 PM10/28/09 6:00:20 PM

I 130 I
FINANCIAL REPORT
Fund Name ICICI Bank Ltd. ICICI
Home Finance Company Ltd.
ICICI Lombard General
Insurance Co. Ltd.
ICICI Securities
Limited
ICICI Securities Primary
Dealership Ltd. Total
Health Saver Return Guarantee Fund III 2,943 — — — 1,949 4,892Invest Shield Life Fund 63,874 6,716 3,310 774 17,932 92,606Balancer Fund 1,183,374 110,492 232,957 14,635 442,462 1,983,920Protector Fund 1,077,688 157,000 166,573 11,680 3,737,425 5,150,366Maximiser Fund — — — — 7,107,175 7,107,175Preserver Fund 119,050 59,880 — — 338,182 517,112Multiplier Fund — — — — 290,000 290,000New Invest Shield Balanced Fund 71,234 6,225 3,928 868 32,830 115,085Pension R.I.C.H. Fund — — — — 790,000 790,000Pension Flexi Balanced 37,048 2,099 2,297 434 8,378 50,256Pension Flexi Growth Fund — — — — 1,258,300 1,258,300Invest Shield Pension Fund 12,653 1,349 662 152 23,588 38,404Pension Balancer Fund 693,801 39,721 84,035 5,747 149,271 972,575Pension Protector Fund 604,814 83,751 87,657 6,337 3,415,689 4,198,248Pension Maximiser Fund — — — — 2,594,800 2,594,800Pension Return Guarantee Fund II 337,961 84,500 128,031 — 132,040 682,532Pension Return Guarantee Fund III 114,233 — — — 91,361 205,594Pension Preserver Fund 42,857 11,362 — — 210,449 264,668Return Guarantee Fund — — — — 3,116 3,116Return Guarantee Fund II 161,147 26,000 37,856 — 43,042 268,045Return Guarantee Fund III 31,238 — — — 21,612 52,850R.I.C.H. Fund — — — — 310,000 310,000Cash Plus Fund 219,051 21,694 11,755 2,686 258,961 514,147Secure Plus Fund 18,736 2,036 947 233 5,444 27,396Secure Plus Pension Fund 8,164 902 420 100 2,396 11,982Health Saver Return Guarantee Fund — 900 — — — 900
Total 6,014,052 935,365 862,242 52,472 25,210,285 33,074,416
For the year 2007-08: (Rs. ‘000)
Fund Name ICICI Bank Ltd. ICICI Securities Primary Dealership Ltd. ICICI Securities Ltd. ICICI Home Finance
Company Ltd. Total
Group Capital Guarantee Balanced Fund 13,805 10,635 258 290 24,987 Group Capital Guarantee Debt Fund 354 253 5 26 638 Group Capital Guarantee Growth Fund 762 711 13 66 1,553 Group Balanced Fund 270,220 171,418 4,985 34,716 481,339 Group Debt Fund 95,701 51,317 1,550 9,452 158,020 Group Short Term Debt Fund 148,428 316,912 90,000 78,989 634,329 Group Growth Fund 70,379 42,046 1,127 3,912 117,464 Invest Shield Life Fund 40,603 39,550 5,721 7,179 93,053 Balancer Fund 854,608 654,338 48,963 146,619 1,704,529 Protector Fund 587,104 547,246 33,326 81,830 1,249,506 Maximiser Fund 250,000 — 5,000 — 255,000 Group Capital Guarantee Short Term Debt Fund 33,572 21,879 — 7,329 62,780 Preserver Fund 47,264 — — — 47,264 Cash Plus Fund 114,620 100,160 31,752 13,261 259,793 New Invest Shield Balanced Fund 35,987 31,914 10,584 1,637 80,122 Invest Shield Pension Fund 8,713 5,839 149 640 15,341 Pension Balancer Fund 297,705 205,270 5,784 62,905 571,664 Pension Protector Fund 258,536 146,550 4,265 46,621 455,972 Pension Preserver Fund 4,619 — — — 4,619 Pension Maximiser Fund — 360,000 360,000 — 720,000 Secure Plus Fund 17,182 9,097 219 2,071 28,569 Secure Plus Pension Fund 7,554 4,619 99 980 13,252 Flexi Balanced Fund 24,360 15,578 487 318 40,744 Pension Flexi Balanced Fund 11,851 7,258 213 1,159 20,480 Flexi Growth Fund 250,000 — — — 250,000
Total 3,443,928 2,742,589 604,501 500,000 7,291,018
(c) Sales: For the year 2008-09: (Rs. ‘000)
Fund Name ICICI Bank Ltd. ICICI Securities Primary Dealership Ltd. Total
Flexi Balanced Fund 21,188 6,374 27,562
Flexi Growth Fund 494,957 379,492 874,449
Group Capital Guarantee Balanced Fund 12,425 51,367 63,792
Group Capital Guarantee Debt Fund 28,066 712,840 740,906
Group Capital Guarantee Short Term Debt Fund — 861,142 861,142
Group Capital Guarantee Growth Fund 1,060 6,548 7,608
Group Balanced Fund 156,689 245,803 402,492
Group Debt Fund 203,391 104,062 307,453
Group Short Term Debt Fund 30,030 429,217 459,247
Group Leave Encashment Balance Fund 8,546 47,184 55,730
Group Leave Encashment Income Fund 58 246 304
ICICI PRU AR09_Final Pg29-197 (Ac).indd Sec1:130ICICI PRU AR09_Final Pg29-197 (Ac).indd Sec1:130 10/28/09 6:00:20 PM10/28/09 6:00:20 PM

I 131 I
ANNUAL REPORT 2008-09ICICI PRUDENTIAL LIFE INSURANCE
Fund Name ICICI Bank Ltd. ICICI Securities Primary Dealership Ltd. Total
Group Leave Encashment Short Term Fund 880 2,889 3,769
Group Growth Fund 42,600 544,897 587,497
Invest Shield Life Fund 27,957 10,532 38,489
Balancer Fund 488,986 237,865 726,851
Protector Fund 1,192,581 3,463,220 4,655,801
Maximiser Fund 2,861,748 4,903,670 7,765,418
Preserver Fund 61,250 324,850 386,100
Multiplier Fund — 290,159 290,159
New Invest Shield Balanced Fund 64,903 24,756 89,659
Pension R.I.C.H. Fund — 490,428 490,428
Pension Flexi Balanced 18,442 3,883 22,325
Invest Shield Pension Fund 7,727 22,203 29,930
Pension Balancer Fund 203,405 80,992 284,397
Pension Protector Fund 517,645 3,218,976 3,736,621
Pension Maximiser Fund 502,061 2,598,569 3,100,630
Pension Preserver Fund 67,550 208,720 276,270
R.I.C.H. Fund 129,823 210,391 340,214
Cash Plus Fund 159,213 230,076 389,289
Secure Plus Fund 12,012 3,179 15,191
Secure Plus Pension Fund 5,140 1,465 6,605
Health Saver Preserver Fund 17 — 17
Health Saver Flexi Growth Fund 22 — 22
Health Saver Protector Fund 59 — 59
Health Saver Balancer Fund 5 — 5
Pension Flexi Growth Fund — 1,259,232 1,259,232
Total 7,320,439 20,975,226 28,295,665
For the year 2007-08: (Rs. ‘000)
Fund Name ICICI Bank Ltd. ICICI Lombard General Insurance Co. Ltd.
ICICI Securities Primary Dealership Ltd.
ICICI Securities Ltd. Total
Group Capital Guarantee Balanced Fund — 252 2,972 — 3,224
Group Capital Guarantee Debt Fund 78 4 104 — 186
Group Capital Guarantee Growth Fund — 12 277 — 289
Group Balanced Fund — 5,173 226,365 — 231,538
Group Debt Fund — 888 24,805 21,464 47,157
Group Short Term Debt Fund 68,234 — 48,963 — 117,197
Group Growth Fund 1,384 841 18,230 — 20,456
Invest Shield Life Fund — 596 7,399 — 7,995
Balancer Fund 37,529 19,022 338,626 — 395,177
Protector Fund 9,748 11,210 329,640 82,996 433,593
Maximiser Fund — 199,038 — 250,419 449,457
Group Capital Guarantee Short Term Debt Fund — — 2,326 — 2,326
Preserver Fund — — 43,029 — 43,029
Cash Plus Fund — 1,325 24,592 10,732 36,649
New Invest Shield Balanced Fund — 361 9,296 16,098 25,755
Invest Shield Pension Fund — 124 1,542 — 1,666
Pension Balancer Fund 19,495 5,740 65,658 — 90,894
Pension Protector Fund 9,748 4,400 84,556 — 98,704
Pension Preserver Fund — — 2,352 — 2,352
Secure Plus Fund — 204 2,782 — 2,986
Secure Plus Pension Fund — 103 1,198 — 1,301
Flexi Balanced Fund — 143 8,001 10,732 18,876
Pension Flexi Balanced Fund — 49 2,923 10,732 13,704
Flexi Growth Fund — — — 250,419 250,419
Total 146,215 249,487 1,245,638 653,590 2,294,930
ICICI PRU AR09_Final Pg29-197 (Ac).indd Sec1:131ICICI PRU AR09_Final Pg29-197 (Ac).indd Sec1:131 10/28/09 6:00:20 PM10/28/09 6:00:20 PM

I 132 I
FINANCIAL REPORT
(d) Placement of Fixed Deposits with ICICI Bank: (Rs. ‘000)
Fund Name 2008-09 2007-08
Flexi Balanced Fund 10,494 8,021 Flexi Growth Fund 775,012 — Group Capital Guarantee Balanced Fund 19,689 4,375 Group Capital Guarantee Short Term Debt Fund 203,074 16,124 Group Capital Guarantee Growth Fund 459 242 Group Capital Guarantee Debt Fund — 89 Group Debt Fund 233,826 32,911 Group Short Term Debt Fund 206,781 269,926 Group Balanced Fund — 95,305 Group Growth Fund — 26,717 Group Leave Encashment Balance Fund 14,295 — Group Leave Encashment Income Fund 55 — Group Leave Encashment Short Term Fund 407 — Health Saver Balancer Fund 112 — Health Saver Flexi Balanced Fund 141 — Health Saver Preserver Fund 20 — Invest Shield Life Fund 7,652 14,209 Balancer Fund 136,056 314,230 Protector Fund 616,057 186,089 Maximiser Fund 5,046,597 — Preserver Fund — 27,046 Multiplier Fund 116,239 — New Invest Shield Balanced Fund 21,253 12,259 Pension R.I.C.H. Fund 116,984 — Pension Flexi Balanced Fund 2,232 4,658 Pension Flexi Growth Fund 356,384 — Invest Shield Pension Fund 1,388 3,465 Pension Balancer Fund 58,535 109,568 Pension Protector Fund 357,063 76,795 Pension Maximiser Fund 1,087,772 — Pension Preserver Fund — 2,815 Pension Multiplier Fund 50,227 — R.I.C.H. Fund 100,785 — Cash Plus Fund 105,885 38,918 Secure Plus Fund 4,527 4,264 Secure Plus Pension Fund — 1,974
Total 9,650,000 1,250,000
(e) Redemption of Fixed Deposits with ICICI Bank: (Rs. ‘000)
Fund Name 2008-09 2007-08
Flexi Balanced Fund 3,496 5,000 Flexi Growth Fund 878,478 262,500 Group Capital Guarantee Balanced Fund 14,955 3,200 Group Capital Guarantee Debt Fund 32,000 30 Group Capital Guarantee Short Term Debt Fund 203,074 49,200 Group Capital Guarantee Growth Fund 36 250 Group Balanced Fund — 204,400 Group Growth Fund — 45,200 Group Debt Fund 168,913 24,460 Group Short Term Debt Fund 206,781 — Group Leave Encashment Balance Fund 14,295 — Group Leave Encashment Income Fund 55 — Group Leave Encashment Short Term Fund 407 — Health Saver Balancer Fund 112 — Health Saver Flexi Balanced Fund 141 — Health Saver Preserver Fund 20 — Protector Fund 443,023 121,600 Maximiser Fund 2,086,597 79,060 Invest Shield Life Fund — 23,300 New Invest Shield Balanced Fund 12,259 10,370 Pension R.I.C.H. Fund 116,984 — Balancer Fund — 1,027,700 Pension Flexi Balanced Fund 4,658 — Pension Flexi Growth Fund 356,384 151,500 Invest Shield Pension Fund 3,465 1,000 Pension Protector Fund 149,616 244,020 Pension Maximiser Fund 587,772 100,000 Pension Preserver Fund 20,000 1,500 Pension Balancer Fund — 351,720 Preserver Fund — 40,000 R.I.C.H. Fund 221,785 — Cash Plus Fund 22,381 43,190 Secure Plus Fund 2,314 6,600 Secure Plus Pension Fund — 4,300
Total 5,550,000 2,800,100
ICICI PRU AR09_Final Pg29-197 (Ac).indd Sec1:132ICICI PRU AR09_Final Pg29-197 (Ac).indd Sec1:132 10/28/09 6:00:20 PM10/28/09 6:00:20 PM

I 133 I
ANNUAL REPORT 2008-09ICICI PRUDENTIAL LIFE INSURANCE
(f) Reverse Repo: For the year 2008-09: (Rs. ‘000)
Fund Name ICICI Bank Ltd. ICICI Securities Primary Dealership Ltd. Total
Flexi Balanced Fund 951,713 63,561 1,015,274Flexi Growth Fund 27,046,862 39,656,652 66,703,515Group Capital Guarantee Balanced Fund 1,010,566 — 1,010,566Group Capital Guarantee Debt Fund 1,623 926,649 928,272Group Capital Guarantee Short Term Debt Fund 1,086,475 2,599,315 3,685,790Group Capital Guarantee Growth Fund 139,853 6,121 145,974Group Balanced Fund 1,499,095 403,953 1,903,048Group Short Term Debt Fund 110,111 203,864 313,974Group Leave Encashment Balance Fund 146,717 — 146,717Group Leave Encashment Income Fund 7,064 2,334 9,398Group Leave Encashment Short Term Fund 36,377 507 36,885Group Growth Fund 671,189 1,875,947 2,547,136Health Saver Balancer Fund 6,269 — 6,269Health Saver Protector Fund 12,094 — 12,094Health Saver Flexi Balanced Fund 4,904 — 4,904Health Saver Flexi Growth Fund 3,150 — 3,150Health Saver Preserver Fund 327 — 327Health Saver Multiplier Fund 3,497 — 3,497Health Saver Return Guarantee Fund II 9,310 — 9,310Health Saver Return Guarantee Fund III 6,776 — 6,776Invest Shield Life Fund 16,654 11,288 27,941Balancer Fund 3,683,628 1,141,943 4,825,571Protector Fund 147,850 396,805 544,656Maximiser Fund 108,764,580 84,266,877 193,031,457Preserver Fund 326,313 165,470 491,783Multiplier Fund 3,258,238 9,253,707 12,511,945New Invest Shield Balanced Fund — 18,795 18,795Pension R.I.C.H. Fund 4,873,345 10,352,402 15,225,747Pension Flexi Balanced Fund 1,380,283 513,593 1,893,876Pension Flexi Growth Fund 25,077,806 33,149,571 58,227,378Invest Shield Pension Fund 68,032 — 68,032Pension Balancer Fund 5,177,078 782,148 5,959,226Pension Protector Fund 279,492 619,961 899,453Pension Maximiser Fund 19,635,168 23,377,861 43,013,030Pension Multiplier Fund 6,199,651 4,935,284 11,134,935Pension Return Guarantee Fund II 110,468 — 110,468Pension Return Guarantee Fund III 180,726 — 180,726Pension Preserver Fund 302,066 31,541 333,608Return Guarantee Fund 19,894 — 19,894Return Guarantee Fund II 59,773 — 59,773Return Guarantee Fund III 62,652 — 62,652R.I.C.H. Fund 5,471,437 7,056,142 12,527,579Cash Plus Fund 1,710,263 327,471 2,037,734Secure Plus Fund 95,783 607 96,389Secure Plus Pension Fund 104,805 — 104,805
Total 219,759,958 222,140,370 441,900,328
For the year 2007-08: (Rs. ‘000)
Fund Name ICICI Bank Ltd. ICICI Securities Primary Dealership Ltd. Total
Group Capital Guarantee Balanced Fund — 7,394 7,394 Group Capital Guarantee Debt Fund — 96 96 Group Capital Guarantee Growth Fund — 144 144 Group Balanced Fund — 8,008 8,008 Group Debt Fund 76,768 30,463 107,231 Group Short Term Debt Fund — 927 927 Group Growth Fund — 71,471 71,471 Invest Shield Life Fund — 2,497 2,497 Balancer Fund — 288 288 Protector Fund — 45,696 45,696 Maximiser Fund — 1,951,382 1,951,382 Preserver Fund — 533,906 533,906 Cash Plus Fund — 7,456 7,456 New Invest Shield Balanced Fund — 2,642 2,642 Invest Shield Pension Fund — 2,392 2,392 Pension Balancer Fund — 337,694 337,694 Pension Protector Fund — 8,729 8,729 Pension Maximiser Fund — 181,716 181,716 Pension Preserver Fund — 65,843 65,843 Secure Plus Fund — 1,329 1,329 Secure Plus Pension Fund — 276 276 Pension Flexi Growth Fund — 714,403 714,403 Pension Flexi Balanced Fund 10,700 17,005 27,704 Flexi Balanced Fund 57,413 23,526 80,939 Flexi Growth Fund 2,033 899,097 901,130
Total 146,914 4,914,380 5,061,294
ICICI PRU AR09_Final Pg29-197 (Ac).indd Sec1:133ICICI PRU AR09_Final Pg29-197 (Ac).indd Sec1:133 10/28/09 6:00:20 PM10/28/09 6:00:20 PM

I 134 I
FINANCIAL REPORT
(g) Interest Income: For the year 2008-09: (Rs. ‘000)
Fund Name ICICI Bank Ltd. ICICI Home Finance Company Ltd.
ICICI Securities Primary Dealership Ltd Total
Balancer Fund 24,672 12,719 2,541 39,932Cash Plus Fund 6,162 1,326 1,157 8,645Flexi Balanced Fund 1,019 32 247 1,297Flexi Growth Fund 9,750 — 14,285 24,036Group Balanced Fund 6,903 5,099 2,213 14,215Group Capital Guarantee Balanced Fund 966 1 138 1,106Group Capital Guarantee Debt Fund 51 2,315 8,879 11,245Group Capital Guarantee Growth Fund 119 0 33 152Group Capital Guarantee Short Term Debt Fund 7,340 550 1,454 9,344Group Growth Fund 2,169 391 1,944 4,505Group Debt Fund 9,084 945 849 10,878Group Leave Encashment Balance Fund 295 — 31 326Group Leave Encashment Income Fund 4 — 1 4Group Leave Encashment Short Term Fund 25 — 2 27Group Short Term Debt Fund 25,895 2,294 1,881 30,070Health Saver Balancer Fund 2 — — 2Health Saver Flexi Balanced Fund 2 — — 2Health Saver Flexi Growth Fund 6 — — 6Health Saver Multiplier Fund 1 — — 1Health Saver Preserver Fund 0 — — 0 Health Saver Protector Fund 5 — — 5Health Saver Return Guarantee Fund — 76 — 76Health Saver Return Guarantee Fund II 1 49 — 50Health Saver Return Guarantee Fund III 3 3 — 7Invest Shield Life Fund 1,117 718 623 2,458Invest Shield Pension Fund 370 64 120 554Maximiser Fund 43,499 — 36,301 79,799Multiplier Fund 1,131 — 3,787 4,918New Invest Shield Balanced Fund 1,351 164 397 1,912Pension Balancer Fund 8,631 6,928 1,147 16,706Pension Flexi Balanced Fund 757 116 296 1,169Pension Flexi Growth Fund 5,615 — 13,483 19,098Pension Maximiser Fund 10,023 — 12,143 22,167Pension Multiplier Fund 1,220 — 1,885 3,105Pension Preserver Fund 443 — 152 595Pension Protector Fund 10,389 4,845 3,557 18,790Pension R.I.C.H. Fund 2,252 — 4,583 6,835Pension Return Guarantee Fund 205 3,065 — 3,270Pension Return Guarantee Fund II 57 1,862 — 1,919Pension Return Guarantee Fund III 205 161 — 365Preserver Fund 2,013 — 557 2,570Protector Fund 20,083 7,580 5,146 32,809R.I.C.H. Fund 1,597 — 2,920 4,517Return Guarantee Fund 42 768 — 811Return Guarantee Fund II 18 564 — 582Return Guarantee Fund III 67 42 — 108Secure Plus Fund 435 207 105 748Secure Plus Pension Fund 165 98 64 327
Total 206,159 52,982 122,920 382,062
For the year 2007-08: (Rs. ‘000)
Fund Name ICICI Bank Ltd. ICICI Securities Primary Dealership Ltd.
ICICI Home Finance Company Ltd. Total
Group Capital Guarantee Balanced Fund 599 57 — 657 Group Capital Guarantee Debt Fund 4 2 — 6 Group Capital Guarantee Short Term Debt Fund 3,887 70 10 3,967 Group Capital Guarantee Growth Fund 30 7 — 37 Group Balanced Fund 23,015 516 48 23,579 Group Debt Fund 3,221 281 13 3,515 Group Short Term Debt Fund 9,715 1,135 108 10,958 Group Growth Fund 5,152 231 5 5,388 Invest Shield Life Fund 2,534 166 10 2,710 Balancer Fund 111,868 586 201 112,655 Protector Fund 58,915 864 112 59,891 Maximiser Fund 2,306 415 — 2,721 Preserver Fund 5,218 163 — 5,382 New Invest Shield Balanced Fund 854 167 2 1,023 Invest Shield Pension Fund 557 34 1 592 Pension Balancer Fund 39,428 535 86 40,049 Pension Protector Fund 26,898 120 64 27,082 Pension Maximiser Fund 472 39 — 511 Pension Preserver Fund 366 20 — 386 Cash Plus Fund 4,834 265 18 5,118 Secure Plus Fund 759 56 3 817 Secure Plus Pension Fund 488 34 1 523 Flexi Balanced Fund 174 122 — 296 Flexi Growth Fund 2,355 286 — 2,641 Pension Flexi Balanced Fund 49 61 2 111 Pension Flexi Growth Fund 715 291 — 1,006
Total 304,410 6,524 685 311,619
ICICI PRU AR09_Final Pg29-197 (Ac).indd Sec1:134ICICI PRU AR09_Final Pg29-197 (Ac).indd Sec1:134 10/28/09 6:00:21 PM10/28/09 6:00:21 PM

I 135 I
ANNUAL REPORT 2008-09ICICI PRUDENTIAL LIFE INSURANCE
(h) Amortisation income: For the year 2008-09: (Rs. ‘000)
Fund Name ICICI Bank Ltd. ICICI Home Finance Company Ltd. Total
Flexi Balanced Fund 682 250 932
Flexi Growth Fund 42,956 1 42,957
Group Capital Guarantee Balanced Fund 370 349 719
Group Capital Guarantee Debt Fund 6 5 12
Group Capital Guarantee Short Term Debt Fund 4,018 2,966 6,984
Group Capital Guarantee Growth Fund 12 31 43
Group Balance Fund 7,374 2,697 10,071
Group Debt Fund 3,084 930 4,013
Group Short Term Debt Fund 10,837 5,136 15,973
Group Leave Encashment Balance Fund 14 228 241
Group Leave Encashment Income Fund 2 2 5
Group Leave Encashment Short Term Fund 55 38 93
Group Growth Fund 2,330 602 2,932
Health Saver Balancer Fund 0 — 0
Health Saver Protector Fund 2 — 2
Health Saver Flexi Balanced Fund 0 — 0
Health Saver Flexi Growth Fund 1 — 1
Health Saver Preserver Fund 0 — 0
Health Saver Multiplier Fund 0 — 0
Health Saver Return Guarantee Fund 3 — 3
Invest Shield Life Fund 1,081 475 1,556
Balancer Fund 25,934 7,810 33,744
Protector Fund 17,300 4,975 22,276
Maximiser Fund 14,694 0 14,694
Preserver Fund 7,380 1,947 9,327
New Invest Shield Balanced Fund 1,053 440 1,493
Pension Flexi Balanced Fund 529 148 678
Pension Flexi Growth Fund 560 0 560
Invest Shield Pension Fund 249 95 344
Pension Balancer Fund 8,456 2,808 11,264
Pension Protector Fund 8,945 2,386 11,331
Pension Maximiser Fund 12,917 — 12,917
Pension Multiplier Fund 1,059 — 1,059
Pension Preserver Fund 1,661 331 1,991
R.I.C.H. Fund 5,366 — 5,366
Cash Plus Fund 3,427 1,533 4,960
Secure Plus Fund 478 144 622
Secure Plus Pension Fund 224 64 287
TOTAL 183,056 36,390 219,447
For the year 2007-08: (Rs. ‘000)
Fund Name ICICI Bank Ltd.
Flexi Balanced Fund 114Group Capital Guarantee Balanced Fund 67Group Capital Guarantee Debt Fund 1Group Capital Guarantee Short Term Debt Fund 233Group Capital Guarantee Growth Fund 2Group Balanced Fund 1,365Group Debt Fund 490Group Short Term Debt Fund 997Group Growth Fund 379Invest Shield Life Fund 203Balancer Fund 4,525Protector Fund 2,426Maximiser Fund 1Preserver Fund 391New Invest Shield Balanced Fund 174Pension Flexi Balanced Fund 59Invest Shield Pension Fund 44Pension Balancer Fund 1,556Pension Protector Fund 1,279Pension Preserver Fund 38Cash Plus Fund 553Secure Plus Fund 98Secure Plus Pension Fund 45
Total 15,038
ICICI PRU AR09_Final Pg29-197 (Ac).indd Sec1:135ICICI PRU AR09_Final Pg29-197 (Ac).indd Sec1:135 10/28/09 6:00:21 PM10/28/09 6:00:21 PM

I 136 I
FINANCIAL REPORT
(i) Profit/ Loss on sale of investments: For the year 2008-09: (Rs. ‘000)
Fund Name ICICI Bank Ltd. ICICI Securities Primary Dealership Ltd . Total
Flexi Balanced Fund 2,398 -6 2,392
Group Capital Guarantee Balanced Fund 1,486 -20 1,466
Group Capital Guarantee Debt Fund 1,264 0 1,264
Group Capital Guarantee Growth Fund 128 -2 126
Group Balanced Fund 17,615 -236 17,379
Group Debt Fund 6,864 -105 6,759
Group Short Term Debt Fund 7 — 7
Group Leave Encashment Balance Fund 955 16 971
Group Growth Fund 4,852 -57 4,795
Invest Shield Life Fund 3,092 -54 3,038
Balancer Fund 52,185 -848 51,337
Protector Fund 42,381 -383 41,998
Maximiser Fund — 81 81
Preserver Fund 9 — 9
New Invest Shield Balanced Fund 3,476 -41 3,435
Pension Flexi Balanced Fund 1,645 -4 1,641
Invest Shield Pension Fund 868 -11 857
Pension Balancer Fund 21,259 -244 21,015
Pension Protector Fund 27,784 -184 27,600
Pension Preserver Fund 13 — 13
Cash Plus Fund 10,571 -128 10,443
Secure Plus Fund 1,323 -15 1,308
Secure Plus Pension Fund 565 -7 559
Total 200,741 -2,248 198,493
For the year 2007-08: (Rs. ‘000)
Fund Name ICICI Bank Ltd. ICICI Lombard General Insurance Co. Ltd .
ICICI Securities Primary Dealership Ltd .
ICICI Securities Ltd. Total
Group Capital Guarantee Balanced Fund — 2 19 — 21
Group Capital Guarantee Debt Fund 4 0 1 — 4
Group Capital Guarantee Growth Fund — 0 2 — 2
Group Balanced Fund — 36 443 — 479
Group Debt Fund — 6 108 1 115
Group Short Term Debt Fund 3,152 — 250 — 3,402
Group Growth Fund 64 6 22 — 91
Invest Shield Life Fund — 4 47 — 51
Balancer Fund 1,734 151 1,968 — 3,853
Protector Fund 450 78 2,126 4 2,658
Group Capital Guarantee Short Term Debt Fund — — 7 — 7
Preserver Fund — — 160 — 160
Cash Plus Fund — 9 196 1 206
New Invest Shield Balanced Fund — 3 78 1 81
Invest Shield Pension Fund — 1 10 — 11
Pension Balancer Fund 901 40 390 — 1,331
Pension Protector Fund 450 31 658 — 1,139
Pension Preserver Fund — — 9 — 9
Secure Plus Fund — 1 16 — 17
Secure Plus Pension Fund — 1 7 — 8
Flexi Balanced Fund — 1 63 1 64
Pension Flexi Balanced Fund — — 18 1 19
Total 6,755 370 6,597 7 13,729
ICICI PRU AR09_Final Pg29-197 (Ac).indd Sec1:136ICICI PRU AR09_Final Pg29-197 (Ac).indd Sec1:136 10/28/09 6:00:21 PM10/28/09 6:00:21 PM

I 137 I
ANNUAL REPORT 2008-09ICICI PRUDENTIAL LIFE INSURANCE
(ii) Company-wise details of investments held in the Promoter Group: For the year 2008-09: (Rs. ‘000)
Fund Name ICICI Bank Ltd.
% to NAV
ICICI Securities Primary
Dealership Ltd.
% to NAV
ICICI Home Finance Company Ltd.
% to NAV
First Source Solutions Ltd.
% to NAV Total
Balancer Fund 776,426 3.58% — — 118,302 0.55% — — 894,728Cash Plus Fund 125,385 3.63% — — 36,693 1.06% — — 162,078Flexi Balanced Fund 33,040 2.44% — — 4,110 0.30% 1,386 0.10% 38,535Flexi Growth Fund 158,816 0.50% — — — — 47,841 0.15% 206,657Group Balanced Fund 125,665 2.14% 20,642 0.35% 93,480 1.59% — — 239,787Group Debt Fund — — — — 23,678 0.70% — — 23,678Group Short Term Debt Fund 388,493 7.22% — — 41,568 0.77% — — 430,061Group Capital Guarantee Balanced Fund 33,741 5.21% — — 5,288 0.82% 146 0.02% 39,176Group Capital Guarantee Debt Fund — — 168,827 8.44% 50,770 2.54% — — 219,597Group Capital Guarantee Growth Fund 1,741 2.83% 275 0.45% 469 0.76% 91 0.15% 2,576Group Capital Guarantee Short Term Debt Fund 268,835 8.59% — — 25,039 0.80% — — 293,875Group Leave Encashment Balance Fund 20,774 6.87% — — 3,452 1.14% — — 24,226Group Leave Encashment Income Fund 14 2.22% — — — — — — 14Group Leave Encashment Short Term Fund 1,351 2.83% — — 373 0.78% — — 1,724Group Growth Fund 6,176 0.27% 8,631 0.37% 13,090 0.57% 1,461 0.06% 29,358Health Saver Balancer Fund 234 6.25% — — — — — — 234Health Saver Flexi Balanced Fund 173 5.22% — — — — — — 173Health Saver Flexi Growth Fund 4,000 5.62% — — — — — — 4,000Health Saver Preserver Fund 37 2.89% — — — — — — 37Health Saver Protector Fund 1,295 6.33% — — — — — — 1,295Health Saver Return Guarantee Fund — — — — 4,484 7.60% — — 4,484Health Saver Return Guarantee Fund II — — — — 4,649 7.00% — — 4,649Health Saver Return Guarantee Fund III 150 0.23% — — 382 0.58% — — 532Invest Shield Life Fund 30,648 2.70% 6,153 0.54% 14,481 1.28% 2,210 0.19% 53,492Invest Shield Pension 5,983 2.65% — — 2,094 0.93% 454 0.20% 8,530Maximiser Fund 500,098 0.66% — — — — — — 500,098New Invest Shield Balanced Fund 48,538 3.36% — — 8,327 0.58% 2,570 0.18% 59,435Pension Balancer Fund 302,152 3.27% — — 115,531 1.25% 4,841 0.05% 422,523Pension Flexi Balanced Fund 18,189 1.93% — — 3,424 0.36% 855 0.09% 22,468Pension Flexi Growth Fund — — — — — — 39,338 0.17% 39,338Pension Maximiser Fund 267,575 1.24% — — — — 24,848 0.12% 292,422Pension Preserver Fund 27,980 2.78% — — 2,142 0.21% — — 30,122Pension Protector Fund 690,724 7.94% — — 83,476 0.96% — — 774,200Pension R.I.C.H. Fund 62,152 0.55% 300,000 2.66% — — — — 362,152Pension Return Guarantee Fund — — — — 148,757 6.95% — — 148,757Pension Return Guarantee Fund II — — — — 174,796 8.77% — — 174,796Pension Return Guarantee Fund III — — — — 19,720 0.95% — — 19,720Preserver Fund 132,299 4.57% — — 15,635 0.54% — — 147,934Protector Fund 486,140 3.29% — — 128,067 0.87% — — 614,207R.I.C.H. Fund — — 200,000 2.82% — — — — 200,000Return Guarantee Fund — — — — 37,396 5.65% — — 37,396Return Guarantee Fund II — — — — 52,684 7.31% — — 52,684Return Guarantee Fund III 15,000 2.02% — — 5,093 0.68% — — 20,093Secure Plus Fund 11,108 4.04% — — 4,283 1.56% — — 15,391Secure Plus Pension Fund 2,920 2.37% — — 1,961 1.59% — — 4,881
Total 4,547,851 704,527 1,243,693 126,041 6,622,112
% to Total Funds under Management in ULIP 1.59% 0.25% 0.43% 0.04% 2.31%
For the year 2007-08: (Rs. ‘000)
Fund Name ICICI Bank Ltd.
% to NAV
ICICI Securities Primary
Dealership Ltd.
% to NAV
ICICI Home Finance Company Ltd.
% to NAV
First Source Solutions Ltd.
% to NAV Total
Flexi Balanced Fund 23,622 2.54% 4,405 0.47% 322 0.03% 3,868 0.42% 32,217 Group Capital Guarantee Balanced Fund 13,015 5.06% 2,188 0.85% 294 0.11% 347 0.13% 15,843 Group Capital Guarantee Debt Fund 256 6.21% 90 2.19% 26 0.64% — — 372 Group Capital Guarantee Short Term Debt Fund 44,514 4.22% 2,763 0.26% 7,422 0.70% — — 54,700 Group Capital Guarantee Growth Fund 481 3.42% 271 1.92% 67 0.47% 70 0.49% 889 Group Balanced Fund 275,210 4.74% 20,340 0.35% 35,158 0.61% — — 330,708 Group Debt Fund 97,459 6.25% 10,605 0.68% 9,572 0.61% — — 117,636 Group Short Term Debt Fund 391,353 6.70% 44,835 0.77% 79,995 1.37% — — 516,183 Group Growth Fund 75,152 2.59% 8,505 0.29% 3,962 0.14% 3,461 0.12% 91,079 Invest Shield Life Fund 40,326 4.32% 6,532 0.70% 7,270 0.78% 5,236 0.56% 59,365 Balancer Fund 903,282 3.80% 23,156 0.10% 148,486 0.63% — — 1,074,924 Protector Fund 536,341 5.77% 33,845 0.36% 82,872 0.89% — — 653,059 Maximiser Fund 214 0.00% — — — — — — 214 Preserver Fund 74,702 5.52% — — — — — — 74,702 Pension Maximiser Fund — — — — — — 58,863 0.25% 58,863 New Invest Shield Balanced Fund 35,318 3.75% 6,593 0.70% 1,658 0.18% 6,088 0.65% 49,656 Pension Flexi Balanced Fund 12,581 2.41% 2,184 0.42% 1,174 0.23% 2,026 0.39% 17,965 Invest Shield Pension Fund 9,270 4.84% 1,304 0.68% 648 0.34% 1,075 0.56% 12,297 Pension Balancer Fund 310,067 3.77% 15,311 0.19% 63,706 0.77% 11,468 0.14% 400,551 Pension Protector Fund 238,981 6.09% 4,659 0.12% 47,215 1.20% — — 290,854 Pension Preserver Fund 7,472 4.75% — — — — — — 7,472 Cash Plus Fund 111,483 5.77% 10,429 0.54% 13,430 0.70% — — 135,342 Secure Plus Fund 15,878 7.63% 2,191 1.05% 2,097 1.01% — — 20,166 Secure Plus Pension Fund 7,323 7.56% 1,332 1.37% 992 1.02% — — 9,647 Flexi Growth Fund — — — — — — 113,331 0.41% 113,331 Pension Flexi Growth Fund — — — — — — 93,190 0.54% 93,190
Total 3,224,298 108% 201,537 14.02% 506,368 12.43% 299,022 4.66% 4,231,226
% to Total Funds under Management in ULIP 1.30% 0.08% 0.20% 0.12% 1.70%
ICICI PRU AR09_Final Pg29-197 (Ac).indd Sec1:137ICICI PRU AR09_Final Pg29-197 (Ac).indd Sec1:137 10/28/09 6:00:21 PM10/28/09 6:00:21 PM

I 138 I
FINANCIAL REPORT
5. Unclaimed redemptions of units: (Rs. ‘000)
Scheme NameUnits Value* Units Value*
2008-09 2007-08
Balancer 716 15,535 1,926 43,473 Flexi Balanced 4 38 4 46 Flexi Growth 146 1,174 156 2,082 Maximiser 224 4,446 625 26,578 Maximiser Fund Growth 265 7,008 — —Multiplier 35 220 55 514 Pension Multiplier 7 45 — —Preserver 27 390 21 275 Protector 302 4,848 781 17,434
* At NAV as at year end
6. Net Asset Value (NAV) : Highest, Lowest and Closing during the year : For the year 2008-09: (Per unit)
Scheme Name Highest Lowest Closing
Balancer Fund 28.00 22.98 24.67Protector Fund 18.47 16.29 17.90Maximiser Fund 59.69 31.29 36.21Preserver Fund 14.27 12.93 14.27Multiplier Fund 9.19 4.86 5.72Multiplier Fund II 10.15 5.40 6.36Multiplier Fund III 10.10 5.35 6.31Multiplier Fund IV 10.10 5.37 6.34R.I.C.H. Fund 11.42 6.50 7.52R.I.C.H. Fund II 11.45 6.56 7.59R.I.C.H. Fund III 11.41 6.52 7.54R.I.C.H. Fund IV 11.43 6.56 7.58Balancer Fund II 18.30 15.13 16.33Protector Fund II 13.95 12.22 13.55Maximiser Fund II 32.45 17.16 19.86Balancer Fund III 12.95 10.62 11.41Protector Fund III 13.05 11.49 12.64Maximiser Fund III 15.09 7.92 9.16Preserver Fund III 12.90 11.70 12.90Balancer Fund IV 11.02 9.11 9.83Protector Fund IV 12.01 10.51 11.66Maximiser Fund IV 11.56 6.10 7.07Preserver Fund IV 11.53 10.46 11.53Pension Balancer Fund 26.38 21.64 23.76Pension Protector Fund 16.57 14.67 16.11Pension Maximiser Fund 59.80 30.78 35.75Pension Preserver Fund 14.22 12.87 14.22Pension Balancer Fund II 18.82 15.54 17.18Pension Protector Fund II 13.93 12.23 13.57Pension Maximiser Fund II 33.86 17.55 20.40Pension Multiplier Fund 10.26 5.40 6.27Pension Multiplier Fund II 10.25 5.43 6.35Pension R.I.C.H. Fund 11.38 6.40 7.43Pension R.I.C.H. Fund II 11.39 6.44 7.48Group Balanced Fund 18.57 16.57 17.90Group Debt Fund 15.31 13.39 15.07Group Short Term Debt Fund 14.55 13.42 14.55Group Growth Fund 24.86 18.08 19.88Group Capital Guarantee Balanced Fund 13.28 12.02 12.85Group Capital Guarantee Debt Fund 14.09 11.84 13.97Group Capital Guarantee Growth Fund 12.05 9.92 10.50Group Leave Encashment Balance Fund 10.68 9.63 10.33Group Leave Encashment Short Term Fund 10.94 10.00 10.94Group Leave Encashment Income Fund 11.27 10.00 11.19Group Capital Guarantee Short Term Debt Fund II 12.05 11.05 12.05Group Capital Guarantee Balanced Fund II 11.87 10.73 11.50Group Capital Guarantee Debt Fund II 13.11 11.00 13.01Group Capital Guarantee Growth Fund II 11.04 9.10 9.66Group Capital Guarantee Short Term Debt Fund 14.04 12.83 14.04Group Return Guarantee Fund 10.28 9.96 10.28Group Return Guarantee Fund II 10.00 10.00 10.00Invest Shield Cash Fund 13.93 12.19 13.53Invest Shield Life Fund 15.34 13.31 14.53Invest Shield Pension Fund 15.37 13.34 14.54New Invest Shield Balanced Fund 13.08 10.70 11.78Cash Plus Fund 14.58 12.80 14.15Secure Plus Fund 14.42 12.68 14.00Secure Plus Pension Fund 14.18 12.43 13.78Flexi Growth Fund 13.11 7.15 8.28Flexi Growth Fund II 13.22 7.24 8.39Flexi Growth Fund III 13.06 7.13 8.26Flexi Growth Fund IV 11.28 6.19 7.17Pension Flexi Growth Fund 12.94 6.91 7.96Pension Flexi Growth Fund II 13.05 7.02 8.09Flexi Balanced Fund 11.91 8.64 9.66Flexi Balanced Fund II 12.12 8.90 10.00Flexi Balanced Fund III 11.79 8.59 9.61Flexi Balanced Fund IV 10.81 7.92 8.88Pension Flexi Balanced Fund 12.51 9.11 10.15
ICICI PRU AR09_Final Pg29-197 (Ac).indd Sec1:138ICICI PRU AR09_Final Pg29-197 (Ac).indd Sec1:138 10/28/09 6:00:22 PM10/28/09 6:00:22 PM

I 139 I
ANNUAL REPORT 2008-09ICICI PRUDENTIAL LIFE INSURANCE
Scheme Name Highest Lowest Closing
Pension Flexi Balanced Fund II 12.43 9.10 10.20Health Saver Balancer Fund 10.27 9.78 10.23Health Saver Protector Fund 10.28 10.00 10.28Health Saver Flexi Balanced Fund 10.40 9.59 10.34Health Saver Flexi Growth Fund 10.86 9.24 10.70Health Saver Multiplier Fund 10.71 9.23 10.54Health Saver Preserver Fund 10.20 10.00 10.20Return Guarantee Fund 10.57 10.00 10.57Return Guarantee Fund II 10.28 9.99 10.28Pension Return Guarantee Fund 10.58 10.00 10.58Pension Return Guarantee Fund II 10.28 9.98 10.28Health Saver Return Guarantee Fund 10.23 9.94 10.23Health Saver Return Guarantee Fund II 10.26 9.97 10.26Return Guarantee Fund III 10.14 9.95 10.14Pension Return Guarantee Fund III 10.14 9.94 10.14Health Saver Return Guarantee Fund III 10.14 9.95 10.14Return Guarantee Fund IV 10.00 10.00 10.00Pension Return Guarantee Fund IV 10.00 10.00 10.00Health Saver Return Guarantee Fund IV 10.00 10.00 10.00
For the year 2007-08: (Per unit)
Scheme Name Highest Lowest Closing
Balancer Fund 29.49 22.82 27.03Protector Fund 16.42 14.96 16.31Maximiser Fund 69.57 42.37 54.76Preserver Fund 12.93 11.84 12.93Multiplier Fund 10.81 7.91 8.32Pension Multiplier Fund 10.05 8.85 9.30Multiplier Fund II 10.13 8.71 9.16Pension Multiplier Fund II 10.05 8.83 9.28Multiplier Fund III 10.13 8.69 9.14Multiplier Fund IV 10.13 8.68 9.13R.I.C.H. Fund 10.68 10.00 10.56R.I.C.H. Fund II 10.69 10.00 10.57R.I.C.H. Fund III 10.70 10.00 10.58R.I.C.H. Fund IV 10.69 10.00 10.57Pension R.I.C.H. Fund 10.61 10.00 10.47Pension R.I.C.H. Fund II 10.60 10.00 10.48Balancer Fund II 19.18 14.72 17.64Protector Fund II 12.29 11.13 12.23Maximiser Fund II 37.73 22.86 29.76Balancer Fund III 13.66 10.60 12.49Protector Fund III 11.58 10.55 11.51Maximiser Fund III 17.59 10.74 13.85Preserver Fund III 11.70 10.73 11.70Balancer Fund IV 11.67 10.00 10.62Protector Fund IV 10.58 9.99 10.55Maximiser Fund IV 13.47 9.90 10.61Preserver Fund IV 10.46 10.00 10.46Pension Balancer Fund 27.68 21.64 25.46Pension Protector Fund 14.75 13.43 14.67Pension Maximiser Fund 69.68 42.70 54.99Pension Preserver Fund 12.86 11.78 12.86Pension Balancer Fund II 19.67 15.23 18.15Pension Protector Fund II 12.27 11.13 12.23Pension Maximiser Fund II 39.35 23.94 31.10Group Balanced Fund 18.22 15.28 17.53Group Debt Fund 13.52 12.27 13.42Group Short Term Debt Fund 13.42 12.25 13.42Group Growth Fund 26.69 19.15 23.65Group Capital Guarantee Balanced Fund 13.18 11.35 12.70Group Capital Guarantee Debt Fund 11.93 10.83 11.86Group Capital Guarantee Growth Fund 12.79 10.16 11.80Group Capital Guarantee Short Term Debt Fund II 11.04 10.06 11.04Group Capital Guarantee Balanced Fund II 11.73 10.05 11.31Group Capital Guarantee Debt Fund II 11.08 10.04 11.02Group Capital Guarantee Growth Fund II 11.70 9.86 10.80Group Capital Guarantee Short Term Debt Fund 12.82 11.66 12.82Invest Shield Cash Fund 12.30 11.19 12.25Invest Shield Life Fund 16.01 13.09 15.05Invest Shield Pension Fund 16.12 13.13 15.12New Invest Shield Balanced Fund 13.90 10.86 12.79Cash Plus Fund 12.88 11.71 12.81Secure Plus Fund 12.79 11.60 12.70Secure Plus Pension Fund 12.51 11.36 12.44Flexi Growth Fund 16.08 9.76 12.58Flexi Growth Fund II 16.18 9.78 12.69Flexi Growth Fund III 16.02 9.76 12.55Flexi Growth Fund IV 13.80 9.87 10.82Pension Flexi Growth Fund 16.39 9.87 12.45Pension Flexi Growth Fund II 16.24 9.75 12.55Flexi Balanced Fund 13.55 9.92 11.64Flexi Balanced Fund II 13.76 9.93 11.83Flexi Balanced Fund III 13.45 9.90 11.53Flexi Balanced Fund IV 12.27 10.00 10.55Pension Flexi Balanced Fund 14.20 10.07 12.32Pension Flexi Balanced Fund II 14.04 9.93 12.22
ICICI PRU AR09_Final Pg29-197 (Ac).indd Sec1:139ICICI PRU AR09_Final Pg29-197 (Ac).indd Sec1:139 10/28/09 6:00:22 PM10/28/09 6:00:22 PM

I 140 I
FINANCIAL REPORT
7. Expenses & gross income charged to Fund (%) Annualized expense ratio & gross income ratio (including unrealized gains) to average daily net assets of
the Fund For the year 2008-09:
Scheme Name Expenses Ratio (%) Gross Income Ratio (%)
Balancer Fund 2.11 -6.82Protector Fund 1.36 11.67Maximiser Fund 2.24 -39.46Cash Plus Fund 1.30 11.62Secure Plus Fund 1.30 11.31Preserver Fund 0.80 10.70Invest Shield Life Fund 1.31 -1.87New Invest Shield Balanced Fund 1.30 -5.70Flexi Growth Fund 2.10 -38.82Flexi Balanced Fund 1.97 -14.81R.I.C.H. Fund 1.99 -33.29Multiplier Fund 2.26 -27.08Pension Balancer Fund 1.50 -4.09Pension Protector Fund 1.30 11.86Pension Maximiser Fund 1.68 -39.75Secure Plus Pension Fund 1.31 11.59Pension Preserver Fund 0.79 11.09Invest Shield Pension Fund 1.31 -2.26Pension Flexi Growth Fund 1.77 -39.37Pension Flexi Balanced Fund 1.27 -14.87Pension R.I.C.H. Fund 1.92 -34.61Pension Multiplier Fund 2.03 -34.79Group Balanced Fund 1.35 3.22Group Debt Fund 1.38 11.43Group Short Term Debt Fund 1.37 9.41Group Capital Guarantee Short Term Debt Fund 1.54 10.89Group Capital Guarantee Balanced Fund 1.96 4.57Group Capital Guarantee Debt Fund 1.70 27.88Group Growth Fund 1.33 -16.25Group Capital Guarantee Growth Fund 2.33 -7.71Group Leave Encashment Balance Fund 1.35 4.81Group Leave Encashment Income Fund 1.32 7.80Group Leave Encashment Short Term Fund 1.36 10.36Group Return Guarantee Fund 0.25 3.05Group Return Guarantee Fund II 0.00 0.00Health Saver Balancer Fund 0.20 5.05Health Saver Protector Fund 0.16 3.13Health Saver Flexi Balanced Fund 0.23 6.98Health Saver Flexi Growth Fund 0.32 14.39Health Saver Preserver Fund 0.26 2.06Health Saver Multiplier Fund 0.33 12.64Health Saver Return Guarantee Fund 0.32 2.58Health Saver Return Guarantee Fund II 0.27 3.27Health Saver Return Guarantee Fund III 0.14 2.40Health Saver Return Guarantee Fund IV 0.00 0.00Pension Return Guarantee Fund 0.45 3.94Pension Return Guarantee Fund II 0.28 3.50Pension Return Guarantee Fund III 0.14 2.25Pension Return Guarantee Fund IV 0.00 0.00Return Guarantee Fund 0.44 3.80Return Guarantee Fund II 0.28 3.39Return Guarantee Fund III 0.14 2.41Return Guarantee Fund IV 0.00 0.00
For the year 2007-08:
Scheme Name Expenses Ratio (%) Gross Income Ratio (%)
Balancer Fund 1.94 17.28Protector Fund 1.27 10.47Maximiser Fund 2.03 18.99Cash Plus Fund 1.18 9.66Secure Plus Fund 1.18 9.98Preserver Fund 0.71 9.57Invest Shield Life Fund 1.19 12.58New Invest Shield Balanced Fund 1.17 12.37Flexi Growth Fund 1.93 2.92Flexi Balanced Fund 1.77 8.9R.I.C.H. Fund 0.08 7.01Multiplier Fund 0.74 -24.11Pension Balancer Fund 1.46 16.33Pension Protector Fund 1.28 10.29Pension Maximiser Fund 1.61 15.14Secure Plus Pension Fund 1.19 10.15Pension Preserver Fund 0.7 9.64Invest Shield Pension Fund 1.2 12.67Pension Flexi Growth Fund 1.51 -11.83Pension Flexi Balanced Fund 1.02 8.14Pension R.I.C.H. Fund 0.07 6.05Pension Multiplier Fund 0.18 -6.38Group Balanced Fund 1.26 14.2Group Debt Fund 1.23 9.29Group Short Term Debt Fund 1.24 10.25Group Capital Guarantee Short Term Debt Fund 1.22 10.35Group Capital Guarantee Balanced Fund 2.06 12.25Group Capital Guarantee Debt Fund 1.58 10.64Group Growth Fund 1.22 14.88Group Capital Guarantee Growth Fund 2.56 14.83
ICICI PRU AR09_Final Pg29-197 (Ac).indd Sec1:140ICICI PRU AR09_Final Pg29-197 (Ac).indd Sec1:140 10/28/09 6:00:22 PM10/28/09 6:00:22 PM

I 141 I
ANNUAL REPORT 2008-09ICICI PRUDENTIAL LIFE INSURANCE
8. Provision for doubtful debts on assets of the respective funds: 2008-09: Nil 2007-08: Nil
9. Fund-wise disclosure of appreciation and/or depreciation in value of investments segregated class-wise For the year 2008-09: (Rs. ‘000)
Scheme Name Equity Government Securities
Debentures and other securities Total
Flexi Balanced Fund (106,077) (3,861) 8,265 (101,673)Flexi Growth Fund (8,819,412) — — (8,819,412)Group Capital Guarantee Balanced Fund (6,539) (2,608) 4,101 (5,046)Group Capital Guarantee Debt Fund — — 154,634 154,634Group Capital Guarantee Short Term Debt Fund — — 21,367 21,367Group Capital Guarantee Growth Fund (3,926) (155) 319 (3,763)Group Balanced Fund (137,337) (30,376) 75,521 (92,192)Group Debt Fund — (12,442) 45,358 32,916Group Short Term Debt Fund — — 26,784 26,784Group Leave Encashment Balance Fund (9,037) (1,343) 3,096 (7,284)Group Leave Encashment Income Fund — (1) 7 6Group Leave Encashment Short Term Fund — — 53 53Group Return Guarantee Fund — — 30,002 30,002Group Growth Fund (240,312) (6,904) 16,436 (230,781)Health Saver Balancer Fund 48 (2) 4 49Health Saver Protector Fund — (14) 56 42Health Saver Flexi Balanced Fund 70 (2) 3 70Health Saver Flexi Growth Fund 3,569 — 1 3,570Health Saver Preserver Fund — — 0 0Health Saver Multiplier Fund 519 — 0 519Health Saver Return Guarantee Fund — — 316 316Health Saver Return Guarantee Fund II — — 721 721Health Saver Return Guarantee Fund III — — 452 452Invest Shield Life Fund (26,953) (4,512) 10,245 (21,220)Balancer Fund (722,451) (85,491) 183,444 (624,499)Protector Fund — (70,574) 165,140 94,566Maximiser Fund (11,611,365) (2,440) 3,250 (11,610,555)Preserver Fund — — 11,791 11,791Multiplier Fund (1,607,882) — 2,420 (1,605,462)New Invest Shield Balanced Fund (64,488) (5,155) 9,649 (59,994)Pension R.I.C.H. Fund (2,144,419) — — (2,144,419)Pension Flexi Balanced Fund (77,591) (2,819) 4,624 (75,786)Pension Flexi Growth Fund (5,543,596) — 1 (5,543,595)Invest Shield Pension Fund (8,501) (897) 1,887 (7,511)Pension Balancer Fund (129,826) (34,141) 80,447 (83,520)Pension Protector Fund — (42,569) 88,095 45,526Pension Maximiser Fund (3,957,049) — (1,783) (3,958,832)Pension Multiplier Fund (706,136) — — (706,136)Pension Return Guarantee Fund — — 24,372 24,372Pension Return Guarantee Fund II — — 27,269 27,269Pension Return Guarantee Fund III — — 15,903 15,903Pension Preserver Fund — — 3,371 3,371Return Guarantee Fund — — 6,251 6,251Return Guarantee Fund II — — 8,570 8,570Return Guarantee Fund III — — 4,764 4,764R.I.C.H. Fund (1,210,416) — — (1,210,416)Cash Plus Fund — (17,963) 43,473 25,510Secure Plus Fund 205 (1,028) 3,077 2,254Secure Plus Pension Fund — (441) 1,280 840
For the year 2007-08: (Rs. ‘000)
Scheme Name Equity Government Security
Debentures and other securities Total
Flexi Balanced Fund 240 (1,583) 1,021 (322)Flexi Growth Fund (687,995) — 1743 (686,252)Group Capital Guarantee Balanced Fund 13,808 (848) 519 13,479Group Capital Guarantee Debt Fund — (12) 8 (4)Group Capital Guarantee Short Term Debt Fund — — 562 562Group Capital Guarantee Growth Fund 343 (22) 31 352Group Balanced Fund 165,707 (19,185) 7,023 153,545Group Debt Fund — (7,498) 1,854 (5,644)Group Short Term Debt Fund — — 3,564 3,564Group Growth Fund 145,003 (5,670) 892 140,225Invest Shield Life Fund 51,865 (1,932) 1130 51,063Balancer Fund 2,700,898 (68,735) 32,731 2,664,895Protector Fund — (29,219) 13,419 (15,801)Maximiser Fund 15,562,276 — 3,388 15,565,665Preserver Fund — — 47 47Multiplier Fund (616,517) — — (616,517)New Invest Shield Balanced Fund 29,577 (1,661) 900 28,816Pension Flexi Balanced Fund 399 (930) 398 (133)Pension Flexi Growth Fund (1,219,858) — 1,005 (1,218,854)Invest Shield Pension Fund 10,363 (410) 296 10,249Pension Balancer Fund 773,560 (23,542) 11,893 761,912Pension Protector Fund — (15,598) 4,837 (10,761Pension Maximiser Fund 2,577,270 — 574 2,577,844Pension Multiplier Fund (108,986) — — (108,986)Pension Preserver Fund — — 7 7Pension R.I.C.H. Fund 70,052 — — 70,052R.I.C.H. Fund 37,560 — — 37,560Cash Plus Fund — (7,708) 3,948 (3,760)Secure Plus Fund 534 (900) 309 (58)Secure Plus Pension Fund — (407) 176 (231)
ICICI PRU AR09_Final Pg29-197 (Ac).indd Sec1:141ICICI PRU AR09_Final Pg29-197 (Ac).indd Sec1:141 10/28/09 6:00:22 PM10/28/09 6:00:22 PM

I 142 I
FINANCIAL REPORT
10. Industry wise disclosure of investments (with exposure of 10% and above) Flexi Balanced Fund (2008-2009)
Industry Security nameMarket Value
(Rs. ‘000)% of NAV
Banking services HDFC Bank 45,618 3.36%State Bank of India 38,443 2.83%ICICI Bank 2010 22,546 1.66%9.85% HDFC Bank 2019 20,562 1.52%Axis Bank 12,026 0.89%Bank of India 2010 11,027 0.81%IDBI Bank 2010 11,000 0.81%State Bank of Patiala 2010 10,929 0.81%Punjab National Bank 2010 10,890 0.80%8.70% ICICI Bank 2010 10,494 0.77%11.11% State Bank of India 2009 9,424 0.69%10.85% HDFC Bank 2018 8,745 0.64%11.55% State Bank of Patiala 2009 7,128 0.53%9.95% Axis Bank 2019 6,916 0.51%Punjab National Bank 2009 6,136 0.45%Bank of India 2009 5,740 0.42%Allahabad Bank 2009 5,725 0.42%Andhra Bank 2009 5,652 0.42%Punjab National Bank 4,485 0.33%10.10% Axis Bank 2017 3,476 0.26%Union Bank of India 3,407 0.25%Oriental Bank of Commerce 2009 3,264 0.24%Bank of Baroda 2010 2,796 0.21%UCO Bank 2010 2,749 0.20%ABN Amro Bank 2009 2,161 0.16%Axis Bank 2009 2,145 0.16%8.90% State Bank of India 2018 1,812 0.13%10.43% Axis Bank 2009 1,519 0.11%9.90% Canara Bank 2010 524 0.04%8.47% IDBI Bank 2011 193 0.01%
Banking services Total 277,532 20.47%
Others 1,010,359 74.50%Net Current Assets 68,232 5.03%
Grand Total 1,356,123 100.00%
Flexi Balanced Fund (2007-2008)
Industry Security name Market Value (Rs. ‘000) % of NAV
Banking services 9.50% State Bank of Patiala 2008 28,000 3.01%Axis Bank 23,759 2.56%Union Bank of India 2008 15,476 1.66%HDFC Bank 15,396 1.66%ICICI Bank 2009 13,983 1.50%State Bank of India 13,964 1.50%9.40% Yes Bank 2008 12,500 1.34%10.10% State Bank of India 2022 10,371 1.12%10.50% Axis Bank 2008 9,000 0.97%10.30% ICICI Bank 2009 8,021 0.86%Punjab National Bank 2009 6,794 0.73%Punjab National Bank 4,837 0.52%10.20% State Bank of India 2022 4,345 0.47%9.90% IDBI Bank 2009 3,815 0.41%10.10% Axis Bank 2017 3,585 0.39%Canara Bank 2008 3,360 0.36%10.50% Axis Bank 2009 3,344 0.36%10.43% Axis Bank 2009 3,041 0.33%9.35% Punjab National Bank 2023 1,977 0.21%10.00% ICICI Bank 2017 1,618 0.17%IDBI Bank 2009 981 0.11%9.78% State Bank of Bikaner and Jaipur 2022 865 0.09%Citibank 2008 827 0.09%9.90% State Bank of Patiala 2022 820 0.09%9.90% Canara Bank 2010 524 0.06%9.90% Canara Bank 2009 509 0.05%9.35% Punjab National Bank 2022 344 0.04%8.47% IDBI Bank 2013 187 0.02%
Banking services Total 192,243 20.68%
Others 724,389 77.92%Net Current Assets 13,030 1.40%
Grand Total 929,662 100.00%
ICICI PRU AR09_Final Pg29-197 (Ac).indd Sec1:142ICICI PRU AR09_Final Pg29-197 (Ac).indd Sec1:142 10/28/09 6:00:23 PM10/28/09 6:00:23 PM

I 143 I
ANNUAL REPORT 2008-09ICICI PRUDENTIAL LIFE INSURANCE
Flexi Growth Fund (2008-2009)
Industry Security name Market Value (Rs. ‘000) % of NAV
Banking services HDFC Bank 2,514,697 7.84%State Bank of India 2,050,338 6.39%Axis Bank 879,040 2.74%Punjab National Bank 493,896 1.54%Syndicate Bank 2009 193,134 0.60%8.70% ICICI Bank 2010 158,816 0.50%
Banking services Total 6,289,921 19.62%
Prime movers Bharat Heavy Electricals Limited 2,783,276 8.68%Cummins India Limited 455,915 1.42%
Prime movers Total 3,239,191 10.10%
Others 22,042,062 68.74%
Net Current Assets 495,133 1.54%
Grand Total 32,066,307 100.00%
Flexi Growth Fund (2007-2008)
Industry Security name Market Value (Rs. ‘000) % of NAV
Banking services HDFC Bank 1,564,522 5.67%Axis Bank 1,321,754 4.79%State Bank of India 802,311 2.91%Punjab National Bank 332,175 1.20%IDBI Bank 2008 247,159 0.90%Union Bank of India 2008 105,024 0.38%9.50% State Bank of Patiala 2008 9,400 0.03%Kotak Mahindra Bank 2008 8,758 0.03%
Banking services Total 4,391,103 15.93%
Others 22,779,414 82.62%Net Current Assets 401,619 1.46%
Grand Total 27,572,136 100.00%
Group Capital Guarantee Balanced Fund (2008-2009)
Industry Security name Market Value (Rs. ‘000) % of NAV
Banking services 8.50% IDBI Bank 2010 50,000 7.71%8.75% Canara Bank 2010 30,590 4.72%8.70% ICICI Bank 2010 19,689 3.04%ICICI Bank 2010 14,052 2.17%11.55% State Bank of Patiala 2009 9,954 1.54%10.43% Axis Bank 2009 7,746 1.19%State Bank of Patiala 2010 7,118 1.10%Punjab National Bank 2010 7,093 1.09%Bank of India 2010 7,083 1.09%IDBI Bank 2010 7,066 1.09%11.11% State Bank of India 2009 6,486 1.00%HDFC Bank 6,095 0.94%State Bank of India 5,770 0.89%10.85% HDFC Bank 2018 5,284 0.82%9.95% Axis Bank 2019 4,431 0.68%Bank of India 2009 3,687 0.57%Andhra Bank 2009 3,681 0.57%Allahabad Bank 2009 3,677 0.57%Punjab National Bank 2,179 0.34%Axis Bank 2,171 0.33%Oriental Bank of Commerce 2009 2,096 0.32%9.90% Canara Bank 2010 2,096 0.32%Bank of Baroda 2010 1,796 0.28%UCO Bank 2010 1,766 0.27%ABN Amro Bank 2009 1,558 0.24%8.90% State Bank of India 2018 1,323 0.20%Oriental Bank of Commerce 1,101 0.17%Axis Bank 2009 273 0.04%8.47% IDBI Bank 2011 252 0.04%
Banking services Total 216,113 33.34%
Others 407,380 62.84%Net Current Assets 24,753 3.82%
Grand Total 648,246 100.00%
ICICI PRU AR09_Final Pg29-197 (Ac).indd Sec1:143ICICI PRU AR09_Final Pg29-197 (Ac).indd Sec1:143 10/28/09 6:00:23 PM10/28/09 6:00:23 PM

I 144 I
FINANCIAL REPORT
Group Capital Guarantee Balanced Fund (2007-2008)
Industry Security name Market Value (Rs. ‘000) % of NAV
Banking services ICICI Bank 2009 8,119 3.16%10.10% State Bank of India 2022 5,495 2.14%10.30% ICICI Bank 2009 4,375 1.70%Punjab National Bank 2009 3,790 1.47%Union Bank of India 2008 3,517 1.37%Kotak Mahindra Bank 2008 3,229 1.25%Canara Bank 2008 2,880 1.12%Axis Bank 2,712 1.05%8.40% Axis Bank 2008 2,442 0.95%State Bank of India 2,218 0.86%9.90% IDBI Bank 2009 2,037 0.79%10.20% State Bank of India 2022 1,929 0.75%11.06% Canara Bank 2009 1,890 0.73%10.50% Axis Bank 2008 1,800 0.70%11.10% Canara Bank 2009 1,760 0.68%10.43% Axis Bank 2009 1,746 0.68%HDFC Bank 1,382 0.54%9.35% Punjab National Bank 2023 1,195 0.46%10.10% Axis Bank 2017 1,174 0.46%10.50% Axis Bank 2009 1,081 0.42%9.50% State Bank of Patiala 2008 1,000 0.39%IDBI Bank 2009 691 0.27%10.00% ICICI Bank 2017 522 0.20%9.78% State Bank of Bikaner and Jaipur 2022 480 0.19%9.90% Canara Bank 2010 478 0.19%9.90% Canara Bank 2009 464 0.18%9.90% State Bank of Patiala 2022 439 0.17%6.75% IDBI Bank 2008 435 0.17%Citibank 2008 420 0.16%8.47% IDBI Bank 2013 244 0.09%Punjab National Bank 2008 226 0.09%9.35% Punjab National Bank 2022 209 0.08%UCO Bank 2009 94 0.04%
Banking services Total 60,473 23.50%
Other financial services Citicorp Finance India Limited 2010 9,500 3.69%Citicorp Maruti Finance Limited 2008 5,260 2.04%11.20% Citifinancial Consumer Finance India Limited 2010 5,144 2.00%9.32% GE Money Financial Services Limited 2009 1,554 0.60%9.90% GE Money Financial Services Limited 2010 1,531 0.59%Rabo India Finance Limited 2008 1,493 0.58%9.90% GE Money Financial Services Limited 2010 1,257 0.49%10.64% TML Financial Services Limited 2009 1,182 0.46%10.68% GE Capital Services Limited 2010 952 0.37%10.49% GE Capital Services Limited 2009 941 0.37%10.93% TML Financial Services Limited 2010 861 0.33%8.90% Citifinancial Consumer Finance India Limited 2009 727 0.28%8.75% Citicorp Finance India Limited 2009 593 0.23%10.75% Citicorp Finance India Limited 2008 538 0.21%9.45% GE Money Financial Services Limited 2011 538 0.21%9.55% Citicorp Maruti Finance Limited 2010 446 0.17%
Other financial services Total 32,517 12.64%
Financial institutions 9.40% Power Finance Corporation Limited 2013 3,303 1.28%9.25% Export Import Bank of India 2012 2,502 0.97%8.00% Export Import Bank of India 2009 2,485 0.97%9.03% Power Finance Corporation Limited 2013 1,898 0.74%10.25% IDFC Limited 2008 1,498 0.58%NABARD 2018 1,412 0.55%8.60% IDFC Limited 2011 1,394 0.54%9.80% Power Finance Corporation Limited 2012 1,353 0.53%8.49% Power Finance Corporation Limited 2011 1,296 0.50%8.50% Export Import Bank of India 2011 1,070 0.42%8.15% NABARD 2009 864 0.34%9.05% IDFC Limited 2010 843 0.33%9.76% IRFC Limited 2012 771 0.30%10.00% NABARD 2010 758 0.29%9.68% IRFC Limited 2012 749 0.29%9.58% Export Import Bank of India 2010 715 0.28%8.95% IDFC Limited 2018 694 0.27%Export Import Bank of India 2008 680 0.26%8.75% IRFC Limited 2013 639 0.25%8.55% Power Finance Corporation Limited 2011 618 0.24%9.79% IDFC Limited 2009 587 0.23%8.40% Export Import Bank of India 2010 550 0.21%9.68% IRFC Limited 2008 534 0.21%9.95% IRFC Limited 2022 532 0.21%9.35% IDFC Limited 2009 474 0.18%9.00% IDFC Limited 2010 421 0.16%9.10% Export Import Bank of India 2010 398 0.15%8.78% Power Finance Corporation Limited 2016 385 0.15%8.57% IRFC Limited 2016 324 0.13%Power Finance Corporation Limited 2008 108 0.04%
Financial institutions Total 29,855 11.60%
Others 118,114 45.90%Net Current Assets 16,360 6.36%
Grand Total 257,319 100.00%
ICICI PRU AR09_Final Pg29-197 (Ac).indd Sec1:144ICICI PRU AR09_Final Pg29-197 (Ac).indd Sec1:144 10/28/09 6:00:23 PM10/28/09 6:00:23 PM

I 145 I
ANNUAL REPORT 2008-09ICICI PRUDENTIAL LIFE INSURANCE
Group Capital Guarantee Debt Fund (2008-2009)
Industry Security name Market Value (Rs. ‘000) % of NAV
Financial institutions 11.10% Power Finance Corporation Limited 2013 152,709 7.64%8.83% Indian Railway Finance Corporation Limited 2012 102,223 5.11%10.90% Rural Electrification Corporation Limited 2013 73,656 3.68%10.60% Indian Railway Finance Corporation Limited 2018 22,200 1.11%9.25% Export Import Bank of India 2013 21,524 1.08%11.00% Power Finance Corporation Limited 2018 15,572 0.78%11.10% Export Import Bank of India 2010 79 0.00%9.79% IDFC Limited 2009 67 0.00%9.03% Power Finance Corporation Limited 2013 33 0.00%8.50% Export Import Bank of India 2011 30 0.00%8.60% IDFC Limited 2011 25 0.00%9.76% IRFC Limited 2012 15 0.00%9.68% IRFC Limited 2012 14 0.00%9.58% Export Import Bank of India 2009 13 0.00%9.00% IDFC Limited 2010 8 0.00%9.25% Export Import Bank of India 2012 6 0.00%8.55% Power Finance Corporation Limited 2011 4 0.00%8.78% Power Finance Corporation Limited 2016 4 0.00%8.57% IRFC Limited 2016 3 0.00%
Financial institutions Total 388,185 19.41%
Housing finance services 9.70% LIC Housing Finance Limited 2013 102,680 5.14%9.25% HDFC Limited 2016 88,230 4.41%9.80% LIC Housing Finance Limited 2017 76,606 3.83%10.00% ICICI Home Finance Company Limited 2013 50,770 2.54%9.50% HDFC Limited 2017 49,652 2.48%9.20% HDFC Limited 2012 14 0.00%10.25% HDFC Limited 2012 11 0.00%10.00% HDFC Limited 2010 9 0.00%9.70% HDFC Limited 2017 9 0.00%8.95% HDFC Limited 2010 8 0.00%
Housing finance services Total 367,989 18.40%
Banking services 11.00% IDBI Bank 2018 177,117 8.86%10.10% Axis Bank 2017 158,166 7.91%8.47% IDBI Bank 2011 4 0.00%
Banking services Total 335,287 16.77%
Securities and stock traders 9.90% ICICI Securities Limited 2014 168,827 8.44%8.85% Tata Sons Limited 2013 99,039 4.95%9.00% Tata Sons Limited 2010 4 0.00%
Securities & stock traders Total 267,870 13.40%
Refinery 11.45% Reliance Industries Limited 2013 121,537 6.08%11.00% Indian Oil Corporation Limited 2018 100,517 5.03%
Refinery Total 222,054 11.10%
Others 333,574 16.68%Net Current Assets 84,639 4.23%
Grand Total 1,999,598 100.00%
Group Capital Guarantee Debt Fund (2007-2008)
Industry Security name Market Value (Rs. ‘000) % of NAV
Banking services 9.50% State Bank of Patiala 2008 165 4.00%ICICI Bank 2009 157 3.81%10.10% State Bank of India 2022 131 3.18%Union Bank of India 2008 98 2.38%10.30% ICICI Bank 2009 89 2.16%Punjab National Bank 2009 80 1.94%10.50% Axis Bank 2008 55 1.33%9.90% Canara Bank 2010 43 1.04%9.90% Canara Bank 2009 42 1.02%IDBI Bank 2009 41 1.00%8.40% Axis Bank 2008 40 0.97%9.90% IDBI Bank 2009 40 0.97%10.20% State Bank of India 2022 38 0.92%10.10% Axis Bank 2017 36 0.87%10.43% Axis Bank 2009 35 0.85%11.06% Canara Bank 2009 25 0.61%9.35% Punjab National Bank 2023 22 0.53%10.50% Axis Bank 2009 16 0.39%11.10% Canara Bank 2009 15 0.36%Kotak Mahindra Bank 2008 15 0.36%Punjab National Bank 2008 12 0.29%10.00% ICICI Bank 2017 10 0.24%9.78% State Bank of Bikaner and Jaipur 2022 10 0.24%9.90% State Bank of Patiala 2022 9 0.22%Citibank 2008 8 0.19%UCO Bank 2009 5 0.12%6.75% IDBI Bank 2008 4 0.10%8.47% IDBI Bank 2013 4 0.10%
Banking services Total 1,245 30.22%
Financial institutions 9.68% IRFC Limited 2008 133 3.23%9.80% Power Finance Corporation Limited 2012 80 1.94%9.40% Power Finance Corporation Limited 2013 66 1.60%8.49% Power Finance Corporation Limited 2011 43 1.04%9.03% Power Finance Corporation Limited 2013 32 0.78%
ICICI PRU AR09_Final Pg29-197 (Ac).indd Sec1:145ICICI PRU AR09_Final Pg29-197 (Ac).indd Sec1:145 10/28/09 6:00:23 PM10/28/09 6:00:23 PM

I 146 I
FINANCIAL REPORT
Group Capital Guarantee Debt Fund (2007-2008)
Industry Security name Market Value (Rs. ‘000) % of NAV
9.05% IDFC Limited 2010 31 0.75%8.50% Export Import Bank of India 2011 29 0.70%9.79% IDFC Limited 2009 28 0.68%9.10% Export Import Bank of India 2010 25 0.61%9.35% IDFC Limited 2009 25 0.61%10.25% IDFC Limited 2008 22 0.53%Export Import Bank of India 2008 22 0.53%10.00% NABARD 2010 20 0.49%8.40% Export Import Bank of India 2010 15 0.36%9.76% IRFC Limited 2012 14 0.34%8.60% IDFC Limited 2011 13 0.32%8.95% IDFC Limited 2018 13 0.32%9.58% Export Import Bank of India 2010 13 0.32%9.68% IRFC Limited 2012 13 0.32%8.75% IRFC Limited 2013 12 0.29%8.00% Export Import Bank of India 2009 10 0.24%9.00% IDFC Limited 2010 8 0.19%9.95% IRFC Limited 2022 8 0.19%8.15% NABARD 2009 6 0.15%8.55% Power Finance Corporation Limited 2011 4 0.10%8.78% Power Finance Corporation Limited 2016 4 0.10%9.25% Export Import Bank of India 2012 4 0.10%8.57% IRFC Limited 2016 3 0.07%
Financial institutions Total 696 16.89%
Other financial services Citicorp Finance India Limited 2010 80 1.94%Rabo India Finance Limited 2008 53 1.29%11.20% Citifinancial Consumer Finance India Limited 2010 51 1.24%9.32% GE Money Financial Services Limited 2009 50 1.21%9.90% GE Money Financial Services Limited 2010 50 1.21%Citicorp Maruti Finance Limited 2008 40 0.97%10.90% Citifinancial Consumer Finance India Limited 2008 20 0.49%10.64% TML Financial Services Limited 2009 18 0.44%9.45% GE Capital Services Limited 2012 15 0.36%10.68% GE Capital Services Limited 2010 14 0.34%10.93% TML Financial Services Limited 2010 13 0.32%9.45% GE Money Financial Services Limited 2011 10 0.24%Citicorp Finance India Limited 2008 10 0.24%9.55% Citicorp Maruti Finance Limited 2010 8 0.19%10.75% Citicorp Finance India Limited 2008 5 0.12%8.90% Citifinancial Consumer Finance India Limited 2009 4 0.10%8.75% Citicorp Finance India Limited 2009 3 0.07%
Other financial services Total 444 10.78%
Others 1,438 34.90%Net Current Assets 297 7.21%
Grand Total 4,120 100.00%
Group Capital Guarantee Short Term Debt Fund (2008-2009)
Industry Security name Market Value (Rs. ‘000) % of NAV
Banking services 11.55% State Bank of Patiala 2009 164,575 5.26%8.70% ICICI Bank 2010 147,074 4.70%Punjab National Bank 2010 102,919 3.29%9.90% Canara Bank 2010 97,092 3.10%Bank of India 2009 91,260 2.92%11.11% State Bank of India 2009 87,555 2.80%8.75% Canara Bank 2010 86,247 2.76%ICICI Bank 2010 70,788 2.26%Canara Bank 2010 68,637 2.19%ICICI Bank 2009 50,974 1.63%12.57% State Bank of India 2009 50,000 1.60%Hongkong & Shanghai Banking Corporation Limited 2009 49,147 1.57%State Bank of Hyderabad 2010 37,507 1.20%State Bank of Patiala 2010 35,794 1.14%Bank of India 2010 35,679 1.14%IDBI Bank 2010 35,591 1.14%HDFC Bank 2009 32,351 1.03%Bank of Baroda 2010 19,450 0.62%10.43% Axis Bank 2009 19,134 0.61%Allahabad Bank 2009 18,523 0.59%Andhra Bank 2009 18,514 0.59%Syndicate Bank 2010 13,906 0.44%ABN Amro Bank 2009 11,728 0.37%Axis Bank 2009 10,896 0.35%UCO Bank 2010 8,896 0.28%
Banking services Total 1,364,237 43.59%
Financial institutions National Housing Bank 2009 122,206 3.90%9.79% IDFC Limited 2009 121,547 3.88%9.05% IDFC Limited 2009 89,763 2.87%9.35% IDFC Limited 2009 54,772 1.75%8.00% NABARD 2009 34,868 1.11%Export Import Bank of India 2009 10,764 0.34%9.03% Power Finance Corporation Limited 2013 6,540 0.21%9.00% IDFC Limited 2010 4,856 0.16%9.58% Export Import Bank of India 2009 602 0.02%
Financial institutions Total 445,918 14.25%
Others 1,048,585 33.50%Net Current Assets 271,236 8.67%
Grand Total 3,129,976 100.00%
ICICI PRU AR09_Final Pg29-197 (Ac).indd Sec1:146ICICI PRU AR09_Final Pg29-197 (Ac).indd Sec1:146 10/28/09 6:00:24 PM10/28/09 6:00:24 PM

I 147 I
ANNUAL REPORT 2008-09ICICI PRUDENTIAL LIFE INSURANCE
Group Capital Guarantee Short Term Debt Fund (2007-2008)
Industry Security name Market Value (Rs. ‘000) % of NAV
Banking services ICICI Bank 2009 60,878 5.77%10.43% Axis Bank 2009 19,134 1.81%Union Bank of India 2008 16,462 1.56%10.30% ICICI Bank 2009 16,124 1.53%Punjab National Bank 2009 14,718 1.39%9.50% State Bank of Patiala 2008 14,000 1.33%Corporation Bank 2009 13,025 1.23%9.90% Canara Bank 2010 12,092 1.15%9.90% Canara Bank 2009 11,738 1.11%Kotak Mahindra Bank 2008 11,637 1.10%IDBI Bank 2009 11,220 1.06%11.06% Canara Bank 2009 11,069 1.05%Punjab National Bank 2008 9,497 0.90%9.90% IDBI Bank 2009 7,761 0.74%10.10% State Bank of India 2022 5,774 0.55%9.35% Punjab National Bank 2023 4,006 0.38%UCO Bank 2009 3,942 0.37%10.50% Axis Bank 2008 3,845 0.36%10.20% State Bank of India 2022 3,080 0.29%10.50% Axis Bank 2009 2,903 0.27%ABN Amro Bank 2008 2,398 0.23%9.90% State Bank of Patiala 2022 1,608 0.15%Citibank 2008 827 0.08%11.10% Canara Bank 2009 530 0.05%6.75% IDBI Bank 2008 218 0.02%
Banking services Total 258,486 24.48%
Financial institutions 10.25% IDFC Limited 2008 65,464 6.20%9.79% IDFC Limited 2009 20,985 1.99%9.35% IDFC Limited 2009 19,897 1.88%IDFC Limited 2008 19,588 1.86%9.50% NABARD 2012 17,270 1.64%9.68% IRFC Limited 2008 8,353 0.79%Export Import Bank of India 2008 7,823 0.74%10.00% NABARD 2010 7,579 0.72%9.03% Power Finance Corporation Limited 2013 6,349 0.60%8.40% Export Import Bank of India 2010 5,498 0.52%9.00% IDFC Limited 2010 4,744 0.45%9.40% Power Finance Corporation Limited 2013 4,743 0.45%9.10% Export Import Bank of India 2010 4,131 0.39%8.75% IRFC Limited 2013 2,354 0.22%9.80% Power Finance Corporation Limited 2012 2,143 0.20%9.05% IDFC Limited 2010 1,739 0.16%Power Finance Corporation Limited 2008 1,611 0.15%8.49% Power Finance Corporation Limited 2011 1,189 0.11%9.25% Export Import Bank of India 2012 797 0.08%9.58% Export Import Bank of India 2010 599 0.06%
Financial institutions Total 202,856 19.21%
Other financial services 7.05% Citifinancial Consumer Finance India Limited 2008 100,970 9.56%9.90% GE Money Financial Services Limited 2010 5,067 0.48%8.39% Citicorp Maruti Finance Limited 2008 4,996 0.47%Rabo India Finance Limited 2008 4,642 0.44%9.32% GE Money Financial Services Limited 2009 4,080 0.39%Citicorp Maruti Finance Limited 2008 2,500 0.24%10.64% TML Financial Services Limited 2009 2,391 0.23%Citicorp Finance India Limited 2010 2,000 0.19%8.90% Citifinancial Consumer Finance India Limited 2009 1,972 0.19%10.68% GE Capital Services Limited 2010 1,936 0.18%10.49% GE Capital Services Limited 2009 1,915 0.18%10.93% TML Financial Services Limited 2010 1,753 0.17%9.45% GE Money Financial Services Limited 2011 1,048 0.10%9.55% Citicorp Maruti Finance Limited 2010 876 0.08%Citicorp Finance India Limited 2008 200 0.02%8.75% Citicorp Finance India Limited 2009 198 0.02%
Other financial services Total 136,544 12.93%
Others 263,639 24.97%Net Current Assets 194,278 18.40%
Grand Total 1,055,803 100.00%
ICICI PRU AR09_Final Pg29-197 (Ac).indd Sec1:147ICICI PRU AR09_Final Pg29-197 (Ac).indd Sec1:147 10/28/09 6:00:24 PM10/28/09 6:00:24 PM

I 148 I
FINANCIAL REPORT
Group Capital Guarantee Growth Fund (2008-2009)
Industry Security name Market Value (Rs. ‘000) % of NAV
Banking services Allahabad Bank 2009 4,210 6.83%ICICI Bank 2010 1,312 2.13%HDFC Bank 1,226 1.99%State Bank of India 890 1.44%11.55% State Bank of Patiala 2009 882 1.43%Bank of India 2010 661 1.07%IDBI Bank 2010 659 1.07%State Bank of Patiala 2010 636 1.03%Punjab National Bank 2010 633 1.03%Punjab National Bank 469 0.76%10.85% HDFC Bank 2018 456 0.74%Hongkong & Shanghai Banking Corporation Limited 2009 442 0.72%Axis Bank 439 0.71%8.70% ICICI Bank 2010 429 0.70%9.95% Axis Bank 2019 414 0.67%Bank of India 2009 344 0.56%Andhra Bank 2009 329 0.53%Oriental Bank of Commerce 220 0.36%Oriental Bank of Commerce 2009 196 0.32%9.90% Canara Bank 2010 191 0.31%Bank of Baroda 2010 168 0.27%UCO Bank 2010 165 0.27%ABN Amro Bank 2009 142 0.23%Axis Bank 2009 136 0.22%8.90% State Bank of India 2018 84 0.14%8.47% IDBI Bank 2011 13 0.02%
Banking services Total 15,746 25.55%
Others 44,410 72.05%Net Current Assets 1,483 2.41%
Grand Total 61,639 100.00%
Group Capital Guarantee Growth Fund (2007-2008)
Industry Security name Market Value (Rs. ‘000) % of NAV
Banking services 10.10% State Bank of India 2022 277 1.97%10.30% ICICI Bank 2009 242 1.72%Axis Bank 242 1.72%Union Bank of India 2008 232 1.65%ICICI Bank 2009 203 1.44%State Bank of India 192 1.36%HDFC Bank 133 0.94%10.10% Axis Bank 2017 111 0.79%9.90% Canara Bank 2010 109 0.77%IDBI Bank 2009 108 0.77%9.90% Canara Bank 2009 106 0.75%11.06% Canara Bank 2009 100 0.71%10.43% Axis Bank 2009 95 0.67%11.10% Canara Bank 2009 90 0.64%10.20% State Bank of India 2022 88 0.62%9.90% IDBI Bank 2009 74 0.53%10.50% Axis Bank 2009 71 0.50%9.35% Punjab National Bank 2023 60 0.43%Punjab National Bank 2009 43 0.31%Kotak Mahindra Bank 2008 36 0.26%Punjab National Bank 2008 30 0.21%10.00% ICICI Bank 2017 28 0.20%9.78% State Bank of Bikaner and Jaipur 2022 27 0.19%9.90% State Bank of Patiala 2022 25 0.18%Citibank 2008 21 0.15%8.47% IDBI Bank 2013 13 0.09%UCO Bank 2009 13 0.09%
Banking services Total 2,769 19.65%
Other financial services Citicorp Finance India Limited 2010 600 4.26%11.20% Citifinancial Consumer Finance India Limited 2010 309 2.19%9.32% GE Money Financial Services Limited 2009 100 0.71%10.64% TML Financial Services Limited 2009 58 0.41%10.90% Citifinancial Consumer Finance India Limited 2008 50 0.35%9.45% GE Capital Services Limited 2012 49 0.35%10.68% GE Capital Services Limited 2010 47 0.33%Rabo India Finance Limited 2008 44 0.31%10.93% TML Financial Services Limited 2010 42 0.30%9.45% GE Money Financial Services Limited 2011 30 0.21%10.75% Citicorp Finance India Limited 2008 27 0.19%9.55% Citicorp Maruti Finance Limited 2010 24 0.17%9.90% GE Money Financial Services Limited 2010 20 0.14%8.90% Citifinancial Consumer Finance India Limited 2009 12 0.09%
Other financial services Total 1,412 10.02%
Others 9,738 69.09%Net Current Assets 176 1.25%
Grand Total 14,095 100.00%
ICICI PRU AR09_Final Pg29-197 (Ac).indd Sec1:148ICICI PRU AR09_Final Pg29-197 (Ac).indd Sec1:148 10/28/09 6:00:24 PM10/28/09 6:00:24 PM

I 149 I
ANNUAL REPORT 2008-09ICICI PRUDENTIAL LIFE INSURANCE
Group Balanced Fund (2008-2009)
Industry Security name Market Value (Rs. ‘000) % of NAV
Banking services 9.85% HDFC Bank 2019 205,625 3.50%ICICI Bank 2010 125,175 2.13%Bank of India 2009 81,299 1.38%State Bank of India 68,782 1.17%HDFC Bank 65,316 1.11%Bank of India 2010 63,093 1.07%IDBI Bank 2010 62,936 1.07%Punjab National Bank 2009 48,418 0.82%State Bank of Patiala 2010 46,353 0.79%9.95% Axis Bank 2019 39,464 0.67%Punjab National Bank 2010 39,013 0.66%Axis Bank 36,067 0.61%Andhra Bank 2009 32,823 0.56%Allahabad Bank 2009 32,755 0.56%11.55% State Bank of Patiala 2009 28,387 0.48%Punjab National Bank 21,722 0.37%Oriental Bank of Commerce 2009 18,677 0.32%Bank of Baroda 2010 16,000 0.27%UCO Bank 2010 15,731 0.27%Oriental Bank of Commerce 13,432 0.23%8.90% State Bank of India 2018 12,093 0.21%10.10% Axis Bank 2017 10,447 0.18%10.85% HDFC Bank 2018 6,988 0.12%8.47% IDBI Bank 2011 5,095 0.09%6.75% ICICI Bank 2010 490 0.01%
Banking services Total 1,096,181 18.67%
Financial institutions 9.05% IDFC Limited 2010 85,530 1.46%9.40% Power Finance Corporation Limited 2013 72,283 1.23%Power Finance Corporation Limited PTC 2010 63,405 1.08%11.10% Export Import Bank of India 2010 56,494 0.96%11.00% Power Finance Corporation Limited 2018 49,208 0.84%National Housing Bank 2009 47,828 0.81%11.10% Power Finance Corporation Limited 2013 47,055 0.80%8.60% IDFC Limited 2011 46,455 0.79%9.03% Power Finance Corporation Limited 2013 38,004 0.65%IDFC Limited 2010 37,398 0.64%8.55% Indian Railway Finance Corporation Limited 2019 32,746 0.56%9.45% Rural Electrification Corporation Limited 2013 30,940 0.53%8.50% Export Import Bank of India 2011 26,382 0.45%11.75% Rural Electrification Corporation Limited 2011 26,095 0.44%8.45% Indian Railway Finance Corporation Limited 2018 23,303 0.40%Power Finance Corporation Limited 19,492 0.33%9.76% IRFC Limited 2012 17,074 0.29%9.68% IRFC Limited 2012 15,773 0.27%9.58% Export Import Bank of India 2009 15,602 0.27%8.55% Power Finance Corporation Limited 2011 15,018 0.26%9.00% IDFC Limited 2010 14,822 0.25%9.10% IDFC Limited 2018 14,725 0.25%11.25% Power Finance Corporation Limited 2018 14,147 0.24%8.95% IDFC Limited 2018 13,465 0.23%8.46% Indian Railway Finance Corporation Limited 2014 12,665 0.22%8.78% Power Finance Corporation Limited 2016 10,356 0.18%9.50% NABARD 2012 10,304 0.18%9.28% Power Finance Corporation Limited 2017 8,708 0.15%9.05% Export Import Bank of India 2010 8,378 0.14%8.57% IRFC Limited 2016 7,826 0.13%9.25% Export Import Bank of India 2012 5,503 0.09%8.83% Indian Railway Finance Corporation Limited 2012 5,482 0.09%Export Import Bank of India 2009 4,019 0.07%
Financial institutions Total 896,485 15.27%
Others 3,637,758 61.95%Net Current Assets 241,676 4.12%
Grand Total 5,872,100 100.00%
ICICI PRU AR09_Final Pg29-197 (Ac).indd Sec1:149ICICI PRU AR09_Final Pg29-197 (Ac).indd Sec1:149 10/28/09 6:00:24 PM10/28/09 6:00:24 PM

I 150 I
FINANCIAL REPORT
Group Balanced Fund (2007-2008)
Industry Security name Market Value (Rs. ‘000) % of NAV
Banking services Union Bank of India 2008 191,065 3.29%ICICI Bank 2009 166,347 2.87%Canara Bank 2008 96,030 1.65%10.30% ICICI Bank 2009 95,305 1.64%Punjab National Bank 2009 85,921 1.48%9.50% State Bank of Patiala 2008 85,000 1.46%10.10% State Bank of India 2022 84,878 1.46%HDFC Bank 69,294 1.19%Axis Bank 62,333 1.07%9.90% Canara Bank 2010 57,281 0.99%9.90% Canara Bank 2009 55,603 0.96%IDBI Bank 2009 54,449 0.94%9.90% IDBI Bank 2009 45,731 0.79%11.06% Canara Bank 2009 42,586 0.73%11.10% Canara Bank 2009 39,830 0.69%10.20% State Bank of India 2022 39,495 0.68%10.43% Axis Bank 2009 37,382 0.64%State Bank of India 29,094 0.50%10.10% Axis Bank 2017 23,770 0.41%9.35% Punjab National Bank 2023 23,270 0.40%8.40% Axis Bank 2008 22,337 0.38%10.50% Axis Bank 2009 21,037 0.36%Kotak Mahindra Bank 2008 17,099 0.29%6.75% IDBI Bank 2008 14,044 0.24%Punjab National Bank 2008 13,955 0.24%Punjab National Bank 11,851 0.20%10.00% ICICI Bank 2017 11,579 0.20%9.78% State Bank of Bikaner and Jaipur 2022 10,437 0.18%11.00% IDBI Bank 2008 10,020 0.17%9.90% State Bank of Patiala 2022 9,588 0.17%Citibank 2008 9,040 0.16%UCO Bank 2009 5,792 0.10%8.47% IDBI Bank 2013 4,944 0.09%9.35% Punjab National Bank 2022 4,069 0.07%10.20% ICICI Bank 2008 1,505 0.03%6.75% ICICI Bank 2010 475 0.01%
Banking services Total 1,552,436 26.74%
Financial institutions 9.05% IDFC Limited 2010 83,624 1.44%10.25% IDFC Limited 2008 80,377 1.38%9.40% Power Finance Corporation Limited 2013 73,371 1.26%9.50% NABARD 2012 39,760 0.68%9.03% Power Finance Corporation Limited 2013 36,895 0.64%9.80% Power Finance Corporation Limited 2012 36,309 0.63%9.79% IDFC Limited 2009 35,668 0.61%8.60% IDFC Limited 2011 34,507 0.59%9.35% IDFC Limited 2009 29,237 0.50%8.49% Power Finance Corporation Limited 2011 29,089 0.50%8.50% Export Import Bank of India 2011 25,396 0.44%10.04% IRFC Limited 2027 21,558 0.37%Export Import Bank of India 2008 20,770 0.36%8.15% NABARD 2009 20,716 0.36%Power Finance Corporation Limited 2008 20,606 0.35%8.00% Export Import Bank of India 2009 20,423 0.35%9.10% Export Import Bank of India 2010 18,716 0.32%5.85% Power Finance Corporation Limited 2010 17,418 0.30%9.76% IRFC Limited 2012 16,618 0.29%10.00% NABARD 2010 15,662 0.27%9.58% Export Import Bank of India 2010 15,505 0.27%9.68% IRFC Limited 2012 15,343 0.26%9.10% IDFC Limited 2018 14,685 0.25%8.55% Power Finance Corporation Limited 2011 14,593 0.25%9.25% Export Import Bank of India 2012 14,504 0.25%9.00% IDFC Limited 2010 14,481 0.25%8.75% IRFC Limited 2013 13,851 0.24%8.95% IDFC Limited 2018 13,419 0.23%8.40% Export Import Bank of India 2010 11,363 0.20%9.95% IRFC Limited 2022 10,835 0.19%8.78% Power Finance Corporation Limited 2016 10,179 0.18%8.57% IRFC Limited 2016 7,676 0.13%NABARD 2018 6,146 0.11%
Financial institutions Total 839,300 14.46%
Others 2,885,659 49.71%Net Current Assets 527,840 9.09%
Grand Total 5,805,235 100.00%
ICICI PRU AR09_Final Pg29-197 (Ac).indd Sec1:150ICICI PRU AR09_Final Pg29-197 (Ac).indd Sec1:150 10/28/09 6:00:24 PM10/28/09 6:00:24 PM

I 151 I
ANNUAL REPORT 2008-09ICICI PRUDENTIAL LIFE INSURANCE
Group Debt Fund (2008-2009)
Industry Security name Market Value (Rs. ‘000) % of NAV
Banking services 9.85% HDFC Bank 2019 308,437 9.09%Syndicate Bank 2010 138,785 4.09%Bank of India 2010 47,235 1.39%IDBI Bank 2010 47,118 1.39%9.50% State Bank of India 2013 30,400 0.90%9.95% Axis Bank 2019 27,721 0.82%11.55% State Bank of Patiala 2009 26,703 0.79%11.11% State Bank of India 2009 26,594 0.78%12.57% State Bank of India 2009 25,000 0.74%Bank of India 2009 24,586 0.72%Oriental Bank of Commerce 2009 13,982 0.41%Hongkong & Shanghai Banking Corporation Limited 2009 13,761 0.41%Bank of Baroda 2010 11,979 0.35%UCO Bank 2010 11,777 0.35%8.90% State Bank of India 2018 8,985 0.26%10.43% Axis Bank 2009 7,700 0.23%ABN Amro Bank 2009 6,534 0.19%Axis Bank 2009 6,084 0.18%9.50% Oriental Bank of Commerce 2013 5,940 0.18%9.50% IDBI Bank 2013 5,712 0.17%8.47% IDBI Bank 2011 883 0.03%
Banking services Total 795,916 23.46%
Refinery 10.75% Reliance Industries Limited 2018 207,592 6.12%11.45% Reliance Industries Limited 2013 78,292 2.31%10.95% Reliance Gas Transportation Infrastructure Limited 2019 62,103 1.83%10.90% Reliance Gas Transportation Infrastructure Limited 2014 39,730 1.17%13.50% Reliance Industries Limited 2009 308 0.01%
Refinery Total 388,025 11.44%
Financial institutions 9.80% NABARD 2012 57,408 1.69%9.05% IDFC Limited 2010 34,019 1.00%9.05% IDFC Limited 2009 29,921 0.88%IDFC Limited 2010 28,117 0.83%11.10% Power Finance Corporation Limited 2013 27,722 0.82%8.55% Indian Railway Finance Corporation Limited 2019 24,434 0.72%8.45% Indian Railway Finance Corporation Limited 2018 21,289 0.63%12.50% IDFC Limited 2009 16,514 0.49%11.10% Export Import Bank of India 2010 15,446 0.46%9.79% IDFC Limited 2009 14,050 0.41%9.03% Power Finance Corporation Limited 2013 13,907 0.41%11.25% Power Finance Corporation Limited 2018 10,540 0.31%9.10% IDFC Limited 2018 9,817 0.29%8.46% Indian Railway Finance Corporation Limited 2014 9,449 0.28%9.00% IDFC Limited 2010 7,397 0.22%8.75% IRFC Limited 2013 7,100 0.21%11.00% Power Finance Corporation Limited 2018 7,001 0.21%8.60% IDFC Limited 2011 6,515 0.19%9.45% Rural Electrification Corporation Limited 2013 6,350 0.19%9.05% Export Import Bank of India 2010 6,224 0.18%Export Import Bank of India 2009 6,062 0.18%9.40% Power Finance Corporation Limited 2013 3,220 0.09%9.68% IRFC Limited 2012 3,041 0.09%9.76% IRFC Limited 2012 2,342 0.07%9.58% Export Import Bank of India 2009 1,974 0.06%9.25% Export Import Bank of India 2012 1,689 0.05%8.83% Indian Railway Finance Corporation Limited 2012 1,682 0.05%8.55% Power Finance Corporation Limited 2011 1,030 0.03%8.50% Export Import Bank of India 2011 910 0.03%8.57% IRFC Limited 2016 548 0.02%
Financial institutions Total 375,718 11.08%
Others 1,717,162 50.62%Net Current Assets 115,137 3.39%
Grand Total 3,391,958 100.00%
ICICI PRU AR09_Final Pg29-197 (Ac).indd Sec1:151ICICI PRU AR09_Final Pg29-197 (Ac).indd Sec1:151 10/28/09 6:00:25 PM10/28/09 6:00:25 PM

I 152 I
FINANCIAL REPORT
Group Debt Fund (2007-2008)
Industry Security name Market Value (Rs. ‘000) % of NAV
Banking services Kotak Mahindra Bank 2008 72,431 4.65%10.10% State Bank of India 2022 62,118 3.99%ICICI Bank 2009 59,490 3.82%10.30% ICICI Bank 2009 32,911 2.11%9.40% Yes Bank 2008 30,000 1.92%Punjab National Bank 2009 29,589 1.90%Union Bank of India 2008 28,481 1.83%10.50% Axis Bank 2008 22,500 1.44%9.50% State Bank of Patiala 2008 18,000 1.15%9.90% IDBI Bank 2009 15,656 1.00%9.90% Canara Bank 2010 15,596 1.00%IDBI Bank 2009 15,270 0.98%9.90% Canara Bank 2009 15,139 0.97%10.43% Axis Bank 2009 13,295 0.85%10.10% Axis Bank 2017 12,392 0.80%Canara Bank 2008 9,604 0.62%ABN Amro Bank 2008 9,569 0.61%9.35% Punjab National Bank 2023 8,581 0.55%9.35% Punjab National Bank 2022 8,447 0.54%10.50% Axis Bank 2009 5,119 0.33%10.00% ICICI Bank 2017 5,058 0.32%Punjab National Bank 2008 4,907 0.31%9.78% State Bank of Bikaner and Jaipur 2022 3,628 0.23%9.90% State Bank of Patiala 2022 3,287 0.21%11.06% Canara Bank 2009 2,915 0.19%11.10% Canara Bank 2009 2,670 0.17%UCO Bank 2009 2,037 0.13%Citibank 2008 1,428 0.09%8.47% IDBI Bank 2013 857 0.05%6.75% IDBI Bank 2008 827 0.05%
Banking services Total 511,802 32.84%
Financial institutions IDFC Limited 2008 46,523 2.99%9.05% IDFC Limited 2010 33,261 2.13%8.49% Power Finance Corporation Limited 2011 31,770 2.04%9.50% NABARD 2012 28,917 1.86%9.40% Power Finance Corporation Limited 2013 25,223 1.62%9.80% Power Finance Corporation Limited 2012 15,082 0.97%9.03% Power Finance Corporation Limited 2013 13,501 0.87%9.79% IDFC Limited 2009 10,286 0.66%9.35% IDFC Limited 2009 10,280 0.66%9.10% IDFC Limited 2018 9,790 0.63%8.75% IRFC Limited 2013 7,302 0.47%9.00% IDFC Limited 2010 7,227 0.46%10.25% IDFC Limited 2008 5,257 0.34%9.80% NABARD 2012 5,061 0.32%9.10% Export Import Bank of India 2010 4,928 0.32%9.25% Export Import Bank of India 2012 4,840 0.31%Export Import Bank of India 2008 4,280 0.27%8.95% IDFC Limited 2018 3,471 0.22%8.60% IDFC Limited 2011 3,130 0.20%9.68% IRFC Limited 2012 2,958 0.19%10.00% NABARD 2010 2,627 0.17%9.76% IRFC Limited 2012 2,280 0.15%Power Finance Corporation Limited 2008 2,152 0.14%NABARD 2018 1,993 0.13%9.58% Export Import Bank of India 2010 1,962 0.13%8.40% Export Import Bank of India 2010 1,906 0.12%9.95% IRFC Limited 2022 1,872 0.12%9.68% IRFC Limited 2008 1,671 0.11%8.55% Power Finance Corporation Limited 2011 1,001 0.06%8.50% Export Import Bank of India 2011 876 0.06%8.15% NABARD 2009 685 0.04%8.00% Export Import Bank of India 2009 676 0.04%8.57% IRFC Limited 2016 538 0.03%
Financial institutions Total 293,326 18.82%
Others 648,486 41.61%Net Current Assets 104,862 6.73%
Grand Total 1,558,476 100.00%
ICICI PRU AR09_Final Pg29-197 (Ac).indd Sec1:152ICICI PRU AR09_Final Pg29-197 (Ac).indd Sec1:152 10/28/09 6:00:25 PM10/28/09 6:00:25 PM

I 153 I
ANNUAL REPORT 2008-09ICICI PRUDENTIAL LIFE INSURANCE
Group Short Term Debt Fund (2008-2009)
Industry Security name Market Value (Rs. ‘000) % of NAV
Banking services 8.50% IDBI Bank 2010 196,559 3.65%8.70% ICICI Bank 2010 179,181 3.33%8.75% Canara Bank 2010 177,320 3.30%Bank of India 2009 148,806 2.77%10.43% Axis Bank 2009 138,692 2.58%Canara Bank 2010 135,350 2.52%Punjab National Bank 2010 122,687 2.28%11.11% State Bank of India 2009 115,138 2.14%11.55% State Bank of Patiala 2009 109,467 2.04%ICICI Bank 2010 105,419 1.96%ICICI Bank 2009 103,893 1.93%State Bank of Hyderabad 2010 98,163 1.83%Axis Bank 2009 72,273 1.34%Hongkong & Shanghai Banking Corporation Limited 2009 72,000 1.34%HDFC Bank 2009 61,211 1.14%State Bank of Patiala 2010 53,507 0.99%Bank of India 2010 53,134 0.99%IDBI Bank 2010 53,002 0.99%12.57% State Bank of India 2009 50,000 0.93%Syndicate Bank 2010 46,354 0.86%9.90% Canara Bank 2010 45,500 0.85%Andhra Bank 2009 27,674 0.51%Allahabad Bank 2009 27,585 0.51%Bank of Baroda 2010 13,475 0.25%UCO Bank 2010 13,248 0.25%Union Bank of India 2010 10,358 0.19%
Banking services Total 2,229,996 41.46%
Others 2,409,171 44.79%Net Current Assets 739,488 13.75%
Grand Total 5,378,655 100.00%
Group Short Term Debt Fund (2007-2008)
Industry Security name Market Value (Rs. ‘000) % of NAV
Banking services 10.30% ICICI Bank 2009 269,926 4.62%ICICI Bank 2009 259,148 4.44%9.50% State Bank of Patiala 2008 175,500 3.00%Kotak Mahindra Bank 2008 144,658 2.48%9.90% Canara Bank 2010 130,332 2.23%9.90% Canara Bank 2009 126,514 2.17%Punjab National Bank 2009 119,277 2.04%IDBI Bank 2009 114,080 1.95%10.43% Axis Bank 2009 82,012 1.40%Canara Bank 2009 80,893 1.38%10.10% State Bank of India 2022 80,408 1.38%Union Bank of India 2008 65,585 1.12%Corporation Bank 2009 55,432 0.95%Punjab National Bank 2008 50,281 0.86%9.90% IDBI Bank 2009 42,274 0.72%11.06% Canara Bank 2009 35,352 0.61%9.40% Yes Bank 2008 30,000 0.51%10.50% Axis Bank 2008 23,000 0.39%UCO Bank 2009 20,871 0.36%Canara Bank 2008 19,251 0.33%9.35% Punjab National Bank 2023 16,982 0.29%11.10% Canara Bank 2009 14,360 0.25%10.50% Axis Bank 2009 12,415 0.21%8.40% Axis Bank 2008 9,928 0.17%10.20% State Bank of India 2022 7,900 0.14%9.90% State Bank of Patiala 2022 6,935 0.12%6.75% IDBI Bank 2008 5,538 0.09%Citibank 2008 5,143 0.09%
Banking services Total 2,003,995 34.30%
Financial institutions 9.79% IDFC Limited 2009 123,910 2.12%9.35% IDFC Limited 2009 105,346 1.80%9.50% NABARD 2012 91,087 1.56%IDFC Limited 2008 85,112 1.46%9.00% IDFC Limited 2010 58,929 1.01%Export Import Bank of India 2008 45,351 0.78%9.68% IRFC Limited 2008 41,435 0.71%8.75% IRFC Limited 2013 34,702 0.59%9.03% Power Finance Corporation Limited 2013 27,026 0.46%Power Finance Corporation Limited 2008 21,135 0.36%9.40% Power Finance Corporation Limited 2013 20,697 0.35%10.00% NABARD 2010 20,210 0.35%9.80% Power Finance Corporation Limited 2012 18,397 0.31%8.40% Export Import Bank of India 2010 14,662 0.25%8.49% Power Finance Corporation Limited 2011 12,967 0.22%9.10% Export Import Bank of India 2010 9,931 0.17%9.05% IDFC Limited 2010 8,931 0.15%9.58% Export Import Bank of India 2010 8,308 0.14%9.25% Export Import Bank of India 2012 3,418 0.06%
Financial institutions Total 751,554 12.86%
Others 2,216,820 37.94%Net Current Assets 870,129 14.89%
Grand Total 5,842,498 100.00%
ICICI PRU AR09_Final Pg29-197 (Ac).indd Sec1:153ICICI PRU AR09_Final Pg29-197 (Ac).indd Sec1:153 10/28/09 6:00:25 PM10/28/09 6:00:25 PM

I 154 I
FINANCIAL REPORT
Group Leave Encashment Balanced Fund (2008-2009)
Industry Security name Market Value (Rs. ‘000) % of NAV
Banking services 8.70% ICICI Bank 2010 14,298 4.73%11.11% State Bank of India 2009 11,245 3.72%8.75% Canara Bank 2010 10,000 3.31%10.43% Axis Bank 2009 7,000 2.32%11.55% State Bank of Patiala 2009 6,498 2.15%ICICI Bank 2010 6,476 2.14%Hongkong & Shanghai Banking Corporation Limited 2009 3,932 1.30%10.85% HDFC Bank 2018 3,399 1.12%State Bank of India 3,288 1.09%State Bank of Patiala 2010 3,284 1.09%Punjab National Bank 2010 3,273 1.08%Bank of India 2010 3,264 1.08%IDBI Bank 2010 3,256 1.08%HDFC Bank 3,187 1.05%9.95% Axis Bank 2019 2,042 0.68%Bank of India 2009 1,699 0.56%Andhra Bank 2009 1,698 0.56%Allahabad Bank 2009 1,695 0.56%Axis Bank 1,660 0.55%Punjab National Bank 1,285 0.43%ABN Amro Bank 2009 1,080 0.36%Axis Bank 2009 999 0.33%Oriental Bank of Commerce 2009 967 0.32%Bank of Baroda 2010 828 0.27%UCO Bank 2010 814 0.27%Oriental Bank of Commerce 661 0.22%8.90% State Bank of India 2018 619 0.20%
Banking services Total 98,447 32.58%
Others 191,163 63.26%Net Current Assets 12,580 4.16%
Grand Total 302,190 100.00%
Group Leave Encashment Balanced Fund (2007-2008)
Industry Security name Market Value (Rs. ‘000) % of NAV
Banking services Oriental Bank of Commerce 2008 249,982 100.00%
Banking services Total 249,982 100.00%
Net Current Assets — 0.00%
Grand Total 249,982 100.00%
Group Leave Encashment Income Fund (2008-2009)
Industry Security name Market Value (Rs. ‘000) % of NAV
Banking services 11.55% State Bank of Patiala 2009 52 8.35%9.90% Canara Bank 2010 47 7.55%9.85% HDFC Bank 2019 41 6.60%10.43% Axis Bank 2009 38 6.04%ICICI Bank 2010 14 2.22%Bank of India 2010 7 1.20%IDBI Bank 2010 7 1.19%10.85% HDFC Bank 2018 7 1.05%Punjab National Bank 2010 7 1.05%9.95% Axis Bank 2019 4 0.64%Bank of India 2009 4 0.62%Andhra Bank 2009 4 0.62%Allahabad Bank 2009 4 0.62%Oriental Bank of Commerce 2009 2 0.30%Bank of Baroda 2010 2 0.30%UCO Bank 2010 2 0.30%8.90% State Bank of India 2018 1 0.19%
Banking services Total 243 38.85%
Financial institutions 9.25% Export Import Bank of India 2012 23 3.62%8.83% Indian Railway Finance Corporation Limited 2012 22 3.61%8.55% Indian Railway Finance Corporation Limited 2019 11 1.79%10.75% Rural Electrification Corporation Limited 2013 11 1.73%8.46% Indian Railway Finance Corporation Limited 2014 6 0.97%11.25% Power Finance Corporation Limited 2018 5 0.80%IDFC Limited 2010 4 0.60%9.40% Power Finance Corporation Limited 2013 2 0.33%8.45% Indian Railway Finance Corporation Limited 2018 1 0.16%9.05% Export Import Bank of India 2010 1 0.15%
Financial institutions Total 86 13.75%
Others 199 32.16%Net Current Assets 95 15.24%
Grand Total 623 100.00%
ICICI PRU AR09_Final Pg29-197 (Ac).indd Sec1:154ICICI PRU AR09_Final Pg29-197 (Ac).indd Sec1:154 10/28/09 6:00:25 PM10/28/09 6:00:25 PM

I 155 I
ANNUAL REPORT 2008-09ICICI PRUDENTIAL LIFE INSURANCE
Group Leave Encashment Income Fund (2007-2008)
Industry Security name Market Value (Rs. ‘000) % of NAV
Banking services Oriental Bank of Commerce 2008 20,001 100.00%
Banking services Total 20,001 100.00%
Net Current Assets — 0.00%
Grand Total 20,001 100.00%
Group Leave Encashment Short Term Fund (2008-2009)
Industry Security name Market Value(Rs. ‘000) % of NAV
Banking services Hongkong & Shanghai Banking Corporation Limited 2009 2,064 4.32%8.50% IDBI Bank 2010 2,000 4.19%10.43% Axis Bank 2009 1,950 4.09%9.90% Canara Bank 2010 1,743 3.65%ABN Amro Bank 2009 1,468 3.08%11.55% State Bank of Patiala 2009 1,452 3.04%HDFC Bank 2009 1,270 2.66%11.11% State Bank of India 2009 1,262 2.64%ICICI Bank 2009 944 1.98%8.70% ICICI Bank 2010 407 0.85%IDBI Bank 2010 336 0.70%Bank of India 2009 175 0.37%Allahabad Bank 2009 175 0.37%Andhra Bank 2009 174 0.36%Bank of Baroda 2010 85 0.18%UCO Bank 2010 84 0.18%
Banking services Total 15,589 32.66%
Others 11,236 23.53%Net Current Assets 20,908 43.80%
Grand Total 47,733 100.00%
Group Leave Encashment Short Term Fund (2007-2008)
Industry Security name Market Value (Rs. ‘000) % of NAV
Banking services Oriental Bank of Commerce 2008 25,182 100.00%
Banking services Total 25,182 100.00%
Net Current Assets — 0.00%
Grand Total 25,182 100.00%
Group Return Guarantee Fund (2008-2009)
Industry Security name Market Value (Rs. ‘000) % of NAV
Financial institutions 10.00% IDFC Limited 2013 181,538 7.84%11.00% Power Finance Corporation Limited 2018 105,670 4.56%11.10% Power Finance Corporation Limited 2013 86,739 3.75%8.46% Indian Railway Finance Corporation Limited 2014 86,604 3.74%9.25% Export Import Bank of India 2013 51,247 2.21%10.85% Rural Electrification Corporation Limited 2018 5,546 0.24%
Financial institutions Total 517,344 22.34%
Banking services 9.85% HDFC Bank 2019 115,664 5.00%10.85% HDFC Bank 2018 96,612 4.17%11.35% IDBI Bank 2013 86,646 3.74%10.10% Corporation Bank 2018 69,654 3.01%9.50% State Bank of India 2013 66,700 2.88%9.50% Oriental Bank of Commerce 2013 27,413 1.18%9.25% IDBI Bank 2014 24,576 1.06%9.50% Canara Bank 2013 11,383 0.49%9.50% IDBI Bank 2013 9,940 0.43%
Banking services Total 508,588 21.96%
Housing finance services 9.80% LIC Housing Finance Limited 2017 140,035 6.05%10.25% HDFC Limited 2017 139,699 6.03%9.90% HDFC Limited 2013 63,984 2.76%11.25% HDFC Limited 2018 9,222 0.40%
Housing finance services Total 352,940 15.24%
Refinery 11.45% Reliance Industries Limited 2013 214,270 9.25%11.00% Indian Oil Corporation Limited 2018 49,859 2.15%
Refinery Total 264,129 11.41%
Others 616,093 26.61%Net Current Assets 56,378 2.43%
Grand Total 2,315,472 100.00%
Group Return Guarantee Fund II (2008-2009)
Industry Security name Market Value (Rs. ‘000) % of NAV
Net Current Assets 6,275 100.00%
Grand Total 6,275 100.00%
ICICI PRU AR09_Final Pg29-197 (Ac).indd Sec1:155ICICI PRU AR09_Final Pg29-197 (Ac).indd Sec1:155 10/28/09 6:00:25 PM10/28/09 6:00:25 PM

I 156 I
FINANCIAL REPORT
Group Growth Fund (2008-2009)
Industry Security name Market Value (Rs. ‘000) % of NAV
Banking services State Bank of India 100,022 4.33%HDFC Bank 80,156 3.47%Axis Bank 42,168 1.83%Punjab National Bank 32,556 1.41%Oriental Bank of Commerce 19,928 0.86%10.85% HDFC Bank 2018 17,215 0.75%Bank of India 2010 16,148 0.70%IDBI Bank 2010 14,529 0.63%9.95% Axis Bank 2019 10,145 0.44%Bank of India 2009 8,405 0.36%ABN Amro Bank 2009 6,553 0.28%Axis Bank 2009 6,234 0.27%ICICI Bank 2010 6,176 0.27%Oriental Bank of Commerce 2009 4,780 0.21%Bank of Baroda 2010 4,095 0.18%UCO Bank 2010 4,026 0.17%10.10% Axis Bank 2017 3,663 0.16%8.90% State Bank of India 2018 3,384 0.15%8.47% IDBI Bank 2011 778 0.03%
Banking services Total 380,961 16.51%
Refinery Reliance Industries Limited 127,699 5.53%Bharat Petroleum Corporation Limited 24,663 1.07%10.95% Reliance Gas Transportation Infrastructure Limited 2019 23,809 1.03%11.45% Reliance Industries Limited 2013 21,932 0.95%10.90% Reliance Gas Transportation Infrastructure Limited 2014 15,231 0.66%Hindustan Petroleum Corporation Limited 14,001 0.61%10.75% Reliance Industries Limited 2018 12,217 0.53%Reliance Petroleum Limited 12,099 0.52%
Refinery Total 251,651 10.90%
Others 1,594,497 69.08%Net Current Assets 80,935 3.51%
Grand Total 2,308,044 100.00%
Group Growth Fund (2007-2008)
Industry Security name Market Value (Rs. ‘000) % of NAV
Banking services HDFC Bank 112,791 3.88%Axis Bank 102,382 3.52%State Bank of India 52,623 1.81%ICICI Bank 2009 46,310 1.59%10.30% ICICI Bank 2009 26,717 0.92%10.10% State Bank of India 2022 25,525 0.88%Union Bank of India 2008 25,231 0.87%Punjab National Bank 2009 22,642 0.78%Punjab National Bank 21,425 0.74%10.20% State Bank of India 2022 14,221 0.49%9.90% IDBI Bank 2009 12,770 0.44%10.50% Axis Bank 2009 10,895 0.38%10.43% Axis Bank 2009 10,001 0.34%IDBI Bank 2009 7,218 0.25%9.35% Punjab National Bank 2023 6,575 0.23%9.90% Canara Bank 2010 6,454 0.22%9.90% Canara Bank 2009 6,265 0.22%Kotak Mahindra Bank 2008 5,087 0.18%11.06% Canara Bank 2009 4,325 0.15%11.10% Canara Bank 2009 4,180 0.14%Punjab National Bank 2008 4,152 0.14%10.10% Axis Bank 2017 3,790 0.13%8.40% Axis Bank 2008 2,978 0.10%9.78% State Bank of Bikaner and Jaipur 2022 2,890 0.10%9.90% State Bank of Patiala 2022 2,724 0.09%9.50% State Bank of Patiala 2008 2,500 0.09%10.00% ICICI Bank 2017 2,124 0.07%UCO Bank 2009 1,723 0.06%Citibank 2008 1,586 0.05%9.35% Punjab National Bank 2022 1,143 0.04%6.75% IDBI Bank 2008 969 0.03%8.47% IDBI Bank 2013 755 0.03%
Banking services Total 550,971 18.97%
Others 2,283,860 78.61%Net Current Assets 70,304 2.42%
Grand Total 2,905,135 100.00%
ICICI PRU AR09_Final Pg29-197 (Ac).indd Sec1:156ICICI PRU AR09_Final Pg29-197 (Ac).indd Sec1:156 10/28/09 6:00:26 PM10/28/09 6:00:26 PM

I 157 I
ANNUAL REPORT 2008-09ICICI PRUDENTIAL LIFE INSURANCE
Health Saver Balance Fund (2008-2009)
Industry Security name Market Value (Rs. ‘000) % of NAV
Banking services 9.90% Canara Bank 2010 230 6.15%10.43% Axis Bank 2009 215 5.74%State Bank of Hyderabad 2010 161 4.31%IDBI Bank 2010 145 3.88%Andhra Bank 2009 130 3.47%ICICI Bank 2010 122 3.26%Syndicate Bank 2010 121 3.22%Union Bank of India 2010 113 3.02%8.70% ICICI Bank 2010 112 2.99%9.50% Oriental Bank of Commerce 2013 99 2.65%9.50% IDBI Bank 2013 70 1.87%9.85% HDFC Bank 2019 62 1.65%HDFC Bank 51 1.35%State Bank of India 49 1.31%State Bank of Patiala 2010 25 0.68%Punjab National Bank 2010 25 0.67%Bank of India 2010 24 0.65%9.95% Axis Bank 2019 16 0.43%Punjab National Bank 14 0.36%Union Bank of India 13 0.34%Bank of India 2009 13 0.34%Allahabad Bank 2009 13 0.34%Oriental Bank of Commerce 2009 7 0.18%Bank of Baroda 2010 6 0.16%UCO Bank 2010 6 0.16%8.90% State Bank of India 2018 3 0.08%
Banking services Total 1,845 49.27%
Others 1,216 32.65%Net Current Assets 676 18.08%
Grand Total 3,737 100.00%
Health Saver Protector Fund (2008-2009)
Industry Security name Market Value (Rs. ‘000) % of NAV
Banking services 10.43% Axis Bank 2009 1,375 6.72%12.57% State Bank of India 2009 1,100 5.38%9.50% Oriental Bank of Commerce 2013 1,100 5.38%Punjab National Bank 2010 996 4.87%Bank of Baroda 2010 986 4.82%Syndicate Bank 2010 973 4.76%ICICI Bank 2009 973 4.76%9.85% HDFC Bank 2019 704 3.44%ICICI Bank 2010 322 1.58%Bank of India 2010 162 0.79%State Bank of Patiala 2010 161 0.79%9.95% Axis Bank 2019 103 0.50%Bank of India 2009 84 0.41%Allahabad Bank 2009 84 0.41%Andhra Bank 2009 83 0.41%8.75% Canara Bank 2010 78 0.38%Oriental Bank of Commerce 2009 48 0.24%UCO Bank 2010 40 0.20%8.90% State Bank of India 2018 23 0.11%
Banking services Total 9,395 45.96%
Financial institutions 9.35% IDFC Limited 2009 799 3.91%National Housing Bank 2009 569 2.78%Export Import Bank of India 2009 540 2.64%10.75% Rural Electrification Corporation Limited 2013 538 2.63%8.55% Indian Railway Finance Corporation Limited 2019 202 0.99%11.25% Power Finance Corporation Limited 2018 122 0.60%IDFC Limited 2010 78 0.38%9.40% Power Finance Corporation Limited 2013 51 0.25%
Financial institutions Total 2,899 14.18%
Others 4,317 21.09%Net Current Assets 3,837 18.77%
Grand Total 20,448 100.00%
ICICI PRU AR09_Final Pg29-197 (Ac).indd Sec1:157ICICI PRU AR09_Final Pg29-197 (Ac).indd Sec1:157 10/28/09 6:00:26 PM10/28/09 6:00:26 PM

I 158 I
FINANCIAL REPORT
Health Saver Flexi Balanced Fund (2008-2009)
Industry Security name Market Value (Rs. ‘000) % of NAV
Banking services 8.75% Canara Bank 2010 240 7.25%Allahabad Bank 2009 201 6.08%10.43% Axis Bank 2009 189 5.72%ABN Amro Bank 2009 161 4.86%8.70% ICICI Bank 2010 141 4.27%Syndicate Bank 2010 111 3.36%11.11% State Bank of India 2009 100 3.02%State Bank of India 80 2.42%HDFC Bank 51 1.53%9.85% HDFC Bank 2019 41 1.24%ICICI Bank 2010 31 0.95%Union Bank of India 28 0.85%State Bank of Patiala 2010 18 0.54%Punjab National Bank 2010 18 0.53%Bank of India 2010 15 0.45%IDBI Bank 2010 15 0.45%9.95% Axis Bank 2019 10 0.30%Andhra Bank 2009 10 0.29%Bank of India 2009 8 0.23%Oriental Bank of Commerce 2009 5 0.14%Bank of Baroda 2010 4 0.11%UCO Bank 2010 4 0.11%8.90% State Bank of India 2018 3 0.09%
Banking services Total 1,484 44.80%
Others 1,299 39.28%Net Current Assets 526 15.92%
Grand Total 3,309 100.00%
Health Saver Flexi Growth Fund (2008-2009)
Industry Security name Market Value (Rs. ‘000) % of NAV
Banking services State Bank of India 4,316 6.06%HDFC Bank 4,122 5.79%8.70% ICICI Bank 2010 4,000 5.62%Union Bank of India 868 1.22%Axis Bank 602 0.85%
Banking services Total 13,908 19.53%
Refinery Reliance Industries Limited 3,769 5.29%Hindustan Petroleum Corporation Limited 2,962 4.16%Bharat Petroleum Corporation Limited 2,021 2.84%
Refinery Total 8,752 12.29%
Others 42,305 59.41%Net Current Assets 6,239 8.76%
Grand Total 71,204 100.00%
Health Saver Preserver Fund (2008-2009)
Industry Security name Market Value (Rs. ‘000) % of NAV
Banking services 10.43% Axis Bank 2009 81 6.35%ABN Amro Bank 2009 71 5.63%9.50% Oriental Bank of Commerce 2013 59 4.66%11.11% State Bank of India 2009 51 4.02%9.90% Canara Bank 2010 42 3.31%Syndicate Bank 2010 37 2.93%Punjab National Bank 2010 36 2.85%HDFC Bank 2009 36 2.85%Union Bank of India 2010 30 2.38%8.50% IDBI Bank 2010 25 1.97%Canara Bank 2010 22 1.75%8.70% ICICI Bank 2010 20 1.58%ICICI Bank 2010 17 1.31%8.75% Canara Bank 2010 16 1.29%12.57% State Bank of India 2009 14 1.12%State Bank of Hyderabad 2010 13 1.05%Bank of India 2010 9 0.73%IDBI Bank 2010 9 0.73%State Bank of Patiala 2010 8 0.66%Bank of India 2009 5 0.38%Allahabad Bank 2009 5 0.38%Andhra Bank 2009 4 0.31%Bank of Baroda 2010 2 0.19%UCO Bank 2010 2 0.18%
Banking services Total 614 48.62%
Financial institutions IDFC Limited 2009 58 4.56%Export Import Bank of India 2009 56 4.41%National Housing Bank 2009 39 3.04%9.35% IDFC Limited 2009 19 1.52%8.00% NABARD 2009 7 0.55%
Financial institutions Total 179 14.08%
Others 164 12.85%Net Current Assets 310 24.44%
Grand Total 1,267 100.00%
ICICI PRU AR09_Final Pg29-197 (Ac).indd Sec1:158ICICI PRU AR09_Final Pg29-197 (Ac).indd Sec1:158 10/28/09 6:00:26 PM10/28/09 6:00:26 PM

I 159 I
ANNUAL REPORT 2008-09ICICI PRUDENTIAL LIFE INSURANCE
Health Saver Multiplier Fund (2008-2009)
Industry Security name Market Value (Rs. ‘000) % of NAV
Banking services HDFC Bank 703 6.20%State Bank of India 515 4.55%Axis Bank 195 1.72%Punjab National Bank 98 0.86%
Banking services Total 1,511 13.34%
Refinery Reliance Industries Limited 634 5.60%Bharat Petroleum Corporation Limited 353 3.12%Hindustan Petroleum Corporation Limited 231 2.04%
Refinery Total 1,218 10.76%
Others 8,298 73.23%Net Current Assets 302 2.67%
Grand Total 11,329 100.00%
Health Saver Return Guarantee Fund (2008-2009)
Industry Security name Market Value (Rs. ‘000) % of NAV
Banking services 9.50% State Bank of India 2013 5,146 8.72%9.50% Canara Bank 2013 4,115 6.97%11.35% IDBI Bank 2013 3,786 6.41%9.50% Oriental Bank of Commerce 2013 3,680 6.23%10.85% HDFC Bank 2018 3,485 5.91%
Banking services Total 20,212 34.24%
Financial institutions 9.50% Export Import Bank of India 2013 3,620 6.13%10.00% IDFC Limited 2013 3,234 5.48%9.28% Power Finance Corporation Limited 2017 2,667 4.52%8.45% Indian Railway Finance Corporation Limited 2018 974 1.65%
Financial institutions Total 10,495 17.78%
Housing finance services 10.00% ICICI Home Finance Company Limited 2013 3,554 6.02%9.80% LIC Housing Finance Limited 2017 2,400 4.07%11.15% HDFC Limited 2018 2,292 3.88%10.25% ICICI Home Finance Company Limited 2014 930 1.58%9.90% HDFC Limited 2013 640 1.08%
Housing finance services Total 9,816 16.63%
Refinery 11.45% Reliance Industries Limited 2013 4,012 6.80%11.00% Indian Oil Corporation Limited 2018 3,083 5.22%
Refinery Total 7,095 12.02%
Others 9,053 15.34%Net Current Assets 2,352 3.99%
Grand Total 59,023 100.00%
Health Saver Return Guarantee Fund II (2008-2009)
Industry Security name Market Value (Rs. ‘000) % of NAV
Financial institutions 10.60% Indian Railway Finance Corporation Limited 2018 3,552 5.35%11.25% Power Finance Corporation Limited 2018 2,462 3.71%9.25% Export Import Bank of India 2013 2,306 3.47%10.00% IDFC Limited 2013 2,113 3.18%11.00% Power Finance Corporation Limited 2018 1,978 2.98%8.45% Indian Railway Finance Corporation Limited 2018 974 1.47%
Financial institutions Total 13,385 20.16%
Housing finance services 10.25% ICICI Home Finance Company Limited 2014 4,649 7.00%10.25% HDFC Limited 2017 3,156 4.75%9.90% HDFC Limited 2013 1,331 2.01%9.80% LIC Housing Finance Limited 2017 1,328 2.00%9.14% LIC Housing Finance Limited 2018 836 1.26%10.35% HDFC Limited 2017 811 1.22%
Housing finance services Total 12,111 18.24%
Refinery 11.45% Reliance Industries Limited 2013 5,812 8.76%11.00% Indian Oil Corporation Limited 2018 5,246 7.90%
Refinery Total 11,058 16.66%
Banking services 10.85% HDFC Bank 2018 3,257 4.91%9.50% State Bank of India 2013 1,900 2.86%11.35% IDBI Bank 2013 1,860 2.80%9.85% HDFC Bank 2019 1,758 2.65%10.10% Corporation Bank 2018 1,507 2.27%
Banking services Total 10,282 15.49%
Others 15,694 23.64%Net Current Assets 3,853 5.81%
Grand Total 66,383 100.00%
ICICI PRU AR09_Final Pg29-197 (Ac).indd Sec1:159ICICI PRU AR09_Final Pg29-197 (Ac).indd Sec1:159 10/28/09 6:00:26 PM10/28/09 6:00:26 PM

I 160 I
FINANCIAL REPORT
Health Saver Return Guarantee Fund III (2008-2009)
Industry Security name Market Value (Rs. ‘000) % of NAV
Banking services 9.25% IDBI Bank 2014 4,071 6.22%9.50% Canara Bank 2013 3,070 4.69%10.43% Axis Bank 2009 2,975 4.55%9.85% HDFC Bank 2019 2,447 3.74%10.85% HDFC Bank 2018 2,069 3.16%9.50% Oriental Bank of Commerce 2013 1,200 1.83%10.10% Corporation Bank 2018 1,040 1.59%9.50% State Bank of India 2013 877 1.34%11.35% IDBI Bank 2013 649 0.99%8.70% ICICI Bank 2010 150 0.23%
Banking services Total 18,548 28.35%
Financial institutions 9.05% IDFC Limited 2013 4,128 6.31%9.68% Power Finance Corporation Limited 2018 1,856 2.84%8.46% Indian Railway Finance Corporation Limited 2014 1,306 2.00%11.00% Power Finance Corporation Limited 2018 1,168 1.78%10.00% IDFC Limited 2013 1,148 1.75%10.60% Indian Railway Finance Corporation Limited 2018 999 1.53%11.25% Power Finance Corporation Limited 2018 169 0.26%
Financial institutions Total 10,774 16.47%
Housing finance services 9.75% LIC Housing Finance Limited 2017 4,583 7.00%10.25% HDFC Limited 2017 1,190 1.82%11.25% HDFC Limited 2018 1,142 1.74%10.25% ICICI Home Finance Company Limited 2014 382 0.58%10.35% HDFC Limited 2017 156 0.24%
Housing finance services Total 7,453 11.39%
Others 22,991 35.14%Net Current Assets 5,666 8.66%
Grand Total 65,432 100.00%
Health Saver Return Guarantee Fund IV (2008-2009)
Industry Security name Market Value (Rs. ‘000) % of NAV
Net Current Assets 20,997 100.00%
Grand Total 20,997 100.00%
Invest Shield Life Fund (2008-2009)
Industry Security name Market Value (Rs. ‘000) % of NAV
Banking services 9.50% IDBI Bank 2013 49,300 4.34%ICICI Bank 2010 22,996 2.03%HDFC Bank 22,552 1.99%State Bank of India 14,431 1.27%11.55% State Bank of Patiala 2009 13,536 1.19%11.11% State Bank of India 2009 13,205 1.16%State Bank of Patiala 2010 11,655 1.03%Punjab National Bank 2010 11,613 1.02%Bank of India 2010 11,591 1.02%IDBI Bank 2010 11,563 1.02%10.85% HDFC Bank 2018 10,879 0.96%8.70% ICICI Bank 2010 7,652 0.67%9.95% Axis Bank 2019 7,245 0.64%Axis Bank 6,296 0.55%Bank of India 2009 6,033 0.53%Andhra Bank 2009 6,029 0.53%Allahabad Bank 2009 6,018 0.53%Punjab National Bank 2009 5,609 0.49%9.90% Canara Bank 2010 5,165 0.46%10.10% Axis Bank 2017 4,080 0.36%Oriental Bank of Commerce 2009 3,431 0.30%ABN Amro Bank 2009 3,393 0.30%Axis Bank 2009 3,144 0.28%Bank of Baroda 2010 2,940 0.26%UCO Bank 2010 2,890 0.25%Union Bank of India 2,629 0.23%8.90% State Bank of India 2018 2,088 0.18%Punjab National Bank 1,975 0.17%8.47% IDBI Bank 2011 609 0.05%
Banking services Total 270,547 23.84%
Financial institutions 9.00% IDFC Limited 2010 22,992 2.03%11.10% Power Finance Corporation Limited 2013 15,583 1.37%9.40% Power Finance Corporation Limited 2013 12,008 1.06%11.00% Power Finance Corporation Limited 2018 8,953 0.79%12.50% IDFC Limited 2009 8,053 0.71%11.10% Export Import Bank of India 2010 7,925 0.70%IDFC Limited 2010 6,742 0.59%9.03% Power Finance Corporation Limited 2013 5,630 0.50%8.55% Indian Railway Finance Corporation Limited 2019 5,550 0.49%8.60% IDFC Limited 2011 4,986 0.44%11.75% Rural Electrification Corporation Limited 2011 4,231 0.37%Export Import Bank of India 2009 3,090 0.27%8.50% Export Import Bank of India 2011 2,527 0.22%9.68% IRFC Limited 2012 2,415 0.21%
ICICI PRU AR09_Final Pg29-197 (Ac).indd Sec1:160ICICI PRU AR09_Final Pg29-197 (Ac).indd Sec1:160 10/28/09 6:00:26 PM10/28/09 6:00:26 PM

I 161 I
ANNUAL REPORT 2008-09ICICI PRUDENTIAL LIFE INSURANCE
Invest Shield Life Fund (2008-2009)
Industry Security name Market Value (Rs. ‘000) % of NAV
11.25% Power Finance Corporation Limited 2018 2,392 0.21%9.05% IDFC Limited 2010 2,309 0.20%8.46% Indian Railway Finance Corporation Limited 2014 2,119 0.19%9.76% IRFC Limited 2012 2,006 0.18%8.95% IDFC Limited 2018 1,979 0.17%9.58% Export Import Bank of India 2009 1,838 0.16%8.55% Power Finance Corporation Limited 2011 1,490 0.13%9.05% Export Import Bank of India 2010 1,446 0.13%8.45% Indian Railway Finance Corporation Limited 2018 1,410 0.12%8.78% Power Finance Corporation Limited 2016 960 0.08%9.25% Export Import Bank of India 2012 804 0.07%8.83% Indian Railway Finance Corporation Limited 2012 801 0.07%8.57% IRFC Limited 2016 772 0.07%
Financial institutions Total 131,011 11.54%
Others 693,876 61.14%Net Current Assets 39,433 3.47%
Grand Total 1,134,867 100.00%
Invest Shield Life Fund(2007-2008)
Industry Security name Market Value (Rs. ‘000) % of NAV
Banking services UCO Bank 2009 58,528 6.27%ICICI Bank 2009 24,699 2.64%10.10% State Bank of India 2022 17,409 1.86%10.30% ICICI Bank 2009 14,209 1.52%Punjab National Bank 2009 12,983 1.39%Axis Bank 12,458 1.33%9.90% Canara Bank 2010 11,845 1.27%9.90% Canara Bank 2009 11,498 1.23%Union Bank of India 2008 11,101 1.19%IDBI Bank 2009 10,895 1.17%State Bank of India 10,600 1.13%9.90% IDBI Bank 2009 6,855 0.73%10.43% Axis Bank 2009 5,547 0.59%11.06% Canara Bank 2009 5,453 0.58%HDFC Bank 4,911 0.53%Kotak Mahindra Bank 2008 4,526 0.48%10.50% Axis Bank 2008 4,400 0.47%10.10% Axis Bank 2017 4,187 0.45%11.10% Canara Bank 2009 4,180 0.45%10.50% Axis Bank 2009 3,545 0.38%9.35% Punjab National Bank 2023 3,451 0.37%8.40% Axis Bank 2008 2,482 0.27%9.50% State Bank of Patiala 2008 2,000 0.21%9.78% State Bank of Bikaner and Jaipur 2022 1,555 0.17%9.90% State Bank of Patiala 2022 1,431 0.15%10.00% ICICI Bank 2017 1,417 0.15%Citibank 2008 1,053 0.11%6.75% IDBI Bank 2008 1,029 0.11%Punjab National Bank 824 0.09%9.35% Punjab National Bank 2022 603 0.06%8.47% IDBI Bank 2013 591 0.06%
Banking services Total 256,265 27.44%
Financial institutions 9.00% IDFC Limited 2010 22,462 2.41%9.40% Power Finance Corporation Limited 2013 10,981 1.18%9.25% Export Import Bank of India 2012 9,133 0.98%9.79% IDFC Limited 2009 6,923 0.74%9.03% Power Finance Corporation Limited 2013 5,466 0.59%NABARD 2018 5,316 0.57%9.50% NABARD 2012 5,009 0.54%Export Import Bank of India 2008 4,268 0.46%9.80% Power Finance Corporation Limited 2012 4,262 0.46%10.04% IRFC Limited 2027 3,687 0.39%10.25% IDFC Limited 2008 3,578 0.38%8.49% Power Finance Corporation Limited 2011 3,501 0.37%8.60% IDFC Limited 2011 3,296 0.35%8.50% Export Import Bank of India 2011 2,433 0.26%9.10% Export Import Bank of India 2010 2,426 0.26%9.68% IRFC Limited 2012 2,349 0.25%9.05% IDFC Limited 2010 2,258 0.24%8.75% IRFC Limited 2013 2,055 0.22%8.95% IDFC Limited 2018 1,972 0.21%9.76% IRFC Limited 2012 1,953 0.21%8.15% NABARD 2009 1,877 0.20%9.58% Export Import Bank of India 2010 1,827 0.20%10.00% NABARD 2010 1,819 0.19%8.00% Export Import Bank of India 2009 1,809 0.19%8.55% Power Finance Corporation Limited 2011 1,448 0.16%8.40% Export Import Bank of India 2010 1,320 0.14%9.95% IRFC Limited 2022 1,249 0.13%8.78% Power Finance Corporation Limited 2016 943 0.10%8.57% IRFC Limited 2016 757 0.08%9.68% IRFC Limited 2008 669 0.07%Power Finance Corporation Limited 2008 433 0.05%
Financial institutions Total 117,479 12.58%
Others 551,709 59.07%Net Current Assets 8,482 0.91%
Grand Total 933,935 100.00%
ICICI PRU AR09_Final Pg29-197 (Ac).indd Sec1:161ICICI PRU AR09_Final Pg29-197 (Ac).indd Sec1:161 10/28/09 6:00:26 PM10/28/09 6:00:26 PM

I 162 I
FINANCIAL REPORT
Balancer Fund (2008-2009)
Industry Security name Market Value (Rs. ‘000) % of NAV
Banking services HDFC Bank 608,247 2.80%ICICI Bank 2010 588,488 2.71%State Bank of India 514,339 2.37%Bank of India 2009 348,007 1.60%Axis Bank 325,432 1.50%Punjab National Bank 2010 299,992 1.38%State Bank of Patiala 2010 204,748 0.94%IDBI Bank 2010 204,208 0.94%Bank of India 2010 203,430 0.94%Punjab National Bank 2009 193,671 0.89%8.70% ICICI Bank 2010 187,938 0.87%Punjab National Bank 180,690 0.83%9.95% Axis Bank 2019 127,349 0.59%Allahabad Bank 2009 120,407 0.56%Andhra Bank 2009 105,608 0.49%8.75% Canara Bank 2010 65,335 0.30%Oriental Bank of Commerce 2009 60,122 0.28%Oriental Bank of Commerce 57,582 0.27%UCO Bank 2010 50,637 0.23%Bank of Baroda 2010 50,559 0.23%8.90% State Bank of India 2018 39,537 0.18%9.25% IDBI Bank 2014 37,694 0.17%Union Bank of India 2010 28,785 0.13%9.90% State Bank of Patiala 2017 28,123 0.13%10.10% Axis Bank 2017 26,887 0.12%11.00% IDBI Bank 2018 21,035 0.10%8.47% IDBI Bank 2011 18,535 0.09%9.35% Punjab National Bank 2017 8,131 0.04%9.50% Canara Bank 2013 1,000 0.00%
Banking services Total 4,706,516 21.70%
Financial institutions 9.40% Power Finance Corporation Limited 2013 260,886 1.20%9.00% IDFC Limited 2010 233,547 1.08%Power Finance Corporation Limited PTC 2010 179,648 0.83%8.60% IDFC Limited 2011 162,643 0.75%11.10% Export Import Bank of India 2010 156,023 0.72%8.55% Indian Railway Finance Corporation Limited 2019 137,488 0.63%11.00% Power Finance Corporation Limited 2018 126,636 0.58%9.03% Power Finance Corporation Limited 2013 123,163 0.57%IDFC Limited 2010 120,405 0.56%9.45% Rural Electrification Corporation Limited 2013 115,762 0.53%8.50% Export Import Bank of India 2011 108,024 0.50%11.25% Power Finance Corporation Limited 2018 95,227 0.44%Power Finance Corporation Limited 80,904 0.37%9.50% NABARD 2012 65,809 0.30%9.05% IDFC Limited 2010 65,073 0.30%10.60% Indian Railway Finance Corporation Limited 2018 59,495 0.27%8.55% Power Finance Corporation Limited 2011 59,491 0.27%8.45% Indian Railway Finance Corporation Limited 2018 58,045 0.27%11.75% Rural Electrification Corporation Limited 2011 57,282 0.26%9.68% IRFC Limited 2012 57,124 0.26%9.76% IRFC Limited 2012 55,924 0.26%9.25% Export Import Bank of India 2013 55,860 0.26%9.58% Export Import Bank of India 2009 50,580 0.23%8.46% Indian Railway Finance Corporation Limited 2014 39,864 0.18%8.95% IDFC Limited 2018 38,918 0.18%8.65% Rural Electrification Corporation Limited 2019 37,968 0.18%11.10% Power Finance Corporation Limited 2013 37,715 0.17%9.40% NABARD 2010 35,479 0.16%8.57% IRFC Limited 2016 30,910 0.14%8.78% Power Finance Corporation Limited 2016 28,436 0.13%9.25% Export Import Bank of India 2012 27,745 0.13%9.05% Export Import Bank of India 2010 27,410 0.13%9.28% Power Finance Corporation Limited 2017 26,838 0.12%9.25% Export Import Bank of India 2012 17,054 0.08%8.83% Indian Railway Finance Corporation Limited 2012 16,988 0.08%10.04% IRFC Limited 2027 7,606 0.04%
Financial institutions Total 2,857,970 13.18%
Others 13,555,992 62.51%Net Current Assets 565,052 2.61%
Grand Total 21,685,530 100.00%
Balancer Fund (2007-2008)
Industry Security name Market Value (Rs. ‘000) % of NAV
Banking services HDFC Bank 721,474 3.04%Axis Bank 619,454 2.61%ICICI Bank 2009 552,036 2.32%Union Bank of India 2008 317,554 1.34%10.30% ICICI Bank 2009 314,230 1.32%Punjab National Bank 2009 285,058 1.20%10.10% State Bank of India 2022 248,191 1.05%9.90% Canara Bank 2010 241,925 1.02%9.90% Canara Bank 2009 234,836 0.99%State Bank of India 233,380 0.98%IDBI Bank 2009 224,336 0.94%11.06% Canara Bank 2009 166,146 0.70%Punjab National Bank 155,831 0.66%
ICICI PRU AR09_Final Pg29-197 (Ac).indd Sec1:162ICICI PRU AR09_Final Pg29-197 (Ac).indd Sec1:162 10/28/09 6:00:27 PM10/28/09 6:00:27 PM

I 163 I
ANNUAL REPORT 2008-09ICICI PRUDENTIAL LIFE INSURANCE
Balancer Fund (2007-2008)
Industry Security name Market Value (Rs. ‘000) % of NAV
11.10% Canara Bank 2009 151,985 0.64%9.90% IDBI Bank 2009 149,905 0.63%10.43% Axis Bank 2009 122,841 0.52%10.20% State Bank of India 2022 122,390 0.52%10.50% Axis Bank 2009 93,323 0.39%Kotak Mahindra Bank 2008 82,776 0.35%9.35% Punjab National Bank 2023 77,378 0.33%10.10% Axis Bank 2017 76,251 0.32%Punjab National Bank 2008 67,555 0.28%6.75% IDBI Bank 2008 65,372 0.28%9.50% State Bank of Patiala 2008 52,500 0.22%8.40% Axis Bank 2008 49,639 0.21%10.00% ICICI Bank 2017 37,016 0.16%9.78% State Bank of Bikaner and Jaipur 2022 34,060 0.14%9.90% State Bank of Patiala 2022 31,966 0.13%Citibank 2008 31,209 0.13%11.00% IDBI Bank 2008 30,060 0.13%UCO Bank 2009 28,043 0.12%8.47% IDBI Bank 2013 17,987 0.08%9.35% Punjab National Bank 2022 13,537 0.06%
Banking services Total 5,650,244 23.79%
Financial institutions 9.40% Power Finance Corporation Limited 2013 240,676 1.01%9.00% IDFC Limited 2010 228,164 0.96%IDFC Limited 2008 225,267 0.95%9.50% NABARD 2012 177,200 0.75%9.79% IDFC Limited 2009 143,308 0.60%9.35% IDFC Limited 2009 141,540 0.60%9.80% Power Finance Corporation Limited 2012 129,915 0.55%8.60% IDFC Limited 2011 125,041 0.53%9.03% Power Finance Corporation Limited 2013 122,760 0.52%10.25% IDFC Limited 2008 116,077 0.49%10.04% IRFC Limited 2027 111,586 0.47%8.50% Export Import Bank of India 2011 103,989 0.44%Power Finance Corporation Limited 2008 101,191 0.43%8.49% Power Finance Corporation Limited 2011 99,934 0.42%8.15% NABARD 2009 77,631 0.33%8.00% Export Import Bank of India 2009 66,339 0.28%9.05% IDFC Limited 2010 63,623 0.27%9.10% Export Import Bank of India 2010 62,451 0.26%8.55% Power Finance Corporation Limited 2011 57,809 0.24%5.85% Power Finance Corporation Limited 2010 55,719 0.23%10.00% NABARD 2010 55,577 0.23%9.68% IRFC Limited 2012 55,568 0.23%Export Import Bank of India 2008 54,484 0.23%9.76% IRFC Limited 2012 54,431 0.23%9.58% Export Import Bank of India 2010 50,265 0.21%8.75% IRFC Limited 2013 45,416 0.19%8.40% Export Import Bank of India 2010 40,320 0.17%9.95% IRFC Limited 2022 40,023 0.17%8.95% IDFC Limited 2018 38,786 0.16%9.25% Export Import Bank of India 2012 37,006 0.16%8.57% IRFC Limited 2016 30,317 0.13%8.78% Power Finance Corporation Limited 2016 27,950 0.12%NABARD 2018 13,580 0.06%Power Finance Corporation Limited 3,243 0.01%
Financial institutions Total 2,997,186 12.62%
Others 14,248,179 59.99%Net Current Assets 853,904 3.60%
Grand Total 23,749,513 100.00%
Protector Fund (2008-2009)
Industry Security name Market Value(Rs. ‘000) % of NAV
Banking services 9.85% HDFC Bank 2019 504,886 3.42%11.11% State Bank of India 2009 499,476 3.38%ICICI Bank 2010 486,121 3.29%9.90% Canara Bank 2010 360,550 2.44%Bank of India 2009 303,261 2.05%Bank of India 2010 174,849 1.18%IDBI Bank 2010 174,415 1.18%Punjab National Bank 2009 169,464 1.15%11.55% State Bank of Patiala 2009 158,804 1.07%8.75% Canara Bank 2010 132,949 0.90%9.95% Axis Bank 2019 109,405 0.74%Andhra Bank 2009 90,804 0.61%Allahabad Bank 2009 90,774 0.61%12.57% State Bank of India 2009 90,486 0.61%Canara Bank 2010 84,427 0.57%State Bank of Patiala 2010 82,081 0.56%Bank of Baroda 2010 63,253 0.43%Oriental Bank of Commerce 2009 51,758 0.35%10.85% HDFC Bank 2018 51,149 0.35%UCO Bank 2010 43,595 0.29%9.50% Oriental Bank of Commerce 2013 42,500 0.29%8.90% State Bank of India 2018 31,152 0.21%Union Bank of India 2010 27,583 0.19%Punjab National Bank 2010 20,574 0.14%
ICICI PRU AR09_Final Pg29-197 (Ac).indd Sec1:163ICICI PRU AR09_Final Pg29-197 (Ac).indd Sec1:163 10/28/09 6:00:27 PM10/28/09 6:00:27 PM

I 164 I
FINANCIAL REPORT
Protector Fund (2008-2009)
Industry Security name Market Value(Rs. ‘000) % of NAV
Axis Bank 2009 19,526 0.13%8.47% IDBI Bank 2011 11,486 0.08%ABN Amro Bank 2009 10,220 0.07%9.50% Canara Bank 2013 7,012 0.05%10.43% Axis Bank 2009 3,268 0.02%8.70% ICICI Bank 2010 20 0.00%
Banking services Total 3,895,848 26.35%
Financial institutions 9.40% Power Finance Corporation Limited 2013 162,858 1.10%9.35% IDFC Limited 2009 142,425 0.96%Power Finance Corporation Limited PTC 2010 126,810 0.86%8.45% Indian Railway Finance Corporation Limited 2018 126,073 0.85%11.00% Power Finance Corporation Limited 2018 116,260 0.79%8.60% IDFC Limited 2011 109,720 0.74%11.10% Export Import Bank of India 2010 104,358 0.71%IDFC Limited 2010 100,444 0.68%11.75% Rural Electrification Corporation Limited 2011 85,457 0.58%8.55% Indian Railway Finance Corporation Limited 2019 84,652 0.57%11.10% Power Finance Corporation Limited 2013 80,636 0.55%9.03% Power Finance Corporation Limited 2013 72,676 0.49%9.68% IRFC Limited 2012 63,401 0.43%8.50% Export Import Bank of India 2011 60,648 0.41%National Housing Bank 2009 47,828 0.32%9.45% Rural Electrification Corporation Limited 2013 42,218 0.29%IDFC Limited 2009 41,124 0.28%Export Import Bank of India 2009 39,258 0.27%9.80% NABARD 2012 37,576 0.25%8.55% Power Finance Corporation Limited 2011 36,905 0.25%11.25% Power Finance Corporation Limited 2018 36,630 0.25%9.76% IRFC Limited 2012 36,623 0.25%8.46% Indian Railway Finance Corp. Limited 2014 32,874 0.22%9.58% Export Import Bank of India 2009 32,808 0.22%10.00% IDFC Limited 2013 29,796 0.20%9.28% Power Finance Corporation Limited 2017 22,241 0.15%9.05% Export Import Bank of India 2010 21,581 0.15%9.00% IDFC Limited 2010 20,267 0.14%8.57% IRFC Limited 2016 19,274 0.13%9.50% NABARD 2012 17,621 0.12%8.78% Power Finance Corporation Limited 2016 12,514 0.08%9.25% Export Import Bank of India 2012 9,720 0.07%8.83% Indian Railway Finance Corporation Limited 2012 9,683 0.07%
Financial institutions Total 1,982,959 13.41%
Others 8,298,250 56.13%Net Current Assets 606,416 4.10%
Grand Total 14,783,473 100.00%
Protector Fund (2007-2008)
Industry Security name Market Value (Rs. ‘000) % of NAV
Banking services ICICI Bank 2009 297,237 3.20%9.50% State Bank of Patiala 2009 250,000 2.69%Union Bank of India 2008 193,519 2.08%10.10% State Bank of India 2022 186,123 2.00%10.30% ICICI Bank 2009 186,089 2.00%Punjab National Bank 2009 171,430 1.84%9.90% Canara Bank 2010 135,019 1.45%9.90% Canara Bank 2009 131,063 1.41%IDBI Bank 2009 125,683 1.35%11.06% Canara Bank 2009 94,511 1.02%9.90% IDBI Bank 2009 93,134 1.00%11.10% Canara Bank 2009 86,230 0.93%ABN Amro Bank 2008 76,547 0.82%10.43% Axis Bank 2009 71,631 0.77%10.20% State Bank of India 2022 66,055 0.71%6.75% IDBI Bank 2008 59,933 0.64%10.00% ICICI Bank 2017 53,015 0.57%10.10% Axis Bank 2017 52,333 0.56%9.35% Punjab National Bank 2023 44,610 0.48%9.50% State Bank of Patiala 2008 42,000 0.45%Kotak Mahindra Bank 2008 41,925 0.45%Punjab National Bank 2008 34,216 0.37%10.50% Axis Bank 2009 32,627 0.35%Citibank 2008 20,914 0.22%9.78% State Bank of Bikaner and Jaipur 2022 20,530 0.22%9.90% State Bank of Patiala 2022 18,566 0.20%UCO Bank 2009 14,202 0.15%8.47% IDBI Bank 2013 11,147 0.12%10.50% Axis Bank 2008 8,000 0.09%9.35% Punjab National Bank 2022 5,793 0.06%
Banking services Total 2,624,082 28.22%
Financial institutions 9.50% NABARD 2012 248,986 2.68%9.40% Power Finance Corporation Limited 2013 147,556 1.59%8.49% Power Finance Corporation Limited 2011 135,299 1.46%9.80% Power Finance Corporation Limited 2012 97,535 1.05%8.60% IDFC Limited 2011 87,630 0.94%9.79% IDFC Limited 2009 80,988 0.87%9.35% IDFC Limited 2009 71,688 0.77%
ICICI PRU AR09_Final Pg29-197 (Ac).indd Sec1:164ICICI PRU AR09_Final Pg29-197 (Ac).indd Sec1:164 10/28/09 6:00:27 PM10/28/09 6:00:27 PM

I 165 I
ANNUAL REPORT 2008-09ICICI PRUDENTIAL LIFE INSURANCE
Protector Fund (2007-2008)
Industry Security name Market Value (Rs. ‘000) % of NAV
9.03% Power Finance Corporation Limited 2013 70,555 0.76%9.68% IRFC Limited 2012 61,673 0.66%8.50% Export Import Bank of India 2011 58,382 0.63%10.00% NABARD 2010 56,658 0.61%IDFC Limited 2008 48,971 0.53%Power Finance Corporation Limited 2008 48,810 0.52%10.04% IRFC Limited 2027 48,625 0.52%8.15% NABARD 2009 47,802 0.51%8.40% Export Import Bank of India 2010 41,105 0.44%Export Import Bank of India 2008 39,398 0.42%9.10% Export Import Bank of India 2010 39,244 0.42%9.80% NABARD 2012 36,436 0.39%8.55% Power Finance Corporation Limited 2011 35,861 0.39%9.76% IRFC Limited 2012 35,645 0.38%9.58% Export Import Bank of India 2010 32,603 0.35%8.75% IRFC Limited 2013 26,929 0.29%9.68% IRFC Limited 2008 24,928 0.27%9.95% IRFC Limited 2022 23,741 0.26%8.57% IRFC Limited 2016 18,904 0.20%8.78% Power Finance Corporation Limited 2016 12,300 0.13%9.25% Export Import Bank of India 2012 8,958 0.10%
Financial institutions Total 1,687,210 18.15%
Housing finance services 9.80% LIC Housing Finance Limited 2017 190,807 2.05%9.75% LIC Housing Finance Limited 2017 147,041 1.58%9.50% HDFC Limited 2009 138,160 1.49%9.50% HDFC Limited 2017 105,478 1.13%10.00% ICICI Home Finance Company Limited 2013 82,872 0.89%9.15% LIC Housing Finance Limited 2010 78,878 0.85%8.50% HDFC Limited 2008 45,792 0.49%7.15% HDFC Limited 2010 40,614 0.44%9.50% HDFC Limited 2013 34,928 0.38%9.20% HDFC Limited 2012 33,880 0.36%10.25% HDFC Limited 2012 33,276 0.36%HDFC Limited 2008 28,587 0.31%9.70% HDFC Limited 2017 22,977 0.25%8.95% HDFC Limited 2010 22,203 0.24%6.65% HDFC Limited 2008 21,830 0.23%10.00% HDFC Limited 2010 19,998 0.22%7.60% HDFC Limited 2017 9,314 0.10%5.82% HDFC Limited 2008 4,501 0.05%
Housing finance services Total 1,061,136 11.41%
Others 3,527,640 37.94%Net Current Assets 397,633 4.28%
Grand Total 9,297,701 100.00%
Maximiser Fund (2008-2009)
Industry Security name Market Value(Rs. ‘000) % of NAV
Banking services HDFC Bank 6,625,204 8.71%State Bank of India 5,458,050 7.18%Axis Bank 3,645,483 4.79%Punjab National Bank 1,544,121 2.03%Oriental Bank of Commerce 609,822 0.80%Bank of India 2009 580,303 0.76%Union Bank of India 443,577 0.58%8.70% ICICI Bank 2010 406,383 0.53%Punjab National Bank 2010 336,942 0.44%State Bank of Patiala 2010 139,379 0.18%9.50% IDBI Bank 2013 133,708 0.18%ICICI Bank 2010 93,715 0.12%8.50% IDBI Bank 2010 72,422 0.10%Union Bank of India 2010 54,146 0.07%Punjab National Bank 2009 48,419 0.06%9.50% Canara Bank 2013 40,050 0.05%Andhra Bank 2009 23,286 0.03%Canara Bank 2010 17,938 0.02%9.50% State Bank of India 2013 14,370 0.02%
Banking services Total 20,287,318 26.67%
Others 55,430,228 72.87%Net Current Assets 348,827 0.46%
Grand Total 76,066,373 100.00%
ICICI PRU AR09_Final Pg29-197 (Ac).indd Sec1:165ICICI PRU AR09_Final Pg29-197 (Ac).indd Sec1:165 10/28/09 6:00:27 PM10/28/09 6:00:27 PM

I 166 I
FINANCIAL REPORT
Maximiser Fund (2007-2008)
Industry Security name Market Value (Rs. ‘000) % of NAV
Banking services HDFC Bank 7,660,733 7.88%Axis Bank 6,463,624 6.65%State Bank of India 3,927,436 4.04%Punjab National Bank 1,811,427 1.86%ABN Amro Bank 2008 5,263 0.01%Union Bank of India 2008 1,280 0.00%ICICI Bank 2009 214 0.00%Punjab National Bank 2009 158 0.00%9.50% State Bank of Patiala 2008 50 0.00%
Banking services Total 19,870,185 20.43%
Refinery Reliance Industries Limited 11,780,132 12.11%Indian Oil Corporation Limited 117,942 0.12%
Refinery Total 11,898,074 12.23%
Computer software Satyam Computers Limited 4,851,170 4.99%Infosys Technologies Limited 4,549,080 4.68%Kpit Cummins Infosystem Limited 168,272 0.17%Tech Mahindra Limited. 157,638 0.16%Tata Consultancy Services Limited 137,942 0.14%Wipro Limited 74,794 0.08%
Computer software Total 9,938,896 10.22%
Others 55,501,876 57.06%Net Current Assets 51,787 0.05%
Grand Total 97,260,818 100.00%
Preserver Fund (2008-2009)
Industry Security name Market Value(Rs. ‘000) % of NAV
Banking services Punjab National Bank 2010 182,852 6.32%12.57% State Bank of India 2009 162,500 5.62%Bank of Baroda 2010 149,698 5.17%Axis Bank 2009 124,604 4.31%Hongkong & Shanghai Banking Corporation Limited 2009 94,559 3.27%8.75% Canara Bank 2010 89,122 3.08%10.43% Axis Bank 2009 81,883 2.83%ABN Amro Bank 2009 78,435 2.71%ICICI Bank 2009 70,836 2.45%ICICI Bank 2010 61,463 2.12%9.90% Canara Bank 2010 56,925 1.97%State Bank of Hyderabad 2010 55,817 1.93%Canara Bank 2010 52,064 1.80%State Bank of Patiala 2010 31,224 1.08%Bank of India 2010 30,979 1.07%IDBI Bank 2010 30,902 1.07%8.50% IDBI Bank 2010 30,070 1.04%11.11% State Bank of India 2009 29,525 1.02%11.55% State Bank of Patiala 2009 29,430 1.02%Syndicate Bank 2010 23,177 0.80%HDFC Bank 2009 20,562 0.71%Andhra Bank 2009 16,148 0.56%Bank of India 2009 16,124 0.56%Allahabad Bank 2009 16,083 0.56%Union Bank of India 2010 12,609 0.44%UCO Bank 2010 7,724 0.27%
Banking services Total 1,555,315 53.76%
Financial institutions National Housing Bank 2009 122,528 4.24%Export Import Bank of India 2009 105,327 3.64%IDFC Limited 2009 102,926 3.56%9.05% IDFC Limited 2009 82,323 2.85%8.00% NABARD 2009 34,861 1.21%9.35% IDFC Limited 2009 10,419 0.36%
Financial institutions Total 458,384 15.84%
Others 810,432 28.01%Net Current Assets 68,845 2.38%
Grand Total 2,892,976 100.00%
ICICI PRU AR09_Final Pg29-197 (Ac).indd Sec1:166ICICI PRU AR09_Final Pg29-197 (Ac).indd Sec1:166 10/28/09 6:00:27 PM10/28/09 6:00:27 PM

I 167 I
ANNUAL REPORT 2008-09ICICI PRUDENTIAL LIFE INSURANCE
Preserver Fund (2007-2008)
Industry Security name Market Value (Rs. ‘000) % of NAV
Banking services 9.40% Yes Bank 2008 140,000 10.35%ABN Amro Bank 2008 114,820 8.49%9.50% State Bank of Patiala 2008 105,300 7.79%10.50% Axis Bank 2008 104,000 7.69%ICICI Bank 2009 100,890 7.46%State Bank of Mysore 2008 89,777 6.64%Union Bank of India 2008 83,540 6.18%Canara Bank 2008 57,573 4.26%Kotak Mahindra Bank 2008 39,360 2.91%10.43% Axis Bank 2009 32,507 2.40%11.06% Canara Bank 2009 29,587 2.19%10.30% ICICI Bank 2009 27,046 2.00%Punjab National Bank 2009 24,195 1.79%Corporation Bank 2009 21,557 1.59%9.90% Canara Bank 2009 13,150 0.97%10.50% Axis Bank 2009 4,792 0.35%Citibank 2008 4,008 0.30%IDBI Bank 2009 1,809 0.13%
Banking services Total 993,911 73.48%
Securities and stock traders DSP Merill Lynch Capital Limited 2008 90,946 6.72%Tata Sons Limited 2008 59,054 4.37%
Securities and stock traders Total 150,000 11.09%
Others 196,653 14.54%Net Current Assets 12,018 0.89%
Grand Total 1,352,582 100.00%
Multiplier Fund (2008-2009)
Industry Security name Market Value(Rs. ‘000) % of NAV
Banking services State Bank of India 524,082 5.83%HDFC Bank 473,762 5.27%Axis Bank 191,329 2.13%Punjab National Bank 188,612 2.10%Oriental Bank of Commerce 81,474 0.91%
Banking services Total 1,459,259 16.22%
Refinery Reliance Industries Limited 753,100 8.37%Reliance Petroleum Limited 117,576 1.31%Bharat Petroleum Corporation Limited 95,926 1.07%Hindustan Petroleum Corporation Limited 62,666 0.70%Indian Oil Corporation Limited 48,475 0.54%
Refinery Total 1,077,743 11.98%
Others 6,445,853 71.66%Net Current Assets 12,649 0.14%
Grand Total 8,995,504 100.00%
Multiplier Fund (2007-2008)
Industry Security name Market Value (Rs. ‘000) % of NAV
Banking services HDFC Bank 341,454 6.52%Axis Bank 313,965 6.00%State Bank of India 181,025 3.46%Punjab National Bank 28,830 0.55%
Banking services Total 865,274 16.53%
Refinery Reliance Industries Limited 587,617 11.23%Reliance Petroleum Limited 126,022 2.41%Bharat Petroleum Corporation Limited 26,399 0.50%Hindustan Petroleum Corporation Limited 2,799 0.05%
Refinery Total 742,837 14.19%
Others 3,339,258 63.80%Net Current Assets 286,499 5.47%
Grand Total 5,233,868 100.00%
ICICI PRU AR09_Final Pg29-197 (Ac).indd Sec1:167ICICI PRU AR09_Final Pg29-197 (Ac).indd Sec1:167 10/28/09 6:00:28 PM10/28/09 6:00:28 PM

I 168 I
FINANCIAL REPORT
New Invest Shield Balanced Fund (2008-2009)
Industry Security name Market Value(Rs. ‘000) % of NAV
Banking services 10.43% Axis Bank 2009 37,831 2.62%HDFC Bank 35,112 2.43%State Bank of Patiala 2010 32,512 2.25%ICICI Bank 2010 27,285 1.89%8.70% ICICI Bank 2010 21,253 1.47%State Bank of India 18,904 1.31%Punjab National Bank 2010 13,764 0.95%Bank of India 2010 13,751 0.95%IDBI Bank 2010 13,717 0.95%11.55% State Bank of Patiala 2009 12,546 0.87%10.85% HDFC Bank 2018 12,196 0.84%11.11% State Bank of India 2009 11,912 0.82%Axis Bank 11,744 0.81%9.90% Canara Bank 2010 11,701 0.81%9.95% Axis Bank 2019 8,606 0.60%Bank of India 2009 7,157 0.50%Andhra Bank 2009 7,145 0.49%Allahabad Bank 2009 7,139 0.49%Punjab National Bank 2009 6,979 0.48%Union Bank of India 4,787 0.33%Oriental Bank of Commerce 2009 4,071 0.28%Bank of Baroda 2010 3,487 0.24%10.10% Axis Bank 2017 3,487 0.24%UCO Bank 2010 3,429 0.24%ABN Amro Bank 2009 3,417 0.24%Punjab National Bank 3,086 0.21%Axis Bank 2009 2,982 0.21%8.90% State Bank of India 2018 2,376 0.16%8.47% IDBI Bank 2011 374 0.03%
Banking services Total 342,750 23.73%
Others 1,074,372 74.39%Net Current Assets 27,154 1.88%
Grand Total 1,444,276 100.00%
New Invest Shield Balanced Fund (2007-2008)
Industry Security name Market Value (Rs. ‘000) % of NAV
Banking services UCO Bank 2009 58,277 6.20%ICICI Bank 2009 21,240 2.26%9.40% Yes Bank 2008 17,500 1.86%Axis Bank 15,641 1.66%10.10% State Bank of India 2022 13,800 1.47%Union Bank of India 2008 12,563 1.34%10.30% ICICI Bank 2009 12,259 1.30%State Bank of India 10,906 1.16%Punjab National Bank 2009 10,703 1.14%HDFC Bank 6,419 0.68%9.90% IDBI Bank 2009 5,954 0.63%Punjab National Bank 5,376 0.57%Kotak Mahindra Bank 2008 4,920 0.52%10.43% Axis Bank 2009 4,731 0.50%Canara Bank 2008 3,841 0.41%10.10% Axis Bank 2017 3,585 0.38%10.50% Axis Bank 2009 3,430 0.36%11.06% Canara Bank 2009 3,328 0.35%IDBI Bank 2009 3,084 0.33%9.35% Punjab National Bank 2023 2,978 0.32%9.90% Canara Bank 2010 2,701 0.29%10.50% Axis Bank 2008 2,625 0.28%9.90% Canara Bank 2009 2,621 0.28%11.00% IDBI Bank 2008 2,505 0.27%11.10% Canara Bank 2009 2,170 0.23%10.00% ICICI Bank 2017 1,818 0.19%9.50% State Bank of Patiala 2008 1,500 0.16%9.78% State Bank of Bikaner and Jaipur 2022 1,340 0.14%9.90% State Bank of Patiala 2022 1,235 0.13%Citibank 2008 660 0.07%9.35% Punjab National Bank 2022 519 0.06%8.47% IDBI Bank 2013 363 0.04%
Banking services Total 240,592 25.58%
Others 741,598 78.85%Net Current Assets (41,637) (4.43%)
Grand Total 940,553 100.00%
Pension R.I.C.H. Fund (2008-2009)
Industry Security name Market Value(Rs. ‘000) % of NAV
Banking services State Bank of India 574,313 5.10%HDFC Bank 558,732 4.96%Punjab National Bank 364,363 3.23%Axis Bank 237,351 2.11%8.75% Canara Bank 2010 137,630 1.22%8.70% ICICI Bank 2010 62,152 0.55%Punjab National Bank 2010 47,305 0.42%
Banking services Total 1,981,846 17.59%
Others 9,302,641 82.58%Net Current Assets (19,903) (0.18%)
Grand Total 11,264,584 100.00%
ICICI PRU AR09_Final Pg29-197 (Ac).indd Sec1:168ICICI PRU AR09_Final Pg29-197 (Ac).indd Sec1:168 10/28/09 6:00:28 PM10/28/09 6:00:28 PM

I 169 I
ANNUAL REPORT 2008-09ICICI PRUDENTIAL LIFE INSURANCE
Pension R.I.C.H. Fund (2007-2008)
Industry Security name Market Value (Rs. ‘000) % of NAV
Banking services HDFC Bank 149,100 4.60%Axis Bank 87,673 2.71%State Bank of India 82,413 2.54%Punjab National Bank 47,453 1.46%
Banking services Total 366,639 11.31%
Others 1,953,479 60.28%Net Current Assets 920,359 28.40%
Grand Total 3,240,477 100.00%
Pension Flexi Balanced Fund (2008-2009)
Industry Security name Market Value(Rs. ‘000) % of NAV
Banking services HDFC Bank 30,422 3.23%State Bank of India 30,057 3.19%ICICI Bank 2010 15,957 1.70%9.85% HDFC Bank 2019 14,394 1.53%Axis Bank 8,797 0.93%Bank of India 2010 8,042 0.85%IDBI Bank 2010 8,022 0.85%State Bank of Patiala 2010 7,961 0.85%Punjab National Bank 2010 7,932 0.84%11.11% State Bank of India 2009 5,727 0.61%9.95% Axis Bank 2019 5,035 0.53%Punjab National Bank 2009 4,361 0.46%11.55% State Bank of Patiala 2009 4,230 0.45%Bank of India 2009 4,186 0.44%Andhra Bank 2009 4,118 0.44%Union Bank of India 3,921 0.42%Punjab National Bank 2,880 0.31%Oriental Bank of Commerce 2009 2,381 0.25%8.70% ICICI Bank 2010 2,232 0.24%Bank of Baroda 2010 2,039 0.22%UCO Bank 2010 2,005 0.21%9.90% Canara Bank 2010 1,913 0.20%10.43% Axis Bank 2009 1,631 0.17%ABN Amro Bank 2009 1,501 0.16%10.10% Axis Bank 2017 1,489 0.16%8.90% State Bank of India 2018 1,311 0.14%Axis Bank 2009 1,310 0.14%8.47% IDBI Bank 2011 79 0.01%
Banking services Total 183,933 19.54%
Others 718,368 76.33%Net Current Assets 38,826 4.13%
Grand Total 941,127 100.00%
Pension Flexi Balanced Fund (2007-2008)
Industry Security name Market Value (Rs. ‘000) % of NAV
Banking services 9.50% State Bank of Patiala 2008 13,900 2.67%Axis Bank 12,717 2.44%ICICI Bank 2009 7,249 1.39%Punjab National Bank 6,104 1.17%9.40% Yes Bank 2008 5,000 0.96%10.30% ICICI Bank 2009 4,658 0.89%State Bank of India 4,428 0.85%10.10% State Bank of India 2022 4,345 0.83%Punjab National Bank 2009 4,006 0.77%Union Bank of India 2008 3,535 0.68%HDFC Bank 3,465 0.66%10.50% Axis Bank 2008 3,450 0.66%9.90% IDBI Bank 2009 2,136 0.41%IDBI Bank 2009 1,918 0.37%ABN Amro Bank 2008 1,914 0.37%9.90% Canara Bank 2010 1,913 0.37%9.90% Canara Bank 2009 1,857 0.36%Kotak Mahindra Bank 2008 1,805 0.35%10.50% Axis Bank 2009 1,769 0.34%10.20% State Bank of India 2022 1,635 0.31%10.43% Axis Bank 2009 1,621 0.31%10.10% Axis Bank 2017 1,536 0.29%Canara Bank 2008 1,441 0.28%9.35% Punjab National Bank 2023 946 0.18%10.00% ICICI Bank 2017 675 0.13%9.78% State Bank of Bikaner and Jaipur 2022 507 0.10%9.90% State Bank of Patiala 2022 472 0.09%Punjab National Bank 2008 189 0.04%Citibank 2008 175 0.03%9.35% Punjab National Bank 2022 166 0.03%UCO Bank 2009 78 0.01%8.47% IDBI Bank 2013 77 0.01%
Banking services Total 95,687 18.35%
Others 397,554 76.23%Net Current Assets 28,258 5.42%
Grand Total 521,499 100.00%
ICICI PRU AR09_Final Pg29-197 (Ac).indd Sec1:169ICICI PRU AR09_Final Pg29-197 (Ac).indd Sec1:169 10/28/09 6:00:28 PM10/28/09 6:00:28 PM

I 170 I
FINANCIAL REPORT
Pension Flexi Growth Fund (2008-2009)
Industry Security name Market Value(Rs. ‘000) % of NAV
Banking services HDFC Bank 1,818,495 7.91%State Bank of India 1,201,399 5.22%Axis Bank 507,924 2.21%Punjab National Bank 207,419 0.90%Union Bank of India 190,905 0.83%Syndicate Bank 2009 48,283 0.21%
Banking services Total 3,974,425 17.28%
Others 18,737,175 81.45%Net Current Assets 292,406 1.27%
Grand Total 23,004,006 100.00%
Pension Flexi Growth Fund (2007-2008)
Industry Security name Market Value (Rs. ‘000) % of NAV
Banking services HDFC Bank 1,042,535 6.06%Axis Bank 840,448 4.88%State Bank of India 443,566 2.58%Punjab National Bank 231,624 1.35%State Bank of Travancore 2008 146,122 0.85%
Banking services Total 2,704,295 15.71%
Others 14,818,628 86.11%Net Current Assets - 313,195 -1.82%
Grand Total 17,209,728 100.00%
Invest Shield Pension Fund (2008-2009)
Industry Security name Market Value(Rs. ‘000) % of NAV
Banking services HDFC Bank 4,599 2.03%ICICI Bank 2010 4,595 2.03%11.55% State Bank of Patiala 2009 2,718 1.20%State Bank of India 2,690 1.19%11.11% State Bank of India 2009 2,638 1.17%State Bank of Patiala 2010 2,330 1.03%Punjab National Bank 2010 2,321 1.03%Bank of India 2010 2,316 1.02%IDBI Bank 2010 2,311 1.02%10.85% HDFC Bank 2018 2,140 0.95%9.90% Canara Bank 2010 1,866 0.83%9.95% Axis Bank 2019 1,446 0.64%8.70% ICICI Bank 2010 1,388 0.61%Axis Bank 1,284 0.57%Bank of India 2009 1,206 0.53%Andhra Bank 2009 1,205 0.53%Allahabad Bank 2009 1,203 0.53%10.43% Axis Bank 2009 1,137 0.50%Punjab National Bank 2009 1,123 0.50%Oriental Bank of Commerce 2009 686 0.30%ABN Amro Bank 2009 677 0.30%Axis Bank 2009 630 0.28%Union Bank of India 602 0.27%Bank of Baroda 2010 587 0.26%UCO Bank 2010 578 0.26%8.90% State Bank of India 2018 412 0.18%Punjab National Bank 370 0.16%8.47% IDBI Bank 2011 127 0.06%
Banking services Total 45,185 19.99%
Financial institutions Export Import Bank of India 2009 17,192 7.60%11.10% Power Finance Corporation Limited 2013 2,816 1.25%11.00% Power Finance Corporation Limited 2018 1,930 0.85%11.10% Export Import Bank of India 2010 1,600 0.71%12.50% IDFC Limited 2009 1,599 0.71%IDFC Limited 2010 1,337 0.59%9.03% Power Finance Corporation Limited 2013 1,152 0.51%8.55% Indian Railway Finance Corporation Limited 2019 1,092 0.48%8.60% IDFC Limited 2011 1,007 0.45%11.75% Rural Electrification Corporation Limited 2011 840 0.37%9.00% IDFC Limited 2010 750 0.33%9.68% IRFC Limited 2012 655 0.29%8.50% Export Import Bank of India 2011 556 0.25%11.25% Power Finance Corporation Limited 2018 470 0.21%9.05% IDFC Limited 2010 465 0.21%8.46% Indian Railway Finance Corporation Limited 2014 416 0.18%9.76% IRFC Limited 2012 409 0.18%9.58% Export Import Bank of India 2009 375 0.17%8.55% Power Finance Corporation Limited 2011 303 0.13%9.05% Export Import Bank of India 2010 286 0.13%8.45% Indian Railway Finance Corporation Limited 2018 277 0.12%8.78% Power Finance Corporation Limited 2016 196 0.09%9.25% Export Import Bank of India 2012 163 0.07%8.83% Indian Railway Finance Corporation Limited 2012 163 0.07%8.57% IRFC Limited 2016 157 0.07%9.40% Power Finance Corporation Limited 2013 142 0.06%
Financial institutions Total 36,348 16.08%
Others 137,191 60.69%Net Current Assets 7,339 3.25%
Grand Total 226,063 100.00%
ICICI PRU AR09_Final Pg29-197 (Ac).indd Sec1:170ICICI PRU AR09_Final Pg29-197 (Ac).indd Sec1:170 10/28/09 6:00:28 PM10/28/09 6:00:28 PM

I 171 I
ANNUAL REPORT 2008-09ICICI PRUDENTIAL LIFE INSURANCE
Invest Shield Pension Fund (2007-2008)
Industry Security name Market Value (Rs. ‘000) % of NAV
Banking services IDBI Bank 2009 17,306 9.03%UCO Bank 2009 12,051 6.29%ICICI Bank 2009 5,508 2.87%10.30% ICICI Bank 2009 3,465 1.81%10.10% State Bank of India 2022 3,014 1.57%State Bank of India 2,754 1.44%Punjab National Bank 2009 2,590 1.35%Axis Bank 2,445 1.28%Union Bank of India 2008 2,119 1.11%HDFC Bank 1,671 0.87%9.90% IDBI Bank 2009 1,412 0.74%11.06% Canara Bank 2009 1,348 0.70%10.43% Axis Bank 2009 1,137 0.59%9.90% Canara Bank 2010 1,056 0.55%9.90% Canara Bank 2009 1,025 0.53%10.10% Axis Bank 2017 1,004 0.52%10.50% Axis Bank 2008 925 0.48%11.10% Canara Bank 2009 880 0.46%10.50% Axis Bank 2009 726 0.38%9.35% Punjab National Bank 2023 708 0.37%8.40% Axis Bank 2008 496 0.26%9.78% State Bank of Bikaner and Jaipur 2022 434 0.23%9.50% State Bank of Patiala 2008 400 0.21%9.90% State Bank of Patiala 2022 396 0.21%10.00% ICICI Bank 2017 297 0.16%6.75% IDBI Bank 2008 257 0.13%Citibank 2008 219 0.11%Punjab National Bank 217 0.11%9.35% Punjab National Bank 2022 124 0.06%8.47% IDBI Bank 2013 123 0.06%
Banking services Total 66,107 34.50%
Others 125,237 65.37%Net Current Assets 250 0.13%
Grand Total 191,594 100.00%
Pension Balancer Fund (2008-2009)
Industry Security name Market Value(Rs. ‘000) % of NAV
Banking services ICICI Bank 2010 243,616 2.63%HDFC Bank 224,876 2.43%State Bank of India 198,139 2.14%9.85% HDFC Bank 2019 177,248 1.92%Bank of India 2009 143,787 1.55%Axis Bank 121,385 1.31%State Bank of Patiala 2010 106,122 1.15%Punjab National Bank 2010 105,739 1.14%Punjab National Bank 2009 96,836 1.05%Bank of India 2010 90,044 0.97%IDBI Bank 2010 89,821 0.97%8.70% ICICI Bank 2010 58,535 0.63%9.95% Axis Bank 2019 56,285 0.61%Allahabad Bank 2009 46,747 0.51%Andhra Bank 2009 46,484 0.50%9.50% Oriental Bank of Commerce 2013 27,000 0.29%Oriental Bank of Commerce 2009 26,655 0.29%Bank of Baroda 2010 22,835 0.25%UCO Bank 2010 22,451 0.24%Punjab National Bank 21,951 0.24%8.90% State Bank of India 2018 15,784 0.17%Union Bank of India 14,905 0.16%8.47% IDBI Bank 2011 5,554 0.06%
Banking services Total 1,962,799 21.22%
Financial institutions 9.40% Power Finance Corporation Limited 2013 92,125 1.00%9.00% IDFC Limited 2010 79,286 0.86%8.55% Indian Railway Finance Corporation Limited 2019 71,214 0.77%9.03% Power Finance Corporation Limited 2013 71,021 0.77%9.05% IDFC Limited 2010 70,349 0.76%Power Finance Corporation Limited PTC 2010 63,405 0.69%11.10% Export Import Bank of India 2010 56,337 0.61%IDFC Limited 2010 51,531 0.56%8.60% IDFC Limited 2011 48,276 0.52%9.45% Rural Electrification Corporation Limited 2013 40,486 0.44%11.00% Power Finance Corporation Limited 2018 35,080 0.38%11.75% Rural Electrification Corporation Limited 2011 30,528 0.33%8.45% Indian Railway Finance Corporation Limited 2018 29,714 0.32%9.50% NABARD 2012 28,759 0.31%8.50% Export Import Bank of India 2011 27,393 0.30%8.65% Rural Electrification Corporation Limited 2019 20,460 0.22%11.10% Power Finance Corporation Limited 2013 20,440 0.22%12.50% IDFC Limited 2009 20,158 0.22%9.25% Export Import Bank of India 2012 18,046 0.20%11.25% Power Finance Corporation Limited 2018 18,014 0.19%9.68% IRFC Limited 2012 17,243 0.19%9.76% IRFC Limited 2012 16,964 0.18%8.55% Power Finance Corporation Limited 2011 16,417 0.18%8.46% Indian Railway Finance Corporation Limited 2014 15,929 0.17%9.58% Export Import Bank of India 2009 15,637 0.17%9.40% NABARD 2010 15,212 0.16%
ICICI PRU AR09_Final Pg29-197 (Ac).indd Sec1:171ICICI PRU AR09_Final Pg29-197 (Ac).indd Sec1:171 10/28/09 6:00:28 PM10/28/09 6:00:28 PM

I 172 I
FINANCIAL REPORT
Pension Balancer Fund (2008-2009)
Industry Security name Market Value(Rs. ‘000) % of NAV
8.95% IDFC Limited 2018 14,931 0.16%9.05% Export Import Bank of India 2010 10,935 0.12%8.78% Power Finance Corporation Limited 2016 10,478 0.11%9.28% Power Finance Corporation Limited 2017 10,379 0.11%8.57% IRFC Limited 2016 8,535 0.09%9.25% Export Import Bank of India 2012 6,019 0.07%8.83% Indian Railway Finance Corporation Limited 2012 5,996 0.06%NABARD 2019 1,043 0.01%
Financial institutions Total 1,058,340 11.44%
Others 6,054,399 65.46%Net Current Assets 173,392 1.87%
Grand Total 9,248,930 100.00%
Pension Balancer Fund (2007-2008)
Industry Security name Market Value (Rs. ‘000) % of NAV
Banking services HDFC Bank 253,762 3.08%Axis Bank 207,330 2.52%ICICI Bank 2009 189,929 2.31%Punjab National Bank 2009 127,436 1.55%Union Bank of India 2008 110,533 1.34%10.30% ICICI Bank 2009 109,568 1.33%9.90% Canara Bank 2010 103,793 1.26%9.90% Canara Bank 2009 100,752 1.22%IDBI Bank 2009 94,521 1.15%10.10% State Bank of India 2022 81,981 1.00%State Bank of India 63,498 0.77%10.20% State Bank of India 2022 60,616 0.74%Punjab National Bank 60,203 0.73%9.90% IDBI Bank 2009 52,565 0.64%11.06% Canara Bank 2009 49,191 0.60%Canara Bank 2009 48,838 0.59%11.10% Canara Bank 2009 45,760 0.56%10.43% Axis Bank 2009 42,522 0.52%Kotak Mahindra Bank 2008 33,056 0.40%10.50% Axis Bank 2009 31,121 0.38%Punjab National Bank 2008 26,978 0.33%9.35% Punjab National Bank 2023 26,484 0.32%10.10% Axis Bank 2017 26,032 0.32%6.75% IDBI Bank 2008 20,373 0.25%9.50% State Bank of Patiala 2008 20,000 0.24%9.78% State Bank of Bikaner and Jaipur 2022 11,929 0.14%UCO Bank 2009 11,198 0.14%9.90% State Bank of Patiala 2022 11,093 0.13%10.00% ICICI Bank 2017 10,569 0.13%Citibank 2008 9,436 0.11%11.00% IDBI Bank 2008 7,515 0.09%8.47% IDBI Bank 2013 5,390 0.07%9.35% Punjab National Bank 2022 4,624 0.06%8.40% Axis Bank 2008 2,482 0.03%
Banking services Total 2,061,078 25.05%
Financial institutions 9.40% Power Finance Corporation Limited 2013 84,353 1.03%9.50% NABARD 2012 70,463 0.86%9.05% IDFC Limited 2010 68,782 0.84%9.79% IDFC Limited 2009 59,422 0.72%9.00% IDFC Limited 2010 57,342 0.70%9.35% IDFC Limited 2009 56,523 0.69%9.03% Power Finance Corporation Limited 2013 41,922 0.51%9.80% Power Finance Corporation Limited 2012 36,818 0.45%8.60% IDFC Limited 2011 35,282 0.43%10.25% IDFC Limited 2008 34,141 0.41%10.04% IRFC Limited 2027 33,689 0.41%8.49% Power Finance Corporation Limited 2011 30,395 0.37%Power Finance Corporation Limited 2008 29,286 0.36%Export Import Bank of India 2008 27,083 0.33%8.50% Export Import Bank of India 2011 26,369 0.32%9.25% Export Import Bank of India 2012 23,289 0.28%8.15% NABARD 2009 21,551 0.26%5.85% Power Finance Corporation Limited 2010 19,793 0.24%9.10% Export Import Bank of India 2010 19,128 0.23%9.68% IRFC Limited 2012 16,773 0.20%10.00% NABARD 2010 16,673 0.20%9.76% IRFC Limited 2012 16,511 0.20%8.55% Power Finance Corporation Limited 2011 15,953 0.19%8.75% IRFC Limited 2013 15,767 0.19%9.58% Export Import Bank of India 2010 15,539 0.19%8.95% IDFC Limited 2018 14,880 0.18%8.40% Export Import Bank of India 2010 12,096 0.15%9.95% IRFC Limited 2022 12,045 0.15%NABARD 2018 11,296 0.14%8.78% Power Finance Corporation Limited 2016 10,298 0.13%8.57% IRFC Limited 2016 8,371 0.10%8.00% Export Import Bank of India 2009 865 0.01%
Financial institutions Total 942,698 11.46%
Others 4,956,397 60.23%Net Current Assets 268,870 3.27%
Grand Total 8,229,043 100.00%
ICICI PRU AR09_Final Pg29-197 (Ac).indd Sec1:172ICICI PRU AR09_Final Pg29-197 (Ac).indd Sec1:172 10/28/09 6:00:29 PM10/28/09 6:00:29 PM

I 173 I
ANNUAL REPORT 2008-09ICICI PRUDENTIAL LIFE INSURANCE
Pension Protector Fund (2008-2009)
Industry Security name Market Value(Rs. ‘000) % of NAV
Banking services 8.70% ICICI Bank 2010 412,663 4.74%11.55% State Bank of Patiala 2009 369,962 4.25%9.85% HDFC Bank 2019 308,437 3.55%ICICI Bank 2010 278,061 3.20%9.50% State Bank of India 2013 169,673 1.95%8.75% Canara Bank 2010 147,982 1.70%9.90% Canara Bank 2010 109,574 1.26%Bank of India 2010 102,727 1.18%IDBI Bank 2010 102,472 1.18%9.50% Canara Bank 2013 100,032 1.15%Punjab National Bank 2009 96,836 1.11%11.11% State Bank of India 2009 80,082 0.92%10.85% HDFC Bank 2018 70,680 0.81%Canara Bank 2010 66,165 0.76%9.95% Axis Bank 2019 64,416 0.74%Punjab National Bank 2010 55,801 0.64%Bank of India 2009 53,468 0.61%Allahabad Bank 2009 53,331 0.61%Andhra Bank 2009 53,329 0.61%State Bank of Patiala 2010 52,625 0.61%10.43% Axis Bank 2009 46,210 0.53%12.57% State Bank of India 2009 43,400 0.50%9.50% Oriental Bank of Commerce 2013 42,727 0.49%Oriental Bank of Commerce 2009 30,409 0.35%Bank of Baroda 2010 26,051 0.30%UCO Bank 2010 25,613 0.29%Axis Bank 2009 19,344 0.22%8.90% State Bank of India 2018 17,627 0.20%ABN Amro Bank 2009 10,787 0.12%8.47% IDBI Bank 2011 4,321 0.05%
Banking services Total 3,014,805 34.66%
Financial institutions 9.35% IDFC Limited 2009 213,586 2.46%11.00% Power Finance Corporation Limited 2018 72,226 0.83%9.40% Power Finance Corporation Limited 2013 68,760 0.79%Power Finance Corporation Limited PTC 2010 63,405 0.73%IDFC Limited 2010 58,692 0.67%12.50% IDFC Limited 2009 56,238 0.65%11.10% Export Import Bank of India 2010 47,815 0.55%8.55% Indian Railway Finance Corporation Limited 2019 47,396 0.54%8.60% IDFC Limited 2011 44,211 0.51%11.10% Power Finance Corporation Limited 2013 42,838 0.49%9.05% IDFC Limited 2009 39,755 0.46%IDFC Limited 2009 37,428 0.43%9.03% Power Finance Corporation Limited 2013 30,178 0.35%11.75% Rural Electrification Corporation Limited 2011 29,545 0.34%9.00% IDFC Limited 2010 27,788 0.32%8.50% Export Import Bank of India 2011 26,331 0.30%9.50% Export Import Bank of India 2013 25,855 0.30%9.45% Rural Electrification Corporation Limited 2013 25,181 0.29%11.25% Power Finance Corporation Limited 2018 20,502 0.24%8.45% Indian Railway Finance Corporation Limited 2018 19,314 0.22%8.46% Indian Railway Finance Corporation Limited 2014 18,301 0.21%9.68% IRFC Limited 2012 17,748 0.20%8.55% Power Finance Corporation Limited 2011 14,612 0.17%9.76% IRFC Limited 2012 13,481 0.15%9.05% Export Import Bank of India 2010 12,211 0.14%9.28% Power Finance Corporation Limited 2017 12,109 0.14%9.58% Export Import Bank of India 2009 12,104 0.14%8.95% IDFC Limited 2018 10,504 0.12%8.78% Power Finance Corporation Limited 2016 9,537 0.11%8.57% IRFC Limited 2016 7,590 0.09%9.80% NABARD 2012 5,219 0.06%9.25% Export Import Bank of India 2012 4,262 0.05%8.83% Indian Railway Finance Corporation Limited 2012 4,246 0.05%
Financial institutions Total 1,138,968 13.09%
Others 4,182,757 48.09%Net Current Assets 361,314 4.15%
Grand Total 8,697,844 100.00%
Pension Protector Fund (2007-2008)
Industry Security name Market Value (Rs. ‘000) % of NAV
Banking services ICICI Bank 2009 154,622 3.94%Punjab National Bank 2009 124,486 3.17%Canara Bank 2009 93,134 2.37%Union Bank of India 2008 90,923 2.32%9.90% Canara Bank 2010 76,924 1.96%10.30% ICICI Bank 2009 76,795 1.96%9.90% Canara Bank 2009 74,670 1.90%IDBI Bank 2009 69,686 1.78%10.10% State Bank of India 2022 41,943 1.07%9.90% IDBI Bank 2009 38,349 0.98%11.06% Canara Bank 2009 37,502 0.96%11.10% Canara Bank 2009 34,820 0.89%10.43% Axis Bank 2009 29,922 0.76%Canara Bank 2008 28,811 0.73%6.75% IDBI Bank 2008 25,911 0.66%10.10% Axis Bank 2017 25,367 0.65%
ICICI PRU AR09_Final Pg29-197 (Ac).indd Sec1:173ICICI PRU AR09_Final Pg29-197 (Ac).indd Sec1:173 10/28/09 6:00:29 PM10/28/09 6:00:29 PM

I 174 I
FINANCIAL REPORT
Pension Protector Fund (2007-2008)
Industry Security name Market Value (Rs. ‘000) % of NAV
Kotak Mahindra Bank 2008 23,842 0.61%10.20% State Bank of India 2022 20,008 0.51%Punjab National Bank 2008 19,458 0.50%ABN Amro Bank 2008 19,137 0.49%9.35% Punjab National Bank 2023 18,484 0.47%9.50% State Bank of Patiala 2008 18,135 0.46%10.50% Axis Bank 2008 16,000 0.41%10.50% Axis Bank 2009 13,417 0.34%9.78% State Bank of Bikaner and Jaipur 2022 8,467 0.22%UCO Bank 2009 8,077 0.21%10.00% ICICI Bank 2017 7,564 0.19%Citibank 2008 7,354 0.19%8.47% IDBI Bank 2013 4,194 0.11%9.90% State Bank of Patiala 2022 2,530 0.06%9.35% Punjab National Bank 2022 2,518 0.06%
Banking services Total 1,213,050 30.92%
Financial institutions 9.40% Power Finance Corporation Limited 2013 60,833 1.55%9.79% IDFC Limited 2009 43,768 1.12%9.35% IDFC Limited 2009 40,767 1.04%9.80% Power Finance Corporation Limited 2012 37,094 0.95%8.60% IDFC Limited 2011 34,644 0.88%9.03% Power Finance Corporation Limited 2013 29,297 0.75%8.75% IRFC Limited 2013 28,365 0.72%9.00% IDFC Limited 2010 27,148 0.69%10.25% IDFC Limited 2008 25,789 0.66%8.50% Export Import Bank of India 2011 25,348 0.65%8.49% Power Finance Corporation Limited 2011 22,476 0.57%8.15% NABARD 2009 20,269 0.52%Power Finance Corporation Limited 2008 20,065 0.51%Export Import Bank of India 2008 18,547 0.47%9.68% IRFC Limited 2012 17,264 0.44%9.10% Export Import Bank of India 2010 14,227 0.36%8.55% Power Finance Corporation Limited 2011 14,199 0.36%10.00% NABARD 2010 13,136 0.33%9.76% IRFC Limited 2012 13,121 0.33%9.58% Export Import Bank of India 2010 12,029 0.31%8.95% IDFC Limited 2018 10,469 0.27%10.04% IRFC Limited 2027 9,876 0.25%8.40% Export Import Bank of India 2010 9,530 0.24%8.78% Power Finance Corporation Limited 2016 9,374 0.24%9.95% IRFC Limited 2022 9,242 0.24%8.57% IRFC Limited 2016 7,444 0.19%9.80% NABARD 2012 5,061 0.13%9.25% Export Import Bank of India 2012 3,742 0.10%9.68% IRFC Limited 2008 1,403 0.04%9.50% NABARD 2012 796 0.02%8.00% Export Import Bank of India 2009 328 0.01%
Financial institutions Total 585,651 14.93%
Non-Banking financial cos. (NBFCs) Cholamandalam DBS Finance Limited 2008 87,883 2.24%Cholamandalam DBS Finance Limited 2009 55,676 1.42%9.10% Cholamandalam DBS Finance Limited 2009 27,725 0.71%10.00% Sundaram Finance Limited 2010 24,428 0.62%8.60% Sundaram Finance Limited 2008 22,447 0.57%11.26% Sundaram Finance Limited 2010 22,428 0.57%10.75% Kotak Mahindra Prime Limited 2010 22,321 0.57%11.30% Kotak Mahindra Prime Limited 2010 19,098 0.49%11.05% Sundaram Finance Limited 2010 18,955 0.48%11.30% Shriram Transport Finance Company Limited 2010 17,931 0.46%10.85% Sundaram Finance Limited 2009 16,329 0.42%7.00% Mahindra & Mahindra Finance Limited 2008 14,963 0.38%10.25% Cholamandalam DBS Finance Limited 2009 14,083 0.36%9.51% Mahindra & Mahindra Finance Limited 2010 13,099 0.33%9.45% Sundaram Finance Limited 2010 11,981 0.31%Sundaram Finance Limited 2008 11,252 0.29%11.30% Cholamandalam DBS Finance Limited 2009 5,273 0.13%6.00% Bajaj Auto Finance Limited 2010 4,922 0.13%
Non-Banking financial cos. (NBFCs) Total 410,794 10.47%
Housing finance services 9.80% LIC Housing Finance Limited 2017 57,997 1.48%9.50% HDFC Limited 2009 57,516 1.47%9.75% LIC Housing Finance Limited 2017 49,526 1.26%10% ICICI Home Finance Company Limited 2013 47,215 1.20%9.50% HDFC Limited 2017 35,900 0.92%6.65% HDFC Limited 2008 30,830 0.79%5.82% HDFC Limited 2008 22,356 0.57%9.50% HDFC Limited 2013 14,424 0.37%10.25% HDFC Limited 2012 13,199 0.34%HDFC Limited 2008 11,911 0.30%9.20% HDFC Limited 2012 11,670 0.30%7.15% HDFC Limited 2010 9,720 0.25%7.60% HDFC Limited 2017 8,750 0.22%10.00% HDFC Limited 2010 8,295 0.21%9.70% HDFC Limited 2017 7,885 0.20%8.95% HDFC Limited 2010 7,287 0.19%
Housing finance services Total 394,481 10.06%
Others 1,089,228 27.77%Net Current Assets 229,371 5.85%
Grand Total 3,922,575 100.00%
ICICI PRU AR09_Final Pg29-197 (Ac).indd Sec1:174ICICI PRU AR09_Final Pg29-197 (Ac).indd Sec1:174 10/28/09 6:00:29 PM10/28/09 6:00:29 PM

I 175 I
ANNUAL REPORT 2008-09ICICI PRUDENTIAL LIFE INSURANCE
Pension Maximiser Fund (2008-2009)
Industry Security name Market Value(Rs. ‘000) % of NAV
Banking services HDFC Bank 1,628,662 7.55%State Bank of India 1,458,114 6.76%Axis Bank 951,048 4.41%Punjab National Bank 447,951 2.08%Union Bank of India 367,125 1.70%8.70% ICICI Bank 2010 241,714 1.12%Syndicate Bank 2009 241,417 1.12%Oriental Bank of Commerce 141,280 0.66%ICICI Bank 2010 25,861 0.12%
Banking services Total 5,503,172 25.51%
Others 16,100,884 74.65%Net Current Assets (34,792) (0.16%)
Grand Total 21,569,264 100.00%
Pension Maximiser Fund (2007-2008)
Industry Security name Market Value (Rs. ‘000) % of NAV
Banking services HDFC Bank 1,848,421 7.73%Axis Bank 1,739,217 7.28%State Bank of India 985,389 4.12%Punjab National Bank 316,581 1.32%
Banking services Total 4,889,608 20.46%
Refinery Reliance Industries Limited 2,620,382 10.97%
Refinery Total 2,620,382 10.97%
Others 16,087,295 67.32%Net Current Assets 300,382 1.26%
Grand Total 23,897,667 100.00%
Pension Multiplier Fund (2008-2009)
Industry Security name Market Value(Rs. ‘000) % of NAV
Banking services HDFC Bank 227,713 5.89%State Bank of India 211,479 5.47%Axis Bank 79,495 2.06%Punjab National Bank 73,270 1.90%8.50% IDBI Bank 2010 49,700 1.29%Oriental Bank of Commerce 31,819 0.82%State Bank of Hyderabad 2010 24,568 0.64%
Banking services Total 698,044 18.07%
Refinery Reliance Industries Limited 312,705 8.09%Reliance Petroleum Limited 63,639 1.65%Bharat Petroleum Corporation Limited 36,591 0.95%Hindustan Petroleum Corporation Limited 17,501 0.45%
Refinery Total 430,436 11.14%
Others 2,722,341 70.46%Net Current Assets 13,104 0.34%
Grand Total 3,863,925 100.00%
Pension Multiplier Fund (2007-2008)
Industry Security name Market Value (Rs. ‘000) % of NAV
Banking services HDFC Bank 163,270 6.48%Axis Bank 116,898 4.64%State Bank of India 79,363 3.15%Punjab National Bank 12,632 0.50%
Banking services Total 372,163 14.77%
Refinery Reliance Industries Limited 258,267 10.25%Reliance Petroleum Limited 55,086 2.19%Bharat Petroleum Corporation Limited 11,464 0.45%
Refinery Total 324,817 12.89%
Others 1,598,315 63.42%Net Current Assets 224,777 8.92%
Grand Total 2,520,072 100.00%
Pension Return Guarantee Fund (2008-2009)
Industry Security name Market Value(Rs. ‘000) % of NAV
Financial institutions 10.00% IDFC Limited 2013 208,658 9.75%9.50% Export Import Bank of India 2013 180,982 8.46%11.00% Power Finance Corporation Limited 2018 55,199 2.58%9.28% Power Finance Corporation Limited 2017 37,744 1.76%9.03% Power Finance Corporation Limited 2013 37,178 1.74%
Financial institutions Total 519,761 24.29%
Housing finance services 9.80% LIC Housing Finance Limited 2017 200,198 9.36%10.00% ICICI Home Finance Company Limited 2013 148,757 6.95%9.70% HDFC Limited 2017 78,581 3.67%
ICICI PRU AR09_Final Pg29-197 (Ac).indd Sec1:175ICICI PRU AR09_Final Pg29-197 (Ac).indd Sec1:175 10/28/09 6:00:29 PM10/28/09 6:00:29 PM

I 176 I
FINANCIAL REPORT
Pension Return Guarantee Fund (2008-2009)
Industry Security name Market Value(Rs. ‘000) % of NAV
11.15% HDFC Limited 2018 41,364 1.93%9.90% HDFC Limited 2018 7,579 0.35%
Housing finance services Total 476,479 22.27%
Refinery 11.45% Reliance Industries Limited 2013 208,631 9.75%11.00% Indian Oil Corporation Limited 2018 138,439 6.47%10.90% Reliance Gas Transportation Infrastructure Limited 2014 83,113 3.88%
Refinery Total 430,183 20.10%
Banking services 10.85% HDFC Bank 2018 155,210 7.25%11.35% IDBI Bank 2013 83,175 3.89%9.35% Punjab National Bank 2018 40,181 1.88%9.50% State Bank of India 2013 23,390 1.09%9.50% Oriental Bank of Commerce 2013 1,395 0.07%
Banking services Total 303,351 14.18%
Others 348,627 16.29%Net Current Assets 61,335 2.87%
Grand Total 2,139,736 100.00%
Pension Return Guarantee Fund II (2008-2009)
Industry Security name Market Value(Rs. ‘000) % of NAV
Financial institutions 10.60% Indian Railway Finance Corporation Limited 2018 125,760 6.31%9.25% Export Import Bank of India 2013 93,168 4.67%10.00% IDFC Limited 2013 88,116 4.42%11.00% Power Finance Corporation Limited 2018 73,725 3.70%11.25% Power Finance Corporation Limited 2018 68,339 3.43%8.45% Indian Railway Finance Corporation Limited 2018 32,618 1.64%8.55% Indian Railway Finance Corporation Limited 2019 4,404 0.22%9.03% Power Finance Corporation Limited 2013 4,169 0.21%
Financial institutions Total 490,299 24.59%
Housing finance services 10.25% ICICI Home Finance Company Limited 2014 174,796 8.77%10.25% HDFC Limited 2017 76,472 3.84%9.90% HDFC Limited 2013 52,632 2.64%9.80% LIC Housing Finance Limited 2017 40,857 2.05%9.14% LIC Housing Finance Limited 2018 36,601 1.84%10.35% HDFC Limited 2017 31,725 1.59%9.70% HDFC Limited 2017 7,693 0.39%
Housing finance services Total 420,776 21.10%
Refinery 11.45% Reliance Industries Limited 2013 178,801 8.97%11.00% Indian Oil Corporation Limited 2018 146,553 7.35%
Refinery Total 325,354 16.32%
Banking services 10.85% HDFC Bank 2018 129,527 6.50%11.35% IDBI Bank 2013 67,870 3.40%9.85% HDFC Bank 2019 53,462 2.68%9.50% Canara Bank 2013 23,303 1.17%10.10% Corporation Bank 2018 12,995 0.65%
Banking services Total 287,157 14.40%
Others 425,356 21.33%Net Current Assets 44,978 2.26%
Grand Total 1,993,920 100.00%
Pension Return Guarantee Fund III (2008-2009)
Industry Security name Market Value (Rs. ‘000) % of NAV
Banking services 9.25% IDBI Bank 2014 140,723 6.76%9.50% State Bank of India 2013 111,544 5.36%9.50% Oriental Bank of Commerce 2013 94,431 4.54%9.85% HDFC Bank 2019 92,747 4.46%10.85% HDFC Bank 2018 69,708 3.35%10.10% Corporation Bank 2018 39,921 1.92%11.35% IDBI Bank 2013 31,745 1.53%9.50% Canara Bank 2013 28,740 1.38%
Banking services Total 609,559 29.29%
Financial institutions 9.05% IDFC Limited 2013 106,434 5.11%10.00% IDFC Limited 2013 65,706 3.16%8.46% Indian Railway Finance Corporation Limited 2014 48,225 2.32%10.60% Indian Railway Finance Corporation Limited 2018 41,846 2.01%11.00% Power Finance Corporation Limited 2018 34,482 1.66%9.68% Power Finance Corporation Limited 2018 29,899 1.44%11.25% Power Finance Corporation Limited 2018 20,332 0.98%
Financial institutions Total 346,924 16.67%
Housing finance services 9.75% LIC Housing Finance Limited 2017 101,834 4.89%9.80% LIC Housing Finance Limited 2017 60,968 2.93%10.25% HDFC Limited 2017 54,534 2.62%11.25% HDFC Limited 2018 33,550 1.61%10.25% ICICI Home Finance Company Limited 2014 19,720 0.95%10.35% HDFC Limited 2017 8,841 0.42%
Housing finance services Total 279,447 13.43%
Others 811,253 38.98%Net Current Assets 34,206 1.64%
Grand Total 2,081,389 100.00%
ICICI PRU AR09_Final Pg29-197 (Ac).indd Sec1:176ICICI PRU AR09_Final Pg29-197 (Ac).indd Sec1:176 10/28/09 6:00:29 PM10/28/09 6:00:29 PM

I 177 I
ANNUAL REPORT 2008-09ICICI PRUDENTIAL LIFE INSURANCE
Pension Return Guarantee Fund IV (2008-2009)
Industry Security name Market Value (Rs. ‘000) % of NAV
Net Current Assets 617,927 100.00%
Grand Total 617927 100.00%
Pension Preserver Fund (2008-2009)
Industry Security name Market Value (Rs. ‘000) % of NAV
Banking services Punjab National Bank 2010 94,494 9.39%ABN Amro Bank 2009 74,524 7.41%Bank of Baroda 2010 67,737 6.73%8.75% Canara Bank 2010 57,263 5.69%Axis Bank 2009 51,815 5.15%11.11% State Bank of India 2009 51,432 5.11%8.50% IDBI Bank 2010 34,524 3.43%Union Bank of India 2010 26,819 2.67%Canara Bank 2010 20,383 2.03%ICICI Bank 2010 19,479 1.94%10.43% Axis Bank 2009 17,576 1.75%State Bank of Hyderabad 2010 16,851 1.67%Allahabad Bank 2009 14,764 1.47%Hongkong & Shanghai Banking Corporation Limited 2009 9,829 0.98%Bank of India 2010 9,819 0.98%State Bank of Patiala 2010 9,795 0.97%IDBI Bank 2010 9,794 0.97%ICICI Bank 2009 8,500 0.84%Syndicate Bank 2010 8,307 0.83%12.57% State Bank of India 2009 7,500 0.75%Bank of India 2009 5,111 0.51%Andhra Bank 2009 5,066 0.50%11.55% State Bank of Patiala 2009 4,032 0.40%HDFC Bank 2009 2,919 0.29%UCO Bank 2010 2,448 0.24%9.90% Canara Bank 2010 1,370 0.14%
Banking services Total 632,151 62.83%
Others 339,686 33.76%Net Current Assets 34,356 3.41%
Grand Total 1,006,193 100.00%
Pension Preserver Fund (2007-2008)
Industry Security name Market Value (Rs. ‘000) % of NAV
Banking services 9.40% Yes Bank 2008 15,000 9.54%Punjab National Bank 2009 11,771 7.48%9.90% Canara Bank 2009 11,022 7.01%ICICI Bank 2009 9,767 6.21%ABN Amro Bank 2008 9,568 6.08%Kotak Mahindra Bank 2008 9,348 5.94%State Bank of Mysore 2008 8,340 5.30%10.50% Axis Bank 2008 8,100 5.15%Union Bank of India 2008 6,909 4.39%9.50% State Bank of Patiala 2008 5,800 3.69%10.43% Axis Bank 2009 3,091 1.96%Canara Bank 2008 2,881 1.83%10.30% ICICI Bank 2009 2,815 1.79%Corporation Bank 2009 2,060 1.31%10.50% Axis Bank 2009 452 0.29%IDBI Bank 2009 190 0.12%
Banking services Total 107,114 68.09%
Others 48,469 30.81%Net Current Assets 1,732 1.10%
Grand Total 157,315 100.00%
Return Guarantee Fund (2008-2009)
Industry Security name Market Value (Rs. ‘000) % of NAV
Banking services 9.50% State Bank of India 2013 45,150 6.82%10.85% HDFC Bank 2018 39,756 6.01%9.50% Oriental Bank of Commerce 2013 27,026 4.08%11.35% IDBI Bank 2013 21,199 3.20%9.50% Canara Bank 2013 15,875 2.40%9.35% Punjab National Bank 2018 10,681 1.61%9.50% IDBI Bank 2013 2,070 0.31%10.43% Axis Bank 2009 1,270 0.19%
Banking services Total 163,027 24.63%
Financial institutions 10.00% IDFC Limited 2013 55,816 8.43%9.50% Export Import Bank of India 2013 48,089 7.27%11.00% Power Finance Corporation Limited 2018 12,617 1.91%9.03% Power Finance Corporation Limited 2013 11,514 1.74%9.28% Power Finance Corporation Limited 2017 9,914 1.50%9.25% Export Import Bank of India 2013 3,126 0.47%
Financial institutions Total 141,076 21.31%
ICICI PRU AR09_Final Pg29-197 (Ac).indd Sec1:177ICICI PRU AR09_Final Pg29-197 (Ac).indd Sec1:177 10/28/09 6:00:30 PM10/28/09 6:00:30 PM

I 178 I
FINANCIAL REPORT
Return Guarantee Fund (2008-2009)
Industry Security name Market Value (Rs. ‘000) % of NAV
Housing finance services 9.80% LIC Housing Finance Limited 2017 54,850 8.29%10% ICICI Home Finance Company Limited 2013 37,396 5.65%9.70% HDFC Limited 2017 19,202 2.90%11.15% HDFC Limited 2018 10,914 1.65%
Housing finance services Total 122,362 18.49%
Refinery 11.45% Reliance Industries Limited 2013 55,411 8.37%11.00% Indian Oil Corporation Limited 2018 33,708 5.09%10.90% Reliance Gas Transportation Infrastructure Limited 2014 18,700 2.83%
Refinery Total 107,819 16.29%
Others 107,840 16.29%Net Current Assets 19,768 2.99%
Grand Total 661,892 100.00%
Return Guarantee Fund II (2008-2009)
Industry Security name Market Value(Rs. ‘000) % of NAV
Housing finance services 10.25% ICICI Home Finance Company Limited 2014 52,684 7.31%9.80% LIC Housing Finance Limited 2017 36,873 5.11%10.25% HDFC Limited 2017 23,904 3.32%9.90% HDFC Limited 2013 19,092 2.65%9.14% LIC Housing Finance Limited 2018 11,758 1.63%10.35% HDFC Limited 2017 9,642 1.34%9.90% HDFC Limited 2018 6,358 0.88%9.70% HDFC Limited 2017 1,788 0.25%
Housing finance services Total 162,099 22.48%
Financial institutions 10.60% Indian Railway Finance Corporation Limited 2018 37,184 5.16%9.25% Export Import Bank of India 2013 29,006 4.02%10.00% IDFC Limited 2013 27,188 3.77%11.25% Power Finance Corporation Limited 2018 24,591 3.41%11.00% Power Finance Corporation Limited 2018 21,933 3.04%8.45% Indian Railway Finance Corporation Limited 2018 11,051 1.53%8.55% Indian Railway Finance Corporation Limited 2019 1,225 0.17%9.03% Power Finance Corporation Limited 2013 1,146 0.16%
Financial institutions Total 153,324 21.27%
Refinery 11.45% Reliance Industries Limited 2013 65,897 9.14%11.00% Indian Oil Corporation Limited 2018 59,084 8.20%
Refinery Total 124,981 17.34%
Banking services 10.85% HDFC Bank 2018 40,246 5.58%11.35% IDBI Bank 2013 20,626 2.86%10.10% Corporation Bank 2018 19,805 2.75%9.85% HDFC Bank 2019 17,272 2.40%9.50% Canara Bank 2013 4,620 0.64%9.50% Oriental Bank of Commerce 2013 4,425 0.61%
Banking services Total 106,994 14.84%
Others 149,448 20.73%Net Current Assets 24,082 3.34%
Grand Total 720,928 100.00%
Return Guarantee Fund III (2008-2009)
Industry Security name Market Value(Rs. ‘000) % of NAV
Banking services 9.25% IDBI Bank 2014 44,227 5.95%9.50% State Bank of India 2013 30,850 4.15%9.90% Canara Bank 2010 29,850 4.01%9.85% HDFC Bank 2019 24,983 3.36%10.85% HDFC Bank 2018 22,328 3.00%9.50% Oriental Bank of Commerce 2013 21,005 2.83%8.70% ICICI Bank 2010 15,000 2.02%10.10% Corporation Bank 2018 11,020 1.48%11.35% IDBI Bank 2013 6,922 0.93%Union Bank of India 2010 1,554 0.21%
Banking services Total 207,739 27.94%
Financial institutions 9.05% IDFC Limited 2013 40,479 5.44%9.68% Power Finance Corporation Limited 2018 19,795 2.66%10.00% IDFC Limited 2013 14,825 1.99%8.46% Indian Railway Finance Corporation Limited 2014 14,568 1.96%10.60% Indian Railway Finance Corporation Limited 2018 8,658 1.16%11.00% Power Finance Corporation Limited 2018 6,824 0.92%11.25% Power Finance Corporation Limited 2018 3,276 0.44%
Financial institutions Total 108,425 14.58%
Housing finance services 9.75% LIC Housing Finance Limited 2017 33,096 4.45%9.80% LIC Housing Finance Limited 2017 14,121 1.90%10.25% HDFC Limited 2017 13,452 1.81%11.25% HDFC Limited 2018 10,978 1.48%10.25% ICICI Home Finance Company Limited 2014 5,093 0.68%10.35% HDFC Limited 2017 832 0.11%
Housing finance services Total 77,572 10.43%
Others 236,748 31.84%Net Current Assets 113,022 15.20%
Grand Total 743,506 100.00%
ICICI PRU AR09_Final Pg29-197 (Ac).indd Sec1:178ICICI PRU AR09_Final Pg29-197 (Ac).indd Sec1:178 10/28/09 6:00:30 PM10/28/09 6:00:30 PM

I 179 I
ANNUAL REPORT 2008-09ICICI PRUDENTIAL LIFE INSURANCE
Return Guarantee Fund IV (2008-2009)
Industry Security name Market Value(Rs. ‘000) % of NAV
Net Current Assets Net Current Assets 206,294 100.00%
Grand Total 206,294 100.00%
R.I.C.H. FUND (2008-2009)
Industry Security name Market Value(Rs. ‘000) % of NAV
Banking services State Bank of India 368,470 5.19%HDFC Bank 325,603 4.59%Punjab National Bank 254,893 3.59%Axis Bank 120,402 1.70%Punjab National Bank 2010 102,739 1.45%8.50% IDBI Bank 2010 64,700 0.91%Union Bank of India 2010 61,555 0.87%State Bank of Patiala 2010 50,485 0.71%9.50% IDBI Bank 2013 49,200 0.69%Bank of India 2009 30,045 0.42%
Banking services Total 1,428,092 20.13%
Refinery Reliance Industries Limited 614,467 8.66%Bharat Petroleum Corporation Limited 71,145 1.00%Reliance Petroleum Limited 29,101 0.41%
Refinery Total 714,713 10.08%
Others 4,995,424 70.43%Net Current Assets - 45,284 -0.64%
Grand Total 7,092,945 100.00%
R.I.C.H. FUND (2007-2008)
Industry Security name Market Value (Rs. ‘000) % of NAV
Banking services HDFC Bank 61,238 4.01%Axis Bank 47,391 3.10%State Bank of India 40,806 2.67%Punjab National Bank 20,410 1.34%
Banking services Total 169,845 11.12%
Others 951,492 62.32%Net Current Assets 405,360 26.55%
Grand Total 1,526,697 100.00%
Cash Plus Fund (2008-2009)
Industry Security name Market Value(Rs. ‘000) % of NAV
Banking services 9.85% HDFC Bank 2019 205,625 5.96%10.43% Axis Bank 2009 111,628 3.24%9.90% Canara Bank 2010 96,581 2.80%ICICI Bank 2010 81,653 2.37%Bank of India 2009 69,881 2.03%Punjab National Bank 2010 65,397 1.90%10.85% HDFC Bank 2018 60,877 1.76%8.75% Canara Bank 2010 57,728 1.67%Punjab National Bank 2009 48,419 1.40%8.70% ICICI Bank 2010 43,733 1.27%11.55% State Bank of Patiala 2009 43,722 1.27%11.11% State Bank of India 2009 42,347 1.23%State Bank of Patiala 2010 41,347 1.20%Bank of India 2010 41,156 1.19%IDBI Bank 2010 41,053 1.19%Canara Bank 2010 26,674 0.77%9.95% Axis Bank 2019 25,753 0.75%HDFC Bank 2009 24,000 0.70%Andhra Bank 2009 21,386 0.62%Allahabad Bank 2009 21,366 0.62%ABN Amro Bank 2009 20,486 0.59%12.57% State Bank of India 2009 20,000 0.58%Oriental Bank of Commerce 2009 12,183 0.35%Union Bank of India 2010 11,865 0.34%9.50% Canara Bank 2013 10,800 0.31%Bank of Baroda 2010 10,437 0.30%UCO Bank 2010 10,261 0.30%Axis Bank 2009 10,184 0.30%8.90% State Bank of India 2018 7,261 0.21%8.47% IDBI Bank 2011 1,372 0.04%
Banking services Total 1,285,175 37.25%
Financial institutions 11% Power Finance Corporation Limited 2018 42,455 1.23%Power Finance Corporation Limited PTC 2010 31,703 0.92%9.05% IDFC Limited 2010 30,960 0.90%9.40% Power Finance Corporation Limited 2013 29,651 0.86%11.10% Export Import Bank of India 2010 25,218 0.73%IDFC Limited 2010 23,810 0.69%11.10% Power Finance Corporation Limited 2013 22,496 0.65%8.55% Indian Railway Finance Corporation Limited 2019 19,562 0.57%9.68% IRFC Limited 2012 18,403 0.53%9.03% Power Finance Corporation Limited 2013 15,327 0.44%
ICICI PRU AR09_Final Pg29-197 (Ac).indd Sec1:179ICICI PRU AR09_Final Pg29-197 (Ac).indd Sec1:179 10/28/09 6:00:30 PM10/28/09 6:00:30 PM

I 180 I
FINANCIAL REPORT
Cash Plus Fund (2008-2009)
Industry Security name Market Value(Rs. ‘000) % of NAV
12.50% IDFC Limited 2009 14,791 0.43%11.75% Rural Electrification Corporation Limited 2011 13,698 0.40%9.35% IDFC Limited 2009 12,663 0.37%9.00% IDFC Limited 2010 11,886 0.34%8.60% IDFC Limited 2011 10,901 0.32%Export Import Bank of India 2009 10,372 0.30%9.10% IDFC Limited 2018 9,817 0.28%11.25% Power Finance Corporation Limited 2018 8,447 0.24%9.45% Rural Electrification Corporation Limited 2013 7,845 0.23%8.46% Indian Railway Finance Corporation Limited 2014 7,541 0.22%9.28% Power Finance Corporation Limited 2017 5,102 0.15%9.05% Export Import Bank of India 2010 5,030 0.15%8.45% Indian Railway Finance Corporation Limited 2018 4,910 0.14%9.76% IRFC Limited 2012 4,789 0.14%10.75% Rural Electrification Corporation Limited 2013 4,731 0.14%9.58% Export Import Bank of India 2009 4,416 0.13%8.50% Export Import Bank of India 2011 4,043 0.12%8.55% Power Finance Corporation Limited 2011 2,665 0.08%9.25% Export Import Bank of India 2012 2,329 0.07%8.83% Indian Railway Finance Corporation Limited 2012 2,320 0.07%8.78% Power Finance Corporation Limited 2016 1,704 0.05%8.57% IRFC Limited 2016 1,386 0.04%8.95% IDFC Limited 2018 65 0.00%
Financial institutions Total 411,036 11.91%
Others Others 1,607,802 46.60%Net Current Assets Net Current Assets 145,846 4.23%
Grand Total 3,449,859 100.00%
Cash Plus Fund (2007-2008)
Industry Security name Market Value (Rs. ‘000) % of NAV
Banking services Union Bank of India 2008 118,013 6.11%ICICI Bank 2009 67,319 3.49%9.50% State Bank of Patiala 2008 53,350 2.76%10.50% Axis Bank 2008 40,000 2.07%10.30% ICICI Bank 2009 38,918 2.02%10.10% State Bank of India 2022 37,602 1.95%Punjab National Bank 2009 35,258 1.83%Kotak Mahindra Bank 2008 27,108 1.40%10.20% State Bank of India 2022 22,175 1.15%9.90% Canara Bank 2010 21,881 1.13%9.90% Canara Bank 2009 21,240 1.10%IDBI Bank 2009 20,938 1.08%9.90% IDBI Bank 2009 18,959 0.98%10.43% Axis Bank 2009 15,256 0.79%Canara Bank 2008 14,405 0.75%11.06% Canara Bank 2009 11,837 0.61%10.10% Axis Bank 2017 11,266 0.58%9.35% Punjab National Bank 2023 9,413 0.49%11.10% Canara Bank 2009 8,350 0.43%10.50% Axis Bank 2009 6,799 0.35%Punjab National Bank 2008 6,062 0.31%10.00% ICICI Bank 2017 5,246 0.27%8.40% Axis Bank 2008 4,964 0.26%9.78% State Bank of Bikaner and Jaipur 2022 4,303 0.22%9.90% State Bank of Patiala 2022 3,874 0.20%UCO Bank 2009 2,516 0.13%Citibank 2008 2,454 0.13%6.75% IDBI Bank 2008 1,938 0.10%9.35% Punjab National Bank 2022 1,641 0.08%8.47% IDBI Bank 2013 1,332 0.07%
Banking services Total 634,417 32.85%
Financial institutions 9.40% Power Finance Corporation Limited 2013 30,347 1.57%9.05% IDFC Limited 2010 30,270 1.57%9.50% NABARD 2012 18,838 0.98%9.68% IRFC Limited 2012 17,901 0.93%9.10% Export Import Bank of India 2010 15,265 0.79%9.03% Power Finance Corporation Limited 2013 14,879 0.77%9.79% IDFC Limited 2009 13,830 0.72%9.68% IRFC Limited 2008 13,366 0.69%9.35% IDFC Limited 2009 12,700 0.66%Power Finance Corporation Limited 2008 12,034 0.62%9.00% IDFC Limited 2010 11,612 0.60%9.80% Power Finance Corporation Limited 2012 10,184 0.53%9.10% IDFC Limited 2018 9,790 0.51%8.75% IRFC Limited 2013 9,097 0.47%8.49% Power Finance Corporation Limited 2011 8,212 0.43%10.25% IDFC Limited 2008 7,687 0.40%Export Import Bank of India 2008 7,046 0.36%8.60% IDFC Limited 2011 6,114 0.32%5.85% Power Finance Corporation Limited 2010 6,037 0.31%8.95% IDFC Limited 2018 5,238 0.27%9.76% IRFC Limited 2012 4,661 0.24%9.58% Export Import Bank of India 2010 4,388 0.23%10.00% NABARD 2010 4,244 0.22%8.50% Export Import Bank of India 2011 3,892 0.20%8.15% NABARD 2009 3,287 0.17%8.00% Export Import Bank of India 2009 3,131 0.16%
ICICI PRU AR09_Final Pg29-197 (Ac).indd Sec1:180ICICI PRU AR09_Final Pg29-197 (Ac).indd Sec1:180 10/28/09 6:00:30 PM10/28/09 6:00:30 PM

I 181 I
ANNUAL REPORT 2008-09ICICI PRUDENTIAL LIFE INSURANCE
Cash Plus Fund (2007-2008)
Industry Security name Market Value (Rs. ‘000) % of NAV
8.40% Export Import Bank of India 2010 3,079 0.16%9.95% IRFC Limited 2022 2,766 0.14%8.55% Power Finance Corporation Limited 2011 2,590 0.13%9.25% Export Import Bank of India 2012 1,908 0.10%8.78% Power Finance Corporation Limited 2016 1,675 0.09%8.57% IRFC Limited 2016 1,359 0.07%
Financial institutions Total 297,427 15.40%
Others 877,112 45.42%Net Current Assets 122,190 6.33%
Grand Total 1,931,146 100.00%
Secure Plus Fund (2008-2009)
Industry Security name Market Value(Rs. ‘000) % of NAV
Banking services Andhra Bank 2009 11,396 4.14%Allahabad Bank 2009 10,105 3.67%ICICI Bank 2010 6,581 2.39%8.70% ICICI Bank 2010 4,527 1.65%11.55% State Bank of Patiala 2009 4,104 1.49%11.11% State Bank of India 2009 4,015 1.46%State Bank of Patiala 2010 3,335 1.21%Punjab National Bank 2010 3,323 1.21%Bank of India 2010 3,316 1.21%IDBI Bank 2010 3,308 1.20%10.85% HDFC Bank 2018 3,283 1.19%9.95% Axis Bank 2019 2,072 0.75%Bank of India 2009 1,726 0.63%10.43% Axis Bank 2009 1,679 0.61%9.90% Canara Bank 2010 1,350 0.49%9.85% HDFC Bank 2019 1,337 0.49%ABN Amro Bank 2009 1,035 0.38%Oriental Bank of Commerce 2009 982 0.36%Axis Bank 2009 947 0.34%Bank of Baroda 2010 841 0.31%UCO Bank 2010 827 0.30%8.90% State Bank of India 2018 606 0.22%8.47% IDBI Bank 2011 204 0.07%State Bank of India 46 0.02%
Banking services Total 70,945 25.79%
Financial institutions 11.10% Power Finance Corporation Limited 2013 4,300 1.56%9.40% Power Finance Corporation Limited 2013 3,613 1.31%11.00% Power Finance Corporation Limited 2018 2,939 1.07%8.45% Indian Railway Finance Corporation Limited 2018 2,756 1.00%11.10% Export Import Bank of India 2010 2,421 0.88%12.50% IDFC Limited 2009 2,343 0.85%IDFC Limited 2010 1,941 0.71%8.60% IDFC Limited 2011 1,785 0.65%9.03% Power Finance Corporation Limited 2013 1,712 0.62%8.55% Indian Railway Finance Corporation Limited 2019 1,645 0.60%11.75% Rural Electrification Corporation Limited 2011 1,231 0.45%9.45% Rural Electrification Corporation Limited 2013 1,220 0.44%9.00% IDFC Limited 2010 1,070 0.39%Export Import Bank of India 2009 947 0.34%8.50% Export Import Bank of India 2011 910 0.33%8.55% Power Finance Corporation Limited 2011 727 0.26%11.25% Power Finance Corporation Limited 2018 710 0.26%9.76% IRFC Limited 2012 667 0.24%8.46% Indian Railway Finance Corporation Limited 2014 636 0.23%9.68% IRFC Limited 2012 626 0.23%9.58% Export Import Bank of India 2009 609 0.22%9.05% Export Import Bank of India 2010 420 0.15%8.78% Power Finance Corporation Limited 2016 294 0.11%8.57% IRFC Limited 2016 283 0.10%9.25% Export Import Bank of India 2012 236 0.09%8.83% Indian Railway Finance Corporation Limited 2012 235 0.09%9.35% IDFC Limited 2009 223 0.08%
Financial institutions Total 36,499 13.27%
Others 156,189 56.78%Net Current Assets 11,463 4.17%
Grand Total 275,096 100.00%
Secure Plus Fund (2007-2008)
Industry Security name Market Value (Rs. ‘000) % of NAV
Banking services ICICI Bank 2009 11,176 5.37%Punjab National Bank 2009 6,061 2.91%Kotak Mahindra Bank 2008 5,583 2.68%10.10% State Bank of India 2022 4,624 2.22%Union Bank of India 2008 4,284 2.06%10.30% ICICI Bank 2009 4,264 2.05%Canara Bank 2009 3,824 1.84%9.90% Canara Bank 2010 3,417 1.64%9.90% Canara Bank 2009 3,317 1.59%IDBI Bank 2009 3,152 1.51%
ICICI PRU AR09_Final Pg29-197 (Ac).indd Sec1:181ICICI PRU AR09_Final Pg29-197 (Ac).indd Sec1:181 10/28/09 6:00:30 PM10/28/09 6:00:30 PM

I 182 I
FINANCIAL REPORT
Secure Plus Fund (2007-2008)
Industry Security name Market Value (Rs. ‘000) % of NAV
9.90% IDBI Bank 2009 2,062 0.99%11.06% Canara Bank 2009 1,838 0.88%10.20% State Bank of India 2022 1,741 0.84%10.43% Axis Bank 2009 1,679 0.81%10.50% Axis Bank 2008 1,525 0.73%11.10% Canara Bank 2009 1,440 0.69%9.35% Punjab National Bank 2023 1,049 0.50%9.50% State Bank of Patiala 2008 1,000 0.48%8.40% Axis Bank 2008 993 0.48%10.10% Axis Bank 2017 951 0.46%Punjab National Bank 2008 943 0.45%10.50% Axis Bank 2009 767 0.37%6.75% IDBI Bank 2008 554 0.27%9.78% State Bank of Bikaner and Jaipur 2022 471 0.23%10.00% ICICI Bank 2017 437 0.21%9.90% State Bank of Patiala 2022 425 0.20%UCO Bank 2009 391 0.19%Citibank 2008 348 0.17%8.47% IDBI Bank 2013 198 0.10%State Bank of India 69 0.03%Corporation Bank 11 0.01%
Banking services Total 68,594 32.95%
Financial institutions 9.40% Power Finance Corporation Limited 2013 3,305 1.59%9.79% IDFC Limited 2009 2,014 0.97%9.35% IDFC Limited 2009 1,975 0.95%9.25% Export Import Bank of India 2012 1,898 0.91%9.03% Power Finance Corporation Limited 2013 1,662 0.80%8.75% IRFC Limited 2013 1,604 0.77%9.80% Power Finance Corporation Limited 2012 1,393 0.67%8.60% IDFC Limited 2011 1,277 0.61%10.04% IRFC Limited 2027 1,220 0.59%10.25% IDFC Limited 2008 1,204 0.58%8.49% Power Finance Corporation Limited 2011 1,080 0.52%NABARD 2018 1,080 0.52%9.00% IDFC Limited 2010 1,045 0.50%8.50% Export Import Bank of India 2011 876 0.42%Export Import Bank of India 2008 795 0.38%9.05% IDFC Limited 2010 728 0.35%8.15% NABARD 2009 725 0.35%9.10% Export Import Bank of India 2010 724 0.35%8.00% Export Import Bank of India 2009 706 0.34%8.55% Power Finance Corporation Limited 2011 706 0.34%9.68% IRFC Limited 2008 669 0.32%9.76% IRFC Limited 2012 649 0.31%9.68% IRFC Limited 2012 609 0.29%10.00% NABARD 2010 606 0.29%9.58% Export Import Bank of India 2010 606 0.29%8.95% IDFC Limited 2018 605 0.29%8.40% Export Import Bank of India 2010 440 0.21%9.95% IRFC Limited 2022 427 0.21%8.78% Power Finance Corporation Limited 2016 289 0.14%8.57% IRFC Limited 2016 278 0.13%Power Finance Corporation Limited 2008 108 0.05%
Financial institutions Total 31,303 15.04%
Housing finance services 9.50% HDFC Limited 2017 4,210 2.02%9.50% HDFC Limited 2009 3,052 1.47%8.50% HDFC Limited 2008 2,939 1.41%9.75% LIC Housing Finance Limited 2017 2,664 1.28%9.80% LIC Housing Finance Limited 2017 2,369 1.14%10.00% ICICI Home Finance Company Limited 2013 2,097 1.01%9.50% HDFC Limited 2013 800 0.38%7.60% HDFC Limited 2017 675 0.32%9.20% HDFC Limited 2012 630 0.30%10.25% HDFC Limited 2012 611 0.29%HDFC Limited 2008 562 0.27%10.00% HDFC Limited 2010 452 0.22%9.70% HDFC Limited 2017 426 0.20%8.95% HDFC Limited 2010 375 0.18%
Housing finance services Total 21,862 10.50%
Others 72,998 35.06%Net Current Assets 13,438 6.45%
Grand Total 208,195 100.00%
Secure Plus Pension Fund (2008-2009)
Industry Security name Market Value(Rs. ‘000) % of NAV
Banking services 8.75% Canara Bank 2010 7,500 6.10%10.43% Axis Bank 2009 7,274 5.91%State Bank of Hyderabad 2010 3,790 3.08%ICICI Bank 2010 2,920 2.37%11.55% State Bank of Patiala 2009 1,818 1.48%11.11% State Bank of India 2009 1,788 1.45%State Bank of Patiala 2010 1,480 1.20%Punjab National Bank 2010 1,475 1.20%Bank of India 2010 1,473 1.20%IDBI Bank 2010 1,469 1.19%10.85% HDFC Bank 2018 1,400 1.14%
ICICI PRU AR09_Final Pg29-197 (Ac).indd Sec1:182ICICI PRU AR09_Final Pg29-197 (Ac).indd Sec1:182 10/28/09 6:00:31 PM10/28/09 6:00:31 PM

I 183 I
ANNUAL REPORT 2008-09ICICI PRUDENTIAL LIFE INSURANCE
Secure Plus Pension Fund (2008-2009)
Industry Security name Market Value(Rs. ‘000) % of NAV
9.95% Axis Bank 2019 921 0.75%Bank of India 2009 767 0.62%Andhra Bank 2009 766 0.62%Allahabad Bank 2009 765 0.62%9.90% Canara Bank 2010 690 0.56%9.85% HDFC Bank 2019 514 0.42%ABN Amro Bank 2009 452 0.37%Oriental Bank of Commerce 2009 435 0.35%Axis Bank 2009 417 0.34%Bank of Baroda 2010 374 0.30%UCO Bank 2010 367 0.30%8.90% State Bank of India 2018 261 0.21%8.47% IDBI Bank 2011 102 0.08%
Banking services Total 39,218 31.88%
Financial institutions 11.10% Power Finance Corporation Limited 2013 1,896 1.54%9.40% Power Finance Corporation Limited 2013 1,669 1.36%11.00% Power Finance Corporation Limited 2018 1,292 1.05%8.45% Indian Railway Finance Corporation Limited 2018 1,152 0.94%11.10% Export Import Bank of India 2010 1,083 0.88%12.50% IDFC Limited 2009 1,014 0.82%9.35% IDFC Limited 2009 872 0.71%IDFC Limited 2010 853 0.69%8.60% IDFC Limited 2011 848 0.69%9.03% Power Finance Corporation Limited 2013 784 0.64%8.55% Indian Railway Finance Corporation Limited 2019 704 0.57%9.45% Rural Electrification Corporation Limited 2013 540 0.44%11.75% Rural Electrification Corporation Limited 2011 533 0.43%9.00% IDFC Limited 2010 520 0.42%8.50% Export Import Bank of India 2011 505 0.41%Export Import Bank of India 2009 415 0.34%9.76% IRFC Limited 2012 324 0.26%9.68% IRFC Limited 2012 311 0.25%11.25% Power Finance Corporation Limited 2018 304 0.25%9.58% Export Import Bank of India 2009 293 0.24%8.55% Power Finance Corporation Limited 2011 273 0.22%8.46% Indian Railway Finance Corporation Limited 2014 271 0.22%9.05% Export Import Bank of India 2010 181 0.15%8.78% Power Finance Corporation Limited 2016 176 0.14%8.57% IRFC Limited 2016 142 0.12%9.25% Export Import Bank of India 2012 109 0.09%8.83% Indian Railway Finance Corporation Limited 2012 108 0.09%
Financial institutions Total 17,172 13.96%
Others 61,168 49.72%Net Current Assets 5,464 4.44%
Grand Total 123,022 100.00%
Secure Plus Pension Fund (2007-2008)
Industry Security name Market Value (Rs. ‘000) % of NAV
Banking services IDBI Bank 2009 6,832 7.05%ICICI Bank 2009 5,144 5.31%Punjab National Bank 2009 2,747 2.83%Union Bank of India 2008 2,012 2.08%10.30% ICICI Bank 2009 1,974 2.04%Canara Bank 2009 1,659 1.71%9.90% Canara Bank 2010 1,617 1.67%9.90% Canara Bank 2009 1,569 1.62%Kotak Mahindra Bank 2008 1,495 1.54%10.10% State Bank of India 2022 1,100 1.14%11.06% Canara Bank 2009 997 1.03%9.90% IDBI 2009 959 0.99%10.20% State Bank of India 2022 794 0.82%10.50% Axis Bank 2008 775 0.80%10.43% Axis Bank 2009 774 0.80%11.10% Canara Bank 2009 750 0.77%9.50% State Bank of Patiala 2008 500 0.52%8.40% Axis Bank 2008 496 0.51%9.35% Punjab National Bank 2023 481 0.50%10.10% Axis Bank 2017 476 0.49%Punjab National Bank 2008 418 0.43%6.75% IDBI Bank 2008 396 0.41%10.50% Axis Bank 2009 349 0.36%9.78% State Bank of Bikaner and Jaipur 2022 218 0.22%10.00% ICICI Bank 2017 205 0.21%9.90% State Bank of Patiala 2022 196 0.20%UCO Bank 2009 173 0.18%Citibank 2008 171 0.18%8.47% IDBI Bank 2013 99 0.10%
Banking services Total 35,376 36.50%
Financial institutions 9.4% Power Finance Corporation 2013 1,534 1.58%9.79% IDFC 2009 948 0.98%9.35% IDFC 2009 875 0.90%8.75% IRFC 2013 777 0.80%9.03% Power Finance Corporation 2013 761 0.79%9.80% Power Finance Corporation 2012 664 0.69%10.25% IDFC 2008 617 0.64%8.60% IDFC 2011 614 0.63%
ICICI PRU AR09_Final Pg29-197 (Ac).indd Sec1:183ICICI PRU AR09_Final Pg29-197 (Ac).indd Sec1:183 10/28/09 6:00:31 PM10/28/09 6:00:31 PM

I 184 I
FINANCIAL REPORT
Secure Plus Pension Fund (2007-2008)
Industry Security name Market Value (Rs. ‘000) % of NAV
10.04% IRFC 2027 609 0.63%9.25% Export Import Bank of India 2012 593 0.61%9.00% IDFC 2010 508 0.52%8.49% Power Finance Corporation 2011 501 0.52%8.50% Export Import Bank of India 2011 487 0.50%8.00% Export Import Bank of India 2009 378 0.39%8.15% NABARD 2009 377 0.39%Export Import Bank of India 2008 361 0.37%9.05% IDFC 2010 341 0.35%9.68% IRFC 2008 334 0.34%NABARD 2018 332 0.34%9.76% IRFC 2012 315 0.33%10.00% NABARD 2010 303 0.31%9.68% IRFC 2012 303 0.31%9.58% Export Import Bank of India 2010 291 0.30%8.95% IDFC 2018 271 0.28%8.55% Power Finance Corporation 2011 265 0.27%9.10% Export Import Bank of India 2010 249 0.26%8.40% Export Import Bank of India 2010 220 0.23%9.95% IRFC 2022 218 0.22%8.78% Power Finance Corporation 2016 173 0.18%8.57% IRFC 2016 139 0.14%Power Finance Corporation 2008 108 0.11%
Financial institutions Total 14,466 14.93%
Others 40,986 42.29%Net Current Assets 6,084 6.28%
Grand Total 96,912 100.00%
ICICI PRU AR09_Final Pg29-197 (Ac).indd Sec1:184ICICI PRU AR09_Final Pg29-197 (Ac).indd Sec1:184 10/28/09 6:00:31 PM10/28/09 6:00:31 PM

I 185 I
ANNUAL REPORT 2008-09ICICI PRUDENTIAL LIFE INSURANCE
3.21
A
sset
s he
ld t
o c
ove
r P
olic
yho
lder
s’ L
iab
ility
The
Pol
icyh
olde
rs’ l
iabi
litie
s in
clud
ing
linke
d fu
nd a
ggre
gatin
g R
s. 3
10,5
35,9
92 t
hous
and
as a
t M
arch
31,
200
9 ar
e ad
equa
tely
bac
ked
by a
sset
s as
at
Mar
ch 3
1, 2
009
as s
how
n be
low
:
(Rs.
‘000
)
Des
crip
tion
Par L
ifePa
r Pe
nsio
nN
on-P
arA
nnui
ties
Non
-Par
Hea
lthLi
nked
Life
N
on-U
nit
Link
ed L
ife
Uni
tLi
nked
Pen
sion
N
on-U
nit
Link
ed
Pens
ion
Uni
tLi
nked
Hea
lth
Non
-Uni
tLi
nked
H
ealth
Uni
tLi
nked
Gro
up
Non
-Uni
tLi
nked
G
roup
Uni
tTo
tal
Polic
yhol
ders
’ Lia
bilit
ies
as p
er
Bala
nce
Shee
t (A
)14
,910
,867
3,72
5,11
23,
694,
078
5,80
9,10
676
,741
1,55
7,06
116
9,49
0,24
717
9,39
985
,273
,021
13,2
1532
3,12
921
,507
25,4
62,5
0931
0,53
5,99
2
Ass
ets
held
to c
over
polic
yhol
ders
’ lia
bilit
ies
Inve
stm
ents
(As
per S
ched
ule-
8A &
8B)
15,6
26,5
834,
146,
047
4,73
8,02
35,
619,
057
123,
159
2,69
8,90
917
0,86
9,01
71,
134,
911
85,1
47,9
7862
,972
278,
371
156,
491
23,8
06,9
2631
4,40
8,44
4
Fair
Valu
e Ch
ange
Acc
ount
(117
,536
)(9
5,62
5)—
——
——
——
——
——
(213
,161
)
Reva
luat
ion
Rese
rve
(158
,497
)(1
57,8
22)
——
——
——
——
——
—(3
16,3
19)
Net
Inve
stm
ents
15,3
50,5
503,
892,
600
4,73
8,02
35,
619,
057
123,
159
2,69
8,90
917
0,86
9,01
71,
134,
911
85,1
47,9
7862
,972
278,
231
156,
491
23,8
06,9
2631
3,87
8,96
4
Curr
ent A
sset
s an
d Lo
ans
(As
per N
ote
3.17
& 3
.18)
1,05
4,24
518
5,12
831
9,21
619
1,60
921
7,22
73,
367,
470
5,71
9,08
883
6,45
63,
373,
437
100,
011
54,3
9414
,674
1,65
6,58
517
,089
,540
Less
: Cur
rent
Lia
bilit
ies
(As
per N
ote
3.17
& 3
.18)
(234
,765
)(2
9,05
3)(1
,363
,161
)(1
,560
)(2
63,6
45)
(4,5
09,3
18)
(3,0
12,1
56)
(1,7
91,9
68)
(1,7
43,4
85)
(149
,768
)(9
,363
)(1
49,6
58)
(1,0
02)
(13,
259,
175)
Tota
l Ass
ets
(B)
16,1
70,0
304,
048,
675
3,69
4,07
85,
809,
106
76,7
411,
557,
061
173,
575,
949
179,
399
86,7
77,9
3013
,215
323,
129
21,5
0725
,462
,509
317,
709,
329
The
Pol
icyh
olde
rs’ l
iabi
litie
s in
clud
ing
linke
d fu
nd a
ggre
gatin
g R
s. 2
68,1
14,0
79 t
hous
and
as a
t M
arch
31,
200
8 ar
e ad
equa
tely
bac
ked
by a
sset
s as
at
Mar
ch 3
1, 2
008
as s
how
n be
low
:
(R
s. ‘0
00)
Des
crip
tion
Par L
ifePa
r Pen
sion
Non
-Par
Ann
uitie
s N
on-P
arH
ealth
Link
ed L
ife
Non
-Uni
tLi
nked
Life
U
nit
Link
ed P
ensi
on
Non
-Uni
tLi
nked
Pe
nsio
n U
nit
Link
ed G
roup
N
on U
nit
Link
ed G
roup
U
nit
Tota
l
Polic
yhol
ders
’ Lia
bilit
ies
as p
er B
alan
ce S
heet
(A)
11,8
45,1
263,
272,
304
3,32
9,80
74,
043,
527
128,
243
568,
487
167,
631,
889
342,
562
59,1
98,4
4715
,841
17,7
37,8
4626
8,11
4,07
9
Ass
ets
held
to c
over
Pol
icyh
olde
rs’ L
iabi
litie
s
Inve
stm
ents
(As
per S
ched
ule-
8A &
8B)
14,1
32,0
364,
050,
155
3,59
1,54
13,
905,
821
379,
142
5,90
7,23
616
8,41
2,48
32,
393,
180
58,3
19,9
9413
3,93
815
,953
,600
277,
179,
126
Fair
Valu
e Ch
ange
Acc
ount
(1,3
14,1
43)
(419
,596
)—
(41,
447)
——
——
——
—
(1,7
75,1
86)
Reva
luat
ion
Rese
rve
(158
,497
)(1
57,8
21)
——
——
——
——
—(3
16,3
18)
Net
Inve
stm
ents
12,6
59,3
963,
472,
738
3,59
1,54
13,
864,
374
379,
142
5,90
7,23
616
8,41
2,48
32,
393,
180
58,3
19,9
9413
3,93
815
,953
,600
275,
087,
622
Curr
ent A
sset
s an
d Lo
ans
(As
per N
ote
3.17
& 3
.18)
519,
903
134,
807
456,
571
302,
228
75,5
9052
2,88
57,
381,
079
213,
813
4,02
2,62
77,
245
2,20
8,07
815
,844
,826
Less
: Cur
rent
Lia
bilit
ies
(As
per N
ote
3.17
& 3
.18)
(320
,894
)(6
3,36
5)(7
18,3
06)
(123
,075
)(3
26,4
90)
(5,8
61,6
34)
(4,8
56,7
56)
(2,2
64,4
30)
(2,3
55,7
39)
(125
,343
)(4
23,8
32)
(17,
439,
864)
Tota
l Ass
ets
(B)
12,8
58,4
053,
544,
180
3,32
9,80
64,
043,
527
128,
242
568,
487
170,
936,
806
342,
563
59,9
86,8
8215
,840
17,7
37,8
4627
3,49
2,58
4
ICICI PRU AR09_Final Pg29-197 (Ac).indd Sec1:185ICICI PRU AR09_Final Pg29-197 (Ac).indd Sec1:185 10/28/09 6:00:31 PM10/28/09 6:00:31 PM

I 186 I
FINANCIAL REPORT
3.22 Employee benefits Provision for staff benefits as per revised AS 15: (a) Defined Contribution Plans: The amount recognised as an expense during the year is Rs. 330,625 thousand
(Previous year Rs. 263,554 thousand).
(b) Defined Benefit Plans:(Rs. ‘000)
ParticularsYear ended
March 31, 2009
March 31, 2008
Change in Defined Benefit Obligation:Opening obligations as at April 1 110,505 62,376Service cost 45,911 25,017Interest cost 11,070 4,451Actuarial (gain)/loss (5,727) 24,093Benefits paid (10,268) (5,431)
Present value of the defined benefit obligations at March 31 (A) 151,491 110,506
Change in Plan Asset:Opening plan assets, at fair value as at April 1 47,860 44,053Expected return on plan assets 3,491 3,253Actuarial gain/(loss) (10,115) 5,984Contributions 4,966 —Benefits paid (10,268) (5,431)
Fair value of plan assets at March 31 (B) 35,934 47,859
Cost for the year:Service cost 45,911 25,017Interest cost 11,070 4,451Expected return on plan assets (3,491) (3,253)Actuarial (gain)/loss 4,388 18,108
Total net cost recognised as employee remuneration 57,878 44,323
Reconciliation of Benefit Obligations & Planned Assets for the period:Present value of the defined benefit obligations at March 31 (A) 151,491 110,506Fair value of plan assets at March 31 (B) 35,934 47,859
Net asset/(liability) as at March 31 recognised in Balance Sheet (115,557) (62,647)
Investment details of plan assets:The plan assets are invested in insurer managed funds.
Assumptions:Discount rate 5.50% 7.50%Salary escalation rate:Year 1 10.00% 7.00%Year 2 to 3 8.00% 7.00%Year 4 to 6 7.00% 7.00%Year 7 onwards 5.00% 7.00%Estimated rate of return on plan assets 7.50% 7.50%
ICICI PRU AR09_Final Pg29-197 (Ac).indd Sec1:186ICICI PRU AR09_Final Pg29-197 (Ac).indd Sec1:186 10/28/09 6:00:31 PM10/28/09 6:00:31 PM

I 187 I
ANNUAL REPORT 2008-09ICICI PRUDENTIAL LIFE INSURANCE
3.23 Employee Stock Option Scheme (“ESOS”) There are presently six ESOS schemes in force by name Founder I, Founder II, 2004-05, 2005-06, 2006-07 and
2007-08, salient features of which are as stated below:
Founder 1 2004-05 2005-06 2006-07 & Founder II
2007–08
Date of allotment March 28, 2005 April 25, 2005 April 26, 2006 April 24, 2007 April 25, 2008
No. of options granted 2,665,500 3,742,400 4,633,250 6,534,675 (2006-07)
6,074,000
470,000 (Founder II)
Graded Vesting Period
1st Year 50% of options granted
25% of options granted
25% of options granted
25% of options granted
25% of options granted
2nd Year 25% of options granted
25% of options granted
25% of options granted
25% of options granted
25% of options granted
3rd Year 25% of options granted
25% of options granted
25% of options granted
25% of options granted
25% of options granted
4th Year — 25% of options granted
25% of options granted
25% of options granted
25% of options granted
Maximum term of options granted
Later of the tenth anniversary of the date of grant of options or the fifth anniversary of the date of vesting of options
Mode of settlement Equity
Exercise price of options is subject to dilution formula and it depends on the capital base of the Company as at the date of exercise of the options. Exercise price of all the options outstanding as at March 31, 2007 for Founder I (2003-04) scheme, 2004-2005 scheme, 2005-06 scheme, 2006-07 scheme, Founder II and 2007-08 scheme is Rs. 30, Rs. 42, Rs. 70, Rs. 130, Rs. 130 and Rs. 400 respectively. A summary of status of Company’s Employee Stock Option Scheme in terms of options granted, forfeited and exercised is given below:
Particulars March 31, 2009 March 31, 2008
Outstanding at the beginning of the year 12,684,277 7,279,964Add: Granted during the year 6,074,000 7,004,675Less: Forfeited/lapsed during the year 1,005,695 1,464,563 Exercised during the year 1,143,570 135,799Outstanding at the end of the year 16,609,012 12,684,277Exercisable at the end of the year 2,920,138 2,030,765
During the year, the Company has recognised a compensation cost of Rs. Nil (Previous year: Rs. Nil) as the intrinsic value of the options.
Had the Company followed the fair value method for valuing its options for the year, the charge to the Revenue and Profit & Loss Account would have been higher by Rs. 359,034 thousand (Previous year: Rs. 135,282 thousand) and profit/(loss) after tax would have been Rs. 8,156,030 thousand (Previous year: Rs. 14,085,910 thousand). Consequently Company’s basic and diluted earnings per share would have been (Rs. 5.76) (Previous year: (Rs. 10.37)).
The weighted average price of options exercised during the year is Rs. 58.72 (Previous year: Rs. 58.05). The weighted average remaining contractual life of options outstanding at the end of the period is 7 years (Previous year: 7.8 years). The fair value of the options granted during the year was Rs. 400 as of the date of grant.
The Key assumptions used to estimate fair value of options are:
Risk-free interest rate
Expected life
Expected Volatility
Expected dividend yield
6.87%–8%
3–5 Years
28.65%
1.50%
ICICI PRU AR09_Final Pg29-197 (Ac).indd Sec1:187ICICI PRU AR09_Final Pg29-197 (Ac).indd Sec1:187 10/28/09 6:00:31 PM10/28/09 6:00:31 PM

I 188 I
FINANCIAL REPORT
3.24 Foreign exchange gain/(loss):
The amount of foreign exchange gain (net) credited to Revenue and Profit & Loss Account is Rs. 4,090 thousand (Previous year: Rs. 881 thousand foreign exchange loss).
3.25 Earnings per equity share:(Rs. ‘000)
Particulars March 31, 2009 March 31, 2008
I Net profit/(loss) as per profit and loss account available for equity shareholders for both basic and diluted earnings per equity share of Rs. 10 each
(7,796,996) (13,950,627)
II Weighted average number of equity shares for earnings per equity share
(a) For basic earnings per equity share 1,417,180,106 1,357,687,296
(b) For diluted earnings per equity share Number of equity shares for basic earnings per equity share
as per (ii) (a)1,147,180,106 1,357,687,296
Add: Weighted average outstanding employee stock options deemed to be issued for no consideration
Nil Nil
Weighted number of equity shares for diluted earnings per equity share
1,417,180,106 1,357,687,296
III Earnings per equity share
Basic (in Rupees) (5.50) (10.28)
Diluted (in Rupees) (5.50) (10.28)
3.26 Funds for Future Appropriations (‘FFA’) – Linked
Pursuant to IRDA’s notification dated March 29, 2006, the Appointed Actuary has determined an amount of Rs. 1,497,261 thousand (Previous year: Rs. 2,332,916 thousand) as release of actuarial reserves on policies which have lapsed earlier.
The cumulative balance of FFA as at March 31, 2009 of Rs. 5,590,611 thousand (Previous year Rs. 4,093,352 thousand) is not available for distribution to shareholders. Such amount is classified under Funds for Future appropriations – Linked, in the Balance Sheet.
3.27 The Micro, Small and Medium Enterprises Development Act, 2006
There are no dues payable to vendors covered by the Micro, Small and Medium Enterprises Development Act, 2006, as at March 31, 2009.
ICICI PRU AR09_Final Pg29-197 (Ac).indd Sec1:188ICICI PRU AR09_Final Pg29-197 (Ac).indd Sec1:188 10/28/09 6:00:31 PM10/28/09 6:00:31 PM

I 189 I
ANNUAL REPORT 2008-09ICICI PRUDENTIAL LIFE INSURANCE
3.28 Additional disclosures on expenses
The additional disclosures on expenses pursuant to IRDA notification dated March 28, 2008 have been detailed herein below:
(Rs. ‘000)
Particulars March 31, 2009 March 31, 2008
Outsourcing expenses 2,238,035 2,672,699
Business development expenses 813,879 1,886,603
Market support expenses 816,875 2,282,160
3.29 Previous year comparatives
Previous year figures have been regrouped and reclassified wherever necessary, to conform to current year presentation.
For & on behalf of the Board of Directors
____________________ ____________________ ____________________
Avijit Chatterjee K. V. Kamath Keki Dadiseth
Appointed Actuary Chairman Director
____________________ ____________________ ____________________
Sanaulla Khan Shikha Sharma Barry Stowe
Company Secretary Managing Director Director
____________________
N. S. Kannan
Executive Director
Place: Mumbai
Date: April 21, 2009
ICICI PRU AR09_Final Pg29-197 (Ac).indd Sec1:189ICICI PRU AR09_Final Pg29-197 (Ac).indd Sec1:189 10/28/09 6:00:32 PM10/28/09 6:00:32 PM

I 190 I
FINANCIAL REPORT
ICICI PRUDENTIAL LIFE INSURANCE COMPANY LIMITEDRECEIPTS & PAYMENTS ACCOUNT
FOR THE YEAR ENDED MARCH 31, 2009 (Rs. ‘000)
Particulars March 31, 2009 March 31, 2008
CASH FLOWS FROM OPERATING ACTIVITIESCash receipts from customers:Premium & Other receipts 174,912,805 155,767,196
Cash paid towards operating activities:Expenses & Withdrawals (78,648,580) (74,888,209)Reinsurance premium ceded (433,156) (206,148)Advances & Deposits (415,371) (531,646)Loan against policies (20,663) (1,599)Taxes Paid (202,896) (79,720,666) (230,711) (75,858,313)
Net cash from operating activities (A) 95,192,139 79,908,883
CASH FLOWS FROM INVESTING ACTIVITIESSale of fixed assets 1,024 3,508Purchase of fixed assets (726,847) (725,823) (1,348,968) (1,345,460)Purchase of investments (4,564,045,395) (1,514,934,707)Loan 4,562 4,058 Sale of Investments 4,447,683,173 1,414,945,308 Interest & Dividend received 9,221,551 5,659,929
Net cash from investing activities (B) (107,861,932) (95,670,872)
CASH FLOWS FROM FINANCING ACTIVITIESProceeds from issuance of share capital 262,614 889,226Share Premium on capital issued 9,805,443 16,119,025
Net cash used in financing activities (C) 10,068,057 17,008,251
Net increase in cash and cash equivalents (A+B+C) (2,601,736) 1,246,262Cash and cash equivalents at beginning of the year 6,168,887 4,922,625
Cash and Cash Equivalents at end of the year 3,567,151 6,168,887
Note:Cash & cash equivalents at the end of the year includes: – Cash (Including cheques in hand & stamps in hand) 2,474,405 2,986,791 – Bank Balances & Money at call & short notice 1,092,746 3,182,096
[Including bank balance for linked business of 3,567,151 6,168,887Rs. 8,390 thousands (Previous Year Rs. 3,807 thousands)]
As per our report of even date attached.
For Walker, Chandiok & Co For B S R & Co. For and on behalf of the Board of DirectorsChartered Accountants Chartered Accountants
Khushroo B. Panthaky Akeel Master Avijit Chatterjee K. V. Kamath Keki Dadiseth Barry StowePartner Partner Appointed Actuary Chairman Director DirectorMembership No. 042423 Membership No. 046768
Sanaulla Khan Shikha Sharma N. S. Kannan Company Secretary Managing Director Executive Director Place : Mumbai Date : April 21, 2009
ICICI PRU AR09_Final Pg29-197 (Ac).indd Sec1:190ICICI PRU AR09_Final Pg29-197 (Ac).indd Sec1:190 10/28/09 6:00:32 PM10/28/09 6:00:32 PM

I 191 I
ANNUAL REPORT 2008-09ICICI PRUDENTIAL LIFE INSURANCE
SUMMARY OF FINANCIAL STATEMENT (Rs. lakhs)
Sr. No. Particulars 2008-09 2007-08 2006-07 2005-06 2004-05
POLICYHOLDERS ACCOUNT
1 Gross premium income 1,535,622 1,356,106 791,299 426,105 236,382
2 Net premium income # 1,531,819 1,353,677 789,682 425,421 236,000
3 Income from investments (Net)@ (614,712) 292,318 98,906 142,319 19,270
4 Other income 95,051 160,948 75,816 23,114 23,345
– Contribution from the Shareholders account 94,857 160,635 75,800 23,067 23,335
– Linked Income — — — — —
– Fees and Charges 194 313 16 47 10
5 Total income 1,012,158 1,806,943 964,404 590,854 278,614
6 Commissions 69,999 81,097 52,551 28,339 17,796
7 Brokerage — — — — —
8 Operating expenses related to insurance business 273,872 291,994 152,296 72,383 46,152
9 Provisions for tax 2,114 2,896 1,226 610
10 Total Expenses 345,985 375,987 206,073 101,332 63,947
11 Payment to policyholders * 220,661 201,493 72,750 21,064 10,120
12 Increase in actuarial liability 64,412 58,897 64,314 32,895 22,467
13 Transfer to Linked Fund ** 359,807 1,138,055 607,664 434,557 178,906
14 Surplus/Deficit from operations 21,293 32,511 13,602 1,006 3,175
SHAREHOLDERS ACCOUNT
15 Total income under Shareholders Account 3,527 6,226 6,779 2,792 1,135
16 Profit/(loss) before tax (88,070) (154,314) (69,167) (20,333) (22,241)
17 Provision for tax 10,100 14,808 4,276 1,545 1,079
18 Profit/(loss) after tax (77,970) (139,506) (64,891) (18,788) (21,162)
19 Profit/(loss) carried to Balance sheet (377,646) (299,676) (160,170) (95,279) (68,569)
MISCELLANEOUS
20 (A) Policyholders account:
Total funds *** 3,110,655 2,702,056 1,497,502 824,678 346,833
Total Investments ^ 3,204,457 2,831,546 1,559,443 833,030 345,860
Yield on investments (%) (20%) 13% 8% 24% 10%
(B) Shareholders account:
Total funds 100,442 77,856 50,103 25,548 23,930
Total Investments 66,201 21,102 15,672 44,847 32,095
Yield on investments (%) 8% 34% 11% 5% 4%
21 Yield on total investments (20%) 13% 8% 23% 9%
22 Paid up equity capital 142,726 140,111 131,230 118,500 92,500
23 Net worth 100,442 77,856 50,103 25,548 23,931
24 Total assets 3,282,853 2,833,708 1,569,090 861,569 373,939
25 Earnings per share (Rs.) (5.50) (10.28) (5.28) (1.82) (2.76)
26 Book value per share (Rs.) 7.04 5.56 3.82 2.16 2.59
# Net of reinsurance@ Net of losses* Inclusive of interim bonuses, if any** Represents increase in unit reserve*** Includes provision for linked liabilities^ Includes assets held to cover linked liabilities
ICICI PRU AR09_Final Pg29-197 (Ac).indd Sec1:191ICICI PRU AR09_Final Pg29-197 (Ac).indd Sec1:191 10/28/09 6:00:32 PM10/28/09 6:00:32 PM

I 192 I
FINANCIAL REPORT
ACCOUNTING RATIOS
Sr. No.
Particulars March 31, 2009 March 31, 2008
1. New business premium income growth (segmentwise)(New business premium for current year divided by new business premium for previous year)Participating Life 98.3% 83.0%Participating Pension 81.9% 67.7%Non-Participating 95.4% 104.5%Annuities Non-Participating 94.0% 79.5%Health 96.3% 379.6%Linked Life 56.5% 115.7%Linked Pension 98.9% 331.5%Linked Group 123.3% 163.7%
2. Net retention ratio 99.8% 99.8%(Net premium divided by gross premium)
3. Ratio of expenses of management 22.5% 27.7%(Expenses of management divided by the total gross direct premium)
4. Commission Ratio 4.6% 6.0%(Gross commission paid to Gross premium)
5. Ratio of policyholders liabilities to shareholders funds 298.6% 302.4%
6. Growth rate of shareholders fund 129.0% 155.4%(Shareholders fund for current year divided by Shareholders fund for previous year)
7. Ratio of surplus to increase in policyholders liability– Par Life 9.1% 38.1%– Par Pension 13.6% 47.9%– Non-Par 41.6% —– Annuity Non-Par 2.1% —
8. Change in networth (percentage increase) 29.0% 55.4%
9. Profit after tax / Total income Nil Nil
10. (Total Real Estate + Loans) / Cash & invested assets 1.6% 1.6%
11. Total Investment */ (Capital + Surplus) 407.4% 470.1%
12. Total Affiliated Investment / (Capital+Surplus) 75.0% 25.4%
* Excludes Asset held to cover linked liabilities
ICICI PRU AR09_Final Pg29-197 (Ac).indd Sec1:192ICICI PRU AR09_Final Pg29-197 (Ac).indd Sec1:192 10/28/09 6:00:32 PM10/28/09 6:00:32 PM

I 193 I
ANNUAL REPORT 2008-09ICICI PRUDENTIAL LIFE INSURANCE
ICICI PRUDENTIAL LIFE INSURANCE COMPANY LIMITEDNEW BUSINESS PROFIT – FY 2008-09
Introduction
Life insurance policies when sold usually result in an accounting loss in the first policy year. This is called strain
and it arises largely due to the high acquisition costs associated with selling insurance and the prudential margin in
the reserving basis. Measuring sales performance using statutory profit/loss figures then becomes contradictory as
higher sales result in bigger losses. This also does not take into account the actual value created by the sale, which
will accrue to the Company over the life of the policy. To overcome these issues, a measure like NBP is used to
measure sales performance and value created by new business sales.
Definition
NBP is a metric for the economic value of the new business written during a defined period. It is measured as the
present value of the future profits for the shareholders on account of new business sales, based on a given set of
assumptions. Actual experience could differ from these assumptions especially in respect of expense over runs in
the initial years.
The NBP has been calculated net of tax after providing for the cost of capital that would be required to support
the business. The cost of capital is taken as the difference between the nominal value for the solvency capital and
the present value, at the discount rate, of future release of the capital together with the investment earning on the
solvency capital.
Basis of Preparation
NBP incorporates best estimate assumptions of future rates of investment returns, policy discontinuances, mortality,
expenses, inflation, taxation, bonus rates and liability valuation bases.
Economic Assumptions
We have left the long term economic assumptions unchanged from last year. The economic assumptions used for
calculation of NBP are as follows:
Particulars FY2008-09 FY2007-08
Inflation 5.50% 5.50%
Investment returns by asset class– Cash 6.50% 6.50%– Medium term G. Sec. 7.90% 7.90%– Long term G. Sec. 8.40% 8.40%– Corporate Bonds 8.85% 8.85%– Equity 13.25% 13.25%
Risk Discount Rate 13.25% 13.25%
Taxation at the current rate of 12.5% (plus 10% surcharge + 3% education cess) is assumed to apply to Life and
Health business throughout the projection period. The earning rate for each product category would depend on the
asset mix of the funds relating to the product.
Results
(Rs. in mn)
Particulars FY2008-09 FY2007-08
NBP 10,120 12,539
ICICI PRU AR09_Final Pg29-197 (Ac).indd Sec1:193ICICI PRU AR09_Final Pg29-197 (Ac).indd Sec1:193 10/28/09 6:00:32 PM10/28/09 6:00:32 PM

I 194 I
FINANCIAL REPORT
Sensitivity
The sensitivity of the NBP to the economic assumptions is given below:
(Rs. mn)
Particulars Base Case +1% -1%
Investment income 10,120 10,682 9,582
Risk Discount Rate 10,120 9,180 11,099
This year, in view of the gap between market rates and our assumptions, we also disclose in the table below the
effect of changing economic assumptions to reflect observed market rates. We construct two scenarios:
A, wherein bond yields reflect market rates but the risk discount rate is unchanged, so, implicitly, the equity risk
premium is increased, and
B, wherein bond yields are reduced as in A, and so is the risk discount rate.
Particulars Scenario A Scenario B
Inflation 5.00% 5.00%
Investment returns by asset class– Cash 5.50% 5.50%– Medium term G. Sec 6.75% 6.75%– Long term G. Sec 7.75% 7.75%– Corporate Bonds 8.25% 8.25%– Equity 13.25% 12.10%
Risk Discount Rate 13.25% 12.10%
Sensitivity
The sensitivity of the NBP to the economic assumptions is given below: (Rs. in mn)
Particulars NB Profits
Base Case 10,120
Scenario A 9,869
Scenario B 10,595
ICICI PRU AR09_Final Pg29-197 (Ac).indd Sec1:194ICICI PRU AR09_Final Pg29-197 (Ac).indd Sec1:194 10/28/09 6:00:32 PM10/28/09 6:00:32 PM

I 195 I
ANNUAL REPORT 2008-09ICICI PRUDENTIAL LIFE INSURANCE
CONTACT INFORMATIONAt ICICI Prudential Life we believe that all stakeholders & customers should have access to complete information regarding the company, its products, its position, etc. ICICI Prudential Life website (www.iciciprulife.com) serves as an easy mode of communication for all customers / stakeholders.
Customers / Stakeholders can also contact us as follows :
Write to us :
ICICI Prudential Life Insurance Company Ltd.
Vinod Silk Mills Compound, Chakravarthy Ashok Road,
Ashok Nagar, Kandivali (East), Mumbai 400 101
Call us :
• Toll free BSNL / MTNL number – 1800-22-2020
• Call centre numbers :
Location Number Location Number
Andhra Pradesh
Assam
Bihar
Chhattisgarh
Delhi
Goa
Gujarat
Haryana (Karnal)
Haryana (Faridabad)
Karnataka
Kerala
Madhya Pradesh
9849577766
9954077766
9931377766
9893127766
9818177766
9890447766
9898277766
9896177766
9818177766
9845577766
9895477766
9893127766
Maharashtra (Mumbai)
Maharashtra (Rest)
Orissa
Punjab
Rajasthan
Tamil Nadu (Chennai)
Tamil Nadu (Rest)
Uttar Pradesh (Agra, Bareilly, Meerut, Varanasi)
Uttar Pradesh (Kanpur, Lucknow)
Uttaranchal
West Bengal (Kolkata)
West Bengal (Rest)
9892577766
9890447766
9937777766
9815977766
9829277766
9840877766
9894477766
9935277766
9935277766
9897307766
9831377766
99330 77766
Email us:Prospect / Customer : To know more about our policies or for any comments, queries or suggestions about our services and products or our website, please write to [email protected]
NRI Customers : To know more about our policies or for any comments, queries or suggestions about our services and products or our website, please write to [email protected]
Group Customer : To know more about our policies or for any comments, queries or suggestions about our services and products or our website, please write to [email protected]
Prospect Advisor : For an opportunity to become an Advisor with ICICI Prudential, individuals who are graduates and above the age of 25 years can e-mail their resumes to [email protected]
Prospect Corporate Agency : For an opportunity to become a Corporate Agent with ICICI Prudential, any company, firm, bank, or financial institutions such as broker, NBFC etc. can send an e-mail to [email protected]
Walk into any of our offices: You could walk into any of our 2,104 offices located across the country, the details of which can be obtained from the Branch Locator section of our website (www.iciciprulife.com).
ICICI PRU AR09_Final Pg29-197 (Ac).indd Sec1:195ICICI PRU AR09_Final Pg29-197 (Ac).indd Sec1:195 10/28/09 6:00:32 PM10/28/09 6:00:32 PM

Notes
ICICI PRU AR09_Final Pg29-197 (Ac).indd Sec1:196ICICI PRU AR09_Final Pg29-197 (Ac).indd Sec1:196 10/28/09 6:00:32 PM10/28/09 6:00:32 PM

VISION
To be the dominant Life, Health & Pensions player
built on trust by world-class people & service.
Awards & Accolades
Life Insurance Company of the Year
ICICI Prudential Life was awarded the Life Insurance Company of the Year at the
12th Asia Insurance Industry Awards 2008.
Brand Equity Most Trusted Brands 2009
ICICI Prudential Life ranked as the Most Trusted Pvt Life Insurance brand in The Economic Times - Brand Equity Most Trusted Brands 2009 survey.
Best Life Insurer-Runner Up
ICICI Prudential Life Insurance was declared Runner Up in the Best Life Insurer category at the
Outlook Money & NDTV Profit Awards 2008.
ICAI Award for Excellence in Financial Reporting
ICICI Prudential Life Insurance was awarded with the coveted ICAI Award for Excellence in Financial Reporting under the Insurance
sector category by the Institute of Chartered Accountants of India (ICAI) for the financial year ended March 31, 2008.
UK Trade & Investment India Business Awards 2008
ICICI Prudential Life won the UK Trade & Investment India Business Awards 2008 in the Business Partnership
Award-Large Company category
Bronze Effies in the Sevices Catgeory
ICICI Prudential Life won two Bronze Effies for advertising effectiveness in the sevices category.
Brand Excellence in Banking and Financial services
ICICI Prudential Life won the Award for Brand Excellence in the Banking and Financial Services category at
the Asia Brand Congress 2008.
HR Excellence Award 2008
Confederation of Indian Industry (CII) - Western Region awarded ICICI Prudential Life a Commendation for Strong
Commitment to HR Excellence 2008
SAP-ACE 2008 Award for Best Business Objects Implementation
ICICI Prudential Life was awarded the SAP-ACE 2008 Best Business Objects Award for its IT practices.
ICICI PRU AR09_COVER.indd 2ICICI PRU AR09_COVER.indd 2 11/7/09 11:43:12 AM11/7/09 11:43:12 AM

ICICI PRUDENTIAL LIFE INSURANCE COMPANY LIMITEDRegistered Office: ICICI PruLife Towers, 1089 Appasaheb Marathe Marg, Prabhadevi, Mumbai 400 025.
Tel: +91-22-4039 1600 or visit us at www.iciciprulife.com
Annual Report 2008-09
learn • adapt • strengthenearn• da •str nh
n
An
nu
al Rep
ort 2008-09
ICICI PRUDENTIAL LIFE IN
SURANCE COM
PANY LIM
ITED
ICICI PRU AR09_COVER.indd 1ICICI PRU AR09_COVER.indd 1 11/7/09 11:43:10 AM11/7/09 11:43:10 AM