Annual Report 2007 - Cropper · Plant (EDP) per working day ... Annual Report 2007 James Cropper...
62
James Cropper PLC Annual Report 2007 for the period ended 31 March 2007 Registered number: 30226
Transcript of Annual Report 2007 - Cropper · Plant (EDP) per working day ... Annual Report 2007 James Cropper...

James Cropper PLC
Annual Report 2007
for the period ended 31 March 2007
Registered number: 30226

Over the next few years it is anticipated that there will be a significant increase inoutput from our manufacturing facility in Burneside. As a consequence there will be a
corresponding increase in energy consumption, water abstraction and wastegeneration. This expansion will take place against the background of increasingly
tighter regulatory control by Government agencies, most notably through the termsand conditions of the Group’s IPPC Permit to Operate, Climate Change Agreement
and the European Union Emission Trading Scheme (“EUETS”).
Water• 1 million gallons/ 4,545 cubic metres of water are
abstracted from the River Kent each working day• 10 million gallons/ 45,450 cubic metres of water
are re-cycled every working day• 1 million gallons/ 4,545 cubic metres of water
effluent are discharged to the Effluent De-wateringPlant (EDP) per working day
• Papermaking fibres were recovered from watereffluent in the form of “sludge”
• A study is to be undertaken into the feasibility ofthe Group cleaning its water effluent, thusallowing the Group to discharge its cleaned waterdirectly into the River Kent. This would sever theGroup’s dependency on United Utilities PLC.
Land• In 2005/06 10,000 tonnes of recovered papermaking
“sludge” was deposited in the Group’s landfill site• A new EDP was commissioned in May 2007• Landfilling of papermaking “sludge” ceased in
2007/08• The new EDP recovers papermaking fibres in the
form of “cake”, which is considerably dryer than“sludge”
• Annual output of “cake” will be 3,750 tonnes.• Landspreading of papermaking “cake” commenced
in 2007/08 • A feasibility study indicates that “cake” and other
waste reclaimed materials can be utilised as fuels ina biomass boiler.
Lagoons will bereplaced with our newEffluent Disposal Plant
Landfill site will bereturned to a natural
state

The Group’s location on the edge of the Lake District National Park and on the River Kent, a Siteof Special Scientific Interest and a European Site, Special Area of Conservation, will ensure that
its activities will come under close scrutiny. In addition the rapid increase in energy costs inrecent years brings consumption and conservation of energy into sharp business focus
particularly when weighed against the background of increasing manufacturing output. Unlessmanaged effectively, a number of energy and environmental issues could constrain the Group
from meeting its strategic objectives.
Air• The Group operates a “good quality” Combined
Heat and Power (CHP) Plant• In 2005/06 the CHP Plant consumed 7.5 million
therms of gas• In 2005/06 the Group emitted 44,000 tonnes of
carbon dioxide• The Group will have to comply with the EUETS
from January 2008• The Group’s Phase 2 EUETS allocation is 41,000
tonnes of carbon dioxide per annum• A waste heat recovery unit commissioned in
2006/07 will reduce gas consumption and CO2
emissions by 5% per annum
• The Biomass feasibility study indicates that abiomass boiler would reduce gas consumptionby 20%
• The Biomass boiler would generate steam fromwaste that is regarded to be carbon neutral
• The Group has now exceeded all 3 of its ClimateChange Agreement (CCA) Milestones for specificenergy use per tonne of saleable product.
1

Vision StatementJames Cropper PLC
Our Company GoalTo prosper and grow throughdeveloping a portfolio ofcomplementary and successfulbusiness activities
Our Values– the beliefs and standards by whichwe will deliver our Company Goal
• Improving profitability and havingthe drive to succeed
• An absolute commitment to safetyand the environment
• Valuing customers as the lifebloodof our business
• Developing the potential of ouremployees in a stimulating andenjoyable workplace
• Treating everyone with dignity andrespect
• Being enthusiastic about doingthings better
• Making a positive contribution toour community
• Having integrity and high standardsin everything we do
2 Vision Statement
Summary of Results
Summary of Results IFRS basis UK GAAP basisGroup 5 Year Performance 2007 2006 2005 2005 2004 2003
Group turnover £'000 69,085 64,201 64,568 64,568 58,010 56,419
Profit and Loss Summary £'000Trading activitiesPaper Division (papermaking and retail) 1,077 (6) 2,157 2,207 806 1,011Converting Division 460 62 385 389 438 551Technical Fibre Products 2,053 777 521 522 506 646Other Group expenses (86)
3,504 833 3,063 3,118 1,750 2,208Director and employee bonuses (433)"On-going" trading operating profit 3,071 833 3,063 3,118 1,750 2,208Profit on sale of trade investment 116Trading operating profit 3,071 949 3,063 3,118 1,750 2,208Joint venture (95) (89) (114) (114) (93) (23)Other (expenditure)/income (200) (200) (50) 16Trading profit before interest 2,976 860 2,749 2,804 1,607 2,201Net interest (438) (511) (357) (337) (355) (408)
Trading profit before tax 2,538 349 2,392 2,467 1,252 1,793(After future service pension contributions paid)Net pension adjustments toOperating profit (610) (364) (423) (696) (467) 74Net interest 179 (114) (330)
Net pension adjustment before tax (431) (478) (753) (696) (467) 74
Overall Group after pension adjustmentsOperating profit 2,461 585 2,640 2,422 1,283 2,282Joint venture (95) (89) (114) (114) (93) (23)Other (expenditure)/income (200) (200) (50) 16Profit before interest 2,366 496 2,326 2,108 1,140 2,275Net interest (259) (625) (687) (337) (355) (408)
Profit/(loss) before tax 2,107 (129) 1,639 1,771 785 1,867
Earnings/(Loss) per Share 16.2p (1.2p) 12.6p 13.8p 7.6p 15.1p
Dividends per Share 7.0p 4.1p 8.2p 8.2p 7.8p 7.5p
Balance Sheet Summary £'000Non-pension assets - excluding cash 45,758 46,668 47,005 46,155 45,759 43,627Non-pension liabilities - excluding borrowings (13,505) (11,993) (11,524) (12,044) (11,184) (10,376)
32,253 34,675 35,481 34,111 34,575 33,251Net pension (liabilities)/assets (4,306) (7,221) (7,495) 831 (73) 394
27,947 27,454 27,986 34,942 34,502 33,645Net borrowings (5,294) (8,595) (8,350) (7,404) (7,427) (6,526)Equity shareholders' funds 22,653 18,859 19,636 27,538 27,075 27,119
Gearing % 23 46 43 27 27 24
Capital Expenditure £'000 2,756 2,889 3,228 3,228 3,101 2,299
Following adoption of Regulation 1606/2002 by the European Parliament in July 2002 all EU listed companies are required to reporttheir consolidated financial statements under IFRS adopted for use in the EU (“adopted IFRS”) for accounting periods beginning onor after 1 January 2005. Prior to this period James Cropper PLC had previously reported its results under UK Generally AcceptedAccounting Principles (“UK GAAP”).
Summary of Results 3

Contents
Annual Report 2007
James Cropper PLC
Summary of Results 3
Directors, Bankers and Advisers 5
Chairman’s Review 6
Financial Review 8
Business Review • Speciality Papers 13
Business Review • The Paper Mill Shop 14
Business Review • Converting 15
Business Review • Technical Fibre Products 16
Health and Safety 17
Environment 18
Effluent De-watering Plant 21
Risk Management 22
Report of the Directors 23
Directors’ Remuneration Report 27
Independent Auditors’ Report to the Members of James Cropper PLC 30
Group Profit and Loss Account 31
Balance Sheets 32
Cash Flow Statements 33
Statements of Recognised Incomeand Expense 33
Notes to the Financial Statements 34
2006 - 2007 Shareholder Information 56
Notice of Annual General Meeting 57
4 Contents

Directors, Bankers and Advisers
Directors, Bankers and Advisers 5
Non-Executive Chairman
James A Cropper BA, FCA – Born 1938– is the great, great grandson of thefounder. He joined the Company in 1966. Hebecame Non-Executive Chairman in 2001.He is also Lord-Lieutenant of Cumbria.
Executive Directors
Chief Executive & Managing Director,Paper DivisionAlun I Lewis BSc, MBA – Born 1957. He joined the Group in 1987 fromWiggins Teape Limited and the Board inApril 1998, becoming Chief Executive inJanuary 2001.
Group Finance DirectorJohn M Denman BSc, FCA – Born 1952. He joined the Group and the Board in1995 from Cable & Wireless PLC. He isresponsible for Finance, Safety andEnvironment, Purchasing, InformationSystems and Project Management. He isalso a trustee of the James Cropper PLCPension Scheme, Treasurer of theConfederation of Paper Industries Limitedand a director of the Paper Federation ofGreat Britain Limited.
Sales and Marketing Director, Paper DivisionNigel A Read BA – Born 1954. Hejoined the Group in 1981 from RobertFletcher & Sons Limited and the Board in1998. He is also a trustee of the JamesCropper PLC Pension Scheme.
Operations Director, Paper DivisionPatrick J Willink BSc, MBA – Born 1964– is also related to the founder. He joinedthe Group in 1990 from AquascutumLimited and the Board in 1998.
Managing Director, Technical Fibre Products LtdGeorge T Quayle BSc, C Chem, MRSC– Born 1953. He joined the Group in1992 from Whatman PLC and the Boardin 1998.
Non-Executive Directors
John R Sclater MA, MBA – Born 1940. He joined the Board in 1972. He isChairman of Graphite Enterprise TrustPLC, Argent Group (Europe) Limited andFinsbury Emerging Biotechnology TrustPLC. He is a director of Millennium &Copthorne Hotels PLC. He was formerlyChairman of Nordic Bank PLC, GuinnessMahon & Co Limited, Hill Samuel BankLimited, Berisford International PLC, TheUnion Discount Company of London PLCand various other companies. He wasalso the First Church EstatesCommissioner, a member of the Councilof the Duchy of Lancaster and a Trusteeof The Grosvenor Estate.
Peter L Herring BSc (Econ) – Born 1940. He joined the Board in 1997. He is adirector of Brenmatch Limited and waspreviously a director of BPB PLC.
David R Wilks LLB (Hons) – Born 1954. He joined the Board in April 2004. He is aDirector of Wilks & Partners, themanagement consultancy he founded in2001. Prior to this, he had extensivemanufacturing operations experience withH. J. Heinz and United Biscuits and was adirector of ER Consultants.
Mark Cropper MA - Born in 1974. He joined the Board in 2006 and is thesixth generation of the Cropper family tobe involved in the business. Mark is aFSA authorised corporate finance adviserfor Turquoise International, whichspecialises in energy and environmentalinvestment. He previously worked atJohnson Matthey PLC as a fuel cellanalyst. He is a director of EllergreenLimited and formerly a director of RivaSociety GB Limited.
Company SecretaryDavid R Carey FCCA – Born 1947. He joined the Group in 1974 as ChiefAccountant. He became CompanySecretary in 1996.
BankersBarclays Bank PLCSinger & Friedlander LimitedThe Royal Bank of Scotland PLCHSBC Bank PLCFortis Bank SA/NV
Independent AuditorsPricewaterhouseCoopers LLP, Newcastle upon Tyne
Tax AdvisorsPricewaterhouseCoopers LLP, Newcastle upon Tyne
StockbrokersBrewin Dolphin Securities, Birmingham
Corporate LawyersDickinson Dees, Newcastle upon Tyne
Financial AdvisersClose Brothers PLC, London
RegistrarsCapita Registrars, Huddersfield
Public RelationsCitigate Dewe Rogerson, Birmingham
Pension AdvisorsWatson Wyatt, Manchester
James Cropper PLCBurneside Mills, Kendal, Cumbria LA9 6PZ, England
Telephone 01539 722002Fax 01539 722001
email: [email protected]: www.cropper.com
Company RegistrationNo: 30226 (Limited by shares)
BS EN ISO 9001: 2000 FM 10048
BS EN ISO 14001: 2004 EMS 57536
OHSAS 18001: 1999 OHS 93474
Chairman’s Review
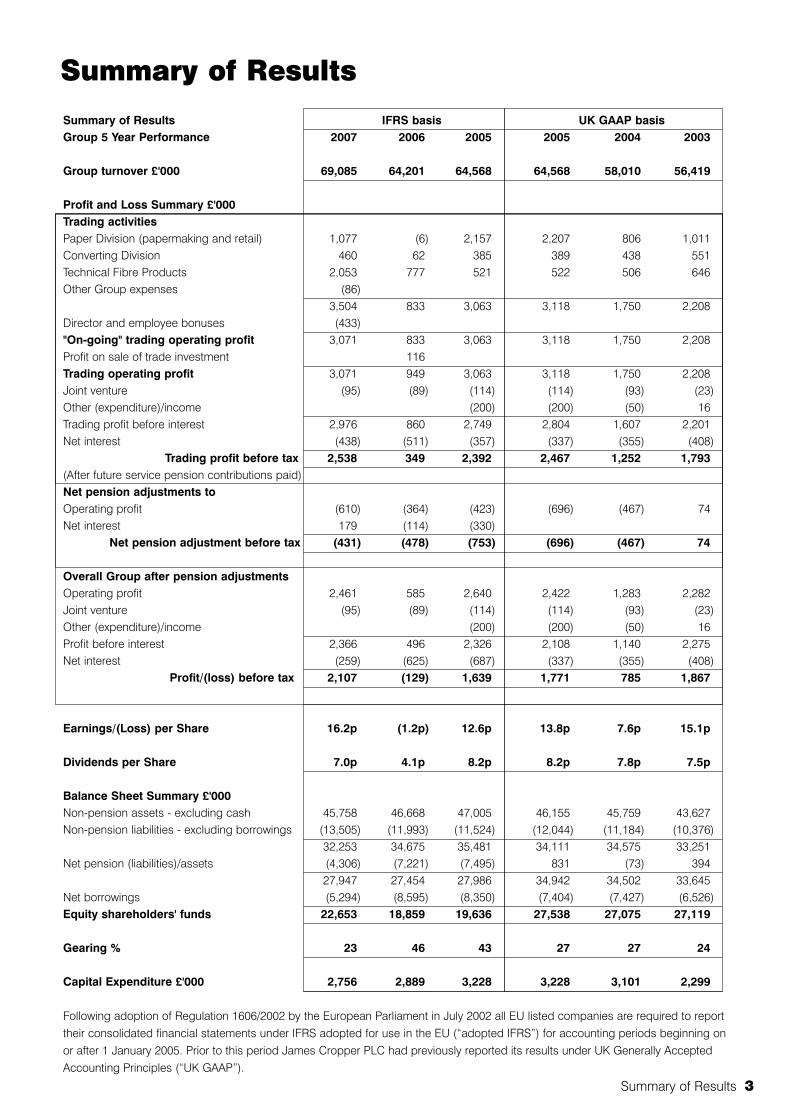
I am delighted to report that the Group recorded a profit before tax of£2,107,000 for the year (a profit of £2,538,000 prior to net IFRS pensionadjustments). This compares with a loss before tax of £129,000 in 2006 (a profit of £349,000 prior to net IFRS pension adjustments).
James Cropper PLC
DividendsOur strong recovery and return to profitability is reflected in theproposed increase in dividend to shareholders. The Board isproposing a final dividend payment of 5.1p, making a totaldividend for the full year of 7.0p compared to 4.1p in 2006, anoverall increase of 71%.
AIMThe Board, after careful consideration, proposes to move thetrading of the Company’s issued share capital from the OfficialList of the UK Listing Authority to the Alternative InvestmentMarket (“AIM”) of the London Stock Exchange plc. The Boardconsiders that AIM would provide a regulatory framework moreappropriate to a company of James Cropper’s size.
A Circular explaining the implications of the proposed move toAIM and giving Notice of an Extraordinary General Meeting toapprove the de-listing of the Company’s shares from the OfficialList is expected to be despatched to shareholders at the sametime as the Company’s Annual Report and Financial Statementsscheduled to be posted on 9 July 2007.
It is expected that the Extraordinary General Meeting to approvethe de-listing will be held following the conclusion of the AnnualGeneral Meeting, which is to be held on 1 August 2007.
Technical Fibre Products (“TFP”)Operating profit for the year was £2,053,000 against £777,000 in2006, with turnover improving overall by 34% on the previousyear to £9,003,000.
Given the 11% weakening of the US$ over the year TFP’s resultsare impressive. Sales into the North American market grew by48% in £Sterling terms and by 61% in US$ terms. Global growthof engineered composite materials, the continued resurgence ofcommercial aircraft new-builds and the commercialisation ofconductive components in consumer electronics have beenprime drivers behind this growth. At the average exchange ratefor the year, sales to the North American market representedapproximately 48% of TFP’s turnover in £Sterling terms.
Sales to Rest of the World were ahead by 23%, with sales ofcomposite and insulating materials leading the way. Our positionin the European thermal insulation market has beenstrengthened as a consequence of TFP’s main customer in thismarket transfering responsibility for converting operations to TFPin the fourth quarter of the year.
James Cropper Speciality Papers (“Speciality Papers”)Speciality Papers reported an operating profit of £1,435,000compared to a loss of £247,000 last year.
Sales increased by 5% to £45,967,000, with UK and export salesimproving by 7% and 2% respectively. Volume increased by 3%.Although price increases were achieved, the competitive natureof both UK and export markets limited the full recovery of thedramatic cost increases experienced and reported in previousyears.
The sudden reversal in the latter part of the year of the steepupward trend in the cost of natural gas experienced in theprevious 12-month period had a very significant impact on theprofitability of Speciality Papers. Although the average cost ofnatural gas in the first half was 34p per therm, up 15% on theprevious period, prices fell in the second half of the year bringingthe average for the full year to 31p per therm, down 34%. The fallwas driven by increased UK storage capacity, commissioning ofadditional pipelines from Europe and a milder winter.Expenditure on gas totalled £2.2m for the year against £3.2m inthe previous year.
The saving derived from the fall in energy costs was offset by asteady increase in the cost of pulp. Although the C= was relativelystable against £Sterling throughout the year, the US$ fellsignificantly against both currencies. This affected the relativeprices of Northern Bleached Softwood Kraft (“NBSK”) pulp, themarket benchmark priced in US$s and hardwoods priced in C=.NBSK opened the financial year at US$630 per tonne andincreased progressively to US$760 per tonne at the end of thefinancial year, up 21%. The cost of C= priced hardwoodsfluctuated by a much smaller degree during the course of theyear. Overall pulp costs in the year were £0.8m higher than in theprevious 12 months.
During the year significant progress was made with regard to thereduction of the cost base through greater energy efficiency,improved productivity and lower wastage.
James Cropper Converting (“Converting”)Converting’s turnover increased by 2% to £11,157,000.Operating profit was £460,000 compared to £62,000 in theprevious year. (The prior year’s profit was after a deduction of£250,000 relating to accelerated depreciation attributable to therationalisation of laminating equipment anticipated in the pastfinancial year).
The incremental improvement in profitability in the year primarilyderived from the substantial refurbishment of an existinglaminating line. This investment was commissioned half waythrough the financial year being reported and has delivered asignificant increase in capability, output and productivity. Theweakening of the US$ over the year adversely affected marginson mountboard sales to the USA.
The Paper Mill ShopThe depressed level of consumer spending across most of theretail sector, which has been widely reported, continued to affectThe Paper Mill Shop.
Turnover was £6,038,000, down 2% on the previous year, whilstthe operating profit of £241,000 reported last year was reducedto a loss of £358,000. Although only one new outlet was openedduring the course of the year, brand development was extendedthrough the launch of an Internet offering which commencedtrading in the second half-year.
During the year we also commissioned external research into thepapercraft market. The Board, having reviewed the results of thisresearch, has agreed a plan to implement the recommendationsmade in order to restore this subsidiary’s profitability.
Pensions and International Accounting Standard19 (“IAS 19”)Over the course of the year we have witnessed a significantimprovement in the pension position, with the IAS19 deficitdeclining by £4,163,000 to £6,152,000 as at 31 March 2007.(2006 -£10,315,000).
6 Chairman’s Review

Chairman’s Review 7
Actual future service pension contributions paid in the period bythe Group to its two final salary schemes in accordance with theActuaries’ recommendations, resulting from their latest “on-going” valuations, were £988,000. Under IAS 19 the chargeagainst profit in the year was £1,419,000, which was £431,000 inexcess of the future service contributions that were actuallyrequired. In addition, contributions totalling £838,000 were paidto the two schemes in respect of their past service deficitsbrought forward.
PeopleThe past few years have been especially challenging for theemployees of James Cropper PLC as the Group strived to makein-roads into its cost base, whilst improving customer service,against the background of adverse trading conditions. The yearhas seen the completion of major investments in SpecialityPapers and Converting, which together eliminated some 25 jobs.Most of the employees affected by these changes have been re-deployed into other roles as a consequence of natural turnoverwithin the business. Other changes have also led to improvedproductivity through the reduction of jobs.
The involvement, inventiveness and flexibility of our employeesare essential components in our objective to improveperformance across the Group. I am delighted that in striving forthis, our employees will be rewarded with bonuses for theirendeavours to improve profitability, safety and attendanceperformance over the year.
It has been a time of change at senior management level. Nigel Mitchell, our HR Manager left us and was succeeded byJonathan Smith, whilst Isabelle Maddock was recruited asFinancial Controller in anticipation of David Carey’s retirement inSeptember 2007. I was particularly delighted to welcome my sonMark to the Board as a Non-Executive Director, the sixthgeneration of my family to be involved with James Cropper PLC.
Jonathan Smith Isabelle Maddock Mark Cropper
SafetyThere were 12 Lost Time Accidents (“LTAs”) in the past financialyear compared to 17 in the previous year. Over the last six yearsthe 12-month moving average has fallen from 3.5 LTAs permonth to 1 LTA per month. This improvement marks the steadyprogress of our Safety Strategy over this period. We firmlybelieve that a safer working environment also provides a moreeffective, productive and cost efficient working environment. Thecreation of a safer working environment is therefore offundamental importance to the Group’s employees and otherstakeholders.
EnvironmentThe Group has embarked on an ambitious investmentprogramme to ensure that energy and environmental issues donot constrain the Group from meeting its strategic objectives.Initially the programme will focus on effluent treatment, solidwaste and energy generation and usage. This programme willstretch out over the next four years.
In the past year a project to capture and re-use heat escapingfrom our power station was successfully commissioned. Initialperformance has been very encouraging, suggesting that it willreduce the Group’s gas consumption by 5% per annum. Also, inthe year the Group invested in a new Effluent Dewatering Plant(“EDP”), which has dramatically reduced the water content ofpapermaking sludge. Although in the short-term sludge will bespread on farmland, a feasibility study currently beingundertaken indicates that it could be consumed as an energysource in biomass combustion.
OutlookTFP’s exceptional growth in the past financial year beingreported has rewarded our patient, long-term resolve indeveloping this business. The extent and varied nature of ourcurrent commercial product portfolio and product developmentprogramme gives us increased confidence that TFP will continueto grow profitably, although as shareholders should appreciate, itmay be unrealistic to expect growth to be sustainable at the rateachieved in the past year.
The impact of reduced energy costs on Speciality Papers ismost welcome. However a further significant fall in the price ofgas over the coming year is not anticipated, whilst pulp isexpected to continue on an upward trend over this period. In thepast year Speciality Papers has successfully developed andimplemented plans that have lead to improved productivity andreduced wastage. Our efforts to increase efficiency will continue,along with our drive to increase sales of higher margin products.
The recovery of Converting’s fortunes following thecommissioning of the re-furbished laminating line is gratifying.We believe that the full year impact of this investment will beevident in this new financial year.
It is clear from The Paper Mill Shop’s detailed research that thepapercraft market continues to grow and provide opportunities.The research gives the Board confidence that this subsidiary canbe developed into a substantially bigger retail business and thatits profitability can be restored over the next three years.
Cash management continues to be under firm control.Investment over the next two years will be prioritised on businessdevelopment and projects to minimise energy costs and improveoperating efficiencies.
We look forward to restoring our progressive dividend policy aswe continue to make further progress with the business.
James Cropper
Chairman

Financial ReviewJames Cropper PLC
International Financial ReportingStandards (“IFRS”)From accounting periods starting after 31 December 2004 all EU listed groups arerequired to prepare their statutory accountsin compliance with IFRS. IFRS hasintroduced changed Profit and LossAccount and Balance Sheet formats andnew accounting policies. Although anumber of the Group’s accounting policieshave changed, the only area where therehas been a significant change to the Profitand Loss Account and the Balance Sheetis the treatment of our final salary pensionschemes in accordance with IAS 19. Thetable opposite distinguishes between theGroup’s trading activities and the elementsrelating to the performance of the Group’stwo final salary schemes in accordancewith IAS 19.
The Group’s principal accounting policiesare noted in the Statutory Accounts sectionof the Annual Report.Overall performance• “On-going” trading operating profit was
£3,071,000 compared to £833,000 in theprevious year.
• Net trading interest charges for the yearwere £438,000 against £511,000previously.
• Trading profit before tax was £2,538,000compared to £349,000 in 2006.
• The net adverse IFRS pensionadjustment was £431,000 compared to anet adverse adjustment in the previousyear of £478,000.
• The Group recorded an overall profitbefore tax of £2,107,000 for the year.This compares with a loss before tax of£129,000 for the previous year.
• A tax charge of £746,000 arose withrespect to the year. This comprised acurrent tax charge of £641,000 and adeferred tax charge of £105,000.
• The Profit after Tax was thereforereduced to £1,361,000 compared to aLoss after Tax of £102,000 in theprevious year.
• Basic and diluted earnings per sharewere 16.2 pence for the year comparedto a loss of 1.2 pence in 2006.
• Shareholders’ funds at the year-end were£22,653,000, with net debt of£5,294,000, resulting in a gearing ratio of 23%.
• On 24 May 2007 a statement was madeto the market stating that, whilst auditclearance had not yet been received,barring unforeseen circumstances thegroup profit before tax for the year to 31 March 2007 would be not less than£1,900,000. As the audit had not beencompleted this was a cautious statementand the final audited accounts show agroup profit before tax of £2,107,000.
2007 2006 Change Change£'000 £'000 £'000s %
Trading Profit and Loss AccountTurnoverSpeciality Papers 45,967 43,839 2,128 5The Paper Mill Shop 6,038 6,159 (121) (2)Converting 11,157 10,887 270 2Technical Fibre Products 9,003 6,700 2,303 34
72,165 67,585 4,580 7Less inter-segmental sales (3,080) (3,384) 304 (9)
69,085 64,201 4,884 8ExpensesRaw materials and consumables used (30,425) (27,720) (2,705) 10Energy costs (2,833) (4,139) 1,306 (32)Employee benefit costs * (16,659) (16,542) (117) 1Depreciation and amortisation (3,315) (3,715) 400 (11)Other expenses (12,890) (11,709) (1,181) 10Other income and changes in inventory 108 457 (349) (76)
(66,014) (63,368) (2,646) 4
"On-going" trading operating profit * 3,071 833 2,238 269(* Before net pension adjustments)
Profit and Loss SummaryTrading activitiesSpeciality Papers 1,435 (247) 1,682The Paper Mill Shop (358) 241 (599)Converting 460 62 398Technical Fibre Products 2,053 777 1,276Other Group expenses (86) (86)
3,504 833 2,671Director and employee bonuses (433) (433)"On-going" trading operating profit 3,071 833 2,238Profit on sale of trade investment 116 (116)Trading operating profit 3,071 949 2,122Joint Venture (95) (89) (6)Trading profit before interest 2,976 860 2,116Net interest (438) (511) 73
Trading profit before tax 2,538 349 2,189(After future service pension contributions paid)Net pension adjustmentsGroup operating profit (610) (364) (246)Net interest 179 (114) 293
Net pension adjustment before tax (431) (478) 47
Overall Group after pension adjustmentsProfit before interest 2,366 496 1,870Net interest (259) (625) 366
Profit/(Loss) before tax 2,107 (129) 2,236
Balance Sheet SummaryNon-pension Assets - excl. Cash 45,758 46,668 (910)Non-pension Liabilities - excl. Borrowings (13,505) (11,993) (1,512)
32,253 34,675 (2,422)Net pension liabilities (4,306) (7,221) 2,915
27,947 27,454 493Net Borrowings (5,294) (8,595) 3,301Equity shareholders' funds 22,653 18,859 3,794
Gearing % 23 46
8 Financial Review

Balance SheetShareholders’ Funds increased by £3,794,000 from £18,859,000at the previous year-end to £22,653,000 as at 31st March 2007as a consequence of the profit for the year of £1,361,000,actuarial gains (net of deferred tax) of £2,629,000 and proceedsof share issues of £147,000, offset by dividends paid during theyear of £343,000.
Capital expenditure was £2,756,000, with the major investmentbeing devoted to effluent treatment and energy saving projects.
Net current assets increased by £1,630,000 over the year from£12,994,000 to £14,624,000, with working capital (stocks,debtors, net of creditors) decreasing by £208,000 and net cashincreasing by £1,838,000. Working capital movements includeda £99,000 increase in stocks and a £1,063,000 increase in tradeand other debtors, offset by a £817,000 increase in trade andother creditors.
Over the year bank loans falling due after more than a year fellby £1,463,000 from £8,113,000 to £6,650,000.
Financial Review
Financial Review 9
Trading Profit and Loss AccountGroup turnover was £69,085,000 compared to £64,201,000 lastyear, up 8%. Overall Group raw material and consumable costs,excluding energy, were £30,425,000 up 10% on last year. Thecost of energy consumption fell over the previous year by£1,306,000 to £2,833,000, down 32%.
As a result of reduced energy costs, increased turnover andimproved efficiencies the profitability of James CropperSpeciality Papers increased from a trading loss of £247,000 to aprofit of £1,435,000. Sales increased by 5% with volume up by3%. Although price increases were achieved, the competitivenature of both UK and export markets limited the full recovery ofthe dramatic cost increases experienced in previous years.
Although the C= was relatively stable against £Sterling throughoutthe year, the US$ fell significantly against both currencies. Thisaffected the relative prices of Northern Bleached Softwood Kraft(“NBSK”) pulp, the market benchmark priced in US$s andhardwoods priced in C=. NBSK opened the financial year atUS$630 per tonne and increased progressively to US$760 pertonne at the end of the financial year, up 21%. The cost of C=priced hardwoods fluctuated by a much smaller degree duringthe course of the year. Currency and pulp trends are shown inthe following graphs.
The depressed level of consumer spending across most of theretail sector continued to affect The Paper Mill Shop. Turnoverwas £6,038,000, down 2% on the previous year, whilst theoperating profit of £241,000 was reduced to a loss of £358,000.
The profitability of Converting and Technical Fibre Products(“TFP”) were adversely affected by the 11% weakening of theUS$ during the period.
Converting’s turnover increased by 2% to £11,157,000.Operating profit was £460,000 compared to £62,000 in theprevious year (which was after a deduction of £250,000 relatingto accelerated depreciation). Comparable profit was up 47%.The incremental improvement in profitability primarily derivedfrom the substantial refurbishment of an existing laminating line,which has delivered a significant increase in capability, outputand productivity.
The operating profit of TFP was £2,053,000 against £777,000,with turnover up 34% on the previous year at £9,003,000. Salesinto the US market grew by 48% in £Sterling terms and by 61%in US$ terms. At the average exchange rate for the year, sales tothe US market represented approximately 48% of TFP’s turnoverin £Sterling terms.
Electro Fiber Technologies Inc, the joint venture company basedin the USA in which TFP has a 50% share, incurred a loss, theGroup’s share of which was £95,000. This was slightly up on theprevious year.
Prior to net IFRS pension adjustments employment costsincreased by 1% to £16,659,000 compared to £16,542,000 in theprevious year. The average number of people employed fellfrom 613 to 605 over the year. For greater analysis see Table F.
Other external charges increased from £11,709,000 to£12,890,000, up £1,181,000. Increases were associated with theimpact of foreign currency exchange rate changes on BalanceSheet items, retailing activity, effluent treatment charges,operating leases, consultancy and the cost of regulatorycompliance.
Depreciation and amortisation totalled £3,315,000 compared to£3,715,000 in 2006. The 2006 charge included £250,000 relatingto accelerated depreciation attributable to equipment due to bedecommissioned later in 2006.
2003/04 actual 2004/05 actual 2005/06 actual 2006/07 actual90
80
70
60
50
40
30
20
10
0Apr May Jun Jul Aug Sep Oct Nov Dec Jan Feb Mar
Gas Cost (pence per therm)
160
150
140
130
120
110
100
90
80
Apr 01 Oct 01 Apr 02 Oct 02 Apr 03 Oct 03 Apr 04 Oct 04 Apr 05 Oct 05 Apr 06 Oct 06 Apr 07
$/£ C=/£ $/ C=
Currency Index
130
120
110
100
90
80
70
60
Apr 01 Oct 01 Apr 02 Oct 02 Apr 03 Oct 03 Apr 04 Oct 04 Apr 05 Oct 05 Apr 06 Oct 06 Apr 07
Softwoods $/tonne £/tonne Hardwoods C=/tonne £/tonne
Pulp Index in Denominated Currencies

Financial Review (continued)
James Cropper PLC
Cash FlowSummarised cash flow is shown in Table A.
Net cash inflow from operating activities inthe year was after deducting past servicepension deficit payments of £838,000.
Net cash outflow from investing activities inthe year includes capital expendituretotaling £2,756,000 offset by £1,691,000received from the sale and subsequentlease back of assets.
Total cash and borrowing changes over theyear and facilities available are shown inTable B.
Foreign CurrencyThe majority of exports into continentalEurope are invoiced in C=s. C=s are used topurchase C= priced pulp and other rawmaterials sourced from Europe in C=s.Similarly, export sales outside Europe areinvoiced in US$ and the receipts fund thepurchase of US$ priced pulp. These stepsreduce exposure to foreign currency ratefluctuations. The situation is monitored toensure that whenever possible currencyreceipts and payments are matched. Table C illustrates the Group’s currencymanagement process in practice,comparing the opening and closingexchange rates for the financial year.
Converting and TFP generated surplusUS$s during the year, which, as aconsequence of the weakened US$ had adetrimental impact on divisional profitability.Speciality Papers absorbed a proportion ofthese US$ funds. The C= deficit principallyarose in Speciality Papers. Potentialforeign currency surpluses or deficits aredealt with by a combination of foreigncurrency forward selling and forwardpurchasing contracts.
10 Financial Review
Table A 2007 2006 Change£'000 £'000 £'000s
Net cash inflow from operating activities 4,656 3,086 1,570Net cash outflow from investing activities (1,152) (2,645) 1,493
3,504 441 3,063
Net cash flow from financing activities (1,536) 1,375 (2,911)
Net increase in cash and cash equivalents 1,968 1,816 152
Opening cash and cash equivalents 1,762 (54) 1,816
Closing cash and cash equivalents 3,730 1,762 1,968
Closing cash and cash equivalents comprises:
Cash at bank and in hand 3,730 1,762 1,968
Table B 2007 2006 ChangeNet debt £'000 £'000 £'000sCash and cash equivalents 3,730 1,762 1,968
Borrowings: repayable within one year (2,374) (2,244) (130)
Net cash 1,356 (482) 1,838
Borrowings: non-current (6,650) (8,113) 1,463
Net debt (5,294) (8,595) 3,301FacilitiesBorrowings: repayable within one year 2,374 2,244 130
Borrowings: non-current 6,650 8,113 (1,463)
Facilities drawn down 9,024 10,357 (1,333)
Undrawn facilities 3,455 3,484 (29)
Facilities 12,479 13,841 (1,362)Funds availableCash and cash equivalents 3,730 1,762 1,968
Undrawn facilities 3,455 3,484 (29)
Funds available at year end 7,185 5,246 1,939Borrowings: repayable within one year (2,374) (2,244) (130)
Funds available in excess of one year 4,811 3,002 1,809
Table C US$ C= Opening rate April 2006 v. £ 1.73 1.43
Closing rate March 2007 v. £ 1.92 1.47
Exchange rate movement % (11) (2)
Strengthened/(Weakened) v. £
Currency transactions in year
Sales receipts '000 17,708 14,327
Purchase payments 000 (16,459) (17,649)
Surplus/(deficit) '000 1,249 (3,322)
£ @ Opening rate £'000 723 (2,319)
£ @ Closing rate £'000 649 (2,267)
(Loss)/gain £'000 (74) 52
Financial Review
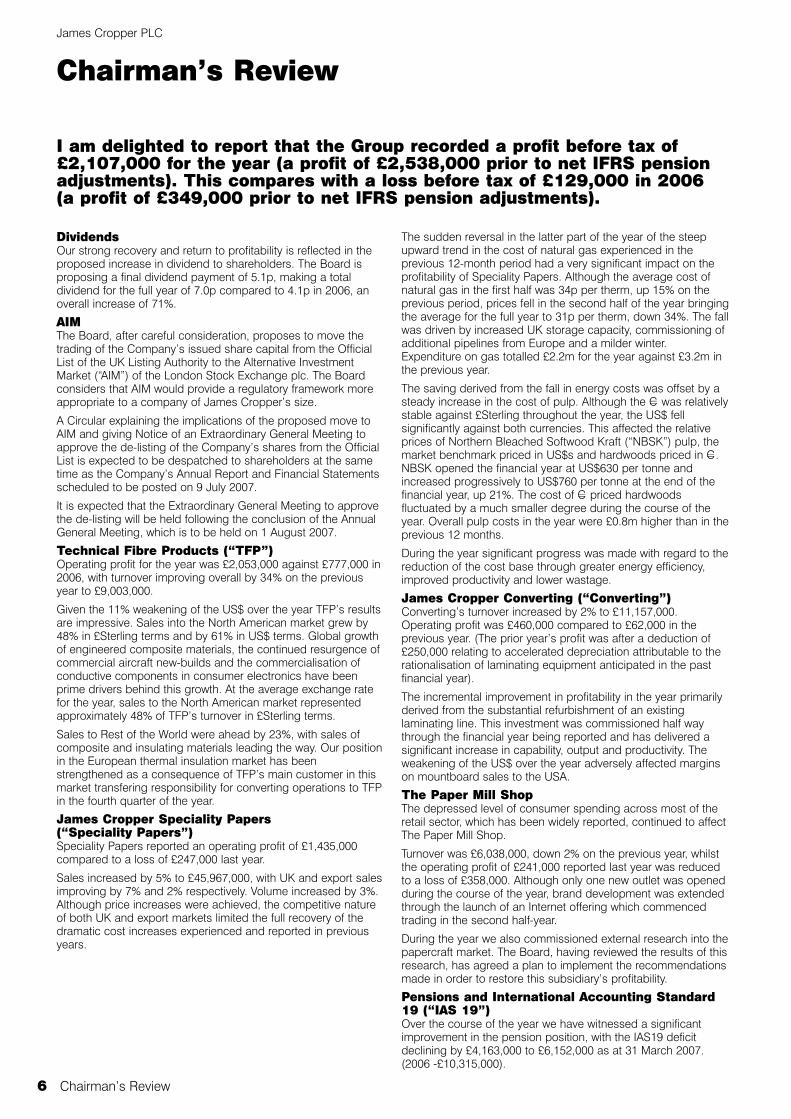
PensionsThe Group operates two funded pensionschemes providing defined benefits for themajority of its full time employees includingExecutive Directors. The latest actuarial“on-going” valuations of the JamesCropper PLC Pension Scheme (the “StaffScheme”) and the James Cropper PLCWorks Pension Plan (the “Works Scheme”)were conducted using the projected unitmethod as at 1 April 2005. The results ofthe valuations are shown in Table D.
These results show a significantimprovement in funding over the previousvaluations in April 2003. The mainunderlying factors leading to theimprovement in funding are:
• An injection of £800,000 into eachscheme during the course of 2004 and
• An increase in stock market values overthe intervening period, offset by morepessimistic assumptions relating to:
- Longevity
- Low yields
- Low interest rates and
- Low inflation
It is the intention of the Board to eliminatethe deficits over a period of ten years.During the past financial year furtherinjections of £420,000 and £418,000 weremade to the Staff Scheme and WorksScheme respectively.
Membership of Staff and Works Schemeshas been closed to new members for anumber of years in order to contain theGroup’s exposure to rising pension costs.Since 2001 all new employees have beenable to join a defined contribution GroupPersonal Pension Plan. The Groupexposure to employee’s GPP plans islimited to a fixed percentage ofcontractual pay.
IAS 19IAS 19 requires that actuaries calculate theassets and liabilities of companies’pension schemes based on values andinterest rates at their annual balance sheetdate. Surpluses or deficits revealed bythese valuations are included on thesponsoring company’s balance sheets,either directly against Reserves or via theProfit and Loss Account. Under IAS 19pension scheme liabilities are measuredon an actuarial basis using the projectedunit method. (This is the same method asused for the “on-going” valuation of theGroup’s schemes). Pension liabilities arediscounted at the current rate of return onan AA rated quality corporate bond ofequivalent currency and term. The pensionscheme assets are measured at fair valueat the Balance Sheet date. The net ofthese two figures gives the schemesurplus or deficit. As market values of thescheme assets and the discount factorsapplied to the scheme liabilities willfluctuate, this method of valuation willoften lead to large variations in the“pension balance” year on year. An “on-going” valuation takes account of theprojected growth in the pension schemes’assets by asset type over the projectedlife of the scheme.
The assumptions used by the Actuariesfor their IAS 19 valuations are likely to bevery different from those that they usedwith regard to their “on-going” valuations.
IAS 19 regards a sponsoring companyand its pension schemes as a singleaccounting entity rather than two or moreseparate legal entities. The actuarialvaluation is the starting point for thecreation of the IAS 19 accounting entity.
The valuation determines the net positionof a pension scheme, i.e. the differencebetween its assets and liabilities. On theintroduction of IAS 19 the net position,surplus or deficit, is brought onto thesponsoring company’s Balance Sheetsuch that Reserves are immediatelyadjusted by the net position reduced bydeferred tax. This obviously results ineither an increase or decrease in the netasset value of the sponsoring company.Upon valuation at subsequent year-endsthe movement in value from the previousvaluation is expressed in the followingcomponent parts:
Profit and Loss Account Operating costs
• Current service charge, being the costof benefits earned in the current periodshown net of employees’ contributions.
• Past service costs, being the costs ofbenefit improvements.
• Curtailment and settlement costs.
Finance costs, being the net of
• Expected return on pension schemeassets.
• Interest cost on the accrued pensionscheme liabilities.
Financial Review 11
Table D Assets Liabilities Deficit FundingLevel
£'000 £'000 £'000 %"On-going" valuation as at April 2005Staff Scheme 20,341 (23,533) (3,192) 86
Works Scheme 22,072 (25,747) (3,675) 86
Combined deficit (6,867)
"On-going" valuation as at April 2003Staff Scheme 15,866 (20,238) (4,372) 78
Works Scheme 15,012 (19,664) (4,652) 76
Combined deficit (9,024)
ChangeStaff Scheme 4,475 (3,295) 1,180
Works Scheme 7,060 (6,083) 977
Combined deficit 2,157

Financial Review (continued)
James Cropper PLC
Statement of Total RecognisedGains and Losses• Actuarial gains and losses arising from
variances against previous actuarialassumptions.
The above items are offset in the year-to-year movement by actual contributionspaid by the employer in the period. Table E shows the results of the IAS 19valuations.
Actual future service pension contributionspaid in the period by the Group to its twofinal salary schemes in accordance withthe actuaries’ recommendations, resultingfrom their latest “on-going” valuations,were £988,000. Under IAS 19 the chargeagainst profit in the year was £1,419,000,which was £431,000 in excess of thefuture service contributions that wereactually required.
It should be noted that the combined IAS19 deficit as at 1 April 2005 of£10,707,000 compares with the combined“on-going” deficit of £6,867,000 as at thesame date shown in table D.
Table F analyses employment costscharged against Operating Profit.
Table E Staff Works Total Total2007 2007 2007 2006
IAS19 DEFICIT £'000 £'000 £'000 £'000Current Service Charge (654) (944) (1,598) (1,392)
Finance income/(costs) 149 30 179 (114)
Future service contributions paid 488 500 988 1,028
Net impact on Profit and (17) (414) (431) (478)Loss AccountPast service deficit contributions paid 420 418 838 914
Actuarial gains or losses 1,833 1,923 3,756 (44)
Opening deficit (3,519) (6,796) (10,315) (10,707)
Closing deficit (1,283) (4,869) (6,152) (10,315)Deferred Taxation @ 30% 385 1,461 1,846 3,095
Net - Deficit (898) (3,408) (4,306) (7,220)
Table FTotal adjusted employment costs 2007 2006 Change
£'000 £'000 £'000sWages and salaries 13,989 14,292 (303)
Director and employee bonuses 433 433
Social security costs 1,244 1,245 (1)
Future service pension contributions paid 988 1,028 (40)
Other pension costs 292 290 2
Total employment costs 16,946 16,855 91
Own labour capitalised (287) (313) 26
Chargeable against Trading Operating Profit 16,659 16,542 117
Wages and salaries 13,989 14,292 (303)
Director and employee bonuses 433 433
Social security costs 1,244 1,245 (1)
Current service pension charge (IAS 19) 1,598 1,392 206
Other pension costs 292 290 2
Total employment costs 17,556 17,219 337
Own labour capitalised (287) (313) 26
Chargeable against Group Operating Profit 17,269 16,906 363
Difference being:
Net IAS 19 pension adjustment againstoperating profit 610 364 246
Average monthly number of employees 605 613 (8)
12 Financial Review

Speciality PapersWhile the well-documented reversal in the cost of gas grabbed theheadlines, the real success for Speciality Papers lay in the contributionmade by business development plans and operating efficiencyimprovements deployed over the course of recent years. Despite the competitive nature of both UK and export markets, thefinancial year saw Speciality Papers make encouraging progress indelivering profitable and sustainable growth, with sales value increasing by5% to £45,967,000 and volume by 3% to 41,282 tonnes.
UK sales led the way with strong performances from book andfile covering materials, filing grades and industrials, while exportmarkets, despite the continuing impact of the weakening US$,gained significant new business in a number of packaging andgraphical applications. Although price increases were achieved,the competitive nature of both UK and export markets limited thefull recovery of the dramatic cost increases experienced inprevious years.
Within operations, the focus as always was on the efficienciesand effectiveness of equipment and key processes in support ofcustomers’ requirements. It is pleasing to record that despite theincreasingly complexity and technically demanding nature of theproduct range, improvements in productivity, quality and energyefficiencies all made significant contributions to returning thebusiness to profitability after last year’s disappointing result.
After two years of dramatic gas price increases, culminating inthe unprecedented levels experienced over the winter of2005/06, the dire predictions for the cost of gas during the lastwinter did not materialise, with the profile of gas prices for thesecond half of the year more in line with historical levels. Pulpprice increases, on the other hand, did continue to increase overthe course of the year broadly in line with expectations and asthe single largest purchased raw material, served to erode someof the cost relief seen with energy.
Subsidiary investment over the course of the year included anumber of successful energy projects, ranging from energyefficient pumps and motors to the successful commissioning ofa waste heat recovery unit for the combined heat and powerplant. Improvement team activities and targeted investment ontwo of our paper machines delivered valuable additional capacityand improved quality, while the Finishing Department benefittedfrom the final commissioning of the investment in automating thepacking line.
While the challenges to the industry over recent years have seenan acceleration in consolidation and closures of many millsacross all sectors in Europe and the USA, the old adage “getbig, get niche or get out” is more relevant now than ever beforefor the paper industry in general. Fortunately, Speciality Papers isboth clear and focused in terms of its strategy. The continueddevelopment of its process and people capabilities is wellplaced to service its targeted niche markets with its bespokeapproach to small batch manufacturing of technicallydemanding, coloured paper and boards.
Business Review
2007 2006 Change Change£'000 £'000 £'000 %
Turnover 45,967 43,839 2,128 5Operating profit/(loss) 1,435 (247) 1,682
13

Business Review
The Paper Mill ShopIt proved to be an extremely difficult year for The Paper Mill Shop(“TPMS”) with a disappointing sales level and a significant operating lossin the year. Although consumer confidence and the general retail climateimproved from the previous year, we were unable to take advantage of thisin our chain of shops. Sales were 2% lower than in the previous year butthis relatively small fall was only possible because we benefited from fullyear sales at the five stores opened during the course of the previous year.
James Cropper PLC
Last year’s Annual Report referred to the growth in retailcompetition in the papercraft market; this has continued togather pace during the year with some very significant growthamongst both large specialist craft chains and supermarkets.In this more hostile trading environment some of theweaknesses of our offer have been exposed; what wasacceptable to consumers in the early years of our retailinitiative has become less acceptable to today’s moresophisticated crafting customer.
During the final quarter of the financial year we commissioneddetailed market research into the papercraft market, the needsof the different types of customer and the fit between theseand the current TPMS offer. This research included focusgroups of our current customers as well as crafters who do notbuy from us. The results have given us a fascinating insightinto the market’s perception of who we are and what we do.
The Board reviewed the results of this research and hasagreed an Action Plan to implement the many improvementsthat need to be made in order to restore the subsidiary’sprofitability. This includes a strengthening of TPMS’smanagement team, which we can now see has been under-resourced over the last couple of years.
It is clear that this is still a growing and interesting market andthe Board is confident that TPMS can develop into asubstantially bigger business and that profitability will berestored over the next three years. As well as pointing out ourweaknesses, the market research also highlighted some verypositive aspects of our business and these give us theplatform on which we will be able to build.
We launched our transactional website in November 2006; thiswas intentionally a low-key start as we learned more about thisroute to market and the behaviour of the web customer. Wehave been able to replicate aspects of our pick and mix paperand card offer on the site and consumer feedback has beenencouraging. As with the stores, much needs to be done toleverage the potential of this route to market.
2007 2006 Change Change£'000 £'000 £'000 %
Turnover 6,038 6,159 (121) (2)Operating (loss)/profit (358) 241 (599)
14 Business Review

Business ReviewJames Cropper PLC
The UK trading environment over the whole year was slightlymore favourable than the prior year as there was someunderlying growth in retail sales and the housing marketremained relatively buoyant. Demand for displayboardproducts is very much tied to the health of the retail sector,however there were technical changes in the market during thecourse of the year. A number of large UK printers installedlarge format litho machines as an alternative to traditionalscreen-printing machines. This created a demand for lowerthickness products, which have to be suitable for the lithoprinting process.
As a consequence Converting was able to meet this demandand secure additional business. There was also a trend forsome retailers to use our fully recyclable displayboardproducts in place of plastic alternatives. These developmentsare welcomed given that the displayboard market is generallyaccepted to be mature.
Converting remains the world’s only picture mountboardproducer vertically integrated with a paper mill capable ofsupplying all the elements of the product. UK demand forpicture mountboard continued to be competitive, particularly atthe lower value, price lead end of the market. However, byworking closely with Arqadia, our long established distributor,we managed to maintain sales and even modestly increasesales of higher value added products during the year. The US$weakened by 11% over the year impacting adversely onmargins on sales of picture mountboard to the USA. AsConverting has little expenditure denominated in US$ againstwhich to offset its US$ revenues, this impact was felt on thebottom line. Currency concerns apart, the weakness of theUSA housing market created a subdued market for framed art.However USA sales held up reasonably well over the course ofthe year.
Sales of digital printing products to small businesses and theprofessional via our website, www.papermilldirect.com, thoughrelatively modest, continued to grow. Ironically one spin offfrom this activity has resulted in major OEMs, such as Fuji andEpson, placing orders on Converting to manufacturer ownbrand products.
During the year a specialist film laminator was installed. Thishas generated considerable interest from existing and potentialcustomers. A number of products are at the final developmentstage, with commercial sales anticipated in the coming year.
ConvertingThe improvement in Converting’s profitability primarily derived from asubstantial refurbishment of Laminator 1. This has delivered a significantincrease in capability, output and productivity. As this investment was notcommissioned until half way through the financial year the full benefits willonly be evident in the coming year. It had been planned to mothball thesecond line, Laminator 2, but an increase in sales of lower caliper point ofsales displayboard reversed this decision.
2007 2006 Change Change£'000 £'000 £'000 %
Turnover 11,157 10,887 270 2Operating profit 460 62 398
15
16 Business Review
Business Review
Technical Fibre ProductsThe Company’s 20th year of trading marked a significant growth in itsearnings as its latent potential began to be realised. This has beenachieved through our resolve to patiently service technically drivenapplications and markets over many years in the knowledge thatcommercialisation would bring its rewards.
Sales for the year, at just over £9 million, represents a 34%increase on the previous year. The USA market again deliveredthe highest annual growth rate at 61% in US$ terms andaccounted for 48% of total £Sterling revenues. A 29% growth inEuropean markets was also delivered. However a 15% declinewas experienced in our much smaller and cyclical Asianmarket. Return on sales and return on investment more thandoubled, at 22% and 35%, respectively.
The majority of sales growth in the USA has been derived fromthe continued expansion of global aerospace and fireprotection markets, combined with commercial consolidationof our conductive materials in consumer electronic devices. Weremain confident that expansion of these markets will continueat a reasonable pace in the near term alongside existing andnew opportunities in composite material fabrications.
Growth in European sales of composite and insulatingmaterials has also been significant. Our position in theEuropean thermal insulation market has been strengthened asa consequence of TFP’s main customer in this markettransfering responsibility for converting operations to TFP in thefourth quarter.
In order to effectively service this business a dedicated satelliteoperation has been set up in Cheshire, where experiencedpersonnel and efficient distribution networks are available.
As the fuel cell market develops demand for our electrodesupport substrates continues. This trend is expected toexperience an upward move in the near term. This follows fromrenewed interest in phosphoric acid fuel cells, for stationaryapplications, and new materials developed for automotive PEMsystems. The latter resulting from our participation in acollaborative research project sponsored by the Department ofTrade and Industry. A new collaborative two-year programmeto develop high temperature electrode systems has recentlycommenced with financial support again from the DTI.
The extent and varied nature of our commercially drivenproduct development pipeline, together with the commitmentand determination of our people to deliver strong, value addingpartnerships, provides confidence for the continued growthand success of TFP.
2007 2006 Change Change£'000 £'000 £'000 %
Turnover 9,003 6,700 2,303 34Operating profit 2,053 777 1,276

There were 12 Lost Time Accidents (“LTAs”) in the past financialyear compared to 17 in the previous year. The chart illustratesthe incidence of LTAs over the last six years. The 12-monthmoving average has fallen from 3.5 per month to 1 per monthover this period.
The generally accepted statistical safety theory, known as the“Safety Iceberg” or “Safety Triangle” theory, indicates that forevery lost time accident that happens, there are a relatively largenumber of near misses or dangerous occurrences (“DOs”).Using this theory, a variation of the Safety Triangle is used by theGroup to estimate how many DOs should be reported comparedto the number of LTA’s that actually arose. Using this basis it isassumed that for every 1 LTA there were 160 underlying DOs.Given that there were 12 LTAs in the past financial year,statistically 1,920 DOs should have arisen.
An organisation’s behaviour towards safety reflects itsunderlying values. Culture is shaped by management attitudeand actions. In a long established organisation such as JamesCropper PLC culture is deep rooted and is moulded by history.Inevitably this has a strong influence on current values andbehaviours. Culture takes a long time to change. Without adoubt changing the Safety Culture within an organisation is thehardest challenge of any safety strategy.
Health and Safety
The Group’s Safety Strategy embraces the need to create well-developedsafety management processes and a sound safety culture. The long-termaim of the Strategy is to achieve zero injuries. By adopting the principlethat all injuries are preventable, management are accepting that it is theirresponsibility to achieve this aim in the long term.
Health and Safety 17
An improvement in safety culture will follow improvements insafety hardware and systems driven by management. From theoutset the Safety Strategy Team recognised that the Strategywould progress from a “regulation led” phase through a “management led” phase to a “people led” phase.
These phases correspond to the categorisation of developmentof safety culture and improvement in performance identified bythe Health and Safety Executive. After five years of significantinvestment in guarding, processes, training, systems andpersonal protection the Group can be confident that it hasembarked upon the “management led” phase. In the“management led” phase culture will change once managementhas demonstrated that it is seriously committed to change bydelivering against positive actions that are perceived to makechanges for the better. The Safety Culture elements of the SafetyStrategy will therefore primarily focus on providing managementwith the competences and processes required to facilitatechange through their behaviour towards safety and theirrelationships with their people. The Safety Strategy Team firmlybelieves that a safer working environment is also a moreeffective, productive and cost efficient working environment.Therefore the creation of a safer working environment is offundamental importance to the Group’s key stakeholders,namely employees, shareholders, customers, suppliers, bankers,insurers and government agencies.
Total Lost Time AccidentsFor the last 6 years with a 12 month moving average
Feb 07Feb 06Feb 05Feb 04Feb 03Feb 02Apr 01
EnvironmentJames Cropper PLC
18 Environment
The aims of the Group’s Environment Strategy are primarily to:
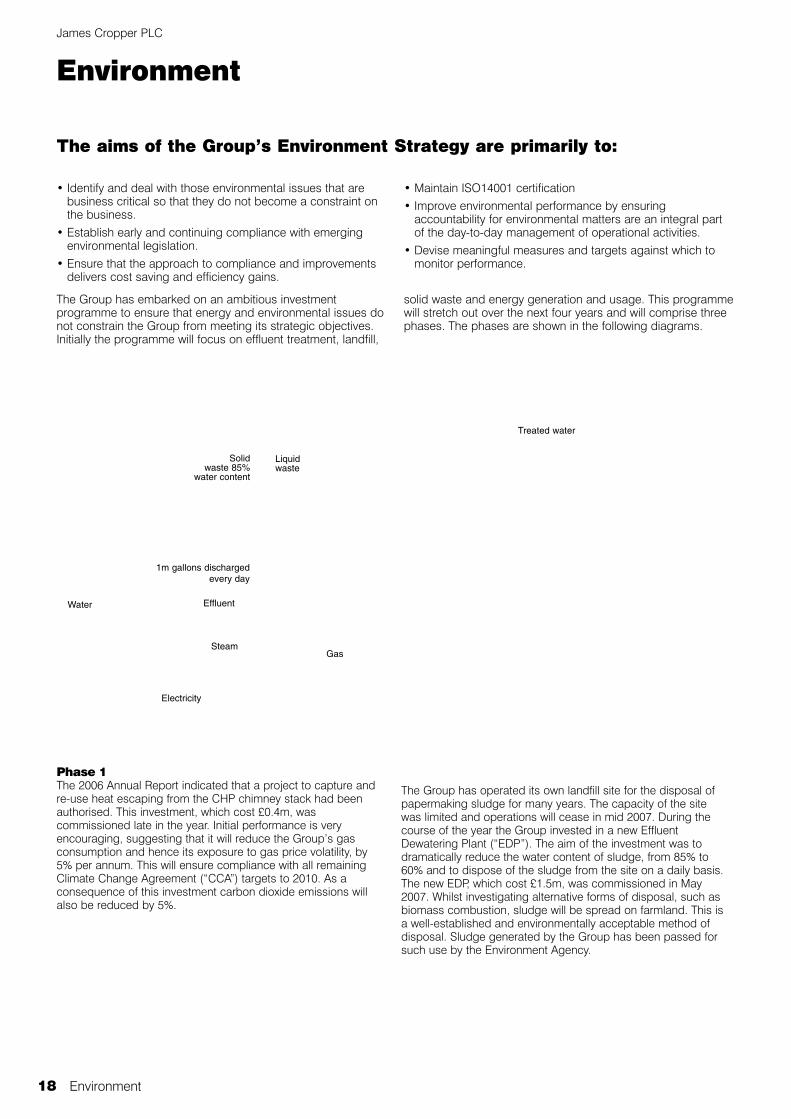
The Group has embarked on an ambitious investmentprogramme to ensure that energy and environmental issues donot constrain the Group from meeting its strategic objectives.Initially the programme will focus on effluent treatment, landfill,
solid waste and energy generation and usage. This programmewill stretch out over the next four years and will comprise threephases. The phases are shown in the following diagrams.
• Identify and deal with those environmental issues that arebusiness critical so that they do not become a constraint onthe business.
• Establish early and continuing compliance with emergingenvironmental legislation.
• Ensure that the approach to compliance and improvementsdelivers cost saving and efficiency gains.
• Maintain ISO14001 certification• Improve environmental performance by ensuring
accountability for environmental matters are an integral partof the day-to-day management of operational activities.
• Devise meaningful measures and targets against which tomonitor performance.
Solid waste 85%
water content
Liquid waste
Treated water
Steam
Effluent
1m gallons dischargedevery day
Water
Gas
Electricity
Phase 1The 2006 Annual Report indicated that a project to capture andre-use heat escaping from the CHP chimney stack had beenauthorised. This investment, which cost £0.4m, wascommissioned late in the year. Initial performance is veryencouraging, suggesting that it will reduce the Group’s gasconsumption and hence its exposure to gas price volatility, by5% per annum. This will ensure compliance with all remainingClimate Change Agreement (“CCA”) targets to 2010. As aconsequence of this investment carbon dioxide emissions willalso be reduced by 5%.
The Group has operated its own landfill site for the disposal ofpapermaking sludge for many years. The capacity of the sitewas limited and operations will cease in mid 2007. During thecourse of the year the Group invested in a new EffluentDewatering Plant (“EDP”). The aim of the investment was todramatically reduce the water content of sludge, from 85% to60% and to dispose of the sludge from the site on a daily basis.The new EDP, which cost £1.5m, was commissioned in May2007. Whilst investigating alternative forms of disposal, such asbiomass combustion, sludge will be spread on farmland. This isa well-established and environmentally acceptable method ofdisposal. Sludge generated by the Group has been passed forsuch use by the Environment Agency.

Environment
Environment 19
Phase 2During the year investigations were undertaken into thefeasibility of generating steam from biomass combustion.Energy derived from burning waste wood and paper,papermaking waste and forest timber is regarded as carbon-neutral. The investigation is also considering the feasibility ofincluding fuel derived from processed municipal domesticwaste as an energy source. Preliminary studies indicate thatsuch fuel material is dry, light and odourless. It would be mixedwith other biomass fuels. If feasible and cost effective, biomasscombustion would lead to a reduction in gas consumption ofup to 20%, mitigate the impact of the European Union EmissionTrading Scheme (“EUETS”) and minimise the disposal ofsludge by landspreading and of solid waste to landfill.
The biomass initiative is clearly in line with Government policiesto reduce the amount of waste buried in landfill sites and togenerate more energy from renewable sources. A conclusionon the viability of the biomass combustion is expected by theautumn of 2007. If the results of the feasibility study are positivethe proposal would need to be submitted for planningpermission. The Group would also consult with other interestedparties, including our neighbours, to provide assurance as tothe health and safety aspects of such an operation. It will beimportant to gain strong local support for the project if it movedbeyond the feasibility stage.
Solid waste water
content = 85%
Solid waste water
content = 60%
5% saving in gas consumption
Liquid waste
Treated water
Steam
Effluent
1m gallons dischargedevery day
Water
Gas
Electricity
Environment (continued)
James Cropper PLC
Phase 3In recent years the Group has been subjected to significantincreases in the cost of treating waste water effluent dischargedto sewer by its EDP. Five years ago the annual cost of treatmentwas £0.4m. By 2007 this had risen to £1.0m per annum. Double-digit increases are also forecast for the next five years. Theseincreases, which do not relate to the actual cost of treatment,have been granted by OfWat, the UK water regulator, to allowUnited Utilities PLC, the water utility company responsible forNorth West England to raise revenue to fund general investment.These increases have been imposed on users on a mandatorybasis. Given these circumstances a study will be undertakenduring the coming year into the feasibility of full on-site watertreatment that would allow direct discharge of treated water intothe River Kent thus avoiding the need for water to be treated byUnited Utilities PLC. Before such a project could go ahead itwould, of course involve gaining the agreement of theEnvironment Agency and English Nature, given the specialstatus of the river.
Climate Change RegulationsThe Group is a signatory to the paper sector Climate ChangeAgreement (“CCA”) negotiated with DEFRA by the Confederationof Paper Industries. Under the Agreement the Group receivespartial exemption from the Climate Change Levy on its naturalgas consumption, an 80% discount against the Levy attributableto imported electricity and exemption from Business Ratesotherwise chargeable on our CHP plant. In return, the Group iscommitted to a series of increasingly stringent energy usetargets that take effect over milestone target periods, every otheryear, for the 10-year term of the Agreement. To date the Grouphas now met all three of its CCA milestones targets for specificenergy use per tonne of saleable product.
EUETS, a mandatory scheme for greenhouse gas emissionallowance trading within the EU, was introduced in 2005. It is oneof the policies being introduced by the EU to tackle emissions ofcarbon dioxide and other greenhouse gases from a number ofspecific industrial activities. The Group’s power generationfacilities will be subject to this scheme as from 1 January 2008.In 2005/06 the Group emitted 44,000 tonnes of carbon dioxide.EUETS allows the Group to emit 41,000 tonnes of carbondioxide per annum. The waste heat recovery unit commissionedin 2006/07 will reduce emissions by 5.0% per annum. By the endof 2007/08 the Group will be EUETS neutral.
ForestryJames Cropper PLC continues its policy of purchasing only fromthose suppliers who demonstrate practical application ofenvironmentally sound management. Annual purchases aresome 40,000 tonnes of virgin wood pulp of the highestenvironmental pedigree. All of our suppliers commit to theconcept of sustainable forest management and comply fully withtheir local national standards and legislation. Formal statementsof suppliers’ environmental policies are received and assessedby the Group through visits and audits of our suppliers. All ofour suppliers have attained the International Standards ISO 9000and ISO 14001 relating to quality and environmentalmanagement procedures respectively. Increasing volumes ofwood supply to our pulp producers are subject to forestcertification procedures and chain of custody accreditation. Our pulp comes substantially from Sweden and Finland andrelationships with suppliers have been established andcontinued over many years.
20 Environment

This process separated out solid material, “sludge”, whilstliquids were pumped to United Utilities’ Kendal WastewaterTreatment Works for further treatment before being dischargedinto the River Kent. The primary settlement process yieldedapproximately 10,000 tonnes of “sludge” per annum, of whichthe water content was 85%. The operation necessitated thealternative use of two primary settlement lagoons, each beingemptied every 6 to 8 weeks once full. On removal from thelagoons “sludge” was deposited in the Group’s landfill site. Thecapacity of this site was limited.
To ensure compliance with ever more stringent environmentalregulations, whilst simultaneously maintaining efficient support togrowing manufacturing activities, it became clear that animproved effluent dewatering system had to be installed toreplace the historical settlement, desludging and landfillingdisposal methods. The aim of the project was to dramaticallyreduce the water content of “sludge” and for it to be disposedfrom site on a daily basis. Following investigations into availabletechnologies on site trials were conducted against projectedvolumes and content of effluents. The trials identified thatdissolved air flotation (DAF) was the most appropriate solution.
Our DAF plant was supplied by Nijhuis Water Treatment. Theplant has made it possible to separate solids from liquid effluenton a continuous basis. The installation of additional dewateringdevices has enabled water content of solid effluent to bedramatically reduced to 60% with the total tonnage reduced to3,750 tonnes per annum. This dewatered “cake” providesopportunities for alternative re-use / recycling or disposal optionsto be considered.
The installation of the DAF plant will now make it possible toexplore in more detail the available technologies to support thefuture strategy for complete on-site effluent treatment andpossible direct discharge to the River Kent, via a Phase 2 watercleaning process.
Key to images below
1 General storage building owned by James Cropper PLC
2 Demolition of existing structures
3 Site ground prepared for foundations
4 Concrete and steel create new bases
5 Steelwork erected
6 Base laid for circular tank
7 Delivery of equipment
8 Equipment being installed
9 Circular storage rises vertically section by section
10 Completed circular storage
11 Fitting of equipment
Effluent De-watering Plant 21
Effluent De-watering Plant
For many decades approximately 1 million gallons (4,545 cubic metres) ofpapermaking effluent were discharged each day into settlement lagoons onthe Group’s Burneside site. Within the lagoons the effluent underwentprimary settlement.
Risk Management
The management of risk is fundamental to sound business managementand underlying profit performance. Risk management transcends everyaspect of the organisation and its activities, affecting policies, employees,assets, customers, suppliers and the wider community.
James Cropper PLC
The Group manages risk by a combination of insurance and self-insurance. Self-insurance refers to actions taken internally or inconjunction with other third parties. In broad terms, high risks infinancial and operational areas are more dependent oninsurance than risks in commercial and personnel areas, whichbecause of their nature are more likely to be managed by self-insurance. In addition to the Audit Committee, which is amandatory requirement under the Combined Code, the Boardhas for some time established other Steering Groups with riskmanagement briefs. These include:
• Health & Safety
• Environment
• Insurance
• Human Resources
• Foreign Currency
• Purchasing
• Pensions
• Information Systems
The Board sets appropriate policies on internal control. It seeksregular assurance that processes are functioning effectively. Indetermining its policies with regard to internal control the Board’sconsideration includes the following factors:
• The extent and categories of risk which it regards asacceptable for the Group to bear;
• The likelihood of the risks concerned materialising;
• The nature and extent of the risks facing the Group;
• The Group’s ability to reduce the incidence and impact on thebusiness of risks that do materialise; and
• The costs of operating particular controls relative to the benefitthereby obtained in managing the related risks.
All employees have some responsibility for internal control aspart of their accountability for achieving objectives. They,collectively, have the necessary knowledge, skills, informationand authority to establish, operate and monitor the systems ofinternal control. This requires an understanding of the Group, itsobjectives, the industries and markets in which it operates, andthe risks it faces.
The Group does not have an internal audit department. Howevercross-functional teams regularly carry out Health & Safety andEnvironmental audits. We work with our external auditors andother specialist consultants to identify risks and weaknesses ininternal controls.
The Group’s operational quality processes and environmentaland safety management systems are accredited with ISO 9001,ISO 14001 and OHSAS 18001 respectively. Not only doescompliance with these standards form the basis of soundinternal control but also they are increasingly important insatisfying customers’ aspirations with regard to the managementof their supply chains. BSI audits our processes for continuingcompliance every six months. TFP is accredited with the Investorin People Award. This accreditation is subject to triennial audits.The next audit will take place in late 2008.
Sound internal control is primarily dependent on peopleunderstanding the key issues that relate to their area of activityand what they are expected to do in certain circumstances. Thisunderstanding stems from the Group’s Goal and its Values. TheGoal set the direction. Our Values influence our behaviours.Sound behaviours are critical to the development of successfulrelationships between people. The Group’s strategic aims areencompassed in a comprehensive financial planning andbudgeting process with performance monitored on monthlybasis. Through our performance management process theGroup’s strategic aims, plans and budgets are translated intoobjectives at all levels of the organisation. The performancemanagement process is seen as a key vehicle through whichindividual employee’s performance can be enhanced anddeveloped for the mutual benefit of the individual andorganisation as a whole. Training and development increasesemployees’ competencies and therefore enables them to dealwith risks more effectively. Clearly defined policies, processesand procedures (P, P & Ps) provide employees with guidance.There has been considerable effort in recent years to documentand revise our P, P & Ps across all areas of activity. These allowemployees to understand the relevant practices to be deployed.Our information systems are being extensively modernised toprovide faster communications and greater accuracy that willenable the organisation to become more efficient and effective.Throughout our organisation we are working strenuously toeliminate waste. All these initiatives will allow us to become moreresponsive to the needs of our customers and manage our riskexposure more effectively.
22 Risk Management
BS EN ISO 9001: 2000 FM 10048
BS EN ISO 14001: 2004 EMS 57536
OHSAS 18001: 1999 OHS 93474

Report of the Directors 23
Report of the Directors
The Directors have pleasure in submitting to the members their Annual Report and the audited accounts of the Group for the 52 weeksended 31 March 2007.The Annual General Meeting of the Groupwill be held at the Bryce Institute,Burneside on Wednesday, 1 August 2007at 10.30am.
Review of the BusinessThe Group’s principal activities comprisethe manufacture and retail of paper andpaper related products.
The Chairman’s Review includes a reviewof business activities during the year andcomments on future developments andprospects. Details of the Group’sactivities are included in the DivisionalReviews.
ResultsThe profit attributable to equity holders ofthe Company for the 52 weeks ended 31March 2007 is set out in the Profit andLoss Account. The dividends paid duringthe year, and the proposed final dividend,are set out in the Notes to the financialstatements.
Research and DevelopmentThe Group continues to invest in researchand development to ensure that the rangeand quality of products are continuallyupdated.
Corporate Governance(i) Directors’ ResponsibilitiesThe Board is accountable to the Group’sshareholders for corporate governanceand this section describes how therelevant principles of governance areapplied to the Group. Throughout theyear the Group has complied with theprovisions set out in the Combined Codeon Corporate Governance issued in July2003 by the Financial Reporting Council(“FRC”) except where stated below and inthe Directors’ Remuneration Report.
The Combined Code on CorporateGovernance issued in June 2006(Combined Code (2006)) contains only alimited number of modifications to theCombined Code (2003). The Listing Ruleswere amended in October 2006 for theCombined Code (2006) and this appliesto reporting periods beginning on or after1 November 2006.
The Group has also complied with theTurnbull Guidance.
(ii) The BoardThe Group Board considers that it is wellbalanced and operates in an effectivemanner and is collectively responsible forthe success of the Company. It comprisesfive Executive Directors and five Non-Executive Directors.
Despite three directors not beingindependent under the Combined Code,the Board deems all the non-executivedirectors to be independent even thoughJames Cropper and Mark Cropper haveclose family ties and John Sclater andPeter Herring have each served on theBoard for more than nine years. Theydisplay independence of character andjudgment and provide unequivocalcounsel and advice to the Board.
James Cropper is the Chairman of theCompany and is responsible for therunning of the Board. Alun Lewis is theChief Executive and is responsible for therunning of the Company’s business.Peter Herring is the senior independentNon-Executive Director.
The Group Board meets eight times peryear, each meeting scheduled over twodays, with prepared agendas fordiscussion and formal schedules of itemsto be approved covering structure andstrategy, management, financial reportingand controls, board membership andcommittees, and corporate governance.There is a schedule of matters reservedfor the Board’s decision.
The Executive Committee, under thechairmanship of Alun Lewis, met seventimes during the year with preparedagendas for discussion.
All Directors have access to the adviceand services of the Company Secretary.The Board has also established a formalprocedure whereby Directors, wishing todo so in the furtherance of their duties,may take independent professionaladvice, if necessary, at the Company’sexpense. All Directors are aware of theirresponsibility to regularly update theirskills and knowledge.
(iii) Board CommitteesThere are four sub-committees reportingto the Group Board:• Executive Committee• Remuneration Committee• Audit Committee• Nomination Committee
The Executive Committee comprises theexecutive directors and its terms ofreference include the development andimplementation of strategies, operationalplans, and the assessment and control ofrisk. Alun Lewis, the Company’s ChiefExecutive, is Chairman of the Committee.
The Audit Committee, the RemunerationCommittee, and the NominationCommittee comprise the non-executivedirectors of the Company. David Wilks isChairman of the Audit Committee, PeterHerring is Chairman of the RemunerationCommittee, and James Cropper isChairman of the Nomination Committee.These committees do not consist solely ofdirectors deemed independent under theCombined Code.
The Board is satisfied that the AuditCommittee has at least two members whohave relevant financial experience.
Each of the Committees held meetingsduring the year and their terms ofreference are displayed on theCompany’s website.
The following table sets out attendance ofthe Directors at the Board and Committeemeetings during the financial year.
In the few instances when a Director hasnot been able to attend a Board orCommittee meeting due to othercommitments his comments on thepapers to be considered have beencommunicated in advance to the relevantchairman.
Group Board Executive Audit Remuneration NominationsMeetings Committee Committee Committee Committee
Meetings (Executive Directors attend by invitation)
(8 in the year) (7 in the year) (2 in the year) (3 in the year) (2 in the year)
ChairmanJ A Cropper 8 2 3 2Executive DirectorsA I Lewis (Chief Executive) 8 6 1 3 2J M Denman 8 7 1G T Quayle 8 6N A Read 8 7P J Willink 8 7Non Executive DirectorsP L Herring 8 2 3 2J R Sclater 8 2 3 2D R Wilks 8 2 3 2M A J Cropper 4(appointed 25.10.06)
24 Report of the Directors
Report of the Directors (continued)
James Cropper PLC
(iv) Re-electionThe Directors are subject to retirement byrotation and re-election by theshareholders in accordance with theArticles of Association whereby one thirdof the Directors retire by rotation eachyear. George Quayle and David Wilksretire by rotation in accordance with theArticles of Association and, being eligible,offer themselves up for re-election.
Mark Cropper was appointed a Directoron 25 October 2006, and in accordancewith the Articles of Association will retire atthe Annual Meeting but is offering himselffor re-election.
The Combined Code provides that anyDirector who has served more than nineyears as a non-executive director shouldretire and be re-appointed annually. PeterHerring and John Sclater have servedmore than nine years and accordingly areretiring from the Board of Directors at theAnnual General Meeting but are offeringthemselves for re-election.
Resolutions 3 to 7 at the Annual GeneralMeeting deal with the proposed re-elections of directors.
(v) Performance EvaluationThe Board undertakes a board evaluationon an annual basis, including the sub-committees of the Board whereappropriate.
The performance evaluation processincludes the Chairman reviewing andmonitoring the Chief Executive’sperformance on an annual basis and theChief Executive reviewing and monitoringthe Executive Directors. The high levelindividual objectives agreed at the reviewsare communicated to the RemunerationCommittee.
The Chairman reviews the non-executivedirectors’ performance annually on anindividual basis.
The Chairman’s performance is appraisedby the senior independent director andthe other non-executive directors withoutthe Chairman being present, and thecomments fed back to him for discussion.
(vi) Financial Policies and InternalControlsThe Board is committed to presenting afull, balanced and understandableassessment of the Company’s positionand prospects, both in the Annual Reportand at other times as appropriatethroughout the year.
The Directors are responsible forpreparing the Annual Report, theDirectors’ Remuneration Report and thefinancial statements in accordance withapplicable law and International FinancialReporting Standards (IFRSs) as adoptedby the European Union.
The Directors are responsible forpreparing financial statements for eachfinancial year which give a true and fairview, in accordance with IFRSs asadopted by the European Union, of thestate of affairs of the company and thegroup and of the profit or loss of thegroup for that period. In preparing thosefinancial statements, the Directors arerequired to:
• select suitable accounting policies andthen apply them consistently;
• make judgements and estimates thatare reasonable and prudent;
• state whether the financial statementscomply with IFRSs as adopted by theEuropean Union;
The Directors confirm that they havecomplied with the above requirements inpreparing the financial statements.
The Directors are responsible for keepingproper accounting records that disclosewith reasonable accuracy at any time thefinancial position of the company and thegroup and to enable them to ensure thatthe financial statements and the Directors’Remuneration Report comply with theCompanies Act 1985 and Article 4 of theIAS Regulation. They are also responsiblefor safeguarding the assets of thecompany and the group and hence fortaking reasonable steps for the preventionand detection of fraud and otherirregularities.
The Directors are responsible for themaintenance and integrity of thecorporate and financial informationincluded on the company’s website.Legislation in the United Kingdomgoverning the preparation anddissemination of financial statements maydiffer from legislation in other jurisdictions.
The Board is responsible for and setsappropriate policies on internal controland seeks regular assurance, at leastannually, that enables it to satisfy itselfthat processes are functioning effectively.Such a system is designed to managerather than eliminate the risk of failure toachieve business objectives and canprovide reasonable, but not absolute,assurance against material misstatementor loss. If a failure is discovered theBoard will take remedial action.
There is no internal audit function withinthe Company and the Board consider thatthis is appropriate given the nature of theGroup’s activities. The report from theexternal auditors’ confirming theirindependence and objectivity wasreviewed by the Audit Committee. Allnon-audit services undertaken by theexternal auditors were reviewed andagreed by the Audit Committee.
The Audit Committee monitors andreviews the effectiveness of theCompany’s financial accounting process.
The Key Performance Indicators (KPIs)and principal risks and uncertaintiesaffecting the Group are considered in theChairman’s Review and the FinancialReview.
(vii) Risk ManagementThe Directors continually review theeffectiveness of the Group’s system ofinternal controls.
The Board has overall ownership of therisk management strategy and processand coordinates activity across theGroup. There is an ongoing process foridentifying, evaluating and managingsignificant risks faced by the Group,which has been in place for the yearunder review and up to the date ofapproval of this Annual Report. TheGroup manages risk by a combination ofinsurance and self-insurance. Self-insurance refers to actions taken internallyor in conjunction with other third parties.In broad terms, high risks in financial andoperational areas are more dependent oninsurance than risks in commercial andpersonnel areas, which because of theirnature are more likely to be managed byself-insurance.
Each subsidiary company has a strategyand process for highlighting the key riskareas of their business, and explaining thecontrol measures and risk exposure. Itthen takes appropriate steps to managethe risk exposure taking into considerationthe likelihood, impact and cost/benefit ofeach of the risks, In addition to the AuditCommittee, which is a mandatoryrequirement under the Combined Code,the Board has Steering Groups with riskmanagement briefs.
These include:
• Health & Safety • Environment
• Insurance • Foreign Currency
• Human Resources • Purchasing
• Pensions • Information Systems
(viii) Relations with ShareholdersThe Finance Director and Chief Executivemake presentations to institutionalinvestors at the time of the announcementof the interim and final results, and thepresentations can be found on theCompany’s website.
Citigate Dewe Rogerson, the Company’spublic relations advisors, and BrewinDolphin Securities, the Company’sstockbrokers, arrange a series ofpresentations during the year toencourage new shareholder investment,and the Company’s executives attendprivate investor trade shows to promotethe Company.

The non-executive directors attend theAnnual General Meeting and are availablefor discussions with shareholders.
(ix) Going ConcernThe Directors have considered the currenttrading prospects, working capitalrequirements, and the availability offinance and are of the opinion that theGroup and Company are going concerns.The accounts have been prepared on thisbasis.
At the Annual General Meeting theChairman will give an update on thecurrent trading position and invitesshareholders to table any questions andencourages their participation.
Payment of CreditorsThe Company had 32 days (2006: 30days) purchases outstanding at 31 March2007. It is the Group’s policy to agreeterms of payment with its suppliers whenagreeing the terms of a businesstransaction or transactions. All suppliersare aware of this procedure and theGroup abides by the agreed paymentterms subject to the terms and conditionsbeing met by the supplier.
Employee InvolvementRegular Consultative Meetings are heldwith the employee trade unionrepresentatives to advise them on allaspects of company developments. Amonthly briefing on Group performance iscarried out for all employees and theyreceive a copy of the Annual Report. As amatter of policy, plans are formallydiscussed with those who will use newequipment, plant and computer systemsbefore designs are finalised. SafetyImprovement teams deal with day-to-dayaspects of safety improvement.
The Group operates an Employee ProfitSharing Scheme which is made up ofthree elements – financial performance,safety performance, and attendanceperformance. A Save as You Earn ShareOption Scheme is also available toencourage employee involvement.
Independent to the assets on the GroupBalance Sheet there is an EmployeeShare Trust which currently holds approx152,000 shares in James Cropper PLC forthe benefit of all employees so that theirinterests are linked to the Company’sfuture growth.
The Trust was set up in 1997 and theinitial finance came from savings achievedthrough the introduction of a ProfitRelated Pay salary replacement scheme.
The share dividends relating to theshareholding are paid into the Trust.
No director is a trustee of the Scheme,and the trustees confirm that they applythe assets for purely benevolentpurposes.
Employment of Disabled PeopleIt is the Group’s policy to give equality ofopportunity when considering applicationsfrom disabled people where the jobrequirements are considered to be withintheir ability. When existing employeesbecome disabled they are retainedwherever reasonable and practicable.The Group tries to provide equalpromotion opportunities whereverpossible.
Donations for Political andCharitable PurposesNo donations for political purposes weremade by the Group. Donations totalling£13,000 (2006: £13,000) were made forvarious local charitable purposes.
Directors’ Authority to allotsharesResolution 11 which will be proposed asan ordinary resolution renews an existingauthority which expires this year and givesthe Directors authority to exercise thepowers of the Company to allot un-issuedshares.
The Directors have no present intention ofexercising the allotment authorityproposed by this resolution other thanpursuant to existing rights underemployee share schemes. To ensurecompliance with recently publishedinstitutional guidelines and marketpractice, it is proposed that the authoritywill expire at the conclusion of the nextAnnual General Meeting or, if earlier, 15months from the forthcoming AnnualGeneral Meeting except insofar ascommitments to allot shares have beenentered into before that date. It is theintention of the Directors to seek a similarauthority annually.
Disapplication of Pre-emptionRightsResolution 12 is being proposed as aspecial resolution and renews an authoritythat expires at the Annual GeneralMeeting. The resolution would grant theDirectors authority for the ensuing year toallot shares by way of rights toshareholders and to issue a maximum of£105,905 (being 5% of the issued ordinaryshare capital) for cash without firstoffering the shares to the existingshareholders pursuant to Section 95 ofthe Companies Act 1985. The resolutionalso disapplies pre-emption rights in theevent of sales of treasury shares. Theauthority will terminate at the next AnnualGeneral Meeting or 15 months after theforthcoming Annual General Meeting,whichever comes first. The Directorspropose to renew this authority annually.
Purchase by the Company of itsown SharesResolution 13 will be proposed as aspecial resolution to renew an existingauthority which expires at the AnnualGeneral Meeting and gives the Companyauthority to make market purchases of itsown shares. The Directors would onlyexercise this power when it would be inthe interests of the Group’s shareholdersas a whole to do so, having regard to theeffect on both earnings and net assetvalues per share. Currently there is nointention of making such repurchases. If such repurchases were made, theDirectors would have to agree whether theshares are be cancelled or to be held intreasury so as to be available for sale ata later date.
The amount of the general authority to theDirectors represents 15% of the issuedordinary share capital. The authority willterminate at the next Annual GeneralMeeting or 15 months after theforthcoming Annual General Meeting,whichever comes first.
Delisting and Admission to AIMA separate circular is being sent toshareholders incorporating a noticeconvening an extraordinary generalmeeting in connection with the proposeddelisting of the Company’s ordinaryshares and admission to AIM.
Substantial InterestsApart from the interests of Directors referred to overleaf, the notified shareholdings inexcess of 3% of the issued capital at 1 June 2007 were as follows: -
J A Cropper 1974 Settlement 1,062,974 12.5%
Credit Agricole Cheuvreux International Limited 542,500 6.4%
Barclayshare Nominees Ltd 423,278 5.0%
Stargas Nominees Ltd 264,320 3.1%
P O’Reilly 254,500 3.0%
Report of the Directors 25
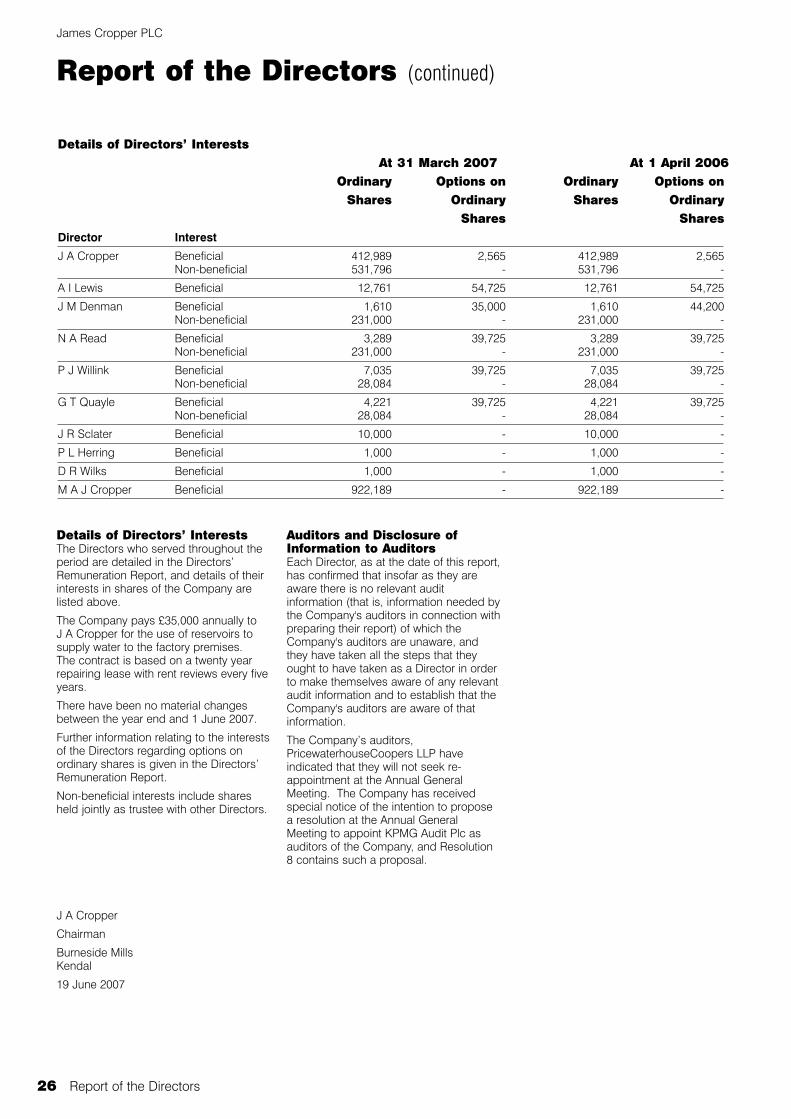
Details of Directors’ InterestsAt 31 March 2007 At 1 April 2006
Ordinary Options on Ordinary Options onShares Ordinary Shares Ordinary
Shares SharesDirector Interest
J A Cropper Beneficial 412,989 2,565 412,989 2,565Non-beneficial 531,796 - 531,796 -
A I Lewis Beneficial 12,761 54,725 12,761 54,725
J M Denman Beneficial 1,610 35,000 1,610 44,200Non-beneficial 231,000 - 231,000 -
N A Read Beneficial 3,289 39,725 3,289 39,725Non-beneficial 231,000 - 231,000 -
P J Willink Beneficial 7,035 39,725 7,035 39,725Non-beneficial 28,084 - 28,084 -
G T Quayle Beneficial 4,221 39,725 4,221 39,725Non-beneficial 28,084 - 28,084 -
J R Sclater Beneficial 10,000 - 10,000 -
P L Herring Beneficial 1,000 - 1,000 -
D R Wilks Beneficial 1,000 - 1,000 -
M A J Cropper Beneficial 922,189 - 922,189 -
Details of Directors’ InterestsThe Directors who served throughout theperiod are detailed in the Directors’Remuneration Report, and details of theirinterests in shares of the Company arelisted above.
The Company pays £35,000 annually to J A Cropper for the use of reservoirs tosupply water to the factory premises. The contract is based on a twenty yearrepairing lease with rent reviews every fiveyears.
There have been no material changesbetween the year end and 1 June 2007.
Further information relating to the interestsof the Directors regarding options onordinary shares is given in the Directors’Remuneration Report.
Non-beneficial interests include sharesheld jointly as trustee with other Directors.
J A Cropper
Chairman
Burneside MillsKendal
19 June 2007
Auditors and Disclosure ofInformation to AuditorsEach Director, as at the date of this report,has confirmed that insofar as they areaware there is no relevant auditinformation (that is, information needed bythe Company's auditors in connection withpreparing their report) of which theCompany's auditors are unaware, andthey have taken all the steps that theyought to have taken as a Director in orderto make themselves aware of any relevantaudit information and to establish that theCompany's auditors are aware of thatinformation.
The Company’s auditors,PricewaterhouseCoopers LLP haveindicated that they will not seek re-appointment at the Annual GeneralMeeting. The Company has receivedspecial notice of the intention to proposea resolution at the Annual GeneralMeeting to appoint KPMG Audit Plc asauditors of the Company, and Resolution8 contains such a proposal.
Report of the Directors (continued)
James Cropper PLC
26 Report of the Directors

Directors’ Remuneration Report 27
Directors’ Remuneration Report
This Report provides details of Directors’ remuneration.
Service ContractsThe Executive Directors are employed on rolling one year contractssubject to one year’s notice served by the Group on the Executive, andsix months notice served by the Executive on the Group. TheChairman is employed on a rolling contract subject to three monthsnotice by either side. Other Non-Executive Directors are on onemonth’s notice by either side and they are typically expected to servetwo three-year terms, with additional terms of office agreed on anannual basis.
Salaries and FeesThe remuneration and emoluments of Executive Directors aredetermined by the Remuneration Committee. The remuneration of theNon-Executive Directors is agreed by the Group Board and they arenot entitled to participate in pension schemes, bonus arrangements orshare schemes. The basic salaries of the Executive Directors arereviewed annually and take into consideration cost of living and overallaccountability. Also considered is remuneration paid to seniorexecutives in comparable public companies. This information ischecked by reference to published surveys, but no formula is in placeto determine any specific relationship.
The remuneration of senior management is discussed by theChairman of the Remuneration Committee and the Chief Executive andtheir recommendations endorsed by the Remuneration Committee.
No Director can take part in the decision on his own salary or reward.
Annual BonusAn Executive Directors’ Incentive Scheme was introduced in April 2005which is structured to reward the Executive Directors if targets areachieved on group profitability, return on investment, safety, productivityimprovements and a discretionary element agreed by the
Remuneration Committee. The total bonus payable to a director iscapped at 25% of their contractual salary and is not pensionable.
Share Option SchemesThe Group operates an Inland Revenue Approved Share OptionScheme and an Unapproved Share Option Scheme for ExecutiveDirectors. Details of the options granted are shown later in this report.No options were granted in the year.
Comparison of Five Year Cumulative TotalShareholder Return (TSR)To enable shareholders to assess the Company’s performance againstthe London Stock Exchange, the cumulative TSR for the period ended 31 March 2007 is shown in the graph below. The FTSE All Share isdeemed to be the most appropriate comparison in terms ofperformance. TSR is the total return to shareholders in terms of capitalgrowth and dividends reinvested.
Information Subject to Audit
Details of Directors’ RemunerationThe following table brings together the various elements of remuneration of each director for the financial period ended 31 March 2007: -
Salary and Fees Benefits Annual Bonus Total2007 2006 2007 2006 2007 2006 2007 2006£’000 £’000 £’000 £’000 £’000 £’000 £’000 £’000
ExecutiveA I Lewis 96 94 15 13 11 - 122 107
J M Denman 81 79 13 13 11 - 105 92
N A Read 77 75 12 11 10 - 99 86
P J Willink 73 71 17 15 11 - 101 86
G T Quayle 73 71 14 12 15 - 102 83
Non-ExecutiveJ A Cropper 34 36 11 8 - - 45 44
J R Sclater 15 15 - - - - 15 15
P L Herring 17 17 - - - - 17 17
D R Wilks 17 17 - - - - 17 17
M A J Cropper* 7 - - - - - 7 -
490 475 82 72 58 - 630 547
*(appointed 25.10.06)
31.3.00 31.3.01 31.3.02 31.3.03 31.3.04 31.3.05 31.3.06 31.3.07
James Cropper PLC FTSE All Share Index
James Cropper & FTSE All Share Total Returns Rebased
230
210
190
170
150
130
110
90
70
50
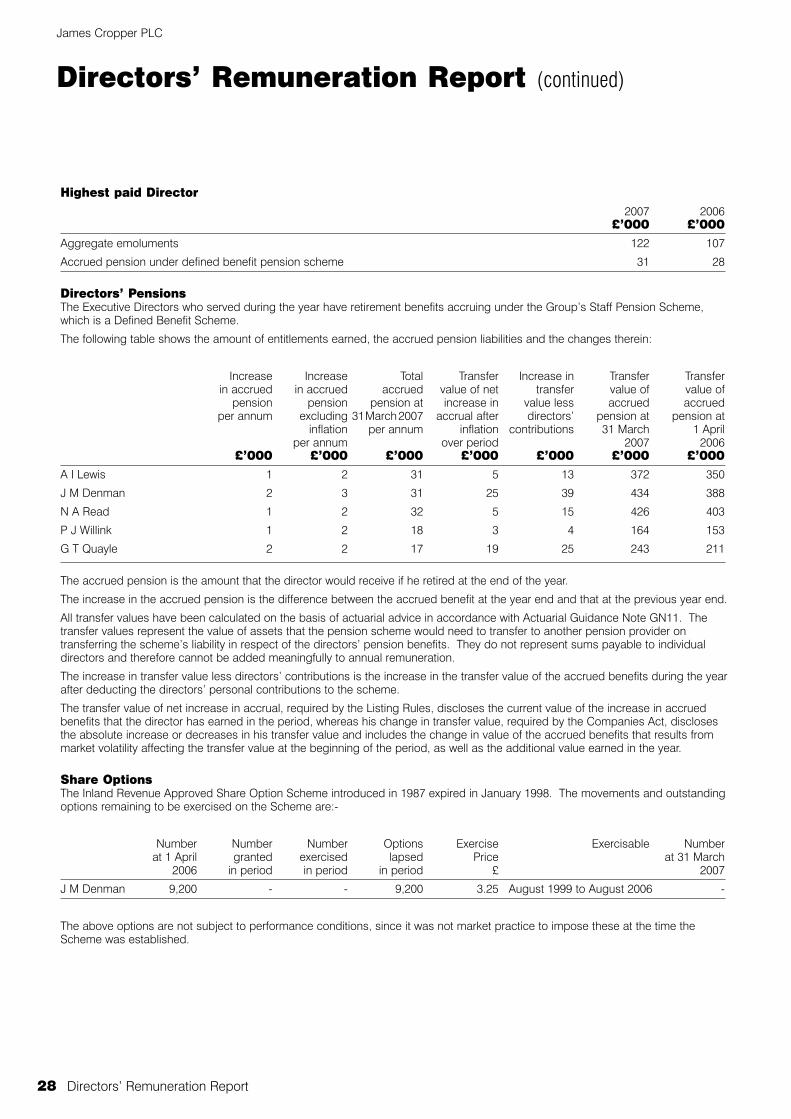
Highest paid Director2007 2006
£’000 £’000Aggregate emoluments 122 107
Accrued pension under defined benefit pension scheme 31 28
Directors’ PensionsThe Executive Directors who served during the year have retirement benefits accruing under the Group’s Staff Pension Scheme,which is a Defined Benefit Scheme.
The following table shows the amount of entitlements earned, the accrued pension liabilities and the changes therein:
Increase Increase Total Transfer Increase in Transfer Transferin accrued in accrued accrued value of net transfer value of value of
pension pension pension at increase in value less accrued accruedper annum excluding 31March2007 accrual after directors’ pension at pension at
inflation per annum inflation contributions 31 March 1 Aprilper annum over period 2007 2006
£’000 £’000 £’000 £’000 £’000 £’000 £’000A I Lewis 1 2 31 5 13 372 350
J M Denman 2 3 31 25 39 434 388
N A Read 1 2 32 5 15 426 403
P J Willink 1 2 18 3 4 164 153
G T Quayle 2 2 17 19 25 243 211
The accrued pension is the amount that the director would receive if he retired at the end of the year.
The increase in the accrued pension is the difference between the accrued benefit at the year end and that at the previous year end.
All transfer values have been calculated on the basis of actuarial advice in accordance with Actuarial Guidance Note GN11. Thetransfer values represent the value of assets that the pension scheme would need to transfer to another pension provider ontransferring the scheme’s liability in respect of the directors’ pension benefits. They do not represent sums payable to individualdirectors and therefore cannot be added meaningfully to annual remuneration.
The increase in transfer value less directors’ contributions is the increase in the transfer value of the accrued benefits during the yearafter deducting the directors’ personal contributions to the scheme.
The transfer value of net increase in accrual, required by the Listing Rules, discloses the current value of the increase in accruedbenefits that the director has earned in the period, whereas his change in transfer value, required by the Companies Act, disclosesthe absolute increase or decreases in his transfer value and includes the change in value of the accrued benefits that results frommarket volatility affecting the transfer value at the beginning of the period, as well as the additional value earned in the year.
Share OptionsThe Inland Revenue Approved Share Option Scheme introduced in 1987 expired in January 1998. The movements and outstandingoptions remaining to be exercised on the Scheme are:-
Number Number Number Options Exercise Exercisable Numberat 1 April granted exercised lapsed Price at 31 March
2006 in period in period in period £ 2007
J M Denman 9,200 - - 9,200 3.25 August 1999 to August 2006 -
The above options are not subject to performance conditions, since it was not market practice to impose these at the time theScheme was established.
James Cropper PLC
28 Directors’ Remuneration Report
Directors’ Remuneration Report (continued)
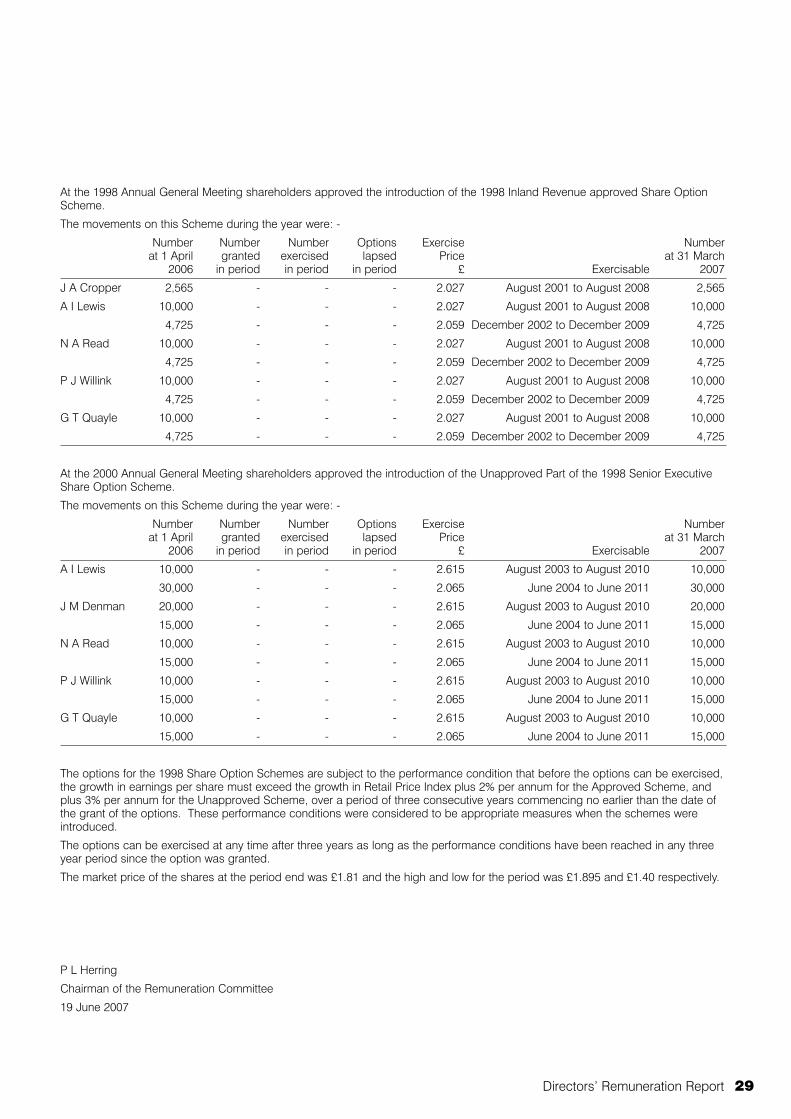
Directors’ Remuneration Report 29
At the 1998 Annual General Meeting shareholders approved the introduction of the 1998 Inland Revenue approved Share OptionScheme.
The movements on this Scheme during the year were: -
Number Number Number Options Exercise Numberat 1 April granted exercised lapsed Price at 31 March
2006 in period in period in period £ Exercisable 2007
J A Cropper 2,565 - - - 2.027 August 2001 to August 2008 2,565
A I Lewis 10,000 - - - 2.027 August 2001 to August 2008 10,000
4,725 - - - 2.059 December 2002 to December 2009 4,725
N A Read 10,000 - - - 2.027 August 2001 to August 2008 10,000
4,725 - - - 2.059 December 2002 to December 2009 4,725
P J Willink 10,000 - - - 2.027 August 2001 to August 2008 10,000
4,725 - - - 2.059 December 2002 to December 2009 4,725
G T Quayle 10,000 - - - 2.027 August 2001 to August 2008 10,000
4,725 - - - 2.059 December 2002 to December 2009 4,725
At the 2000 Annual General Meeting shareholders approved the introduction of the Unapproved Part of the 1998 Senior ExecutiveShare Option Scheme.
The movements on this Scheme during the year were: -
Number Number Number Options Exercise Numberat 1 April granted exercised lapsed Price at 31 March
2006 in period in period in period £ Exercisable 2007
A I Lewis 10,000 - - - 2.615 August 2003 to August 2010 10,000
30,000 - - - 2.065 June 2004 to June 2011 30,000
J M Denman 20,000 - - - 2.615 August 2003 to August 2010 20,000
15,000 - - - 2.065 June 2004 to June 2011 15,000
N A Read 10,000 - - - 2.615 August 2003 to August 2010 10,000
15,000 - - - 2.065 June 2004 to June 2011 15,000
P J Willink 10,000 - - - 2.615 August 2003 to August 2010 10,000
15,000 - - - 2.065 June 2004 to June 2011 15,000
G T Quayle 10,000 - - - 2.615 August 2003 to August 2010 10,000
15,000 - - - 2.065 June 2004 to June 2011 15,000
The options for the 1998 Share Option Schemes are subject to the performance condition that before the options can be exercised,the growth in earnings per share must exceed the growth in Retail Price Index plus 2% per annum for the Approved Scheme, andplus 3% per annum for the Unapproved Scheme, over a period of three consecutive years commencing no earlier than the date ofthe grant of the options. These performance conditions were considered to be appropriate measures when the schemes wereintroduced.
The options can be exercised at any time after three years as long as the performance conditions have been reached in any threeyear period since the option was granted.
The market price of the shares at the period end was £1.81 and the high and low for the period was £1.895 and £1.40 respectively.
P L Herring
Chairman of the Remuneration Committee
19 June 2007

James Cropper PLC
30 Independent Auditors’ Report
Independent Auditors’ Report to the Members of James Cropper PLCWe have audited the group and parentcompany financial statements (the ‘‘financial statements’’) of JamesCropper PLC for the 52 weeks ended 31March 2007 which comprise the GroupProfit and Loss Account, the BalanceSheets, the Cash Flow Statements, theStatements of Recognised Income andExpense and the related notes. Thesefinancial statements have been preparedunder the accounting policies set outtherein. We have also audited theinformation in the Directors’ RemunerationReport that is described as having beenaudited.
Respective responsibilities ofdirectors and auditorsThe directors’ responsibilities for preparingthe Annual Report, the Directors’Remuneration Report and the financialstatements in accordance with applicablelaw and International Financial ReportingStandards (IFRSs) as adopted by theEuropean Union are set out in theStatement of Directors’ Responsibilities.
Our responsibility is to audit thefinancial statements and thepart of the Directors’Remuneration Report to be audited inaccordance with relevant legal andregulatory requirements and InternationalStandards on Auditing (UK and Ireland).This report, including the opinion, hasbeen prepared for and only for thecompany’s members as a body inaccordance with Section 235 of theCompanies Act 1985 and for no otherpurpose. We do not, in giving this opinion,accept or assume responsibility for anyother purpose or to any other person towhom this report is shown or into whosehands it may come save where expresslyagreed by our prior consent in writing.We report to you our opinion as to whetherthe financial statements give a true andfair view and whether the financialstatements and the part of the Directors’Remuneration Report to be audited havebeen properly prepared in accordancewith the Companies Act 1985 and, asregards the group financial statements,Article 4 of the IAS Regulation. We alsoreport to you whether in our opinion theinformation given in the Directors’ Reportis consistent with the financial statements.The information given in the Directors’Report includes that specific informationpresented in the Financial Review that iscross referred from the Business Reviewsection of the Directors’ Report.In addition we report to you if, in ouropinion, the company has not kept properaccounting records, if we have notreceived all the information andexplanations we require for our audit,
or if information specified by law regardingdirectors’ remuneration and othertransactions is not disclosed.We review whether the CorporateGovernance Statement reflects thecompany’s compliance with the nineprovisions of the Combined Code (2003)specified for our review by the ListingRules of the Financial Services Authority,and we report if it does not. We are notrequired to consider whether the board’sstatements on internal control cover allrisks and controls, or form an opinion onthe effectiveness of the group’s corporategovernance procedures or its risk andcontrol procedures.We read other information contained in theAnnual Report and consider whether it isconsistent with the audited financialstatements. The other informationcomprises only the Chairman’s Review, theFinancial Review, the Business Reviews,the Heath and Safety Review, theEnvironmental Review, Effluent De-wateringPlant, the Risk Management Report, theReport of the Directors and the unauditedpart of the Directors’ RemunerationReport. We consider the implications forour report if we become aware of anyapparent misstatements or materialinconsistencies with the financialstatements. Our responsibilities do notextend to any other information.
Basis of audit opinionWe conducted our audit in accordancewith International Standards on Auditing(UK and Ireland) issued by the AuditingPractices Board. An audit includesexamination, on a test basis, of evidencerelevant to the amounts and disclosures inthe financial statements and the part of theDirectors’ Remuneration Report to beaudited. It also includes an assessment ofthe significant estimates and judgmentsmade by the directors in the preparation ofthe financial statements, and of whetherthe accounting policies are appropriate tothe group’s and company’scircumstances, consistently applied andadequately disclosed.We planned and performed our audit soas to obtain all the information andexplanations which we considerednecessary in order to provide us withsufficient evidence to give reasonableassurance that the financial statementsand the part of the Directors’Remuneration Report to be audited arefree from material misstatement, whethercaused by fraud or other irregularity orerror. In forming our opinion we alsoevaluated the overall adequacy of thepresentation of information in the financialstatements and the part of the Directors’Remuneration Report to be audited.
OpinionIn our opinion:• the group financial statements give a
true and fair view, in accordance withIFRSs as adopted by the EuropeanUnion, of the state of the group’s affairsas at 31 March 2007 and of its profitand cash flows for the 52 weeks thenended;
• the parent company financialstatements give a true and fair view, inaccordance with IFRSs as adopted bythe European Union as applied inaccordance with the provisions of theCompanies Act 1985, of the state ofthe parent company’s affairs as at 31 March 2007 and cash flows for the52 weeks then ended;
• the financial statements and the part ofthe Directors’ Remuneration Report tobe audited have been properlyprepared in accordance with theCompanies Act 1985 and, as regardsthe group financial statements, Article 4of the IAS Regulation; and
• the information given in the Directors’Report is consistent with the financialstatements.
PricewaterhouseCoopers LLPChartered Accountants and Registered AuditorsNewcastle upon Tyne19 June 2007
Notes:(a) The maintenance and integrity of the
James Cropper PLC website is theresponsibility of the directors; the workcarried out by the auditors does notinvolve consideration of these mattersand, accordingly, the auditors acceptno responsibility for any changes thatmay have occurred to the financialstatements since they were initiallypresented on the website.
(b) Legislation in the United Kingdomgoverning the preparation anddissemination of financial statementsmay differ from legislation in otherjurisdictions.
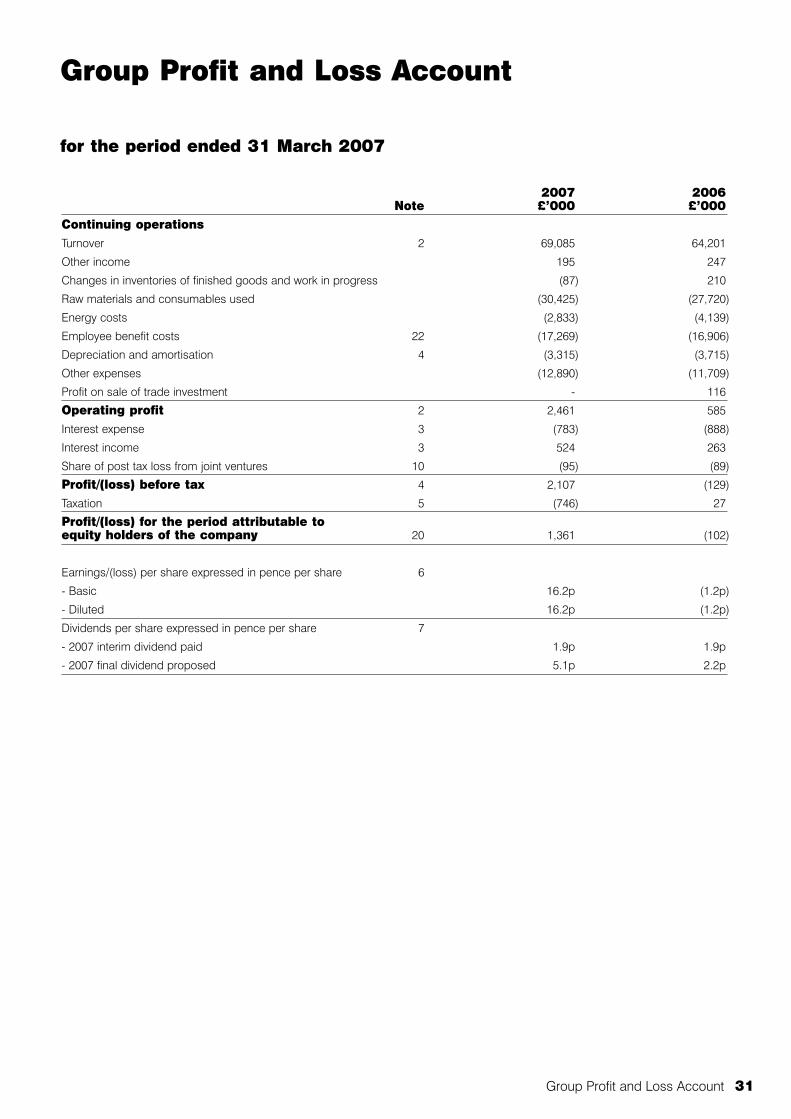
Group Profit and Loss Account
for the period ended 31 March 2007
Group Profit and Loss Account 31
2007 2006Note £’000 £’000
Continuing operationsTurnover 2 69,085 64,201
Other income 195 247
Changes in inventories of finished goods and work in progress (87) 210
Raw materials and consumables used (30,425) (27,720)
Energy costs (2,833) (4,139)
Employee benefit costs 22 (17,269) (16,906)
Depreciation and amortisation 4 (3,315) (3,715)
Other expenses (12,890) (11,709)
Profit on sale of trade investment - 116
Operating profit 2 2,461 585
Interest expense 3 (783) (888)
Interest income 3 524 263
Share of post tax loss from joint ventures 10 (95) (89)
Profit/(loss) before tax 4 2,107 (129)
Taxation 5 (746) 27
Profit/(loss) for the period attributable to equity holders of the company 20 1,361 (102)
Earnings/(loss) per share expressed in pence per share 6
- Basic 16.2p (1.2p)
- Diluted 16.2p (1.2p)
Dividends per share expressed in pence per share 7
- 2007 interim dividend paid 1.9p 1.9p
- 2007 final dividend proposed 5.1p 2.2p

Balance Sheets
as at 31 March 2007
James Cropper PLC
Group Company
2007 2006 2007 2006Note £’000 £’000 £’000 £’000
AssetsNon-current assetsIntangible assets 8 1,351 1,316 1,351 1,316Property, plant and equipment 9 21,517 23,763 1,080 1,295Investments in subsidiary undertakings 10 - - 7,350 7,350Investments in joint ventures 10 58 77 - -Deferred tax assets 18 1,846 3,095 1,846 3,095
24,772 28,251 11,627 13,056
Current assetsInventories 11 8,366 8,267 - -Trade and other receivables 12 14,462 13,399 26,500 28,839Financial assets- Derivative financial instruments 16 4 2 4 2Cash and cash equivalents 13 3,730 1,762 422 1,087Current tax assets - - 67 -
26,562 23,430 26,993 29,928
LiabilitiesCurrent liabilitiesTrade and other payables 14 (8,544) (7,727) (3,173) (4,516)Financial liabilities- Borrowings 15 (2,374) (2,244) (2,374) (2,244)Current tax liabilities (1,020) (465) - (104)
(11,938) (10,436) (5,547) (6,864)
Net current assets 14,624 12,994 21,446 23,064
Non-current liabilitiesFinancial liabilities- Borrowings 15 (6,650) (8,113) (6,650) (8,113)Retirement benefit liabilities 17 (6,152) (10,315) (6,152) (10,315)Deferred tax liabilities 18 (3,941) (3,958) (584) (558)
(16,743) (22,386) (13,386) (18,986)
Net assets 22,653 18,859 19,687 17,134
Shareholders’ equityOrdinary share capital 19 2,118 2,090 2,118 2,090Share premium 20 573 454 573 454Translation reserve 20 (8) 10 - -Other reserves 20 - 61 - 14Retained earnings 20 19,970 16,244 16,996 14,576
Total shareholders’ equity 22,653 18,859 19,687 17,134
The financial statements on pages 31 to 55 were approved by the Board of Directors on 19 June 2007 and were signed on its behalf by:
J A Cropper
Director
32 Balance Sheets
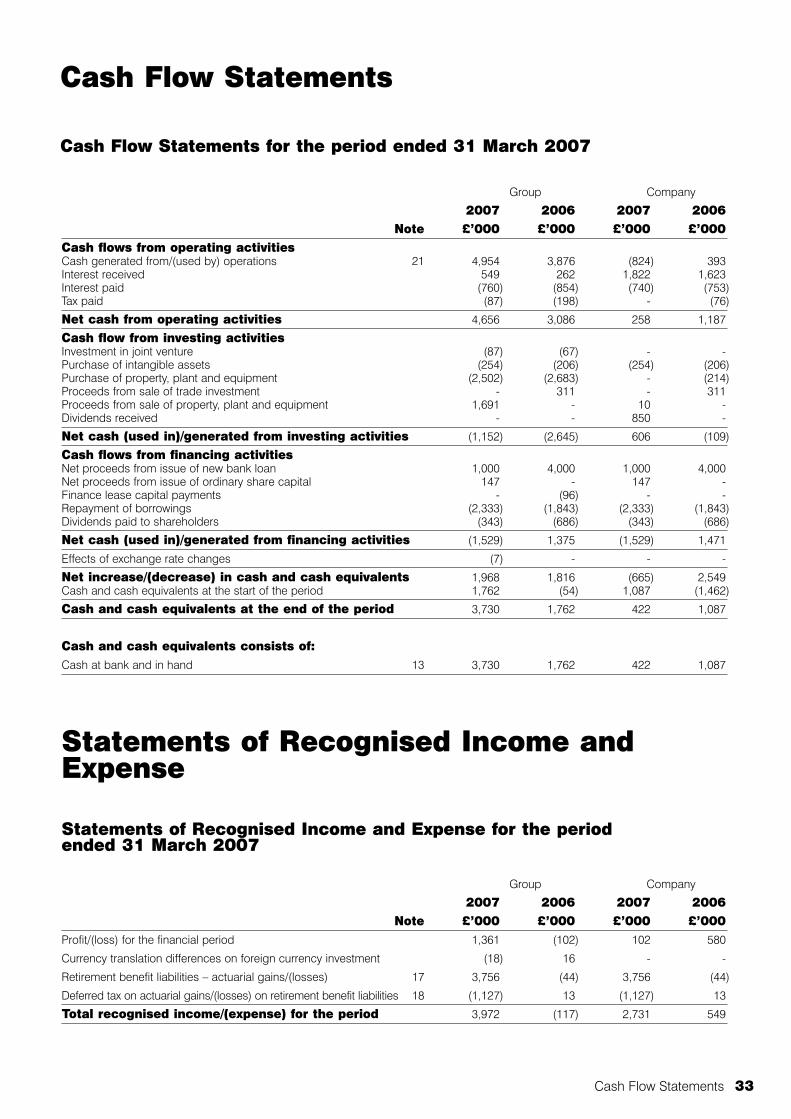
Cash Flow Statements
Cash Flow Statements 33
Cash Flow Statements for the period ended 31 March 2007
Group Company
2007 2006 2007 2006Note £’000 £’000 £’000 £’000
Cash flows from operating activitiesCash generated from/(used by) operations 21 4,954 3,876 (824) 393Interest received 549 262 1,822 1,623Interest paid (760) (854) (740) (753)Tax paid (87) (198) - (76)
Net cash from operating activities 4,656 3,086 258 1,187
Cash flow from investing activitiesInvestment in joint venture (87) (67) - -Purchase of intangible assets (254) (206) (254) (206)Purchase of property, plant and equipment (2,502) (2,683) - (214)Proceeds from sale of trade investment - 311 - 311Proceeds from sale of property, plant and equipment 1,691 - 10 -Dividends received - - 850 -
Net cash (used in)/generated from investing activities (1,152) (2,645) 606 (109)
Cash flows from financing activitiesNet proceeds from issue of new bank loan 1,000 4,000 1,000 4,000Net proceeds from issue of ordinary share capital 147 - 147 -Finance lease capital payments - (96) - -Repayment of borrowings (2,333) (1,843) (2,333) (1,843)Dividends paid to shareholders (343) (686) (343) (686)
Net cash (used in)/generated from financing activities (1,529) 1,375 (1,529) 1,471
Effects of exchange rate changes (7) - - -
Net increase/(decrease) in cash and cash equivalents 1,968 1,816 (665) 2,549Cash and cash equivalents at the start of the period 1,762 (54) 1,087 (1,462)
Cash and cash equivalents at the end of the period 3,730 1,762 422 1,087
Cash and cash equivalents consists of:Cash at bank and in hand 13 3,730 1,762 422 1,087
Statements of Recognised Income andExpense
Statements of Recognised Income and Expense for the period ended 31 March 2007
Group Company
2007 2006 2007 2006Note £’000 £’000 £’000 £’000
Profit/(loss) for the financial period 1,361 (102) 102 580
Currency translation differences on foreign currency investment (18) 16 - -
Retirement benefit liabilities – actuarial gains/(losses) 17 3,756 (44) 3,756 (44)
Deferred tax on actuarial gains/(losses) on retirement benefit liabilities 18 (1,127) 13 (1,127) 13
Total recognised income/(expense) for the period 3,972 (117) 2,731 549
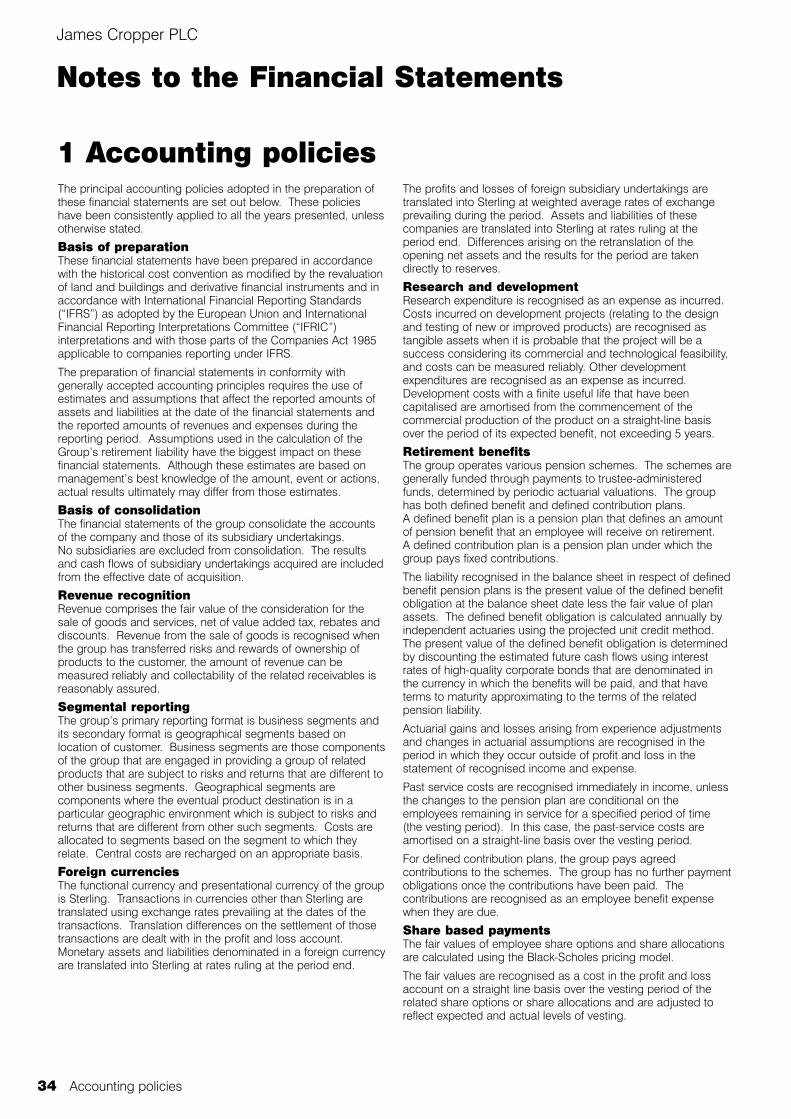
James Cropper PLC
34 Accounting policies
Notes to the Financial Statements
1 Accounting policiesThe principal accounting policies adopted in the preparation ofthese financial statements are set out below. These policieshave been consistently applied to all the years presented, unlessotherwise stated.
Basis of preparationThese financial statements have been prepared in accordancewith the historical cost convention as modified by the revaluationof land and buildings and derivative financial instruments and inaccordance with International Financial Reporting Standards(“IFRS”) as adopted by the European Union and InternationalFinancial Reporting Interpretations Committee (“IFRIC”)interpretations and with those parts of the Companies Act 1985applicable to companies reporting under IFRS.
The preparation of financial statements in conformity withgenerally accepted accounting principles requires the use ofestimates and assumptions that affect the reported amounts ofassets and liabilities at the date of the financial statements andthe reported amounts of revenues and expenses during thereporting period. Assumptions used in the calculation of theGroup’s retirement liability have the biggest impact on thesefinancial statements. Although these estimates are based onmanagement’s best knowledge of the amount, event or actions,actual results ultimately may differ from those estimates.
Basis of consolidationThe financial statements of the group consolidate the accountsof the company and those of its subsidiary undertakings. No subsidiaries are excluded from consolidation. The resultsand cash flows of subsidiary undertakings acquired are includedfrom the effective date of acquisition.
Revenue recognitionRevenue comprises the fair value of the consideration for thesale of goods and services, net of value added tax, rebates anddiscounts. Revenue from the sale of goods is recognised whenthe group has transferred risks and rewards of ownership ofproducts to the customer, the amount of revenue can bemeasured reliably and collectability of the related receivables isreasonably assured.
Segmental reportingThe group’s primary reporting format is business segments andits secondary format is geographical segments based onlocation of customer. Business segments are those componentsof the group that are engaged in providing a group of relatedproducts that are subject to risks and returns that are different toother business segments. Geographical segments arecomponents where the eventual product destination is in aparticular geographic environment which is subject to risks andreturns that are different from other such segments. Costs areallocated to segments based on the segment to which theyrelate. Central costs are recharged on an appropriate basis.
Foreign currenciesThe functional currency and presentational currency of the groupis Sterling. Transactions in currencies other than Sterling aretranslated using exchange rates prevailing at the dates of thetransactions. Translation differences on the settlement of thosetransactions are dealt with in the profit and loss account.Monetary assets and liabilities denominated in a foreign currencyare translated into Sterling at rates ruling at the period end.
The profits and losses of foreign subsidiary undertakings aretranslated into Sterling at weighted average rates of exchangeprevailing during the period. Assets and liabilities of thesecompanies are translated into Sterling at rates ruling at theperiod end. Differences arising on the retranslation of theopening net assets and the results for the period are takendirectly to reserves.
Research and developmentResearch expenditure is recognised as an expense as incurred.Costs incurred on development projects (relating to the designand testing of new or improved products) are recognised astangible assets when it is probable that the project will be asuccess considering its commercial and technological feasibility,and costs can be measured reliably. Other developmentexpenditures are recognised as an expense as incurred.Development costs with a finite useful life that have beencapitalised are amortised from the commencement of thecommercial production of the product on a straight-line basisover the period of its expected benefit, not exceeding 5 years.
Retirement benefitsThe group operates various pension schemes. The schemes aregenerally funded through payments to trustee-administeredfunds, determined by periodic actuarial valuations. The grouphas both defined benefit and defined contribution plans. A defined benefit plan is a pension plan that defines an amountof pension benefit that an employee will receive on retirement. A defined contribution plan is a pension plan under which thegroup pays fixed contributions.
The liability recognised in the balance sheet in respect of definedbenefit pension plans is the present value of the defined benefitobligation at the balance sheet date less the fair value of planassets. The defined benefit obligation is calculated annually byindependent actuaries using the projected unit credit method.The present value of the defined benefit obligation is determinedby discounting the estimated future cash flows using interestrates of high-quality corporate bonds that are denominated inthe currency in which the benefits will be paid, and that haveterms to maturity approximating to the terms of the relatedpension liability.
Actuarial gains and losses arising from experience adjustmentsand changes in actuarial assumptions are recognised in theperiod in which they occur outside of profit and loss in thestatement of recognised income and expense.
Past service costs are recognised immediately in income, unlessthe changes to the pension plan are conditional on theemployees remaining in service for a specified period of time(the vesting period). In this case, the past-service costs areamortised on a straight-line basis over the vesting period.
For defined contribution plans, the group pays agreedcontributions to the schemes. The group has no further paymentobligations once the contributions have been paid. Thecontributions are recognised as an employee benefit expensewhen they are due.
Share based paymentsThe fair values of employee share options and share allocationsare calculated using the Black-Scholes pricing model.
The fair values are recognised as a cost in the profit and lossaccount on a straight line basis over the vesting period of therelated share options or share allocations and are adjusted toreflect expected and actual levels of vesting.
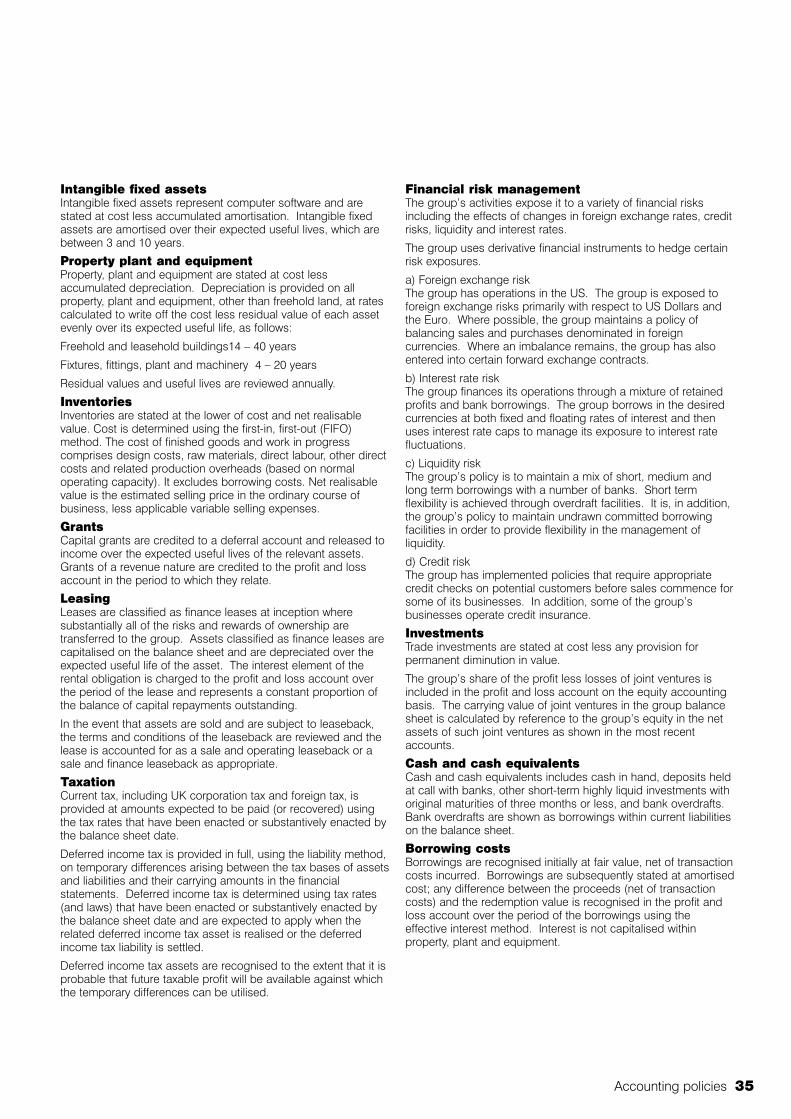
Accounting policies 35
Intangible fixed assetsIntangible fixed assets represent computer software and arestated at cost less accumulated amortisation. Intangible fixedassets are amortised over their expected useful lives, which arebetween 3 and 10 years.
Property plant and equipmentProperty, plant and equipment are stated at cost lessaccumulated depreciation. Depreciation is provided on allproperty, plant and equipment, other than freehold land, at ratescalculated to write off the cost less residual value of each assetevenly over its expected useful life, as follows:
Freehold and leasehold buildings14 – 40 years
Fixtures, fittings, plant and machinery 4 – 20 years
Residual values and useful lives are reviewed annually.
InventoriesInventories are stated at the lower of cost and net realisablevalue. Cost is determined using the first-in, first-out (FIFO)method. The cost of finished goods and work in progresscomprises design costs, raw materials, direct labour, other directcosts and related production overheads (based on normaloperating capacity). It excludes borrowing costs. Net realisablevalue is the estimated selling price in the ordinary course ofbusiness, less applicable variable selling expenses.
GrantsCapital grants are credited to a deferral account and released toincome over the expected useful lives of the relevant assets.Grants of a revenue nature are credited to the profit and lossaccount in the period to which they relate.
LeasingLeases are classified as finance leases at inception wheresubstantially all of the risks and rewards of ownership aretransferred to the group. Assets classified as finance leases arecapitalised on the balance sheet and are depreciated over theexpected useful life of the asset. The interest element of therental obligation is charged to the profit and loss account overthe period of the lease and represents a constant proportion ofthe balance of capital repayments outstanding.
In the event that assets are sold and are subject to leaseback,the terms and conditions of the leaseback are reviewed and thelease is accounted for as a sale and operating leaseback or asale and finance leaseback as appropriate.
TaxationCurrent tax, including UK corporation tax and foreign tax, isprovided at amounts expected to be paid (or recovered) usingthe tax rates that have been enacted or substantively enacted bythe balance sheet date.
Deferred income tax is provided in full, using the liability method,on temporary differences arising between the tax bases of assetsand liabilities and their carrying amounts in the financialstatements. Deferred income tax is determined using tax rates(and laws) that have been enacted or substantively enacted bythe balance sheet date and are expected to apply when therelated deferred income tax asset is realised or the deferredincome tax liability is settled.
Deferred income tax assets are recognised to the extent that it isprobable that future taxable profit will be available against whichthe temporary differences can be utilised.
Financial risk managementThe group’s activities expose it to a variety of financial risksincluding the effects of changes in foreign exchange rates, creditrisks, liquidity and interest rates.
The group uses derivative financial instruments to hedge certainrisk exposures.
a) Foreign exchange riskThe group has operations in the US. The group is exposed toforeign exchange risks primarily with respect to US Dollars andthe Euro. Where possible, the group maintains a policy ofbalancing sales and purchases denominated in foreigncurrencies. Where an imbalance remains, the group has alsoentered into certain forward exchange contracts.
b) Interest rate riskThe group finances its operations through a mixture of retainedprofits and bank borrowings. The group borrows in the desiredcurrencies at both fixed and floating rates of interest and thenuses interest rate caps to manage its exposure to interest ratefluctuations.
c) Liquidity riskThe group’s policy is to maintain a mix of short, medium andlong term borrowings with a number of banks. Short termflexibility is achieved through overdraft facilities. It is, in addition,the group’s policy to maintain undrawn committed borrowingfacilities in order to provide flexibility in the management ofliquidity.
d) Credit riskThe group has implemented policies that require appropriatecredit checks on potential customers before sales commence forsome of its businesses. In addition, some of the group’sbusinesses operate credit insurance.
InvestmentsTrade investments are stated at cost less any provision forpermanent diminution in value.
The group’s share of the profit less losses of joint ventures isincluded in the profit and loss account on the equity accountingbasis. The carrying value of joint ventures in the group balancesheet is calculated by reference to the group’s equity in the netassets of such joint ventures as shown in the most recentaccounts.
Cash and cash equivalentsCash and cash equivalents includes cash in hand, deposits heldat call with banks, other short-term highly liquid investments withoriginal maturities of three months or less, and bank overdrafts.Bank overdrafts are shown as borrowings within current liabilitieson the balance sheet.
Borrowing costsBorrowings are recognised initially at fair value, net of transactioncosts incurred. Borrowings are subsequently stated at amortisedcost; any difference between the proceeds (net of transactioncosts) and the redemption value is recognised in the profit andloss account over the period of the borrowings using theeffective interest method. Interest is not capitalised withinproperty, plant and equipment.

Financial instrumentsDerivatives are initially recognised at fair value on the date aderivative contract is entered into and are subsequently re-measured at their fair value at each balance sheet date. Theresulting gain or loss on re-measurement is recognised in theprofit and loss account, unless hedge accounting is applicable.
Loans and receivables are non-derivative financial assets withfixed or determinable payments that are not quoted in an activemarket. They arise when the group provides money, goods orservices directly to a debtor with no intention of trading thereceivable. They are included in current assets, except thosewith maturities greater than twelve months after the balancesheet date, which are classified as non-current assets. Loansand receivables are included within trade and other receivablesin the balance sheet.
The fair value of financial instruments traded in active markets isbased on quoted market prices at the balance sheet date.
InterestInterest is recognised in the consolidated income statement onan accruals basis using the effective interest method.
Trade receivablesTrade receivables are recorded at their nominal amount less anallowance for doubtful debts.
Trade payablesTrade payables are stated at their nominal value.
Impairment of assetsAt each reporting date, the group assesses whether there is anyindication that an asset may be impaired. Where an indicator ofimpairment exists, the group makes an estimate of recoverableamount. Where the carrying value of an asset exceeds itsrecoverable amount the asset is written down to its recoverableamount. Recoverable amount is the higher of fair value lesscosts to sell and value in use and is deemed for an individualasset. If the asset does not generate cash flows that are largelyindependent of those from other assets or groups of assets, therecoverable amount of the cash generating unit to which theasset belongs is determined. Discount rates reflecting the assetspecific risks and the time value of money are used for the valuein use calculation.
Joint venturesJoint ventures are entities over which the group has joint control,established by contractual agreement. Investments in jointventures are accounted for using the equity method. If thegroup's share of losses in a joint venture equals or exceeds itsinvestment in the joint venture the group does not recognisefurther losses, unless it has incurred obligations or madepayments on behalf of the joint venture.
New standards and interpretation not appliedThe following key standards and interpretations have been issued by the International Accounting Standards Board (IASB) and IFRICwith an effective date that does not impact on these financial statements so they have not been applied.
International Accounting Standards and Interpretations Effective dateIFRS 7 Financial Instruments: Disclosures 1 January 2007
IAS 1 Amendment - Presentation of financial statements 1 January 2007
IFRS 8 Operating Segments 1 January 2009
IFRIC 8 Scope of IFRS 2 1 May 2006
IFRIC 9 Reassessment of embedded derivatives 1 June 2006
IFRIC 10 Interim financial reporting and impairment 1 November 2006
IFRIC 11 IFRS 2: Group and Treasury Share Transactions 1 March 2007
IFRIC 12 Service Concession Arrangements 1 January 2008
IAS 23 Revised- Borrowing costs 1 January 2009
Upon adoption of IFRS 7, the group will need to disclose the fair value of its financial instruments and its risk exposure in greaterdetail although there is not expected to be any effect on the reported income or net assets. The directors do not anticipate that theadoption of any of the other above standards and interpretations will have a material impact on the group's financial statements in theperiod of initial application.
Notes to the Financial Statements (continued)
James Cropper PLC
36 Accounting policies
1 Accounting policies (continued)

Segmental reporting 37
Primary reporting format – business segments
Period ended Papermaking Retail Converting Technical Group Other Eliminations Group31 March 2007 Fibre Services
Products£’000 £’000 £’000 £’000 £’000 £’000 £’000 £’000
Continuing operationsRevenue - external 43,680 6,038 10,364 9,003 - - - 69,085
- inter segment 2,287 - 793 - - - (3,080) -
Segment profit/(loss) before HQ Intra Group charges 1,896 (336) 551 2,144 (1,794) - - 2,461
Segment profit/(loss) after HQ Intra Group charges 1,435 (358) 460 2,053 (1,129) - - 2,461
Interest expense (783)
Interest income 524
Share of post tax results of joint ventures (95)
Profit before tax 2,107
Taxation (746)
Profit for the year from continuing operations 1,361
Segment assets 28,352 1,832 9,145 9,864 38,619 1,648 (38,077) 51,383
Investment in equity accounted joint venture - - - 58 - - - 58
Total assets 28,352 1,832 9,145 9,922 38,619 1,648 (38,077) 51,441
Total liabilities (22,799) (1,426) (6,970) (7,176) (18,932) - 28,515 (28,788)
Other segment itemsCapital expenditure 1,731 52 323 396 254 - - 2,756
Depreciation 1,742 365 367 417 205 - - 3,096
Amortisation of intangible assets - - - - 219 - - 219
Impairment of trade receivables (4) - (5) 28 - - - 19
At 31 March 2007, the Group is organised into five main business segments:
• Papermaking – relates to James Cropper Speciality Papers. Manufacturer of coloured paper and boards.
• Retail – relates to The Paper Mill Shop. Retailing of paper and associated products.
• Converting – relates to James Cropper Converting. Converting of paper.
• Technical Fibre Products – Manufacture of high performance wet-laid non-wovens from fibres.
• Group services – comprises central functions providing services to the subsidiary companies
Comparative information is presented on the same basis.
2 Segmental reporting

Period ended Papermaking Retail Converting Technical Group Other Eliminations Group1 April 2006 Fibre Services
Products£’000 £’000 £’000 £’000 £’000 £’000 £’000 £’000
Continuing operationsRevenue - external 41,231 6,159 10,111 6,700 - - - 64,201
- inter segment 2,608 - 776 - - - (3,384) -
Segment profit/(loss) before HQ Intra Group charges 214 265 158 867 (1,035) - - 469
Segment profit/(loss) after HQ Intra Group charges (247) 241 62 777 (364) - - 469
Interest expense (888)
Interest income 263
Share of post tax results of joint ventures (89)Profit on sale of trade investment 116
Loss before tax (129)Taxation 27
Loss for the year from continuing operations (102)
Segment assets 27,763 2,101 9,890 8,180 42,827 1,648 (40,962) 51,447
Investment in equity accounted joint venture - - - 77 - - - 77
Total assets 27,763 2,101 9,890 8,257 42,827 1,648 (40,962) 51,524
Total liabilities (23,240) (1,425) (7,931) (5,508) (25,693) - 31,132 (32,665)
Other segment itemsCapital expenditure 1,363 573 381 152 420 - - 2,889Depreciation 2,017 280 615 448 173 - - 3,533Amortisation of intangible assets - - - - 182 - - 182Impairment of trade receivables (5) - 8 (14) - - - (11)
Secondary reporting format – geographical segmentsThe group’s manufacturing operations are based in the UK. The sales analysis in the table below is based on the location of thecustomer.
Revenue Segment asset Capital expenditure
2007 2006 2007 2006 2007 2006Continuing operations £’000 £’000 £’000 £’000 £’000 £’000UK 43,871 40,591 49,833 50,049 2,756 2,889Europe 12,000 11,230 - - - -Asia 4,413 4,637 - - - -The Americas 7,036 5,955 1,550 1,398 - -Australasia 1,558 1,473 - - - -Africa 207 315 - - - -
69,085 64,201 51,383 51,447 2,756 2,889
Investment in equity accounted joint ventures - - 58 77 - -
69,085 64,201 51,441 51,524 2,756 2,889
CompanyThe Company’s business is to invest in its subsidiaries and, therefore, it operates in a single segment.
Notes to the Financial Statements (continued)
James Cropper PLC
38 Segmental reporting
2 Segmental reporting (continued)

Finance costs 39
3 Finance costs2007 2006£’000 £’000
Interest expenseInterest payable on bank borrowings 783 761
Interest payable on finance leases - 13
Retirement benefits:Expected return on pension scheme assets - (2,954)
Interest on pension scheme liabilities - 3,068
Total interest expense 783 888
Interest incomeInterest receivable on bank borrowings 345 263
Retirement benefits:Expected return on pension scheme assets 3,492 -
Interest on pension scheme liabilities (3,313) -
Total interest income 524 263
4 Profit/(loss) before tax2007 2006£’000 £’000
The following items have been charged/(credited) in arriving at profit/(loss) before tax:
Staff costs (note 22) 17,269 16,906Depreciation of property, plant and equipment:- owned assets 3,096 3,430- under finance leases - 103Amortisation of intangibles 219 182Profit on disposal of fixed assets (39) -Other operating lease rentals payable- Plant and machinery 386 234- Retail outlets 972 851Repairs and maintenance expenditure on property, plant and equipment 2,342 2,307Government grants received (133) (190)Fair value adjustments relating to financial assets and liabilities at fair value through profit and loss 8 19Research and development expenditure 767 972Foreign exchange differences 267 (116)Trade receivables impairment 19 (11)Fixed asset impairment - 250
Government grants relate to assistance received for research projects.
Services provided by the group’s auditor and network firmsDuring the period the group obtained the following services from the group’s auditor at costs as detailed below:
2007 2006£’000 £’000
Audit services:- Fees payable to the company’s auditor for the audit of parent company and consolidated accounts 13 12
Other services:- Remuneration payable to the company’s auditor for the auditing of accounts of associates of the
company pursuant to legislation (including that of countries and territories outside Great Britain) 40 40- Fees in respect of work performed on grants 3 5- IFRS accounting advisory services - 2- Tax compliance services 32 29- Tax advisory services - 2
88 90

5 TaxationAnalysis of charge in period
2007 2006Continuing operations £’000 £’000Current tax 958 155Prior year adjustments in respect of current tax (317) 19
641 174
Deferred tax (note 18) (116) (129)Prior year adjustments in respect of deferred tax (note 18) 221 (72)
105 (201)
Taxation 746 (27)
Tax on items charged to equityDeferred tax on actuarial gains on retirement benefit liabilities 1,127 (13)
The tax for the period is higher (2006: higher) than the standard rate of corporation tax in the UK (30%). The differences are explained below:
2007 2006£’000 £’000
Profit/(loss) on ordinary activities before tax 2,107 (129)
Profit on ordinary activities multiplied by rate of corporation tax in the UK of 30% (2006: 30%) 632 (39)
Effects of:Adjustments to tax in respect of prior period (96) (53)
Unrelieved tax losses 129 -
Tax at marginal rates - (11)
Expenses not deductible for tax purposes 79 67
Other 2 9
Total taxation (continuing operations) 746 (27)
6 Earnings/(loss) per shareBasic earnings per share is calculated by dividing the earnings attributable to ordinary shareholders by the weighted average numberof shares outstanding during the year.
For diluted earnings per share, the weighted average number of ordinary shares in issue is adjusted to assume conversion of alldilutive potential ordinary shares. The group has one class of dilutive potential ordinary shares: those share options granted toemployees where the exercise price is less than the average market price of the company’s ordinary shares during the year.
Reconciliations of the earnings and weighted average number of shares used in the calculations are set out below.
2007 2006Earnings Weighted Per- Earnings Weighted Per-
average share average sharenumber amount number amount
of shares of shares£’000 ’000 pence £’000 ’000 pence
Basic EPSEarnings attributable to ordinary shareholders 1,361 8,376 16.2 (102) 8,359 (1.2)
Effect of dilutive securitiesOptions - 9 - - - -
Diluted EPS 1,361 8,385 16.2 (102) 8,359 (1.2)
Notes to the Financial Statements (continued)
James Cropper PLC
40 Taxation

Dividends 41
7 Dividends2007 2006£’000 £’000
Final paid for the period ended 1 April 2006/period ended 2 April 2005 184 527
Interim paid for the period ended 31 March 2007/period ended 1 April 2006 159 159
In addition, the directors are proposing a final dividend in respect of the financial period ended 31 March 2007 of 5.1p per sharewhich will absorb an estimated £432,000 (2006:£184,000) of shareholders’ funds. If approved by members at the Annual GeneralMeeting, it will be paid on 10 August 2007 to shareholders who are on the register of members at 20 July 2007. There are no taximplications in respect of this proposed dividend.
The proposed dividend is not accounted for until it is formally approved at the Annual General Meeting.
8 Intangible assetsGroup and Company
Computer Software£’000
CostAt 2 April 2006 2,717Additions – externally generated 109Additions – internally generated 145
At 31 March 2007 2,971
Aggregate amortisationAt 2 April 2006 1,401Charge for the period 219
At 31 March 2007 1,620
Net book amount at 31 March 2007 1,351
Computer Software£’000
CostAt 3 April 2005 2,511Additions – externally generated 20Additions – internally generated 186
At 1 April 2006 2,717
Aggregate amortisationAt 3 April 2005 1,219Charge for the period 182
At 1 April 2006 1,401
Net book amount at 1 April 2006 1,316
The computer software capitalised principally relates to the ongoing development of the group’s Enterprise Resource Planning andFinancial systems.
The remaining amortisation period of the assets at the period end is 8 years (2006: 9 years).

Notes to the Financial Statements (continued)
James Cropper PLC
42 Property plant and equipment
9 Property plant and equipmentGroup Freehold Plant &
land & machinerybuildings Total
£’000 £’000 £’000CostAt 2 April 2006 10,068 66,028 76,096
Additions at cost 100 2,402 2,502
Disposals (24) (3,003) (3,027)
At 31 March 2007 10,144 65,427 75,571
Accumulated depreciationAt 2 April 2006 3,940 48,393 52,333
Charge for the period 287 2,809 3,096
Disposals (24) (1,351) (1,375)
At 31 March 2007 4,203 49,851 54,054
Net book amount at 31 March 2007 5,941 15,576 21,517
Group Freehold Plant &land & machinery
buildings Total£’000 £’000 £’000
CostAt 3 April 2005 10,068 63,345 73,413
Additions at cost - 2,683 2,683
At 1 April 2006 10,068 66,028 76,096
Accumulated depreciationAt 3 April 2005 3,673 45,127 48,800
Charge for the period 267 3,266 3,533
At 1 April 2006 3,940 48,393 52,333
Net book amount at 1 April 2006 6,128 17,635 23,763
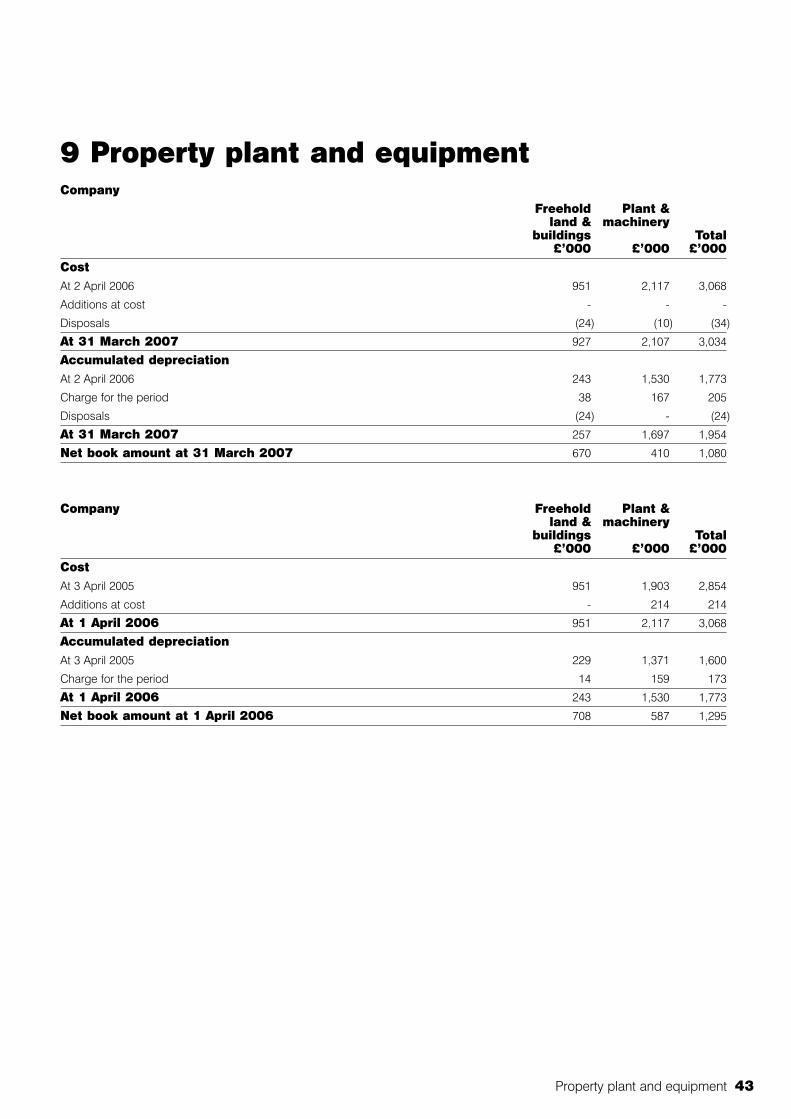
Property plant and equipment 43
9 Property plant and equipmentCompany
Freehold Plant &land & machinery
buildings Total£’000 £’000 £’000
CostAt 2 April 2006 951 2,117 3,068
Additions at cost - - -
Disposals (24) (10) (34)
At 31 March 2007 927 2,107 3,034
Accumulated depreciationAt 2 April 2006 243 1,530 1,773
Charge for the period 38 167 205
Disposals (24) - (24)
At 31 March 2007 257 1,697 1,954
Net book amount at 31 March 2007 670 410 1,080
Company Freehold Plant &land & machinery
buildings Total£’000 £’000 £’000
CostAt 3 April 2005 951 1,903 2,854
Additions at cost - 214 214
At 1 April 2006 951 2,117 3,068
Accumulated depreciationAt 3 April 2005 229 1,371 1,600
Charge for the period 14 159 173
At 1 April 2006 243 1,530 1,773
Net book amount at 1 April 2006 708 587 1,295

10 Investments(i) Investments in subsidiary undertakings
Group Company
2007 2006 2007 2006£’000 £’000 £’000 £’000
At 31 March 2007 and 2 April 2006 - - 7,350 7,350
Investments in subsidiary undertakings are stated at cost. A list of principal subsidiary undertakings is given below:
Country of incorporation % holding Nature of businessJames Cropper Speciality Papers Limited England 100 Manufacture of coloured paper and boardsThe Paper Mill Shop Company Limited England 100 Retailing of paperJames Cropper Converting Limited England 100 Paper converterTechnical Fibre Products Limited England 100 Manufacture of high performance
wet-laid nonwovens from fibresTechnical Fiber Products Inc. USA 100 Sales organisationMelmore Limited England 100 Dormant companyPapermilldirect.com Limited England 100 Dormant company
(ii) Investments in joint venturesGroup Company
2007 2006 2007 2006£’000 £’000 £’000 £’000
At 2 April 2006 77 83 - -
Investment in the year 87 67 - -
Share of loss in the year (95) (89) - -
Exchange adjustments (11) 16 - -
At 31 March 2007 58 77 - -
The investment in joint ventures relates to the Group’s 50% shareholding in Electro Fiber Technologies Inc., a company based in theUSA. The investment is held by Technical Fiber Products Inc.
The aggregate amounts included in the financial statements relating to the Group’s share of joint ventures are:
Group
2007 2006£’000 £’000
Gross assets 73 97
Gross liabilities (15) (20)
58 77
11 InventoriesGroup Company
2007 2006 2007 2006£’000 £’000 £’000 £’000
Materials 3,961 3,775 - -
Work in progress 1,674 1,515 - -
Finished goods 2,731 2,977 - -
8,366 8,267 - -
Inventories are stated after a provision for impairment of £121,000 (2006: £126,000)
Notes to the Financial Statements (continued)
James Cropper PLC
44 Investments

Trade and other receivables 45
12 Trade and other receivablesGroup Company
2007 2006 2007 2006£’000 £’000 £’000 £’000
Trade debtors 13,554 11,467 - -
Less: Provision for impairment of receivables (67) (48) - -
Trade debtors – net 13,487 11,419 - -
Amounts owed by group undertakings - - 26,062 27,456
Other debtors 140 1,020 114 1,001
Prepayments 835 960 324 382
14,462 13,399 26,500 28,839
Concentrations of credit risk with respect to trade receivables are mitigated by the Group as described in the accounting policies.Due to this, management believe there is no further credit risk provision required in excess of normal provision for doubtfulreceivables.
13 Cash and cash equivalentsGroup Company
2007 2006 2007 2006£’000 £’000 £’000 £’000
Cash at bank and in hand 3,730 1,762 422 1,087
14 Trade and other payablesGroup Company
2007 2006 2007 2006£’000 £’000 £’000 £’000
Trade payables 1,813 1,640 1,081 1,160
Amounts owed to group undertakings - - - 2,264
Other tax and social security payable 1,164 867 852 572
Other creditors 169 43 149 33
Accruals 5,398 5,177 1,091 487
8,544 7,727 3,173 4,516
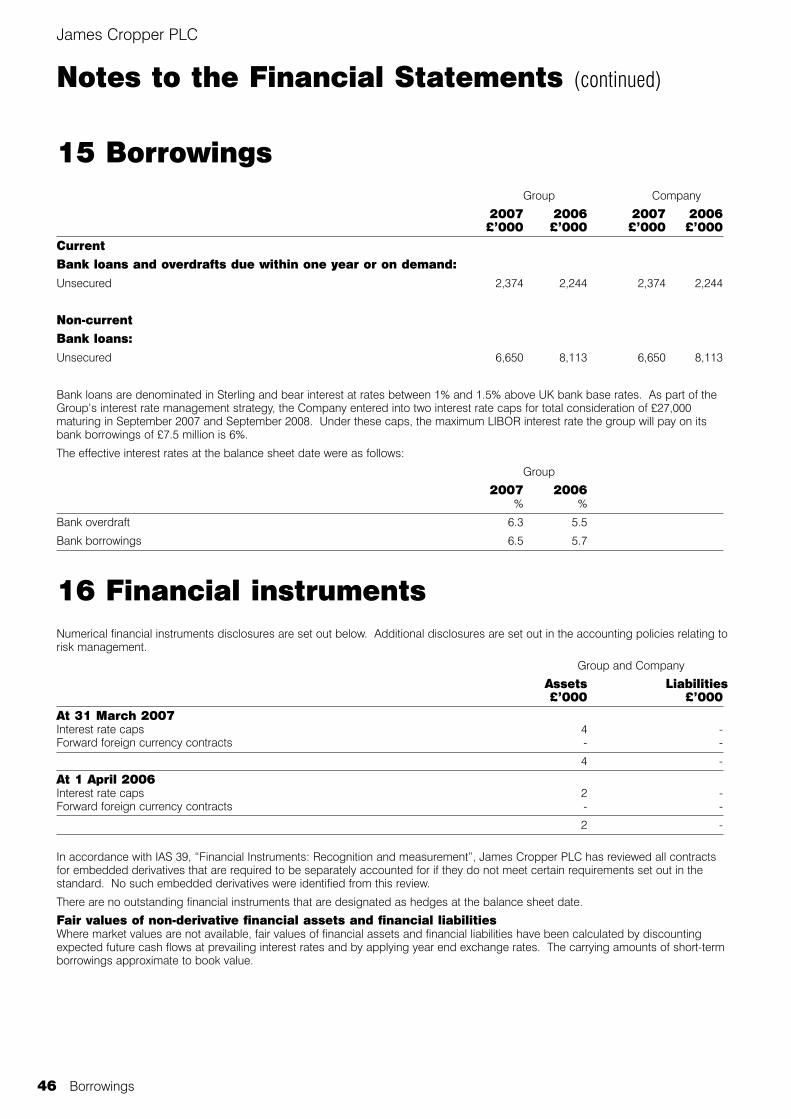
Notes to the Financial Statements (continued)
James Cropper PLC
46 Borrowings
15 BorrowingsGroup Company
2007 2006 2007 2006£’000 £’000 £’000 £’000
Current Bank loans and overdrafts due within one year or on demand:Unsecured 2,374 2,244 2,374 2,244
Non-currentBank loans:Unsecured 6,650 8,113 6,650 8,113
Bank loans are denominated in Sterling and bear interest at rates between 1% and 1.5% above UK bank base rates. As part of theGroup’s interest rate management strategy, the Company entered into two interest rate caps for total consideration of £27,000maturing in September 2007 and September 2008. Under these caps, the maximum LIBOR interest rate the group will pay on itsbank borrowings of £7.5 million is 6%.
The effective interest rates at the balance sheet date were as follows:
Group
2007 2006% %
Bank overdraft 6.3 5.5
Bank borrowings 6.5 5.7
16 Financial instrumentsNumerical financial instruments disclosures are set out below. Additional disclosures are set out in the accounting policies relating torisk management.
Group and Company
Assets Liabilities£’000 £’000
At 31 March 2007Interest rate caps 4 -Forward foreign currency contracts - -
4 -
At 1 April 2006Interest rate caps 2 -Forward foreign currency contracts - -
2 -
In accordance with IAS 39, “Financial Instruments: Recognition and measurement”, James Cropper PLC has reviewed all contractsfor embedded derivatives that are required to be separately accounted for if they do not meet certain requirements set out in thestandard. No such embedded derivatives were identified from this review.
There are no outstanding financial instruments that are designated as hedges at the balance sheet date.
Fair values of non-derivative financial assets and financial liabilitiesWhere market values are not available, fair values of financial assets and financial liabilities have been calculated by discountingexpected future cash flows at prevailing interest rates and by applying year end exchange rates. The carrying amounts of short-termborrowings approximate to book value.

Financial instruments 47
16 Financial instruments (continued)
Fair value of non-current borrowingsGroup Group2007 2006
Book Fair Book Fairvalue value value value£’000 £’000 £’000 £’000
Long term borrowings (note 15) (6,650) (6,650) (8,113) (8,113)
Fair value of other financial assets and financial liabilitiesShort term borrowings (note 15) (2,374) (2,374) (2,244) (2,244)
Trade and other payables (note 14) (8,544) (8,544) (7,727) (7,727)
Trade and other receivables (note 12) 14,462 14,462 13,399 13,399
Cash at bank and in hand (note 13) 3,730 3,730 1,762 1,762
The fair values are based on cash flows discounted using a rate based on borrowings of 6.5% (2006: 5.7%). The fair value of longterm borrowings approximates to the carrying value reported in the balance sheet as these are floating rates where payments arereset to market rates at intervals of less than one year, and the current rate is below the Group’s interest rate cap.
Maturity of financial liabilitiesThe maturity profile of the carrying amount of the Group’s non-current financial liabilities, at 31 March 2007, was as follows:
Other Otherfinancial 2007 financial 2006
Debt liabilities Total Debt liabilities Total£’000 £’000 £’000 £’000 £’000 £’000
In more than one year but not more than two years 2,182 - 2,182 2,194 - 2,194
In more than two years but not more than five years 4,111 - 4,111 4,991 - 4,991
In more than five years 357 - 357 928 - 928
6,650 - 6,650 8,113 - 8,113
Borrowing facilitiesThe Group has the following undrawn committed borrowing facilities available at 31 March 2007 in respect of which all conditionsprecedent had been met at that date:
Floating Fixed 2007 2006rate rate Total Total
£’000 £’000 £’000 £’000Expiring within one year 3,455 - 3,455 3,484
The facilities expiring within one year are annual facilities subject to review at various dates during 2007/08. All these facilities incurcommitment fees at market rates.

Notes to the Financial Statements (continued)
James Cropper PLC
48 Retirement benefits
17 Retirement benefitsThe Group operates a number of pension schemes. Two of these schemes, the James Cropper PLC Works Pension Plan (“WorksScheme”) and the James Cropper PLC Pension Scheme (“Staff Scheme”) are funded schemes of the defined benefit type. TheGroup also operates a defined contribution scheme and makes contributions to personal pension plans for its employees in the USA.
Pension costs for defined the contribution scheme and personal pension contributions are as follows:
Group2007 2006£’000 £’000
Defined contribution schemes 139 135
Personal pension contributions 9 10
Other pension costs totalled £144,000 (2006: £145,000) and represent life assurance charges and government pension protectionfund levies.
Defined benefit plansThe most recent actuarial valuations of the Staff Scheme and the Works Scheme have been updated to 31 March 2007 by qualifiedindependent actuaries. The major assumptions used by the actuary for each scheme were as noted below. The expected return onplan assets is calculated by using a weighted average across each category of asset:
Staff Scheme Works Scheme2007 2006 2007 2006
% % % %Rate of increase in pensionable salaries 4.2 4.0 4.2 4.0
Rate of increase of pensions in payment and deferred 3.2 3.0 3.2 3.0
Discount rate 5.4 5.0 5.4 5.0
Inflation assumption 3.2 3.0 3.2 3.0
Expected return on plan assets 6.3 6.2 6.4 6.3
In respect of mortality, PA92 series' tables, projected to 2010 for the Works Plan and 2020 for the Staff Scheme, have been used.
The amounts recognised in the balance sheet are determined as follows:
2007 2006 2005 2004 2003£’000 £’000 £’000 £’000 £’000
Present value of scheme liabilities (66,733) (66,007) (55,436) (51,855) (43,565)
Fair value of plan assets 60,581 55,692 44,729 38,080 30,634
Net liability recognised in the balance sheet (6,152) (10,315) (10,707) (13,775) (12,931)
The fair value of the plan assets comprises the following categories of asset in the stated proportions:
Staff Scheme Works Scheme2007 2006 2007 2006
% % % %Equities 59 57 68 71
Bonds 32 35 28 25
Property - - 1 1
Cash 3 1 3 3
Annuities 6 7 - -
The pension plan assets include investments in the shares of the Company with a fair value of £418,000 (2006: £368,000).

Retirement benefits 49
Defined benefit plans (continued)
The amounts recognised in the profit and loss account are as follows:
2007 2006£’000 £’000
Current service cost 1,598 1,392
Total included within employee benefit costs 1,598 1,392
Expected return on plan assets (3,492) (2,954)Interest on pension scheme liabilities 3,313 3,068
Total included within interest (179) 114
Total 1,419 1,506
Analysis of the movement in the balance sheet liability2007 2006£’000 £’000
At 2 April 2006 (10,315) (10,707)Total expense as above (1,419) (1,506)Contributions paid 1,826 1,942Actuarial gains/(losses) recognised in SORIE 3,756 (44)
At 31 March 2007 (6,152) (10,315)
The actual return on plan assets was £4,255,000 (2006: £9,740,000). The Company expects to pay £935,000 (2006: £895,000) incontributions to the Staff Scheme and £946,000 (2006: £971,000) in contributions to the Works Scheme in the next financial period.
The cumulative amount of gains/losses recognised in the SORIE since the adoption of IAS 19 is gains of £5,933,000 (2006: gains of£2,177,000).
Analysis of the movement in the defined benefit obligation (DBO) and scheme assets
Works scheme Staff schemeAssets DBO Assets DBO£’000 £’000 £’000 £’000
At 2 April 2006 28,596 (35,392) 27,096 (30,615)Expected return on assets 1,808 - 1,684 -Current service cost - (944) - (654)Benefits paid (1,110) 1,110 (793) 793Contributions by plan participants 416 (416) 295 (295)Employer contributions 918 - 908 -Interest cost - (1,778) - (1,535)Actuarial (losses)/gains (67) 1,990 830 1,003
At 31 March 2007 30,561 (35,430) 30,020 (31,303)
Experience adjustments2007 2006 2005 2004 2003£’000 £’000 £’000 £’000 £’000
Arising on plan assets 763 6,786 2,253 5,035 (10,445)Percentage of scheme assets 1.3% 12.2% 5.0% 13.0% (34.0%)
Arising on plan liabilities (204) 1,983 (32) (1,458) 684Percentage of scheme liabilities (0.3%) 3.0% (0.1%) (3.0%) 2.0%
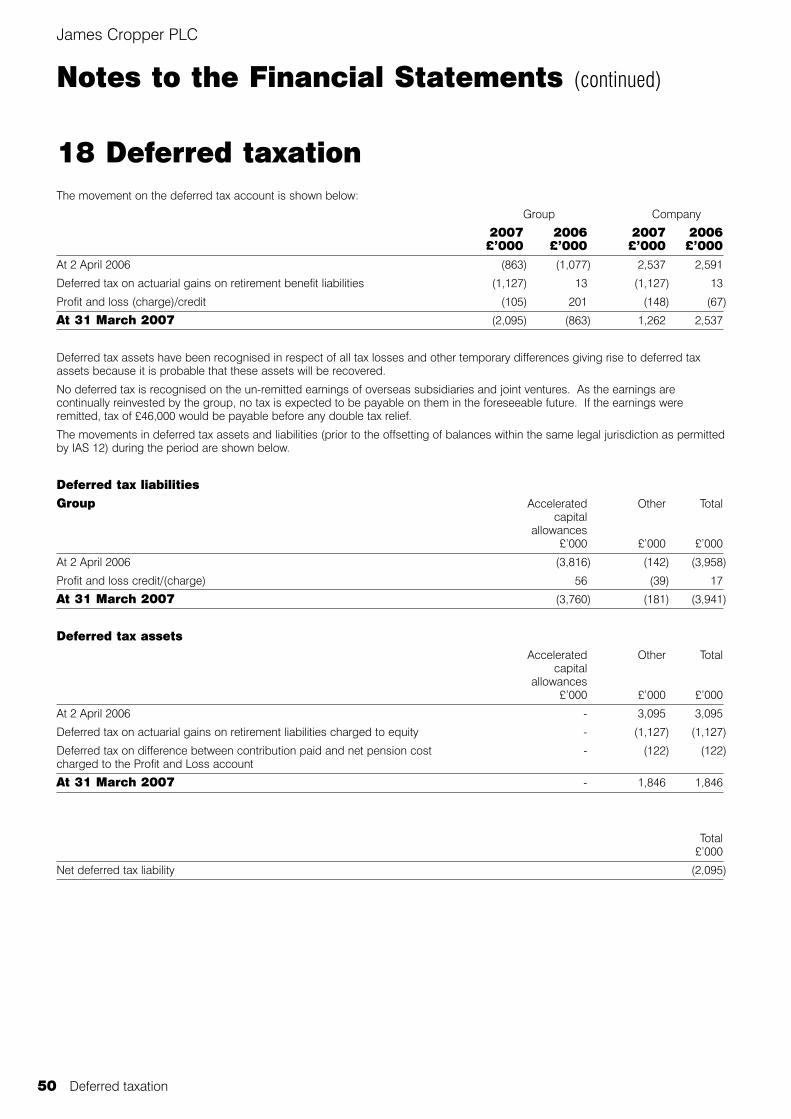
Notes to the Financial Statements (continued)
James Cropper PLC
50 Deferred taxation
18 Deferred taxationThe movement on the deferred tax account is shown below:
Group Company
2007 2006 2007 2006£’000 £’000 £’000 £’000
At 2 April 2006 (863) (1,077) 2,537 2,591
Deferred tax on actuarial gains on retirement benefit liabilities (1,127) 13 (1,127) 13
Profit and loss (charge)/credit (105) 201 (148) (67)
At 31 March 2007 (2,095) (863) 1,262 2,537
Deferred tax assets have been recognised in respect of all tax losses and other temporary differences giving rise to deferred taxassets because it is probable that these assets will be recovered.
No deferred tax is recognised on the un-remitted earnings of overseas subsidiaries and joint ventures. As the earnings arecontinually reinvested by the group, no tax is expected to be payable on them in the foreseeable future. If the earnings wereremitted, tax of £46,000 would be payable before any double tax relief.
The movements in deferred tax assets and liabilities (prior to the offsetting of balances within the same legal jurisdiction as permittedby IAS 12) during the period are shown below.
Deferred tax liabilitiesGroup Accelerated Other Total
capitalallowances
£’000 £’000 £’000
At 2 April 2006 (3,816) (142) (3,958)
Profit and loss credit/(charge) 56 (39) 17
At 31 March 2007 (3,760) (181) (3,941)
Deferred tax assetsAccelerated Other Total
capitalallowances
£’000 £’000 £’000
At 2 April 2006 - 3,095 3,095
Deferred tax on actuarial gains on retirement liabilities charged to equity - (1,127) (1,127)
Deferred tax on difference between contribution paid and net pension cost - (122) (122)charged to the Profit and Loss account
At 31 March 2007 - 1,846 1,846
Total£’000
Net deferred tax liability (2,095)
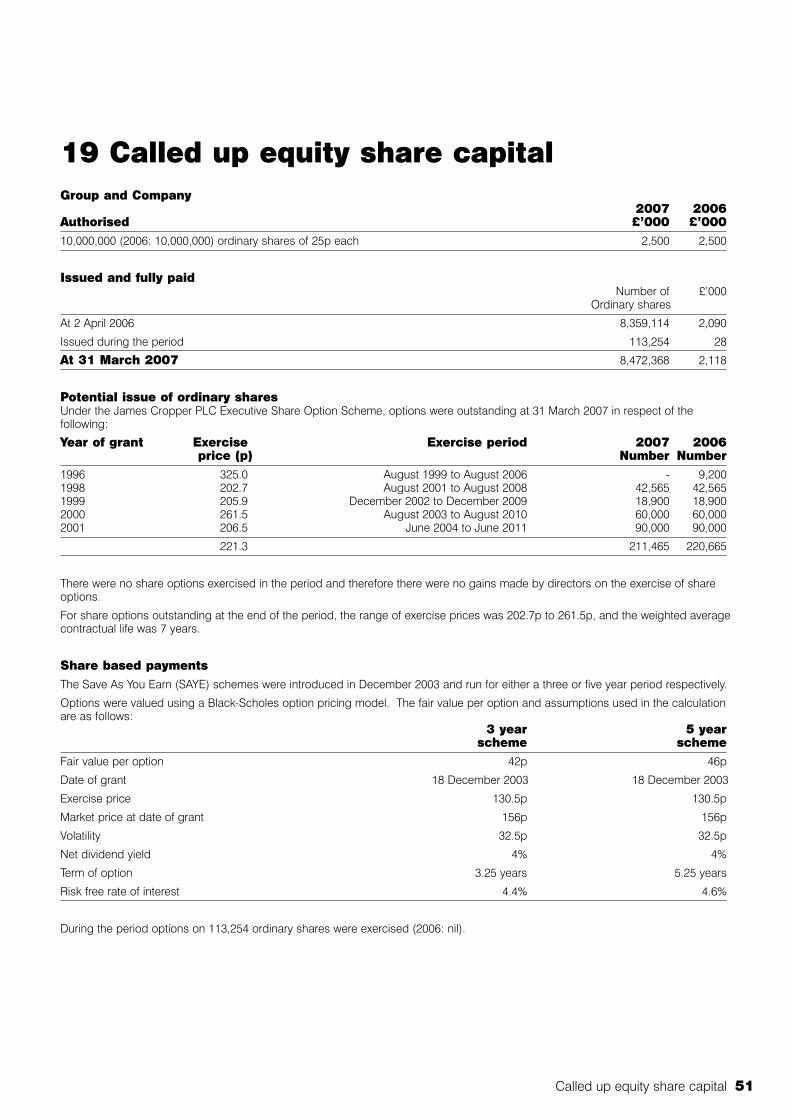
Called up equity share capital 51
19 Called up equity share capitalGroup and Company
2007 2006Authorised £’000 £’00010,000,000 (2006: 10,000,000) ordinary shares of 25p each 2,500 2,500
Issued and fully paidNumber of £’000
Ordinary shares
At 2 April 2006 8,359,114 2,090
Issued during the period 113,254 28
At 31 March 2007 8,472,368 2,118
Potential issue of ordinary sharesUnder the James Cropper PLC Executive Share Option Scheme, options were outstanding at 31 March 2007 in respect of thefollowing:
Year of grant Exercise Exercise period 2007 2006price (p) Number Number
1996 325.0 August 1999 to August 2006 - 9,2001998 202.7 August 2001 to August 2008 42,565 42,5651999 205.9 December 2002 to December 2009 18,900 18,9002000 261.5 August 2003 to August 2010 60,000 60,0002001 206.5 June 2004 to June 2011 90,000 90,000
221.3 211,465 220,665
There were no share options exercised in the period and therefore there were no gains made by directors on the exercise of shareoptions.
For share options outstanding at the end of the period, the range of exercise prices was 202.7p to 261.5p, and the weighted averagecontractual life was 7 years.
Share based paymentsThe Save As You Earn (SAYE) schemes were introduced in December 2003 and run for either a three or five year period respectively.
Options were valued using a Black-Scholes option pricing model. The fair value per option and assumptions used in the calculationare as follows:
3 year 5 year scheme scheme
Fair value per option 42p 46p
Date of grant 18 December 2003 18 December 2003
Exercise price 130.5p 130.5p
Market price at date of grant 156p 156p
Volatility 32.5p 32.5p
Net dividend yield 4% 4%
Term of option 3.25 years 5.25 years
Risk free rate of interest 4.4% 4.6%
During the period options on 113,254 ordinary shares were exercised (2006: nil).
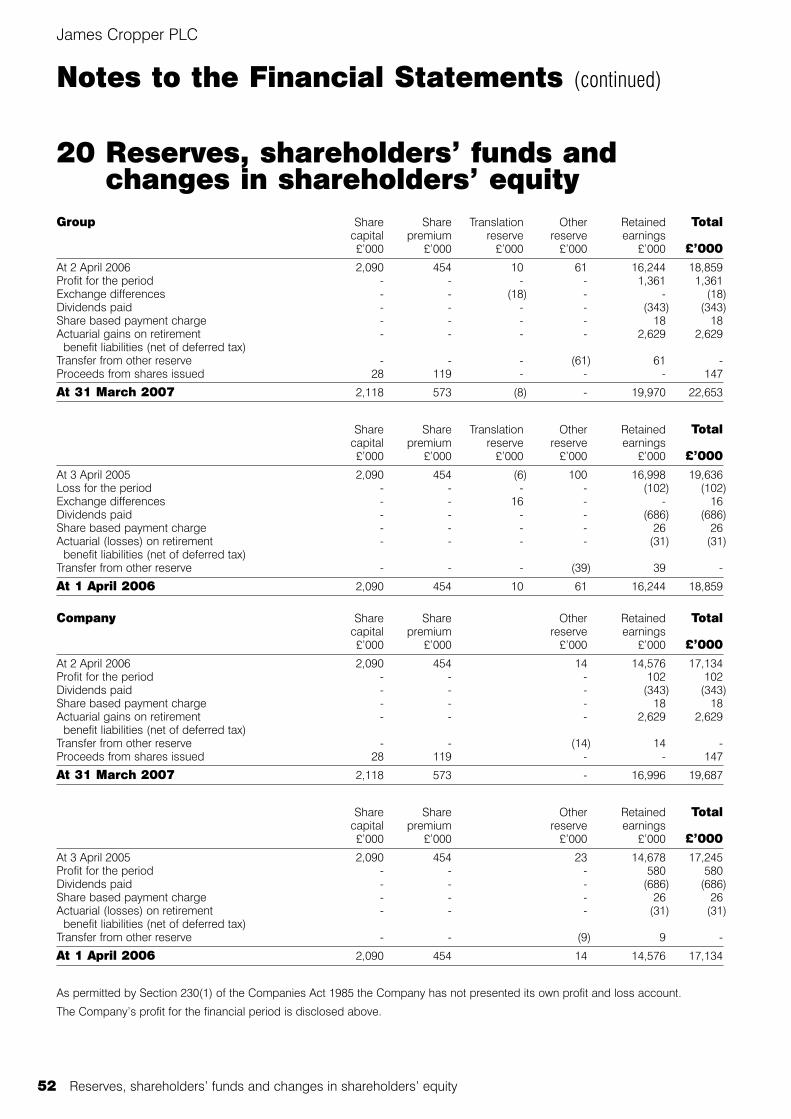
Notes to the Financial Statements (continued)
James Cropper PLC
52 Reserves, shareholders’ funds and changes in shareholders’ equity
20 Reserves, shareholders’ funds andchanges in shareholders’ equity
Group Share Share Translation Other Retained Totalcapital premium reserve reserve earnings£’000 £’000 £’000 £’000 £’000 £’000
At 2 April 2006 2,090 454 10 61 16,244 18,859Profit for the period - - - - 1,361 1,361Exchange differences - - (18) - - (18)Dividends paid - - - - (343) (343)Share based payment charge - - - - 18 18Actuarial gains on retirement - - - - 2,629 2,629
benefit liabilities (net of deferred tax)Transfer from other reserve - - - (61) 61 -Proceeds from shares issued 28 119 - - - 147
At 31 March 2007 2,118 573 (8) - 19,970 22,653
Share Share Translation Other Retained Totalcapital premium reserve reserve earnings£’000 £’000 £’000 £’000 £’000 £’000
At 3 April 2005 2,090 454 (6) 100 16,998 19,636Loss for the period - - - - (102) (102)Exchange differences - - 16 - - 16Dividends paid - - - - (686) (686)Share based payment charge - - - - 26 26Actuarial (losses) on retirement - - - - (31) (31)
benefit liabilities (net of deferred tax)Transfer from other reserve - - - (39) 39 -
At 1 April 2006 2,090 454 10 61 16,244 18,859
Company Share Share Other Retained Totalcapital premium reserve earnings£’000 £’000 £’000 £’000 £’000
At 2 April 2006 2,090 454 14 14,576 17,134Profit for the period - - - 102 102Dividends paid - - - (343) (343)Share based payment charge - - - 18 18Actuarial gains on retirement - - - 2,629 2,629
benefit liabilities (net of deferred tax)Transfer from other reserve - - (14) 14 -Proceeds from shares issued 28 119 - - 147
At 31 March 2007 2,118 573 - 16,996 19,687
Share Share Other Retained Totalcapital premium reserve earnings£’000 £’000 £’000 £’000 £’000
At 3 April 2005 2,090 454 23 14,678 17,245Profit for the period - - - 580 580Dividends paid - - - (686) (686)Share based payment charge - - - 26 26Actuarial (losses) on retirement - - - (31) (31)
benefit liabilities (net of deferred tax)Transfer from other reserve - - (9) 9 -
At 1 April 2006 2,090 454 14 14,576 17,134
As permitted by Section 230(1) of the Companies Act 1985 the Company has not presented its own profit and loss account.
The Company’s profit for the financial period is disclosed above.

Cash flow from operating activities 53
21 Cash flow from operating activitiesReconciliation of net profit/(loss) to net cash generated from operating activities:
Group Company2007 2006 2007 2006
Continuing operations £’000 £’000 £’000 £’000Net profit/(loss) 1,361 (102) 102 580
Adjustments for:Tax 746 (27) (23) 20Interest income and expense 259 625 (1,024) (847)Depreciation/amortisation 3,315 3,715 424 355Share of loss of joint venture 95 89 - -Profit on sale of trade investment - (116) - (116)Dividends from subsidiary companies - - (850) -Past service deficit payments (838) (914) (838) (914)Net IFRS pension adjustments 431 478 431 478Profit on disposal of property, plant and equipment (39) - - -Share based payments 17 25 17 25Changes in working capital:Increase in inventories (99) (604) - -(Increase)/decrease in trade and other receivables (1,100) (233) 2,304 (2,048)Increase/(decrease) in payables 806 940 (1,367) 2,860
Cash generated from/(used by) operating activities 4,954 3,876 (824) 393
22 Employees and directorsStaff costs for the group during the period
2007 2006£’000 £’000
Wages and salaries 14,422 14,292
Social security costs 1,244 1,245
Pension costs (note 17) 1,890 1,682
17,556 17,219
Own labour capitalised (287) (313)
17,269 16,906
The average monthly number of people (including executive directors) employed in the Group was 605 (2006: 613).
The average monthly number of people (including executive directors) employed in the Company was 57 (2006:60).
Key management compensation 2007 2006£’000 £’000
Salaries and short term benefits 800 703
Post-employment benefits 111 109
Share based payments 1 1
912 813

Notes to the Financial Statements (continued)
James Cropper PLC
54 Commitments under operating leases
23 Commitments under operating leases2007 2006
Group Property Plant and Property Plant andmachinery machinery
£’000 £’000 £’000 £’000Commitments under non-cancellable operating leases:Within one year - 2 34 2
Later than one year and less than five years 1,257 569 1,221 628
After five years 4,545 1,820 5,002 -
5,802 2,391 6,257 630
2007 2006Company Property Plant and Property Plant and
machinery machinery£’000 £’000 £’000 £’000
Commitments under non-cancellable operating leases expiring:Later than one year and less than five years - 438 - 415
Contingent rent payments are determined on the basis of turnover.
24 Capital commitmentsGroup Company
2007 2006 2007 2006£’000 £’000 £’000 £’000
Contracts placed for future capital expenditure not 557 589 14 57provided in the financial statements
25 Contingent liabilitiesThere were no contingent liabilities at the period end. The Company is included in a cross guarantee between itself and itssubsidiaries.

Related party transactions 55
26 Related party transactionsGroupThe Group has taken advantage of the exemption not to disclose intra-group transactions that are eliminated on consolidation.
The Group also has the following transactions with related parties that are not eliminated on consolidation:
2007Sales Purchases Receivable Payable£’000 £’000 £’000 £’000
Electro Fiber Technologies Inc. - 105 - 5
2006Sales Purchases Receivable Payable£’000 £’000 £’000 £’000
Electro Fiber Technologies Inc. - 103 - 4Pacofa SA 120 - 21 -
120 103 21 4
CompanyThe Company pays £35,000 (2006: £35,000) annually to Mr J A Cropper for the use of reservoirs to supply water to the factorypremises.
The contract is based on a twenty year repairing lease with rent reviews every five years. The rent is negotiated through independentadvisers representing each party.
The Company also has the following transactions with related entities:2007
Sales Manage- Receiv- Loans ment able and net
charges Inter-Company
funding£’000 £’000 £’000 £’000
James Cropper Speciality Papers Limited 45,161 3,829 858 16,000The Paper Mill Shop Company Limited 53 133 49 -James Cropper Converting Limited 13,387 589 34 6,000Technical Fibre Products Limited 339 606 121 3,000
58,940 5,157 1,062 25,000
2006Sales Manage- Receiv- Loans
ment able and netcharges Inter-
Companyfunding
£’000 £’000 £’000 £’000James Cropper Speciality Papers Limited 34,335 3,369 2,817 12,654The Paper Mill Shop Company Limited 573 148 140 50James Cropper Converting Limited 8,040 697 747 5,082Technical Fibre Products Limited 152 628 147 3,555
43,100 4,842 3,851 21,341
27 Post balance sheet eventsOn 21 March 2007 the 2007 Budget was announced by the Chancellor of the Exchequer. One of the changes stated was that the rateof UK Corporation Tax will be reduced from 30% to 28% with effect from 1 April 2008. As the changes were not substantively enactedas at 31 March 2007 the changes are treated as non adjusting post balance sheet events. The effect of the changes on the financialstatements would be that the deferred tax balance for the group would be changed to £1,955,000 from £2,095,000 for 2007 and to£805,000 from £863,000 for 2006. The deferred tax balance for the company would be changed to £1,177,000 from £1,262,000 for2007 and £2,368,000 from £2,537,000 for 2006. This does not include the impact of the withdrawal of Industrial Building Allowancesanticipated in 2011.
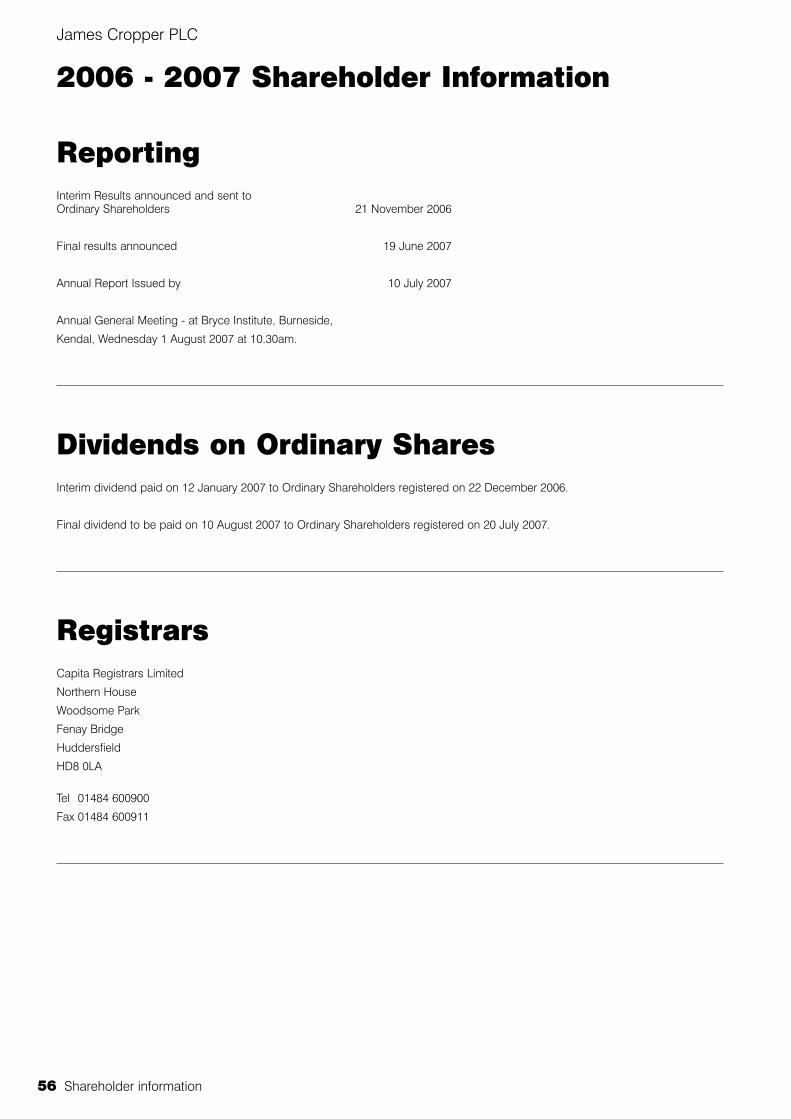
2006 - 2007 Shareholder Information
James Cropper PLC
56 Shareholder information
ReportingInterim Results announced and sent to Ordinary Shareholders 21 November 2006
Final results announced 19 June 2007
Annual Report Issued by 10 July 2007
Annual General Meeting - at Bryce Institute, Burneside,
Kendal, Wednesday 1 August 2007 at 10.30am.
Dividends on Ordinary SharesInterim dividend paid on 12 January 2007 to Ordinary Shareholders registered on 22 December 2006.
Final dividend to be paid on 10 August 2007 to Ordinary Shareholders registered on 20 July 2007.
RegistrarsCapita Registrars Limited
Northern House
Woodsome Park
Fenay Bridge
Huddersfield
HD8 0LA
Tel 01484 600900
Fax 01484 600911

Notice of Annual General Meeting
Notice of Annual General Meeting 57
Notice is hereby given that the one hundred and eighteenthannual general meeting of James Cropper PLC (the “Company”)will be held at the Bryce Institute, Burneside, Kendal, Cumbria at10.30am on Wednesday 1 August 2007 to consider and, ifthought fit, pass the following resolutions, of which resolutions 12and 13 are to be proposed as special resolutions of theCompany: -
1. To receive and consider the statement of accounts andreports of the directors and the auditors for the 52 weeksended 31 March 2007.
2. To declare a final dividend.
3. To re-elect Mr G. T. Quayle as a director of the Company.
4. To re-elect Mr D. R. Wilks as a director of the Company.
5. To re-elect Mr P. L. Herring as a director of the Company.
6. To re-elect Mr J. R. Sclater as a director of the Company.
7. To confirm the appointment of Mr M. A. J. Cropper as adirector of the Company, having been appointed duringthe course of the year.
8. Special notice having been given, to appoint KPMG AuditPlc as auditors of the Company to hold office from theconclusion of the meeting until the next Annual GeneralMeeting.
9. To authorise the directors to agree the remuneration of theauditors of the Company.
10. To consider and approve the directors’ remuneration reportfor the 52 weeks ended 31 March 2007.
11. That the directors be authorised for the purpose of section80 of the Companies Act 1985 (the “Act”) to allot relevantsecurities (within the meaning of section 80(2) of the Act)up to an aggregate nominal amount of £381,908 providedthat: -
(a) except as provided in paragraph (b) below thisauthority shall expire at the conclusion of the nextAnnual General Meeting of the Company after thepassing of this resolution or 15 months from the dateof this resolution (whichever is the earlier), but may bepreviously revoked or varied by an ordinary resolutionof the Company; and
(b) the Company may before such expiry make an offeror agreement which would or might require relevantsecurities to be allotted after such expiry and thedirectors may allot relevant securities in pursuance ofsuch offer or agreement notwithstanding that theauthority conferred by this resolution has expired.
12. That subject to the passing of and pursuant to the generalauthority conferred by the resolution numbered 11 in thenotice convening this meeting the directors be empoweredpursuant to Section 95 of the Companies Act 1985 (the“Act”) to allot equity securities (as defined in section 94 ofthe Act) or where the equity securities are held by theCompany as qualifying shares (to which sections 162A to162 G of the Act apply), in each case as if section 89(1) ofthe Act did not apply to any such allotment, provided thatthis power shall be limited to:-
(a) the allotment of equity securities in connection withany rights or other pre-emptive issue in favour of theordinary shareholders where the equity securitiesrespectively attributable to the interests of all ordinaryshareholders are proportionate (as nearly as may be)to the respective number of ordinary shares held bythem on a fixed record date (but subject to suchexclusions or other arrangements as the directorsmay deem necessary or expedient in relation tofractional entitlements or any legal or practicalproblems under the laws of any territory or therequirements of any regulatory body or stockexchange in any territory or any other matterwhatsoever); and
(b) otherwise than pursuant to paragraph (a) of thisresolution, the allotment of equity securities up to anaggregate nominal amount of £105,905 and shallexpire on the conclusion of the next Annual GeneralMeeting of the Company after the passing of thisresolution or 15 months from the date of thisresolution (whichever is earlier) except that theCompany may before such expiry make an offer oragreement which would or might require equitysecurities to be allotted after such expiry and thedirectors may allot equity securities in pursuance ofany such offer or agreement as if the power conferredby this resolution had not expired.
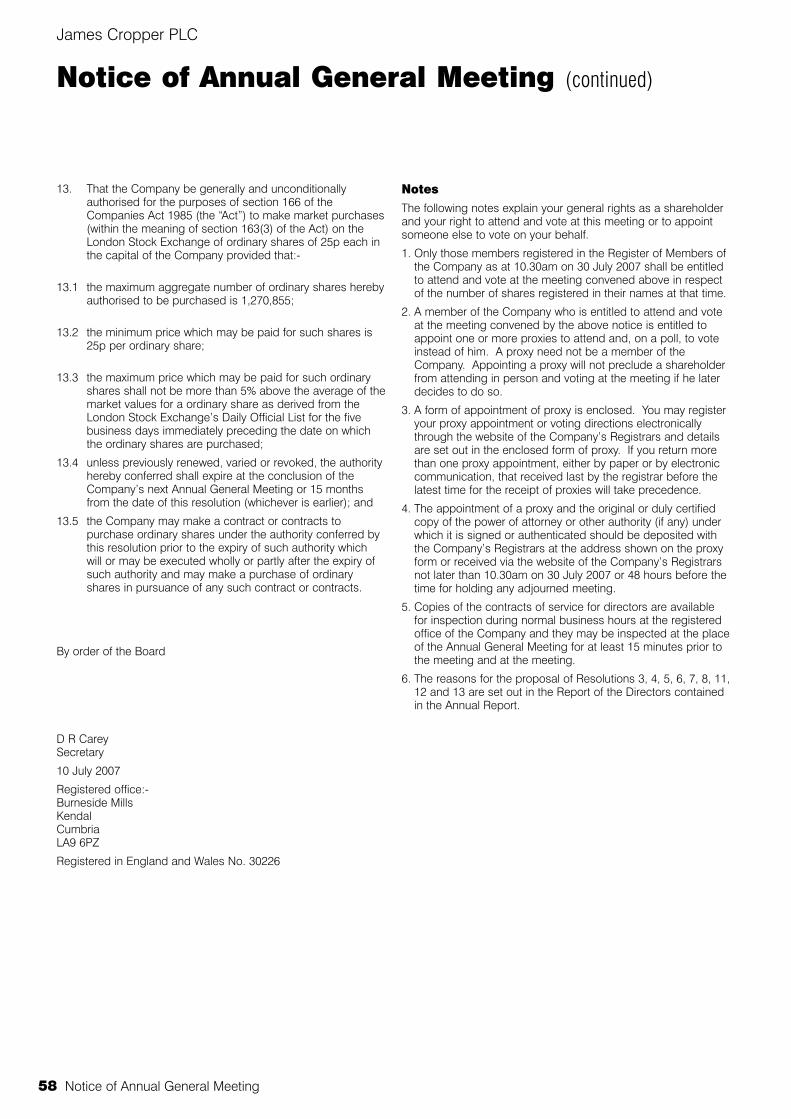
13. That the Company be generally and unconditionallyauthorised for the purposes of section 166 of theCompanies Act 1985 (the “Act”) to make market purchases(within the meaning of section 163(3) of the Act) on theLondon Stock Exchange of ordinary shares of 25p each inthe capital of the Company provided that:-
13.1 the maximum aggregate number of ordinary shares herebyauthorised to be purchased is 1,270,855;
13.2 the minimum price which may be paid for such shares is25p per ordinary share;
13.3 the maximum price which may be paid for such ordinaryshares shall not be more than 5% above the average of themarket values for a ordinary share as derived from theLondon Stock Exchange’s Daily Official List for the fivebusiness days immediately preceding the date on whichthe ordinary shares are purchased;
13.4 unless previously renewed, varied or revoked, the authorityhereby conferred shall expire at the conclusion of theCompany’s next Annual General Meeting or 15 monthsfrom the date of this resolution (whichever is earlier); and
13.5 the Company may make a contract or contracts topurchase ordinary shares under the authority conferred bythis resolution prior to the expiry of such authority whichwill or may be executed wholly or partly after the expiry ofsuch authority and may make a purchase of ordinaryshares in pursuance of any such contract or contracts.
By order of the Board
D R CareySecretary
10 July 2007
Registered office:-Burneside MillsKendalCumbriaLA9 6PZ
Registered in England and Wales No. 30226
NotesThe following notes explain your general rights as a shareholderand your right to attend and vote at this meeting or to appointsomeone else to vote on your behalf.
1. Only those members registered in the Register of Members ofthe Company as at 10.30am on 30 July 2007 shall be entitledto attend and vote at the meeting convened above in respectof the number of shares registered in their names at that time.
2. A member of the Company who is entitled to attend and voteat the meeting convened by the above notice is entitled toappoint one or more proxies to attend and, on a poll, to voteinstead of him. A proxy need not be a member of theCompany. Appointing a proxy will not preclude a shareholderfrom attending in person and voting at the meeting if he laterdecides to do so.
3. A form of appointment of proxy is enclosed. You may registeryour proxy appointment or voting directions electronicallythrough the website of the Company’s Registrars and detailsare set out in the enclosed form of proxy. If you return morethan one proxy appointment, either by paper or by electroniccommunication, that received last by the registrar before thelatest time for the receipt of proxies will take precedence.
4. The appointment of a proxy and the original or duly certifiedcopy of the power of attorney or other authority (if any) underwhich it is signed or authenticated should be deposited withthe Company’s Registrars at the address shown on the proxyform or received via the website of the Company’s Registrarsnot later than 10.30am on 30 July 2007 or 48 hours before thetime for holding any adjourned meeting.
5. Copies of the contracts of service for directors are availablefor inspection during normal business hours at the registeredoffice of the Company and they may be inspected at the placeof the Annual General Meeting for at least 15 minutes prior tothe meeting and at the meeting.
6. The reasons for the proposal of Resolutions 3, 4, 5, 6, 7, 8, 11,12 and 13 are set out in the Report of the Directors containedin the Annual Report.
Notice of Annual General Meeting (continued)
James Cropper PLC
58 Notice of Annual General Meeting

The Report
James Cropper PLC
Paper
All the paper used in this report has been produced byJames Cropper PLC
Cover Zen Pure White 300gsm
Inset Accent Glacier White 160gsm
Available from UK paper merchants GFSmith & Son (London) Limited
Production
Printed by Dixons Printing Company Ltd
Design and artwork by rj.design
James Cropper PLC
Burneside Mills
Kendal
Cumbria
England
LA9 6PZ
Tel +44 (0)1539 722002
Fax +44 (0)1539 818239
www.cropper.com