Annual Report 2005 -...
80
Annual Report 2005
Transcript of Annual Report 2005 -...

Annual Report
2005

Number of Plants: 46 49 95
Number of Distribution Centers: 264 282 546
Number of Employees: 33,000 33,900 66,900
Percentage of Volume: 61% 39% 100%
U.S. Outside the U.S. Total
The Pepsi Bottling Group, Inc. is the world’s largest manufacturer, seller and distributor of carbonated and non-carbonated Pepsi-Cola beverages.
Trademark Mountain Dew
Trademark Pepsi
Aquafina
Other PepsiCo brands
Dr Pepper
Sierra MistOther Non-PepsiCo brandsLiptonSoBeTropicanaFrappuccino
Aqua Minerale
Other Non-PepsiCo brandsLipton
MirindaIVIFiestaFrukoYedigunTamek
Trademark Pepsi7Up
KAS
AquafinaTropicana
Other PepsiCo brands
Mexico Brand Mix*Trademark Pepsi
U.S. / Canada Brand Mix*
Europe Brand Mix*
7UpMirindaManzanita Sol
Squirt
Garci CrespoOther PepsiCo brandsOther Non-PepsiCo brands
Electropura
*Percent of total 2005 regional volume
PBG S&P 500
1
$ in millions, except per share data 2005 2004 2003
Net Revenues: $11,885 $10,906 $10,265
Operating Income: $ 1,023 $ 976 $ 956
Diluted EPS: $ 1.86 $ 1.73 $ 1.50
Pro Forma Diluted EPS:1 $ 1.86 $ 1.73 $ 1.56
Net Cash Provided by Operations: $ 1,219 $ 1,222 $ 1,075
Capital Expenditures: $ (715 $ (688 $ (635
Net Cash Provided by Operations,
less Capital Expenditures: $ 504 $ 534 $ 440
Fiscal year 2003 Diluted EPS of $1.50 was adjusted by adding $0.04 for the impact of a Canadian tax law change and $0.02 for the cumulativeeffect of change in accounting principle (impact of adoption of EITF 02-16). For additional information on the impact of EITF Issue No. 02-16,see page 57. For additional information on the Canadian tax law change, see page 68.
1
)) )
Chairman’s LetterPage 2
Full Speed AheadPage 4
Board of DirectorsPage 14
Corporate OfficersPage 15
Glossary of TermsPage 16
Form 10-KPage 17
Pro Forma Diluted Earnings Per Share$2.00
$1.75
$1.50
$1.25
$1.00
$0.75
$0.50
$0.25
$0.00 2005
$1.86$1.73
$1.56
20042003
Stock Price Performance
95
100
110
4th Qtr 2004
The performance graph above compares the cumulative total return of PBG’s common stock to the S&P Stock Index on a calendar quarter basis.*
*
105
4th Qtr 20051st Qtr 2005 2nd Qtr 2005 3rd Qtr 2005

Dear PBG Shareholders,At PBG, speed is essential. It’s embedded in our values. It’s integral to our culture. Itcomes from understanding that every daypresents hundreds of thousands of chancesto win a new customer or satisfy an exist-ing customer. And PBG people know thoseopportunities become wins for the supplierwho moves the fastest – to exceed cus-tomer and consumer desires. “Full speedahead” describes our approach to achievingour short-term goals and to developing ourlong-range plans.
In 2005, our business improved by everyfinancial measure – a testament to ouremployees’ ability to focus and move forward. Although we faced significant costincreases in raw materials and fuel thatexerted pressure on our bottom line, westill delivered strong results. We believethat our ability to do so is evidence of ourstrength, our skill and our speed – anunbeatable combination in the marketplaceand in our workplace.
2 3
The Numbers: We Delivered in 2005• Topline growth was well-balancedbetween volume and net revenue per caseacross all our major territories
• Adjusted operating profit growth was four percent*
• Operating free cash flow (net cash provided by operations less capital spend-ing) was $504 million
• More than $550 million was returned toshareholders through dividends and sharere-purchases
• Stock price growth was six percent – double the performance of the S&P 500
Topline Growth – a True Balancing ActIn 2005, both our constant territory volumeand reported net revenue per case grew a healthy four percent worldwide. TheUnited States made a great showing anddelivered two percent volume gains andthree percent net revenue per case gains.
In 2005, we were everywhere consumerswere. Again this year we capitalized onconsumer interest in health and wellness,with a great variety of low and no-calorieentries. Our Diet CSD portfolio was upthree percent at year end, and TrademarkAquafina saw gains of more than 30 percent, helped by the addition of AquafinaFlavorSplash. Other non-carbonated beverages were up nine percent, and our Lipton trademark performed extremely
well with a product platform that incorpo-rates premium, popular and value products.In the energy category we posted double-digit gains. And we continued to capitalizeon the shift to flavored CSDs with our popular Tropicana Twister line. Our packageofferings addressed portion sizes, portabil-ity and varying price points. We rolled out a 12-ounce bottled multipack Fridgemate for both Aquafina and CSDs and we alsolaunched half-liter 12 packs for non-carbs.
While consumers still do most of theirshopping for beverages in foodstores, their“on the go” lifestyles dictate that they shopin many other locations as well, and we’removing with them – in club stores andmass merchandisers, in dollar stores and in foodservice. In 2005, we made gainsacross the board in these growth channels.
In Canada, we posted our most balancedtopline growth in the past five years. Wegrew our cold drink business by more thantwo percent, fueled by innovation in bothproducts and promotions. And we built onour share leadership with our three corebrands – Pepsi, Diet Pepsi and 7UP.
In Mexico, our volume grew five percent,lifted by our water business, which showedvery strong growth. Jug water was up 11 percent, helped in part by the addition of home delivery, and our bottled water,EPura, continued to attract consumers withits new brand and positioning, and was up 13 percent at year end. In Mexico City,we faced increased competitive activityfrom low-cost flavor brands. As the yeardrew to a close, we took a number of pricing and package-size actions to
enable us to regain our footing. We sell 75 percent of our carbonated soft drinksoutside of the metropolitan area of MexicoCity, and that part of our business grew two percent. Overall in Mexico, our CSDgrowth was down one percent on a physical case basis, up one percent on an eight-ounce basis.
Europe turned in strong overall toplineresults. In Spain, we had challenges from a soft pricing environment and heightenedcompetitive activity in major retailers.These factors led to profit erosion in thatcountry. This was mitigated by solid performances in Russia and Turkey, which generated growth by focusing on the Pepsitrademark and our non-carb portfolio. Inthose countries, we spent considerabletime and energy ensuring that our “go tomarket” approach was at its most effective.In Russia, we converted more routes todirect store delivery, and in Turkey, we continued to consolidate third-party distributors and migrate selling activities to our own employees. These changes are enabling us to have more control of the point of sale and to provide better customer service.
Investing for GrowthIn 2005, we concentrated $48 million ofstrategic investments on key productivityinitiatives, including restructuring in Europe,I/T enhancements, and the most importantarea – the launch and rollout of our newservice initiative, Customer Connect. Thiseffort is designed to address our customers’most pressing issues – by minimizing out of stocks, providing service as scheduled,
improving weekend service and ensuringquick resolution of any issues that mayarise. Customer Connect involves new technologies and new processes that willstrengthen the impact of our customer service across the business in the U.S. and Canada.
We were honored in April when we received recognition from our largest customer, Wal-Mart. They chose us as“Bottler of the Year” from among all thedistributors of soft drinks, water, beer, wine,liquor and other beverage categories thatserve their business. We expect thatCustomer Connect will help us strengthenour partnerships and service levels with all our customers, and look forward tobringing its full power to bear in 2006.
Continued Emphasis on DiversityWe continue to focus on the multi-culturalmarkets in PBG and the best way to ensurethat our products, promotions and serviceresonate with different audiences.Borrowing on the significant equity we’vebuilt with Manzanita Sol, Pepsi’s apple-flavored carbonated soft drink in Mexico, in September, we introduced the product to all of our U.S. markets with significantLatino populations. This is a good exampleof our ongoing work to appeal to an important and growing segment of the U.S. population.
We also emphasize the importance ofstaffing with diversity across our organiza-tion, from the Board of Directors to thefrontline, and we continue to makeprogress. In 2005, we received recognitionfrom two important publications, Black
Enterprise and Diversity Inc., acknowledg-ing our efforts and our results. Diversity Inc.ranked PBG 14th among the top 50 companies in the U.S. for diversity, andBlack Enterprise chose PBG as one of the30 best companies for diversity in its inaugural listing.
A New Chief Operating OfficerEric Foss, who has been in the Pepsi system for more than 20 years, assumedthe position of Chief Operating Officer,adding corporate strategy, worldwide manufacturing operations and informationtechnology to his ongoing responsibility for our businesses in the U.S. and Canada.Eric is a great partner for me and a big reason for PBG’s continuing success.
The Future is BrightIn 2006, we are poised for another strongyear. We expect to begin realizing the benefits of our investments in CustomerConnect in the U.S. and Canada. We alsoplan to continue improvements in our go-to-market restructuring and cost productivityefforts in Europe. We will move forwardwith the actions we are taking in MexicoCity to make us more competitive. At PBG,a bias toward action is built into our DNA.We intend to move – full speed ahead –as always, to capitalize on the advantagesof our category, our capability and our commitment to deliver another year of outstanding results for our shareholders, for our customers and for all our employees.
John T. CahillChairman of the Board andChief Executive Officer
*See non-GAAP measurements and adjusted results in Items That Affect Historical or Future Comparability on page 32.

t the core of PBG’s business are the products wesell – some of the world’s best-known brands thatspan virtually every liquid refreshment beveragecategory. Pepsi-Cola, a household name and still our biggest seller, is the kingpin of an ever-expanding family of favorites. Sierra Mist celebrated its third birthday in 2005 as our national lemon-lime soda, and Mountain Dewremained the favorite “neon” with a commanding
Near right: Aquafina is the leading national bottled water in the U.S., growing more than 30 percent in 2005.
Far right: With its big, established trademark, the line of Tropicana juice drinks has been a strong player for PBG in this fast-growing category.
4 5
Bulk Driver Sonny Armijo putsMountain Dew in its place amongour core brands in this super-market beverage aisle. OriginalMountain Dew gained momentumin 2005, with Diet Dew growing at more than eight percent for the year.
lead across channels. Internationally, our carbon-ated portfolio includes 7Up, KAS and Mirinda,along with numerous regional favorites.
PBG’s non-carbonated brand mix is rich and bringsus a great marketplace advantage. In the U.S., weboast the leading national bottled water brand,Aquafina, while in Russia, our Aqua Mineralewater is a powerhouse brand and a strong growthengine. In Mexico, we sell the leading jug water,Electropura, along with EPura bottled water.Tropicana juice drinks, in year two as part of thePepsi family, have added one of the most recog-nized and trusted trademarks to our lineup. Ourbottled Lipton teas are top sellers in the U.S., andlead their category in Russia,Turkey and Greece.Starbucks Frappuccino holds its place as the out-right leader in U.S. ready-to-drink coffee bever-ages, dominating the category. Among healthyrefreshment beverages, SoBe – with its growinglist of varieties – remains a standout brand.
A
The brands we sell are built to move – fromPepsiCo’s research and development, to the plantswhere we produce them, to the hundreds of thousands of locations worldwide where we sell,deliver and display them. We’ve watched thesebrands move into the lives and hearts of our consumers – at meal time, play time and in theworkplace. In 2005 they did so at a healthy pace,telling us, our shareholders and our customersthat we’re moving in the right direction.
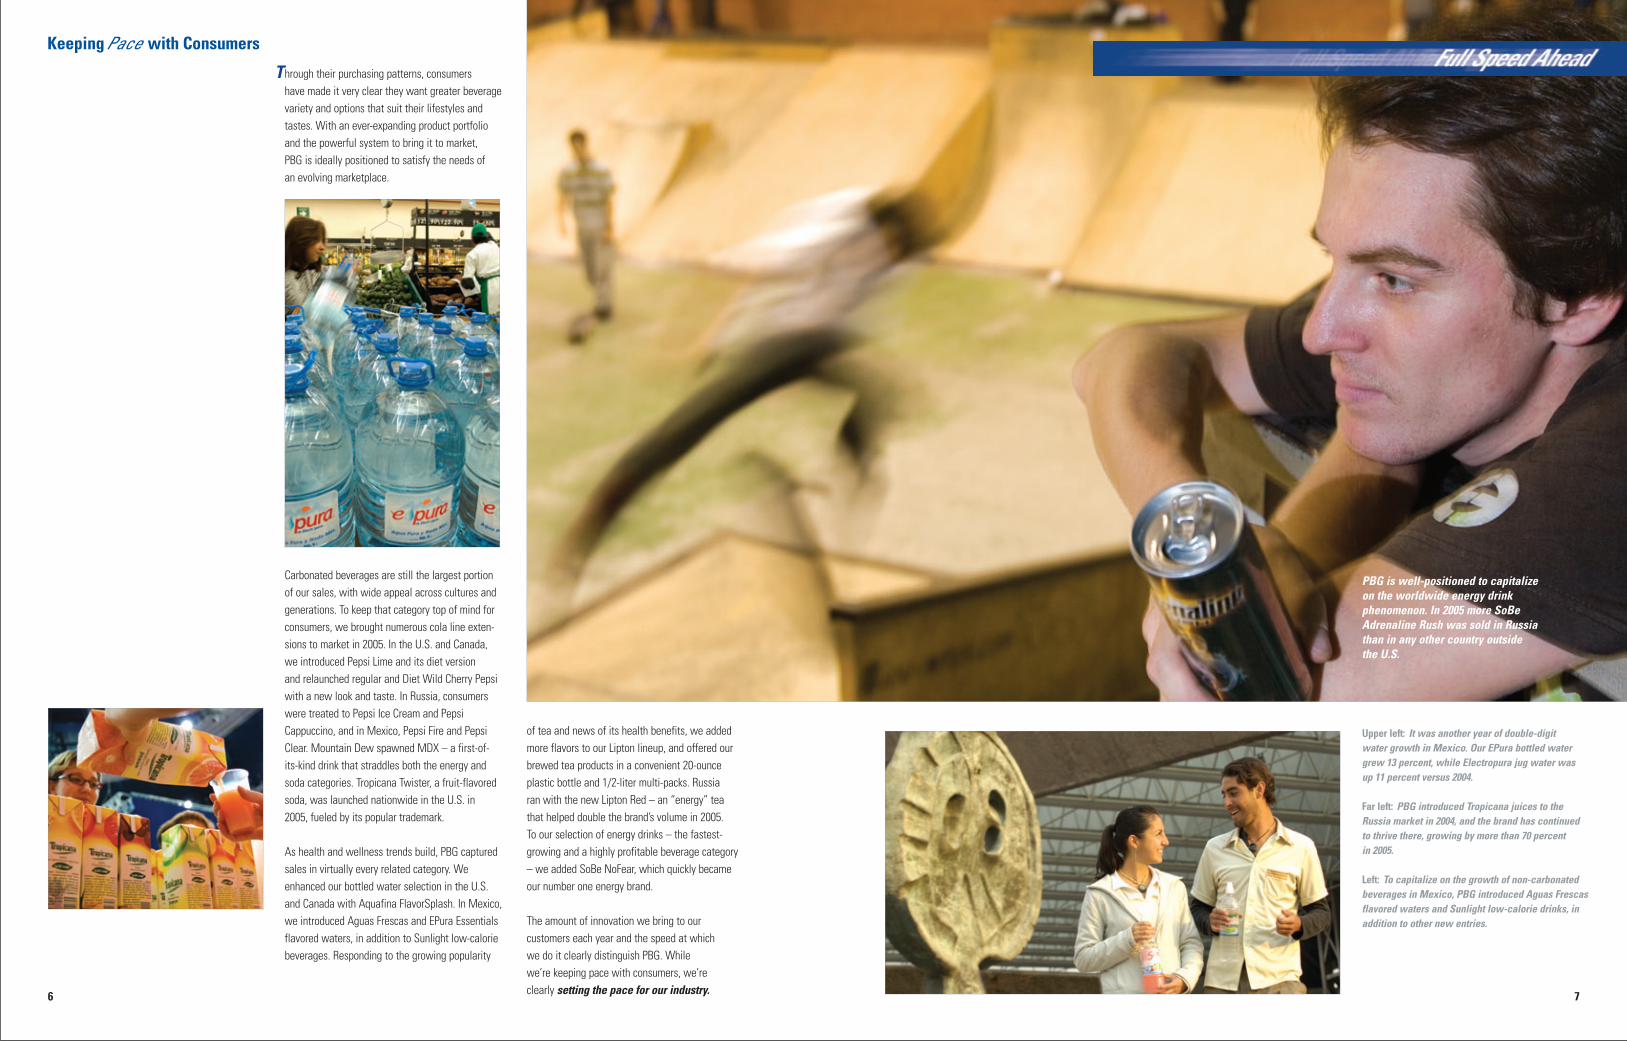
hrough their purchasing patterns, consumers have made it very clear they want greater beveragevariety and options that suit their lifestyles andtastes. With an ever-expanding product portfolioand the powerful system to bring it to market, PBG is ideally positioned to satisfy the needs of an evolving marketplace.
Carbonated beverages are still the largest portionof our sales, with wide appeal across cultures andgenerations. To keep that category top of mind forconsumers, we brought numerous cola line exten-sions to market in 2005. In the U.S. and Canada,we introduced Pepsi Lime and its diet version and relaunched regular and Diet Wild Cherry Pepsiwith a new look and taste. In Russia, consumerswere treated to Pepsi Ice Cream and PepsiCappuccino, and in Mexico, Pepsi Fire and PepsiClear. Mountain Dew spawned MDX – a first-of-its-kind drink that straddles both the energy andsoda categories. Tropicana Twister, a fruit-flavoredsoda, was launched nationwide in the U.S. in 2005, fueled by its popular trademark.
As health and wellness trends build, PBG capturedsales in virtually every related category. Weenhanced our bottled water selection in the U.S.and Canada with Aquafina FlavorSplash. In Mexico,we introduced Aguas Frescas and EPura Essentialsflavored waters, in addition to Sunlight low-caloriebeverages. Responding to the growing popularity
of tea and news of its health benefits, we addedmore flavors to our Lipton lineup, and offered ourbrewed tea products in a convenient 20-ounceplastic bottle and 1/2-liter multi-packs. Russia ran with the new Lipton Red – an “energy” teathat helped double the brand’s volume in 2005. To our selection of energy drinks – the fastest-growing and a highly profitable beverage category– we added SoBe NoFear, which quickly becameour number one energy brand.
The amount of innovation we bring to our customers each year and the speed at which we do it clearly distinguish PBG. While we’re keeping pace with consumers, we’re clearly setting the pace for our industry.
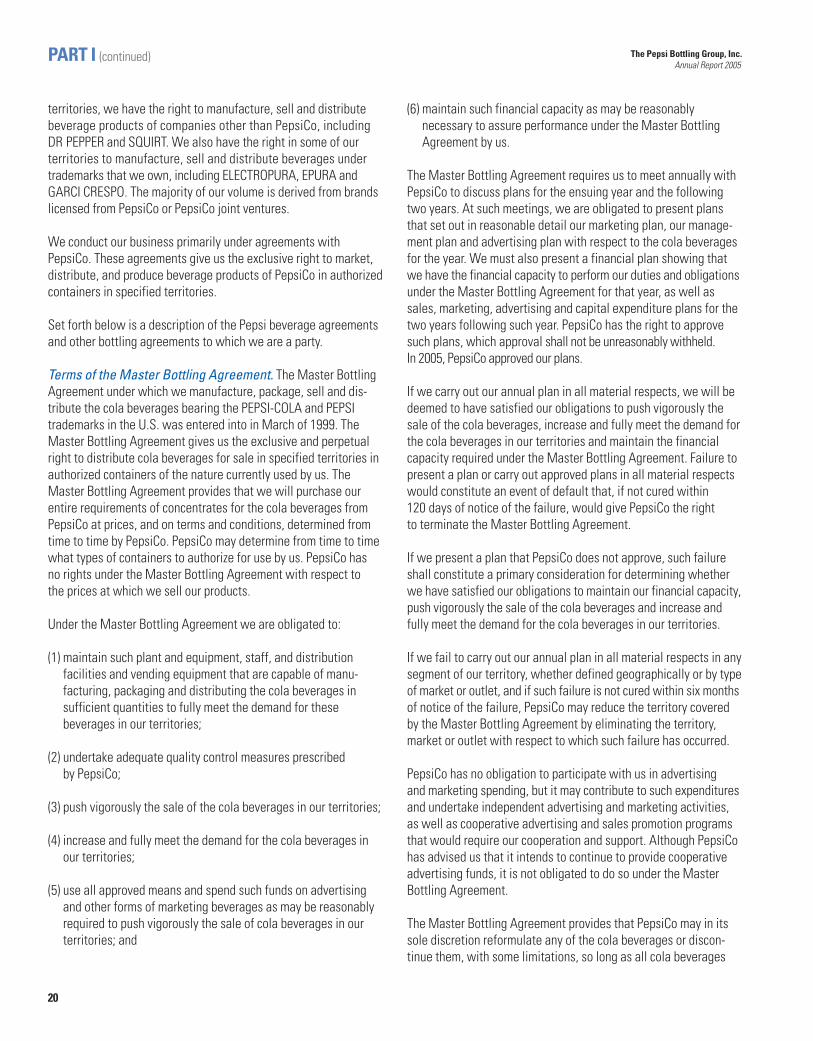
Upper left: It was another year of double-digit water growth in Mexico. Our EPura bottled watergrew 13 percent, while Electropura jug water was up 11 percent versus 2004.
Far left: PBG introduced Tropicana juices to theRussia market in 2004, and the brand has continued to thrive there, growing by more than 70 percent in 2005.
Left: To capitalize on the growth of non-carbonatedbeverages in Mexico, PBG introduced Aguas Frescasflavored waters and Sunlight low-calorie drinks, inaddition to other new entries.
PBG is well-positioned to capitalizeon the worldwide energy drink phenomenon. In 2005 more SoBeAdrenaline Rush was sold in Russiathan in any other country outsidethe U.S.
T
6 7

he hallmarks of PBG’s direct store delivery (DSD)system are speed, flexibility and reach – all criticalfactors in bringing new products to market, addingaccounts to our base and meeting increasing volume demands.
Introducing a new product “overnight” – oncedeemed an exceptional feat of logistics – is now awell-coordinated routine for PBG’s manufacturing,sales and distribution teams. In 2005, we rollednearly 100 new products and packages into the
U.S. and Canada markets, and many in our othergeographies, as well. With our DSD system comesPBG’s own team of merchandisers, who build thehigh-impact displays that stop shoppers in theirtracks – a time and resource saver for customers.
In our international markets, DSD brings a tremen-dous advantage to our business. Few companieshave both the agility to access “up and down thestreet” outlets in urban markets, and the power tohandle the size and pace of the rapidly growingmodern trade. In Russia, Spain, Greece and Turkey,we serve thousands of traditional outlets and anexpanding network of superstores, through a combination of DSD and third-party contractors tailored to each market.
T
Far left: We continued to expand DSD capability in areas of Russia where the demand and economics were appropriate. In 2005, the numberof DSD accounts in Russia grew by more than 10 percent. PBG delivers both beverages and Frito-Lay brand snacks to many of those customers.
Above: Bulk Driver Corey Diaz offloads product for her customer - arriving at the time her customer expected his delivery.
Overall, in 2005 our plants operatedat their highest quality levels ever –several of them ranking among thebest in the worldwide Pepsi system.
Because DSD gives PBG control of every stepalong the supply chain, we can offer our customers quality assurance from production tofinal delivery. In 2005, PBG’s plants once againexceeded their previous year’s performance. Wewere able to meet the growing volume and speeddemands of our business, while turning in ourbest-ever levels of product quality.
Timing may be everything, but only when it bringsthe promise of excellence with it. Fortunately forour customers and consumers, we meet theneed for both.
8 9

s shoppers spend more time away from home and more money in emerging channels, PBG goeswhere the growth is. In the U.S., that means torestaurants, supercenters, the travel and leisure category, and club and dollar stores. In 2005, oursales in these “non-measured” channels substan-tially outpaced those in traditional retail outlets.
The foodservice channel is particularly important tothe beverage business. Today, more “food dollars” in the U.S. and Canada are already spent on away-from-home meals. We want the drinks thataccompany those meals to be ours. As a result, PBGhas re-energized its foodservice team with a focuson pursuing restaurants, workplaces, campuses andleisure locations. In 2005, we achieved solid growthin every one of those categories, and set the stagefor a promising 2006. By leveraging the advantagesof our broad product portfolio and our customerservice agenda, we secured a number of new contracts – including Hershey Entertainment andResorts, the University of Florida and RutgersUniversity, Quiznos Sub shops and a renewal withthe Dallas Fort Worth Airport.
The increasing consumer diversity in our largestmarket, the U.S., also generates new selling oppor-tunities. Our multi-cultural advertising, promotionalmaterials and products, such as Manzanita Sol, an apple-flavored soda and a mainstay of ourMexico portfolio, have helped PBG gain access to the fastest-growing ethnic groups – in the neighborhood markets and outlets they prefer.
In Mexico, PBG added more than 10,000 new cus-tomers to our account base across the traditional,“up and down the street” businesses and the modern trade, and grew our base of cold drinkequipment by nearly 10 percent. And in Russia, our sales force secured new access points and posted growth across all channels, led by double-digit increases in modern trade and kiosk sales.
The Russian team gained substantial space insome of the biggest and fastest-growing retailers,including the Ramstore and Magnit chains.
Gaining distribution points for our products willalways be paramount for PBG because we knowthat every shelf, display, cooler, vendor or fountainwe win leads to refreshment – when andwhere it’s needed.
Top Right: Manzanita Sol, a flavored soda onceoffered only in our Mexico market, is now availablein markets in the U.S. with a large number of Latinos,including Phoenix, Arizona.
Bottom right: A young consumer finds his beverage of choice – Aquafina – in this local sports center,where he and his teammates can choose from thebroad variety in the bank of PBG vending machines.
PBG added home delivery ofElectropura jug water to more than250 delivery routes in Mexico City,growing the brand's household penetration by offering conven-ience to consumers.
A
10 11

Above: Merchandiser Stacey Lowdermilk replenishes the beverage aisle with enough product to avoid an “out of stock” occurrence in her retail account.
Far left: PBG Checker Raymond Cane “certifies” a pallet of product for 100 percent accuracy before it is loaded for delivery, ensuring our drivers arrive with the right stock and generate a correct invoice.
n 2005, we laid the foundation for big improve-ments in customer service that provide our salesforce more time to sell and serve their accounts
I
Early results of these investments in technology,processes and people show we are on track tomeet our goals: to have our products in the storeand our sales reps with our customers at the timethey are needed. Because when it comes to thebeverage business, being there for the sale is what counts.
12 13
Across our U.S. grocery accounts, in 2005 we again demonstrated our in-store executional excellence by outperforming our chief competitor with total inventory on display. Here, Aaron Spencer, CustomerRepresentative, updates a customer about the performance of Pepsi Lime in his store.
and will ultimately contribute to our growth. All of these efforts are geared toward ensuring ourproducts are in stock at all times so that our customers – and we – never miss an opportunity to quench a thirst or complete a meal.
Our service work included the launch of proprietaryhandheld computer software to help our sales teamcreate more accurate orders. By using historicalsales data and anticipating marketplace conditions,the new application decreases the occurrence of“out of stocks,” the number one issue for our customers. Processes and tools introduced into ourU.S. warehouses in 2005 enable more accurate pallet-building, ensuring that what our customersordered is exactly what is delivered and billed. We committed to stringent parameters and tightertimeframes for delivering equipment and respond-ing to customer issues, so we don’t lose a customer– or a sale – to a competitor.
Nearly all of PBG’s U.S. employees in 2005 wereeducated about the most critical needs of our customers and how superior service can become a competitive advantage for PBG. Our Canadianemployees will go through the same trainingprocess in 2006.

Linda G. Alvarado, 53, was elected to PBG’sBoard in March 1999. She is the President and Chief Executive Officer of AlvaradoConstruction, Inc., a general contracting firmspecializing in commercial, industrial, environ-mental and heavy engineering projects, a position she assumed in 1976. Ms. Alvarado is also a director of Pitney Bowes, Inc., Qwest Communications International, Inc.,Lennox International and 3M Company.
Ira D. Hall, 61, was elected to PBG’s Board in March 2003. From 2002 until his retirementin late 2004, Mr. Hall was President and Chief Executive Officer of Utendahl CapitalManagement, LP. From 1999 to 2001, Mr. Hallwas Treasurer of Texaco Inc. and GeneralManager, Alliance Management for Texaco Inc.from 1998 to1999. Mr. Hall is also a director of Ameriprise Financial, Inc., Praxair, Inc. andThe Reynolds and Reynolds Company.
Blythe J. McGarvie, 49, was elected to PBG’s Board in March 2002. She is President of Leadership for International Finance, a private consulting firm providing leadershipseminars for corporate and academic groups.From 1999 to December 2002, Ms. McGarviewas Executive Vice President and Chief
Financial Officer of BIC Group. From 1994 to1999, she served as Senior Vice President andChief Financial Officer of Hannaford Bros. Co.Ms. McGarvie is a Certified Public Accountantand is a director of Accenture Ltd., LafargeNorth America, Inc. and The St. Paul TravelersCompanies, Inc.
Barry H. Beracha, 64, was elected to PBG’sBoard in March 1999. Prior to his retirement in June 2003, Mr. Beracha most recently servedas an Executive Vice President of Sara LeeCorporation and Chief Executive Officer of Sara Lee Bakery Group since August 2001.Mr. Beracha was the Chairman of the Boardand Chief Executive Officer of The EarthgrainsCompany from 1993 to August 2001. Mr.Beracha is also a director of McCormick & Co.,Inc. and Chairman of the Board of Trustees of St. Louis University.
Thomas H. Kean, 70, was elected to PBG’sBoard in March 1999. Mr. Kean heads THKConsulting, LLC, a private consulting firm.Previously, Mr. Kean served as the President of Drew University from 1990 to 2005 and was the Governor of the State of New Jerseyfrom 1982 to 1990. Mr. Kean is also a directorof Amerada Hess Corporation, AramarkCorporation, CIT Group, Inc., Franklin
Resources, Inc. and UnitedHealth Group, Inc. He was also Chairman of The NationalCommission on Terrorist Attacks Upon theUnited States.
Rogelio Rebolledo, 61, was elected to PBG’s Board in May 2004 and was appointedPresident and Chief Executive Officer of PBGMexico in January 2004. From 2000 to 2003,Mr. Rebolledo was President and ChiefExecutive Officer of Frito-Lay International(“FLI”), a subsidiary of PepsiCo, Inc., operatingin Latin America, Asia Pacific, Australia,Europe, the Middle East and Africa. In May2006, he will become a director of Applebee’sInternational, Inc.
Susan D. Kronick, 54, was elected to PBG’sBoard in March 1999. Ms. Kronick became Vice Chairman of Federated Department Storesin February 2003. Previously, she had beenGroup President of Federated DepartmentStores since April 2001. From 1997 to 2001,Ms. Kronick was the Chairman and ChiefExecutive Officer of Burdines, a division ofFederated Department Stores.
John T. Cahill, 48, was elected to PBG’s Boardin January 1999 and became Chairman of theBoard in January 2003. He has been PBG’sChief Executive Officer since September 2001.Previously, Mr. Cahill served as President andChief Operating Officer of PBG. He served asPBG’s Executive Vice President and ChiefFinancial Officer from 1998 to August 2000prior to becoming President and ChiefOperating Officer in August 2000. Mr. Cahill is also a director of the Colgate-PalmoliveCompany.
John A. Quelch, 54, was elected to PBG’sBoard in January 2005. Mr. Quelch has beenSenior Associate Dean and Lincoln FileneProfessor of Business Administration at Harvard Business School since 2001. From 1998to 2001, Mr. Quelch was Dean of the LondonBusiness School. Prior to that, he was anAssistant Professor, an Associate Professor anda full Professor of Business Administration atHarvard Business School from 1979 to 1998.Mr. Quelch is also a Director of WPP Group plcand Inverness Medical Innovations, Inc.
Margaret D. Moore, 58, was elected to PBG’sBoard in January 2001. Ms. Moore is SeniorVice President, Human Resources of PepsiCo, a position she assumed at the end of 1999.From November 1998 to December 1999, shewas Senior Vice President and Treasurer ofPBG. Prior to joining PBG, Ms. Moore spent 25 years with PepsiCo in a number of seniorfinancial and human resources positions.
Clay G. Small, 56, was elected to PBG’s Boardin May 2002. Mr. Small is Senior Vice Presidentand Managing Attorney of PepsiCo, Inc. From1997 to February 2004, he was Senior VicePresident and General Counsel of Frito-Lay, Inc.,a subsidiary of PepsiCo. Mr. Small joinedPepsiCo as an attorney in 1981. He served asVice President and Division Counsel of thePepsi-Cola Company from 1983 to 1987 andSenior Vice President and General Counsel of Pizza Hut, Inc. from 1987 to 1997.
From left to right:
Committees:1 Nominating and Corporate Governance Committee2 Audit and Affiliated Transactions Committee3 Compensation and Management Development Committee
1,3
14 15
2,3
2,3
2,3
1,3
2,3
1,3
John L. BerisfordSenior Vice President ofHuman Resources17 years
Neal A. BronzoSenior Vice President andChief Information Officer15 years
John T. CahillChairman and Chief Executive Officer16 years
Alfred H. DrewesSenior Vice President and Chief Financial Officer24 years
Andrea L. ForsterVice President and Controller18 years
Eric J. FossChief Operating Officer23 years
Robert C. KingPresident, North American Field Operations16 years
Yiannis PetridesPresident, PBG Europe18 years
Steven M. RappSenior Vice President,General Counsel and Secretary19 years
Rogelio RebolledoPresident and Chief Executive Officer, PBG Mexico30 years
Gary K. WandschneiderExecutive Vice PresidentWorldwide Operations24 years

Bulk delivery:Products are pre-ordered through a sales representative and then distributed to large format outlets by a driver assigned to those accounts.
Channel:Refers to either cold drink or take-home
Cold drink:Cold products sold in retail and food-service accounts, and that carry the highest profit margins
Constant territory:PBG’s fiscal year ends on the last Saturday in December and, as a result, a 53rd weekwas added to the fiscal year 2005. Fiscal2006 has 52 weeks. Constant territory calculations assume a 52-week year and all significant acquisitions made in the prioryear were made at the beginning of that year.These calculations exclude all significantacquisitions made in the current year.
16
Direct store delivery:Distribution system by which products are sold, delivered and merchandised by PBG employees
Energy drinks:Functional drinks containing unique energizing formulations that satisfy the consumer's need for an energy boost
Foodservice accounts:Outlets where consumers buy single-serve soft drinks for immediate consumption, usually to complement an away-from-home meal
Household penetration:The percentage of households in a definedmarket that has purchased a particular branded item
Large format:Accounts that are large chain foodstores,supercenters, mass merchandisers, chain drug stores, club stores and military bases
Modern trade:Refers to the growing international network of new, contemporary-style outlets,including supermarkets, large chain storesand hypermarkets, as opposed to small, independently owned shops
Non-measured channels:Channels for which syndicated sales and share performance data are not readily available
Out of stocks:Products missing or absent anywhere along our supply chain, and ultimately from the store shelf
Take-home:Unchilled products sold for at-home or future consumption
Third-party distributor:A separate company hired to distribute products to selected outlets
Corporate HeadquartersThe Pepsi Bottling Group, Inc.1 Pepsi WaySomers, NY 10589914.767.6000
Transfer AgentFor services regarding your account such as change of address, replacement of lost stock certificates or dividend checks, direct deposit of dividends or change in registered ownership, contact:
The Bank of New YorkShareholder Services DepartmentP.O. Box 11258Church Street StationNew York, NY 10286-1258
Telephone: 800.432.0140E-mail: [email protected]: http://www.stockbny.comOrThe Pepsi Bottling Group, Inc.Shareholder Relations Coordinator1 Pepsi WaySomers, NY 10589Telephone: 914.767.6339
In all correspondence or telephone inquiries, please mentionPBG, your name as printed on your stock certificate, yourSocial Security number, your address and telephone number.
Direct Purchase and Sales PlanThe BuyDIRECT Plan, administered by The Bank of New York, provides existing shareholders and interested first-timeinvestors a direct, convenient and affordable alternative forbuying and selling PBG shares. Contact The Bank of New Yorkfor an enrollment form and brochure that describes the planfully. For BuyDIRECT Plan enrollment and other shareholderinquiries:
The Pepsi Bottling Group, Inc.c/o The Bank of New YorkP.O. Box 11019New York, NY 10286-1019Telephone: 800.432.0140
Stock Exchange ListingCommon shares (symbol: PBG) are traded on the New YorkStock Exchange.
CertificationsThe certifications of our Chief Executive Officer and Chief Financial Officer, as required by section 302 of theSarbanes-Oxley Act, are included as exhibits to PBG’s 2005 Annual Report on Form 10-K filed with the SEC. PBGsubmitted its annual certification regarding corporate governance listing standards to the New York StockExchange after its 2005 Annual Meeting of Shareholders.
Independent Public AccountantsDeloitte & Touche LLPTwo World Financial CenterNew York, NY 10281-1414
Annual MeetingThe annual meeting of shareholders will be held at10:00 a.m., Wednesday, May 24, 2006, at PBG headquartersin Somers, New York.
Investor RelationsPBG’s 2006 quarterly releases are expected to be issuedthe weeks of April 18, July 11 and October 3, 2006, andJanuary 30, 2007.
Earnings and other financial results, corporate news and other company information are available on PBG’s website: http://www.pbg.com
Investors desiring further information about PBG shouldcontact the Investor Relations department at corporateheadquarters at 914.767.6339.
Institutional investors should contact Mary Winn Settino at914.767.7216.
This publication contains many of the valuable trademarksowned and used by PepsiCo. Inc. and its subsidiaries and affiliates in the United States and internationally.

17
UNITED STATES SECURITIES AND EXCHANGE COMMISSIONWashington, D.C. 20549
FORM 10-KMu Annual report pursuant to Section 13 or 15(d) of the Securities Exchange Act of 1934
For the Fiscal Year Ended December 31, 2005or
M Transition report pursuant to Section 13 or 15(d) of the Securities Exchange Act of 1934 (No Fee Required)For the transition period from _________to _________
Commission file number 1-14893
The Pepsi Bottling Group, Inc.(Exact name of Registrant as Specified in its Charter)
Incorporated in Delaware 13-4038356(State or other Jurisdiction of Incorporation or organization) (I.R.S. Employer Identification No.)
One Pepsi Way, Somers, New York 10589(Address of Principal Executive Offices) (Zip code)
Registrant’s telephone number, including area code: (914) 767-6000
Securities registered pursuant to Section 12(b) of the Act:
Title of Each Class Name of Each Exchange on Which Registered
Common Stock, par value $.01 per share New York Stock Exchange
Securities registered pursuant to Section 12(g) of the Act: None
Indicate by check mark if the registrant is a well-known seasoned issuer, as defined in Rule 405 of the Securities Act.Yes Mu No M
Indicate by check mark if the registrant is not required to file reports pursuant to Section 13 or Section 15(d) of the Act.Yes M No Mu
Indicate by check mark whether the registrant: (1) has filed all reports required to be filed by Section 13 or 15(d) of the SecuritiesExchange Act of 1934 during the preceding 12 months (or for such shorter period that the registrant was required to file such reports) and(2) has been subject to such filing requirements for the past 90 days. Yes Mu No M
Indicate by check mark if disclosure of delinquent filers pursuant to Item 405 of Regulation S-K is not contained herein, and will not becontained, to the best of registrant’s knowledge, in definitive proxy or information statements incorporated by reference in Part III of thisForm 10-K or any amendment to this Form 10-K. M
Indicated by check mark whether the registrant is a large accelerated filer, an accelerated filer or a non-accelerated filer. See defini-tion of “accelerated filer and large accelerated filer” in Rule 12b-2 of the Exchange Act. Large accelerated filer Mu Accelerated filer M Non-accelerated filer M
Indicate by check mark whether the registrant is a shell company (as defined in Rule 12b-2 of the Exchange Act). Yes M No Mu
The number of shares of Capital Stock of The Pepsi Bottling Group, Inc. outstanding as of February 15, 2006 was 237,237,138. The aggregate market value of The Pepsi Bottling Group, Inc. Capital Stock held by non-affiliates of The Pepsi Bottling Group, Inc. as of June 11,2005 was $4,053,664,844.
Documents of Which Portions Are Incorporated by Reference Parts of Form 10-K into Which Portion of Documents Are Incorporated
Proxy Statement for The Pepsi Bottling Group, Inc. May 24, 2006 Annual Meeting of Shareholders III

18
Table of Contents The Pepsi Bottling Group, Inc.Annual Report 2005
PART I
Item 1. Business 19Item 1A.Risk Factors 24Item 1B. Unresolved Staff Comments 27Item 2. Properties 27Item 3. Legal Proceedings 27Item 4. Submission of Matters to a Vote of Shareholders 27
PART II
Item 5. Market for Registrant’s Common Equity, Related Shareholder Matters and Issuer Purchases of Equity Securities 29
Item 6. Selected Financial Data 30Item 7. Management’s Discussion and Analysis of
Financial Condition and Results of Operations 31Item 7A.Quantitative and Qualitative Disclosures
About Market Risk 75Item 8. Financial Statements and Supplementary Data 75Item 9. Changes in and Disagreements With
Accountants on Accounting and Financial Disclosure 75
Item 9A.Controls and Procedures 75Item 9B. Other Information 76
PART III
Item 10. Directors and Executive Officers of PBG 77Item 11. Executive Compensation 77Item 12. Security Ownership of Certain Beneficial
Owners and Management and Related Stockholder Matters 77
Item 13. Certain Relationships and Related Transactions 78Item 14. Principal Accountant Fees and Services 78
PART IV
Item 15. Exhibits and Financial Statement Schedules 78
SIGNATURES 79
INDEX TO EXHIBITS 82

19
PART I The Pepsi Bottling Group, Inc.Annual Report 2005
ITEM 1. BUSINESS
Introduction
The Pepsi Bottling Group, Inc. (“PBG”) was incorporated inDelaware in January, 1999, as a wholly owned subsidiary ofPepsiCo, Inc. (“PepsiCo”) to effect the separation of most ofPepsiCo’s company-owned bottling businesses. PBG became apublicly traded company on March 31, 1999. As of January 27,2006 PepsiCo’s ownership represented 41.3% of the outstandingcommon stock and 100% of the outstanding Class B commonstock, together representing 46.9% of the voting power of allclasses of PBG’s voting stock. PepsiCo also owned approximately6.7% of the equity interest of Bottling Group, LLC, PBG’s principaloperating subsidiary, as of January 27, 2006. We refer to our publicly traded common stock as “Common Stock” and, togetherwith our Class B common stock, as our “Capital Stock.” Whenused in this Report, “PBG,” “we,” “us” and “our” each refers toThe Pepsi Bottling Group, Inc. and, where appropriate, to BottlingGroup, LLC, which we also refer to as “Bottling LLC.”
We maintain a website at http://www.pbg.com. We make avail-able, free of charge, through the Investor Relations – FinancialInformation – SEC filings section of our website, our annual reporton Form 10-K, quarterly reports on Form 10-Q, current reports onForm 8-K, and any amendments to those reports filed or furnishedpursuant to Section 13(a) or 15(d) of the Securities Exchange Act of1934, as amended, as soon as reasonably practicable after suchreports are electronically filed with, or furnished to, the Securitiesand Exchange Commission (the “SEC”). Additionally, we have madeavailable, free of charge, the following governance materials on our website at http://www.pbg.com under Investor Relations –Company Information – Corporate Governance: Certificate ofIncorporation, Bylaws, Corporate Governance Principles andPractices, Worldwide Code of Conduct (including any amendmentthereto), Director Independence Policy, the Audit and AffiliatedTransactions Committee Charter, the Compensation andManagement Development Committee Charter, the Nominatingand Corporate Governance Committee Charter and the DisclosureCommittee Charter. These governance materials are available inprint, free of charge, to any PBG shareholder upon request.
Principal Products
PBG is the world’s largest manufacturer, seller and distributor ofPepsi-Cola beverages. The beverages sold by us include PEPSI-COLA,DIET PEPSI, MOUNTAIN DEW, AQUAFINA, LIPTON BRISK, SIERRAMIST, DIET MOUNTAIN DEW, TROPICANA JUICE DRINKS, SOBE,and STARBUCKS FRAPPUCCINO. In addition to the foregoing, thebeverages we sell outside the U.S. include 7 UP, KAS, AQUAMINERALE, MIRINDA and MANZANITA SOL. In some of ourterritories, we have the right to manufacture, sell and distribute
soft drink products of companies other than PepsiCo, includingDR PEPPER and SQUIRT. We also have the right in some of our territories to manufacture, sell and distribute beverages undertrademarks that we own, including ELECTROPURA, EPURA andGARCI CRESPO.
We have the exclusive right to manufacture, sell and distributePepsi-Cola beverages in all or a portion of 41 states and theDistrict of Columbia in the U.S., nine Canadian provinces, Spain,Greece, Russia, Turkey and all or a portion of 23 states in Mexico.In 2005, approximately 71% of our net revenues were generated in the United States, 10% of our net revenues were generated inMexico and the remaining 19% of our net revenues were generatedin Canada, Spain, Greece, Russia and Turkey. In 2005, worldwidesales of our products to two of our customers accounted forapproximately 10% of our net revenues. We have an extensivedirect store distribution system in the United States, Mexico andCanada. In Russia, Spain, Greece and Turkey, we use a combinationof direct store distribution and distribution through wholesalers,depending on local marketplace considerations.
Raw Materials and Other Supplies
We purchase the concentrates to manufacture Pepsi-Cola beverages and other beverage products from PepsiCo and otherbeverage companies.
In addition to concentrates, we purchase sweeteners, glass andplastic bottles, cans, closures, syrup containers, other packagingmaterials, carbon dioxide and some finished goods. We generallypurchase our raw materials, other than concentrates, from multiplesuppliers. PepsiCo acts as our agent for the purchase of such rawmaterials in the United States and Canada and, with respect tosome of our raw materials, in certain of our international markets.The Pepsi beverage agreements, as described below, provide that,with respect to the beverage products of PepsiCo, all authorizedcontainers, closures, cases, cartons and other packages and labelsmay be purchased only from manufacturers approved by PepsiCo.There are no materials or supplies used by PBG that are currently in short supply. The supply or cost of specific materials could beadversely affected by various factors, including price changes,strikes, weather conditions and governmental controls.
Patents, Trademarks and Licenses
Our portfolio of beverage products includes some of the best recognized trademarks in the world and includes PEPSI-COLA, DIET PEPSI, MOUNTAIN DEW, AQUAFINA, LIPTON BRISK, SIERRAMIST, DIET MOUNTAIN DEW, TROPICANA JUICE DRINKS, SOBE,and STARBUCKS FRAPPUCCINO. In addition to the foregoing, thebeverages we sell outside the U.S. include 7 UP, KAS, AQUAMINERALE, MIRINDA and MANZANITA SOL. In some of our
20
PART I (continued) The Pepsi Bottling Group, Inc.Annual Report 2005
territories, we have the right to manufacture, sell and distributebeverage products of companies other than PepsiCo, includingDR PEPPER and SQUIRT. We also have the right in some of our territories to manufacture, sell and distribute beverages undertrademarks that we own, including ELECTROPURA, EPURA andGARCI CRESPO. The majority of our volume is derived from brandslicensed from PepsiCo or PepsiCo joint ventures.
We conduct our business primarily under agreements withPepsiCo. These agreements give us the exclusive right to market,distribute, and produce beverage products of PepsiCo in authorizedcontainers in specified territories.
Set forth below is a description of the Pepsi beverage agreementsand other bottling agreements to which we are a party.
Terms of the Master Bottling Agreement. The Master BottlingAgreement under which we manufacture, package, sell and dis-tribute the cola beverages bearing the PEPSI-COLA and PEPSItrademarks in the U.S. was entered into in March of 1999. TheMaster Bottling Agreement gives us the exclusive and perpetualright to distribute cola beverages for sale in specified territories inauthorized containers of the nature currently used by us. TheMaster Bottling Agreement provides that we will purchase ourentire requirements of concentrates for the cola beverages fromPepsiCo at prices, and on terms and conditions, determined fromtime to time by PepsiCo. PepsiCo may determine from time to timewhat types of containers to authorize for use by us. PepsiCo has no rights under the Master Bottling Agreement with respect to the prices at which we sell our products.
Under the Master Bottling Agreement we are obligated to:
(1) maintain such plant and equipment, staff, and distribution facilities and vending equipment that are capable of manu-facturing, packaging and distributing the cola beverages in sufficient quantities to fully meet the demand for these beverages in our territories;
(2) undertake adequate quality control measures prescribedby PepsiCo;
(3) push vigorously the sale of the cola beverages in our territories;
(4) increase and fully meet the demand for the cola beverages inour territories;
(5) use all approved means and spend such funds on advertisingand other forms of marketing beverages as may be reasonablyrequired to push vigorously the sale of cola beverages in ourterritories; and
(6) maintain such financial capacity as may be reasonably necessary to assure performance under the Master BottlingAgreement by us.
The Master Bottling Agreement requires us to meet annually withPepsiCo to discuss plans for the ensuing year and the followingtwo years. At such meetings, we are obligated to present plansthat set out in reasonable detail our marketing plan, our manage-ment plan and advertising plan with respect to the cola beveragesfor the year. We must also present a financial plan showing thatwe have the financial capacity to perform our duties and obligationsunder the Master Bottling Agreement for that year, as well assales, marketing, advertising and capital expenditure plans for thetwo years following such year. PepsiCo has the right to approvesuch plans, which approval shall not be unreasonably withheld. In 2005, PepsiCo approved our plans.
If we carry out our annual plan in all material respects, we will bedeemed to have satisfied our obligations to push vigorously thesale of the cola beverages, increase and fully meet the demand forthe cola beverages in our territories and maintain the financialcapacity required under the Master Bottling Agreement. Failure topresent a plan or carry out approved plans in all material respectswould constitute an event of default that, if not cured within120 days of notice of the failure, would give PepsiCo the right to terminate the Master Bottling Agreement.
If we present a plan that PepsiCo does not approve, such failureshall constitute a primary consideration for determining whetherwe have satisfied our obligations to maintain our financial capacity,push vigorously the sale of the cola beverages and increase andfully meet the demand for the cola beverages in our territories.
If we fail to carry out our annual plan in all material respects in anysegment of our territory, whether defined geographically or by typeof market or outlet, and if such failure is not cured within six monthsof notice of the failure, PepsiCo may reduce the territory coveredby the Master Bottling Agreement by eliminating the territory,market or outlet with respect to which such failure has occurred.
PepsiCo has no obligation to participate with us in advertising and marketing spending, but it may contribute to such expendituresand undertake independent advertising and marketing activities,as well as cooperative advertising and sales promotion programsthat would require our cooperation and support. Although PepsiCohas advised us that it intends to continue to provide cooperativeadvertising funds, it is not obligated to do so under the MasterBottling Agreement.
The Master Bottling Agreement provides that PepsiCo may in itssole discretion reformulate any of the cola beverages or discon-tinue them, with some limitations, so long as all cola beverages

21
The Pepsi Bottling Group, Inc.Annual Report 2005
are not discontinued. PepsiCo may also introduce new beveragesunder the PEPSI-COLA trademarks or any modification thereof.When that occurs, we are obligated to manufacture, package, distribute and sell such new beverages with the same obligationsas then exist with respect to other cola beverages. We are prohibitedfrom producing or handling cola products, other than those ofPepsiCo, or products or packages that imitate, infringe or causeconfusion with the products, containers or trademarks of PepsiCo.The Master Bottling Agreement also imposes requirements withrespect to the use of PepsiCo’s trademarks, authorized containers,packaging and labeling.
If we acquire control, directly or indirectly, of any bottler of colabeverages, we must cause the acquired bottler to amend its bottling appointments for the cola beverages to conform to theterms of the Master Bottling Agreement.
Under the Master Bottling Agreement, PepsiCo has agreed not towithhold approval for any acquisition of rights to manufacture andsell PEPSI trademarked cola beverages within a specific area –currently representing approximately 11.3% of PepsiCo’s U.S. bottling system in terms of volume – if we have successfully negotiated the acquisition and, in PepsiCo’s reasonable judgment,satisfactorily performed our obligations under the Master BottlingAgreement. We have agreed not to acquire or attempt to acquire any rights to manufacture and sell PEPSI trademarked cola beveragesoutside of that specific area without PepsiCo’s prior written approval.
The Master Bottling Agreement is perpetual, but may be terminatedby PepsiCo in the event of our default. Events of default include:
(1) our insolvency, bankruptcy, dissolution, receivership or the like;
(2) any disposition of any voting securities of one of our bottlingsubsidiaries or substantially all of our bottling assets withoutthe consent of PepsiCo;
(3) our entry into any business other than the business of manu-facturing, selling or distributing non-alcoholic beverages or any business which is directly related and incidental to suchbeverage business; and
(4) any material breach under the contract that remains uncured for120 days after notice by PepsiCo.
An event of default will also occur if any person or affiliated groupacquires any contract, option, conversion privilege, or other rightto acquire, directly or indirectly, beneficial ownership of more than15% of any class or series of our voting securities without the consent of PepsiCo. As of February 15, 2006, to our knowledge, no shareholder of PBG, other than PepsiCo, held more than 10.2%of our Common Stock.
We are prohibited from assigning, transferring or pledging the Master Bottling Agreement, or any interest therein, whether voluntarily, or by operation of law, including by merger or liquidation,without the prior consent of PepsiCo.
The Master Bottling Agreement was entered into by us in the context of our separation from PepsiCo and, therefore, its provisionswere not the result of arm’s-length negotiations. Consequently, theagreement contains provisions that are less favorable to us thanthe exclusive bottling appointments for cola beverages currently in effect for independent bottlers in the United States.
Terms of the Non-Cola Bottling Agreements. The beverageproducts covered by the non-cola bottling agreements are bever-ages licensed to us by PepsiCo, consisting of MOUNTAIN DEW,AQUAFINA, SIERRA MIST, DIET MOUNTAIN DEW, MUG root beerand cream soda, MOUNTAIN DEW CODE RED and SLICE. The non-cola bottling agreements contain provisions that are similar to those contained in the Master Bottling Agreement with respectto pricing, territorial restrictions, authorized containers, planning,quality control, transfer restrictions, term and related matters. Ournon-cola bottling agreements will terminate if PepsiCo terminatesour Master Bottling Agreement. The exclusivity provisions contained in the non-cola bottling agreements would prevent usfrom manufacturing, selling or distributing beverage productswhich imitate, infringe upon, or cause confusion with, the beverageproducts covered by the non-cola bottling agreements. PepsiComay also elect to discontinue the manufacture, sale or distributionof a non-cola beverage and terminate the applicable non-cola bottling agreement upon six months notice to us.
Terms of Certain Distribution Agreements. We also haveagreements with PepsiCo granting us exclusive rights to distributeAMP and DOLE in all of our territories and SOBE in certain specifiedterritories. The distribution agreements contain provisions generallysimilar to those in the Master Bottling Agreement as to use oftrademarks, trade names, approved containers and labels and causesfor termination. We also have the right to sell and distributeGATORADE in Spain, Greece and Russia and in certain limitedchannels of distribution in the U.S. and Canada. Some of these beverage agreements have limited terms and, in most instances,prohibit us from dealing in similar beverage products. We are alsocurrently distributing TROPICANA JUICE DRINKS in the United Statesand Canada and TROPICANA JUICES in Russia and Spain.
Terms of the Master Syrup Agreement. The Master SyrupAgreement grants us the exclusive right to manufacture, sell anddistribute fountain syrup to local customers in our territories. The Master Syrup Agreement also grants us the right to act as a manufacturing and delivery agent for national accounts within our territories that specifically request direct delivery without using a middleman. In addition, PepsiCo may appoint us to manufacture

22
PART I (continued) The Pepsi Bottling Group, Inc.Annual Report 2005
and deliver fountain syrup to national accounts that elect deliverythrough independent distributors. Under the Master SyrupAgreement, we have the exclusive right to service fountain equipment for all of the national account customers within our territories. The Master Syrup Agreement provides that the determination of whether an account is local or national is at the sole discretion of PepsiCo.
The Master Syrup Agreement contains provisions that are similarto those contained in the Master Bottling Agreement with respectto concentrate pricing, territorial restrictions with respect to localcustomers and national customers electing direct-to-store deliveryonly, planning, quality control, transfer restrictions and relatedmatters. The Master Syrup Agreement had an initial term offive years which expired in 2004 and was renewed for an additionalfive-year period. The Master Syrup Agreement will automaticallyrenew for additional five-year periods, unless PepsiCo terminatesit for cause. PepsiCo has the right to terminate the Master SyrupAgreement without cause at any time upon twenty-four monthsnotice. In the event PepsiCo terminates the Master SyrupAgreement without cause, PepsiCo is required to pay us the fairmarket value of our rights thereunder.
Our Master Syrup Agreement will terminate if PepsiCo terminatesour Master Bottling Agreement.
Terms of Other U.S. Bottling Agreements. The bottling agreements between us and other licensors of beverage products,including Cadbury Schweppes plc for DR PEPPER, SCHWEPPES,CANADA DRY, HAWAIIAN PUNCH and SQUIRT, the Pepsi/LiptonTea Partnership for LIPTON BRISK and LIPTON’S ICED TEA, and theNorth American Coffee Partnership for STARBUCKS FRAPPUCCINO,contain provisions generally similar to those in the Master BottlingAgreement as to use of trademarks, trade names, approved containersand labels, sales of imitations and causes for termination. Some of these beverage agreements have limited terms and, in mostinstances, prohibit us from dealing in similar beverage products.
Terms of the Country-Specific Bottling Agreements. Thecountry-specific bottling agreements contain provisions generallysimilar to those contained in the Master Bottling Agreement andthe non-cola bottling agreements and, in Canada, the MasterSyrup Agreement with respect to authorized containers, planning,quality control, transfer restrictions, term, causes for terminationand related matters. These bottling agreements differ from theMaster Bottling Agreement because, except for Canada, they includeboth fountain syrup and non-fountain beverages. Certain of thesebottling agreements contain provisions that have been modified to reflect the laws and regulations of the applicable country. Forexample, the bottling agreements in Spain do not contain a restriction on the sale and shipment of Pepsi-Cola beverages intoour territory by others in response to unsolicited orders. In
addition, in Mexico and Turkey we are restricted in our ability to manufacture, sell and distribute beverages sold under non-PepsiCo trademarks.
Seasonality
Our peak season is the warm summer months beginning in Mayand ending in September. More than 65% of our operating incomeis typically earned during the second and third quarters. More than80% of cash flow from operations is typically generated in thethird and fourth quarters.
Competition
The carbonated soft drink market and the non-carbonated beverage market are highly competitive. Our competitors in these markets include bottlers and distributors of nationally advertisedand marketed products, bottlers and distributors of regionallyadvertised and marketed products, as well as bottlers of privatelabel soft drinks sold in chain stores. Among our major competitorsare bottlers that distribute products from The Coca-Cola Companyincluding Coca-Cola Enterprises Inc., Coca-Cola Hellenic BottlingCompany S.A., Coca-Cola FEMSA S.A. de C.V. and Coca-ColaBottling Co. Consolidated. Our market share for carbonated softdrinks sold under trademarks owned by PepsiCo in our U.S. territories ranges from approximately 21% to approximately 37%.Our market share for carbonated soft drinks sold under trademarksowned by PepsiCo for each country, outside the U.S., in which wedo business is as follows: Canada 38%; Russia 25%; Turkey 19%;Spain 12% and Greece 9% (including market share for our IVIbrand). In addition, market share for our territories and the territories of other Pepsi bottlers in Mexico is 13% for carbonatedsoft drinks sold under trademarks owned by PepsiCo. All marketshare figures are based on generally available data published by third parties. Actions by our major competitors and others in thebeverage industry, as well as the general economic environment,could have an impact on our future market share.
We compete primarily on the basis of advertising and marketingprograms to create brand awareness, price and promotions, retailspace management, customer service, consumer points of access,new products, packaging innovations and distribution methods.We believe that brand recognition, market place pricing, consumervalue, customer service, availability and consumer and customergoodwill are primary factors affecting our competitive position.
Governmental Regulation Applicable to PBG
Our operations and properties are subject to regulation by variousfederal, state and local governmental entities and agencies in theUnited States as well as foreign governmental entities and agencies in Canada, Spain, Greece, Russia, Turkey and Mexico.

23
The Pepsi Bottling Group, Inc.Annual Report 2005
As a producer of food products, we are subject to production,packaging, quality, labeling and distribution standards in each of the countries where we have operations, including, in theUnited States, those of the Federal Food, Drug and Cosmetic Actand the Public Health Security and Bioterrorism Preparedness andResponse Act. The operations of our production and distributionfacilities are subject to laws and regulations relating to the protection of our employees’ health and safety and the environmentin the countries in which we do business. In the United States, we are subject to the laws and regulations of various governmentalentities, including the Department of Labor, the EnvironmentalProtection Agency and the Department of Transportation, and variousfederal, state and local occupational, labor and employment andenvironmental laws. These laws and regulations include theOccupational Safety and Health Act, the Clean Air Act, the CleanWater Act, the Resource Conservation and Recovery Act, theComprehensive Environmental Response, Compensation andLiability Act, the Superfund Amendments and Reauthorization Act, the Federal Motor Carrier Safety Act and the Fair LaborStandards Act.
We believe that our current legal, operational and environmentalcompliance programs are adequate and that we are in substantialcompliance with applicable laws and regulations of the countriesin which we do business. We do not anticipate making any materialexpenditures in connection with environmental remediation andcompliance. However, compliance with, or any violation of, futurelaws or regulations could require material expenditures by us or otherwise have a material adverse effect on our business, financial condition or results of operations.
Bottle and Can Legislation Legislation has been enacted in certain states and Canadian provinces where we operate that generally prohibits the sale of certain beverages in non-refillablecontainers unless a deposit or levy is charged for the container.These include California, Connecticut, Delaware, Hawaii, Iowa,Maine, Massachusetts, Michigan, New York, Oregon, WestVirginia, British Columbia, Alberta, Saskatchewan, Manitoba, New Brunswick, Nova Scotia, Ontario, Prince Edward Island and Quebec.
Massachusetts and Michigan have statutes that require us to pay all or a portion of unclaimed container deposits to the stateand Hawaii and California impose a levy on beverage containers tofund a waste recovery system.
In addition to the Canadian deposit legislation described above,Ontario, Canada currently has a regulation requiring that at least 30% of all soft drinks sold in Ontario be bottled inrefillable containers.
The European Commission issued a packaging and packing wastedirective that was incorporated into the national legislation ofmost member states. This has resulted in targets being set for therecovery and recycling of household, commercial and industrialpackaging waste and imposes substantial responsibilities uponbottlers and retailers for implementation. Similar legislation hasbeen enacted in Turkey.
Mexico adopted legislation regulating the disposal of solid wasteproducts. In response to this legislation, PBG Mexico maintainsagreements with local and federal Mexican governmental authori-ties as well as with civil associations, which require PBG Mexico,and other participating bottlers, to provide for collection and recycling of certain minimum amounts of plastic bottles.
We are not aware of similar material legislation being enacted in any other areas served by us. We are unable to predict, however,whether such legislation will be enacted or what impact its enactment would have on our business, financial condition orresults of operations.
Soft Drink Excise Tax Legislation Specific soft drink excisetaxes have been in place in certain states for several years. The states in which we operate that currently impose such a taxare West Virginia and Arkansas and, with respect to fountainsyrup only, Washington. In Mexico, there are excise taxes on any sweetened beverage products produced without sugar, including our diet soft drinks and imported beverages that are not sweetened with sugar.
Value-added taxes on soft drinks vary in our territories located inCanada, Spain, Greece, Russia, Turkey and Mexico, but are consistent with the value-added tax rate for other consumer products. In addition, there is a special consumption tax applicableto cola products in Turkey. In Mexico, bottled water in containersover 10.1 liters are exempt from value-added tax, and PBGobtained a tax exemption for containers holding less than10.1 liters of water.
We are not aware of any material soft drink taxes that have been enacted in any other market served by us. We are unable to predict, however, whether such legislation will be enacted or what impact its enactment would have on our business, financialcondition or results of operations.
Trade Regulation As a manufacturer, seller and distributor ofbottled and canned soft drink products of PepsiCo and other softdrink manufacturers in exclusive territories in the United Statesand internationally, we are subject to antitrust and competitionlaws. Under the Soft Drink Interbrand Competition Act, soft drink

24
PART I (continued) The Pepsi Bottling Group, Inc.Annual Report 2005
bottlers operating in the United States, such as us, may have anexclusive right to manufacture, distribute and sell a soft drinkproduct in a geographic territory if the soft drink product is in substantial and effective competition with other products of thesame class in the same market or markets. We believe that thereis such substantial and effective competition in each of the exclusive geographic territories in which we operate.
School Sales Legislation; Industry Guidelines In 2004,Congress passed the Child Nutrition Act which requires school districts to implement a school wellness policy by July 2006. As of December 2005, several school districts in PBG’s bottling territories have imposed restrictions on soft drink sales in schools.Additionally, several states have enacted restrictions on soft drinksales in schools. Members of the American Beverage Associationhave endorsed a school vending policy (the “ABA Policy”) that limits the types of beverages sold in elementary, middle and highschools. Also, the beverage associations in the European Unionand various provinces in Canada have recently issued guidelinesrelating to the sale of beverages in schools. PBG intends to fullycomply with the ABA Policy and these guidelines.
California Carcinogen and Reproductive Toxin LegislationA California law requires that any person who exposes another to a carcinogen or a reproductive toxin must provide a warning tothat effect. Because the law does not define quantitative thresh-olds below which a warning is not required, virtually all manufac-turers of food products are confronted with the possibility ofhaving to provide warnings due to the presence of trace amountsof defined substances. Regulations implementing the law exemptmanufacturers from providing the required warning if it can bedemonstrated that the defined substances occur naturally in theproduct or are present in municipal water used to manufacture the product. We have assessed the impact of the law and itsimplementing regulations on our beverage products and have concluded that none of our products currently requires a warningunder the law. We cannot predict whether or to what extent foodindustry efforts to minimize the law’s impact on food products willsucceed. We also cannot predict what impact, either in terms ofdirect costs or diminished sales, imposition of the law may have.
Mexican Water Regulation In Mexico, we pump water from our own wells and we purchase water directly from municipalwater companies pursuant to concessions obtained from theMexican government on a plant-by-plant basis. The concessionsare generally for 10-year terms and can generally be renewed byus prior to expiration with minimal cost and effort. Our concessionsmay be terminated if, among other things, (a) we use materially
more water than permitted by the concession, (b) we use materiallyless water than required by the concession, (c) we fail to pay forthe rights for water usage or (d) we carry out, without governmentauthorization, any material construction on or improvement to, our wells. Our concessions generally satisfy our current waterrequirements and we believe that we are generally in compliancein all material respects with the terms of our existing concessions.
Employees
As of December 31, 2005, we employed approximately66,900 workers, of whom approximately 33,000 were employed in the United States. Approximately 8,900 of our workers in theUnited States are union members and approximately 17,300 of our workers outside the United States are union members. We consider relations with our employees to be good and have not experienced significant interruptions of operations due to labor disagreements.
Financial Information on Industry Segments and Geographic Areas
See Note 15 to PBG’s Consolidated Financial Statements includedin Item 7 below.
ITEM 1A. RISK FACTORS
Our business and operations entail a variety of risks and uncer-tainties, including those described below.
We may not be able to respond successfully to consumertrends related to carbonated and non-carbonated beverages.
Consumers are seeking increased variety in their beverages, and there is a growing interest among the public regarding health and wellness issues. This interest has resulted in a decline in consumer demand for full-calorie carbonated soft drinks and anincrease in consumer demand for products associated with healthand wellness, such as water, reduced calorie carbonated softdrinks and certain non-carbonated beverages. Because we relymainly on PepsiCo to provide us with the products that we sell, ifPepsiCo fails to develop innovative products that respond to theseand other consumer trends this could put us at a competitive disadvantage in the marketplace and adversely affect our businessand financial results.

25
The Pepsi Bottling Group, Inc.Annual Report 2005
We may not be able to respond successfully to the demandsof our largest customers.
Our retail customers are consolidating, leaving fewer customerswith greater overall purchasing power. In addition, two of our customers together comprise approximately 10% of our annualworldwide sales. Because we do not operate in all markets inwhich these customers operate, we must rely on PepsiCo andother PepsiCo bottlers to service such customers outside of ourmarkets. Our inability, or the inability of PepsiCo and PepsiCo bottlers as a whole, to meet the product, packaging and servicedemands of our largest customers could lead to a loss or decreasein business from such customers and have a material adverseeffect on our business and financial results.
We may not be able to compete successfully within the highly competitive carbonated and non-carbonated beverage markets.
The carbonated and non-carbonated beverage markets are bothhighly competitive. Competitive pressures in our markets couldcause us to reduce prices or forego price increases required to off-set increased costs of raw materials and fuel, increase capitaland other expenditures, or lose market share, any of which couldhave a material adverse effect on our business and financial results.
Because we depend upon PepsiCo to provide us with concentrate, certain funding and various services, changesin our relationship with PepsiCo could adversely affect our business and financial results.
We conduct our business primarily under beverage agreementswith PepsiCo. If our beverage agreements with PepsiCo are terminated for any reason, it would have a material adverse effecton our business and financial results. These agreements providethat we must purchase all of the concentrate for such beverages atprices and on other terms which are set by PepsiCo in its sole discretion. Any significant concentrate price increases could materially affect our business and financial results.
PepsiCo has also traditionally provided bottler incentives and funding to its bottling operations. PepsiCo does not have to maintain or continue these incentives or funding. Termination or decreases in bottler incentives or funding levels could materiallyaffect our business and financial results.
Under our shared services agreement, we obtain various servicesfrom PepsiCo, including procurement of raw materials and certainadministrative services. If any of the services under the sharedservices agreement was terminated, we would have to obtainsuch services on our own. This could result in a disruption of suchservices, and we might not be able to obtain these services on
terms, including cost, that are as favorable as those we receivethrough PepsiCo.
Our business requires a significant supply of raw materials,the limited availability or increased costs of which couldadversely affect our business and financial results.
The production of our beverage products is highly dependent oncertain raw materials. In particular, we require significant amountsof aluminum and plastic bottle components, such as resin. We also require access to significant amounts of water. Any sustainedinterruption in the supply of raw materials or any significantincrease in their prices could have a material adverse effect on our business and financial results.
PepsiCo’s equity ownership of PBG could affect matters concerning us.
As of January 27, 2006, PepsiCo owned approximately 46.9% ofthe combined voting power of our voting stock (with the balanceowned by the public). PepsiCo will be able to significantly affectthe outcome of PBG’s stockholder votes, thereby affecting mattersconcerning us.
We may have potential conflicts of interest with PepsiCo,which could result in PepsiCo’s objectives being favoredover our objectives.
Our past and ongoing relationship with PepsiCo could give rise to conflicts of interests. In addition, two members of our Board ofDirectors and one of the three Managing Members of BottlingGroup LLC, our primary operating subsidiary, are Senior VicePresidents of PepsiCo, a situation which may create conflictsof interest.
These potential conflicts include balancing the objectives ofincreasing sales volume of PepsiCo beverages and maintaining orincreasing our profitability. Other possible conflicts could relate to the nature, quality and pricing of services or products providedto us by PepsiCo or by us to PepsiCo.
Conflicts could also arise in the context of our potential acquisitionof bottling territories and/or assets from PepsiCo or other independent PepsiCo bottlers. Under our Master BottlingAgreement, we must obtain PepsiCo’s approval to acquire anyindependent PepsiCo bottler. PepsiCo has agreed not to withholdapproval for any acquisition within agreed upon U.S. territories ifwe have successfully negotiated the acquisition and, in PepsiCo’sreasonable judgment, satisfactorily performed our obligationsunder the master bottling agreement. We have agreed not toattempt to acquire any independent PepsiCo bottler outside ofthose agreed-upon territories without PepsiCo’s prior written approval.

26
PART I (continued) The Pepsi Bottling Group, Inc.Annual Report 2005
Our acquisition strategy may be limited by our ability to successfully integrate acquired businesses into ours or ourfailure to realize our expected return on acquired businesses.
We intend to continue to pursue acquisitions of bottling assets andterritories from PepsiCo’s independent bottlers. The success of our acquisition strategy may be limited because of unforeseencosts and complexities. We may not be able to acquire, integratesuccessfully or manage profitably additional businesses withoutsubstantial costs, delays or other difficulties. Unforeseen costs andcomplexities may also prevent us from realizing our expected rateof return on an acquired business. Any of the foregoing could havea material adverse effect on our business and financial results.
Our success depends on key members of our management, the loss of whom could disrupt our business operations.
Our success depends largely on the efforts and abilities of keymanagement employees. Key management employees are not parties to employment agreements with us. The loss of the servicesof key personnel could have a material adverse effect on our business and financial results.
If we are unable to fund our substantial capital requirements,it could cause us to reduce our planned capital expendituresand could result in a material adverse effect on our businessand financial results.
We require substantial capital expenditures to implement ourbusiness plans. If we do not have sufficient funds or if we areunable to obtain financing in the amounts desired or on acceptableterms, we may have to reduce our planned capital expenditures,which could have a material adverse effect on our business andfinancial results.
Our substantial indebtedness could adversely affect our financial health.
We have a substantial amount of indebtedness, which requires usto dedicate a substantial portion of our cash flow from operationsto payments on our debt. This could limit our flexibility in planningfor, or reacting to, changes in our business and place us at a competitive disadvantage compared to competitors that have lessdebt. Our indebtedness also exposes us to interest rate fluctuations,because the interest on some of our indebtedness is at variable
rates, and makes us vulnerable to general adverse economic andindustry conditions. All of the above could make it more difficult forus, or make us unable, to satisfy our obligations with respect to allor a portion of such indebtedness and could limit our ability toobtain additional financing for future working capital expenditures,strategic acquisitions and other general corporate requirements.
Our foreign operations are subject to social, political and economic risks and may be adversely affected by foreign currency fluctuations.
In the fiscal year ended December 31, 2005, approximately 29% of our net revenues were generated in territories outside the United States. Social, economic and political conditions in ourinternational markets may adversely affect our business and financial results. The overall risks to our international businessesinclude changes in foreign governmental policies and other politicalor economic developments. These developments may lead to newproduct pricing, tax or other policies and monetary fluctuationswhich may adversely impact our business and financial results. In addition, our results of operations and the value of our foreignassets are affected by fluctuations in foreign currency exchange rates.
We may incur material losses and costs as a result of product liability claims that may be brought against us or any product recalls we have to make.
We may be liable if the consumption of any of our products causesinjury or illness. We also may be required to recall products if theybecome contaminated or are damaged or mislabeled. A significantproduct liability or other product-related legal judgment against usor a widespread recall of our products could have a materialadverse effect on our business and financial results.
Newly adopted governmental regulations could increase our costs or liabilities or impact the sale of our products.
Our operations and properties are subject to regulation by variousfederal, state and local government entities and agencies as wellas foreign governmental entities. Such regulations relate to, amongother things, food and drug laws, environmental laws, competitionlaws, taxes, and accounting standards. We cannot assure you thatwe have been or will at all times be in compliance with all regulatoryrequirements or that we will not incur material costs or liabilities in connection with existing or new regulatory requirements.

27
The Pepsi Bottling Group, Inc.Annual Report 2005
ITEM 1B. UNRESOLVED STAFF COMMENTS
None.
ITEM 2. PROPERTIES
As of December 31, 2005, we operated 95 soft drink productionfacilities worldwide, of which 86 were owned and 7 were leased.In addition, one facility used for the manufacture of soft drinkpackaging materials was operated by a PBG joint venture in Turkeyand one facility used for can manufacturing was operated by aPBG joint venture in Ayer, Massachusetts. Of our 546 distributionfacilities, 335 are owned and 211 are leased. We believe that ourbottling, canning and syrup filling lines and our distribution facilitiesare sufficient to meet present needs. We also lease headquartersoffice space in Somers, New York.
We also own or lease and operate approximately 41,000 vehicles,including delivery trucks, delivery and transport tractors and trailersand other trucks and vans used in the sale and distribution of oursoft drink products. We also own more than 2 million coolers, softdrink dispensing fountains and vending machines.
With a few exceptions, leases of plants in the United States and Canada are on a long-term basis, expiring at various times,with options to renew for additional periods. Most internationalplants are leased for varying and usually shorter periods, with or without renewal options. We believe that our properties are in good operating condition and are adequate to serve our current operational needs.
ITEM 3. LEGAL PROCEEDINGS
From time to time we are a party to various litigation proceedingsarising in the ordinary course of our business, none of which, in theopinion of management, is likely to have a material adverse effecton our financial condition or results of operations, including thefollowing proceeding:
At the end of the fourth quarter of 2004 and during the firstthree quarters of 2005, we received Notices of Violation (“NOVs”)and Orders For Compliance from the Environmental ProtectionAgency, Region 9 (“EPA”), relating to operations at four bottlingplants in California and one in Hawaii. The NOVs allege that weviolated our permits and the Clean Water Act as a result of certainevents relating to waste water discharge and storm water run-off.
We have been cooperating with the authorities in their investigationof these matters, including responding to various documentrequests pertaining to our plants in California and each of ourplants in Arizona and Hawaii. In August 2005, we met with representatives of the EPA to discuss the circumstances giving riseto the NOVs and our responses. We believe monetary sanctionsmay be sought in connection with one or more of the NOVs. Wefurther believe that neither the sanctions nor the remediation costsassociated with these NOVs will be material to the Company’sresults of operations or financial condition.
ITEM 4. SUBMISSION OF MATTERS TO A VOTE OF SHAREHOLDERS
None.
Executive Officers of the Registrant
Executive officers are elected by our Board of Directors, and theirterms of office continue until the next annual meeting of the Boardor until their successors are elected and have been qualified.There are no family relationships among our executive officers.
Set forth below is information pertaining to our executive officerswho held office as of February 15, 2006:
John T. Cahill, 48, is our Chairman of the Board and ChiefExecutive Officer. He has been our Chairman of the Board sinceJanuary 2003 and Chief Executive Officer since September 2001.Previously, Mr. Cahill served as our President and Chief OperatingOfficer from August 2000 to September 2001. Mr. Cahill has beena member of our Board of Directors since January 1999 and servedas our Executive Vice President and Chief Financial Officer prior to becoming President and Chief Operating Officer in August 2000.He was Executive Vice President and Chief Financial Officer of thePepsi-Cola Company from April 1998 until November 1998. Prior to that, Mr. Cahill was Senior Vice President and Treasurer ofPepsiCo, having been appointed to that position in April 1997. In1996, he became Senior Vice President and Chief Financial Officerof Pepsi-Cola North America. Mr. Cahill joined PepsiCo in 1989where he held several other senior financial positions through1996. Mr. Cahill is also a director of the Colgate-Palmolive Company.
Alfred H. Drewes, 50, is our Senior Vice President and ChiefFinancial Officer. Appointed to this position in June 2001, Mr.Drewes previously served as Senior Vice President and ChiefFinancial Officer of Pepsi-Cola International (“PCI”). Mr. Drewesjoined PepsiCo in 1982 as a financial analyst in New Jersey.

28
During the next nine years, he rose through increasingly responsi-ble finance positions within Pepsi-Cola North America in fieldoperations and headquarters. In 1991, Mr. Drewes joined PCI asVice President of Manufacturing Operations, with responsibility for the global concentrate supply organization. In 1994, he wasappointed Vice President of Business Planning and New BusinessDevelopment and, in 1996, relocated to London as the VicePresident and Chief Financial Officer of the Europe and Sub-SaharanAfrica Business Unit of PCI.
Eric J. Foss, 47, is our Chief Operating Officer. Previously, Mr.Foss was President of PBG North America from September 2001 to September 2005. Prior to that, Mr. Foss was the Executive VicePresident and General Manager of PBG North America fromAugust 2000 to September 2001. From October 1999 untilAugust 2000, he served as our Senior Vice President, U.S. Salesand Field Operations, and prior to that, he was our Senior VicePresident, Sales and Field Marketing, since March 1999. Mr. Fossjoined Pepsi-Cola Company in 1982 and has held a variety of otherfield and headquarters-based sales, marketing and general management positions. From 1994 to 1996, Mr. Foss was GeneralManager of Pepsi-Cola North America’s Great West Business Unit.In 1996, Mr. Foss was named General Manager for the CentralEurope Region for Pepsi-Cola International, a position he held untiljoining PBG in March 1999. Mr. Foss is also a director of UnitedDominion Realty Trust, Inc.
Yiannis Petrides, 47, is the President of PBG Europe. He wasappointed to this position in June 2000, with responsibilities for our operations in Spain, Greece, Turkey and Russia. Prior to that, Mr. Petrides served as Business Unit General Manager for PBG inSpain and Greece. Mr. Petrides joined PepsiCo in 1987 in the inter-national beverage division. In 1993, he was named GeneralManager of Frito-Lay’s Greek operation with additional responsibilityfor the Balkan countries. In 1995, Mr. Petrides was appointedBusiness Unit General Manager for Pepsi Beverages International’sbottling operation in Spain.
Steven M. Rapp, 52, is our Senior Vice President, GeneralCounsel and Secretary. Appointed to this position in January 2005,Mr. Rapp previously served as Vice President, Deputy GeneralCounsel and Assistant Secretary from 1999 through 2004.Mr. Rapp joined PepsiCo as a corporate attorney in 1986 and wasappointed Division Counsel of Pepsi-Cola Company in 1994.
Rogelio Rebolledo, 61, was appointed President and ChiefExecutive Officer of PBG Mexico in January 2004 and elected toPBG’s Board in May 2004. From 2000 to 2003, Mr. Rebolledo wasPresident and Chief Executive Officer of Frito-Lay International(“FLI”), a subsidiary of PepsiCo, Inc., operating in Latin America,Asia Pacific, Australia, Europe, Middle East and Africa. From 1997to 2000, Mr. Rebolledo was the President of the Latin America/Asia Pacific region for FLI. Mr. Rebolledo joined PepsiCo, Inc. in1976 and held several senior positions including serving asPresident and Chief Executive Officer of the Latin America Regionof PepsiCo Foods International (“PFI”) and President of theSabritas, Gamesa, Brazil and Spain PFI operations. Mr. Rebolledowas elected to serve as a director of Applebee’s International, Inc.beginning in May 2006.
Gary K. Wandschneider, 53, was appointed Executive VicePresident, Worldwide Operations in September 2005. Prior to that,Mr. Wandschneider was our Senior Vice President of Operations, aposition he held since 1997. From 1994 to 1997, Mr. Wandschneiderserved as Vice President of Manufacturing and Logistics. In 1992,he was appointed General Manager for PBG’s Texoma BusinessUnit. Mr. Wandschneider joined Pepsi-Cola North America in 1982 as a Production Manager. He worked in a variety of manufacturing and operations jobs of increasing responsibilityuntil 1990, when he was named Vice President of Operations for Pepsi-Cola North America.
PART I (continued) The Pepsi Bottling Group, Inc.Annual Report 2005

29
PART II The Pepsi Bottling Group, Inc.Annual Report 2005
ITEM 5. MARKET FOR REGISTRANT’S COMMON EQUITY,RELATED SHAREHOLDER MATTERS AND ISSUER PURCHASESOF EQUITY SECURITIES
Stock Trading Symbol – PBG.
Stock Exchange Listings – PBG’s Common Stock is listed on theNew York Stock Exchange. Our Class B common stock is not publicly traded.
Shareholders – As of February 15, 2006, there were approximately56,925 registered and beneficial shareholders of Common Stock.PepsiCo is the holder of all of the outstanding shares of Class Bcommon stock.
Stock Prices – The high and low sales prices for a share of PBGCommon Stock on the New York Stock Exchange, as reported byBloomberg Service, for each fiscal quarter of 2005 and 2004 wereas follows (in dollars):
2005 High Low
First Quarter $29.13 $26.00Second Quarter $30.04 $26.95Third Quarter $30.20 $27.77Fourth Quarter $30.35 $26.66
2004 High Low
First Quarter $29.99 $23.75Second Quarter $30.69 $27.60Third Quarter $31.40 $26.00Fourth Quarter $29.46 $25.70
Dividend Policy – Quarterly cash dividends are usually declared inJanuary, March, July and November and paid at the end of March,June, September and at the beginning of January. The dividendrecord dates for 2006 are expected to be March 10, June 9,September 8 and December 8.
Cash Dividends Declared Per Share on Capital Stock:
Quarter 2005 20041 $.05 $.012 $.08 $.053 $.08 $.054 $.08 $.05Total $.29 $.16
PBG Purchase of Equity Securities – In the fourth quarter of 2005,we repurchased approximately 5 million shares of PBG CommonStock. Since the inception of our share repurchase program inOctober 1999, approximately 101 million shares of PBG CommonStock have been repurchased. Our share repurchases for the fourthquarter of 2005 are as follows:
Maximum Number (or
Total Number Approximate of Shares Dollar Value) (or Units) of Shares
Purchased (or Units) Total as Part of that May Yet
Number Average Publicly Be Purchasedof Shares Price Paid Announced Under the(or Units) per Share Plans or Plans or
Period Purchased(1) (or Unit)(2) Programs(3) Programs(3)
Period 10 09/04/05–10/01/05 2,029,100 $27.99 2,029,100 27,332,000
Period 1110/02/05–10/29/05 2,127,100 $27.88 2,127,100 25,204,900
Period 12 10/30/05–11/26/05 665,000 $28.71 665,000 24,539,900
Period 13 11/27/05–12/31/05 517,300 $29.59 517,300 24,022,600
Total 5,338,500 $28.19 5,338,500
(1) Shares have only been repurchased through publicly announced programs.
(2) Average share price excludes brokerage fees.
(3) The PBG Board has authorized the repurchase of shares of PBG Common Stockon the open market and through negotiated transactions as follows:
Number of SharesDate Share Repurchase Programs Authorized to bewere Publicly Announced Repurchased
October 14, 1999 20,000,000July 13, 2000 10,000,000July 11, 2001 20,000,000May 28, 2003 25,000,000March 25, 2004 25,000,000March 24, 2005 25,000,000Total shares authorized to be repurchased
as of December 31, 2005 125,000,000
Unless terminated by resolution of the PBG Board, each sharerepurchase program expires when we have repurchased all sharesauthorized for repurchase thereunder.

30
PART II (continued) The Pepsi Bottling Group, Inc.Annual Report 2005
ITEM 6. SELECTED FINANCIAL DATA
SELECTED FINANCIAL AND OPERATING DATAin millions, except per share data
Fiscal years ended 2005(1) 2004 2003 2002 2001
Statement of Operations Data:Net revenues $11,885 $10,906 $10,265 $9,216 $8,443Cost of sales 6,253 5,656 5,215 5,001 4,580Gross profit 5,632 5,250 5,050 4,215 3,863Selling, delivery and administrative expenses 4,609 4,274 4,094 3,317 3,187Operating income 1,023 976 956 898 676Interest expense, net 250 230 239 191 194Other non-operating expenses, net 1 1 7 7 –Minority interest 59 56 50 51 41Income before income taxes 713 689 660 649 441Income tax expense(2)(3)(4) 247 232 238 221 136Income before cumulative effect of change in accounting principle 466 457 422 428 305Cumulative effect of change in accounting principle,
net of tax and minority interest – – 6 – –Net income $ 466 $ 457 $ 416 $ 428 $ 305
Per Share Data:(5)
Basic earnings per share $ 1.91 $ 1.79 $ 1.54 $ 1.52 $ 1.07Diluted earnings per share $ 1.86 $ 1.73 $ 1.50 $ 1.46 $ 1.03Cash dividends declared per share $ 0.29 $ 0.16 $ 0.04 $ 0.04 $ 0.04Weighted-average basic shares outstanding 243 255 270 282 286Weighted-average diluted shares outstanding 250 263 277 293 296
Other Financial Data:Cash provided by operations(6) $ 1,219 $ 1,222 $ 1,075 $ 1,009 $ 874Capital expenditures $ (715) $ (688) $ (635) $ (618) $ (585)
Balance Sheet Data (at period end):Total assets(6) $11,524 $10,937 $11,655 $10,142 $7,942Long-term debt $ 3,939 $ 4,489 $ 4,493 $ 4,539 $3,285Minority interest $ 496 $ 445 $ 396 $ 348 $ 319Accumulated other comprehensive loss $ (262) $ (315) $ (380) $ (468) $ (370)Shareholders’ equity $ 2,043 $ 1,949 $ 1,881 $ 1,824 $1,601
(1) Our fiscal year 2005 results included an extra week of activity. The pre-tax income generated from the extra week was spent back in strategic initiatives within our selling, delivery and administrative expenses. The 53rd week had no impact on our net income or diluted earnings per share.
(2) Fiscal year 2001 includes Canada tax law change expense of $25 million. (3) Fiscal year 2003 includes Canada tax law change expense of $11 million. (4) Fiscal year 2004 includes Mexico tax law change benefit of $26 million and international tax restructuring charge of $30 million.(5) Reflects the 2001 two-for-one stock split. (6) Certain reclassifications were made in our Consolidated Financial Statements to prior year amounts to conform to the 2005 presentation.

31
The Pepsi Bottling Group, Inc.Annual Report 2005
ITEM 7. MANAGEMENT’S DISCUSSION ANDANALYSIS OF FINANCIAL CONDITION ANDRESULTS OF OPERATIONS
MANAGEMENT’S FINANCIAL REVIEW
Tabular dollars in millions, except per share data
Overview
The Pepsi Bottling Group, Inc. (“PBG” or the “Company”) is theworld’s largest manufacturer, seller and distributor of Pepsi-Colabeverages. When used in these Consolidated Financial Statements,“PBG,” “we,” “our” and “us” each refers to The Pepsi BottlingGroup, Inc. and, where appropriate, to Bottling Group, LLC, ourprincipal operating subsidiary.
We have the exclusive right to manufacture, sell and distributePepsi-Cola beverages in all or a portion of the U.S., Mexico, Canadaand Europe, which consists of operations in Spain, Greece, Russiaand Turkey. As shown in the graph below, the U.S. business is thedominant driver of our results, generating 61% of our volume, 71%of our revenues and 83% of our operating income.
PBG is the world’s largest manufacturer, seller and distributor ofPepsi-Cola beverages. The beverages sold by us include PEPSI-COLA,DIET PEPSI, MOUNTAIN DEW, AQUAFINA, LIPTON BRISK, SIERRAMIST, DIET MOUNTAIN DEW, TROPICANA JUICE DRINKS, SOBEand STARBUCKS FRAPPUCCINO. In addition to the foregoing, thebeverages we sell outside the U.S. include 7 UP, KAS, AQUA MINERALE, MIRINDA and MANZANITA SOL. In some of our territories, we have the right to manufacture, sell and distributesoft drink products of companies other than PepsiCo, Inc.(“PepsiCo”), including DR PEPPER and SQUIRT. We also have theright in some of our territories to manufacture, sell and distributebeverages under trademarks that we own, including ELECTROPURA,EPURA and GARCI CRESPO.
Our products are sold in either a cold-drink or take-home format.Our cold-drink format consists of cold products sold in the retailand foodservice channels, which carry the highest profit marginson a per-case basis. Our take-home format consists of unchilledproducts that are sold for at-home future consumption.
Physical cases represent the number of units that are actually produced, distributed and sold. Each case of product as sold to ourcustomers, regardless of package configuration, represents onephysical case. Our net price and gross margin on a per-case basisare impacted by how much we charge for the product, the mix ofbrands and packages we sell, and the channels in which the productis sold. For example, we realize a higher net revenue and grossmargin per case on a 20-ounce chilled bottle sold in a conveniencestore than on a two-liter unchilled bottle sold in a grocery store.
Our financial success is dependent on a number of factors, including: our strong partnership with PepsiCo, the customer relationships we cultivate, the pricing we achieve in the market-place, our market execution, our ability to meet changing consumerpreferences and the efficiency we achieve in manufacturing anddistributing our products. Key indicators of our financial successare measured by the number of physical cases we sell, the netprice and gross margin we achieve on a per-case basis, and ouroverall cost productivity, reflecting how well we manage our rawmaterial, manufacturing, distribution and other overhead costs.
The following discussion and analysis covers the key driversbehind our business performance in 2005 and is categorized intothe following sections:
• Items that affect historical or future comparability • Financial performance summary • Critical accounting policies • Related party transactions • Results of operations • Liquidity and financial condition and • Market risks and cautionary statements.
The discussion and analysis throughout Management’s FinancialReview should be read in conjunction with the ConsolidatedFinancial Statements and the related accompanying notes. Thepreparation of our Consolidated Financial Statements in conformitywith accounting principles generally accepted in the United Statesof America (“U.S. GAAP”) requires us to make estimates andassumptions that affect the reported amounts in our ConsolidatedFinancial Statements and the related accompanying notes, includingvarious claims and contingencies related to lawsuits, taxes, environmental and other matters arising out of the normal courseof business. We use our best judgment, based on the advice of external experts and our knowledge of existing facts and circumstances and actions that we may undertake in the future,
14%
18%
61%
7%
11%
10%
8%
71%
8%6%3%
83%
Volume1.6 Billion
Revenues $11.9 Billion
Operating Income $1.0 Billion
United States Canada Mexico Europe

32
PART II (continued) The Pepsi Bottling Group, Inc.Annual Report 2005
in determining the estimates that affect our ConsolidatedFinancial Statements.
Items That Affect Historical or Future Comparability
High Fructose Corn Syrup (“HFCS”) SettlementIncluded in our selling, delivery and administrative expenses for2005 was a pre-tax gain of $29 million in the U.S. from the settlementof the HFCS class action lawsuit. The lawsuit related to purchasesof high fructose corn syrup by several companies, including bottlingentities owned and operated by PepsiCo, during the period fromJuly 1, 1991 to June 30, 1995 (the “Claims Period”). Certain of thebottling entities owned by PepsiCo during the Claims Period weretransferred to PBG when PepsiCo formed PBG in 1999. Withrespect to these entities, which we currently operate, we received$23 million in HFCS settlement proceeds. We received an additional$6 million in HFCS settlement proceeds related to bottling operationsnot previously owned by PepsiCo, such as manufacturing co-operatives of which we are a member.
53rd Week Our fiscal year ends on the last Saturday in December and, as aresult, a 53rd week is added every five or six years. Fiscal year2005 consisted of 53 weeks while fiscal years 2004 and 2003 consisted of 52 weeks. Our 2005 results included pre-tax incomeof approximately $19 million due to the 53rd week.
Strategic Spending Initiatives We reinvested both the pre-tax gain of $29 million from the HFCS settlement and the pre-tax income of $19 million from the53rd week in long-term strategic spending initiatives in the U.S.,Canada and Europe. The strategic spending initiatives includedprograms designed primarily to enhance our customer serviceagenda, drive productivity and improve our management informationsystems. These strategic spending initiatives were recorded inselling, delivery and administrative expenses.
Non-GAAP Measurements and Adjusted Results We prepare our consolidated financial statements in conformitywith U.S. GAAP. In an effort to provide investors with additionalinformation regarding the Company’s results we have included inthis document certain “non-GAAP” measures as defined by theSecurities and Exchange Commission. Specifically, we have presented “non-GAAP” measures to supplement our FinancialPerformance Summary and our 2006 Outlook. We have excludedthe impact of the HFCS Settlement, the 53rd Week and theStrategic Spending Initiatives from our 2005 results and from certain items in our 2006 Outlook as we consider these items asunusual and outside of the ordinary course of our business.Management believes these “non-GAAP” financial measures provide useful information to investors regarding the underlyingbusiness performance of the Company’s ongoing results andshould be considered in addition to, not in lieu of, U.S. GAAPreported measures. “Non-GAAP” measures used in this documentare referred to as “adjusted.”
The tables below and on the next page illustrate the approximate dollars and percentage points of operating income growth that theseunusual items contributed to our 2005 operating results.
HFCS Spending Adjusted in millions, except per share data Reported Settlement 53rd Week Initiatives Results*
Revenue $11,885 $ 0 $ (139) $ 0 $11,746Cost of sales 6,253 0 (72) 0 6,181Gross profit 5,632 0 (67) 0 5,565Selling, delivery and administrative expenses 4,609 29 (43) (48) 4,547Operating income/(loss) 1,023 (29) (24) 48 1,018Interest expense, net 250 0 (5) 0 245Other non-operating expense, net 1 0 0 0 1Minority interest 59 (2) (1) 3 59Income before taxes 713 (27) (18) 45 713Income taxes 247 (9) (6) 15 247Net income $ 466 $ (18) $ (12) $ 30 $ 466Diluted EPS $ 1.86 $(0.07) $(0.05) $0.12 $ 1.86
*See Non-GAAP Measurements and Adjusted Results for further information.

33
The Pepsi Bottling Group, Inc.Annual Report 2005
Operating Income Growth Rates FY 2005
Reported Operating Income 5%HFCS Settlement (3%)53rd Week Impact (2%)Strategic Spending Initiatives 4%Adjusted Operating Income* 4%
*See Non-GAAP Measurements and Adjusted Results on previous page for further information.
Financial Performance Summary
December 31, December 25, Fiscal Yearin millions, except per share data 2005 2004 % Change
Net revenues $11,885 $10,906 9%Gross profit $ 5,632 $ 5,250 7%Operating income $ 1,023 $ 976 5%Net income $ 466 $ 457 2%Diluted earnings per share $ 1.86 $ 1.73 7%
During 2005, we delivered strong results, reflecting robust toplinegrowth which was partially offset by higher raw material costs and selling, delivery and administrative expenses. Overall, we grewour worldwide operating income by five percent, which includes aone percentage point benefit from the net impact of the 53rd week,the gain from the HFCS settlement and spending initiatives. Theseresults were driven by operating income growth in the U.S. ofsix percent, of which two percentage points were driven by theunusual items discussed above, coupled with double-digitincreases in Mexico and Canada. This growth was partially offsetby a double-digit operating income decrease in Europe, driven bydeclines in Spain. Our operating income growth in Mexico, whichincludes the lapping of a $9 million impairment charge in 2004,was below our expectations due mostly to lower than anticipatedcost savings in our selling, delivery and administrative expenses.
Our strong worldwide topline growth was driven by innovation,including new products, pricing improvements and strong executionin the marketplace as well as the impact of the 53rd week. Growthwas driven primarily by an approximate three-percent increase in volume and a three-percent increase in net revenue per case. The impact of the 53rd week, the effect of foreign currency translation and acquisitions each contributed a percentage pointto our topline growth.
In the U.S., we achieved a five-percent volume increase, whichincludes three percentage points of growth due to the 53rd weekand acquisitions. The balance of the growth was due primarily tovolume increases in both large format stores and our foodservicebusiness which consists of restaurants and workplaces. These volume increases were driven by a three-percent increase in ourtake-home channel and a two-percent increase in our cold-drinkchannel. Our portfolio growth was in line with consumer trends,with most of the volume increase coming from our water,
non-carbonated and diet portfolios. In the U.S., net revenue percase increased three percent, driven primarily by rate increases.
In Canada, topline growth of 14 percent was driven primarily by the favorable impact of foreign currency translation, coupledwith a net revenue per case increase of three percent and volumeimprovements of two percent, as well as the 53rd week. Volumeand pricing growth was fueled by strong execution and strategicmarketing programs that were designed to gain consumer interest.
In Europe, we delivered strong topline results, growing net revenues by 12 percent versus the prior year, driven by double-digit volume growth in Russia and Turkey.
Our Mexico topline growth of 10 percent was driven primarily byvolume growth of five percent and the favorable impact of foreigncurrency translation. Our volume growth in Mexico was fueled by double-digit increases in both our bottled water and jug businesses, partially offset by slight declines in our carbonatedsoft drink business.
Our strong worldwide topline growth was partially offset byincreases in cost of sales, which have continued to pressure ourbottom line results. On a per-case basis, cost of sales increasedfive percent, reflecting significant increases in raw material costs.During 2005, we continued to see increases in resin prices, exacerbated by a severe hurricane season in the U.S. Theseincreases added approximately $100 million of costs or approximatelytwo percentage points of growth to our worldwide cost of salesper case. Additionally, the negative impact of foreign currencytranslation contributed one percentage point of growth to our cost of sales per case increase.
Worldwide selling, delivery and administrative expenses increasedeight percent. Increases in selling, delivery and administrative costswere driven by higher volume growth, wage and benefit increases and rising fuel prices. Additionally, the strategic spending initia-tives and the additional expenses from the 53rd week, partially offset by the gain from the settlement of the HFCS class action lawsuit, added approximately one percentage point of growth toour overall selling, delivery and administrative expenses. Thestrategic spending initiatives included programs to implement ournew customer service program, drive productivity and improve our management information systems.
Interest expense, net increased by $20 million due to the impact of rising interest rates on approximately 26 percent of our debtthat is variable, coupled with the impact of the 53rd week.
The Company’s cash flow from operations continued to be strongin 2005. We generated $1.2 billion of cash from operations, aftercontributing $77 million into our pension plans, which are

34
PART II (continued) The Pepsi Bottling Group, Inc.Annual Report 2005
adequately funded. With our strong cash flows, we utilized$715 million for capital investments to grow our business andreturned $554 million to our shareholders through share repurchasesand dividends during the year. During 2005, we increased our annualdividend by 60 percent, raising it from $0.20 to $0.32 per share.
2006 Outlook
In 2006, our fiscal year will consist of 52 weeks, while fiscal year2005 consisted of 53 weeks. Our U.S. and Canadian operationsreport on a fiscal year that consists of 52 weeks, ending on the lastSaturday in December. Every five or six years a 53rd week isadded. Our other countries report on a calendar-year basis.
Our 2005 results included the impact of the 53rd week. In order to provide comparable guidance for 2006, we have excluded theimpact of the 53rd week from our volume outlook, as described in the table below.
As discussed in Note 2 in the Notes to the Consolidated FinancialStatements, the Company will adopt Statement of FinancialAccounting Standards No. 123 (revised 2004), “Share-BasedPayment” (“SFAS 123R”) in the first quarter of 2006. SFAS 123Rwill require that all stock-based payments be expensed based onthe fair value of the awards. In accordance with existing accountingguidelines, the Company did not recognize compensation expensefor stock options during fiscal year 2005. Therefore, managementbelieves that providing an adjusted measure that excludes theimpact of SFAS 123R from the 2006 Outlook provides a meaningfulyear-over-year comparison of SD&A, operating income change anddiluted earnings per share. The tables below provide an adjustedforecast by excluding, where applicable, the impact of the53rd week and the impact of the adoption of SFAS 123R in 2006:
Adjusted Forecasted Impact of Forecasted
2006 vs. 53rd week Impact of 2006 vs. 2005 growth in 2005 SFAS 123R 2005 growth*
Worldwide Volume 2% 1% – 3%U.S. Volume Flat to 1% 1% – 1 to 2%Worldwide Operating
Income (in dollars) (2%) to (4%) – 7% 3% to 5%
Full-Year Adjusted Forecasted Full-Year
2006 Impact of Forecasted Results SFAS 123R Results*
Worldwide SD&A (in millions) $4,807–$4,858 $ (70) $4,737–$4,788
Diluted Earnings Per Share $1.76 to $1.84 $0.18 $1.94 to $2.02
*See Non-GAAP Measurements and Adjusted Results in Items that Affect Historical or FutureComparability on page 32 for further information.
In 2006, we will carefully balance our net revenue per case, usingrate increases where marketplace conditions allow, while alsomanaging the mix of products we plan to sell. We expect toincrease both our worldwide and U.S. net revenue per case two to three percent, driven primarily by rate improvements, coupledwith a mix shift into higher-priced products.
In 2006, worldwide cost of sales per case is expected to increaseby approximately three percent. We are expecting the rate ofgrowth of our raw material costs, particularly resin and sweeteners,to moderate during 2006. Nonetheless we anticipate that our rawmaterial costs, including aluminum, resin and sweeteners willincrease in the low single digits in 2006. As a result, we expect our gross margin per case to grow about two percent.
Our selling, delivery and administrative expenses are expected torise approximately four to five percent, including increases in fuelcost and higher pension expense, each contributing approximately$20 million of additional expense. The impact of adopting SFAS123R will add approximately $70 million to our overall SD&A andresult in a seven percentage point reduction in our operating income.Accordingly, we expect our operating income to be down two tofour percent for the year.
In 2006, we expect interest expense to increase to approximately$270 million, reflecting the impact of rising interest rates on approxi-mately 26 percent of our debt that is variable, coupled with increasedinterest associated with anticipated debt financings in 2006.
From a cash flow perspective, we expect to generate net cash provided by operations of over $1.2 billion and we plan to spendapproximately $735 million in capital investments. Net cash provided by operations less capital expenditures is expected to be $500 to $520 million in 2006. Our cash flows from operations in2006 are expected to increase versus 2005 due to lower pensioncontributions and a greater mix of non-cash charges in 2006.
Critical Accounting Policies
The preparation of our consolidated financial statements in conformity with U.S. GAAP often requires us to make judgments,estimates, and assumptions regarding uncertainties that affect the results of operations, financial position and cash flows of theCompany, as well as the related footnote disclosures. Manage-ment bases its estimates on knowledge of our operations, marketsin which we operate, historical trends, and other assumptions.Actual results could differ from these estimates under differentassumptions or conditions. Significant accounting policies are discussed in the Notes to the Consolidated Financial Statements.Our critical accounting policies are those policies that manage-ment believes are most important to the portrayal of PBG’s financialcondition and results of operations and require the use of estimates,
35
The Pepsi Bottling Group, Inc.Annual Report 2005
assumptions and the application of judgment. Management hasreviewed these critical accounting policies and related disclosureswith the Audit and Affiliated Transactions Committee of ourBoard of Directors.
Allowance for Doubtful AccountsA portion of our accounts receivable will not be collected due to bank-ruptcies and sales returns. Estimating an allowance for doubtfulaccounts requires significant management judgment and assumptionsregarding the potential for losses on receivable balances.
Our accounting policy for the provision for doubtful accountsrequires reserving an amount based on the evaluation of the agingof accounts receivable, sales return trend analysis, detailed analysis of high-risk customer accounts, and the overall marketand economic conditions of our customers. Accordingly, we estimatethe amounts necessary to provide for losses on receivables byusing quantitative measures, evaluating specific customer accountsfor risk of loss, and adjusting for changes in economic conditionsin which we and our customers operate.
We manage the risk of losses on accounts receivable by havingeffective credit controls and by evaluating our receivables on anongoing basis. Our allowance for doubtful accounts representsmanagement’s best estimate of probable losses inherent in ourportfolio. If a general economic downturn occurs causing the financialcondition of our customers to deteriorate or if one of our customershas an unforeseen inability to pay us, the allowance for doubtfulaccounts and bad debt expense would be increased from our estimate.
The following is an analysis of the allowance for doubtful accountsfor the fiscal years ended December 31, 2005, December 25, 2004and December 27, 2003:
Allowance for Doubtful Accounts
2005 2004 2003
Beginning of the year $ 61 $72 $67Bad debt expense 3 (5) 12Accounts written off (12) (7) (8)Foreign currency translation (1) 1 1End of the year $ 51 $61 $72
Recoverability of Goodwill and Intangible Assets withIndefinite Lives Goodwill and intangible assets with indefinite useful lives arenot amortized, but instead tested annually for impairment.
Our identified intangible assets principally arise from the allocationof the purchase price of businesses acquired, and consist primarilyof franchise rights, distribution rights and brands. We assignamounts to such identified intangibles based on their estimated
fair values at the date of acquisition. The determination of theexpected life will be dependent upon the use and underlying characteristics of the identified intangible asset. In determiningwhether our intangible assets have an indefinite useful life, weconsider the following as applicable: the nature and terms ofunderlying agreements; our intent and ability to use the specificasset contained in an agreement; the age and market position of the products within the territories we are entitled to sell; the historical and projected growth of those products; and costs, ifany, to renew the agreement.
We evaluate our identified intangible assets with indefinite usefullives for impairment annually (unless it is required more frequentlybecause of a triggering event). We measure impairment as theamount by which the carrying value exceeds its estimated fair value.
The fair value of our franchise rights and distribution rights ismeasured using a multi-period excess earnings method that is based upon estimated discounted future cash flows. Wededuct a contributory charge from our net after-tax cash flows for the economic return attributable to our working capital, otherintangible assets and property, plant and equipment, which represents the required cash flow to support these assets. Thenet discounted cash flows in excess of the fair returns on theseassets represent the estimated fair value of our franchise rightsand distribution rights.
The fair value of our brands is measured using a multi-period royaltysavings method, which reflects the savings realized by owning the brand and, therefore, not having to pay a royalty fee to a thirdparty. In valuing our brands, we have selected an estimated industry royalty rate relating to each brand and then applied it to the forecasted revenues associated with each brand. The net discounted after-tax cash flows from these royalty charges represent the fair value of our brands.
Our discount rate utilized in each fair value calculation is basedupon our weighted-average cost of capital plus an additional riskpremium to reflect the risk and uncertainty inherent in separatelyacquiring the identified intangible asset between a willing buyerand a willing seller. The additional risk premium associated withour discount rate effectively eliminates the benefit that we believeresults from synergies, scale and our assembled workforce, all ofwhich are components of goodwill. Each year we re-evaluate ourassumptions in our discounted cash flow model to addresschanges in our business and marketplace conditions.
We evaluate goodwill on a country-by-country basis (“reportingunit”) for impairment. We evaluate each reporting unit for impairmentbased upon a two-step approach. First, we compare the fair valueof our reporting unit with its carrying value. Second, if the carryingvalue of our reporting unit exceeds its fair value, we compare the

36
PART II (continued) The Pepsi Bottling Group, Inc.Annual Report 2005
implied fair value of the reporting unit’s goodwill to its carryingamount to measure the amount of impairment loss. In measuringthe implied fair value of goodwill, we would allocate the fair valueof the reporting unit to each of its assets and liabilities (includingany unrecognized intangible assets). Any excess of the fair valueof the reporting unit over the amounts assigned to its assets andliabilities is the implied fair value of goodwill.
We measure the fair value of a reporting unit as the discountedestimated future cash flows, including a terminal value, whichassumes the business continues in perpetuity, less its respectiveminority interest and net debt (net of cash and cash equivalents).Our long-term terminal growth assumptions reflect our currentlong-term view of the marketplace. Our discount rate is basedupon our weighted-average cost of capital for each reporting unit.Each year we re-evaluate our assumptions in our discounted cash flow model to address changes in our business and marketplace conditions.
Considerable management judgment is necessary to estimate discounted future cash flows in conducting an impairment test forgoodwill and other identified intangible assets, which may beimpacted by future actions taken by us and our competitors andthe volatility in the markets in which we conduct business. Achange in assumptions in our cash flows could have a significantimpact on the fair value of our reporting units and other identifiedintangible assets, which could then result in a material impairmentcharge to our results of operations. For example, an inability toachieve strategic business plan targets in a reporting unit couldresult in an impairment charge of one or more specific intangibleassets. In Mexico, we have recorded approximately $1 billion ofintangible assets. Mexico has not met our profit expectations;however, we have specific plans in place to improve our futureresults. We will continue to closely monitor our performance inMexico and evaluate the realizability of each intangible asset.
Pension and Postretirement Medical Benefit PlansWe sponsor pension and other postretirement medical benefitplans in various forms, covering employees who meet specifiedeligibility requirements. Our U.S. employees participate in noncon-tributory defined benefit pension plans, which cover substantiallyall full-time salaried employees, as well as most hourly employ-ees. Our net pension expense for the defined benefit plans for ouroperations outside the U.S. was not significant, and accordinglyassumptions and sensitivity analyses regarding these plans arenot included in the discussion below.
Assumptions and estimates are required to calculate the expensesand obligations for these plans including discount rate, expectedreturn on plan assets, retirement age, mortality, turnover, healthcare cost trend rates and compensation rate increases.
We evaluate these assumptions with our actuarial advisors on an annual basis and we believe that they are appropriate. Ourassumptions are based upon historical experience of the plan andexpectations for the future. These assumptions may differ materi-ally from actual results due to changing market and economic con-ditions. An increase or decrease in the assumptions or economicevents outside our control could have a material impact onreported net income and the related funding requirements.
Key AssumptionsThe assets, liabilities and assumptions used to measure pension and postretirement medical expense for any fiscal yearare determined as of September 30th of the preceding year (“measurement date”).
The discount rate assumption is derived from the present value ofour expected pension and postretirement medical benefit paymentstreams. The present value is calculated by utilizing a yield curvethat matches the timing of our expected benefit payments. Theyield curve is developed by our actuarial advisers using a portfolioof several hundred high quality non-callable corporate bonds. The bonds are rated Aa or better by Moody’s and have at least$250 million in principal amount. The bonds are denominated inU.S. dollars and have maturity dates ranging from six months tothirty years. Once the present value of all the expected paymentstreams has been calculated, a single discount rate is determined.The weighted-average discount rate for fiscal year 2006 for ourpension and postretirement medical plans is 5.80 percent and5.55 percent, respectively.
In evaluating the expected rate of return on assets for a given fiscalyear, we consider both projected future returns of asset classes andthe actual 10 to 15-year historic returns on asset classes in our pension investment portfolio, reflecting the weighted-averagereturn of our asset allocation. Our target asset allocation for ourdomestic pension assets is 75 percent equity investments, of whichapproximately 80 percent is invested in domestic equities and20 percent is invested in foreign equities. The remaining 25 percentof our plan assets is invested primarily in fixed income securities,which is equally divided between U.S. government and corporatebonds. Our current portfolio’s target asset allocation for the 10 and15-year periods had weighted-average returns of 8.80 percent and10.80 percent, respectively. Over time, the expected rate of returnon pension plan assets should approximate the actual long-termreturns. Based on the historic and estimated future returns of ourportfolio, we estimate the long-term rate of return on assets for our domestic pension plans to be 8.50 percent in 2006.

37
The Pepsi Bottling Group, Inc.Annual Report 2005
Pension and Postretirement Medical Plans AccountingDifferences between actual and expected returns on plan assetsare recognized in the net periodic pension calculation overfive years. To the extent the amount of all unrecognized gains andlosses exceeds 10 percent of the larger of the benefit obligationor plan assets, such amount is amortized over the averageremaining service period of active participants. Net unrecognizedlosses within our pension and postretirement plans totaled$611 million and $603 million at December 31, 2005 andDecember 25, 2004, respectively.
The following table provides our current and expected weighted-average assumptions for our pension and postretirement medicalplans’ expense in the United States:
Pension 2006 2005
Discount rate 5.80% 6.15%Expected return on plan assets
(net of administrative expenses) 8.50% 8.50%Rate of compensation increase 3.53% 3.60%
Postretirement 2006 2005
Discount rate 5.55% 6.15%Rate of compensation increase 3.53% 3.60%Health care cost trend rate 9.00% 10.00%
During 2005, our Company-sponsored defined benefit pension andpostretirement medical plan expenses in the U.S. totaled $109 mil-lion, including a special termination benefit charge of $9 millionfor a voluntary early retirement enhancement program. In 2005,our ongoing pension and postretirement medical plan expenses,excluding the special termination benefit charge, were $100 million.In 2006, our ongoing expenses will increase by approximately$19 million to $119 million due primarily to the following factors:
• A decrease in our weighted-average discount rate for our pension and postretirement medical expense from 6.15 percentand 6.15 percent to 5.80 percent and 5.55 percent, respectively,reflecting declines in the yields of long-term corporate bondscomprising the yield curve. This change in assumption willincrease our 2006 defined benefit pension and postretirementmedical expense by approximately $12 million.
• Certain benefit plan enhancements and demographic changeswill increase our 2006 defined benefit pension and post-retirement medical expense by approximately $7 million.
Sensitivity AnalysisIt is unlikely that in any given year the actual rate of return will bethe same as the assumed long-term rate of return of 8.50 percent.The following table provides a summary of the last three years ofactual returns versus the expected long-term returns for ourdomestic pension plans:
2005 2004 2003
Expected return on plan assets (net of administrative expenses) 8.50% 8.50% 8.50%
Actual return on plan assets (net of administrative expenses) 13.33% 11.61% 19.79%
Sensitivity of changes in key assumptions for our principal pensionand postretirement plans’ expense in 2006 are as follows:
• Discount rate – A 25-basis point change in the discount ratewould increase or decrease the expense for our pension andpostretirement medical benefit plans in 2006 by approximately$9 million.
• Expected return on plan assets – A 25-basis point change in theexpected return on plan assets would increase or decrease theexpense for our pension plans in 2006 by approximately $3 mil-lion. The postretirement medical benefit plans have no expectedreturn on plan assets as they are funded from the general assetsof the Company as the payments come due.
For further information about our pension and postretirement planssee Note 12 in the Notes to Consolidated Financial Statements.
Casualty Insurance CostsDue to the nature of our business, we require insurance coverage forcertain casualty risks. In the United States we are self-insured forworkers’ compensation and automobile risks for occurrences up to $10million, and product and general liability risks for occurrences up to $5million. For losses exceeding these self-insurance thresholds, we pur-chase casualty insurance from a third-party provider.
Our liability for casualty costs of $188 million and $169 million as of December 31, 2005 and December 25, 2004, respectively, isestimated using individual case-based valuations and statisticalanalyses and is based upon historical experience, actuarialassumptions and professional judgment. We do not discount our loss expense reserves. These estimates are subject to theeffects of trends in loss severity and frequency and are subject to a significant degree of inherent variability. We evaluate these estimates with our actuarial advisors periodically during the yearand we believe that they are appropriate, although an increase or decrease in the estimates or events outside our control could have a material impact on reported net income. Accordingly, the

38
PART II (continued) The Pepsi Bottling Group, Inc.Annual Report 2005
ultimate settlement of these costs may vary significantly from theestimates included in our financial statements.
Income TaxesOur effective tax rate is based on pre-tax income, statutory taxrates, tax regulations and tax planning strategies available to us inthe various jurisdictions in which we operate. The tax bases of ourassets and liabilities reflect our best estimate of the tax benefitsand costs we expect to realize. We establish valuation allowancesto reduce our deferred tax assets to an amount that will more likelythan not be realized. A significant portion of deferred tax assetsconsists of net operating loss carryforwards (“NOLs”). We haveNOLs totaling $1,146 million at December 31, 2005, which areavailable to reduce future taxes in the U.S., Spain, Greece, Russia,Turkey and Mexico. The majority of our NOLs are generated over-seas, the largest of which is coming from our Mexican andSpanish operations. Of these NOLs, $6 million expire in 2006 and$1,140 million expire at various times between 2007 and 2025.
Significant management judgment is required in determining oureffective tax rate and in evaluating our tax position. We establishreserves when, based on the applicable tax law and facts and circumstances relating to a particular transaction or tax position, it becomes probable that the position will not be sustained whenchallenged by a taxing authority. A change in our tax reservescould have a significant impact on our results of operations.
Under our tax separation agreement with PepsiCo, PepsiCo maintains full control and absolute discretion for any combined orconsolidated tax filings for tax periods ended on or before our initial public offering that occurred in March 1999. However, PepsiComay not settle any issue without our written consent, which consent cannot be unreasonably withheld. PepsiCo has contractuallyagreed to act in good faith with respect to all tax examination matters affecting us. In accordance with the tax separation agreement, we will bear our allocable share of any risk or benefitresulting from the settlement of tax matters affecting us for thesetax periods.
A number of years may elapse before a particular matter for whichwe have established a tax contingency reserve is audited and finallyresolved. The number of years for which we have audits that areopen varies depending on the tax jurisdiction. The U.S. InternalRevenue Service (“IRS”) is currently examining our and PepsiCo’sjoint tax returns for 1998 through March 1999 and our tax returnsfor the 2001 and 2002 tax years. The IRS audit of our 1999 and2000 tax returns concluded in 2005. However, pursuant to anagreement with the IRS, our 1999 and 2000 tax years remain open
solely with respect to matters arising out of the IRS examination of PepsiCo involving our initial public offering transaction onMarch 31,1999. While it is often difficult to predict the final outcome or the timing of the resolution, we believe that our taxreserves reflect the probable outcome of known tax contingencies.Favorable resolutions would be recognized as a reduction of ourtax expense in the year of resolution. Unfavorable resolutionswould be recognized as a reduction to our reserves, a cash outlayfor settlement and a possible increase to our annual tax provision.
For further information about our income taxes see Note 14 in theNotes to Consolidated Financial Statements.
Related Party Transactions
PepsiCo is considered a related party due to the nature of our fran-chise relationship and its ownership interest in our company. More than 80 percent of our volume is derived from the sale ofbrands from PepsiCo. At December 31, 2005, PepsiCo ownedapproximately 41.2 percent of our outstanding common stock and100 percent of our outstanding class B common stock, togetherrepresenting approximately 46.8 percent of the voting power of allclasses of our voting stock. In addition, PepsiCo owns 6.7 percentof the equity of Bottling Group, LLC, our principal operating subsidiary.We fully consolidate the results of Bottling Group, LLC and present PepsiCo’s share as minority interest in our ConsolidatedFinancial Statements.
Our business is conducted primarily under beverage agreementswith PepsiCo, including a master bottling agreement, a non-colabottling agreement and a master syrup agreement. Additionally,under a shared services agreement, we obtain various servicesfrom PepsiCo, which include services for information technologymaintenance and the procurement of raw materials. We also provide services to PepsiCo, including facility and credit and collection support.
We review our annual marketing, advertising, management andfinancial plans each year with PepsiCo for its approval. If we fail to submit these plans, or if we fail to carry them out in all materialrespects, PepsiCo can terminate our beverage agreements. Becausewe depend on PepsiCo to provide us with concentrate, bottlerincentives and various services, changes in our relationship withPepsiCo could have a material adverse effect on our business andfinancial results.

39
The Pepsi Bottling Group, Inc.Annual Report 2005
The Consolidated Statements of Operations include the followingincome (expense) amounts as a result of transactions with PepsiCoand its affiliates:
2005 2004 2003
Net revenues:Bottler incentives(a) $ 51 $ 22 $ 21
Cost of sales:Purchases of concentrate and
finished products, and AQUAFINA royalty fees(b) $(2,993) $(2,741) $(2,527)
Bottler incentives(a) 559 522 527Manufacturing and distribution
service reimbursements(c) – – 6$(2,434) $(2,219) $(1,994)
Selling, delivery and administrative expenses:
Bottler incentives(a) $ 78 $ 82 $ 98Fountain service fee(d) 183 180 200Frito-Lay purchases(e) (144) (75) (51)Shared services(f):
Shared services expense (69) (68) (72)Shared services revenue 8 10 10
Net shared services (61) (58) (62)HFCS(h) 23 – –
$ 79 $ 129 $ 185Income tax benefit(g) $ 3 $ 17 $ 7
(a) Bottler Incentives and Other Arrangements – In order to promote PepsiCo beverages, PepsiCo, at its sole discretion, provides us with various forms of bottler incentives. Theseincentives cover a variety of initiatives, including direct market-place support and advertising support. We record most of theseincentives as an adjustment to cost of sales unless the incentiveis for reimbursement of a specific, incremental and identifiablecost. Under these conditions, the incentive would be recordedas an offset against the related costs, either in revenue or selling, delivery and administrative expenses. Changes in ourbottler incentives and funding levels could materially affect our business and financial results.
(b) Purchase of Concentrate and Finished Product – As part of ourfranchise relationship, we purchase concentrate from PepsiCo,pay royalties and produce or distribute other products throughvarious arrangements with PepsiCo or PepsiCo joint ventures.The prices we pay for concentrate, finished goods and royaltiesare determined by PepsiCo at its sole discretion. Concentrateprices are typically determined annually. In February 2005,PepsiCo increased the price of U.S. concentrate by two percent.PepsiCo has recently announced a further increase of approxi-mately two percent, effective February 2006. Significantchanges in the amount we pay PepsiCo for concentrate,
finished goods and royalties could materially affect our business and financial results. These amounts are reflected incost of sales in our Consolidated Statements of Operations.
(c) Manufacturing and Distribution Service Reimbursements –In 2003, we provided manufacturing services to PepsiCo andPepsiCo affiliates in connection with the production of certainfinished beverage products.
(d) Fountain Service Fee – We manufacture and distribute fountainproducts and provide fountain equipment service to PepsiCocustomers in some territories in accordance with the Pepsi beverage agreements. Amounts received from PepsiCo forthese transactions are offset by the cost to provide these services and are reflected in our Consolidated Statements ofOperations in selling, delivery and administrative expenses.
(e) Frito-Lay Purchases – We purchase snack food products fromFrito-Lay, Inc., a subsidiary of PepsiCo, for sale and distributionin Russia. Amounts paid to PepsiCo for these transactions arereflected in selling, delivery and administrative expenses in ourConsolidated Statements of Operations.
(f) Shared Services – We provide to and receive various servicesfrom PepsiCo and PepsiCo affiliates pursuant to a shared services agreement and other arrangements. In the absence of these agreements, we would have to obtain such services on our own. We might not be able to obtain these services onterms, including cost, which are as favorable as those wereceive from PepsiCo. Total expenses incurred and income generated are reflected in selling, delivery and administrativeexpenses in our Consolidated Statements of Operations.
(g) Income Tax Benefit – Under our tax separation agreement withPepsiCo, PepsiCo maintains full control and absolute discretionfor any combined or consolidated tax filings for tax periodsended on or before our initial public offering that occurred inMarch 1999. PepsiCo has contractually agreed to act in goodfaith with respect to all tax examination matters affecting us. In accordance with the tax separation agreement, we will bearour allocable share of any risk or benefit resulting from the settlement of tax matters affecting us for these periods.
(h) High Fructose Corn Syrup (“HFCS”) Settlement – On June 28,2005, Bottling Group, LLC and PepsiCo entered into a settlementagreement related to the allocation of certain proceeds fromthe settlement of the HFCS class action lawsuit. The lawsuitrelated to purchases of high fructose corn syrup by several companies, including bottling entities owned and operated byPepsiCo, during the period from July 1, 1991 to June 30, 1995(the “Class Period”). Certain of the bottling entities owned byPepsiCo were transferred to PBG when PepsiCo formed PBG in

40
PART II (continued) The Pepsi Bottling Group, Inc.Annual Report 2005
1999 (the “PepsiCo Bottling Entities”). Under the settlementagreement with PepsiCo, the Company ultimately received45.8 percent (or approximately $23 million) of the total recoveryrelated to HFCS purchases by PepsiCo Bottling Entities duringthe Class Period.
As of December 31, 2005 and December 25, 2004, the receivablesfrom PepsiCo and its affiliates were $143 million and $150 million,respectively. These balances are shown as part of accounts receivablein our Consolidated Financial Statements. The payables to PepsiCoand its affiliates were $176 million and $144 million, respectively.These balances are shown as part of accounts payable and othercurrent liabilities in our Consolidated Financial Statements.
For further information about our relationship with PepsiCo and itsaffiliates see Note 16 in Notes to Consolidated Financial Statements.
Results of Operations – 2005
Volume
Fiscal Year EndedDecember 31, 2005 vs.
December 25, 2004Outside
Worldwide U.S. the U.S.
Base volume 3% 2% 5%Acquisitions 1% 1% 0%Impact of 53rd week 1% 2% 1%Total Volume Change 5% 5% 6%
Our full-year reported worldwide physical case volume increasedfive percent in 2005 versus 2004. Worldwide volume growthreflects increases in all of PBG territories. PBG territories aredefined as U.S., Canada, Europe and Mexico.
In the U.S., increases in volume, excluding acquisitions and theimpact of the 53rd week, were driven by a three-percent increasein our take-home channel and a two-percent increase in our cold-drink channel. These volume increases were attributable to solidresults in large format businesses and foodservice venues. In theU.S. our growth reflects consumer trends. Our non-carbonatedbeverage volume increased 18 percent, led by 31-percent growthin Trademark AQUAFINA and the successful introduction ofAQUAFINA FLAVOR SPLASH, coupled with solid performance inTrademark STARBUCKS and in our energy drinks. Our total carbonatedsoft drink portfolio was down about one percent, mostly driven by declines in brand PEPSI, partially offset by the successful introduction of PEPSI LIME, double-digit growth in brand WILDCHERRY PEPSI, and a three-percent increase in our diet portfolio.
In Canada, volume increased three percent in 2005 versus 2004,primarily driven by increases in both the cold-drink and take-homechannels. This growth was fueled by strong execution and strategic marketing programs that were designed to gain consumer interest. The 53rd week contributed approximately one percentage point of growth.
In Europe, volume grew eight percent in 2005 versus 2004, driven by double-digit increases in Russia and Turkey. In Russia, we hadsolid growth in trademark PEPSI and AQUA MINERALE, coupledwith strong growth in TROPICANA JUICE, LIPTON ICED TEA andlocal brands. In Turkey, we continued to improve our customer service through the consolidation of third party distributors and themigration of selling activities to our own employees. These improve-ments and an effective advertising campaign resulted in volumeincreases in brand PEPSI and in local brands, such as YEDIGUN.
Total volume in Mexico was up five percent for the year, drivenlargely by growth in our water business, including an 11-percentincrease in our jug water business and a 13-percent increase inour bottled water business. The investments that we began mak-ing in 2004 in the marketplace and in our infrastructure in Mexicohave enabled us to improve both our bottled water and jug waterbusinesses, including expansion of our home delivery system for jug water. Our carbonated soft drink portfolio in Mexico wasdown about one percent primarily due to competitive pressure inthe Mexico City area. This decline was partially offset by solid performance in our carbonated soft drink business outside theMexico City area which accounts for 75 percent of our volume.
Net Revenues
Fiscal Year EndedDecember 31, 2005 vs.
December 25, 2004Outside
Worldwide U.S. the U.S.
Volume impact 3% 2% 5%Net price per case impact (rate/mix) 3% 3% 2%Acquisitions 1% 1% 1%Currency translation 1% 0% 4%Impact of 53rd week 1% 2% 0%Total Net Revenues Change 9% 8% 12%
Worldwide net revenues were $11.9 billion in 2005, a nine-percentincrease over the prior year. The increase in net revenues for theyear was driven primarily by strong volume growth and increasesin net price per case, coupled with the favorable impact from currency translation in Canada and Mexico, acquisitions and the impact of the 53rd week.

41
The Pepsi Bottling Group, Inc.Annual Report 2005
In the U.S., net revenues increased eight percent in 2005 versus2004. The increases in net revenues in the U.S. were driven prima-rily by increases in net price per case, solid growth in volume, andthe impact of the 53rd week. Additionally, acquisitions added onepercentage point of growth. Increases in net price per case in theU.S. were mostly due to rate increases.
Net revenues outside the U.S. grew approximately 12 percent in2005 versus 2004. The increases in net revenues outside the U.S. were driven primarily by growth in volume and the favorableimpact of foreign exchange in Canada and Mexico, coupled withnet price per case increases in Europe and Canada.
Cost of Sales
Fiscal Year EndedDecember 31, 2005 vs.
December 25, 2004Outside
Worldwide U.S. the U.S.
Volume impact 4% 2% 5%Cost per case impact 4% 4% 4%Acquisitions 1% 1% 1%Currency translation 1% 0% 4%Impact of 53rd week 1% 2% 0%Total Cost of Sales Change 11% 9% 14%
Worldwide cost of sales was $6.3 billion in 2005, an 11-percentincrease over 2004. The growth in cost of sales was driven primarilyby volume and cost per case increases, coupled with the negativeimpact of foreign currency translation in Canada and Mexico,acquisitions and the impact of the 53rd week. During 2005, wecontinued to see increases in resin prices, exacerbated by a severehurricane season in the U.S. These increases added approximately$100 million of costs or approximately two percentage points ofgrowth to our worldwide cost of sales per case.
In the U.S., cost of sales grew nine percent in 2005 versus 2004,due to increases in cost per case and volume growth, coupled withthe impact of the 53rd week and acquisitions. The increases incost per case resulted from higher raw material costs, primarilydriven by resin.
Cost of sales outside the U.S. grew approximately 14 percent in2005 versus 2004, reflecting strong volume growth and increasesin cost per case, coupled with the negative impact from foreigncurrency translation. Growth in cost per case resulted from higherraw material costs, primarily driven by resin increases across all of our countries. Foreign currency translation contributed four percentage points of growth, reflecting the appreciation of theCanadian dollar and Mexican peso.
Selling, Delivery and Administrative Expenses
Fiscal Year EndedDecember 31, 2005 vs.
December 25, 2004Outside
Worldwide U.S. the U.S.
Cost impact 5% 4% 5%HFCS Settlement (1)% (1)% 0%Strategic Spending Initiatives 1% 1% 1%Acquisitions 1% 1% 1%Currency translation 1% 0% 4%Impact of 53rd week 1% 1% 0%Total SD&A Change 8% 6% 11%
Worldwide selling, delivery and administrative expenses were$4.6 billion, an eight-percent increase over 2004. Increases in selling, delivery and administrative costs were driven by highervolume growth, wage and benefit increases and rising fuel prices.The strategic spending initiatives and the impact of the 53rd weekin the U.S. and Canada, partially offset by the pre-tax gain of$29 million in the U.S. from the settlement of the HFCS classaction lawsuit contributed approximately one percentage point ofan increase in selling, delivery and administrative expenses. PBGinvested both the HFCS gain and the additional income from the53rd week in long-term strategic spending initiatives whichtotaled $48 million. The strategic spending initiatives included programs to enhance our customer service agenda, drive productivity,including restructuring in Europe, and improve our managementinformation systems.
In the U.S., increases reflected higher volume growth, wage andbenefit increases, additional expenses from the 53rd week and rising fuel prices, partially offset by the gain from settlement ofthe HFCS class action lawsuit. In addition, the strategic spendinginitiatives contributed more than one percentage point of growthto our increase in selling, delivery and administrative expenses for the year.
Outside the U.S., increases were driven primarily by volume growth,wage and benefit increases, and the negative impact of foreign currency translation in Canada and Mexico, coupled with strategicspending initiatives. These increases were partially offset by thelapping of a $9 million non-cash impairment charge taken for thefranchise licensing agreement associated with the SQUIRT trademarkin Mexico in the prior year. Our selling, delivery and administrativeexpenses in Mexico were higher than expected as certain of thecost savings initiatives have not yielded expected results.
Net Interest Expense
Net interest expense increased by $20 million, when comparedwith 2004, largely due to higher effective interest rates from

42
PART II (continued) The Pepsi Bottling Group, Inc.Annual Report 2005
interest rate swaps, which convert our fixed-rate debt to variabledebt, coupled with the impact of the 53rd week of approximately$5 million. As of December 31, 2005 approximately 26 percent ofour long-term debt was variable.
Minority Interest
Minority interest represents PepsiCo’s approximate 6.7 percent and6.8 percent ownership in our principal operating subsidiary, BottlingGroup, LLC for the years ended 2005 and 2004, respectively.
Income Tax Expense
Our effective tax rates for 2005 and 2004 were 34.7 percent and33.7 percent, respectively. The increase in our 2005 effective taxrate versus the prior year is mainly due to higher earnings in theU.S. and increased tax contingencies related to certain historic taxpositions and resulting from changes in our international legalentity and debt structure. These increases in our tax provisionwere partially offset by the reversal of valuation allowances andthe tax deduction for qualified domestic production activitiesenacted pursuant to the American Jobs Creation Act of 2004. Thereversal of the valuation allowances was due in part to improvedprofitability trends in Russia and a change to the Russia tax lawthat enables us to use a greater amount of our Russian NOLs.Additionally, the implementation of U.S. legal entity restructuringcontributed to the remainder of the valuation allowance reversal.
Earnings Per Share
shares in millions 2005 2004 2003
Basic earnings per share on reported net income $1.91 $1.79 $1.54
Basic weighted-average shares outstanding 243 255 270
Diluted earnings per share on reported net income $1.86 $1.73 $1.50
Diluted weighted-average shares outstanding 250 263 277
DilutionDiluted earnings per share reflects the potential dilution that couldoccur if equity awards from our stock compensation plans wereexercised and converted into common stock that would then par-ticipate in net income. Our employee equity award issuances haveresulted in $0.05, $0.06 and $0.04 per share of dilution in 2005,2004 and 2003, respectively.
Diluted Weighted-Average Shares OutstandingThe decrease in shares outstanding reflects the effect of our sharerepurchase program, which began in October 1999, partially offset
by share issuances from the exercise of stock options. The amountof shares authorized by the Board of Directors to be repurchasedtotals 125 million shares, of which we have repurchased approxi-mately 17 million shares in 2005 and 101 million shares since the inception of our share repurchase program.
Results of Operations – 2004
Volume
52 Weeks EndedDecember 25, 2004 vs.
December 27, 2003Outside
Worldwide U.S. the U.S.
Base volume 2% 2% 3%Acquisitions 1% 0% 1%Total Volume Change 3% 2% 4%
Our full-year reported worldwide physical case volume increasedthree percent in 2004 versus 2003. Worldwide volume growthreflects increases in the U.S., Europe and Canada, partially offsetby a flat performance in Mexico.
In the U.S., volume increased by two percent in 2004 versus 2003,driven by a four-percent increase in our cold-drink channel and aone-percent increase in our take-home channel. During 2004, wehad solid results in our convenience and gas segment and food-service business segment, which consists of our on-premise andfull-service vending account customers. From a brand perspective,Trademark PEPSI’s volume was down one percent for the year, due to declines in brand PEPSI and PEPSI TWIST, partially offset by solid growth from our diet portfolio. Our non-carbonated soft drink portfolio increased 11 percent for the full year led by theintroduction of TROPICANA JUICE DRINKS and continued growthfrom AQUAFINA.
In Europe, volume grew ten percent in 2004 versus 2003, driven by double-digit increases in Russia and Turkey. In Russia, we hadsolid growth in our core brands, coupled with contributions fromnew product introductions, including TROPICANA JUICE andLIPTON ICED TEA. In Turkey, we continue to improve in the areas of execution and distribution, which resulted in volume increasesin brand PEPSI, AQUAFINA and local brands.
Total volume in Mexico, excluding the impact of acquisitions, was flat for the year. Volume trends in Mexico improved during thesecond half of the year, increasing four percent versus the prioryear. Improvement in the second half of the year reflected improvedmarketplace execution, brand and package innovation and ourfocus on consumer value. During the second half of the year, wesaw increases in each of our jug, bottled water and carbonated

43
The Pepsi Bottling Group, Inc.Annual Report 2005
soft drink categories. Increases in the second half of the year wereoffset by volume declines in the first half of the year driven primarilyby our jug water business.
Net Revenues
52 Weeks EndedDecember 25, 2004 vs.
December 27, 2003Outside
Worldwide U.S. the U.S.
Volume impact 2% 2% 3%Net price per case impact (rate/mix) 3% 3% 1%Acquisitions 0% 0% 1%Currency translation 1% 0% 3%Total Net Revenues Change 6% 5% 8%
Worldwide net revenues were $10.9 billion in 2004, a six-percentincrease over the prior year. The increase in net revenues for theyear was driven by improvements in volume, growth in net priceper case and the favorable impact from currency translation.
In the U.S., net revenues increased five percent in 2004 versus2003. The increases in net revenues in the U.S. were driven by growth in both volume and net price per case. Increases in netprice per case in the U.S. were due to a combination of rateincreases, primarily in cans, and mix benefits from the sale ofhigher-priced products.
Net revenues outside the U.S. grew approximately eight percent in2004 versus 2003. The increases in net revenues outside the U.S.were driven primarily by growth in volume and net price per casein Europe and Canada, coupled with the favorable impact of foreignexchange. This growth was partially offset by net revenue declinesin Mexico. Net revenues in Mexico declined three percent on afull-year basis due primarily to the devaluation of the Mexicanpeso. In local currency, our net price per case in Mexico in 2004was flat versus the prior year.
Cost of Sales
52 Weeks EndedDecember 25, 2004 vs.
December 27, 2003Outside
Worldwide U.S. the U.S.
Volume impact 2% 2% 3%Cost per case impact 5% 5% 4%Acquisitions 0% 0% 1%Currency translation 1% 0% 3%Total Cost of Sales Change 8% 7% 11%
Worldwide cost of sales was $5.7 billion in 2004, an eight-percentincrease over 2003. The growth in cost of sales per case wasdriven primarily by significant increases in raw material costs, coupled with mix shifts into more expensive products and packages and the negative impact of foreign currency translation.
In the U.S., cost of sales grew seven percent in 2004 versus 2003,due to volume growth and increases in cost per case. Theincreases in cost per case resulted from higher commodity costs,primarily driven by aluminum and resin, coupled with the impact of mix shifts into more expensive products and packages.
Cost of sales outside the U.S. grew approximately eleven percentin 2004 versus 2003, reflecting increases in cost per case and volume, coupled with the negative impact from foreign currencytranslation. Growth in cost per case was driven by increases inEurope and Mexico. In Europe, we experienced higher sweetenercosts in Turkey and mix shifts into more expensive products inRussia. In Mexico, sweetener costs increased throughout the year,coupled with a steep rise in resin costs in the fourth quarter.Foreign currency translation contributed three percentage points of growth, reflecting the appreciation of the euro and Canadiandollar, partially offset by the devaluation of the Mexican peso.
Selling, Delivery and Administrative Expenses
52 Weeks EndedDecember 25, 2004 vs.
December 27, 2003Outside
Worldwide U.S. the U.S.
Cost impact 3% 4% 3%Acquisitions 0% 0% 1%Currency translation 1% 0% 2%Total SD&A Change 4% 4% 6%
Worldwide selling, delivery and administrative expenses were$4.3 billion, a four-percent increase over 2003. Increases in selling,delivery and administrative costs were driven by higher operatingcosts in the U.S. and Europe, coupled with the negative impact offoreign currency translation.
In the U.S., increases reflect higher labor and benefit costs. These increases were partially offset by reduced operating costsdriven from a number of productivity initiatives we put in placeduring 2004, coupled with a reduction in our bad debt expense.
Outside the U.S., increases were driven primarily by higher operatingcosts in Russia and Turkey and the negative impact of foreign currency throughout Europe and Canada. These increases were partially offset by declines in Mexico due to the devaluation of theMexican peso and reduced operating costs. We consolidated a

44
number of warehouses and distribution systems in Mexico and are starting to capitalize on productivity gains and reduced costs.These results also included a $9 million non-cash impairmentcharge related to our re-evaluation of the fair value of our franchise licensing agreement for the SQUIRT trademark in Mexico, as a resultof a change in its estimated accounting life. See Note 7 in Notes toConsolidated Financial Statements for additional information.
Net Interest Expense
Net interest expense decreased by $9 million to $230 million,when compared with 2003, largely due to lower effective interestrates achieved on our long-term debt.
Minority Interest
Minority interest represents PepsiCo’s approximate 6.8 percent ownership in our principal operating subsidiary, Bottling Group, LLC.
Income Tax Expense
Our effective tax rate for 2004 and 2003 was 33.7 percent and36.3 percent, respectively. The decrease in our effective tax rateversus the prior year is due largely to the lapping of an $11 million($0.04 per diluted share) tax charge relating to a Canadian tax law change in the fourth quarter of 2003. In 2004, we had the following significant tax items, which decreased our tax expense by approximately $4 million:
• Tax reserves – During 2004, we adjusted previously establishedliabilities for tax exposures due largely to the settlement of cer-tain international tax audits. The adjustment of these liabilitiesresulted in an $8 million (or $0.02 per diluted share) tax benefitfor the year.
• International tax structure change – In December 2004, we initi-ated a reorganization of our international tax structure to allowfor more efficient cash mobilization and to reduce potentialfuture tax costs. This reorganization triggered a $30 million tax charge ($0.11 per diluted share) in the fourth quarter.
• Mexico tax rate change – In December 2004, legislation wasenacted changing the Mexican statutory income tax rate. Thisrate change decreased our net deferred tax liabilities andresulted in a $26 million ($0.09 per diluted share) tax benefit in the fourth quarter.
Liquidity and Financial Condition
Cash Flows
Fiscal 2005 Compared with Fiscal 2004Net cash provided by operations decreased by $3 million to$1,219 million in 2005. Decreases in net cash provided by opera-tions were driven by higher tax disbursements as a result of thelapping of the tax stimulus package in 2004 and higher incentivecompensation payments in 2005, partially offset by lower pensioncontributions and working capital improvements, particularly in the area of our receivables.
Net cash used for investments increased by $80 million to$842 million, principally reflecting higher acquisition and capitalspending, partially offset by higher proceeds from sales of property,plant and equipment.
Net cash used for financing decreased by $1,212 million to$183 million driven primarily by the lapping of the repayment of our $1.0 billion note in February 2004 and lower purchases oftreasury stock, partially offset by higher dividend payouts.
Fiscal 2004 Compared with Fiscal 2003Net cash provided by operations grew by $147 million to $1,222 million in 2004. Increases in net cash provided by operationswere driven by higher profits, lower pension contributions andworking capital improvements, which include the lapping of a one-time payment in 2003 relating to the settlement of our New Jersey wage and hour litigation. These increases were partially offset by higher tax payments.
Net cash used for investments increased by $37 million to $762 mil-lion, principally reflecting higher capital spending, partially offsetby higher proceeds from sales of property, plant and equipment.
Net cash used for financing increased by $2,048 million to$1,395 million driven primarily by the repayment of our $1.0 billionnote in February 2004, lower proceeds from long-term borrowingsand higher share repurchases, partially offset by increased stockoption exercises and higher short-term borrowings.
Liquidity and Capital Resources
We believe that our future cash flows from operations and borrowing capacity will be sufficient to fund capital expenditures,acquisitions, dividends and working capital requirements for theforeseeable future.
We have a $500 million commercial paper program in the U.S. thatis supported by a credit facility, which is guaranteed by Bottling
PART II (continued) The Pepsi Bottling Group, Inc.Annual Report 2005

45
Group, LLC and expires in April 2009. At December 31, 2005, we had $355 million in outstanding commercial paper with aweighted-average interest rate of 4.30 percent. At December 25,2004, we had $78 million in outstanding commercial paper with a weighted-average interest rate of 2.32 percent.
We had available bank credit lines of approximately $835 millionat December 31, 2005. These lines were used to support the general operating needs of our businesses. As of year-end 2005,we had $156 million outstanding under these lines of credit at aweighted-average interest rate of 4.33 percent. As of year-end2004, we had available short-term bank credit lines of approximately$381 million and $77 million was outstanding under these lines ofcredit at a weighted-average interest rate of 3.72 percent.
Certain of our other senior notes have redemption features andnon-financial covenants that will, among other things, limit ourability to create or assume liens, enter into sale and lease-backtransactions, engage in mergers or consolidations and transfer orlease all or substantially all of our assets. Additionally, certain of ourcredit facilities and senior notes have financial covenants consistingof the following:
• Our debt to capitalization ratio should not be greater than .75 on the last day of a fiscal quarter when PepsiCo Inc.’s ratings areA- by S&P and A3 by Moody’s or higher. Debt is defined as total
long-term and short-term debt plus accrued interest plus totalstandby letters of credit and other guarantees less cash and cashequivalents not in excess of $500 million. Capitalization isdefined as debt plus shareholders equity plus minority interestexcluding the impact of the cumulative translation adjustment.
• Our debt to EBITDA ratio should not be greater than five on thelast day of a fiscal quarter when PepsiCo Inc.’s ratings are lessthan A- by S&P or A3 by Moody’s. EBITDA is defined as the lastfour quarters of earnings before depreciation, amortization, net interest expense, income taxes, minority interest, net othernon-operating expenses and extraordinary items.
• New secured debt should not be greater than 10 percent of BottlingGroup, LLC’s net tangible assets. Net tangible assets are defined astotal assets less current liabilities and net intangible assets.
We are in compliance with all debt covenants.
Our peak borrowing timeframe varies with our working capitalrequirements and the seasonality of our business. Additionally,throughout the year, we may have further short-term borrowingrequirements driven by other operational needs of our business.During 2005, borrowings from our commercial paper program inthe U.S. peaked at $355 million. Outside the U.S., borrowings fromour international credit facilities peaked at $234 million, reflectingpayments for working capital requirements.
Contractual Obligations
The following table summarizes our contractual obligations as of December 31, 2005:
Payments Due by Period
Less than More thanContractual Obligations Total 1 year 1–3 years 3–5 years 5 years
Long-term debt obligations(1) $4,556 $ 593 $ 13 $1,300 $2,650Capital lease obligations(2) 5 1 1 – 3Operating leases(2) 230 50 73 43 64Interest obligations(3) 2,521 245 450 332 1,494Purchase obligations:
Raw material obligations(4) 212 84 120 8 –Capital expenditure obligations(5) 58 58 – – –Other obligations(6) 362 171 100 37 54
Other long-term liabilities(7) 38 8 13 8 9Total $7,982 $1,210 $770 $1,728 $4,274
(1) See Note 9 in Notes to Consolidated Financial Statements for additional information relating to our long-term debt obligations.(2) See Note 10 in Notes to Consolidated Financial Statements for additional information relating to our lease obligations.(3) Represents interest payment obligations related to our long-term fixed-rate debt as specified in the applicable debt agreements. Additionally, a portion of our long-term debt has variable
interest rates due to either existing swap agreements or interest arrangements. We estimated our variable interest payment obligations by using the interest rate forward curve.(4) Represents obligations to purchase raw materials pursuant to contracts entered into by PepsiCo on our behalf and international agreements to purchase raw materials.(5) Represents commitments to suppliers under capital expenditure related contracts or purchase orders.(6) Represents “non-cancelable” agreements that specify fixed or minimum quantities, price arrangements and timing of payments. Also includes agreements that provide for termination penalty clauses.(7) Primarily relates to contractual obligations associated with non-compete contracts that resulted from business acquisitions. The table excludes other long-term liabilities included in our
Consolidated Financial Statements, such as pension, postretirement and other non-contractual obligations. See Note 12 in Notes to Consolidated Financial Statements for a discussion of ourfuture pension and postretirement contributions and corresponding expected benefit payments for years 2006 through 2015.
The Pepsi Bottling Group, Inc.Annual Report 2005

46
Off-Balance Sheet Arrangements
There are no off-balance sheet arrangements that have or are reasonably likely to have a current or future material effect on our financial condition, results of operations, liquidity, capitalexpenditures or capital resources.
Capital Expenditures
Our business requires substantial infrastructure investments tomaintain our existing level of operations and to fund investmentstargeted at growing our business. Capital infrastructure expenditurestotaled $715 million, $688 million and $635 million during 2005,2004 and 2003, respectively.
Acquisitions
In September 2005, we acquired the operations and exclusiveright to manufacture, sell and distribute Pepsi-Cola beveragesfrom the Pepsi-Cola Bottling Company of Charlotte, North Carolina.The acquisition did not have a material impact on our ConsolidatedFinancial Statements.
As a result of the acquisition, we have assigned $70 million togoodwill, $118 million to franchise rights and $12 million to non-compete arrangements. The goodwill and franchise rights are not subject to amortization. The non-compete agreements are beingamortized over ten years. The allocations of the purchase price forthe acquisition are still preliminary and will be determined basedon the estimated fair value of assets acquired and liabilitiesassumed as of the date of the acquisition. The operating results of the acquisition are included in the accompanying ConsolidatedFinancial Statements from its date of purchase. The acquisitionwas made to enable us to provide better service to our large retailcustomers. We expect the acquisition to reduce costs througheconomies of scale.
During 2004, we acquired the operations and exclusive right to manufacture, sell and distribute Pepsi-Cola beverages fromfour franchise bottlers. The following acquisitions occurred for anaggregate purchase price of $95 million in cash and assumption of liabilities of $22 million:
• Gaseosas, S.A. de C.V. of Mexicali, Mexico in March
• Seltzer and Rydholm, Inc. of Auburn, Maine in October
• Phil Gaudreault et Fils Ltee of Quebec, Canada in November
• Bebidas Purificada, S.A. de C.V. of Juarez, Mexico in November
As a result of these acquisitions, we have assigned $5 million to goodwill, $66 million to franchise rights and $3 million to
non-compete arrangements. The goodwill and franchise rights arenot subject to amortization. The non-compete agreements arebeing amortized over five to ten years.
During 2004, we also paid $1 million for the purchase of certaindistribution rights relating to SOBE.
We intend to continue to pursue other acquisitions of independentPepsiCo bottlers, particularly in territories contiguous to our own,where they create shareholder value.
Market Risks and Cautionary Statements
Quantitative and Qualitative Disclosures about Market Risk
In the normal course of business, our financial position is routinelysubject to a variety of risks. These risks include the risk associatedwith the price of commodities purchased and used in our business,interest rates on outstanding debt and currency movements of non-U.S. dollar denominated assets and liabilities. We are also subjectto the risks associated with the business environment in which we operate, including the collectibility of accounts receivable. We regularly assess all of these risks and have policies and procedures in place to protect against the adverse effects of these exposures.
Our objective in managing our exposure to fluctuations in com-modity prices, interest rates and foreign currency exchange ratesis to minimize the volatility of earnings and cash flows associatedwith changes in the applicable rates and prices. To achieve thisobjective, we have derivative instruments to hedge against therisk of adverse movements in commodity prices, interest rates andforeign currency. Our corporate policy prohibits the use of derivativeinstruments for trading or speculative purposes, and we have procedures in place to monitor and control their use. See Note 11in Notes to Consolidated Financial Statements for additional information relating to our derivative instruments.
A sensitivity analysis has been prepared to determine the effectsthat market risk exposures may have on our financial instruments.We performed the sensitivity analyses for hypothetical changes in commodity prices, interest rates and foreign currency exchangerates and changes in our stock price on our unfunded deferredcompensation liability. Information provided by these sensitivityanalyses does not necessarily represent the actual changes in fair value that we would incur under normal market conditionsbecause, due to practical limitations, all variables other than thespecific market risk factor were held constant. As a result, thereported changes in the values of some financial instruments thatare affected by the sensitivity analyses are not matched with theoffsetting changes in the values of the items that those instrumentsare designed to finance or hedge.
PART II (continued) The Pepsi Bottling Group, Inc.Annual Report 2005

47
The Pepsi Bottling Group, Inc.Annual Report 2005
Commodity Price RiskWe are subject to market risks with respect to commoditiesbecause our ability to recover increased costs through higher pricingmay be limited by the competitive environment in which we operate. We use futures contracts and options on futures in thenormal course of business to hedge anticipated purchases of certaincommodities used in our operations. With respect to commodityprice risk, we currently have various contracts outstanding forcommodity purchases in 2006 and 2007, which establish our purchase prices within defined ranges. We estimate that a 10-percent decrease in commodity prices with all other variablesheld constant would have resulted in a decrease in the fair value of our financial instruments of $1 million and $10 million at December 31, 2005 and December 25, 2004, respectively.
Interest Rate RiskInterest rate risk is present with both fixed and floating-rate debt.We use interest rate swaps to manage our interest expense risk.These instruments effectively change the interest rate of specificdebt issuances. As a result, changes in interest rates on our variabledebt would change our interest expense. We estimate that a50-basis point increase in interest rates on our variable rate debtand cash equivalents with all other variables held constant wouldhave resulted in an increase to net interest expense of $4 millionin both 2005 and 2004.
Foreign Currency Exchange Rate RiskIn 2005, approximately 29 percent of our net revenues came fromoutside the United States. Social, economic and political conditionsin these international markets may adversely affect our results ofoperations, cash flows and financial condition. The overall risks toour international businesses include changes in foreign governmentalpolicies and other political or economic developments. Thesedevelopments may lead to new product pricing, tax or other policiesand monetary fluctuations that may adversely impact our business.In addition, our results of operations and the value of the foreignassets and liabilities are affected by fluctuations in foreign currencyexchange rates.
As currency exchange rates change, translation of the statementsof operations of our businesses outside the U.S. into U.S. dollarsaffects year-over-year comparability. We generally have nothedged against these types of currency risks because cash flowsfrom our international operations are usually reinvested locally.
We have foreign currency transactional risks in certain of our international territories for transactions that are denominated incurrencies that are different from their functional currency. We
have entered into forward exchange contracts to hedge portions of our forecasted U.S. dollar cash flows in our Canadian business.A 10-percent weaker U.S. dollar against the Canadian dollar, with all other variables held constant, would result in a decrease in the fair value of these contracts of $9 million and $10 million atDecember 31, 2005 and December 25, 2004, respectively.
Foreign currency gains and losses reflect both transaction gainsand losses in our foreign operations, as well as translation gains and losses arising from the re-measurement into U.S. dollarsof the net monetary assets of businesses in highly inflationarycountries. Turkey is considered a highly inflationary economy foraccounting purposes.
Beginning in 2006, Turkey will no longer be considered highly inflationary, and will change its functional currency from theU.S. Dollar to the Turkish Lira. We do not expect any materialimpact on our consolidated financial statements as a result ofTurkey’s change in functional currency.
Unfunded Deferred Compensation LiabilityOur unfunded deferred compensation liability is subject to changesin our stock price as well as price changes in certain other equityand fixed income investments. Employees participating in ourdeferred compensation program can elect to defer all or a portionof their compensation to be paid out on a future date or dates. As part of the deferral process, employees select from phantominvestment options that determine the earnings on the deferredcompensation liability and the amount that they will ultimatelyreceive. Employee investment elections include PBG stock and avariety of other equity and fixed-income investment options.
Since the plan is unfunded, employees’ deferred compensationamounts are not directly invested in these investment vehicles.Instead, we track the performance of each employee’s investmentselections and adjust his or her deferred compensation accountaccordingly. The adjustments to the employees’ accounts increaseor decrease the deferred compensation liability reflected on ourConsolidated Balance Sheets with an offsetting increase ordecrease to our selling, delivery and administrative expenses.
We use prepaid forward contracts to hedge the portion of ourdeferred compensation liability that is based on our stock price.Therefore, changes in compensation expense as a result ofchanges in our stock price are substantially offset by the changesin the fair value of these contracts. We estimate that a 10-percentunfavorable change in the year-end stock price would havereduced the fair value from these commitments by $2 million in2005 and 2004.

48
PART II (continued) The Pepsi Bottling Group, Inc.Annual Report 2005
Cautionary Statements
Except for the historical information and discussions containedherein, statements contained in this annual report on Form 10-Kand in the annual report to the shareholders may constituteforward-looking statements as defined by the Private SecuritiesLitigation Reform Act of 1995. These forward-looking statementsare based on currently available competitive, financial and economic data and our operating plans. These statements involvea number of risks, uncertainties and other factors that could causeactual results to be materially different. Among the events anduncertainties that could adversely affect future periods are:
• changes in our relationship with PepsiCo that could have a material adverse effect on our long-term and short-term businessand financial results;
• material changes in expected levels of bottler incentive payments from PepsiCo;
• restrictions imposed by PepsiCo on our raw material suppliersthat could increase our costs;
• material changes from expectations in the cost or availability of raw materials, ingredients or packaging materials;
• limitations on the availability of water or obtaining water rights;
• an inability to achieve cost savings;
• material changes in capital investment for infrastructure and aninability to achieve the expected timing for returns on cold-drinkequipment and related infrastructure expenditures;
• decreased demand for our product resulting from changes in con-sumers’ preferences;
• an inability to achieve volume growth through product and packaging initiatives;
• impact of competitive activities on our business;
• impact of customer consolidations on our business;
• changes in product category consumption;
• unfavorable weather conditions in our markets;
• an inability to meet projections for performance in newlyacquired territories;
• loss of business from a significant customer;
• failure or inability to comply with laws and regulations;
• changes in laws, regulations and industry guidelines governingthe manufacture and sale of food and beverages, includingrestrictions on the sale of carbonated soft drinks in schools;
• litigation, other claims and negative publicity relating to allegedunhealthy properties of soft drinks;
• changes in laws and regulations governing the environment,transportation, employee safety, labor and government contracts;
• changes in accounting standards and taxation requirements(including unfavorable outcomes from audits performed by various tax authorities);
• unforeseen economic and political changes;
• possible recalls of our products;
• interruptions of operations due to labor disagreements;
• changes in our debt ratings;
• material changes in expected interest and currency exchangerates and unfavorable market performance of our pension planassets; and
• an inability to achieve strategic business plan targets that couldresult in an intangible asset impairment charge.
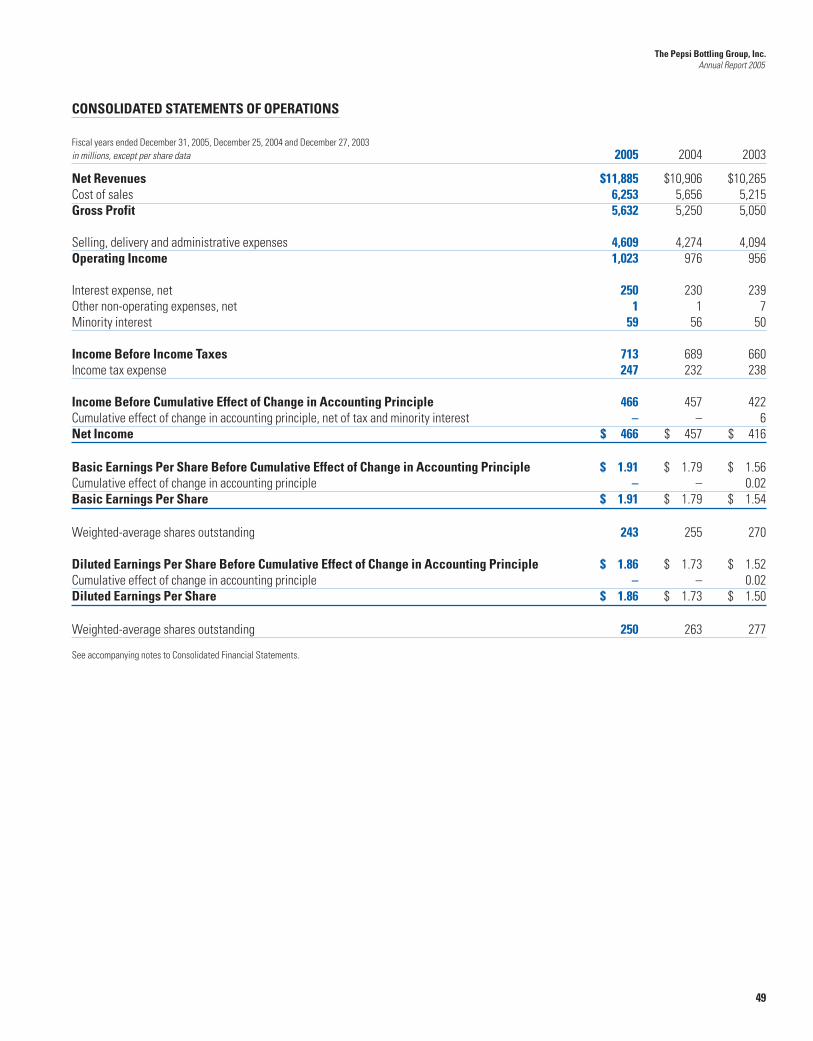
49
The Pepsi Bottling Group, Inc.Annual Report 2005
CONSOLIDATED STATEMENTS OF OPERATIONS
Fiscal years ended December 31, 2005, December 25, 2004 and December 27, 2003in millions, except per share data 2005 2004 2003
Net Revenues $11,885 $10,906 $10,265Cost of sales 6,253 5,656 5,215Gross Profit 5,632 5,250 5,050
Selling, delivery and administrative expenses 4,609 4,274 4,094Operating Income 1,023 976 956
Interest expense, net 250 230 239Other non-operating expenses, net 1 1 7Minority interest 59 56 50
Income Before Income Taxes 713 689 660Income tax expense 247 232 238
Income Before Cumulative Effect of Change in Accounting Principle 466 457 422Cumulative effect of change in accounting principle, net of tax and minority interest – – 6Net Income $ 466 $ 457 $ 416
Basic Earnings Per Share Before Cumulative Effect of Change in Accounting Principle $ 1.91 $ 1.79 $ 1.56Cumulative effect of change in accounting principle – – 0.02Basic Earnings Per Share $ 1.91 $ 1.79 $ 1.54
Weighted-average shares outstanding 243 255 270
Diluted Earnings Per Share Before Cumulative Effect of Change in Accounting Principle $ 1.86 $ 1.73 $ 1.52Cumulative effect of change in accounting principle – – 0.02Diluted Earnings Per Share $ 1.86 $ 1.73 $ 1.50
Weighted-average shares outstanding 250 263 277
See accompanying notes to Consolidated Financial Statements.

50
PART II (continued) The Pepsi Bottling Group, Inc.Annual Report 2005
CONSOLIDATED STATEMENTS OF CASH FLOWS
Fiscal years ended December 31, 2005, December 25, 2004 and December 27, 2003in millions 2005 2004 2003
Cash Flows – OperationsNet income $ 466 $ 457 $ 416Adjustments to reconcile net income to net cash provided by operations:
Depreciation 615 580 556Amortization 15 13 12Deferred income taxes (65) 31 125Cumulative effect of change in accounting principle – – 6Other non-cash charges and credits:
Defined benefit pension and postretirement expenses 109 88 77Minority interest expense 59 56 50Casualty self-insurance expense 85 93 97Other non-cash charges and credits 84 61 79
Net other non-cash charges and credits 337 298 303Changes in operating working capital, excluding effects of acquisitions:
Accounts receivable, net 7 (53) (23)Inventories (29) (38) 4Prepaid expenses and other current assets 1 (16) 7Accounts payable and other current liabilities 4 98 (82)Income taxes payable 77 30 (2)
Net change in operating working capital 60 21 (96)Casualty insurance payments (66) (53) (40)Pension contributions (77) (83) (162)Other, net (66) (42) (45)
Net Cash Provided by Operations 1,219 1,222 1,075Cash Flows – InvestmentsCapital expenditures (715) (688) (635)Acquisitions of bottlers, net of cash acquired (155) (96) (100)Proceeds from sale of property, plant and equipment 29 22 10Other investing activities, net (1) – –Net Cash Used for Investments (842) (762) (725)Cash Flows – FinancingShort-term borrowings, net – three months or less 274 104 8Proceeds from issuances of long-term debt 36 23 1,141Payments of long-term debt (36) (1,014) (30)Minority interest distribution (12) (13) (7)Dividends paid (64) (31) (11)Proceeds from exercise of stock options 109 118 35Purchases of treasury stock (490) (582) (483)Net Cash (Used for)/Provided by Financing (183) (1,395) 653Effect of Exchange Rate Changes on Cash and Cash Equivalents 3 5 10Net Increase/(Decrease) in Cash and Cash Equivalents 197 (930) 1,013Cash and Cash Equivalents – Beginning of Year 305 1,235 222Cash and Cash Equivalents – End of Year $ 502 $ 305 $1,235
Supplemental Cash Flow Information Non-Cash Investing and Financing Activities:
Liabilities incurred and/or assumed in conjunction with acquisitions of bottlers $ 22 $ 20 $ 146Change in accounts payable related to capital expenditures $ (6) $ 29 $ 9
See accompanying notes to Consolidated Financial Statements.

51
The Pepsi Bottling Group, Inc.Annual Report 2005
CONSOLIDATED BALANCE SHEETS
December 31, 2005 and December 25, 2004in millions, except per share data 2005 2004
ASSETSCurrent AssetsCash and cash equivalents $ 502 $ 305Accounts receivable, less allowance of $51 in 2005 and $61 in 2004 1,186 1,204Inventories 458 427Prepaid expenses and other current assets 266 247
Total Current Assets 2,412 2,183Property, plant and equipment, net 3,649 3,581Other intangible assets, net 3,814 3,639Goodwill 1,516 1,416Other assets 133 118
Total Assets $11,524 $10,937
LIABILITIES AND SHAREHOLDERS’ EQUITYCurrent LiabilitiesAccounts payable and other current liabilities $ 1,583 $ 1,517Short-term borrowings 426 155Current maturities of long-term debt 589 53
Total Current Liabilities 2,598 1,725Long-term debt 3,939 4,489Other liabilities 1,027 914Deferred income taxes 1,421 1,415Minority interest 496 445
Total Liabilities 9,481 8,988
Shareholders’ EquityCommon stock, par value $0.01 per share:
authorized 900 shares, issued 310 shares 3 3Additional paid-in capital 1,709 1,719Retained earnings 2,283 1,887Accumulated other comprehensive loss (262) (315)Deferred compensation (14) (1)Treasury stock: 71 shares and 61 shares in 2005 and 2004, respectively, at cost (1,676) (1,344)
Total Shareholders’ Equity 2,043 1,949Total Liabilities and Shareholders’ Equity $11,524 $10,937
See accompanying notes to Consolidated Financial Statements.

52
PART II (continued) The Pepsi Bottling Group, Inc.Annual Report 2005
CONSOLIDATED STATEMENTS OF CHANGES IN SHAREHOLDERS’ EQUITY
Fiscal years ended December 31, 2005, December 25, 2004 and December 27, 2003 AccumulatedOther
Common Additional Deferred Retained Comprehensive Treasury Comprehensivein millions, except per share data Stock Paid-in Capital Compensation Earnings Loss Stock Total Income
Balance at December 28, 2002 $3 $1,750 $ – $1,066 $(468) $ (527) $1,824Comprehensive income:
Net income – – – 416 – – 416 $416Net currency translation adjustment – – – – 90 – 90 90Cash flow hedge adjustment (net of tax
and minority interest of $13) – – – – 18 – 18 18Minimum pension liability adjustment
(net of tax and minority interest of $14) – – – – (20) – (20) (20)Total comprehensive income $504Stock option exercises: 3 shares – (23) – – – 58 35Tax benefit – stock option exercises – 8 – – – – 8Purchase of treasury stock: 23 shares – – – – – (483) (483)Stock compensation – 8 (4) – – – 4Cash dividends declared on common stock
(per share: $0.04) – – – (11) – – (11)Balance at December 27, 2003 3 1,743 (4) 1,471 (380) (952) 1,881Comprehensive income:
Net income – – – 457 – – 457 $457Net currency translation adjustment – – – – 84 – 84 84Cash flow hedge adjustment (net of tax and
minority interest of $2) – – – – (3) – (3) (3)Minimum pension liability adjustment
(net of tax and minority interest of $13) – – – – (16) – (16) (16)Total comprehensive income $522Stock option exercises: 9 shares – (72) – – – 190 118Tax benefit – stock option exercises – 51 – – – – 51Purchase of treasury stock: 21 shares – – – – – (582) (582)Stock compensation – (3) 3 – – – –Cash dividends declared on common stock
(per share: $0.16) – – – (41) – – (41)Balance at December 25, 2004 3 1,719 (1) 1,887 (315) (1,344) 1,949Comprehensive income:
Net income – – – 466 – – 466 $466Net currency translation adjustment – – – – 65 – 65 65Cash flow hedge adjustment
(net of tax and minority interest of $5) – – – – (7) – (7) (7)Minimum pension liability adjustment
(net of tax and minority interest of $3) – – – – (5) – (5) (5)Total comprehensive income $519Stock option exercises: 7 shares – (49) – – – 158 109Tax benefit – stock option exercises – 23 – – – – 23Purchase of treasury stock: 17 shares – – – – – (490) (490)Stock compensation – 16 (13) – – – 3Cash dividends declared on common stock
(per share: $0.29) – – – (70) – – (70)Balance at December 31, 2005 $3 $1,709 $ (14) $2,283 $(262) $(1,676) $2,043
See accompanying notes to Consolidated Financial Statements.

53
The Pepsi Bottling Group, Inc.Annual Report 2005
NOTES TO CONSOLIDATED FINANCIAL STATEMENTS
Tabular dollars in millions, except per share data
Note 1 – Basis of Presentation
The Pepsi Bottling Group, Inc. (“PBG” or the “Company”) is theworld’s largest manufacturer, seller and distributor of Pepsi-Colabeverages. We have the exclusive right to manufacture, sell anddistribute Pepsi-Cola beverages in all or a portion of the UnitedStates, Mexico, Canada and Europe, which consists of operationsin Spain, Greece, Russia and Turkey. When used in these ConsolidatedFinancial Statements, “PBG,” “we,” “our” and “us” each refers toThe Pepsi Bottling Group, Inc. and, where appropriate, to BottlingGroup, LLC (“Bottling LLC”), our principal operating subsidiary.
At December 31, 2005, PepsiCo, Inc. (“PepsiCo”) owned98,511,358 shares of our common stock, consisting of98,411,358 shares of common stock and 100,000 shares of Class Bcommon stock. All shares of Class B common stock that have beenauthorized have been issued to PepsiCo. At December 31, 2005,PepsiCo owned approximately 41.2 percent of our outstandingcommon stock and 100 percent of our outstanding Class B commonstock, together representing 46.8 percent of the voting power of all classes of our voting stock. In addition, PepsiCo owns approxi-mately 6.7 percent of the equity of Bottling LLC. We fully consolidatethe results of Bottling LLC and present PepsiCo’s share as minorityinterest in our Consolidated Financial Statements.
The common stock and Class B common stock both have a parvalue of $0.01 per share and are substantially identical, except for voting rights. Holders of our common stock are entitled to one vote per share and holders of our Class B common stock are entitled to 250 votes per share. Each share of Class B commonstock is convertible into one share of common stock. Holders of our common stock and holders of our Class B common stock shareequally on a per-share basis in any dividend distributions.
Our Board of Directors has the authority to issue up to20,000,000 shares of preferred stock, and to determine the priceand terms, including, but not limited to, preferences and votingrights of those shares without stockholder approval. AtDecember 31, 2005, there was no preferred stock outstanding.
Certain reclassifications were made in our Consolidated Financial Statements to 2004 and 2003 amounts to conform to the 2005 presentation.
Note 2 – Summary of Significant Accounting Policies
Basis of Consolidation – The accounts of all of our wholly andmajority-owned subsidiaries are included in the accompanyingConsolidated Financial Statements. We have eliminated inter-company accounts and transactions in consolidation.
Fiscal Year – Our U.S. and Canadian operations report using a fiscal year that consists of fifty-two weeks, ending on the lastSaturday in December. Every five or six years a fifty-third week isadded. In 2005, our fiscal year consisted of fifty-three weeks (theadditional week was added to the fourth quarter). Fiscal years2004 and 2003 consisted of fifty-two weeks. Our remaining coun-tries report using a calendar-year basis. Accordingly, we recognizeour quarterly business results as outlined below:
Quarter U.S. & Canada Mexico & Europe
First Quarter 12 weeks January and FebruarySecond Quarter 12 weeks March, April and MayThird Quarter 12 weeks June, July and AugustFourth Quarter 16 weeks/ September, October,
17 weeks (FY 2005) November and December
Revenue Recognition – Revenue, net of sales returns, is recog-nized when our products are delivered or shipped to customers inaccordance with the written sales terms. We offer certain salesincentives on a local and national level through various customertrade agreements designed to enhance the growth of our revenue.Customer trade agreements are accounted for as a reduction toour revenues.
Customer trade agreements with our customers include paymentsfor in-store displays, volume rebates, featured advertising and othergrowth incentives. A number of our customer trade agreements arebased on quarterly and annual targets that generally do not exceedone year. Estimated amounts to be paid to our customers for tradeagreements are based upon current performance, historical experi-ence, forecasted volume and other performance criteria.
Advertising and Marketing Costs – We are involved in a vari-ety of programs to promote our products. We include advertisingand marketing costs in selling, delivery and administrativeexpenses. Advertising and marketing costs were $421 million,$426 million and $453 million in 2005, 2004 and 2003, respec-tively, before bottler incentives received from PepsiCo and otherbrand owners.
Bottler Incentives – PepsiCo and other brand owners, at their discre-tion, provide us with various forms of bottler incentives. These incentives

54
PART II (continued) The Pepsi Bottling Group, Inc.Annual Report 2005
cover a variety of initiatives, including direct marketplace support andadvertising support. We classify bottler incentives as follows:
• Direct marketplace support represents PepsiCo’s and other brandowners’ agreed-upon funding to assist us in offering sales andpromotional discounts to retailers and is generally recorded as anadjustment to cost of sales. If the direct marketplace support is areimbursement for a specific, incremental and identifiable program,the funding is recorded as an adjustment to net revenues.
• Advertising support represents agreed-upon funding to assist usfor the cost of media time and promotional materials and is generally recorded as an adjustment to cost of sales. Advertisingsupport that represents reimbursement for a specific, incrementaland identifiable media cost, is recorded as a reduction to advertising and marketing expenses within selling, delivery andadministrative expenses.
Total bottler incentives recognized as adjustments to net revenues,cost of sales and selling, delivery and administrative expenses inour Consolidated Statements of Operations were as follows:
Fiscal Year Ended
2005 2004 2003
Net revenues $ 51 $ 22 $ 21Cost of sales 604 559 561Selling, delivery and administrative expenses 79 84 108Total bottler incentives $734 $665 $690
Shipping and Handling Costs – Our shipping and handling costsare recorded primarily within selling, delivery and administrativeexpenses. Such costs recorded within selling, delivery and administrative expenses totaled $1.5 billion, $1.6 billion and $1.4 billion in 2005, 2004 and 2003, respectively.
Foreign Currency Gains and Losses – We translate the balance sheets of our foreign subsidiaries that do not operate inhighly inflationary economies at the exchange rates in effect at the balance sheet date, while we translate the statements of operations at the average rates of exchange during the year. Theresulting translation adjustments of our foreign subsidiaries arerecorded directly to accumulated other comprehensive loss.Foreign currency gains and losses reflect both transaction gainsand losses in our foreign operations, as well as translation gainsand losses arising from the re-measurement into U.S. dollars ofthe net monetary assets of businesses in highly inflationary coun-tries. Beginning January 1, 2006, Turkey is no longer considered tobe a highly inflationary economy for accounting purposes. We donot expect any material impact on our consolidated financial state-ments as a result of Turkey’s change in functional currency.
Pension and Postretirement Medical Benefit Plans – Wesponsor pension and other postretirement medical benefit plans in various forms covering substantially all employees who meet eligibility requirements. We account for our defined benefit pensionplans and our postretirement medical benefit plans using actuarialmodels required by Statement of Financial Accounting Standards(“SFAS”) No. 87, “Employers’ Accounting for Pensions,” and SFASNo. 106, “Employers’ Accounting for Postretirement BenefitsOther Than Pensions.”
The assets, liabilities and assumptions used to measure pensionand postretirement medical expense for any fiscal year are deter-mined as of September 30 of the preceding year (“measurementdate”). The discount rate assumption used in our pension and post-retirement medical benefit plans’ accounting is based on currentinterest rates for high-quality, long-term corporate debt as determinedon each measurement date. In evaluating the expected rate ofreturn on assets for a given fiscal year, we consider both projectedfuture returns of asset classes and the actual 10 to 15-year historicreturns on asset classes in our pension investment portfolio,reflecting the weighted-average return of our asset allocation.Differences between actual and expected returns are recognizedin the net periodic pension calculation over five years. To theextent the amount of all unrecognized gains and losses exceeds10 percent of the larger of the pension benefit obligation or planassets, such amount is amortized over the average remaining service period of active participants. We amortize prior servicecosts on a straight-line basis over the average remaining serviceperiod of employees expected to receive benefits.
Income Taxes – Our effective tax rate is based on pre-taxincome, statutory tax rates, tax regulations and tax planningstrategies available to us in the various jurisdictions in which weoperate. The tax bases of our assets and liabilities reflect our bestestimate of the tax benefit and costs we expect to realize. Weestablish valuation allowances to reduce our deferred tax assetsto an amount that will more likely than not be realized.
Significant management judgment is required in determining oureffective tax rate and in evaluating our tax position. We establishreserves when, based on the applicable tax law and facts and circumstances relating to a particular transaction or tax position, it becomes probable that the position will not be sustained whenchallenged by a taxing authority. A change in our tax reservescould have a significant impact on our results of operations.
Earnings Per Share – We compute basic earnings per share bydividing net income by the weighted-average number of commonshares outstanding for the period. Diluted earnings per sharereflect the potential dilution that could occur if securities or othercontracts to issue common stock were exercised and convertedinto common stock that would then participate in net income.

55
The Pepsi Bottling Group, Inc.Annual Report 2005
Cash Equivalents – Cash equivalents represent funds we havetemporarily invested with original maturities not exceedingthree months.
Allowance for Doubtful Accounts – A portion of our accountsreceivable will not be collected due to bankruptcies and salesreturns. Our accounting policy for the provision for doubtfulaccounts requires reserving an amount based on the evaluation of the aging of accounts receivable, sales return trend analysis,detailed analysis of high-risk customers’ accounts, and the overallmarket and economic conditions of our customers.
Inventories – We value our inventories at the lower of cost or netrealizable value. The cost of our inventory is generally computedon the first-in, first-out method.
Property, Plant and Equipment – We state property, plant and equipment (“PP&E”) at cost, except for PP&E that has beenimpaired, for which we write down the carrying amount to esti-mated fair market value, which then becomes the new cost basis.
Goodwill and Other Intangible Assets, net – Goodwill andintangible assets with indefinite useful lives are not amortized, but instead tested annually for impairment.
We evaluate our identified intangible assets with indefinite usefullives for impairment annually (unless it is required more frequentlybecause of a triggering event). We measure impairment as the amountby which the carrying value exceeds its estimated fair value. Basedupon our annual impairment analysis performed in the fourth quar-ter of 2005, the estimated fair values of our identified intangibleassets with indefinite lives exceeded their carrying amounts.
We evaluate goodwill on a country-by-country basis (“reportingunit”) for impairment. We evaluate each reporting unit for impair-ment based upon a two-step approach. First, we compare the fairvalue of our reporting unit with its carrying value. Second, if thecarrying value of our reporting unit exceeds its fair value, we com-pare the implied fair value of the reporting unit’s goodwill to itscarrying amount to measure the amount of impairment loss. Inmeasuring the implied fair value of goodwill, we would allocatethe fair value of the reporting unit to each of its assets and liabili-ties (including any unrecognized intangible assets). Any excess ofthe fair value of the reporting unit over the amounts assigned to itsassets and liabilities is the implied fair value of goodwill. Basedupon our annual impairment analysis in the fourth quarter of 2005,the estimated fair value of our reporting units exceeded their carrying value, and as a result, we did not need to proceed to thesecond step of the impairment test.
Other identified intangible assets that are subject to amortizationare amortized on a straight-line basis over the period in which weexpect to receive economic benefit and are reviewed for impairmentwhen facts and circumstances indicate that the carrying value of the asset may not be recoverable. The determination of theexpected life will be dependent upon the use and underlying characteristics of the intangible asset. In our evaluation of theintangible assets, we consider the nature and terms of the under-lying agreements, the customer’s attrition rate, competitive environment and brand history, as applicable. If the carrying valueis not recoverable, impairment is measured as the amount bywhich the carrying value exceeds its estimated fair value. Fairvalue is generally estimated based on either appraised value orother valuation techniques.
Casualty Insurance Costs – In the United States, we are self-insured or have large deductible programs for workers’ compensationand automobile risks for occurrences up to $10 million, and productand general liability risks for occurrences up to $5 million. Forlosses exceeding these self-insurance thresholds, we purchasecasualty insurance from a third-party provider. Our liability forcasualty costs was $188 million as of December 31, 2005 of which$61 million was reported in accounts payable and other current liabilities and $127 million was recorded in other liabilities in ourConsolidated Balance Sheets. Our liability for casualty costs isestimated using individual case-based valuations and statisticalanalyses and is based upon historical experience, actuarialassumptions and professional judgment. We do not discount our loss expense reserves.
Minority Interest – PBG and PepsiCo contributed bottling busi-nesses and assets used in the bottling businesses to BottlingGroup, LLC, our principal operating subsidiary, in connection withthe formation of Bottling Group, LLC in February 1999. AtDecember 31, 2005, PBG owns 93.3 percent of Bottling Group, LLCand PepsiCo owns the remaining 6.7 percent. Accordingly, theConsolidated Financial Statements reflect PepsiCo’s share of theconsolidated net income of Bottling Group, LLC as minority interestin our Consolidated Statements of Operations, and PepsiCo’s shareof consolidated net assets of Bottling Group, LLC as minority interest in our Consolidated Balance Sheets.
Treasury Stock – We record the repurchase of shares of our common stock at cost and classify these shares as treasury stockwithin shareholders’ equity. Repurchased shares are included inour authorized and issued shares but not included in our sharesoutstanding. We record shares reissued using an average cost. At December 31, 2005 we had 125 million shares authorized underour share repurchase program. Since the inception of our sharerepurchase program in October 1999, we have repurchasedapproximately 101 million shares and have reissued approximately30 million shares for stock option exercises.
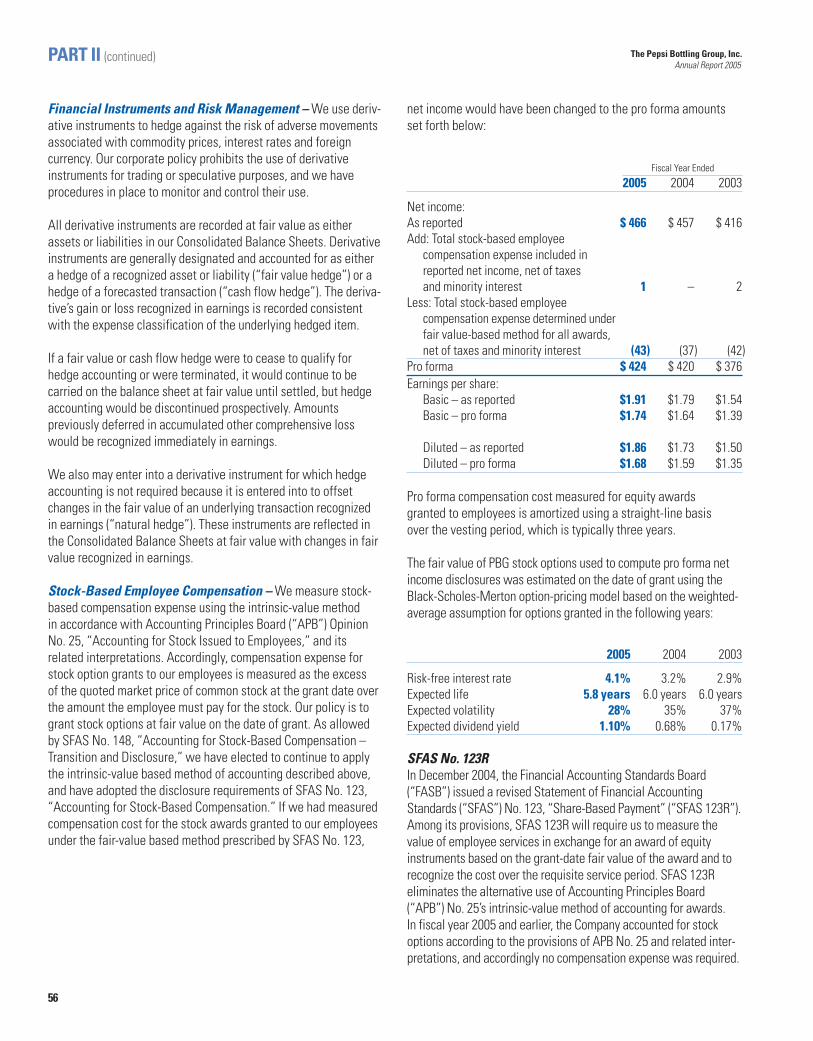
56
PART II (continued) The Pepsi Bottling Group, Inc.Annual Report 2005
Financial Instruments and Risk Management – We use deriv-ative instruments to hedge against the risk of adverse movementsassociated with commodity prices, interest rates and foreign currency. Our corporate policy prohibits the use of derivativeinstruments for trading or speculative purposes, and we have procedures in place to monitor and control their use.
All derivative instruments are recorded at fair value as eitherassets or liabilities in our Consolidated Balance Sheets. Derivativeinstruments are generally designated and accounted for as either a hedge of a recognized asset or liability (“fair value hedge”) or ahedge of a forecasted transaction (“cash flow hedge”). The deriva-tive’s gain or loss recognized in earnings is recorded consistentwith the expense classification of the underlying hedged item.
If a fair value or cash flow hedge were to cease to qualify forhedge accounting or were terminated, it would continue to be carried on the balance sheet at fair value until settled, but hedgeaccounting would be discontinued prospectively. Amounts previously deferred in accumulated other comprehensive losswould be recognized immediately in earnings.
We also may enter into a derivative instrument for which hedgeaccounting is not required because it is entered into to offsetchanges in the fair value of an underlying transaction recognized in earnings (“natural hedge”). These instruments are reflected inthe Consolidated Balance Sheets at fair value with changes in fairvalue recognized in earnings.
Stock-Based Employee Compensation – We measure stock-based compensation expense using the intrinsic-value method in accordance with Accounting Principles Board (“APB”) OpinionNo. 25, “Accounting for Stock Issued to Employees,” and itsrelated interpretations. Accordingly, compensation expense forstock option grants to our employees is measured as the excess of the quoted market price of common stock at the grant date overthe amount the employee must pay for the stock. Our policy is togrant stock options at fair value on the date of grant. As allowedby SFAS No. 148, “Accounting for Stock-Based Compensation –Transition and Disclosure,” we have elected to continue to applythe intrinsic-value based method of accounting described above,and have adopted the disclosure requirements of SFAS No. 123,“Accounting for Stock-Based Compensation.” If we had measuredcompensation cost for the stock awards granted to our employeesunder the fair-value based method prescribed by SFAS No. 123,
net income would have been changed to the pro forma amountsset forth below:
Fiscal Year Ended
2005 2004 2003
Net income:As reported $ 466 $ 457 $ 416Add: Total stock-based employee
compensation expense included in reported net income, net of taxes and minority interest 1 – 2
Less: Total stock-based employee compensation expense determined under fair value-based method for all awards, net of taxes and minority interest (43) (37) (42)
Pro forma $ 424 $ 420 $ 376Earnings per share:
Basic – as reported $1.91 $1.79 $1.54Basic – pro forma $1.74 $1.64 $1.39
Diluted – as reported $1.86 $1.73 $1.50Diluted – pro forma $1.68 $1.59 $1.35
Pro forma compensation cost measured for equity awards granted to employees is amortized using a straight-line basis over the vesting period, which is typically three years.
The fair value of PBG stock options used to compute pro forma netincome disclosures was estimated on the date of grant using theBlack-Scholes-Merton option-pricing model based on the weighted-average assumption for options granted in the following years:
2005 2004 2003
Risk-free interest rate 4.1% 3.2% 2.9%Expected life 5.8 years 6.0 years 6.0 yearsExpected volatility 28% 35% 37%Expected dividend yield 1.10% 0.68% 0.17%
SFAS No. 123RIn December 2004, the Financial Accounting Standards Board(“FASB”) issued a revised Statement of Financial AccountingStandards (“SFAS”) No. 123, “Share-Based Payment” (“SFAS 123R”).Among its provisions, SFAS 123R will require us to measure thevalue of employee services in exchange for an award of equityinstruments based on the grant-date fair value of the award and torecognize the cost over the requisite service period. SFAS 123Reliminates the alternative use of Accounting Principles Board(“APB”) No. 25’s intrinsic-value method of accounting for awards. In fiscal year 2005 and earlier, the Company accounted for stockoptions according to the provisions of APB No. 25 and related inter-pretations, and accordingly no compensation expense was required.

57
The Pepsi Bottling Group, Inc.Annual Report 2005
The Company will adopt SFAS 123R in the first quarter of 2006 byusing the modified prospective approach. Under this method, wewill recognize compensation expense for all share-based paymentsover the vesting period based on their grant-date fair value.Measurement and our method of amortization of costs for share-based payments granted prior to, but not vested as of the date ofadoption, would be based on the same estimate of the grant-datefair value and the same amortization method that was previouslyused in our SFAS 123 pro forma disclosure. Prior periods will notbe restated. Currently, the Company uses the Black-Scholes-Mertonoption-pricing model to estimate the value of stock optionsgranted to employees in its pro forma disclosure and plans to continue to use this method upon adoption of SFAS 123R.
The financial statement impact will be dependent on future stock-based awards and any unvested stock options outstanding at thedate of adoption. We expect the adoption of SFAS 123R to reduceour 2006 diluted EPS by $0.18 per share.
Commitments and Contingencies – We are subject to variousclaims and contingencies related to lawsuits, taxes, environmentaland other matters arising out of the normal course of business.Liabilities related to commitments and contingencies are recognizedwhen a loss is probable and reasonably estimable.
New Accounting Standards
SFAS No. 123RSee discussion in “Stock-Based Employee Compensation” above.
FASB Staff Position No. FAS 109-1In December 2004, the FASB issued Staff Position No. FAS 109-1(“FSP 109-1”), “Application of FASB Statement No. 109, Accountingfor Income Taxes, to the Tax Deduction on Qualified ProductionActivities Provided by the American Jobs Creation Act of 2004.”FSP 109-1 clarifies SFAS No. 109’s guidance that applies to thenew tax deduction for qualified domestic production activities. Thetax deduction for qualified production activities is effective for our2005 tax year. This tax deduction reduced our income tax provisionby $7 million in 2005.
FASB Staff Position No. FAS 109-2In December 2004, the FASB issued Staff Position No. FAS 109-2(“FSP 109-2”), “Accounting and Disclosure Guidance for theForeign Earnings Repatriation Provision within the American JobsCreation Act of 2004.” FSP 109-2 provides that an enterprise isallowed time beyond the financial reporting period of enactment toevaluate the effect of the new tax law on its plan for applying
SFAS No. 109 to the repatriation provisions of the Act. PBG evalu-ated the Foreign Earnings Repatriation Provision and based on thefacts surrounding our foreign operations, decided not to repatriateany of our foreign earnings and profits pursuant to the provision.
FASB Interpretation No. 47In March 2005, the FASB issued Interpretation No. 47 (“FIN 47”),“Accounting for Conditional Asset Retirement Obligations,” thatrequires an entity to recognize a liability for a conditional assetretirement obligation when incurred if the liability can be reasonablyestimated. FIN 47 clarifies that the term Conditional AssetRetirement Obligation refers to a legal obligation to perform anasset retirement activity in which the timing and/or method of settlement are conditional on a future event that may or may notbe within the control of the entity. FIN 47 also clarifies when anentity would have sufficient information to estimate reasonablythe fair value of an asset retirement obligation. FIN 47 is effectiveno later than the end of fiscal years ending after December 15,2005. This standard did not have a material impact on ourConsolidated Financial Statements.
SFAS No. 151 In November 2004, the FASB issued SFAS No. 151, “InventoryCosts, an amendment of ARB No. 43, Chapter 4” (“SFAS 151”).SFAS 151 clarifies the accounting for abnormal amounts of idlefacility expense, freight, handling costs and wasted materials(spoilage). In addition, this statement requires that allocation offixed production overheads to the costs of conversion be based onnormal capacity of production facilities. SFAS 151 is effective forthe first annual reporting period beginning after June 15, 2005.The adoption of SFAS 151 did not have a material impact on ourConsolidated Financial Statements.
Emerging Issues Task Force (“EITF”) Issue No. 02-16“Accounting by a Customer (including a Reseller) for CertainConsideration Received from a Vendor”The EITF reached a consensus on Issue No. 02-16 in 2003,addressing the recognition and income statement classification ofvarious cash consideration received from a vendor. In accordancewith EITF Issue No. 02-16, we have reclassified certain bottlerincentives from revenue and selling, delivery and administrativeexpenses to cost of sales beginning in 2003. During 2003, werecorded a transition adjustment of $6 million, net of taxes andminority interest of $1 million, for the cumulative effect on prioryears. This adjustment reflects the amount of bottler incentivesthat can be attributed to our 2003 beginning inventory balances.
Assuming EITF Issue No. 02-16 had been adopted for all periodspresented, pro forma net income and earnings per share for the

58
PART II (continued) The Pepsi Bottling Group, Inc.Annual Report 2005
years ended December 31, 2005, December 25, 2004, andDecember 27, 2003, would have been as follows:
Fiscal Year Ended
December 31, December 25, December 27,2005 2004 2003
Net income:As reported $ 466 $ 457 $ 416Pro forma $ 466 $ 457 $ 422
Earnings per share:Basic – as reported $1.91 $1.79 $1.54Basic – pro forma $1.91 $1.79 $1.56
Diluted – as reported $1.86 $1.73 $1.50Diluted – pro forma $1.86 $1.73 $1.52
Note 3 – Inventories
2005 2004
Raw materials and supplies $173 $159Finished goods 285 268
$458 $427
Note 4 – Prepaid Expenses and Other Current Assets
2005 2004
Prepaid expenses $214 $198Other assets 52 49
$266 $247
Note 5 – Accounts Receivable
2005 2004
Trade accounts receivable $1,018 $1,056Allowance for doubtful accounts (51) (61)Accounts receivable from PepsiCo 143 150Other receivables 76 59
$1,186 $1,204
Note 6 – Property, Plant and Equipment, net
2005 2004
Land $ 277 $ 257Buildings and improvements 1,299 1,263Manufacturing and distribution equipment 3,425 3,289Marketing equipment 2,334 2,237Other 177 177
7,512 7,223Accumulated depreciation (3,863) (3,642)
$ 3,649 $ 3,581
We calculate depreciation on a straight-line basis over the esti-mated lives of the assets as follows:
Buildings and improvements 20–33 yearsManufacturing and distribution equipment 2–15 yearsMarketing equipment 3–7 years
Note 7 – Other Intangible Assets, net and Goodwill
2005 2004
Intangibles subject to amortization:Gross carrying amount:
Customer relationships and lists $ 53 $ 46Franchise/distribution rights 46 44Other identified intangibles 39 30
138 120Accumulated amortization:
Customer relationships and lists (9) (6)Franchise/distribution rights (22) (15)Other identified intangibles (18) (16)
(49) (37)Intangibles subject to amortization, net 89 83Intangibles not subject to amortization:
Carrying amount:Franchise rights 3,093 2,958Distribution rights 302 288Trademarks 218 208Other identified intangibles 112 102
Intangibles not subject to amortization 3,725 3,556Total other intangible assets, net $3,814 $3,639Goodwill $1,516 $1,416
In 2005, total other intangible assets, net and goodwill increasedby approximately $275 million due to the following:
OtherIntangible
Goodwill Assets, net Total
Balance at December 25, 2004 $1,416 $3,639 $5,055Purchase price allocations relating
to recent acquisitions 72 127 199Impact of foreign currency translation 28 49 77Increase in pension asset – 14 14Amortization of intangible assets – (15) (15)
Balance at December 31, 2005 $1,516 $3,814 $5,330

59
The Pepsi Bottling Group, Inc.Annual Report 2005
For intangible assets subject to amortization, we calculate amortization expense over the period we expect to receive economic benefit. Total amortization expense was $15 million, $13 million and $12 million in 2005, 2004 and 2003, respectively. The weighted-average amortization period for each category of intangible assets and its estimated aggregate amortization expense expected to be recognizedover the next five years are as follows:
Weighted-Average Estimated Aggregate Amortization Expense to be Incurred
Amortization Fiscal Year Ending
Period 2006 2007 2008 2009 2010
Customer relationships and lists 18 years $3 $3 $3 $3 $3Franchise/distribution rights 7 years $5 $3 $2 $2 $2Other identified intangibles 8 years $5 $4 $3 $2 $1
In 2004, total other intangible assets, net and goodwill increasedby approximately $107 million due to the following:
OtherIntangible
Goodwill Assets, net Total
Balance at December 27, 2003 $1,386 $3,562 $4,948Purchase price allocations relating
to recent acquisitions 9 65 74Impact of foreign currency translation 21 31 52Intangible asset impairment charge – (9) (9)Increase in pension asset – 3 3Amortization of intangible assets – (13) (13)
Balance at December 25, 2004 $1,416 $3,639 $5,055
During the fourth quarter of 2004 we recorded a $9 million non-cashimpairment charge ($6 million net of tax and minority interest) in selling, delivery and administrative expenses relating to ourre-evaluation of the fair value of our franchise licensing agreementfor the SQUIRT trademark in Mexico, as a result of a change in itsestimated accounting life. The franchise licensing agreements forthe SQUIRT trademark were considered to have an indefinite lifeand granted The Pepsi Bottling Group Mexico S.R.L. (“PBG Mexico”)the exclusive right to produce, sell and distribute beverages underthe SQUIRT trademark in certain territories of Mexico. InDecember 2004, Cadbury Bebidas, S.A. de C.V. (“Cadbury Mexico”),
the owner of the SQUIRT trademark, sent PBG Mexico notices thatpurportedly terminated the SQUIRT licenses for these territorieseffective January 15, 2005. PBG Mexico believes that theselicenses continue to be in effect and that Cadbury Mexico has nolegally supportable basis to terminate the licenses. However, as aresult of these unanticipated actions, PBG Mexico was no longercertain that it will have the right to distribute SQUIRT in Mexicoafter certain of its contractual rights expire in 2015. Accordingly,we have concluded that the franchise rights relating to the SQUIRTtrademark should no longer be considered to have an indefinitelife, but should be treated as having a 10-year life for accountingpurposes. Due to the reduction in the useful life of these franchiserights, we wrote the carrying value of the SQUIRT franchise rightsdown to its current estimated fair value in 2004. The remainingcarrying value will be amortized over the estimated useful lifeof 10 years.
We measured the fair value of SQUIRT’s franchise rights using amulti-period excess earnings method, which was based upon estimated discounted future cash flows for 10 years. We deducteda contributory charge from our net after-tax cash flows for the economic return attributable to the working capital and property,plant and equipment, for SQUIRT’s franchise rights. The net discounted cash flows in excess of the fair returns on these assetsrepresent the fair value of the SQUIRT franchise rights.
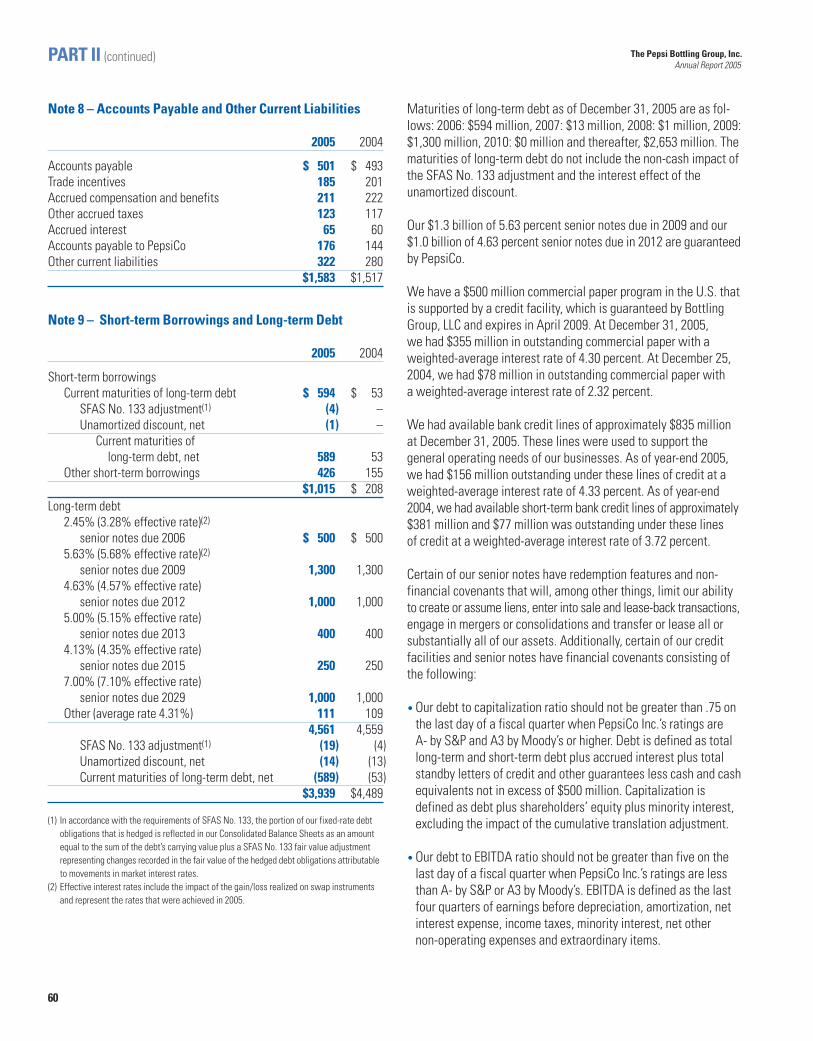
60
PART II (continued) The Pepsi Bottling Group, Inc.Annual Report 2005
Note 8 – Accounts Payable and Other Current Liabilities
2005 2004
Accounts payable $ 501 $ 493Trade incentives 185 201Accrued compensation and benefits 211 222Other accrued taxes 123 117Accrued interest 65 60Accounts payable to PepsiCo 176 144Other current liabilities 322 280
$1,583 $1,517
Note 9 – Short-term Borrowings and Long-term Debt
2005 2004
Short-term borrowingsCurrent maturities of long-term debt $ 594 $ 53
SFAS No. 133 adjustment(1) (4) –Unamortized discount, net (1) –
Current maturities of long-term debt, net 589 53
Other short-term borrowings 426 155$1,015 $ 208
Long-term debt2.45% (3.28% effective rate)(2)
senior notes due 2006 $ 500 $ 5005.63% (5.68% effective rate)(2)
senior notes due 2009 1,300 1,3004.63% (4.57% effective rate)
senior notes due 2012 1,000 1,0005.00% (5.15% effective rate)
senior notes due 2013 400 4004.13% (4.35% effective rate)
senior notes due 2015 250 2507.00% (7.10% effective rate)
senior notes due 2029 1,000 1,000Other (average rate 4.31%) 111 109
4,561 4,559SFAS No. 133 adjustment(1) (19) (4)Unamortized discount, net (14) (13)Current maturities of long-term debt, net (589) (53)
$3,939 $4,489
(1) In accordance with the requirements of SFAS No. 133, the portion of our fixed-rate debtobligations that is hedged is reflected in our Consolidated Balance Sheets as an amountequal to the sum of the debt’s carrying value plus a SFAS No. 133 fair value adjustmentrepresenting changes recorded in the fair value of the hedged debt obligations attributableto movements in market interest rates.
(2) Effective interest rates include the impact of the gain/loss realized on swap instrumentsand represent the rates that were achieved in 2005.
Maturities of long-term debt as of December 31, 2005 are as fol-lows: 2006: $594 million, 2007: $13 million, 2008: $1 million, 2009:$1,300 million, 2010: $0 million and thereafter, $2,653 million. Thematurities of long-term debt do not include the non-cash impact of the SFAS No. 133 adjustment and the interest effect of theunamortized discount.
Our $1.3 billion of 5.63 percent senior notes due in 2009 and our$1.0 billion of 4.63 percent senior notes due in 2012 are guaranteedby PepsiCo.
We have a $500 million commercial paper program in the U.S. thatis supported by a credit facility, which is guaranteed by BottlingGroup, LLC and expires in April 2009. At December 31, 2005, we had $355 million in outstanding commercial paper with aweighted-average interest rate of 4.30 percent. At December 25,2004, we had $78 million in outstanding commercial paper with a weighted-average interest rate of 2.32 percent.
We had available bank credit lines of approximately $835 millionat December 31, 2005. These lines were used to support the general operating needs of our businesses. As of year-end 2005,we had $156 million outstanding under these lines of credit at aweighted-average interest rate of 4.33 percent. As of year-end2004, we had available short-term bank credit lines of approximately$381 million and $77 million was outstanding under these lines of credit at a weighted-average interest rate of 3.72 percent.
Certain of our senior notes have redemption features and non-financial covenants that will, among other things, limit our abilityto create or assume liens, enter into sale and lease-back transactions,engage in mergers or consolidations and transfer or lease all orsubstantially all of our assets. Additionally, certain of our creditfacilities and senior notes have financial covenants consisting ofthe following:
• Our debt to capitalization ratio should not be greater than .75 onthe last day of a fiscal quarter when PepsiCo Inc.’s ratings are A- by S&P and A3 by Moody’s or higher. Debt is defined as totallong-term and short-term debt plus accrued interest plus totalstandby letters of credit and other guarantees less cash and cashequivalents not in excess of $500 million. Capitalization isdefined as debt plus shareholders’ equity plus minority interest,excluding the impact of the cumulative translation adjustment.
• Our debt to EBITDA ratio should not be greater than five on thelast day of a fiscal quarter when PepsiCo Inc.’s ratings are lessthan A- by S&P or A3 by Moody’s. EBITDA is defined as the lastfour quarters of earnings before depreciation, amortization, netinterest expense, income taxes, minority interest, net other non-operating expenses and extraordinary items.

61
The Pepsi Bottling Group, Inc.Annual Report 2005
• New secured debt should not be greater than 10 percent ofBottling Group, LLC’s net tangible assets. Net tangible assets aredefined as total assets less current liabilities and netintangible assets.
We are in compliance with all debt covenants.
Our peak borrowing timeframe varies with our working capitalrequirements and the seasonality of our business. Additionally,throughout the year, we may have further short-term borrowingrequirements driven by other operational needs of our business.During 2005, borrowings from our commercial paper program inthe U.S. peaked at $355 million. Outside the U.S., borrowings fromour international credit facilities peaked at $234 million, reflectingpayments for working capital requirements.
Amounts paid to third parties for interest, net of cash receivedfrom our interest rate swaps, was $246 million, $232 million and$243 million in 2005, 2004 and 2003, respectively. Total interestexpense incurred during 2005, 2004 and 2003 was $258 million,$236 million and $247 million, respectively.
At December 31, 2005, we have outstanding letters of credit, bankguarantees and surety bonds valued at $276 million from financialinstitutions primarily to provide collateral for estimated self-insurance claims and other insurance requirements.
Note 10 – Leases
We have non-cancelable commitments under both capital andlong-term operating leases, which consist principally of buildings,office equipment and machinery. Certain of our operating leasesfor our buildings contain escalation clauses, holiday rent allowancesand other rent incentives. We recognize rent expense on our operating leases, including these allowances and incentives, on astraight-line basis over the lease term. Capital and operating leasecommitments expire at various dates through 2072. Most leasesrequire payment of related executory costs, which include propertytaxes, maintenance and insurance.
At December 31, 2005, the present value of minimum paymentsunder capital leases was $5 million, after deducting $1 million forimputed interest. We plan to receive $5 million of sublease incomefor the periods 2006 through 2013.
Our future minimum commitments under non-cancelable leases asof December 31, 2005 and rental expense under operating leasesare set forth below:
Leases
Future Minimum Rental Payments Capital Operating
2006 $1 $ 502007 1 422008 – 312009 – 242010 – 19Thereafter 3 64Total $5 $230
Components of rental expense under operating leases:
Rental Expense 2005 2004 2003
Minimum rentals $90 $77 $71Sublease rental income (2) (2) (2)Total $88 $75 $69
Note 11 – Financial Instruments and Risk Management
Cash Flow Hedges – We are subject to market risk with respectto the cost of commodities because our ability to recover increasedcosts through higher pricing may be limited by the competitiveenvironment in which we operate. We use future and option con-tracts to hedge the risk of adverse movements in commodity pricesrelated primarily to anticipated purchases of aluminum and fuelused in our operations. These contracts generally range fromone to 12 months in duration and qualify for cash flow hedgeaccounting treatment.
We are subject to foreign currency transactional risks in certain ofour international territories for transactions that are denominated incurrencies that are different from their functional currency. Beginningin 2004, we entered into forward exchange contracts to hedge portionsof our forecasted U.S. dollar purchases in our Canadian business.These contracts generally range from one to 12 months in durationand qualify for cash flow hedge accounting treatment.
We have also entered into several treasury rate lock agreementsto hedge against adverse interest rate changes on certain debtfinancing arrangements.
For a cash flow hedge, the effective portion of the change in thefair value of a derivative instrument, which is highly effective, isdeferred in accumulated other comprehensive loss until the under-lying hedged item is recognized in earnings. The ineffective portionof a fair value change on a qualifying cash flow hedge is recognized

62
PART II (continued) The Pepsi Bottling Group, Inc.Annual Report 2005
in earnings immediately and is recorded consistent with theexpense classification of the underlying hedged item.
The following summarizes activity in accumulated other compre-hensive loss (“AOCL”) related to derivatives designated as cashflow hedges held by the Company during the applicable periods:
Before Net ofMinority MinorityInterest Minority Interest
Year ended December 31, 2005 and Taxes Interest Taxes and Taxes
Accumulated net gains as of December 25, 2004 $17 $(1) $(6) $10
Net changes in the fair value of cash flow hedges 5 – (2) 3
Net gains reclassified from AOCL into earnings (17) 1 6 (10)
Accumulated net gains as of December 31, 2005 $ 5 $ – $(2) $ 3
Before Net ofMinority MinorityInterest Minority Interest
Year ended December 25, 2004 and Taxes Interest Taxes and Taxes
Accumulated net gains as of December 27, 2003 $ 22 $(1) $ (8) $ 13
Net changes in the fair value of cash flow hedges 29 (2) (10) 17
Net gains reclassified from AOCL into earnings (34) 2 12 (20)
Accumulated net gains as of December 25, 2004 $ 17 $(1) $ (6) $ 10
Assuming no change in the commodity prices and foreign currencyrates as measured on December 31, 2005, $2 million of deferredloss will be recognized in earnings over the next 12 months. Theineffective portion of the change in fair value of these contractswas not material to our results of operations in 2005, 2004 or 2003.
Fair Value Hedges – We finance a portion of our operationsthrough fixed-rate debt instruments. We effectively converted$800 million of our senior notes to floating rate debt through theuse of interest rate swaps with the objective of reducing our over-all borrowing costs. These interest rate swaps meet the criteria for fair value hedge accounting and are 100 percent effective ineliminating the market rate risk inherent in our long-term debt.Accordingly, any gain or loss associated with these swaps is fullyoffset by the opposite market impact on the related debt. Thechange in fair value of the interest rate swaps was a decrease of$15 million and $7 million in 2005 and 2004, respectively. In 2005,the current portion of the fair value change of our swaps and debt
has been recorded in accounts payable and other current liabilitiesand current maturities of long-term debt in our ConsolidatedBalance Sheets. The long-term portion of the change in 2005 hasbeen recorded in other liabilities and long-term debt. In 2004, thefair value change of our swaps and debt has been recorded in otherliabilities and long-term debt in our Consolidated Balance Sheets.
Unfunded Deferred Compensation Liability – Our unfundeddeferred compensation liability is subject to changes in our stockprice as well as price changes in other equity and fixed-incomeinvestments. Participating employees in our deferred compensationprogram can elect to defer all or a portion of their compensation tobe paid out on a future date or dates. As part of the deferralprocess, employees select from phantom investment options thatdetermine the earnings on the deferred compensation liability andthe amount that they will ultimately receive. Employee investmentelections include PBG stock and a variety of other equity and fixed-income investment options.
Since the plan is unfunded, employees’ deferred compensationamounts are not directly invested in these investment vehicles.Instead, we track the performance of each employee’s investmentselections and adjust his or her deferred compensation accountaccordingly. The adjustments to the employees’ accounts increasesor decreases the deferred compensation liability reflected on ourConsolidated Balance Sheets with an offsetting increase ordecrease to our selling, delivery and administrative expenses.
We use prepaid forward contracts to hedge the portion of ourdeferred compensation liability that is based on our stock price. At December 31, 2005, we had a prepaid forward contract for710,000 shares at a price of $29.34, which was accounted for as a natural hedge. This contract requires cash settlement and has afair value at December 31, 2005, of $20 million recorded in prepaidexpenses and other current assets in our Consolidated BalanceSheets. The fair value of this contract changes based on the changein our stock price compared with the contract exercise price. Werecognized $1 million in income in 2005 and $2 million in income in 2004, resulting from the change in fair value of these prepaidforward contracts. The earnings impact from these instruments isclassified as selling, delivery and administrative expenses.
Other Financial Assets and Liabilities – Financial assets withcarrying values approximating fair value include cash and cashequivalents and accounts receivable. Financial liabilities with carrying values approximating fair value include accounts payableand other accrued liabilities and short-term debt. The carryingvalue of these financial assets and liabilities approximates fairvalue due to their short maturities and since interest rates approximate current market rates for short-term debt.
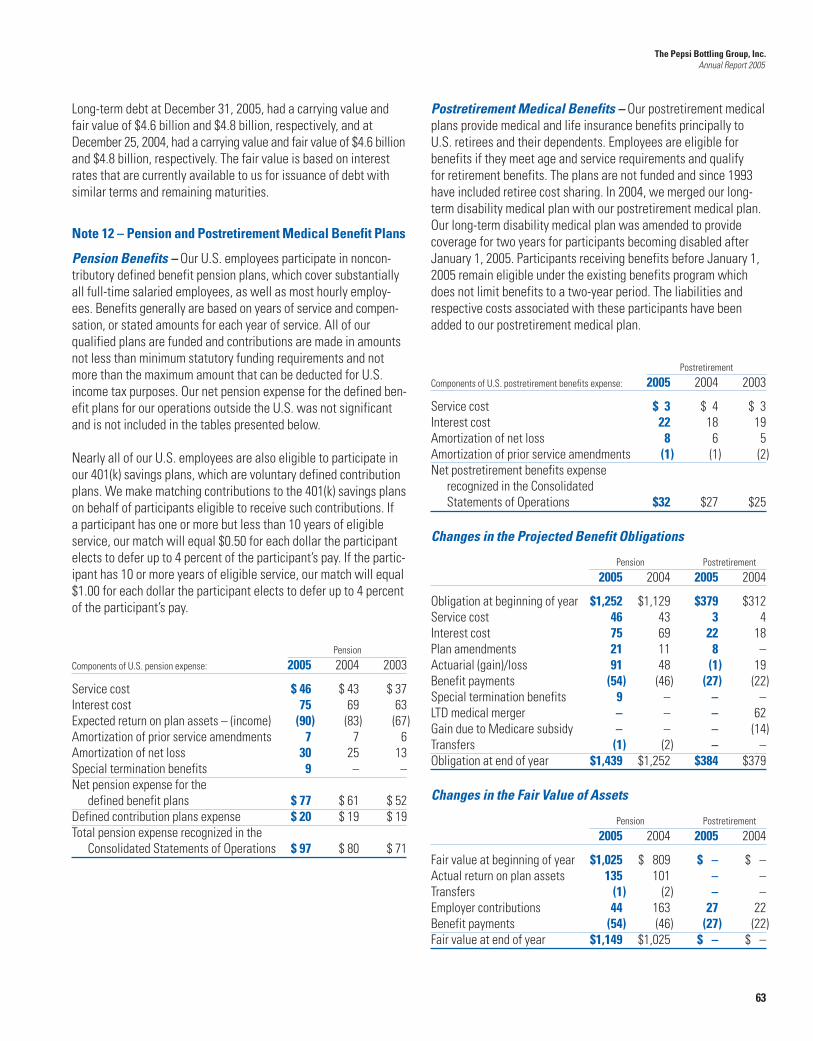
63
The Pepsi Bottling Group, Inc.Annual Report 2005
Long-term debt at December 31, 2005, had a carrying value andfair value of $4.6 billion and $4.8 billion, respectively, and atDecember 25, 2004, had a carrying value and fair value of $4.6 billionand $4.8 billion, respectively. The fair value is based on interestrates that are currently available to us for issuance of debt withsimilar terms and remaining maturities.
Note 12 – Pension and Postretirement Medical Benefit Plans
Pension Benefits – Our U.S. employees participate in noncon-tributory defined benefit pension plans, which cover substantiallyall full-time salaried employees, as well as most hourly employ-ees. Benefits generally are based on years of service and compen-sation, or stated amounts for each year of service. All of ourqualified plans are funded and contributions are made in amountsnot less than minimum statutory funding requirements and notmore than the maximum amount that can be deducted for U.S.income tax purposes. Our net pension expense for the defined ben-efit plans for our operations outside the U.S. was not significantand is not included in the tables presented below.
Nearly all of our U.S. employees are also eligible to participate inour 401(k) savings plans, which are voluntary defined contributionplans. We make matching contributions to the 401(k) savings planson behalf of participants eligible to receive such contributions. If a participant has one or more but less than 10 years of eligibleservice, our match will equal $0.50 for each dollar the participantelects to defer up to 4 percent of the participant’s pay. If the partic-ipant has 10 or more years of eligible service, our match will equal$1.00 for each dollar the participant elects to defer up to 4 percentof the participant’s pay.
Pension
Components of U.S. pension expense: 2005 2004 2003
Service cost $ 46 $ 43 $ 37Interest cost 75 69 63Expected return on plan assets – (income) (90) (83) (67)Amortization of prior service amendments 7 7 6Amortization of net loss 30 25 13Special termination benefits 9 – –Net pension expense for the
defined benefit plans $ 77 $ 61 $ 52Defined contribution plans expense $ 20 $ 19 $ 19Total pension expense recognized in the
Consolidated Statements of Operations $ 97 $ 80 $ 71
Postretirement Medical Benefits – Our postretirement medicalplans provide medical and life insurance benefits principally toU.S. retirees and their dependents. Employees are eligible for benefits if they meet age and service requirements and qualify for retirement benefits. The plans are not funded and since 1993have included retiree cost sharing. In 2004, we merged our long-term disability medical plan with our postretirement medical plan. Our long-term disability medical plan was amended to provide coverage for two years for participants becoming disabled afterJanuary 1, 2005. Participants receiving benefits before January 1,2005 remain eligible under the existing benefits program whichdoes not limit benefits to a two-year period. The liabilities andrespective costs associated with these participants have beenadded to our postretirement medical plan.
Postretirement
Components of U.S. postretirement benefits expense: 2005 2004 2003
Service cost $ 3 $ 4 $ 3Interest cost 22 18 19Amortization of net loss 8 6 5Amortization of prior service amendments (1) (1) (2)Net postretirement benefits expense
recognized in the Consolidated Statements of Operations $32 $27 $25
Changes in the Projected Benefit Obligations
Pension Postretirement
2005 2004 2005 2004
Obligation at beginning of year $1,252 $1,129 $379 $312Service cost 46 43 3 4Interest cost 75 69 22 18Plan amendments 21 11 8 –Actuarial (gain)/loss 91 48 (1) 19Benefit payments (54) (46) (27) (22)Special termination benefits 9 – – –LTD medical merger – – – 62Gain due to Medicare subsidy – – – (14)Transfers (1) (2) – –Obligation at end of year $1,439 $1,252 $384 $379
Changes in the Fair Value of Assets
Pension Postretirement
2005 2004 2005 2004
Fair value at beginning of year $1,025 $ 809 $ – $ –Actual return on plan assets 135 101 – –Transfers (1) (2) – –Employer contributions 44 163 27 22Benefit payments (54) (46) (27) (22)Fair value at end of year $1,149 $1,025 $ – $ –

64
Additional Plan Information
Pension Postretirement
2005 2004 2005 2004
Projected benefit obligation $1,439 $1,252 $384 $379Accumulated benefit obligation $1,330 $1,150 $384 $379Fair value of plan assets(1) $1,190 $1,033 $ – $ –
(1) Includes fourth quarter employer contributions.
The accumulated and projected obligations for all plans exceed thefair value of assets.
Funded Status Recognized on the Consolidated Balance Sheets
Pension Postretirement
2005 2004 2005 2004
Funded status at end of year $(290) $(227) $(384) $(379)Unrecognized prior service cost 64 50 2 (6)Unrecognized loss 474 458 137 145Fourth quarter
employer contribution 41 8 6 8Net amounts recognized $ 289 $ 289 $(239) $(232)
Net Amounts Recognized in the Consolidated Balance Sheets
Pension Postretirement
2005 2004 2005 2004
Other liabilities $(158) $(136) $(239) $(232)Intangible assets 64 50 – –Accumulated other
comprehensive loss 383 375 – –Net amounts recognized $ 289 $ 289 $(239) $(232)Increase in minimum liability
included in accumulated other comprehensive loss in Shareholders’ Equity $ 8 $ 29 $ – $ –
At December 31, 2005 and December 25, 2004, the accumulatedbenefit obligation of PBG’s U.S. pension plans exceeded the fairmarket value of the plan assets resulting in the recognition of theunfunded liability as a minimum balance sheet liability. As a resultof this additional liability, our intangible asset increased by $14 millionto $64 million in 2005, which equals the amount of unrecognizedprior service cost in our plans. The remainder of the liability thatexceeded the unrecognized prior service cost was recognized as anincrease to accumulated other comprehensive loss of $8 million and$29 million in 2005 and 2004, respectively, before taxes and minorityinterest. The adjustments to accumulated other comprehensive lossare reflected after minority interest of $1 million and $2 million, and deferred income taxes of $2 million and $11 million in 2005 and2004, respectively, in our Consolidated Statements of Changes inShareholders’ Equity.
Assumptions – The weighted-average assumptions used to measure net expense for years ended:
Pension Postretirement
2005 2004 2003 2005 2004 2003
Discount rate 6.15% 6.25% 6.75% 6.15% 6.25% 6.75%Expected return on plan assets(1) 8.50% 8.50% 8.50% N/A N/A N/ARate of compensation increase 3.60% 4.20% 4.34% 3.60% 4.20% 4.34%
(1) Expected return on plan assets is presented after administration expenses.
PART II (continued) The Pepsi Bottling Group, Inc.Annual Report 2005

65
The weighted-average assumptions used to measure the benefitliability as of the end of the year were as follows:
Pension Postretirement
2005 2004 2005 2004
Discount rate 5.80% 6.15% 5.55% 6.15%Rate of compensation increase 3.53% 3.60% 3.53% 3.60%
We have evaluated these assumptions with our actuarial advisorsand we believe that they are appropriate, although an increase or decrease in the assumptions or economic events outside ourcontrol could have a material impact on reported net income.
Funding and Plan Assets
Allocation Percentage
Target Actual ActualAsset Category 2006 2005 2004
Equity securities 75% 76% 75%Debt securities 25% 24% 25%
The table above shows the target allocation and actual allocation.Our target allocations of our plan assets reflect the long-termnature of our pension liabilities. None of the assets are investeddirectly in equity or debt instruments issued by PBG, PepsiCo orany bottling affiliates of PepsiCo, although it is possible thatinsignificant indirect investments exist through our broad marketindices. Our equity investments are diversified across all areas ofthe equity market (i.e., large, mid and small capitalization stocksas well as international equities). Our fixed income investmentsare also diversified and consist of both corporate and U.S. governmentbonds. We currently do not invest directly into any derivativeinvestments. PBG’s assets are held in a pension trust account atour trustee’s bank.
PBG’s pension investment policy and strategy are mandated byPBG’s Pension Investment Committee (“PIC”) and are overseen by the PBG Board of Directors’ Compensation and ManagementDevelopment Committee. The plan assets are invested using acombination of enhanced and passive indexing strategies. The performance of the plan assets is benchmarked against marketindices and reviewed by the PIC. Changes in investment strate-gies, asset allocations and specific investments are approved bythe PIC prior to execution.
Health Care Cost Trend Rates – We have assumed an averageincrease of 9.0 percent in 2006 in the cost of postretirementmedical benefits for employees who retired before cost sharingwas introduced. This average increase is then projected todecline gradually to 5.0 percent in 2013 and thereafter.
Assumed health care cost trend rates have an impact on theamounts reported for postretirement medical plans. A one-percentage point change in assumed health care costs would have the following impact:
1% 1%Increase Decrease
Effect on total fiscal year 2005 service and interest cost components $1 $(1)
Effect on the fiscal year 2005 accumulated postretirement benefit obligation $7 $(7)
On May 19, 2004, the FASB issued Staff Position No. FAS 106-2 to provide guidance relating to the prescription drug subsidy provided by the Medicare Prescription Drug, Improvement andModernization Act of 2003 (“Act”). The prescription drug benefitscurrently provided to all our Medicare-eligible retirees would beconsidered actuarially equivalent to the benefit provided under theAct based on the guidance issued by the Centers for Medicare &Medicaid Services.
For the years ended 2005 and 2004, the net periodic postretirementmedical benefits cost decreased by $1.7 million and $1.1 million,respectively as a result of the Act.
In addition, the Obligation (accumulated projected benefit obligation)as of year end 2005 and 2004 decreased by $14.8 million and$14.3 million, respectively as a result of the Act.
There were no changes in estimates of participation or per-capitaclaims costs as a result of the Act.
Pension and Postretirement Cash Flow – Our contributionsare made in accordance with applicable tax regulations that provide us with current tax deductions for our contributions andfor taxation to the employee when the benefits are received. Wedo not fund our pension plan and postretirement medical planswhen our contributions would not be tax deductible or when benefits would be taxable to the employee before receipt. Of thetotal pension liabilities at December 31, 2005, $52 million relatesto plans not funded due to these unfavorable tax consequences.
Employer Contributions to U.S. Plans Pension Postretirement
2004 $81 $222005 $77 $272006 (expected) $56 $28
The Pepsi Bottling Group, Inc.Annual Report 2005

66
The following table summarizes restricted stock and restricted stock unit activity for the years ended 2005, 2004, and 2003:
Restricted Stock Restricted Stock Units
Granted Weighted- Granted Weighted-during Average Outstanding during Average Outstanding
the year Grant Price at year end the year Grant Price at year end
2005 – $ – 352,000 538,000 $28.12 567,0002004 45,000 $24.25 394,000 3,000 $30.25 29,0002003 350,000 $23.48 350,000 1,000 $18.25 26,000
PART II (continued) The Pepsi Bottling Group, Inc.Annual Report 2005
Our 2006 expected contributions are intended to meet orexceed the IRS minimum requirements and provide us with current tax deductions.
Expected Benefit Payments – The expected benefit paymentsmade from our pension and postretirement medical plans (with andwithout the subsidy received from the Act) to our participants over thenext ten years are as follows:
Pension Postretirement
Including ExcludingMedicare Medicare
Expected Benefit Payments Subsidy Subsidy
2006 $ 55 $ 27 $ 282007 $ 60 $ 26 $ 272008 $ 65 $ 26 $ 282009 $ 69 $ 27 $ 282010 $ 75 $ 27 $ 282011 to 2015 $483 $136 $142
Note 13 – Stock-Based Compensation Plans
Under our stock-based long-term incentive compensation plans(“incentive plan”) we grant non-qualified stock options to certainemployees, including middle and senior management. We alsogrant restricted stock and restricted stock units to certain senior
executives. Non-employee members of our Board (“Directors”)participate in a separate incentive plan. Directors receive a one-timerestricted stock award of $25,000 upon commencing service on ourBoard and, each year while serving as a Director, each Director isgranted an equity-based award, which may include non-qualifiedstock options, shares of common stock or restricted stock.
Beginning in 2006, under our incentive plans an equal mix of stockoptions and restricted stock units will be granted to Directors andmiddle and senior management employees.
Restricted Stock and Restricted Stock Units – Restrictedstock and restricted stock units granted to employees have vestingperiods that range from two to five years. In addition, restrictedstock unit awards to certain senior executives contain vesting pro-visions that are contingent upon the achievement of pre-establishedperformance targets. The initial restricted stock award to Directorsremains restricted while the individual serves on the Board. Theannual grants to Directors are immediately vested, but may bedeferred. All restricted stock and restricted stock unit awards aresettled in shares of PBG common stock.
Upon issuance of restricted stock or restricted stock units, unearnedcompensation is recognized within shareholders’ equity for the costof the stock or units. The unearned compensation is recognized ascompensation expense ratably over the vesting period of the award.

67
The Pepsi Bottling Group, Inc.Annual Report 2005
Stock Options – Options granted in 2005, 2004 and 2003 hadexercise prices ranging from $27.75 per share to $29.75 per share,$24.25 per share to $30.25 per share and $18.25 per share to$25.50 per share, respectively, expire in 10 years and generallybecome exercisable 25 percent after one year, an additional25 percent after two years, and the remainder after three years.We measure the fair value of our options on the date of grantusing the Black-Scholes-Merton option-pricing model.
The following table summarizes option activity during 2005:
Weighted-AverageExercise
Options in millions Options Price
Outstanding at beginning of year 38.4 $20.35Granted 7.9 $28.24Exercised (6.8) $15.93Forfeited (1.4) $26.61
Outstanding at end of year 38.1 $22.54Exercisable at end of year 22.7 $19.08Weighted-average fair value of options
granted during the year $ 8.68
The following table summarizes option activity during 2003:
Weighted-AverageExercise
Options in millions Options Price
Outstanding at beginning of year 37.4 $15.53Granted 8.1 $23.27Exercised (3.1) $11.27Forfeited (1.1) $22.44
Outstanding at end of year 41.3 $17.19Exercisable at end of year 26.9 $13.93Weighted-average fair value of options
granted during the year $ 9.29
The following table summarizes option activity during 2004:
Weighted-AverageExercise
Options in millions Options Price
Outstanding at beginning of year 41.3 $17.19Granted 7.1 $29.54Exercised (9.3) $12.86Forfeited (0.7) $25.38
Outstanding at end of year 38.4 $20.35Exercisable at end of year 23.4 $16.43Weighted-average fair value of options
granted during the year $10.81
Stock options outstanding and exercisable at December 31, 2005:
Options Outstanding Options Exercisable
Weighted-Average Weighted- Weighted-
Remaining Average AverageOptions in millions Contractual Exercise ExerciseRange of Exercise Price Options Life In Years Price Options Price
$ 9.38–$11.49 3.1 4.25 $ 9.39 3.1 $ 9.39$11.50–$15.88 4.9 3.36 $11.75 4.9 $11.75$15.89–$22.50 5.9 5.37 $20.52 5.7 $20.57$22.51–$28.24 10.6 6.90 $24.38 7.4 $24.57$28.25–$30.25 13.6 8.78 $28.85 1.6 $29.51
38.1 6.66 $22.54 22.7 $19.08

68
PART II (continued) The Pepsi Bottling Group, Inc.Annual Report 2005
Note 14 – Income Taxes
The details of our income tax provision are set forth below:
2005 2004 2003
Current:Federal $238 $135 $93Foreign 26 35 12State 26 17 8
290 187 113Deferred:
Federal (36) 54 74Foreign (19) (22) 26State (10) 9 14
(65) 41 114225 228 227
International legal entity/debt restructuring reserves 22 30 –
International tax rate change (benefit)/expense – (26) 11
247 232 238Cumulative effect of change in
accounting principle – – (1)$247 $232 $237
In 2005, our tax provision includes increased taxes on U.S. earningsand additional contingencies related to certain historic tax positions,as well as the following significant items:
• Valuation allowances – In the fourth quarter, we reversed valuation allowances resulting in a $27 million tax benefit. These reversals were due in part to improved profitability trendsin Russia and a change to the Russia tax law that enables us to use a greater amount of our Russian NOLs. Additionally, theimplementation of U.S. legal entity restructuring contributed to the remainder of the valuation allowance reversal.
• International legal entity/debt restructuring – In the fourth quarter, we completed the reorganization of our internationallegal entity and debt structure to allow for more efficient cashmobilization, to reduce taxable foreign exchange risks and toreduce potential future tax costs. This reorganization resulted in a $22 million tax charge.
In 2004, we had the following significant tax items, whichdecreased our tax expense by approximately $4 million:
• International tax structure change – In December 2004, we initiated a reorganization of our international tax structure toallow for more efficient cash mobilization and to reduce futuretax costs. This reorganization triggered a $30 million tax chargein the fourth quarter, of which $14 million was recorded as part
of our current provision and $16 million was recorded in ourdeferred tax provision.
• Mexico tax rate change – In December 2004, legislation wasenacted changing the Mexican statutory income tax rate. Thisrate change decreased our net deferred tax liabilities andresulted in a $26 million tax benefit in the fourth quarter.
• Tax reserves – During 2004, we adjusted previously establishedliabilities for tax exposures due largely to the settlement of certain international tax audits. The adjustment of these liabilities resulted in an $8 million tax benefit for the year.
Our 2003 income tax provision includes an increase in income taxexpense of $11 million due to enacted tax rate changes in Canadaduring the 2003 tax year.
Our U.S. and foreign income before income taxes is set forth below:
2005 2004 2003
U.S. $588 $550 $533Foreign 125 139 127Income before income taxes and cumulative
effect of change in accounting principle $713 $689 $660Cumulative effect of change in
accounting principle – – (7)$713 $689 $653
Our reconciliation of income taxes calculated at the U.S. federalstatutory rate to our provision for income taxes is set forth below:
2005 2004 2003
Income taxes computed at the U.S. federal statutory rate 35.0% 35.0% 35.0%
State income tax, net of federal tax benefit 2.1 2.2 1.9
Impact of foreign results (4.4) (10.4) (11.4)Change in valuation allowances, net (6.0) 3.4 5.6Nondeductible expenses 1.8 2.1 1.9Qualified domestic production
activity deduction (0.9) – –International tax audit settlements, net – (1.2) –Other, net 4.1 2.0 1.4
31.7 33.1 34.4International legal entity/debt
restructuring reserves 3.0 4.3 –International rate change (benefit)/expense – (3.7) 1.7Total effective income tax rate before
cumulative effect of change in accounting principle 34.7% 33.7% 36.1%
Cumulative effect of change in accounting principle – – 0.2
Total effective income tax rate 34.7% 33.7% 36.3%

69
The Pepsi Bottling Group, Inc.Annual Report 2005
The details of our 2005 and 2004 deferred tax liabilities (assets)are set forth below:
2005 2004
Intangible assets and property, plant and equipment $1,627 $1,575Other 94 112Gross deferred tax liabilities 1,721 1,687
Net operating loss carryforwards (291) (356)Employee benefit obligations (196) (179)Bad debts (16) (17)Various liabilities and other (83) (91)Gross deferred tax assets (586) (643)Deferred tax asset valuation allowance 228 320Net deferred tax assets (358) (323)Net deferred tax liability $1,363 $1,364
Consolidated Balance Sheets ClassificationPrepaid expenses and other current assets $ (61) $ (51)Other assets (14) –Accounts payable and other current liabilities 17 –Deferred income taxes 1,421 1,415
$1,363 $1,364
We have net operating loss carryforwards (“NOLs”) totaling$1,146 million at December 31, 2005, which are available toreduce future taxes in the U.S., Spain, Greece, Russia, Turkey andMexico. Of these NOLs, $6 million expire in 2006 and $1,140 millionexpire at various times between 2007 and 2025. At December 31,2005, we have tax credit carryforwards in the U.S. of $4 millionwith an indefinite carryforward period and in Mexico of $14 million,which expires at various times between 2009 and 2015.
We establish valuation allowances for our deferred tax assetswhen the amount of expected future taxable income is not likely to support the use of the deduction or credit. Our valuationallowances, which reduce deferred tax assets to an amount thatwill more likely than not be realized, decreased by $92 million in 2005 and increased by $49 million in 2004.
Approximately $17 million of our valuation allowance relating toour deferred tax assets at December 31, 2005, would be applied to reduce goodwill if reversed in future periods.
Deferred taxes are not recognized for temporary differencesrelated to investments in foreign subsidiaries that are essentiallypermanent in duration. Determination of the amount of unrecognizeddeferred taxes related to these investments is not practicable. Theundistributed earnings and profits of our foreign subsidiaries wereapproximately $564 million at December 31, 2005. The AmericanJobs Creation Act of 2004 provides a special tax deduction for the
repatriation in either 2004 or 2005 of earnings and profits from foreign subsidiaries. We evaluated this special tax deduction and,based on the facts surrounding our foreign operations, decided notto repatriate any of our undistributed foreign earnings and profitspursuant to this deduction.
Income taxes receivable from taxing authorities were $39 millionand $50 million at December 31, 2005 and December 25, 2004,respectively. Such amounts are recorded within prepaid expensesand other current assets and other long-term assets in ourConsolidated Balance Sheets. Income taxes payable to taxingauthorities were $34 million and $17 million at December 31, 2005and December 25, 2004, respectively. Such amounts are recordedwithin accounts payable and other current liabilities in ourConsolidated Balance Sheets.
Income taxes receivable from related parties were $4 million and$5 million at December 31, 2005 and December 25, 2004, respectively.Such amounts are recorded within accounts receivable in ourConsolidated Balance Sheets. Amounts paid to taxing authoritiesand related parties for income taxes were $235 million, $172 millionand $115 million in 2005, 2004 and 2003 respectively.
Under our tax separation agreement with PepsiCo, PepsiCo maintainsfull control and absolute discretion for any combined or consolidatedtax filings for tax periods ended on or before our initial public offeringthat occurred in March 1999. PepsiCo has contractually agreed toact in good faith with respect to all tax examination matters affectingus. In accordance with the tax separation agreement, we will bearour allocable share of any risk or benefit resulting from the settlementof tax matters affecting us for these periods.
Note 15 – Geographic Data
We operate in one industry, carbonated soft drinks and otherready-to-drink beverages. We conduct business in the U.S.,Mexico, Canada, Spain, Russia, Greece and Turkey.
Net Revenues
2005 2004 2003
U.S. $ 8,438 $ 7,818 $ 7,406Mexico 1,177 1,071 1,105Other countries 2,270 2,017 1,754
$11,885 $10,906 $10,265
Long-Lived Assets
2005 2004
U.S. $6,129 $5,875Mexico 1,478 1,435Other countries 1,505 1,444
$9,112 $8,754

70
PART II (continued) The Pepsi Bottling Group, Inc.Annual Report 2005
Note 16 – Related Party Transactions
PepsiCo is considered a related party due to the nature of our franchise relationship and its ownership interest in our company.The most significant agreements that govern our relationship with PepsiCo consist of:
(1) The master bottling agreement for cola beverages bearing the“PEPSI-COLA” and “PEPSI” trademarks in the United States;master bottling agreements and distribution agreements fornon-cola products in the United States; and a master fountainsyrup agreement in the United States;
(2) Agreements similar to the master bottling agreement and thenon-cola agreements for each country in which we operate,including Canada, Spain, Russia, Greece, Turkey and Mexico, as well as a fountain syrup agreement for Canada, similar tothe master syrup agreement;
(3) A shared services agreement where we obtain various servicesfrom PepsiCo, which includes services for information technologymaintenance and the procurement of raw materials. We alsoprovide services to PepsiCo, including facility and credit andcollection support. The amounts paid or received under thiscontract are equal to the actual costs incurred by the companyproviding the service; and
(4) Transition agreements that provide certain indemnities to theparties, and provide for the allocation of tax and other assets,liabilities and obligations arising from periods prior to the initialpublic offering. Under our tax separation agreement, PepsiComaintains full control and absolute discretion for any combinedor consolidated tax filings for tax periods ended on or beforethe date of our initial public offering.
Additionally, we review our annual marketing, advertising, management and financial plans each year with PepsiCo for itsapproval. If we fail to submit these plans, or if we fail to carrythem out in all material respects, PepsiCo can terminate our beverageagreements. If our beverage agreements with PepsiCo are terminatedfor this or for any other reason, it would have a material adverseeffect on our business and financial results.
The Consolidated Statements of Operations include the followingincome (expense) amounts as a result of transactions with PepsiCoand its affiliates:
2005 2004 2003
Net revenues:Bottler incentives(a) $ 51 $ 22 $ 21
Cost of sales:Purchases of concentrate and finished products, and AQUAFINA royalty fees(b) $(2,993) $(2,741) $(2,527)
Bottler incentives(a) 559 522 527Manufacturing and distribution service reimbursements(c) – – 6
$(2,434) $(2,219) $(1,994)Selling, delivery and
administrative expenses:Bottler incentives(a) $ 78 $ 82 $ 98Fountain service fee(d) 183 180 200Frito-Lay purchases(e) (144) (75) (51)Shared services(f):
Shared services expense (69) (68) (72)Shared services revenue 8 10 10
Net shared services (61) (58) (62)HFCS(h) 23 – –
$ 79 $ 129 $ 185Income tax benefit(g) $ 3 $ 17 $ 7
(a) Bottler Incentives and Other Arrangements – In order to pro-mote PepsiCo beverages, PepsiCo, at its discretion, provides uswith various forms of bottler incentives. These incentives covera variety of initiatives, including direct marketplace support andadvertising support. We record most of these incentives as an adjustment to cost of sales unless the incentive is for reimbursement of a specific, incremental and identifiable cost.Under these conditions, the incentive would be recorded as an offset against the related costs, either in revenue or selling,delivery and administrative expenses. Changes in our bottlerincentives and funding levels could materially affect our business and financial results.
(b) Purchase of Concentrate and Finished Product – As part of our franchise relationship, we purchase concentrate fromPepsiCo, pay royalties and produce or distribute other productsthrough various arrangements with PepsiCo or PepsiCo joint ventures. The prices we pay for concentrate, finished goods androyalties are determined by PepsiCo at its sole discretion. Concen-trate prices are typically determined annually. In February 2005,PepsiCo increased the price of U.S. concentrate by two percent.PepsiCo has recently announced a further increase of approximatelytwo percent, effective February 2006. Significant changes in theamount we pay PepsiCo for concentrate, finished goods and

71
The Pepsi Bottling Group, Inc.Annual Report 2005
royalties could materially affect our business and financialresults. These amounts are reflected in cost of sales in ourConsolidated Statements of Operations.
(c) Manufacturing and Distribution Service Reimbursements – In2003, we provided manufacturing services to PepsiCo andPepsiCo affiliates in connection with the production of certainfinished beverage products.
(d) Fountain Service Fee – We manufacture and distribute fountain products and provide fountain equipment service toPepsiCo customers in some territories in accordance with thePepsi beverage agreements. Amounts received from PepsiCofor these transactions are offset by the cost to provide theseservices and are reflected in our Consolidated Statements ofOperations in selling, delivery and administrative expenses.
(e) Frito-Lay Purchases – We purchase snack food products fromFrito-Lay, Inc., a subsidiary of PepsiCo, for sale and distributionin Russia. Amounts paid to PepsiCo for these transactions arereflected in selling, delivery and administrative expenses in ourConsolidated Statements of Operations.
(f) Shared Services – We provide to and receive various servicesfrom PepsiCo and PepsiCo affiliates pursuant to a shared servicesagreement and other arrangements. In the absence of theseagreements, we would have to obtain such services on our own. We might not be able to obtain these services on terms, including cost, which are as favorable as those we receive fromPepsiCo. Total expenses incurred and income generated arereflected in selling, delivery and administrative expenses in ourConsolidated Statements of Operations.
(g) Income Tax Benefit – Under our tax separation agreement withPepsiCo, PepsiCo maintains full control and absolute discretion for any combined or consolidated tax filings for taxperiods ended on or before our initial public offering thatoccurred in March 1999. PepsiCo has contractually agreed to actin good faith with respect to all tax examination matters affectingus. In accordance with the tax separation agreement, we willbear our allocable share of any risk or benefit resulting from thesettlement of tax matters affecting us for these periods.
(h) High Fructose Corn Syrup (“HFCS”) Settlement – On June 28,2005, Bottling Group LLC and PepsiCo entered into a settlementagreement related to the allocation of certain proceeds fromthe settlement of the HFCS class action lawsuit. The lawsuitrelated to purchases of high fructose corn syrup by several companies, including bottling entities owned and operated byPepsiCo, during the period from July 1, 1991 to June 30, 1995(the “Class Period”). Certain of the bottling entities owned byPepsiCo were transferred to PBG when PepsiCo formed PBG in
1999 (the “PepsiCo Bottling Entities”). Under the settlementagreement with PepsiCo, the Company ultimately received45.8 percent (or approximately $23 million) of the total recoveryrelated to HFCS purchases by PepsiCo Bottling Entities duringthe Class Period.
We are not required to pay any minimum fees to PepsiCo, nor arewe obligated to PepsiCo under any minimum purchase requirements.
We paid PepsiCo $1 million and $3 million during 2004 and 2003,respectively, for distribution rights relating to the SOBE brand incertain PBG-owned territories in the U.S. and Canada.
Bottling Group, LLC will distribute pro rata to PepsiCo and PBG,based upon membership interest, sufficient cash such that aggre-gate cash distributed to us will enable us to pay our income taxes and interest on our $1 billion 7.0% senior notes due 2029.PepsiCo’s pro-rata cash distribution during 2005, 2004 and 2003from Bottling Group, LLC was $12 million, $13 million and $7 mil-lion, respectively.
As of December 31, 2005 and December 25, 2004, the receivablesfrom PepsiCo and its affiliates were $143 million and $150 million,respectively. These balances are shown as part of accounts receivable in our Consolidated Financial Statements. The payablesto PepsiCo and its affiliates were $176 million and $144 million,respectively. These balances are shown as part of accounts payableand other current liabilities in our Consolidated Financial Statements.
Two of our board members are employees of PepsiCo. Neither ofthese board members serves on our Audit and Affiliated TransactionsCommittee, Compensation and Management Development Committeeor Nominating and Corporate Governance Committee. In addition,one of the managing directors of Bottling Group, LLC, our principaloperating subsidiary, is an employee of PepsiCo.
Note 17 – Contingencies
We are subject to various claims and contingencies related to lawsuits, taxes, environmental and other matters arising out of thenormal course of business. We believe that the ultimate liabilityarising from such claims or contingencies, if any, in excess ofamounts already recognized is not likely to have a material adverseeffect on our results of operations, financial condition or liquidity.
Note 18 – Acquisitions
In September 2005, we acquired the operations and exclusive rightto manufacture, sell and distribute Pepsi-Cola beverages from thePepsi-Cola Bottling Company of Charlotte, North Carolina. The

72
PART II (continued) The Pepsi Bottling Group, Inc.Annual Report 2005
acquisition did not have a material impact on our ConsolidatedFinancial Statements.
As a result of the acquisition, we have assigned $70 million togoodwill, $118 million to franchise rights and $12 million to non-compete arrangements. The goodwill and franchise rights are not subject to amortization. The non-compete agreements are beingamortized over ten years. The allocations of the purchase price for the acquisition are still preliminary and will be determined basedon the estimated fair value of assets acquired and liabilitiesassumed as of the date of the acquisition. The operating results ofthe acquisition are included in the accompanying consolidatedfinancial statements from its date of purchase. The acquisitionwas made to enable us to provide better service to our large retailcustomers. We expect the acquisition to reduce costs througheconomies of scale.
During 2004, we acquired the operations and exclusive right tomanufacture, sell and distribute Pepsi-Cola beverages from fourfranchise bottlers. The following acquisitions occurred for anaggregate purchase price of $95 million in cash and assumption of liabilities of $22 million:
• Gaseosas, S.A. de C.V. of Mexicali, Mexico in March
• Seltzer and Rydholm, Inc. of Auburn, Maine in October
• Phil Gaudreault et Fils Ltee of Quebec, Canada in November
• Bebidas Purificada, S.A. de C.V. of Juarez, Mexico in November
As a result of these acquisitions, we have assigned $5 million togoodwill, $66 million to franchise rights and $3 million to non-compete arrangements. The goodwill and franchise rights are not subject to amortization. The non-compete agreements are beingamortized over five to ten years.
During 2004, we also paid $1 million for the purchase of certaindistribution rights relating to SOBE.
Note 19 – Accumulated Other Comprehensive Loss
The year-end balances related to each component of accumulatedother comprehensive loss were as follows:
2005 2004 2003
Net currency translation adjustment $ (46) $(111) $(195)Cash flow hedge adjustment(1) 3 10 13Minimum pension liability adjustment(2) (219) (214) (198)Accumulated other comprehensive loss $(262) $(315) $(380)
(1) Net of minority interest and taxes of $(2) million in 2005, $(7) million in 2004 and $(9) millionin 2003.
(2) Net of minority interest and taxes of $164 million in 2005, $161 million in 2004 and$148 million in 2003.
Note 20 – Computation of Basic and Diluted Earnings PerShare
shares in thousands 2005 2004 2003
Number of shares on which basic earnings per share are based:Weighted-average outstanding
during period 243,461 255,061 269,933Add – Incremental shares under
stock compensation plans 6,752 8,423 6,986Number of shares on which diluted
earnings per share are based: 250,213 263,484 276,919Basic and diluted net income applicable
to common shareholders $ 466 $ 457 $ 416Basic earnings per share $1.91 $1.79 $1.54Diluted earnings per share $1.86 $1.73 $1.50
Diluted earnings per share reflect the potential dilution that could occur if the stock options or other equity awards from ourstock compensation plans were exercised and converted into common stock that would then participate in net income. Optionsto purchase 9.9 million shares at December 31, 2005, 6.8 millionshares at December 25, 2004, and 14.3 million shares atDecember 27, 2003 are not included in the computation of dilutedearnings per share because the effect of including the options inthe computation would be antidilutive.

73
The Pepsi Bottling Group, Inc.Annual Report 2005
Note 21 – Selected Quarterly Financial Data (unaudited)
First Second Third Fourth2005 Quarter Quarter Quarter Quarter Full Year
Net revenues $2,147 $2,862 $3,214 $3,662 $11,885Gross profit 1,031 1,367 1,519 1,715 5,632Operating income 120 303 393 207 1,023Net income 39 148 205 74 466
First Second Third Fourth2004 Quarter Quarter Quarter Quarter(1)(2) Full Year
Net revenues $2,067 $2,675 $2,934 $3,230 $10,906Gross profit 1,016 1,297 1,412 1,525 5,250Operating income 137 286 357 196 976Net income 50 142 191 74 457
(1) Includes Mexico tax law change benefit of $26 million and international tax restructuring charge of $30 million.(2) Includes a $9 million non-cash impairment charge ($6 million net of tax and minority interest) relating to our re-evaluation of the fair value of our franchise licensing agreement for the SQUIRT
trademark in Mexico.

74
PART II (continued) The Pepsi Bottling Group, Inc.Annual Report 2005
REPORT OF INDEPENDENT REGISTERED PUBLIC ACCOUNTING FIRM
The Board of Directors and Shareholders ofThe Pepsi Bottling Group, Inc.Somers, New York
We have audited the accompanying consolidated balance sheetof The Pepsi Bottling Group, Inc. and subsidiaries (the “Company”)as of December 31, 2005, and the related consolidated statementsof operations, changes in shareholders’ equity, and cash flows for the year then ended. These financial statements are theresponsibility of the Company’s management. Our responsibility isto express an opinion on these consolidated financial statementsbased on our audit.
We conducted our audit in accordance with the standards of the Public Company Accounting Oversight Board (United States).Those standards require that we plan and perform the audit toobtain reasonable assurance about whether the financial statementsare free of material misstatement. An audit includes examining, on a test basis, evidence supporting the amounts and disclosuresin the financial statements. An audit also includes assessing theaccounting principles used and significant estimates made bymanagement, as well as evaluating the overall financial statementpresentation. We believe that our audit provides a reasonablebasis for our opinion.
In our opinion, such consolidated financial statements presentfairly, in all material respects, the financial position of the Companyas of December 31, 2005, and the results of its operations and itscash flows for the year then ended in conformity with accountingprinciples generally accepted in the United States of America.
We have also audited, in accordance with the standards of thePublic Company Accounting Oversight Board (United States), the effectiveness of the Company’s internal control over financialreporting as of December 31, 2005, based on the criteria estab-lished in Internal Control – Integrated Framework issued by theCommittee of Sponsoring Organizations of the Treadway Commissionand our report dated February 24, 2006 expressed an unqualifiedopinion on management’s assessment of the effectiveness of the Company’s internal control over financial reporting and anunqualified opinion on the effectiveness of the Company’s internalcontrol over financial reporting.
New York, New YorkFebruary 24, 2006
REPORT OF INDEPENDENT REGISTERED PUBLIC ACCOUNTING FIRM
The Board of Directors and ShareholdersThe Pepsi Bottling Group, Inc.:
We have audited the accompanying consolidated balance sheet ofThe Pepsi Bottling Group, Inc. and subsidiaries as of December 25,2004, and the related consolidated statements of operations, cashflows, and changes in shareholders’ equity for each of the fiscalyears in the two-year period ended December 25, 2004. These consolidated financial statements are the responsibility of theCompany’s management. Our responsibility is to express an opinionon these consolidated financial statements based on our audits.
We conducted our audits in accordance with the standards of the Public Company Accounting Oversight Board (United States).Those standards require that we plan and perform the audit toobtain reasonable assurance about whether the financial state-ments are free of material misstatement. An audit includes examining, on a test basis, evidence supporting the amounts anddisclosures in the financial statements. An audit also includesassessing the accounting principles used and significant estimatesmade by management, as well as evaluating the overall financialstatement presentation. We believe that our audits provide a reasonable basis for our opinion.
In our opinion, the consolidated financial statements referred to above present fairly, in all material respects, the financial position of The Pepsi Bottling Group, Inc. and subsidiaries as ofDecember 25, 2004, and the results of their operations and theircash flows for each of the fiscal years in the two-year periodended December 25, 2004, in conformity with U.S. generallyaccepted accounting principles.
New York, New YorkFebruary 25, 2005

75
ITEM 7A. QUANTITATIVE AND QUALITATIVE DISCLOSURES ABOUT MARKET RISK
Included in Item 7, Management’s Financial Review – MarketRisks and Cautionary Statements.
ITEM 8. FINANCIAL STATEMENTS AND SUPPLEMENTARY DATA
Included in Item 7, Management’s Financial Review –Financial Statements.
The financial statements of Bottling LLC, included in Bottling LLC’sAnnual Report on Form 10-K and filed with the SEC on February 24,2006, are hereby incorporated by reference as required by the SECas a result of Bottling LLC’s guarantee of up to $1,000,000,000aggregate principal amount of our 7% Senior Notes due in 2029.
ITEM 9. CHANGES IN AND DISAGREEMENTSWITH ACCOUNTANTS ON ACCOUNTING ANDFINANCIAL DISCLOSURE
None.
ITEM 9A. CONTROLS AND PROCEDURES
Evaluation of Disclosure Controls and ProceduresPBG’s management carried out an evaluation, as required byRule 13a-15(b) of the Securities Exchange Act of 1934 (the “ExchangeAct”), with the participation of our Chief Executive Officer and ourChief Financial Officer, of the effectiveness of our disclosure controlsand procedures, as of the end of our last fiscal quarter. Based uponthis evaluation, the Chief Executive Officer and the Chief FinancialOfficer concluded that our disclosure controls and procedures wereeffective, as of the end of the period covered by this Annual Reporton Form 10-K, in timely alerting them to material information relatingto PBG and its consolidated subsidiaries required to be included inour Exchange Act reports filed with the SEC.
Management’s Report on Internal Control Over Financial ReportingPBG’s management is responsible for establishing and maintainingadequate internal control over financial reporting for PBG. Internalcontrol over financial reporting is a process designed to providereasonable assurance regarding the reliability of financial reportingand the preparation of financial statements in accordance withgenerally accepted accounting principles and includes those poli-cies and procedures that (1) pertain to the maintenance of recordsthat, in reasonable detail, accurately and fairly reflect the transactionsand dispositions of PBG’s assets, (2) provide reasonable assurancethat transactions are recorded as necessary to permit preparationof financial statements in accordance with generally acceptedaccounting principles, and that PBG’s receipts and expenditures are being made only in accordance with authorizations of PBG’smanagement and directors, and (3) provide reasonable assuranceregarding prevention or timely detection of unauthorized acquisition,use, or disposition of PBG’s assets that could have a material effecton the financial statements.
As required by Section 404 of the Sarbanes-Oxley Act of 2002 andthe related rule of the SEC, management assessed the effectivenessof PBG’s internal control over financial reporting using the InternalControl – Integrated Framework developed by the Committee ofSponsoring Organizations of the Treadway Commission.
Based on this assessment, management concluded that PBG’sinternal control over financial reporting was effective as ofDecember 31, 2005. Management has not identified any materialweaknesses in PBG’s internal control over financial reporting as ofDecember 31, 2005.
Our independent auditors, Deloitte & Touche, LLP (“D&T”), who haveaudited and reported on our financial statements, issued an attestationreport on our assessment of the Company’s internal control overfinancial reporting. D&T’s reports are included in this annual report.
The Pepsi Bottling Group, Inc.Annual Report 2005

76
The Pepsi Bottling Group, Inc.Annual Report 2005
Report of Independent Registered Public Accounting Firm
The Board of Directors and Shareholders ofThe Pepsi Bottling Group, Inc.Somers, New York
We have audited management’s assessment, included in the accompanying Management’s Report on Internal Control overFinancial Reporting, that The Pepsi Bottling Group, Inc. and subsidiaries(the “Company”) maintained effective internal control over financialreporting as of December 31, 2005, based on criteria established inInternal Control – Integrated Framework issued by the Committee of Sponsoring Organizations of the Treadway Commission. TheCompany’s management is responsible for maintaining effectiveinternal control over financial reporting and for its assessment of the effectiveness of internal control over financial reporting. Ourresponsibility is to express an opinion on management’s assessmentand an opinion on the effectiveness of the Company’s internal control over financial reporting based on our audit.
We conducted our audit in accordance with the standards of thePublic Company Accounting Oversight Board (United States).Those standards require that we plan and perform the audit toobtain reasonable assurance about whether effective internal control over financial reporting was maintained in all materialrespects. Our audit included obtaining an understanding of internalcontrol over financial reporting, evaluating management’s assessment,testing and evaluating the design and operating effectiveness ofinternal control, and performing such other procedures as we considered necessary in the circumstances. We believe that ouraudit provides a reasonable basis for our opinions.
A company’s internal control over financial reporting is a processdesigned by, or under the supervision of, the company’s principalexecutive and principal financial officers, or persons performingsimilar functions, and effected by the company’s board of directors,management, and other personnel to provide reasonable assuranceregarding the reliability of financial reporting and the preparation offinancial statements for external purposes in accordance with gen-erally accepted accounting principles. A company’s internal controlover financial reporting includes those policies and procedures that(1) pertain to the maintenance of records that, in reasonable detail,accurately and fairly reflect the transactions and dispositions of the assets of the company; (2) provide reasonable assurance thattransactions are recorded as necessary to permit preparation offinancial statements in accordance with generally accepted accountingprinciples, and that receipts and expenditures of the company arebeing made only in accordance with authorizations of managementand directors of the company; and (3) provide reasonable assuranceregarding prevention or timely detection of unauthorized acquisition,use, or disposition of the company’s assets that could have a materialeffect on the financial statements.
Because of the inherent limitations of internal control over financialreporting, including the possibility of collusion or improper management override of controls, material misstatements due toerror or fraud may not be prevented or detected on a timely basis.Also, projections of any evaluation of the effectiveness of theinternal control over financial reporting to future periods are subject to the risk that the controls may become inadequatebecause of changes in conditions, or that the degree of compliancewith the policies or procedures may deteriorate.
In our opinion, management’s assessment that the Companymaintained effective internal control over financial reporting asof December 31, 2005, is fairly stated, in all material respects,based on the criteria established in Internal Control – IntegratedFramework issued by the Committee of Sponsoring Organizationsof the Treadway Commission. Also in our opinion, the Companymaintained, in all material respects, effective internal controlover financial reporting as of December 31, 2005, based on thecriteria established in Internal Control – Integrated Frameworkissued by the Committee of Sponsoring Organizations of theTreadway Commission.
We have also audited, in accordance with the standards of thePublic Company Accounting Oversight Board (United States), theconsolidated financial statements and financial statement scheduleas of and for the year ended December 31, 2005 and our reportsdated February 24, 2006 expressed an unqualified opinion on thosefinancial statements and financial statement schedule.
New York, New YorkFebruary 24, 2006
Changes in Internal ControlsPBG’s management also carried out an evaluation, as required byRule 13a-15(d) of the Exchange Act, with the participation of ourChief Executive Officer and our Chief Financial Officer, of changesin PBG’s internal control over financial reporting. Based on thisevaluation, the Chief Executive Officer and the Chief FinancialOfficer concluded that there were no changes in our internal control over financial reporting that occurred during our last fiscalquarter that have materially affected, or are reasonably likely tomaterially affect, our internal control over financial reporting.
ITEM 9B. OTHER INFORMATION
None.

77
ITEM 10. DIRECTORS AND EXECUTIVE OFFICERSOF PBG
The name, age and background of each of our directors nominatedfor election are contained under the caption “Election of Directors”in our Proxy Statement for our 2006 Annual Meeting of Shareholders.The identification of our Audit Committee and our Audit Committeefinancial expert is contained in PBG’s Proxy Statement for our 2006Annual Meeting of Shareholders under the captions “CORPORATEGOVERNANCE – Committees of the Board of Directors – The Auditand Affiliated Transactions Committee.” Information regarding theadoption of our Worldwide Code of Conduct, any material amend-ments thereto and any related waivers are contained in our ProxyStatement for our 2006 Annual Meeting of Shareholders under thecaptions “CORPORATE GOVERNANCE – Worldwide Code ofConduct.” All of the foregoing information is incorporated hereinby reference. The Worldwide Code of Conduct is posted on thePBG Website at http://www.pbg.com under Investor Relations –Company Information – Corporate Governance. Pursuant to Item401(b) of Regulation S-K, the requisite information pertaining toour executive officers is reported in Part I of this Report.
Information on compliance with Section 16(a) of the Exchange Actis contained in our Proxy Statement for our 2006 Annual Meetingof Shareholders under the captions “OWNERSHIP OF PBG COMMONSTOCK – Section 16 Beneficial Ownership Reporting Compliance”and is incorporated herein by reference.
ITEM 11. EXECUTIVE COMPENSATION
Information on compensation of our directors and certain namedexecutive officers is contained in our Proxy Statement for our 2006Annual Meeting of Shareholders under the captions “Directors’Compensation” and “EXECUTIVE COMPENSATION,” respectively,and is incorporated herein by reference.
ITEM 12. SECURITY OWNERSHIP OF CERTAINBENEFICIAL OWNERS AND MANAGEMENT ANDRELATED STOCKHOLDER MATTERS
Information on the number of shares of PBG Common Stock beneficially owned by each director, each named executive officerand by all directors and all executive officers as a group is containedunder the captions “OWNERSHIP OF PBG COMMON STOCK –Ownership of Common Stock by Directors and Executive Officers”and information on each beneficial owner of more than 5% of PBGCommon Stock is contained under the captions “OWNERSHIP OFPBG COMMON STOCK-Stock Ownership of Certain BeneficialOwners” in our Proxy Statement for our 2006 Annual Meeting ofShareholders and is incorporated herein by reference.
PART III The Pepsi Bottling Group, Inc.Annual Report 2005
Equity Compensation Plan Information. The table below sets forth certain information as of December 31, 2005, the last day of the fiscal year, for (i) all equity compensation planspreviously approved by our shareholders and (ii) all equity compensation plans not previously approved by our shareholders.
Number of securities remaining
Number of available for futuresecurities to be issued Weighted-average issuance under equity
upon exercise of exercise price of compensation plansoutstanding options, outstanding options, (excluding securitieswarrants and rights warrants and rights reflected in column (a))
Plan Category (a) (b) (c)
Equity compensation plans approved by security holders 35,754,810(1) 22.81 15, 941,667Equity compensation plans not approved by security holders 2,877,834(2) 14.77 0(3)
Total 38,632,644 22.21 15,941,667
(1) The securities reflected in this category are authorized for issuance (a) upon exercise of awards granted under the Directors’ Stock Plan and the 2004 Long-Term Incentive Plan and (b) uponexercise of awards granted prior to May 26, 2004 under the following PBG plans: (i) 1999 Long-Term Incentive Plan; (ii) 2000 Long-Term Incentive Plan and (iii) 2002 Long-Term Incentive Plan.Effective May 26, 2004, no securities were available for future issuance under the 1999 Long-Term Incentive Plan, the 2000 Long-Term Incentive Plan, or the 2002 Long-Term Incentive Plan.
(2) The securities reflected in this category are authorized for issuance upon exercise of awards granted prior to May 26, 2004 under the PBG Stock Incentive Plan (the “SIP”). Effective May 26,2004, no securities were available for future issuance under the SIP.
(3) The 2004 Long-Term Incentive Plan and the Directors’ Stock Plan, both of which have been approved by shareholders, are the only equity compensation plans that provide securities remainingavailable for future issuance.

78
PART III (continued) PART IV The Pepsi Bottling Group, Inc.Annual Report 2005
Description of the PBG Stock Incentive Plan.Effective May 26, 2004, no securities were available for futureissuance under the SIP. The SIP is a non-shareholder approved,broad-based plan that was adopted by the Board of Directors onMarch 30, 1999. No grants, other than stock option awards, havebeen made under the SIP. All stock options were granted to selectgroups of non-management employees with an exercise price equal to the fair market value of PBG Common Stock on the grantdate. The options generally become exercisable three years fromthe date of grant and have a ten-year term. At year-end 2005,options covering 2,877,834 shares were outstanding under the SIP.The SIP is filed as Exhibit 10.11 to our Annual Report on Form 10-Kfor the year ended December 25, 1999 and qualifies this summaryin its entirety.
ITEM 13. CERTAIN RELATIONSHIPS AND RELATEDTRANSACTIONS
Information relating to certain transactions between PBG, PepsiCoand their affiliates and certain other persons is set forth under thecaption “CERTAIN RELATIONSHIPS AND RELATED TRANSACTIONS”in our Proxy Statement for our 2006 Annual Meeting of Shareholdersand is incorporated herein by reference.
ITEM 14. PRINCIPAL ACCOUNTANT FEES ANDSERVICES
PBG changed its independent auditors, effective June 1, 2005,from KPMG LLP (“KPMG”) to Deloitte & Touche LLP (“D&T”).Information relating to audit fees, audit-related fees, tax fees andall other fees billed in fiscal 2004 and 2005 by KPMG, and in 2005by D&T, for services rendered to PBG is set forth under the caption“INDEPENDENT AUDITORS” in the Proxy Statement for our 2006Annual Meeting of Shareholders and is incorporated herein by reference. In addition, information relating to the pre-approvalpolicies and procedures of the Audit and Affiliated TransactionsCommittee is set forth under the caption “INDEPENDENTAUDITORS – Pre-Approval Policies and Procedures” in the ProxyStatement for our 2006 Annual Meeting of Shareholders and isincorporated herein by reference.
ITEM 15. EXHIBITS AND FINANCIAL STATEMENTSCHEDULES
(a)1. Financial Statements. The following consolidated financial statements of PBG and its subsidiaries are included in Item 7:
Consolidated Statements of Operations — Fiscal years endedDecember 31, 2005, December 25, 2004 and December 27, 2003.
Consolidated Statements of Cash Flows — Fiscal years endedDecember 31, 2005, December 25, 2004 and December 27, 2003.
Consolidated Balance Sheets — December 31, 2005 andDecember 25, 2004.
Consolidated Statements of Changes in Shareholders’ Equity —Fiscal years ended December 31, 2005, December 25, 2004 andDecember 27, 2003.
Notes to Consolidated Financial Statements.
Independent Auditors’ Reports.
The financial statements of Bottling LLC, included in Bottling LLC’sAnnual Report on Form 10-K and filed with the SEC on February 24,2006, are hereby incorporated by reference as required by the SECas a result of Bottling LLC’s guarantee of up to $1,000,000,000aggregate principal amount of our 7% Senior Notes due in 2029.
2. Financial Statement Schedules. The following financial statement schedules of PBG and its subsidiaries are included in this Report on the page indicated:
Page
Independent Auditors’ Report on Schedule (Deloitte & Touche LLP) 80
Independent Auditors’ Report on Schedule and Consent (KPMG LLP) 80
Schedule II – Valuation and Qualifying Accounts for the fiscal years ended December 31, 2005, December 25, 2004 and December 27, 2003 81
Index to Exhibits 82

79
The Pepsi Bottling Group, Inc.Annual Report 2005
SIGNATURES
Pursuant to the requirements of Section 13 of the Securities Exchange Act of 1934, The Pepsi Bottling Group, Inc. has duly caused thisreport to be signed on its behalf by the undersigned, thereunto duly authorized.
Dated: February 23, 2006
The Pepsi Bottling Group, Inc.
John T. Cahill Chairman and Chief Executive Officer
Pursuant to the requirements of the Securities Exchange Act of 1934, this report has been signed below by the following persons on behalfof The Pepsi Bottling Group, Inc. and in the capacities and on the date indicated.
SIGNATURE TITLE DATE
/s/ John T. Cahill Chairman of the Board and Chief Executive Officer February 23, 2006John T. Cahill
/s/ Alfred H. Drewes Senior Vice President and Chief Financial Officer (Principal Financial Officer) February 23, 2006Alfred H. Drewes
/s/ Andrea L. Forster Vice President and Controller (Principal Accounting Officer) February 23, 2006Andrea L. Forster
/s/ Linda G. Alvarado Director February 23, 2006Linda G. Alvarado
/s/ Barry H. Beracha Director February 23, 2006Barry H. Beracha
/s/ Ira D. Hall Director February 23, 2006Ira D. Hall
/s/ Thomas H. Kean Director February 23, 2006Thomas H. Kean
/s/ Susan D. Kronick Director February 23, 2006Susan D. Kronick
/s/ Blythe J. McGarvie Director February 23, 2006Blythe J. McGarvie
/s/ Margaret D. Moore Director February 23, 2006Margaret D. Moore
/s/ John A. Quelch Director February 23, 2006John A. Quelch
/s/ Rogelio Rebolledo Director February 23, 2006Rogelio Rebolledo
/s/ Clay G. Small Director February 23, 2006Clay G. Small

80
The Pepsi Bottling Group, Inc.Annual Report 2005
REPORT OF INDEPENDENT REGISTERED PUBLIC ACCOUNTING FIRM
The Board of Directors and Shareholders ofThe Pepsi Bottling Group, Inc.Somers, New York
We have audited the consolidated financial statements of ThePepsi Bottling Group, Inc. and subsidiaries (the “Company”) as ofDecember 31, 2005, and for the year ended December 31, 2005,management’s assessment of the effectiveness of the Company’sinternal control over financial reporting as of December 31, 2005,and the effectiveness of the Company’s internal control over finan-cial reporting as of December 31, 2005, and have issued our reportsthereon dated February 24, 2006; such reports are included elsewherein this Form 10-K. Our audit also included the consolidated financialstatement schedule of the Company listed in Item 15. This consolidatedfinancial statement schedule is the responsibility of the Company’smanagement. Our responsibility is to express an opinion based onour audit. In our opinion, such consolidated financial statementschedule, when considered in relation to the basic consolidatedfinancial statements taken as a whole, presents fairly, in all materialrespects, the information set forth therein.
New York, New YorkFebruary 24, 2006
REPORT AND CONSENT OF INDEPENDENT REGISTEREDPUBLIC ACCOUNTING FIRM
The Board of DirectorsThe Pepsi Bottling Group, Inc.:
The audits referred to in our report dated February 25, 2005, withrespect to the consolidated financial statements of The PepsiBottling Group, Inc. and subsidiaries, included the related financialstatement schedule as of December 25, 2004, and for each of thefiscal years in the two-year period ended December 25, 2004,included in this Form 10-K. This financial statement schedule is theresponsibility of the Company’s management. Our responsibility isto express an opinion on this financial statement schedule basedon our audits. In our opinion, such financial statement schedule,when considered in relation to the basic consolidated financialstatements taken as a whole, presents fairly in all materialrespects the information set forth therein.
We consent to the incorporation by reference in the registrationstatements (No. 333-60428, 333-79357, 333-79369, 333-79375,333-79365, 333-80647, 333-69622, 333-73302, 333-100786, 333-117894, 333-128992, 333-128993) on Form S-8 of The PepsiBottling Group, Inc. of our reports, with respect to the consolidatedbalance sheets of The Pepsi Bottling Group, Inc. and subsidiaries,as of December 25, 2004, and the related consolidated statementsof operations, cash flows, and changes in shareholders’ equity foreach of the fiscal years in the two-year period ended December 25,2004 and our report on the related financial statement schedule,dated February 25, 2005 included in the annual report on Form 10-K.
New York, New YorkFebruary 23, 2006

81
The Pepsi Bottling Group, Inc.Annual Report 2005
SCHEDULE II – VALUATION AND QUALIFYING ACCOUNTSTHE PEPSI BOTTLING GROUP, INC.
Balance At Charged to Accounts Foreign Balance At Beginning Cost and Written Currency End Of
(in millions) Of Period Expenses Acquisitions Off Translation Period
DescriptionFiscal Year Ended December 31, 2005Allowance for losses on trade accounts receivable $61 $ 3 $– $(12) $(1) $51Fiscal Year Ended December 25, 2004Allowance for losses on trade accounts receivable $72 $ (5) $– $ (7) $1 $61Fiscal Year Ended December 27, 2003Allowance for losses on trade accounts receivable $67 $12 $– $ (8) $1 $72

82
Index to Exhibits The Pepsi Bottling Group, Inc.Annual Report 2005
EXHIBIT
3.1 Articles of Incorporation of The Pepsi Bottling Group, Inc.(“PBG”), which are incorporated herein by reference toExhibit 3.1 to PBG’s Registration Statement on Form S-1(Registration No. 333-70291).
3.2 By-Laws of PBG, which are incorporated herein by referenceto Exhibit 3.2 to PBG’s Registration Statement on Form S-1(Registration No. 333-70291).
3.3 Amendment to Articles of Incorporation of PBG, which isincorporated herein by reference to Exhibit 3.3 to PBG’sRegistration Statement on Form S-1 (Registration No. 333-70291).
3.4 Amendment to Articles of Incorporation of PBG dated as of November 27, 2001, which is incorporated herein by reference to Exhibit 3.4 to PBG’s Annual Report onForm 10-K for the year ended December 29, 2001.
4.1 Form of common stock certificate, which is incorporatedherein by reference to Exhibit 4 to PBG’s RegistrationStatement on Form S-1 (Registration No. 333-70291).
4.2 Indenture dated as of February 8, 1999 among PepsiBottling Holdings, Inc., PepsiCo, Inc., as Guarantor, andThe Chase Manhattan Bank, as trustee, relating to$1,000,000,000 53⁄8% Senior Notes due 2004 and$1,300,000,000 55⁄8% Senior Notes due 2009, which isincorporated herein by reference to Exhibit 10.9 to PBG’sRegistration Statement on Form S-1 (Registration No. 333-70291).
4.3 First Supplemental Indenture dated as of February 8, 1999among Pepsi Bottling Holdings, Inc., Bottling Group, LLC,PepsiCo, Inc. and The Chase Manhattan Bank, as trustee,supplementing the Indenture dated as of February 8, 1999among Pepsi Bottling Holdings, Inc., PepsiCo, Inc. and TheChase Manhattan Bank, as trustee, which is incorporatedherein by reference to Exhibit 10.10 to PBG’s RegistrationStatement on Form S-1 (Registration No. 333-70291).
4.4 Indenture, dated as of March 8, 1999, by and among PBG,as obligor, Bottling Group, LLC, as guarantor, and TheChase Manhattan Bank, as trustee, relating to$1,000,000,000 7% Series B Senior Notes due 2029, whichis incorporated herein by reference to Exhibit 10.14 toPBG’s Registration Statement on Form S-1 (RegistrationNo. 333-70291).
EXHIBIT
4.5 U.S. $500,000,000 5-Year Credit Agreement dated as ofApril 28, 2004 among The Pepsi Bottling Group Inc.,Bottling Group, LLC, JP Morgan Chase Bank as Agent,Banc of America Securities LLC and Citigroup GlobalMarkets Inc., as Joint Lead Arrangers and Book Managersand Bank of America, N.A., Citicorp USA, Inc., CreditSuisse First Boston and Deutsche Bank Securities Inc., as Syndication Agents, which is incorporated herein by reference to Exhibit 4.1 to PBG’s Quarterly Report on Form 10-Q for the quarter ended June 12, 2004.
4.6 Indenture, dated as of November 15, 2002, among BottlingGroup, LLC, PepsiCo, Inc., as Guarantor, and JPMorganChase Bank, as Trustee, relating to $1 Billion 45⁄8% SeniorNotes due November 15, 2012, which is incorporatedherein by reference to Exhibit 4.8 to PBG’s Annual Reporton Form 10-K for the year ended December 28, 2002.
4.7 Registration Rights Agreement, dated as of November 7,2002 relating to the $1 Billion 4 5⁄8% Senior Notes dueNovember 15, 2012, which is incorporated herein by reference to Exhibit 4.9 to PBG’s Annual Report on Form 10-K for the year ended December 28, 2002.
4.8 Indenture, dated as of June 10, 2003 by and betweenBottling Group, LLC, as Obligor, and JPMorgan ChaseBank, as Trustee, relating to $250,000,000 41⁄8% SeniorNotes due June 15, 2015, which is incorporated herein byreference to Exhibit 4.1 to Bottling Group, LLC’s registrationstatement on Form S-4 (Registration No. 333-106285).
4.9 Registration Rights Agreement dated June 10, 2003 by and among Bottling Group, LLC, J.P. Morgan SecuritiesInc., Lehman Brothers Inc., Banc of America Securities LLC,Citigroup Global Markets Inc, Credit Suisse First BostonLLC, Deutsche Bank Securities Inc., Blaylock & Partners,L.P. and Fleet Securities, Inc, relating to $250,000,00041⁄8% Senior Notes due June 15, 2015, which is incorporatedherein by reference to Exhibit 4.3 to Bottling Group, LLC’sregistration statement on Form S-4 (Registration No. 333-106285).
4.10 Indenture, dated as of October 1, 2003, by and betweenBottling Group, LLC, as Obligor, and JPMorgan Chase Bank,as Trustee, which is incorporated herein by reference toExhibit 4.1 to Bottling Group, LLC’s Form 8-K datedOctober 3, 2003.

83
The Pepsi Bottling Group, Inc.Annual Report 2005
EXHIBIT
4.11 Form of Note for the $500,000,000 2.45% Senior Notes due October 16, 2006, which is incorporated herein by reference to Exhibit 4.2 to Bottling Group, LLC’s Form 8-Kdated October 3, 2003.
4.12 Form of Note for the $400,000,000 5.00% Senior Notesdue November 15, 2013, which is incorporated herein byreference to Exhibit 4.1 to Bottling Group, LLC’s Form 8-Kdated November 13, 2003.
10.1 Form of Master Bottling Agreement, which is incorporatedherein by reference to Exhibit 10.1 to PBG’s RegistrationStatement on Form S-1 (Registration No. 333-70291).
10.2 Form of Master Syrup Agreement, which is incorporatedherein by reference to Exhibit 10.2 to PBG’s RegistrationStatement on Form S-1 (Registration No. 333-70291).
10.3 Form of Non-Cola Bottling Agreement, which is incorporatedherein by reference to Exhibit 10.3 to PBG’s RegistrationStatement on Form S-1 (Registration No. 333-70291).
10.4 Form of Separation Agreement, which is incorporatedherein by reference to Exhibit 10.4 to PBG’s RegistrationStatement on Form S-1 (Registration No. 333-70291).
10.5 Form of Shared Services Agreement, which is incorporatedherein by reference to Exhibit 10.5 to PBG’s RegistrationStatement on Form S-1 (Registration No. 333-70291).
10.6 Form of Tax Separation Agreement, which is incorporatedherein by reference to Exhibit 10.6 to PBG’s RegistrationStatement on Form S-1 (Registration No. 333-70291).
10.7 Form of Employee Programs Agreement, which is incorporated herein by reference to Exhibit 10.7 to PBG’sRegistration Statement on Form S-1 (Registration No. 333-70291).
10.8 PBG Executive Income Deferral Plan, which is incorporatedherein by reference to Exhibit 10.8 to PBG’s Annual Reporton Form 10-K for the year ended December 25, 1999.
10.9 PBG 1999 Long-Term Incentive Plan, which is incorporatedherein by reference to Exhibit 10.9 to PBG’s Annual Reporton Form 10-K for the year ended December 25, 1999.
10.10 PBG Directors’ Stock Plan, which is incorporated herein byreference to Exhibit 10.10 to PBG’s Annual Report on Form10-K for the year ended December 25, 1999.
EXHIBIT
10.11 PBG Stock Incentive Plan, which is incorporated herein byreference to Exhibit 10.11 to PBG’s Annual Report onForm 10-K for the year ended December 25, 1999.
10.12 Amended PBG Executive Income Deferral Program, which isincorporated herein by reference to Exhibit 10.12 to PBG’s AnnualReport on Form 10-K for the year ended December 30, 2000.
10.13 PBG Long Term Incentive Plan, which is incorporated hereinby reference to Exhibit 10.13 to PBG’s Annual Report onForm 10-K for the year ended December 30, 2000.
10.14 PBG Directors’ Stock Plan, which is incorporated by refer-ence to Exhibit 10.14 to PBG’s Annual Report on Form 10-Kfor the year ended December 29, 2001.
10.15 Amendment No. 1 to the PBG Directors’ Stock Plan, which is incorporated herein by reference to Exhibit 10 to PBG’sQuarterly Report on Form 10-Q for the quarter endedJune 14, 2003.
10.16 2002 PBG Long-Term Incentive Plan, which is incorporatedby reference to Exhibit 10.15 to PBG’s Annual Report onForm 10-K for the year ended December 28, 2002.
10.17 Form of Mexican Master Bottling Agreement, which isincorporated by reference to Exhibit 10.16 to PBG’s AnnualReport on Form 10-K for the year ended December 28, 2002.
10.18 PBG 2004 Long-Term Incentive Plan which is incorporatedherein by reference to Appendix B to PBG’s ProxyStatement for the 2004 Annual Meeting of Shareholders.
10.19 Form of Employee Restricted Stock Agreement under thePBG 2004 Long-Term Incentive Plan, which is incorporatedherein by reference to Exhibit 10.1 to PBG’s Quarterly Reporton Form 10-Q for the quarter ended September 4, 2004.
10.20 Form of Employee Stock Option Agreement under the PBG2004 Long-Term Incentive Plan, which is incorporated hereinby reference to Exhibit 10.2 to PBG’s Quarterly Report onForm 10-Q for the quarter ended September 4, 2004.
10.21 Form of Non-Employee Director Annual Stock OptionAgreement under the PBG Directors’ Stock Plan which isincorporated herein by reference to Exhibit 10.3 to PBG’sQuarterly Report on Form 10-Q for the quarter endedSeptember 4, 2004.

84
EXHIBIT
10.22 Form of Non-Employee Director Restricted StockAgreement under the PBG Directors’ Stock Plan, which isincorporated herein by reference to Exhibit 10.4 to PBG’sQuarterly Report on Form 10-Q for the quarter endedSeptember 4, 2004.
10.23 PBG Executive Incentive Compensation Plan which isincorporated herein by reference to Exhibit B to PBG’sProxy Statement for the 2000 Annual Meetingof Shareholders.
10.24 Summary of the material terms of the PBG ExecutiveIncentive Compensation Plan, which is incorporated hereinby reference to Exhibit 10.6 to PBG’s Quarterly Report onForm 10-Q for the quarter ended September 4, 2004.
10.25 Description of the compensation paid by PBG to its non-management directors which is incorporated herein by reference to the Directors’ Compensation section in PBG’sProxy Statement for the 2004 Annual Meeting ofShareholders, as updated by the Form 8-K filed onJanuary 31, 2005.
10.26 Form of Director Indemnification, which is incorporatedherein by reference to Exhibit 10.1 to PBG’s QuarterlyReport on Form 10-Q for the quarter ended June 11, 2005.
10.27 PBG 2005 Executive Incentive Compensation Plan which is incorporated herein by reference to Exhibit A to PBG’sProxy Statement for the 2005 Annual Meeting ofShareholders (the “Proxy Statement”).
10.28 PBG 2004 Long-Term Incentive Plan as amended andrestated, effective May 25, 2005, which is incorporatedherein by reference to Exhibit B to the Proxy Statement.
EXHIBIT
10.29 Settlement Agreement between Bottling Group, LLC andPepsiCo, Inc. dated June 28, 2005, which is incorporatedherein by reference to Exhibit 10.4 to PBG’s QuarterlyReport on Form 10-Q for the quarter ended June 11, 2005.
10.30 Form of Employee Restricted Stock Unit Agreement whichis incorporated herein by reference to Exhibit 10.1 to PBG’sQuarterly Report on Form 10-Q for the quarter endedSeptember 3, 2005.
10.31* Amended and Restated PBG Directors’ Stock Plan.
10.32* Form of Non-Employee Director Restricted Stock UnitAgreement under the Amended and Restated PBGDirectors’ Stock Plan.
12* Statement re Computation of Ratios.
21* Subsidiaries of PBG.
23.1* Report and Consent of KPMG LLP.
23.2* Consent of Deloitte & Touche LLP.
24* Copy of Power of Attorney.
31.1* Certification by the Chief Executive Officer pursuant toSection 302 of the Sarbanes-Oxley Act of 2002.
31.2* Certification by the Chief Financial Officer pursuant toSection 302 of the Sarbanes-Oxley Act of 2002.
32.1* Certification by the Chief Executive Officer pursuant toSection 906 of the Sarbanes-Oxley Act of 2002.
32.2* Certification by the Chief Financial Officer pursuant toSection 906 of the Sarbanes-Oxley Act of 2002.
*Exhibit is included in PBG’s Annual Report on Form 10-K filed with the Securities andExchange Commission on February 24, 2006.
Index to Exhibits (continued) The Pepsi Bottling Group, Inc.Annual Report 2005

Bulk delivery:Products are pre-ordered through a sales representative and then distributed to large format outlets by a driver assigned to those accounts.
Channel:Refers to either cold drink or take-home
Cold drink:Cold products sold in retail and food-service accounts, and that carry the highest profit margins
Constant territory:PBG’s fiscal year ends on the last Saturday in December and, as a result, a 53rd weekwas added to the fiscal year 2005. Fiscal2006 has 52 weeks. Constant territory calculations assume a 52-week year and all significant acquisitions made in the prioryear were made at the beginning of that year.These calculations exclude all significantacquisitions made in the current year.
16
Direct store delivery:Distribution system by which products are sold, delivered and merchandised by PBG employees
Energy drinks:Functional drinks containing unique energizing formulations that satisfy the consumer's need for an energy boost
Foodservice accounts:Outlets where consumers buy single-serve soft drinks for immediate consumption, usually to complement an away-from-home meal
Household penetration:The percentage of households in a definedmarket that has purchased a particular branded item
Large format:Accounts that are large chain foodstores,supercenters, mass merchandisers, chain drug stores, club stores and military bases
Modern trade:Refers to the growing international network of new, contemporary-style outlets,including supermarkets, large chain storesand hypermarkets, as opposed to small, independently owned shops
Non-measured channels:Channels for which syndicated sales and share performance data are not readily available
Out of stocks:Products missing or absent anywhere along our supply chain, and ultimately from the store shelf
Take-home:Unchilled products sold for at-home or future consumption
Third-party distributor:A separate company hired to distribute products to selected outlets
Corporate HeadquartersThe Pepsi Bottling Group, Inc.1 Pepsi WaySomers, NY 10589914.767.6000
Transfer AgentFor services regarding your account such as change of address, replacement of lost stock certificates or dividend checks, direct deposit of dividends or change in registered ownership, contact:
The Bank of New YorkShareholder Services DepartmentP.O. Box 11258Church Street StationNew York, NY 10286-1258
Telephone: 800.432.0140E-mail: [email protected]: http://www.stockbny.comOrThe Pepsi Bottling Group, Inc.Shareholder Relations Coordinator1 Pepsi WaySomers, NY 10589Telephone: 914.767.6339
In all correspondence or telephone inquiries, please mentionPBG, your name as printed on your stock certificate, yourSocial Security number, your address and telephone number.
Direct Purchase and Sales PlanThe BuyDIRECT Plan, administered by The Bank of New York, provides existing shareholders and interested first-timeinvestors a direct, convenient and affordable alternative forbuying and selling PBG shares. Contact The Bank of New Yorkfor an enrollment form and brochure that describes the planfully. For BuyDIRECT Plan enrollment and other shareholderinquiries:
The Pepsi Bottling Group, Inc.c/o The Bank of New YorkP.O. Box 11019New York, NY 10286-1019Telephone: 800.432.0140
Stock Exchange ListingCommon shares (symbol: PBG) are traded on the New YorkStock Exchange.
CertificationsThe certifications of our Chief Executive Officer and Chief Financial Officer, as required by section 302 of theSarbanes-Oxley Act, are included as exhibits to PBG’s 2005 Annual Report on Form 10-K filed with the SEC. PBGsubmitted its annual certification regarding corporate governance listing standards to the New York StockExchange after its 2005 Annual Meeting of Shareholders.
Independent Public AccountantsDeloitte & Touche LLPTwo World Financial CenterNew York, NY 10281-1414
Annual MeetingThe annual meeting of shareholders will be held at10:00 a.m., Wednesday, May 24, 2006, at PBG headquartersin Somers, New York.
Investor RelationsPBG’s 2006 quarterly releases are expected to be issuedthe weeks of April 18, July 11 and October 3, 2006, andJanuary 30, 2007.
Earnings and other financial results, corporate news and other company information are available on PBG’s website: http://www.pbg.com
Investors desiring further information about PBG shouldcontact the Investor Relations department at corporateheadquarters at 914.767.6339.
Institutional investors should contact Mary Winn Settino at914.767.7216.
This publication contains many of the valuable trademarksowned and used by PepsiCo. Inc. and its subsidiaries and affiliates in the United States and internationally.

1 Pepsi WaySomers, NY 10589
www.pbg.com