Annual Report 2004 Sculpting Our Future
60
Annual Report 2004 Sculpting Our Future ®
Transcript of Annual Report 2004 Sculpting Our Future

Annual Report 2004
Sculpting Our Future
®

SCU
LPT
ING
OU
R FU
TU
RE
Financial Highlights 1
FTI at a Glance 2
Shareholder Letter 4
Review of Operations 9
Financial Section 17
Table of Contents

Year ended December 31, 2002 2003 2004
Revenues $ 224,113 $ 375,695 $ 427,005
Total costs and expenses 160,784 261,870 348,536
Operating income of continuing operations 63,329 113,825 78,469
Income from continuing operations 34,908 64,791 42,878
Income from continuing operations per diluted common share $ 1.02 $ 1.54 $ 1.01
Adjusted EBITDA $ 68,662 $ 123,537 $ 100,760
For the years ended December 31, 2002 through 2004 (in thousands, except per share data)
Financial Highlights
0
90
180
360
270
450
0
20
40
80
100
120
60
0
25
50
100
125
75
Revenues (millions)
2002 2003 20040
90
180
360
270
450
0
20
40
80
100
120
60
0
25
50
100
125
75
Adjusted EBITDA before one-time charges (millions)
2002 2003 2004

A T A G L A N C E
FTI is the premier provider of corporate finance/restructuring, forensic and litigation consulting and technology, and economic consulting. Strategically located in 24 of the major U.S. cities, London and Melbourne, FTI’s total workforce of approximately 1,000 employees includes numerous PhDs, MBAs, CPAs, CIRAs, CFEs, and technologists who are committed to delivering the highest level of service to clients. These clients include the world’s largest corporations, financial institutions and law firms in matters involving financial and operational improvement and major litigation.
Clear vision To be the world’s leading firm that organizations
rely on when confronting critical issues that shape
their future
Industry-leading business segments
2
Corporate Finance/Restructuring The nation’s market-leading restructuring practice, providing performance improvement, turnaround, capital solutions, interim management, creditor advisory and transaction advisory services to organizations facing critical strategic, operational and financial challenges.
Forensic and Litigation Consulting The nation’s only forensic and litigation practice providing law firms and corporations confronted with complex financial challenges with end-to-end capabilities—from dispute advisory and forensic accounting, expert testimony and trial services to a host of litigation technology solutions.
Economic Consulting One of the world’s thought leaders in economic consulting, providing law firms, corporations and government clients with clear analysis of complex economic issues for use in legal and regulatory proceedings, strategic decisions and public policy debates.
Industry accolades
Ranked among the top 20 on Fortune magazine’s “100 Fastest-Growing Companies” in 2003 and 2004
Topped The Deal’s bankruptcy league tables for five straight quarters
World-class clients
In 2004 FTI served on approximately 3,200 matters for 1,300 clients, including: •91 of the top 100 law firms 1 •181 of the Fortune 500 corporations •21 of the 25 largest U.S. banks 2
1Source: The American Lawyer magazine’s Am Law 100 2Source: American Banker magazine
30
60
90
120
150
10/31/03 1/31/04 3/31/04 6/30/04 9/30/04
FTI Consulting Competitor #1
Competitor #3Competitor #2
30
60
90
120
150
Top Non-Investment Banks – Number of Bankruptcy Cases
Source: The Deal

• More than 1,000 professionals in 24 offices across the United States and in London, England, and Melbourne, Australia
• An unparalleled treasury of intellectual capital: 37 PhDs, 117 MBAs, 144 CPAs, 13 JDs, 17 CIRAs (Certified Insolvency and Restructuring Advisors), 28 CFEs (Certified Fraud Examiners), 8 CFAs (Chartered Financial Analysts) and a certified anti-money laundering specialist
• Thought leaders and highly sought-after professionals across a wide variety of industries and disciplines
• Additions in 2004 included 15 senior managing directors with top quality experience in many fields, including interim management services, creditor rights, transaction advisory services, homeland security and investment banking
•2004 leadership developments:
■ Dennis Shaughnessy named chairman of the board after board approved separation of the offices of chairman of the board and chief executive officer
■ Jack Dunn elected president in addition to his role as chief executive officer
■ Dominic DiNapoli named executive vice president and chief operating officer
■ Barry Kaufman named executive vice president and chief risk management officer
■ Business segment leaders named: Roger Carlile (Forensic and Litigation Consulting), DeLain Gray (Corporate Finance/Restructuring) and John Klick (Economic Consulting)
■ Two independent directors appointed to board, filling all vacancies and bringing total number of directors to eight: Mark H. Berey and Gerard E. Holthaus
San FranciscoSan Jose
Los Angeles
Phoenix
Salt Lake City
Tucson
Denver
Dallas
Houston
Atlanta
Pittsburgh
Chicago
Charlotte
London
New YorkSaddle Brook
Cleveland
Washington, DCAnnapolis
Boston
PhiladelphiaIndianapolis
Seattle
Nashville
Melbourne
AustraliaKing of Prussia
FTI International Footprint – 24 U.S. Cities, London and Melbourne
Financial Overview: Revenues and EBITDA
0
90
180
360
450
270
Revenues EBITDA (in millions)
2002
68.7
224.1
2001
33.4
122.3
2000
24.9
95.5
1999
8.648.9
2003
123.5
375.7
2004
100.8
427.0
The best people
Revenues $427 million $100.8 million
Earnings per share (before one-time charges) $1.10 Year-end cash and cash equivalents $25.7 million Cash flow from operations $58.4 million Long-term debt retired $20 million Long-term debt $105 million Stock repurchased 657,300 shares ($10.8 million) Utilization of billable personnel 77 percent Average bill rate per hour $354
Financial strength
3
Adjusted EBITDA

Dear Shareholder:
Six years ago we embarked on a strategy to become a world-
class financial consulting organization. As we enter 2005, we
believe it is a good time to pause and reflect on how far we
have come and, more importantly, to appreciate just how
far we can go.
From a company of 196 employees in 1999, we now have more
than 1,000 employees in 24 locations around the United States
and in the U.K. and Australia. From revenues of $49 million
in 1999, we achieved record revenues in 2004 of $427 million.
From a company known primarily for applied sciences and
expert financial and litigation services, we now advise the
world’s leading organizations on a wide variety of issues that
are critical to their future viability.
The rapid pace of change has brought great rewards. It has
also brought its share of challenges. Nevertheless, we ended
the year a longtime strong financial performer and a leader
in all three areas we serve.
4
Left to right: Dominic DiNapoli, Executive Vice President and Chief Operating Officer
Dennis J. Shaughnessy, Chairman of the Board
Jack B. Dunn, IV, President and Chief Executive Officer

Performance through diversification
Our record revenues in 2004 resulted in part from our
aggressive efforts to diversify the business through acquisitions
and new hires. Fifteen months ago, more than 70 percent of
our revenues came from the restructuring practice. Today,
we have a healthy mix, with approximately 38 percent of
revenues from Corporate Finance/Restructuring, 42 percent
from Forensic and Litigation Consulting and 20 percent from
Economic Consulting, based on 2004 results. Within the
segments we have diversified even further, supplementing our
existing areas of expertise with additional practice groups.
Our 2003 acquisitions accounted for approximately 35 percent
of 2004 revenues. As these diverse and complementary
acquisitions become further integrated and strengthened
within the company, we expect their profitability and
predictability to improve and fully meet our expectations.
Cash flow was excellent in 2004 because of our strong
revenues. During the year we retired $38 million of debt
from a high of $143 million, and we ended the year with
more than $25 million in cash, for a net debt of $80 million.
In addition, we repurchased over $14 million of our stock over
the past five quarters.
We also adopted measures in 2004 to increase the transparency
of our results. We now break down results by business segment,
providing a clearer picture of the company’s performance.
Strength through segment growth
On a segment basis, our $160 million practice in Corporate
Finance/Restructuring is the number one practice in the United
States by size, reputation, league tables and almost any other
measure. It has diversified nicely from primarily a bank, shared
national credit practice to a healthy combination of bank and
debtor work, participating in both large- and middle-market
cases. Traditional restructuring work has been augmented with
complementary practices in interim and crisis management,
investment banking, transaction support and tax consulting.
Our $180 million Forensic and Litigation Consulting practice
is also a national leader by size and its unique, integrated,
go-to-market strategy. By reputation, recognition and client
penetration, it still has plenty of room to grow. About $20
million of this segment is our legacy trial support, which is well
recognized as a provider of choice for courtroom support,
theme development, graphics and jury analysis. Embedded
technology and related services, including electronic evidence
consulting and document and information management, comprise
$46 million, or more than 10 percent, of the firm’s business.
5
Forensic and Litigation Consulting and Economic Consulting
Corporate Finance/Restructuring Forensic Accounting
Economic Consulting
Corporate Finance/Restructuring
0
100
200
300
400
500
0
100
200
300
400
500
95.5122.3
224.1
375.7
427.0
2000 2001 2002 2003 2004
Record Revenues (in millions)
Forensic and Litigation Consulting and Economic Consulting
Corporate Finance/Restructuring Forensic Accounting
Economic Consulting
Corporate Finance/Restructuring
0
100
200
300
400
500
0
100
200
300
400
500
95.5122.3
224.1
375.7
427.0
2000 2001 2002 2003 2004
Evolving Business Mix 2003 2004
70%
30%
42% 38%
20%
5

While traditional courtroom support is a mature industry and
we enjoy a terrific franchise, technology is revolutionizing the
practice and we have invested significantly in this area. Our
acquisition in late Feburary 2005 of Ringtail Solutions Group,
a leading global developer of litigation support and knowledge
management technologies, is a major step in expanding our
presence in the growing litigation software solutions market.
We expect our technology and related service offerings to
generate revenues of approximately $100 million within two
to three years.
With the proliferation of securities and Sarbanes-Oxley issues,
our 2003 acquisition of Ten Eyck Associates, which specializes
in SEC accounting and enforcement matters, has also been a
bright spot. This year's initiatives include homeland security-
related services and offerings designed specifically for the
general counsel.
Our third segment is our $90 million Economic Consulting
business. The Lexecon brand is a market leader and our
Network Industries Strategies practice should be a beneficiary
of what many are predicting to be a major resurgence in
telecommunications activity this year.
Stability through committed leadership
Our new management structure, which was implemented
in 2004, put three new segment leaders into place to
reinforce accountability and to facilitate the integration
and consolidation of our fast-growing practices. New
hiring, including 15 senior managing directors, and the
implementation of new policies have reinvigorated our
company leadership.
We now have a strong and committed senior team of
professionals on board. They have demonstrated their loyalty
to us by signing employment contracts based on multiple years
of commitment and a substantial penalty for early termination.
We have demonstrated our commitment to them through
equity offerings and incentive compensation.
Excellence through diverse and exceptional talent
These dedicated senior executives form the core of our growing
treasury of intellectual capital, which has never been richer.
We are now more than 1,000 strong. In addition to people
joining us through acquisitions during the last 12 months, more
than 290 people joined us through the hiring process. Our
roster includes some of the most well-recognized and talented
individuals in the business, with educational and professional
experience across a wide range of areas. Their expertise
ranges from organizational theory and behavioral science to
economics and accounting. This diverse and deep talent pool,
including those with doctoral, law and business degrees as well
as certified public accountants, fraud examiners and more,
allow us to readily meet the demands of any client situation.
Average billing rates of more than $350 per hour and utilization
rates of more than 75 percent are testimony to the value-added
concept we bring to bear on behalf of our clients.
Success through integration
Delivering on this value-added concept relies on the successful
integration of our practices into a mature and cohesive culture.
Our rapid growth through acquisition and hiring has made
this one of our highest priorities. A mature, cohesive culture is
6
“ New hiring, including 15 senior
managing directors, and the
implementation of new policies
have reinvigorated our
company leadership.”

7
critical to operating efficiently and facilitating the creation of
multidisciplinary teams to better serve clients and increase our
service opportunities.
We have already made great strides on that front. In 2004
we convened a high-level, cross-functional team to develop
a clear vision statement and mission for the company that
communicates our shared purpose and focuses the energies
of our people on common goals. Strong relationships across
the company are developing as our practices consolidate
and mature under new leadership. During 2004 more than 20
engagements included professionals from multiple practices.
We expect this number to continue growing in the coming
year. Integration is also being fueled by the implementation of
information technologies that improve communication and
workflow across the company.
Recognition through strong client relationships
We are privileged to serve the country’s largest corporations,
financial institutions, insurance companies and public entities,
who repeatedly call upon us to work on their most critical
business, social and government matters. These include
issues of health, politics, securities, antitrust, Sarbanes-Oxley,
corporate governance, worldwide bankruptcy, homeland
security and many others. This past year our 1,300 clients
included 91 of the top 100 law firms; 21 of the 25 largest banks
in the United States; and 181 corporations in the 2004 Fortune
500. Thanks to them and their continued support, we were
recently included in Fortune magazine’s list of fastest growing
companies for 2004 at number 18.
Sculpting our future
Our company has come a long way. While we have
encountered some bumps in the road, we face the future
with tremendous advantages. We have an increasingly
diversified and flexible business that allows us to respond to
changing economic and business conditions as well as client
demands. We are committed to investing in organic growth
opportunities. We have a capital structure that provides
capacity for growth through acquisition and geographic
expansion. We employ outstanding leaders and are amassing
broad and deep layers of talent. We are pursuing an integrated,
multidisciplinary business model designed to take full
advantage of opportunities for expanded client service.
These are the foundations on which we build our future as we
endeavor to make the whole of FTI greater than the sum of its
parts. We know that success requires the following:
Steadfastness to our vision:
To be the world’s leading firm that organizations rely on when
confronting critical issues that shape their future.
Execution of our mission:
FTI will be known worldwide for the best people, services and
financial performance by
— Attracting, retaining and investing in high performance
people,
— Collaborating to bring successful resolution to the most
complex and critical client issues,
— Strategically enhancing our global ability to service clients,
—Delivering results that earn the loyalty of our clients,
— Providing superior financial rewards that benefit our
employees and shareholders.
Adherence to our values:
Integrity,
Quality,
Tenacity,
Relationships.
“ We are pursuing an integrated,
multidisciplinary business model
designed to take full advantage
of opportunities for expanded
client service.”

8
As we look ahead, we will continue the work of integrating
our business and our culture, augmenting our existing service
offerings, exploiting our brand and exploring opportunities to
expand geographically as well as through strategic acquisitions.
Above all, we will distinguish our company from the
competition by continuing to assemble the industry’s most
valuable base of intellectual capital. We will continue to build
an infrastructure and compensation system that attracts,
retains and rewards the most highly skilled and sought-after
people in the industry. We will continue to demonstrate to
them our ability to provide an exceptional career path. We
will continue to create an atmosphere that promotes open
and honest dialogue, such as our commitment to Sarbanes-
Oxley, our employee hotline and our website that encourages
a 360-degree concern for our company. In everything we do,
we will endeavor to endow the FTI name with a reputation
that provides entrée to and recognition in any boardroom,
executive committee or business school campus in the
United States and beyond.
Achieving these goals will, in turn, help us establish a pattern
for steady, predictable results in revenues, earnings and
especially cash flow. We are still young in our evolution as a
public company, and we see a bright future ahead. We have
the raw materials, the vision and the expert craftsmen to
continue sculpting a world-class organization. We are grateful
for the support we’ve received from our people, our clients and
our shareholders. We believe our potential as a company is as
great as the effort we make to fulfill it. We hope you will join
us in making that effort a successful one.
Yours truly,
Jack B. Dunn, IV President and Chief Executive Officer
Dennis J. Shaughnessy Chairman of the Board
Dominic DiNapoli Executive Vice President and Chief Operating Officer
March 18, 2005

Shaping our business through diversification and growth
Distinguishing our work through integration and client relationships
Achieving with our people through committed leadership and exceptional talent
139

10
FTI is building unprecedented strength in the financial
consulting marketplace. Acquisitions over the past several
years are transforming the company from a boutique firm into
a consulting powerhouse. The year 2004 was marked by rapid
consolidation of previous acquisitions as well as the continued
strengthening of specialized areas to create a comprehensive
range of service offerings that is unparalleled in the industry.
FTI’s business, which is built on the three pillars of Corporate
Finance/Restructuring, Forensic and Litigation Consulting, and
Economic Consulting, is poised for tremendous growth in the
years ahead as the combined force of its capabilities is brought
to bear in the marketplace. Following are a few examples of
changes in 2004 that are strengthening the business.
Corporate Finance/Restructuring
The Corporate Finance/
Restructuring practice has
undergone dramatic changes
in the past 18 months. Its
traditional focus on the
restructuring business has
been substantially widened
to include the full array of
corporate financial services
that the market is demanding,
including transaction
advisory services, interim
management, investment
banking and creditors rights.
With specializations that
include strategy, operations,
valuation and tax as well as
the fields of energy, health
care and telecommunications,
the practice is positioned as
the market leader and expects
strong future growth.
Forensic and Litigation Consulting
The Forensic and Litigation
Consulting practice has built
the industry’s best and most
complete range of services for
assisting clients with complex
financial matters throughout
the dispute, investigation and
litigation lifecyles. The practice
is an innovator in the use of
technology-enabled solutions,
including electronic discovery.
The strengthening of its
national footprint, with offices
covering all major U.S. markets,
is fueling the growth of the
practice as it provides greater
capabilities to more clients in
more places.
The practice continues to
benefit from Sarbanes-Oxley
as the need for independent
sources of forensic and
accounting expertise grows.
Economic Consulting
FTI’s Economic Consulting
practice, created in large part
from the acquisition of Lexecon
in 2003, is providing the high-
level economic expertise that
the market demands in matters
such as antitrust, mergers
and acquisitions, litigation
and damages analysis. Staffed
with some of the world’s most
renowned economists and
thought leaders, the practice
adds incomparable analytic
depth to FTI’s business mix.
Growth in this practice is
being fueled by major
structural changes in the
marketplace as well as
the development of new
capabilities in nonlitigation-
related management
consulting, including market
research, transfer pricing
and asset optimization.
Shaping our business through diversification and growth
SCU
LPT
ING
OU
R FU
TU
RE

Clients
Law firms
Banks
Creditors
Debtors
State governments
Bankrupt enterprises
Media conglomerates
Insurance companies
Telecommunications providers
Health care organizations
Municipalities
Internet companies
Energy companies
Manufacturers
Retailers
Aerospace companies
Cruise lines
Automobile manufacturers
Federal government entities
services companies
High tech companies
Sports franchises
2004 Headlines
Investment banking subsidiary now operating as FTI Capital Advisors, LLC
FTI Merger & Acquisition Advisors, LLC, changed its name to FTI Capital Advisors, LLC,
in July 2004 to reflect its broadened and growing capabilities. Strengthened in 2004
through the addition of top industry talent, the group advises on debt and equity private
placements, provides sell-side and buy-side acquisition advisory services and delivers
fairness opinions and valuation services to clients around the globe.
Interim management group strengthened and operating as FTI Palladium Partners
While many interim management firms shift focus away from their core business, FTI united
market-leading talent in a single, dedicated interim management practice under the name
FTI Palladium Partners in November 2004. Palladium, a precious element used as a catalyst,
represents preservation, integrity and protection. These are the principles behind the group’s
work to successfully sustain, safeguard and energize companies.
Forensic and Litigation Consulting practice implements new go-to-market strategy
An integration/strategy advisory team was convened in 2004 to harness the collective power of
the Forensic and Litigation Consulting practice and position it at the top of its market space.
The resulting go-to-market strategy unveiled in late 2004 creates market-focused teams in
three specific areas: geographic markets, national products, and key accounts.
Electronic Evidence group enhances discovery and review capabilities with cutting-edge software
FTI’s Electronic Evidence Consulting group bolstered its market-leading position in 2004
through an agreement with Attenex Corporation to provide services using its cutting-edge
software, Attenex® Patterns®, for managing electronic evidence on a single, streamlined
platform.
FTI announces new company-wide vision and mission
To continue building unity and cohesion among its nationwide and international cadre of
professionals, FTI announced its new vision statement in September 2004: To be the world’s
leading firm that organizations rely on when confronting critical issues that shape their
future. A five-pronged mission was also unveiled (see page 7), energizing all areas of the
business around common goals.
Economic Consulting practice expands its service offering
Economic Consulting practice added a Corporate Economic Consulting arm to assist its
corporate clients on making internal business decisions. This practice will focus in areas
such as new product market entry strategies, pricing of new product offerings, asset
and product portfolio optimization, benchmarking, transfer pricing, and the development
of decision-making models.
11
Corporate Finance/Restructuring
Turnaround and restructuring
Interim management
Creditor advisory
Transaction advisory services
Investment banking
Forensic and Litigation Consulting
Financial investigations and forensic accounting
Dispute consulting
Trustee services/Business monitoring
Electronic evidence consulting
Expert Testimony
Technology solutions
Trial communications and graphics/Trial technology/Jury consulting
Economic Consulting
Litigation and damages analysis
Antitrust
Bank support
Board advisory
Public policy
Regulated industries
Securities
Valuation

12
FTI’s diverse array of world-class services offered in locations
throughout the United States and beyond has quickly become
an important competitive advantage. Yet what makes FTI
truly unique is our ability to pool talent across disciplines and
geographies to meet the demands of any client situation.
As the complexity of financial challenges in the marketplace
grows, FTI can draw upon the expertise of hundreds of
professionals with backgrounds and experiences in order to
form powerful problem-solving teams. This integrated,
multidisciplinary approach is based on our firm belief that the
right combination of people and experience can guide clients
through their most difficult issues. By delivering the right
talent at the right time, FTI is earning the trust of its clients
and building the reputation and relationships that will fuel
our growth and success in the future. Following are just a few
examples of FTI successes in 2004.
9/11 World Trade Center insurance coverage trial
FTI worked with the law firm Simpson Thacher & Bartlett on behalf of Swiss Re, which
provided approximately one quarter of the $3.55 billion property insurance program for
the World Trade Center on 9/11--by far the largest share among the 24 World Trade Center
insurers. The client had to convince a Manhattan jury that Swiss Re agreed to a policy form
prior to 9/11 that defined “occurrence” in such a way that Swiss Re’s liability was capped
at a single policy limit, and not the double recovery World Trade Center leaseholder, Larry
Silverstein, sought based on his two occurrence argument. A powerful, cross-functional
team of 16 FTI professionals provided graphics, communication consulting and trial
technology services for this high-stakes trial. On May 3, 2004, a unanimous jury found
for Swiss Re, limiting its liability to a single policy limit.
Distinguishing our work through integration and client relationships
SCU
LPT
ING
OU
R FU
TU
RE

Clients
Law firms
Banks
Creditors
Debtors
State governments
Bankrupt enterprises
Media conglomerates
Insurance companies
Telecommunications providers
Health care organizations
Municipalities
Internet companies
Energy companies
Manufacturers
Retailers
Aerospace companies
Cruise lines
Automobile manufacturers
Federal government entities
services companies
High tech companies
Sports franchises
Interstate Bakeries bankruptcy
The Creditor Rights group of FTI’s Corporate Finance/Restructuring practice was retained
by Interstate Bakeries' official creditors committee. Interstate Bakeries, the largest U.S.
wholesale baker and distributor of fresh baked bread and sweet goods, including Wonder
Bread and Twinkies, filed for bankruptcy in September 2004.
Global Crossing accounting questions
Global Crossing, a high-speed communications provider that filed for bankruptcy in 2002,
engaged FTI to provide independent advice on complex accounting matters as it took
steps to regain compliance with SEC reporting and NASDAQ listing requirements in the
fall of 2004. FTI's NASDAQ expertise and accounting experts in the Forensic and Litigation
Consulting practice assisted the company in their compliance and SEC filing requirements.
TTX Company: The reauthorization of a rail car provider
Lexecon economists were retained by the law firm Covington & Burling to assist TTX
Company, provider and manager of rail cars to the North American rail industry with their
application for reauthorization before the Surface Transportation Board (STB). Through
its economic analysis, Lexecon proved that TTX was not anticompetitive, and the STB
reauthorized the company for 10 years, representing an important industry decision.
BridgeCom/Broadview merger – excellence in telecom investment banking
On January 14, 2005, Broadview Networks Holdings, Inc. and BridgeCom Holdings, Inc.
signed a definitive agreement for a merger. FTI Capital Advisors, LLC, served as financial
advisor to Broadview, assisted by the Telecom group of FTI Consulting. The combined
entity, which will operate under the Broadview name, serves tens of thousands of small
and medium-sized businesses across a footprint of seven northeastern states.
FTI assists a premier investment bank with due diligence services
Our Transaction Advisory Services group was engaged by a premier Wall Street
investment bank to perform financial, accounting and valuation due diligence services
related to the investment bank’s successful acquisition of the equity interests in twelve
power plants and a natural gas pipeline from National Energy & Gas Transmission, Inc.
for approximately $650 million.
13
Clients
Law firms
Banks
Creditors
Debtors
State governments
Bankrupt enterprises
Media conglomerates
Insurance companies
Telecommunications providers
Health care organizations
Municipalities
Internet companies
Energy companies
Transportation companies
Manufacturers
Retailers
Aerospace companies
Cruise lines
Automobile manufacturers
Federal government entities
Food services companies
High-tech companies
Sports franchises

14
At FTI our business is our people. We are committed to
attracting the best talent, investing in their development and
providing a supportive, open and rewarding environment that
breeds teamwork, communication and loyalty. Our model is
already working. In addition to the outstanding people who
have been part of our organization for years and who have
joined through our many recent acquisitions, individuals at the
forefront of their professions are choosing to join the FTI team
and build an exciting future with us. Highlighted below are just
a few of the high-caliber professionals who came on board in
2004 as well as a couple of notable achievements by others.
President Bush appoints Lexecon economist to antitrust commission
Dennis Carlton of FTI’s Economic Consulting practice was named by President George W. Bush
to serve on the Antitrust Modernization Commission. The 12-member bipartisan commission was
created by Congress to evaluate the current operation of the nation’s antitrust laws and enforcement
and determine whether there is a need to modernize them. This is the first antitrust commission
established by Congress since 1938.
Lexecon economist trains staff of new Indonesian competition authority
Colleen Loughlin of FTI’s Economic Consulting practice traveled to Jakarta, Indonesia, to assist in
training the staff of Indonesia’s new competition authority, the KPPU. Loughlin led workshops to
instruct the commission staff on incorporating analytical methods into their analysis in enforcing
Indonesia’s competition law. The workshops were conducted along with present and former
members of the staff of the U.S. Federal Trade Commission.
Former CEO joins FTI’s Forensic and Litigation Consulting practice
Mark R. Kindy, formerly chief executive officer of LexisNexis Applied Discovery, a leading provider
of electronic discovery services to the legal industry, joined the New York office of FTI’s Forensic
and Litigation Consulting practice. He has more than 20 years of strategy, operations, financial and
consulting experience and proven mastery of important technology consulting issues.
Senior officials from the Homeland Security Department join FTI
Two former top officials from the U.S. Department of Homeland Security (DHS) joined the Forensic and
Litigation Consulting practice in Washington, D.C., to leverage FTI’s capabilities in forensic accounting,
fraud, money laundering investigations and electronic discovery in the fight against terrorism.
Michael T. Dougherty served in the number two post at DHS as director of operations for
Immigration and Customs Enforcement (ICE), managing traditional law enforcement missions and
counterterrorism programs.
Lucy Clark served as the general counsel for DHS with responsibility for establishing and supervising the
agency’s legal and regulatory framework and integrating the department’s 22 component agencies.
Achieving with our people through committed leadership and exceptional talent
SCU
LPT
ING
OU
R FU
TU
RE

Clients
Law firms
Banks
Creditors
Debtors
State governments
Bankrupt enterprises
Media conglomerates
Insurance companies
Telecommunications providers
Health care organizations
Municipalities
Internet companies
Energy companies
Manufacturers
Retailers
Aerospace companies
Cruise lines
Automobile manufacturers
Federal government entities
services companies
High tech companies
Sports franchises
Transaction Advisory Services group launched with the addition of two industry-leading professionals
Two of the industry’s most experienced professionals joined the New York office of FTI’s Corporate
Finance/Restructuring practice, launching its national Transaction Advisory Services group.
Patrick J. Donoghue has advised multinational corporations, private equity investors and financial
institutions on mergers and acquisitions, leveraged buyouts and various securities offerings. Formerly
of Standard & Poor’s, he has led transaction services for some of the industry’s highest profile deals.
Anuj Bahal has significant advisory experience in mergers and acquisitions, financial opinions and
all aspects of financial and operating transaction due diligence. Also formerly of Standard & Poor’s,
he has led or co-led transaction advisory services on more than 50 transactions with an aggregate
value in excess of $45 billion.
Creditor Rights group becomes leader with addition of top-notch industry talent
Three national leaders in creditor rights joined FTI’s Corporate Finance/Restructuring practice as part
of its Creditor Rights team in New York. All three joined FTI from the Creditor Rights practice of Ernst &
Young Corporate Finance LLC.
Michael Eisenband, who leads the group, is renowned nationally as an industry leader in providing
restructuring services to creditor committees.
Steven D. Simms has advised creditor groups, companies and lenders on all aspects of
corporate restructurings, mergers, acquisitions, valuation, strategic business planning and
debt and equity financings.
Samuel E. Star specializes in services to creditors in Chapter 11 and out-of-court workout situations.
He is a leader in advising all types of creditor constituencies in both large and small cases.
FTI Capital Advisors, LLC, assembles high-caliber investment banking team
Jeffrey Manning, based in Washington, D.C., has more than 20 years of transaction-related experience,
including investment banking, loan workout, operating restructuring, value investing, bankruptcy
advising and loan trading. He has worked extensively on distressed investment and private placement
opportunities in the United States, Mexico, Canada, the United Kingdom and mainland Europe.
Howard Loewenberg, based in Washington, D.C., has more than 15 years of investment
banking experience, spent almost entirely with Alex. Brown & Sons and its successors, Bankers Trust
Corporation and Deutsche Bank Securities.
Robert M. Werle, based in Los Angeles, has nearly 20 years of investment banking experience,
providing advisory and capital raising services to middle-market and large corporate clients.
Joseph C. Sherwood, based in Los Angeles, has more than 20 years of investment
banking experience, providing advisory and capital raising services to middle-market clients
in southern California.
Raymond J. Zale, based in Dallas, has nearly 20 years of investment banking experience in the
restaurant, food manufacturing, food distribution and consumer food products industry segments.
FTI names Cooper to build Corporate Economic Consulting practice
Dr. Richard V. L Cooper, based in Chicago, is one the world’s top transfer pricing specialists.
Dr. Cooper joins FTI from Ernst & Young, where he built an economic advisory practice focusing on
the retail and consumer products, telecommunications, utilities and pharmaceutical industries.
15
Expertise
Health care
Securities
Antitrust
Sarbanes-Oxley
Corporate governance
Worldwide bankruptcy
Homeland security
Intellectual property
SEC investigations
Telecommunications
Oil and gas
Transportation
Commercial services
Banking
Econometrics
Venture capital
Manufacturing
Technology
Hotel/entertainment
Organizational theory
Behavioral science
Media
Public utilities

16
Our Leaders At the helm of FTI are the management team and board of directors. These distinguished leaders bring FTI and its shareholders unquestioned integrity, a wealth of experience and a tremendous amount of energy and enthusiasm.
FTI Management Team:
From left to right: Dom DiNapoli, Executive Vice President
and Chief Operating Officer; John Klick, Economic Consulting segment leader;
Barry Kaufman, Executive Vice President and Chief Risk Management Officer;
Roger Carlile, Forensic and Litigation Consulting segment leader;
Ted Pincus, Executive Vice President, Chief Financial Officer and Treasurer; and
DeLain Gray, Corporate Finance/ Restructuring segment leader
FTI Board of Directors:
From left to right: Peter O’Malley, Denis Callaghan, Jim Flick, Jack Dunn, Dennis Shaughnessy, Gerry Holthaus, Mark Berey, George Stamas

Selected Financial Data 18
Management’s Discussion and Analysis of Financial Condition and Results of Operations 20
Consolidated Balance Sheets 33
Consolidated Statements of Income 34
Consolidated Statements of Stockholders’ Equity 35
Consolidated Statements of Cash Flows 36
Notes to Consolidated Financial Statements 37
Reports of Independent Registered Public Accounting Firm 52
Management’s Report on Internal Control over Financial Reporting 54
Stock Information 54
Officers and Directors 56
Corporate Data 57
Financial Table of Contents

18
• FTI Consulting, Inc. • Annual Report 2004
The selected financial data presented below for the periods or dates
indicated are derived from our consolidated financial statements.
The consolidated financial statements for the years ended December
31, 2004, 2003, 2002, 2001 and 2000 were audited by Ernst & Young
LLP. You should read the data below in conjunction with our
consolidated financial statements, related notes and other financial
information appearing in “Management’s Discussion and Analysis of
Financial Condition and Results of Operations” and elsewhere in this
report.
AcquisitionsOur results of operations and financial position were impacted by
our acquisition activities. We acquired the following businesses in
transactions accounted for as purchase business combinations.
• As of November 28, 2003, we acquired Lexecon, Inc.
• As of October 31, 2003, we acquired the dispute advisory services
business of KPMG LLP.
• As of October 15, 2003, we acquired Ten Eyck Associates.
• As of January 2, 2002, we acquired Technology & Financial
Consulting, Inc.
• As of August 30, 2002, we acquired the U.S. Business Recovery
Services division of PricewaterhouseCoopers, LLP.
AmortizationEffective January 1, 2002, we adopted Statement of Financial
Accounting Standards No. 142, “Goodwill and Other Intangible
Assets.” Under Statement No. 142, we no longer amortize goodwill
and intangible assets with indefinite useful lives, but we are required
to test these assets for impairment at least annually.
Interest Expense, NetFor the year ended December 31, 2004, interest expense, net
includes a $475,000 discount on a note receivable due from the
owners of one of our former subsidiaries. We discounted this note
by $475,000 in exchange for payment of the note ahead of its
maturity in 2010. We received this prepayment in January 2005.
On January 1, 2003, we adopted Statement of Financial Accounting
Standards No. 145, “Rescission of FASB Statements No. 4, 44 and 64,
Amendment of FASB Statement No. 13, and Technical Corrections.”
Among other changes, Statement No. 145 rescinds Statement No. 4,
which required all gains and losses from extinguishments of debt to
be aggregated and classified as an extraordinary item, net of the
related tax effect. Statement No. 145 provides that gains and losses
from extinguishments of debt should be classified as extraordinary
items only if they are unusual or infrequent or they otherwise meet
the criteria for classification as an extraordinary item, and observes
that debt extinguishment transactions would seldom, if ever, result
in extraordinary item classification of the resulting gains and losses.
Accordingly, our losses on retirement of debt are included in interest
expense for the years ended December 31, 2003 and 2000.
Discontinued OperationsIn 2002, we committed to a plan to sell our applied sciences practice
which we sold in 2003. Because we eliminated the operations and
cash flows of the business components comprising the applied
sciences practice from our ongoing operations as a result of the
disposal transactions, and because we do not have any significant
continuing involvement in the operations after the disposal
transactions, we have presented the results of the applied sciences
practice’s operations as a discontinued operation for all periods.
Selected Financial Data

Revenues(millions)
02000
220
330
110
440
2001 2002 2003 2004
Operating Income(millions)
02000
50
75
25
100
2001 2002 2003 2004
Adjusted EBITDA(millions)
02000
80
120
40
160
2001 2002 2003 2004
Diluted Income Per Share fromContinuing Operations (dollars)
0.02000
0.8
1.2
0.4
1.6
2001 2002 2003 2004
Market Capitalization(millions)
02000
500
750
250
1,000
2001 2002 2003 2004
Net Income(millions)
02000
30
45
15
60
2001 2002 2003 2004
Year Ended December 31,
(in thousands, except per share data) 2004 2003 2002 2001 2000
Income Statement DataRevenues $427,005 $375,695 $224,113 $122,317 $ 95,532Direct cost of revenues 234,970 176,429 108,104 59,074 48,979Selling, general and administrative expenses 102,060 78,701 51,647 33,085 23,920Loss on abandoned facilities 4,670 — — — —Special termination charges — 3,060 — — —Amortization of other intangible assets 6,836 3,680 1,033 4,235 3,942
Operating income 78,469 113,825 63,329 25,923 18,691Interest expense, net (6,086) (4,196) (4,717) (4,356) (19,242)Litigation settlement gains (losses), net 1,672 — — — —
Income (loss) from continuing operations, before income tax provision 74,055 109,629 58,612 21,567 (551)
Income tax provision 31,177 44,838 23,704 8,621 184
Income (loss) from continuing operations 42,878 64,791 34,908 12,946 (735)
Income from operations of discontinued operations, net of income tax provision (benefit) — 1,649 3,145 3,523 3,296
Loss from sale of discontinued operations, net of income tax provision (benefit) — (6,971) (891) — —
(Loss) income from discontinued operations — (5,322) 2,254 3,523 3,296
Net income $ 42,878 $ 59,469 $ 37,162 $ 16,469 $ 2,561
Earnings per common share—basicIncome (loss) from continuing operations $ 1.02 $ 1.58 $ 1.09 $ 0.48 $ (0.05)
Net income $ 1.02 $ 1.45 $ 1.16 $ 0.61 $ 0.16
Earnings per common share—dilutedIncome (loss) from continuing operations $ 1.01 $ 1.54 $ 1.02 $ 0.44 $ (0.04)
Net income $ 1.01 $ 1.41 $ 1.09 $ 0.56 $ 0.14
Weighted average number of common shares outstandingBasic 42,099 40,925 32,031 26,762 15,918
Diluted 42,512 42,046 34,197 29,447 17,982
Balance Sheet DataCash and cash equivalents $ 25,704 $ 5,765 $ 9,906 $ 12,856 $ 3,235Working capital 60,241 14,933 13,778 28,766 20,163Total assets 708,525 660,565 430,531 159,098 149,246Long-term debt, including current portion 105,000 121,250 97,833 28,166 60,500Stockholders’ equity 496,154 455,156 267,975 105,136 68,624
19
•FTI Consulting, Inc. • Annual Report 2004
Selected Financial Data

20
•
Introduction and Overview
The following is a discussion and analysis of our consolidated
financial condition and results of operations for each of the three
years in the period ended December 31, 2004 and significant factors
that could affect our prospective financial condition and results of
operations. You should read this discussion together with our
consolidated financial statements and notes included elsewhere in
this report. Historical results and any discussion of prospective
results may not indicate our future performance. See “- Forward
Looking Statements.”
We are one of the largest providers of forensic and litigation
consulting and technology, corporate finance/restructuring and
economic consulting services in the United States. Within our
forensic and litigation consulting and technology practice, we help
clients assess complex financial transactions and reconstruct events
from incomplete and/or corrupt data, uncover vital evidence,
identify potential claims and assist in the pursuit of economic
recoveries. We also provide asset tracing investigative services and
expert witness services. Our litigation practice serves clients in all
phases of litigation, including pre-filing, discovery, jury selection,
trial preparation, expert testimony and the actual trial. We assist
with refining issues in litigation and venue selection, and provide
fraud investigation and securities litigation assistance. Our trial
graphics and technology and electronic evidence experts assist
clients in preparing for and presenting their cases in court.
Our corporate finance/restructuring practice provides turnaround,
performance improvement, lending solutions, financial and
operational restructuring, restructuring advisory, mergers and
acquisitions and interim management services. We assist under
performing companies in making decisions to improve their financial
and operational position given their current situation. We analyze,
recommend and implement strategic alternatives for our corporate
finance/restructuring clients, such as rightsizing infrastructure,
improving working capital management, selling non-core assets or
business units, restructuring capital and borrowings, and assessing
long-term viability and business strategy. We also lead and manage
the financial aspects of the in-court restructuring process, such as
assessing the impact of a bankruptcy filing on the client’s financial
and operational situation, planning for the smooth transition in and
out of bankruptcy, facilitating the sale of assets and assisting to
arrange debtor-in-possession financing. Through our corporate
finance services, we can help financially distressed companies
implement their plans by providing interim management teams.
Our corporate finance/restructuring practice provides services
throughout the United States and in the United Kingdom.
Within our economic consulting practice, we provide our clients
with analyses of complex economic issues for use in legal and
regulatory proceedings, strategic decision-making and public policy
debates. Our services include providing advice and testimony
related to:
• antitrust and competition issues that arise in the context of
potential mergers and acquisitions;
• other antitrust issues, including alleged price fixing, cartels and
other forms of exclusionary behavior;
• the application of modern finance theory to issues arising in
securities litigation; and
• public policy studies on behalf of companies, trade associations
and governmental agencies.
All of our practices have experience providing testimony in the
following areas: fraud, damages, lost profits, valuation,
accountant’s liability and malpractice, contract disputes, patent
infringement, price fixing, purchase price disputes, solvency and
insolvency, fraudulent conveyance, preferences, disclosure
statements, trademark and copyright infringement and the financial
impact of government regulations.
Recent Events Affecting Our Operations During the first quarter of 2004, we announced the unanticipated
departure of a number of senior professionals in our corporate
finance/restructuring practice. Some or all of those professionals
have formed a company to compete with us. In addition, some of
our clients with engagements on-going at that time transferred
these engagements to those former employees and their company.
These clients requested refunds of their retainer balances, which
negatively impacted our cash flows during the early part of 2004.
In July 2004, we entered into a new lease agreement for office space
in New York City. The lease expires in November 2021. In accordance
with the lease terms, we received a cash inducement of $8.1 million
which we have classified as deferred rent in our balance sheet. We
are amortizing the cash inducement over the life of the lease as a
reduction to the cash rent expense. During the fourth quarter of
2004, we consolidated our New York City and one of our Saddle
Brook, New Jersey offices and relocated our employees into the new
space. As a result of this decision, we vacated our leased office
facilities prior to the lease termination dates. During the fourth
quarter of 2004, we recorded a loss of $4.7 million related to the
abandoned facilities.
Transactions and Developments afterDecember 31, 2004In February 2005, we acquired substantially all of the assets and
assumed certain liabilities of the Ringtail group. Ringtail is a leading
global developer of litigation support and knowledge management
technologies for law firms. The assets we acquired include software
products and technologies and intellectual property. Ringtail has
Management’s Discussion and Analysis of Financial Condition and Results of Operations
FTI Consulting, Inc. • Annual Report 2004

21
•
developed a suite of integrated software modules to manage the
information and workflow in complex legal cases. We paid $35.0
million for the acquisition, consisting of $20.0 million paid in cash
and $15.0 million paid in shares of our common stock. We financed
the cash portion of the purchase price with cash on hand and
borrowings under our revolving credit facility. We may be required
to pay the sellers additional annual consideration based upon post-
acquisition revenues for each of the years from 2005 through 2007.
The earnout consideration may be up to $2.5 million per year and
may be paid in cash, shares of our common stock or a combination
of both. We granted the sellers contractual protection against a
decline in the value of the purchase price and any earnout payment
made in shares of our common stock. If on the first anniversary date
of any issuance of purchase price or earnout shares, the market
price of our common stock has not increased by at least 10%, we
have agreed to make an additional cash payment to the sellers equal
to the deficiency.
Financial and Operating Overview We derive substantially all of our revenue from providing
professional services to our clients in the United States. Over the
past several years the growth in our revenues and profitability has
resulted primarily from the acquisitions we have completed and also
from our ability to attract new and recurring engagements.
Most of our services are rendered under time-and-expense
arrangements that require the client to pay us a fee for the hours
that we incur at agreed-upon rates. Under this arrangement we also
bill our clients for reimbursable expenses which may include the cost
of the production of our work products and other direct expenses
that we incur on behalf of the client, such as travel costs and
materials that we purchase to produce presentations for courtroom
proceedings. We also have performance-based engagements in which
we earn a success fee when and if certain predefined outcomes
occur. This type of success fee may supplement a time-and-expense
arrangement. Success fee revenues may cause significant variations
in our revenues and operating results due to the timing of achieving
the performance-based criteria.
During the year ended December 31, 2004, our revenues increased
$51.3 million, or 13.7%, as compared to the year ended December
31, 2003. Revenues increased by 73.3% in our forensic and litigation
and technology practice and by 397.5% in our economic consulting
practice. This growth was almost entirely due to the acquisitions we
completed during the fourth quarter of 2003 and to a lesser extent
from internal growth. Although total revenues increased, the
reduced volume of new business in the restructuring market and the
unanticipated departure of a number of billable professional staff in
our corporate finance/restructuring practice resulted in a 36.4%
decrease in revenues from those services during 2004 as compared
to 2003. In August 2002, we acquired the Business Recovery Services
division of PricewaterhouseCoopers, LLP. This acquisition accounted
for the majority of the increase in our revenues and profitability for
2003 as compared to 2002. See “-Results of Continuing Operations”
for a more detailed discussion and analysis of our financial results.
Our financial results are primarily driven by:
• the utilization rates of the billable professionals we employ;
• the number of billable professionals we employ;
• the rates per hour we charge our clients for service; and
• the number and size of engagements we secure.
Utilization Rates of Billable ProfessionalsYear Ended PercentDecember 31, Change
2004 2003Forensic and Litigation Consulting
and Technology 74% 70% 5.7 %Corporate Finance/Restructuring 82% 91% (9.9)%Economic Consulting 78% 82% (4.9)%Total 77% 83% (7.2)%
We calculate the utilization rate for our professional staff by
dividing the number of hours that all of our professionals worked on
client assignments during a period by the total available working
hours for all of our professionals, assuming a 40-hour work week
and a 52-week year. Available working hours include vacation and
professional training days, but exclude holidays. Utilization of our
professionals is affected by a number of factors, including:
• the number, size and timing of client engagements;
• the hiring of new professionals, which generally results in a
temporary drop in our utilization rate during the transition period
for new hires;
• our ability to forecast demand for our services and thereby
maintain an appropriate level of professionals; and
• conditions affecting the industries in which we practice as well as
general economic conditions.
During the year ended December 31, 2004, we experienced a
decrease in our overall utilization rate as compared to the year
ended December 31, 2003. This is primarily attributable to a change
in economic conditions, the unanticipated departures of some of
our professionals and the acquisitions we completed in 2003.
During the first half of 2003, utilization rates were high and our
financial performance was strong across all practice areas. However,
during the third quarter of 2003, demand for our corporate
finance/restructuring services began to decline, primarily resulting
from a strengthening economy coupled with a decline in the volume
of new business in the restructuring market. As a result of economic
conditions, utilization rates decreased in our corporate
finance/restructuring practice during 2003. The unanticipated
FTI Consulting, Inc. • Annual Report 2004

22
•
departures of professionals from this practice area during the first
quarter of 2004 resulted in a further reduction to utilization rates
beginning in 2004, since these professionals were highly utilized.
Beginning in late 2003, we began to mitigate the impact of declining
utilization rates by reassigning our corporate finance/restructuring
professionals to other practice areas where demand was higher. We
also began to more closely manage our professional staffing levels to
optimize our utilization rates. We believe we successfully
implemented our business strategy as evidenced by the stabilization
of the utilization rates generated by this practice area.
During the year ended December 31, 2004, the utilization rate in our
forensic and litigation consulting and technology practice was
higher than for the same period of 2003. This is primarily
attributable to the dispute advisory services business of KPMG that
we acquired in the fourth quarter of 2003. The overall utilization
rate of these professionals was much lower than we anticipated for
the first few months after completion of the acquisition. This had a
negative impact on the overall utilization rate of this practice late in
2003 and early in 2004. However, utilization rates improved
beginning late in the first quarter of 2004, resulting in a higher
utilization rate in 2004 as compared to 2003. The utilization rate in
this practice is highly impacted by seasonal factors such as the
vacation of our staff as well as client personnel. This typically results
in lower utilization rates during the summer months of the third
quarter and during the holiday season in the fourth quarter.
The economic consulting practice predominately reflects the results of
the Lexecon business we acquired in the fourth quarter of 2003. Prior
to the Lexecon acquisition, our economic consulting practice was
relatively small and the utilization rates in 2003 primarily reflect the
impact of several large engagements that were ongoing at that time.
Management’s Discussion and Analysis of Financial Condition and Results of Operations
FTI Consulting, Inc. • Annual Report 2004
Number of Billable ProfessionalsDecember 31, 2004 December 31, 2003
Headcount %of Total Headcount %of Total Percent ChangeForensic and Litigation Consulting
and Technology 357 47.9% 343 41.5% 4.1%Corporate Finance/Restructuring 243 32.6% 305 36.9% (20.3)%Economic Consulting 145 19.5% 179 21.6% (19.0)%
Total 745 100.0% 827 100.0% (9.9)%
The number of billable employees decreased from December 31, 2003
to December 31, 2004 largely due to the decrease in demand for our
corporate finance/restructuring services. In addition, during the first
quarter of 2004, about 60 of our professionals departed from our
former FTI/Policano & Manzo corporate finance/restructuring
practice. During the first quarter of 2004, about 35 employees were
reorganized from the economic consulting practice to the forensic
and litigation and technology practice, resulting in a decrease in
headcount in that practice area.
Average Billable Rate per HourYear Ended
December 31, Percent
2004 2003 ChangeForensic and Litigation Consulting
and Technology $284 $273 4.0%Corporate Finance/Restructuring 441 408 8.1%Economic Consulting 374 291 28.5%Total 354 363 (2.5)%
We calculate average billable rate per hour by dividing employee
revenues for the period, excluding outside consultant and
reimbursable revenues, by the number of hours worked on client
assignments during the same period. Average hourly billable rates
are affected by a number of factors, including:
• our clients’ perception of our ability to add value through the
services we provide;
• the market demand for our services;
• introduction of new services by our competitors;
• the pricing policies of our competitors; and
• general economic conditions.
Our average billable rate per hour increased across all practice areas
from December 31, 2003 to December 31, 2004. The improvement in
average billable rates by practice area is the result of several factors,
including:
• planned bill rate increases implemented throughout our corporate
finance/restructuring practice during the second quarter of 2004,
and as a result of promotions during the third quarter of 2004;
• a change in the mix of billable professionals in our corporate
finance/restructuring practice, which resulted in an increasing
percentage of our professional employees being billable at higher
rates; and
• an increase in the billable rates in our economic practice
attributable to the Lexecon acquisition.
Although average billable rates increased across all of our practice
areas during 2004 as compared to 2003, the total company average
billable rate decreased. This decrease is due to a larger percentage of

23
•
In 2003, we did not operate our business practices as segments.
Accordingly, we did not report results of operations by segment.
The table above presents segment profits for the year ended
December 31, 2004. We evaluate the performance of these segments
based on operating income before depreciation, amortization and
corporate general and administrative expenses. Segment profit
consists of the revenues generated by that segment, less the direct
costs of revenue and selling, general and administrative costs that
are incurred directly by that segment as well as an allocation of
some centrally managed costs, such as information technology
services, marketing and facility costs. Unallocated corporate costs
include costs related to other centrally managed administrative
costs. These administrative costs include corporate office support
costs, costs relating to accounting, human resources, legal,
company-wide business development functions, as well as costs
related to overall corporate management.
Total segment profits decreased during the year ended December 31,
2004 as compared to the comparable period of 2003. This decrease
was driven by several factors, including the following:
• the decrease in demand for our corporate finance/restructuring
related services, which began late in the third quarter of 2003;
• the unanticipated departure during the first quarter of 2004
of a numberof billable professional staff in our corporate
finance/restructuringpractice thatoperatedathighutilizationrates;
• lower utilization rates generated by the businesses we acquired in
late 2003 relative to our historical experience;
• lower gross profit margins generated by our recently acquired
businesses, particularly Lexecon, an economic consulting business
that operates in a competitive environment that typically
generates lower gross margins than those experienced by our
financial and litigation and technology consulting and our
corporate finance/restructuring practices;
• the increased investment in practice-area expansion, including
sign-on and direct compensation for several senior-level
professionals;
• a $4.7 million loss on abandoned facilities recorded in our
corporate segment during 2004 related to the relocation and
consolidation of our New York City and one of our Saddle Brook,
New Jersey offices; and
• an increase in corporate overhead expenses driven largely by
increased staffing and consulting costs to support our growing
organization, to address the requirements of the Sarbanes-Oxley
Act and to further strengthen our corporate governance activities.
During 2004, we addressed the decrease in demand for our services
through the voluntary and involuntary turnover of our
professionals as well as through reassignments of professionals to
other practice areas. Our efforts were successful in neutralizing the
impact of decreased demand for our services. Any decrease in
revenues without a corresponding reduction in our costs would
harm our profitability.
Critical Accounting Policies
General Our discussion and analysis of our financial condition and results of
operations are based on our consolidated financial statements,
which we have prepared in accordance with accounting principles
generally accepted in the United States. The preparation of these
financial statements requires us to make estimates and judgments
that affect the reported amounts of assets, liabilities, revenues and
expenses, and related disclosure of contingent assets and liabilities.
On an ongoing basis, we evaluate our estimates, including those
FTI Consulting, Inc. • Annual Report 2004
Segment Profits.(dollars in thousands) Year Ended December 31, 2004 Year Ended December 31, 2003
Segment % of Segment Segment % of Segment PercentProfits Revenues Profits Revenues Change
Forensic and Litigation Consultingand Technology $50,556 28.3% N/A N/A N/A
Corporate Finance/Restructuring 50,714 31.2% N/A N/A N/AEconomic Consulting 19,333 22.5% N/A N/A N/ACorporate (26,185) N/A $(18,720) N/A 39.9%
Total $94,418 22.1% $123,537 32.9% (23.6)%
N/A - Not available
our business being generated in 2004 by the forensic and litigation
consulting and technology practice which has lower billable rates
than our corporate finance/restructuring practice. In 2003, our
corporate finance/restructuring practice accounted for 68.0% of
our consolidated revenues, while in 2004, our corporate
finance/restructuring practice accounted for 38.1% of our
consolidated revenues. At the same time, the percentage of
consolidated revenues generated by our forensic and litigation
consulting and technology practice increased from 27.4% during
2003 to 41.8% during 2004.

24
•
related to bad debts, goodwill, income taxes and contingencies. We
base our estimates on historical experience and on various other
assumptions that we believe are reasonable under the
circumstances. These results form the basis for making judgments
about the carrying values of assets and liabilities that are not readily
apparent from other sources. Actual results may differ from these
estimates under different assumptions or conditions.
We believe that the following critical accounting policies reflect our
more significant judgments and estimates used in the preparation of
our consolidated financial statements.
Revenue Recognition Our services are primarily rendered under arrangements that require
the client to pay us on a time-and-expense basis. We recognize
revenues for our professional services rendered under time-and-
expense engagements based on the hours incurred at agreed upon
rates as work is performed. We recognize revenue from
reimbursable expenses in the period in which the expense is
incurred. The basis for our policy is the fact that we normally obtain
engagement letters or other agreements from our clients prior to
performing any services. In these letters and other agreements, the
clients acknowledge that they will pay us based upon our time spent
on the engagement and at our agreed-upon hourly rates. We are
periodically engaged to provide services in connection with client
matters where payment of our fees is deferred until the conclusion
of the matter or upon the achievement of performance-based
criteria. We recognize revenues for these arrangements when all the
performance-based criteria are met and collection of the fee is
reasonably assured.
Revenues recognized but not yet billed to clients are recorded at net
realizable value as unbilled receivables in the accompanying
consolidated balance sheets. Billings in excess of services provided
represent amounts billed to clients, such as retainers, in advance of
work being performed.
Some clients pay us retainers before we begin any work for them.
We hold retainers on deposit until we have completed the work. We
apply these retainers to final billings and refund any excess over the
final amount billed to clients, as appropriate, upon our completion
of the work. If the client is in bankruptcy, fees for our professional
services may be subject to approval by the court. In some cases, a
portion of the fees to be paid to us by a client is required by a court
to be held until completion of our work. We make a determination
whether to record all or a portion of such a holdback as revenue
prior to collection on a case-by-case basis.
Allowance for Doubtful Accounts and Unbilled ServicesWe maintain an allowance for doubtful accounts for estimated
losses resulting from the inability of our clients to pay our fees or for
disputes that affect our ability to fully collect our billed accounts
receivable as well as potential fee reductions or refunds imposed by
bankruptcy courts. Even if a bankruptcy court approves of our
services, it has the discretion to require us to refund all or a portion
of our fees due to the outcome of the case or a variety of other
factors. We estimate the allowance for these risks by reviewing the
status of all accounts and recording reserves based on our
experiences in these cases and historical bad debt expense.
However, our actual experience may vary significantly from our
estimates. If the financial condition of our clients were to
deteriorate, resulting in their inability to pay our fees, or the
bankruptcy courts require us to refund certain fees, we may need to
record additional allowances or write-offs in future periods. This risk
is mitigated to the extent that we may receive retainers from some
of our clients prior to performing significant services.
The provision for doubtful accounts and unbilled services is
recorded as a reduction to revenues to the extent the provision
relates to fee adjustments, estimates of refunds that may be imposed
by bankruptcy courts and other discretionary pricing adjustments.
To the extent the provision relates to a client’s inability to make
required payments, the provision is recorded as bad debt expense
which we classify within selling, general and administrative expense.
Goodwill and Other Intangible AssetsAs of December 31, 2004, goodwill and the other intangible assets
represented 73.2% of our total assets. The majority of our goodwill
and other intangible assets was generated from acquisitions we
completed during 2002 and the fourth quarter of 2003. Other
intangible assets include tradenames, customer relationships,
contract backlog, non-competition agreements and intellectual
property. We make at least annual impairment assessments of our
goodwill and intangible assets in accordance with our stated
accounting policy. In making these impairment assessments, we
must make subjective judgments regarding estimated future cash
flows and other factors to determine the fair value of the reporting
units of our business that are associated with these assets. It is
possible that these judgments may change over time as market
conditions or our strategies change, and these changes may cause
us to record impairment charges to adjust our goodwill and other
intangible assets to their estimated implied fair value or net
realizable value.
Income TaxesOur income tax provision consists principally of federal and state
income taxes. Our estimated combined federal and state income tax
rate for 2004 is 42.1%. We generated income in a significant number
of states located throughout the United States. Our effective income
tax rate may fluctuate due to a change in the mix of earnings
between higher and lower state tax jurisdictions and the impact of
nondeductible expenses. Additionally, we record deferred tax assets
and liabilities using the liability method of accounting which
Management’s Discussion and Analysis of Financial Condition and Results of Operations
FTI Consulting, Inc. • Annual Report 2004

25
•
Revenues from continuing operations increased during the year ended
December 31, 2004 as compared to the comparable period of 2003. This
increase is primarily attributable to the acquisitions we completed
during the fourth quarter of 2003 offset by the decrease in demand for
our corporate finance/restructuring services, which began during the
third quarter of 2003, as well as the unanticipated departure of
professionals from this practice during the first quarter of 2004. The
acquisitions of Ten Eyck and the dispute advisory services business
from KPMG accounted for about $67.8 million of the $75.5 million
increase in revenues from our forensic and litigation consulting and
technology group. The remainder of the increase in revenues from our
forensic and litigation consulting and technology group is primarily
attributable to growth in our trial consulting business.
The acquisition of Lexecon accounted for substantially all of the
increase in revenues related to our economic consulting practice.
Our corporate finance/restructuring practice accounted for 68.0%
of our revenues during year ended December 31, 2003 as compared
to 38.1% during the year ended December 31, 2004. Late in the third
quarter of 2003, we began to experience a decrease in demand for
our corporate finance/restructuring related services, which has
negatively impacted our revenues from that segment. The departure
of a number of our billable professionals in the corporate
finance/restructuring practice during the first quarter of 2004 also
contributed to the decrease in revenues from that segment. Because
this practice generates the highest billable rate per hour, the
decrease in revenues attributable to this segment has largely
impacted our overall revenue growth. Revenues attributable to this
practice stabilized beginning in the second quarter of 2004 after
decreasing significantly from the fourth quarter of 2003 to the first
quarter of 2004.
FTI Consulting, Inc. • Annual Report 2004
Revenues(dollars in thousands) Year Ended December 31, 2004 Year Ended December 31, 2003
Revenues % of Total Revenues % of Total Percent ChangeForensic and Litigation Consulting
and Technology $178,650 41.8% $103,101 27.4% 73.3%Corporate Finance/Restructuring 162,495 38.1% 255,336 68.0% (36.4)%Economic Consulting 85,860 20.1% 17,258 4.6% 397.5%
Total $427,005 100.0% $375,695 100.0% 13.7%
requires us to measure these assets and liabilities using the enacted
tax rates and laws that will be in effect when the differences are
expected to reverse. We have not recorded a valuation allowance
on our deferred tax assets as we believe the recorded amounts are
more likely than not to be realized. If the assumptions used in
preparing our income tax provision differ from those used in the
preparation of our income tax return, we may experience a change
in our effective income tax rate for the year.
Significant New Accounting Pronouncements
As permitted by Statement of Financial Accounting Standards No.
123, “Accounting for Stock-Based Compensation,” we currently
account for share-based payments to employees using the intrinsic
value method under Accounting Principles Board, or APB, Opinion
No. 25. As such, we generally do not recognize compensation cost
related to employee stock options. In December 2004, the Financial
Accounting Standards Board issued Statement No. 123(R), “Share-
Based Payment,” which is a revision of Statement No. 123.
Statement No. 123(R) requires all share-based payments to
employees and directors to be recognized in the financial statements
based on their fair values, using prescribed option-pricing models.
Upon adoption of Statement 123(R) on July 1, 2005, pro forma
disclosure will no longer be an alternative to financial statement
recognition. Accordingly, the adoption of the fair-value method
prescribed by Statement No. 123(R) will have a significant impact on
our results of operations, although it will not have an impact on our
overall financial position. The impact of adopting Statement No.
123(R) can not be predicted at this time because it will depend on
levels of share-based payments granted in the future. However, had
we adopted Statement No. 123(R) in prior periods, the impact of
that standard would have approximated the impact of Statement
No. 123 as described in note 1 to our consolidated financial
statements. Statement No. 123(R) also requires the benefit related to
income tax deductions in excess of recognized compensation cost to
be reported as a financing cash flow, rather than as an operating
cash flow as required under current accounting principles. This
requirement will reduce our net operating cash flows and increase
our net financing cash flows in periods after adoption. Had we
adopted this statement in prior periods using the valuation method
and assumptions applied in our pro forma disclosures, we would
have reduced our net operating cash flows and increased our net
financing cash flows by $2.2 million during 2004, $11.6 million during
2003 and $12.8 million during 2002. When Statement No. 123(R) is
adopted, we may elect to change our valuation method or
assumptions. Such changes could have an impact on the amount of
stock-based compensation we record.
Results of Continuing Operations
Year Ended December 31, 2004 vs. Year Ended December 31, 2003

26
•
Management’s Discussion and Analysis of Financial Condition and Results of Operations
FTI Consulting, Inc. • Annual Report 2004
Direct Cost of Revenues(dollars in thousands) Year Ended December 31, 2004 Year Ended December 31, 2003
Cost of % of Segment Cost of % of Segment PercentRevenues Revenues Revenues Revenues Change
Forensic and Litigation and Technology Consulting $ 95,473 53.4% $ 57,256 55.5% 66.7%
Corporate Finance/Restructuring 84,877 52.2% 108,826 42.6% (22.0)%Economic Consulting 54,620 63.6% 10,347 60.0% 427.9%
Total $234,970 55.0% $176,429 47.0% 33.2%
Our direct cost of revenues consists primarily of employee
compensation and related payroll benefits, including the amortization
of signing bonuses given in the form of forgivable loans, the cost of
outside consultants that we retain to supplement our professional
staff, reimbursable expenses, including travel and out-of-pocket
expenses incurred in connection with an engagement, and other
related expenses billable to clients.Direct cost of revenues increasedas
a percentage of revenues in both our corporate finance/restructuring
and economic consulting segments primarily due to lower utilization
rates experienced by those practices during the year ended December
31, 2004 as compared to the same period in 2003. This resulted from
revenues growing at a slower pace than direct costs. In addition:
• The number of billable professionals in our corporate
finance/restructuring practice decreased by 20.3%, from 305 to
243, resulting in a decrease in direct costs in that practice. The
unanticipated departure of some of our professionals in this
practice during the first quarter of 2004 accounts for the majority
of the decrease. This contributed to the increase in direct costs as
a percentage of revenues in that practice, primarily because these
professionals generally operated at higher utilization rates and
higher billable rates than our other professionals.
• The acquisition of Lexecon, which operates at a lower gross
margin than our other operating segments, contributed to the
increase in our economic consulting practice.
• During 2004, we paid $10.6 million in signing bonuses to attract
and retain highly-skilled professionals. These signing bonuses
were granted in the form of forgivable loans that we are
amortizing over periods of one to five years. These signing
bonuses increased direct costs during 2004 as compared to 2003
by $0.8 million in the forensic and litigation consulting and
technology, $1.4 million in the corporate finance practice and
$0.4 million in the economic practice.
Direct cost of revenues as a percentage of revenues for the forensic
and litigation consulting and technology practice decreased slightly
during 2004 as compared to 2003. This is primarily due to an
improvement in utilization rates which resulted in revenues growing
at a faster pace than direct costs.
Selling, General and Administrative Expense(dollars in thousands) Year Ended December 31, 2004 Year Ended December 31, 2003
% of Segment % of Segment PercentSG & A Revenues SG & A Revenues Change
Forensic and Litigation Consulting and Technology $ 36,175 20.2% N/A N/A N/A
Corporate Finance/Restructuring 28,512 17.5% N/A N/A N/AEconomic Consulting 12,839 15.0% N/A N/A N/ACorporate 24,534 N/A $17,632 N/A 39.1%
Total $102,060 23.9% $78,701 20.9% 29.7%
N/A - Not available
Selling, general and administrative expenses consist primarily of
salaries and benefits paid to sales and corporate office staff, rent,
marketing, corporate overhead expenses, bad debt expense and
depreciation and amortization of property and equipment. Segment
selling, general and administrative costs includes those expenses
that are incurred directly by that segment as well as an allocation of
some centrally managed costs, such as information technology
services, marketing and facility costs. Unallocated corporate selling,
general and administrative costs include costs related to other
centrally managed administrative costs. These administrative costs
include corporate office support costs, costs relating to accounting,
human resources, legal, company-wide business development
functions, as well as costs related to overall corporate management.
Selling, general and administrative expense increased as a
percentage of our total revenues for the year ended December 31,
2004 as compared to the same period in 2003. This increase is largely
attributable to increased personnel, facilities and general corporate
expenses associated with the businesses we acquired in late 2003.
The number of non-billable employees increased by 12.4%, from 258
at December 31, 2003 to 290 at December 31, 2004.

27
•
The increase in corporate overhead expenses is primarily related to
increased back-office staffing and related costs to support our growing
organization. In addition, corporate staffing and consulting costs have
increased to address the requirements of the Sarbanes-Oxley Act and to
further strengthen our corporate governance activities. In particular,
beginning in late 2003 we began expanding our internal legal and audit
departments and enhanced our regulatory reporting functions.
Bad debt expense increased as a percentage of revenues from1.4%
for the year ended December 31, 2003 to 1.7% for the year ended
December 31, 2004. This increase accounted for $2.0 million of the
increase in our total selling, general and administrative expenses. The
majorityof this increase,or $1.6 million, is attributable to our acquired
operations. The remaining increase is primarily attributable to our
corporate finance practice. The days sales outstanding related to our
corporate finance practice more than doubled, from just under 30
days to just under 60 days. As a result of the unanticipated departure
of professionals during the first quarter of 2004, we returned a large
volume of retainers to clients we lost. This resulted in an increase in
days sales outstanding, as the remaining part of this practice does not
generally obtain large retainers in advance of performing work.
Depreciation and amortization of property and equipment classified
within total selling, general and administrative expense increased by
$3.1 million or 51.1% from the year ended December 31, 2003 as
compared to the same period in 2004. This increase is a result of the
increase in the furniture and equipment and office build-out
necessary to support a larger organization which grew as a result of
the acquisitions we completed during the fourth quarter of 2003.
Loss on Abandoned FacilitiesDuring the fourth quarter of 2004, we consolidated our New York
City and one of our Saddle Brook, New Jersey offices and relocated
our employees into new office facilities in New York City. As a result
of this decision, we vacated our leased office facilities prior to the
lease termination dates. During the fourth quarter of 2004, we
recorded a loss of $4.7 million related to the abandoned facilities.
Special Termination ChargesDuring the fourth quarter of 2003 we recorded $3.1 million of
special termination charges. These charges relate to contractual
benefits payable to specified employees as a result of the
termination of their employment.
Amortization of Other Intangible AssetsThe amortization expense related to other intangible assets increased
by $3.2 million, or 85.8%, for the year ended December 31, 2004 as
compared to the same period in 2003. This increase is related to the
identifiable intangible assets recorded in connection with the
acquisitions we completed during the fourth quarter of 2003.
Interest ExpenseInterest expense consists primarily of interest on debt we incurred to
purchase businesses over the past several years, including the
amortization of deferred bank financing fees. Interest expense
increased by $1.0 million, or 18.7% for the year ended December 31,
2004 as compared to the same period in 2003. This increase is
primarily attributable to higher average borrowings outstanding
during 2004 as compared to2003.Average borrowings increased in
the fourth quarter of 2003 and remained at this higher level
throughout 2004 as a result of the three business combinations
completed in late 2003. During the year ended December 31, 2003,we
wrote-off about $768,000 of deferred bank financing fees as a result
of the early extinguishment of long-term debt.
Discount on Note ReceivableIn December 2004, we agreed to discount a note receivable due
from the owners of one of our former subsidiaries. We discounted
this note by $475,000 in exchange for payment of the note ahead of
its maturity in 2010. We received this prepayment in January 2005.
Litigation Settlement Gains (Losses), NetDuring the fourth quarter of 2004, we reached settlement on various
lawsuits.Asaresult,werecordedagainof$1.7million,netof legalcosts.
Income TaxesOur effective tax rate for continuing operations was 42.1% during
2004 and 40.9% during 2003. Our effective tax rate increased over
the past year as a result of an increasing portion of our taxable
income being generated in state and local jurisdictions with higher
tax rates. See note 9 of Notes to Consolidated Financial Statements
appearing elsewhere in this annual report for a reconciliation of the
federal statutory rate to our effective tax rates during each of these
years, and a summary of the components of our deferred tax assets
and liabilities. We presently anticipate that our effective tax rate
during 2005 will be similar to 2004.
Year Ended December 31, 2003 vs. Year Ended December 31, 2002
RevenuesRevenues from continuing operations increased 67.6% from $224.1
million for the year ended December 31, 2002 to $375.7 million for
2003. This increase is primarily attributable to the acquisition of BRS,
which occurred as of August 30, 2002. Our corporate
finance/restructuring practice accounted for about 68% of our
revenues during 2003. About 27% of our revenues were attributable
to our forensic and litigation consulting and technology practice,
and less than 5% of our revenues were derived from our economic
consulting practice.
During the third quarter of 2003, we began to experience a decrease
in demand for our corporate finance/restructuring related services.
FTI Consulting, Inc. • Annual Report 2004

28
•
Consequently, the decrease in the demand for those services resulted
in a lower utilization of billable professionals during the second half
of 2003 than we had experienced in earlier quarters and a decline in
the growth of our revenues beginning in the third quarter of 2003.
We began mitigating the impact of this decrease in demand by
redeploying some of these professionals to work on transaction
support, loan due diligence reviews and forensic accounting
assignments where demand was higher. In addition, during the
fourth quarter of 2003, we recorded a special termination charge
totaling $3.1 million related to contractual benefits due to specified
employees as a result of the termination of their employment.
Headcount SummaryAs of December 31, Billable Non-billable Total2003 827 258 1,0852002 * 610 159 769Increase 217 99 316
% Increase 35.6% 62.3% 41.1%
* The headcount information for 2002 excludes 294 employees associatedwith our discontinued operations.
The number of billable employees increased from December 31, 2002
to December 31, 2003 largely due to the acquisitions of Lexecon and
KPMG’s dispute advisory services business. We acquired about 290
billable employees as a result of these transactions in the fourth
quarter of 2003. During the latter part of 2003, our corporate
finance/restructuring practice experienced a decrease in billable
employees related to the decreased demand for these services.
Utilization of billable professionals was about 83% during 2003,
compared to about 88% for the same period of 2002. We experienced
a decrease in utilization rates across our largest practice areas in
2003, consisting of our corporate finance/restructuring practice and
our forensic and litigation consulting and technology practice.
During 2003, the volume of bankruptcy cases declined. As a result,
utilization rates decreased in our corporate finance/restructuring
practice primarily due to the decrease in demand for these services.
The decrease in utilization rates in our forensic and litigation
consulting practice and technology is primarily attributable to the
DAS business that we acquired from KPMG in the fourth quarter of
2003. We acquired 151 billable employees from this transaction. The
overall utilization rate of these professionals was lower than our
existing practice. As a result, we actively repositioned our resources
to focus on services where demand was higher.
Our average bill rate per hour for 2003 was $363, an increase from
an average of $311 for 2002. The improvement in our bill rates was
the result of several factors, including:
• an increase in our standard hourly bill rates during the year;
• an increased concentration of corporate finance/restructuring
consulting services, beginning in August 2002, which typically have
higher hourly bill rates than some of our other practice areas; and
• a decrease in billable employees in our corporate
finance/restructuring practice primarily at the lower levels, which
resulted in an increasing percentage of our professional employees
being billable at higher rates.
Direct Cost of RevenuesDirect cost of revenues from our continuing operations was 47.0%
of our total revenues for the year ended December 31, 2003 as
compared to 48.2% for the comparable period in 2002. The increases
in our bill rates resulted in revenues increasing at a faster rate than
direct costs.
Selling, General and Administrative ExpenseSelling, general and administrative expense was 20.9% of our total
revenues for 2003 and 23.0% for 2002. This improvement in 2003
was primarily due to the greater leverage of our corporate overhead
costs in relation to our increased revenue base resulting primarily
from the acquisition of BRS. Although selling, general and
administrative expense did not increase as a percentage of revenues,
it increased in absolute dollars by $27.1 million. This increase is
largely attributable to increased personnel, facilities and general
corporate expenses associated with the acquired operations of BRS
and other business expansion.
Our corporate overhead expenses, included in selling, general and
administrative expense, represented about 5.0% of total revenues
for the year ended December 31, 2003 and 6.8% for 2002. Although
corporate overhead expenses did not increase as a percentage of
revenues, it increased in absolute dollars by $3.5 million or 23.1%.
The increase in corporate overhead expenses is primarily related to
increased staffing and consulting costs to address the requirements
of the Sarbanes-Oxley Act and to further strengthen our corporate
governance and control activities. In particular, we have created an
internal legal department, expanded internal audit activities and
enhanced our regulatory reporting functions. We also increased our
back-office staffing during 2003 to support our growing
organization. The decline in our corporate overhead costs relative to
our revenues reflects the increased leverage of our overhead and
corporate support services in relation to our increased revenue base.
Bad debt expense, included in selling, general and administrative
expense, increased from 1.2% of revenues for the year ended
December 31, 2002 to 1.4% of revenues for 2003. This increase
represented $2.3 million of the increase in selling, general and
administrative expense.
Depreciation and amortization of property and equipment has
increased by $2.1 million from $4.9 million for the year ended
December 31, 2002 to $7.0 million during 2003 as a result of the
increase in the furniture and equipment necessary to support a
larger organization. Depreciation and amortization decreased from
2.2% of revenues during 2002 to 1.9% of revenues during 2003.
Management’s Discussion and Analysis of Financial Condition and Results of Operations
FTI Consulting, Inc. • Annual Report 2004

29
•
Amortization of Other Intangible AssetsIn connection with the acquisition of BRS in August 2002, we
recorded $5.1 million of other intangible assets, consisting primarily
of client backlog. We began to amortize these other intangible
assets in September 2002. Amortization expense of $1.0 million in
2002 is entirely attributable to the BRS acquisition. We recorded
additional amortizable intangible assets in connection with our
acquisition activities in the fourth quarter of 2003. Amortization
expense increased by $2.7 million to $3.7 million during 2003 of
which $3.1 million relates to the BRS acquisition and $0.6 million
relates to the acquisitions completed in 2003.
Interest IncomeInterest income increased $1.0 million from the year ended December
31, 2002 to $1.2 million during 2003. This increase is primarily due to
income recognized on the investment of higher average cash
balances during 2003, primarily resulting from the net proceeds
received from the public offering of our common stock in February
2003 as well as increasing cash flows provided by operations.
Interest ExpenseInterest expense consists primarily of interest on debt we incurred to
purchase businesses over the past several years. Interest rates during
2003 have been lower than in 2002, although the additional
borrowings in August 2002 to acquire BRS substantially increased
the amount of our debt at the beginning of 2003 as compared to
2002. At December 31, 2002, we had $97.8 million of outstanding
bank debt, and at December 31, 2003, we had $121.3 million of
outstanding bank debt.
Interest expense increased from $4.9 million during the year ended
December 31, 2002 to $5.4 million during 2003. Interest expense in
2003 includes $768,000 of deferred debt financing fees we wrote off
in connection with the early debt extinguishments during the year.
Interest expense increased during this period primarily due to the
higher average borrowings outstanding during 2003 as a result of
our additional borrowings in August 2002 to acquire BRS.
Income TaxesOur effective tax rate for continuing operations in 2003 was 40.9%
compared to 40.4% in 2002. Our effective tax rate increased from
2002 to 2003 as a result of an increasing portion of our taxable
income being generated in state and local jurisdictions with high tax
rates. See Note 9 of Notes to Consolidated Financial Statements
appearing elsewhere in this annual report for a reconciliation of the
federal statutory rate to our effective tax rates during each of these
years, and a summary of the components of our deferred tax assets
and liabilities.
Liquidity and Capital Resources
Cash FlowsYear Ended Change from
December 31, Previous Year
(dollars in thousands) 2004 2003 Dollars PercentNet cash provided by
operating activities $ 58,443 $ 100,177 $ (41,734) (41.7)%Net cash used in
investing activities (13,693) (231,741) 218,048 94.1%
Net cash (used in) provided by financing activities (24,811) 127,423 (152,234) (119.5)%
We have historically financed our operations and capital expenditures
solely through cash flows from operations. However, during the early
part of 2004, our operating income declined as compared to the same
period of 2003. As a result we used borrowings under our revolving
credit facility to finance some of our cash needs for operating
activities and capital expenditures during 2004. We also used
borrowings under our revolving credit facility to finance our share
repurchase program, discussed in more detail below. As of December
31, 2004, we fully repaid all borrowings under our revolving credit
facility. During 2004, our working capital requirements were higher
than we have historically experienced primarily due to:
• increased requirements during the first quarter of 2004 to fund
the working capital needs of the dispute advisory services business
of KPMG that we acquired in October 2003;
• increased quarterly incentive compensation payments attributable
to the Lexecon business that we acquired in November 2003, as
Lexecon has more frequent incentive compensation payments
than our existing businesses;
• increased sign-on and retention compensation paid during 2004 to
attract senior-level professionals and retain our strongest
performers; and
• refunds of retainer balances associated with the loss of client
engagements resulting from the departure of corporate
finance/restructuring professionals.
Our operating assets and liabilities consist primarily of billed and
unbilled accounts receivable, accounts payable and accrued
expenses and accrued compensation expense. The timing of billings
and collections of receivables as well as payments for compensation
arrangements affect the changes in these balances. Our billed and
unbilled accounts receivable, net of billings in excess of services
provided has increased primarily due to the following:
• A decrease in retainers we collect from our clients prior to the
performance of our service. Historically, our corporate
finance/restructuring practice has generated the largest amount of
retainers from our clients prior to beginning any billable work. This
practice area also generates the lowest days sales outstanding rate in
our company. The professionals that left us during the first quarter of
FTI Consulting, Inc. • Annual Report 2004

30
•
2004 transferred some of our clients and engagements to their new
company. As a result, we were required to refund a large amount of
retainer balances. Accordingly, the average days sales outstanding in
this practice area more than doubled, from just under 30 days to just
under 60 days. The corporate finance/restructuring practice
continues to have the shortest collection period in our company.
• The acquisition of the dispute advisory services business of
KPMG. We did not acquire any accounts receivable when we
acquired the dispute advisory services business of KPMG during the
fourth quarter of 2003. This business also did not begin to generate
a substantial amount of revenues until late in the first quarter of
2004. Accordingly, the net accounts receivable attributable to the
forensic and litigation consulting and technology practice has
increased substantially more than our other practice areas during
2004 as compared to December 31, 2003.
• The acquisition of Lexecon. The average days sales outstanding
for our economic practice area is the highest in our company and
is attributable to the acquisition of Lexecon which occurred late in
the fourth quarter of 2003. Lexecon has been engaged to provide
services for a client where payment of our fees is deferred until the
conclusion of the matter. At December 31, 2004, billed and unbilled
receivables for this business included $7.3 million of fees for services
rendered where payment will not be received until completion of
the matter. This specific matter is the primary reason for days sales
outstanding increasing in the economic practice.
Net cash used in investing activities during the year ended December
31, 2004 decreased $218.0 million as compared to the same period in
2003, primarily due to $234.1 million of cash used during 2003 to
fund our acquisition activities offset by $12.2 million of cash received
during 2003 from the sale of our applied sciences practice.
Due to the acquisitions we completed during the fourth quarter of
2003, our average employee headcount during 2004 was about 20%
higher than during 2003. Accordingly, capital expenditures increased
from $10.6 million during 2003 to $11.9 million during 2004 to support a
larger organization during 2004 as compared to during 2003. This
increase is primarily due to an increase in spending for leasehold
improvements to modify and expand our office facilities, and to acquire
additional furniture and information technology equipment. We had no
material outstanding purchase commitments as of December 31, 2004.
Our financing activities have consisted principally of borrowings
and repayments under long-term debt arrangements as well as
issuances of common stock. Our long-term debt arrangements have
principally been obtained to provide financing for our business
acquisitions. During the first quarter of 2003, we completed the
public offering of 4.0 million shares of our common stock,
generating net cash proceeds of $99.2 million. We used about half of
the net proceeds from the stock offering to repay our long-term
debt. We also used all of the net cash proceeds from the sale of our
applied sciences practice to repay debt. During the fourth quarter of
2003, we borrowed $104.1 million under our amended and restated
bank credit facility in order to finance our acquisition of Lexecon.
During the year ended December 31, 2004, our financing activities
consisted principally of $16.3 million of principal payments on our
term loans and $47.5 million of borrowings under our revolving
credit facility that were repaid in full during the year.
In October 2003, our board of directors approved a share
repurchase program under which we may purchase, from time to
time, up to $50.0 million of our common stock over the next twelve
months. In October 2004, our board of directors extended the share
repurchase program through October 31, 2005. The shares of
common stock may be purchased through open market or privately
negotiated transactions and will be funded with a combination of
cash on hand, existing bank credit facilities or new credit facilities.
During 2003, we purchased and retired 194,200 shares of our
common stock at a total cost of about $4.0 million. During 2004, we
purchased and retired 657,300 shares of our common stock at a
total cost of about $10.8 million. Since inception of the program, we
have purchased and retired a total of 851,500 shares of our common
stock for $14.8 million.
Capital ResourcesOur amended and restated bank credit facility provides for up to
$225.0 million of secured financing, consisting of a $100.0 million
revolving loan and $125.0 million in term loans. The maturity date of
the $100.0 million revolving credit facility is November 28, 2008.
However, we may choose to repay outstanding borrowings under
the revolving credit facility at any time before maturity without
penalty. Principal payments on the term loans are payable quarterly
through September 30, 2008. Debt under the credit facility bears
interest at an annual rate equal to either the Eurodollar rate plus an
applicable margin or an alternative base rate defined as the higher
of (1) the lender’s announced prime rate or (2) the federal funds rate
plus the sum of 50 basis points and an applicable margin. Under the
credit facility, the lenders have a security interest in substantially all
of our assets. As of December 31, 2004, we had outstanding
aggregate debt under the credit facility of $105.0 million, bearing
interest at rates ranging from 3.7% to 4.0%. We are not subject to
any penalties for early payment of debt under the credit facility.
Our amended and restated bank credit facility contains covenants
which limit our ability to incur additional indebtedness; create
liens; pay dividends on, make distributions or repurchases of our
capital stock or make specified other restricted payments;
consolidate, merge or sell all or substantially all of our assets;
guarantee obligations of other entities; enter into hedging
agreements; enter into transactions with affiliates or related
persons or engage in any business other than the consulting
business. The credit facility requires compliance with financial
ratios, including total indebtedness to earnings before interest,
taxes, depreciation and amortization, or EBITDA; EBITDA to
Management’s Discussion and Analysis of Financial Condition and Results of Operations
FTI Consulting, Inc. • Annual Report 2004

31
•FTI Consulting, Inc. • Annual Report 2004
Contractual Obligations(in thousands) Total 2005 2006 2007 2008 2009 Thereafter
Long-term debt $115,097 $25,509 $29,497 $33,268 $26,823 $ — $ —Operating leases 154,345 12,766 13,488 13,085 12,281 12,252 90,473Capital lease obligations 362 254 89 16 3 — —
Total obligations $269,804 $38,529 $43,074 $46,369 $39,107 $12,252 $90,473
Future OutlookWe believe that our anticipated operating cash flows and our $115.7
million in total liquidity, consisting of our cash on hand and the
total borrowings available under our bank credit facility are
sufficient to fund our capital and liquidity needs for at least the next
twelve months. In making this assessment, we have considered:
• funds required for debt service payments;
• funds required for capital expenditures of about $12.0 million;
• $20.0 million of cash required to fund our acquisition of Ringtail
Solutions Group completed in February 2005;
• the discretionary funding of our share repurchase program; and
• other future contractual obligations.
For the last several years our cash flows from operations have
exceeded our cash needs for capital expenditures and debt service
requirements. We believe that our cash flows from operations,
supplemented by short-term borrowings under our bank credit
facility, as necessary, will provide adequate cash to fund our long-
term cash needs from normal operations.
Our conclusion that we will be able to fund our cash requirements by
using existing capital resources and cash generated from operations
does not take into account the impact of any acquisition
transactions, not currently contemplated, or any unexpected changes
specified charges and the maintenance of a minimum net worth,
each as defined under the amended credit facility. At December 31,
2004, we were in compliance with all covenants as stipulated in the
credit facility agreements.
As of December 31, 2004, our capital resources included $25.7 million
of cash and cash equivalents and a $100.0 million revolving loan
commitment under our amended and restated bank credit facility.
The availability of borrowings under our revolving credit facility is
subject to specified borrowing conditions. We use letters of credit
primarily as security deposits for our office facilities. Letters of credit
reduce the availability under our revolving credit facility. As of
December 31, 2004, we have $10.0 million of outstanding letters of
credit, including an $8.0 million letter of credit used in place of a
security deposit for the New York City lease we entered into in July
2004. As of December 31, 2004, we have $90.0 million of available
borrowings under our revolving credit facility.
Future Capital NeedsWe currently anticipate that our future capital needs will principally
consist of funds required for:
• operating and general corporate expenses relating to the
operation of our business;
• capital expenditures, primarily for information technology
equipment, office furniture and leasehold improvements;
• debt service requirements;
• up to $35.2 million of discretionary funding for our share repurchase
program that has been extended through October 31, 2005;
• $20.0 million of cash to fund the acquisition of the Ringtail group,
which we completed on February 28, 2005; and
• potential acquisitions of businesses that would allow us to
diversify or expand our current service offerings.
We anticipate capital expenditures will be about $12.0 million
during 2005. Our estimate takes into consideration the needs of our
existing business as well as the needs of our recently completed
acquisition of Ringtail. Our capital expenditure requirements may
change if our staffing levels or technology needs change
significantly from what we currently anticipate.
Off-Balance Sheet ArrangementsWe have no off-balance sheet financing arrangements other than
operating leases and we have not entered into any transactions
involving unconsolidated subsidiaries or special purpose entities.
Future Contractual ObligationThe following table sets forth our estimates as to the amounts and
timing of contractual payments for our most significant contractual
obligations and commitments as of December 31, 2004. The
information in the table reflects future unconditional payments and
is based on the terms of the relevant agreements, appropriate
classification of items under generally accepted accounting
principles currently in effect and certain assumptions, such as
interest rates. Future events could cause actual payments to differ
from these amounts. See “-Forward-Looking Statements.”
Future contractual obligations related to our long-term debt include
principal amortization and estimated interest payments based on
interest rates in effect on January 1, 2005. The long-term debt
obligations also assume that payments will be made based on the
current payment schedule and excludes any drawdown under the
revolving loan commitment.

Management’s Discussion and Analysis of Financial Condition and Results of Operations
32
•
We are subject to market risk associated with changes in interest
rates on our variable rate debt. Our primary interest rate risk results
from changes in the U.S. Prime and Eurodollar rates, which are used
to determine the interest rates applicable to borrowings under our
bank credit facility. Interest rate changes expose our variable rate
long-term borrowings to changes in future cash flows. From time to
time, we use derivative instruments primarily consisting of interest
rate swap agreements to manage this interest rate exposure by
achieving a desired proportion of fixed rate versus variable rate
borrowings. These hedges reduce our exposure to rising interest
rates, but also reduce the benefits from lower interest rates. As of
December 31, 2004, we did not have any derivative instruments.
The table below provides information about our debt obligations
and derivative financial instruments that are sensitive to changes in
interest rates as of December 31, 2004. The table presents principal
cash flows and related weighted average interest rates by year of
maturity for our bank credit facility. We have estimated the fair
value of our bank credit facility based on its carrying value, as
interest rates are reset every 30 to 90 days. For the interest rate
swap in effect as of December 31, 2003, the table presents the
notional amount and average pay and receive rates. The fair value
of our derivative financial instrument is based on estimates from
bankers to settle the interest rate swap agreement.
FTI Consulting, Inc. • Annual Report 2004
in significant numbers of billable professionals. The anticipated cash
needs of our business could change significantly if we pursue and
complete additional business acquisitions, if our business plans change,
if economic conditions change from those currently prevailing or
from those now anticipated, or if other unexpected circumstances
arise that may have a material effect on the cash flow or profitability
of our business. Any of these events or circumstances, including any
new business opportunity, could involve significant additional funding
needs in excess of the identified currently available sources and could
require us to raise additional debt or equity funding to meet those
needs. Our ability to raise additional capital, if necessary, is subject to
a variety of factors that we cannot predict with certainty, including:
• our future profitability;
• the quality of our accounts receivable;
• our relative levels of debt and equity;
• the volatility and overall condition of the capital markets; and
• the market prices of our securities.
Any new debt funding, if available, may be on terms less favorable to
us than our current credit facility. See “-Forward-Looking Statements.”
Effect of InflationInflation is not generally a material factor affecting our business.
General operating expenses such as salaries, employee benefits and
lease costs are, however, subject to normal inflationary pressures.
Forward-Looking Statements
Some of the statements under “- Management’s Discussion and
Analysis of Financial Condition and Results of Operations” and
elsewhere in this report contain forward-looking statements within
the meaning of Section 21E of the Securities Exchange Act of 1934.
These statements involve known and unknown risks, uncertainties
and other factors that may cause our or our industry’s actual results,
levels of activity, performance or achievements expressed or implied
by such forward-looking statements not to be fully achieved. These
forward-looking statements relate to future events or our future
financial performance. In some cases, you can identify forward-
looking statements by terminology such as “may,” “will,” “should,”
“expect,” “plan,” “intend,” “anticipate,” “believe,” “estimate,”
“predict,” “potential” or “continue” or the negative of such terms or
other comparable terminology. These statements are only predictions.
We are under no duty to update any of the forward-looking
statements after the date of this report to conform such statements to
actual results and do not intend to do so. Factors, which may cause
the actual results of operations in future periods to differ materially
from intended or expected results include, but are not limited to, the
risk factors described in “Part I - Item 1. Business - Business Risks” of
our annual report for the year ended December 31, 2004 as filed on
form 10-K with the Securities Exchange Commission.
Year of Maturity 2004 2003
Fair Fair(dollars in thousands) 2005 2006 2007 2008 2009 Thereafter Total Value Total Value
Interest Rate Sensitivity:Long-term debtVariable rate $21,250 $26,250 $31,250 $26,250 $ — $ — $105,000 $105,000 $121,250 $121,250Average interest rate 4% 4% 4% 4% 4% 3%
Interest rate swapVariable to Fixed $ — $ — $— $ — $ — $ — $ — $ — $ 8,670 $ 41Average pay rate 7%
Average receive rate 1%
Quantitative and Qualitative Disclosures about Market Risk

33
•FTI Consulting, Inc. • Annual Report 2004
December 31,
(in thousands, except per share amounts) 2004 2003
AssetsCurrent assets
Cash and cash equivalents $ 25,704 $ 5,765Accounts receivable
Billed receivables 89,536 68,906Unbilled receivables 30,663 34,672Allowance for doubtful accounts and unbilled services (16,693) (20,045)
103,506 83,533Notes receivable 9,031 109Prepaid expenses and other current assets 6,041 4,998Deferred income taxes 6,287 4,798
Total current assets 150,569 99,203Property and equipment, net 23,342 21,921Goodwill 507,656 514,544Other intangible assets, net 10,978 10,137Other assets 15,980 14,760Total assets $708,525 $660,565
Liabilities and Stockholders’ EquityCurrent liabilities
Accounts payable, accrued expenses and other $ 20,771 $ 18,869Accrued compensation 39,383 32,815Current portion of long-term debt 21,250 16,250Billings in excess of services provided 8,924 16,336
Total current liabilities 90,328 84,270Long-term debt, net of current portion 83,750 105,000Deferred rent, capital lease obligations and other, net of current portion 12,745 1,822Deferred income taxes 25,548 14,317Commitments and contingent liabilities (notes 6, 7, 8 and 14)Stockholders’ equity
Preferred stock, $0.01 par value; 5,000 shares authorized; none outstanding — —Common stock, $0.01 par value; 75,000 shares authorized; 42,487 shares issued
and outstanding—2004; and 42,253 shares issued and outstanding—2003 425 423Additional paid-in capital 333,735 332,823Unearned compensation (8,551) (5,733)Retained earnings 170,545 127,667Accumulated other comprehensive loss — (24)
Total stockholders’ equity 496,154 455,156Total liabilities and stockholders’ equity $708,525 $660,565
The accompanying notes are an integral part of these consolidated financial statements.
Consolidated Balance Sheets

34
• FTI Consulting, Inc. • Annual Report 2004
Consolidated Statements of Income
Year Ended December 31,
(in thousands, except per share amounts) 2004 2003 2002
Revenues $427,005 $375,695 $224,113Operating expenses
Direct cost of revenues 234,970 176,429 108,104Selling, general and administrative expense 102,060 78,701 51,647Loss on abandoned facilities 4,670 — —Special termination charges — 3,060 —Amortization of other intangible assets 6,836 3,680 1,033
348,536 261,870 160,784Operating income 78,469 113,825 63,329Other income (expense)
Interest income 788 1,193 155Interest expense (6,399) (5,389) (4,872)Discount on note receivable (475) — —Litigation settlement gains (losses), net 1,672 — —
(4,414) (4,196) (4,717)Income from continuing operations before income tax provision 74,055 109,629 58,612Income tax provision 31,177 44,838 23,704Income from continuing operations 42,878 64,791 34,908Discontinued operations
Income from operations of discontinued operations, net of income tax provision of $1,156 in 2003 and $2,198 in 2002 — 1,649 3,145
Loss from sale of discontinued operations, net of income tax provision (benefit) of $2,810 in 2003 and ($607) in 2002 — (6,971) (891)
(Loss) Income from discontinued operations — (5,322) 2,254Net income $ 42,878 $ 59,469 $ 37,162Earnings per common share—basic
Income from continuing operations $ 1.02 $ 1.58 $ 1.09Net income $ 1.02 $ 1.45 $ 1.16
Earnings per common share—dilutedIncome from continuing operations $ 1.01 $ 1.54 $ 1.02Net income $ 1.01 $ 1.41 $ 1.09
The accompanying notes are an integral part of these consolidated financial statements.

35
•FTI Consulting, Inc. • Annual Report 2004
AccumulatedAdditional Other
Common Stock Paid-in Unearned Retained Comprehensive(in thousands) Shares Amount Capital Compensation Earnings (Loss) Income TotalBalance, December 31, 2001 29,387 $294 $ 75,318 $ (568) $ 31,036 $(944) $ 105,136Issuance of common stock
in connection with:Exercise of options, including
tax benefit of $12,754 1,815 18 19,259 19,277Employee stock purchase plan 229 2 3,023 3,025Restricted shares 6 — 28 28Business combinations 4,569 46 102,844 102,890
Payment for fractional shares — — (16) (16)Amortization of
unearned compensation 222 222Comprehensive income:
Other comprehensive income—change in fair value of interest rate swaps, net of income tax provision of $185 251 251
Net income 37,162 37,162Total comprehensive income 37,413Balance, December 31, 2002 36,006 360 200,456 (346) 68,198 (693) 267,975Issuance of common stock
in connection with:Public offering, net of
offering costs of $1,386 3,992 40 99,183 99,223Exercise of options,
including income tax benefit of $11,599 1,798 18 24,478 24,496
Employee stock purchase plan 196 2 4,041 4,043Restricted shares, net
of forfeitures 282 3 5,807 (5,822) (12)Business combinations 176 2 2,372 2,374
Purchase and retirement of common stock (194) (2) (4,030) (4,032)
Payment for fractional shares (3) — (2) (2)Amortization of
unearned compensation 518 435 953Comprehensive income:
Other comprehensive income—change in fair value of interest rate swaps, net of income tax provision of $228 669 669
Net income 59,469 59,469Total comprehensive income 60,138Balance, December 31, 2003 42,253 423 332,823 (5,733) 127,667 (24) 455,156Issuance of common stock
in connection with:Exercise of options, including
tax benefit of $2,055 462 5 4,920 4,925Employee stock purchase plan 202 2 2,837 2,839Restricted shares, net
of forfeitures 227 2 4,140 (4,142) —Purchase and retirement
of common stock (657) (7) (10,803) (10,810)Contingent payments to former
owners of subsidiary, net ofincome tax benefit of $126 (182) (182)
Amortization of unearned compensation 1,324 1,324
Comprehensive income:Other comprehensive income—
change in fair value of interest rate swaps, net of income tax provision of $17 24 24
Net income 42,878 42,878Total comprehensive income 42,902Balance, December 31, 2004 42,487 $425 $333,735 $(8,551) $170,545 $ — $496,154
The accompanying notes are an integral part of these consolidated financial statements.
Consolidated Statements of Stockholders’ Equity

36
• FTI Consulting, Inc. • Annual Report 2004
Consolidated Statements of Cash Flows
Year Ended December 31,
(in thousands) 2004 2003 2002
Operating activitiesNet income $ 42,878 $ 59,469 $ 37,162Adjustments to reconcile net income to net cash provided by operating activities:
Depreciation and other amortization 9,113 7,003 4,947Amortization of other intangible assets 6,836 3,680 1,033Income tax benefit from stock option exercises and other 2,181 11,599 12,754Provision for doubtful accounts 7,062 5,109 2,776Non-cash stock-based compensation 1,324 941 307Loss from sale of discontinued operations — 6,971 1,209Loss on abandoned facilities 4,670 — —Non-cash interest expense and other 1,949 1,873 542Changes in operating assets and liabilities, net of effects from acquisitions:
Accounts receivable, billed and unbilled (27,860) 179 551Prepaid expenses and other assets (10,328) (1,401) (985)Accounts payable, accrued expenses and other 13,824 6,109 5,849Income taxes payable 7,638 4,311 8,280Accrued compensation expense 6,568 (1,841) 11,581Billings in excess of services provided (7,412) (3,825) (5,349)
Net cash provided by operating activities 58,443 100,177 80,657
Investing activitiesPurchases of property and equipment (11,939) (10,612) (8,777)Payments for acquisition of businesses, including contingent payments
and acquisition costs (1,253) (234,117) (145,409)Cash received from sale of discontinued operations — 12,150 —Change in other assets (501) 838 (2,200)Net cash used in investing activities (13,693) (231,741) (156,386)
Financing activitiesIssuance of common stock, net of offering costs — 99,223 —Issuance of common stock under equity compensation plans 2,870 12,897 6,523Purchase and retirement of common stock (10,810) (4,032) —Borrowings under long-term credit facility — 109,121 119,000Payments of long-term debt (16,250) (85,704) (49,333)Borrowings under revolving credit facility 47,500 5,000 45,000Payments of revolving credit facility (47,500) (5,000) (45,000)Payments of capital lease obligations (571) (307) (214)Payments of debt financing fees and other (50) (3,775) (3,197)Net cash (used in) provided by financing activities (24,811) 127,423 72,779Net increase (decrease) in cash and cash equivalents 19,939 (4,141) (2,950)Cash and cash equivalents, beginning of year 5,765 9,906 12,856Cash and cash equivalents, end of year $ 25,704 $ 5,765 $ 9,906
The accompanying notes are an integral part of these consolidated financial statements.

37
•FTI Consulting, Inc. • Annual Report 2004
Notes to Consolidated Financial Statements (dollar and share amounts in tables expressed in thousands, except per share data)
1. Description of Business and SignificantAccounting Policies
Description of businessWe are one of the largest providers of forensic and litigation
consulting and technology, corporate finance/restructuring and
economic consulting services in the United States. Within our
forensic and litigation consulting and technology practice, we work
with companies faced with fraud, financial disclosure and
accounting investigations, misstatements and malpractice issues. We
provide evaluation services, electronic evidence and repository
hosting services and creative solutions to litigation and trial
management problems, and help our clients mitigate the cost of or
avoid litigation. Our corporate finance/restructuring practice assists
under performing companies in making decisions to improve their
financial and operational position given their current situation, as
well as provides services in connection with bankruptcies, mergers
and acquisitions and restructuring management. Within our
economic consulting practice, we provide sophisticated economic,
competition and anti-trust modeling and analysis, and merger,
acquisition and financial advisory services.
We have a total workforce of over 1,000 employees who are
strategically located in 24 cities in the United States, as well as in
London, England and Melbourne, Australia. Our clients include
companies, as well as creditors or other stakeholders, such as
financial institutions, private equity firms and the law firms that
represent them.
Principles of consolidationThe consolidated financial statements include the accounts of FTI
Consulting, Inc. and its wholly owned subsidiaries. All significant
intercompany transactions and balances have been eliminated.
Use of estimatesThe preparation of financial statements in conformity with
accounting principles generally accepted in the United States
requires management to make estimates and assumptions that
affect the amounts reported in the consolidated financial
statements and accompanying notes. Due to the inherent
uncertainty involved in making those assumptions, actual results
could differ from those estimates.
We use estimates to determine the amount of the allowance for
doubtful accounts necessary to reduce accounts receivable and
unbilled receivables to their expected net realizable value and to
account for any potential refunds that may be imposed by
bankruptcy courts. We estimate the amount of the required
allowance by reviewing the status of significant client matters and
past-due receivables as well as by analyzing historical bad debt
trends and realization adjustments to our revenues. Actual
collection experience has not varied significantly from estimates,
due primarily to credit policies, the controls and procedures
designed to estimate realization adjustments to our revenues and a
lack of concentrations of accounts receivable. Accounts receivable
balances are not collateralized.
We also make estimates in determining self-insurance reserves for
certain employee benefit plans and other ordinary accruals. These
estimates are based upon historical trends, current experience and
knowledge of relevant factors.
Cash equivalentsCash equivalents consist of highly liquid short-term investments with
maturities of three months or less at the time of purchase.
Supplemental Cash Flow InformationYear Ended December 31,
2004 2003 2002Cash paid for interest $ 4,962 $ 3,554 $ 4,100Cash paid for income taxes,
net of refunds $21,358 $28,705 $ 4,500Other non-cash investing
and financing activitiesAssets acquired under
capital lease $ — $ 41 $ 514
Issuance of common stock to acquire businesses $ — $ 2,374 $102,890
Property and equipmentWe record property and equipment, including improvements that
extend useful lives, at cost, while maintenance and repairs are
charged to operations as incurred. We calculate depreciation using
the straight-line method based on estimated useful lives ranging
from three to seven years for furniture, equipment and internal use
software. We amortize leasehold improvements and assets under
capital leases over the shorter of the estimated useful life of the
asset or the lease term. The gross amount of assets recorded under
capital lease obligations included in furniture, equipment and
software is $1.3 million as of December 31, 2004 and $1.5 million as
of December 31, 2003.
We capitalize costs incurred during the application development
stage of computer software developed or obtained for internal use.
Capitalized software is classified within furniture, equipment and
software and is amortized over the estimated useful life of the
software, which is generally three years.
GoodwillGoodwill consists of the excess of the purchase price over the fair
value of tangible and identifiable intangible net assets acquired in
purchase business combinations. Upon adoption of Statement of
Financial Accounting Standards No. 142, “Goodwill and Other
Intangible Assets,” on January 1, 2002, we ceased amortizing goodwill.
We review goodwill for impairment as of October 1 of each year or
38
• FTI Consulting, Inc. • Annual Report 2004
Notes to Consolidated Financial Statements
whenever events or changes in circumstances indicate that the
carrying amount may not be recoverable. Impairment is the condition
that exists when the carrying amount of goodwill exceeds its implied
fair value. The implied fair value of goodwill is the amount determined
by deducting the estimated fair value of all tangible and identifiable
intangible net assets of the reporting unit from the estimated fair
value of the reporting unit. If the recorded value of goodwill exceeds
its implied value, an impairment charge is recorded for the excess. For
purposes of impairment testing, our reporting units are our operating
segments which represent the lowest level for which discrete financial
information is available and regularly reviewed by management.
Components are combined when determining reporting units if they
have similar economic characteristics.
Other intangible assetWe amortize our intangible assets that have finite lives over the
estimated periods benefited using the straight-line method. See
Note 5. “Goodwill and Other Intangible Assets.”
Valuation of long-lived assets excluding goodwillWe review long-lived assets, excluding goodwill, for impairment
whenever events or changes in circumstances indicate that the
carrying amount of an asset or group of assets may not be fully
recoverable. These events or changes in circumstances may include
a significant deterioration of operating results, changes in business
plans, or changes in anticipated future cash flows. If an impairment
indicator is present, we evaluate recoverability by a comparison of
the carrying amount of the assets to future undiscounted net cash
flows we expect the assets to generate. We group assets at the
lowest level for which there is identifiable cash flows that are largely
independent of the cash flows generated by other asset groups. If
the total of the expected undiscounted future cash flows is less than
the carrying amount of the asset, an impairment loss, if any, is
recognized for the difference between the fair value and carrying
value of assets. Fair value is generally determined by estimates of
discounted cash flows. The discount rate used in any estimate of
discounted cash flows would be the rate required for a similar
investment of like risk.
Assets to be disposed of are reported at the lower of carrying values
or fair values, less estimated costs of disposal.
Interest rate swapsWe sometimes use derivative instruments consisting primarily of
interest rate swap agreements to manage our exposure to changes
in interest rates. We do not use derivative instruments for trading or
other speculative purposes.
All derivative instruments are reported on the balance sheet at fair
value and changes in a derivative’s fair value are recognized
currently in earnings unless specified hedge criteria are met. If an
interest rate swap is designated a cash flow hedge, the effective
portions of the changes in the fair value of the swap are recorded in
other comprehensive income. Ineffective portions of changes in the
fair value of cash flow hedges are recognized in earnings.
As part of managing the exposure to changes in the market interest
rates on our variable rate debt, we may enter into interest rate swap
transactions with financial institutions acting as the counter-party.
To ensure both appropriate use as a hedge and hedge accounting
treatment, all swaps entered into are designated according to the
hedge objective against a specific debt issue. The notional amounts,
rates and maturities of our interest rate swaps are closely matched
to the related terms of hedged debt obligations. As of December 31,
2004, we are not a party to any interest rate swap agreements.
Debt financing feesWe amortize the costs we incur to obtain debt financing over the
terms of the underlying obligations using the effective interest
method. The amortization of debt financing costs is included in
interest expense. Unamortized debt financing costs are classified
within other assets in our consolidated balance sheets.
Billings in excess of services providedBillings in excess of services provided represents amounts billed to
clients, such as retainers, in advance of work being performed.
Clients may make advance payments, which are held on deposit
until completion of work. These amounts are either applied to final
billings or refunded to clients upon completion of work. Retainers in
excess of related accounts receivable and unbilled receivables are
recorded as billings in excess of services provided in our
consolidated balance sheets.
Revenue recognitionWe derive most of our revenues from professional service activities.
The vast majority of these activities are provided under time-and-
expense billing arrangements, and revenues, consisting of billed fees
and pass-through expenses, are recorded as work is performed and
expenses are incurred. We normally obtain engagement letters or
other agreements from our clients prior to performing any services.
In these letters and other agreements, the clients acknowledge that
they will pay us based upon our time spent on the engagement and
at our agreed-upon hourly rates. We are periodically engaged to
provide services in connection with client matters where payment
of our fees is deferred until the conclusion of the matter or upon the
achievement of performance-based criteria. We recognize revenues
for these arrangements when all the performance-based criteria are
met and collection of the fee is reasonably assured.

39
•FTI Consulting, Inc. • Annual Report 2004
We record allowances for estimated realization adjustments to our
professional services fees that are subject to review by bankruptcy
courts. We record provisions for fee adjustments and discretionary
pricing adjustments as a reduction of revenues. Revenues recognized,
but not yet billed to clients, have been recorded as unbilled
receivables in the accompanying consolidated balance sheets.
Direct cost of revenuesDirect cost of revenues consists primarily of billable employee
compensation and related payroll benefits, the cost of consultants
assigned to revenue-generating activities and direct expenses billable
to clients. Direct cost of revenues does not include an allocation of
overhead costs.
Advertising costsCosts related to advertising and other promotional expenditures are
expensed as incurred. Advertising costs totaled $668,000 during
2004, $406,000 during 2003 and $480,000 during 2002.
Stock-based compensationWe record compensation expense for stock-based compensation for
employees and non-employee members of our board of directors
using the intrinsic value method prescribed by Accounting Principles
Board, or APB, Opinion No. 25, “Accounting for Stock Issued to
Employees.” Under APB Opinion No. 25, compensation expense is
recorded over the vesting period to the extent that the fair value of
the underlying stock on the grant date exceeds the exercise or
acquisition price of the stock or stock-based award.
All options granted under our stock-based employee compensation
plans had an exercise price greater than or equal to the market
value of the underlying common stock on the date of grant. We also
periodically issue restricted and unrestricted stock to employees in
connection with new hires and performance evaluations. The fair
market value on the date of issue of unrestricted stock is
immediately charged to compensation expense, and the fair value
on the date of issue of restricted stock is charged to compensation
expense ratably over the restriction period.
Statement of Financial Accounting Standards No. 123, “Accounting
for Stock-Based Compensation,” encourages companies to recognize
expense for stock-based awards based on their estimated fair value
on the date of grant. Statement No. 123 requires the disclosure of
pro forma income and earnings per share data in the notes to the
financial statements if the fair value method is not adopted. The
following table illustrates the effect on net income and earnings per
share if we had determined compensation costs by applying the fair
value recognition provisions of Statement No. 123 to stock-based
employee awards.
Year Ended December 31,
2004 2003 2002Net income, as reported $ 42,878 $59,469 $37,162Add—Stock-based employee
compensation cost included in reported net income, net of income taxes 767 556 183
Deduct—Total stock-based employee compensation expense determined under fairvalue based method for allawards, net of income taxes (7,391) (10,052) (8,059)
Net income, pro forma $ 36,254 $49,973 $29,286Earnings per common share
Basic, as reported $ 1.02 $ 1.45 $ 1.16Basic, pro forma $ 0.86 $ 1.22 $ 0.91Diluted, as reported $ 1.01 $ 1.41 $ 1.09
Diluted, pro forma $ 0.86 $ 1.22 $ 0.87
The Black-Scholes option-pricing model and other models were
developed for use in estimating the fair value of traded options,
which have no vesting restrictions and are fully transferable. In
addition, option valuation models require the input of subjective
assumptions, including the expected stock price volatility. Because
our stock options have characteristics significantly different from
those of traded options, and because changes in the subjective
input assumptions can materially affect the fair value estimate, we
believe the existing models do not necessarily provide a reliable
measure of the fair value of our stock-based awards. The fair value
of our stock-based awards was estimated on the measurement date
using the Black-Scholes option-pricing model using the following
assumptions.
Year Ended December 31,
2004 2003 2002Assumptions
Risk-free interest rate—option plan grants 1.90%–3.91% 1.86%–2.59% 3.5%
Risk-free interest rate—purchase plan grants 0.96%–1.61% 1.02%–1.16% 3.5%
Dividend yield 0% 0% 0%Expected life of
option grants 3–5 years 3 years 2.6 yearsExpected life of stock
purchase plan grants 0.5 years 0.5 years 0.5 yearsStock price volatility—
option plan grants 54.6%–59.6% 55.5%–59.4% 63.4%–68.5%Stock price volatility—
purchase plan grants 56.9%–71.6% 33.8%–61.0% 54.6%–57.3%Weighted average fair
value of grantsStock options:
Grant price=fair market value $ 7.09 $ 8.98 $11.64
Grant price>fair market value $ 6.63 $ 9.17 –
Employee stock purchase plan shares $ 6.62 $ 7.49 $ 5.53
Restricted shares $18.60 $20.53 $23.39

40
• FTI Consulting, Inc. • Annual Report 2004
Notes to Consolidated Financial Statements
Income taxesWe use the liability method of accounting for income taxes. Under
this method, deferred tax assets and liabilities are determined based
on differences between the financial reporting and tax bases of assets
and liabilities, and are measured using the enacted tax rates and laws
that will be in effect when the differences are expected to reverse.
Stock splitsThe board of directors approved a three-for-two split of our
common stock payable in the form of a stock dividend to
stockholders of record on May 7, 2003, which we paid on June 4,
2003. The board of directors also approved a three-for-two stock
split payable in the form of a stock dividend which was distributed
to stockholders of record on January 2, 2002. All share and per share
data included in these consolidated financial statements have been
restated to reflect these stock splits.
Earnings per common shareBasic earnings per common share is calculated by dividing net income
by the weighted average number of common shares outstanding
during the period. Diluted earnings per common share adjusts basic
earnings per share for the potentially dilutive effects of shares issuable
under our stock option plans using the treasury stock method.
Year Ended December 31,
2004 2003 2002Numerator—basic and dilutedIncome from continuing operations $42,878 $64,791 $34,908(Loss) Income from discontinued
operations – (5,322) 2,254Net income $42,878 $59,469 $37,162DenominatorWeighted average number
of common shares outstanding—basic 42,099 40,925 32,031
Effect of dilutive restricted shares 5 – –Effect of dilutive stock options 408 1,121 2,166Weighted average number
of common shares outstanding—diluted 42,512 42,046 34,197
Earnings per common share—basic
Income from continuing operations $ 1.02 $ 1.58 $ 1.09(Loss) Income from discontinued
operations – (0.13) 0.07Net income $ 1.02 $ 1.45 $ 1.16Earnings per common
share—dilutedIncome from continuing operations $ 1.01 $ 1.54 $ 1.02(Loss) Income from discontinued
operations – (0.13) 0.07Net income $ 1.01 $ 1.41 $ 1.09
Antidilutive stock options and restricted shares 3,046 822 1,718
Concentrations of riskWe derive substantially all of our revenue from providing
professional services to our clients in the United States. We believe
that the geographic and industry diversity of our customer base
throughout the U.S. minimizes the risk of incurring material losses
due to concentrations of credit risk. We are periodically engaged to
provide services in connection with client matters where payment
of our fees is deferred until the conclusion of the matter. At
December 31, 2004, billed and unbilled receivables of $9.4 million
related to fees for services rendered in connection with two client
matters where payment will not be received until the completion of
the engagement.
Significant new accounting pronouncementsAs permitted by Statement of Financial Accounting Standard No.
123, “Accounting for Stock-Based Compensation,” we currently
account for share-based payments to employees using the intrinsic
value method under Accounting Principles Board, or APB, Opinion
No. 25. As such, we generally do not recognize compensation cost
related to employee stock options. In December 2004, the Financial
Accounting Standards Board issued Statement No. 123(R), “Share-
Based Payment,” which is a revision of Statement No. 123. Statement
No. 123(R) requires all share-based payments to employees and
directors to be recognized in the financial statements based on their
fair values, using prescribed option-pricing models. Upon adoption of
Statement 123(R) on July 1, 2005, pro forma disclosure will no longer
be an alternative to financial statement recognition. Accordingly, the
adoption of the fair-value method prescribed by Statement No.
123(R) will have a significant impact on our results of operations,
although it will not have an impact on our overall financial position.
The impact of adopting Statement No. 123(R) can not be predicted at
this time because it will depend on levels of share-based payments
granted in the future. However, had we adopted Statement No.
123(R) in prior periods, the impact of that standard would have
approximated the impact of Statement No. 123 as described above
under “Stock-based compensation.” Statement No. 123(R) also
requires the benefit related to income tax deductions in excess of
recognized compensation cost to be reported as a financing cash
flow, rather than as an operating cash flow as required under
current accounting principles. This requirement will reduce our net
operating cash flows and increase our net financing cash flows in
periods after adoption. Had we adopted this statement in prior
periods using the valuation method or assumptions applied in our
pro forma disclosures, we would have reduced our net operating
cash flows and increased our net financing cash flows by $2.2 million
during 2004, $11.6 million during 2003 and $12.8 million during 2002.
When Statement No.123(R) is adopted, we may elect to change our
valuation method or assumptions. Such changes could have an
impact on the amount of stock-based compensation we record.
ReclassificationsWe have reclassified some prior period amounts to conform to our
current year presentation.

41
•FTI Consulting, Inc. • Annual Report 2004
2. Acquisitions
LexeconIn November 2003, we acquired substantially all of the assets and
most of the liabilities of Lexecon Inc. from its parent company,
Nextera Enterprises, Inc. Lexecon, located in Chicago, Illinois and
Cambridge, Massachusetts, is an economic consulting firm that
provides services throughout the United States. Its clients include
major law firms and the corporations that they represent,
government and regulatory agencies, public and private utilities,
and multinational corporations. Lexecon’s services involve the
application of economic, financial and public policy principles to
market place issues in a large variety of industries. Its services
address three broad areas: litigation support, public policy studies
and business consulting. Lexecon provides expert witness testimony,
economic analyses and other litigation-related services in adversarial
proceedings in courts and before regulatory bodies, arbitrators and
international trade organizations.
We paid Nextera cash of $129.2 million to acquire Lexecon and we
incurred acquisition-related costs of about $1.6 million. We financed
the acquisition with a combination of existing cash resources and
borrowings of $104.1 million under our amended and restated bank
credit facility.
Dispute Advisory Services practice of KPMGIn October 2003, we acquired certain assets and liabilities of the
dispute advisory services business of KPMG LLP, a U.S. accounting
and tax firm, in exchange for $89.1 million in cash. We also incurred
acquisition-related expenses of about $0.8 million. The dispute
advisory services, or DAS, business assists clients in the analysis and
resolution of all phases of complex disputes in a variety of forums,
including litigation, arbitration, mediation and other forms of
dispute resolution. The identifiable assets we acquired included
client backlog, customer relationships and a nominal amount of
computer equipment. We did not acquire the accounts receivable or
any other working capital related to KPMG’s DAS business.
Ten EyckIn October 2003, we acquired the operations and substantially all
the net assets of Ten Eyck Associates, P.C. in exchange for about
$13.2 million in cash and 175,536 restricted shares of our common
stock valued at $2.4 million. Transfer restrictions lapse in two years
for 50% of the shares and in four years for the remaining 50% of the
shares of common stock paid for this acquisition. The common stock
was valued based upon an independent appraisal. We also incurred
acquisition-related expenses of about $0.2 million. Ten Eyck is a
consulting practice that specializes in Securities and Exchange
Commission, or SEC, investigations and securities law litigation, SEC
accounting and enforcement consulting, fraud investigations,
accountants’ malpractice, director and officer liability issues,
financial and accounting crisis management, strategic advice and
other financial litigation consulting services.
Domestic Business Recovery Services Division ofPricewaterhouseCoopersIn August 2002, we acquired the domestic Business Recovery Services,
or BRS, division of PricewaterhouseCoopers, LLP, or PwC, for 4.5
million shares of common stock valued at $101.9 million and $142.0
million in cash, including $2.0 million in acquisition related expenses.
We entered into four-year employment agreements with the former
partners of BRS that we acquired. These partners received a total of
about 3.6 million shares of our common stock and agreed with us to
restrict the transfer of 40% of their shares. During 2004, one-half of
these restricted shares became unrestricted, and during 2006, the
remaining shares will become unrestricted. We granted the BRS
partners contractual protection against a decline in the value of
their restricted shares during the four-year restricted period if the
market price for the shares falls below $18.89 per share. If a BRS
partner terminates his or her employment with us prior to the
expiration of the four-year term of the employment agreement, the
restricted period for the remaining restricted shares will be extended
to eight years from the date of termination, and these shares lose
their price protection. During 2004, we paid $308,000 in relation to
the price protection provision on those shares that became
unrestricted. We recorded the price protection payments as a
change in the value of the shares granted upon acquisition through
a reduction to additional paid-in capital.
Purchase price allocationThe following table summarizes the estimated fair value of the net
assets acquired and liabilities assumed pertaining to the significant
acquisitions we completed in 2003 and 2002. During 2004, we
completed our valuation of the identifiable intangible assets that we
acquired in 2003, consisting principally of contract backlog, client
relationships and tradenames. As a result, we increased the amount
of purchase price allocated to amortizable intangible assets by $7.7
million. The amortization of this additional amount resulted in a
charge to amortization expense of $1.6 million during the fourth
quarter of 2004. As of December 31, 2004, our remaining amortizable
intangible assets are being amortized over a weighted-average useful
life of about 6.5 years. We recorded significant goodwill from these
acquisitions as a result of the value of the assembled workforce we
acquired and the ability to earn a higher rate of return from the
acquired business than would be expected if those net assets had to
be acquired or developed separately. We believe the goodwill
recorded as a result of these acquisitions will be fully deductible for
income tax purposes over the next 15 years.

42
• FTI Consulting, Inc. • Annual Report 2004
Notes to Consolidated Financial Statements
A summary of how we allocated the purchase price of the
significant businesses we acquired is as follows:
Lexecon DAS BRSDirect cost of business
combinationsCash paid, including
transaction costs $130,833 $89,910 $141,994Common stock issued — — 101,880
$130,833 $89,910 $243,874Net assets acquiredAccounts receivable, billed
and unbilled, net $ 20,661 $ — $ 42,651Other current assets 384 — —Furniture, equipment
and software 2,032 221 —Contracts, backlog (estimated
1 year weighted-average useful life) 1,400 2,700 4,200
Customer relationships (estimated6.5 year weighted-averageuseful life) 5,800 2,500 —
Tradename (indefinite useful life) 2,700 — —Intellectual property (estimated
3 year weighted-average useful life) — — 360
Non-compete agreements (estimated 4 year weighted-average useful life) 375 381 540
Goodwill 112,513 84,264 218,361Other assets 67 — —Accounts payable and
accrued expenses (14,465) (1,709)Billings in excess of
services provided (22) (156) (20,529)Other liabilities (612) — —
$130,833 $89,910 $243,874
Pro forma resultsOur consolidated financial statements include the operating results of
each acquired business from the dates of acquisition. The unaudited
pro forma financial information below for the years ended December
31, 2003 and 2002 assumes that our material business acquisitions had
occurred at the beginning of each of the periods presented.
DAS was not a separate reporting unit of KPMG and as a result,
separate complete historical financial statements are not available.
The information included in the pro forma presentation consists of
the revenue from the book-of-business of the partners and directors
who joined FTI and direct expenses, including compensation and
benefits of the professionals and administrative personnel joining
FTI, reimbursable and subcontractor costs and some practice related
costs. Practice related costs consist principally of non-reimbursable
costs, bad debt expense, administrative support and depreciation.
The direct expenses of DAS do not include an allocation of KPMG’s
firm wide expenses such as rent, insurance, national marketing, data
processing, accounting, the cost of national support offices and
other similar corporate expenses. Accordingly, the unaudited pro
forma financial information below is not indicative of the expected
results of our future operations.
Years Ended December 31,
Pro forma financial information for 2003 acquisitions 2003 2002Revenues $514,374 $372,058Income from continuing operations
before income taxes 145,413 98,271Income per common share from continuing
operations—basic $ 2.12 $ 1.83Net income per common share—basic $ 1.99 $ 1.90Income per common share from continuing
operations—diluted $ 2.02 $ 1.71
Net income per common share—diluted $ 1.90 $ 1.78
The following combined unaudited pro forma consolidated results of
operations for the year ended December 31, 2002 give effect to the
acquisition of BRS as if it occurred at the beginning of the period
presented below. The results are not necessarily indicative of what
would have occurred had this transaction been consummated on
that date.
Pro forma financial information for 2002 acquisition 2002Revenues $333,134Income from continuing operations 45,533Income per common share from
continuing operations—basic $ 1.31Net income per common share—basic $ 1.38Income per common share from
continuing operations—diluted $ 1.24
Net income per common share—diluted $ 1.30
3. Discontinued Operations
In July 2002, we committed to a plan to sell our applied sciences
practice, consisting of the LWG asset disposal group and the SEA
asset disposal group. We recorded an after-tax loss of $891,000 as of
December 31, 2002 to present the LWG asset disposal group at its
fair value less cost to sell.
In January 2003, we sold the LWG asset disposal group for total
consideration of $4.15 million, consisting of cash of $2.15 million and
a note in the amount of $2.0 million. During 2003, we recognized an
additional after-tax loss of $0.2 million. The promissory note bears

annual interest at 9.75% and matures December 31, 2010. Interest is
payable monthly in arrears beginning February 28, 2003. Principal
amounts are payable in forty-eight equal monthly installments
beginning on January 31, 2007. This unsecured note is subordinated
in payment to the issuer’s senior bank debt. We have classified the
note within other assets in our consolidated balance sheet.
In August 2003, we completed the sale of the SEA asset disposal
group to SEA’s senior management for total consideration of $16.0
million. The total consideration included $10.0 million in cash and a
promissory note from the buyer in the amount of $6.0 million. We
recognized an after-tax loss of $6.8 million in 2003 related to the sale
of SEA. Under its original terms, the promissory note accrued annual
interest at 9.0% and matured in August 2010. In December 2004, we
agreed to discount the note by $475,000 in exchange for prepayment
of the principal amount of the note. We classified this discount
within other income (expense) in our consolidated statement of
income. In January 2005, we received a $5.5 million cash payment in
full satisfaction of the note.
Because we eliminated the operations and cash flows of the business
components comprising the applied sciences practice from our
ongoing operations as a result of the disposal transactions, and
because we do not have any significant continuing involvement in
the operations after the disposal transactions, we have presented
the results of the applied sciences practice’s operations as a
discontinued operation for all periods prior to the sale. Summarized
operating results of the applied sciences practice are as follows.
Year Ended December 31,
2003 2002Revenues $24,011 $45,833Income before income taxes 2,805 5,343
Net income 1,649 3,145
4. Balance Sheet DetailsDecember 31,
2004 2003Notes receivable
Note receivable from owners of former subsidiary $ 5,525 $ —
Notes receivable from employees, current portion 3,506 109
$ 9,031 $ 109Property and equipment
Furniture, equipment and software $38,426 $33,425Leasehold improvements 8,962 6,424Construction in progress 1,425 1,164
48,813 41,013Accumulated depreciation
and amortization (25,471) (19,092)$23,342 $21,921
Other assetsNote receivable from owners
of former subsidiary $ 2,000 $ 8,000Debt financing fees 4,121 5,519Deferred income taxes 2,925 675Notes receivable from employees 5,547 —Other non-current assets 1,387 566
$15,980 $14,760Accounts payable, accrued expenses and other
Accounts payable $ 7,203 $ 5,733Accrued expenses 8,118 7,513Income taxes payable 3,440 4,420Current portion of capital lease obligations 237 583Deferred income taxes 1,773 620
$20,771 $18,869
Notes receivable due from employees include signing bonuses
granted in the form of non-interest bearing forgivable loans to
attract and retain highly-skilled professionals. These notes are being
amortized to expense over their forgiveness periods of one to five
years. Professionals who terminate their employment with us prior
to the end of the forgiveness period are required to repay the
outstanding, unforgiven loan balance.
43
•FTI Consulting, Inc. • Annual Report 2004

44
• FTI Consulting, Inc. • Annual Report 2004
Notes to Consolidated Financial Statements
December 31, 2004 December 31, 2003
Gross GrossUseful Life Carrying Accumulated Carrying Accumulated
in Years Amount Amortization Amount AmortizationAmortized intangible assets
Contracts, backlog 1.5 $ 491 $ 395 $12,700 $4,247Customer relationships 6 to 8 8,300 1,412 — —Non-compete agreement 3 2,196 982 1,790 306Intellectual property 3 360 280 360 160
11,347 3,069 14,850 4,713
Unamortized intangible assetsTradename Indefinite 2,700 — — —
$14,047 $3,069 $14,850 $4,713
5. Goodwill and Other Intangible Assets
Due to the resignation of a number of our professional staff, we
performed an interim impairment test of our goodwill in February
2004. No impairment of goodwill was identified as a result of our
test. No impairment of goodwill was identified as a result of our
annual impairment test, which we conducted as of October 1, 2004.
Other intangible assets with finite lives are amortized over their
estimated useful lives. The changes in the carrying amount of
goodwill by reportable segment are as follows.
Forensic andLitigation CorporateConsulting Finance/ Discontinued
and Technology Restructuring Economics Operations Consolidated
Balance, December 31, 2002 $ 21,035 $ 267,015 $ 11,191 $13,214 $ 312,455Goodwill acquired during the year 98,698 — 117,939 — 216,637Adjustment to allocation of
BRS purchase price — (1,334) — — (1,334)Goodwill disposed of during the year — — — (6,441) (6,441)Impairment of SEA asset
disposal group — — — (6,773) (6,773)Balance, December 31, 2003 119,733 265,681 129,130 — 514,544Goodwill acquired during the year 731 — 214 — 945Adjustment to allocation of purchase price (1,399) (794) (5,640) — (7,833)
Balance, December 31, 2004 $119,065 $264,887 $123,704 $ — $507,656
As discussed in Note 2. “Acquisitions,” in 2002, we acquired the
domestic Business Recovery Services, or BRS, division of
PricewaterhouseCoopers, LLP. As discussed in Note 3. “Discontinued
Operations,” we sold our applied sciences practice during 2003.
During 2003, we recorded a $6.8 million impairment loss to reflect
the estimated fair value of the net assets of the SEA asset disposal
group less the estimated costs to sell.
For intangible assets with finite lives, we recorded amortization
expense of $6.8 million in 2004, $3.7 million in 2003 and $1.0 million
in 2002. Based solely on the amortizable intangible assets recorded
as of December 31, 2004, we estimate amortization expense to be
$2.0 million in 2005, $1.7 million in 2006, $1.5 million in 2007, $1.3
million in 2008, $1.2 million in 2009 and $0.6 million thereafter.
Actual amortization expense to be reported in future periods could
differ from these estimates as a result of new intangible asset
acquisitions, changes in useful lives or other relevant factors.
6. Fair Value of Financial Instruments
We have determined the estimated fair values of financial
instruments using available market information and appropriate
valuation methodologies. However, considerable judgment is
required in interpreting market data to develop fair value estimates.
As a result, the estimates presented below are not necessarily
indicative of the amounts that we could realize or be required to
pay in a current market exchange.
Cash and cash equivalents, accounts and notesreceivable, accounts payable and accrued expensesThe carrying amounts of these items are reasonable estimates of
their fair values.

DebtThe fair value of long-term debt approximates its carrying value at
December 31, 2004 and 2003, based on an assessment of currently
available terms for similar arrangements.
Interest rate swap agreementsThe carrying amount of our interest rate swap agreement in effect
as of December 31, 2003 is fair value. The fair value of our interest
rate swap agreement is based on estimates obtained from bankers to
settle the agreements. The interest rate swap agreement in effect as
of December 31, 2003 expired in January 2004.
Letters of creditWe use letters of credit to back some lease guarantees. Outstanding
letters of credit totaled $10.0 million at December 31, 2004 and $2.0
million at December 31, 2003. The letters of credit reflect fair value
as a condition of their underlying purpose and are subject to fees
competitively determined in the market place.
7. Long-Term Debt and Capital Lease Obligations
December 31,
2004 2003Bank credit facility
Term loans, interest payable monthly or quarterly (3.7% to 4.0% — 2004; 3.1% to 3.2% —2003) $105,000 $121,250
Revolving loan commitment of $100.0 million — —Total long-term debt 105,000 121,250Less current portion 21,250 16,250Long-term debt, net of current portion $ 83,750 $105,000Total capital lease obligations $ 345 $ 949Less current portion 237 583
Capital lease obligations, net of current portion $ 108 $ 366
Bank credit facilityOur bank credit facility provides for up to $225.0 million of secured
financing, consisting of a $100.0 million revolving credit facility and
$125.0 million in term loans. Principal payments on the term loans
began on December 31, 2003, and are payable quarterly thereafter
through September 30, 2008. The maturity date of the $100.0 million
revolving credit facility is November 28, 2008. However, we may
choose to repay outstanding borrowings under the revolving credit
facility at any time before maturity without penalty. Debt under the
credit facility bears interest at an annual rate equal to the
Eurodollar rate, plus an applicable margin or an alternative base
rate defined as the higher of (1) the lender’s announced U.S. prime
rate or (2) the federal funds rate plus the sum of 50 basis points and
an applicable margin. In addition, we are required to pay
commitment fees on the unused portion of our revolving credit
facility. Under our bank credit facility, the lenders have a security
interest in substantially all of our assets.
The bank credit facility contains covenants which limit our ability to
incur additional indebtedness; create liens; pay dividends on, make
distributions or repurchases of our capital stock or make specified
other restricted payments; consolidate, merge or sell all or
substantially all of our assets; guarantee obligations of other
entities; enter into hedging agreements; enter into transactions with
affiliates or related persons or engage in any business other than the
consulting business. The credit facility requires compliance with
financial ratios, including total indebtedness to earnings before
interest, taxes, depreciation and amortization, or EBITDA; EBITDA to
specified charges and the maintenance of a minimum net worth,
each as defined under the amended credit facility. As of December
31, 2004, we were in compliance with all covenants as stipulated in
the credit facility agreements.
GuaranteesCurrently, we do not have any significant debt guarantees related to
entities outside of the consolidated group. As of December 31, 2004,
substantially all of our subsidiaries are guarantors of borrowings
under our bank credit facility in the amount of $105.0 million.
Interest rate swapsWe have previously entered into interest rate swap transactions on
a portion of our outstanding term loans. At December 31, 2003, the
notional amount of our outstanding interest rate swap agreement
was $8.7 million. The interest rate swap resulted in exchanging
floating London interbank offered rate, or LIBOR, for a fixed rate of
6.65%, and expired in January 2004. We recognize changes in the
fair value of interest rate swaps in the consolidated financial
statements as changes in accumulated other comprehensive income
(loss). During 2003, we did not recognize a net gain (loss) related to
the interest rate swap transactions as there was no ineffective
portion of the cash flow hedge nor was there any portion of the
hedged instrument excluded from the assessment of hedge
effectiveness.
Early extinguishment of debtDuring 2003, we utilized $12.15 million of cash proceeds from the
sale of our applied sciences practice and $49.8 million from the
public offering of our common stock to repay outstanding term
loans under our bank credit facility prior to maturity. As a result of
these repayments, we wrote-off $768,000 of unamortized debt
financing fees to interest expense.
Future maturities of long-term debt and capital lease obligationsFor years subsequent to December 31, 2004, scheduled annual
maturities of long-term debt and capital lease obligations
outstanding as of December 31, 2004 are as follows.
45
•FTI Consulting, Inc. • Annual Report 2004

46
• FTI Consulting, Inc. • Annual Report 2004
Notes to Consolidated Financial Statements
CapitalLong-Term Lease
Debt Obligations Total2005 $ 21,250 $254 $ 21,5042006 26,250 89 26,3392007 31,250 16 31,2662008 26,250 3 26,253
105,000 362 105,362Less imputed interest — 17 17
$105,000 $345 $105,345
8. Commitments and Contingencies
Operating lease commitmentsWe lease office space and office equipment under non-cancelable
operating lease agreements that expire in various years through
2021. The leases normally provide for the payment of minimum
annual rentals and some include provisions for renewal options of
up to 5 years. Some of our leases for office space contain provisions
whereby the future rental payments may be adjusted for increases
in operating expenses above specified amounts.
We entered into a new lease agreement for office space in New York
City. The lease commenced in July 2004 and expires in November
2021. In accordance with the lease terms, we received a cash
inducement of $8.1 million which we have classified as deferred rent
in our balance sheet. We are amortizing the cash inducement over
the life of the lease as a reduction to the cash rent expense.
Rental expense included in continuing operations was $12.5 million
during 2004, $9.5 million during 2003 and $7.7 million during 2002. For
years subsequent to December 31, 2004, future minimum payments
for all operating lease obligations that have initial non-cancelable
lease terms exceeding one year, net of rental income of $0.2 million in
2005, $0.2 million in 2006 and $0.1 million in 2007, are as follows.
2005 $ 12,7662006 13,4882007 13,0852008 12,2812009 12,252Thereafter 90,473
$154,345
Loss on abandoned facilitiesDuring the fourth quarter of 2004, we consolidated our New York
City and one of our Saddle Brook, New Jersey offices and relocated
our employees into our new office facility. As a result of this
decision, we vacated leased office facilities prior to the lease
termination dates. We recorded a loss of $4.7 million within our
corporate segment related to the abandoned facilities during the
fourth quarter of 2004. This charge includes $0.7 million of asset
impairments and $4.0 million representing the present value of the
future lease payments related to the facilities we vacated net of
estimated sublease income of $4.2 million. We calculated the present
value of our future lease payments using a discount rate of 8%.
During the fourth quarter of 2004, we paid about $0.3 million
against the lease loss liability. As of December 31, 2004, the balance
of the liability for loss on abandoned facilities was $3.7 million.
ContingenciesWe are subject to legal actions arising in the ordinary course of
business. In management’s opinion, we believe we have adequate legal
defenses and/or insurance coverage with respect to the eventuality of
such actions. We do not believe any settlement or judgment would
materially affect our financial position or results of operations.
Litigation settlement gains (losses), net During the fourth quarter of 2004, we reached settlement on
various lawsuits. As a result, we recorded net gains of $1.7 million,
net of legal costs.
9. Income Taxes
Significant components of deferred tax assets and liabilities are as
follows.
December 31,
2004 2003Deferred tax assets
Allowance for doubtful accounts $ 2,109 $ 4,178Accrued vacation and bonus 1,767 620Deferred rent 2,925 —Loss on abandoned facilities 1,910 —Restricted stock 501 —Depreciation — 675
9,212 5,473Deferred tax liabilities
Goodwill amortization 25,250 13,347Prepaid expenses 1,001 569Installment sale of subsidiaries 643 —Capitalized software and depreciation 298 512Other 129 509
27,321 14,937
Net deferred tax liability $18,109 $(9,464)
The components of the income tax provision from continuing
operations are as follows.
Year Ended December 31,
2004 2003 2002Current
Federal $16,007 $34,024 $17,219State 5,755 5,736 3,529
21,762 39,760 20,748Deferred
Federal 8,260 4,345 2,533State 1,155 733 423
9,415 5,078 2,956
Income tax provision $31,177 $44,838 $23,704

47
•FTI Consulting, Inc. • Annual Report 2004
Our income tax provision from continuing operations resulted in
effective tax rates that varied from the statutory federal income tax
rate as follows.
Year Ended December 31,
2004 2003 2002Federal income tax provision
at statutory rate $25,919 $38,369 $20,514State income taxes, net of
federal benefit 4,273 6,379 3,104Expenses not deductible for
tax purposes 985 90 82Other — — 4
$31,177 $44,838 $23,704
10. Stockholders’ Equity
Common stockHolders of our common stock are entitled to one vote per share on all
matters submitted for action by the stockholders and share equally,
share for share, if dividends are declared on the common stock. In the
event of any liquidation, dissolution or winding up of our company
or upon the distribution of our assets, all assets and funds remaining
after payment in full of our debts and liabilities, and after the
payment of all liquidation preferences, if any, applicable to any
outstanding preferred stock, would be divided and distributed among
the holders of our common stock ratably. There are no redemption or
sinking fund requirements applicable to shares of our common stock.
Equity offeringIn February 2003, we completed a public offering and sale of
3,992,392 shares of our common stock. We received $99.2 million in
cash, net of $1.4 million of offering costs.
Common stock repurchase programIn October 2003, our board of directors approved a share
repurchase program under which we may purchase, from time to
time, up to $50.0 million of common stock. We are authorized to
purchase shares of our common stock under this program through
October 2005. The shares of common stock may be purchased
through open market or privately negotiated transactions and may
be funded with a combination of cash on hand or borrowings under
our existing or new credit facilities. During 2004, we repurchased
and retired 657,300 shares at a total cost of $10.8 million. During
2003, we repurchased and retired 194,200 shares at a total cost of
$4.0 million.
11. Equity Compensation and EmployeeBenefit Plans
Equity Compensation PlansOur 1997 Stock Option Plan provides for the issuance of up to
11,587,500 shares of common stock to employees and non-employee
directors. Under the terms of the 1997 plan, we may grant option
rights or shares of restricted and unrestricted common stock to
employees. As of December 31, 2004, 370,234 shares of common
stock are available for grant under our 1997 Stock Option Plan.
On May 19, 2004, our stockholders approved the FTI Consulting,
Inc. 2004 Long-Term Incentive Plan. The 2004 plan provides for
grants of option rights, appreciation rights, restricted or
unrestricted shares, performance awards or other stock-based
awards to our officers, employees, non-employee directors and
individual service providers. We are authorized to issue up to
3,000,000 shares of common stock under the 2004 plan. As of
December 31, 2004, 2,250,628 shares of common stock are available
for grant under our 2004 Long-Term Incentive Plan.
Vesting provisions for individual awards under our stock option
plans are at the discretion of our board of directors. Generally,
outstanding options have been granted at prices equal to or
exceeding the market value of the stock on the grant date, vest
over three to five years, and expire ten years subsequent to award.
During 2004, we granted 262,372 shares of restricted common stock
to employees at a weighted-average fair value of $18.60. During
2003, we granted 284,640 shares of restricted common stock to
employees at a weighted-average fair value of $20.53. During 2002,
we granted 6,135 shares of restricted common stock to employees
at a weighted-average fair value of $23.39. Restricted shares are
generally contingent on continued employment and vest over
periods of three to ten years.
The following table summarizes the option activity under the plans
for the years December 31, 2004, 2003 and 2002.
Weighted Weighted Weighted Average Average AverageExercise Exercise Exercise
2004 Price 2003 Price 2002 PriceOptions outstanding, January 1 4,330 $18.54 5,807 $14.72 4,758 $ 5.39Options granted during period:
Grant price = fair market value 965 $17.46 383 $22.53 2,870 $23.03Grant price > fair market value 90 $18.78 90 $26.45 — —
Options exercised (467) $ 6.37 (1,798) $ 7.17 (1,815) $ 3.32Options forfeited (510) $22.27 (152) $21.39 (6) $ 4.23Options outstanding, December 31 4,408 $19.17 4,330 $18.54 5,807 $14.72
Options exercisable, December 31 2,597 $18.35 1,873 $16.74 1,585 $ 9.29

48
• FTI Consulting, Inc. • Annual Report 2004
Notes to Consolidated Financial Statements
Employee Stock Purchase PlanThe FTI Consulting, Inc. Employee Stock Purchase Plan allows
eligible employees to subscribe to purchase shares of common stock
through payroll deductions of up to 15% of eligible compensation,
subject to limitations. The purchase price is the lower of 85% of the
fair market value of our common stock on the first trading day or
the last trading day of each semi-annual offering period. The
aggregate number of shares purchased by an employee may not
exceed $25,000 of fair market value annually, subject to limitations
imposed by Section 423 of the Internal Revenue Code. A total of
2,050,000 shares are authorized for purchase under the plan. As of
December 31, 2004, 580,125 shares of our common stock are
available for purchase under the plan. Employees purchased shares
under this plan during the following years at the weighted average
prices per share as indicated: 2004—202,396 shares at $14.03; 2003—
195,700 shares at $20.66; and 2002—159,254 shares at $15.18.
Employee Benefit PlansWe maintain a qualified defined contribution 401(k) plan, which covers
substantially all of our employees. Under the plan, participants are
entitled to make pre-tax contributions up to the annual maximums
established by the Internal Revenue Service. We match a certain
percentage of participant contributions pursuant to the terms of
the plan, which are limited to a percent of the participant’s eligible
compensation. The percentage match is at the discretion of our board
of directors. We made contributions related to the plan of $3.0 million
during 2004, $2.4 million during 2003 and $1.6 million during 2002.
12. Segment Reporting
We are a multi-disciplined consulting firm with leading practices in the
areas of forensic accounting and litigation, corporate
finance/restructuring and economic consulting services. Prior to
September 1, 2002, we were organized into three operating segments:
corporate finance/restructuring consulting, forensic and litigation
consulting and technology and applied sciences. As a result of the
acquisition of the domestic Business Recovery Services division of
PricewaterhouseCoopers, LLP in August 2002 (see Note 2.
“Acquisitions”) and the decision to sell the applied sciences practice
(see Note 3. “Discontinued Operations”), we began managing our
operations as one segment. During the fourth quarter of 2003, we
completed three acquisition transactions. As part of the integration of
the acquired businesses, we reorganized our operations into three
operating segments. During the first quarter of 2004, we completed the
reorganization and appointed a manager for each operating segment.
Our reportable operating segments are business units that offer
distinct services. Within our forensic and litigation consulting and
technology practice, we help clients assess complex financial
transactions and reconstruct events from incomplete and/or
corrupt data, uncover vital evidence, identify potential claims and
assist in the pursuit of economic recoveries. We also provide asset
tracing investigative services and expert witness services. Our
litigation practice serves clients in all phases of litigation, including
pre-filing, discovery, jury selection, trial preparation, expert
testimony and the actual trial. We assist with refining issues in
litigation and venue selection, and provide fraud investigation and
securities litigation assistance. Our trial graphics and technology and
electronic evidence experts assist clients in preparing for and
presenting their cases in court.
Our corporate finance/restructuring practice provides turnaround,
performance improvement, lending solutions, financial and
operational restructuring, restructuring advisory, mergers and
acquisitions and interim management services. We assist under
performing companies in making decisions to improve their financial
and operational position given their current situation. We analyze,
recommend and implement strategic alternatives for our corporate
finance/restructuring clients, such as rightsizing infrastructure,
improving working capital management, selling non-core assets or
business units, restructuring capital and borrowings, and assessing
long-term viability and business strategy. We also lead and manage
the financial aspects of the in-court restructuring process, such as
assessing the impact of a bankruptcy filing on the client’s financial
Options Outstanding Options Exercisable
Weighted Weighted WeightedAverage Average AverageExercise Remaining Exercise
Exercise Price Range Shares Price Contractual Life Shares Price$ 1.90–$12.36 911 $ 9.15 5.9 years 911 $ 9.15$14.14–$18.60 912 $16.72 8.9 years 162 $17.36$19.24–$21.65 1,043 $20.92 8.3 years 519 $21.07$21.97–$24.28 975 $23.92 7.9 years 577 $24.04$25.67–$33.25 567 $27.79 7.9 years 428 $27.34
4,408 $19.17 2,597 $18.35
The following is a summary of the status of stock options
outstanding and exercisable stock options at December 31, 2004.

and operational situation, planning for the smooth transition in and
out of bankruptcy, facilitating the sale of assets and assisting to
arrange debtor-in-possession financing. Through our corporate
finance services, we can help financially distressed companies
implement their plans by providing interim management teams.
Within our economic consulting practice, we provide our clients with
analyses of complex economic issues for use in legal and regulatory
proceedings, strategic decision-making and public policy debates.
Our services include providing advice and testimony related to:
• antitrust and competition issues that arise in the context of
potential mergers and acquisitions;
• other antitrust issues, including alleged price fixing, cartels and
other forms of exclusionary behavior;
• the application of modern finance theory to issues arising in
securities litigation; and
• public policy studies on behalf of companies, trade associations
and governmental agencies.
We evaluate the performance of these operating segments based on
operating income before depreciation, amortization and corporate
general and administrative expenses. For the year ended December
31, 2004, our corporate segment loss includes a $4.7 million loss on
abandoned facilities as described in note 8. In general, our assets are
not specifically attributable to any particular segment; therefore, we
do not allocate assets to our reportable segments. Accordingly, asset
information by reportable segment is not presented. The reportable
segments use the same accounting policies as those used by the
company. There are no significant intercompany sales or transfers.
Substantially all of our revenues and assets are attributed to or are
located in the United States. We do not have a single customer that
represents ten percent or more of our consolidated revenues.
In 2003, we did not operate our business practices as segments.
Accordingly, we did not report results of operations by segment.
The table below presents revenues, gross margin and segment
profits for the year ended December 31, 2004. For the years ended
December 31, 2003 and 2002, the table presents segment revenues
and gross margin that are estimates derived from classifying client
engagements by the principal nature of the service.
Forensic andLitigation Corporate
Consulting and Finance/ EconomicYear ended December 31, 2004 Technology Restructuring Consulting Corporate TotalRevenues $178,650 $162,495 $85,860 $ — $427,005Gross margin 83,177 77,618 31,240 — 192,035Segment profit (loss) 50,556 50,714 19,333 (26,185) 94,418
Year ended December 31, 2003Revenues $103,101 $255,336 $17,258 $ — $375,695Gross margin 45,845 146,510 6,911 — 199,266Segment profit (loss) N/A N/A N/A (18,720) 123,537
Year ended December 31, 2002Revenues $67,994 $143,986 $12,133 $ — $224,113Gross margin 34,630 79,266 2,113 — 116,009
Segment profit (loss) N/A N/A N/A (15,213) 68,662
N/A - Not available
The following table presents a reconciliation of segment profit to
income from continuing operations before income taxes.
Year Ended December 31,
2004 2003 2002Operating profit
Total segment profit $94,418 $123,537 $68,662Depreciation and amortization (9,113) (6,032) (4,300)Amortization of other
intangible assets (6,836) (3,680) (1,033)Interest expense, net (6,086) (4,196) (4,717)Litigation settlement
gains (losses), net 1,672 — —
Income from continuing operations before income tax provision $74,055 $109,629 $58,612
49
•FTI Consulting, Inc. • Annual Report 2004

50
• FTI Consulting, Inc. • Annual Report 2004
Notes to Consolidated Financial Statements
13. Quarterly Financial Data (unaudited)(dollar and share amounts in tables expressed in thousands, except per share data) Quarter ended
March 31, June 30, September 30, December 31,2004Revenues $110,240 $107,445 $104,433 $104,887Direct cost of revenues 61,898 58,357 56,739 57,976Other operating expenses 27,447 26,047 27,074 32,998Operating income 20,895 23,041 20,620 13,913Interest expense,net (1,407) (1,396) (1,375) (1,908)Litigation settlement gains (losses),net — — — 1,672Income from continuing operations before income taxprovision 19,488 21,645 19,245 13,677Income tax provision 7,971 8,852 8,294 6,060Net income $ 11,517 $ 12,793 $ 10,951 $ 7,617Earnings per common share —basicNet income $ 0.27 $ 0.30 $ 0.26 $ 0.18Earnings per common share —dilutedNet income $ 0.27 $ 0.30 $ 0.26 $ 0.18Weighted average common shares outstandingBasic 42,097 42,172 42,134 41,994Diluted 42,605 42,517 42,479 42,450
2003Revenues $101,351 $ 94,526 $ 83,593 $ 96,225Direct cost of revenues 46,547 43,096 37,409 49,377Other operating expenses 21,931 19,540 19,919 24,051Operating income 32,873 31,890 26,265 22,797Interest expense,net 1,830 741 845 780Income from continuing operations before income taxprovision 31,043 31,149 25,420 22,017Income tax provision 12,575 12,615 10,295 9,353Income from continuing operations 18,468 18,534 15,125 12,664Income (loss)from discontinued operations 975 (6,334) 37 —Net income $ 19,443 $ 12,200 $ 15,162 $ 12,664Earnings per common share —basicIncome from continuing operations $ 0.48 $ 0.45 $ 0.36 $ 0.30Net income $ 0.51 $ 0.30 $ 0.36 $ 0.30Earnings per common share —dilutedIncome from continuing operations $ 0.46 $ 0.44 $ 0.36 $ 0.30Net income $ 0.49 $ 0.29 $ 0.36 $ 0.30Weighted average common shares outstandingBasic 38,652 41,343 41,764 41,893
Diluted 40,338 42,524 42,585 42,627

51
•FTI Consulting, Inc. • Annual Report 2004
The sum of the quarterly earnings per share amounts may not equal
the annual amounts due to changes in the weighted-average number
of common shares outstanding during each quarterly period.
Special termination charges. Operating expenses during the fourth quarter of 2003 include $3.1
million of special termination charges. These charges relate to
contractual benefits due to specified employees as a result of the
termination of their employment.
Interest expense, net. In December 2004, we agreed to discount a note receivable due
from the owners of one of our former subsidiaries. We discounted
this note by $475,000 in exchange for payment of the note ahead of
its maturity in 2010. We received this prepayment in January 2005.
See Note 3. “Discontinued Operations,” for more details.
Interest expense, net for 2003, includes write-offs of deferred
financing fees as a result of early extinguishments. These amounts
total $513,000 during the first quarter of 2003 and $255,000 during
the third quarter of 2003.
Other.During the fourth quarter of 2004, we recorded a $4.7 million loss
on abandoned facilities and net litigation settlement gains of $1.7
million, each of which is described in more detail in Note 8.
"Commitments and Contingencies." We also recorded additional
amortization expense of $1.6 million during the fourth quarter of
2004 as more fully described in Note 2, “Acquisitions - Purchase
price allocation.”
14. Subsequent Events
On February 28, 2005, we acquired substantially all of the assets and
assumed certain liabilities of the Ringtail group. Ringtail is a leading
global developer of litigation support and knowledge management
technologies for law firms. The assets we acquired include software
products and technologies and intellectual property. Ringtail has
developed a suite of integrated software modules to manage the
information and workflow in complex legal cases. We paid $35.0
million for the acquisition, consisting of $20.0 million paid in cash
and 784,109 shares of our common stock valued at $15.0 million.
The fair market value of the common stock is based on the average
market price of the shares over a period from two days before and
two days after the date we entered into a definitive purchase
agreement. We financed the cash portion of the purchase price with
cash on hand and borrowings under our revolving credit facility. We
may be required to pay the sellers additional annual consideration
based upon post-acquisition revenues for the each of the years from
2005 through 2007. This earnout consideration may be up to $2.5
million per year and may be paid in cash, shares of our common
stock or a combination of both. We granted the sellers contractual
protection against a decline in the value of any purchase price or
earnout payment made in shares of our common stock. If on the
first anniversary date of any issuance of purchase price or earnout
shares, the market price of our common stock has not increased by
at least 10%, we have agreed to make an additional cash payment
to the sellers equal to the deficiency.

Report of Independent Registered Public Accounting Firm — Consolidated Financial Statements
52
• FTI Consulting, Inc. • Annual Report 2004
Board of Directors and StockholdersFTI Consulting, Inc.
We have audited the accompanying consolidated balance sheets of
FTI Consulting, Inc. and subsidiaries as of December 31, 2004 and
2003, and the related consolidated statements of income,
stockholders’ equity and cash flows for each of the three years in
the period ended December 31, 2004. These financial statements are
the responsibility of the Company’s management. Our responsibility
is to express an opinion on these financial statements based on our
audits.
We conducted our audits in accordance with the standards of the
Public Company Accounting Oversight Board (United States).
Those standards require that we plan and perform the audit to
obtain reasonable assurance about whether the financial
statements are free of material misstatement. An audit includes
examining, on a test basis, evidence supporting the amounts and
disclosures in the financial statements. An audit also includes
assessing the accounting principles used and significant estimates
made by management, as well as evaluating the overall financial
statement presentation. We believe that our audits provide a
reasonable basis for our opinion.
In our opinion, the financial statements referred to above present
fairly, in all material respects, the consolidated financial position of
FTI Consulting, Inc. and subsidiaries at December 31, 2004 and
2003, and the consolidated results of their operations and their
cash flows for each of the three years in the period ended
December 31, 2004, in conformity with U.S. generally accepted
accounting principles.
We also have audited in accordance with the standards of the
Public Company Accounting Oversight Board (United States), the
effectiveness of FTI Consulting, Inc. and subsidiaries’ internal control
over financial reporting as of December 31, 2004, based on criteria
established in Internal Control-Integrated Framework issued by the
Committee of Sponsoring Organizations of the Treadway
Commission and our report dated March 9, 2005 expressed an
unqualified opinion thereon.
Baltimore, Maryland
March 9, 2005

Report of Independent Registered Public Accounting Firm — Internal Control over Financial Reporting
53
•
Board of Directors and StockholdersFTI Consulting, Inc.
We have audited management’s assessment, included in the
accompanying Management’s Report on Internal Control over
Financial Reporting, that FTI Consulting, Inc. maintained effective
internal control over financial reporting as of December 31, 2004,
based on criteria established in Internal Control—Integrated
Framework issued by the Committee of Sponsoring Organizations of
the Treadway Commission (the COSO criteria). FTI Consulting, Inc.’s
management is responsible for maintaining effective internal control
over financial reporting and for its assessment of the effectiveness of
internal control over financial reporting. Our responsibility is to
express an opinion on management’s assessment and an opinion on
the effectiveness of the Company’s internal control over financial
reporting based on our audit.
We conducted our audit in accordance with the standards of the
Public Company Accounting Oversight Board (United States). Those
standards require that we plan and perform the audit to obtain
reasonable assurance about whether effective internal control over
financial reporting was maintained in all material respects. Our
audit included obtaining an understanding of internal control over
financial reporting, evaluating management’s assessment, testing
and evaluating the design and operating effectiveness of internal
control, and performing such other procedures as we considered
necessary in the circumstances. We believe that our audit provides a
reasonable basis for our opinion.
A company’s internal control over financial reporting is a process
designed to provide reasonable assurance regarding the reliability of
financial reporting and the preparation of financial statements for
external purposes in accordance with generally accepted
accounting principles. A company’s internal control over financial
reporting includes those policies and procedures that (1) pertain to
the maintenance of records that, in reasonable detail, accurately
and fairly reflect the transactions and dispositions of the assets of
the company; (2) provide reasonable assurance that transactions are
recorded as necessary to permit preparation of financial statements
in accordance with generally accepted accounting principles, and
that receipts and expenditures of the company are being made only
in accordance with authorizations of management and directors of
the company; and (3) provide reasonable assurance regarding
prevention or timely detection of unauthorized acquisition, use, or
disposition of the company’s assets that could have a material effect
on the financial statements.
Because of its inherent limitations, internal control over financial
reporting may not prevent or detect misstatements. Also,
projections of any evaluation of effectiveness to future periods are
subject to the risk that controls may become inadequate because of
changes in conditions, or that the degree of compliance with the
policies or procedures may deteriorate.
In our opinion, management’s assessment that FTI Consulting, Inc.
maintained effective internal control over financial reporting as of
December 31, 2004, is fairly stated, in all material respects, based on
the COSO criteria. Also, in our opinion, FTI Consulting, Inc.
maintained, in all material respects, effective internal control over
financial reporting as of December 31, 2004, based on the COSO
criteria.
We also have audited, in accordance with the standards of the
Public Company Accounting Oversight Board (United States), the
consolidated balance sheets of FTI Consulting, Inc. and subsidiaries
as of December 31, 2004 and 2003, and the related consolidated
statements of income, stockholders’ equity, and cash flows for each
of the three years in the period ended December 31, 2004 and our
report dated March 9, 2005 expressed an unqualified opinion
thereon.
Baltimore, Maryland
March 9, 2005
FTI Consulting, Inc. • Annual Report 2004

54
•
Our management is responsible for establishing and maintaining
adequate internal control over financial reporting and for
performing an assessment of the effectiveness of internal control
over financial reporting as of December 31, 2004. Internal control
over financial reporting is a process designed to provide reasonable
assurance regarding the reliability of financial reporting and the
preparation of financial statements for external purposes in
accordance with generally accepted accounting principles. Our
system of internal control over financial reporting includes those
policies and procedures that (i) pertain to the maintenance of
records that, in reasonable detail, accurately and fairly reflect the
transactions and dispositions of our assets; (ii) provide reasonable
assurance that transactions are recorded as necessary to permit
preparation of financial statements in accordance with generally
accepted accounting principles, and that our receipts and
expenditures are being made only in accordance with the
authorization of our management and directors; and (iii) provide
reasonable assurance regarding prevention or timely detection of
unauthorized acquisition, use, or disposition of our assets that could
have a material effect on the financial statements. Under the
supervision and with the participation of our management,
including our Chief Executive Officer and Chief Financial Officer, we
conducted an evaluation of the effectiveness of our internal control
over financial reporting as of December 31, 2004 based on the
framework in Internal Control—Integrated Framework issued by the
Committee of Sponsoring Organizations of the Treadway
Commission (COSO). Based on that evaluation, our management
concluded that our internal control over financial reporting was
effective as of December 31, 2004.
Ernst & Young LLP, the independent registered public accounting
firm that audited our financial statements, has issued an attestation
report on management’s assessment of internal controls, which is
included elsewhere in this annual report.
Date: March 9, 2005
Jack B. Dunn, IV
President and Chief Executive Officer
(principal executive officer)
Theodore I. Pincus
Executive Vice President and Chief Financial Officer
(principal financial officer)
Changes In and Disagreements withAccountants on Accounting and FinancialDisclosureNone.
Management’s Report on Internal Control over Financial Reporting
FTI Consulting, Inc. • Annual Report 2004
Market Price of and Dividends on Our Common Equity and RelatedStockholder Matters
Market InformationOur common stock trades on the New York Stock Exchange under
the symbol "FCN." The following table lists the high and low sale
prices per share for our common stock as reported on the New York
Stock Exchange for the periods indicated. The prices for periods in
2003 have been adjusted to give effect to the three-for-two stock
split that was paid as a stock dividend on June 4, 2003 to
stockholders of record on May 7, 2003.
Year Ended December 31,
2004 2003
High Low High LowQuarter EndedMarch 31 $24.14 $13.55 $30.93 $25.53June 30 17.49 14.56 32.45 22.60September 30 19.65 15.37 27.60 17.00
December 31 21.30 17.51 24.58 16.79
Number of Stockholders of RecordAs of February 25, 2005, the number of record holders of our
common stock was 162.
DividendsWe have not declared or paid any cash dividends on our common
stock to date and we do not anticipate paying any cash dividends on
our shares of common stock in the foreseeable future because we
intend to retain our earnings, if any, to finance the expansion of our
business, make acquisitions and for general corporate purposes. Our
credit facility restricts our ability to a certain extent to pay dividends.
Securities Authorized for Issuance underEquity Compensation Plans
The following table lists information regarding outstanding options
and shares reserved for future issuance under our equity
compensation plans as of December 31, 2004. None of the plans
have outstanding warrants or rights other than options, except for
Market for the Registrant’s Common Equity, Related Stockholder Matters and Issuer Purchases of Equity Securities
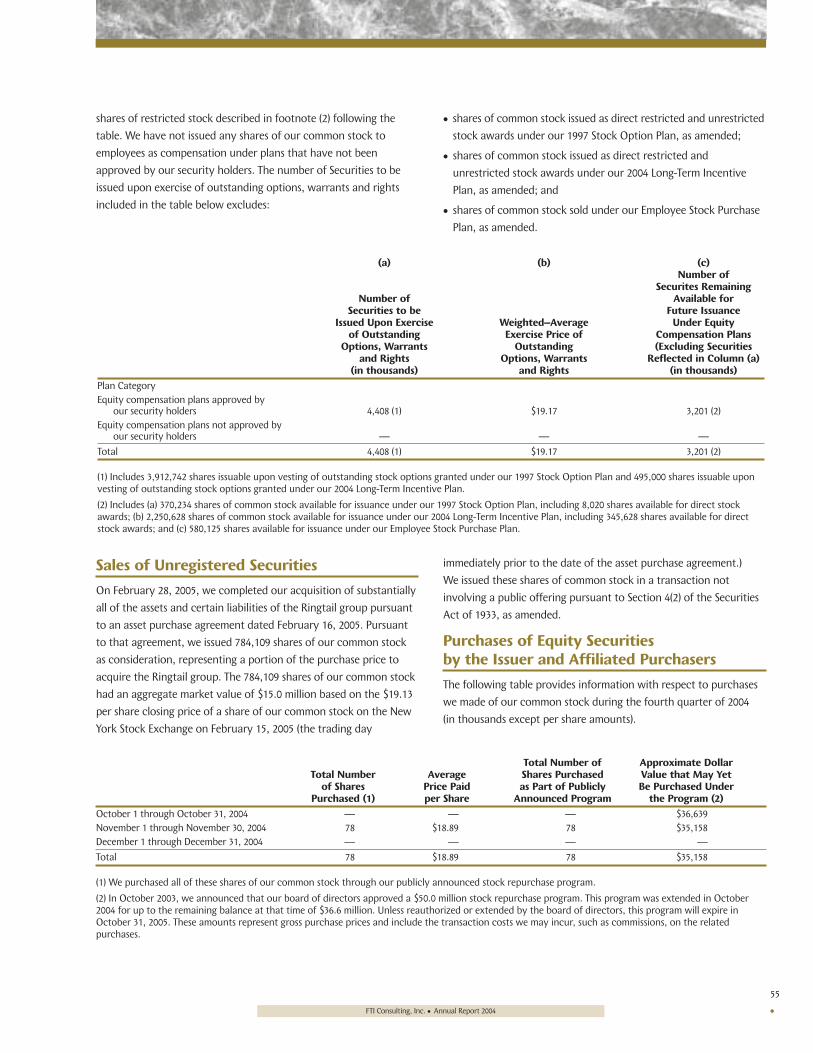
55
•FTI Consulting, Inc. • Annual Report 2004
Sales of Unregistered Securities
On February 28, 2005, we completed our acquisition of substantially
all of the assets and certain liabilities of the Ringtail group pursuant
to an asset purchase agreement dated February 16, 2005. Pursuant
to that agreement, we issued 784,109 shares of our common stock
as consideration, representing a portion of the purchase price to
acquire the Ringtail group. The 784,109 shares of our common stock
had an aggregate market value of $15.0 million based on the $19.13
per share closing price of a share of our common stock on the New
York Stock Exchange on February 15, 2005 (the trading day
immediately prior to the date of the asset purchase agreement.)
We issued these shares of common stock in a transaction not
involving a public offering pursuant to Section 4(2) of the Securities
Act of 1933, as amended.
Purchases of Equity Securities by the Issuer and Affiliated Purchasers
The following table provides information with respect to purchases
we made of our common stock during the fourth quarter of 2004
(in thousands except per share amounts).
Total Number of Approximate DollarTotal Number Average Shares Purchased Value that May Yet
of Shares Price Paid as Part of Publicly Be Purchased Under Purchased (1) per Share Announced Program the Program (2)
October 1 through October 31, 2004 — — — $36,639November 1 through November 30, 2004 78 $18.89 78 $35,158December 1 through December 31, 2004 — — — —
Total 78 $18.89 78 $35,158
(1) We purchased all of these shares of our common stock through our publicly announced stock repurchase program.
(2) In October 2003, we announced that our board of directors approved a $50.0 million stock repurchase program. This program was extended in October2004 for up to the remaining balance at that time of $36.6 million. Unless reauthorized or extended by the board of directors, this program will expire inOctober 31, 2005. These amounts represent gross purchase prices and include the transaction costs we may incur, such as commissions, on the relatedpurchases.
(a) (b) (c)Number of
Securites RemainingNumber of Available for
Securities to be Future IssuanceIssued Upon Exercise Weighted–Average Under Equity
of Outstanding Exercise Price of Compensation Plans Options, Warrants Outstanding (Excluding Securities
and Rights Options, Warrants Reflected in Column (a)(in thousands) and Rights (in thousands)
Plan CategoryEquity compensation plans approved by
our security holders 4,408 (1) $19.17 3,201 (2)Equity compensation plans not approved by
our security holders — — —
Total 4,408 (1) $19.17 3,201 (2)
(1) Includes 3,912,742 shares issuable upon vesting of outstanding stock options granted under our 1997 Stock Option Plan and 495,000 shares issuable uponvesting of outstanding stock options granted under our 2004 Long-Term Incentive Plan.
(2) Includes (a) 370,234 shares of common stock available for issuance under our 1997 Stock Option Plan, including 8,020 shares available for direct stockawards; (b) 2,250,628 shares of common stock available for issuance under our 2004 Long-Term Incentive Plan, including 345,628 shares available for directstock awards; and (c) 580,125 shares available for issuance under our Employee Stock Purchase Plan.
shares of restricted stock described in footnote (2) following the
table. We have not issued any shares of our common stock to
employees as compensation under plans that have not been
approved by our security holders. The number of Securities to be
issued upon exercise of outstanding options, warrants and rights
included in the table below excludes:
• shares of common stock issued as direct restricted and unrestricted
stock awards under our 1997 Stock Option Plan, as amended;
• shares of common stock issued as direct restricted and
unrestricted stock awards under our 2004 Long-Term Incentive
Plan, as amended; and
• shares of common stock sold under our Employee Stock Purchase
Plan, as amended.

Corporate Team
Jack B. Dunn, IV President and Chief Executive Officer
Dennis J. Shaughnessy Chairman of Board
Dominic DiNapoli Executive Vice President and Chief Operating Officer
Theodore I. Pincus Executive Vice President, Chief Financial Officer and Treasurer Barry Kaufman Executive Vice President and Chief Risk Management Officer
Curt A. H. Jeschke, Jr. Vice President - Internal Audit
Dianne R. Sagner Vice President and General Counsel
Charles Boryenace Vice President and Interim Controller
Joanne F. Catanese Associate General Counsel and Secretary
Cheryl J. Meeks Assistant Secretary
Board of Directors
Dennis J. Shaughnessy Chairman of Board
Jack B. Dunn, IV President and Chief Executive Officer
James A. Flick, Jr. President and Chief Executive Officer Winnow, Inc. Peter F. O’Malley Of Counsel O’Malley, Miles, Nylen & Gilmore George P. Stamas Senior Partner Kirkland & Ellis
Denis J. Callaghan Retired Former Director of North American Equity Research Deutsche Bank Alex. Brown
Mark H. Berey Executive Vice President of Business Development, Chief Financial Officer and Director Avendra, LLC
Gerard E. Holthaus Chairman of Board, President and Chief Executive Officer Williams Scotsman, Inc.
56

FTI Corporate Data
Stockholder InformationOur internet website is
www.fticonsulting.com.
We make available, free of
charge on our website, our
annual reports on Form 10-K,
quarterly reports on Form 10-Q,
current reports on Form 8-K and
amendments to those reports
and proxy statements as soon as
reasonably practicable after we
electronically file with or
furnish such materials to the
SEC. We also make available
on our website our Corporate
Governance Guidelines;
Categorical Standards of Director
Independence; Policy on Ethics
and Business Conduct; Charters
for the Audit, Compensation,
and Nominating and Corporate
Goverance Committees
of our Board of Directors;
other corporate governance
documents; and any amendments
to those documents.
You may request paper copies of
our 2004 Annual Report on Form
10-K and the other documents
filed with the SEC by contacting
FTI Consulting, Inc., 900 Bestgate
Road, Suite 100, Annapolis,
MD 21401, Attn: Corporate
Secretary.
Corporate Headquarters
900 Bestgate Road Suite 100 Annapolis, Maryland 21401 410.224.8770
www.fticonsulting.com
Annual Stockholders’ Meeting
The 2005 annual meeting of
stockholders will be held on
May 18, 2005, at 9:30 a.m. at the
corporate business office
at 909 Commerce Road,
Annapolis, Maryland 21401.
Independent AuditorsErnst & Young LLP
Baltimore, Maryland
Transfer AgentAmerican Stock Transfer
& Trust Company
New York, New York
StockFTI’s stock trades on the New
York Stock Exchange (NYSE)
under the symbol FCN.
SEC and NYSE Certifications The most recent certification
by our chief executive officer
and principal financial officer
pursuant to Section 302 of the
Sarbanes-Oxley Act of 2002 have
been filed as exhibits to our
Annual Report on Form 10-K for
our fiscal year ended December
31, 2004, filed with the Securities
and Exchange Commission on
March 15, 2005.
Our chief executive officer’s most
recent certification to
the New York Stock Exchange
was submitted on June 15, 2004.
Design: BenderPlus, New York
Offices
Annapolis, MD 410.224.8770
Atlanta, GA 404.460.6200
Boston, MA 617.897.1500
Cambridge, MA Lexecon 617.520.0200
Charlotte, NC 704.998.6021
Chicago, IL 312.759.8100
Chicago, IL Lexecon 312.322.0200
Cleveland, OH 216.986.2750
Dallas, TX 214.397.1600
Denver, CO 303.689.8800
Houston,TX 713.353.5400
Indianapolis, IN 317.581.6300
King of Prussia, PA 610.992.1600
Los Angeles, CA 213.689.1200
Nashville, TN 615.344.2109
New York, NY 212.247.1010
Philadelphia, PA 215.246.3405
Phoenix, AZ 602.744.7100
Pittsburgh, PA 412.577.2997
Saddle Brook, NJ 201.843.4900
Salt Lake City, UT 801.990.3294
San Francisco, CA 415.283.4200
San Jose, CA 408.261.8800
Seattle, WA 206.224.7607
Tucson, AZ 520.615.3500
Washington, D.C. 202.312.9100
London, England +44 (0)20.7643.2252
Melbourne, Australia +61 (3)9668.2233

900 Bestgate Road, Suite 100 Annapolis, Maryland 21401 www.fticonsulting.com


![[hal-00945905, v2] Crowd Sculpting: A space-time sculpting ...](https://static.fdocuments.us/doc/165x107/61d00833c69c8e549e339118/hal-00945905-v2-crowd-sculpting-a-space-time-sculpting-.jpg)