ANNUAL REPORT 2004-2005...This report describes research funded in collaboration with NOAA’s...
420
ANNUAL REPORT 2004-2005
Transcript of ANNUAL REPORT 2004-2005...This report describes research funded in collaboration with NOAA’s...

A N N U A L R E P O R T 2 0 0 4 - 2 0 0 5

CIRA ANNUAL REPORT FY 04/05 COOPERATIVE INSTITUTE FOR RESEARCH IN THE ATMOSPHERE

ii
CIRA ADVISORY BOARD Peter Dorhout, Colorado State University Interim Vice Provost for Graduate Education Hank Gardner, Colorado State University Interim Vice President for Research Al Powell, NOAA Interim Director NOAA/NESDIS/ORA Richard Rosen, NOAA Assistant Administrator Steven Rutledge, Colorado State University Department Head, Atmospheric Science Sandra Woods, Colorado State University Interim Dean of Engineering Thomas Vonder Haar, Colorado State University Director, CIRA and University Distinguished Professor of Atmospheric Science CIRA ADVISORY COUNCIL Hal C. Cochrane, Colorado State University Department of Economics Mark DeMaria, Colorado State University NOAA RAMM Branch Fran Holt, NOAA (Retired December 2004) Chief, NOAA/NESDIS/ORA/ARAD Sonia Kreidenweis-Dandy, Colorado State University Department of Atmospheric Science “Sandy” MacDonald, NOAA Director, Forecast Systems Laboratory Thomas Vonder Haar, Colorado State University Director, CIRA and University Distinguished Professor of Atmospheric Science

iii
TABLE OF CONTENTS
Page INTRODUCTION . . . . . . . . . . . . . . . . . . . . . . . . . . . . . . . . . . . . . . . . . . 1 CIRA’s Mission and Vision . . . . . . . . . . . . . . . . . . . . . . . . . . . . . . . 2 Education, Training and Outreach . . . . . . . . . . . . . . . . . . . . . . . . . . 3 Organizational Structure . . . . . . . . . . . . . . . . . . . . . . . . . . . . . . . 9 RESEARCH HIGHLIGHTS . . . . . . . . . . . . . . . . . . . . . . . . . . . . . . . . . . . . . 11 DISTRIBUTION OF NOAA FUNDING BY INSTITUTE TASK & THEME. . 21 PROJECT DESCRIPTIONS
NOAA . . . . . . . . . . . . . . . . . . . . . . . . . . . . . . . . . . . . . . . . . . . . . . . . . . 23 Additional CIRA Funding Bermuda Biological Station for Research, Inc. . . . . . . . . . . . . . . . 355 Department of Defense . . . . . . . . . . . . . . . . . . . . . . . . . . . . . . . 359 Lockheed Martin Corporation . . . . . . . . . . . . . . . . . . . . . . . . . . 369 National Aeronautical & Space Administration . . . . . . . . . . . . . . . 371 National Park Service . . . . . . . . . . . . . . . . . . . . . . . . . . . . . . . . . . . . 385 National Science Foundation . . . . . . . . . . . . . . . . . . . . . . . . . . . . . . . 401 Office of Naval Research . . . . . . . . . . . . . . . . . . . . . . . . . . . . . . . 403
APPENDIX: NOAA PROGRAMS VS. CIRA PROJECTS COMPARISON MATRIX. . . . 407 AWARDS . . . . . . . . . . . . . . . . . . . . . . . . . . . . . . . . . . . . . . . . . . . . . . . . . . 411 PUBLICATIONS MATRIX . . . . . . .. . . . . . . . . . . . . . . . . . . . . . . . . . . . . . . 413 EMPLOYEE MATRIX . . . . . . . . . . . . . . . . . . . . . . . . . . . . . . . . . . . . . . . . 414

iv

1
INTRODUCTION
This report describes research funded in collaboration with NOAA’s cooperative
agreement and the CIRA Cooperative Institute concept for the period July 1, 2004
through June 30, 2005. In addition, we also included non-NOAA-funded research (i.e.,
DoD-funded Geosciences, NASA-funded CloudSat and National Park Service Air
Quality Research Division activities) to allow the reader a more complete understanding
of CIRA’s research context. These research activities (and others) are synergistic with
the infrastructure and intellectual talent produced and used by both sides of the funded
activities.
For further information on CIRA, please contact:
Our website: http://www.cira.colostate.edu/
Or
Professor Thomas H. Vonder Haar, Director

2
CIRA MISSION The mission of the Institute is to conduct research in the atmospheric sciences of mutual benefit to NOAA, the University, the State and the Nation. The Institute strives to provide a center for cooperation in specified research program areas by scientists, staff and students, and to enhance the training of atmospheric scientists. Special effort is directed toward the transition of research results into practical applications in the weather and climate areas. In addition, multidisciplinary research programs are emphasized, and all university and NOAA organizational elements are invited to participate in CIRA’s atmospheric research programs. The Institute’s research is concentrated in several theme areas that include global and regional climate, local and mesoscale weather forecasting and evaluation, applied cloud physics, applications of satellite observations, air quality and visibility, and societal and economic impacts, along with cross-cutting research areas of numerical modeling and education, training and outreach. In addition to CIRA’s relationship with NOAA, the National Park Service also has an ongoing cooperation in air quality and visibility research that involves scientists from numerous disciplines; and the Center for Geosciences/Atmospheric Research based at CIRA is a long-term program sponsored by the Department of Defense.
CIRA VISION
CIRA’s Vision is to improve interdisciplinary research in the atmospheric sciences by entraining skills beyond the meteorological disciplines, exploiting cutting-edge advances in engineering and computer science, facilitating transitional activity between pure and applied research, and assisting the Nation through the application of our research.

3
EDUCATION, TRAINING AND OUTREACH ACTIVITIES AHPS CIRA continues to work with the National Weather Service in support of the efficient and effective implementation and development of NWS’s Advanced Hydrologic Prediction Service program (AHPS). This project involves social research and analysis to understand the information needs of various user groups for the presentation, understanding, and training using hydrologic information in a variety of decision-making and risk-based situations involving uncertainty. http://weather.gov/rivers.tab.php Air Quality CD-ROM and Touch Screen Kiosk Development The National Park Service Visibility Research group at CIRA is using interactive technology to tell visitors how human activities impact environmental systems within the national parks. An interactive air quality kiosk was developed to attract visitors to the Oconnaluftee Visitor Center in Great Smoky Mountains National Park, Tennessee. A colorful touch screen display entices visitors to learn more about how air pollution has affected the air, water, soil, plants, and animals in the park. In “Shrinking Views” visitors learn where haze comes from and effects it has on views in the park. In “Ozone Pollution” they see the adverse effect that ozone has on over 30 species of plants in the park. The “Acid Overload” section explores how acid rain impacts sensitive aquatic life and how soils are impacted by high levels of nitrogen. Pictures, colorful graphics, and animated sequences tell the stories in an entertaining yet informative way. Many of the more than one million people that visit Great Smoky Mountains each year will leave with a better understanding of how park environmental resources are damaged, and a clear picture of what each can do to help solve the problems. A similar presentation was developed for the Grants Grove Visitor Center at Kings Canyon National Park, California. As the visitor center was being completely redesigned and updated, the park looked toward utilizing higher technology to share their air quality message. Two touch screens and two large screen plasma displays invite visitors to explore ozone effects on giant sequoia and pine forests, acid rain and its effects on sensitive amphibian species, another section explores the effects of airborne pollutants on views within the park. Visitors can also take a virtual tour flying over the San Joaquin valley to see how pollutants accumulate before they are pushed into the park, and there is an animated recycling challenge that allows visitors to test their knowledge of product recycling. The program is presented in both Spanish and English with the intent of reaching a much larger and diverse audience. Air Toxics Website This website continues to provide online access to air toxic archive data about toxic substances in the air. Analyses of these data provide information about spatial patterns, temporal profile, and general characteristics of various air toxic compounds and continues to be part of the ongoing work to support the deployment of a national air toxics monitoring system. http://vista.cira.colostate.edu/atda

4
CoCoRaHS Website In 1998 a small group of weather volunteers in northern Colorado under the direction of the Colorado Climate Center at Colorado State University began measuring rainfall and hail at their homes to help track local precipitation patterns from summer thunderstorms. Since that time the project has grown into a multi-state network of over 2000 citizens measuring and reporting precipitation amounts year round. There are no electronic measurement devices in CoCoRaHS. Volunteers use clear plastic rain gauges to manually measure the quantity of precipitation. During winter, the depth of snow is measured using rulers and “snow boards.” Quantitative measurements of hail are taken using “hail pads,” squares of Styrofoam wrapped with aluminum foil. Together, this suite of measurements allows a very comprehensive assessment of the moisture falling from the sky. A website has been developed where volunteers enter their data each day. http://www.cocorahs.org. From this site state, county and city maps are automatically updated each day. As of August 19, 2005, there have been 794 reports of hail in 2005. The largest stones measured had a diameter of three inches, but only 8 percent of all storm reports included stones of 1 inch diameter or greater. Scientists are using CoCoRaHS data as ground truth in evaluating and calibrating radar and satellite data. Hydrologists are incorporating CoCoRaHS data in watershed modeling, streamflow prediction, and ground water assessments. The National Weather Service utilizes CoCoRaHS data for forecast verification and as input for issuing local severe weather warnings. CIRA sponsors a science teacher internship program where teachers work directly with CoCoRaHS scientists to develop and test educational materials and lesson plans. Many teachers are getting students involved in CoCoRaHS to learn how scientists collect and analyze scientific data. Most importantly, volunteers of all ages and backgrounds are learning about their local climate and the importance of precipitation in daily life. Nearly 20 additional states have inquired about getting involved in the project, and current plans are to add Pennsylvania, Virginia, Maryland and the District of Columbia in the very near future. Five EnviroSpheres Proposal CIRA has proposed to NOAA to design, develop and implement a prototype interactive website visualizing the role of the “Five EnviroSpheres” – Atmosphere, Hydrosphere, Cryosphere, Lithosphere, and Biosphere – in creating and affecting significant environmental phenomena around the world. This prototype website will allow users to: 1) select a learning level of presentation, i.e., Introductory, Intermediate, and Advanced, 2) provide an option to learn more about each of the Five EnviroSpheres; 3) view a spinning Earth from space as it changes with the seasons; 4) select a sample of significant environmental phenomena of interest as they appear on the spinning Earth; and 5) zoom and “fly over” to the selected geographical location of interest. Once over the location and phenomenon of interest, the user will be able to: a) visualize an animation of the phenomenon created by the interaction of the relevant EnviroSpheres; b) alter the environmental factors that influence the phenomenon to better understand the resulting effect on the phenomenon; c) pursue the option of learning about the science behind the phenomenon through animation of selected
5
internal science processes; and d) connect to NOAA web sites to learn about NOAA’s mission and research related to the phenomenon. The viewer will then be able to continue exploration of another phenomenon in that geographical region, select another phenomenon from an itemized list, or return to the spinning Earth to select other phenomena in other parts of the world. The Five EnviroSpheres program is designed to generate student and public interest in various science disciplines through the interactive visualization of the science that creates our earth’s phenomena. GLOBE Website The Global Learning and Observations to Benefit the Environment Program (GLOBE) continues to be the most extensive educational and outreach program with which CIRA is involved. Working with the NOAA Forecast Systems Laboratory and NCAR, CIRA has inherited the overall responsibility for the development and maintenance of the entire GLOBE Website, database, and real-time data acquisition system, including visualization of all student data and the acquisition and display of reference data. Data entry pages are designed to allow for schools to send their data either by using GLOBE Webpages or simply by email. A data acquisition system capable of ingesting and archiving GLOBE student data from all over the world has been created at: http://www.globe.gov/globe_flash.html By the summer of 2005, GLOBE has expanded to 107 countries, more than 16,000 schools and a GLOBE database that holds more than 13 million GLOBE data records. Continuously and on a yearly basis, GLOBE scientists improve and refine existing protocols and add new measurement protocols such that the Website now has more than 1000 dynamic pages. Hundreds of GLOBE partner organizations have volunteered to conduct the GLOBE training for interested teachers worldwide. As GLOBE country and student participation continues to increase so does the role of satellite data imported into the GLOBE reference database. IMPROVE Website IMPROVE is located at: http://vista.cira.colostate.edu/improve/. This website was designed to provide federal, state, and local air quality regulatory agencies, as well as the general public, access to visibility data. This information includes monitoring a site’s location, topography, air quality measurements over time, and pictures of the site and surroundings. A special feature is photographs documenting the spectrum of visibility conditions at each site. For the public there is an educational section that will guide people through the visibility science and regulatory information at their own pace. Animations, voice, and still images convey the basic concepts of visibility science, air quality data analysis and haze. A 2005 IMPROVE Calendar is available as a download.

6
Joint Hurricane Testbed Development The months of June through November are critical for the development of severe storms that often create devastation along the Eastern and Gulf States of the U.S. These storms are part of a phenomena called “tropical cyclones” which begin as tropical disturbances, grow to tropical depressions, mature into hurricanes (typhoons in the western North Pacific Ocean), and normally die out as tropical storms over land. The current operational method to determine the likelihood of experiencing tropical cyclone conditions is a long-standing operational strike probability product, which gives the probability of a storm’s center being within 75 statute miles from a given location. To improve on the output of the current operational product, a new model has been developed as part of the CIRA JHT project. This new model estimates the probability of experiencing tropical storm or hurricane conditions using a Monte Carlo Probability (MCP) model, where a large set of plausible tracks and intensities are determined by randomly sampling historical forecast errors distributions. These probabilities provide all users with information that enhances their ability to make preparedness decisions specific to their own situations and risk tolerance. This research has the potential to become a standard operational product and be translated into an outreach forecast for the general public that provides the wind probabilities for specific areas within the tropical cyclone path. RMTCs Website RMTCs are international Regional Meteorological Training Centers located in Costa Rica and Barbados. Continued activities with these RMTCs have focused on building case studies of heavy rain events associated with hurricanes, tropical waves, and the incursion of mid-latitude systems during the northern hemisphere winter. Assistance has also focused on fire detection, volcanic ash detection, satellite rainfall estimation, and satellite cloud climatologies. CIRA has helped organize and complete three World Meteorological Organization (WMO) sponsored two-week satellite training courses in these regions. See http://www.cira.colostate.edu/RAMM/TRNGTBL.HTM#vlab for more information on various RMTC activities. Science on a Sphere Development CIRA personnel are currently involved with NOAA’s Forecast Systems Laboratory in the design and implementation of an exciting project to visualize the wonders of the Earth, other planets and moons, and even the sun via a six-foot sphere suspended in space. Called “Science on a Sphere (SOS)” the visual impact of SOS will stimulate one’s imagination and the desire to learn more about our living planet and its surrounding space. SOS is essentially a six-foot spherical screen with a set of computer-driven projectors shining on it. Customized software provides the magical look of projected data onto a seamless animated globe. Global infrared satellite imagery, sea surface temperatures, climate models. X-ray sun imagery, earth bathymetry, and surface elevations data are among the NOAA datasets displayed on the screen. Future imagery will include re-

7
projected global maps of Jupiter and Saturn, a movie showing the history of Earth’s population growth, as well as improved displays of the Sun and the Moon. It is hoped that SOS will plant the “seeds of inquiry” into the minds of our youth who one day will become our future science leaders. Although SOS is in its infancy, it is becoming one of the most visually interesting educational tools created by the science community. More information on Science on a Sphere can be found at: http://www.fsl.noaa.gov/sos/ ShyMet Course The Satellite Hydrology and Meteorology Training Course is designed to cover the basics of Geostationary and Polar orbiting satellites including their instrumentation, orbits, calibration, navigation, and associated radiation theory. The course will include the remote sensing basics necessary for the correct interpretation of satellite imagery, identification of atmospheric and surface phenomena, and the integration of meteorological techniques with satellite observing capabilities. The ShyMet course continues under development at CIRA and CIMSS, at the University of Wisconsin. This course pulls together distance training modules from many sources, including VISIT, into an organized learning path. The goal is to train participants to be certified in the use of satellite data and products as part of the NWS forecasting and warning program. The new training information is also being shared with the international community. VIEWS Website VIEWS is located at: http://vista.cira.colostate.edu/views This website was designed and is maintained to help all the RPO partners (States, local air agencies, Indian tribes, federal land managers) to accumulate, access and analyze the widest possible array of air quality data. The website contains online data links to measure air quality data sets from throughout the country. The addition of aerosol, optical, and meteorological data from over 20 different monitoring networks differentiate this site from the IMPROVE site. Public access to this site is encouraged, as here one will find a living inventory of distributed air quality data resources for the western U.S. VISIT Website VISIT: The Virtual Institute for Satellite Integration Training program offers a broad range of topics for teletraining. Created in 1998, this program offers a distance learning capability for National Weather Service personnel to satisfy NWS training requirements. Topics developed at CIRA, and supported by software developed by the Cooperative Institute for Meteorological Satellite Studies (CIMSS) at the University of Wisconsin, allow for synchronous teletraining sessions to be administered by CIRA personnel to NWS offices. Through August 2005, 60 session topics have been developed, 20 of which were developed at CIRA. More than 975 VISIT teletraining sessions have been administered during that same time period, with over 15,000 certificates of completion having been awarded to the teletraining participants.
8
The VISIT website (http://rammb.cira.colostate.edu/visit/) contains stand-alone versions of most sessions, many of which are of the audio (recorded) variety, and some with embedded instructor notes that can be viewed using a web browser. The web/audio versions make it possible to view the material at any time. VISIT teletraining applications have continued to expand as more NOAA offices turn to this approach as a cost-effective solution to the problem of increased training requirements coupled with shrinking training and travel budgets.
Virtual Library and WMO Global Outreach The Virtual Laboratory for Satellite Training and Data Utilization (VL) has been established to maximize the exploitation of satellite data across the globe. It is a collaborative effort joining the major operational satellite operators across the globe (USA, Europe, China, Japan) with the World Meteorological Organization (WMO) “centers of excellence” (COEs) in satellite meteorology located in Costa Rica, Barbados, China, Australia, Kenya and Niger. These “centers of excellence” serve as the satellite-focused training resource for WMO members where trainers from different countries come to learn, and then return home to train others. In March 2005, CIRA introduced a new concept in training at the COE in Costa Rica. In the past, VL participants have left courses with a variety of materials, often cumbersome and difficult for those from developing countries to effectively use. To remedy that hindrance and to assure that the most up-to-date materials were always available for participants, CIRA developed and through the WMO distributed electronic resource notebooks to all participants. Each electronic notebook contained all materials used in the training course as well as a complete Virtual Resource Library. Since the course, this new resource has enabled those trained in Costa Rica to return home and more effectively use the information to train others. Through WMO, CIRA has now provided electronic notebooks, or copies of their contents to each of the satellite sponsors of the VL as well as each of the COEs. The success of this activity is helping CIRA meet an international outreach goal of advancing the utilization of satellite data. To learn more about the VL, and to tour CIRA’s Virtual resource Library visit the CIRA website (http://www.cira.colostate.edu/WMOVL/index.html).

Bo
ard
ofG
ove
rno
rs
CS
U P
resid
en
t
---
Pro
vo
st
CS
U P
resid
en
t
---
Pro
vo
st
De
an
of
En
gin
ee
rin
g
Dire
cto
r C
IRA
Pro
f. T
hom
as H
.
Vo
nd
er
Ha
ar
Atm
ospheric
Scie
nce D
ept
Ad
vis
ory
Bo
ard
CS
U V
ice
Pre
s..
Ch
airm
an
+ 4
CS
U,
4 N
OA
A
Assis
tan
t to
th
eD
ire
cto
rJo
an
ne
DiV
ico
Ad
vis
ory
Co
un
cil
of
CIR
A F
ello
ws
De
puty
Dire
cto
r
Ke
n E
is
De
pt.
Ma
na
ger
Ma
ry M
cIn
nis
-E
faw
Air
Qu
alit
y R
es.
NP
SD
ou
g F
ox
(Bill
Ma
lm)
Ge
oscie
nce
s A
tmo
s.
Re
se
arc
hT
om
Vo
nd
er
Ha
ar
Bo
uld
er
Colla
bora
tio
ns
Asso
cia
te D
ire
cto
r
Clif
f M
ats
um
oto
Re
se
arc
hIn
fra
str
uctu
reM
ike
Hia
tt
Re
se
arc
h S
up
po
rtS
erv
ices
Do
n R
ein
ke
Mo
de
ling
Ob
se
rvin
g
Syste
ms
So
cio
Eco
nom
ic
Imp
acts
Sh
rip
ad
De
o
Au
gu
st
24
,2
00
5
Adva
nce
d
Com
pu
tin
g
Clim
ate
Gro
up
Scie
nce
Assis
tan
tJo
hn F
ors
yth
e
Oth
er
Colle
ges
NW
SN
ES
DIS
OA
R
NO
AA
NG
DC
FS
LO
RA
ET
L
OG
PN
CD
C
Clo
ud
Sa
tP
roje
ct
Ke
n E
is
Ce
ntr
al
Serv
ices
Sta
ff
PP
&I
JC
SD
A
Data
Assim
ilatio
nG
rou
p
Se
nio
r M
an
ag
er
Da
ve
Cis
mo
ski
Oth
er
Depts
"TB
D"
RA
MM
T
ea
mN
OA
A/N
ES
DIS
Lo
uie
Gra
sso
(Ma
rk D
eM
aria
)
Oth
er
Engin
eeri
ng
Depts
CIR
A O
rgan
izat
ional
Str
uct
ure
NO
AA
/FS
L E
nv
Ap
plic
atio
ns
Re
se
arc
h
NA
SA
/
GL
OB
E
NE
SD
IS/
NG
DC
Adva
nce
d
Wo
rksta
tio
n
De
ve
lop
me
nt
9

10

11
CIRA RESEARCH HIGHLIGHTS July 1, 2004 – June 30, 2005
Global and Regional Climate Dynamics
Modeling studies have been completed on GCM sensitivities to cloud feedback, specifically shallow convection. The model sCAM has been used with several tropical data sets taken during BOMEX, ASTEX, and DYCOMS I and II. Year long simulations have revealed several biases in the NCAR Community Atmosphere Model (CAM) including: anomalous precipitation patterns associated with the Asian Monsoon. The bottom line will be improved parameterizations in these climate models for precipitation and convection.
GCM (CAM2) biases are being evaluated using HIRS and ISCCP data sets.
Discovered biases are being investigated using the model’s energy and water budgets.
CIRA has made great progress in using redundant ISCCP data to shed light on the
datasets’ accuracy of cloud cover.
Comprehensive model sensitivity studies have been performed on North American drought, floods and El Nino seasons using the monsoon convection as a telecommunication mechanism between monsoonal surges in Northern Mexico and convection in the central U.S.
CIRA has had many carbon cycle research starts in the last 6 months. Although too
early to report results, the exceptional growth in CIRA’s carbon research is noteworthy in itself.
A prototype NOAA computational grid has been developed as part of an effort to explore the feasibility of combining geographically distributed computing resources into a single virtual resource (a computational grid). It includes processors located at the Forecast Systems Laboratory in Boulder, Colorado, the Geophysical Fluid Dynamics Laboratory in Princeton, New Jersey, and the Pacific Marine Environmental Laboratory in Seattle, Washington. A rudimentary grid-scheduler was developed to allow users to submit jobs from nodes anywhere on the grid. The coupling of atmospheric and oceanic models across the TeraGrid for climate applications is in progress.
Regional climate simulations were performed for June 2004 with the WRF model to study the effects of soil moisture on precipitation and to compare results obtained with different convective parameterizations and with explicitly resolved convection. Convection is parameterized in simulations on a 20-km resolution grid and cloud-resolving simulations are performed on a 1.7-km resolution grid. A preliminary comparison of modeled precipitation with a .25 degree resolution CPC analysis is presented. A more comprehensive comparison with stage 4 data is planned.

12
Initial in-situ versus satellite measurement comparisons have been performed to see how representative the cloud observatory will be at Eureka, Canada where a cloud radar, radiometer and other instruments for cloud monitoring are being sited. This data will be used for input to climate models and for observing climate changes in the Arctic.
Mesoscale and Local Area Forecasting and Evaluation
The Range Standardization and Automation (RSA) project was upgraded to a whole new set of IBM hardware and a new operating system (Advanced Server 2.0). This project is aimed at providing high-resolution analyses and forecasts to support space center activities at Cape Canaveral and Vandenberg AFB. Utilizing LAPS and the MM5 mesomodel, the RSA system creates high-resolution analysis and forecast products that support operations from the next few minutes to 24 hours in advance. The product set merges with the NOAA and USAF product streams for display on AWIPS. CIRA's efforts combined with those of other team members led to FSL and the LAPS branch being recognized with the 2005 NOAA Technology Transfer Award.
Various diagnostic tools were developed to investigate the interaction between gravity waves and turbulence. A theoretical framework of gravity wave polarization and associated diagnostic methods was also developed. Using the wavelet-based cross-spectral method, spectral results in physical space were localized to see how gravity wave polarization is related to the generation of turbulence.
Research into time-lagged ensemble forecast and modeling using RUC forecasts as a set of ensemble members continued. A multi-variable linear regression scheme was developed. This scheme uses past observational data to train each time-lagged ensemble members and provides optimal weights for these forecasts. Ensemble forecasts using these optimal weights showed significant improved forecast skills in the short-range.
A method to improve ensemble-based forecasts of maximum daily 1-hr and 8-hr averaged ozone concentrations was developed and evaluated. The method minimizes least-square error of ensemble forecasts by assigning weights for its members. Investigation showed that the magnitude of a weight does not necessarily correspond to the quality of the ensemble member. Maximum benefit in performance of the ensemble is achieved when weights are calculated daily, suggesting in a certain way the value of persistence as a forecasting tool.
First year of proof-of-concept testing of local data assimilation and NWP within a NWS Forecast Office produced favorable results. Satellite, radar, and other local data were used for real-time initialization of the WRF model on a Linux cluster.
Additional enhancements were implemented for the specially configured mesoscale
ensemble forecast system comprised of MM5 and WRF model runs developed to support the Road Weather Maintenance Decision Support System (MDSS) for the
13
FHA. New domain and products improve the input that provides forecast winter road conditions and recommended treatment options for road maintenance personnel.
Support to U.S. Forest Service operations continued with LAPS analyses running on
IJET, as well as a recent transfer to the newer cluster called EJET. The large western U.S. domain was increased in resolution from 18km down to 6km. We will be revisiting the possibility of parallelization of the analyses to help restore the radar feed.
LAPS researchers participated in the Developmental Testbed Center's (DTC) winter
experiment of testing high-resolution (5 km) CONUS scale models (NMM and ARW, two versions of the WRF model) for winter forecasting. The experiment was called the DTC Winter Forecast Experiment (DWFE), and the involvement included subjective assessment of the forecasts with a paper presented at the AMS conference on Numerical Weather Prediction and Weather Analysis and Forecasting in August 2005.
Efforts continued to adapt the MDL-developed System for Convection Analysis and
Nowcasting (SCAN) software to KMA's Forecaster Analysis System (FAS), an AWIPS-like, weather forecast workstation. Using the C- and S- band data from the various KMA radar data collection platforms, a real-time radar data processing system was created to generate the required SCAN radar products: Vertically Integrated Liquid (VIL), Composite Reflectivity (CZ), and Storm Track and Identification (STI).
Display of the upstream contributing area (area of rainfall runoff) and downstream
flow path (potential Flash Flood track) from an arbitrary large scale (small) FFMP watershed was added to the Flash Flood Monitoring Program (FFMP). This display improves the NWS forecaster's comprehension of the hydrologic processes and impact features involved in flash flood forecasting.
The MicroMet model is well under development. MicroMet will serve to couple high-
resolution hydrological and land use models with lower resolution (15-40 km) mesoscale models. Three conference papers and two publications are currently under review.
CIRA has completed a toxic dispersion transport model. The unique feature of this
model is that it’s for streams and rivers. Using CSU’s CASC2D hydrological model as a starting point, this model simulates the erosion, deposition, chemical leaching, and solubility of many toxic materials and their transport and dilution down stream in the face of rain and flood events.
Our work with the DoD on soil moisture is converging with NOAA’s activities. We are
currently finishing up a soil moisture data assimilation system that uses WindSat 6 Ghz radiometer data as well as satellite IR and SSMI data. The 6 GHz channel provides deeper penetration and the modeling aspect should allow soil moisture analysis deeper than any sensor data can hope to achieve without a modeling
14
component. The Backus-Gilbert work reported in the Satellite Applications section is a key element of this work.
Research on Ensemble assimilation and prediction techniques is well underway as
part of several research efforts and next year’s report will show significant results.
Applications of Satellite Observations
A breadboard etalon spectrometer and prototype analysis algorithm was developed to measure CO2 remotely. This project, closely linked to the NASA OCO mission is an early development effort that could lead to a NOAA operational mission for the measurement of CO2 sources and sinks at very high resolution.
GOES-N Post Launch Test website online.
http://rammb.cira.colostate.edu/projects/goes_n/
Improved statistical hurricane intensity forecasts developed. SHIPS improved by using satellite data and analysis shows eastern Pacific intensities improved significantly.
The Tropical Cyclone Formation product was successfully transferred from CIRA to
OSDPD.
A cross sensor blended total precipitation product (SSMI and AMSU) has been developed and delivered to OSDPD.
An improved AMSU-based tropical intensity and wind structure estimation algorithm
using a tropical cyclone dataset 5 times larger than previously available is now being run routinely at CIRA.
A two dimensional Backus-Gilbert filter as been developed for general use to any
satellite sensor and specifically for the WindSat data. This technology is critical to all passive microwave data utility within the modeling community. These data must be screened for RFI prior to model assimilation to be of any use over land.
GOES-R Risk reduction activities included generation of synthetic HES images from
simulated data. CAPE and TPW products were generated from the synthetic HES images. CIRA also generated synthetic sounder soundings with variable vertical footprints of the CONUS region. Information content studies, tropical cyclone products, severe weather applications, and prototype fog, smoke, and volcanic ash products were also investigated.
Completed an NPOESS utility study on how these new data could be used in severe
weather modeling and forecasting. As part of this process, a new Operational Operator was developed for the VIIRS 11.02, 12.3, and 13.3 micron channels. Synthetic VIRRS data was generated during this research.

15
QuickSCAT data has been used to measure Gulf (Baja) surges as part of CIRA’s multi-faceted work on the North American Monsoon Experiment.
Quality assessment of the Cloud Top Height product (CTOP) created by the FAA
AWRP Oceanic Weather Product Development Team was conducted. The assessment provided an intercomparison-based analysis of CTOP with an operational cloud top height product. This analysis marked the first use of remote sensing data for verification of aviation weather products in the context of the AWTT process. Based strongly on the results of the CIRA analysis, the FAA technical reviewers decided to make the CTOP product available to operational organizations on an experimental basis.
Cloud Physics
Series of eddy resolving simulations (ERS) and large eddy simulations (LES) of smoke cloud interactions were performed to demonstrate the relative importance of various factors responsible for cloud suppression in the biomass burning regions of Amazonia. The vertical distribution of smoke aerosol in the convective boundary layer was found to be crucial to determining whether cloudiness is reduced or increased. The study also pointed out the importance of coupling aerosol radiative properties and a surface soil and vegetation model to the microphysical-dynamical model. Under polluted conditions (associated, e.g., with biomass burning smoke), the surface flux response to the aerosol may be the single most important factor in cloud reduction.
CIRA has analyzed uncertainty estimates of aerosol direct forcing of climate through
stratocumulus cloud processing.
A major finding in the comparison of VIRS IR rain estimates to TRMM measurements was found. Results indicate the Iris hypothesis is not supported by the data. No trend indicating changes in precipitation efficiency was found in the 18-month period of study.
Numerical Modeling
CIRA has used NESDIS’ Microwave Land Emissivity Model (MEM) and a 1DVAR vertical model to validate and create an AMSU-B antenna pattern that has resulted in a 10-15% bias error improvement to the upper-water vapor profiles. (These biases are in MEM so the discovery of these biases will effect all users of this model’s output).
A 1DVAR global emissivity retrieval system is currently being prepared for
technology transition to NESDIS.
Dr. Tomislava Vukicevic was awarded a Fulbright award for her work on 4DDA research. Her work on assimilation of GOES infrared radiances in the presence of clouds is proving that in increased constraints posed by these radiance values and their more frequent updates to mesoscale models improves forecast accuracy.

16
Developed a model describing the uptake of water vapor by inorganic and organic
particles. This work is critical in the future accuracy of remote sensing of CCNs because of how CCNs’ radiative properties vary as they take on water.
During the past year, support of the RUC development continued, both at NCEP and
at FSL. A new version of the operational RUC was implemented at NCEP on 28 June 2005, with increased horizontal resolution, down to 13km, several new data sources, and improved surface, precipitation and cloud forecasts. The RUC was also used extensively for data impact studies, most recently evaluating wind profilers, lidar and ACARS moisture observations.
To support the Developmental Testbed Center’s desires to make a series of
forecasts using WRF/NMMV1 for the DTC Winter Forecast Experiment (DWFE) using the latest physics incorporated into V2, the V2 physics package was merged into V1. With the use of available supporting software packages such as the SI and post-processing developed for V1, the DWFE was a total success.
CIRA scientists collaborated on the design and development of a prototype WRF
Portal—a Java-based GUI front end for running WRF. The design incorporates a mySQL database, Java application, and communication protocols between the client side application, WRF Portal, and server side workflow manager/job scheduler.
Education, Training, and Outreach
The GLOBE Systems Team comprised of 8 CIRA researchers continued to provide website, database, and data acquisition support to the Program’s worldwide users now located in 109 countries. There are now more than 13 million observations in the GLOBE database collected by students in over 16,000 schools since the Program’s inception in 1995. The Program received the Goldman Sachs Foundation Prize for Excellence in international education (media and technology category) in November 2004.
Science on a SphereTM was installed this past year in its first permanent science museum location at the Nauticus Museum in Norfolk, VA. SOS continues in use at the Science Fiction Museum in Seattle. A full set of Jupiter's Galilean satellites is now available for display. Photo-mosaics of several Saturnian satellites were updated by reprojecting and overlaying recently taken Cassini flyby images. Maps of five Uranian satellites were added as well as one for Neptune. Some image processing was performed to add a high-resolution Voyager mosaic to a pre-existing map of Neptune's moon Triton.
The PACE effort comprised of two separate investigative projects—TMU and FX-Connect—made significant progress this past year. The effort is driven by the need for innovative software tools and data products to minimize adverse weather disruptions in air traffic operations. The FXC Volcanic Ash Coordination Tool project is a response to the needs of collaborating agencies in generating consistent Volcanic Ash Advisories. A successful test based on a simulated volcanic eruption
17
in the North Pacific was conducted in May 2005. The participating agencies were FSL, the Alaska Aviation Weather Unit, Alaska Volcano Observatory, and the Anchorage Center Weather Service Unit. The test enabled the participants to exercise the FXC VACT system in a simulated operational situation, familiarize users with VACT capabilities, and develop collaboration strategies and protocols for operations.
The latest version of the FX-Net Client was installed at the Bureau of Land
Management’s (BLM’s) Federal Test Center in Lakewood, Colorado. The system passed the rigorous network and security tests administered at the Test Center, and was certified for use by the 11 Geographical Area Coordination Centers (GACCs), the NIFC, the National Forest Service and the Ag Outlook Board. BLM users at these locations provide long-range fire predictions, daily fire indexes, and drought outlook products for various BLM websites and for operational use by fire weather forecasters. Specialized maps were added to the FX-Net system for these specialized users.
A new version of the Wavelet Compression code was added to the system, providing higher resolution satellite imagery and improved product retrieval response. New datasets were added via the use of the MADIS system as well as locally generated, high-resolution model output.
The core FX-Net system was used to build the servers for specialized air quality
users. Additional datasets such as the EPA’s AIRNOW real-time air quality observational data, the NOAA/EPA air quality forecast model data (CMAQ), and experimental air quality forecast models, such as FSL’s WRF/Chem model were included in this new system.
The successful implementation of Valid Time Event Codes (VTEC) in warning and
advisory products for severe weather and flooding continues to be one of the most important near term goals of the NWS. During this past year, CIRA researchers helped the NWS successfully implement VTEC for severe convective warnings and some marine warnings.
The AWIPS Linux Prototype System (ALPS) development effort began during
FY04/05 exploring how the AWIPS system can be redesigned to support the longer term needs of the NWS and possibly other NOAA agencies. The focus this past year has been on distributed data and on an improved interface for user developed applications.
Satellite utility and educational efforts have been very active. Coordination with
WMO on the role of satellite meteorology, investigations of improved spatial, temporal, and spectral data, Costa Rica training, and training sessions at the AMS Satellite Conference in 2005 have been conducted or are underway.
The SHyMet training course, a collaboration between CIRA and CIMMS to develop a
distance learning course on satellite hydrology and meteorology, is well underway. Currently NWS SOS’s feedback is being incorporated into the program.

18
The VISIT program has fulfilled all goals identified in 1998. This accomplishment has
been validated from feedback from VISIT participants and students. 15,000 training certificates have been awarded and 15 teletraining courses have been developed. More and more NOAA offices are using VISIT training as travel funds for training continue to shrink.
In close collaboration with CIRES’ NOAA Western Water Assessment, analysis of
three Colorado watersheds is being modeled for drought risk assessment. Societal and Economic Impacts
Professor Cochrane has developed an econometric model that models weather-induced natural disasters and their economic impacts. The model also computes the inter-segment impacts of these disasters. This accounts for such things as a local economy actually being stimulated by post-disaster building activity, government sector activities, and many other cross sector economic couplings.
AHPS Regional Excellence Award received by Central Region for Climate Services
Division’s work on improving delivery of hydrological products. CIRA’s sociological work (Dr. Deo) was critical to the improved understanding of customer needs, clear message generation, and the optimization of the process via workshops, focus groups, and prototype designs.
Joint collaboration with the National Renewable Energy Laboratory (NREL) continued to support applications of the RUC model in wind energy planning. Effort is now concentrated in application of ensemble forecasting methods to produce probability distribution functions for potential wind energy production, detection of nocturnal low-level jet, and improved near-surface wind forecasts through variation in surface roughness.
Infrastructure
Currently installing NOAAPort (Linux version) at CIRA to support R&D for AWIPS.
Completed an intercomparison study of Judd Communications and Campbell Scientific sonic snow depth sensors (for ASOS measurement).
The inventory of Tropical Cyclone IR imagery has grown to 336 storms in the 1995-
2004 timeframe with 93,700 images to assist storm track, intensification and general research efforts.
Delivered a new IT computer system based on DPEAS to OSDPD that saved them
approximately $7M compared to standard IT systems for the processing of multi-platform data. If scaled to the 55 NPOESS EDRs, the savings would be approximately $385,000,000.

19
Completed an ORA IT invited Infrastructure Study Group list of recommendations
(Drs Kidder and Jones). As part of this multi-institutional review, ORA is expected to reorient their IT services and science project management.
CIRA built its first 64-bit Linux cluster. Moving from 32 to 64-bit architecture was
prompted by our modelers who needed additional addressable memory (RAM) to perform simulations over larger domains (larger grid arrays). The immediate outcome of this improved infrastructure was the ability to model three major meteorological events (severe weather, lake effect snow, and Hurricane Lili).
The CloudSat Data Processing Center (DPC) was completed (hardware and
software) during this period. CIRA DPC personnel are now awaiting the expected 29 Sept 2005 launch. The DPC’s functions include data ingest from the USAF satellite earth station network, archive, production of standard products, distribution of products to the CloudSat science team members, and outreach to the broader science community. Please view the DPC website for the latest CloudSat updates. For product information http://cloudsat.atmos.colostate.edu/data/data.html and for the DPC http://www.cloudsat.cira.colostate.edu/
CIRA has developed a DVD-based storage solution. This system has several
attributes worth consideration: o A low cost method of storing real-time satellite (and any other data source)
data.
o A system that can be reconfigured to store a new data source in minutes.
o Unlike all tape storage media, the DVDs are verified at the time of writing. We know we have the data actually on the DVD. In the case of burn errors or a bad DVD, the system rejects the DVD platter and burns another one.
o The system also sorts data by source and writes a full description of the
data on the media. Self documenting. There is no human transcription error possible.
Our Data Systems Group at FSL continued their research into the design and
development for new and modified datasets. Use of Object Data System (ODS) applications and methods has expanded as legacy translators and product generation methods are replaced by the new techniques including OO software development for point data. CIRA researchers in DSG continued to collaborate with FSL scientists and developers to assemble and maintain a state-of-the-art meteorological data center. Data acquired, decoded and processed by DSG have been vital to the success of MADIS, RTVS, and FSL's X-window workstation (FX-Net). Additionally, data delivery systems developed for DTC, DWFE and RUC have also been vital to their success.

20
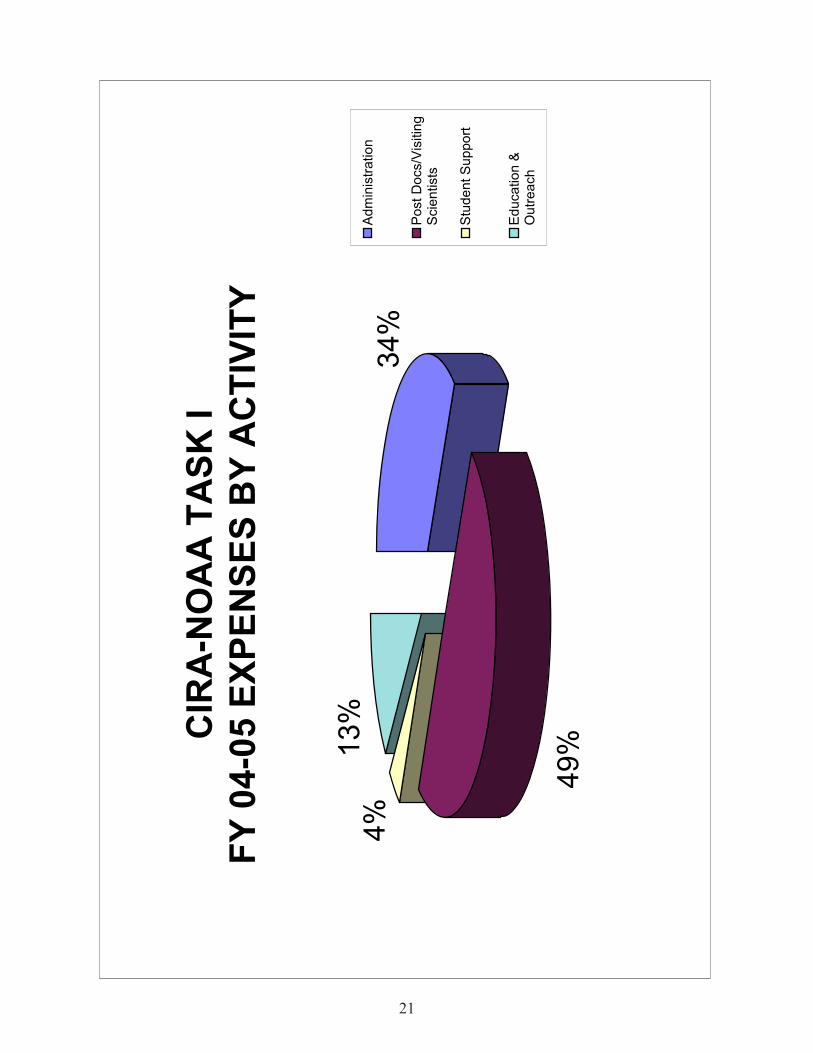
CIR
A-N
OA
A T
AS
K I
FY
04-0
5 E
XP
EN
SE
S B
Y A
CT
IVIT
Y
34
%
49
%
4%
13
%A
dm
inis
tra
tio
n
Po
st
Do
cs/V
isitin
gS
cie
ntists
Stu
de
nt
Su
pp
ort
Ed
uca
tio
n &
Ou
tre
ach
21
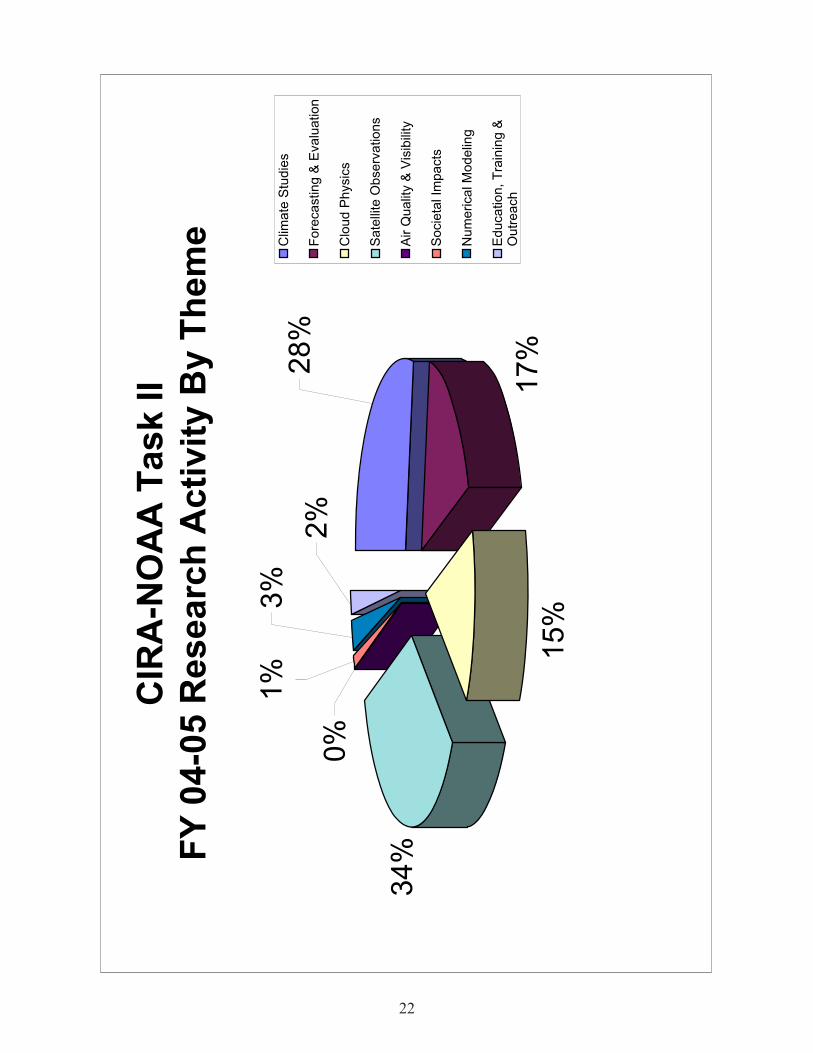
CIR
A-N
OA
A T
ask II
FY
04-0
5 R
esearc
h A
cti
vit
y B
y T
hem
e
17
%1
5%
34
%
0%
1%
3%
2%
28
%C
limate
Stu
die
s
Fore
casting &
Evalu
ation
Clo
ud P
hysic
s
Sate
llite
Observ
ations
Air Q
ualit
y &
Vis
ibili
ty
Socie
tal Im
pacts
Num
erical M
odelin
g
Education, T
rain
ing &
Outr
each
22
23
A HIGH-RESOLUTION METEOROLOGICAL DISTRIBUTION MODEL FOR ATMOSPHERIC, HYDROLOGIC, AND ECOLOGIC APPLICATIONS Principal Investigators: Glen E. Liston (Lead PI), Lixin Lu, Roger A. Pielke, Sr., A. Scott Denning, Cooperative Institute for Research in the Atmosphere (CIRA), Colorado State University, Fort Collins, CO 80523. NOAA Project Goal: Understand climate variability and change to enhance society’s ability to plan and respond. Key Words: Weather, modeling, spatial distribution, air temperature, precipitation. 1. Long-term Research Objectives and Specific Plans to Achieve Them: The overall objective of this proposal is to develop a state-of-the-art, physically based, micrometeorological model that can serve as an interface between the relatively coarse-resolution atmospheric models (e.g., 50- to 5-km grid increment) and fine-resolution (e.g., 1-km to 100-m grid increment) hydrological and ecological models. There are currently only limited physically-valid mechanisms (models) available to convert atmospheric forcing data to the sufficiently high spatial resolution required to drive terrestrial models operating at realistic spatial scales. This lack of available high-resolution atmospheric forcing data has hindered the development of spatially- and physically-realistic hydrologic and ecologic models. Evidence of this can be found by looking at the growth of intermediate-scale (e.g., 10-15 km grid increment) land-surface hydrology models over the last 10-15 years. These models have generally had to adopt the atmospheric modeling approach of “parameterizing” the subgrid-scale physics within the (hydrologic) system they are attempting to model.
We are developing a model that will be able to take the available, relatively coarse-resolution atmospheric datasets (observed [e.g., meteorological station observations, radar observations, satellite data], analyzed [e.g., LAPS, RUC, Eta], or modeled), and convert them, in physically realistic ways, to high-resolution forcing data (air temperature, relative humidity, wind speed and direction, incoming solar and longwave radiation, and orographic and convective precipitation). This will lay the groundwork for substantial improvements to existing hydrologic and ecologic models. This need is particularly acute in the western mountain States where topographic variations lead to significant variations in winter snow precipitation, snow-depth distribution, spring snowmelt, and runoff rates (e.g., changes of over 500% across distances of a few 100 m for some variables). This, in turn, will lead to increased accuracy of operational weather, hydrologic, and water-resource forecasts.
2. Research Accomplishments/Highlights: In order to meet these objectives we are developing a state-of-the-art, physically based, micrometeorological model (MicroMet) that can serve as an interface between the relatively coarse-resolution atmospheric models and fine-resolution hydrological and ecological models. As part of our research effort we have completed a preliminary

24
version of the MicroMet model and written a paper summarizing its performance (see below). The manuscript is in review.
3. Comparison of Objectives Vs. Actual Accomplishments for Reporting Period: All of our objectives are being met at the rates indicated in our original proposal. This is the first year of a three-year project, and the work is still “in progress”. This includes both our model development and data assimilation efforts.
4. Leveraging/Payoff: Our improved, high-resolution atmospheric modeling system is expected to lead to improved local weather and hydrologic forecasts, and improved understanding of, and the ability to simulate, the spatial variability of atmospheric and hydrologic processes and features.
5. Research Linkages/Partnerships/Collaborators, Communications and Networking: As part of our model development and testing, we have been collaborating with NOAA’s Forecast Systems Laboratory (FSL), Local Analysis and Prediction System (LAPS) personnel and the associated (LAPS) datasets (see the publication listed below).
6. Awards/Honors: None 7. Outreach: Conference and meeting presentations: Liston, G. E., 2004: Merging observations and models to describe snow-related land atmosphere interactions at local to global scales. Civil and Environmental Engineering Department, Duke University, 12 October, Durham, North Carolina. Liston, G. E., and K. Elder, 2004: A meteorological distribution system for high resolution terrestrial modeling (MicroMet). American Geophysical Union, Fall Meeting, December 13-17, San Francisco, California. Liston, G. E., and K. Elder, 2004: A distributed snow evolution modeling system (SnowModel). American Geophysical Union, Fall Meeting, December 13-17, San Francisco, California. 8. Publications: Liston, G. E., and K. Elder, 2005: A meteorological distribution system for high resolution terrestrial modeling (MicroMet). In review. Liston, G. E., D. L. Birkenheuer, C. A. Hiemstra, D. Cline, and K. Elder, 2005: NASA Cold Land Processes Experiment (CLPX): Atmospheric analyses data sets. In review.

25
ADVANCED ENVIRONMENTAL SATELLITE RESEARCH SUPPORT Principal Investigator: James F.W. Purdom NOAA Project Goal: Weather and Climate Key Words: Future satellite systems, advanced data utilization, GOES-R system architecture 1. Long Term Goals and Specific Plans to Achieve Them: Advanced environmental satellite research to investigate advanced utilization of systems and satellite derived information for current and future satellite systems through presentations and publications on satellite data utilization, global leadership for evolution of the Global Observing System; recommendations for future NOAA satellite system evolution; international outreach and training activities.
2. Research Accomplishments/Highlights:
Leading WMO in addressing the role of satellites in the redesign and evolution of the Global Observing System.
o WMO/TD No. 1267 “Implementation Plan for Evolution of Space and Surface-based Sub-systems of the GOS” developed by the CBS OPAG-IOS
Investigations of the spectral, spatial and temporal requirements for geostationary satellites as part of a space-based Global Observing System, with particular emphasis on satellite system synergy
Development and Implementation of electronic notebooks for WMO Satellite Training in Costa Rica
Instructor at AMS Satellite Conference 2005 Short Course on Satellite Meteorology and Oceanograph: “Applications of Advanced Imagers.”
4. Leveraging/Payoff: Research and training activities under this activity will help NOAA define future satellite systems while helping assure full utilization near the beginning of the systems space life. Early utilization is worth approximately $60,000 per day of satellite lifetime. 5. Research Linkages/Partners/Collaborators and Planning Activities:
WMO’s Members through Chairing Commission on Basic Systems (CBS) Open Program Area Group (OPAG) on Integrated Observing Systems (IOS) and as a member of the WMO CBS Management Group
WMO Representative to the Coordination Group for Meteorological Satellites (CGMS) which includes heads of all operational and many research satellite agencies or their representatives

26
Co-Chairing the WMO CGMS Virtual Laboratory for Satellite Data Utilization and Training Focus Group which joins together major satellite operators and WMO Centers of Excellence for Global Satellite Training
Planning on the future use of satellite data as part of the THORPEX International Implementation Planning Team
Co-chair of THORPEX Observing System Working Group that is setting goals and objectives for both space-based and in-situ observing systems to support THORPEX
Satellite Meteorology Subject Matter Expert (SME) for Bulletin of American Meteorological Society
6. Awards/Honors: None during this period
7. Outreach – committees and advisory roles
Chair, World Meteorological Organization (WMO) Open Program Area Group on the Integrated Observing System (OPAG IOS)
Co-Chair, WMO/CGMS Virtual Laboratory for Satellite Data Utilization and Training
Chair, EURAINSAT International Review Board Co-Chair, Joint Center for Satellite Data Utilization Advisory Board Co-Chair, THORPEX Observation Systems Working Group International Precipitation Working Group Rapporteur to the Coordination Group
for Meteorological Satellites Advisor to General Kelly, U.S. Permanent representative to World Meteorological
Organization (WMO) at WMO Executive Council WMO Commission on Basic Systems Management Group GOES I/M Technical Advisory Committee THORPEX International Implementation Team WMO/IUGG International Aerosol-Precipitation Science Assessment Group
(IAPSAG)
8. Publications: Conference presentations with conference papers SPIE Conference, Denver, CO (Invited)
o “Virtual Laboratory for Satellite Training and Data Utilization.”
AMS Conference on Satellite Meteorology and Oceanography VA (Invited) o “Applications and Implications of the Next Generation Meteorological
satellite Imagers and Sounders.”

27
Internationally Invited Presentations Beijing, China, September, 2005: Two hour special talk, The talk was the 17th in a special series that has had other presenters including a Nobel Laureate, the Secretary General of WMO and the Administrator of NOAA.
o “Advanced Applications of Satellite Data: The Need for Synergy.” Presentations at workshops and conferences 4th Hyperspectral Workshop, Madison, WI
“Hyperspectral observations and the requirement for satellite system synergy in the GOES-R era”
AMS short course on the “Next Generation of Environmental Sensors and Emerging Applications,” Norfolk, VA (Invited)
“Applications of Advanced Imagers.” International Precipitation Working Group Meeting, Monterey, CA,
“The framework of the IPWG within CGMS” SPIE Conference, Honolulu, Hawaii (Invited)
“Nowcasting severe weather with GOES-R” AMS Annual Meeting, San Diego, Special session on GOES-R and NPOESS (Invited)
“Satellite System Synergy” WMO Training Workshop for RA III and RA IV, Costa Rica
“Using satellite data for mesoscale convective forecasting” “Multispectral and hyperspectral satellite data analysis”
International TOVS Study Conference, Beijing, China
“Evolution of the Space and Surface-Based Sub-Systems of the Global Observing System” “The Virtual Laboratory for Satellite Training and Data Utilization”

28

29
ADVANCED WEATHER (AWIPS) SUPPORT FOR SATELLITE HYDRO-METEOROLOGY (SHYMET) AND VISIT TRAINING AND EDUCATION Principal Investigator: B.H. Connell NOAA Project Goal: Weather and Water
Key Words: Local Forecasts and Warnings, Weather Water Science, Technology and Infusion 1. Long-term Research Objectives and Specific Plans to Achieve Them: Long term research goals include: 1) improved forecast training capabilities and NWS compatible VISIT training sessions due to training development on a platform used by NWS; 2) porting of CIRA research products into AWIPS; and 3) evaluation of and input to improvement of AWIPS satellite data utilization and analysis capabilities. To achieve these objectives, multiple NOAAPORT/AWIPS options have been researched, collaborative work with FSL, COMET and CIMSS has been completed, funds for the NOAAPORT portion of the project have been obtained from NWS, and a proposal for funding of an AWIPS system has been submitted to NESDIS. Once a NOAAPORT data ingest and an AWIPS data processing and display system are installed at RAMM/CIRA, joint efforts with FSL, COMET and CIMSS will continue to facilitate system familiarization and investigate product insertion.
2. Research Accomplishments/Highlights: As this is a new project, highlights to this date include the significant research into system components, definition of the most cost effective system to meet RAMM/CIRA’s objectives, and verification of the proposed configuration with FSL. 3. Comparison of Objectives Vs. Actual Accomplishments for Reporting Period: The acquisition of the NOAAPORT system was somewhat delayed because the technology was in a transitional phase. We did not want to purchase a system that would soon be archiac, so we waited on the development of the more modern version that utilized Linux rather than UNIX. Otherwise, the project is on schedule. 4. Leveraging/Payoff: The current AWIPS configuration provides a minimal satellite data set and no advanced analysis capabilities. Improved forecaster training with advanced satellite data will provide better forecasts and better utilization of NOAA satellite data. 5. Research Linkages/Partnerships/Collaborators, Communications and Networking: This project leverages funds obtained from NWS to facilitate data ingest. Collaborators will include COMET, CIMSS, and FSL.

30
6. Awards/Honors: None at this time 7. Outreach: (a) Graduate/Undergraduate students (List by name, degree status and continuance after obtaining degree); (b) Seminars, symposiums, classes, educational programs; (c) Fellowship programs; (d) K-12 outreach; (e) Public awareness. None 8. Publications: None at this time

31
AN EVALUATION OF ULTRASONIC SNOW DEPTH SENSORS FOR ESTIMATING 6- AND 24-HOUR SNOWFALL TOTALS Principal Investigators: Roger A. Pielke, Sr. and Nolan J. Doesken NOAA Project Goal: Climate; Climate Observations and Analysis
Key Words: ultrasonic sensors; snowfall; snow depth; Campbell Scientific; Judd 1. Long-term Research Objectives and Specific Plans to Achieve Them:
Snowfall and snow depth measurements are important for a variety of disciplines including commerce, transportation and water supply forecasting as well as most daily activities. This measurement has traditionally been performed by human observers here in the U.S. In the early 1990s the National Weather Service (NWS) first deployed the Automated Surface Observing System (ASOS) for airport weather observations. ASOS automated traditionally manual surface observations such as cloud cover, surface visibility, weather and obstructions to vision, and precipitation type and amount. Unfortunately, ASOS did not measure snowfall or depth because there was no suitable sensor available at that time. After ASOS was deployed, snow measurements were abandoned and many long-term weather stations, and climate records dating back as far as the late 1800s (McKee et al., 2000) were interrupted. Measurements of the water content of snow were also compromised since ASOS used a heated tipping bucket rain gauge that has been shown to underestimate precipitation due to sublimation and wind-related effects (Doesken and McKee, 1999). In recent years, ultrasonic depth sensors have been used to measure snow depth remotely in mountain environments. A study done by the NRCS at Mt. Hood, OR found that addition of depth sensors provided a valuable picture of snowpack dynamics that aided in snowmelt and runoff prediction (Lea and Lea, 1998). The SNOTEL network currently has over 400 operational ultrasonic snow depth sensors across the western U.S. Canadian interest in snow depth sensors dates back to the 1980s (Goodison, 1984). The NWS is currently exploring the possibility of using this measurement technology in ASOS and other surface observing networks. The main objective of this study is to test the performance of these sensors in diverse winter environments to see how well their outputs compare to traditional manual snowfall and depth measurements. We will also report on the status of an algorithm to derive 6 hour snowfall from the continuous snow depth reported by the sensors. The results will begin to show what potential these sensors may have to compliment existing NWS automated weather instruments. In the early 1990s the National Weather Service (NWS) deployed the Automated Surface Observing System (ASOS) at airport locations. The introduction of automated sensors for measuring surface conditions led to the abandonment of snow measurements at many sites because there was no automated alternative for measuring snow. The NWS is now exploring the possibility of installing electronic snow depth sensors. But do these new sensors measure and report snow in a manner that

32
accurately depicts true snow accumulation and favorably compares to traditional manual snow measurements used for so many climate applications? This study attempts to answer these questions. Ultrasonic snow depth sensors from two different manufacturers were tested and compared to traditional manual measurements at sites across the country. 2. Research Accomplishments/Highlights:
The two sensors that are being tested are the Judd Communications (2004b) sensor and the Campbell Scientific sensor (SR-50) . Both companies have been manufacturing and distributing depth sensors for several years. Fourteen sites either volunteered or were invited to help with this study. Nine of these sites were NWS Forecast Offices. More sites were interested, but available instrumentation limited the study to 14 locations. To be considered, sites had to have the capability of measuring and reporting snowfall and depth manually at 6-hourly increments for all or the majority of the snowfall season. All sites had adjacent open areas suitable for installation of USDSes. Ideally, all sites should have had at least one Judd and one Campbell Scientific USDS to support intercomparisons; but limitations resulted in 4 sites having only one type or the other. For ease of analysis, the sites have been broken into classes depending on the equipment they are testing. Class I sites have at least one Judd and one Campbell sensor, Class II have at least one Judd sensor only, Class III have at least one Campbell sensor only. Grand Rapids, MI had a unique arrangement with multiple Judd sensors, some digital and some analog. The study sites span various climate types. The sites have been summarized using the Koeppen Climate Classification (FAO, 2005). Sites range from dry to temperate to cold. They also receive varying amounts of snowfall each year. Most of the sites receive greater than 24 inches of snow annually. Although we wanted to test in many climate regions, this project is a single-season intercomparison. Therefore, it was important to sample in many snowy areas to make sure we had a large sample of snow events to compare. Manual and automated data from the Judd sensor were collected during the 2003-2004 snow season from 3 sites: Fort Collins, CO, Stove Prairie, CO and New Brunswick, OH. For the 2004-2005 season 15 sites were instrumented with ultrasonic depth sensors and agreed to take 6 and 24 hour manual measurements of snowfall, snow depth, snow water equivalent and gauge precipitation. Additional measurements were taken of elements such as temperature, snow crystal type, wind speed, and visibility to see what factors may influence sensor performance.

33
3. Comparison of Objectives Vs. Actual Accomplishments for Reporting Period: Based on one winter of data collection at sites across the U.S., the USDSes did a good job of representing the amount of snow present on the ground. Both the Judd and the Campbell Scientific USDSes performed reliably over large ranges of weather conditions with relatively few equipment problems. At the sites that have been analyzed so far, automated depth measurements tended to report less snow on the ground than was observed manually. The sensors agreed more closely with the amount of snow reported in their immediate vicinity than what was manually measured at the conventional observing site. This pointed out just how important siting and exposure are for consistent and comparable measurement. The non snow-depth related scatter and noise in USDS data is problematic, and must be considered. Fortunately, the high-level scatter such as spikes from windy or low- density snow situations are easily identified and filtered out. The small-scale scatter is still of concern, especially when trying to calculate snowfall values based on increasing or decreasing depth of snow. For the purposes of this study, a centered 3-hour moving average was used to smooth the data, but for real-time operations, better sampling and smoothing algorithms will be needed. Smoothing makes it difficult to detect in real time when snow first begins to accumulate, but it reduces the large number of “false snow accumulation” reports. Many applications would already find the raw data produced by USDSes very useful, but real-time snow depth measurements will be most important for forecasting, transportation and snow-removal applications. Based on this study, we are confident that estimates of traditionally reported “snowfall” will be possible from the USDS data. Data continuity studies will be required, however, and improvements in the snowfall algorithm will be necessary to account for melting, settling and possibly even drifting. It is still to be determined if a single sensor configuration will suffice, or if multiple sensors will be preferred in order to better account for spatial variability in snow accumulation. After just one season of detailed testing, it soon becomes apparent how informative continuous snow depth time series can be. These data are very instructive and quickly show many characteristics of snow accumulation, distribution, densification and melting that would have immediate applications in many fields. USDS data would quickly become a valued attribute to the climate record. Some “noise” is inherent in the raw data from these depth sensors. Simple smoothing techniques can remove most outliers, especially retrospectively. The presence of low- density dendritic crystals, high winds, and the presence of blowing snow produce occasional spurious readings. Some stations, especially those using outdoor battery power, experienced diurnal fluctuations. High frequency fluctuations of several tenths of an inch can occur, even with no snow on the ground. At most sites, manual measurements and ultrasonic depth measurements compared very favorably. Manual measurements were often slightly higher. There were several

34
instances where very large differences were observed. In these cases, we found that blowing and drifting patterns were affecting snow accumulation beneath the new sensors. Not surprisingly, station configuration and siting are very important to assure representative data. For many snow-related applications, there is a desire to derive incremental snow accumulation (snowfall) data from changes in observed depth. We are just beginning to develop a snowfall estimation algorithm. The success hinges on successful data smoothing techniques that can be implemented in real time. 4. Leveraging/Payoff:
Ultrasonic depth sensors appear to track snow accumulation very well. Standardizing instrument siting will improve data quality, but there will be periodic brief periods during heavy snow and/or blowing snow situations when accurate data will not be provided. High frequency noise is an impediment to computing accurate snow accumulation estimates in real time. Overall, this sensor has the potential to greatly improve monitoring and our understanding of snow accumulation, settling and melting. 5. Research Linkages/Partnerships/Collaborators, Communications and Networking: Thanks to the NWS for funding this project and to all the NWS employees that are contributing time and effort to making manual snow measurements. Special thanks to all of our non-NWS site observers Carol Sullivan of Stove Prairie, CO; Dave Lesher of Davis, WV; Nick Stefano of High Point, NJ; Randy Borys of Storm Peaks Laboratory at the Steamboat Springs Ski Area; and Randall Osterhuber of Sierra Snow Laboratory for all of their help with this project. 6. Awards/Honors: None as yet 7. Outreach: (a.) Graduate/Undergraduate students (List by name, degree status and continuance after obtaining degree) Wendy Brazenec, completing M.S. degree in Natural Resources; (b) Seminars, symposiums, classes, educational programs; NOAA Snowfall Network Observations Workshop (SNOW) and NOAA Data User’s Forum: Surface Weather & Climate Observations and Data (July 2004). Seminar to AASC (American Association of State Climatologists) Annual meeting (August 2004). Presentation at the Annual AGU (American Geophysical Union) meeting (December 2004). Presentation at the 25th Annual AGU Hydrology Days Conference (March 2005). Presentation at the 15th AMS Conference on Applied Climatology (June 2005).

35
(c) Fellowship programs: (d) K-12 outreach; (e) Public awareness. 8. Publications: Brazenec, W.A., N.J. Doesken, and S.R. Fassnacht, 2004: Evaluation of Two Ultrasonic Snow Depth Sensors for National Weather Service Automated Surface Observing System. Paper C13A-0302, American Geophysical Union Annual meeting, December 2004. Brazenec,W.A. N.J. Doesken, and S.R. Fassnacht, 2005: Evaluation of Two Ultrasonic Snow Depth Sensors for National Weather Service (NWS) Automated Surface Observation System (ASOS) Sites. 25th Annual AGU Hydrology Days, Colorado State University, March 9, 2005, Fort Collins, CO 80523. Brazenec, Wendy A., and Nolan J. Doesken, 2005 An Evaluation of Two Ultrasonic Snow Depth Sensors for Potential Use At Automated Surface Observing Sites. 15th AMS Conference on Applied Climatology, June 2005, Paper No. JP-125.

36

37
ANALYSES AND DIAGNOSITIC STUDIES FROM SMN RADAR AND RELATED DATA IN SUPPORT OF NAME Principal Investigator: Dr. Timothy J. Lang NOAA Project Goal: Climate- Climate Observations and Analysis, Climate Predictions and Projections, Climate Forcing Key Words: Radar Meteorology, North American Monsoon, Rainfall 1. Long-term Research Objectives and Specific Plans to Achieve Them: a) Calibrate and quality control Mexican weather service (SMN) radar-rainfall data obtained during the North American Monsoon Experiment (NAME), which occurred during summer 2004. For this we are comparing measurements from the SMN radars with rain gauges, the NCAR/NSF S-Pol polarimetric radar, and the TRMM satellite. b) Create a merged, quality-controlled reflectivity product from all available radars (SMN and S-Pol) that can used to develop high temporal resolution (~15 minutes) 2-D rainfall maps. Then post these products on the NAME website and in the JOSS archive for access by all NAME investigators. c) Carry out basic diagnostic studies using the merged radar products, emphasizing quantitative rainfall estimation, convective fraction of precipitation, event structure and evolution, convective forcings, mesoscale dynamical organization, and diurnal cycle. These secondary data products also will be shared with the NAME community. d) Evaluate biases in satellite rainfall over the NAME region using NAME radar-based rainfall products. e) Study the relationships between convective storms, synoptic forcing, and lightning in this region, through intercomparison of the radar-based rainfall products, upper-air data, and cloud-to-ground lightning observations made by the long-range National Lightning Detection Network (NLDN).
2. Research Accomplishments/Highlights:
We are in the final stages of quality control for Version 1 of the data, and are now processing the merged radar composites. These will be available this summer, after which we will commence analysis of these data. The final dataset provides rainfall and reflectivity snapshots every 15 minutes over 6 weeks of observations, encompassing the main period of the North American Monsoon (July and August). The dataset includes observations of a wide variety of convective storms, and covers the occurrence of several major synoptic events that affected convective behavior: moisture surges in the Gulf of California, a tropical storm passage, and numerous easterly wave passages. In addition, we have contributed to a journal article on the entire NAME project, which is

38
currently under review for publication in the Bulletin of the American Meteorological Society.
3. Comparison of Objectives Vs. Actual Accomplishments for Reporting Period:
a) Complete - Data quality control and radar intercomparisons are complete for Version 1 of the data, which will be distributed to the NAME community shortly. Work on Version 2 of the data, with improved quality control and rain estimation, will be started this fall. b) In Progress – Version 1 merged radar composites currently are being merged and should be available this summer. After these are made available, we will seek to merge the radar-based rainfall estimates with rain gauge measurements during the same time period. This will provide a high-quality rainfall product, with better spatial resolution and larger areal coverage than either network could provide on its own. c) Yet To Be Started – This work will commence this summer immediately after the Version 1 products are made publicly available. d) Yet To Be Started – Incoming master's student this fall will work on this project. e) In Progress – While waiting for the radar composites, analysis of the lightning and sounding data taken during NAME has been started.
4. Leveraging/Payoff: NAME seeks to determine the underlying sources of predictability of warm season precipitation over North America. To achieve its objectives, NAME employs a multi-scale approach with focused monitoring, diagnostic, and modeling activities in the core monsoon region (Tier I), on the regional scale (Tier II), and on the continental scale (Tier III). The SMN and S-Pol radar observations were made in order to improve our understanding of convective processes within Tier I (northwestern Mexico and the southwestern United States), the central location of the North American Monsoon system. The latent heat release from the convection in this region is a principal driver for the monsoon, which itself is a principal mode of variability for warm season weather in the United States. Thus, in order to improve our understanding and forecasting ability of this weather, we must better understand the large-scale behavior of the monsoon, and for that we must first understand the behavior of convection with its core region. In particular, we need to examine the effects of various atmospheric, oceanic, and land surface characteristics and processes on convective behavior, as well as on precipitation amount and distribution. The NAME radar network is being used to understand these effects.

39
5. Research Linkages/Partnerships/Collaborators, Communications and Networking: Walt Petersen of University of Alabama-Huntsville – Collaboration on lightning, radar and upper-air analyses Phil Arkin of University of Maryland – Collaboration on intercomparison with satellite rainfall estimation National Center for Atmospheric Research – Collaboration on collection of the data, quality control of the data, synthesis of the radar composites, merging of radar and rain gauge data, and analysis of the data Vaisala Corporation – Providers of long-range NLDN data
6. Awards/Honors: N/A
7: Outreach: (a.) L. Gustavo Pereira, Ph.D. candidate
8. Publications: Higgins, W., et al., 2005. “The North American Monsoon Experiment (NAME) 2004 Field Campaign and Modeling Strategy”, Bulletin of the American Meteorological Society, In Review. Lang, T. J., D. Ahijevych, R. Carbone, R. Cifelli, S.W. Nesbitt, G. Pereira, and S. A. Rutledge, 2005. “Radar Observations During NAME 2004. Part I: Data Products and Quality Control”, 32nd Conf. On Radar Meteorology, Albuquerque NM, American Meteorological Society.
Lang, T. J., D. Ahijevych, R. Carbone, R. Cifelli, S.W. Nesbitt, G. Pereira, and S. A. Rutledge, 2005. “Radar Observations During NAME 2004. Part II: Preliminary Results”, 32nd Conf. On Radar Meteorology, Albuquerque NM, American Meteorological Society.
Lang, T. J., D. Ahijevych, R. Carbone, R. Cifelli, S.W. Nesbitt, G. Pereira, and S. A. Rutledge, 2005. “Radar Observations During NAME 2004 – Data Products and Initial Results”, NOAA Climate Diagnostics and Prediction Workshop, State College PA, NOAA.

40

41
ANALYSIS AND INTERPRETATION OF CENSUS DATA Principal Investigator: Shripad D. Deo NOAA Project Goal: Weather and Water (Serve society’s needs for weather and water information) Key Words: Social Science, Communication, Education 1. Long-term Research Objectives and Specific Plans to Achieve Them: The infusion of new science and technology to enhance the quality of information about water resources needs complementary efforts to improve the understanding of how that information is used by diverse user groups served by NOAA’s National Weather Service. To improve such an understanding, the producers of information need to know the institutional, economic, and cultural contexts within which decisions are made by the consumers of their information. To provide useful and usable information the producers need to cultivate socio-technical networks, develop appropriate information tools, and understand the context in which these tools are used. We have started developing a database to support various watches and warnings issued by NWS with census information in graphical and text format. This information will allow the first responders to know the demographic details of an area under threat. By knowing the scope and nature of threat, they can assess vulnerabilities to plan and match resources accordingly. 2. Research Accomplishments/Highlights: a. Effective delivery of water resources information through improved organization on webpages b. Increased appreciation of user information needs to make better decisions c. New recognition of social sciences perspective on science and technology 3. Comparison of Objectives vs. Actual Accomplishments for Reporting Period: The primary objective of providing social sciences input to enhance the quality and understanding of information for better decision-making was achieved during this reporting period through training workshops, focus groups, and new prototype designs. 4. Leveraging/Payoff: The work done with water resources information has provided a template for a social sciences perspective on weather and climate information. 5. Research Linkages/Partnerships/Collaborators, Communication and Networking:

42
6. Awards/Honors: The project was recognized with Regional Excellence Award for collaborative efforts with Climate Services Division in August 2004. 7. Outreach: 8. Publications:

43
APPLIED RESEARCH IN SUPPORT OF IMPLEMENTATION OF NATIONAL WEATHER SERVICE ADVANCED HYDROLOGIC PREDICTION SERVICES IN CENTRAL REGION Principal Investigator: Shripad D. Deo NOAA Project Goal: Weather and Water (Serve society’s needs for weather and water information) Key Words: Social Science, Communication, Education 1. Long-term Research Objectives and Specific Plans to Achieve Them: The infusion of new science and technology to enhance the quality of information about water resources needs complementary efforts to improve the understanding of how that information is used by diverse user groups served by NOAA’s National Weather Service. To improve such an understanding, the producers of information need to know the institutional, economic, and cultural contexts within which decisions are made by the consumers of their information. To provide useful and usable information the producers need to cultivate socio-technical networks, develop appropriate information tools, and understand the context in which these tools are used. 2. Research Accomplishments/Highlights: a. Effective delivery of water resources information through improved organization on webpages b. Increased appreciation of user information needs to make better decisions c. New recognition of social sciences perspective on science and technology 3. Comparison of Objectives vs. Actual Accomplishments for Reporting Period: The primary objective of providing social sciences input to enhance the quality and understanding of information for better decision-making was achieved during this reporting period through training workshops, focus groups, and new prototype designs. 4. Leveraging/Payoff: The work done with water resources information has provided a template for a a social sciences perspective on weather and climate information. 5. Research Linkages/Partnerships/Collaborators, Communication and Networking:

44
6. Awards/Honors: The project was recognized with Regional Excellence Award for collaborative efforts with Climate Services Division in August 2004. 7. Outreach: 8. Publications:

45
ATMOSPHERIC CO2 INVERSION INTERCOMPARISON PROJECT (TRANSCOM3) Principal Investigator: A. Scott Denning NOAA Project Goal: Climate NOAA Programs: Climate Observations and Analysis Key Words: Numerical Modeling, Inverse Modeling, Global Climate Change, Carbon Dioxide 1. Long-term Research Objectives and Specific Plans to Achieve Them: The archive of TransCom model output is a detailed characterization of the response of the atmosphere to hundreds of scenarios of tracer emissions relevant to the carbon cycle, as simulated by nearly every transport model being used for inverse calculations. Think of the archive as the results of a series of forward experiments using transport models to carry pulses of CO2 from particular regions in particular months: after releasing each pulse for a period of one month, concentrations were calculated everywhere in the atmosphere for three simulated years, after which time the concentration is well-mixed. This was done for pulses released from each of 22 regions in each of 12 months, for each of 11 models (to date), for a total of 2904 three-year experiments. Archived output from each experiment includes global monthly mean gridded 3-D concentrations and winds, gridded monthly mean surface concentrations, and timeseries of simulated tracer concentrations and meteorological variables every four hours at 228 locations (Fig. 1), and ancillary “metadata.” Ongoing analysis of the archived TransCom results includes many studies by TransCom participants. We are analyzing the seasonal cycle of estimated regional fluxes and its sensitivity to differences in model transport. The interannual variability in regional fluxes is being estimated using the suite of model output. Also, interannual variability in the transport is being analyzed with respect to its effect on the retrieved fluxes and are analyzing the sensitivity of the estimated regional fluxes to the selection of data: which stations are used for which time periods, the placement of coastal stations in the models, treatment of missing periods in station records, and the level of expected model-data mismatch (error) at each station. A study on the potential use of daily or even four-hourly measurements on the uncertainty in the retrieved fluxes was presented at Sendai by Law, et al (2001). The impact of boundary-layer parameterization, stratosphere-troposphere exchange, and CO oxidation as an atmospheric source of CO2 are being studied using TransCom output (Pak and Prather, 2001). The simulated atmospheric rectifier effect among the models is being evaluated using vertical profile data collected by airborne platforms (Stephens et al, 2001). The effects of transport error and model-to-model differences on potential inversions for carbon fluxes from CO2 retrievals from satellite remote sensing is being studied (Denning et al, 2001). A number of studies of optimal observing systems and network design are being carried out using TransCom output (Maki et al, 2001; Patra et al, 2001; Suntharalingam et al, 2001). TransCom results are also being used to explore potential

46
multitracer inversions using stable isotope ratios of CO2 and atmospheric potential oxygen (APO). This proposal did not seek funding to conduct the research described above. Rather, support is sought for activities to enable this research and related work by many scientists throughout the world. The actual research is supported by many sources at institutions where the work is performed. The work described here is going on now, but the results of the TransCom 3 experiments provide a wealth of information about the detailed behavior of leading transport models that will be mined for years to come by other scientists in ways that we cannot foresee. TransCom model output has been organized and saved to facilitate access and retrieval of information in support of science goals. For example, every participating modeler
Figure 1: Locations of grid cells selected for high-frequency (4-hr) output in TransCom 3 experiments. Many are currently locations where real data are being collected. Others represent hypothetical observing locations.

47
used a common code for creating output files, which was specified in the experimental protocol to avoid confusing differences in file formats or reporting units. All output data are now available to TransCom participants through a password-protected ftp site. Nevertheless, we continue to receive frequent requests from participants for “specialized” retrieval of specific information from these very large files, even though the current “user base” is made up of the experts who created the results. During our recent TransCom workshop, participants agreed that upon publication of the paper on the cyclostationary (seasonal) “control” inversion results, we would open the results to all interested parties in the scientific community. We expect this to occur by the end of 2003. It is hoped that this will stimulate new research by others and lead to new insights about the carbon cycle and tracer transport modeling. In addition to the simulated CO2 concentrations, this open archive will include the flexible, powerful code used to perform the annual mean, seasonal, and interannual inversions used in the TransCom experiments. Interested scientists around the world will be able to repeat our calculations or to design their own inversion algorithms and compare results directly to a community-wide, published result, using identical input and code if they wish. This will be a very valuable resource for the larger scientific community, and will provide an opportunity for new investigators to explore and advance inverse modeling without the need to begin with a forward transport model. We developed a very thorough experimental protocol document (Gurney et al, 2000) which guides a participant through every phase of the experiments. This document can be found electronically on the web and will continue to be made available, along with all input data sets, model output code, inversion codes, and other documentation. This will allow transport modelers who did not participate in the original experiments to perform them later and compare results directly with the rest of the community. The experiments have become a benchmark for model evaluation and we will assist other modelers who wish to perform them. The existing TransCom website (http://transcom.colostate.edu) has been maintained and updated to present and highlights new results as they are produced and published. In addition, we have developed an automated data access system that will allow new users to browse model output and documentation themselves. This will reduce the workload on live programmers for assisting new users. 2. Research Accomplishments/Highlights: We have continued to expand the TransCom website, incorporating the new interannual inversion results. This includes both the results from individual models and the various data files that would allow interested investigators to reproduce the control estimates. We have further provided code and data that would allow interested investigators to perform independent inversion work. We have further updated the website to reflect recent results from a TransCom meeting in Paris. This includes all the Powerpoint presentations, agenda, progress reporting, and future issues.

48
3. Comparison of Objectives Vs. Actual Accomplishments for Reporting Period: We have completed the objective to include all interannual results and supporting materials. Our ongoing support of workshops results is in progress. We have completed the reorganization of the ftp server to provide researchers with all the model output, input files, code, and manuals for global scale inverse modeling. 4. Leveraging/Payoff: The maintenance of the database and website for the TransCom experiment continues to provide researchers with all the ingredients needed to perform global scale inversions with a full suite of model transport realizations. The aim of much of this work is the characterization of carbon sources and sinks which is a critical component of accurate projections of climate change over the coming decades. The importance of such projections to public policy and decision making is immeasurable. 5. Research Linkages/Partnerships/Collaborators, Communications and Networking: A substantial number of scientists have participated in TransCom activities. Among them are: Kevin Robert Gurney: Department of Atmospheric Science, Colorado State University, Fort Collins, CO, 80523 Rachel M. Law: CSIRO Atmospheric Research, PMB 1, Aspendale, Victoria 3195, Australia Scott Denning: Department of Atmospheric Science, Colorado State University, Fort Collins, CO, 80523 Peter J. Rayner: Laboratoire des Sciences du Climat et de l'Environment (LSCE), F-91198 Gif-sur-Yvette Cedex, France David Baker: National Center for Atmospheric Research (NCAR), Boulder, CO 80303 Philippe Bousquet: Laboratoire des Sciences du Climat et de l'Environment (LSCE), F-91198 Gif-sur-Yvette Cedex, France Lori Bruhwiler: National Oceanic and Atmospheric Administration (NOAA), Climate Monitoring and Diagnostics Laboratory, 326 Broadway R/CG1, Boulder, CO 80303 Yu-Han Chen: Department of Earth, Atmospheric, and Planetary Science, Massachusetts Institute of Technology (MIT), Cambridge, MA 02141

49
Philippe Ciais: Laboratoire des Sciences du Climat et de l'Environment (LSCE), F-91198 Gif-sur-Yvette Cedex, France Inez Y. Fung: Center for Atmospheric Sciences, McCone Hall, University of California, Berkeley, Berkeley, CA 94720-4767 Martin Heimann: Max-Planck_Institute fur Biogeochemie, D-07701 Jena, Germany Jasmin John: Center for Atmospheric Sciences, McCone Hall, University of California, Berkeley, Berkeley, CA 94720-4767 Takashi Maki: Quality Assurance Section, Atmospheric Environment Division, Observations Department, Japan Meteorological Agency 1-3-4 Otemachi, Chiyoda-ku, Tokyo 100-8122 Japan Shamil Maksyutov: Institute for Global Change Research, Frontier Research System for Global Change, Yokohama, 236-0001 Japan Philippe Peylin: Laboratoire des Sciences du Climat et de l'Environment (LSCE), F-91198 Gif-sur-Yvette Cedex, France Michael Prather: Earth System Science, University of California, Irvine, CA 92697-3100 Bernard C. Pak: Earth System Science, University of California, Irvine, CA 92697-3100 Shoichi Taguchi: National Institute of Advanced Industrial Science and Technology, 16-1 Onogawa Tsukuba, Ibaraki 305-8569 Japan 6. Awards/Honors: 7. Outreach: (a.) Graduate/Undergraduate students (List by name, degree status and continuance after obtaining degree); (b) Seminars, symposiums, classes, educational programs; (c) Fellowship programs; (d) K-12 outreach; (e) Public awareness. The agenda and talks presented at the Paris 2005 TransCom meeting can be found at http://transcom.colostate.edu/TransCom_3/transcom_3.html. The meeting was held from June 13-16, 2005, at which 20 speakers presented 32 different talks. The TransCom Data Base The TransCom data base is served from a dual processor Pentium system with a 250 Gbyte disk. The system is running Linux-based FTP server. The data base may be accessed at URL: ftp://dendrus.atmos.colostate.edu/transcom.
Table 1 shows the contents of the server.
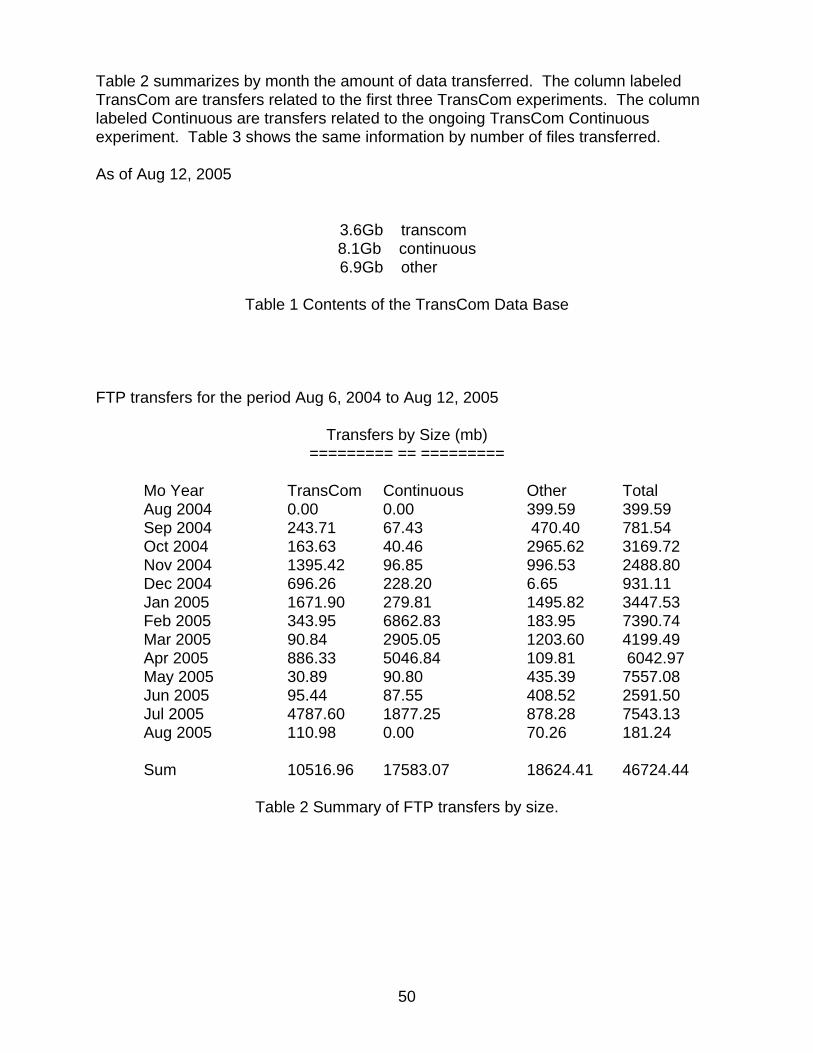
50
Table 2 summarizes by month the amount of data transferred. The column labeled TransCom are transfers related to the first three TransCom experiments. The column labeled Continuous are transfers related to the ongoing TransCom Continuous experiment. Table 3 shows the same information by number of files transferred.
As of Aug 12, 2005
3.6Gb transcom 8.1Gb continuous
6.9Gb other
Table 1 Contents of the TransCom Data Base
FTP transfers for the period Aug 6, 2004 to Aug 12, 2005
Transfers by Size (mb) ========= == =========
Mo Year TransCom Continuous Other Total Aug 2004 0.00 0.00 399.59 399.59 Sep 2004 243.71 67.43 470.40 781.54 Oct 2004 163.63 40.46 2965.62 3169.72 Nov 2004 1395.42 96.85 996.53 2488.80 Dec 2004 696.26 228.20 6.65 931.11 Jan 2005 1671.90 279.81 1495.82 3447.53 Feb 2005 343.95 6862.83 183.95 7390.74 Mar 2005 90.84 2905.05 1203.60 4199.49 Apr 2005 886.33 5046.84 109.81 6042.97 May 2005 30.89 90.80 435.39 7557.08 Jun 2005 95.44 87.55 408.52 2591.50 Jul 2005 4787.60 1877.25 878.28 7543.13 Aug 2005 110.98 0.00 70.26 181.24
Sum 10516.96 17583.07 18624.41 46724.44
Table 2 Summary of FTP transfers by size.

51
Transfers by Count
========= == =====
Mo Year TransCom Continuous Other Total Aug 2004 0 0 477 477 Sep 2004 330 10 447 787 Oct 2004 77 6 1226 1309 Nov 2004 116 24 277 417 Dec 2004 74 50 222 346 Jan 2005 265 91 806 1162 Feb 2005 93 419 254 766 Mar 2005 31 188 147 366 Apr 2005 113 122 126 361 May 2005 10 4 379 393 Jun 2005 29 21 4778 4828 Jul 2005 835 49 59 943 Aug 2005 29 0 43 72
Sum 2002 984 9241 12227
Table 3 Summary of FTP transfers by count.
8. Publications: The following publications have been produced by members of the TransCom community since its inception. As mentioned above, this research in this project is not funded by this grant, but this grant enables the collaborative work to go forward. Peer Reviewed Denning, A.S. M. Holzer, K.R. Gurney, M. Heimann, R.M. Law, P.J. Rayner, I.Y. Fung, S. Fan, S. Taguchi, P. Friedlingstein, Y. Balkanski, M. Maiss, and I. Levin, "Three-dimensional transport and concentration of SF6: A model intercomparison study (Transcom 2)," Tellus, 51B, 266-297, 1999. Gurney, K., R. Law, P. Rayner, and S. Denning, “TransCom 3 Experimental Protocol,” Department of Atmospheric Science, Colorado State University, paper no. 707, July 2000. Engelen, R.J., A.S. Denning, K.R. Gurney, and G.L. Stephens, "Global observations of the carbon budget: I. Expected satellite capabilities in the EOS and NPOESS eras," Journal of Geophysical Research, 106 (D17), 20055-20068, 2001 Gurney, K.R., R.M. Law, A.S Denning, P.J. Rayner, D. Baker, P. Bousquet, L. Bruhwiler, Y.H. Chen, P. Ciais, S. Fan, I.Y. Fung, M. Gloor, M. Heimann, K. Higuchi, J.

52
John, T. Maki, S. Maksyutov, K. Masarie, P. Peylin, M. Prather, B.C. Pak, J. Randerson, J. Sarmiento, S. Taguchi, T. Takahashi, C.W. Yuen, “Towards robust regional estimates of CO2 sources and sinks using atmospheric transport models,” Nature, 415, pp. 626-630, February 7, 2002. Gurney, K.R., R.M. Law, A.S Denning, P.J. Rayner, D. Baker, P. Bousquet, L. Bruhwiler, Y.H. Chen, P. Ciais, S. Fan, I.Y. Fung, M. Gloor, M. Heimann, K. Higuchi, J. John, E. Kowalczyki, T. Maki, S. Maksyutov, P. Peylin, M. Prather, B.C. Pak, J. Sarmiento, S. Taguchi, T. Takahashi, C.W. Yuen, “Transcom 3 CO2 Inversion Intercomparison: 1. Annual mean control results and sensitivity to transport and prior flux information,” Tellus, 55B, 555-579, 2003. Engelen, R.J., A. Scott Denning, K.R. Gurney, and TransCom 3 modelers, “On Error Estimation in Atmospheric CO2 Inversions,” Journal of Geophysical Research, 107 (D22), 4635, 2002. Law, R., Y.H. Chen, K.R. Gurney, P. Rayner, A.S. Denning, and TransCom 3 modelers, “TransCom3 CO2 inversion intercomparison: 2. Sensitivity of annual mean results to data choices,” Tellus, 55B (2), 512-521, 2003. Maksytuov, S., T. Machida, H. Mukai, P. Patra, T. Nakazawa, G. Inoue, and TransCom 3 modelers, “Effect of recent observations on Asian CO2 flux estimates with transport model inversions,” Tellus, 55B, 522-529, 2003. Patra, P.K., S. Maksyutov, and TransCom 3 modelers, “Optimal network design for improved CO2 source inversion,” submitted to Tellus, 55B, 498-511, 2003. Patra, P.K., and S. Maksyutov, “Incremental approach to the optimal network design for CO2 surface source inversion,” Geophys. Res. Lett., Vol. 29., No. 10, 10.1029/2001GL013943, 2002. Rayner, P.J. and R. M. Law and D. M. O'Brien and T. M. Butler and A. C. Dilley, “Global observations of the carbon budget: III. Initial assessment of the impact of satellite orbit, scan geometry and cloud on measuring CO2 from space,” J. Geophys. Res., 2002, in press. Roy, T. P. J. Rayner, R. Matear and R. Francey, “Southern hemisphere ocean CO2 uptake: Reconciling atmospheric and oceanic estimates,” Tellus, 2002, in press. Gurney, K.R., R.M. Law, A.S. Denning, P.J. Rayner, B. Pak, and the TransCom 3 L2 modelers, “Transcom 3 Inversion Intercomparison: Control results for the estimation of seasonal carbon sources and sinks,” Global Biogeochemical Cycles,18, GB1010, doi:10.1029/2003GB002111, 2004. Gurney, K.R. “Towards robust regional estimates of carbon sources and sinks using atmospheric transport models - the TransCom 3 Experiment,” World Resource Review, 16 (2), 243-258, 2004.

53
Presentations: Gurney, K.R., P. Rayner, R. Law, and S. Denning, "TransCom 3: Carbon Inversion Intercomparison," Workshop on Inverse Methods in Global Biogeochemical Cycles, Heraklion, Greece, March 16, 1998. Gurney, K.R., P. Rayner, R. Law, and S. Denning, “Atmospheric Carbon cycle Inversion Intercomparison (TransCom 3),” 1998, presented at Fall 1998 AGU Meeting, San Francisco. Gurney, K.R., P. Rayner, R. Law, and S. Denning, "TransCom 3: Atmospheric Carbon Budget Inversion Intercomparison," International Union of Geodesy and Geophysics, Birmingham, UK, July 21, 1999 Gurney, K.R., P. Rayner, R. Law, and S. Denning, "Atmospheric Carbon Budget Inversion Intercomparison: Preliminary Results," presented at Spring meeting of the American Geophysical Union, May 28 – June 4, 2000. Washington DC. Gurney, K.R., R. Law, P.Rayner, A.S. Denning and TransCom modelers, “Robust regional estimates of annual mean CO2 sources and sinks,” poster presentation, Challenges of a Changing Earth, Amsterdam, June 2001. Gurney, K.R., R. Law, P.Rayner, A.S. Denning and TransCom 3 modelers, “Towards more robust estimates of CO2 fluxes: control results from the TransCom 3 inversion intercomparison,” presentation to NOAA PI meeting, Princeton, NJ, August 2001. Gurney, K.R., R. Law, P.Rayner, A.S. Denning and TransCom 3 modelers, “Uncertainty in the TransCom 3 Control Inversion,” presentation to carbon Modeling Consortium meeting, Princeton, NJ, August 2001. Gurney, K.R., R. Law, P. Rayner, S. Denning and TransCom 3 modelers, “The TransCom 3 Experiment: Key Results from an Atmospheric Carbon Cycle Inversion Intercomparison,” talk presented at the 6th International Carbon Dioxide Conference, Sendai, Japan, October 1–5, 2001. Maki, T., T. Koide, T. Sasaki and TransCom 3 modelers, “Sensitivity of Japan Meterological Agency Carbon Dioxide Transport Model to Carbon Dioxide Monitoring Network,” poster presented at the 6th International Carbon Dioxide Conference, Sendai, Japan, October 1–5, 2001. Jacobson, A.S., J.L. Sarmiento, S. Fan, N. Gruber, and TransCom 3 modelers, “Using transport model bias to assess the reliability of inversion results,” poster presented at the 6th International Carbon Dioxide Conference, Sendai, Japan, October 1–5, 2001. Patra, P.K., S. Maksyutov and TransCom 3 modelers, “Optimal Network Design for CO2 Observations Maximizing the Inversion Performance,” poster presented at the 6th International Carbon Dioxide Conference, Sendai, Japan, October 1–5, 2001.
54
Maki, T. et al., "Sensitivity of Japan Meteorological Agency Carbon Dioxide Transport Model to Carbon Dioxide Monitoring Network", Extended abstracts 6th International CO2 Conference, Sendai, Japan, 2001. Maki, T. et al., “Optimum CO2 Monitoring Network Design Using JMA_CDTM and Inversion Method”, Symposium on Atmospheric Composition Change, Yokohama, Japan, 2001. Denning, A.S., K.R. Gurney, R.M. Law, P.J. Rayner, and TransCom 3 Modelers, “Overview of the Atmospheric CO2 Inversion Intercomparison Project (TransCom3),” presented at Sixth International Carbon Dioxide Conference, October 1-5, 2001, Sendai, Japan. Denning, A.S., K.R. Gurney, R. Engelen, G. Stephens, D.O’Brien, P.J. Rayner and TransCom 3 modelers, “Potential Constraints on the Global Carbon Budget Using Satellite Retrievals of Atmospheric CO2,” poster presented at the 6th International Carbon Dioxide Conference, Sendai, Japan, October 1–5, 2001. Maksyutov, S., T. Machida, T. Nakazawa, G. Inoue, H. Mukai, P.K. Patra and TransCom 3 modelers, “Asian CO2 Fluxes Estimated Using Recent Observations and Transport Model Inversions,” talk presented at the 6th International Carbon Dioxide Conference, Sendai, Japan, October 1–5, 2001. Stephens, B.B., L. Bruhwiler, P.P. Tans, K.R. Gurney and TransCom 3 modelers, “Using Airborne, Continental and Climatological Data to Evaluate Global Atmospheric CO2 Inverse Models,” poster presented at the 6th International Carbon Dioxide Conference, Sendai, Japan, October 1–5, 2001. Gurney, K.R. and the TransCom 3 modelers, “Towards robust regional estimates of CO2 sources and sinks using atmospheric transport models,” CSU departmental seminar, March 21, 2002 Gurney, K.R. and TransCom 3 modelers, “Taking Apart the Global Carbon Cycle: Where is the Missing Sink?,” presented at University seminar, University of California, Santa Barbara, CA, May 2002. Law, R.M., K.R. Gurney, P.J. Rayner, A.S. Denning and Transcom3 modelers, “TransCom3: Using multiple transport models to give more robust estimates of CO2 sources and sinks,” Australian Meteorological and Oceanographic Society, 9th National Conference, 18-20 Feb 2002. Law, R.M., “Bias and noise in inversions: how are the inversion results sensitive to the data and models used to constrain them,” Carbon Data-Model Assimilation (C-DAS) summer institute, NCAR, May 20-31, 2002.
55
Patra, P.K., S. Maksyutov, Y. Sasano, T. Nakazawa, “Comparing optimal extension of the CO2 observations: surface vs. satellite,” Atmospheric Chemistry within the Earth System: From Regional Pollution to Global Climate Change, Crete, Greece, September 18-25, 2002. Gurney, K.R., A.S. Denning, Law, R.M., P.J. Rayner, Baker, D., and Transcom3 modelers, Towards robust regional estimates of CO2 sources and sinks using atmospheric transport models, invited to Spring meeting of the American Geophysical Union, Nice France, April 6 – 10, 2003. Gurney, K.R. and Y. Chen, Sensitivity of inverted carbon sources and sinks from seasonally varying fossil fuel emissions, Spring meeting of the American Geophysical Union, Nice France, April 6 – 10, 2003. Skidmore, J., A.S. Denning, K.R. Gurney, K.J. Davis, and P.J. Rayner, 2003. Using Virtual Tall Tower CO2 Data in Inverse Models to Reduce Uncertainty in Global and Regional Estimates of Carbon Flux. EOS Trans. AGU, 84(47), Fall Meet. Suppl., Abstract A52B-0786, 2003. Gurney, K.R., Chen, Y-H., Maki, T., Kawa, R., Andrews, A., and Zhu, Z., Sensitivity of inverted carbon sources and sinks from seasonal and interannual varying fossil fuel emissions. EOS Trans. AGU, 84(47), Fall Meet. Suppl., Abstract A51H-08, 2003. References
Gurney, K., Law, R., Rayner, P., and A.S. Denning, "TransCom 3 Experimental Protocol," Department of Atmospheric Science, Colorado State University, USA, Paper No. 707, 2000. Law, R. M., Rayner, P. J., Denning, A. S., Erickson, D., Heimann, M., Piper, S. C., Ramonet, M., Taguchi, S., Taylor, J. A., Trudinger, C. M., and Watterson, I. G. 1996. Variations in modelled atmospheric transport of carbon dioxide and the consequences for CO2 inversions Global Biogeochem. Cycles, 10, 783-796. Maki, T. T. Koide, T. Sasaki and TransCom-3 modelers. Sensitivity of Japan Meteorological Agency Carbon Dioxide Transport Model (JMA_CDTM) to CO2 Sampling Network. Presented at the Fifth International CO2 Conference, Sendai, Japan, October, 2001. Abstracts, MA03. Pak B.C. and M.J. Prather. Sensitivity of CO-Oxidation in CO2 Inversion Studies: From Annual to Seasonal Scale. Presented at the Fifth International CO2 Conference, Sendai, Japan, October, 2001. Abstracts, MA03. Patra, P.K. S. Maksyutov and TransCom-3 modelers. Optimal Network Design for CO2 Observations Maximizing the Inversion Performance. Presented at the Fifth International CO2 Conference, Sendai, Japan, October, 2001. Abstracts, MA03.

56
Stephens, B.B. L. Bruhwiler, P. Tans and TransCom 3 modelers. Using Airborne and Continental Data to Evaluate Global Atmospheric CO2 Inverse Models. Presented at the Fifth International CO2 Conference, Sendai, Japan, October, 2001. Abstracts, MA03. Suntharalingam, P. C.M. Spivakovsky, J.A. Logan and M.B. McElroy. The Sensitivity of Terrestrial Flux Estimates to Observation Network Configuration in an Inversion of Atmospheric CO2. Presented at the Fifth International CO2 Conference, Sendai, Japan, October, 2001. Abstracts, MA03.

57
CARBON DIOXIDE MEASUREMENTS FROM AN AIRBORNE SPECTROMETER IN SUPPORT OF OPERATIONAL TEMPERATURE SOUNDINGS AND THE STUDY OF THE CARBON CYCLE Principal Investigator: Graeme L. Stephens/Denis O’Brien, Co-PI NOAA Project Goal: Climate Programs: Climate Observations and Analysis, Climate Forcing Key Words: CO2, sources, satellites, climate 1. Long-term Research Objectives and Specific Plans to Achieve Them: Objectives
To develop remote sensing and modeling techniques to monitor the global distribution of sources and sinks of CO2.
To demonstrate the impact of such observations on operational temperature sounding.
Specific Plans
1. Demonstrate the feasibility of a low cost airborne CO2 spectrometer for use in support of NOAA’s NPOESS airborne simulator test-bed (NAST) and NASA’s Orbiting Carbon Observatory (OCO).
2. Develop procedures to retrieve CO2 from airborne and satellite systems.
3. Incorporate remotely sensed data in chemical transport models to identify sources and sinks of CO2.
4. Analyze the effect of variability in CO2 profiles upon temperature sounding.
2. Research Accomplishments/Highlights: Spectrometer design In collaboration with colleagues at Lockheed-Martin, an innovative design for an etalon spectrometer was developed. The instrument uses crossed etalons to obtain high spectral resolution, high throughput and high stability at low cost. A bread-board prototype was constructed and used to demonstrate the capabilities of the design in the laboratory. Algorithm development A prototype algorithm was developed to retrieve the CO2 column from reflectance spectra in the near infrared bands of CO2 and O2. Because the accuracy requirements

58
are very high, the algorithm compensates for scattering by optically thin cloud and aerosol, as well as uncertainties in temperature and surface reflectance. The algorithm is computationally efficient, and its complexity is commensurate with the information content of the spectra. Cloud detection The accuracy of the CO2 column retrieved from near infrared CO2 absorption spectra is very sensitive to scattered radiance. A prototype neural network algorithm was developed to identify scenes contaminated by optically thin cloud (water or ice) using spectra in the CO2 and O2 near infrared absorption bands. This work was carried out jointly with colleagues in the CSU Department of Computer Science. Radiative transfer modeling Central to both the instrument simulations and the algorithm development is the capability for fast, reliable radiative transfer. Enhancements were made to the RADIANT code, developed by Christi at CSU, to compute analytic Jacobians and to incorporate a variety of surface reflectance models. Geographical coverage of CO2 measurements
Observations of CO2 column using reflected sunlight require almost clear skies. The probability of almost clear sky was assessed using lidar data from the Geoscience Laser Altimeter System (GLAS). The analysis yielded not only statistics for the geographical distribution but also for the vertical distribution of cloud and aerosol. Temperature sounding Historically, temperature sounding of the atmosphere, which relies upon emission by CO2, has assumed that the CO2 volume mixing ratio is fixed. The accuracy of temperature soundings that use the zonal mean profile of CO2 was assessed by Haynes using the variability between the CO2 fields produced by the sixteen atmospheric transport models in the Atmospheric Tracer Transport Model Intercomparison Project (TRANSCOM) as a proxy for the true variability. The analysis used 2000 spectral channels from 500 cm-1 to 2500 cm-1 at 1 cm-1 resolution, comparable to the observing capabilities of AIRS. The retrieval errors were approximately 0.6 K near the surface, falling to less than 0.2 K at about 500 hPa, and rising again to over 1.2 K in the stratosphere. These are significant errors, high-lighting the importance of using reliable a priori profiles of CO2 in temperature sounding.
59
3. Comparison of Objectives Vs. Actual Accomplishments for Reporting Period: a.. Demonstrate the feasibility of a low cost airborne CO2 spectrometer ...
Status — Complete Actions — A bread-board instrument was built at
Lockheed-Martin to confirm numerical simulations of optical and detector performance.
b. Develop procedures to retrieve CO2 from airborne and satellite systems.
Status — Complete Actions — An efficient, semi-empirical algorithm,
based on sound physical principles, has been developed and tested on a small selection of ‘almost clear’ atmospheres.
Future — Conduct more comprehensive testing. Produce an optimized algorithm suitable for operational use.
c. Incorporate remotely sensed data in chemical transport models ...
Status — Yet to be started Actions — Preliminary orbital calculations have been
carried out.
d. Analyze the effect of variability in CO2 profiles upon temperature sounding.
Status — Complete Actions — An assessment has been conducted using
the variability of TRANSCOM CO2 profiles as a proxy for that occurring in the real world.
Future — Develop an algorithm to estimate CO2 column from NAST-I radiances, and integrate the output directly into a temperature sounding algorithm.
4. Leveraging/Payoff: This project is closely related to NASA’s Orbiting Carbon Observatory (OCO), and the investigators are members of the OCO Science Team. There is strong public interest in climate change, and the measures taken to mitigate its effects. To that end, this project is highly relevant.

60
5. Research Linkages/Partnerships/Collaborators, Communications and Networking: This project is tightly linked to NASA’s Orbiting Carbon Observatory mission, which brings collaborations not only within the US but also in Europe. In particular, excellent collaborations on remote sensing and chemical transport modeling exist between the investigators at CSU and scientists at the Laboratoire des Sciences du Climat et de l’Environnement in France. 6. Awards/Honors: None at this time. 7. Outreach: Graduate/undergraduate students: M. L. Christi, PhD student; J. Haynes, PhD student 8. Publications: Papers Bréon, F.-M., D. M. O’Brien, and J. D. Spinhirne, 2005: Scattering layer statistics from space borne GLAS observations. Geophys. Res. Lett., in review. Haynes, J., 2005: CO2 variability prescribed in TRANSCOM: influence on vertical temperature soundings. J. Geophys. Res., in preparation. O’Brien, D. M., 2004: An end-to-end simulation of an airborne spectrometer to measure column averaged mixing ratio of CO2. Technical report, Colorado State University, pp. 52. Spurr, R. J. D. and M. J. Christi, 2005: Linearization of the interaction principle: analytic Jacobians in the “Radiant” model. J. Quant. Spectrosc. Radiat. Transfer, submitted. Conference/workshop Presentations O’Brien, D. M., 2005: Is a semi-empirical inversion algorithm feasible for OCO? Presented at the OCO Science Team Meeting, California Institute of Technology, Los Angeles, 2005-03-21. O’Brien, D. M. and C. Anderson, 2005: Experiments with a neural network for OCO cloud detection. Presented at the OCO Science Team Meeting, California Institute of Technology, Los Angeles, 2005-03-22.

61
CIRA ACTIVITIES AND PARTICIPATION IN THE GOES I-M PRODUCT ASSURANCE PLAN Principal Investigator: T.H. Vonder Haar NOAA Project Goal: Weather and Water Key Words: GOES, Imager, Sounder, product development 1. Long-term Research Objectives and Specific Plans to Achieve Them: In early 1994, NOAA introduced a new geostationary satellite series, GOES-I/M. Recognizing the need to insure transition from GOES-7 to GOES-I/M day-1 products and beyond, NESDIS developed a GOES-I/M Product Assurance Plan, GIMPAP. The GIMPAP provides the means to assure the viability of GOES-I/M day-1 products, to improve initial products and develop advanced products, and to ensure integration of the results into NESDIS operations. The GIMPAP program at CIRA will help ensure the opportunities offered by the new GOES system for supporting NOAA's mission will be realized. It addresses evaluation and validation of GOES day-1 products, day-1 product enhancements and evolution toward future products and sensor systems. There are three major phases: a) during Pre-launch - simulations, establish baselines and ground system preparation; b) intensive 6 month to one year effort after launch of each GOES to evaluate the quality of Imager and Sounder data and assess their utility for product development and utilize the GIMPAP product management structure to assure that the initial GOES product stream is at least equal to or better than the same from previous GOES; and, c) on a continuing basis, as unique spacecraft characteristics become understood, enhance the initial product data sets to take full advantage of the GOES-I/M system to develop advanced meteorological and oceanographic products. In all phases CIRA plans an active role in technology transfer and user training. At CIRA, the means currently exist for the acquisition and analysis of ancillary data from selected platforms such as ground-based profilers, radar, model output, aircraft, and other geostationary satellite data. GOES data will be received both directly for analysis using CIRA unique software and processing systems as well as over the Internet. Two basic type products validation activities will be undertaken at CIRA: a) qualitative, such as satellite images or image loops; and, b) quantitative, such as winds, soundings and combined radiometric products. Product quality will be measured relative to: current levels of performance for GOES-7; specified performance requirements for GOES-I/M; and user response. The focus of CIRA research for the past year includes the following:
Tropical cyclone applied research and algorithm development with an emphasis on quantitative analysis of GOES data.

62
Severe storm research, with an emphasis on the utilization of GOES Imager and Sounder.
Analysis of GOES-N data, with emphasis on data through eclipse and minimized keep-out-zone interruptions.
Investigations using MODIS, AIRS, and MSG data, looking ahead towards future GOES-R ABI bands.
Satellite analysis of mid-latitude cyclones with an emphasis on storms striking the U.S. west coast.
Continued development of satellite cloud climatologies. Continued training activities and development of web-based satellite product
display, with interaction with the Virtual Institute for Satellite Integration Training (VISIT), the International Virtual Laboratory at CIRA, and the WMO Regional and Meteorological Training Centers (RMTCs) located in Barbados and Costa Rica.
2. Research Accomplishments/Highlights: Some highlights of the research activity for GIMPAP include: Two-Part Fog/Stratus Product : A smart analysis of MODIS multi-band imagery was used to detect fog, for a central valley of California case (19 November 2004, 2115 UTC). The first part of the product was trained to discriminate between fog, snow-capped mountains, and surrounding land, as seen by various band combinations using Principal Component Image analysis. The second part of the product was trained to detect variations in the fog deck, due to either the fog thickness or the particle size distribution within the fog. This technique also has application to current and future GOES data.
Figure: Three-color analysis of fog/stratus in the central valley of California, 19 Nov 2004. Analysis utilizes multi-band differencing techniquies of MODIS imagery: (Left) fog/stratus discrmination vs. other features; (Right) variations in fog/stratus characteristics.

63
GOES-N NOAA/Science Post Launch Test Website: The GOES-N NOAA/Science Testing Website has been launched at http://rammb.cira.colostate.edu/projects/goes_n/. D. Hillger volunteered to coordinate the NESDIS activities (between CIRA/Ft. Collins, CIMSS/Madison, and Washington DC) for these science tests. Shortwave Albedo of Cold Cloud Tops: A variation of the GOES shortwave albedo product was created in order to highlight the reflectivity of cold cloud tops. This product is being used to study the characteristics of thick ice clouds, in hopes of relating the observed cloud-top albedo to severe storm properties. Preliminary results from a climatology study of reflective clouds at 3.9 μm found that ice clouds which occur in the high plains, Colorado in particular, are much more likely to be reflective. In addition, the software to generate shortwave albedo images and visible albedo images has been upgraded to work on satellites other than the GOES Imager and Sounder, including AVHRR, MODIS, and MSG (Meteosat Second Generation). The shortwave albedo product emphasizes fog/stratus (water) clouds and reflective land surfaces. The visible albedo product brightens parts of the image with low reflectance due to large solar zenith angles.
Figure: Cloud-top shortwave albedo, showing more reflective cloud tops (10 to 15%) for storms in the high plains of Montana and Wyoming compared to less reflective cloud tops (5%) for storms farther to the west and in more mountainous areas. Cloud Climatologies: Work continues on developing GOES cloud climatologies to gain insight into the effect of local geographic features on cloud frequency and evolution. Monthly climatologies of GOES-east and –west data have been created, and can be stratified by the low-level wind regime to better understand the influence of synoptic forcing. In addition, collaborative research continues with the NWS forecast offices in Tallahassee, FL and Cheyenne, WY, and a new collaborative effort with the NWS office in Monterey was initiated to investigate the regional timing and extent of marine stratus over the area, using pressure differences between stations to determine regimes.

64
Figure: (Left) Low cloud percent for the sea level pressure regime 3 ( pressure difference > 5 hPa between Arcata and San Francisco CA, and pressure difference < 2 hPa between San Francisco and Sacramento CA), Jun-Jul 1999-2003, 1000 UTC, 41 cases; (Right) Low cloud percent for regime 9 (pressure difference <2 hPa between Arcata and San Francisco CA, and pressure difference < 2 hPa between San Francisco and Sacramento CA), June-July 1999-2003, 1000 UTC, 61 cases. Improvements to Statistical Hurricane Intensity Forecasts with Satellite Data: As part of the Joint Hurricane Testbed (JHT) of the NOAA U.S. Weather Research Program, research was performed to improve the operational Statistical Hurricane Intensity Prediction Scheme (SHIPS) by incorporating satellite observations. After successfully testing an experimental version of SHIPS with the satellite data added at the JHT during the 2002 and 2003 seasons, the satellite version was made operational in 2004. In addition, models to predict tropical cyclone intensity change have been developed for the combined basin of the northwest Pacific and the Indian Ocean, and the Southern Hemisphere. These models have begun their transition to operations at the JTWC with the assistance of C. Sampson (NRL, Monterey). Results from the 2004 season showed that the GOES data resulted in significant improvement in the east Pacific intensity forecasts, and more modest improvements in the Atlantic. Tornadic Cells Associated with Hurricane Ivan: D. Lindsey put together a satellite interpretation discussion (SID) entitled “A Satellite Perspective of Tornado-Producing Cells associated with Hurricane Ivan.” Ivan made landfall in the U.S. on 15 September and spawned over 100 tornadoes, resulting in at least 8 fatalities. Visible and infrared data from GOES-12 was analyzed, and it was found that many of these tropical storm induced tornadoes were associated with overshooting tops and minima in local cloud top temperatures. (http://www.cira.colostate.edu/RAMM/picoday/040922/040922.html) RAMM Tropical Cyclone IR Archive: An inventory of the 2004 additions to the IR Archive brings the total number of 1995-2004 tropical cyclones to 336 with 93,700 images. The archive has included all named storms in the Atlantic since 1996 and in the eastern Pacific since 1997. In addition, images from the complete 2004-2005 Southern Hemisphere tropical cyclone season have been added to the archive. This includes 5737 images from 26 tropical cyclones. The images were from Meteosat-5,

65
GOES-9 at 155°E, and GOES-10. The entire RAMM archive now contains more than 102,000 images with 373 tropical cyclones. This dataset is being used to document various characteristics of Atlantic intense hurricanes in combination with “Best Track” and aircraft data. In 2004 there were 6 intense hurricanes bringing the 10-year total to 38. This gives an annual average of 3.8 compared with the long term (1950-2000) average of 2.3. Three 2004 hurricanes – Charley, Ivan, and Jeanne—with U.S. landfall maximum surface wind speeds exceeding all other 1995-2004 hurricanes. Intensity estimates using the Objective Dvorak Technique (ODT) have been completed for the six 2004 cases. Animation of GOES-12 Full Disk Visible Daily Images for August-September 2004: A two-month loop of daily images captures the very active period of the 2004 hurricane season showing the cloud patterns and tracks of 13 tropical cyclones. The full-disk images were remapped to a Mercator projection and are particularly useful since they show the entire tropical North Atlantic and the west coast of Africa. This loop was used in a number of presentations. Successful Tests of Operational Version of a new Tropical Cyclone Formation Product: The conversion of the experimental tropical cyclone formation probability product from CIRA to OSDPD was completed. The final step in this project is to transition the product web site from CIRA to the Tropical Prediction Center (TPC). In addition, the GOES tropical cyclone formation product was also requested by TPC and is in the process of being transitioned to NESDIS operations. The product was developed under the GIMPAP program and research is continuing to improve it and generalize the results to other tropical cyclone basins besides the Atlantic and east Pacific. Towards a satellite-only tropical cyclone wind analysis: The collection of real-time datasets that will be utilized to create a satellite-based low-level wind analysis has been automated. Datasets centered on all active tropical cyclones from JTWC (e.g., western North Pacific, Southern Hemisphere, and Indian Ocean), and NHC (e.g., eastern and central North Pacific, and North Atlantic) include cloud drift vectors from GOES east and west, QuikSCAT, and half-hourly remapped 4 km IR imagery. In an effort to understand how to better estimate near surface winds from satellite-based and aircraft based flight-level (700-850 hPa) winds, J. Kepert (BOM, Australia) shared his code for reducing flight-level winds to the 10-m level. If applicable these routines could be applied to the satellite-based surface wind algorithms being developed. GOES Imagery Provides Perspective on Hurricane Size: GOES infrared imagery from four hurricanes that moved near south Florida were remapped to a common scale: Hurricanes Andrew (1992), Georges (1998), Floyd (1999) and Charley (2004) near their point of closest approach to the south Florida coast. One good aspect of Charley was its extremely small size. If Charley were closer in size to Floyd, the swath of damage would have been much wider. These images are part of an effort to develop an algorithm for estimating storm size from GOES IR data.

66
Figure Caption. GOES infrared imagery of Hurricanes Charley 2004 (upper left), Andrew 1992 (upper right), Floyd 1999 (lower left) and Georges 1998 (lower right) near the point of closest approach to south Florida. Note the extremely small eye size of Hurricane Charley. Center-Relative IR Average Images of Hurricanes: Center-relative IR average images were created for the entire life cycle of the six 2004 Atlantic intense hurricanes. These data sets, particularly when animated, have been shown to capture the important structure changes of hurricanes, while removing much of the shorter term and smaller scale variability. The same processing has also been completed with six additional Atlantic intense hurricanes prior to 2004. Pressure-Wind Relationship Study for Atlantic Intense Hurricanes: A study of the pressure-wind relationship was based on 42 pairs of minimum sea-level pressure (MSLP) and maximum surface wind (Vmax) from the Best Track data set for 1995-2004 Atlantic intense hurricanes. Using the operational pressure-wind relationship from the Dvorak technique, a small bias (about 3 hPa) toward a higher MSLP was found from the pressure-wind relationship. However, this bias is reduced to near zero, by computing the environmental pressure, and using an equivalent pressure-wind relationship for the difference between the environmental pressure and the MSLP.
67
Tropical RAMSDIS upgrade completed at CIRA and HRD: An upgrade on the tropical RAMSDIS systems at CIRA and HRD has been completed. Several new products were added to bring the total ingest to 38 different products covering the globe. Many of these products are available on RAMSDIS Online (http://www.cira.colostate.edu/ramm/rmsdsol/tropical.html). New applications and data were added to the Tropical RAMSDIS: 1) Radar images from the NWS Doppler network; 2) High density QuikScat winds; and 3) An automated routine to display TPC hurricane forecast positions and intensities. Additional Experimental GOES Sounder Products: A triad of new GOES Sounder products have been added to RAMSDIS Online under the experimental section at: http://www.cira.colostate.edu/RAMM/rmsdsol/ROLEX.html. The new products are composites of Sounder sectors from each of GOES-east and GOES-west combined into one image: a band-8 composite; a skin-temperature product with a rainbow-color enhancement; and a split-window longwave temperature difference (with color enhancement intended to show dust areas as red). 3. Comparison of Objectives Vs. Actual Accomplishments for Reporting Period: Most objectives of this project are being completed. Objectives that are incomplete will continue as action items in the following years of this project. 4. Leveraging/Payoff: In response to the need to assure transition from GOES-7 to the new generation GOES products and beyond, CIRA has been involved in the NESDIS GOES-Improved Measurements and Product Assurance Plan, GIMPAP. The GIMPAP provides the means to assure the viability of GOES products, to improve initial products, to perform research to develop advanced products, and to ensure integration of the results into NESDIS and NWS operations. Examples of successful transitions include improved hurricane intensity forecast models provided to the NWS, and fog and volcanic ash detection techniques provided to NESDIS operations. 5. Research Linkages/Partnerships/Collaborators, Communications and Networking: This project involves considerable collaboration with NESDIS, the National Weather Service, NOAA/OAR and the World Meteorological Organization. 6. Awards/Honors: D. Hillger gave an hour-long presentation to the 22nd Rocky Mountain Chinese Society of Science and Engineering (RMCSSE) Annual Conference held in Aurora/Denver CO on 17 July. The presentation consisted of general NOAA/NESDIS slides, slides related to weather satellite history, and slides on GOES-R Risk Reduction activities. The presentation was very well received by about 70 attendees, and Dr. Hillger was awarded a plaque in recognition of his “outstanding” presentation.

68
7. Outreach: (a) Graduate/Undergraduate students (List by name, degree status and continuance after obtaining degree); (b) Seminars, symposiums, classes, educational programs; (c) Fellowship programs; (d) K-12 outreach; (e) Public awareness. (a) Kimberly Mueller, MS completed Sept 2004, currently employeed by Risk Management Systems in San Jose, CA (b) M. DeMaria, April 20, 2005: Tropical cyclone applications of satellite observations. CSU Satellite Meteorology class, Fort Collins, CO J.F. Dostalek, April 14, 2005: RAMM Team Overview and PACJET Activities. NOAA’s Environmental Technology Laboratory (ETL), Boulder, CO P. Naughtin, April 11, 2005: Australia and related topics. CIRA Seminar, Fort Collins, CO. D.W. Hillger, April 19, 2005: Judged posters at the CSU Celebrate Undergraduate Research and Creativity (CURC) Poster Event. Fort Collins, CO. D.L. Lindsey, March 22, 2005: Reflective thunderstorm tops research. ATMOS/CIRA presentation, Fort Collins, CO. V. Castro, B.H. Connell, J.F.W. Purdom, and others, March 7-18, 2005: Regional Training Course on the Use of Environmental Satellite Data in Meteorological Applications for RA III and RA IV. San Jose, Costa Rica. J.A. Knaff, February 14, 2005: Potential for improving tropical cyclone wind speed probabilities. Department of Defense Tropical Cyclone Conference, Honolulu, HI. B.H. Connell, November 8, 2004: GOES and the characteristics of its channels. Remote Sensing class at the Metropolitan State College of Denver, Denver, CO. D.T. Lindsey, D.E. Bikos, J. Braun, J.F. Weaver, and R.M. Zehr, July 1, 2004 – June 30, 2005: VISIT teletraining sessions delivered to NWS offices and others – CIRA Fort Collins, CO. (c) None (d) J.F. Weaver, March 7, 2005: My Career in Meteorology and How I Got There . PaCE (Professional and Career Experience) program. Fort Collins, CO. D. Watson, H. Gosden, D.A. Molenar, April 13, 2005: Meeting regarding the partnership of RAMMB/CIRA and the Poudre High School PaCE (Professional and Community Experience) Program.

69
(e) J.F. Weaver, October 6, 2004: The variety and scope of research taking place at CSU. Series for local business owners. Fort Collins, CO. D.W. Hillger, October 14, 2005: Work at NOAA/CIRA with weather satellites and the next generation GOES. Windsor (CO) Beacon interview. (http://www.windsorbeacon.com/localnews/stories/20041014/1412869.html), Windsor, CO. D.W. Hillger, July 17, 2004: Weather satellite history and RAMM Branch GOES-R Risk Reduction activities. 2nd Rocky Mountain Chinese Society of Science and Engineering (RMCSSE) Annual Conference, Aurora/Denver CO. M. DeMaria, August 18, 2004: Information on hurricane intensity forecasting was provided to P. Spotts of the Christian Science Monitor via a telephone interview. M. DeMaria, September 14, 2004: Telephone interviews were provided to J. Thompson from the St. Petersburg Times and R. Smith from the Associated Press. M. DeMaria, September 7, 2004: A telephone interview was provided to a high school student from South Dade High School in Miami, FL for a report on tropical cyclones. D.W. Hillger, November 3, 2004: RAMM Team provided examples of NESDIS satellite-derived products that may be of use in ecosystem research and applications to the Ecosystems Team. 8. Publications: Refereed Journal Articles Dostalek, J.F., J.F. Weaver, and L. Phillips, 2004: Aspects of a tornadic left-moving thunderstorm of 25 May 1999. Wea. and Forecasting, 19:3, 614-626.
Grasso, L.D., and T.J. Greenwald, 2004: Analysis of 10.7 micron brightness temperatures of a simulated thunderstorm with two-moment microphysics. Mon. Wea.Rev., 132:3, 815-825.
Knaff, J.A. , S.A. Seseske, M. DeMaria, J.L. Demuth, 2004: On the Influences of Vertical Wind Shear on Symmetric Tropical Cyclone Structure Derived from AMSU. Mon. Wea. Rev., 132, 2503-2510. Lindsey, D.T., and M.J. Bunkers, 2005: Observations of a severe left-moving supercell on 4 May 2003. Wea. and Forecasting, 20, 15-22.
70
Conference Proceedings
Combs, C.L., M. DeMaria, W. Blier, and W. Strach, 2004: Exploring the timing of fog formation and dissipation over the San Francisco Bay area using satellite cloud climatologies. AMS 13th Conference on Satellite Meteorology and Oceanography, September 20-23, Norfolk, VA.
Dostalek, J.F., L.D. Grasso, M. Sengupta, M. DeMaria, 2004: Applications of synthetic GOES-R observations for mesoscale weather analysis and forecasting. AMS 13th Conference on Satellite Meteorology and Oceanography, September 20-23, Norfolk, VA.
Zehr, R.M., 2004: Satellite Products and Imagery with Hurricane Isabel. AMS 13th Conference on Satellite Meteorology and Oceanography, September 20-23, Norfolk, VA.
Lindsey, D.T., 2004: On the motion and interaction between left-and right-moving supercells on 4 May 2003. AMS 22nd Conference on Severe Local Storms, Hyannis, MA, 4-8 October, 2004.
Newsletters
Hillger, D.W., and G. Toth, 2004: Anemometers and windsocks. Topical Time, 55(6), (November/December), 29-33.
Weaver, J.F., 2002: Central Colorado's Severe Downslope Windstorms. Colorado Climate Magazine, 3 (4), Colorado Climate Center, Ft. Collins, CO 1-3. Weaver, J.F., 2004: Heavy Snowfall in the Midst of a Drought. CIRA Magazine, Vol. 22, Fall, 8-13.
Presentations
Mainelli, M., M. DeMaria, and L. Shay, 2005: Results from the Incorporation of Ocean Heat Content and GOES Data in the Operational Ships Model During the 2004 Hurricane Season. 59th Interdepartmental Hurricane Conference, 7-11 March, Jacksonville, FL.
Mueller, K.J., R.M. Zehr, M. DeMaria, and J.A. Knaff, 2005: Objective Estimation of Tropical Cyclone Wind Structure From Infrared Satellite Data. 59th Interdepartmental Hurricane Conference, 7-11 March, Jacksonville, FL.
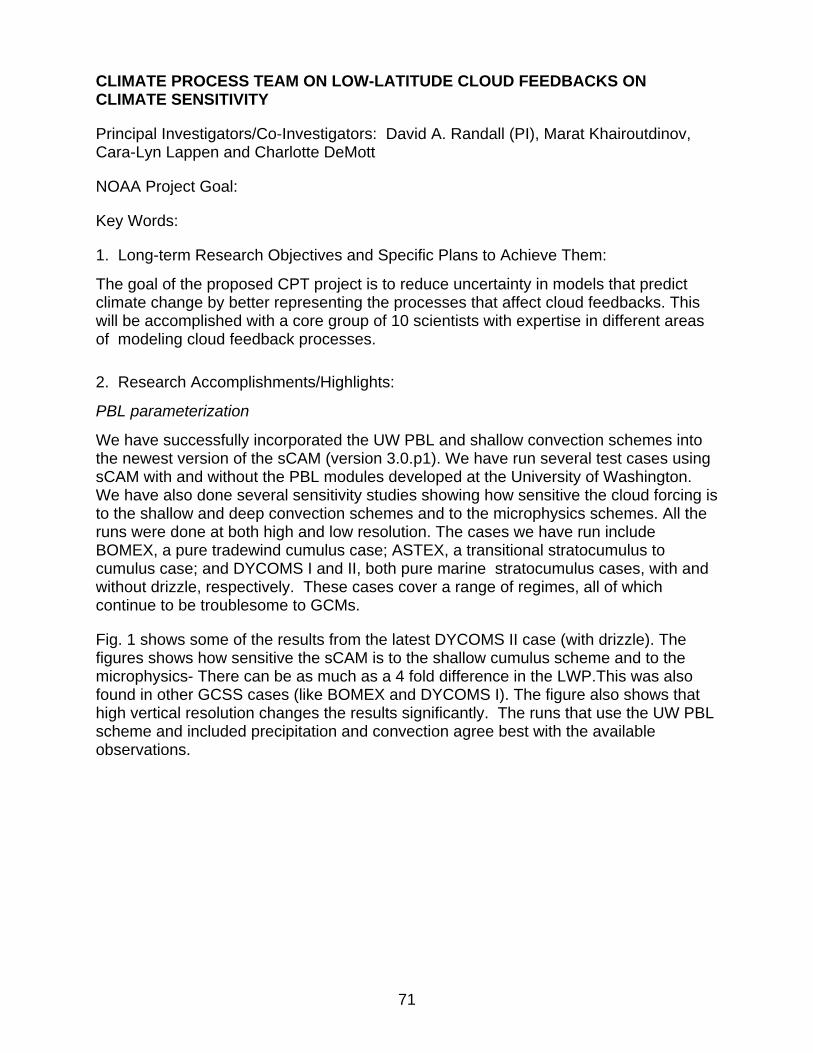
71
CLIMATE PROCESS TEAM ON LOW-LATITUDE CLOUD FEEDBACKS ON CLIMATE SENSITIVITY
Principal Investigators/Co-Investigators: David A. Randall (PI), Marat Khairoutdinov, Cara-Lyn Lappen and Charlotte DeMott
NOAA Project Goal:
Key Words:
1. Long-term Research Objectives and Specific Plans to Achieve Them:
The goal of the proposed CPT project is to reduce uncertainty in models that predict climate change by better representing the processes that affect cloud feedbacks. This will be accomplished with a core group of 10 scientists with expertise in different areas of modeling cloud feedback processes. 2. Research Accomplishments/Highlights:
PBL parameterization
We have successfully incorporated the UW PBL and shallow convection schemes into the newest version of the sCAM (version 3.0.p1). We have run several test cases using sCAM with and without the PBL modules developed at the University of Washington. We have also done several sensitivity studies showing how sensitive the cloud forcing is to the shallow and deep convection schemes and to the microphysics schemes. All the runs were done at both high and low resolution. The cases we have run include BOMEX, a pure tradewind cumulus case; ASTEX, a transitional stratocumulus to cumulus case; and DYCOMS I and II, both pure marine stratocumulus cases, with and without drizzle, respectively. These cases cover a range of regimes, all of which continue to be troublesome to GCMs.
Fig. 1 shows some of the results from the latest DYCOMS II case (with drizzle). The figures shows how sensitive the sCAM is to the shallow cumulus scheme and to the microphysics- There can be as much as a 4 fold difference in the LWP.This was also found in other GCSS cases (like BOMEX and DYCOMS I). The figure also shows that high vertical resolution changes the results significantly. The runs that use the UW PBL scheme and included precipitation and convection agree best with the available observations.

72
Figure 1: Liquid water path simulations using the single-column version of the sCAM, for both low and high vertical resolution. Key- GB=Grenier-Bretherton UW scheme ; CONV= convection ; RES = resolution
We are currently working to implement the ADHOC PBL in sCAM.
In addition, we have published a paper (Lappen and Randall, 2005) on our new method to include momentum transport within the ADHOC framework, and we have submitted a second paper (Lappen and Randall, 2006) describing our new method to determine the pressure terms in the ADHOC equations.
Modeling studies of deep convection
Our research at CSU has been contributing to the CPT goals along two main paths. First, the use of the CSU Multi-scale Modeling Framework (MMF), which is the ‘super-parameterized’ version of NCAR Community Atmosphere Model (CAM), to better understand cloud feedbacks to climate perturbations, and, second, use of the cloud resolving model results to better understand how to improve current parameterizations of clouds.
On the MMF front, our main goal has been to run a cloud-sensitivity-to-SST-perturbation experiment. In this experiment, the simulated climate obtained by using the prescribed climatological SSTs is compared to the climate obtained by perturbing the SSTs by 2K to derive the implied cloud feedback. This feedback obtained by the MMF which explicitly represents the clouds via use of a small cloud-resolving model in each of its global grid cells, is then compared to the results obtained using conventional GCMs where clouds are entirely parameterized.
The computations involving the MMF are very expensive; therefore, before running such a resource consuming cloud-feedback experiment, we have to make sure that the present climate simulations represent reasonable approximation of observed Earth’s climate. Less than a dozen yearly simulations that have been performed so far have

73
revealed several systematic biases. For example, the most notorious and the most persistent bias is anomalous precipitation patterns associated with the Indian and Asian Monsoon during the June-July-August season, especially the bias associated with the Asian Monsoon. Understanding the reasons behind such a bias which we named the Great Red Spot (GRS) is still a subject of current research. We feel that mitigating the GRS may be necessary before committing large computational resources to perform cloud-sensitivity runs.
Even though the MMF allows one to explicitly represent clouds and cloud-scale motions in each cell of GCM, cloud microphysics has still to be parameterized using rather simplistic bulk microphysics scheme. Recently, we performed a series of MMF experiments aimed to test the range of response of cloud and associated hydrological cycle as well as of top-of-atmosphere radiation fluxes to changes in bulk microphysics parameters in some reasonable range. Also, we tested the response of global simulations to super-parameterization’s grid resolution. Figure 2 illustrates sensitivity of MMF simulated longwave (LWCF) and shortwave (SWCF) cloud forcing to super-parameterization’s horizontal grid resolution and the value of threshold of cloud-ice conversion to snow. All the MMF simulation were configured identically to the control simulation (top panel) except higher super-parameterization’s horizontal resolution (1 km vs 4 km in control), but the same number of columns, and higher (middle panels) and lower (second panels from the bottom) by one order of magnitude values of the threshold for cloud ice conversion to snow. This range of two orders of magnitude represent a rather reasonable range routinely used in bulk microphysics schemes. One can see that the simulated range of cloud forcing just due to uncertainty of treatment of ice in the model can be from 20 to 35 W/m2 for LWCF and from -46 to -61 W/m2, compared to the observed 30 W/m2 and -57 W/m2, respectively.

74
Figure 2: Mean December-January-February longwave (left panels) and shortwave (right panels) cloud forcing for MMF simulations (top four panels) and as observed (bottom panels). See the text for explanation of the cases.
The results obtained in such sensitivity runs enable us to adopt the bulk microphysics parameters that reproduce the observed climate most closely. In the following several

75
months, we will use such improved MMF to perform a cloud-sensitivity experiment described above. The results will be used to diagnose the cloud sensitivity to climate perturbations.
One of the goals of the CPT is to define potential improvements to parameterizations used in GCMs. One of the main problems with conventional parameterization of convection in GCM is representation of diurnal cycle of precipitation over land. It has been demonstrated that the CSU MMF representation of the diurnal cycle of precipitation over land is superior to the standard version of the CAM. A comprehensive way to diagnose the problem is to use a single-column version of CAM with conventional parameterization and a high-resolution CRM running the same case. We use the case of shallow-to-deep convection transition based on idealization of observations made during the Large-Scale Biosphere-Atmosphere (LBA) experiment in Amazonia during the TRMM-LBA mission. In this case, the shallow convection is first developing for a few hours starting in the early morning in response to surface fluxes. As the day progresses, the shallow convection transitions to mid-level congestus-type convection, and finally, late noon, a few deep convective towers appear. Figure 3 compares evolution of several fields obtained using the high-resolution CRM (CSU System for Atmospheric Modeling – SAM) and single-column version of CAM. One can see that CAM’s convection scheme ‘fires’ deep convection from the very beginning due to the closure based on CAPE which is more than 2000 J/m2 for the initial morning sounding. Our analysis of the CRM simulation suggests that there is very close coupling between the boundary layer processes and convection which should be incorporated into improved parameterizations. We expect to propose and test a new improved convective scheme for use in CAM during the next year.

76
Figure 3: Evolution of mean vertical profiles of cloud fraction (top panels), cloud condensate (middle panels), and relative humidity (bottom panels) for the shallow-to-deep cumulus transition experiment based on TRMM-LBA as simulated by the high-resolution 3-dimensional CRM (left panels) and single-column version of CAM (right panels).
Observational studies of deep convection
Our recent work focuses on the CPT objective of improving the representation of moist convection in the CAM3. Specifically, we have examined the variability of rainfall intensity at several locations and have begun to explore what controls this variability. Our approach has been to study daily mean and 3- to 6-hourly rainrate variability in two versions of the CAM3: 1) the standard version (referred to as CAM3), using the Zhang-McFarlane (ZM) cumulus parameterization, and 2) a version in which the ZM scheme is replaced with an embedded cloud resolving model in each grid cell (multi-scale modeling framework, or MMF).
Geographical regions were chosen based on the availability of high-frequency observational data collected during field campaigns. The three regions we have

77
examined are the Amazon Basin during the TRMM LBA field campaign, the West Pacific warm pool region during TOGA COARE, and the North American Great Plains during three ARM IOPs at the SGP site. These three regions represent a range of model performance in terms of seasonal mean rainfall simulation.
Results for the TOGA COARE case are shown in Fig. 4. Both the CAM3 and the MMF produce realistic seasonal mean rainfall in the Amazon. The MMF is generally far too dry in the ARM SGP case whereas the CAM3 produces a reasonable rainfall climatology. Both models over-produce rainfall in the tropical western Pacific.
An examination of daily mean rainfall rate PDFs (not shown) reveals some common findings among all three locations. First, the ZM parameterization has a preferred rainfall rate of about 10-20 mm/day for each location. Compared to GPCP precipitation estimates, rainfall rates in the CAM3 routinely underestimate rainfall production at higher rainrates (20-200 mm/day). Too much rainfall is produced at rainrates in the 10-20 mm/day range. On the other hand, the MMF is much better at producing a broad range of daily mean rainfall rates, but tends to underestimate rainfall production at low- to mid-rates (~20 mm/day and less). These findings are true for all three locations, regardless of the seasonal mean rainfall climatology.

78
Figure 4: For the TOGA COARE case, Lag-correlations between rainfall and PBL moist static energy (s, left panels), relative humidity profiles (middle panels), and lifted parcel buoyancy (right panels). CAM3 and MMF correlations are computed using 3-hourly temporal resolution. Observations are available at 6-hourly resolution. Positive (negative) lags correspond to rain leading (lagging) the correlated variable.
We would like to know what influences the timing and intensity of rainfall in each model, and in nature. As a first step, we computed lag-correlations between rainfall, PBL moist static energy (s), relative humidity profiles (computed with respect to water), and buoyancy profiles (computed from a parcel lifted irreversibly from the boundary layer). Results for each model are shown for the TOGA COARE location, although results are similar for each region studied. The first point to note is the overall similarity between

79
the MMF and observations. In both cases, rainfall is preceded by increases in PBLs, increases in low-level relative humidity, and low-level buoyancy. Subsequent to surface rainfall, PBL s and tropospheric buoyancy decrease, while upper-level relative humidity increases. In other words, rainfall production appears to require a moistening and energizing of the low-level atmosphere several hours in advance of rainfall production. While the CAM3 appears to produce the observed rainfall-relative humidity relationship, the timing of rainfall is quite different from that seen in observations. Namely, rainfall is essentially concurrent with maximum PBL moist static energy and tropospheric buoyancy.
This finding supports the long-held notion that the ZM parameterization allows convection to occur too readily, preventing the buildup of energy that would allow more intense convection, and higher daily mean rainrates, to develop.
We have recently been experimenting with a new cumulus parameterization that includes a minimum fractional entrainment rate. Experiments show that the new parameterization realistically delays the onset of deep precipitating convection until later in the diurnal cycle.
3. Comparison of Objectives Vs. Actual Accomplishments for Reporting Period:
The work reported above is very much in line with what we proposed to do.
4. Leveraging/Payoff
Our research will lead to more accurate weather forecasts and predictions of climate change.
5. Research Linkages/Partnerships/Collaborators, Communications and Networking:
We have been collaborating with Chris Bretherton and Peter Blossey of the University of Washington.
6. Awards/Honors: David Randall received CSU’s Scholarship Impact Award for 2005.
7. Outreach:
Maike Ahlgrimm, M.S. level GRA, received M.S Degree in 2004, is continuing her pursuit of a Ph.D. under my direction.
8. Publications:
Khairoutdinov, M., D. A. Randall, and C. DeMott, 2005: Simulation of the atmosphericgeneral circulation using a cloud-resolving model as a super-parameterization of physical processes. J. Atmos. Sci., 62, 2136-2154. Khairoutdinov, M., and D. A. Randall, 2006: A high-resolution simulation of TRMM-LBA. In preparation for J. Atmos. Sci. Lappen, C.-L., and D. A. Randall, 2005: Using idealized coherent structures to parameterize momentum fluxes in a PBL mass-flux model. J. Atmos. Sci. (in press).

80
Lappen, C.-L., and D. A. Randall, 2006: Parameterization of pressure perturbations in a PBL mass flux model. Submitted to J. Atmos. Sci. Randall, D. A., and W. H. Schubert, 2005: Dreams of a stratocumulus sleeper. In Atmospheric Turbulence and Mesoscale Meteorology, Cambridge University Press. Yamaguchi, T., 2005: Entraining cloud-topped boundary layers. M.S. Thesis, Colorado State University. Yamaguchi, T., and D. A. Randall, 2006: Large-eddy simulation of evaporatively driven entrainment into cloud-topped mixed layers. In preparation for J. Atmos. Sci.

81
CONTINUED INVESTIGATION OF THE N.A. MONSOON SENSITIVITY TO BOUNDARY AND REGIONAL FORCING WITH A FOCUS ON LAND-ATMOSPHERE INTERACTION Principal Investigators: Roger A. Pielke, Sr. (Lead PI), Christopher L. Castro, Cooperative Institute for Research in the Atmosphere (CIRA), Colorado State University, Fort Collins, CO 80523. NOAA Project Goal: Understand climate variability and change to enhance society’s ability to plan and respond. Key Words: North American Monsoon System (NAMS), El Niño Southern Oscillation (ENSO), Pacific Decadal Oscillation (PDO), Modeling 1. Long-term Research Objectives and Specific Plans to Achieve Them: Warm season precipitation in North America, and its variability, is strongly influenced by the North American Monsoon System (NAMS). Two hypotheses exist to explain NAMS variability: 1) global-scale climate variability, and 2) local surface influence. A brief review of these hypotheses is offered, emphasizing recent work. Interannually, NAMS onset is influenced by time-evolving teleconnection patterns related to the El Niño Southern Oscillation (ENSO) and the Pacific Decadal Oscillation (PDO). These relationships are present in observations and in atmosphere general circulation models (GCMs) forced with idealized sea surface temperatures. Presumably, local surface influences of snow cover, soil moisture, and vegetation become more important as the summer proceeds. The role of soil moisture, particularly in the central U.S., has been investigated using both GCMs and regional climate models (RCMs). More unknown is the possible role of vegetation, as RCMs are just beginning to incorporate satellite-derived vegetation cover and be coupled with dynamic ecosystem models. NAMS-focused RCM investigations have thus far been limited to diagnostic or sensitivity studies. To systematically test each hypothesis of NAMS variability in a RCM framework, it is desirable to use an ensemble approach in which the RCM experimental design is fixed for a series of summer simulations. The Regional Atmospheric Modeling System (RAMS) is being used to continue the NAMS investigation with a focus on land-surface influence.
2. Research Accomplishments/Highlights: Christopher Castro participated in the NAME field campaign as a radiosonde operator at one of the four sites near the Gulf of California operated by the National Center for Atmospheric Research (NCAR). Specifically, he was located at the Los Mochis airport site for approximately one month. In additional to operational duties at the weather station, he served as the on-site translator. He will likely participate in regional modeling activities using the NAME data once it becomes available. These activities were discussed at the NAME meeting held in Mexico City during March 2005.

82
In addition, all of the dynamical downscaling ensemble experiments for the summer season have been completed. These include all the years in the NCEP Reanalysis for the period 1950-2002 (53 years) and 80 years of general circulation model (GCM) from the NASA Seasonal to Interannual Prediction Project Model. The GCM data consist of 40 years forced with climatological sea surface temperatures and 40 years of the first two rotated EOFs superimposed on the SST climatology. The preliminary results of these dynamical downscaling experiments were reported at the GAPP Principal Investigators Meeting in Boulder, Colorado, and the Climate Diagnostics and Prediction Workshop in Madison, Wisconsin.
3. Comparison of Objectives Vs. Actual Accomplishments for Reporting Period: All of our objectives are being met at the rates indicated in our original proposal. We are currently in progress in Year 2.
4. Leveraging/Payoff: We will use previous results as a control to evaluate the land-surface influence apart from and in conjunction with remote Pacific-SST forcing. We anticipate that significant synergistic relationships may be found that lead to extreme summer climate in North America.
5. Research Linkages/Partnerships/Collaborators, Communications and Networking: We participated in the NAME field campaign and worked with other participating investigators. Christopher Castro acted as the on-site Spanish/English translator while on the field campaign in Los Mochis, Mexico. Our research findings and papers are posted on our research website at http://blue.atmos.colostate.edu/ to provide prompt and broad dissemination of our current research. Dr. Castro also mentors other students and visitors to the Pielke Research project.
6. Awards/Honors: Christopher Castro successfully defended his Dissertation on June 22, 2005 and the Ph.D. will be conferred Fall Semester 2005.
7. Outreach: Conference and Meeting Presentations
Castro, C.L., and R.A. Pielke Sr., 2004: Diagnosing the Climatology and Interannual Variability of the North American Monsoon Using the Regional Atmospheric Modeling System (RAMS): An Update. GAPP Principal Investigators Meeting, Boulder, Colorado, 30-31 August 2004. http://blue.atmos.colostate.edu/presentations/PPT-25.pdf

83
Castro, C.L., and R.A. Pielke Sr., 2004: Diagnosing the Climatology and Interannual Variability of North American Summer Climate with the Regional Atmospheric Modeling System (RAMS). NOAA Climate Diagnostics and Prediction Workshop, Madison, Wisconsin, 18-22 October 2004. http://blue.atmos.colostate.edu/presentations/PPT-26.pdf Castro, C.L., and R.A. Pielke Sr., 2004: Dynamical Downscaling: Assessment of Value Retained and Added Using the Regional Atmospheric Modeling System (RAMS). AGU Fall Meeting, San Francisco, CA, December 13-17, 2004. http://blue.atmos.colostate.edu/presentations/PPT-31.pdf
8. Publications:
Castro, C.L., R.A. Pielke, Sr., and G. Leoncini, 2005: Dynamical Downscaling: Assessment of Value Retained and Added Using the Regional Atmospheric Modeling System (RAMS). J. Geophys. Res. - Atmospheres, 110, No. D5, D05108, doi:10.1029/2004JD004721. http://blue.atmos.colostate.edu/publications/pdf/R-276.pdf Castro, C.L., Ph.D. Dissertation, 2005: Investigation of the Summer Climate of North America: A Regional Atmospheric Modeling Study. Department of Atmospheric Science, Colorado State University, Fort Collins, CO 80523.

84

85
COUPLING BETWEEN MONSOON CONVECTION AND SUBTROPICAL HIGHS IN THE PACS REGION Principal Investigators: Richard H. Johnson/Wayne H. Schubert NOAA Project Goal: Climate Key Words: Monsoon convection, subtropical highs, PACS, intra-seasonal
1. Long-term Research Objectives and Specific Plans to Achieve Them:
The objectives of this research are to document the nature, extent and mechanisms for the coupling between the monsoon heat sources of the Americas and adjacent subtropical anticyclones with their associated low-level jets using both modeling and observational approaches.
Research Activities
Planning activities for NAME
Under this project we have undertaken planning efforts for the North American Monsoon Experiment (NAME). As a member of the NAME SWG, co-PI, Richard Johnson, has worked with other NAME PIs to plan the field effort in 2004, particularly working on the design of the sounding network. The co-PI and his staff have attended several meetings to help coordinate the overall planning effort. One was the NAME SWG meeting in Puerto Vallarta in November 2003. A paper (listed on the final page of this report) was presented at the NAME special session at the meeting of the Mexico Geophysical Union. Another, co-organized by Dave Gochis and Dick Johnson, was held in March 2004 in Boulder to help prepare NAME field logistics. One month later, Dick Johnson and Paul Ciesielski attended the NAME SWG meeting in Tucson (April 2004).
Latent heating profiles over the Amazon
Understanding the relationship between subtropical anticyclones that occur over the PACS region and monsoonal convection over South America requires a fundamental knowledge of the vertical structure of latent heating profiles over the Amazon. Our initial attempt to diagnose these structures using sounding data taken during TRMM-LBA (January and February 1999) and line-integral methods met with limited success due to the fact that the size and shape of the LBA sounding network was not readily conducive to computing budgets with the line integral method.
During 2003 and 2004, we collaborated with Dr. Minghua Zhang (SUNY at Stony Brook) to compute the LBA budgets using the constrained variational method. In this approach, additional data fields (e.g., such as surface rainfall, net-radiative heating rate and surface pressure fields) are used to assure consistencies in the objective analysis (Zhang and Lin 1997). Much of the effort was focused on getting the best estimates of

86
rainfall over the TRMM-LBA domain by combining high temporal resolution rainfall estimates from the S-POL radar and ground-based gauges. Our hope was that this approach would lead to more realistic latent heating profiles that would allow us to distinguish how these profiles varied during the different convective regimes of the LBA. However, so far this analysis has met with limited success.
Moisture surges and the North American Monsoon
This study attempts to deepen our knowledge of the relationship between summertime heavy rain events in the southwestern deserts of the United States and wind/moisture surges over the Gulf of California. Our understanding of these surges and their effect on the North American monsoon has been limited by the paucity of observations over the Gulf of California region. To overcome this deficiency in the observational network, we have begun an investigation of these surges using data from the SeaWinds instrument aboard the NASA QuikSCAT satellite which has been collecting data since July 1999. Typically this satellite provides surface winds at a given oceanic location on a 2 times daily basis with a 25-km horizontal resolution. While the southerly wind surges associated with enhanced monsoonal rainfall typically peak around 600 m above the surface (Douglas 1995), it is our intent to see whether they are detectable in QuikSCAT surface winds, and if so, what are their temporal and spatial characteristics. During the summer of 2000, the National Weather Service (NWS) Offices of Arizona collaborated to monitor moisture surges in the Gulf of California. While six surge events typically occur in a summer season, four major surge events were identified from the 15 June through 15 September 2000 period. By averaging the QuikSCAT winds into 0.5 degree latitudinal bins over the Gulf of California and in a 3 degree strip along the western Mexican coast, we created latitude/time analyses for the winds during the summer of 2000. In the v-component Hovmoller analysis, the four moisture surges identified by the NWS are readily apparent as periods of enhanced southerly winds. Two of these wind surges originated south of 20 degrees N associated with tropical storms; the other two originated near the mouth of the Gulf around 23 degrees N and propagated northward through the Gulf on a time scale of a few days. Results are published in Bordoni et al. (2004).
With these encouraging results, we plan to extend this analysis to other years. This will allow us to document the frequency, strength, and interannual variability of surge events with the ultimate goal to better understand the relationship between surge events and periods of enhanced rainfall in the North American monsoon.
Analysis of surface winds and divergence patterns in stratocumulus regions using QuikSCAT winds and reanalysis products
Past attempts to analyze wind fields in the summertime stratocumulus regimes, which cover the strong subsidence regions off the west coast of the major continents, have been hampered by the paucity of observations over these oceanic regions. In this study, winds derived from the SeaWinds scatterometer (aboard QuikSCAT) are used

87
to examine the boreal summer surface wind and divergence fields in these regions. SeaWinds data covers 93% of the global ocean under clear and cloudy conditions at 25-km resolution and have an estimated accuracy of 2 m s
−1 . The SeaWinds
analyses are compared to those generated from NCEP and ECMWF reanalysis products, which have a spatial resolution of 2.5 degrees. The high resolution and quality of the SeaWinds dataset allows us to assess the reasonableness of the reanalysis products. The analysis and comparison described here is for a four-year mean of surface wind and divergence fields computed for July (1999-2002). To facilitate the comparison with the reanalysis products, the SeaWinds dataset is interpolated to 0.5 degree latitude/longitude grid. Comparison of the wind field analyses show good consistency in the positions of the major subtropical anticyclones. On the other hand, the SeaWinds wind speeds are higher everywhere with the only exception being stronger NCEP winds in a small region off the Chilean coast. Both reanalysis products gravely underestimate wind speeds in the ”Roaring 40s”, the latitude belt around 45 degrees S where there is little land to inhibit the formation of strong winds and ocean currents. Examination of the July mean divergence fields show agreement only in a gross sense with all three analyses exhibiting maxima in surface divergence immediately off the western continental coasts associated with strong subsidence within the subtropical highs, and convergence maximum associated with the inter-tropical convergence zone (ITCZ) around 10 degrees N. Aside from this, two notable differences among these analyses are seen. First, maximum divergence values off the western coasts in the SeaWinds analysis are nearly a factor of two less than those in the reanalyses. And second, surface convergence in the NCEP reanalysis is much weaker and more diffused in the ITCZ and SPCZ than in other two analyses. Results are published in McNoldy et al. (2004).
In this coming year we plan to utilize a variety of statistical approaches to better quantify the differences among the analyses, and hopefully understand their causes and implications. The wide use of the reanalysis products makes identifying their strengths and deficiencies important both to the observational analyst as well as to the modeling community which requires such feedback to improve model physics.
The effects of fine scale potential vorticity structure on the stability of the East-Pacific ITCZ
Recent analysis of surface vorticity maps generated from high-resolution (25 km) QuikSCAT winds reveals fine-scale vorticity structures within the East Pacific ITCZ. Vertical cross-sections of potential vorticity analyzed from dropwindsonde data taken during flights through the ITCZ during EPIC show that these vorticity structures often are coherent in the vertical over several kilometers. These observations will form the basis for studying the undulation and breakdown of the ITCZ when fine-scale vorticity structures are present.

88
It has been proposed that ITCZ breakdown is due to a convectively-modified form of combined barotropic and baroclinic instability of the mean flow. The unstable mean flow can be produced by ITCZ convection in just a couple of days. In this sense, the ITCZ produces favorable conditions for its own instability and breakdown. Past studies have attempted to study this breakdown process by assuming that convection within the ITCZ generates a zonally elongated PV anomaly that has a reversal in the meridional PV gradient on its poleward side. In the model simulations, once a reversal in the meridional PV gradient occurs, the PV strip undulates and breaks down into a number of cyclones in a way that resembles what is observed in satellite images.
Recent observations, such as those described above, suggest that the vorticity struc-tures generated by ITCZ convection are more complicated than originally thought. We are currently revisiting the ITCZ breakdown process when fine scale vorticity structures are present. A nonlinear shallow water model on the sphere is being used to simulate barotropic aspects of ITCZ breakdown. The initial condition consists of a zonal strip of stirred vorticity.
8. Publications: Refereed Bordoni, S., P. E. Ciesielski, R. H. Johnson, B. D. McNoldy, and B. Stevens, Bordoni, S., P. E. Ciesielski, R. H. Johnson, B. D. McNoldy and B. Stevens, 2004: The low-level circulation of the North American Monsoon as revealed by QuikSCAT. Geophys. Res. Lett., 31, L10109, doi:10.1029/2004GL020009. B. D. McNoldy, P. E. Ciesielski, W. H. Schubert, and R. H. Johnson, 2004: Surfacewinds, divergence, and vorticity in stratocumulus regions using QuikSCAT and reanalysis winds. Geophys. Res. Lett., 31, L108105, doi:10.1029/2004GL019768.
Prieto, R., B. D. McNoldy, S. R. Fulton, and W. H. Schubert, 2003: A classification of binary tropical-cyclone-like vortex interactions. Mon. Wea. Rev., 131, 2656–2606.
Ito, T., E. P. Gerber, and W. H. Schubert, 2004: Formation and maintenance of black holes of water vapor in an idealized model of the tropical atmosphere. Quart. J. Roy. Meteorol. Soc., To be submitted.
Randall D. A. and W. H. Schubert, 2004: Dreams of a stratocumulus sleeper. Submitted to an upcoming book containing a collection of articles on the subtropical marine boundary layer.
Johnson, R. H., 2004: Mesoscale processes. Ch. 8, Asian Monsoon, B. Wang, Ed. (in press)

89
Presentations
Ciesielski P. E., B. D. McNoldy, and R. H. Johnson, 2003: Analysis of summertime wind/moisture surges over the gulf of California using QuikSCAT data. Presented at the U.S. Clivar Pan-American Workshop, 17 Sept. 2003, Boulder, CO.
Ciesielski,P. E., and R. H. Johnson, 2004: Plans for a sounding data monitoring and display facility at the NAME operations center in Tucson. NAME Planning Workshop, Tucson, AZ, 21-23 April.
Johnson, R. H., 2004: NAME IOP Coordination. NAME Planning Workshop, Tucson, AZ, 21-23 April.
Johnson, R. H., P. E. Ciesielski, and B. D. McNoldy, 2003: A study of Gulf surges using QuikSCAT data. Paper presented at NAME Session of Mexico Geophysical Union, 5 Nov. 2003, Puerto Vallarta, MX.
McNoldy B. D., P. E. Ciesielski, and W. H. Schubert, 2003: QuikSCAT analysis of surface wind fields in stratocumulus regions. Presented at the U.S. Clivar Pan-American Workshop, 17 Sept. 2003, Boulder, CO.

90

91
CROSS-SENSOR PRODUCTS FOR IMPROVED WEATHER ANALYSIS AND FORECASTING
Principal Investigator: S. Q. Kidder
NOAA Project Goal: Weather and Water. Program: Local Forecasts and Warnings.
Key Words: Blended products, precipitable water, PSDI, operational, AMSU, SSM/I
1. Long-term Research Objectives and Specific Plans to Achieve Them:
This work was part of the NOAA/NESDIS/OSD Product Systems Development and Implementation (PSDI) Program. The long-term research objectives were (1) to produce blended products from the Advanced Microwave Sounding Unit (AMSU) on the NOAA 15, 16, and 17 satellites and from the Special Sensor Microwave/Imager (SSM/I) on the Defense Meteorological Satellite Program (DMSP) F13, F14, and F15 satellites, (2) to install the software at OSDPD and make it operational, and (3) to publish the results.
2. Research Accomplishments/Highlights:
The blended total precipitable water (TPW) product was developed last year and installed at OSDPD. It runs hourly at both CIRA and OSDPD and is made available in real time to forecasters at CIRA and at the NOAA/NESDIS/OSDPD Satellite Services Division (SSD) and to the general public on our Website (http://amsu.cira.colostate.edu/TPW). This year required manuals were written and delivered to OSDPD to aid in making the TPW product operational (K. P. Kidder et al. 2004, 2005a, b). Two papers describing this work were presented at conferences (Kidder and Jones 2004, 2005), and a journal article is in preparation.
3. Comparison of Objectives Vs. Actual Accomplishments for Reporting Period:
Objective 1: Blended TPW Product—completed Objective 2: Blended TPW Product—tech transferred to OSDPD Objective 3: TPW Product publications—in progress
The third year of PSDI funding was withdrawn, so the blended rain rate product which we proposed will not be completed.
4. Leveraging/Payoff:
Two chief uses of the TPW data are in forecasting heavy rain, particularly in coastal regions, and monitoring tropical waves that could turn into tropical cyclones. The improved TPW composites give forecasters a clearer picture of where the water vapor is, which, we hope, will result in improved forecasts. These products are used daily by forecasters at SSD and CIRA and now may be accessed by the general public at http://amsu.cira.colostate.edu (click on “Blended TPW Loops”).

92
5. Research Linkages/Partnerships/Collaborators, Communications and Networking:
Among our research partners at NESDIS are Ralph Ferraro (ORA), Sheldon Kusselson and John Paquette (OSDPD).
6. Awards/Honors: None yet.
7. Outreach:
Our chief outreach activity is making our data available in real time on our AMSU Website: http://AMSU.CIRA.ColoState.EDU.
8. Publications: Kidder, K. P., A. S. Jones, and S. Q. Kidder, 2004: DPEAS CPE Process Document Averaged TPW, August 2004, 23 pp.
Kidder, K. P., A. S. Jones, P. Shott, and, S. Q. Kidder, 2005a: Data Processing and Error Analysis System (DPEAS) User’s Guide, (Revised February 2005), 40 pp.
Kidder, K. P., A. S. Jones, P. Shott, and S. Q. Kidder, 2005b: Data Processing and Error Analysis System (DPEAS) Programmer’s Guide, (Revised January 2005), 69 pp.
Kidder, S. Q., and A. S. Jones, 2004: Blended satellite products for operational forecasting. 13th Conference on Satellite Meteorology and Oceanography, Norfolk, Virginia, 20-23 Sept.
Kidder, S. Q., and A. S. Jones, 2005: A processing system to produce blended total precipitable water products. 21st International Conference on Interactive Information Processing Systems (IIPS) for Meteorology, Oceanography, and Hydrology, American Meteorological Society, San Diego, CA, 9-13 Jan.
9. Additional Information:
In addition to the funded project discussed in my report, I also worked on several other things of interest to NOAA.
1. A previously funded project titled “Technological Transfer and Validation of the CIRA Scheme for the Tropical Rainfall Potential (TRaP) Technique” (5-31158) resulted in two papers being accepted for publication in Weather and Forecasting (Kidder et al. 2005a; Ferraro et al. 2005).
2. I worked on a project to develop cloud algorithms using the new Meteosat Second Generation (MSG, now Meteosat 8) for installation at the Air Force Weather Agency at Offut Air Force Base. Whereas previous operational satellites had two channels (DMSP/OLS), three channels (Meteosats 1–7), or five channels (NOAA/AVHRR), Meteosat 8, with eleven 3-km resolution channels, offers many opportunities to improve cloud detection and characterization. The algorithms developed were (1) a Cloud Mask, (2) a Nocturnal Cloud Mask, (3) Daytime Cirrus, (4) Nocturnal Thin Cirrus, (5) Precipitating Clouds, and (6) Multi-Channel Skin Temperature. A paper detailing these

93
algorithms will be presented at the Battlespace Atmospheric and Cloud Impacts on Military Operations (BACIMO) Conference (Kidder et al. 2005b).
3. Finally, we were lead to consider how to improve satellite observations in the future. A paper on the use of constellations of satellites was presented at the 13th Conference on Satellite Meteorology and Oceanography (Kidder and Vonder Haar 2004).
Publications: Ferraro, R., P. Pellegrino, M. Turk, W. Chen, S. Qiu, R. Kuligowski, S. Kusselson, A. Irving, S. Kidder, and J. Knaff, 2005: The Tropical Rainfall Potential (TRaP) Technique. Part 2: Validation. Weather and Forecasting, in press.
Kidder, S. Q., and T. H. Vonder Haar, 2004: A satellite constellation to observe the spectral radiance shell of earth. 13th Conference on Satellite Meteorology and Oceanography, Norfolk, Virginia, 20-23 Sept.
Kidder, S. Q., S. J. Kusselson, J. A. Knaff, R. R. Ferraro, R. J. Kuligowski, and M. Turk, 2005a: The Tropical Rainfall Potential (TRaP) Technique. Part 1: Description and Examples. Weather and Forecasting, in press.
Kidder, S. Q., J. A. Kankiewicz, and K. E. Eis, 2005b: Meteosat Second Generation Cloud Algorithms for Use at AFWA. To be presented at the Battlespace Atmospheric and Cloud Impacts on Military Operations (BACIMO) Conference, Monterey, CA, 12-14 October 2005.

94

95
DATA FUSION TO DETERMINE NORTH AMERICAN SOURCES AND SINKS OF CARBON DIOXIDE AT HIGH SPATIAL AND TEMPORAL RESOLUTION Principal Investigator: Scott Denning NOAA Project Goal: Climate NOAA Programs: Climate Forcing, Climate Observations and Analysis, Climate and Ecosystems. Key Words: Carbon Cycle, Numerical Modeling, Earth-Atmosphere Interactions 1. Long-term Research Objectives and Specific Plans to Achieve Them: In order to understand the CO2 budget of the atmosphere we must understand earth-atmosphere CO2 fluxes on regional to continental spatial scales and synoptic to seasonal time scales. At the global scale the marine atmospheric boundary layer flask network provides CO2 mixing ratio data that constrain global and hemispheric earth-atmosphere fluxes. These data are the root of our understanding that terrestrial ecosystems are a substantial net sink of CO2. Understanding the processes responsible for terrestrial sources and sinks will require much higher spatial and temporal resolution of flux estimates than are possible through inversion of marine boundary layer data. Land-use history studies have suggested that North America is a substantial carbon sink in approximate agreement with inverse studies using the CO2 flask network data. The land-use history results, however, vary considerably and the precision and resolution of the fluxes derived from the inverse studies are poor and therefore unable to directly confirm or refute the land use studies. Limited atmospheric CO2 data over North America limits our ability to study North American sources and sinks of CO2 with high precision, or with increased spatial or temporal resolution. Continental (AmeriFlux) and global (Fluxnet) networks of continuous eddy-covariance based CO2 flux measurements have emerged. These flux observations provide critical local evaluation points for land-surface models, and excellent data concerning synoptic, seasonal, and interannual variability in net CO2 fluxes, but the areas represented by the flux measurements are very small (order 1 km2). In addition to these continental flux data, continental CO2 mixing ratio data of comparable precision and accuracy to the marine flask network are becoming available, especially over North America. Continuous observations are being conducted both on tall towers and AmeriFlux towers, and a program of periodic aircraft profiling is now underway. These efforts are greatly increasing the density and quality of CO2 mixing ratio data over the continent. To date, however, inverse studies of the North American carbon budget have not utilized these emerging data sources directly (i.e. tower fluxes and continental mixing ratio observations). In addition, studies have been limited largely to annual or seasonal temporal resolution and continental spatial resolution, and have largely ignored the abundance of data available in high-frequency CO2 flux and mixing ratio data. This is done in part to avoid potential complications that arise from the influence of the

96
atmospheric boundary layer on continental mixing ratio data. Preliminary network design studies suggest that incorporating only the existing continental CO2 mixing ratio data could reduce the uncertainty in the annual, continental net flux of CO2 by a factor of two as compared to studies that use only the marine flask network. We have proposed a program that will embrace the complexity of the continental boundary layer and turn the emerging wealth of data in North America to our advantage. This can be accomplished by merging research groups at the forefronts of terrestrial boundary layer CO2 flux and mixing ratio observations (Davis et al.) and high resolution, land-atmosphere carbon cycle modeling including inverse studies (Denning et al.). The study will explore the potential for fusion of CO2 flux and mixing ratio observations in a coupled land-atmosphere data assimilation framework, focusing on the utilization of the emerging North American flux and mixing ratio observational networks. We are accomplishing this via inverse modeling incorporating the emerging North American CO2 mixing ratio observational network, forwards modeling built upon the North American flux network, and cross-evaluation of these two model-data fusion approaches. We expect to achieve further results on all of our proposed objectives: 1) development and evaluation of a comprehensive analysis system for estimation of monthly CO2 exchange across North America at high spatial resolution based on the existing and emerging N. American mixing ratio and flux networks; 2) dramatic reduction in the uncertainty in the annual net North American CO2 flux and its interannual variations, as compared to currently published results; 3) attribution of CO2 sources between fossil fuel combustion and ecosystem exchange using CO and other trace gases; 4) application of AmeriFlux tower CO2 flux observations to evaluate the mechanisms responsible for seasonal to interannual responses of ecosystem carbon exchange to climate variability (temperature, radiation, precipitation); 5) evaluation of the flux and mixing ratio predictions of the forwards and inverse models; 6) evaluation of the strengths and weaknesses of atmospheric and ecosystem models, and the flux and mixing ratio observational networks used in these studies. The methods explored here will be portable to other parts of the globe. 2. Research Accomplishments/Highlights:
We have continued developing the modeling framework to analyze CO2 tower measurements and to estimate regional CO2 fluxes, using the CSU Regional Atmospheric Modeling System (RAMS), the Lagrangian Particle Dispersion Model (LPDM), an influence function approach and an inversion method. A preliminary series of multi-month regional meteorological simulations was performed using RAMS v 4.3 for several years from the period of WLEF tower data availability (1996-2004). These simulations on two nested grids ( 100xΔ = km and 20xΔ = km) were used to drive the LPDM and derive influence functions for the WLEF tower and the ring of towers in the case of our 2004 simulation (see below).

97
The above approach was used to investigate the Lake Superior signature in CO2 concentrations observed at the WLEF tower. CO2 flux from the water area is negligible in comparison to the flux from land. Our analysis demonstrated statistically significant differences in the observed CO2 concentration between air coming from the Lake Superior and from the land area. The air crossing Lake Superior has a lower CO2 concentration than the air coming from the land during the spring months (March - May) and a higher CO2 concentration during the summer months (June - August). The influence function technique allows us to isolate contributions from different source areas or different types of vegetation. The influence functions were also used to analyze a frontal passage across the ring of towers on April 29 and May 5 of 2004. It was demonstrated that the towers were affected by different source areas before and after the front, resulting in a visible jump in the observed CO2. The influence functions also indicated a deeper mixing layer and increased vertical exchange in the air affecting the tower observation after the passage of the front. Further simulations for the 2004 ring of towers campaign are being performed with the newest version of our regional meteorological model: SiB-RAMS. The Simple Biosphere (SiB) model is incorporated into RAMS to simulate carbon fluxes from vegetated areas and transport of CO2 in the atmosphere. The LPDM and influence function technique has been linked to the SiB-RAMS and is being used estimate CO2 regional fluxes by inversion calculations using observational data from WLEF and the ring of towers. As a test run for the ring of towers inversion, a short period of 16 days was selected for a SiB-RAMS simulation. The period of July 17 through August 2, 2004 was selected for two reasons. NDVI data for 2004, which is required for the coupled biosphere-atmospheric transport, was not available and therefore we used NDVI data from 2001. Mid-summer was deemed the most interesting time in which NDVI temporal variability would be small. We are working on rectifying this situation and expect the next model to contain the 2004 data, although the model sensitivity to it will probably be quite modest. Secondly, we wanted a single continuous period where we could have the maximum simulation length in addition to the greatest number of towers without gaps in their records. The simulation was performed on a 100x100 grid of 40km cells with an interior nested grid of 98x98 10km cells around the WLEF site. The next simulation will either a) further refine this inner grid to one or two km or b) work with a single refined grid on the scale of 10km. CO2 fluxes and mixing ratios have been extracted from the model as well as several meteorological fields. The data has been explored graphically through simultaneous time animations of the fields as well as time series comparisons over the entire simulation window. Initial results have been positive. Some meteorological fields have compared well between the model and the observations at the WLEF site, such as temperature and H20 mixing ratios. Others, such as surface winds, have not. We will need to further investigate this particular issue as it might indicate errors in our vertical transport and thus associated errors in our CO2 transport.

98
CO2 mixing ratio fields from the 30m height on WLEF have matched better in some sections of the simulation than others. We have seen differences of up to 40 ppm, almost exclusively during the night when respiration is strongest and when nighttime inversions make atmospheric transport difficult to model. There is still a large diurnal contribution to the difference between model and observations that will need to be investigated. As expected due to the larger sampling footprint, the 396m height on WLEF is not as well captured by the model. However the errors are smaller due to a smoothing out of the diurnal trend over this larger sampling footprint. The dominant agent in the difference seems to be on a synoptic scale of around 5 days and will require a different type of exploration than the 30m height difference which is due mainly to the diurnal effect. In addition to the tower observations, we have obtained NASA INTEX aircraft CO2 mixing ratio profiles from the summer of 2004. We have begun investigating these in the hopes of comparing them to the vertical profiles produced from the model. Initial exploration of the INTEX data looks very promising although due to the complicated nature of modeling vertical transport, we do not expect a very high level of agreement with the model. INTEX data was not available over the WLEF during the period we have simulated so initial comparisons will have to be made to results in the coarse outer grid. By expanding the length of the simulation we will be able to include at least one flight in the direct proximity of the WLEF site. 3. Comparison of Objectives Vs. Actual Accomplishments for Reporting Period: We are in progress on all objectives as stated in the original proposal. 4. Leveraging/Payoff: The atmospheric burden of CO2 is steadily increasing in response to widespread anthropogenic combustion of fossil fuels, approximately 7 PgC yr-1 of emissions to the atmosphere. A large portion of this carbon, about 4 PgC yr-1, is absorbed by the earth’s oceans and terrestrial ecosystems. This uptake varies annually from 1 to 6 PgC yr-1. Approximately one-half of this large and variable sink is believed to be due to net uptake by terrestrial ecosystems. Understanding the causes and documenting the spatial distribution of this terrestrial sink of carbon are primary goals of carbon cycle science. Another primary need is to understand the cause of the large interannual variability in the terrestrial carbon sink. Such understanding would enable us to better predict the future response of the carbon cycle to climate and land use change, and may suggest ways to mitigate climate change via management of the terrestrial carbon cycle. Progress is hampered by our limited ability to quantify the terrestrial carbon cycle on appropriate spatial and temporal scales. Measurements of ecosystem-atmosphere CO2 exchange that integrate over domains of similar ecosystem and climate, and across seasons would greatly extend our understanding of the terrestrial carbon cycle.

99
5. Research Linkages/Partnerships/Collaborators, Communications and Networking: Our primary collaborators on this are at Pennsylvania State College, in the research group headed by Ken Davis, who acts as a Co-PI on this project, which is linked to his project under the same name, with funding going directly to Penn State. 6. Awards/Honors: 7. Outreach: Two graduate students have been supported under this project: Jih-Wang “Aaron” Wang, M.S. degree conferred Spring 2005, and Andrew Schuh, who is continuing work on his Ph.D. in Atmospheric Science. 8. Publications (and Presentations): Uliasz, M, AS Denning, KJ Davis, 2005: Uncovering the Lake Signature in CO2 Observations at the WLEF Tall Tower: A modeling approach. Submitted to special issue of Agricultural and Forest Meteorology “Carbon Studies in the Upper Great Lakes Region”. Uliasz, M, AS Denning, KJ Davis, SJ Richardson, N Miles, 2004: Estimations Of Regional CO2 Fluxes - Development Of A Modeling Framework Designed For The Ring Of Towers. A11F-04, Fall AGU Meeting, San Francisco. Richardson, SJ, N. Miles, KJ Davis, M Uliasz, AS Denning, 2004: Estimations of Regional CO2 Fluxes - Analysis of Concentration Data From the Ring of Towers in Northern Wisconsin. A13A-0093, Fall AGU Meeting, San Francisco.

100
101
DEVELOPMENT AND EVALUATION OF GOES AND POES PRODUCTS FOR TROPICAL CYCLONE AND PRECIPITATION ANALYSIS Principal Investigators: J.A. Knaff, L.D. Grasso NOAA Project Goal: Weather and Water Key Words: Tropical cyclone, hurricane, precipitation, rainfall, tropical cyclone intensity, tropical cyclone formation 1. Long-term Research Objectives and Specific Plans to Achieve Them: This project encompases the development and improvement of three separate operational products including: (1) the development and operational implementation of an Advanced Microwave Sounding Unit (AMSU) –based global tropical cyclone intensity algorithm, (2) the development and operational implementation of an objective satellite-based tropical cyclone formation predition for the Atlantic and eastern North Pacific, and (3) improvements of the already operational NOAA/NESDIS Hydroestimator product using cloud resolving numerical modeling. The long term goals of this project are as follows:
(1) To develop and operationally implement an AMSU-based tropical cyclone intensity algorithm developed at CIRA. The original algorithm was developed for use in the Atlantic and eastern North Pacific. Using historical global tropical cyclone datasets this algorithm will be generalized for global use. Once generalized it will be produced in real-time in both an experimental and pre-operational manner at CIRA. Working with NOAA/IPB personnel the Algorithm will be made part of SAB’s set of operational products and will provide routine fixes of tropical cyclones to complement their DVORAK-based tropical cyclone intensity estimates. (2) Using a combination of model analyses, GOES water vapor imagery, and historical tropical cyclone formation datasets an algorithm to predict the probablity of tropical cyclone formation will be developed. Development involves statistical screening of the data, and discriminant analysis to produce the probablity of formation in 5 degree latitude/longitude areas. An experimental version of this product will be produced in real-time at CIRA. Following a period of evaluation by personnel at the National Hurricane Center, and working with personnel at NOAA/NESDIS/IPB, the product will be transitioned to an operational platform. The final product will be displayed on the SAB website. (3) The long term research objectives are to aid in the improvement of the operational hydroestimator in collaboration with Dr. Bob Kuligowski. Specifically, a numerical cloud model is combined with an observational operator—that contains OPTRAN code and radiational transfer models—to produce synthetic GOES infrared images. These images are used in conjunction with numerical model output to build brightness temperature/rainrate statistics.

102
2. Research Accomplishments/Highlights: Using the same format as the previous section, the accomplishments and highlights associated with each product is discussed below. (1) The AMSU-based tropical cyclone intensity and wind structure estimation algorithm was updated using a much larger global tropical cyclone database from 1999-2004 (more than 5 times as large as used in the original algorithm), and was improved by utilizing more advanced statistical techniques. Figure 1 shows that the new algorithm reduced the errors by 10% and 5% for the TD,TS and Cat 4,5 samples, respectively, with comparable performance for the Cat 1,2,3 sample. The new algorithm continues to be run in an experimental manner at CIRA using position information from the Automated Tropical Cyclone Forecast System maintained at the National Hurricane Center (NHC) and the Joint Typhoon Warning Center (JTWC). The results are sent via e-mail to NHC and JTWC, as well to the analysts working at NOAA/NESDIS/SAB, who are participating in the validation. The code for this algorithm was provided to NHC and they are in process of implementing it on the operational computing systems, which receive 24 by 7 support. They will run the global version of the algorithm and distribute the results to all U.S. opertional tropical cyclone forecast agencies.
0
2
4
6
8
10
12
14
16
18
20
22
TD,TS Cat 1,2,3 Cat 4,5
Mea
n A
bsol
ute
Erro
r (kt
)
New MSW Estimation Model
Old MSW Estimation Model
9.410.4
11.9 11.8
19.120.1
Figure 1. The Mean Absolute Error of AMSU based estimates of maximum sustained 1-minute winds (in knots) for the old and new algorithms, stratified by Tropical Depressions and Tropical Storms (TD,TS), Category 1,2,3 hurricanes, and Category 4,5 hurricanes.

103
(2) The tropical cyclone formation parameter was run at CIRA on an experimental basis in real-time during the 2004 hurricane season and continues to run in 2005. The product is updated every six hours and is made available to NHC via the web (see http://www.cira.colostate.edu/RAMM/gparm/genesis.asp ). Several features were added to the website based upon feedback from the forecasters. The probability associated with tropical cyclone formation in the next 24 hours is shown on a 5 x 5 degree lat/lon grid that covers the eastern North Pacific and North Atlantic tropical cyclone basins. Time series of the probabilities integrated over larger spatial regions are also shown on the website. Figure 2 shows the time series of the probability product integrated over the tropical Atlantic from the 2004 hurricane season. The formations tended to occur during at the peaks of the probability product. Also, the probability was much higher than normal over the main part of the season (Aug, Sept and Oct) which corresponded with a very active Atlantic hurricane season. The code for the probability product and related website is currently being installed on operational computing systems of the NESDIS Satellite Analysis Branch. This transition to operations should be completed by the end of 2005.
Figure 2. The tropical cyclone formation probability time series for the tropical Atlantic from the 2004 hurricane season. The black line shows climatological probability and the blue line is the predicted probability. The red circles indicate times when tropical cyclone formation occurred within 24 hours.

104
(3) Several sensitivity simulations of the severe weather event over the central plains of the United States in which mid to upper tropospheric relative humidities have been varied from low to high. Output from each run is used to build statistics for the brightness temperature/rainrate relationship to improve the satellite rainrate algorithm. 3. Comparison of Objectives Vs. Actual Accomplishments for Reporting Period: We have met our objectives for this reporting period. The primary goal in this fiscal year was to turn over experimental algorithms to operational forecast centers and to consult on their implementation. 4. Leveraging/Payoff: There are several payoffs that affect both operational forecasting and the general public. There has long been a need for aditional satellite-based methods for tropical cyclone intensity algorithms. An AMSU-based algorithm offers estimates that are completely independent of the operational standard developed by Dvorak in the the 1970s. Operational forecasters at NHC and JTWC are required to forecast the likelihood of tropical cyclone formation in the next 24 hours. Currently there is little objective guidance for tropical cyclone formation. The algorithm developed in this project offers a truely objective guidance method to aid in these forecasts.An improved Hydroestimator product will result in better forecasts and warnings associated with rainfall, which will benifit the public and industry. 5. Research Linkages/Partnerships/Collaborators, Communications and Networking: We are in collaboration with Dr. Bob Kuligowski of NOAA/NESDIS, Michael Turk (NOAA/NESDIS), Antonio Irving (NOAA/NESDIS), Charles Sampson (NRL, Monterey), Edward Fukada (DOD/JTWC)and James Gross (NOAA/NHC). Once operational, the tropical cyclone products will be available to global tropical cyclone centers and the DOD. 6. Awards/Honors: None as yet. 7. Outreach: (a) Graduate/Undergraduate students (List by name, degree status and continuance after obtaining degree); (b) Seminars, symposiums, classes, educational programs; (c) Fellowship programs; (d) K-12 outreach; (e) Public awareness. (a) An undergraduate student in the Department of Computer Science at Colorado State University (Robert DeMaria) assisted with coding for the verification of the AMSU algorithm. An undergraduate student (Daniel Coleman) at Front Range Community College helped with the GOES data processing. (b) M. DeMaria, April 20, 2005: Tropical cyclone applications of satellite observations. CSU Satellite Meteorology class, Fort Collins, CO
105
J.F. Weaver, October 6, 2005: The variety and scope of research taking place at CSU. Series for local business owners. Fort Collins, CO.
(c) None
(d) None
(e) None 8. Publications:
Refereed Journal Articles Demuth, J.L., M. DeMaria, and J.A. Knaff, 2005: Improvements to the Advanced Microwave Sounding Unit Tropical Cyclone Intensity and Size Estimation Algorithms. Submitted to Journal of Applied Meteorology.
Conference Proceedings
Zehr, R.M., 2004: Satellite Products and Imagery with Hurricane Isabel. AMS 13th Conference on Satellite Meteorology and Oceanography, September 20-23, Norfolk, VA.
Presentations
Knaff, J.A., M. DeMaria R.M. Zehr, and K.J. Mueller, 2005: Development of a Multi-platform Satellite Tropical Cyclone Wind Analysis System. 59th Interdepartmental Hurricane Conference, 7-11 March, Jacksonville, FL.

106
107
DEVELOPMENT OF A MULTI-PLATFORM SATELLITE TROPICAL CYCLONE WIND ANALYSIS SYSTEM Principal Investigator: J.A. Knaff NOAA Project Goal: Weather and Water, Commerce and Transportation Key Words: Tropical Cyclone, Hurricane, GOES data, Microwave satellite data 1. Long-term Research Objectives and Specific Plans to Achieve Them: The purpose of this project is to combine measurements from a number of satellite platforms to estimate the surface wind fields of tropical cyclones. There are several methods for estimating subsets of the tropical cyclone wind field from satellite data that are used at operational forecasting centers. However, these methods tend to be used in isolation. For example, the Dvorak classification method has been used for several decades to provide an estimate of the maximum wind of tropical cyclones from either an infrared or visible satellite image. However, it does not directly utilize other information available such as microwave imagery. In this project, GOES infrared imagery and feature-tracked wind, the Advance Microwave Sounder Unit (AMSU) from the NOAA Polar-orbiting satellites, surface scattermeter winds (currently from QuikSCAT), and passive wind speed estimates from Defense Military Satellite Program (DMSP) microwave data will be combined. The wind information from these various sources will be combined in a specialized varitaional analysis that can include measures such as those from DMSP that only provide a wind speed estimate. The eventual goal of the project is to provide the multi-platform wind tropical cyclone wind analysis system to operational forecast centers. 2. Research Accomplishments/Highlights: During the first year of the project, a method to estimate the wind field from GOES IR data was developed. The IR wind field estimate is the anchor for the variational analysis because that data is nearly always available in all tropical cyclone basins. The IR wind field estimate can then be refined when other data sources are available. For this part of the study, a dataset of 402 cases from 1995-2003 Atlantic and east Pacific tropical cyclones was constructed for development of the IR wind field algorithm. GOES infrared imagery was obtained for these cases, which also have aircraft reconnaissance data available for ground truth. The IR wind algorithm uses a parameter wind model and requires an IR image, the storm position, the storm motion vector, and the storm intensity as input. The variational analysis system was adapted to the problem of using satellite wind observations to estimate a complete surface wind field. The analysis system utilizes a “model fitting” approach, where the data on a regular grid that provide the best fit to the observations is determined. A smoothness constraint helps to determine the wind field in data void regions. In the solution for the final wind field, a “cost function” which measures the difference between the observations and the model counterpart of the

108
observations (in this simplest version of the variational analysis used, the model counterpart of the observations is the analysis wind field interpolated to the observations points) is minimized. In this framework, it is straightforward to include observations that only provide an estimate of the wind speed, but without a direction. Two important contributions to tropical cyclone wind field outside of the eyewall region of the storm comes from the AMSU instrument and from QuikSCAT. Considerable effort was made to determine the error characteristics of these two wind instruments, and a method was developed to convert the AMSU winds (which are representative of winds above the boundary layer) to the surface. This work was performed by a CIRA visiting scientist from the Japanese Meteorloglical Agency (JMA). Figure 1. shows an example of the multiplatform satellite analysis (red) and that obtained primarily from aircraft data (blue) for Hurricane Michelle from the 2001 hurricane season. The winds are along a north-south line through 84.1 oW. Results show that the two methods compare reasonably well. Only a very small portion of the global tropical cyclones are sampled with aircraft data. These preliminary results indicate that a reasonably accurate estimate of the tropical cyclone wind field can be determined using only satellite observations, which are available in all tropical cyclone basins around the world. Figure 1. Comparison of satelite only (red) and aircraft analyses of the surface winds from Hurricane Michelle, 2001.

109
In the second year of this project, collection of satellite derived wind datasets (QuickScat, AMSU, Cloud drift, Water Vapor, SSMI, and IR-based) over all global tropical cyclones has been automated as this project moves toward the goal of a satellite-only tropical cyclone wind field. The collection of these data over a 12 hour period preceeding the synoptic time has also been automated to produce a general format for use in variational analysis described above. The production of 6-hourly tropical cyclone wind fields, like the one shown in Fig. 2, nears automation at the time of this report and should be ready for experimental testing by operational centers by 1 August.
Figure 2: Flight-level (~700 mb) wind analysis, which utilizes IR-based winds, cloud drift winds, QuikSCAT and SSMI which were collected over a 12-h period and navigated to a storm relative framework at 18 UTC 9 September. The longer term goal is to transition the final process to operations.

110
3. Comparison of Objectives Vs. Actual Accomplishments for Reporting Period: The project is on schedule. The development of the components of the satellite tropical cyclone wind algorithm are complete. Real-time analyses will be produced for evaluation by operational forecast centers by 1 August. 4. Leveraging/Payoff: This research should lead to improved methods for estimating the tropical cyclone surface wind field. The improved method will provide more accurate measurements of the radii of critical wind thresholds such as gale, storm and hurricane (34, 50 and 64 kt) that are routinely provided by operational forecast centers. These radii are crucial for determining the timing of coastal evacuations, ship routing, and are used as input for other applications such as wave forecast models, and tropical cyclone track and intensity models. All of these parameters are important for protecting lives and property from the effects of tropical cyclones. 5. Research Linkages/Partnerships/Collaborators, Communications and Networking: This work is a collaborative effort between the NOAA/NESDIS Office of Research and Applications, the NOAA/OAR Hurricane Research Division, the NOAA/NCEP Tropical Prediction Center, the Department of Defense Joint Typhoon Warning Center, Colorado State University and the Japenese Meteorological Agency (JMA). It is likely that some aspects of this research will be adapted by JMA, and may lead to new operational forecast products for JTWC and TPC. 6. Awards/Honors: None as yet. 7. Outreach: (a) Two CSU graduate students (both Masters) have contributed to this research. Julie Demuth helped to develop the AMSU tropical cyclone wind analysis system, and Kimberly Mueller is developing the algorithm for the GOES IR wind field. (b) Seminars, symposia, classes, educational programs: M. DeMaria, April 20, 2005: Tropical cyclone applications of satellite observations. CSU Satellite Meteorology class, Fort Collins, CO. J.F. Weaver, October 6, 2005: The variety and scope of research taking place at CSU. Series for local business owners. Fort Collins, CO.
J.F. Weaver, March 7, 2005: My Career in Meteorology and How I Got There . PaCE (Professional and Career Experience) program. Fort Collins, CO. (c) None
111
(d) D. Watson, H. Gosden, and D.A. Molenar, April 13, 2005: Meeting with PaCE personnel at CIRA regarding partnership with RAMMB and the Poudre High School PaCE (Professional and Community Experience) Program. Information on applications of satellites to hurricane analysis is often included in K-12 presentations. 8. Publications: Refereed Journal Articles Demuth, J.L., M. DeMaria, J.A. Knaff, and T.H. Vonder Haar, 2004: Validation of an advanced microwave sounder unit (AMSU) tropical cyclone intensity and size estimation algorithm, J. App. Met., 43, 282-296. Knaff, J.A., S.A. Seseske, M. DeMaria, J.L. Demuth, 2004: On the Influences of Vertical Wind Shear on Symmetric Tropical Cyclone Structure Derived from AMSU. Mon. Wea. Rev., 132, 2503-2510. Mueller K., M. DeMaria, J.A. Knaff and T. Vonder Haar 2005: Objective Estimation of Tropical Cyclone Wind Structure from Infrared Satellite Data. Submitted to Mon. Wea. Rev. Conference Proceedings Bessho, K., M. DeMaria, J.A. Knaff, and J. Demuth, 2004: Tropical Cyclone Wind Retrievals from the Advanced Microwave Sounding Unit (AMSU): Application to Surface Wind Analysis. AMS 26th Conference on Hurricanes and Tropical Meteorology. 3-7 May, Miami, FL. Velden, C., J. P. Kossin, T. L. Olander, D. Herndon, A. J. Wimmers, R. Wacker, R. T. Edson, J. D. Hawkins, K. F. Brueske, B.W. Kabat, and M. DeMaria, 2004: Toward an objective satellite-based algorithm to provide real-time estimates of TC intensity using integrated multispectral (IR and MW) observations. AMS 26th Conference on Hurricanes and Tropical Meteorology. 3-7 May, Miami, FL. Zehr, R.M., 2004: Satellite Products and Imagery with Hurricane Isabel. AMS 13th Conference on Satellite Meteorology and Oceanography, September 20-23, Norfolk, VA. Presentations Knaff, J.A., M. DeMaria R.M. Zehr, and K.J. Mueller, 2005: Development of a Multi-platform Satellite Tropical Cyclone Wind Analysis System. 59th Interdepartmental Hurricane Conference, 7-11 March, Jacksonville, FL.

112
Mueller, K.J., R.M. Zehr, M. DeMaria, and J.A. Knaff, 2005: Objective Estimation of Tropical Cyclone Wind Structure From Infrared Satellite Data. 59th Interdepartmental Hurricane Conference, 7-11 March, Jacksonville, FL.

113
DEVELOPMENT OF AN ANNULAR HURRICANE EYEWALL INDEX FOR TROPICAL CYCLONE INTENSITY FORECASTING Principal Investigator: J.A. Knaff NOAA Project Goal: Weather and Water Key Words: Tropical Cyclones, Hurricanes, Microwave Imagery, Hurricane Eyewall 1. Long-term Research Objectives and Specific Plans to Achieve Them: Although there has been some slow progress in the ability to forecast hurricane intensity change, the prediction of rapid intensity changes remains problematic. Rapid intensification and rapid decay are associated with processes in the hurricane eyewall such as concentric eyes and eyewall replacement cycles. In these cases hurricane intensity is highly transient. In the other extreme, a new type of storm called an “annular” hurricane has recently been identified, which has a large and stable eye, and tends to remain intense for longer than usually anticipated by hurricane forecasters. In this project, an objective technique to identify annular hurricanes will be developed. Input will include microwave imagery from polar orbiting satellites and infrared data from Geostationary Operational Environmental Satellites (GOES), in combination with synoptic scale information and sea surface temperatures from global analyses. A related index to identify concentric eyewalls using similar input data is being developed at the Cooperative Institute for Meteorological Satellite Studies (CIMSS) at the University of Wisconsin. The annular hurricane index developed in this proposal will be combined with the CIMSS Secondary Eyewall Formation (SEF) Index to form a general Index of Tropical cyclone Eyewall Structure and Tendency (I-TEST). This index will be tested in real-time during the 2006 hurricane season at the National Hurricane Center in Miami for evaluation and to obtain feedback from NHC forecasters. 2. Research Accomplishments/Highlights: This project began at the very end of the current fiscal year, so only preliminary work has been completed so far. The infrared and large-scale NCEP analysis databases have been assembled. The microwave data has been obtained and is currently being copied to a mass storage system so that it can be easily accessed. Coordination with CIMSS has begun, and an overview of the goals of the project were presented to collaborators at the National Hurricane Center in Miami. 3. Comparison of Objectives Vs. Actual Accomplishments for Reporting Period: The project is on schedule.

114
4. Leveraging/Payoff: This project has a direct connection with the public interest. Coastal evacuations and other preparations for tropical cyclones are extremely expensive, and hurricanes that undergo rapid intensity chages are the most problematic. This reseach will help to improve the intensity forecasts for hurricanes that have the potential to rapidly weaken or intensify. 5. Research Linkages/Partnerships/Collaborators, Communications and Networking: This research is a joint effort between several groups with NOAA and the university community, including the NOAA/NESDIS Office of Research and Applications, the NOAA/NCEP TPC, Colorado State University and the University of Wisconsin. 6. Awards/Honors: None as yet. 7. Outereach: (a) Graduate/Undergraduate students (List by name, degree status and continuance after obtaining degree); (b) Seminars, symposiums, classes, educational programs; (c) Fellowship programs; (d) K-12 outreach; (e) Public awareness. (a) None (b) None (c) None (d) None (e) None 8. Publications: Presentations M. DeMaria, May 3, 2005: NESDIS/ORA and CIRA Joint Hurricane Testbed and Hurricane Supplemental Projects. National Hurricane Center Seminar, Miami, FL.

115
DEVELOPMENT OF THREE-DIMENSIONAL POLAR WIND RETRIEVAL TECHNIQUES USING THE ADVANCED MICROWAVE SOUNDER UNIT Principal Investigator: T.H. Vonder Haar NOAA Project Goal: Weather and Water Key Words: POES, AMSU, satellite-derived wind measurements 1. Long-term Research Objectives and Specific Plans to Achieve Them: Satellite-derived wind measurements are most valuable over the oceanic regions where fewer conventional observations exist. This lack of observational data extends over all latitudes, from the tropics to the polar regions. Recent results have shown that horizontal winds in polar regions estimated from satellites have the capability to increase the accuracy of numerical model forecasts, illustrating the need for improved wind observations in these data sparse regions. A satellite-based method for estimating the winds in tropical cyclones has been adapted for use at high latitudes. In this method, temperature profiles are calculated from radiances from the Advanced Microwave Sounder Unit (AMSU) which flies aboard NOAA’s most recent polar-orbiting satellite series. Using the hydrostatic assumption and a 100-hPa height field from the GFS model as a boundary condition, the temperature profile is used to compute the height field as a function of pressure. A nonlinear balance equation is then solved for the streamfunction, from which the u and v components of the nondivergent wind may be calculated. These retrievals will be referred to as sounder nonlinear balance winds. Specifics of the plan to develop this technique include:
Validation of the temperature and wind retrievals against radiosonde measurements.
Conversion of the nonlinear balance equation solver from beta-plane geometry on an equidistant latitude/longitude grid to polar stereographic coordinates.
Comparison of the sounder nonlinear balance winds with other methods, such as feature-tracked wind measurements.
Near real-time generation of sounder nonlinear balance winds to get a larger dataset for validation against radiosondes and comparison to other techniques.
Coordination with other groups to determine if a multi-platform method can be used to more accurately estimate polar winds.
2. Research Accomplishments/Highlights:
Research accomplishments of the past year include:
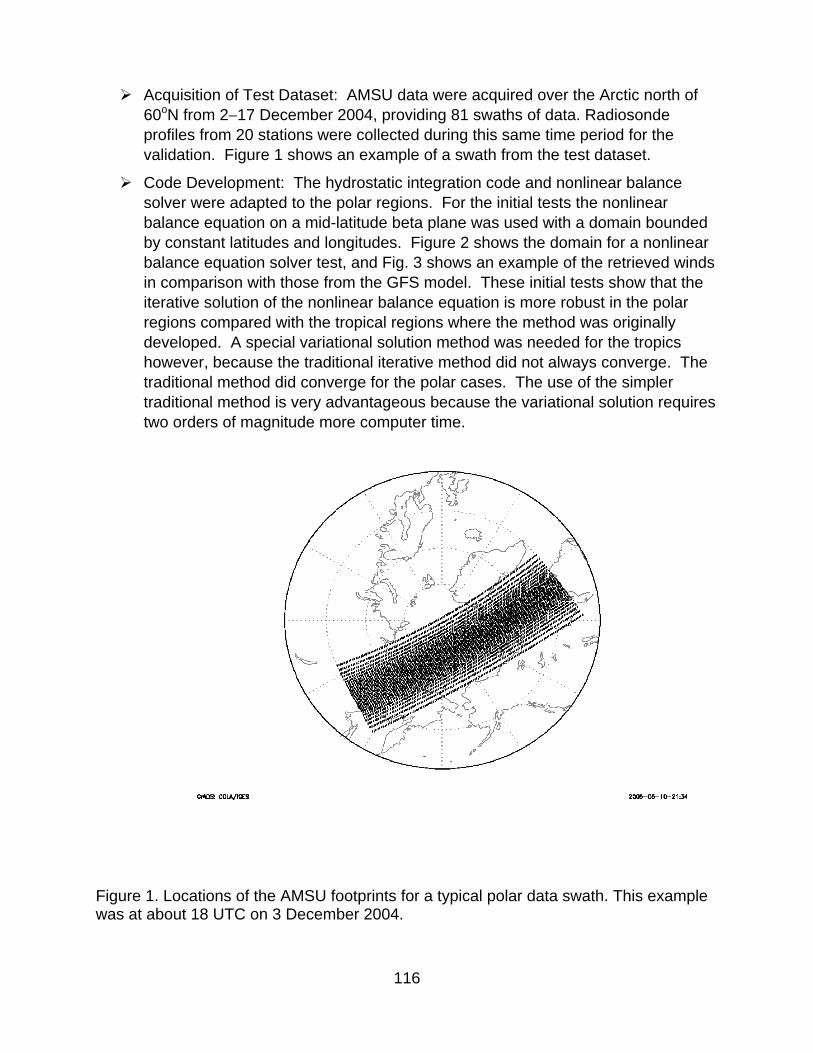
116
Acquisition of Test Dataset: AMSU data were acquired over the Arctic north of 60oN from 2−17 December 2004, providing 81 swaths of data. Radiosonde profiles from 20 stations were collected during this same time period for the validation. Figure 1 shows an example of a swath from the test dataset.
Code Development: The hydrostatic integration code and nonlinear balance solver were adapted to the polar regions. For the initial tests the nonlinear balance equation on a mid-latitude beta plane was used with a domain bounded by constant latitudes and longitudes. Figure 2 shows the domain for a nonlinear balance equation solver test, and Fig. 3 shows an example of the retrieved winds in comparison with those from the GFS model. These initial tests show that the iterative solution of the nonlinear balance equation is more robust in the polar regions compared with the tropical regions where the method was originally developed. A special variational solution method was needed for the tropics however, because the traditional iterative method did not always converge. The traditional method did converge for the polar cases. The use of the simpler traditional method is very advantageous because the variational solution requires two orders of magnitude more computer time.
Figure 1. Locations of the AMSU footprints for a typical polar data swath. This example was at about 18 UTC on 3 December 2004.

117
Figure 2. The domain for the nonlinear balance equation test case.
Figure 3. The 700 hPa winds from the AMSU nonlinear balance retrievals (left) and the corresponding winds from the GFS analysis (right) at about 18 UTC on 3 December 2004. The location of the domain is shown in Fig. 2.

118
3. Comparison of Objectives Vs. Actual Accomplishments for Reporting Period: All stated objectives were met during the 1-year reporting period. 4. Leveraging/Payoff: The development of a satellite-based wind retrieval technique for use over the polar regions will provide wind measurements in an area which is currently sparsely sampled. The inclusion of these wind measurements into numerical models can improve forecasts, to the general benefit of the public. 5. Research Linkages/Partnerships/Collaborators, Communications and Networking: The polar winds project involves collaborations with other agencies. The AMSU temperature retrieval code was developed by Mitch Goldberg of National Environmental Satellite, Data, and Information Service’s Office of Research and Applications. The feature-tracked wind code with which comparisons will be made is the product of the Cooperative Institute for Meteorological Satellite Studies located at the University of Wisconsin – Madison. 6. Awards/Honors: None as yet. 7. Outreach: (a) Graduate/Undergraduate students (List by name, degree status and continuance after obtaining degree); (b) Seminars, symposiums, classes, educational programs; (c) Fellowship programs; (d) K-12 outreach; (e) Public awareness. None 8. Publications: None as yet.
119
ENVIRONMENTAL APPLICATIONS RESEARCH Principal Investigator: T.H. Vonder Haar NOAA Project Goals: Various Key Words: Various 1. Long-term Research Objective s and Specific Plans to Achieve Them: Various. See following reports 2. Research Accomplishments/Highlights: See following reports 3. Comparison of Objectives Vs. Actual Accomplishments for Reporting Period: See following reports 4. Leveraging/Payoff: See following reports 5. Research Linkages/Partnerships/Collaborators, Communication and Networking: See following reports 6. Awards/Honors: See following reports 7. Outreach: See following reports 8. Publications: See following reports

120
I. EAR - Research Collaborations with the Director's Office
CIRA proposed to collaborate closely with the Director’s Office on the continued development and refinement of various research mesoscale models such as the Weather Research and Forecast (WRF) model. CIRA’s efforts were to be directed to the testing and implementation of boundary layer parameterization, along with improvements to the cloud microphysics processes and on additional initialization sensitivity studies. However, the researcher responsible for the effort departed CIRA and this collaboration was not pursued. In the area of data assimilation, CIRA had proposed that important issues related to 3-D and 4-D variational data analysis be investigated. Continuing research in support of FSL’s initiative on a UAV component of a global observational network and the development of a new gridpoint model using a global icosahedron grid was also proposed. However, the CIRA scientist responsible for this collaboration was hired as a federal FSL employee at the start of the fiscal year so this effort ceased as a CIRA project.

121
II. Research Collaborations with the Aviation Division A. High Performance Computing-Advanced Computing Principal Researchers: Jacques Middlecoff and Dan Schaffer; Team Member: Jeff Smith NOAA Project Goals/Programs: In the area of High Performance Computing-Advanced Computing, CIRA proposed four research efforts. All four efforts support NOAA mission goals of (1) Weather and Water—Serve society's needs for weather and water information/Environmental modeling; and (2) Commerce and Transportation—Support the Nation's commerce with information for safe, efficient, and environmentally sound transportation/Aviation weather, Surface weather, and NOAA emergency response. Key Words: Computational grid; TeraGrid; gridpoint statistical interpolation; model parallelization; WRF portal Summary of project objectives and research accomplishments: 1. CIRA researchers would continue to explore the feasibility of combining geographically distributed computing resources into a single virtual resource (a computational grid). In FY03-04, a rudimentary grid was constructed consisting of a few nodes at the Pacific Marine Environmental Laboratory (PMEL) and FSL. In FY04-05, this grid would be extended into a full prototype NOAA grid. It would include more nodes at the aforementioned labs plus a cluster of nodes at the Geophysical Fluid Dynamics Laboratory (GFDL). The coupled Weather Research and Forecast (WRF) / Regional Ocean Modeling System (ROMS) model would be tested across the prototype NOAA grid. In addition, the coupled WRF/ROMS model will be tested across the NSF-sponsored TeraGrid. This effort was largely successful. A prototype NOAA computational grid has been developed. It includes processors located at the Forecast Systems Laboratory in Boulder, Colorado, the Geophysical Fluid Dynamics Laboratory in Princeton, New Jersey, and the Pacific Marine Environmental Laboratory in Seattle, Washington. A rudimentary grid-scheduler has been developed. It allows users to submit jobs from nodes anywhere on the grid. The jobs are able to execute on any of the grid computer clusters. Needed data can be staged to and/or from the remote clusters. A NOAA certificate authority has been developed that provides a secure means for users to access the grid with a "single sign-on." Although it was not possible to couple the WRF/ROMS across the grid due to hardware limitations at GFDL, the coupling of these models across the TeraGrid is in progress. 2. CIRA researchers would: a) further develop and test the ROMS benchmark for the joint procurement benchmark suite; b) provide technical assistance where appropriate in the development of the benchmark suite; c) participate in the evaluation of the vendor
122
proposals; and d) port codes between the three machines at NCEP, GFDL and FSL to establish interoperability between those three machines. The ROMS benchmark was completed and became part of the benchmark suite. CIRA researchers provided technical assistance in the development of the benchmark suite, particularly in the area of comparing output where CIRA researchers wrote a program for fuzzy comparison of NetCDF output files. CIRA researchers also ported the Grid-point Statistical Interpolation (GSI) code and GSIgraph from the IBM machine to jet, continue to maintain and enhance the WRF port to ijet (see #4), and have made headway in porting GFS to jet. 3. CIRA researchers would continue their collaborations on the development of computer software for the parallelization of atmospheric and oceanic weather and climate models. Collectively, this software suite is known as the Scalable Modeling System (SMS). During FY04-05, CIRA researchers would enhance the SMS suite to support nested models with three or more nests such as the Taiwan Central Weather Bureau Non-hydrostatic Forecast System. This effort was highly successful. SMS has been upgraded to provide support for nested models with three or more nests. SMS was used to develop an efficient parallel implementation of the Taiwan Central Weather (CWB) Bureau Non-hydrostatic Forecast System (NFS). The SMS parallel version of NFS was included in a benchmark suite released in June, 2005 as part of CWB supercomputer procurement process. 4. CIRA scientists would participate in the Developmental Testbed Center (DTC) by porting codes to ijet as necessary and assisting DTC participants in running codes on ijet. This effort was very successful. Last year, CIRA scientists ported WRF/NMM V1 to ijet where it was used by the DTC to do a set of retrospective runs. This past year, the DTC wanted to make a series of forecasts using WRF/NMM for the DTC Winter Forecast Experiment (DWFE). To be relevant to the weather forecasting community, the DWFE needed to use the latest physics which were incorporated into WRF/NMM V2. However, supporting software packages for WRF/NMM V2, such as the SI and post, were not available which made it impossible to use WRF/NMM V2. CIRA scientists stepped up to the challenge by merging the V2 physics package into WRF/NMM V1 thereby allowing the DTC to successfully use the new physics for the DWFE. The DWFE was so successful that a follow-on experiment, NMM5-CONUS, started on April 01 and will end on July 31st. CIRA scientists further helped the DTC effort by debugging problems with the WRF/NMM code which surfaced during the DWFE runs on ijet, and by assisting FSL scientist Dr. Georg Grell with the WRF/Chem code. Not satisfied with merely helping DTC scientists run WRF on ijet, CIRA scientists along with FSL scientist Mark Govett designed and developed a prototype WRF Portal, a Java based GUI front end for running WRF. CIRA scientists met with DTC scientists at FSL and NCAR to determine requirements and then designed and developed the mySQL

123
database and the Java application, and worked with Chris Harrop to develop the communication protocols between the client side application, WRF Portal, and Chris Harrop's server side workflow manager/job scheduler. Publications: Devenyi, D., S.G. Benjamin, J.M. Middlecoff, T.W. Schlatter, and S.S. Weygandt, 2005: Gridpoint statistical interpolation for Rapid Refresh. 21st Conference on Weather Analysis and Forecasting, 1-5 August 2005, Washington, D.C., Amer. Meteor. Soc. B. Aviation Systems—Development and Deployment Project Title: FXC VACT (Volcanic Ash Coordination Tool) Project Principal Researcher: Jim Frimel; Team Members: Young Chun and Lisa Gifford NOAA Project Goals/Programs: Weather and Water—Serve society’s needs for weather and water information/Local forecasts and warnings; Commerce and Transportation—Support the Nation’s commerce with information for safe, efficient, and environmentally sound transportation/Aviation weather Key Words: Volcanic ash advisories, data ingest and display system, collaborative tool Background and goals/objectives The FX-Collaborate software (FXC), developed at NOAA's Forecast Systems Lab (FSL) Systems Development Division, is a major component of the FXC FAA and FXC VACT projects. The major system used to acquire, distribute, create and provide the required datasets for the FXC VACT, TMU, and the FXC FAA projects is the AWIPS Linux data ingest and display system. The FXC and AWIPS system software is being tailored, modified, extended, enhanced, and utilized in these projects for use at the participating agencies. The FXC software allows for the remote access and display of AWIPS datasets over the Internet, a collaboration capability among participants at physically different locations, and the ability to utilize tools to aid in discussing forecasts. The TMU project is comprised of AWIPS Linux data ingest systems and Web Servers specifically developed for the creation of web-based products generated via output from the AWIPS system. The FXC VACT project is a custom client/server-based application utilizing the Internet and is based on the FX-Collaborate system architecture. This project is a research and development effort in direct response to investigating the collaborative approaches and needs of agencies involved in generating Volcanic Ash Advisories. The agencies currently participating in this effort are the National Weather Service Alaska Region Headquarters (NWSARH), Anchorage Volcanic Ash Advisory Center (VAAC), Alaska Volcano Observatory (AVO), and the Anchorage Air Route Traffic Control Center,

124
Center Weather Service Unit (CWSU). The FXC Volcanic Ash Coordination Tool is being used at each of these operational sites to investigate forecaster productivity tools and collaboration capabilities in response to aviation hazards posed by volcanic eruptions. The system is being used to simultaneously view identical displays, and share weather information and local site-specific data in near real-time. The project will research collaborative approaches with the goal of helping to create a suite of fully consistent advisories and forecasts for volcanic ash. The FXC VACT Project was rapidly spun up in 2003 by utilizing existing technologies, systems and infrastructure already in place within the ASDAD branch. Four new FXC Client systems were deployed running Windows XP as the operating system. A new Dell 2650 PowerEdge High Availability Server was configured to run the FXC and AWIPS data ingest server software. Previously, the FXC server and AWIPS data ingest server ran on their own respective machine. Running the system in this configuration reduced hardware costs, maintenance costs, and rack space requirements, while improving system efficiency, reliability and software maintenance. Two systems were configured in this fashion as our primary and backup servers for the VACT Project. The initial release of the FXC VACT systems included the delivery and installation of both the hardware and software required by the project. The purpose of this release was to train and familiarize the participating agencies on the current capabilities of the FXC VACT software and systems. Successive software releases and enhancements included the creation of a new localization consisting of specific scales such as Kamchatka and the Aleutian Islands. Aviation map backgrounds have been created and added to include Alaska navigation aids, Alaska Sigmet locations, airport runways and volcano locations. Capability to display and load specific model families and model data defined for the FXC VACT region has been added to the system. This includes the UKMET, AVN, MRF, ECMWF and the MesoETA model data. The satellite menus have been reorganized and renamed to include the HRPT, DMSP and FY3C. The Alaska HIPS Imagery satellite data has been added to the systems and is being ingested via an LDM feed from the National Weather Service Alaska Region Headquarters. Additionally, CCFP 2, 4, and 6 hour forecast and text products have been added. The ability to display an example of Puff model output, a volcanic ash particle-tracking model, from the University of Alaska, Fairbanks, has been added to the FXC VACT system During the 2004/2005 research year, CIRA staff at FSL spent time investigating and extending the current capabilities of the FX-Collaborate and AWIPS systems to apply towards the FXC VACT project requirements. An initial design of an interface for running the Puff UAF dispersion model from the FXC VACT system has been completed. One of the goals of developing the Puff interface for FXC was to implement the capabilities that are available for running puff outside of FXC as well as extending this functionality and leveraging the strengths of FXC. Some of the capabilities based on Puff's technical manual include the ability to change parameters, run multiple eruptions, use remote sensing data, and the ability to handle multiple runs. The capabilities and extensions implemented within FXC include the following: ability to change parameters and the start of parameter/value checking, ability to select English or Metric units, ability to run all input arguments that Puff can recognize, ability to

125
generate output against multiple models, and an initial design for handling multiple eruptions. From the FXC Puff GUI, each of the participating agencies has the ability to independently run the Puff model and generate/store their own model output. Each organization’s model runs are available for viewing and sharing with each of the participating agencies. Puff is currently producing output based on the AVNGBL and the UKMET grids. These grids were added to the system to enable Puff to be run over the desired area of interest. The MesoETA grid is also being used. However, there is currently a problem under investigation with the output generated from this grid. A lot has been accomplished with respect to Puff within FXC but there is still a lot more that needs to be addressed.

126
Fig. 1 provides a view of the Puff-UAF FXC Model Launcher interface.

127
Fig. 2 shows the March 17, 2005 eruptions of Klyuchevskoy; Kamchatka, Russia and captured ash cloud with HRPT IR 4/5 enhanced.

128
Fig. 3 shows the March 17, 2005 eruptions of Klyuchevskoy; Kamchatka, Russia showing Puff-UAF FXC model output run iteratively to show dispersion forecast of the ash cloud.
Additional enhancements and capabilities added to the FXC software included the ability to display the Alaska HIPS Imagery satellite data at its distributed high resolution. There is a significant limitation in the AWIPS system when exporting images to FXC that reduced the resolution of the images. A virtual scales technique was developed and employed in order to do so. A GIS volcano database that allows the user to query this map overlay and retrieve current volcano information was implemented, along with a procedure for keeping this database up-to-date based on the Smithsonian Institute’s volcano database. Other map additions to the software include updates to the navigational aids and NOPAC North Pacific Route Systems maps. Additional data enhancements include the addition of Russian, Japanese, Asia, and Chinese RAOBS, specific radar data and sites for VACT, and the high-resolution grids for that region (AVNGBL, ECMWF, UkMet, MesoEta, Alaska). The ability to display PIREP data on the system is being developed. Delayed Aircraft Location Data from the WSI Pilot Brief

129
system from ingest, decoding, to display was developed and is currently being displayed. Additional enhancements to make these objects appear as directional aircraft need to be developed. An additional tool was developed to assist the forecaster in generating predefined text for the MIS Meteorological Impact Statement from the Alaska Center Weather Service Unit.
Fig. 4 shows some enhancements to the FXC VACT display; MIS Template Text, Aircraft Location Data, NOPAC Routes, GIS Volcano Query of Mt. Spurr
Figures 3 and 4 provide a glimpse of the assistance FXC VACT may provide to aviation forecasters in achieving the goal of generating fully consistent, accurate and timely volcanic ash advisories and forecasts, which in turn affects the safety, efficiency and quality of air traffic operations within International and the National Airspace System (NAS). The ability to run Puff iteratively over an actual volcanic ash event in order to match the model output with the initial plume may assist forecasters to predict ash movement more accurately. This information coupled with FXC VACT's strengths and capabilities of collaborative sharing, overlaying weather information, aviation

130
information, and tools for product generation is expected to result in more consistent, accurate, and timely volcanic ash advisories and forecasts. These added capabilities, along with general software maintenance, hardening, bug fixes and enhancements, describe the two major and two minor releases of the FXC VACT system software during 2004/2005. These major releases were version 2.1 in October 2004 and version 2.2 in April 2005. The culmination of this year's effort was for targeting an operational exercise to test the functionality and utility of FXC VACT in Alaska with the participating agencies. In order to perform this exercise, a scenario was developed to simulate a potentially "real" volcanic eruption in the North Pacific. A successful test based on this scenario was conducted on May 25, 2005. The participating agencies were FSL, the Alaska Aviation Weather Unit, Alaska Volcano Observatory, and the Anchorage Center Weather Service Unit. The test and meetings that followed enabled the participants to exercise the FXC VACT system in a simulated operational situation; familiarize users with VACT capabilities; develop collaboration strategies and protocols for operations; gather feedback on new needs, limitations and requirements; and identify the immediate and potential benefits of the FXC VACT system to operations.
Summary of Project Objectives and Research Accomplishments: The VACT project is highly dynamic, customer driven and relies heavily on customer feedback. As such, requirements, plans, schedules and goals are subject to change. Objectives: The VACT systems will be enhanced with meteorological datasets to improve the detection and prediction of aviation hazards. The range and focus of this research includes volcanic map displays, model and dispersion model data, enhanced maps, GIS, impact databases, and product Generation tools. Accomplishments:
(Completed/In Progress) * Geographic volcano location database sampling * Puff volcanic ash dispersion models * Aircraft Location data and displays * Sector map displays
(In Progress)
* Cloud top interrogation database * Volcanic ASH and TS CWA displays * Volcanic ASH SIGMET displays * TCHP products with NCWF2 * Research Volcanic ASH and TS CWA Creation * Develop international SIGMET displays * Develop WEB display Interface for VACT * VAFTAD dispersion model * CANERM dispersion model

131
Research Linkages/Partnerships/Collaborators: Alaska Volcano Observatory, FAA Alaska Center Weather Unit, FAA Anchorage Weather Service Unit Project Title: Federal Aviation Administration (FAA) Prototyping and Aviation Collaboration (PACE) Effort—Traffic Management Unit (TMU) Project and FXC FAA Project Principal Researcher: Jim Frimel; Team Members: Young Chun and Lisa Gifford NOAA Project Goals/Programs: Weather and Water—Serving society’s needs for weather and water information/Local forecasts and warnings; Commerce and Transportation—Support the Nation’s commerce with safe, efficient, and environmentally sound transportation/Aviation weather Key Words: Aviation weather, software tools, data products Background and Goals/Objectives: PACE is an operational test area located within the Fort Worth Air Route Traffic Control Center's CWSU for developing innovative science and software technology used to directly provide weather support for the ARTCC Traffic Management Unit (TMU). A major goal of PACE is to investigate aviation datasets and forecast products specifically tailored for the ARTCC air traffic weather forecasting environment among operational weather forecasting facilities, and to investigate the utilization of collaborative weather forecasting. The FAA PACE effort as it relates to CIRA research at NOAA Forecast Systems Lab (FSL) is currently comprised of two separate investigative projects—the TMU project and the FXC FAA project. This effort was spawned from the necessity to research and investigate innovative software tools and data products for minimizing adverse weather disruptions in air traffic operations within the National Airspace System (NAS). Requirements and needs can be found in the study performed by FAA ARS-100 on “Decision-Based Weather Needs for the Air Route Traffic Control Center (ARTCC) Traffic Management Unit.” The TMU project is the web-based research and development of products available directly to the Air Traffic Controllers for their evaluation via the Internet. The FXC FAA project is the research and development of software utilized in the PACE facility for investigating and demonstrating collaboration and prototyping of aviation specific data products. The TMU project is currently in the initial phase of a four-phase project designed to address the weather information needs of the TMU relating to the weather-related hazards consisting of convection, icing, turbulence, and ceiling/visibility. Each phase will address the tactical (0-1 hour) and the strategic (2-6 hour) application of the above
132
products to help the TMU decision maker in directing air traffic into and out of the ARTCC airspace. All phases will be subjected to the iterative process of defining, developing, demonstrating, and evaluating the weather related hazard graphic and its presentation to Traffic Manager users. Relating to advanced product displays, visualization and the WWW, CIRA researchers at FSL have enhanced the prototype Tactical Convective Hazards Product (TCHP) on the Traffic Management Unit (TMU) restricted website (http://tmu.fsl.noaa.gov). Previously, the TMU website home page was redesigned and reorganized along with tactical and strategic placeholders for all future products under development. Specific product descriptions used in the TCHP display were accessible via links from the product checkboxes. The CCFP 2, 4, and 6 hour forecast and text products had been added to the static pages with the 2 Hour CCFP and 1 Hour Convective Sigmet products added to enhance the TCHP animation page. Additionally, the capability for automatic updates of products was added to the image player. A very useful added capability used in the evaluation of products and training was the ability to archive and playback TMU data sets. Enhancements had been made to the Impacted Jet routes product by additionally utilizing NCWD as input along with the NCWF and adding a 10 nautical mile impact buffer around the jet routes. During the 2004/2005 research year, CIRA staff at FSL spent time investigating and extending the current capabilities of the FXC FAA and AWIPS systems to apply towards the TMU project requirements. Work was completed on the NCWF Performance indicator. This product can be used to compare the current NCWD with the previous hour's NCWF. Also added were the impacted low, high, and super high sectors. The impacted sectors are based on NCWD and NCWF product height information when possible. NCWD lights up impacts as red, whereas NCWF lights up impacts as yellow. VOR Location and IDs have been combined into a single map overlay. Additionally, delayed Aircraft Location Data from the WSI Pilot Brief system has been added to the display and the menu layout was rearranged to include a Decision Aids section.

133
Fig. 5 shows some of the enhancements to the TCHP web page including NCWF Performance, Aircraft Location Data, Impacted Sectors, and Change in Menu layout highlighting Convective products and Decision aids.
The crosswind Decision Aid page displays the DFW runways in a color encoded go-caution-no go fashion of green, yellow, and red based on runway crosswind information. This prototype crosswind impact page was enhanced with a Dry, Wet, IFR runway indicator and additional FYI usage link to help interpret the various cases and meanings.

134
Fig. 6 shows the runway indicators enhancement to the crosswind decision aid page.
These added capabilities, along with general software maintenance, hardening, bug fixes and enhancements, describe the change to the FXC FAA and TMU project software during 2004/2005. The goal of the TMU website is to consolidate all tactical aviation weather hazards information into a suite of products for presentation to TMU decision-makers in an easily understood format such as what was done for the TCHP. The TMU project will capitalize on development of advanced products from the AWRP and optimize the use of conventional advisories. Feedback from the ZFW Traffic Management Unit and Center Weather Service Unit participants will help refine the content and presentation. The Demonstration and Evaluation (D&E) will expedite fielding of advanced products by obtaining operational input early in the process. When there is agreement between the participants that a satisfactory product has been created, specific recommendations will be made for national implementation on FAA operational systems such as the Volpe National Transportation Systems Center Enhanced Traffic Management System. Summary of Project Objectives and Research Accomplishments: The TMU research is highly dynamic, customer driven and relies heavily on customer feedback. As such, requirements, plans, schedules and goals are subject to change. Objectives: The AWIPS/FXC TMU systems will be enhanced with meteorological datasets to improve the detection and prediction of aviation hazards. The range and focus of this research includes volcanic map displays, model and dispersion model data, enhanced maps, GIS, impact databases, and product generation tools.

135
Accomplishments: (Completed/In Progress) * Aircraft Location data and displays * Sector map displays * Geographic on/off impact databases of runways, jet routes and sectors. * Research and Develop Red/Green light grid approach to TMU Website (In Progress) * Cloud top interrogation database * TCHP products with NCWF2 * Automated TMU Products for icing (PIREPs, AIRMETs, SIGMETs, CWAs, RUC 40km, CIP, IIFA) * Continued research on CWA Creation tool
(Yet to be started) * Research and develop application approach to TMU web capabilities * Research, design and development of a java-based tool for creating CWA's. * Research into the collaborative spatial and temporal ARTCC boundary aspects of CWA's.
Research Linkages/Partnerships/Collaborators: FAA AWC, NWS CWSU Awards:
This past year, the project received the National Weather Association’s Aviation Meteorology Award presented to the CWSU Fort Worth Staff and FSL Aviation Division for exceptional sustained efforts to develop and implement operations enhancements in the area of aviation services.
C. Forecast Verification Branch Project Title: Real-Time Verification System (RTVS) Principal Researcher: Sean Madine; Team Members: Chris Steffen and Dale Betterton NOAA Goal / Program: Commerce and Transportation—Support the Nation’s commerce with information for safe, efficient, and environmentally sound transportation / Aviation Weather Key Words: Verification, aviation weather
RTVS Background Over the past several years, the FAA Aviation Weather Research Program (AWRP) has funded the NOAA Forecast Systems Laboratory (FSL) and its collaborators to develop the Real-Time Verification System (RTVS). This system, currently operated at FSL, provides statistics and verification displays in near real-time for aviation forecast

136
products being created by the Aviation Weather Center (AWC) and the Alaska Aviation Weather Unit (AAWU), both operational NOAA entities. It also generates statistics for experimental products that are being transitioned to operations through the Aviation Weather Technology Transfer (AWTT) process. RTVS makes all of this information available to operational and research communities through the Internet.
Fig 1. Example of RTVS verification of the Collaborative Convective Forecast Product (CCFP), a human-generated strategic forecast issued by the NWS/AWC. This is just one of many forecast and analysis products evaluated by RTVS.

137
Long-term Research Plans:
The CIRA team working on RTVS will continue to collaborate with the Aviation Division in the following areas: 1. Long-term statistical assessment of operational aviation weather products
2. Evaluation of experimental aviation weather products for transition to operations 3. Development of processing infrastructure to support near real-time evaluations
2004-2005 Research Highlights: 1. Quality Assessment of Cloud Top Height Product The CIRA team significantly contributed to a quality assessment of the Cloud Top Height product (CTOP) created by the FAA AWRP Oceanic Weather Product Development Team. The evaluation report, presented to a formal technical review panel, provided an intercomparison-based analysis of CTOP with an operational cloud top height product. This analysis marked the first use of remote sensing data for verification of aviation weather products in the context of the AWTT process. Based strongly on the results of the CIRA analysis, the FAA technical reviewers decided to make the CTOP product available to operational organizations on an experimental basis. This decision has given approval for pilots to receive the CTOP product on an experimental basis to make improved tactical decisions while en route over remote oceanic areas.

138
Fig 2. Example of the Cloud Top Height product that was assessed by CIRA researchers and subsequently moved to evaluation in an operational setting. (Produced by FAA AWRP Oceanic Weather PDT)
2. Technology Transfer of RTVS to NWS Headquarters Verification Group CIRA researchers successfully deployed a prototype RTVS configuration to the NWS Headquarters in Silver Spring, MD. The transfer provides the NWS operational verification group with the ability to perform long-term quality assessments of operational aviation weather products issued from the NWS Aviation Weather Center. This capability, a significant upgrade, aligns very well with the recently elevated NOAA priorities regarding performance evaluation of weather forecasts. 3. User-Based Verification of Convective Forecasts for Aviation Current verification efforts attempt to include measures reflecting the value of the forecast to the users of that information. The CIRA team studied the user-based verification of the Collaborative Convective Forecast Product (CCFP) by incorporating the Aircraft Situational Display (ASD), information about the flight tracks of air traffic in the National Airspace System (NAS), into the quantitative skill scores. By combining quantitative meteorological measures with user impact measures, the analysis creates an overall evaluation of the usefulness of the forecast from the user’s point of view. This information will enable better use of meteorological forecast tools by the strategic air traffic decision community. Below is an example of the impact of convection upon

139
the capacity of a transcontinental air traffic route, a measure that once established, CIRA researchers will use to weight the contribution of the traditional meteorological scores to the overall performance metrics.
Fig 3. A plot of the observed capacity of segments along a transcontinental air traffic route. The blue counts associate with fair weather while the red counts coincide with significant convective activity. In this comparison, convection clearly impacts the airspace capacity.
Summary of Objectives and Accomplishments for 2004-2005: Objective: Evaluation of satellite imagery for verification of products that span "data poor" regions (e.g. oceanic regions)
Status: Completed. CIRA contributed to the evaluation of the cloud top height product as described in the highlights section.
Objective: Analysis and creation of an overall system architecture that will support RTVS processing needs
Status: In Progress. CIRA researchers have performed initial risk reduction development in support of the analysis phase of the system analysis and design.
Objective: Evaluation of system optimization in the context of large geophysical data set processing

140
Status: In Progress. CIRA researchers have performed initial investigations of system processing optimization that will be used in the overall design effort to be carried out in the next fiscal year.
Objective: Research of strategies for data management of geophysical observations, diagnostics and forecast products
Status: In Progress. CIRA researchers have performed initial investigations of data management that will be used in the overall design effort to be carried out in the next fiscal year.
Objective: Research of verification methodologies related to probabilistic forecast products
Status: In Progress. The CIRA team has investigated the use of the Brier score and reliability diagrams in the evaluation of probabilistic forecasts of convection. These approaches will be incorporated into RTVS in the next fiscal year.
Research Collaborations: CIRA researchers in the RTVS group collaborated and/or partnered with the following organizations during the 2004-2005 fiscal year:
Federal Aviation Administration (FAA) National Weather Service (NWS) National Center for Atmospheric Research (NCAR) National Environmental Satellite, Data, and Information Service (NESDIS) Cooperative Institute for Meteorological Satellite Studies (CIMSS) Cooperative Institute for Research in the Environmental Sciences (CIRES)

141
III. Research Collaboration with Information & Technology Services Project Title: Data Systems Group Principal Researcher: Christopher MacDermaid NOAA Project Goals/Programs: (1) Weather and Water—Serve society’s needs for weather and water information/Local Forecasts and Warnings, Air Quality, Environmental Modeling; (2) Commerce and Transportation—Support the Nation’s commerce with information for safe, efficient, and environmentally sound transportation Key Words: Data acquisition, data decoding, data formats, observations, transformation CIRA researchers in DSG collaborate with the NOAA Forecast Systems Lab (FSL) scientists and developers to assemble and maintain a state-of-the-art meteorological data center. The results of this work facilitate the ability of fellow scientists to perform advanced research in the areas of numerical weather prediction (NWP), application development, and meteorological analysis and forecasting. Multiple computers operate in a distributed, event-driven environment known as the Object Data System (ODS) to acquire, process, store, and distribute conventional and advanced meteorological data. The services provided by ODS are illustrated in Figure 1.
FTP
Transfom
Archive
Compute
Ingest LDM
On-line
S
ACARS GOES NOAAPORT NOWrad Etc.
GRIB BUFR GVAR METAR WSR-88D Etc.
Real-Time Data & Notifications
MM5 RSAS RUC WRF Etc.
Real-Time Data Repository & User Data
Fig. 1. Central Facility services provided by ODS
142
Long Term Research Objectives and Specific Plans to Achieve Them: Design and development for new and modified data sets are on-going activities. Use of ODS applications and methods will expand as legacy translators and product generation methods are replaced by new, more flexible techniques. Object Oriented (OO) software development for point data types will continue.
Design and development will continue toward creating an automated "archive search" system. This will facilitate the retrieval of data sets for use by researchers studying interesting weather events.
Development of new metadata handling techniques is planned. This will facilitate the use of real-time and archived data sets. An automated system for acquiring and incorporating metadata is part of this plan. Further research will be conducted on the interactive interface that allows for easy query and management of the metadata content and data discovery. Program interfaces will be added to allow for secure, controlled data access. Retrospective data processing and metadata management are slated for incorporation.
Research Accomplishments/Highlights: DSG's highlights of the past year include:
Analyzing requirements for and then configuring the new digital video broadcast
(DVB-S) channel capability for FSL's NOAAPORT receive systems
Installing and configuring a new Weather Surveillance Radar 88 Doppler (WSR-88D) compute server, ingesting data from 133 radars, and generating NETwork Common Data Format (netCDF) files for 13 sites
Planning for the replacement of 16 end-of-life servers with systems that will
provide better reliability and scalability
Developing a website for the "Utilization of Unmanned Aerial Vehicles for Global Climate Change Research" (UAV) conference
Implementing a web server gateway to help defend against the growing threat of
malicious web application attacks and to ensure high-availability of FSL research data and information
Establishing FSL secure web programming guidelines
Collaborating on the following projects:
o Aircraft Communications Addressing and Reporting System
(ACARS) Acquiring and processing of new data including:
• FedEx Aircraft Meteorological Data Relay (AMDAR) data
143
• Saudi AMDAR data • Canadian AMDAR data • National Center for Atmospheric Research (NCAR) Eddy
Dissipation Rate (EDR) data • UPS V4 Humidity data
Coordinating with AirDat, Inc. on data format and acquiring and processing Tropospheric AMDAR (TAMDAR) data via Local Data Manager (LDM) for the Great Lakes Field Experiment
Installing a new Linux ingest system for increased reliability o The Meteorological Assimilation Data Ingest System (MADIS)
Acquiring and processing of new data including: • Radiometer data from Alaska atmospheric remote
sensing (ARM) site • Minnesota Department of Transportation (DOT) mesonet
data • Polar Operational Environmental Satellite (POES) BUFR
data • Indiana DOT mesonet data • LSU-JSU mesonet data • CO_E470 mesonet data • WT-Meso mesonet data • DCNet mesonet data • INDOT mesonet data • FLDOTMET mesonet data • AKDOT mesonet data • KYTC-RWIS data • MOComAgNet data
Implementing directory services for authentication for MADIS's over 300 users using Open Source Lightweight Directory Access Protocol (OpenLDAP)
Implementing a configuration management method for Local Data Acquisition and Dissemination (LDAD) metadata files
Setting up the initial configuration of the LDAD Quality Control (LQC) systems
Configuring the new MADIS Data Recovery servers for required data ingest and developed methods to monitor processing on the MADIS Data Recovery system
Configuring additional new hardware to meet increased I/O demands
o Developmental Testbed Center (DTC) Winter Forecast Exercise (DWFE)
Developing a DWFE data flow diagram to illustrate the overall data transport for the project
Implementing new ftp processing for acquiring needed verification files from the National Centers for Environmental Prediction (NCEP)

144
Establishing, testing and beginning service for the LDM distribution of data to the National Weather Service (NWS) Eastern, Central and Southern Regions for display of DWFE grids on the Advanced Weather Interactive Processing System (AWIPS)
Configuring the method for transferring DWFE surface grid data
Coordinating with FSL's Aviation Division (AD) on testing product arrival notifications
o Rapid Update Cycle (RUC) Configuring the handling of RUC Convective Probability
Forecast (RCPF) data to enable distribution to Aviation Weather Center (AWC) and NCAR
Continuing delivery of the RUC NCEP backup o Real-time Verification System (RTVS)
Developing methods to ingest, process, and archive Stage4 precipitation data
Configuring the ingest and processing of new turbulence and icing products from NCAR
Summary of Objectives and Accomplishment for 2004-2005:
Objective: Acquisition of Meteorological Data
Continue acquisition of a large variety and volume of conventional (operational) and advanced (experimental) meteorological observations in real-time. The ingested data, which are used by CIRA and FSL researchers on a wide variety of projects, encompass almost all available meteorological observations along the Front Range of Colorado and much of the available data in the entire United States including data from Canada, Mexico, and some observations from around the world. The richness of this meteorological database is illustrated by such diverse datasets as advanced automated aircraft, wind and temperature profiler, satellite imagery and soundings, Global Positioning System (GPS) moisture, Doppler radar measurements, and hourly surface observations.
Status: In progress. Objective: Data Processing
Scientifically analyze and process data into meteorological products in real-time, and make them available to CIRA and FSL researchers and systems developers for current and future research initiatives. The resulting meteorological products cover a broad range of complexity, from simple plots of surface observations to meteorological analysis and model prognoses generated by sophisticated mesoscale computer models.
Status: In progress.

145
Objective: Object Data System (ODS) Improvements/Upgrades
It was proposed that the design and development for new and modified datasets continue. Use of ODS applications and methods will expand as legacy translators and product generation methods are replaced by the new techniques including OO software development for point data.
Status: In progress. Objective: Metadata Handling
Metadata handling techniques for use with all datasets are planned for implementation for real-time data processing. An automated system for acquiring and incorporating metadata is part of this plan. Further work will continue on the interactive interface that allows for easy query and management of the metadata content. Program interfaces will be added to allow for secure, controlled data access. Retrospective data processing and metadata management are slated for incorporation.
Status: In progress.
Leveraging / Payoff: CIRA researchers in DSG collaborate with FSL scientists and developers to assemble and maintain a state-of-the-art meteorological data center. Data acquired, decoded and processed by DSG have been vital to the success of MADIS, RTVS, and FSL's X-window workstation (FX-Net). Additionally, data delivery systems developed for DTC, DWFE and RUC have also been vital to their success. Some of the NOAA projects using this data center are listed below.
MADIS MADIS is dedicated to making value-added meteorological observations available from FSL for the purpose of improving weather forecasting, by providing support for data assimilation, NWP, and other hydro-meteorological applications.
RTVS Verification is the key to providing reliable information for improving weather forecasts. As part of FSL's involvement with the FAA Aviation Weather Research Program (AWRP), the Forecast Verification Branch develops verification techniques, mainly focusing on aviation weather forecasts and tools that allow forecasters, researchers, developers, and program leaders to generate and display statistical information in near real-time using the RTVS.
DTC The WRF (Weather Research & Forecasting Model) DTC is a facility where the NWP research and operational communities interact to accelerate testing and evaluation of

146
new models and techniques for research applications and operational implementation, without interfering with current operations.
FX-Net FX-Net is a meteorological PC workstation that provides access to the basic display capability of an AWIPS workstation via the Internet. The AWIPS workstation user interface is emulated very closely. Bandwidth limitations are addressed by using new data compression techniques along with multithreaded client-side processing and communication. RUC RUC is a high-frequency weather forecast and data assimilation system that provides short-range numerical weather guidance for general public forecasting as well as for the special short-term needs of aviation and severe-weather forecasting. Experimental versions as well as the NCEP backup version are run at FSL. In the case of failures in producing the model at NCEP, FSL's run of the model is used.
Research Linkages / Partnerships / Collaborators, Communication and Networking: DSG's Airmet and Sigmet decoders were updated to be used by RTVS for a prototype real-time verification system running at the NWS.
Outreach: Worked with a Kenosha, Wisconsin high school student to help him run and understand the ODS GRIB-to-NetCDF software.
Gave a presentation at the American Meteorological Society's (AMS) annual conference in Seattle on "Central Facility Data Systems Concepts" and created posters on the "Architecture of MADIS Data Processing and Distribution at FSL" and "Recent advances in the FSL Central Facility Data Systems."
Publications: MacDermaid C.H., R.C. Lipschutz, P. Hildreth, R.A. Ryan, A.B. Stanley, M.F. Barth, and P.A. Miller, 2005: Architecture of MADIS data processing and distribution at FSL. Preprints, 21st International Conference on Interactive Information and Processing Systems for Meteorology, Oceanography, and Hydrology, 9-13 January 2005, San Diego, CA. Amer. Meteor. Soc., CD-ROM P2.39. Lipschutz R. C. and, C. H. MacDermaid, 2005: Recent advances in the FSL Central Facility data systems. Preprints, 21st International Conference on Interactive Information and Processing Systems for Meteorology, Oceanography, and Hydrology, 9-13 January 2005, San Diego, CA. Amer. Meteor. Soc. Hamer, P., 2005: FSL Central Facility data system concepts. Preprints, 21st International Conference on Interactive Information and Processing Systems for Meteorology, Oceanography, and Hydrology, 9-13 January 2005, San Diego, CA. Amer. Meteor. Soc., CD-ROM 18.11.

147
IV. Research Collaborations with the Forecast Research Division A. Special Projects Office (SPO) Principal Researcher: Randy Collander NOAA Project Goals/Programs: All of the research conducted by the SPO supports the NOAA goal to “Serve Society's Needs for Weather and Water Information/Local Forecasts and Warnings.” In addition, the GAINS, the Hourly Precipitation Data Quality Control, and the Statistical Analysis of Rawinsonde Data projects also support NOAA’s goal to “Understand Climate Variability and Change to Enhance Society’s Ability to Plan and Respond/Climate Observations and Analysis.” 1. Global Air-ocean IN-situ System (GAINS) Project Key Words: Constant-volume balloon, long-duration observational platform The GAINS project involves testing of a prototype weather balloon that differs from the "traditional" weather balloon in that it can ascend or descend on command. The "canni-balloon" as it is sometimes called, consists of a helium-filled balloon within an air-filled balloon within a non-expanding fabric shell. Using radio control and on-board pumps, the amount of air within the balloon can be controlled, and since the fabric shell holds the volume constant, the density of the air can be increased substantially. This makes it possible for the balloon to have super pressure which can overcome the buoyant effects of the helium, and allow the balloon to descend. GAINS is a major change in system concept from earlier efforts in developing a Shear-Directed Balloon System (SDBS). The SDBS program represented development toward a recoverable, reusable global sounding system to be operated in the troposphere. GAINS, in contrast, is a long-duration stratospheric platform, instrumented for environmental sensing through a combination of dropsondes, XBTs, and chemistry, particulate, in-situ, and remote sensors. Designed as a 120-ft diameter superpressure vehicle carrying a payload of 780 pounds for year-long flights up to 75,000 ft, GAINS is targeted to meet NOAA’s observing and monitoring mission in the next century. GAINS uses rechargeable batteries to power nearly all balloon functions, and has external solar panels for recharging. Communications to and from the balloon are currently done by high frequency radio, which will eventually be replaced by employing Low Earth Orbiting (LEO) satellite communications. The balloon’s position is provided by on-board Global Positioning System (GPS) instruments. Objectives for the Global Air-ocean IN-situ System (GAINS) project were successfully met in FY05. Building upon knowledge gained from two previous flights in FY03, the third launch of an experimental balloon carrying a prototype turbine (pump) proved very successful. The objectives were to measure the flow rate of a prototype turbine-pump at high altitudes and confirm its power requirements and verify the programming of the Basic Stamp controller algorithm. Despite losing balloon-to-ground telemetry

148
communications 90 seconds after launch, redundant data collection mechanisms resulted in successful demonstration of the pump capabilities. 2. USAF Talon-SHU Project Key Words: Lighter-than-air Near Space Vehicle, trajectory calculation The Talon SHU project intends to provide software for calculating, analyzing, and monitoring lighter-than-air Near Space Vehicle (NSV) launch points, flight trajectories, and displaying the resulting information. This is the first step in realizing an overall vision of optimal utilization of Near Space Vehicles in many application-specific areas and is designed to provide a functional foundation for turning this vision into a reality. During the initial design iteration, SHU will use detailed mission descriptions and weather models to predict expected NSV trajectories. The essential components in this capability include: 1) accurate and up-to-date weather modeling information; 2) a user interface and coordination function to define the desired NSV details and mission, and coordinate the overall process; 3) a calculation program to provide accurate and timely trajectory information based on the setup parameters and expected weather conditions; 4) an ability to provide the resulting information in a method usable by the requesting party; and 5) an ability to store mission information for continued analysis. Accomplishments, considered as a derivative of GAINS, were made in support of the Talon SHU Project. This project involves collaboration by the United States Air Force Tactical Exploitation of National Capabilities (TENCAP), the Air Force Weather Agency (AFWA), and Global Solutions for Science and Learning (GSSL) in Tillamook, Oregon. In FY05, trajectory prediction software originally developed for GAINS was modified to meet the requirements of Talon SHU flight trajectory predictions for Air Force specified global locations. Additionally, software for retrieval and vertical interpolation of numerical weather model data was developed and implemented at FSL and collaborator sites. 3. Hourly Precipitation Data Quality Control Project Key Words: Precipitation observation quality control Precipitation observations from several thousand sites in the United States, in hourly and daily resolution, are received by the National Centers for Environmental Prediction (NCEP) in Washington, D.C. on a daily basis. Much of this data is manually inspected and quality controlled at the River Forecast Centers (RFC) and other locations before being disseminated to the National Weather Service (NWS) offices and other users. The Environmental Modeling Center (EMC) at NCEP desires to have an automated, objective system for performing a more consistent quality control on the hourly data, with the expectation that a cleaner data set would be of great value in evaluating current model predictions as well as input to current numerical weather prediction models. This quality-control software was completed in late FY04 and is currently being implemented on EMC systems.
149
In FY05, consultations with EMC and FSL researchers continued on a limited basis to further refine the set of criteria used for evaluating the validity of individual station precipitation observations. These criteria are applied to individual observations and daily totals as well as station performance over a 30 day period. The final output are listings of stations which passed the criteria and those which failed. The examination includes station reliability (observations received on a regular basis), anomalous observations (excessive hourly values or daily sums), “stuck” gauges (report same value for multiple consecutive hours or pattern of hours), and a neighbor check (comparison to values reported by nearby stations). Software development concluded in early FY05. The software has recently been provided to additional interested users at the National Climatic Data Center (NCDC) and Environment Canada. Publications Tollerud, E.I., R.S. Collander, Y. Lin, and A. Loughe, 2005: On the performance, impact, and liabilities of automated precipitation gauge screening algorithms. 21st Conference on Weather Analysis and Forecasting, 1-5 August 2005, Washington, D.C., Amer. Meteor. Soc. Tollerud, E., T. Fowler, B. Brown, and R. Collander, 2005: Assessing the impact of systematic observation errors on climate and operational precipitation analyses. Preprints, 15th Conference on Applied Climatology, 19-23 June 2005, Savannah, GA., Amer. Meteor. Soc. 4. Developmental Testbed Center Winter Forecast Experiment (DWFE) Project Key Words: Wintertime high-resolution forecasts, Weather Research and Forecast model Motivated by the need for improved model guidance to support the winter weather forecast and warning mission of the National Weather Service, the DTC Winter Forecast Experiment was implemented from December 2004 through March 2005. The experiment offered a solution in the form of high-resolution (4-5 km) numerical weather prediction (NWP) models with improved physics over the CONUS domain, with special emphasis on the eastern United States. Objectives were to:
Evaluate the value of high-resolution NWP forecasts over a large domain during the winter;
Evaluate the relative value of high-resolution deterministic forecasts to the lower resolution ensemble forecast techniques;
Evaluate current NWP models and determine where further model research is required;
Evaluate the relative accuracy of large domain high-resolution simulations to high-resolution simulations on limited regional domains;
Leverage NWS investment in existing and proposed experiments such as the Coastal Storm Initiative and the Distributed Local Modeling Experiment

150
Scripts for plotting surface and upper-air fields (temperature, humidity, winds, etc.) generated by the 5-km resolution Weather Research and Forecasting (WRF) numerical model were developed in the NCAR Command Language (NCL). Using a single set of scripts to produce plots from both the WRF Nonhydrostatic Mesoscale Model (WRF-NMM) running at FSL and the Advanced Research WRF (WRF-ARW) model running at NCAR allowed for direct comparison and evaluation of each model’s predictions of winter weather events. The graphics were made accessible to NWS forecasters and other interested parties through the World Wide Web at: http://dtcenter.org/plots/realtime_conus.php and http://bolas.fsl.noaa.gov/mab/dwfe/ . The WRF-NMM processing continued after the conclusion of DWFE, and the graphics for WRF-NMM continue to be available from the latter website. 5. International H2O Project (IHOP) Project Key Words: Low level moisture flux analysis During July 2002, the International H2O Project (IHOP) was conducted over the Southern Great Plains. The primary goal of IHOP was to obtain more accurate and reliable measurements of low-level temperature and moisture structures and associated atmospheric processes that will ultimately help in understanding when, where, and how storms form, leading to better prediction of rainfall amounts. IHOP involved more than 80 scientists from the U.S., Germany, France, the Netherlands, and Canada collaborating closely with various Oklahoma and Kansas-based laboratories and forecasting agencies including the National Severe Storms Laboratory, the Storm Prediction Center, the Norman, Oklahoma National Weather Service Forecast Office, and others. The four main research components of IHOP were Quantitative Precipitation Forecasting (QPF), Convective Initiation (CI), Atmospheric Boundary Layer (ABL) and Instrumentation. CIRA contributed to the project by performing analysis of moisture flux measurements taken during each flight leg (north, south, east, west), as well as for the entire flight circuit, from the three flight circuits conducted June 9, 2002. 6. Great Lakes Fleet Experiment Project Key Words: TAMDAR data impact The Great Lakes Fleet Experiment (GLFE) involves the analysis of observations received from Mesaba Airlines aircraft equipped with Tropospheric Airborne Meteorological Data Report instrumentation (TAMDAR). The goal is to design, build and fly an inexpensive instrument that would measure meteorological variables from commuter aircraft flying between small and medium-size airports. Comparisons with the FSL's Rapid Update Cycle (RUC) model are being conducted with and without TAMDAR observations to determine the impact of TAMDAR data in numerical weather prediction in the Midwest United States. CIRA collaborated with NCAR personnel regarding comparison of turbulence and icing pilot reports (pireps) and co-located TAMDAR observations. A web-based

151
questionnaire was developed for forecasters and other users of TAMDAR data to provide feedback on the usefulness of the data and the products provided via the web. CIRA staff member also organized the TAMDAR Workshop and Meetings held April 11-12, 2005. 7. Statistical Analysis of Rawinsonde Data for Trend Analysis Project Key Words: Climatological temperature trends
Air Resources Laboratory (ARL) is performing extensive studies of temperature trends seen in observational data over North America (and globally). One data set of particular interest is the North American Rawinsonde network data that dates from approximately 1948 to the present. Director of the Forecast Systems Laboratory has found these studies to be of particular interest and is collaborating with Dr. Betsy Weatherhead of ARL on several formal publications and presentations. CIRA staff contributed to the effort by adding rawinsonde observations from 2003 and 2004 to the analysis dataset and re-computing statistics for the entire period of record at daily, weekly and monthly intervals for 11 stations of interest. B. Regional Analysis and Prediction Project Title: Enhancements of the Rapid Update Cycle (RUC) model Principal Researcher: Tracy Smith NOAA Project Goals/Programs: Weather and Water—Serve society’s needs for weather and water information/Local forecasts and warnings; Commerce and Transportation—Support the Nation’s commerce with information for safe, efficient, and environmentally sound transportation Key Words: 4-D data assimilation and forecast system, rapidly updated analyses Background and Goals/Objectives: The primary focus of the Regional Analysis and Prediction Branch is the refinement and enhancement of the Rapid Update Cycle (RUC). The RUC is a national scale 4-D data assimilation and forecast system specifically designed to run at a high temporal frequency (1-hour cycle), taking advantage of a variety of special observations such as ACARS, RASS, profiler, radar, GPS integrated precipitable water vapor, and GOES soundings. It is run operationally at the NOAA/NWS National Centers for Environmental Prediction, and in various experimental configurations at the Forecast Systems Lab. In addition to refinement and enhancements of the RUC, CIRA collaborates on the development of the Weather Research and Forecast (WRF) model used by CIRA and
152
FSL researchers and which will eventually replace the current hydrostatic forecast model now used in RUC. Overall goals are to continue the development work on the Weather Research and Forecast (WRF) model used by CIRA researchers and to improve the required visualization techniques for the RUC and WRF fields. Additionally, CIRA researchers would work on applications of the RUC to forecast problems, including forecasts of wind energy generation potential and anticipation and detection of significant vertical wind shear at wind-turbine levels. Investigations into the use of mesoscale model time-lagged ensembles to improve the accuracy of short-range forecasts, in particular QPF and wind energy, would also continue. Research Accomplishments: During the past year, support of the RUC development continued, both at NCEP and at FSL. A new version of the operational RUC was implemented at NCEP on 28 June 2005, with increased horizontal resolution, down to 13km, several new data sources, and improved surface, precipitation and cloud forecasts. Extensive documentation on the RUC13, including significant differences from the RUC20, was updated in late May at http://ruc.fsl.noaa.gov/ruc13_docs/RUC13.summary.htm and http://ruc.fsl.noaa.gov/ruc13_docs/RUC13ppt.htm. The RUC is also used extensively for data impact studies, most recently evaluating wind profilers, lidar and ACARS moisture observations. Collaborations with the National Renewable Energy Lab continued to support research applications of the RUC model in wind energy planning. Current work is concentrated in application of time-lagged ensemble forecasting methods to produce probability distribution functions for potential wind energy production, detection of nocturnal low-level jet using the RUC, and improved near-surface wind forecasts through variation in surface roughness parameterization. Publications: Gutman, S.I., K.L. Holub, S.R. Sahm, J.Q. Stewart, T.L. Smith, S.G. Benjamin, and B.E. Schwartz, 2004: Rapid retrieval and assimilation of ground based GPS-Met observations at the NOAA Forecast Systems Laboratory: Impact on weather forecasts. J. Meteor. Society of Japan, 82, 1-10.
Koch, S.E., B.D. Jamison, C. Lu, T.L. Smith, E.I. Tollerud, C. Girz, N. Wang, T.P. Lane, M.A. Shapiro, D.D. Parrish, and O.R. Cooper, 2005: Turbulence and gravity waves within an upper-level front, J. Atm. Sci. (in press). Smith, T.L., S.S. Weygandt, S.G. Benjamin, S.I. Gutman, and S. Sahm, 2004: GPS-IPW observations and their assimilation into the 20-km RUC during severe weather season. Preprints, 22nd Conference on Severe Local Storms, 4-8 October 2004, Hyannis, MA, Amer. Meteor. Soc., CD-ROM 17.5. Benjamin, S.G., T.G. Smirnova, K. Brundage, S.S. Weygandt, T.L. Smith, B. Schwartz, D. Devenyi, J.M. Brown, G.A. Grell, 2004: A 13-km RUC and beyond: Recent
153
developments and future plans. Preprints, 11th Conference on Aviation, Range, and Aerospace Meteorology, 4-8 October 2004, Hyannis, MA, Amer. Meteor. Soc., CD-ROM. Benjamin, S.G., S.S. Weygandt, J.M. Brown T.L. Smith, T. Smirnova, W.R. Moninger, B. Schwartz, E.J. Szoke, and K. Brundage, 2004: Assimilation of METAR cloud and visibility observations in the RUC. Preprints, 11th Conference on Aviation, Range, and Aerospace Meteorology, 4-8 October 2004, Hyannis, MA, Amer. Meteor. Soc., CD-ROM. Benjamin, S.G., S.S. Weygandt, D. Devenyi, J.M. Brown G. Manikin, T.L. Smith, and T.G. Smirnova, 2004: Improved moisture and PBL initialization in the RUC using METAR data. Preprints, 22nd Conference on Severe Local Storms, 4-8 October 2004, Hyannis, MA, Amer. Meteor. Soc., CD-ROM. Koch, S.E., B. Jamison, E. Tollerud, C. Girz, T. Smith, T.P. Lane, N. Wang, M.A. Shapiro, D. Parrish, and O. Cooper, 2004: Analysis of turbulence generation by gravity waves within an upper-tropospheric front. Preprints, 11th Conference on Aviation, Range, and Aerospace Meteorology, 4-8 October 2004, Hyannis, MA, Amer. Meteor. Soc., CD-ROM.
Moninger, W.R., T.S. Daniels, R. Mamrosh, M. Barth, S. Benjamin, R. Collandar, L. Ewy, B. Jamison, R. Lipschutz, P. Miller, B. Schwartz, T. Smith, and E. Szoke, 2004: TAMDAR, the Rapid Update Cycle, and the Great Lakes Flight Experiment. Preprints, 11th Conference on Aviation, Range, and Aerospace Meteorology, 4-8 October 2004, Hyannis, MA, Amer. Meteor. Soc., CD-ROM.
Project Title: Interaction of Gravity Waves and Turbulence in the Upper Troposphere and Lower Stratosphere Principal Researcher: Chungu Lu NOAA Project Goal/Program: Commerce and Transportation—Support the Nation’s commerce with information for safe, efficient, and environmentally sound transportation/Aviation weather Key Words: Clear air turbulence, gravity wave breaking This continued research and development work is supported by the FAA. The goal of the project is to understand the physical mechanisms for the generation of Clear-Air Turbulence (CAT) at the aircraft-flight levels and to assess the predictability of CAT using conventional atmospheric forecast models. Breaking of gravity waves and associated energy cascade have been proposed as being one of the mechanisms for CAT generation in the upper troposphere and lower stratosphere.

154
During the past year, we have developed various diagnostic tools in studying the interaction between gravity waves and turbulence. Figure 1 is the wavelet time-frequency analysis of vertical acceleration data from aircraft observations. We also developed a theoretical framework of gravity wave polarization and associated diagnostic methods. In Figure 2, two of the Stokes parameters (parameters that measure the different aspects of wave polarization), coherency and phase difference between the two components of the horizontal winds are plotted. Using the wavelet-based cross-spectral method, we were able to localize the above spectral results in physical space to see how gravity wave polarization is related to the generation of turbulence. Figure 3a plots the turbulence intensity as function of time. For the same time domain, we plot the coherency and phase-difference angle for the averaged gravity-wave spectrum (Figs 3b and 3c). The shaded regions correspond to the time periods when significant turbulence occurrence was identified. In addition, we conducted various spectral and structure function analysis of model and observed data. Figure 4 plots the power spectral density of horizontal wind indicating distinctive gravity waves and turbulence spectra in the upper troposphere and lower stratosphere. The corresponding second-order structure function is plotted in Figure 5. The third-order structure function (Figure 6) provides more physical information about the interactions between gravity waves and turbulence.
Publications: Koch, S.E., B.D. Jamison, C. Lu, T.L. Smith, E.I. Tollerud, C. Girz, N. Wang, T.P. Lane, M.A. Shapiro, D.D. Parrish, and O.R. Cooper, 2005: Turbulence and gravity waves within an upper-level front, J. Atmos. Sci, (In press). Lu, C., S.E. Koch, and N. Wang, 2005a: Determination of temporal and spatial characteristics of gravity waves using cross-spectral analysis and wavelet transformation. J. Geophys. Res., 110, D01109, doi:10.1029/2004JD004906. Lu, C., S.E. Koch, and N. Wang, 2005b: Stokes parameter analysis of a packet of turbulence-generating gravity waves. J. Geophys. Res. (Accepted) Lu, C., and Co-authors, 2005c: Spectral and structure function analysis of upper-troposphere horizontal velocity fields. Part I: Interaction of turbulence and gravity waves, Kelvin-Helmholtz instability, and wave breaking. J. Geophys. Res. (Being submitted)
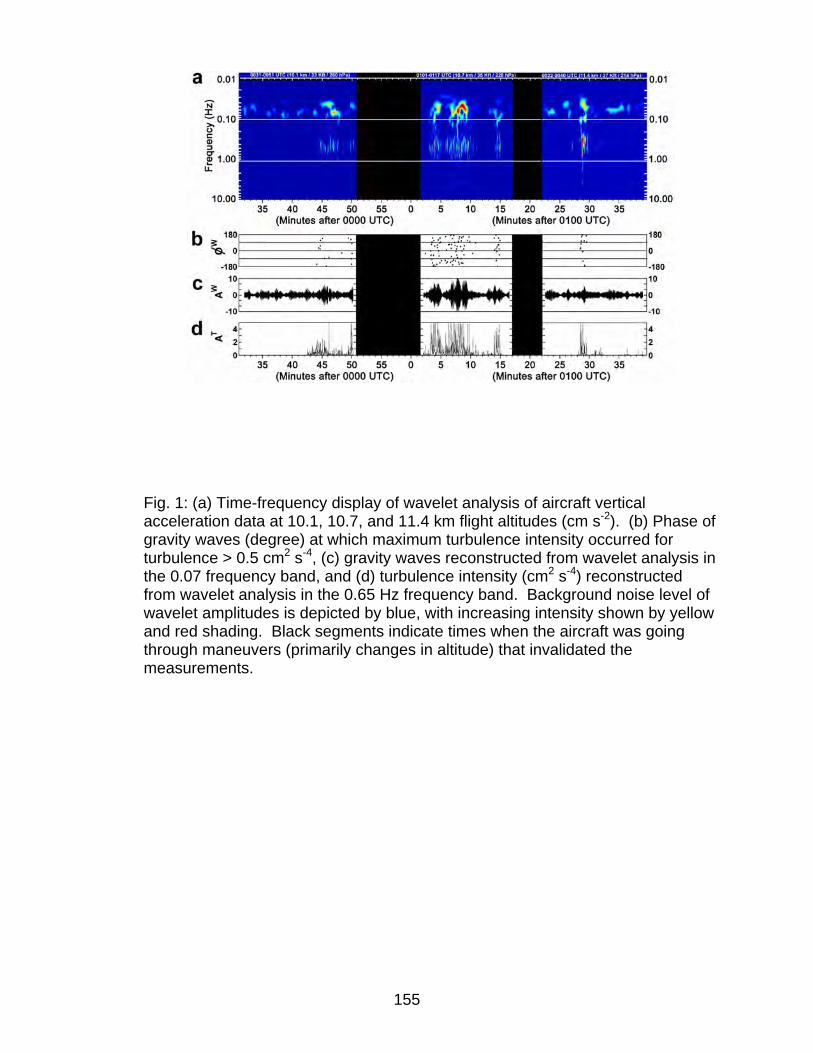
155
Fig. 1: (a) Time-frequency display of wavelet analysis of aircraft vertical acceleration data at 10.1, 10.7, and 11.4 km flight altitudes (cm s-2). (b) Phase of gravity waves (degree) at which maximum turbulence intensity occurred for turbulence > 0.5 cm2 s-4, (c) gravity waves reconstructed from wavelet analysis in the 0.07 frequency band, and (d) turbulence intensity (cm2 s-4) reconstructed from wavelet analysis in the 0.65 Hz frequency band. Background noise level of wavelet amplitudes is depicted by blue, with increasing intensity shown by yellow and red shading. Black segments indicate times when the aircraft was going through maneuvers (primarily changes in altitude) that invalidated the measurements.

156
Fig. 2: The coherency and phase-difference angle between two horizontal components of the wind as functions of frequency, computed from the set of Stokes parameters. The error bars indicate confidence intervals of the analyses (±twice the standard deviation of the time mean divided by the number of the sample size).

157
Fig. 3: The localization of the turbulence intensity and the Stokes parameters in the time domain for the averaged gravity-wave spectrum (f = 0.01-0.2 Hz) using wavelet transformation: a) turbulence intensity; b) gravity-wave velocity coherency; and c) gravity-wave velocity phase-difference angle. The shaded regions indicate the time periods when turbulence is generated.

158
Fig. 4: Power spectral density of longitudinal component of the horizontal wind as function of horizontal wavenumber, plotted in log-log coordinates.
Fig. 5: The second-order structure function computed from the average of (δuL )2 and (δuT )2 as function of spatial scale of r in meters.

159
Fig. 6: The third-order structure function computed from < [δuL (r)]3 > plus 2 < δuL (r)[δuT(r)]2 > as function of spatial scale of r in meters. The red color indicates that the computed values are negative, and the blue color indicates that the computed values are positive. The r, r2 , and r3 slopes are also drawn for reference.
Project Title: Optimal Weighting of Time-Lagged Ensemble Members Using Multi-Variable Linear Regression Principal Researcher: Chungu Lu NOAA Project Goal/Program: Weather and Water—Serve society’s needs for weather and water information/Local forecasts and warnings Key Words: Time-lagged ensemble forecast, optimal weighting This continued research and development effort on time-lagged ensemble forecast and modeling uses NOAA Rapid Update Cycle (RUC) forecasts as a set of ensemble members. Since RUC is initialized every hour, we can generate an ensemble forecast system by combining forecasts valid at the same time but initialized at different times (The time-lagged ensemble idea is shown in Figure 1). Table 1 lists three groups of

160
ensembles that are evaluated at 1-, 2-, and 3-h forecast times, but with different combinations of forecast projections, which form 8 different categories.
There are different ways to weigh these forecasts. The simplest way is to combine these forecasts with equal weights, and then take the mathematical mean as the ensemble forecast value. However, since the time-lagged ensembles are typically related to each other, the equally likely occurrence of forecast error may not be a suitable assumption for the ensembles. For example, longer projected forecasts typically possess larger forecast errors than those of shorter projected forecasts. On the other hand, forecasts initialized too recently, e.g., initialized within 3 hours, may have significant initial spin-up problems. Therefore, optimally weighting these forecasts, other than just taking an ensemble mean, may provide an improved short-range forecast.
During the past year, we have developed a multi-variable linear regression scheme. This scheme uses past observational data to train each time-lagged ensemble member and provides an optimal weight for these forecasts. Ensemble forecasts using these optimal weights showed significant improved forecast skills in the short-range. Figure 2a-d plot forecast errors as functions of forecast time for forecasts from deterministic (solid curve), equally-weighted ensembles (dash curve), and optimally-weighted ensembles (dash-dot curve) for 500-hPa height (Fig. 2a), 850-hPa temperature (Fig. 2b), 250-hPa wind (Fig. 2c), and 850-hPa relative humidity (Fig. 2d) averaged over the CONUS domain.
Publications: Lu, C., 2004: RUC short-range ensemble forecast system. 20th Conference on Weather Analysis and Forecasting, 12-16 January 2004, Seattle, WA., Amer. Meteor. Soc. Lu, C., B. Schwartz, and S. Benjamin, 2005: Short-range forecast using time-lagged ensembles. Mon. Wea. Rev. (In review).

161
Table 1: Time-lagged ensemble systems defined by taking different combinations of RUC forecasts. Eight ensemble systems were categorized into three groups. The first digit in the ensemble symbol represents the verification group, e.g., e21 means ensemble for 2-h forecast verification group, which uses the latest RUC forecasts up to 2-h initialization. The second digit represents the ensemble index within that group.

162
Fig. 1: Schematic diagram showing how a time-lagged ensemble forecast system is constructed.
Fig. 2a: Comparison of forecast errors for 500-hPa height as functions of forecast time, among RUC deterministic forecasts, equally-weighted ensembles, and unequally-weighted ensembles. The ensembles were chosen from the best performing ones from each category.

163
Fig. 2b: As in Fig. 2a except for 850-hPa temperature.

164
Fig. 2c: As in Fig. 2a except for 250-hPa wind.

165
Fig. 2d: As in Fig. 2a except for 850-hPa relative humidity.
Project Title: Air Quality Forecasting Principal Researcher: Mariusz Pagowski NOAA Project Goal/Programs: Weather and Water—Serve society’s needs for weather and water information/Environmental modeling and air quality Key Words: Ensemble-based ozone forecast, boundary layer schemes, land surface models 1. Improving ensemble-based ozone forecasts.
The study is an initial step towards application of data assimilation to air quality forecasting. Forecasts from seven air quality models and ozone data collected over the eastern US and southern Canada during July and August 2004 were used in creating a simple method to improve ensemble-based forecasts of maximum daily 1-hr and 8-hr

166
averaged ozone concentrations. The method minimizes least-square error of ensemble forecasts by assigning weights for its members. The real-time ozone forecasts from this ensemble of models were statistically evaluated against the ozone observations collected for the AIRNow database comprising more than 350 stations. Variability of weights assigned to ensemble members and ensemble performance statistics versus the length of the training period are shown in Figures 1 and 2.
Fig. 1. Variability of weights during the training period.
Fig. 2. Average bias (a), RMSE (b), index of agreement (c) and correlation (d) of ensemble with respect to measurements during the training period.
It can be noted in Figure 1 that the weights for different ensemble members display variability which decreases after about 10 days. Also, further investigation showed that

167
the magnitude of a weight does not necessarily correspond to the quality of the ensemble member. From Figure 2, it can be noted that maximum benefit in performance of the ensemble is achieved when weights are calculated daily, suggesting in a certain way the value of persistence as a forecasting tool. Application of the weighting method significantly improves overall statistics of the weighted ensemble (bias, RMSE, index of agreement) compared to the averaged ensemble or any individual ensemble member as shown in Table 1. If a sufficient number of observations are available, it is recommended that weights be calculated daily; if not, a longer training phase will still provide a positive benefit.
Method Bias RMSE I of A Correlation
Ave Ens 12.14 16.34 0.730 0.710 New Ens 0.16 10.08 0.843 0.708 Model A 5.16 16.80 0.698 0.464 Model B 3.50 11.90 0.796 0.648 Model C 5.61 13.18 0.769 0.630 Model D 17.81 25.13 0.617 0.620 Model E 10.81 16.22 0.685 0.572 Model F 27.81 33.10 0.502 0.569 Model G 14.51 22.56 0.647 0.630 Table 1: Bias, RMSE, index of agreement and correlation for the averaged ensemble, the new weighted ensemble, and the individual models.
Publications: Pagowski, M. et al., 2005: A simple method to improve ensemble-based ozone forecasts, Geophys. Res. Lett., 32, doi:10.1029/2004GL022305. 2. Behavior of WRF BL schemes and land-surface models in 1D simulations during BAMEX. Accuracy of boundary layer forecasts is essential for air quality forecasting. In this study, performance of different boundary layer schemes coupled with land-surface models is investigated. The Weather Research and Forecasting (WRF) model currently offers three options for parameterization of turbulence in the boundary-layer (BL hereafter): 1) Eta implementation of the 1.5-order closure by Janjic (1994) (MYJ)

168
2) The Medium-Range Forecast (MRF) scheme based on Troen and Mahrt
(1986), and Hong and Pan (1996) 3) The Yonsei University (YSU) scheme (Hong and Dudhia 2003), which is a modification of the MRF scheme to include explicit entrainment fluxes of heat, moisture and momentum, counter-gradient transport of momentum, and different specification of the BL height. The above schemes can be coupled with any of the land-surface models (LSMs, hereafter): NOAH (Ek et al. 2003), RUCLSM (Smirnova et al. 2000), and the slab model (SLAB hereafter). Surface fluxes to RUCLSM, SLAB and NOAH are supplied by MYJ’s own scheme or a scheme based on Blackadar's approximation to similarity (SFCCLAY), depending on the BL scheme used. It should also be noted that soil parameters assigned for soil categories vary in different LSMs. Simulations with a 1D version of WRF are performed to highlight differences between boundary layers predicted using combinations of the BL schemes and LSMs and possibly to provide a broad view on biases in the BL observed in 3D WRF runs. The analysis is valid for the summertime, and over land and flat terrain. To account for a variety of atmospheric and soil conditions, simulations are performed using a set of initial conditions and external forcings which are derived from WRF forecasts issued daily for the BAMEX field campaign. The WRF forecasts at 1200 UTC (12-hour forecasts, 0600 LST at BAMEX) and 0000 UTC (24-hour forecasts, 1800 LST at BAMEX) are used to derive initial conditions for the 12-hour 1D runs to simulate diurnal and nocturnal BLs, respectively. For the current experiment, a set consisting of a hundred profiles of wind, temperature, mixing ratio, soil moisture and soil temperature is obtained by randomly weighting two profiles. Time-varying external forcings consisting of geostrophic wind and shortwave and longwave radiation are obtained in a similar manner. Currently, no account is taken for precipitation or advection. At the BAMEX location, surface roughness is equal to 15 cm, vegetation fraction is about 60% and soil category is sandy clay. These are, we believe, typical conditions over the Central US. Here, because of space limitations, only simulations for the diurnal BL will be considered. For the same reason, our analysis will be largely limited to potential temperature and moisture rather than wind. A more complete presentation is available from 2005 WRF Users' Workshop website. Mean vertical profiles of potential temperature at 0600, 0900, 1200, 1500, and 1800 LST, which were obtained by averaging over the ensemble simulated with one hundred initial conditions, are shown in Fig. 3. Potential temperature profiles indicate that results from YSU and MRF are in general quite similar. With NOAH and RUCLSM, differences between profiles of potential temperature for both schemes are practically indistinguishable. For both BL schemes, rate of warming of the BL is faster with NOAH than with RUCLSM but in the late afternoon, potential temperature profiles are very similar. MYJ systematically predicts a shallower and cooler BL than YSU and MRF. For MYJ evolution of BL, stratification is different from YSU or MRF in that the rate of warming is fastest when it is coupled with NOAH, followed by RUCLSM. Also, MYJ coupled with RUCLSM predicts BL which is cooler and shallower than when it is coupled with NOAH.
169
We believe some of the differences in BLs simulated by the different BL schemes can be explained, in addition to very different parameterizations of turbulence in the mixed layer, by the analysis of mixing ratio profiles and latent heat fluxes shown in Figs. 4 and 5, respectively. The most striking feature in Figure 4 is the difference in behavior between MYJ and YSU or MRF. While the lower BL moistens during the day for MYJ, the lower BL becomes drier for YSU and MRF. This behavior is most apparent when MYJ is coupled with RUCLSM. Analysis of Fig. 5 reveals that, indeed, latent heat fluxes simulated with MYJ are larger than with YSU (and also MRF, not shown). Since differences in mean friction velocities and stratification (not shown) are small between the schemes and skin temperatures (not shown) for MYJ are lower, larger latent heat fluxes can only be a result of higher skin moisture for this BL scheme. Also, in this figure, the largest latent heat fluxes occur when MYJ is coupled with RUCLSM. Characteristically, the largest spread in simulations with different initial conditions and forcings occurs for RUCLSM, followed by NOAH. The analysis of BL simulations with the 1D WRF model leads us to the following conclusions. It appears that differences in the prediction of the diurnal evolution of the BL and soil between YSU and MRF are rather small. BLs simulated with MYJ are shallower by several hundred meters, depending on the LSM, when compared to the other BL schemes. Interestingly, for this scheme, BL moistens during the day while the opposite is true for YSU or MRF. To confirm the above findings, it would be beneficial to perform simulations over a broader range of land use categories and soil and vegetation types. To assess benefits of the available BL schemes and LSMs, comprehensive verification with observations is needed.
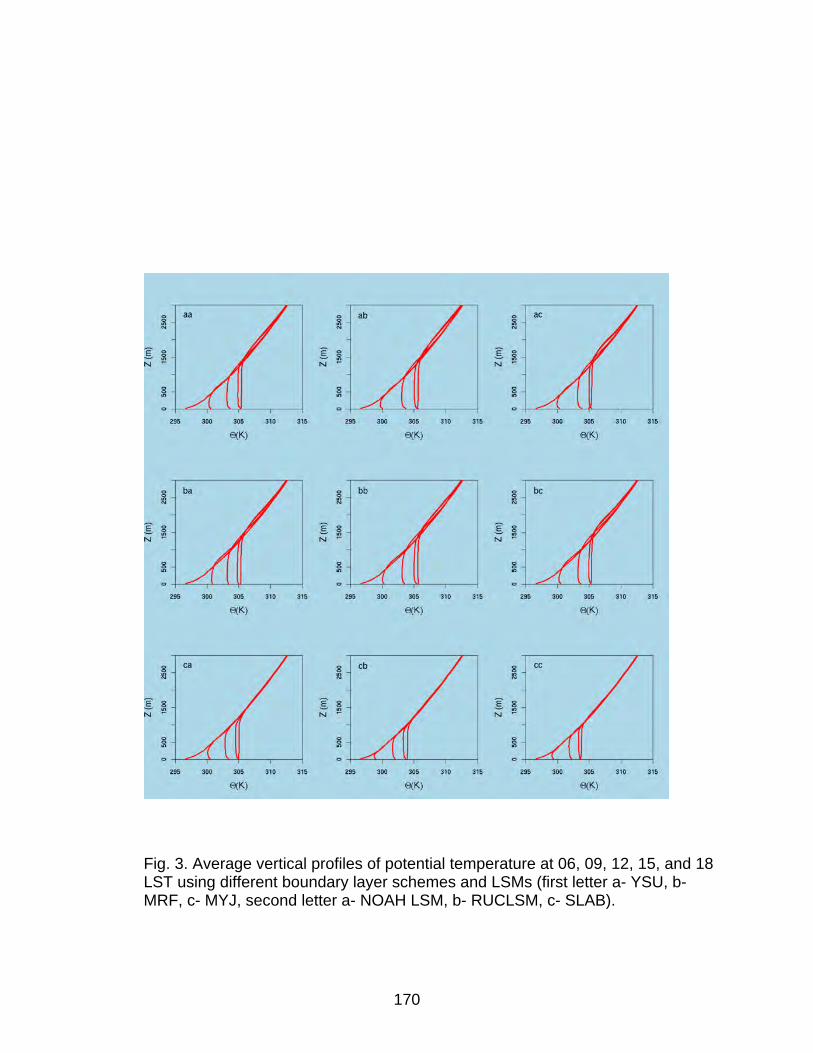
170
Fig. 3. Average vertical profiles of potential temperature at 06, 09, 12, 15, and 18 LST using different boundary layer schemes and LSMs (first letter a- YSU, b- MRF, c- MYJ, second letter a- NOAH LSM, b- RUCLSM, c- SLAB).
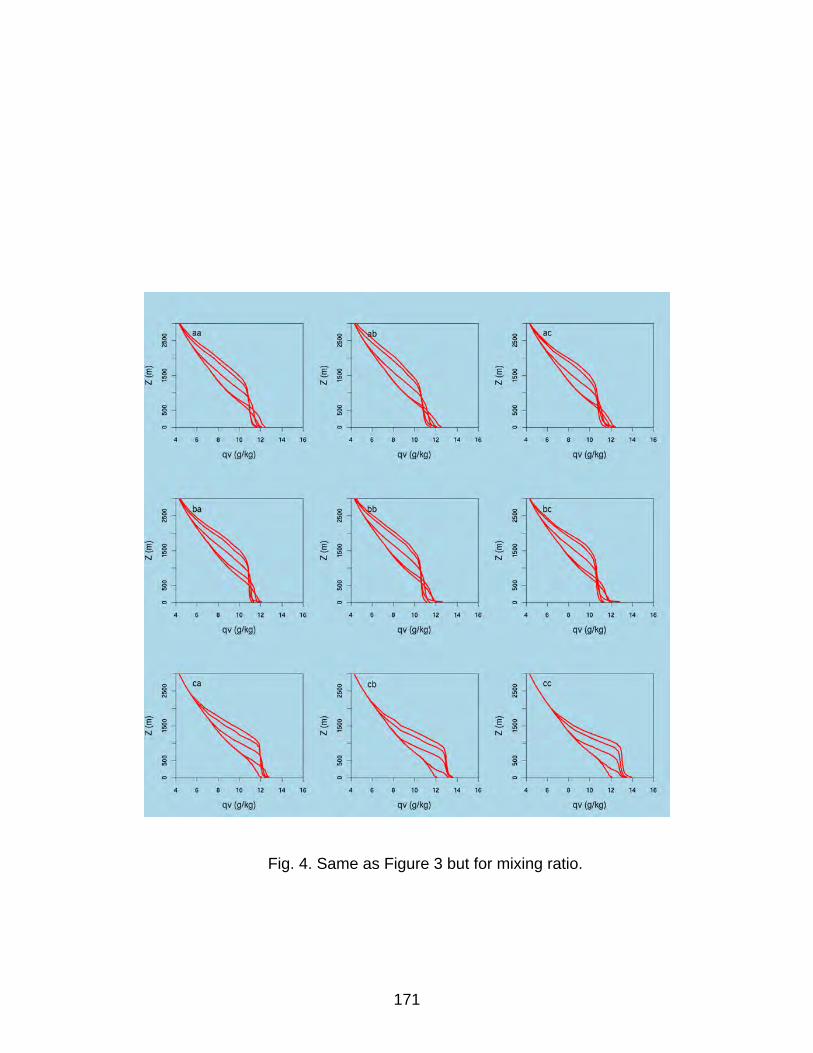
171
Fig. 4. Same as Figure 3 but for mixing ratio.

172
Fig. 5. Ensemble spread (black) and average (red) latent heat fluxes for BL schemes coupled with LSMs (first letter a- YSU, c- MYJ, second letter a- NOAH LSM, b- RUCLSM).
Presented at the 2005 WRF Users' Workshop, Boulder, CO.
References: Ek, M.B., K.E. Mitchell, Y. Lin, E. Rogers, P. Grunmann, V. Koren, G. Gayno, and J.D. Tarpley, 2003: Implementation of Noah land surface model advances in the National Centers for Environmental Prediction operational mesoscale Eta model, J. Geophys. Res, 108(D22), 8851. Hong, S.-Y., and J. Dudhia, 2003: Testing of a new non-local boundary layer vertical diffusion scheme in numerical weather prediction applications, 16th Conference on Numerical Weather Prediction, Seattle, WA.

173
Hong, S.-Y, and H.-L. Pan, 1996: Non-local boundary layer vertical diffusion in Medium-Range Forecast model, Mon. Wea. Rev., 124, 1215-1238. Janjic, Z.I., 1994: The step-mountain eta coordinate model: further developments of the convection, viscous layer, and turbulence closure schemes, Mon. Wea. Rev., 122, 927-945. Smirnova, T.G., J.M. Brown, S.G. Benjamin, and K. Dongsoo, 2000: Parameterization of cold-season processes in the MAPS land-surface scheme, J. Geophys. Res., 105(D3), 4077-4086. Troen, I., and L. Mahrt, 1986: Simple model of the atmospheric boundary layer; sensitivity to surface evaporation, Boundary Layer Meteorol., 37, 129-148.
Project Title: Regional Climate Modeling
Principal Researcher: Mariusz Pagowski
NOAA Project Goal/Program: Climate—Understand climate variability and change to enhance society’s ability to plan and respond/Climate predictions and projections
Key Words: Regional climate simulations, convective parameterization 1. Toward a better understanding and more realistic simulation of warm season precipitation. Regional climate simulations were performed in June 2004 with the WRF model to study the effects of soil moisture on precipitation and to compare results obtained with different convective parameterizations and with explicitly resolved convection. Convection is parameterized in simulations on a 20-km resolution grid and cloud-resolving simulations are performed on a 1.7-km resolution grid. Domain setup and topography are shown in Figure 6. The default parameterization of convection is an ensemble of closures based on varying assumptions (Grell and Devenyi 2002). Turbulence is parameterized with a 2.5 order closure and a land surface model by Smirnova et al. (2002) is used. Initial conditions for the atmospheric and the land surface models are obtained from the RUC analysis.

174
Fig. 6. Simulation domains: D01 – 20-km resolution grid, D03 – 1.7-km resolution grid and its topography.
A preliminary comparison of modeled precipitation with a .25 degree resolution CPC analysis is presented. A more comprehensive comparison with stage 4 data is planned.
Fig. 7. Observed monthly accumulated precipitation in June 2004 from the Climate Prediction Center, simulated in high- and low-resolution domains.
Initial soil moisture obtained from the RUC analysis does not differ significantly from the minimum values allowed for a given soil type. Sensitivity of precipitation to the initial soil moisture is studied by assigning maximum soil moisture for a given soil type.

175
Fig. 8. Sensitivity to the initial soil moisture at different model resolutions. Columns from the left: N-S averaged precipitation, latent, and sensible heat flux. From the top: 1.7-km model resolution: RUC derived soil moisture, maximum soil moisture, 20-km resolution: RUC derived soil moisture, maximum soil moisture.

176
A small high-resolution domain allows for the analysis of spatially averaged precipitation. Differences in hourly characteristics of precipitation in different simulations are illustrated.
Fig. 9. Monthly accumulated precipitation averaged spatially simulated in 1.7-km and 20-km domains with explicitly resolved convection and parameterized convection. A - explicit, B - ensemble of closures, C - Grell, D - Frank-Cohen, E - Krishnamurti, F - Kain-Fritsch, G - Arakawa-Schubert.
References Grell, A.G., and D. Devenyi, 2004: A generalized approach to parameterizing convection combining ensemble and data assimilation techniques, Geophys. Res. Lett., Vol. 29, No. 12. Smirnova, T. G., J. M. Brown, and S. G. Benjamin, 2000: Parameterization of frozen soil physics in MAPS, J. Geophys. Res. 105 (D3), 4077-4086. Presented at annual AGU meeting, New Orleans, June, 2005. Further research on ensemble-based convective parameterization was abandoned since the approach taken based on the linear regression proved too simplistic and did not provide expected results. Further research on bore modeling is currently suspended subject to additional funding.

177
Project Title: Turbulence Project Principal Coordinator: Brian Jamison NOAA Project Goal/Program: Commerce and Transportation—Support the Nation’s commerce with information for safe, efficient, and environmentally sound transportation/Aviation weather Key Words: Clear air turbulence, diagnostic turbulence prediction algorithms FSL, under support from the FAA Aviation Weather Research Program, conducts research to improve forecasts of clear air turbulence (CAT) through field programs designed to measure in-situ turbulence and by developing diagnostic algorithms for turbulence prediction. Tasks related to this project include: analysis of in-situ and model data, research and development of diagnostic algorithms, and climatological analysis of variables related to turbulence. SCATCAT (Severe Clear-Air Turbulence Colliding with Air Traffic) was a field project for in-situ measurement of turbulence. It employed NOAA’s GulfStream IV aircraft to fly to turbulent regions in and around the jet stream. The GIV flew on February 18, 2001 along a southwest to northeast path north of Hawaii. At about 44,000 feet, they dropped high resolution dropsondes, then flew in a stacking pattern back along the same path at lower levels to attempt to capture a turbulence event. In-situ moderate turbulence was encountered at about 35,000 feet, and this event is the focus of the post-processing analysis. A 13km Rapid Update Cycle (RUC) run with forecasts out to 18 hours was created for comparison with the previous 20km run. Using the output data from this new run, horizontal and vertical wind magnitude plots, and vertical potential vorticity plots were generated. The results were somewhat smoother than the previous 20km RUC plots, and did not reveal anything substantially different. A number of plots of turbulence-related variables were prepared for a paper presented at the Aviation, Range, and Aerospace Meteorology (ARAM) conference, and subsequently an article submitted to the Journal of Atmospheric Science (JAS). For these plots, software was modified to compute Richardson number using selected potential temperature levels, to better correlate the observations from the dropsondes to the RUC output. The GEMPAK (GEneral Meteorology PAcKage) software was also used to compute and plot frontogenesis to address multiple scale dynamic interactions between frontogenesis and gravity wave generation. A turbulence case that occurred on January 29th during THORPEX (THe Observing-system Research and Predictability EXperiment) was also investigated. Similar to SCATCAT, 17 dropsondes were deployed during the case. Unfortunately, data for the
178
case were not within a jet streak and occured through a sharply curved upper level weak trough, making it difficult to separate streamwise wind components. Since the effect of the curvature needs to be accounted for in a dynamic analysis, this case became too difficult to warrant further investigation. Another case of in-situ turbulence was observed during BAMEX (the Bow Echo and Mesoscale Convective Vortex Experiment). For this case, software was written to plot turbulence pilot reports in conjunction with model data for analysis. Some dropsondes were deployed during the experiment, and plots of diagnostic turbulence flux (DTF3) and wind magnitude were generated from the dropsonde data. A presentation of initial results was given at the ARAM conference, but further analysis is underway. With regard to diagnostic development, an algorithm to compute Unbalanced Flow (UBF) has been developed, and software was written to include this parameter in the Integrated Turbulence Forecasting Algorithm (ITFA) running routinely at NCAR. Revision of this software occurred this past year to correct some problems with the computation of Jacobian and map scale factors. Also, a band-pass filter using Fast Fourier Transforms was prepared, though preliminary tests revealed that the results using this filter were only slightly different than those using the Schuman filter used in the current version. For the turbulence climatology task, turbulence-related variables including Brunt-Vaisala frequency, shear, and Richardson Number, were examined in two years of 20km RUC analyses. The focus of the study was mid and low level turbulence (i.e. from 1000mb to 300mb). Tallies of occurrences of Richardson Numbers that fall below 0.25 (the critical wave-breaking value) were gathered for each analysis, and plots were generated for each month to examine seasonal variability. In addition, plots were also generated by hour over the entire period to examine diurnal changes. These were compared with turbulence reports from pilot reports (PIREPs). A webpage was developed to analyze loops of these images (http://www-frd.fsl.noaa.gov/mab/jamison/turb/clim/) and notable observations were delivered in a report to the FAA. The achievements for the turbulence project during this fiscal year compare favorably with the goals outlined in the statement of work.
Project Title: TAMDAR (Tropospheric Airborne Meteorological Data Reporting) Principal Researcher: Brian Jamison NOAA Project Goal/Program: Commerce and Transportation—Support the Nation’s commerce with information for safe, efficient, and environmentally sound transportation/Aviation weather Key Words: Airborne weather sensors

179
The TAMDAR project is an evaluation of a new observing system using sensors placed on approximately 60 regional aircraft. The sensors report temperature, pressure, humidity, winds, eddy dissipation rate, and icing. Tasks primarily involve examining the data for quality, and investigating the impact of the data on weather model forecasts. TAMDAR observations were made available on the ACARS webpage, and preliminary analysis involved examining these data and documenting quality issues. Feedback on these issues was given to AirDat (the manufacturer of the sensors) who is addressing and correcting the problems. Simultaneous runs of the RUC development model ("dev") and the identical model including TAMDAR data ("dev2") were implemented and field differences of temperature, humidity, and winds are plotted and provided on a webpage for review (http://www-frd.fsl.noaa.gov/mab/jamison/tamdar/devdiff/). Six isobaric levels (1000mb, 925mb, 850mb, 700mb, 500mb, and 300mb) are compared for the analyses and 3-hour forecasts out to 24 hours. Other efforts to examine the impact of the data on the model include comparing the dev and dev2 cloud analyses and forecasts with satellite data, and performing retroactive runs of the models to allow more control of the input data.
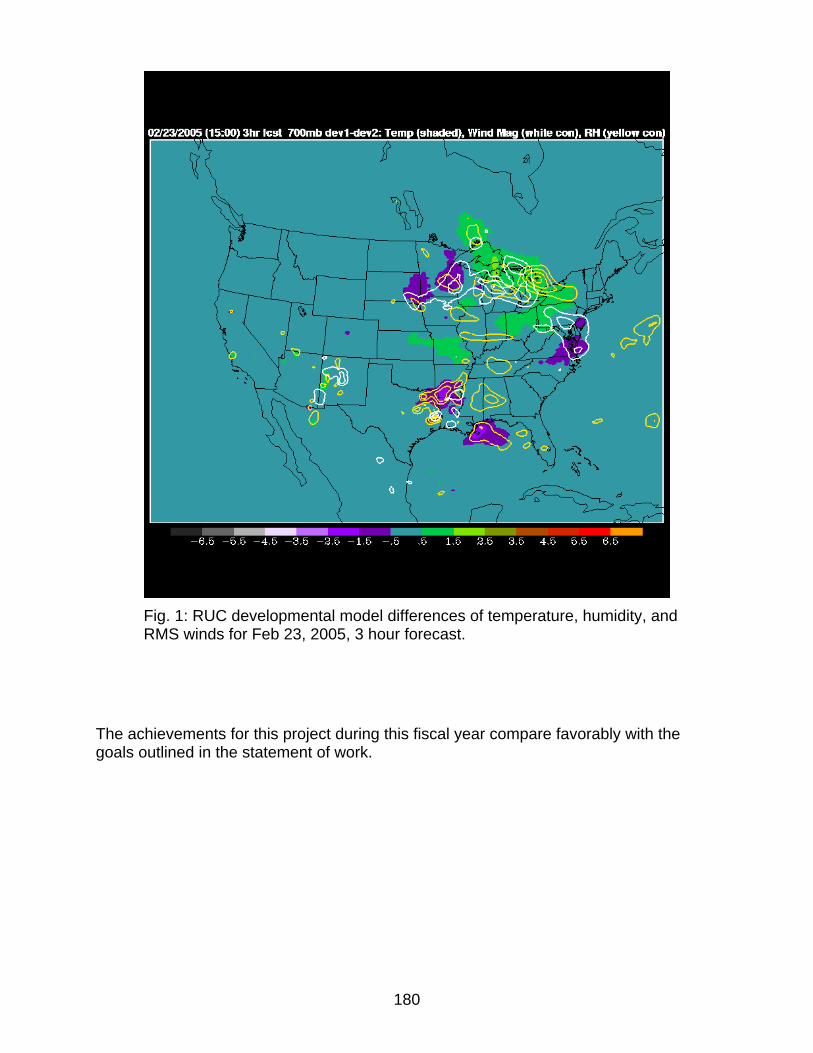
180
Fig. 1: RUC developmental model differences of temperature, humidity, and RMS winds for Feb 23, 2005, 3 hour forecast.
The achievements for this project during this fiscal year compare favorably with the goals outlined in the statement of work.
181
Project Title: GAINS (Global Air-ocean IN-situ System) Project Principal Coordinator: Brian Jamison NOAA Project Goal/Program: Climate—Understand climate variability and change to enhance society’s ability to plan and respond/Climate observations and analysis Key Words: Constant-volume ballon, global long-duration observation platform The GAINS project involves testing of a prototype balloon platform that differs from the "traditional" weather balloon in that it can ascend or descend on command. The "cannibal-loon" as it is sometimes called, consists of a helium-filled balloon within an air-filled balloon within a non-expanding fabric shell. Using radio control and on-board pumps, the amount of air within the balloon can be controlled, and since the fabric shell holds the volume constant, the density of the air can be increased substantially. This makes it possible for the balloon to have super pressure which can overcome the bouyant effects of the helium, and allow the balloon to descend. The GAINS team performed a successful flight test of the turbine pump. The pump operated at all three test altitudes (50,000 ft., 60,000 ft., 70,000 ft.) and generated the required amount of superpressure in the anchor balloon (15%) at each altitude. In addition, a leftover portion of the on-board software allowed the pump to run longer than required at 60,000 ft. and was able to reach 24% superpressure, far exceeding the pre-set goal. This was a great achievement for GAINS, and hopefully will promote continuation of the project. The achievements for this project during this fiscal year compare favorably with the goals outlined in the statement of work. Publications: Koch, S. E., B. Jamison, C. Lu, T. L. Smith, E. Tollerud, T. P .Lane, N. Wang, M. A. Shapiro, D. D. Parrish, and O. Cooper, 2004: Analysis of turbulence generation by gravity waves within an upper-level front. 11th Conference on Aviation, Range, and Aerospace Meteorology, 4-8 October 2004, Hyannis, MA., Amer. Meteor. Soc. Koch, S.E., B.D. Jamison, C. Lu, T.L. Smith, E.I. Tollerud, C.M.I.R.Girz, N. Wang, T.P. Lane, M.A. Shapiro, D.D. Parrish, and O.R. Cooper, 2004: Turbulence and gravity waves within an upper-level front. J. Atm. Sci. (Submitted). Bartels, D.L., F. Caracena, B.D. Jamison, S.E. Koch, and E.I. Tollerud, 2004: Observations of turbulence during BAMEX missions. 11th Conference on Aviation, Range, and Aerospace Meteorology, 4-8 October 2004, Hyannis, MA., Amer. Meteor. Soc.
182
Moninger, W.R., T.S. Daniels, R. Mamrosh, M.F. Barth, S.G. Benjamin, R.S. Collander, L. Ewy, B.D. Jamison, R.C. Lipschutz, P.A. Miller, B.E. Schwartz, T.L. Smith, and E.J. Szoke, 2004: TAMDAR, the Rapid Update Cycle, and the Great Lakes Flight Experiment. 11th Conference on Aviation, Range, and Aerospace Meteorology, 4-8 October 2004, Hyannis, MA., Amer. Meteor. Soc. Project Title: International H2O Project (IHOP) Principal Coordinator: Brian Jamison NOAA Project Goal/Program: Weather and Water—Serve society’s needs for weather and water information/Local forecasts and warnings Key Words: Low-level moisture flux IHOP is a project comprised of a number of diverse missions, one of which focused on low-level jet observation and moisture transport. In this mission, four aircraft were employed, two of which flew opposite of each other on a path defined by a rectangular "box" over northwestern Oklahoma, southwestern Kansas, southeastern Colorado and the eastern Texas panhandle regions. These aircraft dropped high-resolution dropsondes at pre-defined intervals and also used high-resolution lidar instruments for analysis of moisture transport within the low-level jet. CIRA involvement includes analysis and evaluation of variables associated with moisture flux from the available data. Continuing with the data analysis done in 2003, Fortran code was developed that reads an entire leg of dropsonde and lidar data, collates the data according to height, and outputs a file to be used for plotting the data. Plots were generated from these data of the north and south legs for the June 9 case. Our IHOP website (http://www-frd.fsl.noaa.gov/mab/IHOPLLJ/) was updated by recent links to the AMS Weather and Forecasting Conference poster and conference paper, as well as several other recent results and presentations. The website was also revised to have a section devoted to new research results. Fortran code was developed to compare the locations of the Falcon and Lear dropsonde data, and outputs a file to be used for plotting the data. Plots were made for each collocated pair of soundings for comparison. Generally, the plots were quite similar between the Lear and Falcon, even though the observations were taken more than an hour apart. Moisture fluxes were computed for the Lear first and second circuits and flux profile plots were generated to compare the two circuits for each of the drop locations. To further examine the differences between the Lear and Falcon data and also at equivalent height levels (within 1.7 meters), flux differences were analyzed and plotted.

183
Larger differences were noted where the windspeeds were greater, and the larger time span between the Lear circuits also contributed to larger differences. These results were presented in an IHOP conference in Tolouse, France. Also for this conference, plots were created of flux values from the dropsonde data, the High-Resolution Doppler Lidar (HRDL), the Differential Absorption Lidar (DIAL) data, and interpolated radiosonde data for dropsonde locations along the north and south legs of the box. The achievements for the IHOP project during this fiscal year compare favorably with the goals outlined in the statement of work. Publications: Tollerud, E.I., B. Jamison, F. Caracena, S. Koch, M. Hardesty, and G. Ehret, 2004: Multiscale analyses of moisture transport by the central plains low-level jet during IHOP. 20th Conference on Weather Analysis and Forecasting/16th Conf. on Numerical Weather Prediction, 12-16 January 2004, Seattle, WA, Amer. Meteor. Soc. Project Title: Science Quality Datasets -- Radiosonde Data Webpage and Archive Principal Coordinator: Brian Jamison NOAA Project Goal/Program: Climate—Understand climate variability and change to enhance society’s ability to plan and respond/Climate observations and analysis Key Words: Archive of North America radiosonde data A science quality archive of radiosonde data for North America began as a collaborative effort between FSL and NCDC in 1992, and continues to be a widely used baseline data set for weather researchers and climatologists nationwide. The archive exists as a CD-ROM set available from NCDC, and is complemented by a webpage of global radiosonde data updated regularly. Tasks include: managing and updating the radiosonde data webpage, responding to users' questions and requests, and creating periodic CD-ROM updates to the archive. Tasks completed for the past year include: modifying archive update software to accomodate global data, creating software that locates missing stations and includes them in the station history, changing the two-letter country identifiers to those standardized by the International Organization for Standardization (ISO), modifying the access software to allow data retrieval for stations whose begin and end times in the station history fall outside the bounds of the data request, filling small data requests that cannot be filled via the website, responding to questions about the archive and radiosonde data in general, and providing in-depth technical information and references when necessary.

184
The accomplishments for this project during this fiscal year compare favorably with the goals outlined in the statement of work.
C. Local Analysis and Prediction
NOAA Project Goals/Programs:
Weather and Water—Serve society’s needs for weather and water information Local Warnings and Forecasts Weather Water Science, Technology, and Infusion Environmental Modeling Coasts, Estuaries, and Oceans
Commerce and Transportation—Support the Nation’s commerce with information for safe, efficient, and environmentally sound transportation (for activity #8)
Surface Weather Key Words: Local analysis and prediction, high resolution modeling
1. LAPS / WRF Improvements Participating CIRA Scientists: Steve Albers, Brent Shaw Improvements were made in the Local Analysis and Prediction System (LAPS) to analyze observations from new types of instruments and new data formats -- thus expanding the envelope of meteorological data environments that we can operate in with our ever-growing set of users. It is worth noting that LAPS and WRF improvements frequently have cross-cutting benefits that leverage towards many of the supported research projects (both within and external to NOAA) described later in this report. Funding has materialized for certain projects (e.g. STMAS) since the Statement of Work was formulated; LAPS improvements benefiting these projects are included in this section.
LAPS Observational Data Sets
Improvements were made in LAPS to analyze observations from new types of instruments and new data formats - thus expanding the envelope of meteorological data environments that we can operate in with our ever growing set of users. This is outlined in detail below for surface and upper air observations.
Surface Observations
The surface observation ingest can now process LDAD mesonet observations from both the NIMBIS and MADIS databases, using a common read routine with improved error

185
handling. This includes a "level 1" check of MADIS QC flags for temperature and dewpoint. The mesonet "changetime" tests were also improved.
The duplicate METAR check was reworked so that it functions much better in selecting which of the multiple METARs is closest to the nominal LAPS analysis time. Station locations are now listed with higher precision to aid in detecting duplicate observations. A new feature was added to automatically wait for LDAD/MADIS observations to come in and reach a specified count threshold.
Upper Air Observations
The input sounding file (SND) format can now be used for a variety of PADS-related project implementations. The time window was increased for input dropsonde files in "SND" format to +/-3600s, making it easier for the PADS personnel to prepare our input files. Further development was done on the sounding ingest allowing latitude, longitude, and time to be specified at every sounding level. Dropsonde formatting was better standardized between various sources of this data.
Timing strategy was improved for selection of radiometer observations for use in the analyses. Satellite sounding ingest now has the file opening routine moved to help avoid the occurrence of empty output files.
The decision on whether to accept TAMDAR aircraft data now has more flexible user control, particularly when accessing the NIMBUS ACARS database. Software is in place that tests the data type and rejects TAMDAR aircraft data (for non-WFO cases) for the time being while this instrument is being validated. ACARS ingest now has a QC check for wind direction. We began to modify LAPS ingest software to allow adjustment of the aircraft observation assimilation time window. This supports the PADS (see below) and other projects.
Surface Analysis
User adjustable parameters were added that control the analysis fit to observations of temperature and dew point. A wind analysis RMS threshold scaling factor is now being read in via namelist and a new data structure. This allows user control over the amount of detail in the surface wind analysis. The need for this control was pointed out in tests for the STMAS (Mesowave) project. Additional quality control parameters for comparing the observations to the background first guess are now read in via namelist for greater user flexibility. Standard deviation QC thresholds were relaxed for wind and MSL pressure based on the analysis behavior with hurricane Charlie. The surface namelist access routine is now located in the library for better common use by several LAPS programs.
We assigned dummy 'i4time' values (i.e. to system time) to observation time information in observation data structures. This will work transparently with the new time weighting functionality in subroutine 'barnes_multivariate' though it isn't yet ready to be turned on for the surface analyses. Runtime parameter 'maxstns_cmn' was increased so we can use more surface stations overall in the analyses. An array size was increased so we

186
can process a larger number of surface observations derived from soundings. The surface data file CDL specification was updated to remove inconsistencies.
We modified subroutine 'get_bkgwind_sfc' so that the surface winds from the previous analysis cycle will no longer be considered for use as a background. This is a quick way to prevent potential feedback problems if the surface analysis cycles upon itself due to LGA/LWM/LGB first guess fields being unavailable coincident with a fixed observation distribution. A similar change had been made some time ago for the other surface backgrounds with good results. Logging was improved for tracking observation counts within the surface analyses. U and V wind component verification was added against the dependent data.
Space-Time Mesoscale Analysis System (STMAS)
Assistance was provided to the high-frequency variational surface analysis development for the Space-Time Mesoscale Analysis System (STMAS) project. This ran initially for a medium sized domain in the Eastern U.S., then with a larger domain over the same region. More recently, the domain was moved westward and enlarged to cover nearly all of the CONUS grid east of the Rocky Mountains. This work also supported the DWFE project and the FAA.
The STMAS system was set up on EJET, FSL's latest super-computer incarnation, for the purpose of improving product reliability and speed. LAPS timing and web script functionality was improved in support of this run. We are exploring the possibility of using SMS (Scaleable Modeling System) to parallelize the recursive iteration run (and revisiting this for the LAPS wind analysis). LAPS software building scripts were updated and improved to facilitate this testing. Some of the FORTRAN code was reworked for better SMS compatibility, in light of the wind analysis having changed somewhat since the last time we built a parallelized version using SMS.
A waiting strategy was recently put in place so that the analysis waits a reasonable amount of time for the local data to arrive. Web products were improved, particularly for perturbation pressure. We are currently making various adjustments to the EJET run, continuing the process of optimizing speed and reliability.
Radar Processing
We have worked towards more efficiency and other functional improvements for radar remapping and mosaicing. This is described in detail as follows.
A user defined data file can now be used to list radars for "raw" NetCDF file generation. This is part of the process of integrating the Archive-II to NetCDF format conversion software more fully into LAPS.
For the radar remapper, we added an iterative (and efficient) calculation of 'k_eff' - the K coordinate derived from the effective range. This range is calculated given the elevation angle as well as the position at the center of the LAPS grid point being illuminated by the radar beam. This will help standardize the K coordinate of each radar gate from a

187
tilt that illuminates a particular I,J, thus reducing artifacts that show up on upper tilts near the radar for grids with high vertical resolution. Out of grid bounds testing for radar gates was also improved.
A few routines for reading NSSL 3D reflectivity radar mosaics, obtained from Dongsoo Kim of FSL, were added to the LAPS repository. We have increased our Colorado area analyses from 8 Doppler (wideband) radars up to 13 with good runtime performance.
Wind / Temperature Analyses
Memory usage is now more straightforward and more efficient in the wind analysis to help with large domains and with setting up a parallelized version. A new wind analysis flag was added for a code branch that will allow an interface with Dr. Yuanfu Xie's variational analysis core routine. We will thus be able to switch for comparisons between the modified Barnes and variational analysis techniques. Representative wind and height analysis fields are shown in Figure 1 below.
Fig 1. LAPS 500 hPa wind barbs (orange), wind speed (image), and height field (green contours) for July 13, 2005. Green and red squares denote Doppler velocity observations and yellow wind barbs represent derived single- or dual-Doppler wind observations.

188
Logging info for utilization and vertical distribution of profile data was improved for situations when all profile levels are used. A user adjustable parameter was added to control Doppler radar weighting. Verification data formatting was adjusted in support of the PADS project. Wind analysis timing log information was improved in support of parallelization efforts. Some of the SMS constructs were updated as part of this.
The temperature analysis and data reporting scripts now work with GOES12 satellite soundings. The temperature logging information currently features more descriptive and accurate output when we have numerous soundings present. We have also added tracking logic for soundings having missing data so they are not counted in QC stats (e.g. if profiles are outside time bounds or domain). A check was added to use radiometer temperature measurements only if below 3000m AGL in its region of greatest accuracy.
Our hydrostatic integration routine for heights now uses a 3-D pressure field, effectively allowing it to operate with an arbitrary vertical grid coordinate. Diagnostic information was added pertaining to whether the input grids for hydrostatic height integration satisfy various constraints (e.g. for a pressure grid).
Cloud / Precipitation Analyses
The storm total precipitation accumulation is now reset at 1200UTC each day instead of attempting to determine when precipitation has stopped in the domain. Logging information was updated to be more consistent among various IR satellite processing "modes." A "README" file was added to help document the derived products program. Logging information was also streamlined in the precipitation accumulation analysis.
Stability Indices
For stability index calculations, the maximum allowable number of LAPS grid levels was increased from 70 to 150. The strategy was cleaned up so that future similar changes can be made in a more generic fashion.
General Software Improvements & Portability
A flag was added that will allow LAPS to easily switch between present analysis schemes and the new 3DVAR that is being planned. A 5km Colorado regional domain for LAPS-III was localized for eventual testing on EJET.
Scripts that manage LAPS software builds, monitor LAPS output, and compile a parallelized version of LAPS were updated and improved. LAPS documentation and error logging were updated and improved. Timing commands were added for improved information used for load balancing. Analysis logging output was improved and streamlined. A new general purpose parameter 'MAX_BACKGROUND_FILES' is now in place and being used. Physical constants such as the earth's radius are being set up in a more centralized location to improve LAPS consistency.

189
LAPS built scripts were updated to keep track of the new 'tgz' and localization filename conventions. Permissions were changed on our executable installation script to make file access easier. LAPS documentation was updated in a number of areas. Two examples include the accessing of raw data and precipitation verification. Software was streamlined to make it more understandable.
Software improvements were made to better support the Intel compiler. A patch was added that allows LAPS to support a 64-bit Opteron processor running Linux. We are starting to utilize a new parameter to represent the cutoff year for filenames that utilize two digit years. This helps determine what century we are in yielding greater flexibility for archival reruns. The scripts that build the parallelized SMS version of certain LAPS analyses are being tested on the new cluster (called EJET), in support of projects such as USFS and STMAS.
WWW LAPS Interface
Various improvements were made to pre-generated analysis web products and scripts. These include greater portability, ease of use, web security, support for the STMAS project, larger image size, robustness, and logging information. Analysis fields shown on the web (e.g. helicity and radar reflectivity) were adjusted to be more consistent with the forecast fields being displayed. A slight change was made to LGA/FUA temperature contour/image scaling. Labels and user selections were improved for altitudes above 50mb as well as for surface background divergence plots. Plotting of latitude and longitude lines was set up to work with the newer mapping routines. Color coding of upper air temperature observation plots (e.g. radiometer and satellite) was updated and improved.
Pre-generated analysis web products were improved and more fully integrated into LAPS software so that they can be produced via the main LAPS scheduler script (sched.pl). Precip type was added to our pre-generated radar reflectivity image plot. Precipitation type plots are now more generalized for handling larger domains. Various additional plotting modules were streamlined. Theta (e) now replaces the Fosberg fire-weather index, and dew point depression replaces the PBL depth on our pre-generated analysis plots. Specific humidity plots are now more robust. Soil moisture plots were added in support of the RSA project.
Display capability for perturbation pressure was added in support of the STMAS project. More flexibility is now in place for adjusting the number of colors in image color tables, thus helping the STMAS perturbation pressure display. Web generation script options were improved to work better on remote machines such as EJET, especially supporting the STMAS project. We started writing a subroutine called 'read_radar_raw2d' to read "raw" VRC files for display of individual narrowband radar data. Cross-section height fields were added. Cross-section labeling was improved for cases when there are >60 levels. Scripts used for product monitoring as well as "on-the-fly" web display were refined. We have updated the export version of the on-the-fly web page scripts to benefit our external users.

190
Mesoscale NWP Model Initialization and Evaluation
The 'wfoprep_mm5.pl.in' script was changed so that the 'wfoprep.nl' namelist is no longer automatically rewritten thus improving reliability when there are file system glitches.
An experimental PERL module was written that may be able to consolidate much of the PBS job submission functionality. We might experiment with calling this module from the MM5 scripts to see how useful it is. So far, it supports single processor jobs though it could potentially be expanded to support multi-processor jobs. PERL script PBS wall clock time syntax was corrected in response to recent operating system upgrades.
Our accomplishments for this project compare favorably with the objectives proposed in the statement of work.
2. Geostationary Orbiting Environmental Satellite (GOES) Project Participating CIRA Scientist: Brent Shaw Most of the funded work relating to GOES was completed by CIRA personnel in the previous year's reporting period. Analysis runs relating to IHOP are discussed below in section 10.
3. Range Standardization and Automation (RSA) Project Participating CIRA Scientists: Brent Shaw, Steve Albers, Ed Szoke We continued to support the LAPS/MM5 shadow runs at FSL. This includes some model script changes as noted above in the "LAPS & MM5 Improvements" section. Tests were designed on our shadow run to see how robust LAPS/MM5 is in the face of short-term data outages. We assisted troubleshooting data and model outages at the Western Range. Support for plotting soil moisture was added to help in its evaluation.
Progress was made in reconfiguring the LAPS & MM5 runs since the acquisition of the new Linux cluster hardware and operating system. LAPS analyses are now running fairly well. After making some PBL-related MM5 script revisions, the MM5 forecast model is now completing its single processor hourly run. We collaborated with other LAPB staff to get the multi-processor runs running that forecast out to 24 hours. We also assisted with the re-installation of LAPS/MM5 on the shadow system after a second operating system upgrade.

191
Testing and development has continued with Profiler and RASS data from the Eastern and Western Ranges. For these data, we are checking the proper handling of QC flags by the ingest software. SODAR data utilization was improved in the wind analysis so that we now process all observation levels even when several SODAR levels lie within adjacent LAPS levels. The processing of Meteorological Tower observations was enhanced with changes to read in and utilize the RSA QC flags (for T, Td, Wind). We added RSA QC flag decoding for values from 13-20 to keep our software current with the latest range data specifications. We also added a QC test involving the 'editflag' for real-time AMPS soundings. We are continuing to track down why certain datasets (such as narrowband radar) aren't making it into the analysis. Figure 2 shows one of our hourly analysis fields.
Fig 2. Convective Available Potential Energy as shown in an hourly LAPS analysis of the Eastern Range.

192
Partial changes were made to read in soil moisture observations that are mixed in with meteorological tower data. The first step here is to add the soil moisture data into our reformatted surface observation (LSO) file. Soil moisture web-based plots were set up, both for surface observations and for gridded fields. This will help us to evaluate the current soil moisture processing along with further improvements slated for the future.
We conducted a successful data denial test on our shadow RSA runs. We coordinated the preparation as well as delivered the LAPS/MM5 presentation for the RSA Technical Interchange Meeting held at FSL in June. An outline of current issues was developed to assist in planning next year's activities. CIRA's efforts combined with those of other team members led to FSL and the LAPB branch being recognized by NOAA with a Technology Transfer Award. Our accomplishments for this project compare favorably with the objectives proposed in the statement of work.
4. Coastal Storms Initiative Participating CIRA Scientists: Brent Shaw, Steve Albers
The Coastal Storms Initiative (CSI) is a project sponsored by the National Ocean Service and managed by the NWS Office of Science and Technology to perform a proof-of-concept for local data assimilation and NWP within a NWS Forecast Office. CIRA researchers set up, configured, and tested the new Weather Research and Forecast (WRF) model on a Linux cluster installed at the Jacksonville, FL, forecast office in early 2003. During the past year, we continued to provide support on an as-needed basis to keep the runs functioning properly. Funding and personnel issues this year have temporarily limited our progress towards some of the longer term goals.
5. WINDPADS (Precision Airdrop) Participating CIRA Scientist: Steve Albers In several analyses, the tracking of observation time in the observation data structures was more completely set up. This allows us to apply an observation time weight and associated adjustments to observation error statistics, initially in the wind analysis. Wind analysis logging information was augmented so we could better track the processing of wind profile information with respect to time trending, vertical interpolation, and grid rotation.
In support of the PADS project, the operational version of our sounding ingest software now accepts raw soundings in our ASCII "SND" format. These are time binned into the intermediate SND file output by the sounding ingest program. We are also testing a new version that includes support for soundings having lat/lon/times that vary level by level.

193
We participated in a teleconference to map out strategies for assimilating aircraft observations along with soundings in the LAPS/PADS system. Work has begun to make the LAPS aircraft data time windows more flexible to accommodate the PADS requirements. Our accomplishments for this project compare favorably with the objectives proposed in the statement of work.
6. Taiwan Central Weather Bureau (CWB) Participating CIRA Scientists: Steve Albers, Brent Shaw
We have delivered an improved Schultz microphysics module for use in the LAPS/MM5 run at the CWB. We are beginning discussions on how to implement a 3DVAR version of the LAPS analyses that we hope to run at the CWB. We are also testing the staging of the parallelized version of the LAPS wind analysis on a CWB Linux cluster using SMS.
We are continuing our FSL shadow runs with 9km and 3km LAPS analyses. We have restarted our LAPS-initialized MM5 9km shadow runs as well. Development continues on the WRF initialized with LAPS. In collaboration with Li-Hui Tai at the CWB, we examined a case study to see how the LAPS can be made to properly initialize the WRF model. We are continuing this work with our new CWB visitor Yun-Tsai Lin.
Our real-time analysis graphics now have support for precipitation plots in metric units. Improvements were made to error handling in the observational databases with an associated increase in the number of allowed stations for mesonet data.
Training activities also continued with the CWB. Instead of FSL visiting the CWB, however, the CWB sent two meteorologists to FSL in November for training with the Integrated Forecast Preparation System (IFPS). This system is being used at all Weather Forecast Offices in the National Weather Service to create gridded and text forecasts, and may be implemented in the future at the CWB. The CWB meteorologists spent two weeks at FSL in extensive training.
Our accomplishments for this project compare favorably with the objectives proposed in the statement of work.
7. AWIPS Support to the NWS Participating CIRA Scientists: Ed Szoke, Steve Albers a) AWIPS/LAPS We continue a long-term effort to have LAPS software running in the National Weather Service WFOs for evaluation and use by operational forecasters. The LAPS software is being periodically updated within successive AWIPS builds in order to use our latest
194
analyses. The graphical product monitor was made more robust and was configured to operate on-site at LAPS/AWIPS installations.
b) EFF Activities We continued our interaction with the local National Weather Service (NWS) Weather Forecast Office (WFO) in Boulder, located within the David Skaggs Research Center. This involves FSL staff working some forecast shifts, as well as involvement in some cooperative projects. An ongoing project has been running a local model, the MM5, initialized in a hot-start configuration with LAPS, out to 24 h four times a day. The model is run at FSL and the output sent to the Boulder WFO for display on their AWIPS, where we are then able to receive subjective feedback from the forecasters. During the winter in 2005, we also helped the Boulder WFO install the 5km experimental NMM model onto AWIPS, where it remains.
Another project that continued, with some funding from the NWS, involves the Boulder WFO serving as one of three test sites for an experimental infrasound system developed by Dr. Al Bedard of the NOAA/Environmental Technology Lab in Boulder. The system is able to detect infrasound signals from phenomena that includes tornadoes and developing tornadoes. The hope is that it could provide a significant enhancement to Doppler radar in both detection of tornadoes and reducing false alarm, both critical National Weather Service goals. A presentation was provided on our summer 2004 results at the AMS 22nd Conference on Severe Local Storms.
CIRA personnel continue to give FSL weather briefings several times per month.
c) D3D Activities D3D is currently without any official funding support, but we continue to support WFOs that are interested in testing the software. Interest in D3D remains across the NWS but current AWIPS systems were deemed insufficient to support D3D. However, FSL is testing a new workstation that should be able to support the D3D application for testing in the future. Additionally, D3D is used at UCAR/COMET during their training, and for some training at some WFOs. Our overall accomplishments for AWIPS/D3D support compare favorably with the objectives proposed in the statement of work.
8. Federal Highways road weather modeling Participating CIRA Scientists: Brian Jamison, Brent Shaw The Maintenance Decision Support System (MDSS) is a project sponsored by the Federal Highways Administration. The goal of this project is to create a decision support software package to help winter road maintenance personnel decide how to best respond to weather problems on highways. MDSS takes automated weather observations and forecasts and runs pavement conditions models to suggest an optimum combination of plowing and chemical applications, and recommends the time to make these treatments.

195
LAPS runs ensembles of the MM5 and WRF models with boundary conditions from the Eta model, and provides web resources for graphical output (http://laps.fsl.noaa.gov/mdss/). During the winter season, analyses and forecasts are provided hourly from both ensemble models.
Graphical products (Figure 3, for example) are created automatically in near real-time, through the use of Perl scripts, shell scripts, and NCL software to automatically generate images from the ensemble model forecasts. These are then placed in a directory used by the website interface. Changes to these scripts are implemented as necessary, and archival of older images is performed regularly.
Fig 3. 6 hour forecast of the Eta-initialized WRF ensemble model showing 1 hour accumulated precipitation, accumulated snow depth, and precipitation type, valid at 3pm MST on February 15, 2005.
Changes that occurred this past year include: relocation of the domain from Iowa to Colorado and the surrounding states, development of a new product showing short wave radiation (insolation) and cloud cover, corrections to the precipitation and snow

196
depth accumulation plots, correction of a slight map navigation problem, and creation of a separate product that uses the 1-hour precipitation rather than the accumulated precipitation in order to accommodate a new feature of the website that was developed to loop images based on valid time (to observe changes in the forecast with time).
Tasks completed for this project during this fiscal year exceed those outlined in the statement of work.
9. United States Forest Service (USFS) Participating CIRA Scientists: Steve Albers, Brent Shaw We continued to support USFS operations with LAPS analyses running on IJET, and recently transferred to the newer cluster called EJET. Our large western U.S. domain was increased in resolution from 18km down to 6km. The resulting increase in the number of grid points necessitated some account adjustments as well as the withholding of Doppler velocity data from the wind analysis to allow the hourly runs to finish on time. We will be revisiting the possibility of parallelization of the analyses to help restore the radar feed.
Scripts were further developed that will help build a parallelized version of LAPS on the JET clusters, using the Scalable Modeling System (SMS). We did some experiments with auto-parallelization flags as an alternative method to speed software execution on the two processor nodes. Other script modifications helped to keep track with changes to the JET queuing and node configuration. Our LAPS driver script was changed for smoother operation on JET. This included changing the 'qsub_wait' call to 'qsub' and reducing the wall clock time limit from 30min to 20min.
The forecast component of the USFS LAPS runs was discontinued due to funding cuts. Bearing this in mind, our accomplishments for this project compare favorably with the objectives proposed in the statement of work.
10. International H2O Project (IHOP) Participating CIRA Scientists: Ed Szoke, Brent Shaw, Steve Albers LAPS analysis reruns were completed for two case days in June 2002. These reruns feature higher resolution in the boundary layer for low-level jet analysis. Runs with and without experimental dropsonde data are being compared for possible use in an upcoming publication.

197
IHOP research into subjective verification of the MM5 and WRF LAPS-initialized runs made in real-time during IHOP and the post-IHOP reruns continued, with a conference paper presented at the AMS 22nd Conference on Severe Local Storms in October. Research will be wrapping up in 2005 on the model evaluation with a paper to be submitted to Weather and Forecasting. We have documented a number of areas where the IHOP models gave input that would be of value for forecasting, including skill in predicting upscale growth of convection into organized lines, supercell storms, and convective initiation.
Figure 4 below shows a composite of fields from the 2 June IHOP case.
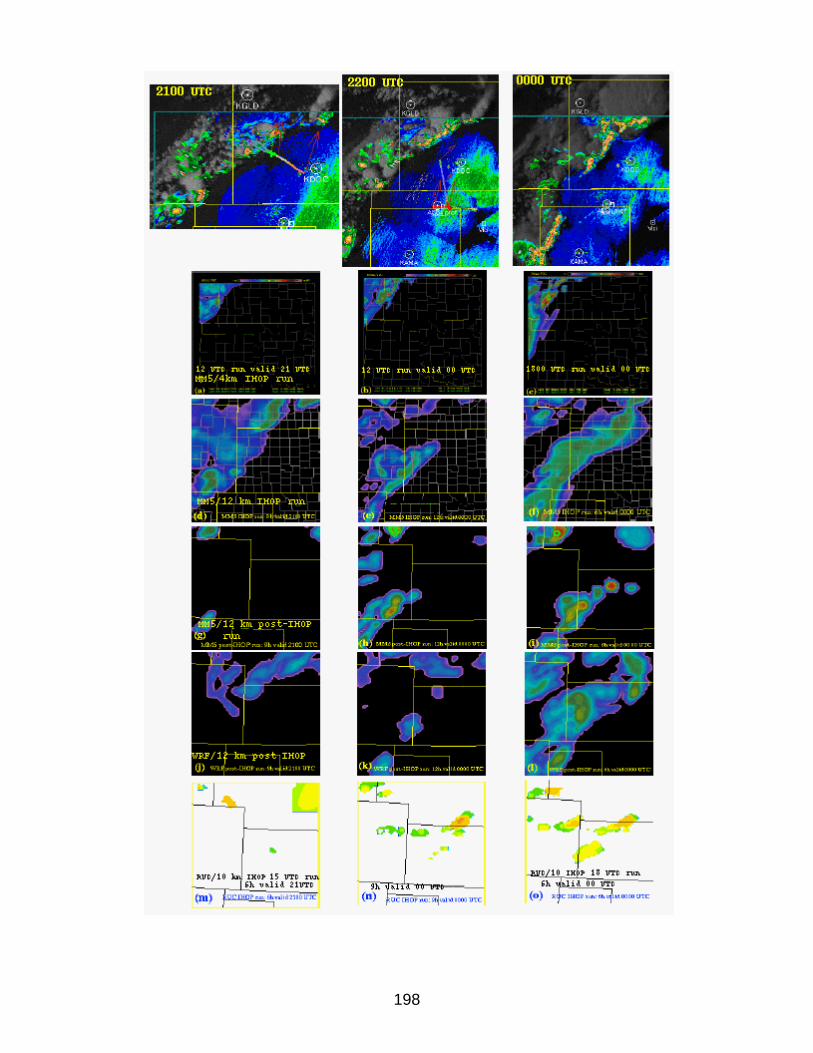
198

199
Fig 4. Forecasts from the 2 June special IHOP and post-IHOP model runs. Top row shows the observed radar reflectivity/visible satellite composite imagery for 2100 UTC 2 June, 2200 UTC 2 June, and 0000 UTC 3 June. Model forecasts are from two different runs; for a-l: left and middle rows, 1200 UTC runs valid at 2100 UTC (left row) and 0000 UTC (middle); right row 1800 UTC runs valid at 0000 UTC. Model runs are from the IHOP MM5/4 km (a-c), MM5/12 km IHOP run (d-f), MM5/12 km post-IHOP run (g-i), WRF/12 km post-IHOP run (j-l). Image is max column reflectivity (scale in a-c); contours surface reflectivity (dBZ). In m-o are RUC/10 km IHOP model runs showing forecast of cloud top height, in kft above ground (scale shown). In (m) and (n) forecasts from the 1500 UTC run valid at 2100 UTC (m) and 0000 UTC (n). In (o), 6h forecast from the 1800 UTC run. The IHOP MM5/12 km run used a convective parameterization scheme, while the 4 km and post-IHOP runs did not. It turned out that for this rather dry environment, a convective parameterization scheme was useful in making a better forecast. The right column shows that, at least for all but the RUC model for this case, better forecasts were made by the 1800 UTC run compared with the 1200 UTC run, showing the value of frequent updates with the LAPS assimilation scheme, which included a hot-start initialization. Our accomplishments for this project compare favorably with the objectives proposed in the statement of work.
11. Weather Research and Forecast Model (WRF) Participating CIRA Scientists: Brian Jamison, Steve Albers, Brent Shaw The Local Analysis and Prediction System (LAPS) branch of FSL has developed a graphical user interface (GUI) to allow a user to define a particular domain and resolution to run the Weather Research and Forecasting (WRF) model using LAPS model initialization data. Part of this effort involves generating some graphical products of static initialization fields, including: average terrain elevation, annual minimum and maximum green fraction, top and bottom layer dominant category soil type, terrain slope index, terrain adjusted mean annual soil temperature, and land use dominant category.
Occasionally, the graphics generated have some problems with particular defined domains and projections that need to be corrected. This past year, several corrections were implemented. The soil temperature plot was misrepresented due to the interpolation used for contouring, resulting in an apparent "data edge" being lost. This was corrected by using a raster method of plotting the data using a grid box scheme. Another correction with a north-pole domain that used a stereographic projection was resolved by applying the correct center latitude.
We found that certain users of the GUI had trouble getting the graphics depending on the version of NCAR Graphics that they were using. After some investigation using different combinations of versions of NCAR Graphics and NCAR Command Language (NCL), it was discovered that a plot is always generated, though in some cases may not have a map background or will have a map background of a lower resolution. The GUI
200
currently advises users to have the latest version of NCAR Graphics and NCL available (along with a down-loadable database for high-resolution coastline maps). Based on this investigation, however, the new recommendation will be for the user to have a version of NCAR Graphics higher than 4.1.1 and the high-resolution map database.
The next step with the WRFSI is to develop code to produce a skew-T (i.e. temperature, humidity, and wind) vertical profile of the model at any particular point of a domain. Preliminary tests of this feature have been successful, and further work toward this goal will take place in the coming year.
In collaboration with our Federal partners, we improved LAPS software to report more detailed statistics when performing the vertical hydrostatic integration. This helped us to work on the design of a strategy for calculating height information within the WRF Standard Initialization (SI) when these fields are unavailable from the large-scale model background.
The accomplishments for this project during this fiscal year compare favorably with the objectives outlined in the statement of work.
12. Outreach and Other Interaction Within and Outside of FSL
CIRA researchers in the LAPB have been involved in several projects outside the LAPS group, including:
Assessment of the turbulence algorithms derived from the RUC. Subjective verification of the determination of surface ceiling analysis and
forecasts from the RUC13. Assessment of the value of experimental TAMDAR data, working with the RUC
group. Participation in the Developmental Testbed Center's (DTC) winter experiment of
testing high-resolution (5 km) CONUS scale models (NMM and ARW, two versions of the WRF model) for winter forecasting. The experiment was called the DTC Winter Forecast Experiment (DWFE), and we are involved with subjective assessment of the forecasts with a paper to be presented at the upcoming AMS conference on Numerical Weather Prediction and Weather Analysis and Forecasting in August 2005. In addition, we designed a web-based form for real-time subjective forecaster input, since the models were made available to NWS forecasters either via the web, FSL's FX-Net, or on AWIPS. We are gearing up for a possible project with the Space Flight Meteorology Group (SFMG). They have sent us some of their raw data and we participated in an analysis of what type of software development would be needed to interface LAPS ingest and analyses with their observations.

201
Publications:
Bartels, D.L., F. Caracena, B.D. Jamison, S.E. Koch, and E.I. Tollerud, 2004: Observations of turbulence during BAMEX missions. 11th Conference on Aviation, Range, and Aerospace Meteorology, 4-8 October 2004, Hyannis, MA., Amer. Meteor. Soc.
Bedard, A.J. Jr., B.W. Bartram, B. Entwistle, J. Golden, S. Hodanish, R. M. Jones, R. T. Nishiyama, A. N. Keane, L. Mooney, M. Nicholls, E. J. Szoke, E. Thaler, and D. C. Welsh, 2004: Overview of the ISNet data set and conclusions and recommendations from a March 2004 workshop to review ISNet data. 22nd Conf. on Severe Local Storms, 4-8 October 2004, Hyannis, MA, Amer. Meteor. Soc., CD-ROM, 1.1.
Benjamin, S.G., S.S. Weygandt, J.M. Brown, T.L. Smith, T.G. Smirnova, W.R. Moninger, B.E. Schwartz, E.J. Szoke, and K.J. Brundage, 2004: Assimilation of METAR cloud and visibility observations in the RUC. 11th Conference on Aviation, Range, and Aerospace Meteorology, 4-8 October 2004, Hyannis, MA, Amer. Meteor. Soc., CD-ROM, 9.13.
Koch, S.E., B. Jamison, E. Tollerud, C. Girz, T. Smith, T.P. Lane, N. Wang, M.A. Shapiro, D.D. Parrish, and O. Cooper, 2004: Analysis of turbulence generation by gravity waves within an upper-tropospheric front. Submitted to J. Atmos. Sci.
Koch, S.E., R. Gall, G. DiMego, E. Szoke, J. Waldstreicher, P. Manousos, B. Meisner, N. Seaman, M. Jackson, R. Graham, A. Edman, and D. Nietfeld, 2005: Lessons learned from the DTC Winter Forecast Experiment. 17th Conference on Numerical Weather Prediction, 1-5 August 2005, Washington, D.C., Amer. Meteor. Soc.
Koch, S.E., Y. Xie, N. Wang, J.A. McGinley, P.A. Miller, and S. Albers, 2004: A new approach for mesoscale surface analysis: The Space-Time Mesoscale Analysis System (STMAS). 22nd Conference on Severe Local Storms, 4-8 October 2004, Hyannis, MA, Amer. Meteor. Soc., CD-ROM, J1.5.
Koch, S., Y. Xie, J.A. McGinley, and S. Albers, 2005: Nowcasting applications of the Space-Time Mesoscale Analysis System. 21st Conference on Weather Analysis and Forecasting, 1-5 August 2005, Washington, D.C., Amer. Meteor. Soc., 1-5 August 2005.
Moninger, W.R., T.S. Daniels, R. Mamrosh, M. Barth, S. Benjamin, R. Collander, L. Ewy, B. Jamison, R. Lipschutz, P. Miller, B. Schwartz, T. Smith, and E. Szoke, 2004: TAMDAR, the Rapid Update Cycle, and the Great Lakes Flight Experiment. 11th Conference on Aviation, Range, and Aerospace Meteorology, 4-8 October 2004, Hyannis, MA, Amer. Meteor. Soc., CD-ROM, P8.6.
Szoke, E.J., B.L. Shaw, and J.M. Brown, 2004: Performance of real-time and post-IHOP mesoscale models in determining storm type and evolution for the IHOP-2002 experimental period. 22nd Conference on Severe Local Storms, 4-8 October 2004, Hyannis, MA, Amer. Meteor. Soc., CD-ROM, P13.
202
Szoke, E.J., A.J. Bedard, Jr., E. Thaler, and R. Glancy, 2004: A comparison of ISNET data with radar data for tornadic and potentially tornadic storms in northeast Colorado. 22nd Conference on Severe Local Storms, 4-8 October 2004, Hyannis, MA, Amer. Meteor. Soc., CD-ROM 1.2.
Szoke, E., S.E. Koch, and D. Novak, 2005: An examination of the performance of two high-resolution numerical models for forecasting extended snow bands during the DTC Winter Forecast Experiment. 21st Conference on Weather Analysis and Forecasting, 1-5 August 2005, Washington, D.C., Amer. Meteor. Soc.
Xie, Y., S.E. Koch, J.A. McGinley, S. Albers, and N. Wang, 2005: A sequential variational analysis approach for mesoscale data assimilation. 21st Conference on Weather Analysis and Forecasting, 1-5 August 2005, Washington, D.C., Amer. Meteor. Soc.
Other Publications and Presentations:
November 2004 (Ed Szoke and Dave Barjenbruch [WFO-Boulder]): Presentations on the March 2003 massive winter storm at the COMET Canadian Meteorological Agency Workshop.
June (John McGinley, Steve Albers [presenter], Ed Szoke, Dan Birkenheuer): Status and Plans for the RSA LAPS/MM5 Implementation - July 2005
Additional reports and LAPS information may be found at http://laps.fsl.noaa.gov/presentations/presentations.html

203
V. Research Collaborations with the Technology Outreach Division A. FX-Net Forecaster Workstation Project Principal Researcher: Sher Schranz NOAA Project Goal/Programs: Weather and Water—Serve society’s need for weather and water information/Local forecasts and warnings, Air quality, Environmental modeling, Weather water science, technology, and infusion. FX-Net also supports NOAA’s cross-cutting priorities of environmental literacy, outreach and education. Key Words: PC workstation, fire weather, air quality FX-Net for Fire Weather/All Hazards: Fire Weather Mission Goal: NOAA’s National Fire Weather Program seeks to eliminate weather-related wild land fire fatalities and injuries, and to reduce fire suppression and land management costs by providing more timely and accurate weather information. NWS forecasters at Weather Forecast Offices and the Storm Prediction Center utilize the latest model and observation data to produce national outlooks identifying critical fire weather patterns. The NOAA mission is to provide tools to support the forecasters producing these long and short-range forecasts in support of fire-management decision makers. When a wildfire does erupt, the NOAA mission to provide services in support of public safety becomes critical. Forecasters must produce very short-range, ‘now’ casts of weather hazards that will directly affect fire-fighting activities. Forecasters become dependent on the tools they can carry with them to the fire. Their ability to function effectively as a part of the fire fighting coordination team is dependent on these tools. Research Objectives: The goal of the NWS FX-Net fire weather research project is to provide the most comprehensive real-time atmospheric dataset possible to tactically-deployed weather forecasters. This required the development of a system capable of delivering all NOAAPort data over a small-bandwidth Internet communications link. The ultimate goal is to provide a comprehensive system for an all-hazards TACMET (Tactical Meteorologist) deployed anywhere on or offshore. The ultimate system would include inter-system collaboration, dispersion modeling capability, data interrogation and editing capability and a database-independent data retrieval system. Research for this project has concentrated on compressing the data as much as possible while retaining data precision, providing extended and newly created data sets and developing tools needed in a field situation. To meet these goals with a very small development team is a major challenge. In order to meet this challenge, the development group employs a number of research and development strategies. All members of the group conduct extensive research in tool development, leveraging existing and newly developed code. Code developed for the AWIPS program is used

204
extensively in the FX-Net system. Java code and techniques required for the FX-Net client are developed and leveraged with some help from the World Wide Web and other programs within FSL. Future research will include evaluating new data distribution, data basing and display technologies to meet the goals of the ultimate system. New technologies to be evaluated include UCAR’s OpenDAP/DODS data distribution system, Bit Torrent data distribution system, WebEx collaboration and training tools, CG/AR, CIRA’s DPEAS and FSL systems such as FX-Connect and the Volcanic Ash Coordination Tool. The Wavelet Compression (see project B (W4 below) research for the FX-Net project continues to concentrate on code optimization, improved compression ratios for image data, and extended precision control capabilities. Research Accomplishments/Highlights and Current Status: Even thought the ultimate all-hazards system is not a complete reality, the development team has been very successful in providing key elements to the users. Significant changes to the basic FX-Net system were made in the past year. The system was upgraded to a RedHat Linux Enterprise operating system and the latest operational version of the AWIPS server software. This provided users with FX-Net database upgrades, newly released model grids, and additional observing systems as well as increased system security. The AWIPS server code was modified to provide specialized, non-localized map scales to accommodate local model data and added observational data. A new version of the Apache (Internet request-handling) software was also installed. This new version of the FX-Net system was considered a major upgrade by the NWS regional offices in the Western, Southern, Alaska and Pacific regions. A new version of the Wavelet Compression code was added to the system, providing higher resolution satellite imagery and improved product retrieval response. New datasets were added via the use of the MADIS system and locally generated, high-resolution model output was added to the system. Tools were added to the FX-Net client to provide an automated menu update capability and screen-to-printer direct capability. As it is critical that newly developed fire weather products reach the IMET in the field, new datasets must be added at an increasingly faster rate. Fire Weather products are being developed by the National Weather Service as part of their Fire Weather Customer and Partner Requirements (NWS Service Improvement Plan – 2004). It is critical that these products be added to the FX-Net system in the future. Planning and research are underway to provide these products to the FX-Net user in a compatible format for integrated displays.

205
Research areas under investigation include: remote user collaboration, dispersion model execution control, client password protection, graphical drawing capability, data interrogation and enhanced compression to improve product resolution and delivery. Benefits to the Public:
FX-Net Meets this Goal: The National Weather Service provides members of their forecasting team who are specially trained in all-hazards situations. The Incident Meteorologists (IMETs) are deployed to wildfires as part of the fire-fighting team. The team is tasked with protecting lives and property. In order to support the team, the IMET must have timely, high-resolution, operational data to keep the fire control managers up to date on the latest weather conditions. When forecasting the weather in the WFO, IMETs use the operational NWS forecasting system, AWIPS, as their daily forecasting system. When deployed to the field for fires and floods, the IMETs previously had to rely on the Internet for all their real-time atmospheric data. Limitations in bandwidth and the need to have many Internet windows open at once caused resource and time restrictions, and in many cases the data were not refreshed frequently enough to support their mission. To alleviate these restrictions, the National Weather Service implemented an All Hazards Onsite Meteorological Support System to support the IMETs at remote locations. The core component of the system is the FX-NET system. FX-NET provides AWIPS-like displays on a laptop remote from the data server. The use of Wavelet Compression technology allows the transmission of high-resolution observations, models, satellite and radar data over bandwidth-restricted communication links. The system can be used over a link as slow as 56 kbps. Products delivered to the IMETs through FX-Net are essentially the same as those delivered to AWIPS using the same user-interface. Therefore, training on this system was minimal. FX-Net has proved to be a critical component for the fire management team. The Chief of the Meteorological Services Division at the NWS Western Region Headquarters in Salt Lake City, Utah has stated that “The FX-Net system is heavily used; to the IMETs, it’s the most critical system they have.” (October 29, 2004, re: the California fires.) New datasets are added to the system when time and resources permit. Research Collaborations and Technology Transfer:
a. FX-Net at the National Interagency Fire Center (NIFC) Via a technology transfer Memorandum of Agreement which began in 2002, the latest version of the FX-Net Client was installed at the Bureau of Land Management’s (BLM’s) Federal Test Center in Lakewood, Colorado. The system passed the rigorous network and security tests administered at the Test Center, and was certified for use by the 11 Geographical Area Coordination Centers (GACCs), the NIFC, the National Forest Service and the Ag Outlook Board. The FX-Net servers and clients are distributed and maintained by the FX-Net Project team.
206
BLM users at the above locations provide long-range fire predictions, daily fire indexes, and drought outlook products for various BLM websites and for operational use by fire weather forecasters. Specialized maps were added to the FX-Net system for these specialized users. b. FX-Net and the EPA Air Quality Pilot Project In FY04, NOAA and the EPA signed a Memorandum of Agreement to pursue a Pilot Project that provided a special air quality FX-Net system to select state and local air quality forecasters on the east coast. The success of that project led to a second Pilot Project Agreement in FY05 which allows state and local air quality forecasters across the U.S. access to the FX-Net Air Quality system. The core FX-Net system was used to build the servers for the specialized air quality users. Additional datasets such as the EPA’s AIRNOW real-time air quality observational data, the NOAA/EPA air quality forecast model data (CMAQ), and experimental air quality forecast models, such as FSL’s WRF/Chem model were included in this new system. EPA users who participated in the pilot project use this system as their primary forecast preparation system during significant air quality forecasting seasons. c. FX-Net in Atmospheric and Air Quality Research The FX-Net system has been used by the University of New Hampshire and Plymouth State University for the past 4 years. These groups have used the system in the classroom as well as the primary forecast system for field experiments such as the 2004 NEAQS-ICARTT study. Other universities using the system in the classroom and the field include the University of Northern Iowa, Florida State University and the University of Northern Florida. Researchers from the U.S. Air Force, Boeing, NASA and the Weather Modification community have also used the system for model verification, field studies and experimental weather forecasting. d. FX-Net and the Public Sector In FY04-05, a formal Memorandum of Agreement was signed with ENSCO to evaluate the FX-Net system for commercial use. This project is ongoing with commercial evaluation results to be reported sometime in FY06. Awards and Honors: Two members of the FX-Net development team were named “Employee of the Month” by FSL management in FY 04/05. Three members received promotions at the end of the CIRA fiscal year to reward significant contributions to the project.
207
Outreach/Education: a) Graduate and undergraduate students: A Junior CU math and computer science student was employed by the project from October 2004 until June 2005. The student experienced working with FX-Net software developers and researchers to learn all aspects of the system. b) Seminars, etc.: An FX-Net workstation was demonstrated to the emergency management community at the 2005 Hurricane Conference in New Orleans in March 2005. A FX-Net presentation was given to participants at the International Satellite Direct Readout Conference in December in Miami, FL. Demonstrations of the system were given to participants by the Tampa, FL IMET using his field system (VSAT, laptop, etc.). FX-Net was demonstrated to Adm. Lautenbacher and other visitors to the exhibits at the Annual AMS Conference in San Diego in January 2005. FX-Net training was held at the Annual Incident Meteorologist’s (IMETS) training meeting in March in Boise, Idaho. An FX-Net forecasting seminar for state and local air quality forecasters was given at the 2005 EPA Air Quality Conference in San Francisco in February 2005. Using a commercial product, WebEx, state and local air quality forecasters were trained ‘virtually’. Forecasters from North Carolina, Maryland, Maine, Pennsylvania and Texas were trained by FX-Net developers in Boulder, CO. The WebEx license holder (from North Carolina) initiated the training session with the rest of the participants joining the session from their respective offices. The training went very well as all participants were seeing the same display on their systems in their offices. They also heard, via teleconferencing, all the training dialogue, questions and answers. c) K-12 outreach, public awareness: The FX-Net project participated in the 2005 AMS Weather Fest in San Diego, CA. An FX-Net client was demonstrated to attending K-12 students, parents, teachers and the general public during a 6-hour event at the San Diego Convention Center. A description of how the system is used by tactical fire weather forecasters and the air quality community was also provided. Publications: Schranz, S., N. Wang, J. Stewart, and E. Polster, 2005: FX-Net: Integrating air chemistry and weather data for research and operations. 21st International Conference on Interactive Information and Processing Systems (IIPS) for Meteorology, Oceanography, and Hydrology, 10-14 January 2005, San Diego, CA., Amer. Meteor. Soc. Soc., CD-ROM, 15.4.

208
Stewart, J., S.W. Schranz, E. Polster, N. Wang, 2005: FX-Net for air quality research forecasting. Atmospheric Sciences and Air Quality Conference, 27-29 April 2005, San Francisco, CA, Amer. Meteor. Soc.
B. Gridded FX-Net or the World Wide Weather Workstation (W4) Project Principal Researcher: Sher Schranz NOAA Project Goal/Programs: Weather and Water—Serve society’s need for weather and water information/Local Forecasts and Warnings, Environmental Modeling, Weather Water Science, Technology, and Infusion. FX-Net is a cross-cutting solution provided to all these program elements. Key Words: PC workstation for gridded products, wavelet compression World Wide Weather Workstation (W4) for Fire Weather Fire Weather Mission Goal: NOAA’s National Fire Weather Program seeks to eliminate weather-related wild land fire fatalities and injuries, and to reduce fire suppression and land management costs by providing more timely and accurate weather information. NWS forecasters and collaborative forecasters at the National Interagency Fire Center (NIFC), and at the 11 Geographical Area Control Centers (GACCs) utilize the latest model and observation data to produce national outlooks identifying critical fire weather patterns. The NOAA mission is to provide tools to support the NWS and NIFC forecasters producing these long and short-range forecasts in support of fire-management decision makers. Forecasters become dependent on the tools they can carry with them to the fire. Their ability to function effectively as a part of the fire fighting coordination team is dependent on these tools. Research Objectives: Gridded FX-Net is a highly-leveraged, technology transfer research project proceeding in collaboration with the National Interagency Fire Center and the FX-Net development team. As a technology transfer program, the NIFC Gridded FX-Net system aims to improve the GACC forecaster’s capabilities to provide long-term fire behavior and fire potential products. An essential part of producing these products is the numerical prediction models delivered via the NOAAPort to the AWIPS data servers. The research for this project centers on combining the enabling technologies from the FX-Net and AWIPS systems. The goal is to deliver gridded model output data, bit-mapped satellite and

209
radar imagery, as well as all the observational data available via NOAAPort to AWIPS D2D (Display 2D) clients. The FY05 goals were to build a prototype system demonstrating the ability to host multiple, remote D2D users from one AWIPS server. The system components include: a) Data and file servers (based on AWIPS data and file servers). b) Client (based on the AWIPS D2D display system), which manipulates and displays the data. c) Wavelet Compression* code, used to reduce the size of the data sets for transmission to remote D2D clients. d) LDM ‘push’ data delivery, used to distribute the data from the server to the remote client The following is a sample requirements analysis report: Gridded data distribution User Requirements: Requirement: Model grids are required as input to NWS algorithms that produce a set of derived parameters which are used as input to fire potential and fire index statistical algorithms. The output from these algorithms is displayed as a fire potential matrix on a website. Dependencies: The GFS Long Range model is a priority. Parameters required (?). The NWS algorithm is not available to FSL for testing. This algorithm will be installed on the FX-Net server by someone designated by NIFC from the NWS or GACC office. Analysis: Grids must be accessible from the FX-Net AWIPS-like data base on the Gridded FX-Net Client in each GACC office. The NWS grids extraction and NIFC statistical algorithms will be installed to operate on the grids from the gridded Client data base. Prototype implementation: These grids will be accessible from the gridded Client data base as they are in AWIPS. They will be stored as they are in AWIPS for the users to have access to the grids in the same manner. These grids are also available to the D2D Client display. The GFS grids will be ‘pushed’ to the client. Other data sets, including satellite and radar imagery, observations and other model grids will be available via ‘pull’ commands. All research will be based on a similar requirements analysis and system evaluation in collaboration with GACC and NIFC scientists. Future research areas include:
Additional data sets added to the distribution system An intelligent ‘pull’ capability added to the client

210
New and more robust data compression scheme for gridded data New data compression scheme for radar and observation data New data compression scheme for data with irregular boundaries (i.e. theta
fields) Research Accomplishments/Highlights and Current Status: Research in FY05 centered on developing a prototype remote AWIPS client-based on the AWIPS data and applications servers. A prototype system was developed and tested at the FSL laboratories using existing hardware. Research areas included: Server software: a) servers - creating new file server data managers, monitoring code, a compression manager, an integrated LDM data delivery system, and modified metar and raob decoders; b) overall server system processes, including startup and shutdown scripts and data bundling, were modified for the prototype system. Wavelet Compression: a) direct compression of these products will not achieve the desired compression efficiency, since products in these formats contain information that requires both lossless and lossy compression. In order to separate this group of information for compression, stage them, and combine them together in the decompression stage, several pairs of application data format decoders and encoders must be developed to handle different products; b) to meet the requirements of reliability and robustness in an operational environment, a few error resilient check and safeguards are added to the software. In May, 2005 a Gridded FX-Net prototype system was installed at the BLM National Test Center in Lakewood, Colorado. The system has passed all the security and network tests and is certified to be installed at NIFC and GACC offices. The next phase of the project requires installation of three clients at three independent locations to monitor bandwidth utilization, server IGC loading and multiple-client auto-updating. Benefits to the Public: The Gridded FX-Net system, by providing BLM, NIFC and GACC offices with gridded model output data, will allow timelier, more accurate delivery of fire behavior and fire danger products to the public. Algorithms currently unavailable to the GACC offices, due to the lack of gridded data, will become available to forecasters to run with local data and the benefit of local expertise. As a result these localized products become more accurate and local emergency managers, fire weather analysts and the general public can have access to more accurate products.
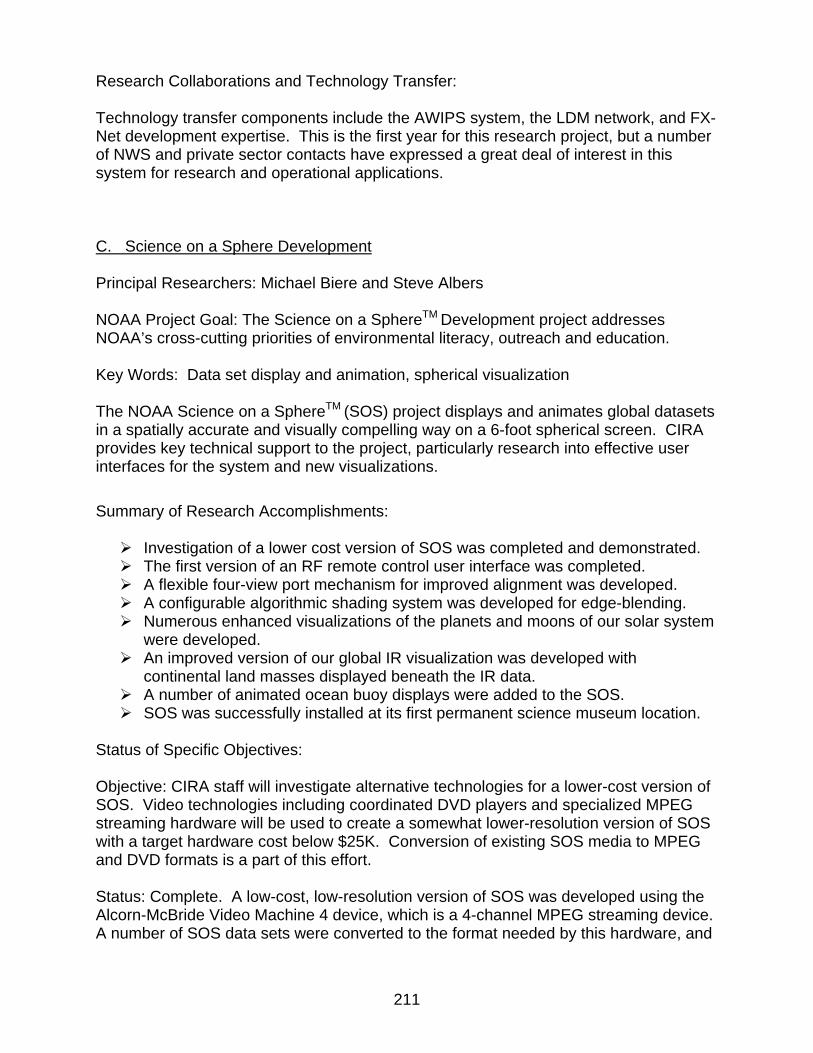
211
Research Collaborations and Technology Transfer: Technology transfer components include the AWIPS system, the LDM network, and FX-Net development expertise. This is the first year for this research project, but a number of NWS and private sector contacts have expressed a great deal of interest in this system for research and operational applications. C. Science on a Sphere Development Principal Researchers: Michael Biere and Steve Albers NOAA Project Goal: The Science on a SphereTM Development project addresses NOAA’s cross-cutting priorities of environmental literacy, outreach and education. Key Words: Data set display and animation, spherical visualization The NOAA Science on a SphereTM (SOS) project displays and animates global datasets in a spatially accurate and visually compelling way on a 6-foot spherical screen. CIRA provides key technical support to the project, particularly research into effective user interfaces for the system and new visualizations.
Summary of Research Accomplishments:
Investigation of a lower cost version of SOS was completed and demonstrated. The first version of an RF remote control user interface was completed. A flexible four-view port mechanism for improved alignment was developed. A configurable algorithmic shading system was developed for edge-blending. Numerous enhanced visualizations of the planets and moons of our solar system
were developed. An improved version of our global IR visualization was developed with
continental land masses displayed beneath the IR data. A number of animated ocean buoy displays were added to the SOS. SOS was successfully installed at its first permanent science museum location.
Status of Specific Objectives: Objective: CIRA staff will investigate alternative technologies for a lower-cost version of SOS. Video technologies including coordinated DVD players and specialized MPEG streaming hardware will be used to create a somewhat lower-resolution version of SOS with a target hardware cost below $25K. Conversion of existing SOS media to MPEG and DVD formats is a part of this effort.
Status: Complete. A low-cost, low-resolution version of SOS was developed using the Alcorn-McBride Video Machine 4 device, which is a 4-channel MPEG streaming device. A number of SOS data sets were converted to the format needed by this hardware, and

212
the SOS user interface was modified to control the device. The system was demonstrated and worked well, although the reduction in visual quality from the lower-resolution data is noticeable. The project is now concentrating on higher-resolution displays rather than this low-cost approach. Objective: CIRA staff will be continuing to extend and improve the software and user interface of the existing version of SOS. Status: In progress. A remote control user interface for use by presenters was developed using an ATI RT remote. A four-view port mode was developed for the OpenGL display software, which allows independent stretching and shearing of the sides of the displayed image, giving us tighter control over alignment of adjacent projectors. The SOS software was ported to the Macintosh platform, giving us more choices of future display hardware. We developed new configurable edge-blending shading software. Additional software was developed to allow a fifth projector to fill in a projection void at the bottom of the sphere. We've continued working on a number of global data sets for Earth and elsewhere in the Solar System. Oceanic buoy observations were overlayed on the "Blue Marble" Earth image. A static image shows locations for five different global buoy networks. We also produced two movies that show the drift of over ~1000 ARGO buoys over a several month period. The first movie shows only the horizontal buoy drift, while the second modulates the intensities to represent the timing of each buoy dive cycle. We developed new methods to display and quality control real-time Aviation Weather Center McIDAS format global IR satellite animations. This includes removal of artifacts and time interpolation from a 30-min to 15-min looping interval. These are being distributed to the Nauticus Museum where the SOS was recently deployed. Animations in real-time are now being produced for sea surface temperature (and anomaly). These analyses are obtained from web displays provided by the Fleet Numerical Operations Center of the DOD. A map of Mercury was produced by blending some Mariner 10 photo-mosaics with a USGS shaded-relief map. An improved high-resolution map of Venus was produced by combining several Magellan mosaics supplied by The Planetary Society along with other spacecraft data. We now have a full set of Jupiter's Galilean satellites that we can display on SOS. Photo-mosaics of several Saturnian satellites were updated by reprojecting and overlaying recently taken Cassini flyby images. Maps of five Uranian satellites were added as well as one for Neptune. Some image processing was performed to add a high-resolution Voyager mosaic to a pre-existing map of Neptune's moon Triton. A map of the cosmic background radiation was produced that shows the early universe from an external perspective. Figure.1 below offers a collage of a few of these maps.

213
Venus Jupiter's moon Lo
Jupiter's moon Europa Saturn's moon Enceladus
Saturn's moon Lapetus Neptune's moon Triton
Fig. 1. These cylindrical projection maps represent global image mosaics of several solar system objects. They are generally stored as JPEG images that are 2048 x 4096 pixels in size. The SOS software dynamically renders these Cartesian datasets into the global spherical views that are viewed by the audience. Full details and credits for these maps may be viewed online at 'http://laps.fsl.noaa.gov/albers/sos/sos.html'.
Objective: … support its installation and operation in new and existing venues.
Status: In progress. We installed SOS in its first permanent science museum location at the Nauticus Museum in Norfolk, VA. SOS continues in use at the Science Fiction Museum in Seattle.

214
VI. Research Collaborations with the Modernization Division A. WFO-Advanced Project—Data Group Principal Researcher: MarySue Schultz NOAA Project Goal/Program: AWIPS supports NOAA mission goal to “serve society's needs for weather and water information” and NOAA program for local forecasts and warnings. Key Words: Data processing and visualization, forecast and warning support The WFO-Advanced project is responsible for developing and evaluating new techniques for weather data processing and visualization, in support of the AWIPS project. The AWIPS project, sponsored by the National Weather Service (NWS), has the objective of modernizing the technology used in Weather Forecast Offices (WFOs) in the U.S. to improve the accuracy and timeliness of the warnings disseminated to the public. The Data Group of the Modernization Division is responsible for conducting research and for implementing new techniques in the areas of real-time programming, data processing optimization, data base access, data decoding, and data distribution in support of this AWIPS objective. Accomplishments: 1. Objective: Explore new technologies to address the rapid increase in existing meteorological data and the introduction of new data sets.
During the past year, CIRA staff members conducted research on the operational use of the AWIPS and Graphical Forecast Editor (GFE) software at a number of WFOs, to determine which datasets, visualization tools and forecasting tools were most heavily used. Data was collected on a daily basis and analyzed once a month. The results were reported to NWS headquarters and to the AWIPS developers, and were also presented to the larger AWIPS community at the 2005 AMS conference in San Diego, CA. This research has led to a number of improvements to the software: enhancements have been made to the AWIPS and GFE visualization and forecasting tools that are used most often, and tools that are not used have been removed; AWIPS menus have been redesigned to provide easier access to frequently used datasets. These modifications have streamlined AWIPS and the GFE in preparation for the introduction of new data and tools. CIRA staff was responsible for developing the capability of decoding and displaying model output data distributed in GRIB2 format. This is important because GRIB2 compresses data by a 2.5 to 1 ratio over other data distribution formats, which will reduce the bandwidth needed to deliver new high resolution model data to the WFOs. The high-resolution data shows smaller scale features, which may be responsible for producing local scale severe weather. Extended forecast periods (84 – 192 hr) are also available in the high-resolution data. CIRA researchers designed the decoding software using multiple configuration tables to process the data, making it possible in the future

215
to decode new GRIB2 data at the WFOs by simply adding information to the tables. With the GRIB2 capability installed at the WFOs, forecasters can view model output data with 12 km (or as low as 5 km) resolution, as opposed to the previous 40 km or 80 km data. In addition, the new software will allow WFO sites to ingest and display their own local high-resolution model data. 2. Objective: Integrate data into the development of the next generation of forecaster workstations based on Linux. CIRA researchers are involved in a multi-year project that involves porting the existing AWIPS software from Hewlett Packard's version of Unix (HPUX) to RedHat Linux. The AWIPS software was initially implemented on HPUX, but was experiencing performance problems due to the increase in data volume. The Linux operating system was evaluated, and was found to have both lower cost and better performance than HPUX. As a result, the NWS decided to replace the aging HPUX hardware at the WFOs with PCs running RedHat Linux. The porting effort began several years ago, and since then, CIRA researchers have been involved in moving the data ingest and data decoding software to Linux. This effort has involved: modifying code to accommodate differences between the original and target operating systems; developing techniques for making key software more efficient, especially in the interface between the workstation and the data ingest system; and running stability and performance tests on the ported software. The activities performed by CIRA for the Linux port prepares the AWIPS data ingest and workstation interface software for handling the data volumes that will be available to the next generation of AWIPS. 3. Objective: Investigate a new distributed data schema that will make data available on demand to Weather Forecast Offices, as well as to other organizations. Enhance the workstation interface to make use of the new data system. FSL and the NWS have jointly sponsored the Advanced Linux Prototype System (ALPS) project to satisfy this objective. The ALPS goals are: to complete the HP to Linux transition described in Objective 2 above; to address key AWIPS architectural issues in the areas of data distribution and workstation software design; and to provide evolutionary changes to AWIPS. A new data paradigm was investigated during the early part of 2004. In the current AWIPS design, all available data is delivered to each WFO, where it is stored locally. This design puts a heavy load on the data delivery network and on the data servers and data bases at the WFOs. The new paradigm involves storing model output and satellite data on a central server, delivering it to the WFOs only when needed. The other data types will continue to be distributed to each WFO. The load on the network and at the WFOs will be reduced, which should result in faster data access to the local data, and should allow the NWS to continue expanding the available data sets without upgrading the hardware at the WFOs. The design calls for data on the central server to be stored in a standard format so that it can be made available to other organizations. CIRA researchers made a number of contributions to ALPS during 2004/2005: 1) contributed to the overall design of the distributed data base; 2) designed and implemented data storage and retrieval software for the central server; and 3) modified the workstation interface software to retrieve data from the central server. CIRA researchers developed a prototype system using the new

216
software, and successfully demonstrated the prototype to the NWS Corporate Board in November 2004. The success of the prototype system demonstrated that the new data paradigm is a viable alternative to the current data distribution design. If there is sufficient funding, work on the ALPS project will continue in 2005-2006. The focus will be on experimenting with different remote data access packages and techniques, and adding capabilities to the prototype.
Publications: Wakefield, J.S., P.A. McDonald, M.S. Schultz, J.E. Ramer, and X. Jing, 2004: Processing and display of atmospheric electricity data to support launch operations at the Eastern Range. 11th Conference on Aviation, Range, and Aerospace Meteorology and the 22nd Conference on Severe Local Storms, 4-8 October 2004, Hyannis, MA, Amer. Meteor. Soc.
Roberts, W.F., and L. K. Cheatwood, 2005: Examples of GFE Suite and D2D Use in operations during 2004. 21st International Conference on Interactive Information and Processing Systems (IIPS) for Meteorology, Oceanography, and Hydrology, 9-14 January 2005, San Diego, CA., Amer. Meteor. Soc. B. Advanced Development Principal Researcher: Scott O’Donnell The primary goal in this research partnership is to keep abreast of advanced technology and apply it to CIRA and FSL research results, particularly with regard to how it can be effectively used to develop the next generation of forecaster workstations. This has many aspects including configuration management, development applications and innovative systems studies, new programming languages, and techniques. Advanced Development staff research these areas and prototype promising technologies. The applied, joint research efforts result in new, innovative applications of these advanced technologies. Several initiatives in collaboration with the Decision Assistance Branch at the NWS Meteorological Development Lab would include:
• Porting of SCAN (System for Convection Analysis and Nowcasting) into AWIPS to better integrate weather surveillance radar data for short-term severe weather analyses and forecasts
• Integrating MDL’s FFMP (Flash Flood Monitoring Program) into AWIPS for hydrologic forecast and emergency management support
• Porting of NCAR’s auto-nowcaster application (Cumulus Cloud Growth) algorithm into SCAN’s nowcasting capability for 30- and/or 60-minute forecasts and displaying forecast products on D2D
• Investigating various GIS datasets to improve FFMP usability

217
Project Title: Adaptation of AWIP's SCAN application for the Korean Weather Forecaster Analysis System (FAS) NOAA Project Goal/Program: Weather and Water—Serve society's needs for weather and water information/Local forecast and warnings Key Words: System for Convection Analysis and Nowcasting (SCAN), radar product generation Long-term Research Objectives: The Decision Assistance Branch (DAB) of the NWS Meteorological Development Lab (MDL) is collaborating with foreign national weather forecasting agencies, the Korean Weather Administration (KMA) and the Taiwan Central Weather Bureau (CWB) to help them improve their short-term weather forecasting capabilities on AWIPS-like workstations. Supporting this partnership, CIRA continues this collaborative effort transferring MDL's AWIPS SCAN (System for Convection Analysis and Nowcasting) application to KMA's AWIPS-like FAS (Forecaster Analysis System) workstation. Related activities to accomplish this task include the ingest of KMA radar data, generation and storage of the radar products required by SCAN, and the development of an operational SCAN-oriented geographic database. Research Accomplishments: This Korean Meteorological Administration (KMA) task continues to work to adapt the MDL-developed System for Convection Analysis and Nowcasting (SCAN) software to KMA's Forecaster Analysis System (FAS), an AWIPS-like, weather forecast workstation. This is the third of a three-year plan, scheduled to be completed in December. Radar Product Generation: KMA collects radar data from its several radar weather surveillance sites which can be thought of as similar to NexRAD's Level-II data. However, KMA does not have a system to generate the radar products required by SCAN. 'Radar Product Generation' became a primary task for KMA and the visiting researcher assisting this project at FSL. Using the C- and S- band data from the various KMA radar data collection platforms, a real-time radar data processing system has been created to generate the required SCAN radar products: Vertically Integrated Liquid (VIL), Composite Reflectivity (CZ), and Storm Track and Identification (STI) (see example products below). Emulating the ORPG (Open Radar Generation Processor) system, this radar processing system is designed to be extensible as the need for additional radar products become necessary to support KMA’s future forecasting needs. In another KMA project, conducted at NSSL (National Severe Storms Laboratory), a KMA scientist is developing techniques to provide radar data Quality Control. This radar processing system is designed to use the results of that project in a seamless manner. No changes to this system are anticipated.

218
Radar Data Storage and Notification: AWIPS has developed real-time methods to retrieve radar data products directly from the Radar Product Generator (RPG) and automatically store and disseminate notifications for workstation visualization and/or further processing. These AWIPS methods have been utilized with few modifications to allow a seamless integration of Korean radar products into the Korean FAS (AWIPS-like) workstation. Localization Customization: Prior to the beginning of this project, significant modifications to AWIPS's underlying localization data sets occurred. This has required a conversion of many of the previously used background maps and localization data sets from an internal binary file format to the AWIPS GIS standard 'shapefile' format. The 'shapefile' format includes many data base attributes not previously associated with the GIS data. Some of the conversions required locating, preprocessing, creating data bases, and the subsequent creation of programs to associate map locations with the data base attributes. The GIS data set changes also required many new, customized localization scripts to support the specific needs of the KMA operational forecast offices. Testing: The working prototype is still being tailored to use the available KMA data sets (not available at FSL), with initial testing to be followed by more robust, operational performance testing for each KMA forecast office which uses the FAS system. Future Exploration: A short-term visiting scientist returned to FSL to conduct some investigative research to learn more about the AWIPS system and how the NWS could provide future support and additional applications. I provided his primary support during his 3-month visit. Presentations: A detailed progress report was made in September 2005 to Dr. Sung-Nam Oh, Director, Remote Sensing Lab, KMA, Mr. Hyeon Lee, Director, Information Management Division, KMA, and Mr. Byung Sun Kim, Director, Remote Sensing Division, KMA to discuss the progress and anticipated results of the SCAN work being conducted at FSL. During a visit to MDL headquarters in Silver Spring in December 2005, I described and discussed the benefits of adding FFMP to the KMA suite of SCAN applications with Dr. Sung-Nam Oh, Director, Remote Sensing Lab, KMA.

219
Example KMA radar products:
Fig. 1. An example of a Composite Reflectivity radar product created from KMA radar data using the real-time KMA Radar Product Generation system developed for this project and displayed on the KMA FAS workstation (Note the Korean language menus).

220
Fig. 2. An example of the KMA generated Vertically Integrated Liquid (VIL) radar product using the real-time KMA Radar Product Generation system.
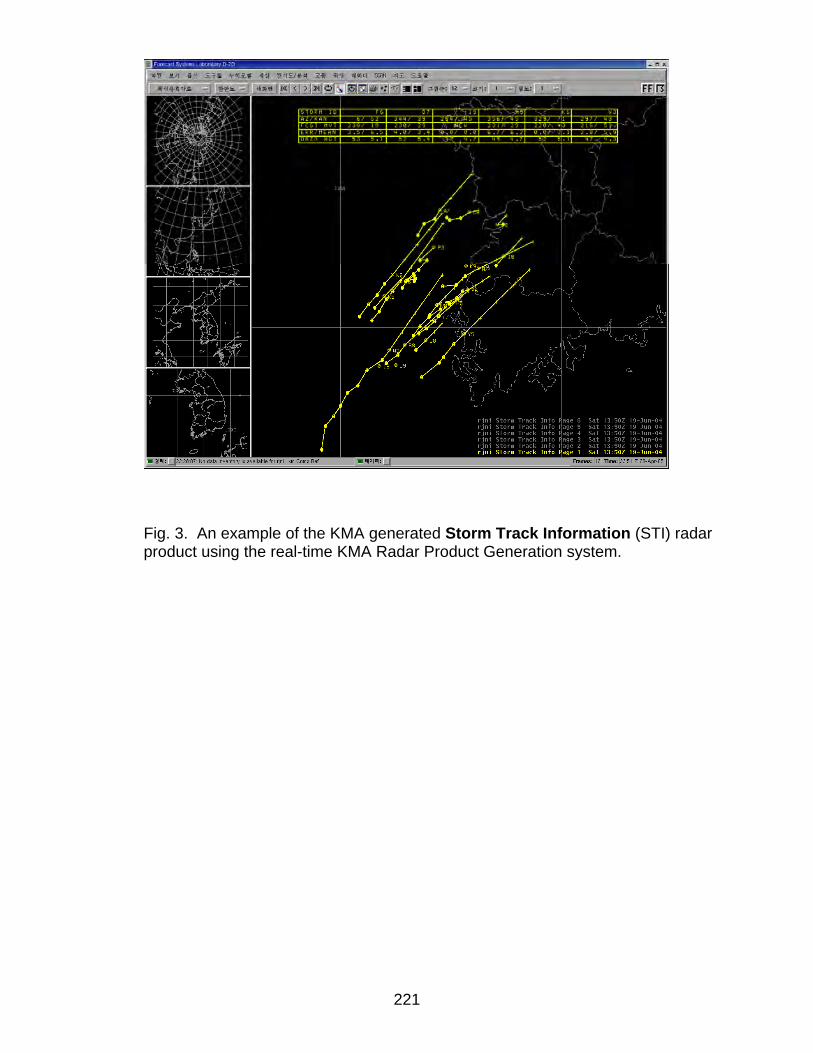
221
Fig. 3. An example of the KMA generated Storm Track Information (STI) radar product using the real-time KMA Radar Product Generation system.

222
Fig. 4. An example overlay of the CZ and STI products on the KMA FAS workstation.
Project Title: Display of upstream contributing area and downstream flow path in AWIP's Flash Flood Monitoring Program (FFMP) NOAA Project Goal: Weather and Water—Serve society's needs for weather and water information/local forecasts and warnings Key Words: Flash Flood Monitoring Program (FFMP), flash flood forecasting Project Goal: Collaborating with the Decision Assistance Branch (DAB) of the NWS Meteorological Development Lab (MDL), CIRA has added to the Flash Flood Monitoring Program (FFMP), display of the upstream contributing area (area of rainfall runoff) and downstream flow path (potential Flash Flood track) from an arbitrary large scale (small) FFMP watershed. This display improves the NWS forecaster's comprehension of the hydrologic processes and impact features involved in flash flood forecasting.

223
Project Accomplishments: The addition of the “Basin Trace” to the FFMP (Flash Flood Monitoring Program) was completed and is included in the AWIPS OB6 release. The application enhancement is designed to allow forecasters to visualize the area of rainfall-runoff into a selected FFMP watershed and the flow route the runoff will follow from the selected watershed. This additional visualization information will help the forecaster identify locations in the path of a flash flood and provide a targeted Flash Flood Warning for both the Emergency Managers and the public. Project Title: Inclusion of NCAR AutoNowcaster products into SCAN's nowcasting capability for 30 to 60 minute forecasts and the display of these forecast products on AWIPS. NOAA Project Goal/Program: Weather and Water—Serve society's needs for weather and water information/Local forecasts and warnings Key Words: System for Convection Analysis and Nowcasting (SCAN), NCAR AutoNowcaster products, convective boundary initiation
Project Goal: Collaborate with the Decision Assistance Branch (DAB) of the NWS Meteorological Development Lab (MDL) and NCAR RAP to display AutoNowcaster Convective Boundary products on AWIPS and send to NCAR forecaster defined initiation locations of convective boundaries. Project Accomplishments: Initially, this project was proposed as a very modest ‘Cumulus Cloud Growth' display, emulating the very simplest of the AutoNowcaster products. As time and experience allowed, it became apparent that forecasters needed better estimates of convective boundary locations, while at the same time, the AutoNowcaster required human intervention to optimally identify the initial locations of the convective boundaries. Using AWIPS techniques to draw the location of convective boundary initiation, this geographic information is transferred to the NCAR AutoNowcaster processing system for inclusion in their analysis. The resulting products are returned to AWIPS for display and boundary revisions, thus providing a convenient, symbiotic system. To date, we have established communications protocols, developed real-time, automated data ingest and storage, and display techniques, and designed the data

224
transfer techniques around AWIPS' LDAD (Local Data Acquisition and Dissemination) system. To evaluate the system implementation, a real-time prototype test is planned to be installed in the Dallas/Fort Worth Forecast Office prior to the late summer convective season.
Fig. 1. An example of NCAR AutoNowcaster analysis products displayed on AWIPS.

225
Project Title: Training of SCAN (System for Convection Analysis and Nowcasting) for CWB forecasters and scientists. NOAA Project Goal/Programs: Weather and Water—Serve society's needs for weather and water information/Local forecasts and warnings Key Words: System for Convection Analysis and Nowcasting (SCAN) Project Goal: Collaborate with the Decision Assistance Branch (DAB) of the NWS Meteorological Development Lab (MDL) and FSL's TOD to provide SCAN user training to CWB scientists. Project Accomplishments: I traveled to CWB in July (2004) to provide training support for the SCAN software ported to the CWB WINS (AWIPS-like) weather forecast workstation and transferred to CWB earlier in the year. Several SCAN training sessions were provided to operational forecasters. Also, several meetings were held with software developers and maintenance staff to help resolve their development and support problems. These meetings went very well, solving several long standing problems during our visit. A Lab-wide presentation introduced the primary features of SCAN and the importance of 0-3 hour 'nowcasts'. CWB generally issues 6-hour forecasts, adding 3-hour forecasts during typhoons. They never issue shorter term forecasts. We met with the Remote Sensing Group; presented an abbreviated SCAN briefing (highlights of the presentation made to the entire Lab earlier in the week), followed by an in-depth review of FFMP (Flash Flood Monitoring Program). We described how FFMP could add a 0-3 hr flash flood forecast capability to the Weather Bureau. The primary issues the researchers had with FFMP were that the forecasters do not issue 'nowcasts' (0-3 hr forecasts) and that the Water Resources Agency (WRA) was responsible for issuing 'ALL' flood warnings. These items lead to an intense and interesting discussion; the outcome: that they (CWB forecasters) recognize the need for short term forecasts and that they could issue a “First Alert” to warn of a dangerous condition, while still relying on the WRA to issue the flash flood warning, thus, providing safety while preserving the divisions of authority. Several informal discussions and meetings occurred with various Deputy Directors at CWB during my visit. From my perspective, these improved my understanding of CWB's goals and how I might help improve FSL’s and MDL's support CWB. A progress report was also provided to Wan-Ho Lee, Director and CIO of CWB in July.

226
C. Advanced Technology—Creation of a more efficient distributed processing architecture to support the NOAA Profiler Network Principal Researcher: Robert Prentice NOAA Project Goal/Program: Weather and Water—Serve society’s needs for weather and water information/Local forecasts and warnings Key Words: Profilers Background and Objectives: CIRA research includes development of software that supports atmospheric profiler data acquisition and quality assurance. This software is critical to supporting the wide distribution of profiler data to many government agencies. The NOAA profiler network (NPN) is one of the most effective means of gathering atmospheric wind data in support of weather forecasting and modeling activities. This fact is supported by an in-depth analysis performed for a COEA (Cost and Operations Effectiveness) report developed for Congress during 2004. A technical review of the project, presented to FSL by the Demonstration Division in June 2004, emphasized both this point and the strong correlation between the profiler project's goals and NOAA's strategic plan and goal to serve society’s needs for weather and water information. Fig. 1 below shows the locations of CAP and NPN profilers in the U.S.
Fig 1. Locations of CAP and NPN profilers in the U.S.
CIRA research involves both the design of software to efficiently handle profiler data, and the application of engineering practices to the software environment supporting the profiler observation network. The recent focus of software development has been to replace an aging VAX hub system, which runs vintage FORTRAN software, with a more

227
modern Java-based implementation running on a number of Linux and Windows servers. A second thrust has been the continuing support of an ever-expanding network of Cooperative Agency Profilers (CAP) systems. All new software design efforts must necessarily take place in an environment where the support of an existing operational system and retaining the ability to incrementally upgrade existing software are always a priority. One of the priorities for CIRA researchers has been to bring the incremental upgrade process under release control, so that personnel can more efficiently and reliably maintain the state of the system. This comes as increasing security requirements demand frequent upgrade of operating systems and software services. CIRA’s contribution has helped such upgrades to become routine and reliable operations. CAP software has been isolated from hub replacement software, and has been placed under revision control. It can be installed onto upgraded systems as needed, but will not be substantially altered until it can be re-engineered to be more compatible with the hub replacement software architecture. Hub replacement software is under automated build and release control, and is where active development is focused. Standardizing software build, release, and installation processes has been challenging because of the unique needs of the profiler group. The software supporting the profiler observation network is a mix of Java, Perl, shell script, and system configuration files that are used on both Linux and Windows platforms. This mixed environment poses special requirements that are best automated so that operators and developers need not keep painstaking track of such details. One by-product of this work has been the generation of a software library that facilitates the development of Perl scripts that run identically on Windows XP and Linux platforms. Research Accomplishments: During the past year, the software release mechanism was completed, and has been used to successfully install obsnet-2E software numerous times. A similar release mechanism has been established for obsnet-3A. With this process in place, it is now possible to know precisely what is installed on all machines. Facility and software tracking systems are up and running successfully. These are customized versions of a commercial PHP-based tool (FogBugz). This tool consolidates and makes readily available all information regarding current, planned, and historical tasks, problems, and incidents. I have participated in design discussions related to the new 3A version of obsnet software. It uses a new product-based design, in which all data flows through the system within standardized product packages, allowing the message-based system to be comprised of highly modular components that receive and generate products. I completed the transport system design. The product design itself has been completed and partially documented.
228
I am responsible for keeping much of our web documentation related to software development practices and development tools up-to-date. I established a new style for our intranet web pages, and a form of organization that allows rapid access to all kinds of information. We are making the web our primary source of all types of documentation. A converter process to convert historical NCDC data from Netcdf format to the current Bufr format has been implemented and tested. This seemingly straightforward task has been complicated by the following factors:
Inconsistencies in software design between code that reads data from Netcdf files and code that writes data to Bufr files.
Sloppy configuration management (circa 2001) caused loss of the source code for the version of software being used to read Netcdf files. Interfaces to this code had to be deduced from later versions of the code.
The code used to write data into Bufr files was in the midst of change. Problems in the Bufr generation code, usually relating to the handling of missing
data, were found and corrected. None of the code was well documented.
In spite of these difficulties, the conversion software was written and tested. Numerous changes to available testing and data dumping capabilities were needed to allow comparison utilities (primarily diff) to compare generated Bufr output with that currently generated in production to create daily BUFR files directly from hub data. Prior to this time, there was heavy reliance on visual inspection of data, rather than comprehensive (automated) comparison. The more thorough approach brought to light some significant discrepancies in moment, rass, and surface data files (both Netcdf and BUFR), all of which are less visible to customers than wind data. Nearly all of these discrepancies have been eliminated in the code that generates daily BUFR files from XDX data files. Tracking down the source of the Netcdf file problems has been, in itself, a non-trivial process, given the following constraints:
The code that writes Netcdf files is a completely different version of software than that which is being used to read Netcdf files.
The author of this software has left the group, and the code is scantily documented.
The major problem is sporadic, and was not revealed through code inspection. The associated test infrastructure was designed only for use within the
production environment itself, and was considered to be too risky to use, given the limited knowledge the team now has of this subsystem.

229
VII. Research Collaborations with the Systems Development Division Project Title: 2D Display (D2D) Development and AWIPS Support Principal Researchers: Jim Ramer and Jim Fluke NOAA Project Goal/Program: Activities associated with AWIPS directly address NOAA Goal to Serve Society's Needs for Weather and Water Information and Support the Local Forecasts and Warnings Program. Key Words: 2D workstation visualization Summary of Objectives and Accomplishments: CIRA proposed continued research collaboration to investigate, design, develop and test advanced meteorological workstation display software. The emphasis within SDD is on the exploratory development of new user interface and data rendering aspects of meteorological workstations. The D2D display software and associated data storage software has become the central visualization component of the NWS AWIPS system. CIRA, collaborating with SDD, proposed to continue to augment this software base with novel data sources and visualization approaches. In some cases, these new capabilities have been driven by new requirements arising from the adaptation of AWIPS by organizations other than the NWS. For example, CIRA researchers have helped customize AWIPS for the RSA project to meet weather forecast requirements at the Vandenberg AFB and Cape Canaveral space launch facilities. The major new capabilities added to RSA last year resulted from merging the changes for AWIPS Operational Builds 2, 3 and 4 into the RSA baseline. Also, progress was made on merging the RSA changes into the AWIPS baseline so that RSA simply becomes part of AWIPS, with the goal that any future RSA changes would be AWIPS changes. This will provide useful RSA features to AWIPS users, and will keep RSA much more up to date. The WFO-Advanced workstation software is the core of AWIPS display capabilities, as well as the display-generating engine behind the FX-Net and FX-Connect workstations. CIRA researchers continued to extend and maintain the WFO-Advanced workstation capabilities, mainly in conjunction with AWIPS and ALPS (AWIPS Linux Prototype System) projects.
The successful implementation of Valid Time Event Codes (VTEC) in warning and advisory products for severe weather and flooding continues to be one of the most important near-term goals of the NWS. During FY04/05, CIRA researchers helped the NWS successfully implement VTEC for severe convective warnings and some marine warnings. During FY05/06, CIRA researchers will aid in the implementation of VTEC in many hydrologic (flood) warnings and advisories. Upgrading and maintaining the

230
VTEC’s capability within AWIPS continues to require substantial changes both to AWIPS warning generation software and the text workstation component of AWIPS. CIRA also continued to provide routine software maintenance support and bug-fixes to the AWIPS software, as well as software configuration management support for local developers working on AWIPS. This includes: keeping the local FSL AWIPS baselines in sync with the official baseline maintained by Northrop Grumman Information Systems; creating new local baselines when needed for AWIPS, RSA and ALPS; and keeping the RSA and ALPS baselines up to date by merging any needed AWIPS changes into them.
The AWIPS Linux Prototype System (ALPS) development effort began during FY04/05 exploring how the AWIPS system can be redesigned to support the longer term needs of the NWS and possibly other NOAA agencies. The focus this past year has been on distributed data and on an improved interface for user developed applications. The distributed data effort so far has been mostly exploratory. However, there has already been a great deal of prototype work done on the new applications interface, and this continues apace with the goal of having a usable first capability early next fiscal year.

231
FUNDS FOR THE COOPERATIVE INSTITUTE FOR RESEARCH IN THE ATMOSPHERE Principal Investigators: T. Vonder Haar NOAA Project Goal: Various Key Words: 1. Long-term Research Objectives and Specific Plans to Achieve Them: 2. Research Accomplishments/Highlights: 3. Comparison of Objectives Vs. Actual Accomplishments for Reporting Period: 4. Leveraging/Payoff: 5. Research Linkages/Partnerships/Collaborators, Communications and Networking: 6. Awards/Honors: 7. Outreach: CIRA conducted various tours for corporations and local public and private schools. Seminars July 27, 2004, E. Raschke (Univ. of Hamburg). Radiation Budget of the Atmosphere from ISCCP Products. August 5, 2004, E. Raschke (Univ. of Hamburg). Climate and Society. August 19, 2004, B. Johnson (ERDC). Watershed Water Quality and Contaminant Development Activities Ongoing at the Environmental Laboratory ERDC. September 2, 2004, H.V. Storch (GKSS, Germany). The Utility of Long-Term Reconstruction with Regional Climate Models. September 16, 2004, H. Rolston III (CSU). Using Water Naturally. September 28, 2004, M. Rodriguez (Univ. of CA, Irvine). Air Pollution Simulation Modeling: Global and Urban Scale Issues. September 30, 2004, B. Cotton. Aerosols, Clouds, and Precipitation. October 4, 2004, J. Staehelin (ETH, Zurich). The Puzzle of Long-Term Tropospheric Ozone Trends – a Phenomenological Analysis.
232
October 8, 2004, G. Campbell. The Space Elevator. October 13, 2004, A. Majda (NY Univ.). A New Multi-Scale Model for the Madden-Julian Oscillation. October 14, 2004, D. Chelton (Oregon State Univ.). The Influence of Sea Surface Temperature on Surface Wind Fields in the ECMWF and NCEP Models. October 20, 2004, C. Johnson (NCAR). Information Content of Observations in 4D-Var. October 21, 2004, J. Weiss (Univ. of CO). Vortex Dynamics in Geophysical Turbulence. October 27, 2004, H. Miura (Japan). Development of a Global Cloud Resolving Model on a Spherical Hexagonal-Pentagonal Geodesic Grid. October 28, 2004, B. Mapes (NOAA). Mesoscale Wind Divergence Profiles in Tropical Convection. November 2, 2004, G. Stephens. On the Retrieval of Cloud and Precipitation Properties from Space. November 4, 2004, J. Kuettner (NCAR). How the Lee Wave Was Discovered (and other Scientific Gliding Adventures). November 10, 2004, L. Uccellini (NCEP). NCEP Update. November 18, 2004, T. Zhang (NSIDC/CIRES). Inferring Climatic Change Signals from Geothermal Gradients: Promises and Problems. November 30, 2004, J. Purdom. Applications and Implications of the Next Generation Meteorological Satellite Imagers and Sounders. December 2, 2004, A.R. Albayrak (CSU). Sigma Point Filters. December 7, 2004, T. Strawa (NASA). Aerosols in the Looking Glass. December 9, 2004, T. Vukicevic. From Information to Knowledge: Data Assimilation in Atmospheric Sciences. December 14, 2004, C. Davis (NCAR). How Does Vertical Wind Shear Affect Hurricane Formation? December 15, 2004, R. Leffler. Going … Going … Gone? Earth’s Melting Tropical Glaciers.

233
January 20, 2005, B. Schichtel. Cause of Haze at Big Bend National Park, Texas – Results from the BRAVO Study. January 27, 2005, B. Conzemius (CSU). The Dynamics of Sheared Convective Boundary layer Entrainment as Reproduced by Large Eddy Simulations. February 10, 2005, J. Alexander (CRA, Boulder). The Gravity Wave Response to Observed Fine-Scale Latent Heating Structure. February 15, 2005, Z. J. Luo. Characterization of the Upper-Tropospheric Temperature, Moisture, and Cloud Biases of a Global Climate Model Using Satellite Observations. February 17, 2005, D. Neelin (UCLA). Pathways of Tropical Rainfall Impacts by Teleconnections, Greenhouse Gases and Aerosols. February 22, 2005, R. Morss (NCAR). Meteorological Observations for Science and Society: An Interdisciplinary Approach to Observing Network Design. February 24, 2005, D. Whitley (CSU). The Temperature Inverse Problem, Optimization, and No Free Lunch. March 3, 2005, V. Larson (Univ. of WI, Milwaukee). Some Thoughts on Cloud Parameterization. March 9, 2005, D. Estep (CSU). Fast and Reliable Methods for Determining the Evolution of Uncertain Parameters in Differential Equations. March 10, 2005, T. Takemura (NASA/GSFC). Simulation of the Climate Response to Aerosol Effects with an Aerosol Transport-Radiation Model. March 24, 2005, R. Wakimoto (UCLA). Understanding the Generation of High Winds Associated With Bow Echoes. March 25, 2005, L. Grasso. Synthetic GOESR-ABI/HES Imagery. March 31, 2005, R. Salmon (Scripps). A General Method for Conserving Quantities Related to Potential Vorticity in Numerical Models. April 5, 2005, G. Dittberner (NOAA/NESDIS/OSD). Advanced Technologies for Future Environmental Satellite Systems. April 7, 2005, C. Williams (NOAA/ETL). Radar Profilers Used in Multi-Sensor Hydraulic Campaigns. April 11, 2005, P. Naughtin (Australia). Australia and Related Topics.

234
April 14, 2005, J. Peel (CSU). The Health Effects of Ambient Air Pollution: An Epidemiologic Perspective. April 21, 2005, G. Rottman (CU). Solar Radiation and its Effect on our Atmosphere and Climate. April 25, 2005, A. Powell, Jr. (NOAA/NESDIS/ORA). In Search of the Sun-Earth Connection. May 5, 2005, A. Arakawa (UCLA). From Cyclone-Resolving to Cloud-Resolving GCMs: A Historical Prospective. May 24, 2005, M. Zupanski. The Maximum Likelihood Ensemble Filter (MLEF). May 24, 2005, M. Kim (NASA GSFC/GEST). Microwave Remote Sensing of Snowfall. May 26, 2005, A. Comrie (Univ. of AZ). Meteorogically Adjusted Urban Air Quality Trends in the Southwestern United States. June 8, 2005, J. Steppeler (GWS, Germany). Numerical Developments for the Nonhydrostatic Model LM. June 8, 2005, D. Mitchell (DRI, Nevada). Radiative Transfer Methods in a Cloudy Atmosphere. June 20, 2005, W. Frank (Penn State Univ.). Tropical Waves and Cyclogenesis. June 23, 2005, B. Ruston (NRL). A 1DVAR Preprocessor for Assimilation of Infrared and Microwave Window Channels Over Land. June 29, 2005, M. Bell (Leeds Univ.). Micro-Modeling of the Dispersion of Automotive Pollutants and Kerbside Exposures. Fellowship Program Zhengzhao “Johnny” Luo – CIRA Post Doc Project Title: Characterizing Upper Tropospheric Temperature, Moisture and Cloud Biases of a Climate Model Using Satellite Observations NOAA Project Goal: Climate. Specifically, Climate Observations and Analysis
Key Words: Climate Model, Satellite Observation, CAM2, HIRS, ISCCP
235
1. Long-term Research Objectives and Specific Plans to Achieve Them:
The long-term goal is to: i) evaluate Global Climate Models (GCMs) using various satellite sensors (e.g. HIRS, MSU, ISCCP, TRMM, and CloudSat), ii) understand model biases, and iii) improve model formulation of moist physics processes. The plan to achieve these goals is to use forward radiative transfer models to simulate satellite observations within GCMs and to carry out model diagnostic studies.
2. Research Accomplishments/Highlights:
NCAR GCM CAM2 has been evaluated against HIRS and ISCCP through satellite simulators. Some model biases are identified. Furthermore, the model energy and water budgets are studied to understand possible sources of the biases.
Accomplishments/highlights include: a) A paper in collaboration with Prof. Graeme Stephens is being prepared. b) NCAR invited me to the NCAR CCSM workshop (July 2004) to present my research results under their funding. Moreover, NCAR Climate Modeling Section showed genuine interest in collaborating with us. c) GEWEX 5th International Scientific Conference (June 2005) invited me to give a talk on this study.
3. Comparison of Objectives Vs. Actual Accomplishments for Reporting Period:
The short-term objective (i.e. comparing the NCAR GCM with HIRS and ISCCP observations) has been achieved. Long-term objectives, such as model bias source identification and model diagnostics, are still under way.
4. Leveraging/Payoff:
Global Climate Model (GCM) is practically the only tool to comprehensively predict and understand future climate change. Model evaluation and diagnostics, on the other hand, are important to model improvement. Conventional model evaluation often involves a handful of field campaigns only. Our study systematically explores using satellite sensors to evaluate models and connecting satellite-observed quantities to model formulations.
5. Research Linkages/Partnerships/Collaborators, Communications and Networking:
Collaboration has been under way with Prof. Graeme Stephens at the Atmospheric Science Department of CSU. Dr. Phil Rasch from NCAR also expressed his interest in working with us on model evaluation and diagnostic studies.
6. Awards/Honors: None as yet
7. Outreach:
a) Was invited by NCAR to present my results at the Community Climate Modeling System (CCSM) workshop at Santa Fe, July 2004.

236
b) Was invited by the GEWEX to give a talk at the 5th International Scientific Conference at Costa Mesa, CA June 2005.
8. Publications:
Luo, Z. and G. L. Stephens (2005): Characterizing Upper Tropospheric Temperature, Moisture and Cloud Biases of a Climate Model Using Satellite Observations. In proceedings of the GEWEX 5th International Scientific Conference, Costa Mesa CA June 20 -24, 2005.
Philip Stephens – CIRA Post Doc Project Title: Backus—Gilbert Spatial Filter Principal Investigator: Tom Vonder Haar
NOAA Project Goal: Supporting NOAA’s Mission Program: Satellite Services Key Words: Backus—Gilbert, Remote Sensing
1. Long Term Research Goals: 2. Research Accomplishments/Highlights: I have implemented a Backus—Gilbert method which can be applied to any sensor when the appropriate antenna pattern function is supplied. I have also analyzed in detail the Backus—Gilbert method and its variants and clarified the understanding of many of its features. 3. Comparison of Objectives Vs. Actual Accomplishments for Reporting Period: The objective of this year was to implement the Backus—Gilbert method for the WindSat satellite. This has been done and at the same time the understanding of the method and its variants has been extended and improved. Also, I have contributed to quantifying the AMSU-B sensor antenna pattern correction and a general study of the geometric variation a satellite’s orbit has on the antenna pattern footprint. 4. Leverage/Payoff: My research will help improve the data which is given to models. This, in turn, will allow modelers to produce better results and allow them to get a better hold on where the

237
shortcomings of their models lie. This new approach is also a much more cost effective spatial filter implementation that reduces the amount of software customization required. 5. Research Linkages/Partnerships/Collaborators, Communication and Networking: My research was part of a larger project which is jointly funded by the DoD Center for Geosciences/Atmospheric Research under a Cooperative Agreement with the Army Research Laboratory. Also, the NPOESS Inter Governmental Studies Program has jointly funded the projects. 6. Awards/Honors: 7. Outreach: 8. Publications: Stephens, P.J. and Jones, A.S., “Bounds on the Variance in the Pattern Matching Criteria”, submitted to IEEE Trans. Geo. Rem. Sens. Stephens, P.J. and Jones, A.S., “Geometrical Variations of Gain Patterns”, to be submitted to IEEE Trans. Geo. Rem. Sens . Stephens, P.J. and Jones, A.S., “Application of a Discrete Backus—Gilbert Spatial Filter”, to be submitted to J. Atmos. and Oceanic Technol. Nielson, M., Stephens, P.J., Jones, A.S, Forsythe, J., Kessler R., and Vonder Haar, T., “Impact of AMSU-B Antenna Pattern Corrections on Physical Profile Retrieval Methods”, submitted to J. Atmos. and Oceanic Technol. ________ 8. Funds for CIRA Publications: Vonder Haar, T.H. , 2005. Annual Report on the Cooperative Institute for Research in the Atmosphere, 01 July 2004 – 30 June 2005, Cooperative Institute for Research in the Atmosphere, Colorado State University, Ft. Collins, CO.

238

239
GETTING READY FOR NOAA’S ADVANCED REMOTE SENSING PROGRAMS: A SATELLITE HYDRO-METEOROLOGY (SHyMet) TRAINING AND EDUCATION PROPOSAL Principal Investigator: B.H. Connell NOAA Project Goal: Weather and Water Key Words: training, outreach, collaboration 1. Long-term Research Objectives and Specific Plans to Achieve Them: The overall objective of the SHyMet program is to develop and deliver a comprehensive distance-learning course on satellite hydrology and meteorology. This will be done with close collaboration with experts from CIRA, the Cooperative Institute for Meteorological Satellite Studies (CIMSS) at the University of Wisconsin, Madison, the Cooperative Program for Operational Meteorology, Education and Training (COMET) in Boulder, Colorado, the National Weather Service (NWS) Training Center (NWSTC) in Kansas City, Missouri, and the NWS Warning Decision Training Branch (WDTB) in Norman, Oklahoma. The challenge is to provide necessary background information to cover the many aspects of current image and product use and interpretation as well as evaluate data and products available from new satellite technologies and provide new training on the these tools to be used operationally. The (SHyMet) Course will cover the necessary basics of remote sensing, satellite instrumentation, orbits, calibration, and navigation, and will heavily focus on identification of atmospheric and surface phenomena, and the integration of meteorological analysis with satellite observations and products into the weather forecasting and warning process. The course will primarily be delivered through a combination of teletraining, CD-ROM, and web-based instruction. If funding is available, all participants who have successfully completed the distance part of the course will attend a 3.5-day SHyMet Workshop offered at the COMET Classroom in Boulder, Colorado. Plans to achieve research objectives:
Develop course outline Inventory existing training materials and assess relevency to course outline. Develop detailed outlines for proposed topics and identify learning and
assessment activities. Develop weather event simulator cases to support training materials Organize course material for beginner and advanced training track Within the Learning Management System (LMS), set up a learning path to track
the various levels of the course, and set up pre and post course testing to track the progress of the participants throughout the course.
Deliver various levels of the course.

240
2. Research Accomplishments/Highlights: During the first year activities, CIRA and CIMSS prepared an outline of the Satellite Hydro-Meteorology (SHyMet) training course. An inventory of existing tutorial materials and potential resources for the course were also completed. During the second year activities, the outline went through revisions to reflect feedback from the Science and Operations Officers of various National Weather Service offices. (http://rammb.cira.colostate.edu/training/shymet/) Other activities during the second year included: reviewing the inventory of existing tutorial materials for the new course; draft of a Basics of Remote Sensing Lecture which pulls basic pertinent information from the existing training materials into a 1-hour lecture, and participation at a ShyMet meeting hosted by the University of Wisconsin in September 2004. In both years, existing training materials were used or adapted for outreach efforts and collaborative training efforts. 3. Comparison of Objectives Vs. Actual Accomplishments for Reporting Period: For the specific plans mentioned above, the first year activities including the first two bullets and have been completed. Feedback from the customer and reassessment of funding related to the implemantation of the course led to additional course planning during the second year (related to bullet 1). Further review of course material during the second year led to the systhesis of materials for a draft version of Basics of Remote Sensing. Feedback from the customer has shifted the focus from completing a weather events simulator case for use at the in-house training at COMET to short examples of satellite images and products that highlight their use. As time/funding permits, the weather events simulator case will be revisited. Bullets 5, 6, and 7 are being addressed in the current (third) year. 4. Leveraging/Payoff: The training materials being developed will help the user (the weather forecaster) better utilize current satellite products that are available. This will in turn lead to better weather forecasts for the public. 5. Research Linkages/Partnerships/Collaborators, Communications and Networking: Other groups within NOAA, for example the Satellite Applications Branch, and other government and international organizations have expressed a strong interest in the proposed training. The Department of Defense (DOD) has expressed interest in incorporating this satellite training course into their programs. Because of CIRA's, VISIT's and COMET's close links with the World Meteorological Organization (WMO),

241
the training courses will be included in the WMO’s Virtual Laboratory for Education and Training in Satellite Meteorology. This interest indicates that the training research and development activities at CIRA have wide-ranging applications. 6. Awards.Honors: None as yet 7. Outreach: (a) Graduate/Undergraduate students (List by name, degree status and continuance after obtaining degree); (a) None (b) Seminars, symposiums, classes, educational programs: B.H. Connell and J.A. Knaff, May 10, 2005: CIRA Supervisors & Project Leaders Meeting at the Tamasag Conference Center in Ft. Collins, CO. A poster on training activities associated with VISIT/SHyMet was displayed. D.W. Hillger, April 19, 2005: Judged posters at the CSU Celebrate Undergraduate Research and Creativity (CURC) Poster Event. Fort Collins, CO. V. Castro, B.H. Connell, J.F.W. Purdom, and others, March 7-18, 2005: Regional Training Course on the Use of Environmental Satellite Data in Meteorological Applications for RA III and RA IV. San Jose, Costa Rica. D.W. Hillger, December 8, 2005: NOAA’s GOES Program: Past, Present, and Future. Fifth Canadian/COMET Winter Weather Workshop, Boulder, CO. B.H. Connell, November 8, 2004: GOES and the characteristics of its channels. Remote Sensing class at the Metropolitan State College of Denver, Denver, CO. CIRA has participated in monthly VISITview weather briefings using GOES satellite imagery (http://hadar.cira.colostate.edu/vview/vmrmtcrso.html) and voice via Yahoo messenger between the US and RA III and RA IV countries. Each session lasts about 60 minutes. VISIT sessions are proving to be a very powerful training tool. People learn how to use new products in real time situations with appropriate guidance. (c) None (d) J.F. Weaver, March 7, 2005: My Career in Meteorology and How I Got There. PaCE (Professional and Career Experience) program. Fort Collins, CO. (e) None J.F. Weaver, October 6, 2004: The variety and scope of research taking place at CSU. Series for local business owners. Fort Collins, CO. 8. Publications: None as yet

242
243
GLOBAL MICROWAVE SURFACE EMISSIVITY ERROR ANALYSIS Principal Investigator: A. Jones NOAA Project Goal: Weather and Water NOAA Related Programs: Local Forecasts and Warnings, Environmental Modeling, Weather Water Science, Technology, and Infusion Program 1. Long-term Research Objectives and Specific Plans to Achieve Them: The NESDIS Microwave Land Emissivity Model (MEM) is used as an important radiative boundary condition for 3D satellite data assimilation within the NCEP Global Data Assimilation System (GDAS). The purpose of this project is to develop advanced techniques to validate the MEM using satellite data sources and other ancillary data sets such as water vapor profiles and land surface temperature fields, and to create new general procedures for analysis of the (observational versus model) innovation vector errors. The work is funded by the Joint Center for Satellite Data Assimilation (JCSDA). Approach: The observational emissivity method is a 1D variational (1DVAR) algorithm where the emissivities are grouped into retrieved “bands.” The emissivities are constrained by assumed covariance errors that will be incrementally updated as the analysis continues and matures. Coincident MEM model output is then intercompared with the direct 1DVAR emissivity retrievals to validate the MEM results. The following project goals have been met:
Improve atmospheric profiling capabilities (advanced data assimilation, 1DVAR) Conduct needed error analysis work related to the MEM versus independent
observations Generalize the error characterization approach to future Observational Operator
(OO) and Data Assimilation (DA) needs Improve understanding of existing MEMs
2. Research Accomplishments / Highlights:
1. This work created and validated an AMSU-B Antenna Pattern Correction module that results in 10-15% bias improvements to AMSU-B upper-water vapor profiles. A draft journal manuscript has been created (Nielsen et al., 2005).
2. A robust near-real-time 1DVAR global emissivity retrieval system suitable for transition to operations was created using the DPEAS grid computing framework.
3. MEM intercomparisons to 1DVAR emissivity retrievals indicate several regions needing future MEM improvement (particularly desert and coastal regions). Differences can be large locally.

244
4. Collaborations with several JCSDA participants continue, especially with Dr. Ben Ruston (NRL) Monterey, CA on the JCSDA project “Assimilation of Passive Microwave Radiances over Land: Use of JCSDA Common Microwave Emissivity Model (MEM) in Complex Terrain Regions.”
5. Publication of project results continues (Jones et al., 2005a; Nielsen et al., 2005; Forsythe et al., 2004; Jones et al., 2004; 2005b; 2005c, Nielsen et al., 2004; Shott and Jones, 2005a; 2005b).
Conclusions and Recommendations: This project is part of a larger international scientific effort to perform microwave emissivity model validation and impact studies. We are planning an international workshop next spring in Paris, France. This project has created the first detailed global all-microwave emissivity retrieval capability for use in emissivity validation studies. The creation of this data set was a key objective of the project. Much technical work remains to be performed in terms of the analysis of the results and in performing additional intercomparisons (see Future Work below). We recommend that instantaneous seasonal emissivities be generated and used in a new and more complete global analysis of microwave emissivities in conjunction with ongoing JCSDA emissivity research activities. This work will also improve the quality of other microwave land surface products. Initial JCSDA data assimilation studies by NRL suggest the potential for NWP model forecast improvements using microwave surface emissivities with data assimilation techniques. Future Work and Plans: Future work includes: 1) transition of the AMSU-B Antenna Pattern Correction source code for operational testing, 2) continued emissivity cross-correlation studies and collaborations re: MEM improvements, 3) perform intercomparisons with NRL JCSDA emissivity work. Follow-on activities are planned for an expanded global microwave emissivity validation atlas for seasonal microwave emissivity intercomparisons in collaboration with the NOAA MEM physical scientists (Dr. Weng and Dr. Yan, NESDIS/ORA). 3. Comparison of Objectives vs. Actual Accomplishments for Reporting Period: The project is nearly complete. A new CIRA hire, Mr. Shott, joined the CIRA project team in Jan. 2005. All technical objectives have been met and are on time. However, the joint journal publication with our NESDIS MEM collaborators is roughly 6 months behind schedule. In addition, the scope of the data set analysis was reduced due to computational and storage limitations given current funding levels (more than 1 TB of output data was generated for 2 weeks of global microwave surface emissivity analysis data). The size of the satellite data processing task is quite large. We plan to expand that aspect of the work in the next follow-on phase with our NESDIS collaborators. Data sets were successfully merged and collocated as planned, and an error analysis approach was successfully designed and used. Current results contain a full error matrix as part of the final output emissivity product. That error analysis work was

245
presented at the 3rd JCSDA Workshop on Satellite Data Assimilation. Research into dynamic error covariance estimation approaches is in progress. Initial global microwave emissivity outputs have been transitioned to the NESDIS/ORA staff, and work continues on creating additional and more detailed analyses for JCSDA research activities. Publication of the microwave emissivity methodology and results is in progress (Jones et al., 2005a). 4. Leveraging / Payoff: This work has identified MEM model biases on the order of 5-10% (some locations have even greater biases). This translates to regional radiometric errors on the order of 10-20K. This is a substantial error source than be removed by advanced microwave emissivity analysis work. Future work will involve reducing the source of the NOAA MEM model biases and improving the NWP model performance as a result. As a result, this work will increase the use of global microwave satellite data by 25% (land regions are currently omitted in microwave radiance data assimilation systems). In related work, we are using the new microwave emissivities to perform the first global microwave water vapor retrievals over land. Thus this project’s high quality microwave surface emissivities can extend the atmospheric profiling capabilities of existing microwave satellite sensors. This is an important new research topic within the satellite meteorological community. 5. Research Linkages / Partnerships / Collaborators: This work was funded by the Joint Center for Satellite Data Assimilation (JCSDA). NOAA collaborators include: Dr. Fuzhong Weng, and Dr. Banghua Yan (NESDIS/ORA). NRL collaborators include: Dr. Ben Ruston, and Dr. Nancy Baker (NRL). 6. Awards/Honors: 7. Outreach: 8. Publications This Year: Journal Papers Jones, A. S., P. S. Shott, J. M. Forsythe, C. L. Combs, T. H. Vonder Haar, 2005a: Retrieval of global microwave surface emissivity over land using AMSU, In preparation.
Nielsen, M., P. J. Stephens, A. S. Jones, J. M. Forsythe, R. W. Kessler, T. H. Vonder Haar, 2005: AMSU-B antenna pattern corrections, In preparation.
Technical Reports and Conference Papers Forsythe, J., A. Jones, and T. Vonder Haar, 2004: Development of a global microwave land emissivity retrieval, SPIE Conference, August 2-6, Denver, CO.

246
Jones, A. S., J. M. Forsythe, and T. H. Vonder Haar, 2004: Retrieval of global microwave surface emissivity over land, 13th Conference on Satellite Meteorology and Oceanography, September 20-24, Norfolk, VA.
Jones, A. S., P. C. Shott, J. M. Forsythe, C. L. Combs, R. W. Kessler, M. J. Nielsen, P. J. Stephens, T. H. Vonder Haar, 2005b: Global microwave surface emissivity error analysis, BACIMO 2005, October 12-14, Monterey, CA.
Jones, A., S., J. M. Forsythe, C. L. Combs, and T. H. Vonder Haar, 2005c: Characterization of global microwave surface emissivity over land, 9th Symposium on Integrated Observing and Assimilation Systems for Atmosphere, Oceans, and Land Surface, January 9-13, San Diego, CA, poster P4.8.
Nielsen, M., J. M. Forsythe, A. S. Jones, and T. H. Vonder Haar, 2004: The effect of antenna pattern corrections on AMSU-B radiances, 13th Conference on Satellite Meteorology and Oceanography, September 20-24, Norfolk, VA.
Shott, P. C., and A. S. Jones, 2005a: DPEAS CPE Process Document NOAA-16 AMSU-A Processing, June 2005, 7 pp.
Shott, P. C., and A. S. Jones, 2005b: DPEAS CPE Process Document MEM Processing, June 2005, 8 pp.
Presentations Dr. A. S. Jones, “Global Microwave Surface Emissivity Error Analysis”, 3rd JCSDA Workshop on Satellite Data Assimilation, Camp Springs, MD, Apr. 20-21, 2005.
247
IMPACT OF FUNDAMENTAL ASSUMPTIONS OF PROBABILISTIC DATA Principal Investigator: Milija Zupanski NOAA Project Goal: Weather and Water NOAA Programs: Environmental Modeling, Weather Water Science, Technology, and Infusion
Key Words: Probabilistic assimilation/prediction, Ensemble, Maximum Likelihood Ensemble Filter, Global Forecasting System 1. Long-term Research Objectives and Specific Plans to Achieve Them: The Long-term objective of this research is to explore the possibility for NOAA operational use of an ensemble assimilation/prediction system, by designing a double-resolution system, with a high-resolution model used as a control, and a low-resolution model used in ensemble forecasting. The system will include real observations in the second year of the project. 2. Research Accomplishments/Highlights: During the first year of the project, the efforts were directed toward the development of an interface between the Maximum Likelihood Ensemble Filter (MLEF) and the Global Forecasting System (GFS). Main accomplishments achieved during the first year of the project are:
Work on development of an interface between the MLEF and GFS at resolution T62 is close to completion.
Preliminary experiments are designed such that the NCEP inter-comparison observations from January 1 – February 28, 2004 are used. This will allow a clear-cut comparison with other ensemble methodologies developed to work with GFS.
Model error (bias) and parameter estimation are being included in the system. The MLEF code with capability of using the ensemble mean (instead of the
mode) is developed. 3. Comparison of Objectives Vs. Actual Accomplishments for Reporting Period: The results of this research are directly related to the NOAA goals and plans through the THORPEX Research Program. The personnel working on this project include Milija Zupanski, Arif Albayrak, and Kevin Micke. We work closely with NOAA/NCEP scientists Yucheng Song and Mozheng Wei, as well as with research groups at Univ. of Maryland (Istvan Szunyogh), NOAA/CDC (Tom Hamill, Jeff Whitaker), NRL Monterey (Craig Bishop), and others.

248
The work is conducted on the NOAA/NCEP IBM SP computers, directly employing all required operational codes, thus making the results of this research easily transferable to NOAA operations. Preliminary results of the comparison between the conditional mean and mode using a global shallow-water model are presented at the EGU/THORPEX meeting in Vienna, Austria, in April 2005. [Available at ftp://ftp.cira.colostate.edu/Milija/posters/EGU_Vienna2005.ppt]
249
IMPROVEMENT IN DETERMINISTIC AND PROBABILISTIC TROPICAL CYCLONE SURFACE WIND PREDICITONS Principal Investigator: J.A. Knaff NOAA Project Goal: Weather and Water Key Words: Tropical Cyclones, Hurricanes, Ocean Heat Content, Hurricane Intensity Forecasting, GOES data 1. Long-term Research Objectives and Specific Plans to Achieve Them: This purpose of this project is to develop new methods for improving deterministic and probabilistic surface wind predictions that will be evaluated in an operational setting. This is the second year of a 2-year project, which was funded by NOAA’s Joint Hurricane Testbed (JHT). The deterministic surface wind prediction improvements expand upon previous work with the Statistical Hurricane Intensity Prediction Scheme (SHIPS). A major limitation of SHIPS is that it relies almost entirely on relationships between the storm environment conditions and intensity changes. Research results have shown that internal processes such as eye wall contraction and replacement can also have large impacts on hurricane intensity changes. Since these processes can often be observed in aircraft reconnaissance observations and GOES imagery, a new component to the SHIPS model is being developed and evaluated where aircraft reconnaissance and GOES imagery will be utilized to better determine the inner core structure. Aircraft data are not currently used as SHIPS input, and the GOES 10.7 μm imagery is used in a rudimentary way that involves averages over large areas. The intensity forecast model with the inner core GOES and aircraft data will be a separate component that predicts deviations from the SHIPS prediction, and will be referred to as the GOES and Reconnaissance Intensity Prediction (GRIP) model. To account for nonlinear interactions between possible predictors, a neural network prediction method will be tested in addition to the multiple linear regression method that is currently used by SHIPS. As part of the overall development of statistical tropical cyclone forecasting techniques, a new method for estimating the uncertainty associated with surface wind forecasts is proposed. The wind uncertainty estimate is obtained using a Monte Carlo Probability (MCP) model, where a large set of plausible tracks and intensities are determined by randomly sampling historical forecast error distributions. Special procedures were developed to account for the effects of land, for the serial correlation between the track and intensity forecast errors, and for the relationships between intensity and wind structure. A prototype version of the MCP was developed for the Atlantic basin and provides fields of the probability of the surface wind exceeding specified wind thresholds over specified time intervals. In this proposal, the Atlantic MCP model will be generalized to include the East Pacific, Central Pacific, and West Pacific tropical cyclone basins. The code will also be generalized so that it can run as part of the

250
Automated Tropical Cyclone Forecast (ATCF) system, and generate fields on the NWS National Digital Forecast Database grid system. 2. Research Accomplishments/Highlights: The GRIP model was developed from cases from the 1995-2003 hurricane seasons, and tested on independent cases from the 2004 season. Figure 1 shows an example of the aircraft reconnaissance data that is input to the automated objective analysis system, and the analyzed wind field. Several parameters from the wind field are used for the intensity prediction in combination with parameters from GOES imagery.
Figure 1. Aircraft flight level winds from hurricane Jeanne in storm relative coordinates from 25 September 2004 (left panel) and the objectively analyzed wind speed field (right panel). Two versions of the GRIP model were developed for comparison. One utilized physically-based variables such as the average GOES brightness temperature and radius of maximum wind, and the other used the amplitudes of empirical orthogonal functions (principal components, PCs) of the radial profiles of the GOES and aircraft data. Both were tested on independent cases from the 2004 hurricane season. Figure 2 shows the improvements in the intensity forecasts with these two versions of the GRIP model. The PC model had a negative impact in the short range, but a positive impact at later times. The physical model had a smaller negative impact, but also a smaller positive impact. A model that combines these two types of input is under development and will be tested during the 2005 Atlantic season.

251
Figure 2. The improvement of the GRIP model relative to the SHIPS model for independent cases from the 2004 Atlantic hurricane season. Work is continuing to determine if neural network methods can provide improved prediction. This part of the project is in collaboration with Dr. Charles Anderson from the Colorado State University Computer Science Department, who is an expert on computer learning techniques. A preliminary version of the neural network model was developed, but did not show improvement relative to a simpler linear model. The lack of improvement appeared to be related to over-fitting of the dependent data by the neural network model, and a new version that corrects this problem is currently being tested. Considerable progress was made on the new wind probability estimation technique. Versions were developed for Atlantic and eastern, central and western North Pacific tropical cyclone basins. The code was successfully ported to TPC computing systems, and several experimental products are being generated and distributed in real time for the 2005 hurricane season. Figure 3 shows an example of one of the new probability products from the TPC web site that was available in real time in 2005.
-8
-6
-4
-2
0
2
4
6
12 24 36 48 60 72 84 96 108 120
Forecast Interval (hr)
Perc
ent I
mpr
ovem
ent
Physical Input
Principal Component Input
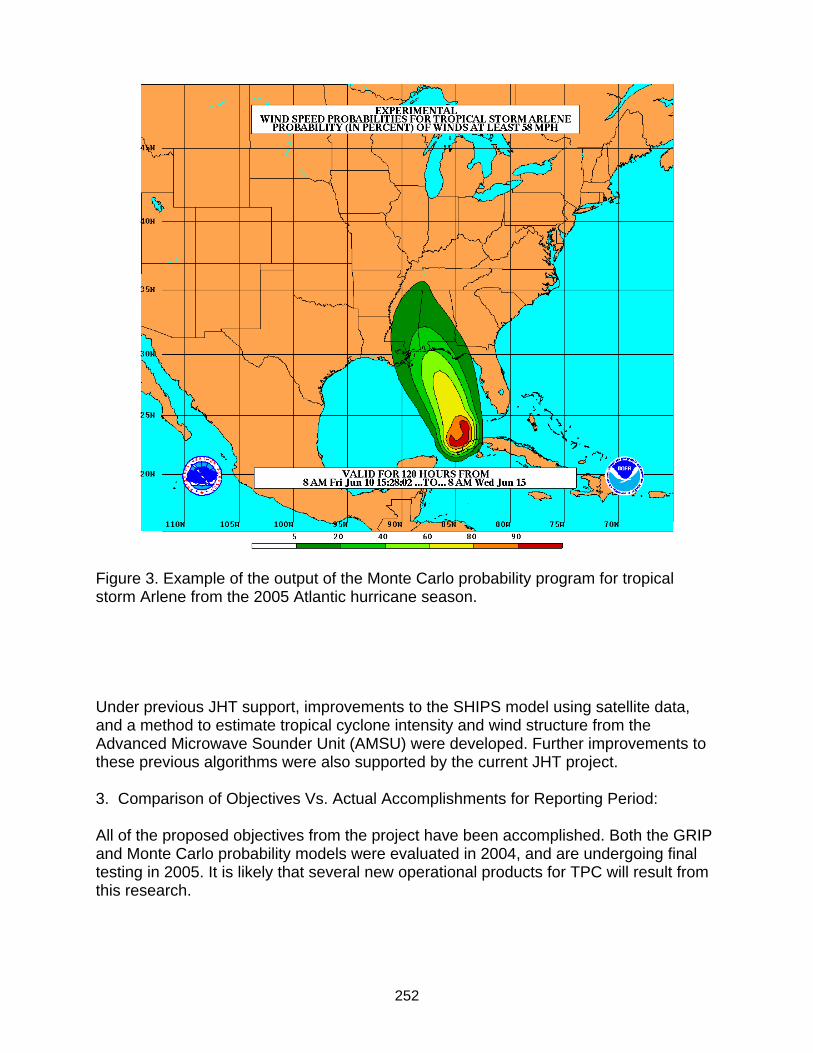
252
Figure 3. Example of the output of the Monte Carlo probability program for tropical storm Arlene from the 2005 Atlantic hurricane season. Under previous JHT support, improvements to the SHIPS model using satellite data, and a method to estimate tropical cyclone intensity and wind structure from the Advanced Microwave Sounder Unit (AMSU) were developed. Further improvements to these previous algorithms were also supported by the current JHT project. 3. Comparison of Objectives Vs. Actual Accomplishments for Reporting Period: All of the proposed objectives from the project have been accomplished. Both the GRIP and Monte Carlo probability models were evaluated in 2004, and are undergoing final testing in 2005. It is likely that several new operational products for TPC will result from this research.

253
4. Leveraging/Payoff: This project has a direct connection with the public interest. Coastal evacuations and other preparations for tropical cyclones are extremely expensive. The improved intensity forecasts should help to narrow down the regions that require coastal evacuations because the size of these regions are proportional to the forecasted intensity, but are increased to account for intensity forecast uncertainty. The new probability program will provide a quantitative measure of the risk of various wind thresholds, and will likely lead to a number of new operational products that will be distributed to the public. 5. Research Linkages/Partnerships/Collaborators, Communications and Networking: This research is a joint effort among several groups within NOAA and the university community, including the NOAA/NESDIS Office of Research and Applications, the NOAA/NCEP TPC, the NOAA/OAR Hurricane Research Division, Colorado State University and the Unversity of Miami. 6. Awards/Honors: None as yet 7. Outreach: (a) Graduate/Undergraduate students (List by name, degree status and continuance after obtaining degree); (b) Seminars, symposiums, classes, educational programs; (c) Fellowship programs; (d) K-12 outreach; (e) Public awareness. (a) Kimberly Mueller received her Master’s Degree in the Department of Atmospheric Science at Colorado State University. As part of her thesis work, she helped to develop the variational objective analysis system and assembled the aircraft database for the project. Several student hourly employees also contributed to the database development used in this research project. (b) See Section 8 below (c) None (d) Simplified versions of the difficulties of hurricane intensity forecasting have been included in talks given to K-12 students. (e) As part of this project, input on non-technical training was provided to the Tropical Prediction Center to be used as part of their public outreach program, as new operational products are developed from the Monte Carlo probability model. This training is now included on the Tropical Prediction Center web page as part of the description of the new probability products (see www.nhc.noaa.gov ).

254
8. Publications: Refereed Journal Articles Knaff, J.A., S.A. Seseske, M. DeMaria, J.L. Demuth, 2004: On the Influences of Vertical Wind Shear on Symmetric Tropical Cyclone Structure Derived from AMSU. Mon. Wea. Rev., 132, 2503-2510. DeMaria, M., M. Mainelli, L.K. Shay, J.A. Knaff, and J. Kaplan, 2005: Further Improvements to the Statistical Hurricane Intensity Prediction Scheme (SHIPS), Weather and Forecasting, in press. Newsletters DeMaria, M., J.A. Knaff, J. Demuth, R.M. Zehr, and J.F. Dostalek, 2005: CIRA contributions to the Joint Hurricane Testbed. CIRA Magazine, 23, Spring, 5-7. Presentations Knaff, J.A., M. DeMaria, R.M. Zehr, and K.J. Mueller, 2005: Development of a Multi-platform Satellite Tropical Cyclone Wind Analysis System. 59th Interdepartmental Hurricane Conference, 7-11 March, Jacksonville, FL.
Mainelli, M., M. DeMaria, and L. Shay, 2005: Results from the Incorporation of Ocean Heat Content and GOES Data in the Operational Ships Model During the 2004 Hurricane Season. 59th Interdepartmental Hurricane Conference, 7-11 March, Jacksonville, FL.
DeMaria, M., J.A. Knaff, K.J. Mueller and R.M. Zehr: Improvements in Deterministic and Probabilistic Tropical Cyclone Wind Predictions: A Joint Hurricane Testbed Project Update. 59th Interdepartmental Hurricane Conference, 7-11 March, Jacksonville, FL. M. DeMaria, April 20, 2005: Tropical cyclone applications of satellite observations. CSU Satellite Meteorology class, Fort Collins, CO. M. DeMaria, May 2, 2005: Updates to the SHIPS, AMSU and Monte Carlo Wind Probability Algorithms for 2005. Training presentation at the Tropical Prediction Center, Miami, FL. Workshops J.A. Knaff, February 14, 2005: Potential for improving tropical cyclone wind speed probabilities. Department of Defense Tropical Cyclone Workshop, Honolulu, HI.

255
INTERACTIONS OF THE MONSOON AND ANTICYCLONES IN THE COUPLED ATMOSPHERE-OCEAN SYSTEM Investigators: David A. Randall (PI), Todd Ringler NOAA Project Goal: Key Words:
1. Long-term Research Objectives and Specific Plans to Achieve Them: The goal of our PACS project is to reduce uncertainty in models that predict climate change by better representing the processes that affect cloud feedbacks.
2. Research Accomplishments/Highlights: The mixed-layer approach to modeling the planetary boundary layer (PBL) is particularly well suited to inversion-topped PBLs, such as the stratocumulus-topped boundary layer found off the continental American coasts in the subtropical Pacific ocean. However, a strong temperature inversion near 850 hPa (the trade-wind inversion) is not confined to the stratocumulus regimes, but has been observed over most parts of the subtropical-tropical Pacific ocean. Over the past year, we have tested a simple mixed-layer model’s (MLM) ability to diagnose PBL depth, entrainment velocity and cumulus mass flux velocity from monthly mean re-analysis data (both from the National Centers for Environmental Prediction (NCEP) and the European Center for Medium-Range Weather Forecasts (ERA-40)). Part of this test involved a comparison between the Colorado State University’s General Circulation Model (CSU GCM) and the MLM run with input data from the CSU GCM. The results were also compared to some available observations (soundings from the East Pacific Investigation of Climate). The MLM succeeds in diagnosing positive PBL depths and entrainment velocities on the order of hundreds of meters and mm s-1, respectively (Fig. 1). Convective regions are marked by deep PBLs in the MLM’s output, and entrainment is generally large where the PBL is deep. The cumulus mass flux velocity is large in the convective areas and small in the stable regions (Fig. 2). Comparison with the CSU GCM shows that neglecting temporal covariances, as is done in the MLM, changes the diagnosed PBL depth by several hundred meters (Fig. 3). However, the temporal covariances in the GCM are significantly larger than in the re-analysis data (a weakness of the GCM), and the effect of the covariances on the PBL depth is much smaller when the MLM is run with the re-analysis data. Observations with similar spatial and temporal coverage as the model output are as yet unavailable. However, the PBL depth can be estimated from available soundings in the stable regions of the domain by locating the height of the temperature inversion. The MLM’s PBL is shallow compared to the inversion base height from EPIC soundings, particularly over the cold tongue. The MLM’s PBL depth does mimic the general

256
behavior of the observed inversion, though, whose base is low over the cold tongue and lifts toward the north until the inversion disappears in the convection associated with the intertropical convergence zone (ITCZ). There is a conflict between the MLM’s PBL depth and the picture of the PBL depth obtained from other models (CSU GCM, ERA-40), where the PBL is shallowest in the convective areas and deep in the stable areas of the domain. In contrast, the MLM’s PBL depth is deepest (unreasonably so) in the deep-convective areas. The difference in the MLM results from the NCEP and ERA-40 re-analyses is quite remarkable. The runs with ERA-40 data provide a much better output. In particular, the cumulus mass flux velocity, a rather elusive quantity, appears to be reasonably well diagnosed and marks the areas of deep convection clearly with large velocities.
Fig. 1: PBL depth diagnosed by the MLM from ERA-40 monthly mean re-analysis data for October 2001. White areas indicate above-scale values.
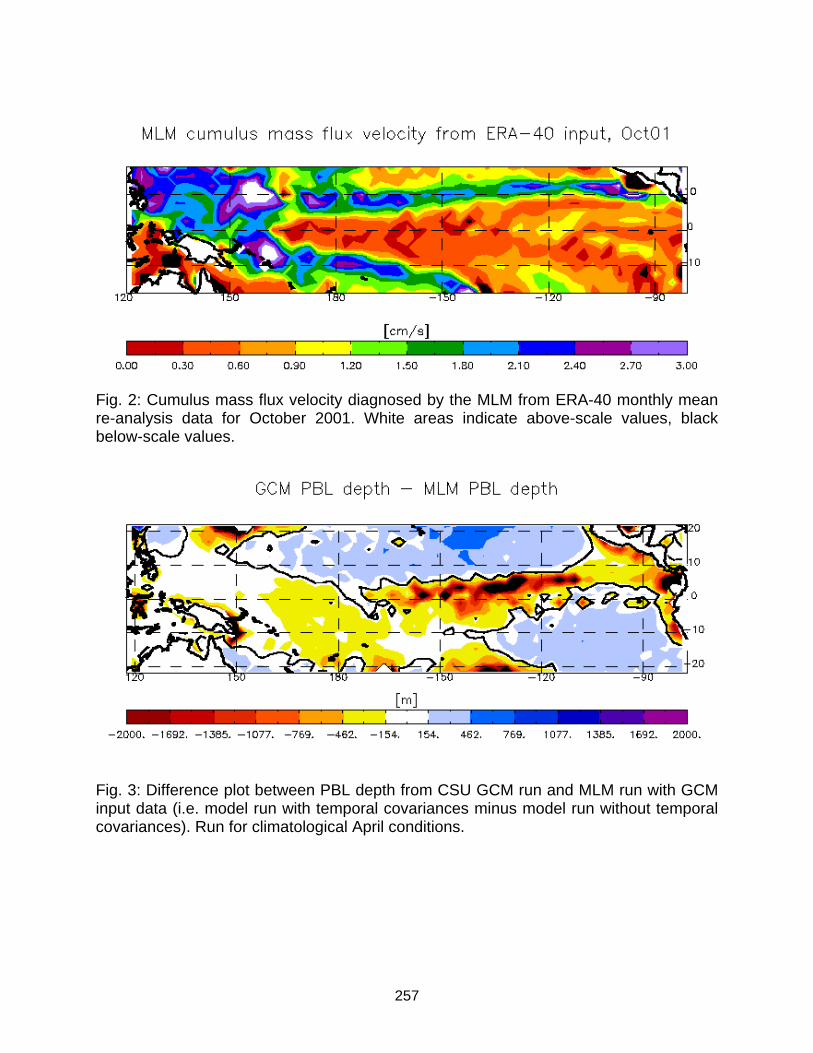
257
Fig. 2: Cumulus mass flux velocity diagnosed by the MLM from ERA-40 monthly mean re-analysis data for October 2001. White areas indicate above-scale values, black below-scale values.
Fig. 3: Difference plot between PBL depth from CSU GCM run and MLM run with GCM input data (i.e. model run with temporal covariances minus model run without temporal covariances). Run for climatological April conditions.
258
3. Comparison of Objectives Vs. Actual Accomplishments for Reporting Period: The work reported above deals with PBL and cloud processes over the Pacific, which is what we proposed to work on. 4. Leveraging/Payoff: Our research will lead to more accurate weather forecasts and predictions of climate change. 5. Research Linkages/Partnerships: We have been collaborating with Martin Kohler and Anton Beljaars of the European Centre for Medium Range Weather Forecasts. 6. Awards/Honors: David Randall received CSU’s Scholarship Impact Award for 2005. 7. Outreach: Maike Ahlgrimm, M.S. level GRA, received M.S Degree in 2004, is continuing her pursuit of a Ph.D. under my direction. 8. Publications: Ahlgrimm, M., 2004: M. S. thesis, Colorado State University. Ahlgrimm, M., and D. A. Randall, 2005: Diagnosing monthly mean boundary-layer properties from re-analysis data using a bulk boundary-layer model. J. Atmos. Sci. (in press). DeMott, C., D. A. Randall, and M. Khairoutdinov, 2006: In preparation for J. Atmos. Sci. Khairoutdinov, M., and D. A. Randall, 2006: A high-resolution simulation of TRMM-LBA. In preparation for J. Atmos. Sci. Randall, D. A., and W. H. Schubert, 2005: Dreams of a stratocumulus sleeper. In Atmospheric Turbulence and Mesoscale Meteorology, Cambridge University Press. Yamaguchi, T., 2005: Entraining cloud-topped boundary layers. M.S. Thesis, Colorado State University. Yamaguchi, T., and D. A. Randall, 2006: Large-eddy simulation of evaporatively driven entrainment into cloud-topped mixed layers. In preparation for J. Atmos. Sci.

259
INTERNATIONAL SATELLITE CLOUD CLIMATOLOGY PROJECT SECTOR PROCESSING AND ANALYSIS Principal Investigators: G. Garrett Campbell and T.H. Vonder Haar NOAA Project Goal: Climate Observations Key Words: Climate, Observations, Cloud 1. Long-term Research Objectives and Specific Plans to Achieve Them:
The International Satellite Cloud Climatology Project collects and processes operational satellite data to establish a climatology of observations of cloudiness and cloud properties (Figure 1 shows a sample product from the project). CIRA acts as the Sector Processing Center and is funded by the Atmospheric Research Center of NOAA. Our prime responsibility is the collection of GOES satellite data for the project. In the last year we have collected 99% of the time slots available from GOES West-- processing more than 1 terabyte of raw data in the process. This provides full disk imagery every 3 hours for use in the cloud analysis. Also we collected GOES East data, substituting for Environment Canada as they implemented data collection software. 2. Research Accomplishments/Highlights: In addition we participate in the validation of the over all products. We began GOES data collection at the start of the project in 1983 and now more than 20 years of global cloud analyses are available for the general scientific community. There is some redundancy in the ISCCP data products allowing many internal comparisons to verify changes seen in the observations. These comparisons lead the GRL paper: (Campbell and Vonder Haar 2005). The important result for Campbell and Vonder Haar (2005) is that fluctuation of +-1% agree between HIRS and ISCCP AVHRR data so detection of changes at that level are possible. As Figure 2 demonstrates, redundancy is critical to that conclusion. In the spring of 2005 Campbell and Bryan Baum (NASA) organized an International Committee of Experts to assess the quality and long-term stability of many different cloud climatologies under the GEWEX program. The conclusion of our first meeting is that consistent changes do occur among different data sets for areas with strong weather forcing. For global scale averages, measurement uncertainties dominate the time variations. But most importantly, it appears that modest improvements in the data sets will substantially improve the agreement on the climate scale. 3. Comparison of Objectives Vs. Actual Accomplishments for Reporting Period: The basic objective of the project is the collection of satellite data. This was achieved with 99% of potential data collected.
260
For validation, we have greatly improved the understanding of the precision of the observations with the comparison studies. 4. Leveraging/Payoff: NOAA has responsibility for collecting climate records to lead to a better understanding of climate processing and to provide baseline records for detecting changes. ISCCP provides a valuable “Climate Data Record” but estimating its accuracy has been problematic. In the last year we have made substantial progress in the understanding errors inherent to cloud observations. 5. Research Linkages/Partnerships/Collaborators, Communications and Networking: ISCCP is an international effort under the World Meteorological Organization. Within the U.S. there is substantial collaboration between NOAA and NASA on this project. 6. Awards/Honors: None as yet 7. Outreach: 8. Publications: Campbell, G. and T.H. Vonder Haar, 2005, Global Cloudiness: Nearly constant in time from ISCCP observations. Geophy Res. Letters.
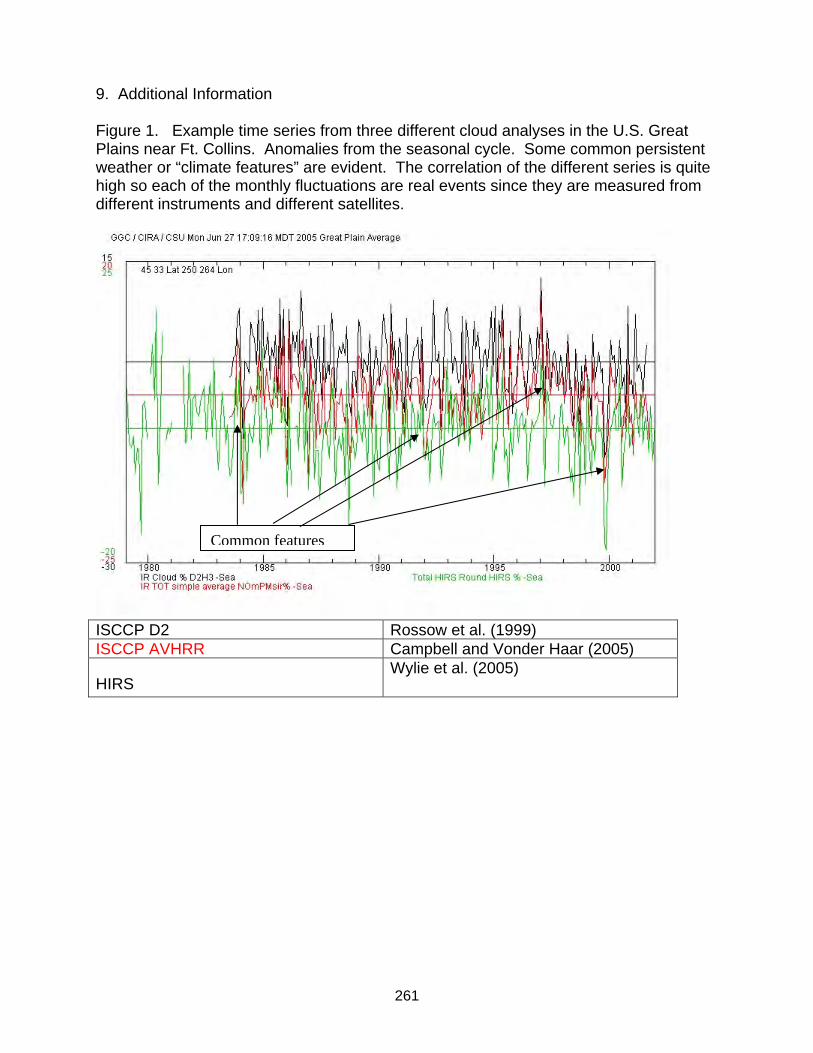
261
9. Additional Information Figure 1. Example time series from three different cloud analyses in the U.S. Great Plains near Ft. Collins. Anomalies from the seasonal cycle. Some common persistent weather or “climate features” are evident. The correlation of the different series is quite high so each of the monthly fluctuations are real events since they are measured from different instruments and different satellites.
ISCCP D2 Rossow et al. (1999) ISCCP AVHRR Campbell and Vonder Haar (2005)
HIRS Wylie et al. (2005)
Common features

262
Figure 2. From Campbell and Vonder Haar (2005). Tropical (20N to 20S) average cloudiness anomalies from annual cycle and 11 month running means, from ISCCP A (black) and HIRS (blue). The heavy line in middle is the linear trend in the ISCCP geo. product. The diurnal adjusted ISCCP A (red) is also shown. Tick marks show AVHRR changes.
References Campbell, G. and T.H. Vonder Haar, 2005, Global Cloudiness: Nearly constant in time from ISCCP observations. Geophy. Res. Letters. Rossow, W.B., and R.A. Schiffer, 1999: Advances in understanding clouds from ISCCP. BAMS, 80, 2261-2287. Wylie, D., D. L. Jackson, W. P. Menzel and J. J. Bates, 2005, Trends in global cloud cover in 22 Years of HIRS Observations, J. of Climate
263
INVESTIGATION OF SMOKE CLOUD-AEROSOL INTERACTIONS USING LARGE EDDY SIMULATIONS Principal Investigators: Hongli Jiang and Cliff Matsumoto in collaboration with Graham Feingold of NOAA/ETL NOAA Project Goal: To understand climate variability and change to enhance society’s ability to plan and respond. Key Words: Climate, aerosol, cloud, radiation, and surface fluxes 1. Long-term Research Objectives and Specific Plans to Achieve Them: Aerosol particles affect clouds in myriad ways by changing cloud droplet size, precipitation and radiative processes. Over the past year I have been engaged in a study to investigate the effect of absorbing aerosol on cloud properties, particularly cloud fraction and cloud liquid water. Absorbing aerosol modify clouds through various pathways: (i) by heating the atmosphere locally, they tend to stabilize the atmosphere with respect to the cloud; (ii) by reducing the incoming solar radiation at the surface they reduce surface latent and sensible heat fluxes; and (iii) by modifying droplet growth characteristics. The study targeted warm, continental cumulus clouds using a large eddy model (Feingold et al. 2005). We examined smoke-cloud interactions in the biomass burning regions of Amazonia to demonstrate the relative importance of various factors responsible for cloud suppression. We found that the vertical distribution of smoke aerosol in the convective boundary layer is crucial to determining whether cloudiness is reduced or increased. Smoke aerosol emitted at the surface in a daytime convective boundary layer, residing in the layer where clouds tend to form, will reduce cloudiness. We also found that the reduction in surface latent and sensible heat fluxes associated with biomass burning is sufficient by itself to substantially reduce cloudiness. The model described in Feingold et al. (2005) includes unprecedented treatment of coupled smoke aerosol-cloud-radiative feedback in 3-dimensional (3D) model that resolves scales on the order of 200 m, but fixed surface fluxes. We have recently extended our prior work by incorporating the Land Ecosystem-Atmospheric Feedback (LEAF) into the model of Feingold et al. (2005) to examine the effect of aerosol on warm cumulus clouds in a continental setting with a range of aerosol conditions (Jiang and Feingold, 2005). We have examined (i) the response of cloud drop number and size to changes in aerosol; (ii) the response of radiation and dynamics to changes in cloud drop size; (iii) absorbing aerosol to affect radiation; and (iv) absorbing aerosol to affect surface latent and sensible heat fluxes. 2. Research Accomplishments/Highlights: Simulations are based on a sounding on 26 September, 2001 at 07:38 local time (11:38 UTC) form Fazenda, a continental site, and run for a little over 8 h (500 min). The domain size is 6 km x 6 km x 5km with Δx = Δy=100 m and Δz = 50 m. The time step is

264
2 s. Two sets (a total of eight), 3D simulations have also been performed as summarized in Table 1. The differences between the two sets of simulations are (i) no aerosol radiative coupling (S1), and (ii) the coupling of smoke heating with the dynamical model. Selective results from Jiang and Feingold (2005) are presented here. Time series of various fields averaged over the last 5 h (11 to 16 local time) for both set 1 and set 2 as a function of Na are shown in Fig. 1. In the S1 simulations, as Na increases from 100 cm-3 to 2000 cm-3 the domain averaged LWP decreases by about 40 % (Fig. 1a); cloud fraction decreases by 32 % (Fig. 1b); vertically integrated droplet concentration Nd,int increase from 13x104 cm-2 to 194x104 cm-2 (Fig. 1c); cloud depth decreases by 300 m (about 50 %; Fig. 1d); cloud optical depth is doubled (Fig. 1e); the surface air temperature is unchanged (values are within (0.1% of each other; Fig. 1f); the net solar radiative flux at the surface decreases by only 1.6% (Fig. 1g); and the surface total heat flux decreases slightly (about 2.8%; Fig. 1h) to balance the decrease in the net solar radiative flux. It is worth noting that in these S1 simulations, the surface radiative flux and total heat flux are reduced only slightly by the increase in Na over the 5 h time period because the aerosol is not coupled to the dynamical model. In the S2 simulations (Fig. 1, dashed line – green), where the aerosol radiative properties are coupled to the dynamical model, the general tendencies with respect to increases in Na are similar to those in S1 (Fig. 1, solid line – red), except that the rate of change of most of the fields is much larger. The domain-averaged LWP decreases by 89% (Fig. 1a); cloud fraction decreases by 74% (Fig. 1b); and cloud depth decreases by 69% (Fig. 1d). The increase in Na leads to a smaller increase in the vertically integrated Nd,int ranging from 13 x 104 cm-2 to 73 x 104 cm-2, and a saturation in Nd,int after 1000 cm-
3. The smaller increase in Nd,int and larger increase in LWP result in a modest increase in cloud optical depth from S2-100 to S2-500, and then a decrease to about 63% of the value at S2-100. The clouds become optically thinner as Na increases, largely because of the decreasing cloud depth and LWP. To elucidate the reasons for the reduction in LWP, cloud fraction, and Zdepth associated with increases in Na, the vertical structure of buoyancy and buoyancy fluxes are considered (Fig. 2). These are horizontally and temporally averaged over the sixth hour when the heaviest precipitation event is produced in the S1-100 simulation (not shown). This hour was chosen to include the effects of cooling associated with evaporating precipitation and the potential effects on dynamics. During hour six, all cases experience negative buoyancy in the region of cloud top (3500 m - 4500 m). S1-100 has the least negative buoyancy (Fig. 2a). Positive values of buoyancy fluxes in the cloud-top layer suggest evaporative cooling in association with downdrafts (Fig. 2b). Detailed analysis of the contribution of heat and vapor flux reveals that strong cooling in the downdrafts dominates the total buoyancy flux (Stull, 1988), while moistening due to latent heat of vaporization contributes only a small amount to negative vapor flux (not shown). Fig. 2a and 2b provide evidence that under polluted conditions, evaporative cooling of numerous small droplets near cloud top results in negative buoyancy that prevents

265
vertical cloud development. This is accompanied by suppression of precipitation as well as a decrease in cloud amount due to complete evaporation of smaller droplets in the dry environment. In the clean case, evaporation is less efficient, negative buoyancy is much weaker, and clouds can grow deeper. A small number of droplets can grow to sizes large enough to generate precipitation and survive complete evaporation. Profiles of other variables, time-averaged over a longer time period (the last 5 h of simulations, 11 -- 16 local time), reveal a strong positive correlation between Na and Nd, and a negative correlation with reff (Fig. 3). In the most polluted case (Na = 2000 cm-3), the maximum in-cloud reff is only 9.5 μm. This is smaller than the value of 14 μm sometimes considered to be a precipitation threshold radius (Rosenfeld, 1999). In the clean case (Na = 100 cm-3), the average reff is as high as 80 μm in the cloud layer and about 180 μm as rain falls below the cloud base; drizzle rates are commensurate (Fig. 3c). Large in-cloud drizzle rates are sustained by the larger cloud liquid water mixing ratios (Fig. 3d). The differences in reff between S1-1000 and S1-2000 simulations are small because the number of activated drops approaches saturation (Fig. 1c). Neither of these polluted cases generates surface precipitation (Fig. 3c). In depth discussion of all the simulation results are submitted for publication in the Journal of Geophysical Research (Jiang and Feingold, 2005). The major results of this study may be summarized as follows. For simulations without the aerosol radiative-dynamical coupling (S1):
Increases in Na result in increases in droplet number Nd and cloud optical depth.
In contrast to common perception, increases in Na in these warm cumulus
clouds are associated with decreases in cloud fraction, LWP and cloud depth. Our analysis suggests that under increasingly polluted conditions, the more effective evaporation of smaller droplets at cloud top generate negative buoyancy that suppresses vertical development.
As expected, increases in Na are associated with decreases in effective
radius and reduction in surface precipitation. In these simulations, the suppression of precipitation derives from both the decrease in droplet sizes (less efficient collision-coalescence) as well as the reduction in LWPs.
For the simulations with aerosol radiative-dynamical coupling (S2), the trends in the S2 results are similar to those in S1 except that the rate of change in many fields is much stronger (see Fig. 1). The biggest differences between S1 and S2 simulations are that the radiatively active aerosols block up to 26.5% of incoming solar radiative flux from reaching the surface (for the most polluted case). The reduction in the surface radiative flux leads to reduction in the surface heat flux and consequently much shallower clouds and lower cloud cover that in S1 simulations. The stabilization of the boundary layer due to surface cooling and aerosol heating aloft contributes to further reduction in convective activity.

266
Overall, this study has challenged us to look at some fundamental issues regarding aerosol-cloud-radiative-surface flux feedbacks in the cumulus cloud regime over land. In particular the sign of the change of aerosol-induced effects on LWP and cloud fraction is called into question by this and other recent studies. The study has also pointed to the importance of coupling aerosol radiative properties and a surface soil and vegetation model to the microphysical-dynamical model. As shown here, under polluted conditions (associated, e.g. with biomass burning smoke), the surface flux response to the aerosol may be the single most important factor in cloud reduction. 8. Publications: Feingold, G, H. Jiang, and J.Y. Harrington, 2004: On smoke suppression of clouds in Amazonia, Geophys. Res. Lett. , 32, L02804, 10.1029/2004GL021369. Jiang, H. and G. Feingold, 2005: The effect of aerosol on warm convective clouds: Aerosol-cloud-surface flux feedback in a new coupled large eddy model, submitted to J. Geophys. Res. Table 1. Description of simulations. Na is aerosol concentration; τa is aerosol optical depth (day); τα,rh is optical depth associated with the hydrated aerosol based on the initial profile.
Name τα τα,ρη Na Aerosol heating
S1-100 0.04 0.05 100 No S1-500 0.20 0.26 500 No S1-1000 0.40 0.53 1000 No S1-2000 0.80 0.80 2000 No S2-100 100 Yes S2-500 500 Yes S2-1000 1000 Yes S2-2000 2000 Yes

267
0
20
40
60
LWP
[g m
-2]
(a) S1S2
0
0.1
0.2
clou
d fr
actio
n
(b)
10
100
Nd,
int [
10-4
cm
-2]
(c)
200
400
600
0 500 1000 1500 2000
Zde
pth
[m]
Na [cm-3]
(d)
0
2
4
τ c
(e)
30
31
32
Tsf
c [°
C]
(f)
500
600
700
800
Fso
lar [
W m
-2]
(g)
400
500
600
700
0 500 1000 1500 2000
Fse
n+la
t [W
m-2
]
Na [cm-3]
(h)
Figure 1. Time averaged over the last 5 h (11 to 16 local time) of time series of surface fields as a function of aerosol concentrations Na for both S1 and S2 simulations as described in Table 1.

268
2000
3000
4000
5000
-0.04 -0.02 0 0.02
Hei
ght (
m)
Buoyancy [m s-2]
(a)S1-100S1-500
S1-1000S1-2000
2000
3000
4000
5000
0 0.4 0.8 1.2 1.6 2
Hei
ght (
m)
(g/θ)<w’θv’>wd [10-3 m2 s-3]
(b)
Figure 2. Horizontally averaged profiles of (a) buoyancy, and (b) buoyancy flux, time averaged over the sixth h of the simulations for S1. Line types are as labeled.

269
0
2000
4000
0 10 20
Hei
ght (
m)
Nd [cm-3]
(a) S1-100S1-500
S1-1000S1-2000
0
2000
4000
0 50 100 150 200
Hei
ght (
m)
reff [μm]
(b)
0
2000
4000
0 4 8
Fdriz [mm day-1]
(c)
0
2000
4000
0 0.01 0.02
ql [g kg-1]
(d)
Figure 3. Horizontally averaged profiles of (a) number concentration of droplets (Nd), (b) effective radius (reff), (c) drizzle rate (Fdriz), and (d) cloud liquid water mixing ratio (rl), time averaged over the last 5 h (11 to 16 local time) of thee simulations for S1. Line types are as labeled.

270

271
MAXIMIZING THE USEFULNESS OF GRID TECHNOLOGY ON NOAA OFFICE PCs Principal Investigator: A. Jones NOAA Project Goal: Supporting NOAA’s Mission Related Programs: Satellite Services, Information Technology Services Summary: This is a collaborative project with NESDIS/OSDPD (OSDPD lead: Ms. Limin Zhao) to maximize the usefulness of grid technology on NOAA Office PCs for satellite data processing. The work is funded by the NOAA High Performance Computing and Communications (HPCC) Program and by matching funds from NESDIS/OSDPD. 1. Long-term Research Objectives and Specific Plans to Achieve Them: A typical office PC can be idle more than 80% of the time. This work uses an innovative PC-based grid computing system developed at CIRA called the Data Processing and Error Analysis System (DPEAS). The new system enables the previously wasted computing cycles to be used for NOAA data processing efforts in a secure and efficient manner. A technology transition cost/benefit analysis was performed on the DPEAS software framework technologies as used in three case study examples. The software framework uses advanced shared libraries and software systems that speed the transition of software technology from research into NOAA operations. Out of the three case studies that were analyzed, a total of 4 years of effort was saved. This resulted in a cost savings of $600K, with the creation of more than $7M in benefits due to the improved technology transition speed. Blended products are also identified to have proportionally larger benefits from the possible time improvements. The average ROI of the new software framework method is 3,167%. The lowest ROI analyzed was 2,981%. These transition method benefits are in addition to an earlier reported cost/benefit result of $1M over a 5 year period based on hardware and software considerations alone. Thus the software framework approach for satellite processing has great potential for NOAA. 2. Research Accomplishments / Highlights:
Six office PCs were connected as computational worker nodes to an advanced computing cluster within the NESDIS/OSDPD office PC network.
The technology demonstrated the successful technology transition for a six-satellite Blended Total Precipitable Water (TPW) product
Completed the delivery of DMSP SSMIS DPEAS software modules to OSDPD for new scientific sensor use.
Creation of DPEAS software framework training guides (Kidder et al., 2004a; 2004b; 2005a; 2005b; Shott and Jones 2005).
Two collaborative training trips to OSDPD at Suitland, MD (Nov. 10-11, 2004; and Apr. 18-19, 2005).

272
Preliminary completion of a cost/benefit analysis (Jones et al., 2005) that
includes workflow impacts on the technology transition using the DPEAS software framework.
Publication of project results (Kidder and Jones, 2004; 2005a; 2005b). Conclusions and Recommendations: The technology transition process is now simplified and improved. This results in faster transition times measured in a few days to mere hours. Total benefits from this work (primarily from process time improvements) amounted to more than $7M. The method has substantial cost savings in its implementation, and the average ROI using the new software framework is 3,167%. We recommend that NOAA take advantage of existing computational platforms (AIX/Linux/Windows) by implementing a common satellite processing software framework. Such a framework should leverage existing successful satellite processing models such as the DPEAS CPE example of this work, and other successful systems within NESDIS. As NPOESS Data Exploitation (NDE) and GOES-R activities proceed, they should be implemented in such a manner to leverage a common software framework for more efficient transition of technology from the research community to the operational community (and vice-versa). Such a system would be highly mobile, scalable, configurable, and also provide a common training and educational asset for NOAA, while improving technology transition and reducing costs. Future Work and Plans: Future efforts will be to implement to a collaborative NESDIS software framework in collaboration with OSDPD, ORA and the NOAA Cooperative Institutes. This work is in the early formative stages at this time. 3. Comparison of Objectives vs. Actual Accomplishments for Reporting Period: The cost/benefit analysis goal is nearly complete, and is undergoing final report revisions. The DPEAS Software Framework Technology was successfully transitioned to OSDPD in several stages and then analyzed for cost/benefit results. The Blended TPW Algorithm is currently providing 24/7 experimental products from OSDPD to operational NOAA users. Operational hardware has been purchased by OSDPD to make the system operational. 4. Leveraging / Payoff: This work resulted in a ROI of 3,167%. Accrued estimated benefits amount to more than $7M in process improvements for this particular series of analyzed case studies. If concepts from this work were successfully applied to more satellite processing systems in the future, software framework benefits to NOAA and the Nation could easily exceed $350M (e.g., application to the NPOESS 55 EDRs = 55 * $7M = $385M).
273
5. Research Linkages/Partnerships/Collaborators, Communications and Networking: This work was jointly funded by the NOAA High Performance Computing and Communications Program and NESDIS/OSDPD. NOAA Collaborators include: Ms. Limin Zhao (OSDPD), Dr. Ivan Tcherednitchenko (Computer Sciences Corporation), Dr. Ralph Ferraro (ORA), Mr. Carl Karlburg (OSDPD). Ms. Ingrid Guch (OSD) has also been helpful in the initial creation and guidance of the project. The end-user Blended TPW testing is in collaboration with Mr. Sheldon Kusselson (OSDPD/SAB), Ms. Jianbin Yang, and Mr. John Paquette (OSDPD/SSD). 8. Publications This Year: Journal Papers Kidder, S. Q., and A. S. Jones, 2005a: Blended satellite products for operational forecasting. J. Atmos. Oceanic Technol., in preparation.
Technical Reports and Conference Papers Jones, A. S., P. C. Shott, L. Zhao, I. Tcherednitchenko, R. R. Ferraro, C. Karlburg, S. Q. Kidder, 2005: Maximizing the Usefulness of Grid Technology on NOAA Office PCs: Cost/Benefit Analysis, 22 pp., in preparation.
Kidder, K. P., A. S. Jones, and S. Q. Kidder, 2004a: DPEAS CPE Process Document Averaged TPW, August 2004, 23 pp.
Kidder, K. P., A. S. Jones, and S. Q. Kidder, 2004b: Data Processing and Error Analysis System (DPEAS) DPEAS Cross-sensor Processing Environment (CPE) Guide, (Revised June 2004), 30 pp.
Kidder, K. P., A. S. Jones, S. Q. Kidder, and P. Shott, 2005a: Data Processing and Error Analysis System (DPEAS) Programmers’s Guide, (Revised January 2005), 69 pp.
Kidder, K. P., A. S. Jones, S. Q. Kidder, and P. Shott, 2005b: Data Processing and Error Analysis System (DPEAS) User’s Guide, (Revised February 2005), 40 pp.
Kidder, S. Q., and A. S. Jones, 2004b: Blended satellite products for operational forecasting, 13th Conference on Satellite Meteorology and Oceanography, September 20-24, Norfolk, VA.
Kidder, S. Q., and A. S. Jones, 2005: A processing system to produce blended total precipitable water products, 21st International Conference on Interactive Information Processing Systems (IIPS) for Meteorology, Oceanography, and Hydrology, January 9-13, San Diego, CA, poster P1.43.
Shott, P. C, and A. S. Jones, 2005: DPEAS Documentation Summary, June 2005, 6 pp.

274
Presentations Dr. A. S. Jones, “DPEAS Training Session”, NESDIS/OSDPD, Suitland, MD, Apr. 19, 2005.

275
NESDIS POSTDOCTORAL PROGRAM
Principal Investigators: Various (see below) NOAA Project Goal: Various (see below) Robert C. Hale – NESDIS Post Doc Project Title: Evaluation of the effects of land use/land cover changes on observed climate in the conterminous United States Principal Investigator: Kevin P. Gallo Office of Research & Applications, NOAA/NESDIS USGS National Center for EROS NOAA Project Goal: Climate – climate observations and analysis Key Words: Land use/land cover change, temperature, urbanization, deforestation, NDVI, Land Cover Trends Project
1. Long-term Research Objectives and Specific Plans to Achieve Them: The over-arching objective of this project is to examine linkages between observed near-surface air temperature and changes in land use/land cover over a multi-decadal time period. The Land Cover Trends Project at the USGS National Center for EROS is currently analyzing land use/land cover change in 10 km by 10 km or 20 km by 20 km sample blocks located within the 84 Level III ecoregions of the conterminous U.S. By utilizing results from the Land Cover Trends Project and records of daily maximum, minimum, and average temperature from U.S. Climate Normals stations located within or near these sample blocks, correlations between type and/or amount of land use/land cover change and trends in local or regional climate are being studied. Comparisons will also be made with satellite-derived Normalized Difference Vegetation Index (NDVI) data from the locations of the Normals stations to determine relationships between NDVI and the observed temperature trends and land use/land cover change. 2. Research Accomplishments/Highlights: To date, the Land Cover Trends Project has completed analysis of 22 of 84 ecoregions, encompassing 552 sample blocks. These 552 sample blocks have been intersected with 10-km buffer zones surrounding the 5332 Climate Normals stations of the conterminous U.S. This intersection yielded 356 stations occurring within 10 km of Trends sample blocks. Dominant land cover/land use change type, amount, and time period of change have been determined for each of these 356 stations.
276
Examination of trends in minimum, maximum, and average temperature at those Normals stations with buffer zones intersecting Trends sample blocks has also been completed in this first year of this project. Results of these statistical analyses will be the focus of an oral presentation at the 16th William T. Pecora Memorial Symposium. Current efforts are addressing potential associations between the observed temperature trends and nearby changes in land use/land cover. Also, methods for distinguishing influences of land use/land cover change from other factors impacting observed temperature are being evaluated.
3. Comparison of Objectives Vs. Actual Accomplishments for Reporting Period:
Identify U.S. Climate Normals stations located within or near study sites of the Land Cover Trends Project – Completed
Document the land use/land cover changes that have occurred within 10 km of U.S. Climate Normals stations for the nominal 1973-2000 period – Completed
Begin determination of trends in minimum, maximum, and average temperature at stations within or near Land Cover Trends Project sample blocks – Completed
Begin evaluation of linkages between temperature trends and land use/land cover changes – In progress
4. Leveraging/Payoff: Developing an understanding of how land use/land cover change may affect regional climate is critical to appropriate climate change attribution, and thus to decision-making and public policy. 5. Research Linkages/Partnerships/Collaborators, Communications and Networking: Collaborative effort between the Office of Research and Applications, NOAA/NESDIS (principal investigator K. P. Gallo), the USGS National Center for EROS (co-investigator T. R. Loveland), the National Climatic Data Center (co-investigator T. W. Owen), and CIRA/Colorado State University (postdoctoral research associate R. C. Hale). 6. Awards/Honors: None at this time 7. Outreach: None at this time 8. Publications: None as yet

277
Lei Ji – NESDIS Post Doc Project Title: Comparison of Vegetation Index Products Derived from AVHRR and MODIS Principal Investigator: Kevin Gallo NOAA Project Goal: Supporting NOAA’s mission Key Words: vegetation index, AVHRR, MODIS, VIIRS 1. Long-term Research Objectives and Specific Plans to Achieve Them: The Normalized difference vegetation index (NDVI) products are routinely produced from visible and near-infrared (NIR) data acquired by both the MODIS (since 2000) and AVHRR sensors (since 1979). The follow-on sensor to the AVHRR, the Visible/Infrared Imager/Radiometer Suite (VIIRS) will be very similar to the MODIS sensor. A long time series of NDVI record (20+ years) are important in monitoring the changes of vegetation activity and other land surface properties. The relationship between the AVHRR derived NDVI values and those of MODIS and future sensors is therefore critical to continued long-term detection of land surface properties. The bandwidths associated with the red and NIR data used to compute NDVI differ for the MODIS and AVHRR. The MODIS red (620 to 670 nm) and NIR (841 to 876 nm) bands are much narrower than the AVHRR red (585 to 680 nm) and NIR (730 to 980 nm) bands. Assessment and qualification of the data agreement between MODIS and AVHRR NDVI provided the information of the data continuity and the basis of constructing the transfer function between the two data sets. The objectives of theproject were to compare similarly processed MODIS and AVHRR NDVI data sets over coincident time and space intervals and examine the relationship between the NDVI values derived from the two sensors.
2. Research Accomplishments/Highlights: The comparison of NDVI products among four satellite platforms and sensors, including Terra and Aqua MODIS sensors and NOAA-16 and NOAA-17 AVHRR sensor for the years 2001-2003. The comparison was conducted for the16-day NDVI composite data for all land cover types within the United States. It was found that although differences existed in several factors that might influence the composite NDVI values, the NDVI values observed with the Terra and Aqua MODIS, and NOAA-16 and NOAA-17 AVHRR, were quite similar when sampled over similar time intervals, spatial areas, and land cover types. Additional improvements to the relationships in NDVI might be expected with aerosol correction of the AVHRR data and adjustments for differences between the sensors in solar and satellite viewing geometry. The prospects appear good for future efforts to reprocess AVHRR data sets with a goal of continuity of an NDVI product through time. With inclusion of water vapor corrections and potential additional data adjustments, historical AVHRR NDVI data may be useful as a climatological tool. NDVI data should continue to be directly compared to NDVI derived from MODIS data as well as future data acquired by the operational VIIRS sensors.

278
3. Comparison of Objectives Vs. Actual Accomplishments for Reporting Period: The main objectives of the study have been achieved. In addition to analysis of NDVI composite products, comparisons should be made for the individual red and NIR band data acquired on single dates. These studies would optimally include analysis of the influence of bi-directional reflectance on the individual bands as well as NDVI data. 4. Leveraging/Payoff: 5. Research Linkages/Partnerships/Collaborators, Communications and Networking: The NOAA funded project was undertaken with the cooperation of a scientific team at the USGS, National Center for Earth Resources Observation and Science. 6. Awards/Honors: None as yet. 7. Outreach:
a. Presented paper in the Annual Meeting of the Great Plains/Rocky Mountain Division of the Association of American Geographers (Sioux Falls, South Dakota, September 30 – October 2, 2004): A new agreement coefficient for comparing remotely sensed data acquired from different sensors. b. Presented paper in the American Society for Photogrammetry & Remote Sensing 2005 Annual Conference (Baltimore, MD, March 7-11, 2005): A new agreement coefficient for comparing images. 8. Publications: Gallo, K., L. Ji, B. Reed, J. Dwyer, and J. Eidenshink, 2004, Comparison of MODIS and AVHRR 16-day normalized difference vegetation index composite data. Geophysical Research Letters, 31: L07502, doi:10.1029/2003GL019385. Ji, L., and K. Gallo, The agreement coefficient for image comparison, Photogrammetric Engineering & Remote Sensing, accepted.

279
Tong Zhu – NESDIS Post Doc Project Title: Microwave Remote Sensing of Atmospheric and Surface Parameters and Their Applications in Numerical Weather Prediction Models. Principal Investigator: Fuzhong Weng, Tong Zhu NOAA Project Goal: Weather & Water Key Words: Hurricane Model Initialization, AMSU data, Data Assimilation 1. Long-term Research Objectives and Specific Plans to Achieve Them: Develop hurricane model initialization and assimilation schemes to be implemented in the operational forecast models using microwave data from AMSU, SSM/IS and ATMS. The research will also include the validation of these microwave sensor-derived products and algorithms. Further assessment of the schemes and the usefulness in numerical weather prediction models will be studied. 2. Research Accomplishments/Highlights: We developed a quasi-operational tropical cyclone monitoring system, in which the atmospheric temperature profile is retrieved from AMSU sensor and the sea-surface wind speed is derived from AMSR-E sensor. The hurricane model initial vortex is obtained by assimilating above satellite microwave observations in to hurricane model with a 4-dimensional variational (4-DVAR) data analysis method. 3. Comparison of Objectives Vs. Actual Accomplishments for Reporting Period: The project is going well. Now, we are testing the newly developed tropical cyclone monitoring system for the 2005 hurricane season. We are going to implement the system and perform impacts studies on hurricane prediction with the assimilation of atmospheric temperature, moisture and wind information from satellite microwave measurements. 4. Leveraging/Payoff: Scientists from several U.S. and foreign agencies are interested in our hurricane model initialization schemes. Our weak hurricane initialization scheme is going to be tested on the NOAA/EMC computer. 5. Research Linkages/Partnerships/Collaborators, Communication and Networking: We are collaborating with NOAA/EMC hurricane modeling group in developing a weak hurricane vortex scheme, and collaborating with IPRC at the University of Hawaii to implement a 4-DVAR analysis scheme into a quasi-operational monitoring system.

280
6. Awards/Honors: None as yet 7. Outreach: This project offers Dr. Tong Zhu a postdoctoral fellowship at CIRA. 8. Publications: Weng, F. and T. Zhu, 2004: Hurricane model initialization with AMSU measurements. SPIE Remote Sensing of the Atmosphere, Environment, and Space, Honolulu, Hawaii, 8-12 November, 2004. Zhu, Tong, and F. Weng, 2004: Applications of Satellite Microwave Data for Hurricane Prediction. Observation, Theory and Modeling of Atmospheric Variability. World Scientific Series on Meteorology of East Asia – Vol. 3.

281
ORA IT INFRASTRUCTURE OF THE FUTURE
Principal Investigator: A. Jones NOAA Project Goal: Supporting NOAA’s Mission Related Programs: Satellite Services, Information Technology Services This is a collaborative multi-institutional study panel review of NESDIS/ORA IT infrastructure (ORA lead: Ms. Susan Callis). The study panel provides guidance and makes recommendations to optimize and improve ORA’s effectiveness as it relates to satellite data processing and technical research capabilities. Due to the institutional synergies, the impact of future satellite program components (NPOESS, GOES-R, and NPOESS Data Exploitation) and collaboration technologies are critical to the research-to-operations transfer path and are vital to future CIRA collaborative research activities with NOAA. Activities of the Study Group are detailed in the ORA document entitled “ORA IT Infrastructure of the Future Study Group, Proposal for Study Group” (March 15, 2005). This work represents the participation of Drs. A. S. Jones and S. Q. Kidder within the review study panel. The work is funded by NESDIS/ORA. 1. Long-term Research Objectives and Specific Plans to Achieve Them: Drs. Jones and Kidder are members of the ORA IT Infrastructure Study Group. Participation in the study panel activities includes an on-site visit to ORA, and detailed report generation following the visit. The on-site review was held in mid-May 2005. Tasks include the following:
Review of background ORA materials Participation in the on-site review Evaluation/discussion/drafting of recommendations Review of the draft report and provision of comments
2. Research Accomplishments / Highlights: This work was performed on a fast track. The project began in less than two months after the announcement of the study group formation.
On-site review of ORA IT infrastructure was completed during May 16-20, 2005. Draft of review conclusions and recommendations are now complete
(Callis, et al., 2005). Final acceptance and distribution of study panel findings is pending.
Conclusions and Recommendations: A comprehensive list of panel recommendations have been submitted to ORA senior management (Callis et al., 2005). After internal discussion and review, we expect ORA management to begin implementation of those recommendations, possibly streamlining
282
and reorienting their IT services, science project management activities, and restructuring their current IT business practices. Several new initiatives have been identified for significant improvements in the future manageability of the ORA IT Infrastructure. The final report should be available in about 4-6 weeks. Future Work and Plans: Future efforts will be to assist ORA in the implementation of components of the future IT infrastructure as it pertains to the CIRA mission. This could include joint software framework initiatives and other topics as determined by ORA in collaboration with CIRA. This work is in the early formative stages at this time. 3. Comparison of Objectives vs. Actual Accomplishments for Reporting Period: The intense on-site review work and report generation is now complete. A final draft of the report was recently submitted to ORA senior management and was delivered on schedule. 4. Leveraging / Payoff: This work is critical to several large satellite programs including NPOESS, GOES-R, and the NPOESS Data Exploitation (NDE) program. The study group expects the streamlining of the ORA IT infrastructure to generate substantial new research capabilities by reducing duplication of efforts and leveraging joint research assets through a more coordinated and targeted management approach. 5. Research Linkages/Partnerships /Collaborators: This work includes participation by CIRA, the Cooperative Institute for Meteorological Satellite Studies (CIMSS, Univ. of Wisconsin), Scripps Institute of Oceanography (Univ. of CA, San Diego), and private contractors from SP Systems Inc., QSS Group Inc., and ERT, Inc. 8. Publications This Year: Technical Report Callis, S., J. Brust, P. Chang, J. Daniels, A. S. Jones, S. Q. Kidder, D. Molenar, T. Schreiner, J. Simpson, R. Sinha, W. Wolf, 2005, J. Huie, and C. A. Meetre: ORA IT Infrastructure of the Future, 114 pp.
Presentation Dr. A. S. Jones, “Overview of the Data Processing and Error Analysis System”, NESDIS/ORA, Camp Springs, MD, May 16, 2005.

283
PROPOSAL ON EFFICIENT ALL-WEATHER (CLOUDY & CLEAR) OBSERVATIONAL OPERATOR FOR SATELLITE DATA ASSIMILATION RADIANCE Principal Investigator: Tomislava Vukicevic NOAA Project Goal: Weather and Water Key Words: radiance assimilation; 4DVAR; mesoscales; clouds; soil moisture 1. Long-term Research Objectives and Specific Plans to Achieve Them: Develop methodology for improving analysis and prediction of the atmospheric hydrology and soil moisture in high spatial resolution using satellite observations. The atmospheric hydrology includes humidity, clouds and precipitation. The objective of improved analysis and prediction is to be achieved by study and development of satellite radiance data assimilation techniques with high resolution, cloud resolving NWP models in four dimensions (4D - temporal and 3 spatial dimensions). The studies over the next 5 years will include assimilation of a broad spectrum of satellite observations from visible to microwave and from geostationary and polar-orbiting satellites. The studies will address improving the analysis of atmospheric and surface moisture and cloud properties in 4D and optimal estimation of cloud microphysical models. 2. Research Accomplishments/Highlights: A 4D variational (4DVAR) data assimilation research system was developed in CIRA in the period 2000-2004 using the Regional Atmospheric Modeling System (RAMS). The 4DVAR research system, designated Regional Atmospheric Modeling and Data Assimilation System (RAMDAS) main features are:
a) State-of-the-art models for projection of satellite radiance data onto arbitrary analysis grid and a set of radiative transfer and optical properties models that are dynamically linked to the cloud resolving forecast model for simulation of visible and infrared radiances (Jones et al; 2003; Greenwald et al., 2003, 2005; Vukicevic et al., 2004, 2005)
b) efficient minimization algorithm with preconditioning (Zupanski et al., 2005)
c) Background covariance model in 3 spatial dimensions (Zupanski et al., 2005)
Recent studies of the impact of the GOES imager infrared radiance observations in assimilation with RAMDAS show that these observations significantly improve analysis of the clouds and their environment in high spatial resolution when minimal conditions for cloud formation are already present in the environment. The assimilation results clearly demonstrate that increasing the observational constraint from individual to combined channel measurements and from less to more frequent observation times systematically improves the accuracy.
284
In addition, a new observational model for assimilation of passive microwave observations was developed for studies on improving soil moisture analysis (Jones et al., 2004). The operator includes both forward and adjoint versions of a land surface microwave model. The sensitivity analysis in Jones, et al. (2004) indicates that the strength of influence of land model parameters varies with the degree of soil wetness which implies that adjustment and accuracy of these parameters in assimilation will vary depending on the regime. 3. Comparison of Objectives Vs. Actual Accomplishments for Reporting Period: N/A 4. Leveraging/Payoff: All of the above research is sponsored by other agencies, but it contributes to the NOAA objectives.
5. Research Linkages/Partnerships/Collaborators, Communications and Networking:
Continued: Co-PI on NASA supported project, entitled “Fast Fluxes Slow Pools:
Integrating Eddy Covariance, Remote Sensing & Ecosystem Processes”, collaboration with UNH (PI - Rob Braswell)
New: Co-PI on NOAA/JCSDA, entitled “Global Microwave Surface Emissivity
Error Analysis” (PI- Andy Jones)
New: Co-PI on NASA, entitled “Automated Error Propagation Analysis for use with a Physical Data Assimilation”; Collaboration with NREL (PI - Dennis Ojima)
New: PI on NOAA JCSDA/JCSDI (NESDIS), entitled “ Efficient All-Weather
(Cloudy and Clear) Observational Operator for Satellite Radiance Data Assimilation”.”
New: Co-PI on the project supported by the NSF, entitled “Biocomplexity:
Carbonshed Studies of Carbon Sequestration in Complex Terrain”; Collaboration with NCAR (PI- Dave Schimel).
Continued: DoD CG/AR
6. Awards/Honors:
Department of State sponsored Fulbright Award for 2005/06 to teach and collaborate at the University of Beograd, Serbia and Montenegro.

285
7. Outreach: (a.) Graduate students:
Primary advisor for X. Warrant-Laird, PhD candidate at the Program for Atmospheric and Oceanic Sciences, CU, Boulder
Committee member for C. Seaman, PhD candidate in the Atmospheric Sciences,
CSU, Ft. Collins (Primary advisor, Dr. T. Vonder Haar)
Committee member for D. Poselt, PhD candidate in the Atmospheric Sciences, CSU, Ft. Collins (Primary advisor, Dr. G. Stephens)
(b) Seminars, symposiums, classes, educational programs;
Taught graduate course on “Dynamic Data Assimilation” in the Atmospheric Science Department at the Colorado State University, Spring 2004
Gave lecture at Short course on Atmospheric Data Assimilation, Summer School
at the University of L’Aquila, Italy, September 2004
Gave lecture at Short Course on “Satellite Data Assimilation”, AMS Committee on Satellite Meteorology and Oceanography, 84th AMS annual meeting,
Seattle, WA
Gave lecture at Spring Colloquium on Regional Modeling and Prediction, Trieste, Italy, 2005
8. Publications: Vukicevic, T., M. Sengupta, A. Jones and T. Vonder Haar, 2005: Cloud Resolving Data Assimilation: Information content of IR window observations and uncertainties in estimation. J. Atmos. Sci., Accepted. Vukicevic, T., T. Greenwald, M. Zupanski, D. Zupanski, T. Vonder Haar, and A. Jones, 2004: Mesoscale cloud state estimation from visible and infrared satellite radiances. Mon. Wea. Rev., 132, 3066-3077. Vukicevic, T., E. Kalnay, and T. Vonder Haar, 2004: The need for a national data assimilation education program. BAMS, January 2004. Zupanski, M., D. Zupanski, T. Vukicevic, K. Eis and T. Vonder Haar. 2005: CIRA/CSU Four-Dimensional Variational Data Assimilation System. Mon. Wea. Rev, 133, 829–843. Jones, A., T. Vukicevic, and T., Vonder Haar, 2004: Observational operator for variational assimilation of passive microwave radiance data in soil moisture analysis. J. Hydrometeorology, 5, 213-229.

286
Greenwald, T., T. Vukicevic, and L. Grasso, 2004: Adjoint Analysis of an Observational Operator for Visible and Infrared Cloudy-sky Radiance Assimilation. Q. J. R. Met. Soc., 130, 685-705.

287
RADAR REMOTE SENSING PROCESSES AND INVESTIGATION OF SMOKE AEROSOL CLOUD INTERACTIONS USING LARGE EDDY SIMULATIONS Principal Investigator: Shelby Frisch NOAA Project Goal/Program: Climate—Understand climate variability and change to enhance society’s ability to plan and respond/Climate observations and analysis
Key Words: Arctic climate, temperature, satellite comparisons 1. Long-Term Research Objectives and Specific Plans to Achieve Them: To see how representative the Cloud observatory will be at Eureka, Canada where we are siting a cloud radar, radiometer and other instruments for cloud monitoring. This data will be used for input to climate models and for observing climate changes in the Arctic
2. Research Accomplishments/Highlights: We have compared the in-situ temperature measurements at Alert and Eureka, Canada and Pt. Barrow Alaska with satellite APPX temperatures. We have APPX temperature data from 1982 to 2000. One of the factors that may affect the comparison is the cloud fraction. We have compared the in-situ temperature measurements at Barrow Alaska, Alert and Eureka, Canada with satellite derived surface temperatures. This helps us determine how well the satellite data is retrieving surface temperatures. We are now looking to see how cloud cover may affect these comparisons. In addition, we have compared the APPX satellite surface temperature retrievals for special variability. We found that the two Canadian sites (Alert and Eureka) were almost perfectly correlated, except for a mean difference in temperature of about 1.5 degrees C. There was a significant difference at the Barrow, Alaska and the Tiksi, Russia sites. Presentations:
University of Toronto CANDAC Science meeting April 18-20 NASA Cloud Climatology Meeting April 5-7 NASA CERES Science Team Meeting May 3-5 NOAA Arctic Science Meeting
3. Comparison of Objectives Vs. Actual Accomplishments for Reporting Period: Our objective in examining long term data for various Arctic sites is in progress. We need to obtain temperature data from Tiksi, Russia and observe other satellite temperature and cloud fraction data.
4. Leveraging/Payoff: Help in modeling Arctic climate and measurements of Arctic climate change.

288
5. Research Linkages/Partnerships/Collaborators, Communications and Networking:
Jeff Key, NOAA National Environmental Satellite Data and Information Service, 1225 W. Dayton St, Madison, WI, 53706, USA
Xuanji Wang , Cooperative Institute for Meteorological Satellite Studies, 1225 W.
Dayton St, Madison, WI, 53706, USA
Axel Schweiger, University of Washington, Seattle, Washington
Sunny Sun-Mack and Patrick Minnis NASA/Langley Research Center, Hampton, Virginia
6. Awards/Honors: None as yet 7. Outreach:
8. Publications: Uttal, T., S. Frisch, X. Wang, and J. Key, 2004: Long-term observations of cloudiness, radiation and aerosols with permanent atmospheric observatories. ACIA International Symposium on Climate Change in the Arctic, Reykjavik, Iceland, 9-12 November 2004.
Uttal, T., S. Frisch, X. Wang, J. Key, A. Schweiger, S. Sun-Mack, and P. Minnis, 2005: Comparison of monthly mean cloud fraction and cloud optical depth determined from surface cloud radar, TOVS, AVHRR, and MODIS over Barrow, Alaska. 8th Conference on Polar Meteorology and Oceanography, 9-13 January 2005, San Diego, CA., Amer. Met. Soc.
289
RESEARCH & DEVELOPMENT FOR GOES-R RISK REDUCTION Principal Investigators: T.H. Vonder Haar NOAA Project Goal: Weather and Water Key Words: GOES-R, Risk-Reduction, product development, ABI, HES 1. Long-term Research Objectives and Specific Plans to Achieve Them: The long term research objectives are to identify the utility of GOES-R data along with advanced product development, and Advanced Baseline Imager (ABI) and Hyperspectral Environmental Suite (HES) applications. Specific plans to achive the above objectives are to focus on mesoscale weather events with fast time scales including hurricanes, severe thunderstorms, lake effect snow, and fog. In addition, long-term objectives include simulating GOES-R data in the following two ways:
Use existing operational and experimental satellite data. Use a numerical cloud model in conjunction with an observational operator—that
contains OPTRAN code and radiative transfer models, to produce synthetic GOES-R images.
2. Research Accomplishments/Highlights: Synthetic Images: This year we moved away from 32-bit computers towards a 64-bit cluster. This enabled us to simulate the three events—severe weather, lake effect snow, and Hurricane Lili--over larger horizontal domains. This made the synthetic images more practical for analysis. We also obtained spectral coefficients for the GOESR-ABI from the Joint Center for Satellite Data Assimilation: Last year we used coefficients for GOES-9 since ABI values were not available. As a result, we were able to generate synthetic GOESR-ABI images for ten channels ranging from 3.9 to 13.3 µm. Further, we were able to generate synthetic HES images directly from simulated data. Convective Available Potential Energy (CAPE) and Total Precipitable Water (TPW) were two fields created at different horizontal footprints for the severe weather and lake effect snow cases. In addition to spatial sampling, temporal sampling was examined through the use of the Discrete Fourier Transform. This technique was applied to the CAPE field of the severe weather case. Lastly, synthetic sounder soundings, with different vertical footprints, were generated from observed soundings across the United States. This work was highlighted in reports to both the head of NOAA and the Department of Commerce. Additional information may be obtained at our website: http://rammb.cira.colostate.edu/projects/goes_r Data Collection: Collection of GOES, AIRS, AVHRR, and MODIS satellite data, and ancillary observations for the case studies is continuing. In particular, a polar low and a second fog case have been collected, in addition to several tropical cyclone, severe weather and lake-effect snow cases.

290
Data Assimilation: Information content of data was examined through the use of the maximum likelihood ensemble kalman filter technique. This procedure has the distinct advantage in that adjoints of forward models are not required. This technique was applied to the simulation of Hurricane Lili and demonstrated the method can provide information of the relative importance of various types of input. This initial study considered the case where the initial condition was known perfectly, and then various model variables were sub-sampled. The next step is to apply the method to a case initialized with observations rather than the analysis from the NAM model. Tropical Cyclone Product Development: Analysis of AIRS soundings in tropical cyclone environments and eyes continues. A total of 83 AIRS soundings with co-located GPS dropsondes from the NOAA Gulfstream Jet have been obtained for Hurricanes Lili, Isabel and Fabian. The soundings in the eyes of these storms are also being analyzed. Figure 1 shows the location of the AIRS sounding in the eye of hurricane Isabel and the corresponding temperature anomaly profile. A downward hydrostatic integration of the AIRS eye sounding gave a surface pressure estimate of 936 hPa, which was within 3 hPa of the minimum sea level pressure estimated from aircraft. Soundings from other eye cases are also being analyzed.
Figure Caption. The locations of AIRS soundings in the eye and environment of hurricane Isabel (left). The temperature anomaly profile (eye minus environment) comparison on the right Prototype product development for fog, smoke and volcanic ash analysis: The focus is on the development of new products or the improvement of existing products, such as the fog/stratus product. A fog/stratus product exists, but hopefully can be improved with the additional spectral coverage that will be available through GOES-R ABI bands. Development work on these products has been focused on the ABI-equivalent bands from MODIS. A large database of case studies is available, including several
100
200
300
400
500
600
700
800
900
10000 2 4 6 8 10 12 14 16 18
Temperature Anomaly (C)
Pres
sure
(hPa
)
Eye Sounding
Environment Sounding
Eye - Environment Temperature

291
fog/stratus examples. Figure 3.1 shows examples of the fog/stratus product generated by various combinations of bands and Principal Component Images (PCIs).
Figure Caption: Comparison of the three sample fog/stratus discrimination products, showing that there are different ways to discriminate features of interest. The same technique can be applied to other atmospheric and land features. Severe Weather Applications: Research continues to determine how GOES data and MODIS can be used to determine relationships between cloud top structure (especially shortwave reflectivity) and severe weather. This study is in preparation for an ABI product for severe weather nowcasting. Figure 5.1 show MODIS bands 7 and 22, corresponding to the proposed ABI bands 6 and 7, respectively, of a severe weather event in northeast Colorado on 24 May 2005. A large radiance gradient across the top of the convective complex suggests that parts of the anvil contain more small ice crystals. There were several severe weather reports, including a few tornadoes, associated with this event. A future nowcasting product will utilize storm top shortwave reflectivity and its association with ice crystal distributions.
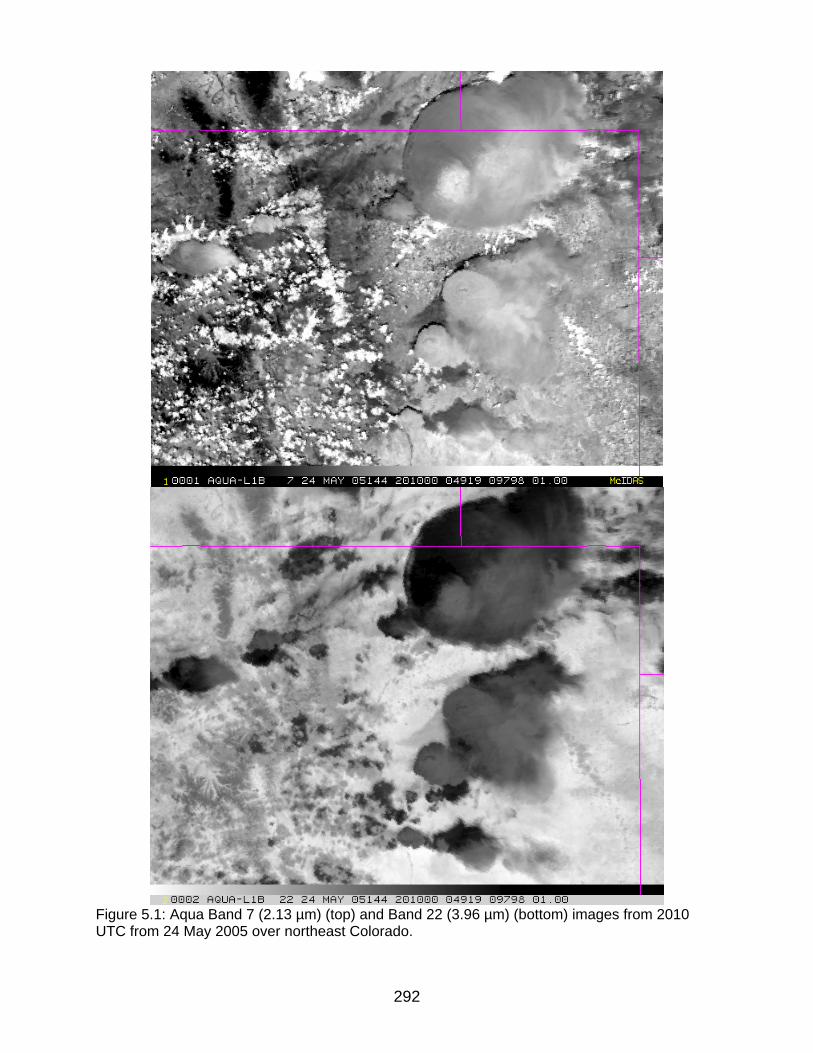
292
Figure 5.1: Aqua Band 7 (2.13 µm) (top) and Band 22 (3.96 µm) (bottom) images from 2010 UTC from 24 May 2005 over northeast Colorado.

293
3. Comparison of Objectives Vs. Actual Accomplishments for Reporting Period: In general all of the objectives have been met with one exception. Preliminary results from the hurricane simulation suggested that the areal coverage of the simulated domain of interest was too small for practical application. As a result, we have decided to move the simulation to a new 64-bit machine so as to exceede the 4 GB RAM limit present on 32-bit architecture. 4. Leveraging/Payoff: What NOAA will recieve for resources invested is:
Advanced product development Extended operational use of the GOES-R satellite Improved products for severe weather and tropical cyclone analysis and
forecasts Imrpoved products for fog, volcanic ash and fire detection
5. Research Linkages/Partnerships/Collaborators, Communications and Networking: Our research linkage includes:
Coordinating with CIMSS and the Joint Center for Satellite Data Assimilation. These groups are producing the required OPTRAN coefficients and code for
radiative modeling of GOES-R ABI channels. Coordination with Dr. David Mitchell of the Desert Research Institute, Reno,
Nevada.The coordination produces efficient production of a final product. That is, we can avoid duplication of work and take advantage of the expertise of the other groups.
The tropical cyclone analysis is being coordinated with OAR/AOML and the NCEP Tropical Prediction Center, and NESDIS with regard to the AIRS retrievals
The severe weather research is in collaboration OAR/NSSL 6. Awards/Honors: None as yet 7. Outreach: (a) Graduate/Undergraduate students (List by name, degree status and continuance after obtaining degree); (b) Seminars, symposiums, classes, educational programs; (c) Fellowship programs; (d) K-12 outreach; (e) Public awareness. (a) An undergraduate student is partially supported by this project. (b) D. Mitchell, June 8, 2005: Characterizing particle size, water path, and photon tunneling in ice and water clouds. CIRA Seminar, Fort Collins, CO. D.W. Hillger, May 24, 2005: Results of the GOES-R Risk Reduction activities at CIRA that can be applied as well to data from NPOESS VIIRS and other instruments. COMET Curriculum Development Workshop, Boulder, CO.

294
M. DeMaria, April 20, 2005: Tropical cyclone applications of satellite observations. CSU Satellite Meteorology class, Fort Collins, CO D.W. Hillger, April 19, 2005: Judged posters at the CSU Celebrate Undergraduate Research and Creativity (CURC) Poster Event. Fort Collins, CO. D.L. Lindsey, March 22, 2005: Reflective thunderstorm tops research. ATMOS/CIRA presentation, Fort Collins, CO. B.H. Connell and J.F.W. Purdom, March 7-18, 2005: Regional Training Course on the Use of Environmental Satellite Data in Meteorological Applications for RA III and RA IV. San Jose, Costa Rica. D.W. Hillger, December 8, 2004: NOAA’s GOES Program: Past, Present, and Future. Fifth Canadian/COMET Winter Weather Workshop, Boulder, CO. B.H. Connell, November 8, 2004: GOES and the characteristics of its channels. Remote Sensing class at the Metropolitan State College of Denver, Denver, CO. D.W. Hillger, July 17, 2004: Weather satellite history and RAMM Branch GOES-R Risk Reduction activities. 2nd Rocky Mountain Chinese Society of Science and Engineering (RMCSSE) Annual Conference, Aurora/Denver CO. (c) None
(d) J.F. Weaver, March 7, 2005: My Career in Meteorology and How I Got There. Partnership with RAMMB and the Poudre High School PaCE (Professional and Community Experience) Program, Fort Collins, CO.
D. Watson, H. Gosden, D.A. Molenar, April 13, 2005: Meeting with program directors. Partnership with RAMMB and the Poudre High School PaCE (Professional and Community Experience) Program. Fort Collins, CO.
(e) J.F. Weaver, October 6, 2004: The variety and scope of research taking place at CSU. Series for local business owners. Fort Collins, CO. D.W. Hillger, October 14, 2005: Work at NOAA/CIRA with weather satellites and the next generation GOES. Windsor (CO) Beacon interview. Windsor, CO.

295
8. Publications:
Refereed Journal Articles
Grasso, L.D., and T.J. Greenwald, 2004: Analysis of 10.7 micron brightness temperatures of a simulated thunderstorm with two-moment microphysics. Mon. Wea.Rev., 132:3, 815-825.
Conference Proceedings
DeMaria, M., D.W. Hillger, C.D. Barnet, J.P. Dunion, and R.T. DeMaria, 2004: Evaluation of Hyperspectral Infrared Soundings in Tropical Cyclone Environments. AMS 13th Conference on Satellite Meteorology and Oceanography, September 20-23, Norfolk, VA.
Dostalek, J.F., L.D. Grasso, M. Sengupta, M. DeMaria, 2004: Applications of synthetic GOES-R observations for mesoscale weather analysis and forecasting. AMS 13th Conference on Satellite Meteorology and Oceanography, September 20-23, Norfolk, VA.
Grasso, L.D., M. Sengupta and M. DeMaria, 2004: Applications of Simulated GOES-R Observations for Advance Product Development for Mesoscale Weather Forecasting. SPIE Annual Meeting, August 2-6, Denver, CO.
Hillger, D.W., M. DeMaria, and J.F.W. Purdom, 2004: Analysis of Simulated GOES-R Data and Products for Mesoscale Meteorology. AMS 13th Conference on Satellite Meteorology and Oceanography, September 20-23, Norfolk, VA.
Hillger, D.W., M. DeMaria, J.F.W. Purdom, and C.D. Barnet, 2004: Risk Reduction Activities for Future GOES-R Instrumentation. SPIE Asia-Pacific Symposium, November 8-12, Honolulu, HI.
Hillger, D.W., M. DeMaria and R.M. Zehr, 2004: Advance Mesoscale Product Development for GOES-R Using Operational and Experimental Satellite Observations. SPIE Annual Meeting, August 2-6, Denver, CO.
Hillger, D.W. and T.J. Schmit, 2004: Quantization Noise for GOES-R ABI Bands. AMS 13th Conference on Satellite Meteorology and Oceanography, September 20-23, Norfolk, VA.
Zehr, R.M., 2004: Satellite Products and Imagery with Hurricane Isabel. AMS 13th Conference on Satellite Meteorology and Oceanography, September 20-23, Norfolk, VA.
Zupanski, D., M. Zupanski, M. DeMaria, and L.D. Grasso, 2005: Critical issues of ensemble data assimilation in application to GOES-R risk reduction program. 9th Symposium on Integrated Observing and Assimilation Systems for the Atmosphere, Oceans, and Land Surface (IOAS-AOLS). 10-14 January, San Diego, CA.

296
Presentations
Zehr, R.M., M. DeMaria, J.A. Knaff, and K.J. Mueller, 2005: NOAA’s Next-Generation Polar and Geostationary Satellites; Hurricane Applications. 59th Interdepartmental Hurricane Conference, 7-11 March, Jacksonville, FL.

297
SCIENCE STEWARDSHIP OF THEMATIC CLIMATE DATA RECORDS—A PILOT STUDY WITH GLOBAL WATER VAPOR Principal Investigator: Thomas H. Vonder Haar Project Researcher: John Forsythe NOAA Project Goal: Climate Key Words: Climate Data Records, CDR, Data Stewardship, NVAP, water vapor, AIRS, satellite meteorology 1. Long-term Research Objectives and Specific Plans to Achieve Them: This project was begun in June 2005 as a demonstration of the concepts of scientific data stewardship of Climate Data Records (CDRs). NOAA is responsible for scientific data stewardship of climate data records. Stewardship of these important records goes far beyond just managing the archive of data for future use. The key question to answer is: Are we creating and preserving data sets which will be useful for scientists to address the climate questions of the future? Understanding how biases in the observing systems and algorithms impact the CDR is critical. Far too often, these effects are not discovered until years after the production of the data set. Drifts in instrument performance and spacecraft orbits, and intersatellite calibration all must be documented and understood for a successful CDR program.
Water vapor is a key variable in global change research, as the amount of water vapor in Earth’s atmosphere is projected to increase as temperature warms. Water vapor is the most important greenhouse gas in the atmosphere, so detecting and understanding feedback effects on warming are critical to predicting climate change.
We choose to focus on stewardship of the global water vapor record in this study because of our over 10 years experience at CIRA with the NASA Water Vapor Project (NVAP) CDR, which was originally created by CIRA scientists in the mid-1990’s. NVAP was assembled from measurements from a variety of water vapor-sensing spacecraft. The NVAP dataset spans 1988 – 2001 and has been used by hundreds of scientists worldwide. It is perhaps the most comprehensive record of Earth’s water vapor ever assembled. However, the best water vapor sensing spacecraft ever flown, NASA’s Aqua satellite, did not become available until mid-2002. How does the NVAP record of water vapor compare to our new discoveries from Aqua?
This study is a roughly 6 month effort to compare the NVAP record of water vapor to findings from Aqua. In addition, Global Positioning System (GPS) retrievals of total precipitable water (TPW) will be compared at selected surface stations.
To achieve this goal, the NVAP dataset will be created for selected months in 2003 and 2004, using heritage techniques, and compared to Aqua and GPS. A journal paper documenting these findings is the expected outcome.

298
2. Research Accomplishments/Highlights: After one month of effort, the major accomplishment has been to collect the necessary datasets to create NVAP. Over 100 GB of data has been collected to date. The Atmospheric and Infrared Sounder (AIRS) Level 2 and Level 3 data is being obtained via the NASA DAAC system, and Advanced TOVS (ATOVS) and Special Sensor Microwave / Imager (SSM/I) data are being obtained through the NOAA Comprehensive Large Array Storage System (CLASS) service. Ancillary data (e.g. sea surface temperature) is being obtained through CLASS as well. 3. Comparison of Objectives Vs. Actual Accomplishments for Reporting Period: In Progress: Data collection, science code check to run in data years 2003, 2004.
Yet to Be Started: Production of an initial month of NVAP (September 2003), then production of 5 more months.
Yet to Be Started: Comparison of AIRS retrievals to NVAP fields.
Yet to Be Started: Comparison of GPS retrievals to NVAP fields.
Yet to Be Started: Journal paper documenting these findings. 4. Leveraging/Payoff: Tom Karl (Director of NOAA’s National Climate Data Center) has presented our time series figure of the tropospheric temperature, sea surface temperature and TPW anomalies at scientific conferences (Figure 1). 5. Research Linkages/Partnerships/Collaborators, Communications and Networking:
There is a close linkage to NASA in that Aqua is a NASA spacecraft and NVAP was a NASA-sponsored CDR. Results gained from this NOAA effort may help guide creation of future years of NVAP, in terms of error characterization and reanalysis efforts. 6. Awards/Honors: None as yet
7. Outreach: N/A 8. Publications:
Journal paper expected around December 2005.
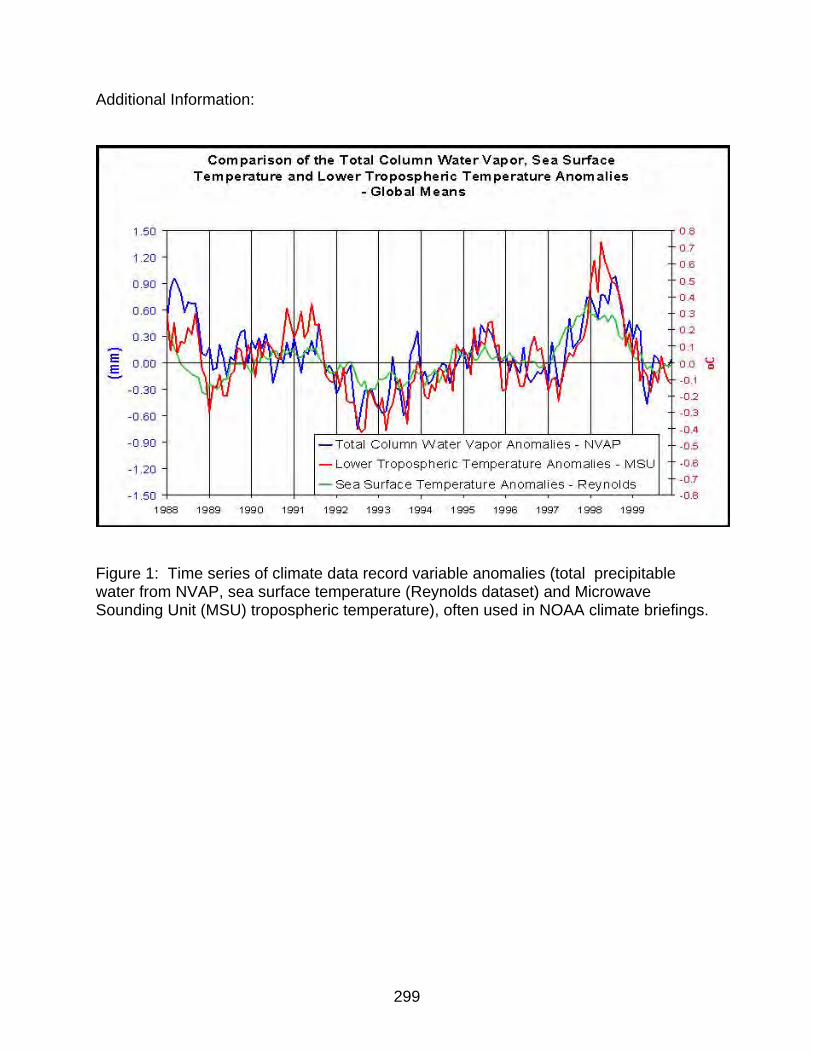
299
Additional Information:
Figure 1: Time series of climate data record variable anomalies (total precipitable water from NVAP, sea surface temperature (Reynolds dataset) and Microwave Sounding Unit (MSU) tropospheric temperature), often used in NOAA climate briefings.

300

301
SENSITIVITY OF THE NORTH AMERICAN MONSOON TO SOIL MOISTURE AND VEGETATION AND ITS TELECOMMUNICATION MECHANISMS INTO THE U.S.: A MODELING AND OBSERVATIONAL STUDY Principal Investigator: William R. Cotton NOAA Project Goal – Climate; Climate Forcing and Climate Predictions and Projections Key Words - Climate; Climate Forcing and Climate Predictions and Projections 1. Long-term Research Objectives and Specific Plans to Achieve Them:
Examine positive potential vorticity anomalies generated by monsoon convection as a telecommunication mechanism between convection over Northern Mexico during monsoon surges and convection/mesoscale convective systems over the central U.S.
Examine the relative influence and dynamics of LLJs and the monsoon boundary
layer on the evolution of precipitating systems associated with the North American Monsoon (NAM).
Examine the sensitivity of the NAM to soil moisture, soil type, and vegetation
Plans are to continue regional simulations of the evolution of the NAM for selected years using RAMS and to perform sensitivity studies with the model. 2. Research Accomplishments/Highlights:
Saleeby and Cotton (2005a,b) emphasize the model sensitivity to initial soil moisture and SST, and they reveal the strong impact that anomalies in these surface fields impose upon resulting warm season precipitation. These studies were accomplished using the RAMS mesoscale model for seasonal simulations of the North American warm season. The 1988 U.S. drought, 1993 U.S. floods, and 1997 strong El Nino seasons were simulated and tested for sensitivity to initial surface fields. Results reveal a strong localized effect of soil moisture anomalies, such that, a wet anomaly increases the surface latent heat flux, creates an anomalous low in the height field, and increases the seasonal precipitation. A domain-wide reduction in SSTs tends to impose a greater influence in regions of warmer SST. Over the Gulfs of Mexico and California, an SST reduction tends to reduce the latent heat flux, increase the height field, increase stability, and reduce the seasonal precipitation. This effect tends to extend several hundred kilometers onshore along coastal zones via a stronger sea breeze circulation induced by warm coastal areas and cooler, more stable ocean areas. While these impacts are significant, the interseasonal variability, largely controlled by strength and positioning of the monsoon ridge, is greater than any reasonable imposed variability in surface conditions.
302
Recently, a new set of seasonal simulations have been carried out from June 1 – August 31 for the 1988, 1993, 1997, 1998, 1999, and 2000 warm seasons. These simulations cover the U.S., a portion of Canada, and most of Central America. A single grid configuration is used with 30km grid spacing, the Kain-Fritsch cumulus parameterization, and single-moment microphysics with both liquid and ice species. These simulations will be further examined using various initial surface condition datasets (soil moisture, SST, and vegetation) to assess the model variability to the available datasets and determine which tend to be most reliable. Furthermore, each season is being examined for the existence of long-lived potential vorticity anomalies which form from convection over the core monsoon region and propagate into the central U.S. These anomalies can sometimes aid in formation of MCSes to the lee of the Colorado Rockies. Also, shorter-term 6km grid-spacing simulations are being carried out over the Gulf of California to better examine the structure and evolution of monsoon surge events with respect to moisture flux and development of the low-level jet. 3. Comparison of Objectives Vs. Actual Accomplishments for Reporting Period:
Our research accomplishments are consistent with the stated objectives in the original proposal. 4. Leveraging/Payoff:
The results of this research should aid in improved seasonal forecasts of the NAM and its influence on precipitation over the central U.S. 5. Research Linkages/Partnerships/Collaborators, Communication and Networking: None. 6. Awards/Honors: None as yet. 7. Outreach: (a.) Graduate/Undergraduate students (List by name, degree status and continuance after obtaining degree); (b) Seminars, symposiums, classes, educational programs; (c) Fellowship programs; (d) K-12 outreach; (e) Public awareness. (a) This research supported Steve Saleeby who is a Ph.D. candidate in Atmospheric Science at CSU. (b) Seminar given at AMS Annual Meeting (see pub list below): 8. Publications: Saleeby, S.M., and W.R. Cotton, 2005a: Sensitivity of wet and dry North American Monsoon seasons to variability in sea surface temperature and soil moisture. 85th AMS Annual Meeting, San Diego, CA.

303
Saleeby, S.M., and W.R. Cotton, 2005b: Simulations of the North American monsoon system Part II: Interseasonal variability and sensitivity to soil moisture and sea surface temperature. J. Climate, (In revision). Saleeby, S.M., and W.R. Cotton, 2005: Sensitivity of wet and dry North American monsoon seasons to variability in sea surface temperature and soil moisture. Proceedings, American Meteorological Society 85th Annual Meeting, January 9-13, 2005, San Diego, CA.

304

305
SEVERE WEATHER AND TROPICAL CYCLONE PRODUCT DEVELOPMENT FOR THE NATIONAL POLAR-ORBITING OPERATIONAL ENVIRONMENTAL SATELLITE SYSTEM (NPOESS) PREPARATORY PROJECT Principal Investigator: L.D. Grasso NOAA Project Goal: Weather and Water Key Words: NPOESS, VIIRS 1. Long-term Research Objectives and Specific Plans to Achieve Them: The long-term research objectives are to assess the utility of NPP/NPOESS instruments for severe weather and tropical cyclone applications and advanced—in time—product development. The specific plans to achieve the above objectives are to combine a numerical cloud model with an observational operator—that contains OPTRAN code along with radiative transfer models—to produce synthetic infrared images of simulated severe weather and tropical cyclone events. Synthetic VIIRS images can then be used to examine thunderstorm cloud top structure. Synthetic images will also be used to expand the scope of the project by including simulated tropical cyclones and the Advanced Technology Microwave Sounder (ATMS); that is, develop a real-time ATMS tropical cyclone intensity/size algorithm for NPP. This will be similar to the real-time AMSU algorithm that is being used by NHC and JTWC. 2. Research Accomplishments/Highlights: Our research accommplishments include the following:
Simulation of the 8 May 2003 severe weather event over the central plains of the United States, the 12 February 2003 lake effect snow event over the eastern Greal Lakes, and a 36-hour simulation of Hurricane Lili that occured over the Gulf of Mexico in October of 2002 (Figs. 1-3).
Development of an observational operator for VIIRS channel at 11.02, 12.3, and 13.3 µm.
Development of sampling rates as a function of footprint sizes of a synthetic microwave instrument for Hurricane Lili.
5. Comparison of Objectives Vs. Actual Accomplishments for Reporting Period: We have essentially met our objectives of the second year: To continue our demonstration of the procedure of combining a numerical cloud model with an observational operator to produce synthetic imagery from simulated output. Because OPTRAN code uses spectral weighting function coefficients specific to an insturment, we decided to use the current MODIS Terra coefficients since VIIRS values are not yet available.

306
4. Leveraging/Payoff: What NPOESS will recieve for resources invested is:
Advanced product development, and Extended operational use of the satellite.
5. Research Linkages/Partnerships/Collaborators, Communications and Networking: Our research linkage includes:
Coordinating with CIMSS and the Joint Center for Satellite Data Assimilation. These groups are producing the required OPTRAN coefficients and code for
radiative modeling of NPP/NPOESS channels. The coordination produces efficient production of a final product. That is, we can
avoid duplication of work and take advantage of the expertise of the other groups.
Began a collaboration with Dr. David Mitchell of the Desert Research Institute, Reno, Nevada.
6. Awards/Honors: None as yet 7. Outreach: (a) Graduate/Undergraduate students (List by name, degree status and continuance after obtaining degree); (b) Seminars, symposiums, classes, educational programs; (c) Fellowship programs; (d) K-12 outreach; (e) Public awareness. (a) None (b) See section 8 (c) None (d) None (e) None 8. Publications:
Refereed Journal Articles
Grasso, L.D., and T.J. Greenwald, 2004: Analysis of 10.7 micron brightness temperatures of a simulated thunderstorm with two-moment microphysics. Mon. Wea. Rev., 132:3, 815-825. Greenwald, T.J., T. Vukicevic, L.D. Grasso, and T. H. Vonder Haar, 2004: Adjoint sensitivity analysis of an observational operator for visible and infrared cloudy-sky radiance assimilation. Quart. Jour. Royal Met. Soc., 130:597, 685-705.

307
Presentations
Grasso, L.D., M. Zupanski, J. Dostalek, M. Sengupta, D. Zupanski, and M. DeMaria, 2004: Applications of simulated satellite observations for advanced product development of mesoscale weather events. CIRA Directors Meeting, Fort Collins, CO. A seminar entitled “GOES-R ABI/HES” was presented by Louie Grasso in March of 2005 at CIRA. Synthetic VIIRS imagery was also included in this presentation. In addition, results from this project were presented at the Interdepartmental Hurricane Conference in March of 2005. A seminar entitled “Radiative aspects of a cloudy atmosphere” was presented by Dr. David Mitchell in June of 2005 at CIRA. Additional Information:
Figure 1. Synthetic 400 m VIIRS 11.02 µm of the 8 May 2003 severe weather event over eastern Kansas and western Missouri.

308
Figure 2. Synthetic 400 m VIIRS 11.02 µm of the 12 February 2003 lake effect snow event over the eastern Great Lakes.

309
Figure 3. Synthetic 400 m VIIRS 11.02 µm of Hurricane Lili over the Gulf of Mexico on 1 October 2002.

310
311
SHIP-BASED OBSERVATIONS OF PRECIPITATING CONVECTION AND ENVIRONMENTAL CONDITIONS IN SUPPORT OF NAME-2004 Principal Investigator: Steven A. Rutledge NOAA Project Goal: Weather and Water Programs: Local Forecasts and Warnings; Hydrology; Environmental Modeling. Key Words: Monsoon, Weather Prediction, Mesoscale, Radar 1. Long-term Research Objectives and Specific Plans to Achieve Them: The long-term, overarching research objective of this work is to understand the organizational characteristics of convection in the Gulf of California/western coastal plane region of Mexico and the relationship between convection in this area and the onset of the North American Monsoon, in particular, Gulf Surges. Gulf Surges are important for establishing monsoonal conditions in the southwestern portion of the U.S. This proposed effort intended to conduct shipboard radar, profiler and thermodynamic measurements at the mouth of the Gulf of California in support of the NAME field campaign in summer 2004. The NAME project was unable to fund deployment of a shipboard Doppler radar; therefore the proposed effort was seriously compromised because of this observational limitation.
2. Research Accomplishments/Highlights: Since the observational component of NAME, our efforts have focused on QC of the shipboard sounding and 915 MHZ profiler data, and reshaping the goals of this proposed work given the notable absence of the Doppler weather radar. We have had several meetings with Dr. Chris Fairall and Dr. Christopher Williams to discuss use of the 915 MHz profiler and flux instrumentation collected on the Mexican Naval Ship, Altair. Here we are using the profiler data to characterize vertical motions in relation to convection that passed over the ship. This is one component of a project led by M.S. student David Lerach, focusing on the land-based profiler observations acquired by NOAA. Furthermore, the diurnal cycle of sensible and latent heat fluxes measured on the Altair are being related to convection. Thermodynamic sounding data acquired from the Altair are being used to identify synoptic flow patterns and Gulf Surges. These data are being incorporated into the Ph.D. study of Luis Gustavo Pereira who is developing a detailed climatology of convection in NAME.
3. Comparison of Objectives Vs. Actual Accomplishments for Reporting Period: The specific objectives of this supported research are: Detect and track seabreezes and Gulf Surges with the shipboard instrumentation; this work is underway but is obviously compromised because of the absence of the ship radar. Rather sounding and profiler data are being used to identify these periods; Identify the horizontal and vertical structure of precipitating systems and use these to validate cloud-resolving model simulations of same; this work is moving ahead very well using the S-pol and SMN

312
radar observations. An intense QC effort of the radar data has been completed in the Radar Meteorology Group, led by Dr. Timothy Lang; Investigate the coupling of deep convection over both the ocean and nearby land surfaces to changes in ocean fluxes and resulting effects on SST; this work has not yet started but will be conducted in the coming research period.
4. Leveraging/Payoff: This work has direct couplings to improving the numerical forecasts of the North America Monsoon, the major warm-season precipitation source for a large region of the southwestern U.S. The ability of forecast models to simulate convective rainfall and moisture transport are expected to be improved by the NAME project. Radar and thermodynamic analyses planned as part of this work are central to achieving these improvements.
5. Research Linkages/Partnerships/Collaborators, Communications and Networking: This work is coupled to support provided by NSF for NAME analyses, in particular, analysis of the NCAR S-pol data. We have also formed research collaborations with the following NAME investigators: Dr. Phil Arkin in the area of satellite-radar precipitation algorithms; Dr. David Gochis in the area of radar-rain gauge rainfall products, with particular attention to studying rainfall behavior as a function of topography on the SMO; Dr. Mitch Moncrieff, in the area of validating mesoscale and cloud-resolving model simulations of NAME convection against radar observations; Dr. Walt Petersen relating easterly wave passages to convective structures and associated modulation in lightning frequency.
6. Awards/Honors: None as yet
7. Outreach: (a.) Graduate/Undergraduate students (David Lerach, M.S. candidate) List by name, degree status and continuance after obtaining degree); (b) Seminars, symposiums, classes, educational programs; (c) Fellowship programs; (d) K-12 outreach; (e) Public awareness. None
8. Publications: The North American Monsoon Experiment (2004) Field Campaign. Bull. Amer. Meteor. Soc., submitted March 2005. (W. Higgins, et al.)

313
STUDY OF GULF SURGES USING QUICKSCAT AND NAME OBSERVATIONS Principal Investigator: Richard H. Johnson NOAA Project Goal: Climate Key Words: Monsoon, precipitation, atmospheric budgets 1. Long-term Research Objectives and Specific Plans to Achieve Them: The objectives of this research are to investigate the temporal and spatial characteristics of southerly wind surges in the Gulf of California during the North American summer monsoon. Past attempts to describe and understand these surges have been hampered by a lack of an adequate in-situ observing network. It is our intent to analyze QuikSCAT data for the 2000-2004 period to test the hypotheses that: (i) QuikSCAT-derived surface winds can be used as an effective tool to monitor Gulf Surges, map their evolution and spatial variability, and determine their variability on seasonal to interannual timescales, and (ii) a source of cool air in Gulf Surges is from an acceleration of the flow across the strong SST gradient that exists at the southern tip of Baja. Candidate mechanisms for accelerating this flow are easterly waves, hurricanes, or mesoscale convective systems. Enhanced measurements from the 2004 North American Monsoon Experiment (NAME) field phase will be used to investigate these possible mechanisms. We also proposed to conduct a mesoscale modeling study to investigate the dynamics of monsoon surges. 2. Research Accomplishments: QuikSCAT data have been used to investigate Gulf Surges and their interannual variability for the period 2000-2004. Surges occur in all summers, but are stronger in some summers than others. A large fraction are connected with tropical cyclone passages to the south of the Gulf of California. The 2004 NAME experiment provided an unprecedented dataset for studying Gulf Surges. These data are currently being processed and analyzed and we anticipate new results concerning the structure and dynamics of Gulf Surges within the coming months. 3. Comparison of Objectives Vs. Actual Accomplishments for Reporting Period: a. General properties of Gulf Surges as determined by QuikSCAT Gulf Surges can be readily detected by QuikSCAT, as noted in our recent paper on surges in 2000 (Bordoni et al. 2004). Further work is underway to investigate and compare surges for other years. b. Mechanisms for surge initiation and propagation NAME 2004 has provided new insight into the structure and dynamics of Gulf Surges. Preliminary results from the NCAR ISS network along the Gulf of California indicates

314
that there is an initial pulse in the surges that has characteristics of an undular bore (Johnson et al. 2004). NAME data are currently being used to further investigate the properties of Gulf Surges. 4. Leveraging/Payoff: Gulf Surges directly impact precipitation in the southwestern United States. Improved understanding of their initiation and propagation should contribute toward improved skill in prediction of rainfall in that region. 5. Research Linkages/Partnerships/Collaborators, Communications and Networking: In the course of our research, we have developed collaborations with Ph.D. candidate Simona Bordoni and Prof. Bjorn Stevens of UCLA, and a paper has come out of this collaboration (Bordoni et al. 2004). In addition, we have been collaborating with Dr. Tim Liu of NASA JPL on the use of a high-resolution QuikSCAT data set they have prepared especially for NAME. 6. Awards/Honors: None as yet 7. Outreach: M.S. graduate student, Peter Rogers, had partial support from this grant. Operation of CSU NAME sounding data ingest, processing and display facility for forecasters and operations in the field phase of NAME in Tucson, AZ. Dissemination in 2005 of NAME sounding-related datasets at http://tornado.atmos.colostate.edu/name/. Invited talk at Climate Diagnostics Workshop, October 2004, Madison, WI. 8. Publications: Refereed Bordoni, S., P. E. Ciesielski, R. H. Johnson, B. D. McNoldy and B. Stevens, 2004: The low-level circulations of the North American Monsoon as revealed by QuikSCAT. Geophys. Res. Lett., 31, L10109, doi:10.1029/2004GL020009. Higgins, R.W., 2005: The North American Monsoon Experiment (NAME) 2004 field campaign and modeling strategy. Bull. Amer. Meteor. Soc. (submitted). Conference and Workshop Presentations Ciesielski, P.E., 2005: Enhanced sounding network: Performance and results. Presented at the NAME 2004 Data Analysis Meeting and 7th Meeting on the NAME Science Working Group, March, Mexico City, Mexico.

315
Johnson, R.H., 2005: Gulf surges, the diurnal cycle, and convective outflows during NAME as revealed by the NCAR ISS array. Presented at the NAME 2004 Data Analysis Meeting and 7th Meeting on the NAME Science Working Group, March, Mexico City, Mexico. Johnson, R.H., and P.E. Ciesielski, 2004: Preliminary results of the NCAR ISS deployment in NAME. Prepared for the Climate Diagnostics and Prediction Workshop, October, Madison, WI. Johnson, R.H., P.E. Ciesielski, and B.D. McNoldy, 2003: A study of Gulf Surges using QuikSCAT data. Fifth Meeting of the NAME Science Working Group (SWG-5), Puerto Vallarta, Mexico.

316

317
SUPPORT OF THE VIRTUAL INSTITUTE FOR SATELLITE INTEGRATION TRAINING (VISIT) Principal Investigator: T. H. Vonder Haar NOAA Project Goal: Weather and Water Key Words: Professional Training, Satellite Interpretation, VISIT, NWS Training, GOES, Rapid Scan Operations 1. Long-term Research Objectives and Specific Plans to Achieve Them: The primary objective of the VISIT program is to accelerate the transfer of research results based on atmospheric remote sensing data into National Weather Service (NWS) operations. This transfer is accomplished through teletraining modules developed at CIRA and delivered to NWS forecasters. This objective is achieved by the development and delivery of new satellite-based training sessions at CIRA. New topics for teletraining are suggested by either NWS or VISIT personnel, and are often related to new satellite products available in the Advanced Weather Information Processing System (AWIPS). In the last year, two new teletraining sessions have been developed at CIRA, in addition to nine sessions created by VISIT collaborators. As training needs develop for new research and products, VISIT personnel will address those needs by building new teletraining sessions. 2. Research Accomplishments/Highlights: Based on extensive feedback from participants, the VISIT program has fulfilled the original goal identified in 1998. The number of topics addressed, and participating students, has increased appreciably. A typical monthly training calendar now contains about 15 teletraining sessions over a wide variety of topics. To date, over 15,000 training certificates have been awarded (Fig. 1), and most student feedback suggests a direct applicability to current forecast problems. Most NWS forecast offices have participated in VISIT teletraining since October 1, 2004 (Fig. 2). The VISIT website (http://rammb.cira.colostate.edu/visit) contains stand-alone versions of most sessions, with embedded instructor notes, that can be viewed using a web browser. There are audio versions with instructor’s annotations for selected sessions. The web/audio versions make it possible to view the material at any time. VISIT teletraining applications continue to expand as more NOAA offices turn to this approach as a cost-effective solution to the problem of increased training requirements coupled with shrinking training and travel budgets.

318
IST/VISIT Cumulative Training Certificates Issued
0
2000
4000
6000
8000
10000
12000
14000
Apr-99
Jul-9
9
Oct-99
Jan-0
0
Apr-00
Jul-0
0
Oct-00
Jan-0
1
Apr-01
Jul-0
1
Oct-01
Jan-0
2
Apr-02
Jul-0
2
Oct-02
Jan-0
3
Apr-03
Jul-0
3
Oct-03
Jan-0
4
Apr-04
Jul-0
4
Oct-04
Jan-0
5
Apr-05
Jul-0
5
Date
Cer
tific
ates
Figure 1. IST/VISIT Cumulative Training Certificates Issued.
Figure 2. Map showing the NWS forecast offices that have taken VISIT teletraining session(s), number of sessions attended given by the color.

319
3. Comparison of Objectives Vs. Actual Accomplishments for Reporting Period: In the last year, the VISIT team at CIRA has developed two new teletraining sessions: 1) Utilizing GOES Imagery within AWIPS to Forecast Winter Storms, and 2) Monitoring Gulf Moisture Return with GOES Imagery. Each of these sessions was recommended by operational forecasters from the NWS. All other objectives of the proposal were also accomplished. 4. Leveraging/Payoff: In the late 1990s, NOAA’s NWS training requirements began to outpace the availability of travel funds. At the same time, the Internet was becoming more reliable, bandwidth was increasing, and computers were becoming more powerful. The timing was right for the introduction of distance learning. With travel costs increasing and budgets decreasing, the VISIT program continues to provide an attractive alternative to costly residence training. Live interaction between instructors and students via teletraining is the next best alternative to actual classroom training, and is performed at a fraction of the cost. 5. Research Linkages/Partnerships/Collaborators, Commuinications and Networking: The project involves considerable collaboration within the National Weather Service through contributions to training material, input on "beta-tests" of training sessions, and feedback following the delivery of the training. Coordination also occurs with other agencies involved in satellite training such as NESDIS ORA, DoD and COMET. 6. Awards/Honors: None as yet 7. Outreach: (a) Graduate/Undergraduate students (List by name, degree status and continuance after obtaining degree); (b) Seminars, symposiums, classes, educational programs; (c) Fellowship programs; (d) K-12 outreach; (e) Public awareness. (a) A high school student and a college undergraduate student are supported by this project. (b) B.H. Connell and J.F.W. Purdom, March 7-18, 2005: A WMO sponsored Regional Training Course on the Use of Environmental Satellite Data in Meteorological Applications for RA III and RA IV, Costa Rica. San Jose, Costa Rica. D.E. Bikos, J.F. Weaver, J. Braun, and R.M. Zehr, Jul 1, 2004 – Jun 30, 2005: 179 VISIT teletraining sessions delivered to NWS offices, and others (3601 participants). CIRA, Fort Collins, CO. (c) None (d) D. Watson, H. Gosden, D.A. Molenar, April 13, 2005: Meeting regarding the partnership of RAMMB/CIRA and the Poudre High School PaCE (Professional and Community Experience) Program.
320
J.F. Weaver, March 7, 2005: My Career in Meteorology and How I Got There . PaCE (Professional and Career Experience) program. Fort Collins, CO. (e) VISIT training material is available to the public via the Internet.
J.F. Weaver, October 6, 2004: The variety and scope of research taking place at CSU. Series for local business owners. Fort Collins, CO.
8. Publications:
Refereed
Bikos, D., J.F. Weaver, and J. Braun: The Role of GOES Imagery in Tracking Low-level Moisture. Submitted to Wea. and Forecasting.
Newsletters
Weaver, J.F., 2004: Heavy Snowfall in the Midst of a Drought. CIRA Magazine, 22, Fall, 8-13. Presentations D.E. Bikos and J. Braun, April 13-14, 2005: The VISIT program and VISITview software for distance learning. Information Science and Technology Colloquium, Fort Collins, CO.

321
THE CIRES-NOAA WESTERN WATER ASSESSMENT—PROVIDING INCREASED FOCUS ON THE CRUCIAL AGRICULTURAL SECTOR Principal Investigators (current): Dr. John Wilkins-Wells/Mr. John McKenzie, Ph.D. student, Department of Agricultural and Natural Resource Economics NOAA Project Goal: Local and Regional Decision Support For Agricultural Producers, Mutual Ditch Companies, and Irrigation Districts Key Words: Monte Carlo simulation, regression, risk, uncertainty, forecasting, quotas, streamflows, water resources, ditch companies, irrigation districts, decision analysis. 1. Long-term Research Objectives and specific Plans to Achieve Them: Introduction: Farmers and ranchers develop plans of action based on their expectations of events that may occur during their planning, production, and marketing horizon. These ex-ante decisions include their expectations of future prices, production potential, and marketing constraints. Additionally, expectations of weather and climate conditions that relate to the availability of water in the West are seriously considered in the mixture of risk variables that producers must sort out on a seasonal basis. Reducing the uncertainty of expectations through water forecasting techniques for irrigation districts, mutual irrigation companies and their agricultural producer members have been available to them, not site specifically, but on a regional basis. It is proposed that micro-watershed analysis is preferable as a planning tool to regional forecasts for these agricultural water suppliers and their members in order to make better economic decisions. It is argued that future research should be directed at providing more capabilities for irrigators in site-specific forecasting, in addition to large river basin or regional forecasting. Climate forecasting information specifically designed for use by agricultural water supply organizations has lagged behind other information and hardware technologies for the distribution and management of water, such as technologies for improved business record keeping and improved measurement of water to achieve equity in water distribution and water conservation. The current research is taking place in the context of working with, learning from, and partnering with local ditch companies, irrigation districts, agricultural producers, water commissioners, and the Ditch and Reservoir Company Alliance of Colorado (DARCA). This “ownership” in the research by the ditch companies/water users and a reputable representative of their interests (DARCA) is crucial for the successful adoption of the output of the research. The research is a unique opportunity for the climate and technical expertise of The Western Water Assessment and the Climate Diagnostics Center of NOAA to develop site-specific solutions for agricultural water suppliers in a partnership setting. The agricultural and water sectors in the United States have initiated and adopted emerging technologies that have increased efficiencies and productivity. Net returns to farmers have increased by advances in the size and precision of agricultural equipment,
322
the introduction of F1 hybrid seeds, the increased efficiency of irrigation, and by advances in the optimal uses of inputs. Meanwhile, agricultural water suppliers have utilized information and hardware technologies for the efficient distribution and management of water, such as technologies for improved business record keeping, GIS, and water conservation measures. However, site-specific climate forecasting information designed for use by farmers and agricultural water supply organizations has lagged behind other advancements. The use of decision strategies surrounding information on climate factors may be the most important and underutilized tool that farmers and water supply organizations have at their disposal today. Reliable and adequate forecasts may have a profound influence on the financial viability of their farmer shareholders. This decision making expertise is a crucial part, if not an essential component, of the modernization of irrigated agriculture in the West. An advancement that has not been widely adopted is the use of sophisticated decision making technologies for those decisions that involve risk and uncertainty. Risk can be thought of as those uncertain events that can be explained, while uncertainty can be described as those uncertain events which cannot be modeled with much confidence. Over time, uncertainty can be upgraded to mere risk if analytical methods are developed and sufficient data is generated and collected. These decision making technologies include the applied uses of Monte Carlo simulation, stochastic optimization, and real options. Desktop computers, increasingly able to perform more calculations per second, have become relatively inexpensive; software is user friendly and powerful; information for the water and farm sectors is easily accessible in digital format and for the most part is free of charge. The water and farm sector’s abilities to access free and plentiful quantities of historic information - unlike most U.S. industries - would appear to give it an advantage over other sectors of the economy. However, the widespread implementation of on-going decision analysis under uncertainty for problems at the farm/water supply level is lacking. Corporate America is also awash in a deluge of information along with the local water and agricultural sectors; and they, too, fail to capitalize on it. Long Term Research Objectives: This research focuses on the application of risk assessment modeling techniques for catchment basin water yield and regional and local climate forecasting for mutual ditch companies and irrigation districts operating in mountainous and semi-mountainous areas. These water suppliers have unique needs that often cannot be met by larger river basin modeling and regional and local climate forecasting, due to catchment basin variation in snow fields, elevation, forest cover, evapotranspiration, wind velocity, and rain shadow effects. Methods of modeling catchment basin water yield will include Monte Carlo simulation and stochastic optimization of historical water data provided by those cooperating with the researchers. The key research question is how effectively such analytical tools can be applied to the needs of these smaller mutual ditch companies and irrigation districts in mountainous and semi-mountainous areas. The research involves assessing the capability of these smaller water providers to make better use of more sophisticated risk assessment modeling of local catchment basin water yields using historical and forecasted climate data. The end product is an improved method of modeling risk assessment of water supplies. Eventual adoption of such modeling is expected to allow irrigators to more effectively consult with district and ditch company management regarding monthly

323
delivery adjustments based on how much risk the irrigators are willing to undertake in calling for remaining water supplies. The research is analyzing three systems to test and assess the suitability of the water supply risk assessment modeling technique. These systems are located on Surface Creek, the Florida River and on Boulder Creek. In cooperation with the National Oceanic and Atmospheric Administration, the risk assessment modeling combines small catchment basin data with regional climate information and forecasts by NOAA to determine how regional climate forecasting data can be used more effectively in small catchment basin risk assessment. The modeling methodology includes combining regression techniques with Monte Carlo simulation. Inputs into the model will be in non-parametric terms using actual historical data as the input rather than assuming normal curves with their associated parameters of means and standard deviations. The output of the regression equation will be analyzed in the context of risk (Monte Carlo simulation) to provide confidence bands around predicted results. The additional step of adding climatological distributions from NOAA is introduced into the regression equations for forecasting purposes. The likelihood of water supply and water supply needs are predicted, allowing the user to decide on the lowest risk course of action. Training in this methodology would be provided to the participants as part of the research. Specific Plans:
a. Develop a short working bibliography of key literature on quota forecasting techniques and water supply prediction capabilities for agricultural water suppliers.
b. Meet with Western Water Assessment (WWA) staff to discuss and learn
about all pertinent NOAA climate forecasting capabilities, and how they possibly relate to the current research objectives.
c. Use DARCA’s guidance to identify three representative mutual ditch and
irrigation companies or irrigation districts that are representative of these organizations in the state of Colorado to study their quota setting river diversion prediction systems and develop a model for each. The criteria of selection will be: 1) a manageable watershed to work with, 2) a ditch company/irrigation district that does not have the most senior rights on the creek/river, 3) enthusiasm and need from management and staff, 4) canal companies that rely on their supply from direct flow and storage sources, 5) water suppliers and their shareholders that were impacted greatly from the 2002 drought. Work with DARCA’s management company to develop a working dialogue with DARCA’s members.
d. Organize and deliver three one day workshops on traditional methods estimating water supplies, and introduce the concept of quota setting and predictions based on uncertainty, in order to determine ways in which these procedures might be improved in the future. Workshops are to be held in the summer of 2005. The participants will become familiar with the techniques of risk modeling and the interpretation of the results of this modeling technique. The workshops will provide the attendees with working models. The workshops will explore the role of climate
324
information in current quota setting and river diversion prediction procedures. Specifically the workshops will discuss and obtain feedback on:
i. Developing an applied model of quota setting and river diversion
prediction that is more readily applicable to the needs of ditch companies, particularly in their ability to set optimal seasonal estimates of water availability. A dynamic forecasting system that has the ability to predict available river water on a monthly basis would have the most benefit.
ii. Developing ways to improve quota adjustments and predictions during the irrigation season based on probability modeling of changing water supply conditions (i.e., Monte Carlo simulation).
iii. Discussion of drought management plans implemented by these organizations in the past.
iv. Utilizing climate products developed by NOAA and other climate data sources, determine what type of climate forecasting tools and information would be most beneficial to ditch companies.
v. Outline of delivered material for workshop: 1. Participation of attendees on their needs, appropriate
methods of diffusion of the technology, and impediments to adoption.
2. Decision Making – subjective and objective techniques 3. Problems with current decision making and alternatives
under uncertainty. 4. Statistical concepts 5. Theoretical basis of the modeling 6. Monte Carlo Simulation 7. Forecasting techniques 8. Application and interpretation of the modeling.
e. Assess potential for inclusion of NOAA climate modeling into the Monte
Carlo simulation model being developed for improved quota setting by ditch companies and irrigation districts. Identify NOAA data that can be used in the Monte Carlo modeling research, including snow pack, weather forecasting, soil moisture data, watershed yields, etc. Look at NOAA’s methodology. Transfer usable NOAA data to the research project.
f. Begin compiling data on the three selected water supply organizations
being utilized for the modeling of quota setting and river diversion predictions. This includes compiling historical data on their diversion records, delivery records, reservoir storage, and quota announcements and adjustments made in previous years. Particular attention will be given to operational characteristics of the sampled organizations (staffing, board of director characteristics, etc.), as this data is compiled.
g. Conduct a literature review of appropriate forecasting methods and
consult with NOAA/CSU personnel on potential techniques. Run beta test

325
on the forecasting technique including the Monte Carlo simulation analysis using the data compiled from the selected organizations. Determine the most appropriate regression technique and pay attention to the regression assumptions and post regression problems. Determine whether a time series or a cross sectional method would be more appropriate. Determine any corrective action involved with the forecasting technique. Determine accuracy of the different forecasting techniques. Consult with the representatives of these organizations on the interpretation being given to their historical records on water supply and quota setting. Integrate NOAA data (i.e., snow pack, soil moisture, climate data) for the selected years of the Monte Carlo simulation analysis.
h. Begin assessing the most relevant procedures for information technology
transfer of the model to agricultural water suppliers in Colorado.
i. Begin to use the physical model for economic, planning and financial applications including production functions, portfolio modeling, and other decision analysis of producers and ditch companies.
j. Present initial findings to the DARCA annual convention in 2006.
k. Finalize model in 2006 and 2007. Investigate the applicability of the model
for general users, consultants, extension agents, and engineers.
l. Decide the most appropriate route for technology transfer. 2. Research Accomplishments/Highlights: Research Highlights for 2005: The research focused on three micro-watersheds in the state of Colorado, namely the Surface Creek catchment above Cedaredge, Colorado, the Florida River catchment above Lemon Reservoir near Durango, and Boulder Creek watershed serving the Boulder and White Rock Ditch and Reservoir Company. The emphasis of the 2005 research was analytical and not merely descriptive in nature. The modeling was carried out under regression techniques coupled with Monte Carlo simulation. Explanatory variables were examined including proxies for soil moisture, temperature, precipitation, snow water equivalent, wind, streamflows, and dust storms. In essence, the outputs of the models are to be reported as a probability density function. The simulation of the regression equation allows the use of variables that will occur in the future, i.e. climatological distributions to be inputted as probability density functions. Surface Creek, Working Group Surface Creek, Delta County: A group of water users from Surface Creek has been meeting over this year with the research team to develop a forecasting model for the stream flows at gauging station No. 09143000, 7 miles northeast of the town of Cedaredge. A reliable forecasting model will enable water users along the creek to obtain better estimates of future flows in the creek. The group has provided valuable information and insight into the facts and nuances of the area. The
326
watershed of Surface Creek is comprised of many small reservoirs on the Grand Mesa, Colorado; the area above the gauging station consists of 27.4 sq. miles. Water from the creek is used to fill Fruitgrowers Reservoir, a Bureau of Reclamation project. The creek continues its way through Orchard City where it enters the Gunnison River. The agricultural advisory group to the research was interested in determining the probabilities of various flows in the Creek at different times of the year. This knowledge would enable the growers to know when certain senior and junior water decrees would be entitled to divert water out of Surface Creek. A logistic regression model was developed to predict these probabilities for each of the water decrees. Florida Farmers Ditch Co. and the Florida Co-op Ditch Co., Florida River, La Plata County: The headwaters of the Florida River start on the south slopes of the Needle Mountains in the San Juan River drainage basin. The two ditch companies participating in the research rely on direct flow from the river and the important storage water released from Lemon Reservoir to provide irrigation water through their 86 miles of ditches. The two main ditches have a capacity of 185 c.f.s., with 90 c.f.s. being adjudicated native river flows. Lemon Dam was completed in 1963 under the Bureau of Reclamation’s Colorado River Storage Project. Its drainage area comprises 68 sq. miles and the reservoir has a capacity of 40,146 acre feet. The modeling developed an accurate predictive model of storage and direct water flows entering Lemon Reservoir that the two ditch companies can utilize to forecast availability of water during different months of the irrigation season. Boulder and White Rock Ditch and Reservoir Company, Boulder Creek, Boulder County: The Boulder and White Rock Ditch and Reservoir Company diverts water from Boulder Creek and its service area includes farms in Boulder and Weld Counties. Its system includes twenty-one miles of ditch and two storage reservoirs. The ditch company is working with the research group to develop a model to more accurately issue a quota of river water. The need for such a forecast was made evident during the drought of 2002. The modeling focused on actual water delivered to shareholders. Newsletter: A four page newsletter explaining the research and announcing the workshops was distributed in June and July of 2005 to approximately 900 people or entities in the water community in Colorado. Workshops: The Sociology Water Lab has been in communication with and has met representatives from various entities in the water community from the three areas of the study: Surface Creek, Florida River and Boulder Creek. The meetings prior to the workshops assisted in directing the research and a continual working relationship with the participants was established. Three workshops were conducted, in Cedaredge, Durango, and in Boulder. The goals of the workshops were to: discuss the problem statement and methodology; introduce the participants to risk analysis, Monte Carlo simulation, and forecasting techniques; explain the models and their output; and elicit their comments and input. The Micro-Watershed Forecasting under Uncertainty workshop is a full day workshop of decision making under uncertainty, statistics, and forecasting strategies that brings the

327
power of the personal computer to bear on water and farm management practices. The team from the Sociology Water that delivered the content includes John Wilkins-Wells, John McKenzie, and Troy Lepper. John Wilkins-Wells first introduces the team and the work of the Sociology Water Lab. The Water Lab methodology is explained; it is based on partnering with the end users of the research product so that a useful, applied application of the output is the result. A brief explanation of what we are doing in each particular micro-watershed is presented and the overall format that the workshop will cover. Next, John McKenzie goes through basic explanations of what risk and uncertainty are, and how these concepts affect farm and water management. During this phase of the workshop, our research team uses anecdotal stories to tease out how water is managed in a particular micro-watershed. One particular person in the Florida workshop told a story about how one of the old timers gauged when his water would run out. According to the old timer, once one particular area on the La Plata Peak was bare he knew that his right was going to be called out of the river (and according to those in the workshop, he is usually right). Such information from local water users provides important background information for the modeling. These workshops are also designed to demystify the mathematical and statistical foundations of forecasting in a way that allows the layperson the ability to utilize these instruments to predict with confidence intervals what could happen in their particular micro-watershed at any given time. One of the most important parts of these workshops comes early on when everyone in the workshop receives a 30-minute refresher on statistical methods. If the layperson is going to use methods dealing with risk and uncertainty, they first need a refresher in statistical methods. Weather and climate data are often reported in likelihoods; therefore people need an understanding of this thought process in order to make this type of data useful to them. This statistical review covers the basics, starting with measures of central tendency (mean, median, and mode). The workshops then discuss how the data deviates from our measure of central tendency, usually the mean, by revisiting standard deviations. Once standard deviations have been discussed we move into the different types of distributions we have available for forecasting (normal distributions, other probability density functions, and non-parametric custom distributions). We then wrap this session up with a basic critique of the limitations of probability density functions that rely on an underlying function with its associated parameters. The importance of non-parametric distributions which give a more realistic picture of the data - ones where the actual data is the distribution – are explained. We cannot over-emphasize the importance of this section of the workshops. This brief explanation of basic statistical concepts lays the foundation for everything that we do for the rest of the workshop. These sessions have been well received by those attending the workshops. In the morning session we touch on different types of technological advances that have been adopted by agricultural producers and water providers, while explaining at the same time that decision making technologies have lagged. Different types of deterministic decision making technologies are readily available today (accounting,

328
enterprise analysis, deterministic optimization), but agricultural water users need new stochastic tools to be adopted (Monte Carlo simulation, stochastic optimization, and real options), and easy ways to make use of them in their water system operational plans. Next, the Monte Carlo technique is discussed and how this method actually works. John McKenzie spends a considerable amount of time discussing the mechanics of Monte Carlo analysis. This discussion covers random numbers and how these random numbers are used to generate probability density functions. We then do two empirical examples of how the random number generator can drive a simulation, utilizing problem solving that the water users are familiar with. One is activity based for the participants – a physical simulation that uses a hand-on approach of drawing wheat yields and prices from a hat. These examples are designed to demystify the Monte Carlo analysis in order to give those in the workshop a better understanding of what simulation is doing. One of the examples also gives those in the workshop an opportunity to participate in the actual Monte Carlo analysis, which we know from experience helps make this example understandable. One of the things that sets Monte Carlo simulation apart from other methods is the ability to correlate variables to give a more realistic picture of the data we are modeling. We then discuss correlations and how those correlations, be they negative or positive, affect the output of a model. Stochastic optimization, a powerful but underutilized technique, is another tool that we cover briefly. It is intended to show that very complex optimization problems can be solved under uncertainty. A variation of the traveling salesman problem is shown. Such a problem cannot be solved through an enumeration process, but rather with an optimization algorithm. The participants are asked how these types of problems can be translated into the world of water. For instance, stochastic optimization can be used to optimize water exchanges in a particular water resource management division, micro-watershed, or ditch company. The afternoon session brings all the lessons from the morning to bear on the individual micro-watershed each individual workshop is dealing with (Cedaredge, Florida, Boulder). One of the comments from folks in the workshops in regards to the morning session is that individuals are overwhelmed by the methods discussed, but during the afternoon session things become a little clearer because these methods actually come to bear on their particular micro-watershed. Generally speaking, the input we get in this session helps us zero in on the nuances of the particular micro-watersheds the research is modeling and potential discrepancies with the data we have obtained from various sources for the analysis. The data that are gathered are subject to measurement error, and we interact with water users in the actual micro-watershed to get a better handle on these data. This type of grounding of the data and its analysis is rarely done, but in our opinion must be done if the data collected and used for the modeling is going to be helpful to the actual water users in each individual catchment. Forecasting in each individual micro-watershed is then addressed in this session. One of the helpful aspects about this session is that John McKenzie actually runs through a few models from the start to the finish. We start with the actual raw data and work our way through the data analysis. John starts with a regression, then works through a Monte Carlo analysis, and then does an actual forecast of the water that will be

329
available in a given year. Depending on the model, John may use inflows, snow water equivalent, precipitation, average temperature, and minimum flows as the independent variables in the modeling. The dependent variable may vary as well, depending on ideas generated during discussions. The final segment of the workshop is led by Troy Lepper who interacts and solicits feedback from the participants. During all three workshops, comments from the participants were first-rate and they brought valuable insight into the research project. Comments:
• There are participants who are not very familiar with using Excel. o Some of them want to become better Excel users. A course is being
planned for Jan or Feb 2006. • Variables to include to predict water available
o Dust storms can deposit soil on the snow which will hasten the melting process. This could be modeled as a binary variable.
o Smoke and forest fires could affect a model. A drainage may be altered from a forest fire.
o Look at winter reservoir storage water carry-over from the previous season.
o Look at higher and lower elevation snow pack. Proxies for lower level snow pack may have to be investigated. Perhaps, Forest Service grazing dates could be used.
o Seasonality can be a factor in a model. Does the dependent variable under consideration have a significant autocorrelation?
o Look at the variables in 15-minute intervals rather than a day average. o Look at wind at other sites such as CSU Ag Experiment Station, airports,
volunteer weather stations. o Look at degree days and solar radiation.
• Water Availability Issues o Is there going to be fall river water? o How can we better store water for dry years? o How can we stop the irrigation water from going to the cities?
• Planning o Can the City of Boulder more effectively model their portfolio of water for
production on open space by using the techniques from the workshop? o Models can be used to inform and understand the behavior of the micro-
watersheds. o Local water districts may be able to better coordinate with ditch companies
if they are on a level playing field with the same information. These districts have many decisions to make including leasing water, rate restrictions, building infrastructure, etc. and these tools may of use. These districts could partner with the owners of private water rights.
o Some areas may have limited ability to use the information for changing their portfolio of crops especially when their crops are mainly orchards or alfalfa.

330
• Accountability Issues o Who wants to be held accountable for issuing a water availability forecast? o Who should get the information? Should the shareholders or users have
free access to the information? • Technology Transfer Issues
o The water commissioner, state of Colorado, or the Bureau may the entity to disseminate the data.
o A streamflow chart could be produced that shows the probability of flows for each day of the month. It could be updated on bi-monthly.
A questionnaire was sent out to the participants after the workshops for their evaluations.
3. Comparison of Objectives Vs. Actual Accomplishments for Reporting Period: Modeling of Three Catchments – Completed but future research to refine the model is in progress. Working with NOAA to add climatological distributions to the model – In progress Newsletter – Completed Workshops – Completed Economic, planning, and financial applications – In progress
4. Leveraging/Payoff: A more precise procedure for announcing and adjusting water deliveries over the course of the irrigation season will be tested, in order to help water managers: (1) better estimate water delivery quotas for their users, (2) improve the timing of water releases over the course of the growing season and, (3) help optimize water conservation. Staff on mutual ditch companies and water districts may benefit from risk assessment models that predict total water supply during the irrigation season and/or models that update predictions of total water supply, including the temporal dimension of calls on the river. If improvements can be made in determining the probability of a quantity of water for these water supply organizations, irrigators can then explore an optimal portfolio of crops, reduce risk in the extent of plantings, determine more appropriate irrigation scheduling, and participate more effectively in emerging water marketing institutions (e.g., forbearance contracts, water banking, informal exchanges, leasing of water, etc.). Ranchers will be better able to determine the carrying capacities of their range land. Other decisions, such as forward contracting, hedging, and the need for crop insurance, can be evaluated with more skill.
5. Research Linkages/Partnerships/Collaborators, Communications and Networking: The Sociology Water Lab is beginning to implement the technology transfer of the forecasting models to agricultural water suppliers throughout the West. The Sociology Water Lab is currently collaborating and seeking funding from the Science and Technology Division of the United States Bureau of Reclamation. This research with Reclamation is a continuation of these risk assessment modeling techniques for

331
catchment basin water yields and regional and local climate forecasting for small irrigation districts operating in mountainous and semi-mountainous areas served by Reclamation project facilities. It includes further modeling and workshops with Reclamation personnel. Further contacts with NRCS, the Colorado State Engineer, USGS, and state conservancy districts are being carried out.
6. Awards/Honors: None as yet
7. Outreach: (a.) Graduate/Undergraduate students; John D. McKenzie, Agricultural and Resource Economics, Ph.D. candidate, Troy Lepper, Sociology, Ph.D. candidate (b) Seminars, symposiums, classes, educational programs; See information on workshops (above) (c) Fellowship programs; none (d) K-12 outreach; none (e) Public awareness. See information on newsletter.
8. Publications: None as yet

332

333
THE ROLE OF AFRICA IN TERRESTRIAL CARBON EXCHANGE AND ATMOSPHERIC CO2: REDUCING REGIONAL AND GLOBAL CARBON CYCLE UNCERTAINTY Investigators: Principal Investigator: Niall Hanan, Natural Resource Ecology Laboratory, Colorado State University Joseph Berry, Carnegie Institution of Washington Robert J. Scholes, Centre for Scientific and Industrial ResearchAfrica A. Scott Denning, Department of Atmospheric Sciences, Colorado State University Jason Neff, University of Colorado Jeffrey Privette, NASA-Goddard Space Flight Center Senior Personnel: Dr. Christopher A. Williams, Natural Resource Ecology Laboratory, Colorado State University Dr. Neil Suits, Department of Atmospheric Sciences, Colorado State University
NOAA Project Goal: CLIMATE (Climate Forcing, Climate and Ecosystems) Key Words: Carbon Cycle, Africa, Global, Terrestrial Ecosystems Much uncertainty remains in our understanding of the ways in which atmospheric, terrestrial and oceanic carbon reservoirs interact, and the controls, magnitude and location of fluxes that determine atmospheric CO2 mixing ratio and terrestrial and oceanic sequestration. Analysis of the rate of increase of atmospheric [CO2] suggests that carbon uptake by terrestrial ecosystems offsets fossil fuel emissions by 1.5-2.0 Gt per year. Several studies suggest that a significant proportion of that sink lies in northern deciduous and boreal ecosystems, but the range of estimates by different techniques is large and research also indicates a strong tropical sink. Furthermore, inverse estimates of the role of tropical regions in global carbon exchange may be underestimated because of the paucity of real data and because deep convection in the tropics may mask the tropical signal in the existing network of [CO2] measurements. With expanded research in neo-tropical regions during the last few years, the weakest link in our current understanding of the global carbon cycle, and concomitant potential for greatest return on research effort, is in the old-world tropics, particularly in Africa. With joint funding from the U.S. National Oceanic and Atmospheric Administration (NOAA) and the National Aeronautics and Space Administration (NASA), this project is addressing some of these shortcomings in our understanding of the temporal and spatial dynamics of carbon exchange in Africa. The project includes both biogeochemical forward modeling, using land surface models, and atmospheric inverse modeling of carbon dynamics across the African continent. Field measurements in support of the modeling activities are in preparation for Southern Africa (Kruger National

334
Park, South Africa), West Africa (the Gourma region of northern Mali) and a possible third site in Central Africa (TBD). The project will provide more tightly constrained estimates of the spatial and temporal variation in carbon uptake and release from Africa. Satellite data from the AVHRR series and from MODIS and other Terra satellite instruments, and assimilated climate data, are being used to parameterize a land surface model (SiB3) to estimate the spatial and temporal variation in vegetation activity across the continent to predict spatially and temporally continuous fields of net carbon, water and stable isotope exchange. In parallel with this “forward modeling” of African carbon dynamics, we are preparing new inverse analyses of atmospheric [CO2] and stable isotope concentrations. These analyses will use the existing global flask measurement network augmented by new high precision [CO2] measurements. We expect that the novel combination of forward and inverse estimates of African carbon exchange will lead to model enhancements and reductions in uncertainty, to improved estimates of the spatial and temporal dynamics of carbon and water exchange in Africa, and to an improved understanding of the impacts of climate, climate variability and land use in regional carbon dynamics and the contributions of Africa to the global carbon cycle. Year 1 activities included development of field instrumentation, review of previous studies on continental-scale African carbon dynamics, preparation of datasets to parameterize and run forward simulations of African carbon, water and biogeochemical dynamics, and preparation for new and enhanced atmospheric inversion studies. These activities are described in more detail below. Year 1 Activities 1) Dr. Christopher A. Williams was selected after an international search to be employed at Colorado State University where he will play a leading role in the research and in coordinating the activities of the collaborating institutions and research sites. In September 2004 Dr. Williams completed his Ph.D. at Duke University (advisor John Albertson) on carbon and water dynamics in the Kalahari region of Southern Africa. He joined CSU and commenced work on this project in November 2004.

335
Figure 1. Annual average net assimilation rate (1983-2000) estimated using the SiB3 model, NCEP climate re-analyses and the long-term AVHRR data set. 2) An early activity of this project is to review data from published studies of the carbon dynamics of the African continent. These studies are being compiled into a review of the current state of knowledge and used to compare estimates of the spatial and temporal dynamics of carbon in Africa as estimated using various forward models (including climate and satellite-driven approaches), atmospheric inversions and land-use and biomass inventories. This activity will lead to a review paper for submission to an appropriate international journal. 3) A new study of the historical carbon dynamics of the continent has been initiated using the long-term AVHRR archive and climate re-analyses to parameterize and run the land surface model SiB3 (Simple Biosphere Model, version 3). This study will examine the spatial and temporal variability of net carbon exchange over the past 2 decades and analyze the impacts of climate variability, drought and land use on the NPP and vegetation activity in the region (Figure 1). 4) A separate proposal was developed to fund collaborative research and networking activities among African eddy flux sites (“Afriflux”). The network of sites in Africa is increasing rapidly (Figure 2) and this project was designed to enhance collaboration and synthesis among sites. The proposal was submitted to the NSF Research Coordination Network (RCN) Program but was not successful. However, reviewers and panel considered the underlying plan to enhance collaborative research on the carbon cycle in Africa to be sound and this proposal will be resubmitted in July 2005. 5) A new “precision CO2” instrument package has been designed, built and installed at our field sites in South Africa (Figure 2). The precision CO2 systems will provide continuous very precise measurements of atmospheric carbon dioxide concentration ([CO2]) that will be used to infer regional CO2 drawdown in both regional and global
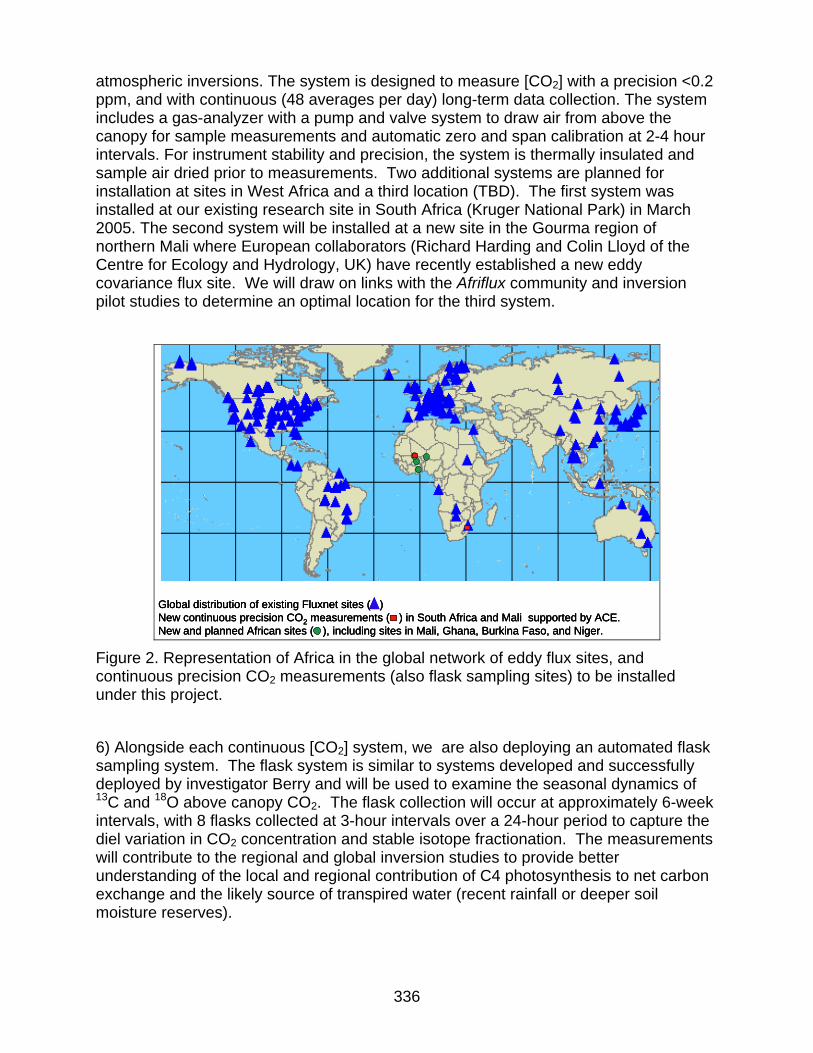
336
atmospheric inversions. The system is designed to measure [CO2] with a precision <0.2 ppm, and with continuous (48 averages per day) long-term data collection. The system includes a gas-analyzer with a pump and valve system to draw air from above the canopy for sample measurements and automatic zero and span calibration at 2-4 hour intervals. For instrument stability and precision, the system is thermally insulated and sample air dried prior to measurements. Two additional systems are planned for installation at sites in West Africa and a third location (TBD). The first system was installed at our existing research site in South Africa (Kruger National Park) in March 2005. The second system will be installed at a new site in the Gourma region of northern Mali where European collaborators (Richard Harding and Colin Lloyd of the Centre for Ecology and Hydrology, UK) have recently established a new eddy covariance flux site. We will draw on links with the Afriflux community and inversion pilot studies to determine an optimal location for the third system.
Global distribution of existing Fluxnet sites ( )New continuous precision CO2 measurements ( ) in South Africa and Mali supported by ACE.New and planned African sites ( ), including sites in Mali, Ghana, Burkina Faso, and Niger.
Global distribution of existing Fluxnet sites ( )New continuous precision CO2 measurements ( ) in South Africa and Mali supported by ACE.New and planned African sites ( ), including sites in Mali, Ghana, Burkina Faso, and Niger.
Global distribution of existing Fluxnet sites ( )New continuous precision CO2 measurements ( ) in South Africa and Mali supported by ACE.New and planned African sites ( ), including sites in Mali, Ghana, Burkina Faso, and Niger.
Figure 2. Representation of Africa in the global network of eddy flux sites, and continuous precision CO2 measurements (also flask sampling sites) to be installed under this project. 6) Alongside each continuous [CO2] system, we are also deploying an automated flask sampling system. The flask system is similar to systems developed and successfully deployed by investigator Berry and will be used to examine the seasonal dynamics of 13C and 18O above canopy CO2. The flask collection will occur at approximately 6-week intervals, with 8 flasks collected at 3-hour intervals over a 24-hour period to capture the diel variation in CO2 concentration and stable isotope fractionation. The measurements will contribute to the regional and global inversion studies to provide better understanding of the local and regional contribution of C4 photosynthesis to net carbon exchange and the likely source of transpired water (recent rainfall or deeper soil moisture reserves).

337
7) Instruments and sampling systems to measure [CO2] and 13C in soil air were purchased and tested during 2004 and installed at the intensive measurement site in South Africa in March 2005. Measurements will be paired in the sandy and clayey soils of the study site. The soil instrumentation consists of small [CO2] sensors installed in the soil alongside sample tubes that will be used at intervals to withdraw air samples for 13C analysis. The soil CO2 sensors measure continuously, while 13C air sample collection is carried out at approximately 4-6 week intervals. Soil surface CO2 flux measurements adjacent to the soil profiles will be made at the time of soil air sampling. These measurements will contribute to our process understanding of soil contribution to total CO2 flux and, more particularly, to our understanding of the source-distributions with depth in the soil, turnover rates of new assimilate and old carbon, and the impact of texture and soil chemistry on carbon cycling in the soil.
Figure 3. Mean carbon isotope (13C) ratio of vegetation in Africa during an 18-year simulation (as shown in Figure 1). Carbon isotope discrimination of the terrestrial biosphere is a function of the weighted contributions of C3 plants, which have a very large discrimination and C4 plants, which display very little discrimination. Africa is characterized by sharp spatial gradients in carbon isotope ratios of the plants. These, in turn, impart a uniquely ‘African’ signal on the carbon isotopic ratios of atmospheric CO2 because of unusual seasonal variations in the spatial distribution of precipitation and plant growth.
8) Simulations of stable isotope dynamics for Africa are also being carried out using the SiB3 model. These simulations will provide forward-model estimates of the fractionation of carbon during uptake and release from the vegetation in Africa, which is particularly important because of the importance of C4 vegetation in African savannas, and the

338
uncertainty that results in the timing and magnitude of fractionation. The field measurements of soil and atmospheric CO2 and 13C will be used to parameterize and/or validate the model and thereby increase our confidence in the model estimates of the continental scale dynamics (Figure 3). 9) New global atmospheric inversions are being prepared that will take advantage of the new precision CO2 data streams and will incorporate much higher resolution estimates of the spatial and temporal distributions of net carbon sources and sinks in Africa. The new basis regions for Africa (Figure 4) will include 10 bioclimatic zones that correspond better to the vegetation and climate zones of Africa. The 10 new basis regions improve on all earlier inversion studies which simply divided Africa into two regions (north and south of the equator) with no consideration of the vast bioclimatic differences incorporated in such large regions. The new field sites and new basis regions have been incorporated into the most recent global transport model simulations (using the PCTM model) that will generate the atmospheric transport information needed for new inversions.
Figure 4. Bioclimate defined basis regions for new atmospheric inversion studies in Africa. 10) A calibration facility is being developed for installation either at CSU or in Pretoria. This system will permit field standard gases to be calibrated (to within <0.2 ppm) as needed for the precision CO2 instrument systems. The calibration facility will use a series of WMO standard gases to calibrate a laboratory gas analyzer that will then be used to calibrate CO2 field cylinders containing dried ambient air. This will reduce the cost associated with purchase of WMO standard gases.

339
Presentations, Publications and Outreach Hanan, NP, Willams, CA, Denning, AS, Scholes, RJ, Africa and the global carbon cycle, manuscript in preparation Christopher Williams, Niall Hanan, Joe Berry, Robert Scholes, A. Scott Denning, Jason Neff, Jeffrey Privette, 2005, Africa and the global carbon cycle: field networks and model studies of African carbon exchange, Kruger National Park Annual Science Networking Meeting, Skukuza, South Africa, April 4-8, 2005 (Oral presentation). Werner Kutsch, Niall Hanan, Robert Scholes, Ian McHugh, Walter Kubheka, Holger Eckhardt, 2005, Savanna carbon and water fluxes, Kruger National Park Annual Science Networking Meeting, Skukuza, South Africa, April 4-8, 2005 (Oral presentation). Christopher A. Williams, Niall Hanan, Joseph Berry, Robert Scholes, A. Scott Denning, Jason Neff, Jeffrey Privette, 2005, Africa and the global carbon cycle: field networks and model studies of African carbon exchange, National Science Foundation US-Africa Workshop: Enhancing Collaborative Research on the Environment in Sub-Saharan Africa, Arlington, VA, January 24-26, 2005 (Poster presentation). Niall Hanan, 2004, Afriflux: promoting research on ecosystem function and land-atmosphere interactions in Africa, Fluxnet Open Science Meeting, December 13-15, 2004, Florence, Italy. (Invited oral presentation). Niall Hanan, Bob Scholes, Werner Kutsch, Ian McHugh, Walter Kubheka, 2004, Water and productivity in semi-arid savannas: examining the water-limited paradigm using whole-ecosystem flux measurements, Kruger National Park Science Network Meeting, Skukuza, South Africa, March 29-April 2, 2004. (Oral presentation). The Kruger Park Times, March 23, 2005. What is a flux tower? Publication in a popular South African bi-weekly newspaper for the Kruger Park area describing for the general public the field measurements and local and continental aims of the ACE project to better understand regional and global carbon dynamics. Comparison of Objectives and Accomplishments for Year 1 Year 1 objectives can be summarized into the three main activities in the original proposal. These are: (i) field measurements at African sites, (ii) forward models of the African carbon cycle, and (iii) inverse modeling of the carbon source-sink dynamics of the continent. Year 1 objectives focused on building and installing field instrumentation and preparatory analyses that lay the groundwork for full-forward and inverse modeling activities. 1) Installation of precision [CO2] at African field sites: in progress (1 installed in South
Africa, 1 planned for late 2005 in Mali, 1 planned for mid 2006 in TBD) 2) Installation of d13C flask samplers: in progress (1 installed in South Africa, 1 planned
for late 2005 in Mali, 1 planned for mid 2006 in TBD) 3) Installation of soil [CO2] and d13C profiles and soil surface flux measurements:
complete (measurements continue)

340
4) African carbon cycle review: in progress (manuscript in preparation for submission August 2005)
5) SiB3 modeling of African carbon cycle: in progress (18-year simulations for inter-annual variability using AVHRR data to be run mid-2005; simulations for 2001-2005 using MODIS data to be added later)
6) Global atmospheric transport model (PCTM) runs: complete (new with the PCTM model using improved basis regions for Africa and other continents have been completed; these data will be used in new atmospheric inversion studies; later PCTM runs will increase the spatial and temporal resolution of outputs to improve the spatial and temporal estimates for Africa (seasonal and sub-regional)
Year 2 Work Plan 1) Retrieve and compile long-term climate re-analyses for Africa (NCEP/ECMWF) for
historical (1982-2002) simulations using AVHRR data, and modern climate datasets (2000-2005, GEOS, GDAS) for simulations using MODIS data products and to drive atmospheric transport model.
2) Generate atmospheric transport vectors for inverse analyses using the global transport model PCTM
3) Retrieve and compile MODIS data fields for Africa for the 2000-2005 period, including Vegetation Index, fPAR, LAI, land use and fire (burn scar) information
4) Compile land surface data sets (soil texture, vegetation type) necessary for forward modeling of African vegetation dynamics, carbon and water dynamics
5) Test two additional continuous CO2 and flask sampling systems for deployment in West Africa and additional location (August 2005)
6) Install field instruments in Mali, West Africa (late 2005) 7) Develop data QA/QC procedures for continuous measurements 8) Commence laboratory analysis of flask samples 9) Run forward simulations of continental carbon cycle using SiB3 and historical
AVHRR data to examine spatial and temporal patterns and variability in the 1982-2002 time-period
10) Complete and submit review paper describing current understanding of African carbon dynamics, drawing on published work using climate-based biogeochemical models, satellite-driven models and atmospheric inversions
11) Field instruments make continuous measurements of atmospheric and soil [CO2] (2005-2007)
12) Atmospheric and soil air sample collection for 13C at approximately 4-6 week intervals (2005-2007)
13) Select third field site in Central or East Africa 14) Compare simulations using the SiB3 land surface model and site measurements of
CO2 and 13C/18O from the Kruger Park and Gourma sites 15) Commence inverse analyses using global flask network with additional data from 2
or 3 new African field sites

341
16) Develop analysis systems to use the new precision CO2 measurements to infer regional carbon uptake and release in the regions of the 2 or 3 new African field sites
17) Commence analysis of biogeochemical and land surface model results for the African continent for the 2000-2004 period using MODIS data on vegetation dynamics, land use and fire; begin comprehensive analysis of the spatial and temporal dynamics of carbon uptake and release

342

343
THE ROLE OF STRATOCUMULUS CLOUDS IN MODIFYING POLLUTION PLUMES TRANSPORTED TO THE NORTH AMERICAN CONTINENT Principal Investigator: Sonia M. Kreidenweis (in collaboration with Graham Feingold, NOAA/ETL) NOAA Project Goal: Climate Key Words: Aerosols, Indirect effect, tropospheric chemistry, clouds 1. Long-term Research Objectives: The long-range transport of pollution plumes to North America is of interest from an air quality and a global climate perspective. Our focus is on understanding how pollution affects aerosols and clouds. We have developed models that describe aerosol-gas-cloud interactions and detailed aerosol thermodynamics to predict modification of both aerosol composition and cloud properties. 2. Research Accomplishments/Highlights: We have analyzed uncertainty estimates of aerosol indirect forcing of climate. Specifically, we have investigated the extent to which broad parameter ranges of (organic) aerosol properties affect cloud drop number concentrations. Based on the results of this analysis, we were able to predict that aerosol composition might change drop number concentration ΔNd by ± 15% compared to well-characterized aerosols (e.g. ammonium sulfate) and, thus, we could significantly reduce the uncertainty reported previously in several papers in the literature (-90% < ΔNd < +120%). Results of our sensitivity study were reported in a peer-reviewed paper and in several conference presentations. The second focus of our work has been a critical review of published literature on so-called heterogeneous chemical processing of organics. Several data sets generated in lab studies are available and it is suggested that heterogeneous conversion of gas-phase organic species may contribute to secondary organic aerosol (SOA) formation. However, there is a significant gap between the measured organic mass fraction of ambient aerosols and the mass fraction that can be explained by conventional models. We have started to modify existing models in order to explore the importance of heterogeneous processes for SOA formation under atmospheric conditions. This work is continuing under a new NOAA award which started in early 2005. In addition, we have developed a numerical model describing the uptake of water vapor by inorganic and/or organic particles to interpret the observed relationship between the ratio of scattering by humidified particles to that by dry particles, i.e., f(RH), size distribution, composition (based on an Aerosol Mass Spectrometer), and activity as cloud condensation nuclei, CCN. Sensitivities studies will be performed, to show conditions under which one can infer useful information on CCN from measured size distributions, diameter growth factors [g(RH)], and f(RH).

344
3. Comparison of Objectives vs. Actual Accomplishments for Reporting Period: We have completed all project objectives, including publications. 4. Leveraging/Payoff: The results of this work will be applicable to reducing the current large uncertainty in estimates of indirect forcing of climate by aerosols.
5. Research Linkages/Partnerships/Collaborators, Communication and Networking: We are collaborating with Dr. Graham Feingold, NOAA ETL, on this project. We have also established communications with Dr. Ann Middlebrook and Dr. Joost deGouw of NOAA AL, who have provided their field data for analysis. We are collaborating with Dr. J. Ogren and Dr. E. Andrews (NOAA/CMDL) and Dr. J. Jimenez and Dr. M. Cubison (University of Colorado), who provided the data sets acquired during the recent International Consortium for Atmospheric Research on Transport and Transformation (ICARTT, 2004) at the Chebogue Point ground station in Nova Scotia, Canada. 6. Awards/Honors: None as yet 7. Outreach: We have reported results from our work at the following conferences during 2004: AGU Fall Meeting, San Francisco, USA Atmospheric Aerosol Aging Workshop, Telluride, CO Thermodynamics of Multi-Component Aerosols Workshop, Bonn, Germany 8. Publications: Refereed Ervens, B., G. Feingold, and S. M. Kreidenweis, The influence of water soluble organic carbon on cloud drop number concentration, J. Geophys. Res., 2005 (in press) Kreidenweis, S. M. Koehler, K. DeMott, P. J. Prenni, A. J. Carrico, C. Ervens, B., Cloud condensation activity of atmospheric aerosols. Part I: Application to inorganic species, Atmos. Chem. Phys., 5, 1357-1370, 2005 Kanakidou, M., J. H. Seinfeld, S. Pandis, I. Barnes, F. J. Dentener, M. C. Facchini, R. van Dingenen, B. Ervens, A. Nenes, C. J. Nielsen, E. Swietlicki, J.P. Putaud, Y. Balkanski, C. E., S. Fuzzi, J. Hjorth, G. Moortgat, R. Winterhalter, C. E. L. Myhre, K. Tsigaridis, E. Vignati, E. Stephanou, and J. Wilson, Organic aerosol and global climate modelling: A review, Atmos. Chem. Phys., 5, 1053-1123, 2005. Koehler, K. A., S. M. Kreidenweis, P. J. DeMott, A. J. Prenni, C. Carrico, B. Ervens, and S. L. Clegg, Cloud condensation activity of atmospheric aerosols. Part II: Application to organic species, Atmos. Chem. Phys. Discuss., 2005 (in preparation)

345
Conference Proceedings Ervens, B., G. Feingold, and S. M. Kreidenweis, The influence of aerosol composition on cloud drop number concentration, AGU Fall Meeting, San Francisco, USA, 2004. Kreidenweis, S. M., P. DeMott, B. Ervens, K. Koehler, Hygroscopicity of Organic Particles and Implications for Warm and Cold Cloud Formation, Atmospheric Aerosol Aging Workshop, Telluride, 2004. Kreidenweis, S. M., P. DeMott, B. Ervens, K. Koehler, Role of Organic Particulate Component for Cloud Activation and Cloud Properties, Thermodynamics of Multi- Component Aerosols Workshop, 2004.

346

347
VARIABILITY AND TRENDS IN GLOBAL PRECIPITATION Principal Investigator: Christian Kummerow and Wesley Berg NOAA Project Goal: Climate Key Words: Rainfall, clouds, satellite, remote sensing, climate
1. Long-term Research Objectives:
Work by Berg and Kummerow comparing rainfall systems over the East and West Pacific show that there are significant changes in the precipitation morphology between these regions, which have significant effects on the retrieved rainfall from different sensors. Our work has focused on exploring these differences and the impact they have upon the global rainfall climatologies with respect to both interannual variability associated with ENSO, and long-term climate trends as well as investigating the confidence that should be assigned to the current trend (or lack thereof) in the global precipitation datasets.
2. Research Accomplishments/Highlights:
Our research efforts focused on using coincident radar and IR data sets to analyze the relationship between IR inferred rainfall and that of the TRMM Precipitation radar (PR). A timely question arose in the scientific community that could be resolved with our data set. The Iris hypothesis put forth by Lindzen, et al. (2001) hypothesized that as sea surface temperature increases, the precipitation efficiency increases, resulting in a decrease in the area of cold cloud. If correct, this Iris effect would have to be accounted for in IR rain estimates in order not to introduce artificial biases related to changes in the ratio of cold cloud to rainfall with warming SST as is the case during ENSO events. Testing this hypothesis and its impact upon IR rain estimates was the subject of an MS thesis completed on May 10, 2004 by Ms. Anita Rapp at CSU. Pixel-level Visible and Infrared Scanner (VIRS) 10.8 μm brightness temperature data and Precipitation Radar (PR) rain rate data from TRMM were collocated and matched to determine individual convective cloud boundaries. Each cloudy pixel was then matched to the underlying SST. The effect of rainfall on the cold cloud area was examined using PR surface rainfall as a proxy for the precipitation efficiency. Normalizing the size of the cold cloud area by its underlying rainfall provided information on whether or not the precipitation efficiency was affecting the area of cold cloud at higher SSTs. Single-core and multi-core convective clouds were investigated separately. Our results do not support the Iris hypothesis. No trend indicating changes in precipitation efficiency (defined as cloud area divided by surface rainfall) was found in the 18-month period covering January 1998 to August 1999 in the tropical western Pacific. Results from both single-core and multi-core convective clouds show negligible correlations, indicating that in regions of higher SSTs, the rainfall from a cloud does not

348
increase as area of cold cloud decreases. Results do, however, indicate the possibility that changes in precipitation efficiency at higher SSTs is affecting warm, shallow convection (not the hypothesized deep convection). These results are presented in the MS thesis of Ms. Anita Rapp, Dept. of Atmospheric Sciences, Colorado State University, and have been submitted for publication in the Journal of Climate. A corresponding area of investigation involved the use of coincident TRMM PR and TMI rainfall estimates to determine the impact of biases in the rainfall estimates associated with climate regimes and to relate those biases to changes in the environment. A strong correlation between the distinct active (PR) and passive (TMI) rainfall estimation techniques with column water vapor was found. In addition, it was determined that aerosols over the East China Sea impact the detection of rainfall over this region. Calculations based on in-situ aerosol data collected south of Japan support a hypothesis that high concentrations of sulfate aerosols may contribute to abnormally high liquid water contents within nonprecipitating clouds in this region. The results of this study have been accepted for publication in the Journal of Applied Meteorology. Ref: Lindzen, Richard S., Chou, Ming-Dah, Hou, Arthur Y. 2001: Does the Earth Have an Adaptive Infrared Iris?. Bull. Amer. Meteorol. Soc.: Vol. 82, No. 3, pp. 417–432. 3. Comparison of Objectives vs. Actual Accomplishments for Reporting Period:
We have completed all project objectives to date. Publications detailing results to date are currently in press. 4. Leveraging/Payoff:
It is anticipated that the results of this work will lead to an improved understanding of rainfall processes and how they are affected by changes in environmental conditions such as SST as well as improved global rainfall estimates for climate applications.
5. Research Linkages/Partnerships/Collaborators, Communication and Networking: None 6. Awards/Honors: None currently 7. Outreach: Results from this work have been reported at the following conferences: Berg, W. and C. Kummerow, Detecting climate variability in tropical rainfall, presented at the 2004 Ioint Assembly, 17-21 May 2004, Montreal, Canada Berg, W., C. Kummerow, and T. L’Ecuyer, The relationship of TRMM rainfall biases to the synoptic environment, presented at the 8th International Conference on Precipitation, 8-12 August 2004, Vancouver, Canada.

349
Berg, W., The relationship between TRMM climate rainfall biases and the synoptic environment, presented at the 13th Conference on Satellite Meteorology and Oceanography, 20-23 September 2004, Norfolk, Virginia. Rapp, A. D., C. Kummerow, and W. Berg: On the ratio of cold cloud area to rainfall as a function of the underlying SST. 8th International Precipitation Conference. Vancouver, Canada, August 8-11, 2004. 8. Publications: Berg, W., T. L’Ecuyer, and C. Kummerow, 2005: Rainfall climate regimes: The relationship of regional TRMM rainfall biases to the environment, J. Appl. Meteor. (Accepted). Rapp, A. D., 2004: Evaluation of the adaptive infrared iris using TRMM satellite measurements. Colorado State University Thesis, 94pp. Rapp, A.D., C. Kummerow, W. Berg, and B. Griffith, 2005: An evaluation of the proposed mechanism of the adaptive infrared iris hypothesis using TRMM satellite measurements, J. of Climate, in press.

350

351
WEATHER SATELLITE DATA AND ANALYSIS EQUIPMENT AND SUPPORT FOR RESEARCH ACTIVITIES Principal Investigator/Group Manager: Michael Hiatt NOAA Project Goal: Infrastructure and Earthstation Key Words: Infrastructure, Earthstation, Data Sets, Computer Resources, Networking, Cluster, Security Archive 1. Long-term Research Objectives and Specific Plans to Achieve Them: Continue excellence in infrastructure operations, maintenance, research, and development. 2. Research Accomplishments/Highlights: See text below. 3. Comparison of Objectives Vs. Actual Accomplishments for Reporting Period: N/A 4. Leveraging/Payoff: 5. Research Linkages/Partnerships/Collaborators, Communications and Networking: 6. Awards/Honors: CIRA Research Initiative Award for last NOAA Review 7. Outreach: 8. Publications: 9. Additional Information: The CIRA Infrastructure Group provides all planning, development, acquisition, deployment, maintenance, and support for CIRA’s information technology including computer resources, networking, security, satellite earthstation, data archive, technical innovations, and project support. This group is staffed by a full-time Electrical Engineer, a full-time PC technician, and 3 part-time hourly students. 90% of staff time is spent performing operations and maintenance. Computer Resources CIRA currently has 200 systems that represent CIRA’s core computer base. These systems are custom designed, assembled, and maintained by the group. The following list gives a brief overview of the infrastructure resources managed by this group:
352
Complete system management: Pentium-4 servers/workstations using the Microsoft Windows XP/2003 operating system, hardware acquisition and installation, user support, system upgrades, software acquisition and installation, and service packs.
Central services: E-mail, website, accounts, accounting, domain, FTP, DHCP, DNS, printing, remote access, power issues, and property accounting.
Security: firewall, NTFS, antivirus, and antispam. Network: LAN, WAN, cabling, switches, firewall, IP control. Infrastructure budget and expenditures: $160k/year hardware/software budget. Technical group consulting: RAMM, NPS, BACIMO, AMSU, Geosciences,
CHANCES, CloudSat, Students, Visiting Scientists. Linux cluster: 64-bit, 40 processor cluster for high throughput modeling. Documentation: Reports, web, diagrams, posters.
Earthstation The satellite earthstation provides key metrological data for CIRA research. The group operates and maintains both current operations and the data archive. CIRA’s archive contains complete GOES, AVHRR, and Meteosat data back to 1994. The earthstation currently collects, processes, distributes, and archives:
GOES-10 GOES-12 NOAA-16/17 Meteosat-5 MSG-1
All products are collected at full resolution and processed into McIDAS-formatted files. These files are distributed to researchers on high-speed servers and archived on DVD for future use. Special Projects CloudSat The group completed the CloudSat data processing computer infrastructure. This new infrastructure contains 45 individual workstations and 15 terabyte RAID storage systems all specified, acquired, assembled and deployed by the group. The topology has proven reliable in other CIRA projects and already successful in CloudSat in the first two months of operation. CloudSat security is extremely important. Several steps to ensure successful security were deployed including special network restrictions, firewalls, surveillance cameras, and door access codes.

353
CIRA-developed DVD archive system
Innovative: Unique solution developed at CIRA leveraging mass market technology.
Low cost: At today’s prices, DVD media is 1/6 the price of tapes. Furthermore, DVD writers are 1/10 the cost and DVD readers are 1/20 the cost of tape drives.
Data verification: Verification on tape is not possible since there is physical contact between the tape and tape drive. Hence, during tape verification the tape may be damaged by the read process. DVD media does not touch the laser and therefore can be reliably verified.
Long life: DVD’s are long life and less affected by environmental issues. Tapes are easily damaged by temperature, humidity, age, and magnetic fields.
Random access: Data retrieval from DVD is significantly faster since the DVD’s are random access. Tapes are sequential access.
Distribution: Large data requests can be handled faster since the DVD’s can be quickly duplicated. The same process on tape media is time consuming and risks damage to the original media.
Retrieval: Web based HTML log files allow quick and easy searching from any Internet computer. Library style indexing and storage make it easy for student help to locate the correct DVD’s.
MSG Earthstation The MSG earthstation went online in May 2004. The system has been reliably collecting and archiving the full MSG data stream. All data is archived to DVD. Data Recovery Meteosat-5 and key NCAR data sets were converted from tape to DVD using CIRA’s new DVD system. About 4TB of data was converted. AMSU The AMSU cluster hardware was upgraded. 10 systems received faster CPU, more memory, and larger hard drives. Linux Cluster The CIRA Linux cluster was dramatically improved with the addition of a new 64-bit cluster. Besides a significant speed increase, the new cluster has more memory and more storage for larger jobs. The modeling group has just begun to leverage the power of this new cluster. The 32-bit cluster still remains operational and continues to produce excellent results. The 64-bit cluster is composed of twenty-three systems, each using a multiple processor setup. It is capable of performing 105.6 billion operations per second at peak operation. The master node is a quad Opteron system utilizing 32GB of RAM as well as a maximum storage of 6TB. The secondary master is configured with dual Opterons,

354
16GB of RAM and a dual GB LAN connection to the nodes. The nodes are collection of 21 systems, each containing a dual Opteron processors as well as 8GB of RAM. Future Work Using the new DVD archive system, CIRA plans to continue to convert GOES, AVHRR, and Meteosat archive tapes to DVD thereby preserving CIRA’s data archive.
355
ADDITIONAL CIRA FUNDING BERMUDA BIOLOGIAL STATION FOR RESEARCH INC. (RISK PREDICTION INITIATIVE
Exploiting Infrared Satellite Data to Estimate Tropical Cyclone Wind Radii Principal Investigator: J.A. Knaff NOAA Project Goal: Weather and Water, Commerce and Transportation Key Words: Tropical cyclone, Satellite, Winds 1. Long-term Research Objectives and Specific Plans to Achieve Them: To develop and apply a method to estimate tropical cyclone wind structure from infrared (IR) imagery. This imagery is already routinely used around the globe to estimate tropical cyclone intensity. The algorithm will be developed from about 250 cases from 1995-2003 for which corresponding aircraft reconnaissance is available. This algorithm will then be applied to the extensive archive of IR data that resides at CIRA (more than 70,000 images from storms around the globe). The IR algorithm and the wind structure statistics from the algorithm will be created. 2. Research Accomplishments/Highlights:
This study used IR data to estimate the wind structure of a tropical cyclone through estimates of the radius of maximum winds (RMAX) and the wind speed at 182 km (V182). The estimative algorithms were developed using 12-hourly analyses of 405 aircraft reconnaissance cases from the 1995-2003 Atlantic and Eastern Pacific hurricanes seasons along with corresponding IR imagery. A multiple linear regression analysis technique was applied to develop a model to predict these two parameters. Independent tests were performed on 50 cases from the 2004 hurricane season. The RMAX and V182 estimates were subsequently used in conjunction with a modified combined Rankine Vortex wind model to estimate the symmetric tangential wind profile out to 202 km from storm center. Additionally, storm motion-derived wind asymmetry was added to the symmetric wind profile to provide a reconstruction of the entire 2-D wind field, at each of 51 radial, and 16 azimuthal grid points. An example of the algorithms output is shown in Figure 1.
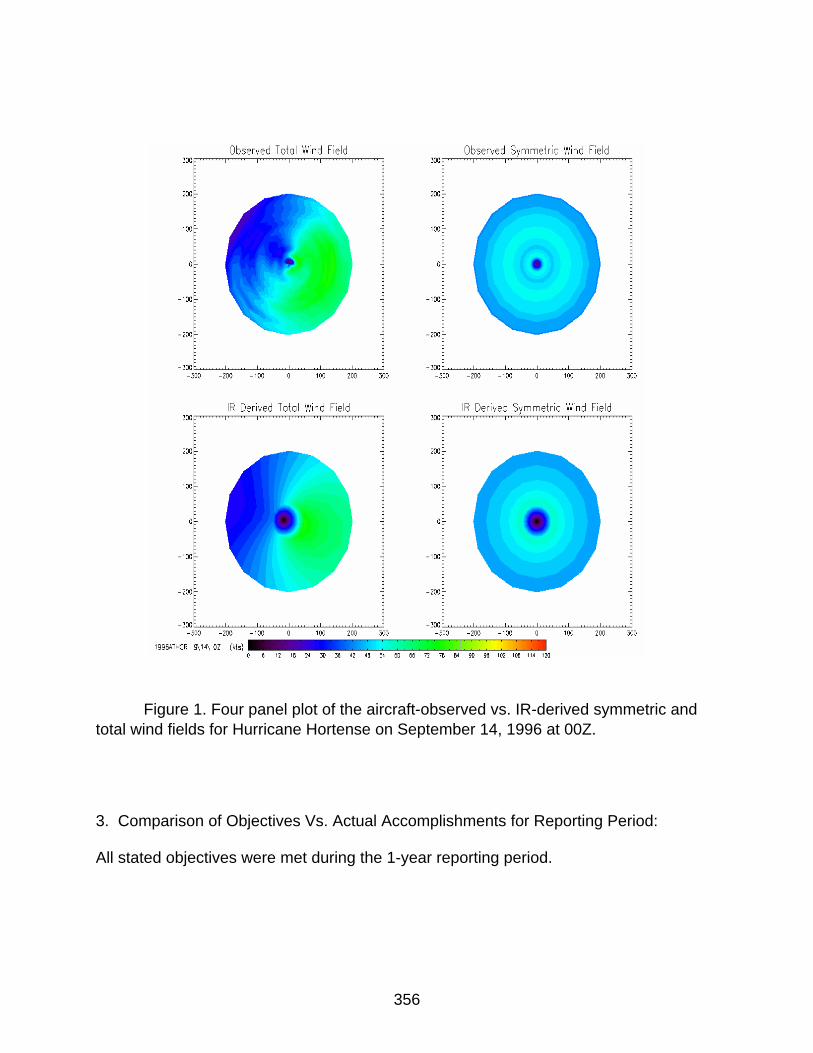
356
Figure 1. Four panel plot of the aircraft-observed vs. IR-derived symmetric and total wind fields for Hurricane Hortense on September 14, 1996 at 00Z.
3. Comparison of Objectives Vs. Actual Accomplishments for Reporting Period: All stated objectives were met during the 1-year reporting period.

357
4. Leveraging/Payoff: This algorithm provides vital information concerning the inner core (within 150 km of the center) wind structure of the tropical cyclone that is typically available only from aircraft data. As a result, this algorithm can be used in conjunction with other satellite-derived data to create a satellite-only tropical cyclone wind analysis, which includes the inner core region. Such a product would be available globally. This is important as routine aircraft reconnassance is available only in the N. Atlantic. 5. Research Linkages/Partnerships/Collaborators, Communications and Networking: This work was funded by a consortium of re-insurance companies and the resulting algorithms are in the public domain. The algorithm can be applied to other applications such as combining the output with other wind data sets, monitoring the size of tropical cyclones etc which are important to NOAA, DOD and local emergency managers. The statistics created from the output of this algorithm is expected to be useful information for the insurance industry allowing better estimates of the risks involved in their business. 6. Awards/Honors: None 7. Outreach: (a) Graduate/Undergraduate students (List by name, degree status and continuance after obtaining degree); (b) Seminars, symposiums, classes, educational programs; (c) Fellowship programs; (d) K-12 outreach; (e) Public awareness. a. Partial support for Kimberly Mueller, MS b. None at this time c. None d. None e. None 8. Publications: Refereed Journal Articles Mueller, K. J., M. DeMaria, J. A. Knaff, T. H. VonderHaar, 2005: Objective Estimation of Tropical Cyclone Wind Structure from Infrared Satellite Data. Submitted to Journal of Applied Meteorology. Presentations
Mueller, K.J., R.M. Zehr, M. DeMaria, and J.A. Knaff, 2005: Objective Estimation of Tropical Cyclone Wind Structure from Infrared Satellite Data. 59th Interdepartmental Hurricane Conference, 7-11 March, Jacksonville, FL.

358

359
DEPARTMENT OF DEFENSE DoD Center for Geosciences/Atmospheric Research CG/AR Principal Investigator: Thomas H. Vonder Haar NOAA Project Goal: All relate to NOAA’s Climate, Weather and Water, and Commerce & Transportation Goal areas. Key Words: Hydrology, Assimilation, Data Fusion, Aerosols, Climatology, Cloud Physics 1. Long-term Research Objectives and Specific Plans to Achieve Them: CG/AR is a DoD-sponsored research activity at CIRA that has been ongoing since 1986. CG/AR research reflects DoD priorities and interests; but to a large degree, addresses NOAA-relevant concerns. The five CG/AR research theme areas are:
Hydrometeorology Cloud Structure, Dynamics and Climatology N-Dimensional Data Assimilation and Data Fusion Boundary Layer Atmospheric and Aerosols Derivation of Battlespace Parameters
The leveraged payoff on these DoD-funded projects has had significant impacts on CIRA’s NOAA research. Specifically the data assimilation work funded by CG/AR was well ahead of NOAA’s interest in this area. The skills and infrastructure developed in this area have allowed CIRA to address the NOAA assimilation problems with minimum spin up and have allowed CIRA to contribute at a more significant level of effort than would have been possible with NOAA-only assimilation research funding. Likewise, CG/AR research in Homeland Defense-related activities is proving to be of interest to both DOD and NOAA. 2. Research Accomplishment/Highlights: The following is a brief description of some of the CG/AR research highlights that have been completed or have made substantial progress in the last year by theme area. 1. Hydrometeorology a. Completed first version of toxic transport hydrological model. This model predicts the heavy metal transport downstream due to overland water flow picking up toxic metals during a rainstorm. This model can be tuned to predict transport of biological, chemical, or radiological (WMD) materials for the DoD or the Office of Homeland Defense. b. We have delivered an advanced sediment transport model to the Army’s Corps of Engineers at ERDC. This CASC2D-SED model will not only predict flood stage of

360
river systems but also show erosion and the building of sandbars as a result of various water flows. c. We have transferred the science for improved over-land microwave soil moisture and an improved sounding algorithm to the Navy Research Laboratory. The sounding improvements reduce the analyzed errors in vertical temperatures which will improve the forecast models that use this data to initialize the forecast model runs. d. Collaborative research is currently underway to exploit the new WindSat 6 GHz radiometer data. This research is of interest to the Army (soil moisture and hydrology) and to the Air Force in support of their AGRMET product. e. We have completed our initial algorithm to improve the water vapor retrievals from today’s available microwave data. The vertical structure of water vapor in the atmosphere is a principal driver in all weather. It provides the energy for most storms as well as providing the water for both rain and clouds. f. We have developed science algorithms for the soon-to-be released SSM/IS data (undergoing DoD check-out) by using available AMSU data. This ability to use historical (available) sensor data to develop new methods to utilize new or yet-to-be flown sensors cuts down on the delay between first availability of data and the DoD’s ability to exploit the data to improve combat support. g. We delivered near real-time CG/AR satellite research products for use in hydromet forcing of the Army Corps of Engineers’ GSSHA model during operations over northern Iraq in the Spring of 2004. 2. Cloud Structure Dynamics and Climatology a. We have completed a modeling study of Electro-Optical propagation effects through mid-level, mixed phase clouds. These results will help our understanding of how infrared energy transmission behaves through mid-level clouds. This work will assist the DoD’s reconnaissance operations as well as improve the ability to use cloud masking to protect UAV and manned aircraft from ground-based detection. b. We have begun interweaving scientific aircraft observations of mixed phase clouds with high-resolution computer simulations to help improve the forecasting of mid-level, mixed phase clouds. It’s these mixed-phase clouds (mixture of water droplets, ice crystals and most importantly super-cooled water droplets) that cause aircraft icing. c. We are using scientific aircraft mixed-phase cloud sampling to help improve satellite-based mixed-phase cloud detection. This work will help improve our forecasting of icing conditions in data sparse regions. d. .We have identified our next collaborative field experiment for the study of mid-level, mixed-phase clouds. We will be teaming up with the Meteorological Service of Canada

361
to study mixed-phase clouds in the central Ontario region during January-April of 2006. During this time, we will also be teaming up with the Army Research Lab to validate and improve operational icing forecasts. e. We have delivered a cloud/no cloud and nighttime fog/stratus cloud discrimination product to Air Force operations support at AFWA. f. We completed a comparison study of various cloud detection methods with the Air Force’s current operational system. The study showed how the USAF system can be significantly improved. g. By combining observations and modeling, we diagnosed large-scale sinking motion in the upper atmosphere as a primary cause leading to dissipation of some mid-level, mixed-phase clouds. This information is useful in improving forecasts of these cloud processes. h. Using satellite images collected recently, we identified the tendency for some mid-level, mixed-phase clouds to dissipate shortly after sunrise. Knowledge of this tendency will help guide operational planning in data-sparse areas. i. Using an instrument deployed on a research aircraft (which can image individual ice particles in clouds), we determined that such particles rarely have pristine or regular shapes. This information is useful for modeling Electrical-Optical propagation through mid-level, mixed-phase clouds. j. Examined the accuracy of operational methods determining the height of the tops of mid-level, mixed-phase clouds and compared these findings with those of more advanced methods, which may be further improved by the knowledge of the cloud’s microphysical composition. k. Implemented a terabyte Raid-5 mass storage system for CHANCES global cloud analysis applications. l. Developed and implemented an improved technique for the production of an infrared radiance background (used in the global cloud analysis application). The result is the production of hourly infrared radiance backgrounds at a 5-km spatial resolution. A spin-off of this new product is the addition of a 24-hr temporal variance cloud analysis and a 5-km snow/ice product. m. Designed and implemented the CHANCES Regional Products application. This complex software system generates cloud climatology products for a user specified subset of the global CHANCES data base. An entire month of products can be built for a 5000 X 5000 km region within a few hours of run time.

362
n. Developed a prototype cloud base algorithm for the neural network, using global surface observations to assign bases to classified structures. 3. N-Dimensional Data Assimilation and Fusion a. Initial development of a table-based forecast model has been completed. This method promises to revolutionize operational forecasting support to the DoD. This table-based approach has the potential of allowing a given forecast numerical model to run thousands of times faster on any given computer – without dumbing down the internal analysis routines. b. We have completed a dynamic non-hydrostatic forecast model concept. Here the model forecast computations are simplified in regions where more complex computations are not required. c. A Town Energy Balance (TEB) model has been merged with a standard weather forecast model. This is a necessary step in improved urban warfare forecast support and homeland security toxic dispersion support. The TEB models the urban landscape at higher resolution and includes the heat effects of air conditioning, pavement and buildings. Prior to this work, urban surface features were only grossly approximated. d. Several information content studies have been completed in reference to the use of satellite data in numerical forecasts. Historically, satellite data was only partially used in defining the state of the atmosphere at the beginning of a forecast run using a numerical model. One of the limiting factors is that satellite data channels contain varying amounts of true information and in many instances, redundant information with respect to adjacent channels. These information content studies point to improved methods of handling these problems, which should improve the positive impact of these data on the forecast process. e. Conducted a model experiment that showed that new data assimilation techniques could overcome forecast model errors. This finding will help the entire weather community prioritize the research efforts between forecast model improvements and data assimilation improvements. f. Improved the initialization methods for the forecast models to produce a scheme where the spin-up times are reduced. Currently this is a major problem for DoD tactical use of forecast models since a model placed in a new forward location takes between 12 and 24 hours to stabilize before the forecasts are accurate. g. Directly ingested cloud images (long ignored in the standard numerical forecasting schemes) via satellite radiances for more accurate numerical modeling; and, conversely, allowed local area numerical modeling gridded field output to create accurate cloud fields.

363
h. Extended the current 4DDA adjoint methods that are typically restricted to 3 dimensional analysis and only for clear sky cases to full 4 dimensional variational analysis with clouds present. i. Developed an adjoint version or “observational operator” for IR image ingest to meso-models. j. Completed the development of an ensemble method for determining the error covariance matrix for the model and forecast error. This method will allow our data assimilation research to use better values than contemporary assimilation research. The result is an improved ability to ingest direct satellite radiances into the forecast models.
4. Boundary Layer Atmospheric Chemistry and Aerosols a. Completed an analysis of multi-sensor errors for the remote detection of aerosols. Most detection methods for aerosol (like dust) use a single sensor from a visible wavelength satellite channel. This analysis showed how a polarized light channel in combination with other sensor data improved detection. This analysis showed the benefit of flying a polarimeter, for this purpose, in the future. b. We are near completion on the first phase of research (Master’s thesis) on partitioning the error for the detection of aerosols between sensor and model error contributions. This analysis has the potential of providing the DoD vital information on a $100 million decision. When completed, the analysis should indicate either the error is mostly in the sensor’s ability to detect aerosols, or that our current physical model’s physics is in need of improvement. In the first case, the DoD would need to spend tens of millions of dollars on improved satellite sensors. In the second case, only tens of thousands of dollars would need to be spent on algorithm improvements. c. We are near completion on a neural network method for the detection of aerosols. This new approach, unlike other methods, uses a forward scattering method. Most current detection methods have satellite sensors detecting aerosols under the satellite with the sun illuminating the atmosphere from “over the satellite’s shoulder.” This new technique has the sun back illuminating the atmosphere as would happen in the early morning or late afternoon. This method has two advantages: it is more sensitive to aerosols, and it provides data during the times of day when the other method doesn’t work.
5. Derivation of Battlespace Parameters a. Developed neural network analysis that will produce a synthetic scene from a sensor. In many instances, meteorological coverage of a specific location of military interest has “holes” in it because one of the satellites passing over the location is without a specific channel or wavelength on all other satellites. Certain wavelengths are critical to initialize a product vital to DoD operations. This work promises to fill in where that critical data is missing by using data from adjacent channels.
364
b. We have just started an acoustical propagation research effort at the behest of the Army Research Laboratory. This is in support of acoustical sensors the Army is considering using to detect low-flying aircraft, land vehicles and dismounted infantry. These sensors are impacted by the atmosphere’s absorption and bending of sound. c. We have transferred a land emissivity algorithm to the Navy Research Laboratory. This achievement was required before the DoD could use any of the microwave sensor data, from any of our current or future satellites, to sense atmospheric variables such as temperature or moisture over land. Prior to this effort, microwave data was used exclusively over water where the background interference was less significant. d. Our neural network analyses for cloud bases were put on hold until the summer of 2005. This research suffered from the lack of “truth,” or an accurate training set. With the launch of CloudSat in late Spring 2005, that training set will become available. e. Work progresses on two novel approaches to speeding up forecast numerical models. Today, forecast facilities both in and out of the DoD must run forecast models that are less complex than the research-grade models due to computer limitations. The answer to this problem has always been to purchase bigger and bigger computers. Our new line of research offers the potential of forecast models, using more complex (and accurate) physics, that are able to run thousands of times faster than current programs. This approach uses the same models but allows the models to use pre-computed values in the more computing-intense portions of the code such as the radiation code that couples the heating and cooling through the vertical profile. This work would allow more accurate models to be run on existing computers and would allow small tactical computers, closer to the battlefield, to run more accurate weather models in support of tactical operations. f. Work progresses in the development of new products based on the new European Meteosat Second Generation (MSG) sensors. We have provided the Air Force algorithms for thin cirrus clouds, and nighttime fog and stratus discrimination. Future products for precipitation, contrail detection, and a snow/cloud discriminator are also being developed. The use of MSG is significant to the DoD because it is the only satellite with a continuous view of the Iraq/Afghanistan area. g. Another new start that is progressing well is the incorporation of aerosols such as dust into the forecast model. Currently, forecasting dust storms is done by a forecast model run in a dust-free setting. After the forecast model has generated its wind fields, this model produces winds that are used to blow the dust around. So, in this instance, the atmospheric forecast moves the dust, but the dust has no effect on the forecast. In the real world, dust in the atmosphere modifies the heat flow in the atmosphere, causing heating and cooling at different rates than in a dust-free atmosphere. This in turn modifies the wind direction and other forecasted variables. Our new work puts the presence of dust in the loop. Currently, no other model allows aerosols to impact the numerical forecast outcome.
365
8. Publications: Castro, C.L., R.A. Pielke Sr., and G. Leoncini, 2005: Dynamical downscaling: Assessment of value retained and added using the Regional Atmospheric Modeling System (RAMS). J. Geophys. Res. - Atmospheres, 110, No. D5, D05108, doi:10.1029/2004JD004721. Falcone, A.K., M.R. Azimi-Sadjadi, A. Pezeshki, J.A. Kankiewicz, and D.L. Reinke, 2004: Coherent-based feature extraction for cloud analysis using satellite imagery data. Proceedings, Asilomar Conference on Signals, Systems, and Computers, November 7- 10, Pacific Grove, CA. P. 1695-1699. Falcone, A.K., M.R. Azimi-Sadjadi, 2005: Development of Canonical Coordinate Features used in Multi-Satellite Cloud Product Generation over Land and Water. 2005 MTS/IEEE Oceans Conference, Washington D.C. (accepted). Forsythe, J.M., A.S. Jones, and T.H. Vonder Haar, 2004: Water vapor profile retrievals from satellite microwave sounding instruments. Preprint CD-ROM, Thirteenth Conference on Satellite Meteorology and Oceanography, September 20-24, Norfolk, VA (AMS). Forsythe, J.M., M.J. Nielsen, A.S. Jones, R.W. Kessler, K.Donofrio, and T.H. Vonder Haar, 2005: Water vapor and temperature profile retrievals from satellite microwave sounding instruments over land and ocean. Abstract, Battlespace Atmospheric and Cloud Impacts on Military Operations Conference (BACIMO) 2005, October 11-15, Monterey, CA (abstract accepted). Jones, A.S., J.M. Forsythe, and T.H. Vonder Haar, 2004: Retrieval of global microwave surface emissivity over land. Preprint CD-ROM, Thirteenth Conference on Satellite Meteorology and Oceanography, September 20-24, Norfolk, VA (AMS). Jones, A.S., J.M. Forsythe, C.L. Combs and T.H. Vonder Haar, 2005: Characterization of global microwave surface emissivity over land. Ninth Symposium on Integrated Observing and Assimilation Systems for the Atmosphere, Oceans, and Land Surface (9IOASAOLS). January 9-13, San Diego, CA (AMS).
Jones, A.S., G. McWilliams, M. Mungiole, G. Mason, C.C. Combs, D. Rapp, P.J. Stephens, P.C. Shott, T. Vukicevic, B. McKeown, and T.H. Vonder Haar, 2005: Applications of windsat for soil moisture satellite data assimilation and DoD impact studies. Abstract, Battlespace Atmospheric and Cloud Impacts on Military Operations Conference (BACIMO) 2005, October 11-15, Monterey, CA (abstract submitted). Kankiewicz, J.A., C.J. Seaman, J.M. Davis, and K.E. Eis, 2005: Simulated transmissivity of mid-level, mixed-phase clouds. Abstract, Battlespace Atmospheric and Cloud Impacts on Military Operations Conference (BACIMO) 2005, October 11-15, Monterey, CA (abstract submitted).

366
Kidder, S.Q., J.A. Kankiewicz, and K.E. Eis, 2005: Meteosat second generation cloud algorithms for use at AFWA. Abstract, Battlespace Atmospheric and Cloud Impacts on Military Operations Conference (BACIMO) 2005, October 11-15, Monterey, CA (abstract submitted). Koyama, T., T. Vukicevic, A.S. Jones, M. Sengupta, and T.H. Vonder Haar, 2005: Information content of the GOES sounder IR measurements in the presence of clouds. Poster, Ninth Symposium on Integrated Observing and Assimilation Systems for the Atmosphere, Oceans, and Land Surface (9IOASAOLS). January 9-13, San Diego, CA (AMS). Leoncini, G., and R.A. Pielke, Sr., 2005: Nonlinear vs. linear mesoscale dynamics. Abstract, Battlespace Atmospheric and Cloud Impacts on Military Operations Conference (BACIMO) 2005, October 11-15, Monterey, CA (abstract submitted). Matsui, T., G. Leoncini, R.A. Pielke, and U.S. Nair, 2004: A new paradigm for parameterization in atmospheric models: application to the new Fu-Liou radiation code. Department of Atmospheric Science, Colorado State University, Fort Collins, Colorado, Paper No. 747. Newsom, R.K., and R.M. Banta, 2004: Assimilating coherent Doppler lidar measurements into a model of the atmospheric boundary layer. Part I: algorithm development and sensitivity to measurement error. J. Tech, 21, 1328-1345.
Newsom, R.K., and R.M. Banta, 2004: Assimilating coherent Doppler lidar measurements into a model of the atmospheric boundary layer. II: Sensitivity analyses. J. Tech, 21, 1809-1824. Nielsen, M., A.S. Jones, J.M. Forsythe, and T.H. Vonder Haar, 2004: Effect of antenna pattern correction on AMSU-B radiances. Preprint CD-ROM, Thirteenth Conference on Satellite Meteorology and Oceanography, September 20-24, Norfolk, VA (AMS). Pielke Sr., R.A. and T. Vukicevic, 2005: Forum on modeling the atmospheric boundary layer. Bull. Amer. Meteor. Soc., 86, 95-96. Raff, D.A., and J.A. Ramirez, 2004: Hillslope drainage development with time: a physical experiment. Geomorphology, 62, 169-80. Raff, D.A., and J.A. Ramirez, 2005: A physical, mechanistic and fully coupled hillslope hydrology model. International Journal of Numerical Methods in Fluids (accepted). Reinke, D.L., K.E. Eis, P.A. Partain, and D.G. Reined, 2005: CloudSat – the “missing link.” Abstract, Battlespace Atmospheric and Cloud Impacts on Military Operations Conference (BACIMO) 2005, October 11-15, Monterey, CA (abstract submitted).

367
Ruston, B., 2004: Characteristics of summertime microwave land emissivity over the conterminous United States. Ph.D. Dissertation, Department of Atmospheric Science, Colorado State University, Fort Collins, CO, 126 pp. Ruston, B., and T.H. Vonder Haar, 2004: Characteristics of summertime microwave land emissivity over the conterminous United States. CIRA Technical Report, Colorado State University, Fort Collins, Colorado, 126 pp. [ISSN: 0737-5352-64]. Ruston, B., and T.H. Vonder Haar, 2004: Characteristics of summertime microwave emissivities from the Special Sensor Microwave Imager over the conterminous United States. J. Geophys. Res., 109, D19103. Sengupta, M., T. Vukicevic, A.S. Jones, and T.H. Vonder Haar, 2005: Assimilation of satellite radiances to improve cloud analysis and short term mesoscale prediction. Battlespace Atmospheric and Cloud Impacts on Military Operations (BACIMO) 2005 Conference, October 11-15, Monterey, CA (ARL) (abstract submitted). Stephens, P.J., and A.S. Jones, 2004: Bounds on the variance in the pattern matching criteria. IEEE Trans. Geosci. Remote Sensing., (submitted). Stephens, P.J., and A.S. Jones, 2005: Adaptable implementation of the Backus-Gilbert method. Battlespace Atmospheric and Cloud Impacts on Military Operations (BACIMO) 2005 Conference, October 11-15, Monterey, CA (ARL) (abstract submitted). Stokowski, D.M., W.R. Cotton, 2005: Addition of the aerosol direct effect to the Colorado State University regional atmospheric modeling system (CSU-RAMS). Battlespace Atmospheric and Cloud Impacts on Military Operations (BACIMO) 2005 Conference, October 11-15, Monterey, CA (ARL) (abstract submitted). Vukicevic, T., M. Sengupta, T. Vonder Haar, A. Jones, and F. Evans, 2004: 4D assimilation of cloudy satellite radiances. Preprint CD-ROM, Thirteenth Conference on Satellite Meteorology and Oceanography, September 20-24, Norfolk, VA (AMS). Vukicevic, T., M. Sengupta, A. Jones and T. Vonder Haar, 2004: Cloud resolving satellite data assimilation: Information content of IR window observations and uncertainties in estimation. J. Atmos. Sci., (accepted). Vukicevic, T., M. Sengupta, A. Jones and T. Vonder Haar, 2005: 4DDATA assimilation of the GOES imager IR radiances in cloudy conditions. Ninth Symposium on Integrated Observing and Assimilation Systems for the Atmosphere, Oceans, and Land Surface (9IOASAOLS). January 9-13, San Diego, CA (AMS). Wichern, G., M. R. Azimi-Sadjadi, M. Mungiole, 2005: Environmentally adaptive acoustic transmission loss prediction with neural networks. Proceedings, 2005 Unattended Ground Sensor Technologies and Applications Conference, SPIE Defense and Security Symposium, Orlando, FL, March 28-April 1.

368
Zupanski, D., 2005: Quantifying and reducing uncertainty by employing model error estimation methods. The Ed Lorenz Symposium, January 9-13, San Diego, CA (AMS). Zupanski, M., and D. Zupanski, T. Vukicevic, K. Eis, and T. Vonder Haar, 2005: CIRA/CSU four-dimensional variational data assimilation system, Mon. Wea. Rev., 829- 843.

369
LOCKHEED MARTIN CORPORATION Project Title: Forecasting and Modeling Studies and Services Principal Investigator: Kenneth Eis NOAA Project Goal: None – this is an Air Force funded project Key Words: MSG, AFWA, MeteoSat-8 This project is a subcontract to Lockheed Martin Co to provide Meteosat Second Generation (now Meteosat-8) to AFWA to improve their use of this new satellite with its additional channels. Specific products were agreed to and are as follows:
Layered cloud mask Nocturnal Fog and Stratus Contrail Detection Multi-channel surface temperature Snow vs Cloud detection Thin CI detection Precipitation
The work took advantage of previous NOAA-sponsored research and MODIS algorithm ideas. The work was completed with final deliveries in June 2005.

370

371
NASA - CLOUDSAT Report Provided by: Ken Eis/Don Reinke CIRA will provide the data processing element (DPC) for this NASA-sponsored satellite program. NOAA relevance includes the basic science products that fit into the NOAA Climate Goal as well as the computer software development that has a potential impact on all science-to-operations software programming activities. CloudSat Data Processing Center (DPC) CloudSat is a satellite experiment designed to measure the vertical structure of clouds from space and, for the first time, will simultaneously observe cloud phase and radiative properties. The primary CloudSat instrument is a 94-GHz, nadir-pointing, Cloud Profiling Radar (CPR). The current launch date for CloudSat is NET September 11, 2005. (Note: the NASA ESSP “CALIPSO” mission is a CloudSat launch partner). A unique aspect of this mission is the fact that CloudSat will be flying in formation with other Earth Sciences missions dubbed the “A-Train.” CloudSat will be a part of a constellation of satellites that currently include NASA’s EOS Aqua and Aura satellites as well as a NASA-CNES lidar satellite (CALIPSO), and a CNES satellite carrying a polarimeter (PARASOL). CloudSat must fly a precise orbit to enable the field of view of the CloudSat radar to be overlapped with the lidar footprint and the other measurements of the constellation. The precision of this overlap creates a unique multi-satellite observing system for studying the atmospheric processes of the hydrological cycle. Additional information about the CloudSat mission may be found at http://cloudsat.atmos.colostate.edu . CIRA will provide all of the science data processing support for the mission. All of the CloudSat standard data products will be produced at the CloudSat Data Processing Center in the new ATS-CIRA Research Center located adjacent to CIRA and the Atmospheric Science Department (see Figure 1).

372
Figure 1. Aerial view of the CIRA / Atmospheric Science complex – showing The Location of the CloudSat DPC.
CloudSat data will be downlinked to the U.S. Air Force Satellite Control Network and transferred via the RTD&E Support Center (RSC), in Albuquerque, NM, to the CIRA DPC. CIRA is responsible for the implementation of the hardware and software infrastructure that is necessary to produce the nine standard data products. Members of the CloudSat Science Team have developed the science algorithms and software for each of these products (Figure 2). Four universities and the NASA Jet Propulsion Lab (JPL) are participants on the CloudSat algorithm development team.
Figure 2. Examples of CloudSat Standard Data Products.
373
During the Operational (on-orbit) Phase, the DPC will be staffed by CIRA employees, Science and Technology Corporation personnel (under a sub-contract to CIRA), and part-time CSU students. More information about the DPC can be found at: http://www.cloudsat.cira.colostate.edu Progress In the Past Year: CIRA has delivered version 2.0 flight-ready software to our Canadian Space Agency Partners and we have placed the software under formal software configuration management. As of July 2005, the DPC software is ready to support on-orbit operations. Current work is focusing on documentation and further automation of the DPC system. In compliance with the milestones that have been laid out for DPC System Version 2, we have developed and implemented a system that is capable of supporting the CloudSat data processing requirements as specified at CDR. In addition, we have completed all objectives of the additional processing capabilities that have been added during successive informal reviews or Standard Data Products Working Group (SDPWG) recommendations which were not part of the original contract requirements. These additions to the DPC were due to the two launch delays, changes to the CloudSat orbit configuration, and a short-fall in the data distribution and storage that was identified since the CDR. The resultant modifications to the requirements list include the decision to have CIRA take on the responsibility for data distribution and storage for the entire mission (DASC function), the modification of the DPC design to include a web-based monitoring and control system, and the development of a web-based interface management / configuration control system. Also added to the original design was a robust ancillary data processing system for the production of the auxiliary data (“-AUX”) products. Over the past six months, the ability to process CloudSat and ancillary data and produce the standard data products described at CDR has been demonstrated through the processing of test data sets #1, #2, and #3, plus data taken directly from the instrument during system-wide test #7. The DPC system is functionally ready to support the current set of CloudSat requirements.

374

375
NASA - MESOSCALE CARBON DATA ASSIMILATION FOR NACP Principal Investigator: Scott A. Denning Co-Principal Investigator: Dusanka Zupanski NOAA Project Goal: Weather and Water NOAA Programs: Environmental Modeling, Weather Water Science, Technology, and Infusion Key Words: Mesoscale Carbon Data Assimilation, North American Carbon Program (NACP), Model Error and Parameter Estimation. 1. Long-term Research Objectives: The major objective of this research is to develop a generalized framework for carbon flux estimation from multiple streams of carbon observations, in support of the North American Carbon Program (NACP). This will be accomplished by using ensemble-based data assimilation techniques applied to a fully -oupled model of regional meteorology, ecosystem carbon fluxes, and biomass burning (SiB-CASA-RAMS). Terrestrial carbon fluxes over North America due to photosynthesis, autotrophic respiration, decomposition, and fires, and a “residual” time-mean source or sink will be simulated by the model. Unknown parameters related to light response, allocation, drought stress, phonological triggers, combustion efficiency, PBL entrainment, convective efficiency, and the time-mean sink will be estimated to obtain optimum consistency with a wide variety of ecological, meteorological, and trace gas observations. 2. Research Accomplishments/Highlights: Development of the generalized framework has just started. Algorithms are currently being developed for application to the Lagrangian Particle Dispersion Model (LPDM) using carbon observations from a ring of towers. Initial experiments are designed to test the algorithm, employing simulated observations in order to obtain a carbon flux estimate in a single point, or in a small number of points. Impact of ensemble size will be evaluated. Preliminary results will be presented at the Seventh International Carbon Dioxide Conference, held 25-30 September 2005, in Boulder, CO. 3. Comparison of Objectives: 4. Leveraging/Payoff: Ensemble data assimilation and model error estimation methodologies are applicable in all areas of research and everyday public life where observations and mathematical models are used. This research is most directly applicable to the NACP.

376
5. Research Linkages/Partnerships/Collaborators, Communications and Networking: Main investigators working on this research project include S. A. Denning, D. Zupanski, J. Collatz, M. Uliasz, M. Zupanski, and I. Backer. Collaborators include K. Gurney, R. Lokupitiya, N. Suits, L. Prihodko, and K. Schaefer. This research is in synergy with other CIRA research projects. These projects include: (i) NOAA/NESDIS research project titled “Research and Development for GOES-R Risk Reduction” (PIs: Prof. T. Vonder Haar and Dr. M. DeMaria). (ii) NOAA/THORPEX research project titled “Impact of Fundamental Assumptions of Probabilistic Data Assimilation/Ensemble Forecasting: Conditional Mode vs. Conditional Mean” (PI: Dr. M. Zupanski). (iii) NASA research project titled “Weak Constraint Approach to Ensemble Data Assimilation: Application to Microwave Precipitation Observations” (PI: D. Zupanski). (iv) NSF project titled “Collaboration in Mathematical Geosciences: Ensemble Data Assimilation Based on Control Theory” (PI: M. Zupanski). All these research projects employ the same ensemble-based data assimilation framework, entitled Maximum Likelihood Ensemble Filter. 6. Awards/Honors: None as yet 7. Outreach: Andrew Schuh and Nicholas Parazoo, graduate students at CSU/Atmospheric Science Department are collaborating on this research project, supervised by Prof. S. A. Denning. 8: Publications:
377
NASA - WEAK CONSTRAINT APPROACH TO ENSEMBLE DATA ASSIMILATION: APPLICATION TO MICROWAVE PRECIPITATION OBSERVATIONS Principal Investigator: Dusanka Zupanski NOAA Project Goal: Weather and Water NOAA Programs: Environmental Modeling, Weather Water Science, Technology, and Infusion Key Words: Ensemble assimilation and prediction, model error estimation, Earth observing system, precipitation observations. 1. Long-term Research Objectives: The major objective of this research is to develop an ensemble-based data assimilation methodology, applicable to atmospheric models including precipitation processes. An essential part of this research is to appropriately estimate and correct model errors. Model error estimation has been recognized as one of the major problems of modern data assimilation techniques. The practical goal of this research is to test this methodology it in application to a single column version of the Goddard Earth Observing System Atmospheric General Circulation Model (GEOS-5 AGCM). 2. Research Accomplishments/Highlights: Basic ensemble data algorithms, developed in the previous year, have been further tested and improved. In particular, the methodology was upgraded to include information content analysis based on information measures such as degrees of freedom (DOF) for signal and entropy reduction. The information content analysis is of special importance for model error estimation, since it can be used to determine adequate balance between the DOF in the model error, the available observations, and the ensemble size. The experimental results have been presented at the AMS conference, held in San Diego, CA, 9-13 January. A manuscript reporting experimental results involving ensemble data assimilation and information theory has been submitted to the Journal of Atmospheric Science. 3. Comparison of Objectives: 4. Leveraging/Payoff: Ensemble data assimilation and model error estimation methodologies are applicable in all area of research and everyday public life where observations and mathematical models are used. Some of these examples include weather, climate, oceanic, and hydrological predictions, space weather, and environmental modeling. In addition, information content analysis provides a means for quantifying value added of new observations (e.g., new satellite missions, such as GOES-R, GPM, and CloudSat).

378
5. Research Linkages/Partnerships/Collaborators, Communications and Networking: This research is performed in collaboration A. Y. Hou and S. Zhang from NASA/Global Modeling and Assimilation Office, and C. D. Kummerow from CSU/Atmospheric Science Department. This research is in synergy with other research CIRA research projects. These projects include: (i) NOAA/NESDIS research project titled “Research and Development for GOES-R Risk Reduction” (PIs: T. Vonder Haar and M. DeMaria). Under this research project similar methodology is employed to estimate value added of the future GOES-R satellite observations. (ii) NOAA/THORPEX research project titled “Impact of Fundamental Assumptions of Probabilistic Data Assimilation/Ensemble Forecasting: Conditional Mode vs. Conditional Mean” (PI: M. Zupanski). Under this project similar model error estimation approach is evaluated in application to NCEP GFS. (iii) NASA research project titled “Mesoscale Carbon Data Assimilation for NACP” (PI: S.A. Denning). Under this projects similar approaches are used for carbon data assimilation problems. All these research projects employ the same ensemble-based data assimilation framework, entitled Maximum Likelihood Ensemble Filter. 6. Awards/Honors: None as yet 7. Outreach: Derek Poselt, a graduate student at CSU/Atmospheric Science Department is collaborating on this research project, supervised by Prof. G. L. Stephens. 8. Publications: Zupanski D., M. Zupanski, A.Y. Hou, S. Zhang, C.D. Kummerow, and S.H. Cheung, 2005a: Information theory and ensemble data assimilation. Submitted to J. Atmos. Sci. [also available at ftp://ftp.cira.colostate.edu/Zupanski/manuscripts/Geos5_Information_JAS.pdf].

379
NASA/UCAR – THE GLOBE PROGRAM Principal Researcher: Mike Turpin Key Words: International education and science program; observations and reporting of science protocols; data access; teachers; students The GLOBE Program is an international education and science program. Its goals are to increase environmental awareness of people throughout the world, contribute to a better understanding of the earth, and help all students reach higher levels of achievement in science and mathematics. Under the guidance of their teachers, students worldwide collect environmental data around their schools and post their observations and measurements through the Internet on the GLOBE Website. GLOBE scientists design protocols for measurements that are appropriate for K-12 students to perform, and are also useful in scientific research. As scientists respond to the major environmental issues of today, laboratory and classroom collaboration will help unravel how complex, interconnected processes affect the global environment. Years of student data collection have resulted in a significant contribution to science. GLOBE's unique global database holds more than 13 million student measurements which are universally accessible on the Web for research. Since it was initiated, the GLOBE Program has grown from 500 U.S. schools in 1995 to more than 15,000 GLOBE schools located in more than 100 countries. In Spring 2003, NASA announced that a partnership between the University Corporation for Atmospheric Research (UCAR) and Colorado State University (CSU) was selected as the winning proposal for the operation of the GLOBE Program. CIRA, along with the Atmospheric Science Department at CSU, comprise the CSU team. On the UCAR side, representatives from the UCAR Office of Programs (UOP), E&O and NCAR comprise the UCAR portion of the GLOBE staff.
GLOBE Highlights in 2004/2005 Beginning in January 2004, just before GLOBE’s 10th anniversary, the GLOBE management team began looking at ways to improve the program to keep it moving forward for another 10 years. Feedback from the community, GLOBE staff, as well as continued direction from the program’s funding agencies, NASA and NSF, began setting the course for the Next Generation GLOBE (NGG). This approach adheres to GLOBE’s mission of improving science education, enhancing environmental awareness, and increasing the understanding of the Earth as a system. More specifically, the vision of the NGG is to maintain a close partnership with NASA and NSF’s integrated Earth systems science programs to provide the worldwide GLOBE community access to top scientists and expose them to programs that are on the cutting edge of Earth systems science research. GLOBE will promote and support students, teachers, and scientists to collaborate on inquiry-based investigations of the environment and the Earth system. GLOBE will experiment with and assess three new approaches to the implementation of the program: helping establish regional

380
consortia world-wide, projects-based management, and the development of a GLOBE Schools Network (GSN). A white paper describing more details can be found at: http://www.globe.gov/fsl/pdf/NGG_6_27_05.pdf . NGG is expected to be fully functional by the 2006 GLOBE Annual Conference. GLOBE was honored for its achievements over the past 10 years at a ceremony in November with the award of the Goldman Sachs Foundation Prize for Excellence in international education. “The GLOBE Program was selected for the unique reach of its work around the world and its ability to bring international education to life through the process of scientific inquiry,” said Dr. Michael Levine, Execute Director of Education at the Asia Society. A portion of the award will be used to facilitate meetings with our country coordinators who are interested in establishing regional consortia.
France became a GLOBE country in October 2004 making it the final major country of western Europe to sign the bi-lateral agreement. CNES (Centre National d’Etudes Spatiales) will be the main organization in France implementing GLOBE, primarily through its satellite mission connections. GLOBE collaborations between the French CALIPSO Outreach Team at CNES in Toulouse, France, together with the CALIPSO and CloudSat Outreach teams at Hampton University (Virginia) and CSU already have begun. During the summer of 2004, CNES sponsored two French teachers from France to attend a workshop in Colorado where they were trained in GLOBE atmosphere protocols connected to CALIPSO and CloudSat missions that observe aerosols and clouds. Then in February, CNES hosted the first GLOBE workshop in France to train teachers in atmosphere protocols which are aligned with CALIPSO outreach. Thirty teachers from 25 schools participated and included a student video conference between French and U.S. schools.
The GLOBE ONE field campaign is still running in Black Hawk cCunty, Iowa. For GLOBE, this is the first attempt at a level larger than one to two schools to partner students and scientists in looking at many different parameters of environmental and Earth science relevance. This campaign was represented at the 2005 AGU Joint Assembly Meeting. Kelen Panec, a GLOBE teacher from Waterloo, IA, gave a presentation about a research project her students are doing with a scientist. They used sun photometer measurements for calculating aerosol optical thickness and continuous one-minute insolation with a pyranometer provided by GLOBE PI, Dr. David Brooks.
In April 2005, during the National Environment Education Week, the first GLOBE online teaching module was developed for the cloud protocol. Using Flash technology, this module explores the science content behind the protocol, simulates taking measurements, demonstrates data entry and data analysis, and provides practical information about inquiry-based classroom implementation. Modules covering other GLOBE protocols are planned for the future. In honor of Earth Science week, GLOBE hosted a contrail “count-a-thon.” Participants, including non-GLOBE-trained students, were asked to observe and report on the type and number of contrails they saw in their area at a certain time of day on October 14 and 15, 2004.

381
Many GLOBE protocols lend themselves to responding to environmental issues not only on a global scale but also at a local level. As a result of the tsunami that struck off the coast of Sumatra on December 26, 2004, a GLOBE Marine Tsunami project headed by GLOBE Thailand with support from UC Merced was formed to study the effects of this catastrophe on marine invertebrates, ecology and water quality. To date, eight schools affected by the tsunami have been trained in some of the pertinent GLOBE protocols. This study aims to further students’ understanding of their environment and conservation of coastal regions. For more information see: http://globethailand.ipst.ac.th/Tsunami/
Technical Accomplishments A major focus of the past year has been on “porting” the GLOBE Visualization system which supports the GLOBE Maps and Graphs and Data Access interfaces from Silicon Graphics (SGI) servers to Linux servers. The code is primarily IDL with some FORTRAN and C backend. This port will decrease cost and increase performance since the SGIs that the visualization system is hosted are very old servers which are by today’s measures slow compared to systems equipped with current x86 chips. GLOBE is committed to supporting GIS (Geographic Information Systems) technology. This technology is a natural extension of what GLOBE does because it is used to view and analyze data from a geographical perspective. To this end, GLOBE has, for many years, made data available in shapefile format which is an interchange format promulgated by a major GIS software vendor, ESRI, for simple vector data with attributes. In considering GIS server-side alternatives on the market, the decision was made to use IONIC’s RedSpider software due to the fact that it had easy-to-install, ubiquitous platform support, integrated well with Oracle, and was based on open-source standards from the ground up allowing the broadest possible range of access from any GIS vendor. Another primary focus continues to be the development/maintenance of the GLOBE Partner Administration Web site. This is a Website that the GLOBE Partners can use to track their workshops, teachers trained and schools’ involvement. Results of this effort during the past year include more user-friendly pages, better tools to support the partners with their teacher training efforts, and a detailed partner administration manual. In addition to the partner page redesign, effort was expended on the development of many additional administration pages to support the new GLOBE management. The operational GLOBE system is mirrored with hardware. Due to cost constraints involving the long-running (it was established in 1998) support staff at the mirror site in Germany, it was decommissioned in October, 2004. As a temporary replacement for a mirror site, replicas of the hardware and software used to run the GLOBE Web site were set up at UCAR. Both mirror servers are now co-located at UCAR. This set-up is not ideal because if network or power to the computer room is interrupted, the site is affected. As a more reliable longer term plan, there are discussions underway to have mirrors established at a technical center in Thailand. This would help with geographical
382
distribution of the Web site and provide GLOBE Thailand a sense that they are making a significant contribution to the program overall as well. The graphics support continues to be a significant contribution to the program and helps to ensure that the GLOBE brand is preserved. As part of the Web site graphics support, GLOBE study site photos are being processed for archive as well as the design of graphics needed for print such as GLOBE brochures, flyers, certificates, bi-annual NASA performance reports, and business cards. Building on the approach of NGG, work is underway to start a re-design of the Web site. The most significant difference is expected to be a much stronger educational focus with more emphasis on student research projects. GLOBE data entry can be done via the Web site or via email where the data needs to be sent in a very specific format. A high school student from Jordan, Mohammad Abu Musa, found a way to simplify the process of generating a formatted e-mail message containing GLOBE data. Written in Visual Basic, this “Email Data Generator” is a client-side application which provides the user with a series of forms (one per protocol) which can be filled in without the users having to know which data to include or in what order that the traditional email processing system required. This software is provided from the GLOBE Web site via the Data Entry link and is a great model of students going the extra mile to help other GLOBE students succeed. In January, GLOBE began preparing to send data to be incorporated into the MADIS (Meteorological Assimilation Data Ingest System) system developed by the NOAA Forecast System Lab. The GLOBE datasets that MADIS can store include air temperature, precipitation, relative humidity and barometric pressure. There are some unique parameters surrounding how GLOBE data is collected, namely, the protocols are designed such that observations are taken as close to true solar noon as possible. Consequently, observation periods are defined from noon of one day to noon of the next rather than midnight to midnight. This is done mainly to accommodate the schedules of schools. Much of GLOBE student data is submitted weeks--sometimes months--after it was first collected, but there is some that is submitted within 24 hours from when it was collected. Incorporation of GLOBE student data into the MADIS dataset is expected soon. Something that often gets overlooked is that GLOBE observations can be made at places other than K-12 schools. The GLOBE Help Desk staff at the CSU Foothills Campus maintains and monitors a GLOBE weather station located just to the east of the Solar Village. To see the data being reported from this station, go to the GLOBE Web site and choose “Schools.” Then type in “Colorado State University” to be taken to a page with a link to the data. The Boulder Valley School District recently received a grant to purchase an automated WeatherHawk station that meets GLOBE’s specifications. This station was set up at the Sombrero Marsh located just behind the district building in Boulder and monitors temperature, wind speed and direction, dew point and sea level pressure. Every 15

383
minutes, the data is recorded to a file on a computer connected to the station. From there, this file is uploaded to the GLOBE servers and processed. This is believed to be the first study site whose data can be seen in “near” real-time on the Web site. To better evaluate how and in what ways GLOBE is being effective in improving student achievement, it’s important to have a certain amount of metadata (e.g. grade level taught and whether the schools are publicly or privately funded) for the participating schools. Keeping this metadata up-to-date is quite challenging. For the U.S., the Department of Education has a database (NCES) which holds metadata on most schools in the country and updates this database annually or at least bi-annually. Within the last year, GLOBE was able to match the majority of the GLOBE schools with the NCES database. This now gives the program the ability to evaluate whether GLOBE is being introduced and implemented at more primary or secondary schools and whether student body population has any impact on level of participation. Within the last year, the development/maintenance of the Teacher’s Guide was shifted from TERC to the GLOBE Program Office. This involved converting the documents into InDesign and then verifying that the conversion worked. In addition to the conversion, there were changes that needed to be made to the content of the 2003 guide. The current version, 2005, will be the last version before the selection of the integrated Earth Science programs are integrated into GLOBE. The rollout of the entire guide should be completed by the end of September 2005. In 2004, the process of cataloguing GLOBE protocols into the DLESE (Digital Library of Earth System Education) database began with the cataloguing of the atmosphere chapter of the GLOBE Teacher’s Guide. In May 2005, the hydrology chapter followed. By the end of the year, the collection will be completed with the cataloguing of the remaining GLOBE investigation chapters. This should make the protocols and learning activities of the Teacher’s Guide more widely available to science educators around the country for their use and adaptation in the classroom.
Publications: Brown, D.H., R. Brummer, C.R. Matsumoto, and M. Turpin, 2004: The GLOBE Program Data System Architecture. International Conference on Computers in Education (ICCE2004), 30 November – 3 December 2004, Melbourne, Australia.
Brown, D.H., R. Brummer, S. Gallagher, S. Henderson, K. Milberger, 2005: Geospatial Data Presentation and GIS in the GLOBE Program. 2004 AGU Fall Meeting, 13-16 December 2004, San Francisco, CA.

384
385
NATIONAL PARK SERVICE (AIR QUALITY DIVISION) FORT COLLINS Principal Investigator: Doug Fox NOAA Project Goal : Weather and Water, specifically, the Air Quality component under the Goal Key Words: Air Quality Research, Visibility Research; Visibility Monitoring; Aerosol Research, Aerosol Monitoring; Rural Air Quality; Air Quality Modeling 1. Long-term Research Objectives and Specific Plans to Achieve Them: The long-term objectives of team are to understand the causes of impaired visibility in national parks and other pristine lands in the United States. Since the early 1980s CIRA has supported the National Park Service visibility research program directed by Dr. Bill Malm. Through these years, this group has conducted research that has helped in formulating and implementing the Clean Air Act mandate to protect the visual resources of national parks and wilderness, so-called class I areas. In April 1999, the EPA promulgated “regional haze” regulations (RHR). RHR require that states (and Indian Tribes) develop plans (subject to 10-year review and revision) that will show reasonable progress toward returning class I areas to “natural” visibility conditions over the next 60 years. 2. Research Accomplishments/Highlights: The NPS/CIRA research group has been instrumental in advancing the science and developing the methodologies enabling the regional haze regulations. Included in past accomplishments is developing the appropriate metrics to use for characterizing visibility, determining the most appropriate instruments to measure visibility for this application, and designing and implementing the national monitoring network for visibility, the IMPROVE network. In addition to research on the IMPROVE network, the group conducts special studies, generally associated with specific national parks, that help to understand relative contributions of pollution sources to visibility. Recently the group has been simulating regional air quality using an assortment of regional air quality models. The group has led the development of interactive web-based data archival and analysis tools through implementation of the VIEWS (Visibility Information Exchange Web System (http://vista.cira.colostate.edu/views), and similar web sites for the IMPROVE program (http://vista.cira.colostate.edu/improve) and for toxic air pollutants (http://vista.cira.colostate.edu/ATDA). 3. Comparison of Objectives Vs. Actual Accomplishments for Reporting Period: Specific objectives for this year have included:
completion of the BRAVO special study program (see a number of reports and publications in the publications list);
implementing regional air quality modeling (the regional air quality models have been installed on the RAMS cluster and are currently being tested);

386
reviewing the science behind relating ambient aerosol concentrations to visibility, the so-called IMPROVE equation (report prepared & currently undergoing extensive peer review);
developing and implementing a QA/QC system for IMPROVE data (draft reports have been prepared);
completing analysis of data from special studies of forest fire emissions and their impact on visibility (ongoing activity).
4. Leveraging/Payoff: Having the NPS research team at CIRA provides a significant opportunity for NOAA to leverage this research for air quality forecasting and related areas of contaminant dispersal. The NPS group is among the nation’s leaders in air pollution research, especially for aerosols and their effects on visibility and other air quality related values. Current research in model evaluation and validation is setting the standard for air quality applications internationally. The group works closely with the Regional Planning Organizations (RPOs) which are a national coordinating group of state air quality agencies for the purpose of looking at trans-state border air pollution issues. VIEWS is specifically funded by the RPOs.
5. Research Linkages/Partnerships/Collaborators, Communications and Networking: The NPS group works cooperatively with the other land managers (USDA and other agencies in the Department Interior (FWS, BIA, BLM), with the EPA, with most of the states and with the RPSes as mentioned above, with a host of universities, national laboratories, and private sector air quality companies to study and provide technical and research background for implementing the visibility provisions of the Clean Air Act and the regional haze regulations. 6. Awards/Honors: Michael Barna, Kristi Gebhart, William Malm, Bret Schichtel. August 2004, National Park Service STAR award for performance substantially exceeding job requirements.
7. Outreach:
(a.) Graduate/Undergraduate students (List by name, degree status and continuance after obtaining degree) (b) Seminars, symposiums, classes, educational programs;
Doug Fox was co-organizer of the EAST Fire Conference at George Mason University in May 2005.
Jenny Hand, Research Scientist, summer 2005, serves as a SOARS (Significant Opportunities in Atmospheric Research and Sciences) Science Mentor at NCAR.

387
From the SOARS website:
SOARS is a four-year program for undergraduate and graduate students Interested in pursuing careers in the atmospheric and related sciences. It includes a 10-week summer program at the National Center for Atmospheric Research (NCAR).
The main role of a science research mentor is to identify and structure a research project appropriate for a SOARS protégé for the summer. The science research mentor and protégé collaborate to create a research plan, and work together to monitor progress and interpret results as the project progresses. On average, a science research mentor spends about 10 hours per week with his or her protégé, discussing the project, guiding research practices, teaching processes and methods, and assisting the protégé in the creation of his or her research paper and presentation.
(c) Fellowship programs; (d) K-12 outreach; (e) Public awareness.
Kristi Gebhart, National Park Service Research Physical Scientist:
o National Park Service Visibility Research Program. Presented at the 18th Annual Northwest Colorado Coal Conference, May 20, 2005, Craig, CO.
o Introduction to Visibility Science. Presented at Bureau of Land Management (BLM) National Interagency Fire Center (NIFC) Training Course RX 410, Smoke Management Techniques, Feb 28-Mar 4, 2005, Boise, ID.
Julie Winchester, Media Specialist:
o The 2005 wall calendar highlighting the IMPROVE program and site operator efforts was written and produced during the fall of 2004.
o The user interface and the introductory section of our educational web site was designed and implemented.
o A PowerPoint presentation was prepared for Big Bend National Park to use in public outreach programs. It highlights park concerns about air quality issues and presents the results of air quality research over the past five years.
A final draft of the storyboard for this project incorporates changes by the park and has received final authorization by the client. A user interface has been designed, reviewed, and implemented, as has an animation for the “what can you do” section of the project. Construction of the project is continuing after a temporary halt called by the park last fall.

388
o Created two posters about park-related research for use in park visitor centers:
Natural Sounds Program
Dark Skies Program
8. Publications, Conference Papers, Presentations:
Ames, R. B., Fox, D.G., Malm, W. C., Schichtel, B. A. 2004. Preliminary apportionments of carbonaceous aerosols to wild fire smoke using observations from the IMPROVE network. Presented at the Air & Waste Management Association Specialty Conference in Ashville, NC.
Ames, R. B., McClure, S. E., Schichtel, B. A., Fox, D.G. 2004. The Visibility Information Exchange Web System (VIEWS): An update on available datasets and web based tools for data analysis and visualization. Presented at the Air & Waste Management Association Specialty Conference in Ashville, NC.
Barna, M. G. and Fox, D. G. 2004. Simulating wildfire smoke emissions and transport. Presented at the Air & Waste Management Association Specialty Conference in Ashville, NC.
Barna, M. G., Gebhart, K. A., Schichtel B. A., and Malm, W. C. 2004. Simulating sulfate contributions from regional sources at six national parks during the BRAVO study. Presented at the Air & Waste Management Association Specialty Conference in Ashville, NC.
Barna, M. G. and Knipping, E. M. 2005. Using sulfur predictions from a global-scale transport model to specify boundary concentrations in a regional-scale air quality model. Presented at the American Association of Aerosol Research Particulate Matter Supersites Program Specialty Conference, Atlanta, GA.
Barna, M. G., Gebhart, K. A., Schichtel, B. A., and Malm, W. C. 2005. Modeling regional sulfate during the BRAVO study: 1. Base emissions simulation and performance evaluation. Atmospheric Environment, in review.
Barna, M. G., Schichtel, B. A., Gebhart, K. A., and Malm, W. C. 2005. Modeling Regional Sulfate during the BRAVO Study: 2. Emission sensitivity simulations and source apportionment. Atmospheric Environment, in review.
Barna, M. G. and Knipping, E. M. 2005. Using sulfur predictions from a global model to specify boundary conditions in a regional air quality model. Atmospheric Environment, in review.
Bench, G., Fallon, S., Malm, W. C., McDade, C., and Collett, J. L., Jr. 2005. Carbon-14 analysis of PM2.5 aerosols at five IMPROVE sites. Presented at the American Association of Aerosol Research Particulate Matter Supersites Program Specialty Conference, Atlanta.

389
Carrico, C., Kreidenweis, S., Collett, J. L., Jr., Engling, G., Day, D. E., and Malm, W. C. 2004. Smoke properties derived from the laboratory combustion of forest fuels. Presented at the American Association of Aerosol Research Annual Conference, Atlanta.
Carrico, C. M., Kreidenweis, S. M., Collett Jr., J. L., Engling, G., Day, D. E., and Malm, W. 2004. Smoke properties derived from the laboratory combustion of forest fuels. Presented at the American Association of Aerosol Research Annual Conference, Atlanta, GA.
Carrico, C. M., Kreidenweis, S. M., Malm, W. C., Day, D. E., Lee, T., Carrillo, J., McMeeking, G. R., and Collett, J. L. 2005. Hygroscopic growth behavior of a carbon-dominated aerosol in Yosemite National Park. Atmospheric Environment, 8, 1393-1404.
Copeland, S. A. 2005. A statistical analysis of visibility impairment in federal class I areas. Presented at the Air & Waste Management Association Visibility Specialty Conference in Ashville, NC.
Day, D. E., Malm, W. C., Carrico, C., and Engling, G. 2004. Hygroscopicity of smoke aerosols from several different forest fuels. Presented at the Air & Waste Management Association Specialty Conference in Ashville, NC.
Day, D. E., Malm, W. C., Carrico, C., and Engling, G. 2004. Optical, hygroscopic and chemical properties of smoke aerosols from several different forest fuels. Presented at the American Association of Aerosol Research Conference in Atlanta, GA.
DeBell, L.J., Talbot, R., Dibb, J., Munger, J., Fischer, E., and Frolking, S. 2004. A major regional air pollution event in the northeastern U.S. caused by extensive forest fires in Quebec, Canada. Journal of Geophysical Research, 109(D19), Art. No. D19305.
DeBell, L.J., Malm, W.C., Schichtel, B.A., Pitchford, M.L., Ashbaugh, L.L., McDade, C., Hyslop, N., Fox. D.G. 2004. Overview of the IMPROVE network’s quality assurance procedures and introduction to our new interactive web-based tools. Presented at the Air & Waste Management Association Specialty Conference in Ashville, NC.
DeBell, L.J., Hyslop, N., Ashbaugh, L.L., Schichtel, B.A., McDade, C., Malm, W.C., Pitchford, M.L., Fox. D.G. 2005. Introduction to the IMPROVE program’s new interactive web-based data validation tools. Presented at the 24th Annual National Conference on Managing Environmental Quality Systems in San Diego, CA.
Farber, R., Lien, N., Green, M., Gebhart, K., Molenar, J., and Iyer, H. 2004. Assessing changes in Grand Canyon haze when a regional point source reduces emissions. Presented at the Air & Waste Management Association Specialty Conference in Ashville, NC.

390
Gebhart, K.A., Schichtel, B.A., Barna, M.G. 2004. Directional biases in back-trajectories due to model and input data. Presented at the A&WMA Visibility Specialty Conference, Paper No. 83, Ashville, NC.
Gebhart, K.A., Malm, W.C., Ashbaugh, L.L. 2004. Summary of spatial, temporal, and inter-species patterns in fine particulate data in Texas. Presented at the A&WMA Visibility Specialty Conference, Paper No. 82, Ashville, NC.
Gebhart, K.A. 2005. Plans for air quality modeling for the Rocky Mountain special study. Presented at a Meeting of Scientists Interested in the Rocky Mountain National Park Study – Fate and Origins of Nitrogen and Sulfur, April 25, Denver, CO.
Gebhart, K.A. 2005. Background meteorology and climatology. Presented at a Meeting of the Scientists Interested in the Rocky Mountain National Park Study – Fate and Origins of Nitrogen and Sulfur, March 30, Fort Collins, CO.
Gebhart, K.A. 2005. Plans for meteorological modeling. Presented at a Meeting of the Scientists Interested in the Rocky Mountain National Park Study – Fate and Origins of Nitrogen and Sulfur, March 30, Fort Collins, CO.
Gebhart, K.A., Malm, W.C., Ashbaugh, L.L. 2005. Spatial, temporal, and inter-species patterns in fine particulate matter in Texas. Submitted to J. of Air & Waste Management Association.
Gebhart, K.A., Schichtel, B.A., Barna, M.G. 2005. Directional biases in back-trajectories due to model and input data. Submitted to J. of Air & Waste Management Association.
Gebhart, K.A., Schichtel, B.A., Barna, M.G., and Malm, W.C. 2005. Qualitative back-trajectory apportionment of sources of particulate sulfate at Big Bend National Park, TX. Submitted to Atmospheric Environment.
Green, M., Farber, R., Lien, N., Gebhart, K., Molenar, J., Iyer, H., and Eatough, D. 2005. Assessing changes in grand canyon haze when a regional point source reduces emissions. Submitted to J. of Air & Waste Management Association.
Gupta, P., Wang, J., Christopher, S. A., and Hand, J. L. 2004. Satellite-based assessment of air quality in megacities. Presented at the American Geophysical Union Fall Annual Meeting, San Francisco.
Hand, J. L., Kreidenweis, S. M., Slusser, J., and Scott, G. 2004. Comparisons of aerosol optical properties derived from sun photometry to estimates inferred from surface measurements in Big Bend National Park, Texas. Atmospheric Environment, 39, 6813-6821.
Hand, J. L., Mahowald, N., Chen, Y., Siefert, R., Luo, C., Subramaniam, A., and Fung, I. 2004. Estimates of atmospheric-processed soluble iron from observations and a global mineral aerosol model: Biogeochemical implications. Journal of Geophysical Research, D17205, doi:10.1029/2004JD004574.

391
Hand, J. L. and Malm, W. C. 2005. Review of the IMPROVE equation for estimating ambient light extinction. Presented at the Regional Haze Data Analysis Workshop, Denver, Colorado.
Hand, J. L., Malm, W. C., Day, D., Lee, T., Carrico, C. M., Carrillo, J., Collett, J., Jr., Laskin, A., Wang, C., Cowin, J. P., and Iedema, M. J. 2004. Individual particle analysis of biomass burning aerosols during the Yosemite Aerosol Characterization Study. Journal of Geophysical Research, under review.
Hand, J. L., Malm, W. C., Laskin, A., Day, D., Lee, T., Carrillo, J., and Collett, J., Jr. 2004. Individual particle analysis of biomass burning aerosols during the Yosemite Aerosol Characterization Study. Presented at the American Geophysical Union Fall Meeting, San Francisco.
Hand, J. L., Malm, W. C., Laskin, A., Day, D. E., Carillo, J., Lee, T., Carrico, C., McMeeking, G, Cowin, J. P., Ledema, M. J., Collett, J. L., Jr., and Kreidenweis, S. M. 2004. Single particle analysis during the Yosemite Aerosol Characterization Study. Presented at the Air & Waste Management Association Specialty Conference in Ashville, NC.
Hansen, J., Bond, T., Cairns, B., Gaeggler, H., Liepert, B., Novakov, T., and Schichtel, B. 2004. Carbonaceous aerosols in the industrial era. EOS, 25, 241-244.
Husar, R.B., Höijärvi, K., Poirot, R.L., Kayin, S., Gebhart, K.A., Schichtel, B.A., and Malm, W.C. 2004. Combined Aerosol Trajectory Tool, CATT: Status report on tools development and use. Presented at the Air & Waste Management Association Specialty Conference, Asheville, NC.
Lunden, M., Black, D., Brown, N., McMeeking, G. R., Kreidenweis, S., Carrico, C., Lee, T., Carrillo, J., Collett Jr., J., Day, D. E., Hand, J. L., and Malm, W. C. 2004. The influence of forest fires in the western United States on pollutant concentrations in California during the summer of 2002. Presented at the American Association of Aerosol Research Conference, Atlanta, GA.
Malm, W. C. 2004a. Regional trends in speciated fine particle concentration in the United States. Presented at the Monitoring Science and Technology Symposium, Denver.
-----. 2004b. Spatial and monthly trends in speciated fine particle concentration in the United States. Presented at the Rocky Mountain States Section of the Air & Waste Management Association Fall Technical Conference, Denver.
-----. 2004c. The view from the top: Factors and trends in visual air quality. Presented at the Northeastern Alpine Gathering, Twin Mountain, NH.
-----. 2005a. Fate and origin of nitrogen and sulfur along the Colorado Front Range and Rocky Mountain National Park. Presented at the Rocky Mountain National Park Air Quality Study Science Meeting, Lakewood, CO.

392
-----. 2005b. IMPROVE and the Regional Haze Rule. Presented at the International Air Quality Advisory Board International Joint Commission, Environment Canada, and National Oceanic and Atmospheric Agency workshop, Boulder, CO,
Malm, W. C., Day, D., Carrico, C. M., Kreidenweis, S. M., Collett, J., McMeeking, G, Lee, T., and Carrillo, J. 2005. Inter-comparison and closure calculations using measurements of aerosol species and optical properties during the Yosemite Aerosol Characterization Study. Journal of Geophysical Research, accepted.
Malm, W. C., Day, D. E., Carrico, C., Lee, T., Collett, J., Kreidenweis, S., McMeeking, G., and Carrillo, J. 2004. Chemical and optical properties of an organic-laden ambient aerosol in Yosemite National Park. Presented at the Air & Waste Management Association Specialty Conference, Asheville, NC.
Malm, W. C., Day, D. E., Kreidenweis, S., Collett Jr., J. L., Carrico, C. M., McMeeking, G. R., Lee, T., Carrillo, J., and Schichtel, B. A. 2005. Hygroscopic properties of an organic-laden aerosol. Submitted to Atmospheric Environment.
Malm, W. C., Schichtel, B. A., Pitchford, M. L., Ashbaugh, L. L., and Eldred, R. A. 2004. Spatial and monthly trends in speciated fine particle concentration in the United States. Journal of Geophysical Research, doi:10.1029/2003JD003739.
Malm, W. C., Schichtel, B. A., Pitchford, M. L., Ashbaugh, L. L., and McDade, C. 2004. An update of spatial and monthly trends in speciated fine particle concentration in the United States. Presented at the Air & Waste Management Association Specialty Conference, Asheville, NC.
Malm, W. C., Schichtel, B. A., Pitchford, M. L., McDade, C., and Ashbaugh, L. L. 2005. Fine and Coarse particle speciation at selected locations in the continental United States. Presented at the Air & Waste Management Association Annual Conference, Minneapolis.
-----. 2004. Coarse particle speciation at nine locations in the continental United States. Presented at the Air & Waste Management Association Specialty Conference, Asheville, NC.
McMeeking, G, Kreidenweis, S. M, Carrico, C., Lee, T. H., Carrillo, J., Collett, J. L., Jr., Day, D. E., Hand, J. L, and Malm, W. C. 2004. Dry aerosol size distributions and derived optical properties during the Yosemite Aerosol Characterization Study. Presented at the Air & Waste Management Association Specialty Conference, Asheville, NC.
McMeeking, G. R., Kreidenweis, S. M., Carrico, C. M., Lee, T., Collett, J. L., and Malm, W. C. 2005. Observations of smoke-influenced aerosol during the Yosemite Aerosol Characterization Study: Size distributions and chemical composition. Journal of Geophysical Research-Atmospheres, D9, doi:10.1029/2004JD005389.

393
Pitchford, M.L., Schichtel, B.A., Gebhart, K.A., Barna, M.G., Malm, W.C., Tombach, I.H., and Knipping, E.M. 2004. Causes of haze at Big Bend National Park – Results of the BRAVO study and more. Presented at the Air & Waste Management Association Specialty Conference, Asheville, NC.
Pitchford, M.L., Schichtel, B.A., Gebhart, K.A., Barna, M.G., Malm, W.C., Tombach, I.H., and Knipping, E.M. 2005. Reconciliation and interpretation of the Big Bend National Park’s light extinction source apportionment – Results from the BRAVO Study Part II. Submitted to J. of Air & Waste Management Association.
Rodriguez, M. A., Medrano, M., Carreras, M., Brouwer, J., Samuelsen, G. S., and Dabdub, D. 2005. Air quality impacts of distributed generation in the south coast air basin I: Scenario development and modeling analysis. Submitted to Atmospheric Environment.
Rodriguez, M. A., and Dabdub, D. 2005. Air quality impacts of distributed generation in the south coast air basin II: Uncertainty and sensitivity analysis. Submitted to Atmospheric Environment.
Rodriguez, M. A., and Dabdub, D. 2005. Air quality impacts of distributed generation: Model uncertainty and sensitivity analysis of pm2.5 aerosol. Presented at the 23d Annual American Association for Aerosol Research Conference, Atlanta, GA.
Schichtel, B. A., Gebhart, K. A., Malm, W. C., Barna, M. G., and Pitchford, M.L. 2004. Reconciliation of particulate sulfate source apportionment during the BRAVO study. Presented at the Air & Waste Management Association Specialty Conference, Asheville, NC.
Schichtel, B. A., Barna, M. G., Gebhart, K. A., and Malm, W. C. 2005. Evaluation of an Eulerian and Lagrangian air quality model using perfluorocarbon tracers released in Texas for the BRAVO haze study. Submitted to Atmospheric Environment.
Schichtel, B. A., Gebhart, K. A., Barna, M. G., and Malm, W. C. 2005. Association of airmass transport patterns and particulate sulfur concentrations at Big Bend National Park, Texas. Submitted to Atmospheric Environment.
Schichtel, B. A., Pitchford, M. L., Gebhart, K. A., Malm, W. C., Barna, M. G., Knipping, E., and Tombach, I. H. 2004. Reconciliation and interpretation of Big Bend National Park's particulate sulfur source apportionment-Results from the BRAVO study Part I. Submitted to Journal of Air & Waste Management Association.
Wang, J., Christopher, S. A., Nair, U. S., Reid, J. S., Prins, E. M., Szykman, J., and Hand, J. L. 2005. Mesoscale modeling of Central American smoke transport to the United States, Part I: “Top-down” assessment of emission strength and diurnal variation impacts. Submitted to Journal of Geophysical Research, Atmospheres.

394
Reports
Carrico, C. M., Malm, W. C., Kreidenweis, S. M., Collett, J. L. Jr., Day, D. E., McMeeking, G. R., Hand, J. L., Herckes, P., Engling, G., Lee, T., and Carrillo, J. 2005. The Yosemite Aerosol Characterization Study of 2002 (YACS), ISSN 0737-5352-65, CIRA, Colorado State University, Fort Collins.
Hand, J. L., and Malm, W. C. 2005. Review of the IMPROVE Equation for Estimating Ambient Light Extinction Coefficients. Available at http://vista.cira.colostate.edu/improve/Publications/GrayLit/016_IMPROVEeqReview/IMPROVEeqReview.htm.
Pitchford, M. L., Tombach, I. H., Barna, M. G., Gebhart, K. A., Green, M. C., Knipping, E., Kumar, N., Malm, W. C., Pun, B., Schichtel, B. A., and Seigneur, C. 2004. Big Bend Regional Aerosol and Visibility Observational (BRAVO) Study: Official Report.
Schichtel, B. A., Gebhart, K. A., Barna, M. G., Malm, W. C., Day, D. E., and Kreidenweis, S. 2004. Big Bend Regional Aerosol and Visibility Observational (BRAVO) Study Results: Air Quality Data and Source Attribution Analyses Results from the National Park Service/Cooperative Institute for Research in the Atmosphere, ISSN 0737-5352-65, CIRA, Colorado State University, Fort Collins.
395
NATIONAL PARK SERVICE-Field Studies of Aerosol Properties Relevant to Air Quality and Visibility in National Parks Principal Investigators: Sonia Kreidenweis and Jeffrey Collett, Jr. NOAA Project Goal: Weather and Water--specifically the Air Quality Program Key Words: Air quality, Aerosols, Visibility, Atmospheric Radiation, Organic Speciation, Aerosol Hygroscopicity, Light Scattering, Light Absorption, Sulfate, Nitrate 1. Long-term Research Objectives and Specific Plans to Achieve Them: The long-term goals of this project are to improve understanding of visibility degradation in national parks, diagnose contributions to air quality problems in specific parks, and to generate new knowledge on fundamental aerosol-related properties relevant to air quality and visibility. The means of accomplishing these goals involve the undertaking and analysis of field measurements of aerosol properties at selected national parks. Laboratory experiments involving the generation and measurement of aerosols, including those from biomass combustion processes, are used for further understanding aerosol behavior. Regular progress reports (bi-monthly) have been submitted to the NPS as requested. 2. Research Accomplishments/Highlights: a. Yosemite Aerosol Characterization Study of 2002: The past year involved the final phase of this study. This included the publication of a number of manuscripts from this study and preparation of a final project report. Among these were a manuscript comparing congruent measurement methods in the Yosemite study (Malm et al.), two manuscripts examining aerosol size distributions in relation to optical properties (McMeeking et al.), two manuscripts on aerosol hygroscopic properties (Carrico et al.; Malm et al.), and a manuscript investigating particle morphology (Hand et al.). Several more manuscripts are in preparation including organic carbon speciation (Engling et al.; Herckes et al.) and an overview of the Yosemite study (McMeeking et al.). b. Missoula Primary Smoke Emissions Study of 2003: The Missoula study of 2003 focused on laboratory measurements of smoke aerosol properties from a range of biomass combustion characteristics. During the past year results from this project have been reduced and prepared for publication. Methodologies have been developed including use of High Performance Anion Exchange Chromatography with Pulsed Amperometric Detection (HPAEC-PAD) as a simple and cost effective method for the analysis of the wood smoke marker, levoglucosan, in aqueous aerosol extracts. Several manuscripts are in progress from the study including one analyzing wood smoke markers (Engling et al.) and one examining primary smoke physical, optical and chemical properties (Carrico et al.).
396
c. NPS/CSU/UC-Davis Mobile Laboratory. A mobile laboratory has been designed and is currently under construction for use in air quality field studies. The vehicle has been purchased and the lab builder is currently constructing the custom laboratory. Related to this, a number of measurement systems have been constructed and tested for use as part of this laboratory including systems for dry particle sizing system, trace gas analysis (ammonia, nitrogen oxides, carbon monoxide, and ozone), a hygroscopic tandem differential mobility analyzer for measuring particle hygroscopic growth, and high time resolution inorganic and organic chemical composition. d. Nitrate/Denuder Study. A combined laboratory and field study has focused on the characterization of nitrate and other ion measurements at the IMPROVE network. As part of this, there has been laboratory testing of nitric acid collection efficiency of new and exposed IMPROVE denuders. A summary of nitrate study results to date has been prepared for publication in the IMPROVE newsletter. A manuscript has been finalized concerning nitrate extraction and measurements from nylon filters (Yu et al.), a second manuscript has been submitted concerning ammonium loss from nylon filters (Yu et al.) and work has continued on manuscripts concerning ionic speciation using conventional filter/denuder systems in comparison to on-line high time resolution methods and concerning the forms and size distributions of aerosol nitrate in several key National Parks. e. Rocky Mountain National Park Study. A study has been conceived to examine air quality issues in Colorado’s Rocky Mountain National Park, commencing in fall 2005. Issues to be addressed include PM2.5 aerosol concentrations and trace gas species concentrations, meteorological transport, and in particular the deposition of sulfate and nitrate in the park and surrounding region. The group has participated in planning meetings and study plan preparation and worked with NPS and the State of Colorado to garner state support for a RMNP pilot study in summer/fall 2005. Extensive participation of the group in the field phase will occur.
3. Comparison of Objectives Vs. Actual Accomplishments for Reporting Period: a. Yosemite Aerosol Characterization Study of 2002
Complete: Data reduction and analysis of measurements from the 2002 field campaign.
Complete: Analysis of samples for wood smoke markers in collected samples. Complete: Documenting the short-term variability of the aerosol size distribution
and aerosol hygroscopicity, and their impacts on regional haze at the park. Complete: Linking aerosol hygroscopicity to chemical composition. In progress: Continue development and testing of new methods for wood smoke
marker (levoglucosan) measurement including biosensors and High-performance Anion Exchange Chromatography
b. Missoula Primary Smoke Emissions Study of 2003
Complete: Data reduction and analysis from two week laboratory study of primary smoke properties.

397
In Progress: Publishing of results from experiment including manuscripts on aerosol physical, chemical, and optical properties and organic speciation analysis (Carrico et al., Engling et al.).
In Progress: Planning for follow-up measurement campaigns in Missoula under Joint Fire Science Program support.
c. NPS/CSU/UC-Davis Mobile Laboratory
Complete: Vehicle specifying, design, ordering, and delivery In Progress: Laboratory construction and customization of vehicle. Complete: Construction of new instrumentation for use in field campaigns. In Progress: Instrumentation testing, optimization, and utilization of measurement
capabilities. d. Nitrate/Denuder Study
Complete: Planned field measurements at selected parks concluding with San Gorgonio Wilderness Area, CA, in July 2004 and Great Smoky Mountains NP in July-Aug 2004.
Complete: Testing of IMPROVE gas denuders in the laboratory at CSU. In Progress: Data analysis and publishing of results from field and laboratory
studies (Yu et al.).
e. Rocky Mountain National Park Study Complete: Initial planning meetings for upcoming campaign. In Progress: Logistics, initial scoping study.
4. Leveraging/Payoff: The national parks are immensely popular public resources, as, for example 286 million people (approximately the population of the U.S.) visited U.S. national parks in 2000. Numerous surveys have demonstrated that visitors to national parks place a high value on pristine conditions in the park, particularly as it relates to air quality and visibility. Visibility protection and monitoring is requisite for continued visitor enjoyment of scenic vistas in the national parks. Maintenance and improvement in air quality is also important in relation to human health impacts and preventing ecosystem damage from airborne pollutants. The research in this project relates directly to diagnosing and remedying air quality problems in national parks and providing the knowledge base for future protection and improvement of air quality in the national parks.
5. Research Linkages/Partnerships/Collaborators, Communications and Networking: Ongoing collaborations with researchers from University of California at Davis (C. McDade, L. Ashbaugh, T. Cahill), Lawrence Berkeley Laboratory (M. Lunden), Lawrence Livermore Laboratory (G. Bench)
6. Awards/Honors: G.R. McMeeking, Herbert Riehl Award for M.S. level student journal publication

398
7. Outreach: a. Graduate/Undergraduate students: G.R. McMeeking, M.S., continuing for Ph.D.; G. Engling, M.S., continuing for Ph.D.; T. Lee, M.S., continuing for Ph.D.; T. Hinerman, B.S. b. Seminars, symposiums, classes, educational programs: Biomass Burning, Air Quality, and Visibility in National Parks, C.M. Carrico, presentation to University of Colorado Mechanical Engineering 5228-001 course on Biomass, Energy and Environment taught by M. Hannigan and J. Milford c. Fellowship programs: G.R. McMeeking, AAAS fellowship d. K-12 outreach: none completed e. Public awareness: none completed 8. Publications: Lee, T., Kreidenweis, S. M. and Collett, Jr., J. L. Aerosol Ion Characteristics during the Big Bend Regional Aerosol and Visibility Observational study. Journal Air and Waste Management Association, 54, 585-592, 2004. Carrico, C.M., Kreidenweis, S. M., Malm, W. C., Day, D., Lee, T., Carrillo, J., McMeeking, G. R., and Collett, Jr., J., Hygroscopic growth behavior of a carbon dominated aerosol in Yosemite National Park, Atmospheric Environment, 39, 8, 1393- 1404, 2005. Malm, W. C., Day, D. E., Carrico, C., Kreidenweis, S. M., Collett, J. L., Jr., McMeeking, G., Lee, T., and Carrillo, J., Intercomparison and closure calculations using measurements of aerosol species and optical properties during the Yosemite Aerosol Characterization Study. J. Geophys. Res., in press, 2005. McMeeking, G., Kreidenweis, S., Carrico, C., Lee, T., Collett, J., and Malm, W., “Observations of smoke influenced aerosol during Yosemite Aerosol Characterization Study, Part I: Size distributions and chemical composition,” Journal of Geophysical Research, 110, D09206, doi:10.1029/2004JD005389, 2005. McMeeking, G., Kreidenweis, S., Carrico, C., Lee, T., Collett, J., Day, D. E., and Malm, W.C., “Observations of smoke influenced aerosol during the Yosemite Aerosol Characterization Study Part II: Aerosol scattering and absorbing properties,” Journal of Geophysical Research, in press, 2005. Yu, X-Y., Lee, T., Ayres, B., Kreidenweis, S. M., and Collett, J. L., Jr., “Particulate Nitrate Measurement Using Nylon Filters,” Journal of the Air and Waste Management Association, in press, 2005. Yu, X-Y., Lee, T., Ayres, B., Kreidenweis, S. M., Malm, W. and Collett, Jr., J. L. (2005) Loss of fine particle ammonium from denuded nylon filters. Atmos. Environ., in review.

399
Abstracts Lee, T., X. Yu, B. Ayres, S.M. Kreidenweis and J.L. Collett, Jr., and W. Malm, The Importance of Coarse Mode Aerosol Nitrate at Several IMPROVE Monitoring Sites, AAAR Specialty Conference, Atlanta, GA, February 2005. Engling, G., C.M. Carrico, P. Herckes, S.M. Kreidenweis, and J.L. Collett, Jr., D.E. Day, W.C. Malm, R. Babbitt, E. Lincoln, Y. Linuma, H. Herrmann, Determination of Levoglucosan in Biomass Combustion Aerosol by HPAEC-pAD, AAAR Specialty Conference, Atlanta, GA, February 2005. Carrico, C.M., Kreidenweis, S. M., Collett, J. L., Jr., Engling, G., Day, D., and Malm, W., “Smoke properties derived from the laboratory combustion of forest fuels,” presented at the 23rd Annual American Association for Aerosol Research conference, Atlanta, GA, October 4-8, 2004. Lunden, M., Black, D., Brown, N., McMeeking, G., Kreidenweis, S., Carrico, C., Lee, T., Carrillo, J., Collett, J. L., Jr., Day, D., Hand, J. L., and Malm, W. C., “The Influence of Forest Fires in the Western United States on Pollutant Concentrations in California During the Summer of 2002,” presented at the 23rd Annual American Association for Aerosol Research conference, Atlanta, GA, October 4-8, 2004. Engling, G., Herckes, P., Carrillo, J., Kreidenweis, S., and Collett, J., “Organic Aerosol Composition in Yosemite National Park During the 2002 Yosemite Aerosol Characterization Study”, presented at the Air and Waste Management Association Conference, Asheville, NC, October 25–29, 2004. McMeeking, G. R., Kreidenweis, S. M., Carrico, C., Lee, T., Carrillo, J., Collett, J. L., Jr., Day, D. E., Hand, J. L., and Malm, W. C., “Dry Aerosol Size Distributions and Derived Optical Properties During the Yosemite Aerosol Characterization Study,” presented at the Air and Waste Management Association Conference, Asheville, NC, October 25–29, 2004. Lee, T., Yu, X-Y., Ayres, B., Kreidenweis, S., and Collett, J. L., Jr., “Characterization of Particulate Inorganic Ions at Selected IMPROVE Sites”, 2004 Fall AGU Meeting, San Francisco, CA, December 13-17, 2004. Hand, J. L., Malm, W., Laskin, A., Day, D., Lee, T., Carrillo, J., and Collett, J. L., Jr., “Individual Particle Analysis of Biomass Burning Aerosols During the Yosemite Aerosol Characterization Study,” 2004 Fall AGU Meeting, San Francisco, CA, December 13-17, 2004.

400

401
NATIONAL SCIENCE FOUNDATION - COLLABORATIVE PROPOSAL TO NSF: ENSEMBLE DATA ASSIMILATION BASED ON CONTROL THEORY Principal Investigator: Milija Zupanski NOAA Project Goal: Weather and Water, Climate NOAA Programs: Environmental Modeling
Climate Observations and Analysis, Climate
Key Words: Non-Gaussian, Non-differentiable, Minimization, Ensemble Assimilation/Prediction, Maximum Likelihood Ensemble Filter, Shallow-water
1. Long-term Research Objectives and Specific Plans to Achieve Them: The long-term objective of this research is to explore the possibility for using an ensemble assimilation/prediction system in general weather and climate applications. In particular, the Colorado State University global shallow-water model is used with the Maximum Likelihood Ensemble Filter (MLEF), in an effort to explore the possibility of developing a non-Gaussian assimilation/prediction framework. In addition, the goal is to address the issue of non-differentiability in minimization algorithms, since they naturally arise in geophysical problems. Main accomplishments achieved so far (2 years) are:
MLEF system with shallow-water model developed and tested in two important scenarios: zonal flow over an isolated mountain and Rossby-Haurwitz waves
Long-term impact of space-time dynamical correlations in weakly-chaotic systems exploited in devising a new methodology for initiation of an ensemble system
Mathematical fundamentals for a mixed Gaussian/non-Gaussian MLEF developed
Mixed Gaussian/Non-Gaussian observation MLEF framework developed and tested
Mixed Gaussian/Non-Gaussian MLEF system, for both observations and the initial conditions is being developed
Non-differentiable minimization algorithm, based on the use of MLEF, is being developed
Although this research is sponsored by the National Science Foundation, the results of this research are being transferred instantly to related projects using the MLEF algorithm, including NOAA, NASA, and DoD projects. The personnel working on this project includes Prof. David Randall (CoPI - CSU Atmospheric Science), Steven Fletcher, and the collaborating group from Florida State University (Prof. Michael Navon - PI, Bahri Uzunoglu), as well as Prof. Dacian Daescu (CoPI - Portland State University). The results of this work were presented at many workshops and conferences, including the 2005 AMS Annual Meeting (San Diego, CA), Workshop on
402
Weather and Climate (International Centre for Theoretical Physics, Trieste, Italy), 4th WMO Data Assimilation Workshop (Prague, Czech Republic), 2005 EGS Annual Meeting (Vienna, Austria). References: Zupanski, M., S.J. Fletcher, I.M. Navon, B. Uzunoglu, R.P. Heikes, D.A. Randall, T.D. Ringler, and D. Daescu, 2005: Initiation of ensemble data assimilation. Tellus A, submitted. Fletcher, S.J., and M. Zupanski, 2005: A framework for data assimilation which allows for non-Gaussian errors. Proc. Roy. Soc. London, submitted.

403
OFFICE OF NAVAL RESEARCH – DEVELOPMENT AND IMPLEMENTATION OF A STATISTICAL TROPICAL CYCLONE INTENSITY PREDICTION SCHEME IN THE SOUTHERN HEMISPHERE AND NORTH INDIAN OCEAN Principal Investigator: J.A. Knaff NOAA Project Goal: Weather and Water, Commerce and Transportation Key Words: Tropical cyclone, prediction, intensity, maximum wind speed 1. Long-term Research Objectives and Specific Plans to Achieve Them: This project builds from the previously successful development of tropical cyclone intensity guidance developed for the Northwest Pacific tropical cyclone basin. It is proposed that two statistical tropical cyclone intensity prediction models will be developed to make forecasts of tropical cyclone intensity out to 120-hours in the Southern Hemisphere and N. Indian Ocean. The first is a purely statistical model based on climatological information (data, location, current intensity etc.) and persistence of initial conditions, which is used primarily for verification purposes. The second is a statistical-dynamical model which utilizes environmental conditions predicted by a global atmospheric model in combination with climatology and persistence factors. The atmospheric fields used for this models development will be acquired from the Navy Operational Global Atmospheric Prediction System (NOGAPS) analyses available at the Naval Research Laboratory (NRL). A comprehensive statistical analysis will be performed to determine the best set of predictors for intensity change in both the Southern Hemisphere and North Indian Ocean. These models will be transitioned for use in operational tropical cyclone forecasting at the Joint Typhoon Warning Center, Honolulu, HI. 2. Research Accomplishments/Highlights: Purely statistical tropical cyclone intensity models have been developed for the Southern Hemisphere and North Indian Ocean regions using the historical tropical cyclone tracks for the 1980-2002 tropical cyclone seasons. These models have been added to the operational suite of products at the Joint Typhoon Warning Center (JTWC) and will be used as the primary control intensity forcasts for this agency. Statistical-dynamical models were developed for Southern Hemisphere tropical cyclone basin and the combined Western North Paicific/North Indian Ocean tropical cyclone basin. Changes were made to the previous formulation of the STIPS model, designed originally for the the western North Pacific basin alone, that included additional thermodynamic predictors related to atmospheric instability and a new inland decay model that will perform better over small islands. Changes will result in small but significant increases in the ability to predict tropical cyclone intensity prediction in these regions with skill measure shown in Table 1. These models have been transitioned to operations at JTWC.

404
Table 1: Shown are the developmental statistics associated with the the Indian Ocean/West Pacific and Southern Hemisphere versions of STIPS. 12-h 24-h 36-h 48-h 60-h 72-h 84-h 96-h 108-h 120-h Percent Variance Explained IO/WP 39 49 53 56 59 60 62 64 65 67 SH 45 55 59 62 64 65 67 68 70 70 Root Mean Square Error IO/WP 5.6 9.2 12.3 14.8 17.0 18.6 20.0 20.9 21.6 22.0 SH 5.3 8.9 11.9 14.5 16.5 17.9 18.5 18.8 18.5 18.3 Using the statistical-dynamic models developed by this project, experimentation using a combination consensus (different models and tracks) and ensembles (same model different tracks) has begun. An example output is shown in Figure 1. Preliminary results suggest that an additional 5% of the variance can be explained using such an approach. These CONSEMBLE modeling efforts will continue at NRL Monterey and are under evaluation at the JTWC.
Figure 1: Example of a consemble tropical cyclone forecast for SH16 on February 6 2005 at 12 UTC. Shown are the consensus members GFS (GFS1), NGAPS (NGS1) , UK Met (UKS1) and ensemble members WBAR (WBS1) and the Consemble average ST10. Note ST5D is the climatology and persistence model,UKMI is the UK Met office model forecast, GFNI is the GFDL model with NOGAPS initialization and JTWC is the offical forecast. The black line is the observed intensity change from the advisories.

405
3. Comparison of Objectives Vs. Actual Accomplishments for Reporting Period: All Accomplishments are complete. 4. Leveraging/Payoff: These tools will lead to better tropical cyclone intensity forecasting in these regions and will likely aid in more efficient Naval operations. In additon, such models can be used to help understand what input (e.g. Ocean Heat content, convective organization, etc.) is needed to make even better tropical cyclone forecasts. 5. Research Linkages/Partnerships/Collaborators, Communications and Networking: Work is sponsored by the Office of Naval Research and requires close collaboration with personnel at both the Naval Research Laboratory in Monterey, CA (C. Sampson) and the Joint Typhoon Warning Center in Honolulu, HI (E. Fukada, S. Gruber). Such work has led to a couple of spin off studies where STIPS will be: 1) used to study the relative importance of Ocean Heat Content 2) used to examine the relative improvement that can be made by using information aquired from passive microwave satellite sensors. Output of these models are being shared with forecast centers in Australia, La Reunion, and Korea via agreements with JTWC and may lead to additional collaborations. 6. Awards/Honors: None as yet 7. Outreach: (a) Graduate/Undergraduate students (List by name, degree status and continuance after obtaining degree); (b) Seminars, symposiums, classes, educational programs; (c) Fellowship programs; (d) K-12 outreach; (e) Public awareness.
a) None b) None c) None d) None e) None
8. Publications: Refereed DeMaria, M., J. A. Knaff, and J. Kaplan, 2005: On the decay of tropical cyclone winds crossing narrow landmasses. Submitted to J. App. Met. Knaff, J.A., C.R. Sampson, and M. DeMaria, 2005: An operational statistical typhoon intensity prediction scheme for the Western North Pacific, In Press Wea. Forecasting.

406
Conference Proceedings Knaff, J.A., C.R. Sampson, and M. DeMaria, 2004: An introduction to the statistical typhoon intensity prediction scheme (STIPS). AMS 26th Conference on Hurricanes and Tropical Meteorology. 3-7 May, Miami, FL. Presentations
Knaff, J.A., and C. Sampson, 2005: Development of STIPS for the Southern Hemisphere and Indian Ocean. 59th Interdepartmental Hurricane Conference, 7-11 March, Jacksonville, FL.
Cecil, D., T.A. Jones, J.A. Knaff, and M. DeMaria, 2004: Statistical forecasting of Pacific and Indian Ocean tropical cyclone intensity using 19-, 37-, and 85- GHz brightness temperatures. AMS 26th Conference on Hurricanes and Tropical Meteorology. 3-7 May, Miami, FL.

407
NOAA PROGRAMS VS. CIRA PROJECTS COMPARISON MATRIX

NO
AA
PR
OG
RA
MS
VS
. C
IRA
PR
OJ
EC
TS
CO
MP
AR
ISO
N M
AT
RIX
Pro
jec
t #
Tit
leP
IS
tart
Da
teE
nd
Da
te
Climate Observationsand
Analysis
ClimateForcing
Climate Predictionsand
Projections
Climateand
Ecosystems
Regional DecisionSupport
LocalForecasts
andWarnings
Hydrology
AirQuality
Environ-mental Modeling
Weather andWater Science
Coasts, Estuaries, andOceansMarine
Transpor-tation
System
AviationWeather
MarineWeather
NOAA Emergency Response
SurfaceWeather
SatelliteServices
PolarSatellite
Acquisitions
Geostation arySatellite Acquisitions
Homeland Security
ITServices
NO
AA
Pro
jec
ts:
5-3
11
00
Th
e C
IRE
S-N
OA
A W
este
rn W
ate
r
Asse
ssm
en
t -
Pro
vid
ing
in
cre
ase
d f
ocu
s o
n
the
cru
cia
l a
gricu
ltu
ral se
cto
rS
mith
, W
asko
m1
0/1
/20
03
9/3
0/2
00
4x
xx
x
5-3
11
30
Fu
nd
s f
or
the
Co
op
era
tive
In
stitu
te f
or
Re
se
arc
h,
Ta
sk 1
Vo
nd
er
Ha
ar
7/1
/20
05
6/3
0/2
00
6x
xx
x
5-3
11
31
Inte
ractio
ns o
f th
e M
on
so
on
an
d
An
ticyclo
ne
s in
th
e C
ou
ple
d A
tmo
sp
he
re-
Oce
an
Syste
mR
an
da
ll, R
ing
ler
7/1
/20
04
6/3
0/2
00
5x
xx
xx
xx
5-3
11
33
Co
ntin
ue
d I
nve
stig
atio
n o
f th
e N
.A.
Mo
nso
on
Se
nsitiv
ity t
o B
ou
nd
ary
an
d
Re
gio
na
l F
orc
ing
with
a F
ocu
s o
n L
an
d-
Atm
osp
he
re I
nte
ractio
nP
ielk
e,
Ca
str
o4
/1/2
00
43
/31
/20
07
xx
xx
xx
x
5-3
11
36
Imp
act
of
Inte
ractive
Ve
ge
tatio
n o
n
Pre
dic
tio
ns o
f N
ort
h A
me
rica
n M
on
so
on
sD
en
nin
g,
Lu
7/1
/20
04
6/3
0/2
00
5
5-3
11
37
Air-S
ea
In
tera
ctio
n R
em
ote
Se
nsin
g
Pro
ce
sse
s
Vo
nd
er
Ha
ar,
Frisch
7/1
/20
04
12
/31
/20
04
5-3
11
40
Re
se
arc
h t
o I
mp
rove
Tro
pic
al C
yclo
ne
Inte
nsity A
na
lyse
s a
nd
Pre
dic
tio
ns U
sin
g
Sa
telli
te D
ata
Vo
nd
er
Ha
ar
(De
Ma
ria
)7
/1/2
00
26
/30
/20
03
5-3
11
41
De
ve
lop
me
nt
of
a V
irtu
al L
ab
ora
tory
We
b
Se
rve
r fo
r In
tern
atio
na
l S
ate
llite
Me
teo
rolo
gy
Tra
inin
gC
on
ne
ll7
/1/2
00
16
/30
/20
02
5-3
11
43
NE
SD
IS P
ostd
octo
ral P
rog
ram
Vo
nd
er
Ha
ar
7/1
/20
04
6/3
0/2
00
5
5-3
11
44
En
viro
nm
en
tal A
pp
lica
tio
ns R
ese
arc
hV
on
de
r H
aa
r1
0/1
/20
04
6/3
0/2
00
5X
XX
XX
XX
XX
X
5-3
11
47
Ad
va
nce
d E
nviro
nm
en
tal S
ate
llite
Re
se
arc
h
Su
pp
ort
Vo
nd
er
Ha
ar
09
/01
/04
8/3
1/2
00
5x
xx
xx
5-3
11
50
Th
e R
ole
of
Str
ato
cu
mu
lus C
lou
ds I
n
Mo
difyin
g P
ollu
tio
n P
lum
es T
ran
sp
ort
ed
To
N.
Am
. C
on
t.K
reid
en
we
is0
9/0
1/0
48
/31
/20
05
xx
xx
5-3
11
51
Inte
rna
tio
na
l S
ate
llite
Clo
ud
Clim
ato
log
y
Pro
ject
Se
cto
r P
roce
ssin
g a
nd
An
aly
sis
Vo
nd
er
Ha
ar,
Ca
mp
be
ll7
/1/2
00
46
/30
/20
05
xx
x
5-3
11
52
Sa
telli
te D
ata
Re
ce
ptio
n a
nd
An
aly
sis
Su
pp
ort
Vo
nd
er
Ha
ar
7/1
/20
04
6/3
0/2
00
5x
xx
xx
x
5-3
11
53
CIR
A A
ctivitie
s a
nd
Pa
rtic
ipa
tio
n in
th
e
GO
ES
I-M
Pro
du
ct
Assu
ran
ce
Pla
nV
on
de
r H
aa
r1
0/1
/20
04
9/3
0/2
00
5x
xx
xx
xx
xx
5-3
11
54
Clim
ate
Pro
ce
ss T
ea
m o
n L
ow
-La
titu
de
Clo
ud
Fe
ed
ba
cks o
n C
lima
te S
en
sitiv
ity
Ra
nd
all
10
/1/2
00
39
/30
/20
06
xx
xx
xx
x
5-3
11
59
GO
ES
-I/M
Pro
du
ct
Assu
ran
ce
an
d
Ad
va
nce
d P
rod
uct
De
ve
lop
me
nt
for
Su
pp
ort
of
the
Virtu
al In
stitu
te f
or
Sa
telli
te
Inte
gra
tio
n T
rain
ing
(V
ISIT
)V
on
de
r H
aa
r1
/1/2
00
41
2/3
1/2
00
4x
xx
x
x
5-3
11
60
Va
ria
bili
ty a
nd
Tre
nd
s in
Glo
ba
l
Pre
cip
ita
tio
n
Ku
mm
ero
w a
nd
Be
rg5
/1/2
00
24
/30
/20
05
xx
xx
xx
x
5-3
11
62
Ha
rne
ssin
g t
he
Sp
are
Co
mp
utin
g P
ow
er
of
De
skto
p P
Cs f
or
Imp
rove
d S
ate
llite
Da
ta
Pro
ce
ssin
g a
nd
Te
ch
no
log
y T
ran
sitio
n
Jo
ne
s a
nd
Kid
de
r7
/1/2
00
46
/30
/20
05
xx
xx
5-3
11
63
Atm
osp
he
ric C
O2
In
ve
rsio
n I
nte
rco
mp
ariso
n
Pro
ject
(Tra
nsC
om
3)
De
nn
ing
9/1
/20
04
8/3
1/2
00
5x
xx
xx
x
5-3
11
65
De
ve
lop
me
nt
an
d E
va
lua
tio
n o
f G
OE
S a
nd
PO
ES
Pro
du
cts
fo
r T
rop
ica
l C
yclo
ne
an
d
Pre
cip
ita
tio
n A
na
lysis
Kn
aff
an
d
Gra
sso
1/1
/20
05
12
/31
/20
05
xx
xx
xx
xx
xx
xx
5-3
11
66
Stu
dy o
f th
e d
ire
ct
an
d in
dire
ct
eff
ects
of
ae
roso
l o
n c
lima
teS
tep
he
ns
7/1
/20
04
6/3
0/2
00
5x
xx
x
5-3
11
68
Ge
ttin
g R
ea
dy f
or
NO
AA
's A
dva
nce
d
Re
mo
te S
en
sin
g P
rog
ram
s A
Sa
telli
te H
yd
ro-
Me
teo
rolo
gy (
SH
yM
et)
Tra
inin
g a
nd
Ed
uca
tio
n P
rop
osa
lC
on
ne
ll7
/1/2
00
56
/30
/20
06
xx
xx
5-3
11
69
Se
ve
re W
ea
the
r a
nd
Tro
pic
al C
yclo
ne
Pro
du
ct
De
ve
lop
me
nt
for
the
Na
tio
na
l P
ola
r-
orb
itin
g O
pe
ratio
na
l E
nviro
nm
en
tal S
ate
llite
Syste
m (
NP
OE
SS
) P
rep
ara
tory
Pro
ject
Gra
sso
7/1
/20
04
6/3
0/2
00
5x
xx
xx
xx
xx
5-3
11
70
Glo
ba
l M
icro
wa
ve
Su
rfa
ce
Em
issiv
ity E
rro
r
An
aly
sis
Jo
ne
s,
Fo
rsyth
e,
Vu
kic
evic
,
Vo
nd
er
Ha
ar
7/1
/20
04
6/3
0/2
00
5x
xx
xx
x
5-3
11
71
Im
pro
ve
me
nt
in D
ete
rmin
istic a
nd
Pro
ba
bili
stic T
rop
ica
l C
yclo
ne
Su
rfa
ce
Win
d
Pre
dic
tio
ns
Kn
aff
(D
eM
aria
)7
/1/2
00
46
/30
/20
05
xx
xx
xx
x
5-3
11
74
An
Eva
lua
tio
n o
f U
ltra
so
nic
Sn
ow
De
pth
Se
nso
rs f
or
Estim
atin
g 6
an
d 2
4 h
r S
no
wfa
ll
To
tals
Pie
lke
an
d
Do
eske
n4
/1/2
00
41
1/3
0/2
00
5x
x
5-3
11
76
De
ve
lop
me
nt
of
a m
ulti-p
latf
orm
sa
telli
te
tro
pic
al cyclo
ne
win
d a
na
lysis
syste
mK
na
ff1
/1/2
00
51
2/3
1/2
00
5x
xx
xx
xx
xx
xx
5-3
11
77
An
aly
sis
an
d I
nte
rpre
tatio
n o
f C
en
su
s D
ata
De
o7
/1/2
00
48
/31
/20
04
xx
x
5-3
11
78
Da
ta F
usio
n t
o D
ete
rmin
e N
ort
h A
me
rica
n
So
urc
es a
nd
Sin
ks o
f C
arb
on
Dio
xid
e a
t
Hig
h S
pa
tia
l a
nd
Te
mp
ora
l R
eso
lutio
n
De
nn
ing
,
Da
vis
1/1
/20
04
12
/31
/20
06
xx
xx
xx

NO
AA
PR
OG
RA
MS
VS
. C
IRA
PR
OJ
EC
TS
CO
MP
AR
ISO
N M
AT
RIX
Pro
jec
t #
Tit
leP
IS
tart
Da
teE
nd
Da
te
Climate Observationsand
Analysis
ClimateForcing
Climate Predictionsand
Projections
Climateand
Ecosystems
Regional DecisionSupport
LocalForecasts
andWarnings
Hydrology
AirQuality
Environ-mental Modeling
Weather andWater Science
Coasts, Estuaries, andOceansMarine
Transpor-tation
System
AviationWeather
MarineWeather
NOAA Emergency Response
SurfaceWeather
SatelliteServices
PolarSatellite
Acquisitions
Geostation arySatellite Acquisitions
Homeland Security
ITServices
5-3
11
79
An
aly
se
s a
nd
Dia
gn
ostic S
tud
ies f
rom
SM
N
Ra
da
r a
nd
Re
late
d D
ata
in
su
pp
ort
of
NA
ME
La
ng
1/1
/20
05
12
/31
/20
05
xx
5-3
11
80
Th
e r
ole
of
Afr
ica
in
te
rre
str
ial ca
rbo
n
exch
an
ge
an
d a
tmo
sp
he
ric C
O2
: R
ed
ucin
g
reg
ion
al a
nd
glo
ba
l ca
rbo
n c
ycle
un
ce
rta
inty
Ha
na
n a
nd
De
nn
ing
5/1
/20
04
4/3
0/2
00
7x
xx
x
5-3
11
81
Imp
act
of
Fu
nd
am
en
tal A
ssu
mp
tio
ns o
f
Pro
ba
bili
stic D
ata
Assim
ilatio
n/E
nse
mb
le
Fo
reca
stin
g:
Co
nd
itio
na
l M
od
e v
s.
Co
nd
itio
na
l M
ea
nM
. Z
up
an
ski
3/1
/20
04
2/2
8/2
00
7x
xx
x
5-3
11
82
Stu
dy o
f G
ulf S
urg
es u
sin
g Q
uik
SC
AT
an
d
NA
ME
Ob
se
rva
tio
ns
Jo
hn
so
n1
0/1
/20
04
9/3
0/2
00
5x
xx
xx
xx
x
5-3
11
83
Sh
ip-B
ase
d O
bse
rva
tio
ns o
f P
recip
ita
tio
n
Co
nve
ctio
n a
nd
En
viro
nm
en
tal C
on
ditio
ns in
Su
pp
ort
of
NA
ME
-20
04
Ru
tle
dg
e1
2/1
/20
03
11
/30
/20
06
xx
xx
xx
5-3
11
84
Pro
po
sa
l o
n E
ffic
ien
t A
ll-W
ea
the
r (C
lou
dy
an
d C
lea
r) O
bse
rva
tio
na
l O
pe
rato
r fo
r
Sa
telli
te R
ad
ian
ce
Da
ta A
ssim
ilatio
n
Vu
kic
evic
,
Se
ng
up
ta,
Vo
nd
er
Ha
ar
8/1
/20
04
7/3
1/2
00
6x
xx
5-3
11
85
De
ve
lop
me
nt
of
Th
ree
-Dim
en
sio
na
l P
ola
r
Win
d R
etr
ieva
l T
ech
niq
ue
s u
sin
g t
he
Ad
va
nce
d M
icro
wa
ve
So
un
de
r U
nit
Vo
nd
er
Ha
ar
(De
Ma
ria
)7
/1/2
00
46
/30
/20
05
xx
xx
x
5-3
11
86
Ad
va
nce
d w
ea
the
r (A
WIP
S)
su
pp
ort
fo
r
sa
telli
te h
yd
ro-m
ete
oro
log
y (
sh
ym
et)
an
d
VIS
IT t
rain
ing
an
d e
du
ca
tio
n
Co
nn
ell,
Mo
len
ar
7/1
/20
04
6/3
0/2
00
6x
xx
5-3
11
87
Se
nsitiv
ity o
f th
e N
. A
m.
Mo
nso
on
to
So
il
Mo
istu
re a
nd
Ve
ge
tatio
n
Co
tto
n1
/1/2
00
51
2/3
1/2
00
7x
xx
xx
x
5-3
11
88
A h
igh
re
so
lutio
n m
ete
oro
log
ica
l d
istr
ibu
tio
n
mo
de
l fo
r a
tmo
sp
he
ric,
hyd
rolo
gic
, a
nd
eco
log
ic a
pp
lica
tio
ns
Lis
ton
, L
ixo
n,
Pie
lke
, D
en
nin
g2
/1/2
00
51
/31
/20
08
xx
xx
x
5-3
11
89
Pro
ce
ssin
g o
f o
rga
nic
ae
roso
ls b
y
he
tero
ge
ne
ou
s a
nd
mu
ltip
ha
se
pro
ce
sse
s
Erv
en
s,
Kre
ide
nw
eis
1/1
/20
05
12
/31
/20
07
xx
5-3
11
90
OR
A I
T I
nfr
astr
uctu
re o
f th
e F
utu
reJo
ne
s,
Kid
de
r4
/1/2
00
58
/31
/20
05
x
5-3
11
91
Scie
nce
ste
wa
rdsh
ip o
f th
em
atic c
lima
te
da
ta r
eco
rds-a
pilo
t stu
dy w
ith
glo
ba
l w
ate
r
va
po
r.
Vo
nd
er
Ha
ar
3/1
/20
05
11
/30
/20
05
xx
xx
x
5-3
11
92
Co
ntin
ue
d D
eve
lop
me
nt
of
Tro
pic
al C
yclo
ne
Win
d P
rob
ab
ility
Pro
du
cts
Kn
aff
(D
eM
aria
)1
/1/2
00
51
2/3
1/2
00
6x
xx
x
5-3
11
93
Imp
rove
d S
tatistica
l In
ten
sity F
ore
ca
st
Mo
de
ls
Kn
aff
(D
eM
aria
an
d K
ap
lan
)1
/1/2
00
51
2/3
1/2
00
6x
xx
xx
xx
5-3
11
94
Re
se
arc
h &
De
ve
lop
me
nt
for
GO
ES
-R R
isk
Re
du
ctio
n
Vo
nd
er
Ha
ar
(De
Ma
ria
)7
/1/2
00
56
/30
/20
06
xx
5-3
11
95
Ad
va
nce
d H
yd
rolo
gic
Pre
dic
tio
n S
erv
ice
De
o3
/1/2
00
59
/30
/20
05
xx
x
5-3
11
96
De
ve
lop
me
nt
of
an
An
nu
lar
Hu
rric
an
e
eye
wa
ll in
de
x f
or
tro
pic
al cyclo
ne
in
ten
sity
fore
ca
stin
gK
na
ff (
De
Ma
ria
)1
/1/2
00
56
/30
/20
06
xx
xx
x
5-3
11
97
Do
cu
me
ntin
g h
isto
rica
l clim
ate
ne
two
rk
sta
tio
ns in
Co
lora
do
Do
eske
n,
Pie
lke
7/1
/20
05
10
/31
/20
05
xx
x
5-3
11
98
Inve
stig
atio
n o
f sm
oke
ae
roso
l-clo
ud
inte
ractio
ns u
sin
g la
rge
ed
dy s
imu
latio
ns
Ma
tsu
mo
to,
Jia
ng
6/1
/20
05
6/3
0/2
00
6X
X
5-3
12
00
Ra
da
r R
em
ote
Se
nsin
g P
roce
sse
sV
on
de
r H
aa
r,
Frisch
4/1
/20
05
10
/31
/20
05
X
5-3
12
02
Ge
ttin
g R
ea
dy f
or
NO
AA
's A
dva
nce
d
Re
mo
te S
en
sin
g P
rog
ram
s A
Sa
telli
te H
yd
ro-
Me
teo
rolo
gy (
SH
yM
et)
Tra
inin
g a
nd
Ed
uca
tio
n P
rop
osa
lC
on
ne
ll7
/1/2
00
56
/30
/20
06
xx
xx
x
Oth
er/
No
n-N
OA
A P
roje
cts
:
5-3
17
03
Assis
tan
ce
fo
r V
isib
ility
Da
ta A
na
lysis
&
Ima
ge
Dis
pla
y T
ech
niq
ue
s (
NP
S)
Fo
x9
/1/2
00
48
/31
/20
05
x
5-3
19
20
Th
e R
ole
of
Atm
osp
he
ric W
ate
r C
on
ten
t in
Clim
ate
an
d C
lima
te C
ha
ng
e (
NA
SA
)
Ste
ph
en
s
Vo
nd
er
Ha
ar
9/1
/20
04
6/3
0/2
00
7x
xx
5-3
26
34
Fo
reca
stin
g a
nd
Mo
de
ling
Stu
die
s a
nd
Se
rvic
es (
LM
)E
is1
2/1
8/2
00
42
/26
/20
05
xx
x
5-3
27
05
Fa
st
Flu
xe
s a
nd
Slo
w P
oo
ls:
Inte
gra
tin
g
Ed
dy C
ova
ria
nce
, R
em
ote
Se
nsin
g a
nd
Eco
syste
m P
roce
sse
s D
ata
With
in a
Da
ta
Assim
ilatio
n F
ram
ew
ork
(N
AS
A)
Vu
kic
evic
02
/01
/03
1/3
1/2
00
6x
x
5-3
27
30
GL
OB
E:
Insp
irin
g t
he
Ne
xt
Ge
ne
ratio
n o
f
Exp
lore
rs (
UC
AR
-NA
SA
)M
ats
um
oto
04
/01
/03
9/3
0/2
00
8
5-3
29
39
De
ve
lop
me
nt
of
mo
bile
ae
roso
l
ch
ara
cte
riza
tio
n la
bo
rato
ry a
nd
an
aly
sis
of
fin
din
gs f
rom
th
e Y
ose
mite
ae
roso
l a
nd
vis
ibili
ty s
pe
cia
l stu
dy,
the
IM
PR
OV
E s
ite
ion
ch
ara
cte
riza
tio
n s
tud
y,
an
d t
he
Mis
so
ula
bu
rn c
ha
mb
er
sm
oke
stu
dy (
NP
S)
Kre
ide
nw
eis
,
Co
llett
09
/01
/04
8/3
1/2
00
5x
xx
5-3
30
23
Co
llab
ora
tive
Pro
po
sa
l to
NS
F:
En
se
mb
le
Da
ta A
ssim
ilatio
n B
ase
d O
n C
on
tro
l T
he
ory
M
. Z
up
an
ski
07
/01
/03
6/3
0/2
00
6x
x
5-3
41
14
Assis
tan
ce
fo
r V
isib
ility
Da
ta A
na
lysis
an
d
Ima
ge
Dis
pla
y T
ech
niq
ue
s (
NP
S)
Fo
x9
/1/2
00
48
/31
/20
05
xx

NO
AA
PR
OG
RA
MS
VS
. C
IRA
PR
OJ
EC
TS
CO
MP
AR
ISO
N M
AT
RIX
Pro
jec
t #
Tit
leP
IS
tart
Da
teE
nd
Da
te
Climate Observationsand
Analysis
ClimateForcing
Climate Predictionsand
Projections
Climateand
Ecosystems
Regional DecisionSupport
LocalForecasts
andWarnings
Hydrology
AirQuality
Environ-mental Modeling
Weather andWater Science
Coasts, Estuaries, andOceansMarine
Transpor-tation
System
AviationWeather
MarineWeather
NOAA Emergency Response
SurfaceWeather
SatelliteServices
PolarSatellite
Acquisitions
Geostation arySatellite Acquisitions
Homeland Security
ITServices
5-3
41
55
Sta
tistica
l A
na
lyse
s R
ela
ted
To
Air Q
ua
lity
an
d A
tmo
sp
he
ric V
isib
ility
(N
PS
)Iy
er
9/1
/20
04
8/3
1/2
00
5x
xx
5-3
50
80
Exp
loitin
g I
nfr
are
d S
ate
llite
Da
ta t
o E
stim
ate
Tro
pic
al C
yclo
ne
Win
d R
ad
ii (R
PI/
BB
SR
)K
na
ff (
De
Ma
ria
)2
/1/2
00
51
/31
/20
06
xx
xx
xx
xx

411
CIRA AWARDS
2004 CIRA Research Initiative Awards: Michael Hiatt, CIRA Research Infrastructure Group Manager
GLOBE support group: Travis Anderson, Matt Hansen, Mike Leon, Karen Milberger, Maureen Murray, Dave Salisbury, Mike Turpin, and Ali Zimmerman.
The Goldman Sachs Foundation Prize for Excellence in International Education was
also awarded to the GLOBE program.
Cliff Matsumoto and Kevin Micke were both recognized as AP Stars by the Colorado State University Administrative Professional Council.
NOAA/FSL’s Aviation Division received the National Weather Association’s Aviation
Meteorology Award. It was presented to the CWSU Fort Worth Staff for exceptional sustained efforts to develop and implement operations enhancements in the area of aviation services. By way of the Environmental Applications Research Project, several CIRA staff members were also included in this group of honorees: Jim Frimel, Lisa Gifford and Young Chun.
The federal researchers supporting the Range Standardization and Augmentation
(RSA) project were nominated for a DOC Technology Transfer Award. RSA is aimed at providing high resolution analyses and forecasts to support space center activities at Cape Canaveral and Vandenberg AFB, utilizing LAPS and the MM5 mesomodel. Unfortunately, CIRA Research Associate Steve Albers was not eligible to be nominated since he is not a federal employee. However, Lab Chief John McGinley made clear that Steve's key contributions to RSA were part of the reason this nomination was possible.
Federal employees Michael Barna, Kristi Gebhart, William Malm, and Bret Schichtel
were awarded the National Park Service STAR award for performance substantially exceeding job requirements in August 2004. All four employees are collocated with CIRA staff on the Foothills Campus of CSU.
U.S. National Park Service-Field Studies of Aerosol Properties Relevant to Air
Quality and Visibility in National Parks (Reporting Period (1 July 2004- 30 June 2005): G.R. McMeeking, Herbert Riehl Award for M.S. level student journal publication
Two CIRA employees were honored this past year as FSL Team Members of the
Month: Sher Schranz and Jebb Stewart.
Kevin Brundage was recognized with the 2004 FSL “Best Web Tool” Award for his Product Inventory Generator (PIG) script program for the RUC web page.

412
Shripad Deo’s Project: Applied Research in Support of Implementation of National Weather Service Advanced Hydrologic Prediction Services in Central Region was recognized with the Regional Excellence Award for Collaborative Efforts with Climate Services Division (August 2004).
David Randall, CIRA Principal Investigator, was awarded CSU’s Scholarship Impact
Award for 2005.

FY01 FY02 FY03 FY04 FY01 FY02 FY03 FY04 FY01 FY02 FY03 FY04Peer-Reviewed ~~~ ~~~ 29 70 20 21 20 14 77 78 40 25Non Peer-Reviewed ~~~ ~~~ 82 128 73 32 48 52 108 44 53 46
CI Lead Author NOAA Lead Author Other Lead Author
413

Category Number BachelorsMasters DoctorateNon-DegreedResearch Scientists 63 27 20 16 0Visiting Scientists 0 0 0 0 0Postdoctoral Fellows 9 0 0 9 0Research Support Staff & Administrative Person 22 1 4 1 16
Total 94 28 24 26 16
Category Number BachelorsMasters DoctorateNon-DegreedResearch Scientists 31 14 8 9 0Visiting Scientists 1 0 0 0 1Postdoctoral Fellows 2 0 0 2 0Research Support Staff & Administrative Person 26 5 2 1 18
Total 60 19 10 12 19
Category Number BachelorsMasters DoctorateUndergraduate 0 0 0 0Graduate 11 0 9 2
Total 11 0 9 0FSL ETL CMDL
Total 46 44 2 0
Total 2
*CIRA does not differentiate between Research Support Staff and Administrative Personnel
CIRA EMPLOYEE MATRIX
Obtained NOAA Employment within the last year
Employees who received 50% support or more
Employees located at NOAA Laboratories
Employees who received less than 50% support
Supported Students
Degree
Degree
Degree
414