Annual Report 20 14 - NERSC · Duan; Yeyi Liu; Ye Feng; Zhiming Xie . ... Bo Sun, Zhiping Tian, Na...
18
Annual Report 2014 Nansen-Zhu International Research Centre Institute of Atmospheric Physics Chinese Academy of Sciences Beijing, China
-
Upload
nguyenduong -
Category
Documents
-
view
215 -
download
2
Transcript of Annual Report 20 14 - NERSC · Duan; Yeyi Liu; Ye Feng; Zhiming Xie . ... Bo Sun, Zhiping Tian, Na...

Annual Report 2014
Nansen-Zhu International Research Centre
Institute of Atmospheric Physics
Chinese Academy of Sciences
Beijing, China
REPORT FROM THE ADVISORY
BOARD VISION The overarching goal of the Nansen-Zhu International Research Centre (NZC) is to make a significant contribution to climate research and training with emphasis on tropical and high-latitude regions, and the interactions between these regions, for past, present and future climate
ORGANIZATION The Nansen-Zhu Centre is a non-profit joint venture located at the Institute of Atmospheric Physics under the Chinese Academy of Sciences (IAP/CAS) in Beijing, China.
AIMS Exchange scientists and graduate students
between the founding partners
Initiate and develop joint research projects between the founding partners
Co-ordinate and facilitate joint research proposals to be submitted to national and international funding bodies
Stimulate and support joint publications in international peer-reviewed journals
Develop co-operation in education and research programs
RESEARCH AREAS NZC’s strategy is to integrate theory and numerical modelling with field observations and remote-sensing products to develop research within three prioritized themes. Each of these research themes will be co-headed by Chinese and Norwegian Scientists:
1. Climate Variability and Interactions (Past, Present and Future)
Co-Heads: Yongqi Gao (NERSC), Jianqi Sun (NZC)
2. Climate Predictability and Prediction
Co-heads: Noel Keenlyside (UoB), Ke Fan (NZC)
3. Regional Climate and Extremes (Dynamic and statistical downscaling)
Co-heads: Odd Helge Otterå (UniRe), Dabang Jiang (NZC)
FOUNDING PARTNERS
Institute of Atmospheric Physics, Chinese Academy of Sciences (IAP/CAS), Beijing, China
Nansen Environmental and Remote Sensing Center (NERSC), Bergen, Norway
University of Bergen (UoB), Bergen, Norway
Peking University (PKU), Beijing, China
Uni Research (UniRe), Bergen, Norway
Nanjing University (NJU), Nanjing, China
LEADER TEAM
Director Professor Huijun Wang, IAP/CAS
Deputy Director Professor Yongqi Gao, NERSC/IAP
Deputy Director Professor Jianqi Sun, IAP/CAS
Research school leader, Professor Tore Furevik, UoB
THE ADVISORY BOARD
Professor Stein Sandven, Director NERSC, Co-chairman
Professor Huijun Wang, Director IAP/CAS, Co-chairman
Professor Nils Gunnar Kvamstø, Director Geophisical Institute/UoB
Professor Benkui Tan, Dep. Director, PKU
Professor Trond Dokken, Research Director UniRe
Professor Xiuqun Yang, Director of School of Atmospheric Sciences, NJU
http://nzc.iap.ac.cn
Cover Photo: Winter in Northeast China, 2014 (H.J. Wang)

ONGOING JOINT RESEARCH 1. The Atlantic Multidecadal Variations
and the Indian Summer Monsoon. PIs are Feifei Luo (NZC) and Lea Svendsen (NERSC) together with colleagues of Shuanglin Li (NZC), Yongqi Gao (NERSC/NZC), Tore Furevik (UoB), and Noel Keenlyside (UoB)
2. Eurasian climate: Arctic forcing versus Tropical forcing. PIs are Fei Li (NZC) and Lingling Suo (NERSC) with colleagues of Huijun Wang (NZC), Yongqi Gao (NERSC/NZC), Jianqi Sun (NZC), Ola M. Johannessen (NERSC/NZC)
3. Arctic Oscillation and Asian Monsoons. PI is Shengping He (NZC) with colleagues of Yongqi Gao (NERSC/NZC), Jianqi Sun (NZC), Tao Wang (NZC) and Tore Furevik (UoB).
4. 20th Century Ocean General Circulation Model Simulation. PI is Yanchun He (NERSC/NZC) with colleagues of Helge Drange (UoB), Yongqi Gao (NERSC/NZC) and Mats Bentsen (UniRe).
5. Last two millennia simulation. PIs are Zhongshi Zhang (UniRe) and Qing Yan (NZC)
6. Monsoon dynamics. PI is PhD at UoB/NZC with colleagues of Harald Sodemann (UoB), Odd Helge Otterå (UniRe) and Dabang Jiang (NZC)
7. Cyclones over China.PIs Ola M.
Johannessen(NERSC) and B.K. Tan (Peking University/Nansen-Zhu) with Lei Chen (PKU) as Post Doc, funded by Nansen Scientific Society
STAFF At the end of 2014, NZC has a core staff of 59 persons. The staffs consist of 20 full-time members with 18 research scientists and 2 administration staff, 2 joint members, 20 PhD students and 17 master students in addition to 25 collaborating scientists.
PUBLICATIONS In 2014, the NZC staff published 54 papers in international referee journals. Of these papers, 39 were published in Scientific Citation Index (SCI) journals, 15 in other journals.
DOCTORAL DISSERTATIONS Eleven PhD-students defended their theses at IAP/CAS during Nov. 2013 to Oct. 2014:
Baoqiang Tian: The variation regularity of summer extreme heavy precipitation events in
STAFF MEMBERS By the end of 2014, the different staff categories are:
FULL-TIME (20) Huijun Wang (Dir., Prof. and Academician)
Jianqi Sun (Dep. Dir., Prof.)
Shuanglin Li (Prof.)
Dabang Jiang (Prof.)
Ke Fan (Prof.)
Aihui Wang (Prof.)
Entao Yu
Huopo Chen
Jun Wang
Tao Wang
Yali Zhu
Ying Zhang
Baoqiang Tian
Donglin Guo
Fei Li
Feifei Luo
Qing Yan
Ya Gao
Liping Zhang (Admin.)
Qin Wang(Admin.)
JOINTLY (2) Yongqi Gao (Dep. Dir., Prof.)
Ola M. Johannessen, Visiting Professor
COLLABORATORS (25) Benkui Tan; Botao Zhou; Eystein Jansen; Helge Drange; Hui Gao; Ingo Bethke; Jianjian Fu; Jiehua Ma; Jinping Han; Jingzhi Su; Lei Yu; Lixia Ju; Mats Bentsen; Odd Helge Ottera; Shan Liu; Shengping He; Tore Furevik; Weiwei Fu; Xianmei Lang; Xiuqun Yang; Xu Yue; Ying Liu; Zhiping Tian; Zhiqing Xu; Zhongshi Zhang
PHD STUDENTS (20) Bo Sun; Chen Li; Dong Chen; Hui Liu; Jiang Jiang; Jianghua Wan; Juan Ao; Kaiqing Yang; Mengzi Zhou; Na Liu; Qin Hu; Sha Wu; Shangfeng Li; Tingting Han; Xiangyu Li; Xiaomin Zhou; Xin Hao; Yang Liu; Yin Fan; Zhicong Yin
MASTER STUDENTS (17) Baohuang Su; Chao Zhang; Dongxia Yang; Hua Li; Huixin Li; Jing Li; Jing Ming; Mengqi Zhang; Shui Yu; Rongxia Li; Ting Lei; Xiaofang Huang; Xiaoxin Wang; Xinshu Duan; Yeyi Liu; Ye Feng; Zhiming Xie
the Yangtze Rvier Valley and the application of year-to-year increment climate prediction (2014.05.09) supervised by Prof. Ke Fan
Fei Li: Impact of Autumn Arctic sea ice on the Eurasian winter and spring climate and possible mechanisms (2014.05.10) supervised by Prof. Huijun Wang and Prof. Yongqi Gao
Feifei Luo: A statistic-dynamical joint approach for decadal prediction of East Asian Surface Air Temperatures (2013.11.23) supervised by Prof. Shuanglin Li and Prof. Tore Furevik
Ke Liu: The Analysis and Projection of Dry/Wet Climate Change in China (2014.05.09) supervised by Prof. Dabang Jiang and Prof. Huijun Wang
Shengping He: Unstable impact of ENSO and Arctic Oscillation on the East Asian winter climate and possible mechanisms (2014.05.10) supervised by Prof. Huijun Wang
Wei Hua: Assessment of the uncertainties in climate change in China and reconstruction of historical temperature and precipitation (2013.11.16) supervised by Prof. Samuel S. Shen and Prof. Huijun Wang
Xuedong Cui: The impact of natural external forcing factors on the Asian summer monsoon and its teleconnection with high-latitude atmospheric circulation (2014.05.11) supervised by Prof. Yongqi Gao and Prof. Jianqi Sun
Ya Gao: Interannual Variability of Summer Precipitation in Pan-Asian Monsoon Region, and Its Model Assessment and Prediction Capabiliyites Evaluation (2014.05.11) supervised by Prof. Dabang Jiang and Prof. Huijun Wang
Yanyan Huang: Predictability of the Summer Climate over East Asia–Western Pacific Regions and Its Predictors Analysis (2014.05.11) supervised by Prof. Huijun Wang
Zhiping Tian: Modeling the Mid-Holocene Climate Change and Ocean and Vegetation Feedbacks over East Asia (2014.05.09) supervised by Prof. Dabang Jiang
Zhiqing Xu: The variation of summer precipitation and its intensity of interannual variability over South China (2014.05.09) supervised by Prof. Ke Fan
In addition, five Master-students defended their thesis at IAP
Jihang Li: Research on the method of wind resource assessment and wind speed prediction based on WRF model (2014.05.11)
supervised by Prof. Zhenhai Guo and Prof. Huijun Wang
Qin Hu: Evaluation of CMIP5 models and climate change projection on the Tibetan Plateau (2014.06.03) supervised by Prof. Dabang Jiang
Yuanyuan Jing: The connection of the Atlantic Decadal Oscillation (AMO) and East Asian Climate in the pre-industrial period (2014.06.03) supervised by Prof. Shuanglin Li
Chen Li: The interannual seesaw between the Somali and the Australian cross-equatorial flow and its connection to East Asian Climate (2014.06.04) supervised by Prof. Shuanglin Li
Jie Sun: The inter-annual variation of winter surface air temperatures between China and the U.S. and the linkage with SST and Extra-tropical wave train (2014.06.04) supervised by Prof. Shuanglin Li
AWARDS NZC staff has received 13 awards in 2014:
Huijun Wang, Ke Fan, Jianqi Sun, Dabang Jiang and Xuejie Gao, National Science Award (Second Prize)
Dabang Jiang: Top Ten National Outstanding Young Meteorologist awarded by the Chinese Meteorological Society
Yali Zhu: Science and Technology Innovation awarded by the Institute of Atmospheric Physics
Ying Zhang: National Outstanding Young Meteorologist awarded by the Chinese Meteorological Society
Donglin Guo: Outstanding Doctoral Dissertation awarded by the Chinese Academy of Sciences
Donglin Guo, Qing Yan: Outstanding Doctoral Dissertation awarded by the Institute of Atmospheric Physics
Fei Li: “Exceptional Contributions to Advances in Atmospheric Sciences” awarded by Co-chief Editors of Advances in Atmospheric Sciences
Fei Li, Shengping He: Outstanding Graduate Student awarded the University of Chinese Academy of Sciences
Bo Sun, Zhiping Tian, Na Liu: Merit Student awarded by the University of Chinese Academy of Sciences
BILATERAL VISITS NZC has close collaboration and frequent project-dependent exchange with students and researchers from NERSC, UoB and UniRe.
Chinese visits to Bergen (13 visits):
Yanchun He (NZC), 01.04-29.06.2014, NERSC
Feifei Luo (NZC), 01.04-30.06.2014, NERSC
Lei Chen (PKU), 02.01-30.06.2014, Nansen Scientific Society (NSS)
Fei Li (NZC), Shengping He (NZC), Zhiqing Xu (NZC), Baoqiang Tian (NZC), Zhiping Tian (NZC), Yue Sui (NZC), Xiaomin Zhou (NZC), Ying Huang (PKU), Kun Wang (PKU), 30.06-05.07.2014, Bergen Summer School
Norwegian visits to Beijing (12 visits):
Stein Sandven (NERSC), 23.10-26.10.2014
Stein Sandven (NERSC), 05.05.-10.05.2014
Ola M. Johannessen (NERSC), 21.10.-24.10.2014
Lingling Suo (NERSC), 05.05.-09.05.2014
Nils Gunnar Kvamsø (UoB), 05.05-08.05.2014
Tore Furevik (UoB), 06.05-09.05.2014
Tore Furevik (UoB), 21.10-25.10.2014
Noel Keenlyside (UoB), 05.05-10.05.2014
Trond Dokken (UniRe), 18.10.-24.10.2014
Odd Helge Otterå (UniRe), 05.05.-09.05.2014
Odd Helge Otterå (UniRe), 21.10.-24.10.2014
Martin King (UniRe), 21.10.-25.10.2014
In addition, Yongqi Gao (NERSC/NZC/UoB) travelled 5 times and Zhongshi Zhang (UniRe/NZC) travelled 3 times back and forth between Beijing and Bergen in 2014.
SUMMER SCHOOL The sixth NZC summer school took place in Rosendal, Bergen, Norway during June 30 – July 5, 2014. With different disciplines and different cultures, 24 participants from Europe, Bangladesh and China with an overarching challenge: the AIM Challenge (Assess, Integrate, Make a plan!).
ANNUAL MEETING The annual meeting of NZC was held in Beijing on October 23-24 with all NZC staff and participants from NZC partners (photo in the back cover). The revised agreement for continued collaboration for the following three years was signed by all the partners.
ECONOMY NZC receives funding partly from the Chinese and Norwegian partners and partly from national and international funding agencies. NZC received 7090 kRMB (990 kEuro) in 2014.
PROSPECTS FOR 2015 The Board expects stable research activities in 2015. This is partly due to changes in funding situations from the Ministry of Science and
Technology (MOST), and the Chinese Academy of Sciences (CAS).
Beijing, October 23 2014
Huijun Wang (Co-chairman)
Stein Sandven (Co-chairman)
Nils Gunnar Kvamstø Benkui Tan
Eystein Jansen Xiuqun Yang
LIST OF PUBLICATIONS IN 2014
SCI INDEXED (39) 1. Chen H., J. Sun, and X. Chen (2014), Projection
and uncertainty analysis of global precipitation-related extremes using CMIP5 models, International Journal of Climatology, 34, 2730-2748
2. Chen, L., Tan, B., Kvamstø, NG, Johannessen, OM (2014), Wintertime cyclone/anticyclone activity over China and Its relation to upper tropospheric jets.Tellus A. 66, 21889, DOI: 10.3402/tellusa.v66.21889
3. Cui X., Y. Gao, and J. Sun (2014), The response of the East Asian summer monsoon to strong tropical volcanic eruptions, Advances in Atmospheric Sciences, 31(6), 1245-1255, doi: 10.1007/s00376-014-3239-8
4. Cui X., Y. Gao, J. Sun, D. Guo, S. Li, and O.M. Johannessen (2014), Role of external forcing factors in modulating the Indian summer monsoon rainfall, the winter North Atlantic Oscillation and their relationship on inter-decadal timescale, Climate Dynamics, 43, 2283-2295.
5. Drinkwater K.F., M. Martin, M. Iselin, O.H. Otterå, K. Trond, S. Svein, and Y. Gao, (2014), The Atlantic Multidecadal Oscillation: Its manifestations and impacts with special emphasis on the Atlantic region north of 60 degrees N, Journal Of Marine Systems, 133, 117-130. doi:10.1016/j.jmarsys.2013.11.001.
6. Fan K., Z. Xu, and B. Tian (2014), Has the intensity of the interannual variability in summer rainfall over South China remarkably increased? Meteorology and Atmospheric Physics, 124, 23-32.
7. Ge J., Z. Guo, D. Zhao, Y. Zhang, T. Wang, L. Yi, and C. Deng (2014), Spatial variations in paleowind direction during the last glacial period in north China reconstructed from variations in the anisotropy of magnetic susceptibility of loess deposits, Tectonophysics, 629, 353–361.
8. Guo D. and H. Wang (2014), Simulated change in the near-surface soil freeze/thaw cycle on the Tibetan Plateau from 1981 to 2010. Chinese Science Bulletin, 59, 2439–2448.
9. Han L., S. Li, and N. Liu (2014), An Approach for Improving Short-term Prediction of Summer Rainfall in North China by Decomposing Interannual and Decadal Variability. Advances in Atmospheric Sciences, 31 (2), 435-448.
10. Han, Z., S. Li, C. Li and S. Jie (2014), The

differences and causes of European climate between 2008 and 2012 winter. Chinese Journal of Geophysics, 57(3), 727-737.
11. Hill D. J., A. M. Haywood, D. J. Lunt, S. J. Hunter, F. J. Bragg, C. Contoux, C. Stepanek, L. Sohl, N. A. Rosenbloom, W. Chan, Y. Kamae, Z. Zhang, A. Abe-Ouchi, M. A. Chandler, A. Jost, G. Lohmann, B. L. Otto-Bliesner, G. Ramstein, and H. Ueda (2014), Evaluating the dominant components of warming in Pliocene climate simulations. Climate of the Past, 10, 79–90.
12. Hua W., S. S. P. Shen, and H. Wang (2014), Analysis of sampling error uncertainties and trends in maximum and minimum temperatures in China. Advances in Atmospheric Sciences, 31(2), 263–272.
13. Huang Y., H. Wang, and K. Fan, 2014: Improving the Prediction of the Summer Asian–Pacific Oscillation Using the Interannual Increment Approach, Journal of Climate, 27, 8126–8134.
14. Koldunov, N.V., Nuno Serra, Armin Kohl, Detlef Stammer, Olivier Henry, Anny Cazenave, Pierre Prandi, Per Knudsen, Ole Baltazar Andersen, Y. Gao, Johnny Johannessen, 2014: Multimodel simulations of Arctic Ocean sea surface height variability in the period 1970–2009, J. Geophys. Res. Oceans, 119 (12), 8936-8954, doi:10.1002/2014JC010170.
15. Li C. and S. Li (2014), Interannual seesaw between the Somali and the Australian cross-equatorial flows and its connection to East Asian summer monsoon, Journal of Climate, 27, 3966-3981.
16. Li F., H. Wang, and J. Liu (2014), The strengthening relationship between Arctic
Oscillation and ENSO after the mid ‐ 1990s.
International Journal of Climatology, 34(7), 2515–2521.
17. Li, F., and H. J. Wang (2014): Autumn Eurasian snow depth, autumn Arctic sea ice cover and East Asian winter monsoon, Int. J. Climatol., 34(13), 3616–3625
18. Li F., H. Wang, and Y. Gao (2014), On the strengthened relationship between East Asian winter monsoon and Arctic Oscillation: A comparison of 1950–1970 and 1983–2012, Journal of Climate, 27(13), 5075–5091.
19. Li S. and X. Chen (2014), Quantifying the response strength of southern stratospheric polar vortex to Indian Ocean warming in austral summer, Advances in Atmospheric Sciences, 31 (2), 492-503.
20. Liu N. and S. Li (2014), Predicting Summer Rainfall over the Yangtze-Huai Region Based on Timescale Decomposition Statistical Downscaling, Weather and Forecasting, 29(1),162-176.
21. Liu Y. and K. Fan (2014), An application of hybrid downscaling model to forecast summer precipitation at stations in China, Atmospheric Research, 143, 17-30.
22. Lohmann, K., J. Mignot, H. R. Langehaug, J. H. Jungclaus, D. Matei, O. H. Otterå, Y. Gao, T. L. Mjell, U. Ninnemann, and H. F. Kleiven
(2014), Using simulations of the last millennium to understand climate variability seen in paleo-observations: similar variation of Iceland-Scotland overflow strength and Atlantic Multidecadal Oscillation, Climate of the Past & Discussions, 10, 3255-3302.
23. Lohmann, K., Jungclaus, J. H., Matei, D., Mignot, J., Menary, M., Langehaug, H. R., Ba, J., Y. Gao, Otterå, O. H., Park, W., and Lorenz, S. (2014), The role of subpolar deep water formation and Nordic Seas overflows in simulated multidecadal variability of the Atlantic meridional overturning circulation, Ocean Science, 10, 227-241.
24. Luo F. and S. Li (2014), Joint statistical-dynamical approach to decadal prediction of East Asian surface air temperature, Science China: Earth Sciences, 57(12), 3062-3072.
25. Ma J. and H. Wang (2014), Design and testing of a global climate prediction system based on a coupled climate model. Science China: Earth Sciences, 57(10), 2417-2427.
26. Ma J., H. Wang and Y. Zhang (2014), Will typhoon over the western North Pacific be more frequent in the blue Arctic conditions? Science China: Earth Sciences, 57(7), 1494–1500.
27. Sandø A. B., Y. Gao, and H. Langehaug (2014), Poleward ocean heat transports, sea ice processes and Arctic sea ice variability in NorESM1-M simulations, Journal of Geophysical Research-Ocean, 19 (3), 2095-2108
28. Sui Y., X. Lang, and D. Jiang (2014), Time of emergence of climate signals over China under the RCP4.5 scenario, Climatic Change, 125, 265−276.
29. Sun B. and H. Wang (2014), Moisture sources of semi-arid grassland in China using the Lagrangian Particle Model FLEXPART, Journal of Climate, 27, 2457–2474.
30. Sun J. (2014), Record-breaking SST over mid-North Atlantic and extreme high temperature over the Jianghuai–Jiangnan region of China in 2013, Chinese Science Bulletin, 59(27), 465–3470.
31. Svendsen L., Steffen Hetzinger, N. Keenlyside, and Y. Gao (2014), Marine-based multi-proxy reconstruction of Atlantic multi-decadal variability, Geophysical Research Letters, 41(4), 1295-1300, doi: 10.1002/2013GL059076.
32. Wang A. and X. Zeng (2014), Range of monthly mean hourly land surface air temperature diurnal cycle over high northern latitudes, Journal of Geophysical Research: Atmospheres, 119, 5836-5844, doi:10.1002/2014JD021602.
33. Wang A., M. Barlage, X. Zeng, and C. S. Draper (2014), Comparison of land skin temperature from a land model, remote sensing, and in situ measurement, Journal of Geophysical Research: Atmospheres, 119, 3093-3106, doi:10.1002/2013JD021026.
34. Wang H., J. Zhu, and Y. Pu (2014), The earth system simulation, Scientia Sinica Physica, Mechanica & Astronomica, 44(10), 1116-1126.
35. Yu E., T. Wang, Y. Gao, and W. Xiang (2014), Precipitation Pattern of the Mid-Holocene

Simulated by a High-Resolution Regional Climate Model, Advances in Atmospheric Sciences, 31, 962–971
36. Zhang R. and D. Jiang (2014), Impact of vegetation feedback on the mid-Pliocene warm climate, Advances in Atmospheric Sciences, 31, 1407−1416.
37. Zhang Z., G. Ramstein, M. Schuster, C. Li, C. Contoux and Q. Yan (2014), Aridification of the Sahara desert caused by Tethys Sea shrinkage during the Late Miocene, Nature, 513, 401–404.
38. Zhou B. and X. Cui (2014), Interdecadal change of the linkage between the North Atlantic Oscillation and the tropical cyclone frequency over the western North Pacific, Science China: Earth Sciences, doi: 10.1007/s11430-014-4862-z.
39. Zhou M. and H. Wang (2014), Late Winter Sea Ice in the Bering Sea: Predictor for Maize and Rice Production in Northeast China, Journal of Applied Meteorology and Climatology, 53, 1183–1192.
OTHERS (15) 1. Ao J. and J. Sun (2014), Difference of water
vapour transportation in the inter-annual and decadal variations of winter precipitation over Western China, Climatic and Environmental Research, 19(4), 497-506. (in Chinese)
2. Chen H. and J. Sun (2014), Robustness of precipitation projections in China: Comparison between CMIP5 and CMIP3 model, Atmospheric and Oceanic Science Letters, 7(1), 67-73.
3. Chen H. and J. Sun (2014), Sensitivity of climate changes to CO2 emissions in China, Atmospheric and Oceanic Science Letters, 7(5), 422-427.
4. Dong X., T. Su, J. Wang, R. Lin (2014), Decadal Variation of the Aleutian Low-Icelandic Low Seesaw Simulated by a Climate System Model (CAS-ESM-C), Atmospheric and Oceanic Science Letters, 7(2), 110-114.
5. Han L.,Z. Han,and S. Li (2014), Projection of
heavy rainfall events in the middle and lower reaches of the Yangtze River valley in the 21st century under different representative concentration pathways, Transactions of
Atmospheric Sciences , 37(5), 529-540 (in
Chinese) 6. Hu Q., D. Jiang, and G. Fan (2014), Evaluation of
CMIP5 models over the Qinghai–Tibetan Plateau, Chinese Journal of Atmospheric Sciences, 38 (5), 924−938. (in Chinese)
7. Jing Y., S. Li, J. Wan, and F. Luo (2014), Relationships between the Oxygen Isotope in Stalagmites from East Asia and the Large Scale Atmospheric-Oceanic Modes, Atmospheric and Oceanic Science Letters, 7(6), 540-545.
8. Li J., Z. Guo, and H. Wang (2014), Analysis of Wind Power Assessment Based on the WRF Model, Atmospheric and Oceanic Science Letters, 7(2), 126-131.
9. Liu H. and Fan. K (2014), The Eurasia seasonal
circulation climatology and variability:Evaluation
of 20CR reanalysis datasets in Eurasia and East
China, Chinese Journal of Atmospheric Sciences, 38(3), 469-483. (in Chinese)
10. Liu K. and D. Jiang (2014), Interdecadal change and cuase analysis of extreme summer and winter droughts over China, Chinese Journal of Atmospheric Sciences, 38, 309−321. (In Chinese)
11. Pan P., Y. Zhu, and J. Wang (2014), Spatial−temporal variations of temperature and the cause analyses in the Yellow River valley during recent 50 years, Climatic and Environmental Research, 19 (4), 477−485. (in Chinese)
12. Wu, L., A. Wang, and Y. Sheng (2014), Impact of Soil Texture on the Land Surface Process in China, Climatic and Environmental Research, 19(5), 559-571, doi: 10.3878/j.issn.1006-9585.2013.13055
13. Xu Z. and K. Fan (2014), Simulating the mechanism of the interannual variability mode of the Indian Ocean sea surface temperature anomalies impacting on the summer rainfall over eastern China, Climatic and Environmental Research, 19(1), 31–40. (in Chinese)
14. Yang K. and D. Jiang (2014), Recent change of the South Asian high, Atmospheric and Oceanic Science Letters, 7, 330−333.
15. Zeng, X, and A. Wang (2014), Global hourly land surface air temperature data sets covering 61 years now available, GEWEX newsletters, 24(3), 6-7.
REPORT OF JOINT RESEARCH Modulation of the Pacific Decadal Oscillation (PDO) on the summer precipitation over East China (Yu, L., Furevik, T., Otterå, O.H., Gao, Y. 2015)
This study found that a modulation of the PDO on the summer precipitation pattern over East China during the 20th century is partly responsible for the “southern flood and northern drought” pattern that occurred during the late 1970s-1990s. During positive PDO phases, the warm winter sea surface temperatures (SSTs) in the eastern subtropical Pacific causes a zonal anomalous circulation over the subtropical-tropical Pacific Ocean that strengthens western Pacific subtropical high and thus more moisture over the Yangtze River Valley (YRV) region. The summer precipitation is increased over the YRV region while it is decreased over North China. The suggested mechanism is found both in the observations and in a 600-year fully coupled pre-industrial simulation with Bergen Climate Model.

Figure: Differences of summer precipitation over East China between the last positive and negative PDO phases in the (a) station data, (b) GPCC and (c) CRU dataset; and differences between earlier positive and negative phses in the (d) GPCC and (e) CRU dataset. The two black rectangles denote North China (upper, 112o-122 o E and 34o-40 o N) and YRV region (lower, 105o-122oE and 27o-33oN). (f) the composited summer precipitation by difference between the positive and negative PDO phases in the 600-yr CTL simulations. The differences with confidence levels exceeding 90% are denoted with white dots
East Asian winter monsoon (EAWM) and Arctic Oscillation (AO) (Li, F., Wang, H.J., Gao, Y., 2014)
In this paper, we use NCEP and ERA40 reanalysis data to document the strengthened relationship between the EAWM and the winterAO on the inter-annual timescale with a comparison of 1950–1970 and 1983–2012. Their connection was statistically insignificant during 1950–1970 whereas it was statistically significant during 1983–2012 (figure). The latter significant connection might be attributed to upstream extension of the East Asian jet stream (EAJS): The EAJS signal is relatively confined to the western North Pacific before the 1970s while it extends westward toward East Asia after the 1980s. This upstream extension leads to the rearrangement of eastward-propagating Rossby waves with a much wider horizontal structure, thereby bonding the EAWM and the AO. Further, the model simulations demonstrated that the reduction of autumn Arctic sea ice cover (ASIC) is responsible for the strengthened EAWM–AO relationship after the 1980s by producing the EAJS upstream extension. After the 1980s, a strong anticyclonic anomaly over the Polar Ocean and anomalous easterly advection over northern Eurasia are generated by the near-surface heating over the Barents–Kara (B–K) seas caused by the reduction of ASIC. This further induces cold anomalies over northern Eurasia, altering the meridional temperature gradient between the mid-latitude and tropical region, and consequently leading to westward penetration of the EAJS.
Figure: (upper panel) Time series of EAWMI (1–4) (solid line with closed-circle) together with -AOI (bar) from 1950–2012. (Lower panel) The 25-year-sliding correlation coefficients between EAWM (1–4) and -AO. The base of bar is 0.39, which indicates the standard, statistically significant at 95% confidence level, as estimated using the Student’s t-test
Natural external forcings modulate the Indian summer monsoon rainfall and the winter North Atlantic Oscillation (Cui, X.D., Gao, Y., Sun,J.Q., Guo, D., Li, S.L., Johannessen, O.M. 2014)
One of the most important climate features for Indian societies (agriculture and electric power supply) is the Indian Summer Monsoon (ISM), leading to heavy rainfall from June to September. For example, a large part of the country receives about 80% of the annual rainfall during the four monsoon months, June to September. Given the socioeconomic impact of monsoons, there is a great need to understand the underlying dynamics of monsoon regions including teleconnection with other major oscillations such as North Atlantic Oscillation (NAO). We use reconstructed data and multi-centennial integrations performed with the Bergen Climate Model Version 2 to investigate the impact of natural external forcing factors on the ISM rainfall, the winter NAO, and the potential relationship between the ISM rainfall and the winter NAO on decadal to inter-decadal timescales. The model simulations include a 600-year control integration (CTL600) and a 600-year integration with time-varied natural external forcing factors from 1400 to 1999 (EXT600). Both reconstructed data and the simulation showed increased ISM rainfall 2–3 years after strong volcanic eruptions (figure). Strong volcanic eruptions decrease the Indian Ocean sea surface temperature (SST), which increases the strength of the southwesterly winds over the Arabian Sea. With negative externally-forced radiative anomaly, the lower stratospheric pole-to-equator winter temperature gradient is enhanced, leading to a positive winter NAO anomaly with a time lag of 1 year. There is no significant correlation between the winter NAO and ISM rainfall in CTL600. However, the ISM rainfall is significantly positively correlated with the winter NAO in EXT600, with the NAO leading by 2–4 years, which is consistent with the NAO–ISM rainfall relationship in the reconstructed data. We suggest that natural external forcing factors regulate the inter-decadal variability of both the winter NAO and the ISM rainfall and thus likely lead to an increased statistical but not causal relationship between them on the inter-decadal timescale over the past centuries.

Figure: (Left) The composite anomalies of simulated unfiltered summer precipitation (unit: mm/day) in the 3rd year after volcano eruptions and (Right) The composite anomalies of the unfiltered summer Palmer Drought Severity Index from the reconstructed Monsoon Asia Drought Atlas over past 600 years. In the panels, the climatology during the 8 pre-eruption years is used as the reference period.
Wintertime cyclone/anticyclone activity over China (Chen, L, Tan, B, Kvamstø, NG, Johannessen, OM. 2014)
In this study, the wintertime cyclone/anticyclone activity and its variability over China are examined based on the National Centers for Environmental Prediction/National Center for Atmospheric Research (NCEP/NCAR) reanalysis data from 1948 to 2007. The climatology of the source, path and lysis regions for cyclones/anticyclones is investigated using an automatic tracking algorithm. Apparent asymmetries in source, lysis and path regions are observed between cyclones and anticyclones. The 1948-2007 data exhibit an upward trend in the annual number and a downward trend in the cyclone and anticyclone intensity. The leading empirical orthogonal function (EOF) mode of the cyclone transit counts (CTC) for the 1948-2007 periods indicates an increase in cyclone activity over north-eastern East Asia since the late 1970s that becomes significant in the mid-1980s. The first EOF mode of the anticyclone transit counts (ATC) is a monopole over northern East Asia, centred west of Lake Baikal, which has increased since 1970. The CTC variability dominates the ATC variability, which corresponds well with the storm track variability. Two distinct variability modes in the upper tropospheric jets over East Asia are also observed. The first mode describes an oscillation in the subtropical jet position; the second mode describes the polar-front jet strength variation. Moreover, the second mode is closely linked to the cyclone/anticyclone activity variability.
Aridification of the Sahara desert caused by Tethys Sea shrinkage during the Late Miocene (Zhang, Z.S., Ramstein, G., Schuster, M., Li, C., Contoux, C. & Yan, Q. 2014)
How old is the Sahara desert? It is widely believed that Sahara desert, the world’s largest subtropical desert, first appeared during the last 2 to 3 million years, but recent discoveries such as
ancient sand dunes and dust records in marine cores push the possible onset of Saharan aridity back in time by several million years. Until now, however, there have been no good explanations for such an early Sahara onset. This study pinpoints the Tortonian stage (~7-11 million years ago) as a pivotal period for triggering North African aridity and creating the Sahara desert. Using snapshot simulations with the Norwegian Earth System Model (NorESM), the international team explored the climate evolution of North Africa through major tectonic shifts over the last 30 million years. They found that the region undergoes aridification with the shrinkage of the Tethys – a giant ocean that was the origin of the modern Mediterranean, Black and Caspian Seas – during the Tortonian (figure). The simulations are the first to show that the Tethys shrinkage has two main consequences for North African climate. First, it weakens the African summer monsoon circulations and dries out North Africa. Second, it enhances the sensitivity of the African summer monsoon and its associated rainfall to orbital forcing. The Tortonian stage thus marks the time when North Africa shifted from a permanently lush, vegetated landscape to a landscape experiencing arid/humid cycles on orbital time scales. Interestingly, these major changes in North African climate and environment are coincident with an important time period for the emergence of early hominids.
Figure: Expansion of desert areas (red hatched) in the Late Oligocene (a, ~30Ma), Early Miocene (b, ~20Ma), Late Miocene (c, ~10Ma) and modern (d) experiments
SCIENTIFIC REPORT Inter-decadal transition of the inter-annual variability of summer rainfall in East China (Sun and Wang, 2014)
This study investigated the inter-decadal variations of the leading empirical orthogonal function (EOF) mode of the inter-annual variability of summer precipitation in East China from 1951–2012. From the 1950s to the 1980s, the main rain belt in the positive-phase years was centered along the middle and lower Yangtze River Valleys

(YRV), with negative rainfall anomalies in South China and North China. Since the 1990s, the main rain belt of the positive-phase years has been shifted northward. During the period 2001–2012, the centre of the main rain belt in the positive-phase years has shifted to the regions between the Yangtze and Yellow Rivers (figure 1). This shift could be attributed to the inter-decadal variations of the anomalous atmospheric water vapor transport (AWVT) associated with the leading mode, which changed from a previously “anticyclone–cyclone” dipole structure to an anticyclonic monopole structure. The underlying physical mechanisms concerning the exertions from sea surface temperatures (SSTs) have also been preliminarily explored. The results indicate that the significant inter-decadal transition in the leading mode of summer precipitation in East China and the causative anomalous AWVT from 2001–2012 may be related to an inter-decadal change of inter-annual variability of the tropical SSTs in both the Indian and Pacific Oceans, which has been below normal from 2001–2012. Therefore, the influence of the tropical SSTs on the inter-annual variability of the East Asian climate may be diminished from 2001–2012, whereby a strongly coupled “anticyclone–cyclone” dipole-structured anomalous AWVT cannot be induced.
Figure 1: The leading EOF modes of summer precipitation in East China for the periods (a) 1951–1962, (b) 1962–1980, (c) 1980–1991, (d) 1991–2001, and (e) 2001–2012. Areas of positive values are contoured by solid lines; areas of negative values are contoured by dashed lines and shaded in gray.
Atmospheric moisture sources affecting East China (Sun and Wang, 2014)
In this study, the atmospheric moisture sources affecting three sub-regions of East China, which are South China (SC), the middle and lower
Yangtze River Valleys (YRV), and North China (NC), are identified and compared based on the simulation results of a Lagrangian particle dispersion model, FLEXPART, for the period 2000–2009. The investigation is conducted for ‘non-precipitation’ and ‘precipitation’ cases of summertime (May–Sep) and wintertime (Oct–Apr). Furthermore, the contributions of moisture originating from the land area, western Pacific Ocean, and Indian Ocean to the precipitation in the three sub-regions of East China are quantitatively estimated (figure 2). The results indicate that during summertime, the transport of moisture from the Indian Ocean and western Pacific dominates the precipitation in SC, with almost equivalent contributions; evaporation over the land area seems to be the key contributor to the precipitation in YRV and NC, followed by the evaporation over the western Pacific. During wintertime, the precipitated moisture in SC originates largely from the western Pacific, while evaporation over the land area is the predominant contributor to the precipitation in YRV and NC. The results of this study indicate that the precipitation in the three sub-regions of East China reflect the contributions of the Indian monsoon and East Asian summer monsoon to different degrees.
Figure 2: The percentages of summertime (May–Sep) and wintertime (Oct–Apr) precipitation in the annual total precipitation and the contributions of moisture from the land area (‘LD’), western Pacific (‘WP’), Indian Ocean (‘IO’), and other source regions (‘others’).
Modulation of Aleutian Low and Antarctic Oscillation co-variability by ENSO (Li, F., Wang, H.J., Gao, Y., 2014)
We use both the NCEP–NCAR reanalysis data (1979–2013) and the Community Atmospheric Model Version 3 (CAM 3) to explore the modulation of El Niño–Southern Oscillation (ENSO) on the co-variability of the Aleutian Low (AL) and the Antarctic Oscillation (AAO). The empirical orthogonal function (EOF) analysis on the NCEP-NCAR reanalysis data indicates that after the late-1990s the global sea level pressure (SLP) and 300-hPa geopotential height (Z300) in boreal January are characterized by the concurrence of the AL and the negative phase of the AAO (-AAO). Associated with this AL–AAO co-variation is a sea surface temperature (SST)
anomaly that resembles the ENSO cycle. Further analyses reveal that the inter-decadal change in ENSO signal (westward extension and more La Niña events) is responsible for the co-variability of AL and AAO after the late-1990s. Correspondingly, the El Niño-related anomalous heating and upward motion over the eastern–central equatorial Pacific can lead to the upper-tropospheric divergence in the western–central Pacific. This upper-tropospheric divergence plays an essential role in coupling the equatorial heat anomalies with the variation of the subtropical westerly jet of both hemispheres, and therefore results in the enhanced meridional circulation of the three cells. It thus implies that ENSO might act as a bridge linking AL and AAO after the late-1990s (figure 3), causing their consistent co-variability. The numerical experiment also supports this hypothesis.
Figure 3: (a) Time series of the Nino3.4 index (black solid line with closed circles) and the un-detrended Nino3.4 index (bar) in boreal January during 1979–2013. (b) The 11-year-sliding correlation coefficients between Nino3.4 and AL (black solid line) and between Nino3.4 and -AAO (blue solid line). The dashed line indicates the standard for 95% significance, estimated by the Student’s t-test.
Link the sea ice to agriculture production in Northeast China (Zhou and Wang, 2014)
We attempt to investigate the linkage between late winter Bering Sea ice and maize/rice yields in Northeast China (NEC). Results show that such ice influences NEC crop production and thus can be employed to predict harvest amounts (figure 4). The possible mechanism is as follows. The positive late winter sea ice cover anomalies can persist until spring and that spring sea ice can strengthen North Pacific Oscillation (NPO) positive-phase patterns, and vice versa. NPO significantly affects sea surface temperature (SST) over the North Pacific due to sea–air interaction, particularly in the Kuroshio Current region, which may persist until summer. In association with the positive SST anomalies, the polar vortex weakens and the western Pacific subtropical high strengthens, resulting in the convergence of southern and northern air masses over NEC. Moreover, both the southerly flow
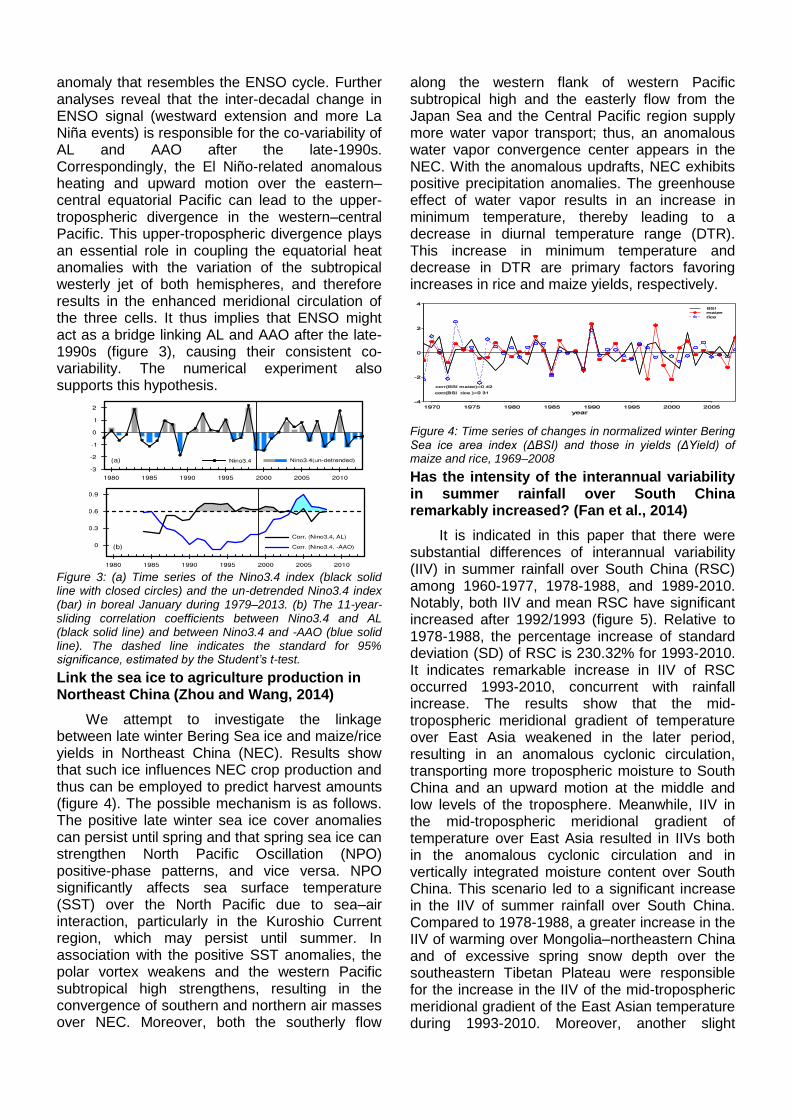
along the western flank of western Pacific subtropical high and the easterly flow from the Japan Sea and the Central Pacific region supply more water vapor transport; thus, an anomalous water vapor convergence center appears in the NEC. With the anomalous updrafts, NEC exhibits positive precipitation anomalies. The greenhouse effect of water vapor results in an increase in minimum temperature, thereby leading to a decrease in diurnal temperature range (DTR). This increase in minimum temperature and decrease in DTR are primary factors favoring increases in rice and maize yields, respectively.
Figure 4: Time series of changes in normalized winter Bering Sea ice area index (ΔBSI) and those in yields (ΔYield) of maize and rice, 1969–2008
Has the intensity of the interannual variability in summer rainfall over South China remarkably increased? (Fan et al., 2014)
It is indicated in this paper that there were substantial differences of interannual variability (IIV) in summer rainfall over South China (RSC) among 1960-1977, 1978-1988, and 1989-2010. Notably, both IIV and mean RSC have significant increased after 1992/1993 (figure 5). Relative to 1978-1988, the percentage increase of standard deviation (SD) of RSC is 230.32% for 1993-2010. It indicates remarkable increase in IIV of RSC occurred 1993-2010, concurrent with rainfall increase. The results show that the mid-tropospheric meridional gradient of temperature over East Asia weakened in the later period, resulting in an anomalous cyclonic circulation, transporting more tropospheric moisture to South China and an upward motion at the middle and low levels of the troposphere. Meanwhile, IIV in the mid-tropospheric meridional gradient of temperature over East Asia resulted in IIVs both in the anomalous cyclonic circulation and in vertically integrated moisture content over South China. This scenario led to a significant increase in the IIV of summer rainfall over South China. Compared to 1978-1988, a greater increase in the IIV of warming over Mongolia–northeastern China and of excessive spring snow depth over the southeastern Tibetan Plateau were responsible for the increase in the IIV of the mid-tropospheric meridional gradient of the East Asian temperature during 1993-2010. Moreover, another slight

increase in the IIV of summer rainfall over South China occurred in 1960-1977 relative to 1978-1988, which partly resulted from the weakening East Asian summer monsoon variability in the late 1970s.
Figure 5: Time series of RSC (mm/day, red) during 1960-
2010 and the 11-year running standard deviation of RSC (mm/day, blue)
Hybrid downscaling to forecast summer precipitation in China (Liu and Fan, 2014)
A pattern prediction hybrid downscaling method was applied to predict summer (June-July-August) precipitation at China 160 stations. The predicted precipitation from the downscaling scheme is available one month before. Four predictors were chosen to establish the hybrid downscaling scheme. The 500-hPa geopotential height (GH5) and 850-hPa specific humidity (q85) were from the skillful predicted output of three DEMETER (Development of a European Multi-model Ensemble System for Seasonal to Interannual Prediction) general circulation models (GCMs). The 700-hPa geopotential height (GH7) and sea level pressure (SLP) were from reanalysis data sets. The hybirid downscaling scheme (HD-4P) has better prediction skill than a conventional statistical downscaling model (SD-2P) which contains two predictors derived the output of GCMs, although two downscaling schemes were performed to improve the seasonal prediction of summer rainfall in comparison with the original output of the DEMETER GCMs. In particular, HD-4P downscaling predictions showed lower root mean square errors than those based on the SD-2P model (figure 6). Furthermore, the HD-4P downscaling model reproduced the China summer precipitation anomaly centres more accurately than the scenario of the SD-2P model in 1998. A hybrid downscaling prediction should be effective to improve the prediction skill of summer rainfall at stations in China.
Figure 6: The spatial RMSE skill score based on the MME downscaling (a) GH5 model, (b) q85 model, (c) GH7 model, (d) SLP model, (e) SD-2P model and (f) HD-4P model. Unit: %.
The near-surface soil freeze/thaw cycle on the Tibetan Plateau from 1981 to 2010 (Guo and Wang, 2014)
The near-surface freeze/thaw cycle in cold regions play a major role in surface energy budget, hydrological activity, and terrestrial ecosystems. In this study, the Community Land Model, version 4 (CLM4) and a suite of new, high-resolution atmospheric data were used to investigate the near-surface soil freeze/thaw cycle change in response to climate warming on the Tibetan Plateau from 1981 to 2010. The in situ observations-based validation showed that, considering the issue of scale mismatch in the comparison, the simulated soil temperature, freeze start and end dates, and freeze duration at near surface were reasonable. In response to the Plateau warming of approximately 0.44oC decade–1, the date of freeze start delayed at an area-mean rate of 1.7 days decade–1, while the date of freeze end advanced at an area-mean rate of 4.7 days decade–1. The delaying freeze start date that was associated with the advancing freeze end date resulted in a statistically significant shortening trend in the freeze duration, with an area-mean rate of 6.4 days decade–1 (figure 7). These changes would strongly affect surface energy flux, hydrological processes, and vegetation dynamics. It was found that the shortening rate of freeze duration at near-surface soil was approximately 3.0 days decade–1 smaller than that at a depth of 1 m. This implied that the changes in soil freeze/thaw cycles at near surface could not sufficiently reflect the situations at deep layer soil. The significant correlations between freeze duration and air temperature indicated that the shortening of near-surface freeze duration was caused by the rise in air temperature, which occurred especially in spring. These results can be used to reveal the law of the response of near-surface freeze/thaw cycle to climate change and indicate the changes in permafrost.

0-8-12 -4
! ! !
! ! !
! ! ! ! ! ! ! !
! ! ! ! ! ! ! ! ! ! ! ! ! ! ! !
! ! ! ! ! ! ! ! ! ! ! ! ! ! ! ! ! ! !
! ! ! ! ! ! ! ! ! ! ! ! ! ! ! ! ! ! ! ! !
! ! ! ! ! ! ! ! ! ! ! ! ! ! ! ! ! ! ! ! ! ! ! ! !
! ! ! ! ! ! ! ! ! ! ! ! ! ! ! ! ! ! ! ! ! ! !
! ! ! ! ! ! ! ! ! ! ! ! ! ! ! ! ! ! ! ! ! ! ! !
! ! ! ! ! ! ! ! ! ! ! ! ! ! ! ! ! ! ! ! !
! ! ! ! ! ! ! ! ! ! ! ! ! ! ! ! ! ! ! ! ! ! ! ! ! ! !
! ! ! ! ! ! ! ! ! ! ! ! ! ! ! ! ! ! ! ! ! ! ! ! ! ! ! ! ! ! ! !
! ! ! ! ! ! ! ! ! ! ! ! ! ! ! ! ! ! ! ! ! ! ! ! ! ! ! ! ! ! ! ! ! ! !
! ! ! ! ! ! ! ! ! ! ! ! ! ! ! ! ! ! ! ! ! ! ! ! ! ! ! ! ! ! ! ! !
! ! ! ! ! ! ! ! ! ! ! ! ! ! ! ! ! ! ! ! ! ! ! ! ! ! ! ! ! ! ! ! !
! ! ! ! ! ! ! ! ! ! ! ! ! ! ! ! ! ! ! ! ! ! ! ! ! ! ! ! ! ! ! ! ! ! !
! ! ! ! ! ! ! ! ! ! ! ! ! ! ! ! ! ! ! ! ! ! ! ! ! ! ! ! ! ! ! ! ! !
! ! ! ! ! ! ! ! ! ! ! ! ! ! ! ! ! ! ! ! ! ! ! ! ! ! ! ! ! ! ! ! ! ! !
! ! ! ! ! ! ! ! ! ! ! ! ! ! ! ! ! ! ! ! ! ! ! ! ! ! ! ! ! ! !
! ! ! ! ! ! ! ! ! ! ! ! ! ! ! ! ! ! ! ! ! ! ! ! ! ! ! ! ! ! ! ! !
! ! ! ! ! ! ! ! ! ! ! ! ! ! ! ! ! ! ! ! ! ! ! ! ! ! ! ! ! ! ! ! !
! ! ! ! ! ! ! ! ! ! ! ! ! ! ! ! ! ! ! ! ! ! ! ! ! ! ! ! ! ! ! ! !
! ! ! ! ! ! ! ! ! ! ! ! ! ! ! ! ! ! ! ! ! ! ! ! ! !
! ! ! ! ! ! ! ! ! ! ! ! ! ! ! ! ! ! ! ! ! ! !
! ! ! ! ! ! ! ! ! ! ! ! ! ! ! ! ! ! ! !
! ! ! ! ! ! ! ! ! ! ! ! ! !
! ! ! ! !
100°E95°E90°E85°E80°E
40°N
35°N
30°N
25°N
0 2 4
! ! !
! ! ! !
! ! ! ! ! ! ! !
! ! ! ! ! ! ! !
! ! ! ! !
! ! ! !
! ! ! ! ! !
! !
!
! ! ! ! !
! ! ! ! !
! ! ! ! ! !
! ! ! !
! ! ! ! ! ! ! ! !
! ! ! ! ! ! ! ! ! ! !
! ! ! ! !
! ! ! !
! ! ! ! ! ! ! ! ! ! ! !
! ! ! ! ! ! ! ! ! ! ! ! ! ! ! ! ! !
! ! ! ! ! ! ! ! ! ! ! ! !
! ! ! ! ! ! ! ! ! ! ! ! !
! ! ! ! ! ! ! ! ! !
! ! ! ! ! !
!
!
! !
!
! ! ! ! ! !
! ! ! ! ! ! ! ! !
! ! ! ! ! ! ! !
! ! ! ! ! ! ! !
! ! ! ! ! !
! ! ! ! !
! ! ! ! ! !
! !
!
! ! ! ! !
! ! ! ! ! !
! ! ! ! ! !
! ! ! ! !
! ! ! ! ! ! ! ! !
! ! ! ! ! ! ! ! ! ! !
! ! ! ! ! ! !
! ! ! !
! ! ! ! ! ! ! ! ! ! ! !
! ! ! ! ! ! ! ! ! ! ! ! ! ! ! ! ! !
! ! ! ! ! ! ! ! ! ! ! ! !
! ! ! ! ! ! ! ! ! ! ! ! !
! ! ! ! ! ! ! ! ! !
! ! ! ! ! ! !
! ! ! ! !
! !
100°E95°E90°E85°E80°E
40°N
35°N
30°N
25°N
0-6-9 -3
! ! ! !
! ! ! ! !
! ! ! ! ! ! ! ! ! ! ! ! ! ! ! ! ! !
! ! ! ! ! ! ! ! ! ! ! ! ! !
! ! ! ! ! ! ! ! ! ! ! ! ! ! ! !
! ! ! ! ! ! ! ! ! ! ! ! ! ! ! ! ! !
! ! ! ! ! ! ! ! ! ! ! ! ! ! ! ! ! !
! ! ! ! ! ! ! ! ! ! ! ! ! ! ! ! ! ! ! ! ! !
! ! ! ! ! ! ! ! ! ! ! ! ! ! ! ! ! ! ! ! ! ! ! ! ! ! ! ! ! ! ! !
! ! ! ! ! ! ! ! ! ! ! ! ! ! ! ! ! ! ! ! ! ! ! ! ! ! ! ! ! ! ! ! ! ! ! !
! ! ! ! ! ! ! ! ! ! ! ! ! ! ! ! ! ! ! ! ! ! ! ! ! ! ! ! ! ! ! ! ! ! ! ! !
! ! ! ! ! ! ! ! ! ! ! ! ! ! ! ! ! ! ! ! ! ! ! ! ! ! ! ! ! ! ! ! ! ! ! ! ! !
! ! ! ! ! ! ! ! ! ! ! ! ! ! ! ! ! ! ! ! ! ! ! ! ! ! ! ! ! ! ! ! ! ! ! ! ! !
! ! ! ! ! ! ! ! ! ! ! ! ! ! ! ! ! ! ! ! ! ! ! ! ! ! ! ! ! ! ! !
! ! ! ! ! ! ! ! ! ! ! ! ! ! ! ! ! ! ! ! ! ! ! ! ! ! ! !
! ! ! ! ! ! ! ! ! ! ! ! ! ! ! ! ! ! ! ! ! ! ! ! ! ! ! ! ! ! ! !
! ! ! ! ! ! ! ! ! ! ! ! ! ! ! ! ! ! ! ! ! ! ! ! ! !
! ! ! ! ! ! ! ! ! ! ! ! ! ! ! ! ! ! ! ! ! ! ! ! ! ! ! ! ! ! ! ! ! ! ! ! ! !
! ! ! ! ! ! ! ! ! ! ! ! ! ! ! ! ! ! ! ! ! ! ! ! ! ! ! ! ! !
! ! ! ! ! ! ! ! ! ! ! ! ! ! ! ! ! ! ! ! ! ! ! !
! ! ! ! ! ! ! ! ! ! ! ! ! ! ! ! ! ! ! ! ! ! !
! ! ! ! ! ! ! ! ! ! ! ! ! ! ! ! ! ! ! !
! ! ! ! ! ! ! ! ! ! ! ! ! !
! ! ! ! ! ! ! ! !
! ! ! !
100°E95°E90°E85°E80°E
40°N
35°N
30°N
25°N
1980 1990 2000 2010
284
287
290
293
296
Da
te o
f fr
ee
ze s
tart
/ d
ay
Year
(b) Time series(a) Trend in date of freeze start
(c) Trend in date of freeze end
(e) Trend in freeze duration
1980 1990 2000 2010
89
96
103
110
117
Date
of fr
eeze
end
/ day
Year
(d) Time series
1980 1990 2000 2010
164
171
178
185
192
Fre
eze
dura
tion/ day
Year
(f) Time series
CR=1.7
CR=-4.7
CR=-6.4
Figure 7: Spatial distributions of the trends in the simulated date of freeze start (a), date of freeze end (c), and freeze duration (e) at near-surface soil as well as their area-averaged time series (b, d, and f, respectively) from 1981 to 2010. CR denotes a change in rate. Areas with significance level exceeding 95% are denoted with dots. The white grids in the northwestern corner of the Plateau represent those areas where soil always freezes over the course of at least one year from 1981 to 2010. The dashed line in subgraphs (b), (d), and (f) represents the trend line of the corresponding time series.
Time of emergence of climate signals over China under the RCP4.5 scenario (Sui et al., 2014)
The signal of climate change is emerging against a background of natural internal variability. The time of emergence (ToE) is an indicator of the magnitude of the climate change signal relative to this background variability and may be useful for climate impact assessments. We examined the ToE of surface air temperature and precipitation over China under a medium mitigation scenario Representative Concentration Pathway 4.5 based on 30 satisfactory global climate models that are chosen from the Coupled Model Intercomparison Project Phase 5. Major conclusions are: the earliest ToE of annual and seasonal temperature occurs in the eastern Qinghai-Tibetan Plateau between 2006 and 2012 for S/N > 1.0 and between 2020 and 2030 for S/N > 2.0, which is 10–20 years sooner than in Northeast China where the latest ToE appears in the country (figure 8a). Consistent with previous studies at the global scale, the median ToE for most of China occurs sooner in summer (2008–2020 for S/N > 1.0 and 2020–2045 for S/N > 2.0), while for Northeast and North China the median ToE occurs sooner in autumn (2015–2025 for S/N > 1.0 and 2040–2050 for S/N > 2.0). For the ToEof temperature, the inter-model uncertainty is at least 24 years in all five regions (figure 8a) and
more than 85 years in some seasons, and the inter-model uncertainty in one season for which the earliest median ToE occurs is the smallest among the seasons. For precipitation, the early ToE occurs in the northeastern Qinghai-Tibetan Plateau for the annual mean, and seasonally it occurs first in winter in northern Northeast China and southwestern Northwest China and in winter and spring in the northeastern Qinghai-Tibetan Plateau (figure 8b). For southern China, the median ToE would not occur until 2090.
Figure 8: Median ToE of annual (a) surface air temperature and (b) precipitation for S/N > 1.0, respectively. Regions 1 to 5 indicated by black polygons in (a) correspond to northwestern China, the eastern Qinghai-Tibetan Plateau, North China, northeastern China, and southeastern China, respectively
Influence of South Asian Black Carbon Aerosol on East Asian Summer Monsoon (Mahmood and Li, 2014)
The remote impact of South Asian black carbon (SABC) aerosol on East Asian summer monsoon (EASM) was studied and compared with the local impact of local East Asian black carbon (EABC) by using ensemble sensitive experiments in atmospheric general circulation model, GFDL AM2.1. The results show that SABC causes a south–north tripolar precipitation response pattern
over East Asia(figure 9). This includes reduced
rainfall over a central area from the Yangtze River valley to East China Sea and southern Japan but intensified rainfall over a northern domain ranging from northern China/Korea to northern Japan as well as over a southern domain, southern China. Such SABC induced changes are about 5–10% of the observed climatological rainfalls in East Asia. Mechanistically, such a remote effect is realized through a propagating wave train along the Asian upper tropospheric jet. The wave train disperses South Asian atmospheric signals downstream and causes intensification of the western Pacific subtropical anticyclone (WPSA), resulting in weakened moisture supply toward East Asia from the Bay of Bengal. In addition, the remote circulation response enhances atmospheric stability over the Yangtze River valley. These two effects together cause rainfall reduction in the

Yangtze River valley. Besides, the remote effect tends to offset a fraction of rainfall intensification induced by local EABC.
Figure 9: Rainfall responses in (a) South Asian BC and (b) East Asian BC ensemble
Quantifying the response strength of southern stratospheric polar votex to Indian Ocean warming in austral summer (Li and Chen, 2014)
A previous multiple-AGCM study suggested that Indian Ocean Warming (IOW) tends to warm and weaken the southern polar vortex. Such an impact is robust because of a qualitative consistency among the five AGCMs used. However, a significant difference exists in the modeled strengths, particularly in the stratosphere, with those in three of the AGCMs (CCM3, CAM3, and GFS) being four to five times as strong as those in the two other models (GFDL AM2, ECHAM5). As to which case reflects reality is an important issue not only for quantifying the role of tropical ocean warming in the recent modest recovery of the ozone hole over the Antarctic, but also for projecting its future trend. This issue is addressed in the present study through comparing the models’ climatological mean states and intrinsic variability, particularly those influencing tropospheric signals to propagate upward and reach the stratosphere. The results suggest that differences in intrinsic variability of model atmospheres provide implications for the difference. Based on a comparison with observations, it is speculated that the impact in the real world may be closer to the modest one simulated by GFDL AM2 and ECHAM5, rather than the strong one simulated by the three other models (CCM3, CAM3 and GFS). In particular, IOW during the past 50 years may have dynamically induced a 1.0°C warming in the polar lower stratosphere (~100 hPa), which canceled a fraction of radiative cooling due to ozone depletion (figure 10).
Figure 10: Comparison of modeled responses of stationary heat transport at 100hPa to IOW in the five AGCMs with the observed trend. The observed trend is calculated as the difference of the mean through 1994-2008 minus 1979-1993. Units: k m s-1
Predicting summer rainfall over the Yangtze-Huai Region based on time-scale decomposition statistical downscaling (Liu and Li, 2014)
A statistical downscaling scheme based on time-scale decomposition is adapted for summer rainfall prediction over the Yangtze–Huai River region of east China. Both the predictand and the predictors are decomposed into interannual and decadal components. Two distinct statistical downscaling models are built for the separated time scales and the predicted results are combined to represent the total prediction. The efficiency of this approach was assessed through comparisons with the models’ raw hindcasts as well as that from one parallel statistical downscaling scheme without time-scale decomposition. The results display that the time-scale decomposition scheme leads to significant improvements in the spatial and temporal correlation coefficients (CCs) and the root-mean-square errors (RMSEs) as well (figure 11). The multiyear averaged spatial CCs reach up to 0.49 for all the individual models and their multimodel ensemble (MME), and the temporal CCs at each station are significantly higher with the coefficients from 0.46 to 0.7. Furthermore, two cases, the years 1998 and 1999, are selected for comparison. The former is a relatively easy predictable case and nearly all models predicted successfully, whereas the latter is a difficult case and nearly all models failed. The results suggest significant improvements for both cases. Thus, the present statistical downscaling scheme with time-scale decomposition may be appropriate for operational predictions.

Figure 11: The correlations between the observation with (a)–(d) the raw DEMETER outputs, (e)–(h) the time-scale decomposition downscaling model for the 42-yr period from 1960 to 2001. The areas exceeding the 95% and 99% significance levels are shaded in light gray and dark gray, respectively
An Approach for Improving Short-Term Prediction of Summer Rainfall over North China by Decomposing Interannual and Decadal Variability (Han et al., 2014)
A statistical downscaling approach was developed to improve seasonal-to-interannual prediction of summer rainfall over North China by considering the effect of decadal variability based on observational datasets and dynamical model outputs. Both predictands and predictors were first decomposed into interannual and decadal components. Two predictive equations were then built separately for the two distinct timescales by using multivariate linear regressions based on independent sample validation. For the inter-annual timescale, 850-hPa meridional wind and 500-hPa geopotential heights from multiple dynamical models’ hindcasts and SSTs from observational datasets were used to construct predictors. For the decadal timescale, two well-known basin-scale SST decadal oscillation (the Atlantic Multidecadal Oscillation and the Pacific Decadal Oscillation) indices were used as predictors. Then, the downscaled predictands were combined to represent the predicted/hindcasted total rainfall. The prediction was compared with the models’ raw hindcasts and those from a similar approach but without timescale decomposition. In comparison to hindcasts from individual models or their multi-model ensemble mean, the skill of the present scheme was found to be significantly higher, with anomaly correlation coefficients increasing from nearly neutral to over 0.4 and with RMSE
decreasing by up to 0.6 mm/d (figure 12). The improvements were also seen in the station-based temporal correlation of the predictions with observed rainfall, with the coefficients ranging from − 0.1 to 0.87, obviously higher than the models’ raw hindcasted rainfall results. Thus, the present approach exhibits a great advantage and may be appropriate for use in operational predictions.
Figure 12: Correlation of mainland China summer precipitation derived from the 160-station-gauged precipitation dataset with (a) the Somali–Australian CEF seesaw index, (b) simultaneous Ni~no-3.4 index, (c) Somali–Australian CEF seesaw index after the ENSO signals are removed, and (d) Ni~no-3.4 index in the previous winter [D(21)JF]. The bigger and smaller black (gray) dots indicate a positive (negative) correlation significant at the 95% and 90% level, respectively.
The differences and causes of European climate between 2008 and 2012 winter (Han et al., 2014)
There are huge differences in the European climate between 2008 and 2012 winter (January and February), and La Nina occurred in both winters. The surface temperature was above normal during 2008 winter, and was below normal during 2012 winter. The atmospheric circulation anomalies are the direct reasons for the different climate. In 2008 winter, the North Atlantic Oscillation anomaly was in positive phase, benefited the Europe warming. During 2012 winter, the blocking over the North Atlantic and high-latitude Eurasia benefited the extreme cold event in Europe. The role of sea surface temperature (SST) and sea ice concentration anomalies were investigated by one atmospheric general circulation model. The SST anomalies over the North Atlantic can explain the atmospheric circulation over Atlantic in Europe in a certain extent separately for these two years, so they are important for the climate differences. While the tropical SST anomalies can just simulate similar atmospheric responses over the North Atlantic in 2012 winter, while they seemed play a negative role in 2008 winter. The loss of sea ice over Arctic adjoined Europe lead to cold conditions over Europe, so it played a negative

role during 2008 winter, while a positive role during 2012 winter (figure 13).
Figure 13: The sea surface temperature anomalies (℃) in
December 2007 (a) and 2011 (b); (c, d) Same as (a, b), but
for the average of January and February in 2008 and 2012.
Design and testing of a global climate prediction system based on a coupled climate model. (Ma and Wang, 2014)
A global climate prediction system (PCCSM4) was developed based on the Community Climate System Model, version 4.0, developed by the National Center for Atmospheric Research (NCAR), and an initialization scheme designed by our group. Thirty-year (1981–2010) one-month-lead retrospective summer climate ensemble predictions were carried out and analyzed. The results showed PCCSM4 can efficiently capture the main characteristics of JJA mean sea surface temperature (SST), sea level pressure (SLP) and precipitation. The prediction skill for SST is high, especially over the central and eastern Pacific where the influence of El Niño-Southern Oscillation (ENSO) is dominant. Temporal correlation coefficients between the predicted Niño3.4 index and observed Niño3.4 index over the 30 years reach 0.7, exceeding the 99% statistical significance level. The prediction of 500-hPa geopotential height, 850-hPa zonal wind and SLP shows greater skill than for precipitation (figure 14). Overall, the predictability in PCCSM4 is much higher in the tropics than in global terms, or over East Asia. Furthermore, PCCSM4 can simulate the summer climate in typical ENSO years and the interannual variability of the Asian summer monsoon well. These preliminary results suggest that PCCSM4 can be applied to real-time prediction after further testing and improvement.
Record-breaking SST over mid-North Atlantic and extreme high temperature over the Jianghuai–Jiangnan region of China in 2013 (Sun, 2014)
Figure 14: TCCs of JJA mean (a) 500-hPa geopotential height, (b) 850-hPa zonal wind, (c) SLP, and (d) precipitation (crossed lines indicate statistical significance at the 95% confidence level).
In July 2013, the Jianghuai–Jiangnan region of China experienced a persistent extreme high temperature, and the surface air temperature (SAT) over many areas of the region set a new record, which had a profound impact on people’s lives. This study explored the possible mechanism for this extreme climate phenomenon. The results show that the sea surface temperature (SST) over the mid-North Atlantic in July 2013 was the warmest observed over the past 160 years. The strong anomaly of the SST connects to the East Asian upper level westerly and western Pacific subtropical high (WPSH) via the teleconnection wave train and further contributes to the SAT variability over the Jianghuai–Jiangnan region; this connection could be one possible mechanism for the formation of the record breaking extreme hot event (EHE) over the Jianghuai–Jiangnan region in July 2013. In addition, for the EHE over the Jianghuai–Jiangnan region, the role of the WPSH was generally emphasised. This study found that the variability of the upper level westerly over the Jianghuai–Jiangnan region is also an important climate factor impacting the SAT of the region (figure 15). In particular, the record-breaking weakness of the upper level westerly corresponded to the record-breaking SAT over the Jianghuai–Jiangnan region in July 2013. These results indicate that the role of the upper level westerly should be emphasised in addition to the WPSH, according to both the variability in the summer air temperature and the EHE over the Jianghuai–Jiangnan region.

Figure 15: Normalised North Atlantic SST index (black line), zonal wind index (multiplied by –1) (green line), WPSH index (blue line) and SAT index (red line). Cycle indicates the maximum value.
Dynamical seasonal predictability of the Arctic Oscillation using a CGCM (Sun and Ahn, 2014)
The potential dynamical predictability of the winter Arctic Oscillation (AO) is investigated using the ensemble hindcast from the Pusan National University coupled general circulation model (PNU-CGCM) over the 30-year period of 1981–2010. The analysis indicates that PNU-CGCM can not only reproduce the spatial distribution of the AO but also significantly simulate the AO’s temporal variability (figure 16). In addition, the coupled model performs well in terms of predicting the AO’s impact on the Northern Hemisphere winter climate. These results reveal the coupled model’s potential for dynamical forecasting of the climate over the mid-latitude to high latitude.
Figure 16: Normalized time series of the leading EOF mode over 1981-2010
The Eurasia seasonal Sea Level Pressure climatology (Liu and Fan, 2014)
We evaluate the characterization capabilities of seasonal Eurasia sea level pressure (SLP) climatology of the newly released Twentieth Century Reanalysis (20CR) datasets by U.S. National Oceanic and Atmospheric Administration (NOAA). The left row and the middle row represent seasonal climatology of SLP field of 20CR and NCEP2 dataset respectively, seasonal differences between these two (20CR minus NCEP2) are showed in the rightmost row, together with corresponding seasonal wind differences at 850hPa (arrow, units: m/s) . The results shows that, during 1979 to 2010, in the Eurasia area, compared with NCEP2 data, 20CR reanalysis data exhibits higher values in the northern high latitudes and lower values in the southern low latitudes, resulting a weaker winter monsoon and a stronger summer monsoon circulations (figure 17). The discrepancy in the Eurasia area may partly cause by the handling of the specified sea-ice concentration in the polar coastal area in 20CR reanalysis data.
Figure 17: Climatology of seasonal evolution of SLP during 1979 to 2010 (left row: 20CR,middle row: NCEP2) and the difference(20CR minus NCEP2) between seasonal SLP field (right row, contour, units: hPa) and seasonal wind at 850hPa (right row, arrow, units: m/s). SLP difference where statistically significant at the 95% level according to the Student’s t test are shaded (red: positive, blue: negative). The magnitude of the wind difference less than 1m/s at 850hPa is omitted.
Precipitation Pattern of the Mid-Holocene Simulated by a High-Resolution Regional Climate Model (Yu et al., 2014)
Early proxy-based studies suggested that there potentially occurred a “southern drought/northern flood” (SDNF) over East China in the mid-Holocene (from roughly 7000 to 5000 years before present). In this study, we used both global and regional atmospheric circulation models to demonstrate that the SDNF—namely, the precipitation increases over North China and decreases over the the lower reaches of the Yangtze River Valley—could have taken place in the mid-Holocene (figure 18). We found that the SDNF in the mid-Holocene was likely caused by the lower SST in the Pacific. The lowered SST and the higher air temperature over mainland China increased the land–sea thermal contrast and, as a result, strengthened the East Asian summer monsoon and enhanced the precipitation over North China.
Figure 18: (a, b) Annual mean, (c, d) JJA, and (e, f) DJF precipitation change (6k minus 0k; shading; units: %) for IAP4 (upper panels) and WRF (lower panels). Areas with confidence level greater than 95% are dotted
From the Annual Meeting of Nansen-Zhu International Centre on October 22-23 in 2014, Beijing
The Nansen-Zhu International Research Centre, Beijing, China
http://nzc.iap.ac.cn
Director: Prof. Huijun Wang (IAP/CAS, NZC)
Founding partners:
Institute of Atmospheric Physics/Chinese Academy of Sciences (IAP/CAS), Beijing, China
Nansen Environmental and Remote Sensing Center (NERSC), Bergen, Norway
Uni Research (UniRe), Bergen, Norway
University of Bergen (UoB), Bergen, Norway
Peking University (PKU), Beijing, China
Nanjing University, Nanjing, China
A partner in the Nansen Group of research institutes led by Prof. Ola M. Johannessen, also comprising;
Nansen Environmental and Remote Sensing
Center
Bergen, Norway
http://www.nersc.no
Nansen International Environmental and
Remote Sensing Centre
St. Petersburg, Russia
http://www.niersc.spb.ru/
Nansen Environmental Research Institute –
India
Cochin, India
http://www.nerci.in
Nansen-Tutu Centre for Marine Environmental
Research
Cape Town, South Africa
Nansen Scientific Society
Bergen, Norway