
Annual report -...
22
Prepared by: Iowa Consortium for Substance Abuse Research and Evaluation University of Iowa, Iowa City, Iowa 52242-5000 With Funds Provided By: Iowa Department of Public Health, Division of Public health, Bureau of Substance Abuse Prevention Through Mentoring Annual report
-
Upload
truongtuyen -
Category
Documents
-
view
215 -
download
1
Transcript of Annual report -...

Prepared by:
Iowa Consortium for Substance Abuse Research and Evaluation
University of Iowa, Iowa City, Iowa 52242-5000
With Funds Provided By:
Iowa Department of Public Health, Division of Public health, Bureau of Substance Abuse
Prevention Through Mentoring
Annual report

Citation of references related to this report is appreciated. Suggested citation:
McGovern, P., Guard, M., & Arndt, S. (2011). Prevention Through mentoring program evaluation:
Annual report. (Iowa Department of Public health Contract #5881YM50 ). Iowa City, IA: Iowa
Consortium for Substance abuse research and evaluation: http://iconsortium.subst-
abuse.uiowa.edu/

Prevention Through Mentoring
Program Evaluation
Annual Report
July 2010 – June 2011
Prepared By:
Patrick McGovern, BA
Evaluation Coordinator
Molly Guard, MA
Associate Director
Stephan Arndt, PhD
Director
© 2011 University of Iowa

Table of Contents Introduction 1 Demographics 1
Outcome Data 2 Change in Past 30-Day Use 3
Table 1: Change in Past 30-Day Use: Programs Serving Middle School Age Youth 3 Graph 1: Change in Past 30-Day Use: Programs Serving Middle School Age Youth 4
Table 2: Change in Past 30-Day Use: Programs Serving High School Age Youth 5 Graph 2: Change in Past 30-Day Use: Programs Serving High School Age Youth 6
Attitudes Toward Use 7
Graph 3: Change in Attitude Toward Use: PTM Survey Respondents 7 Graph 4: Change in Attitude Toward Use: GRIP Mentoring Participants 8
Graph 5: Change in Attitude Toward Use: One on One Mentoring Participants 9
Graph 6: Change in Attitude Toward Use: Link to LNX Mentoring Participants 10
Perceived Risk of Harm from Use 11
Graph 7: Change in Perceived Risk: PTM Survey Respondents 11 Graph 8: Change in Perceived Risk: GRIP Mentoring Participants 12 Graph 9: Change in Perceived Risk: One on One Mentoring Participants 13 Graph 10: Change in Perceived Risk: Link to LNX Mentoring Participants 14 Graph 11: Change in Perception of Harmfulness of Use: PTM K-5 Survey Respondents 15
Mentor-Mentee Match Data 15
Conclusion 16
Table 3: Positive Outcome Percentages for Attitudes by Participant Group 17
Table 4: Positive Outcome Percentages for Perceived Risk by Participant Group 18
Prevention Through Mentoring FY11 Annual Evaluation Report 1
Introduction
The purpose of the Prevention Through Mentoring (PTM) project is to promote the creation and support of community youth mentoring programs to achieve Iowa’s goal of primary prevention of the use and abuse of alcohol, tobacco, and other drugs. Nine substance abuse organizations participate in this project: Big Brothers Big Sisters of Siouxland; Clinton Community School District; Helping Services; Henry County Extension; Iowa City Community School District; Loess Hills Area Education Agency; Mason City Youth Task Force; Northwest Iowa Alcohol and Drug Treatment Unit; and Youth and Shelter Services. These agencies implemented mentoring programs that pair a youth with an adult mentor. These pairs then try to meet regularly and visit, be it by attending events together, playing, and other activities.
Evaluation Design
The evaluation employs a matched pre-post design, whereby a survey is administered when a participant enters the mentoring program and at the beginning of each subsequent project year (pre-test), then again at the end of each project year (post-test). This report provides data for State Fiscal Year 2011 (FY11). It includes participants who entered the program between July, 2010 and March, 2011, and participants who entered the program prior to July, 2010 and remained in the program this fiscal year. Participants who entered the program in April, May, or June, 2011 are not included in the analysis, as agencies are not required to administer post-tests to participants who took pre-tests less than three months prior to the end of the fiscal year. Six-hundred seventy-four participant pre-tests and five-hundred thirty-seven post-tests were collected during FY11, yielding four-hundred forty-three matched pre- and post-tests. Two survey instruments are used: the Prevention Through Mentoring Survey, designed for participants in the sixth grade and above; and the Prevention Through Mentoring K-5 Survey, designed for participants in kindergarten through fifth grade. The pre-post data were used to help answer the following evaluation questions:
Has alcohol/tobacco/marijuana use changed in the target population?
Has the percentage of the target population who indicate positive attitudes at baseline (pre-test) maintained or increased after the intervention (post-test)?
Has perceived risk of alcohol/tobacco/marijuana use maintained a positive response or increased from pre-test to post-test?
Demographics
The median age of all PTM participants at post-test was twelve years old. The median age of PTM Survey respondents (sixth grade and above) at post-test was fourteen years old. The median age of K-5 Survey respondents at post-test was nine years old. Fifty-four percent of participants were female, and nearly thirteen percent were Hispanic or Latino. Participant racial groups are delineated below:

Prevention Through Mentoring FY11 Annual Evaluation Report 2
73.6% White
10.8% Black/African American
1.4% American Indian/Alaskan Native
1.0% Asian
13.3% More than one race
Outcome Data
The figures included in the outcome data section detail results from the standard PTM Survey and the K-5 Survey. PTM Survey results include past 30-day substance use, attitudes toward substance use, and perceptions of risk of harm from substance use. K-5 Survey results include perceptions of risk of harm from substance use. PTM Survey data are provided for all participants with matching PTM Survey pre- and post-tests and for three mentoring programs: GRIP (Great Relationships in Pairs) Mentoring, Link to LNX (Life, Networks & eXcellence), and Academic Mentoring. One On One Mentoring served some youth who completed the PTM Survey and others who completed the K-5 Survey; thus rendering the program data not reportable. All other mentoring programs did not meet the minimum sample size necessary for individual reporting. An attrition analysis was performed on these data to identify potential differences between participants who terminated their involvement in the program and those who remained in the program this fiscal year. Nearly twenty percent of PTM Survey respondents who completed a pre-test did not complete a post-test. However, there were no statistically significant differences on any variables between participants who completed a PTM Survey post-test and those who did not (Cochran-Mantel-Haenszel tests). Thus, the participants represented in the PTM Survey outcome data presented in this report are not noticeably different from those who began the program. Iowa Youth Survey (IYS) data are provided as a reference point for interpreting the outcome data in this report. The Iowa Youth Survey is a triennial census assessment of Iowa’s secondary school-age (grades 6, 8, and 11) student attitudes toward substance use and actual use of substances. The 2010 IYS data included here provide an estimate of the change one might expect to see each year in Iowa’s general youth population due to maturation. Thus, IYS data serve as a general point of reference when examining PTM program outcomes (change from pre-test to post-test) rather than comparing program percentages to zero, or no change. (Note: Youth who participated in PTM programming may also have completed the IYS).
Prevention Through Mentoring FY11 Annual Evaluation Report 3
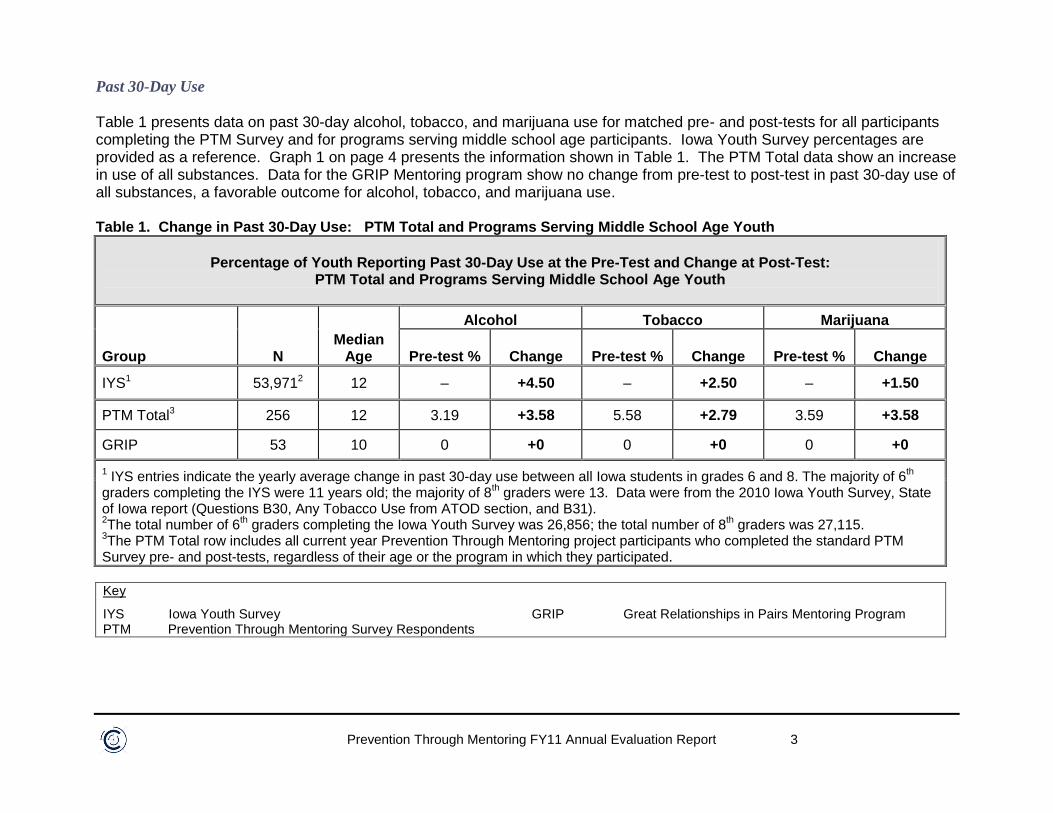
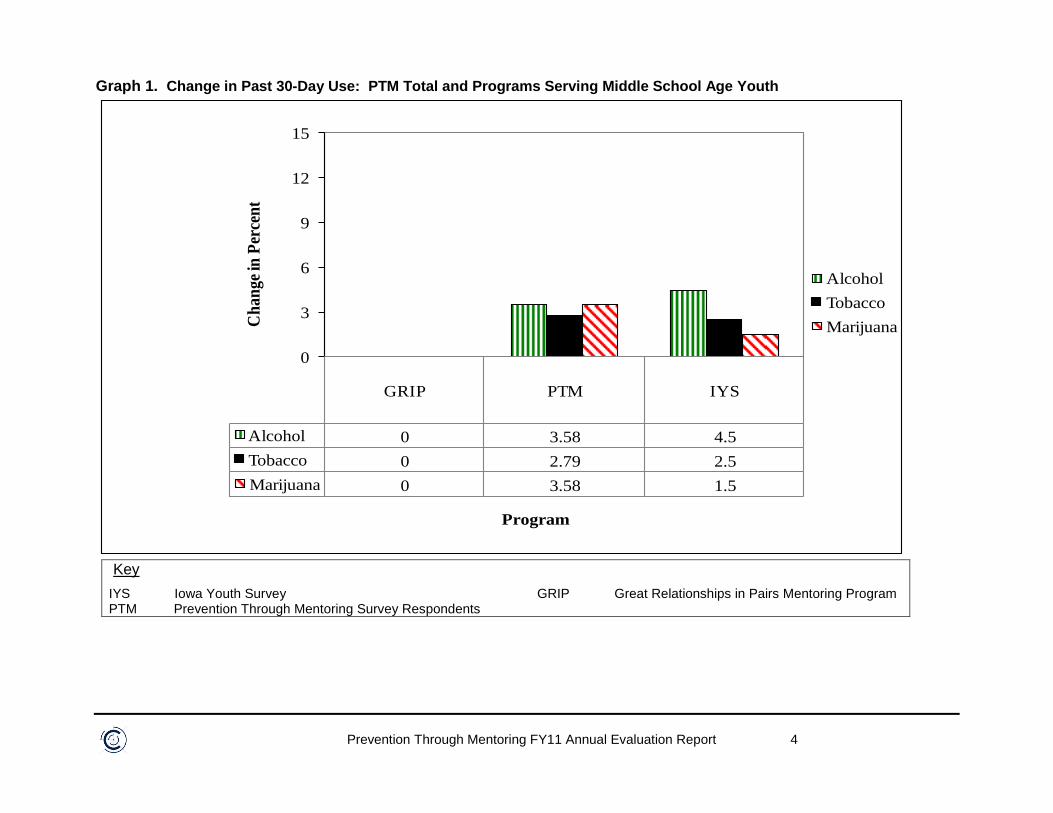
Past 30-Day Use Table 1 presents data on past 30-day alcohol, tobacco, and marijuana use for matched pre- and post-tests for all participants completing the PTM Survey and for programs serving middle school age participants. Iowa Youth Survey percentages are provided as a reference. Graph 1 on page 4 presents the information shown in Table 1. The PTM Total data show an increase in use of all substances. Data for the GRIP Mentoring program show no change from pre-test to post-test in past 30-day use of all substances, a favorable outcome for alcohol, tobacco, and marijuana use. Table 1. Change in Past 30-Day Use: PTM Total and Programs Serving Middle School Age Youth
Percentage of Youth Reporting Past 30-Day Use at the Pre-Test and Change at Post-Test:
PTM Total and Programs Serving Middle School Age Youth
Group N Median
Age
Alcohol Tobacco Marijuana
Pre-test % Change Pre-test % Change Pre-test % Change
IYS1 53,9712 12 – +4.50 – +2.50 – +1.50
PTM Total3 256 12 3.19 +3.58 5.58 +2.79 3.59 +3.58
GRIP 53 10 0 +0 0 +0 0 +0
1 IYS entries indicate the yearly average change in past 30-day use between all Iowa students in grades 6 and 8. The majority of 6
th
graders completing the IYS were 11 years old; the majority of 8th graders were 13. Data were from the 2010 Iowa Youth Survey, State
of Iowa report (Questions B30, Any Tobacco Use from ATOD section, and B31). 2The total number of 6
th graders completing the Iowa Youth Survey was 26,856; the total number of 8
th graders was 27,115.
3The PTM Total row includes all current year Prevention Through Mentoring project participants who completed the standard PTM
Survey pre- and post-tests, regardless of their age or the program in which they participated.
Key
IYS Iowa Youth Survey GRIP Great Relationships in Pairs Mentoring Program PTM Prevention Through Mentoring Survey Respondents
Prevention Through Mentoring FY11 Annual Evaluation Report 4
Graph 1. Change in Past 30-Day Use: PTM Total and Programs Serving Middle School Age Youth
GRIP PTM IYS
Alcohol 0 3.58 4.5
Tobacco 0 2.79 2.5
Marijuana 0 3.58 1.5
0
3
6
9
12
15
Ch
an
ge
in P
erce
nt
Program
Alcohol
Tobacco
Marijuana
Key
IYS Iowa Youth Survey GRIP Great Relationships in Pairs Mentoring Program PTM Prevention Through Mentoring Survey Respondents

Prevention Through Mentoring FY11 Annual Evaluation Report 5
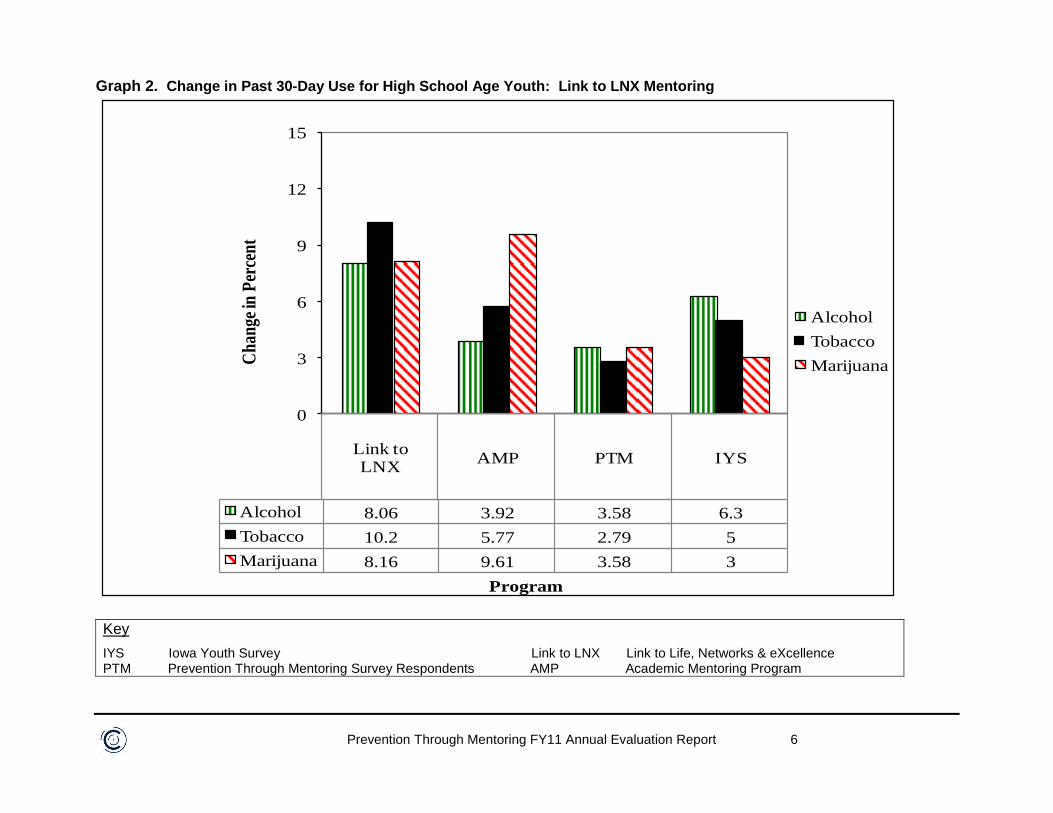
Table 2 presents data on past 30-day alcohol, tobacco, and marijuana use for programs serving high school age participants. Iowa Youth Survey and PTM survey percentages are provided as a reference. Graph 2 on page 6 graphically presents the information shown in Table 2. Data for the Link to LNX Mentoring program show increases in past 30-day use of all substances, and the increases are greater than in the IYS; the same holds true for the Academic Mentoring Program. It should be noted that the median age for Link to LNX participants is one year older than the median age of the IYS comparison group, and that the Link to LNX program targets at-risk and high-risk youth. In addition, caution should be used in interpreting this program’s data due to the relatively small sample size. The median age for the Academic Mentoring Program is two years older, and the small sample size limitation also holds true for this program. Table 2. Change in Past 30-Day Use: Programs Serving High School Age Youth
Percentage of Youth Reporting Past 30-Day Use at the Pre-Test and Change at Post-Test:
Programs Serving High School Age Youth
Group N Median
Age
Alcohol Tobacco Marijuana
Pre-test % Change Pre-test % Change Pre-test % Change
IYS1 50,7722 14 – +6.30 – +5.00 – +3.00
PTM Total3 256 12 3.19 +3.58 5.58 +2.79 3.59 +3.58
Link to LNX 51 15 4.08 +8.06 10.20 +10.20 +2.04 +8.16
AMP 60 16 7.84 +3.92 1.92 +5.77 9.62 +9.61
1IYS entries indicate the yearly average change in 30-day use between all Iowa students in grades 8 and 11. The majority of 8
th
graders completing the IYS were 13 years old; the majority of 11th graders were 16. Data were from the 2008 Iowa Youth Survey,
State of Iowa report (Questions B30, Any Tobacco Use from ATOD section, and B31). 2The total number of 8
th graders completing the Iowa Youth Survey was 27,115; the total number of 11
th graders was 23,657.
3The PTM Total row includes all current year Prevention Through Mentoring project participants who completed the standard PTM
survey pre- and post-tests, regardless of their age or the program in which they participated.
Key
IYS Iowa Youth Survey Link to LNX Link to Life, Networks & eXcellence PTM Prevention Through Mentoring Survey Respondents AMP Academic Mentoring Program
Prevention Through Mentoring FY11 Annual Evaluation Report 6
Graph 2. Change in Past 30-Day Use for High School Age Youth: Link to LNX Mentoring
Link to LNX
AMP PTM IYS
Alcohol 8.06 3.92 3.58 6.3
Tobacco 10.2 5.77 2.79 5
Marijuana 8.16 9.61 3.58 3
0
3
6
9
12
15
Ch
ange
in P
erce
nt
Program
Alcohol
Tobacco
Marijuana
Key
IYS Iowa Youth Survey Link to LNX Link to Life, Networks & eXcellence PTM Prevention Through Mentoring Survey Respondents AMP Academic Mentoring Program

Prevention Through Mentoring FY11 Annual Evaluation Report 7
Attitudes Toward Substance Use Graphs 3 through 6 show change in participants’ attitudes from pre- to post-test toward the use of alcohol, cigarettes, and marijuana. Individual attitudes either: 1) “improved,” which means that attitudes grew more unfavorable toward use of alcohol, tobacco, or marijuana (e.g., respondent felt alcohol use was wrong at pre-test and very wrong at post-test); 2) “maintained +,” which means that the pre- and post-test responses remained the same and were unfavorable toward alcohol, tobacco, or marijuana use (a positive outcome); 3) “maintained –,“ which means that the pre- and post-test responses remained the same and were favorable toward alcohol, tobacco, or marijuana use (a negative outcome); or 4) “worsened,” meaning that attitudes grew more favorable toward alcohol, tobacco, or marijuana use from pre-test to post-test (e.g., respondent felt marijuana use was very wrong at pre-test and a little bit wrong at post-test). Desired outcomes for these questions are improvement in (“improved”) or positive maintenance (“maintained +”) of attitudes toward substance use. Graph 3 shows attitude change from the pre-test to the post-test for PTM Survey respondents. Graphs 4, 5, and 6 show attitude change for GRIP Mentoring, Academic Mentoring Program, and Link to LNX participants, respectively. The number of matched pre- and post-tests containing a response to the question is shown in the key, in parentheses, following each substance. Graph 3. Change in Attitude Toward Alcohol, Cigarette, and Marijuana Use:
PTM Survey Respondents
0
10
20
30
40
50
60
70
80
90
100
Improved Maintained + Maintained - Worsened
Percen
tag
e o
f R
esp
on
den
ts
Attitude Change from Pre- to Post-Test
How wrong do you think it is for someone your age to use...
Alcohol (N = 249)
Cigarettes (N = 250)
Marijuana (N = 246)
PTM Survey respondents showed positive outcomes as follows: Alcohol – 76%; Cigarettes – 85%; and Marijuana – 79%.

Prevention Through Mentoring FY11 Annual Evaluation Report 8
Graph 4. Change in Attitude Toward Alcohol, Cigarette, and Marijuana Use: GRIP Mentoring Participants
0
10
20
30
40
50
60
70
80
90
100
Improved Maintained + Maintained - Worsened
Percen
tag
e o
f R
esp
on
den
ts
Attitude Change from Pre- to Post-Test
How wrong do you think it is for someone your age to use...
Alcohol (N = 51)
Cigarettes (N = 51)
Marijuana (N = 49)
GRIP Mentoring program participants showed positive outcomes as follows: Alcohol – 92%; Cigarettes – 96%; and Marijuana – 100%.
Prevention Through Mentoring FY11 Annual Evaluation Report 9
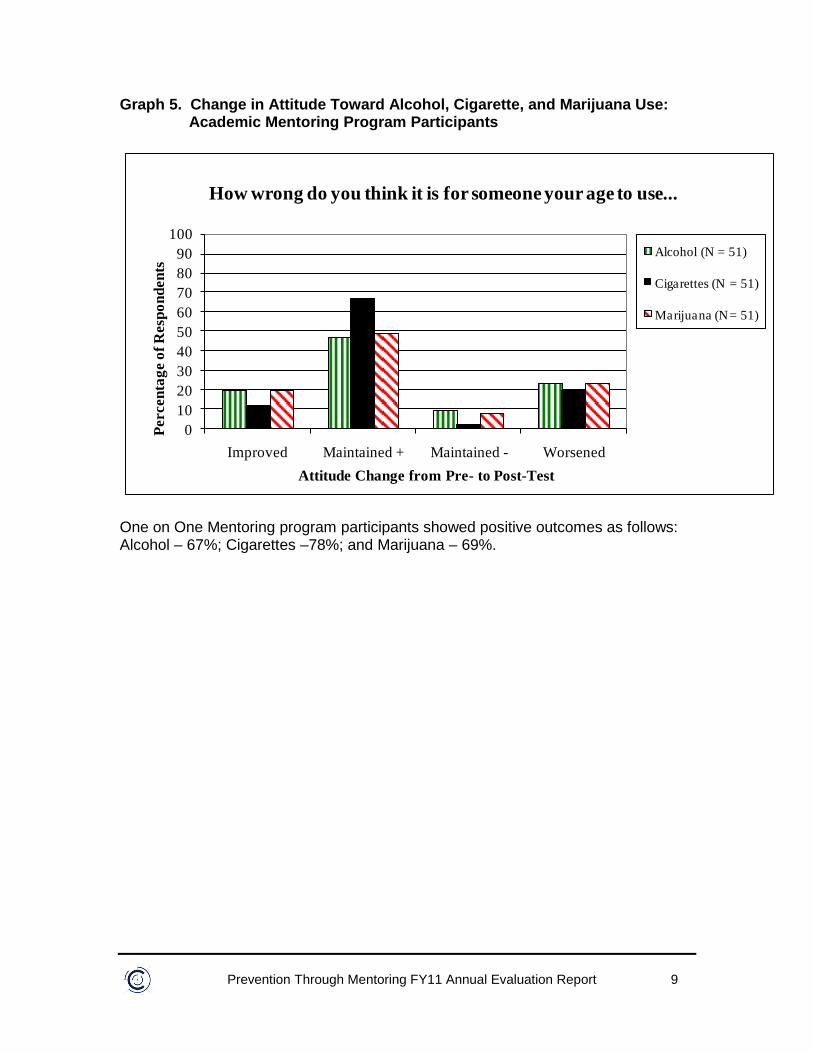
Graph 5. Change in Attitude Toward Alcohol, Cigarette, and Marijuana Use: Academic Mentoring Program Participants
0
10
20
30
40
50
60
70
80
90
100
Improved Maintained + Maintained - Worsened
Percen
tag
e o
f R
esp
on
den
ts
Attitude Change from Pre- to Post-Test
How wrong do you think it is for someone your age to use...
Alcohol (N = 51)
Cigarettes (N = 51)
Marijuana (N = 51)
One on One Mentoring program participants showed positive outcomes as follows: Alcohol – 67%; Cigarettes –78%; and Marijuana – 69%.

Prevention Through Mentoring FY11 Annual Evaluation Report 10
Graph 6. Change in Attitude Toward Alcohol, Cigarette, and Marijuana Use: Link to LNX Mentoring Participants
0
10
20
30
40
50
60
70
80
90
100
Improved Maintained + Maintained - Worsened
Percen
tag
e o
f R
esp
on
den
ts
Attitude Change from Pre- to Post-Test
How wrong do you think it is for someone your age to use...
Alcohol (N = 50)
Cigarettes (N = 50)
Marijuana (N = 49)
Link to LNX Mentoring program participants showed positive outcomes as follows: Alcohol – 48%; Cigarettes – 68%; and Marijuana – 63%.

Prevention Through Mentoring FY11 Annual Evaluation Report 11
Perceived Risk of Harm from Substance Use Graphs 7 through 10 show change in participants’ perception of risk of harm from using alcohol, cigarettes, and marijuana. Perceptions of risk either: 1) “increased,” which means that their reported perceived risk regarding alcohol, tobacco, or marijuana use increased from pre-test to post-test (e.g., Respondent felt alcohol use was a moderate risk at pre-test and a great risk at post-test); 2) “maintained +,” which means that the pre- and post-test responses remained the same and were unfavorable toward alcohol, tobacco, or marijuana use (a positive outcome); 3) “maintained -,” which means that the pre- and post-test responses remained the same and were favorable toward alcohol, tobacco, or marijuana use (a negative outcome); or 4) “decreased,” meaning that their reported perception of risk of harm decreased from pre-test to post-test (e.g., respondent reported that marijuana use posed a moderate risk of harm at pre-test and no risk at post-test). Desired outcomes for these questions are an increase in or positive maintenance (“maintained +”) of change in perceived risk. Graph 7 shows attitude change from the pre-test to the post-test for PTM Survey respondents. Graphs 8, 9, and 10 show change in perception of risk for GRIP Mentoring, Academic Mentoring Program, and Link to LNX participants, respectively. The number of matched pre- and post-tests containing a response to the question is shown in the key, in parentheses, following each substance. Graph 7. Change in Perceived Risk of Harm from Alcohol, Cigarette, and Marijuana Use: PTM Survey Respondents
0
10
20
30
40
50
60
70
80
90
100
Increased Maintained + Maintained - Decreased
Percen
tag
e o
f R
esp
on
den
ts
Change in Perception of Risk from Pre- to Post-Test
How much do you think people risk harming themselves if they use...
Alcohol (N = 251)
Cigarettes (N =249)
Marijuana (N = 248)
PTM Survey Respondents showed positive outcomes as follows: Alcohol – 78%; Cigarettes – 80%; and Marijuana – 79%.

Prevention Through Mentoring FY11 Annual Evaluation Report 12
Graph 8. Change in Perceived Risk of Harm from Alcohol, Cigarette, and Marijuana Use: GRIP Mentoring Participants
0
10
20
30
40
50
60
70
80
90
100
Increased Maintained + Maintained - Decreased
Percen
tag
e o
f R
esp
on
den
ts
Change in Perception of Risk from Pre- to Post-Test
How much do you think people risk harming themselves if they use...
Alcohol (N = 81)
Cigarettes (N = 80)
Marijuana (N = 81)
GRIP Mentoring participants showed positive outcomes as follows: Alcohol – 83%; Cigarettes – 84%; and Marijuana – 90%.

Prevention Through Mentoring FY11 Annual Evaluation Report 13
Graph 9. Change in Perceived Risk of Harm from Alcohol, Cigarette, and Marijuana Use: Academic Mentoring Program Participants
0
10
20
30
40
50
60
70
80
90
100
Increased Maintained + Maintained - Decreased
Percen
tag
e o
f R
esp
on
den
ts
Change in Perception of Risk from Pre- to Post-Test
How much do you think people risk harming themselves if they use...
Alcohol (N = 51)
Cigarettes (N =52)
Marijuana (N = 50)
One on One Mentoring participants showed positive outcomes as follows: Alcohol – 78%; Cigarettes – 81%; and Marijuana – 66%.

Prevention Through Mentoring FY11 Annual Evaluation Report 14
Graph 10. Change in Perceived Risk of Harm from Alcohol, Cigarette, and Marijuana Use: Link to LNX Mentoring Participants
0
10
20
30
40
50
60
70
80
90
100
Increased Maintained + Maintained - Decreased
Percen
tag
e o
f R
esp
on
den
ts
Change in Perception of Risk from Pre- to Post-Test
How much do you think people risk harming themselves if they use...
Alcohol (N = 53)
Cigarettes (N =53)
Marijuana (N = 53)
Link to LNX Mentoring participants showed positive outcomes as follows: Alcohol – 83%; Cigarettes – 89%; and Marijuana – 92%.

Prevention Through Mentoring FY11 Annual Evaluation Report 15
Graph 11 shows change in K-5 Survey respondents’ perception of the harmfulness of using substances. This item on the K-5 Survey differs in some ways from the perception of risk questions on the PTM Survey. The PTM Survey asks, “How much do you think people risk harming themselves…” for each substance separately, and gives the response options of, “no risk, “slight risk,” “moderate risk,” and “great risk.” The item on the K-5 Survey states, “It is _______ harmful for someone my age to use alcohol, tobacco, or illegal drugs,” and gives the fill-in-the-blank response options of, “always,” “most of the time,” “sometimes,” “hardly ever,” and “never.” Graph 11. Perception of Harmfulness of Using Alcohol, Tobacco, or Illegal Drugs: PTM K-5 Survey Respondents
K-5 Survey respondents showed a 96% positive response outcome.
Mentor-Mentee Match Data Agencies submitted tracking forms to the Consortium containing information about meetings between mentors and mentees. This information included: 1) the total number of meetings between each pair; 2) the average length of meetings between each pair; and 3) the average number of meetings per month for each pair. Seven agencies submitted data for the fiscal year. Four-hundred sixty-two mentor-mentee pairs are included in the match data analysis. One-hundred forty-seven pairs were not included due to incomplete reporting or because the matches had occurred less than three months before the end of the reporting period (agencies were not required to report match meeting data
0
10
20
30
40
50
60
70
80
90
100
Improved Maintained + Maintained - Decreased
Per
cen
tage
of
Res
pon
den
ts
Attitude Change from Pre- to Post-test
It is harmful for someone my age to use
alcohol, tobacco, or illegal drugs. (N=184)
Prevention Through Mentoring FY11 Annual Evaluation Report 16
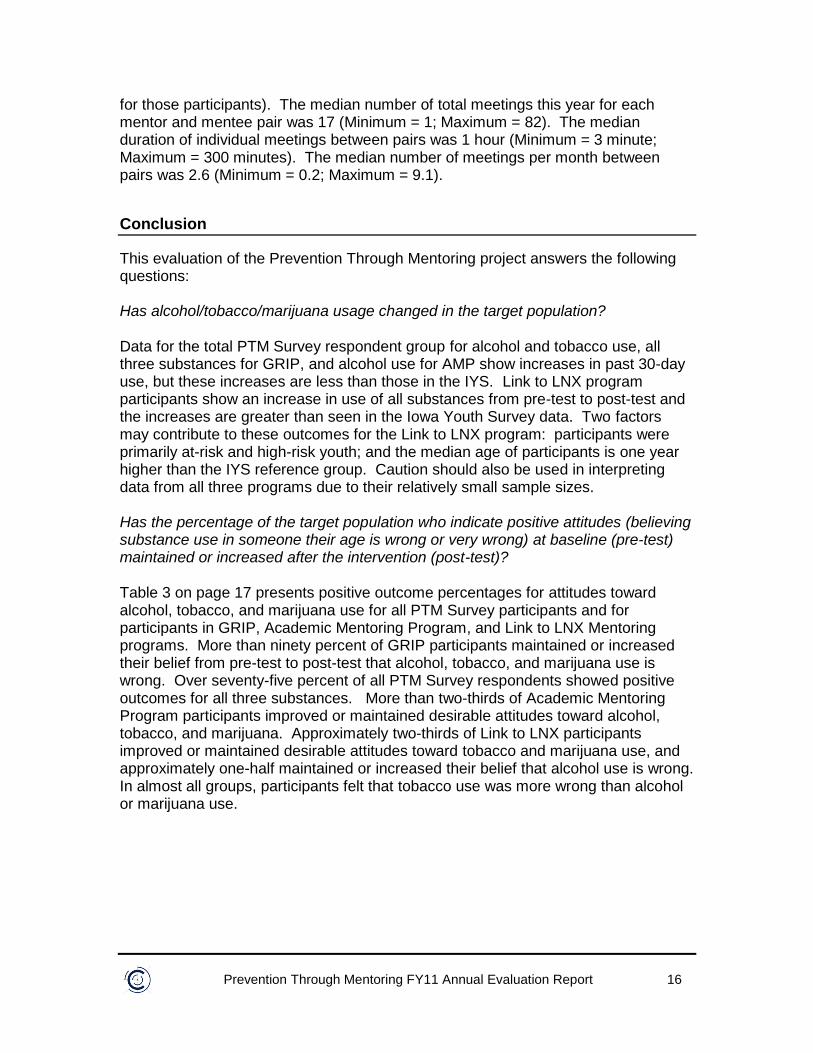
for those participants). The median number of total meetings this year for each mentor and mentee pair was 17 (Minimum = 1; Maximum = 82). The median duration of individual meetings between pairs was 1 hour (Minimum = 3 minute; Maximum = 300 minutes). The median number of meetings per month between pairs was 2.6 (Minimum = 0.2; Maximum = 9.1).
Conclusion
This evaluation of the Prevention Through Mentoring project answers the following questions: Has alcohol/tobacco/marijuana usage changed in the target population? Data for the total PTM Survey respondent group for alcohol and tobacco use, all three substances for GRIP, and alcohol use for AMP show increases in past 30-day use, but these increases are less than those in the IYS. Link to LNX program participants show an increase in use of all substances from pre-test to post-test and the increases are greater than seen in the Iowa Youth Survey data. Two factors may contribute to these outcomes for the Link to LNX program: participants were primarily at-risk and high-risk youth; and the median age of participants is one year higher than the IYS reference group. Caution should also be used in interpreting data from all three programs due to their relatively small sample sizes. Has the percentage of the target population who indicate positive attitudes (believing substance use in someone their age is wrong or very wrong) at baseline (pre-test) maintained or increased after the intervention (post-test)? Table 3 on page 17 presents positive outcome percentages for attitudes toward alcohol, tobacco, and marijuana use for all PTM Survey participants and for participants in GRIP, Academic Mentoring Program, and Link to LNX Mentoring programs. More than ninety percent of GRIP participants maintained or increased their belief from pre-test to post-test that alcohol, tobacco, and marijuana use is wrong. Over seventy-five percent of all PTM Survey respondents showed positive outcomes for all three substances. More than two-thirds of Academic Mentoring Program participants improved or maintained desirable attitudes toward alcohol, tobacco, and marijuana. Approximately two-thirds of Link to LNX participants improved or maintained desirable attitudes toward tobacco and marijuana use, and approximately one-half maintained or increased their belief that alcohol use is wrong. In almost all groups, participants felt that tobacco use was more wrong than alcohol or marijuana use.

Prevention Through Mentoring FY11 Annual Evaluation Report 17
Table 3. Positive Outcome Percentages for Attitudes Toward Substance Use by Participant Group
Positive Outcome Percentages for Attitudes Toward Substance Use
Participant Group Alcohol Tobacco Marijuana
PTM Survey Participants 76% 85% 79%
GRIP Mentoring Participants 92% 96% 100%
Academic Mentoring Program Participants
67% 78% 69%
Link to LNX Participants 48% 68% 63%
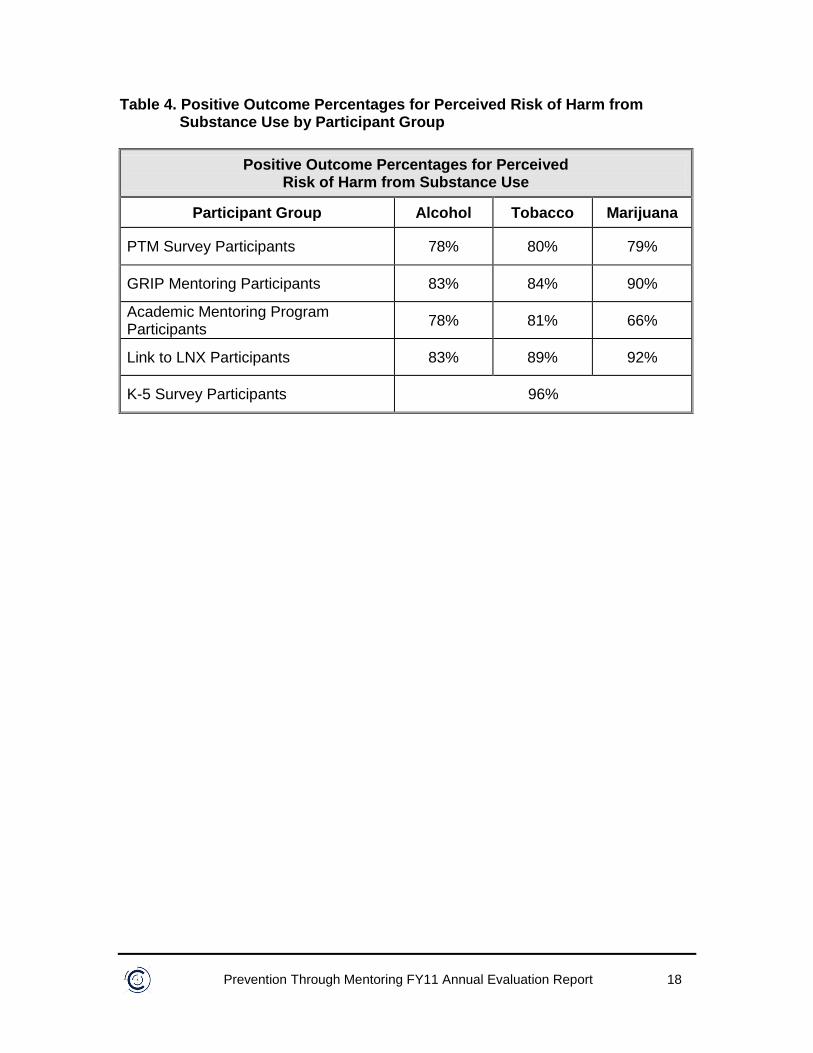
Has perceived risk of alcohol/tobacco/marijuana use maintained a positive response or increased from pre-test to post-test? Table 4 on page 18 presents positive outcome percentages for perceived risk of harm from alcohol, tobacco, and marijuana use for all PTM Survey respondents, GRIP Mentoring participants, Academic Mentoring Program participants, Link to LNX Mentoring participants, and K-5 Survey respondents. At least sixty-six percent of participants in all groups maintained or increased their perception of moderate to great risk of harm from using alcohol, tobacco, and drugs. In all groups except one (with the possible exception of the K-5 Survey respondents, as all substances are combined in one question on that instrument), participants felt that of the three substances, alcohol posed the least risk. Ninety-six percent of participants completing the K-5 Survey showed positive outcomes on perceived harm from using alcohol, tobacco, and illegal drugs. In the Link to LNX Mentoring group, the positive outcome percentages for perceived risk of harm are notably higher for all three substances than the positive outcome percentages for their attitudes toward use of those substances and reported past 30-day use. It may be that the program is increasing participants’ knowledge and perceptions of the risks of substance use, but that more time in the program may be needed to change attitudes and behaviors related to substance use for the at-risk and high-risk population served.
Prevention Through Mentoring FY11 Annual Evaluation Report 18
Table 4. Positive Outcome Percentages for Perceived Risk of Harm from Substance Use by Participant Group
Positive Outcome Percentages for Perceived Risk of Harm from Substance Use
Participant Group Alcohol Tobacco Marijuana
PTM Survey Participants 78% 80% 79%
GRIP Mentoring Participants 83% 84% 90%
Academic Mentoring Program Participants
78% 81% 66%
Link to LNX Participants 83% 89% 92%
K-5 Survey Participants 96%


![Manning, Judy [IDPH] · 2018-07-10 · Manning, Judy [IDPH] From: Sent: To: Subject: Diana Erickson Thursday, September 24, 2015 8:25 AM Manning,](https://static.fdocuments.us/doc/165x107/5f743685033739487e798622/manning-judy-idph-2018-07-10-manning-judy-idph-from-sent-to-subject.jpg)