ANNUAL REP ORT 2000 - Ontario Power Generation · POSITIONING FOR GROWTH AND SUCCESS During 2000,...
68
A N N U A L R E P O R T 2 0 0 0 OPG In Motion
Transcript of ANNUAL REP ORT 2000 - Ontario Power Generation · POSITIONING FOR GROWTH AND SUCCESS During 2000,...

A N N U A L R E P O R T 2 0 0 0
O P G I n M o t i o n
C O R P O R A T E P R O F I L E
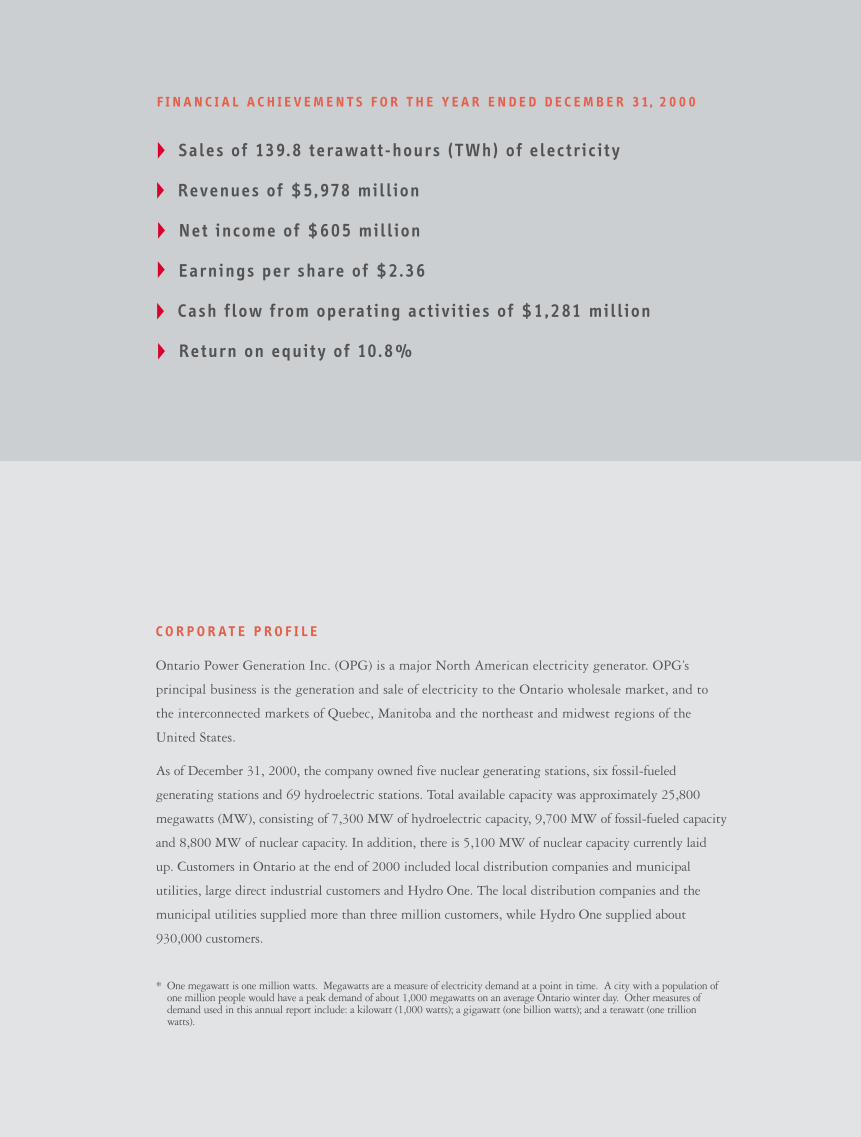
Ontario Power Generation Inc. (OPG) is a major North American electricity generator. OPG’s
principal business is the generation and sale of electricity to the Ontario wholesale market, and to
the interconnected markets of Quebec, Manitoba and the northeast and midwest regions of the
United States.
As of December 31, 2000, the company owned five nuclear generating stations, six fossil-fueled
generating stations and 69 hydroelectric stations. Total available capacity was approximately 25,800
megawatts (MW), consisting of 7,300 MW of hydroelectric capacity, 9,700 MW of fossil-fueled capacity
and 8,800 MW of nuclear capacity. In addition, there is 5,100 MW of nuclear capacity currently laid
up. Customers in Ontario at the end of 2000 included local distribution companies and municipal
utilities, large direct industrial customers and Hydro One. The local distribution companies and the
municipal utilities supplied more than three million customers, while Hydro One supplied about
930,000 customers.
* One megawatt is one million watts. Megawatts are a measure of electricity demand at a point in time. A city with a population ofone million people would have a peak demand of about 1,000 megawatts on an average Ontario winter day. Other measures ofdemand used in this annual report include: a kilowatt (1,000 watts); a gigawatt (one billion watts); and a terawatt (one trillionwatts).
F I N A N C I A L A C H I E V E M E N T S F O R T H E Y E A R E N D E D D E C E M B E R 3 1 , 2 0 0 0
S a l e s o f 13 9. 8 t e ra w a t t - h o u r s ( T W h ) o f e l e c t r i c i t y
R e v e n u e s o f $ 5 , 978 m i l l i o n
N e t i n c o m e o f $ 6 0 5 m i l l i o n
E a r n i n g s p e r s h a r e o f $ 2 . 3 6
C a s h f l o w f r o m o p e ra t i n g a c t i v i t i e s o f $ 1 , 2 81 m i l l i o n
R e t u r n o n e q u i t y o f 10 . 8 %

F I N A N C I A L H I G H L I G H T S
R E S U L T S O F O P E R A T I O N S F O R T H E P E R I O D E N D E D D E C E M B E R 3 1
($ millions unless otherwise stated) 2000
Electricity sold (TWh**) 139.8 136.9 102.0
Revenues 5,978 5,795 4,338
Operating income 1,198 1,010 749
Net income 605 446 326
Earnings before interest, taxes, depreciation and amortization (EBITDA) 2,008 1,816 1,353
Earnings per share (dollars per share) 2.36 1.74 1.27
Capital expenditures 585 485 450
As at December 31:
Total assets 16,791 15,610 15,610
Long-term debt 3,219 3,422 3,422
Shareholder's equity 5,817 5,417 5,417
* The 1999 pro forma financial information reflects the operations of the generation business of Ontario Hydro for the three months ended March 31, 1999 and OPG's actual operating results for the nine months ended December 31, 1999.
* 1 kilowatt-hour (KWh) is the energy expended by ten 100 watt lights burning for one hour. A megawatt-hour (MWh) is 1,000 KWh, a gigawatt-hour(GWh) is 1 million KWh, and a terawatt-hour (TWh) is 1 billion KWh.
APRIL 1-DEC. 311999
12 MONTHSPRO FORMA*
1999
*
On
ta
ri
o
Po
we
r
Ge
ne
ra
ti
on
12 MONTHS
P O S I T I O N I N G F O R G R O W T H A N D S U C C E S S
During 2000, Ontar io Power Generat ion:
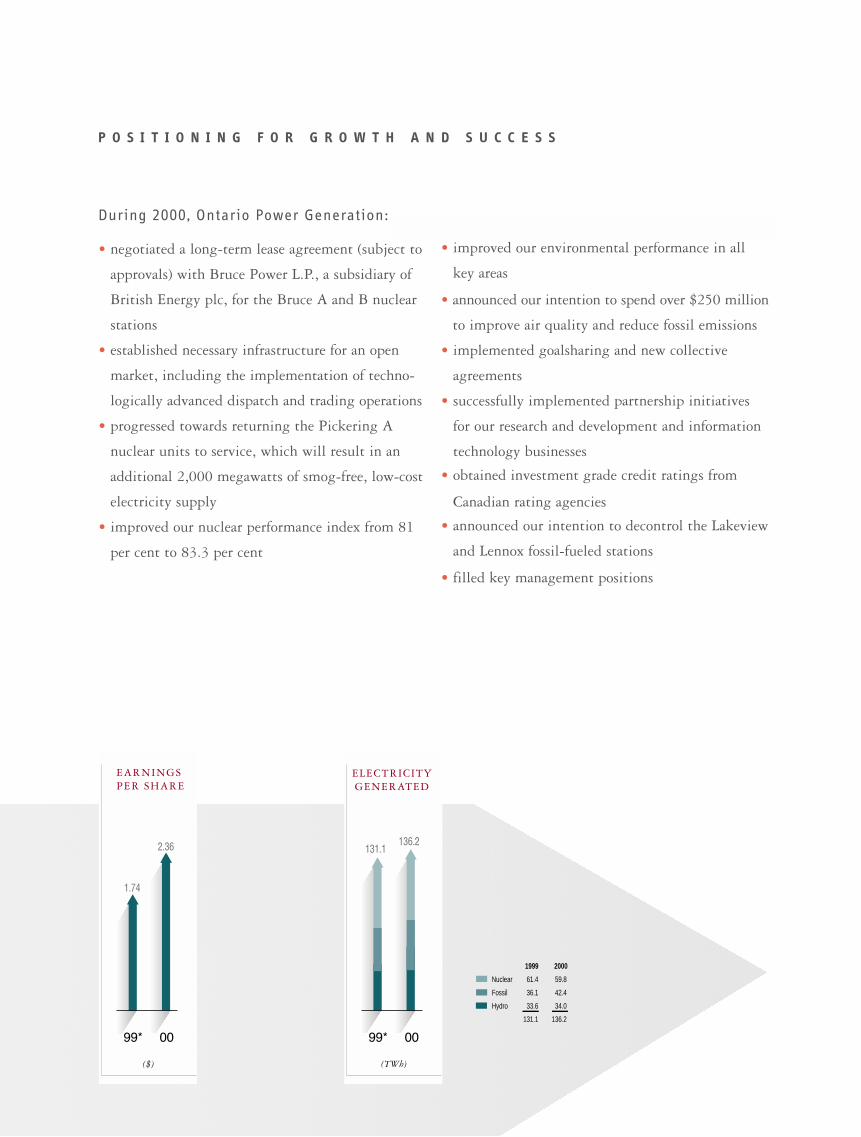
• negotiated a long-term lease agreement (subject to
approvals) with Bruce Power L.P., a subsidiary of
British Energy plc, for the Bruce A and B nuclear
stations
• established necessary infrastructure for an open
market, including the implementation of techno-
logically advanced dispatch and trading operations
• progressed towards returning the Pickering A
nuclear units to service, which will result in an
additional 2,000 megawatts of smog-free, low-cost
electricity supply
• improved our nuclear performance index from 81
per cent to 83.3 per cent
• improved our environmental performance in all
key areas
• announced our intention to spend over $250 million
to improve air quality and reduce fossil emissions
• implemented goalsharing and new collective
agreements
• successfully implemented partnership initiatives
for our research and development and information
technology businesses
• obtained investment grade credit ratings from
Canadian rating agencies
• announced our intention to decontrol the Lakeview
and Lennox fossil-fueled stations
• filled key management positions
Nuclear
Fossil
Hydro
1999
61.4
36.1
33.6
131.1
2000
59.8
42.4
34.0
136.2

O P G I N M O T I O N
At the end of 2000, OPG has significant momentum as it prepares for
competition in a deregulated Ontario electricity market. We are re-engineering
and realigning every aspect of our business – our workforce, business processes,
asset configuration and technology platforms. We remain firmly committed to
safe operations, environmental protection, and meeting the needs of our
customers and the communities in which we operate. We have clear
goals and the resolve to be successful in a new and exciting market.
OPG is “in motion.”
C o n t e n t s
A Message from the Chairman and the President 2
The Year in Review 5
Creating a High-Performance, People-Oriented Company 6
Positioning for Competitive Success 10
Optimizing Our Assets 14
Strengthening Our Commitment to Sustainable Development 18
Financial Section 21
Governance 59
Board of Directors 60
Corporate Officers and Senior Management 61
On
ta
ri
o
Po
we
r
Ge
ne
ra
ti
on
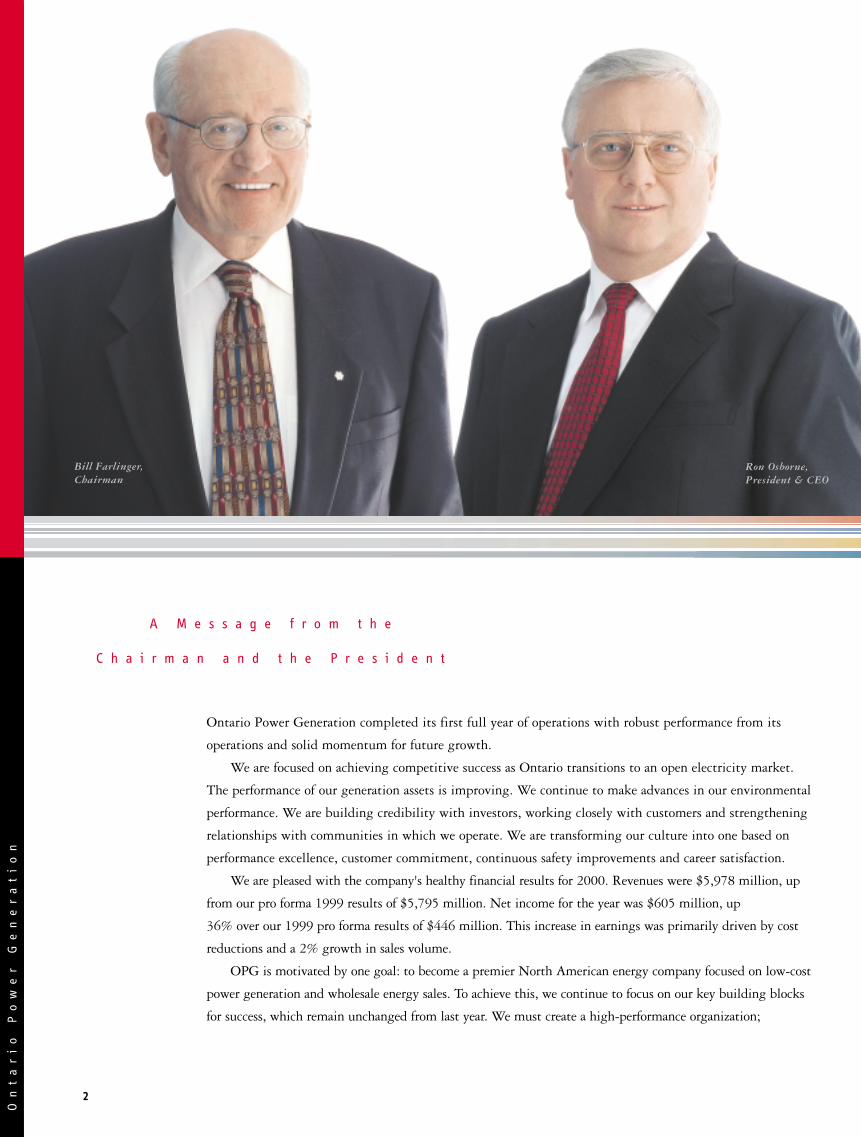
Ontario Power Generation completed its first full year of operations with robust performance from its
operations and solid momentum for future growth.
We are focused on achieving competitive success as Ontario transitions to an open electricity market.
The performance of our generation assets is improving. We continue to make advances in our environmental
performance. We are building credibility with investors, working closely with customers and strengthening
relationships with communities in which we operate. We are transforming our culture into one based on
performance excellence, customer commitment, continuous safety improvements and career satisfaction.
We are pleased with the company's healthy financial results for 2000. Revenues were $5,978 million, up
from our pro forma 1999 results of $5,795 million. Net income for the year was $605 million, up
36% over our 1999 pro forma results of $446 million. This increase in earnings was primarily driven by cost
reductions and a 2% growth in sales volume.
OPG is motivated by one goal: to become a premier North American energy company focused on low-cost
power generation and wholesale energy sales. To achieve this, we continue to focus on our key building blocks
for success, which remain unchanged from last year. We must create a high-performance organization;
A M e s s a g e f r o m t h e
C h a i r m a n a n d t h e P r e s i d e n t
Bill Farlinger,Chairman
Ron Osborne,President & CEO
2
3A n n u a l R e p o r t 2 0 0 0
structure our business for market readiness and competitive success; optimize our asset performance; and
become a sustainable energy company to deliver superior shareholder value. Throughout 2000, we achieved
improvements in each of these areas. Our financial results demonstrate that we are on the right track.
A H i g h - P e r f o r m a n c e , P e o p l e - C e n t r e d O r g a n i z a t i o n
OPG is building a high-performance, customer-focused company, driven by experienced employees who are
committed, team-oriented, and who are valued and rewarded for their contributions. We made significant
progress toward this goal through the expansion of our groundbreaking Partnership Agreement with the
unions; the roll out of our GoalSharing incentive program; introduction of recruitment, retention and leader-
ship programs; and new employee safety initiatives. Our progress is enhanced by a professionally diverse senior
management team that blends energy industry experience with perspectives brought from other sectors.
F o c u s o n C o m p e t i t i v e S u c c e s s
OPG’s success depends on our ability to manage our asset decontrol program, ensure access to capital and
emerge as an industry leader. Within 10 years of the market being opened, we are required to reduce control of
our generating capacity to 35% of capacity available in Ontario.
We will accelerate decontrol so that we can better focus our attention on our North American growth
strategy. Accelerated decontrol will also facilitate the development of competition in Ontario.
With these objectives in mind, in July 2000 we announced the long-term lease of our 6,200 megawatt
Bruce A and B nuclear stations to Bruce Power, a subsidiary of British Energy. Expected to close by mid-2001,
this agreement is one of the largest and most complex transactions of its kind in our industry.
We also announced our intention to decontrol two major fossil-fueled generating stations. At the provincial
government's request, this plan is on hold pending a review of their environmental regulations on fossil-fueled
generation. The decontrol process will resume once this review is complete.
OPG is building credibility within the investment community, spurred by the investment grade debt
ratings we received from Canadian rating agencies in 2000 and by the launch of a $600 million commercial
paper program.
To serve customers better in a new marketplace, we opened a technologically-advanced OPG Energy
Markets facility offering real-time dispatching and trading of electricity as well as the marketing of structured
and customized risk management products and solutions. While a decision has yet to be made on when the
market will open to competition, we must and will be ready.
We are also partnering with innovative companies to leverage our research and development and information
technology businesses. These partnerships will enable us to concentrate on our core competencies – the generation
and marketing of reliable power. They will also provide significant career opportunities for affected employees.
C o n t i n u o u s P e r f o r m a n c e I m p r o v e m e n t
While OPG’s generating fleet is one of the lowest-cost generators in our market region, we improved this
advantage throughout 2000 while continuing to operate in a safe, open and environmentally responsible manner.
OPG’s nuclear stations have made significant performance gains over the past three years. As a virtually smog-
free, low-cost power source, nuclear energy is a critical part of our portfolio, accounting for 44% of our production.
Its role will be strengthened by the planned return to service of our 2,000 megawatt Pickering A Generating
Station, with the four units scheduled to return to service in 2002 and 2003. In February 2001, the Canadian
4
Nuclear Safety Commission accepted the conclusions and recommendations of the environmental
assessment for this project.
Our fossil-fueled and hydroelectric generation assets demonstrated exceptional reliability in 2000.
When added to our nuclear generation, these stations give OPG one of the most flexible portfolios in our
market region. This diversified mix enables us to meet Ontario’s electricity demands as well as to make
additional sales to the U.S., contributing to our strong financial results.
A S u s t a i n a b l e E n e r g y C o m p a n y
OPG is committed to becoming a sustainable energy company. We intend to achieve sustainability
through our environmental performance, our community involvement and our ability to create sustained
shareholder value. In 2000, we made progress toward our goal by improving performance over 1999 in
each of our six key environmental areas – regulatory compliance, air emissions, spills, energy efficiency,
total radiation emissions, and waste management. All of our generating stations are now ISO 14001
certified for their environmental management systems. To improve air quality, we
made significant investments in clean-air technologies; participated in emissions-
reduction credit trading; announced an expansion of our green power portfolio; and
committed to planting 1.6 million native trees and shrubs over the next five years.
We were equally active in protecting land and waterways near our stations.
We also contributed to the quality of life in the communities in which we
operate through numerous corporate and employee-led initiatives, including our
annual Charity Campaign and our support of community initiatives.
G r o w t h S t r a t e g y
We have a focused growth plan to ensure competitive success and build shareholder value. In addition to
supplying our home market of Ontario, we plan to apply for a U.S. Federal Energy Regulatory
Commission licence to generate and market power in the U.S.
We have significant competitive strengths at our disposal:
• a portfolio of generation assets with low system-wide emissions that is diversified in terms of
technology, fuel type, market and dispatch flexibility;
• extensive operating and performance improvement experience; and
• accumulated knowledge of the electricity system, its costs and pricing patterns, both in Ontario
and in adjacent markets.
We will assess selective growth opportunities in U.S. markets. We will also explore opportunities
such as those in the gas sector and in emerging power technologies such as distributed generation.
Additionally, we will continue to build strategic partnerships which can maximize value for our
shareholder, allow us to focus on our core business and leverage our existing core competencies.
Our management team and employees know that our ability to execute our growth strategy
depends on our success today in continuing to improve our operating performance and meet customer
needs. With their ongoing commitment, we are confident that OPG will reach its goal of becoming a
leading North American energy company and in the process deliver higher levels of value, service and
benefits to our shareholder, customers and the communities in which we operate.
Bill Farlinger, Chairman
Ron Osborne, President & CEO
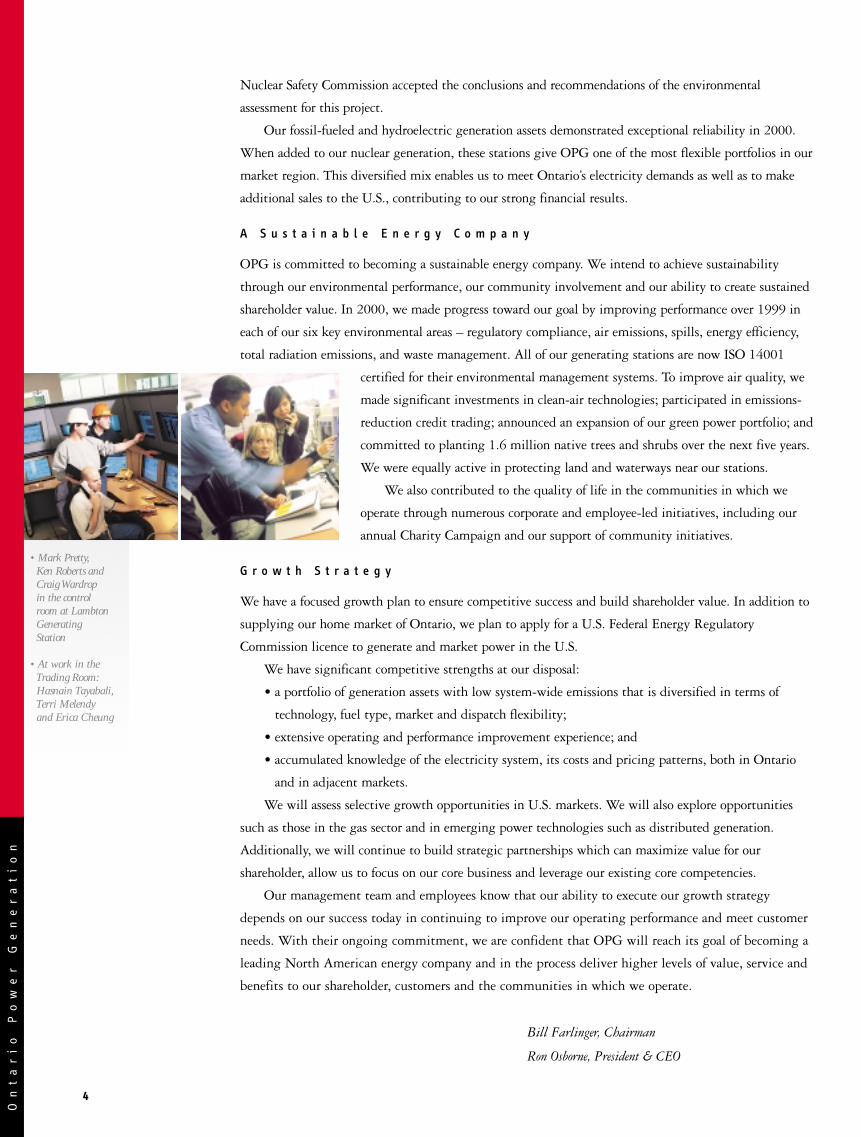
• Mark Pretty, Ken Roberts and Craig Wardropin the control room at Lambton Generating Station
• At work in the Trading Room: Hasnain Tayabali,Terri Melendy and Erica Cheung
On
ta
ri
o
Po
we
r
Ge
ne
ra
ti
on

T h e Y e a r i n R e v i e w
E m p l o y e e s G r e g P r u s s , D a v e S t a f f o r d a n d G a r y M u r p hy m a k e s u r e a s c h e d u l e d w o r k a r e a i s s a f e
a t t h e P i c k e r i n g B N u c l e a r G e n e r a t i n g S t a t i o n .
T h e Y e a r i n R e v i e w

C o m m u n i t y A m b a s s a d o r s : s o m e o f t h e h u n d r e d s o f e m p l o y e e v o l u n t e e r s * w h o v i s i t e d o v e r 16 , 0 0 0 h o u s e h o l d s a s p a r t o f
O P G ’s P i c k e r i n g N e i g h b o u r h o o d Wa l k p r o g r a m .
* The names of employees in this photo are listed on page 62.
On
ta
ri
o
Po
we
r
Ge
ne
ra
ti
on

7A n n u a l R e p o r t 2 0 0 0
High performance companies recognize the vital role people play in their success.
OPG is no exception. We are engaging all employees in our quest to fashion a new,
performance-driven corporate culture – where excellence, respect, teamwork, customer
service and safety are not just words, but values to be lived every day.
P a r t n e r i n g w i t h E m p l o y e e s
The cornerstone of our culture change is our partnership initiative with the unions – a pioneering and jointly-
designed framework to help meet the challenges of competing in an open market. Since about 90% of OPG’s
workforce is unionized, this is a critical initiative for us.
A partnership approach has benefits for management and the unions. Issues are resolved cooperatively,
grievances are reduced, and all employees are more aligned towards achieving corporate objectives.
During 2000, new collective agreements designed to speed marketplace success were reached in a cooper-
ative manner with the Power Workers’ Union and The Society of Energy Professionals, the two unions that
represent the majority of our employees. Tripartite teams consisting of representatives from management and
the two unions were also established to reinforce the partnership ethic across all levels of the organization.
A promising sign that the partnership spirit has taken root was the finalization of a corporate-wide
GoalSharing program, an incentive plan that we believe to be the most extensive in our industry. As a result
of this initiative, virtually all employees shared in OPG’s 2000 operating profits. This program will contribute
significantly to employee understanding of our business drivers while fostering innovation, flexibility and a
continuous raising of the performance bar.
C r e a t i n g a H i g h - P e r f o r m a n c e ,
P e o p l e - O r i e n t e d C o m p a n y
• Kathryn Shaver, senior advisor, Corporate Environment • Leroy Bell, mechanic, Sir Adam Beck Pump Generating Station

On
ta
ri
o
Po
we
r
Ge
ne
ra
ti
on
8
U n l o c k i n g E m p l o y e e E x c e l l e n c e
To reinforce and support our culture change efforts, OPG launched a new leadership development program
focused on supporting and enhancing the management and leadership skills of our senior managers. The
program is part of an extensive and integrated process aimed at identifying, developing and retaining high-
performing, committed employees across the organization.
Our other leadership and learning initiatives include: first line manager academies for our nuclear employees;
enhanced marketing and trading-skills programs for OPG Energy Markets staff; a new employee recognition
program for outstanding employee contributors; and financial and commercial orientation seminars for all
employees. We are also bringing new competencies into the company through a strong recruitment program.
These initiatives are complemented by an extensive program of employee round-table discussions, led by
senior management, to discuss business strategy and listen to employees. More than a thousand of our employees
took part in these meetings in 2000.
C o r p o r a t e O f f i c e r s a n d
S e n i o r M a n a g e m e n t
OPG’s senior management team combines talented executives drawn from
outside OPG with experienced company veterans to form one of the most
diversified and able management teams in the industry.
B i l l F a r l i n g e rChairman
R o n O s b o r n ePresident &
Chief Executive Officer
G e n e P r e s t o nExecutive Vice President &
Chief Nuclear Officer
P i e r r eC h a r l e b o i sSenior Vice President &
Chief Nuclear Engineer
G i s e l l e B r a n g e tVice President-
Treasurer
W a y n e B i n g h a mExecutive Vice President &
Chief Financial Officer

9A n n u a l R e p o r t 2 0 0 0
M a k i n g t h e W o r k p l a c e S a f e
To be a high-performance company, we must be a safety leader. During 2000, workplace safety performance at
OPG improved compared to our 1999 performance. Challenges remain, however, before we achieve the level of
excellence we seek in this all-important area. Our objective is to ensure employee safety and achieve a safety
record within the top quartile of our industry.
While there is still much to be done, we are on the path to realizing this goal – as evidenced by the many
generating stations and crews that set new records in 2000 for days and years worked without lost-time injuries.
For example, the “E” crew at our Pickering B station went 15 years without a lost-time accident. In addition,
three hydroelectric production centres – at Cameron Falls, Ear Falls and Thunder Bay – achieved five years
without a lost-time accident, and our coal-fueled Thunder Bay Generating Station went three years without
such an accident. We attribute these safety results to the shared responsibility our supervisors and employees
have placed on workplace safety and on building a safety culture which this supports. We will continue to
build on this performance improvement through implementation of safety management systems across OPG.
Recognizing that safety performance is but one measure of a healthy workplace, we also launched a major
wellness program focusing on broader health issues. We are determined to reach top industry levels in this
important performance measure.
D a v i dD r i n k w a t e rExecutive Vice President-
Law & Corporate
Development
R i c h a r d D i c e r n iExecutive Vice President &
Corporate Secretary
J i m B u r p e eSenior Vice President-
Pickering A Generating
Station
G r a h a m B r o w nChief Operating Officer
B r u c e B o l a n dSenior Vice President-
OPG Energy Markets
J o h n M u r p h yExecutive Vice President-
Human Resources
J o h n M a t h e rExecutive Vice President &
Chief Information Officer

O P G E n e r g y M a r k e t s e m p l o y e e s R o b C o u l b e c k , M a r t y K e l l y a n d B a r r y S i d o c k i n O P G ’s c o n t r o l r o o m .
On
ta
ri
o
Po
we
r
Ge
ne
ra
ti
on
1 1A n n u a l R e p o r t 2 0 0 0
P o s i t i o n i n g f o r
C o m p e t i t i v e S u c c e s s
Reconfiguring our assets, reducing costs, establishing financial credibility and
continuing to work closely with our customers – these are prerequisites for success
as OPG prepares for the opening of Ontario’s electricity market.
M a n a g i n g D e c o n t r o l
OPG is committed to expanding its position as a successful North American energy company. To do so, we are
decontrolling selected generating assets as required by our generating licence. The decontrol process will occur in
two phases. The first phase requires us to divest control of 4,000 megawatts of price-setting fossil-fueled
generation capacity, with the option of substituting up to 1,000 megawatts of hydroelectric generation, within
42 months of market opening. In the second phase, we must reduce our effective control of generation capacity
in Ontario to 35% or less within 10 years of market opening. OPG is committed to meeting its decontrol
obligations well in advance of these deadlines.
Accordingly, we announced in July our most noteworthy decontrol initiative to date – the lease of our
6,200 megawatt Bruce A and Bruce B nuclear stations for an initial period of 18 years to Bruce Power, a
subsidiary of British Energy, with lease options to extend up to an additional 25 years. The transaction will
provide a fair return for these assets to our shareholder, the Ontario government; free up valuable resources
for continued improvements at our Pickering and Darlington nuclear stations; and strengthen Canada’s
nuclear industry with the presence of an important new participant. Subject to regulatory approvals and the
usual closing conditions, we expect to complete this transaction by mid-2001.
Earlier, in February 2000, we announced our intention to decontrol two fossil-fueled stations, the
Lakeview and Lennox generating stations, representing a combined capacity of almost 3,300 megawatts.
While this initiative has been postponed as the provincial government completes its review of its
environmental regulations governing fossil-fueled generation, we expect to resume the decontrol of these
stations once the review has been finalized. The effect of the proposed decontrol of the Lakeview and Lennox
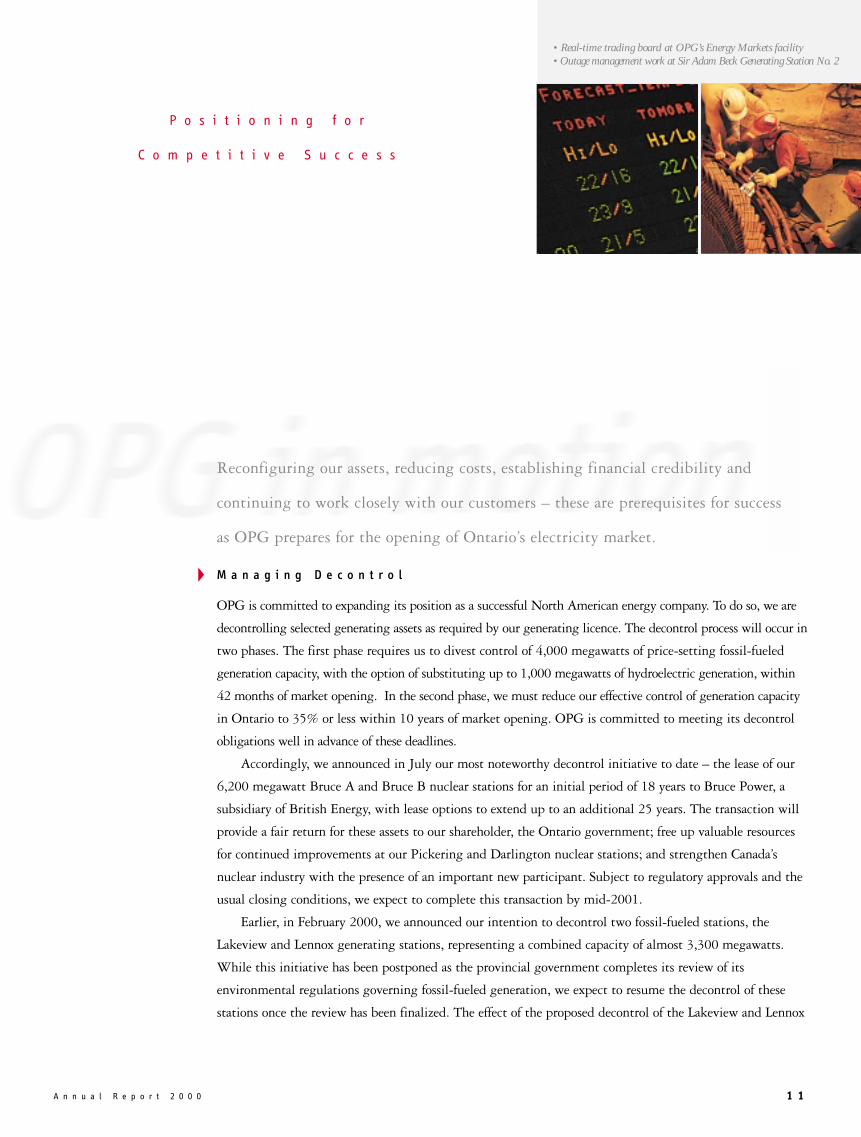
• Real-time trading board at OPG’s Energy Markets facility• Outage management work at Sir Adam Beck Generating Station No. 2

stations will result in meeting the greater part of the first phase of the decontrol requirement.
Overall, our decontrol initiatives will facilitate both competition and consumer choice in Ontario,
while enabling OPG to put increased emphasis on our North American growth strategy. We will emerge
from decontrol with a generating fleet every bit as competitive, reliable, safe and clean as our current fleet.
F o r m i n g S t r a t e g i c P a r t n e r s h i p s
Concurrent with decontrol, OPG embarked on a dynamic program of strategic partnerships throughout
the year.
In August 2000, OPG and C-SAT Technologies Inc. created Kinectrics Inc., forming a new,
independent science and engineering services company. OPG currently owns 90%
of Kinectrics, whose projects include building and testing the largest pre-commercial
solid oxide fuel cell power plant in the world.
In November 2000, we announced a 10-year, $1 billion information technology
agreement with New Horizon System Solutions Inc., a joint venture between OPG
(49%) and Cap Gemini Ernst & Young (51%). The new company plans to offer
information technology services to OPG and throughout the North American
electricity industry.
Both partnerships help OPG to reduce costs and stay focused on our core
activities of competitive power generation and marketing, while at the same time ensuring that our
research and development and our information technology service needs are effectively met.
A d d i n g V a l u e T h r o u g h O P G E n e r g y M a r k e t s
In preparing for open competition, OPG is also committing resources to areas such as portfolio management,
bidding strategies, integrated outage management, and specialized risk management products and energy
services through our OPG Energy Markets group.
During 2000, OPG Energy Markets installed and started testing the technologies and established
business processes required for OPG’s participation in the new market. We also expanded our expertise in
such key areas as product structuring, trading, market analysis and customer care. In September, we
officially opened our OPG Energy Markets facility, which includes one of Canada’s most advanced energy-
trading floors.
Consistent with our long-term strategy, OPG will be applying for a licence from the U.S. Federal
Energy Regulatory Commission, which will permit us to sell directly to U.S. customers once the Ontario
market is open.
S t a y i n g C l o s e t o C u s t o m e r s
To help customers address their power needs in a competitive market, we held meetings involving OPG
senior executives and more than 100 wholesale municipal and direct industrial customers. We also
continued to inform customers about the coming challenges and opportunities in the marketplace through
more than 30 special seminars as well as through information available on our customer Web site.
Customer input from these and other sources enabled us to develop new risk management products and
services that we began offering to customers during the year.
For the second consecutive year, our customer satisfaction index registered a significant gain, surpassing
our annual performance objective. Our goal is to achieve “best in class” customer satisfaction within the
next three years.
1 2
• Maria Grino, ITtechnician inNew HorizonSystem Solutions
• NanticokeGeneratingStation (view ofturbine hall), astation essentialfor meeting cus-tomer electricitydemands
On
ta
ri
o
Po
we
r
Ge
ne
ra
ti
on
1 3A n n u a l R e p o r t 2 0 0 0
S e t t i n g t h e P a c e i n S u p p l y M a n a g e m e n t a n d E - C o m m e r c e
In the area of procurement, we are committed to a total corporate-wide savings target of $100 million. As
part of this effort, our new Supply Chain program realized an estimated savings of $40 million during 2000.
To further manage costs, OPG became an investor and member of Pantellos Corporation, a consortium of
21 major North American utility and energy companies. Pantellos will operate an online business-to-business
marketplace for the electricity, natural gas and other energy sectors – a global portal for purchasing anything
from transformers and wire to turbines and equipment repairs.
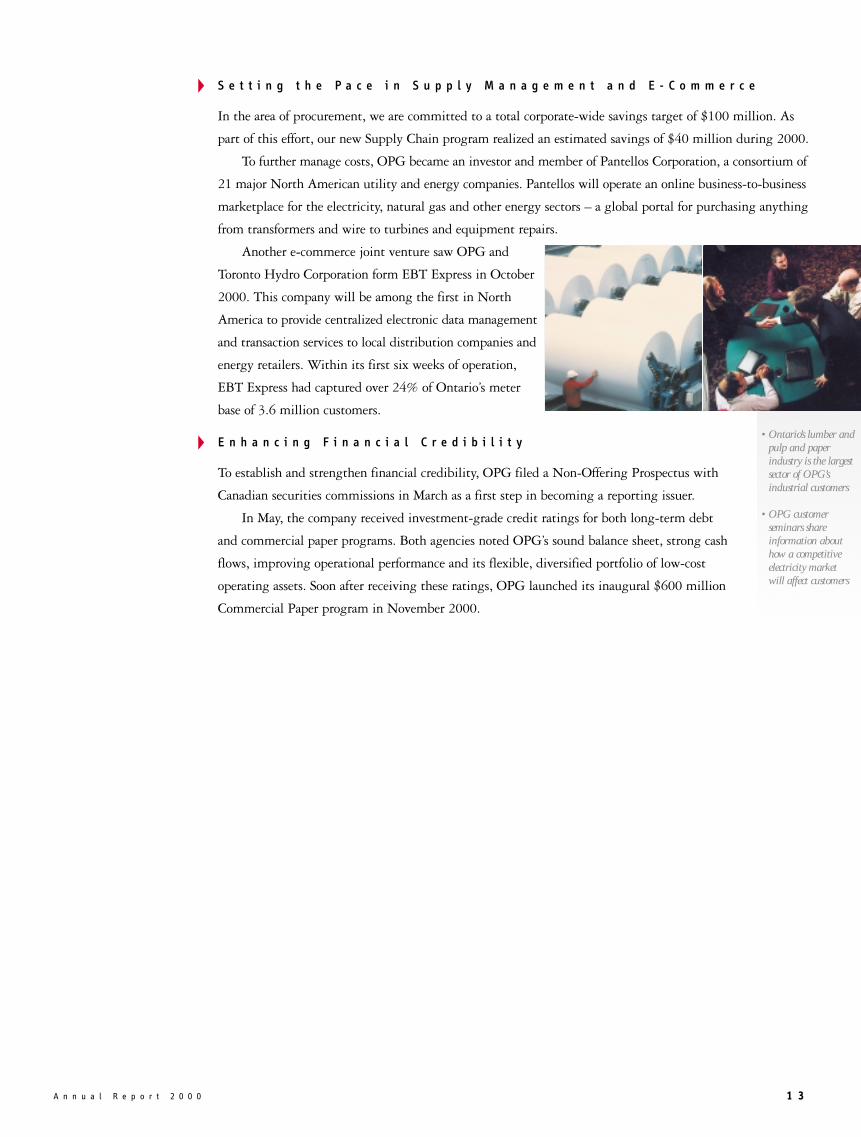
Another e-commerce joint venture saw OPG and
Toronto Hydro Corporation form EBT Express in October
2000. This company will be among the first in North
America to provide centralized electronic data management
and transaction services to local distribution companies and
energy retailers. Within its first six weeks of operation,
EBT Express had captured over 24% of Ontario’s meter
base of 3.6 million customers.
E n h a n c i n g F i n a n c i a l C r e d i b i l i t y
To establish and strengthen financial credibility, OPG filed a Non-Offering Prospectus with
Canadian securities commissions in March as a first step in becoming a reporting issuer.
In May, the company received investment-grade credit ratings for both long-term debt
and commercial paper programs. Both agencies noted OPG’s sound balance sheet, strong cash
flows, improving operational performance and its flexible, diversified portfolio of low-cost
operating assets. Soon after receiving these ratings, OPG launched its inaugural $600 million
Commercial Paper program in November 2000.
• Ontario’s lumber andpulp and paperindustry is the largestsector of OPG’sindustrial customers
• OPG customer seminars shareinformation abouthow a competitiveelectricity marketwill affect customers

E m p l o y e e s C r a i g Wa r d r o p , R hy s J e n k i n s , K e n R o b e r t s a n d W y a t t W i l l i a m s h o l d a p r e - j o b b r i e f i n g p r i o r t o s e r v i c i n g o n e o f t h e
g e n e r a t i n g u n i t s a t t h e L a m b t o n G e n e r a t i n g S t a t i o n .
On
ta
ri
o
Po
we
r
Ge
ne
ra
ti
on

1 5A n n u a l R e p o r t 2 0 0 0
O p t i m i z i n g O u r A s s e t s
OPG generates electricity from a diversified and competitive portfolio of nuclear, hydro-
electric and fossil-fueled stations. Over the past five years, our nuclear and hydroelectric
stations have averaged more than 75% of our annual generation, in addition to having
very competitive operating costs and producing virtually no emissions contributing to
acid rain, smog or global warming. All of our fossil-fueled and major hydroelectric stations
have achieved certification under the ISO 9002 quality management system standard.
Our nuclear stations conform to a quality standard established by the Canadian
Standards Association.
I m p r o v e d N u c l e a r P e r f o r m a n c e
Nuclear power contributed 59.8 terawatt-hours of electricity production in 2000, compared to 61.4
terawatt-hours generated in 1999. The reason for this decline was an extensive scheduled outage program,
including a once-a-decade Vacuum Building outage at our Pickering Generating Stations. Our outage
program should result in higher capacity levels going forward.
Through our Nuclear Performance Improvement program, OPG has made significant strides over the past
three years to narrow the performance gap with industry-leading U.S. nuclear units. At the end of 1997,
OPG’s Nuclear Performance Index, which is based on indicators adopted by the World Association of Nuclear
Operators (WANO), stood at 58%, compared with an industry average of 82%. Our Index score is now more
than 83% compared to average performance scores of just over 90% in the U.S. While much remains to be
accomplished, OPG has achieved clear performance improvements since we began the Nuclear Performance
Improvement program.
Eight of the 11 WANO indicators relate primarily to employee and public safety performance. It is a
• Turbine runner awaiting installation at water-powered R.H. Saunders Generating Station
• Turbine hall at the Darlington Nuclear Generating Station

1 6
credit to our entire nuclear workforce that every one of these eight safety indicators has either shown a
major improvement, reaching top performance levels over the past two years, or has remained stable where
we had already attained top industry performance.
In November 2000, the Canadian Nuclear Safety Commission (CNSC) renewed
the Darlington Generating Station’s operating licence for 27 months.
During the year, OPG completed two major maintenance outages at Darlington
Generating Station significantly ahead of schedule, as well as the Vacuum Building
outage at our Pickering site. In addition to higher production levels, well-executed
nuclear outages also result in lower overall system generation costs and lower
system-wide air emissions.
Progress was also made this year in our plans to return Pickering A to service.
The CNSC held public hearings to review our environmental assessment in support of our plan. Following
the hearings, the CNSC in February 2001 accepted the conclusions and recommendations of the environ-
mental assessment. Assuming we attain all remaining regulatory approvals, we will restart the first of the
station’s four units in early 2002 and should have all four units back in operation by the end of 2003.
The restart of the four-unit Pickering A Nuclear Generating Station provides economic and environmental benefits.
The station’s capacity of more than 2,000 megawatts is the lowest-cost incremental source of electricity generation
available to Ontario, with enough capacity to meet the electricity needs of a city with a population of two million.
Moreover, it has the potential to displace up to 80,000 tonnes of acid gases and 13 million tonnes of greenhouse gas
annually. This is equivalent to the greenhouse gas emissions of about three million cars.
H y d r o e l e c t r i c G e n e r a t i o n
Our lowest-cost power source, hydroelectric generation, produced 34.0 terawatt-hours this year. Despite
low Great Lakes water levels, we made the most of this resource by optimizing water storage and better-
ing availability and reliability targets for all of our hydroelectric stations. Forced outage rates were the
lowest in 20 years, further testimony to the outstanding reliability achieved by these facilities.
OPG continues to invest in its hydroelectric plants to increase their output and extend their service
lives. Major upgrading initiatives have already increased hydroelectric capacity by 175 megawatts since
1995 and will add another 140 megawatts by 2005. In November, a rehabilitation program at the Sir
Adam Beck No. 2 station reached the halfway mark – with eight of 16 units now completed. Both
capacity and energy output from the refurbished units have exceeded targets, and project costs remain
well below budget.
Concurrent with these upgrading efforts, as part of our Dam Safety Program, we completed the first
round of a thorough safety assessment on each of our 258 dams. Updated emergency plans were also put in
place for all of our large dams to ensure effective response in the unlikely event of a dam emergency.
F o s s i l - F u e l e d G e n e r a t i o n
The strength of our fossil-fueled stations is their flexibility to supply both baseload and peaking electricity.
This is critical for commercial success in an open marketplace where demand fluctuates and generators
must respond quickly to capture market opportunities. During the Pickering Nuclear Generating
Station Vacuum Building outage, our fossil-fueled stations were vital in helping us maintain supply
On
ta
ri
o
Po
we
r
Ge
ne
ra
ti
on
• Ralph Fedyk andPeter Johnson atthe PickeringNuclearGeneratingStation simulator
• Sir Adam BeckGeneratingStations atNiagara Falls,Ontario

1 7A n n u a l R e p o r t 2 0 0 0
reliability. Fossil-fueled generation also proved essential to maintaining reliability in Ontario during seasonal
peak periods such as the summer of 2000, when demand in August reached over 23,000 megawatts – a new
record for that month. OPG not only met this demand, but we were also able to export surplus power into
interconnected markets in the U.S., which were also experiencing high electricity demands.
OPG generated a record of 42.4 terawatt-hours of electricity from our fossil-fueled stations in 2000,
compared to 36.1 terawatt-hours in 1999. This is significantly more fossil-fueled energy than we produced
during our previous high-production period in the early 1980s.
Through our continued focus on reducing emissions, we were able to generate this record amount of
fossil-fueled power with almost 60% lower emissions of sulphur dioxide and nitrogen oxide compared to
emission levels in the early 1980s. Measures taken to achieve emission reductions include: installation of sul-
phur dioxide scrubbers at Lambton Generating Station; paying a premium for low sulphur fuel; and the con-
version of the Lennox Generating Station to burn nat-
ural gas as well as oil. In 2000, as part of our emission
reduction efforts, we completed the installation of low-
nitrogen oxide burners on the last of our eight
Nanticoke Generating Station units and on two
Lakeview Generating Station units, reducing the nitro-
gen oxide emissions from these units by an average of
30%.
OPG is committed to maintaining its fossil-fueled
stations at exceptional levels of reliability. In June, we completed a two-year $160 million
restoration program at Nanticoke Generating Station. The project greatly improved plant relia-
bility and environmental performance.
OPG fossil-fueled stations combine with our hydroelectric and nuclear stations to create a
portfolio of generating assets that is flexible, reliable, competitive and clean.
• Des JoachimsGenerating Station
• Lee Cowper andBrian Town performing rehabilitation at the NanticokeGenerating Station

D a v e Ro g a l s k i o f t h e To r o n t o a n d Re g i o n Co n s e r v a t i o n A u t h o r i t y p l a n t s t r e e s w i t h h el p f r o m O P G e m p l o y e e s
S tev e H o u n s el l a n d A n d a K a lv i n s .
On
ta
ri
o
Po
we
r
Ge
ne
ra
ti
on
1 9A n n u a l R e p o r t 2 0 0 0
Sustainable development is a long-term goal for OPG. We support the World Business
Council on Sustainable Development’s definition of sustainable development as the balancing
of environmental leadership, social responsibility and financial growth. We believe that
real benefits will accrue from our commitment. The benefits include: reducing environmental
impacts; meeting our voluntary environmental commitments; managing our environmental
risks and liabilities; becoming a supplier and employer of choice; and securing the trust
of communities, the confidence of investors and the respect of legislators. These benefits
are key components of our brand and create shareholder value.
OPG’s drive towards sustainability is played out on three fronts:
• improving the environmental performance of our operations;
• partnering with our stakeholders and increasing our value to site communities; and
• delivering maximum shareholder value.
I m p r o v i n g E n v i r o n m e n t a l P e r f o r m a n c e
OPG is committed to environmental improvement. As part of that commitment, all OPG generating
stations and plant groups have achieved and continue to maintain ISO 14001 certification, the international
standard for environmental management systems.
Our commitment is both constant and significant. In September, President and CEO Ron Osborne
announced a quarter billion dollar investment in Selective Catalytic Reduction technology to further reduce
nitrogen oxide emissions at the Lambton and Nanticoke stations. OPG will also equip the remaining two
unmodified units at both Lakeview and Lambton stations with low-nitrogen oxide burners. Together, these
initiatives will reduce nitrogen oxide emissions by a further 40%, or 18,000 tonnes, by 2004.
We also met a long-standing commitment to stabilize our net carbon dioxide emissions at their 1990
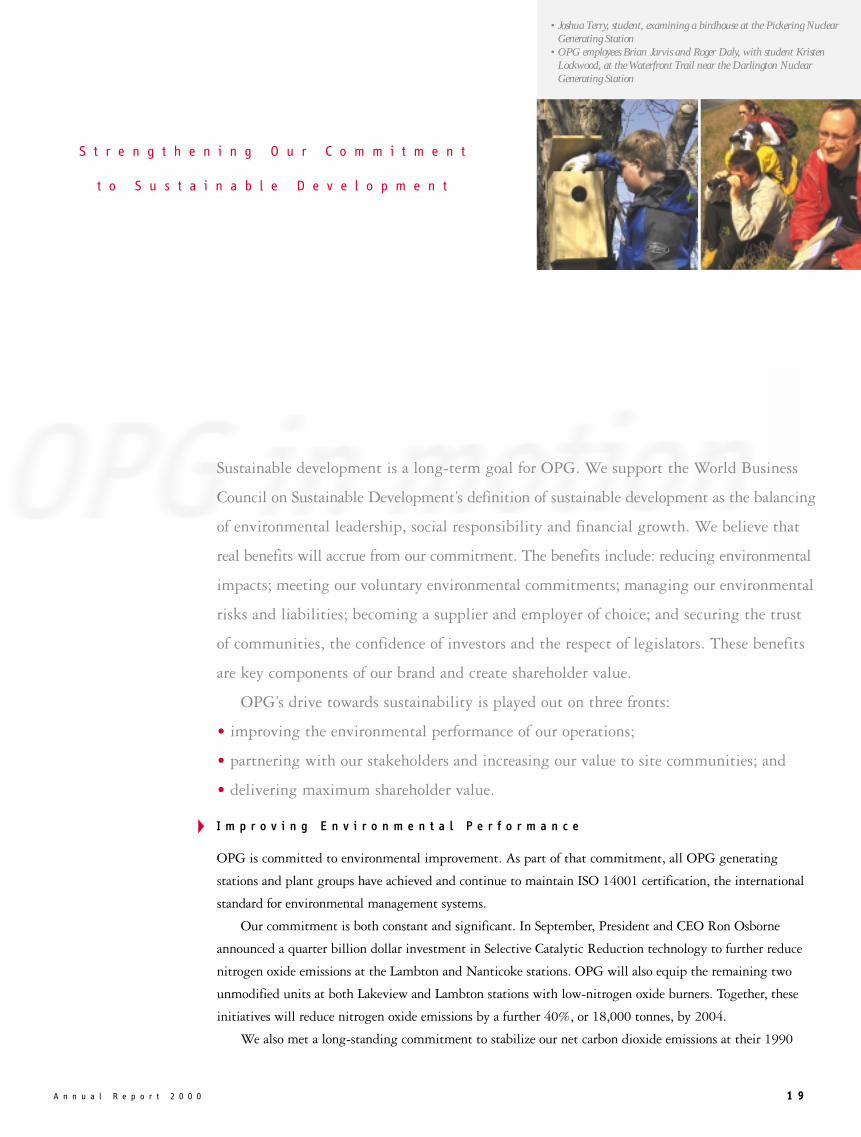
S t r e n g t h e n i n g O u r C o m m i t m e n t
t o S u s t a i n a b l e D e v e l o p m e n t
• Joshua Terry, student, examining a birdhouse at the Pickering NuclearGenerating Station
• OPG employees Brian Jarvis and Roger Daly, with student KristenLockwood, at the Waterfront Trail near the Darlington NuclearGenerating Station
2 0
levels by the end of 2000 through initiatives such as in-house energy efficiency
improvements and improvements in nuclear performance. OPG also continued its
industry-leading role by purchasing more than 13 million tonnes of carbon dioxide
credits, offsetting our emissions with verifiable reductions by others.
Going forward, we will continue to reduce greenhouse gas and other emissions
by returning to service the Pickering A Nuclear Generating Station, quadrupling
our green energy portfolio to 500 megawatts of production capability by 2005, and
by continuing to meet aggressive energy efficiency targets at our stations.
As part of our biodiversity initiatives and also to further offset carbon dioxide
emissions, OPG has pledged to plant 1.6 million native trees and shrubs in southern Ontario over the
next five years. Approximately 240,000 trees were planted in 2000.
OPG also contributed $428.6 million in 2000 to a segregated fund to provide for long-term nuclear
waste management and station decommissioning. Since our inception in April 1999, we have made
contributions of over $830 million to this fund.
OPG was the lead corporate sponsor of Radiance, the Queen’s University-developed solar car that set a new world
distance record of 6,800 kilometres in July. The futuristic-looking one-person vehicle traveled across Canada at about
75 kilometres per hour using just 1,000 watts, the amount of power used to run a toaster.
W o r k i n g w i t h S t a k e h o l d e r s a n d C o m m u n i t i e s
Our commitment includes listening and responding to community concerns, engaging communities and
other stakeholders in constructive dialogue, and enhancing the quality of life in the areas where we operate.
Our nuclear stations have information centres open to the public, and our larger stations regularly
hold open houses. In September, for example, an open house at our Darlington station drew 1,700 visitors.
We also regularly communicate with local residents and elected officials to keep them informed about
our stations’ operations. During our innovative Pickering Neighbourhood Walk, OPG employees visited
more than 16,000 households in the Pickering and Ajax areas.
OPG’s community outreach is sometimes spontaneous – with employees themselves taking charge.
Bruce employees raised over $13,000 in 90 minutes to help residents in Walkerton, Ontario, after a tragic
outbreak of E. coli.
We contributed to the quality of life in Ontario communities by supporting over 400 environmental,
educational and community organizations during 2000. This is in addition to the more than $2.1 million
raised by employees for Ontario communities and charities through our annual Charity Trust Campaign.
C r e a t i n g V a l u e f o r O n t a r i o
Another aspect of our sustainable development commitment is to deliver maximum value to our shareholder,
the province and people of Ontario. In 2000, this included strategic investments in areas such as energy
efficiency and recycling and recovery initiatives. These activities alone delivered over $14 million to OPG’s
bottom line.
OPG’s contribution to Ontario also included:
• about $1 billion in annual purchases of goods and services;
• about $1 billion in annual employee salaries; and
• more than $1.2 billion in taxes, dividends and other payments to the province in 2000.
On
ta
ri
o
Po
we
r
Ge
ne
ra
ti
on
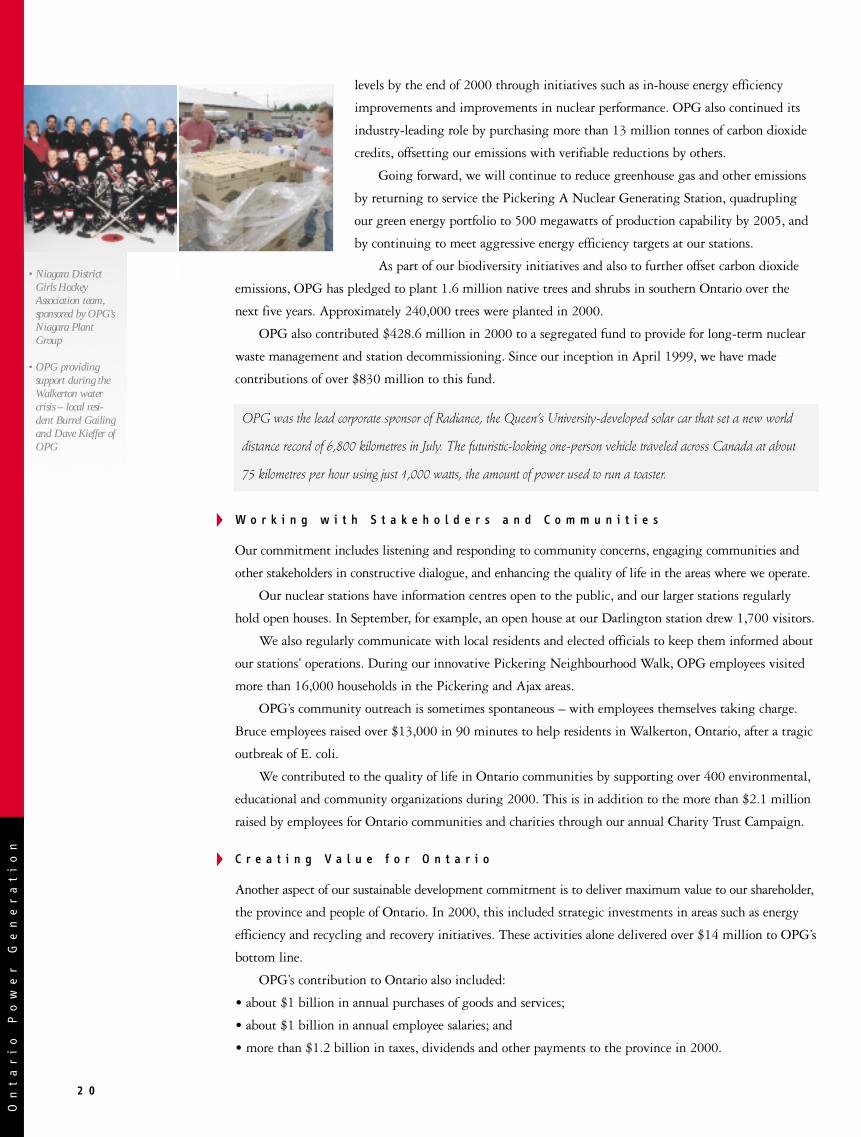
• Niagara DistrictGirls HockeyAssociation team,sponsored by OPG’sNiagara PlantGroup
• OPG providing support during theWalkerton watercrisis – local resi-dent Burrel Gailingand Dave Kieffer ofOPG
2 1
A n n u a l R e p o r t 2 0 0 0
Management’s Discussion and Analysis of Financial Condition and Results of Operations 22
Management’s Responsibility for Financial Reporting 33
Auditors’ Report 34
Consolidated Financial Statements 35
F I N A N C I A L S E C T I O N
On
ta
ri
o
Po
we
r
Ge
ne
ra
ti
on
2 2
O n t a r i o P o w e r G e n e r a t i o n I n c .
M a n a g e m e n t ' s D i s c u s s i o n a n d A n a l y s i s o f
F i n a n c i a l C o n d i t i o n a n d R e s u l t s o f O p e r a t i o n s
The following discussion and analysis of the financial condi-
tion and results of operations of Ontario Power Generation
Inc. ("OPG") should be read in conjunction with the
Consolidated Financial Statements and accompanying notes.
OPG’s financial statements are prepared in accordance with
Canadian generally accepted accounting principles and are
presented in Canadian dollars.
T h e C o r p o r a t i o n
OPG is one of the largest electricity generators in North
America with 69 hydroelectric, six fossil and five nuclear gen-
erating stations forming a complementary mix of generating
assets. At December 31, 2000, total generating capacity of
these stations was approximately 30,900 megawatts ("MW"),
consisting of 7,300 MW of hydroelectric generation capacity,
9,700 MW of fossil-fueled generation capacity and 13,900
MW of nuclear generation capacity, of which 5,100 MW is
currently laid up.
OPG's principal business is the generation and sale of elec-
tricity in the Ontario wholesale market and in the intercon-
nected markets of Quebec, Manitoba and the United States
("U.S.") northeast and midwest. In 2000, OPG supplied
approximately 89% of the electricity consumed in Ontario
through its own generation and purchases from the intercon-
nected markets.
I n c o r p o r a t i o n , C o m m e n c e m e n t o f
O p e r a t i o n s a n d A c q u i s i t i o n o f
B u s i n e s s
OPG was incorporated on December 1, 1998 pursuant to the
Business Corporations Act 1998 (Ontario). As part of the reor-
ganization of Ontario Hydro and the related restructuring of
the electricity industry in Ontario, OPG and its subsidiaries
purchased and assumed certain assets, liabilities, employees,
rights and obligations of the electricity generation business of
Ontario Hydro (the "Acquired Business") on April 1, 1999
and commenced operations on that date.
In consideration of the transfer of assets, liabilities, employ-
ees, rights and obligations of the electricity generation busi-
ness of Ontario Hydro, OPG issued to Ontario Electricity
Financial Corporation ("OEFC") notes payable in the aggre-
gate principal amount of $8,526 million, including a note in
the principal amount of $5,126 million (the "Equity Note")
and assumed a capital lease obligation of Ontario Hydro in the
amount of $30 million on April 1, 1999. The Province of
Ontario (the "Province") has assumed all of OPG's obligations
under the Equity Note and OEFC has released OPG from its
obligations thereunder. In connection therewith, OPG issued
to the Province 256,300,000 common shares as fully paid and
non-assessable shares. OEFC has agreed that without the con-
sent of OPG, it will not sell its remaining $3,400 million of
notes, of which $2,650 million are senior notes and $750 mil-
lion are subordinated notes of OPG.
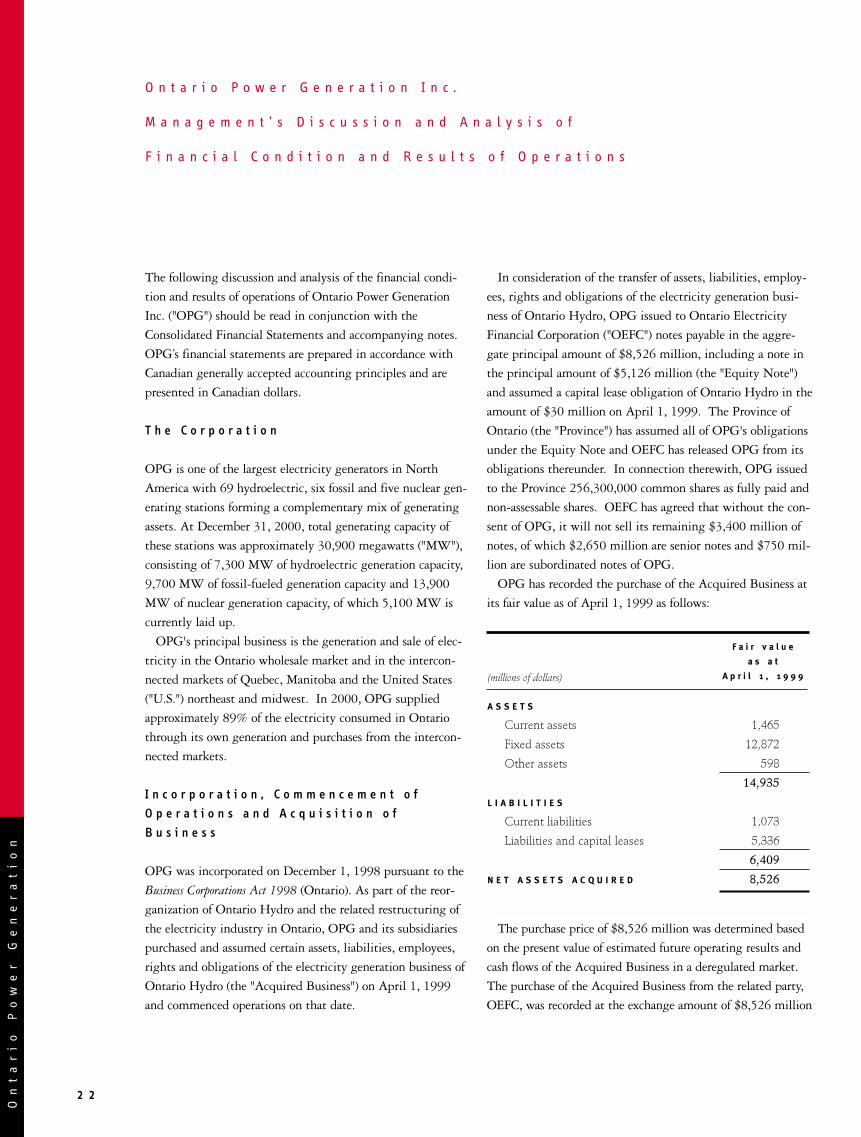
OPG has recorded the purchase of the Acquired Business at
its fair value as of April 1, 1999 as follows:
The purchase price of $8,526 million was determined based
on the present value of estimated future operating results and
cash flows of the Acquired Business in a deregulated market.
The purchase of the Acquired Business from the related party,
OEFC, was recorded at the exchange amount of $8,526 million
A S S E T S
Current assets 1,465
Fixed assets 12,872
Other assets 598
14,935
L I A B I L I T I E S
Current liabilities 1,073
Liabilities and capital leases 5,336
6,409
N E T A S S E T S A C Q U I R E D 8,526
F a i r v a l u e
a s a t
A p r i l 1 , 1 9 9 9(millions of dollars)
2 3A n n u a l R e p o r t 2 0 0 0
in view of the substantive change in ownership interests aris-
ing from the transaction. The aggregate value of the net
assets acquired was allocated to assets and liabilities based on
their estimated fair values. Included within the net assets
acquired by OPG was a deferred pension asset of $555 million
that is reflective of the surplus in OPG's pension plan admin-
istered through OEFC.
The results of operations and cash flow presented in OPG's
Consolidated Financial Statements for the three months ended
March 31, 1999 represent the operations of Ontario Hydro
pertaining to the Acquired Business now conducted by OPG.
These financial statements have been prepared through specif-
ic identification of assets, liabilities (other than debt), revenues
and expenses relating to the Acquired Business, and through
an allocation of certain common financial statement accounts
and items of Ontario Hydro. In particular, a portion of
Ontario Hydro's revenues and debt, and a corresponding por-
tion of related interest and other financial expenses, have been
allocated to the Acquired Business.
As part of the restructuring of the Ontario electricity indus-
try, four other successor entities to Ontario Hydro were creat-
ed in addition to OPG. The other successor entities include
the following:
• Hydro One Inc. (formerly Ontario Hydro Services Company
Inc.) ("Hydro One") purchased and assumed the transmis-
sion, distribution and retail energy services businesses for-
merly operated by Ontario Hydro;
• The Independent Electricity Market Operator ("IMO") is the
centralized independent electricity system co-ordinator
responsible for the balance of supply and demand, control of
the provincial grid, the operation of energy and ancillary
markets, including a spot market, and settlement of finan-
cial transactions;
• The Electrical Safety Authority ("ESA") carries out electrical
equipment and electrical wiring installation inspection func-
tions in Ontario; and
• OEFC is responsible for managing and retiring Ontario
Hydro’s outstanding debt and other obligations and adminis-
tration of the OPG pension plan.
F i n a n c i a l H i g h l i g h t s
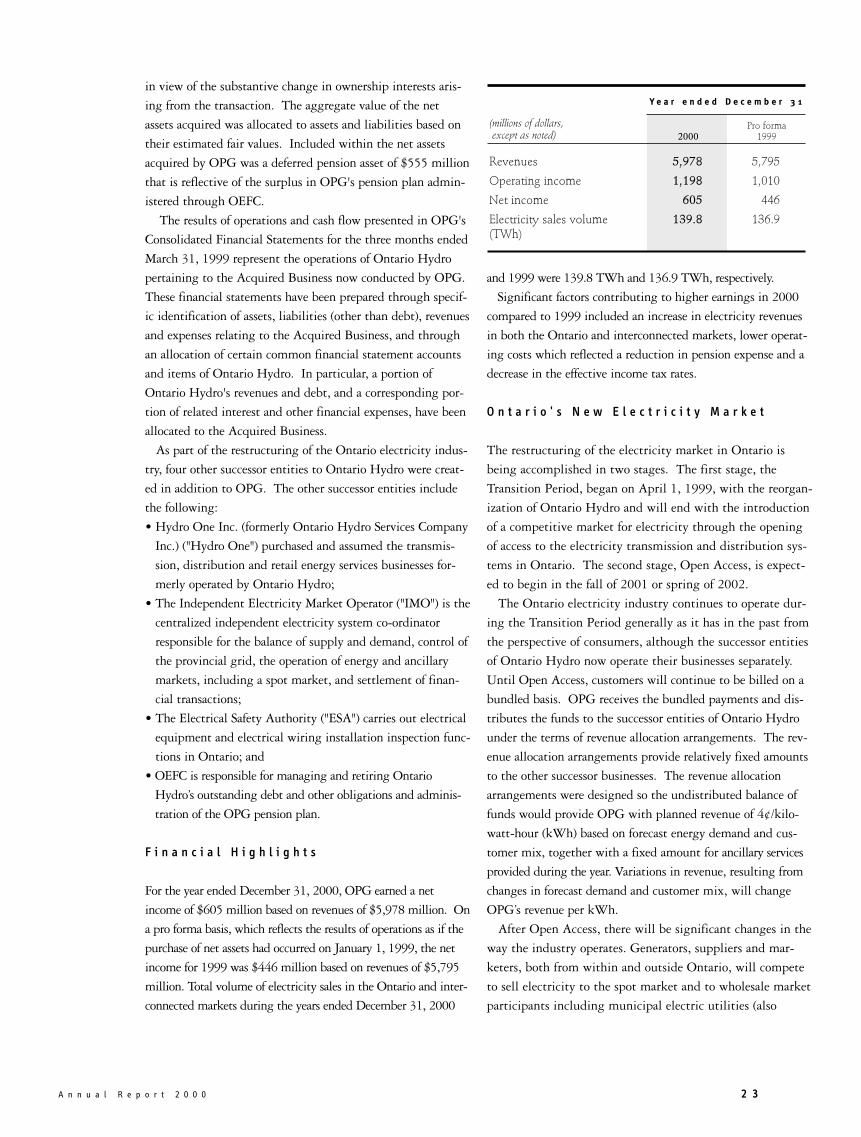
For the year ended December 31, 2000, OPG earned a net
income of $605 million based on revenues of $5,978 million. On
a pro forma basis, which reflects the results of operations as if the
purchase of net assets had occurred on January 1, 1999, the net
income for 1999 was $446 million based on revenues of $5,795
million. Total volume of electricity sales in the Ontario and inter-
connected markets during the years ended December 31, 2000
and 1999 were 139.8 TWh and 136.9 TWh, respectively.
Significant factors contributing to higher earnings in 2000
compared to 1999 included an increase in electricity revenues
in both the Ontario and interconnected markets, lower operat-
ing costs which reflected a reduction in pension expense and a
decrease in the effective income tax rates.
O n t a r i o ' s N e w E l e c t r i c i t y M a r k e t
The restructuring of the electricity market in Ontario is
being accomplished in two stages. The first stage, the
Transition Period, began on April 1, 1999, with the reorgan-
ization of Ontario Hydro and will end with the introduction
of a competitive market for electricity through the opening
of access to the electricity transmission and distribution sys-
tems in Ontario. The second stage, Open Access, is expect-
ed to begin in the fall of 2001 or spring of 2002.
The Ontario electricity industry continues to operate dur-
ing the Transition Period generally as it has in the past from
the perspective of consumers, although the successor entities
of Ontario Hydro now operate their businesses separately.
Until Open Access, customers will continue to be billed on a
bundled basis. OPG receives the bundled payments and dis-
tributes the funds to the successor entities of Ontario Hydro
under the terms of revenue allocation arrangements. The rev-
enue allocation arrangements provide relatively fixed amounts
to the other successor businesses. The revenue allocation
arrangements were designed so the undistributed balance of
funds would provide OPG with planned revenue of 4¢/kilo-
watt-hour (kWh) based on forecast energy demand and cus-
tomer mix, together with a fixed amount for ancillary services
provided during the year. Variations in revenue, resulting from
changes in forecast demand and customer mix, will change
OPG’s revenue per kWh.
After Open Access, there will be significant changes in the
way the industry operates. Generators, suppliers and mar-
keters, both from within and outside Ontario, will compete
to sell electricity to the spot market and to wholesale market
participants including municipal electric utilities (also
Revenues 5,978 5,795
Operating income 1,198 1,010
Net income 605 446
Electricity sales volume 139.8 136.9(TWh)
(millions of dollars, except as noted) 2000
Pro forma1999
Y e a r e n d e d D e c e m b e r 3 1

2 4
referred to as local distribution companies, or "LDCs"), large
commercial and industrial customers, and aggregators, bro-
kers and marketers. Consumers will have access to the elec-
tricity supplier of their choice. Consumers will pay for the
electricity purchased, as well as transmission and distribu-
tion services and "uplift" charges assessed by the IMO in
respect of transmission losses and other costs to operate the
system. In addition, a debt retirement charge will be levied
to service the portion of OEFC's debt that cannot be serviced
by payments in lieu of taxes made by OPG, Hydro One and
the LDCs and other sources of revenue.
In order to ensure an orderly and gradual transition to a
competitive electricity industry after Open Access, the
Province has adopted a framework for market power mitiga-
tion designed to address issues regarding OPG's market posi-
tion in Ontario. The first market power mitigation measure
is a revenue cap mechanism. For the first four years after
Open Access, the significant majority of OPG's expected ener-
gy sales in Ontario will be subject to an average annual rev-
enue cap of 3.8¢/kWh. The amount of energy production
subject to the revenue cap has been predetermined for the
entire four-year period on an annual basis and will be reduced
with the approval of the Ontario Energy Board ("OEB") as
OPG reduces its control of generation capacity in Ontario. At
the end of each one-year period following Open Access, OPG
will be required to pay a rebate to the IMO equal to the dif-
ference between the average spot market price and 3.8¢/kWh
for the amount of energy sales subject to the revenue cap. The
IMO will pass this rebate on to Ontario consumers who draw
energy from the IMO market.
The second market power mitigation measure is a require-
ment for OPG to relinquish control to an independent third
party of some of its generating capacity. This can be accom-
plished through the outright sale or lease of power stations or
by entering into other arrangements transferring control of
the timing, quantity and bidding of energy produced by
OPG's stations. OPG is required to relinquish effective con-
trol of at least 4,000 MW of fossil generating capacity within
42 months after Open Access, with the option of substituting
up to 1,000 MW of hydroelectric generating capacity for an
equal amount of fossil operating capacity. Further, within 10
years of Open Access, OPG must reduce its effective control
over total generation capacity to a level that is no more than
35% of the overall Ontario market's supply.
In addition, in order to ease the transition to Open Access,
the Province has passed a regulation which requires OPG to
continue to offer the terms of certain of its tariffs to approxi-
mately 80 large power consumers for a maximum of four
years after Open Access begins.
Elements of the restructuring of Ontario's electricity mar-
ket, including certain regulations and market rules estab-
lished by the OEB and IMO, are still in a state of transition.
A n a l y s i s o f O p e r a t i n g R e s u l t s
The following discussion and analysis provides a comparison
of the operating results for the year ended December 31, 2000
to pro forma operating results for the year ended December
31, 1999. Pro forma operating results for 1999 have been
provided to enhance the comparability of results for 1999 and
2000, given the significant differences in the business and reg-
ulatory environment, as well as the significant change in
OPG's capital structure that occurred effective April 1, 1999.
The 1999 pro forma statement of income reflects the opera-
tions of the Acquired Business for the three months ended
March 31, 1999 and OPG's actual operating results for the
nine months ended December 31, 1999.
The pro forma statement of income reflects the purchase of
the Acquired Business as if the purchase of net assets had
occurred on January 1, 1999. The historical results prior to
April 1, 1999 have been restated to reflect the acquisition
related adjustments including the allocation of the acquisition
price to the assets and the liabilities of the generation business
of Ontario Hydro. The assumptions and adjustments underly-
ing the pro forma income statement are disclosed in Note 17
to the Consolidated Financial Statements. Some of the more
significant financial statement effects of the purchase that
occurred on April 1, 1999 include the following:
• Revenues for electricity sales in Ontario were adjusted to
reflect the revenue allocation arrangements for the
Transition Period.
• The method of accounting for the acquisition of the
Acquired Business, which resulted in recording assets and
liabilities at fair value, required a significant change in val-
ues of the assets and liabilities.
• There is a large reduction in operating expenses due to
lower depreciation and amortization arising from a signifi-
cantly reduced fixed asset valuation.
• Interest expense is considerably lower due to the significant
reduction in debt financing.
• OPG bears an income and capital tax burden that the
Acquired Business did not incur.
On
ta
ri
o
Po
we
r
Ge
ne
ra
ti
on

2 5A n n u a l R e p o r t 2 0 0 0
Net Income
The net income for 2000 was $605 million compared to pro
forma net income of $446 million in 1999. The increase in
earnings from 1999 was primarily due to an increase in elec-
tricity revenues in both the Ontario and interconnected mar-
kets, lower operating costs that reflected a reduction in pen-
sion expense and a decrease in the effective income tax rates.
Revenues
Total revenues for 2000 were $5,978 million compared with
$5,795 million in 1999, an increase of $183 million or 3%.
Of the total, Ontario energy revenues were $5,576 million
(1999 - $5,446 million), interconnected market revenues were
$279 million (1999 - $233 million) and non-energy revenues
amounted to $123 million (1999 - $116 million).
Ontario energy revenues are earned from the generation and
sale of electricity to the wholesale market. Customers in
Ontario include approximately 214 LDCs and municipal elec-
trical utilities, that in turn serve more than three million cus-
tomers, over 100 large direct industrial customers, and Hydro
One which serves a further 930,000 customers. Ontario rev-
enues in 2000 were $5,576 million compared with $5,446
million in 1999, an increase of $130 million. The higher rev-
enues were primarily due to a 3.4 TWh increase in the vol-
ume of electricity sales from 132.4 TWh in 1999 to 135.8
TWh in 2000. The increase in volume was due to increased
economic activity which contributed to higher demand from
municipal and industrial customers, partially offset by the
impact of warmer winter weather and cooler summer weather
in 2000 which reduced the demand for heating and air condi-
tioning compared to 1999. On a weather-normalized basis,
electricity sales would have been 137.0 TWh in 2000 com-
pared to 132.2 TWh in 1999. The average revenue rate was
4.03¢/kWh in 2000 compared to 4.04¢/kWh in 1999.
Revenues from interconnected markets were $279 million
in 2000 compared with $233 million in 1999, an increase of
$46 million. The increase in interconnected revenue was due
to higher spot market prices in 2000 ($50 million) and an
increase in other revenues from U.S. customers ($20 million),
partially offset by a decrease in sales volumes primarily due to
a cooler summer season. The interconnected sales volumes in
2000 were 4.0 TWh, a decrease of 0.5 TWh from the 1999
sales volume of 4.5 TWh. The average sales prices, excluding
the other revenues, were 6.05¢/kWh in 2000 compared to
4.80¢/kWh in 1999.
Non-energy revenues include sales of engineering and tech-
nical expertise, by-product sales such as flyash, cobalt and
other nuclear isotopes, heavy water sales, foreign exchange
gains and losses, and the sale of services to the other successor
companies to Ontario Hydro in respect of facility and space
management, information technology and other support serv-
ices. Non-energy revenues for 2000 were $123 million com-
pared with $116 million in 1999. The increase was due pri-
marily to higher sales of engineering and technical expertise,
the sale of surplus assets, higher isotope and by-product sales
and an increase in foreign exchange gains, partially offset by a
reduction in the sale of services to other successor companies
of Ontario Hydro.
Operating Expenses
Operation, maintenance and administrative (OM&A) expenses
consist of labour, materials and administrative support.
OM&A expenses in 2000 were $2,186 million compared with
$2,337 million in 1999, a decrease of $151 million or 6%.
The decrease was due primarily to lower pension expense
($170 million), a decrease in costs resulting from the comple-
tion of the Year 2000 computer systems remediation efforts
($39 million) and lower rehabilitation costs at the Nanticoke
and Lambton generating stations ($32 million). While the
current service pension cost remained relatively constant
between the years, the lower pension expense in 2000 was pri-
marily due to higher returns on pension fund assets in 1999, a
R E V E N U E S 5,978 5,795
O P E R AT I N G E X P E N S E S
Operation, maintenanceand administration 2,186 2,337
Fuel 1,271 1,116
Power purchased 180 198
Depreciation and amortization 764 765
Property and capital taxes 379 369
4,780 4,785
O P E R A T I N G I N C O M E 1,198 1,010
Interest expense 140 179
Income before income taxes 1,058 831
Income taxes 453 385
N E T I N C O M E 605 446
Y e a r E n d e d D e c e m b e r 3 1
(millions of dollars) 2000Pro forma (1)
1999
(1) The pro forma results are not necessarily indicative of the results that would have occurred had thetransactions occurred on the relevant dates, because of the significant changes in the business andregulatory environments, financing and other factors.
2 6
change in discount rates and other economic factors. The
impact of these reductions was partially offset by higher
spending on nuclear-related projects ($57 million), including
an increase in activity related to the Pickering A generating
station return to service, costs related to voluntary severance
programs ($18 million), and other increases in operating costs
($15 million).
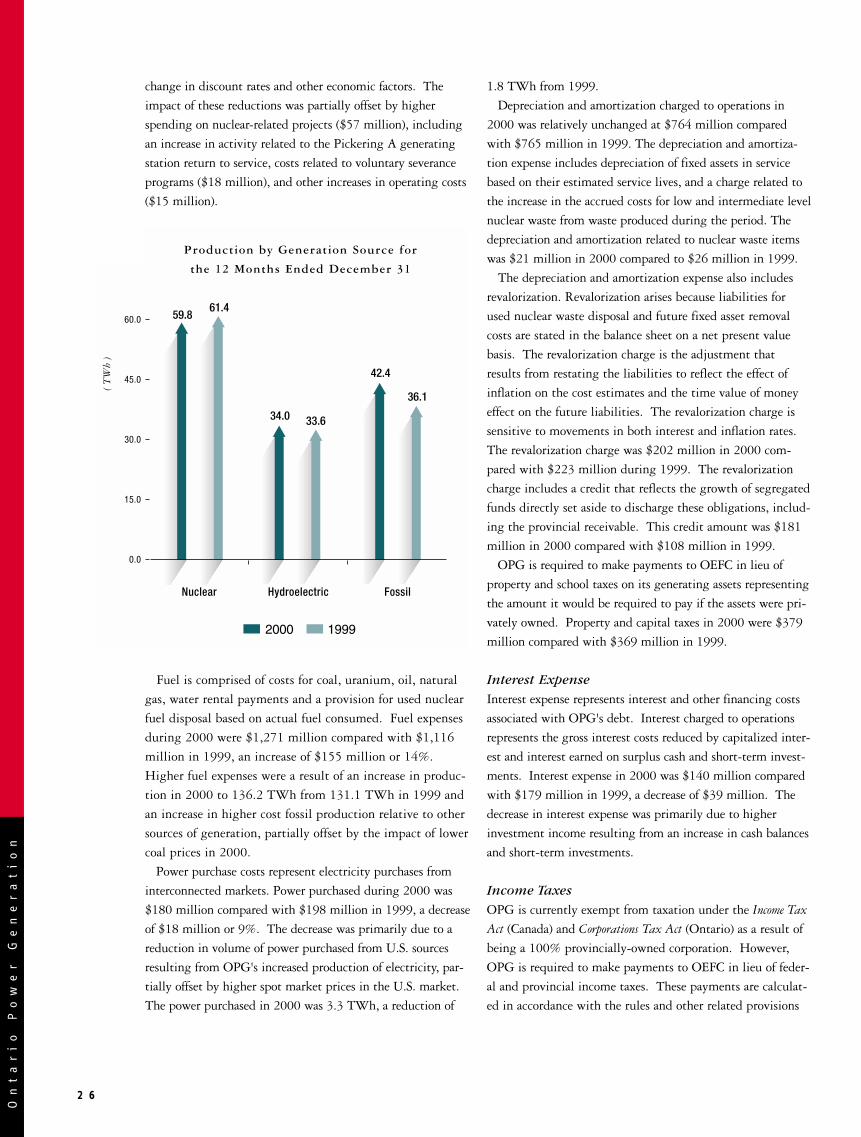
Fuel is comprised of costs for coal, uranium, oil, natural
gas, water rental payments and a provision for used nuclear
fuel disposal based on actual fuel consumed. Fuel expenses
during 2000 were $1,271 million compared with $1,116
million in 1999, an increase of $155 million or 14%.
Higher fuel expenses were a result of an increase in produc-
tion in 2000 to 136.2 TWh from 131.1 TWh in 1999 and
an increase in higher cost fossil production relative to other
sources of generation, partially offset by the impact of lower
coal prices in 2000.
Power purchase costs represent electricity purchases from
interconnected markets. Power purchased during 2000 was
$180 million compared with $198 million in 1999, a decrease
of $18 million or 9%. The decrease was primarily due to a
reduction in volume of power purchased from U.S. sources
resulting from OPG's increased production of electricity, par-
tially offset by higher spot market prices in the U.S. market.
The power purchased in 2000 was 3.3 TWh, a reduction of
1.8 TWh from 1999.
Depreciation and amortization charged to operations in
2000 was relatively unchanged at $764 million compared
with $765 million in 1999. The depreciation and amortiza-
tion expense includes depreciation of fixed assets in service
based on their estimated service lives, and a charge related to
the increase in the accrued costs for low and intermediate level
nuclear waste from waste produced during the period. The
depreciation and amortization related to nuclear waste items
was $21 million in 2000 compared to $26 million in 1999.
The depreciation and amortization expense also includes
revalorization. Revalorization arises because liabilities for
used nuclear waste disposal and future fixed asset removal
costs are stated in the balance sheet on a net present value
basis. The revalorization charge is the adjustment that
results from restating the liabilities to reflect the effect of
inflation on the cost estimates and the time value of money
effect on the future liabilities. The revalorization charge is
sensitive to movements in both interest and inflation rates.
The revalorization charge was $202 million in 2000 com-
pared with $223 million during 1999. The revalorization
charge includes a credit that reflects the growth of segregated
funds directly set aside to discharge these obligations, includ-
ing the provincial receivable. This credit amount was $181
million in 2000 compared with $108 million in 1999.
OPG is required to make payments to OEFC in lieu of
property and school taxes on its generating assets representing
the amount it would be required to pay if the assets were pri-
vately owned. Property and capital taxes in 2000 were $379
million compared with $369 million in 1999.
Interest Expense
Interest expense represents interest and other financing costs
associated with OPG's debt. Interest charged to operations
represents the gross interest costs reduced by capitalized inter-
est and interest earned on surplus cash and short-term invest-
ments. Interest expense in 2000 was $140 million compared
with $179 million in 1999, a decrease of $39 million. The
decrease in interest expense was primarily due to higher
investment income resulting from an increase in cash balances
and short-term investments.
Income Taxes
OPG is currently exempt from taxation under the Income Tax
Act (Canada) and Corporations Tax Act (Ontario) as a result of
being a 100% provincially-owned corporation. However,
OPG is required to make payments to OEFC in lieu of feder-
al and provincial income taxes. These payments are calculat-
ed in accordance with the rules and other related provisions
( T
Wh
)
59.861.4
34.0 33.6
42.4
36.1
60.0
45.0
30.0
15.0
0.0
Nuclear Hydroelectric Fossil
Production by Generation Source for
the 12 Months Ended December 31
On
ta
ri
o
Po
we
r
Ge
ne
ra
ti
on

2 7A n n u a l R e p o r t 2 0 0 0
contained in the federal and provincial tax legislation and the
regulations made under the Electricity Act, 1998.
Effective January 1, 2000, OPG changed its method of
accounting for income taxes from the deferral method to the lia-
bility method of tax allocation as required by The Canadian
Institute of Chartered Accountants' Handbook, Section 3465,
Accounting for Income Taxes. The cumulative effect as at January
1, 2000 of adopting these recommendations was not material.
Therefore, prior year financial statements have not been restat-
ed. For the nine months ended December 31, 1999, the
deferred income tax component of income tax expense is dis-
closed in the financial statements as future income taxes.
Income taxes in 2000 were $453 million compared with
$385 million in 1999. The increase in income taxes of $68
million was due primarily to a higher income before tax in
2000, partially offset by a decrease in the effective income tax
rate from 47.0% in 1999 to 42.8% in 2000.
A s s e t R e m o v a l a n d N u c l e a r W a s t e
M a n a g e m e n t
Liability for Asset Removal and Nuclear Waste
Management
Effective April 1, 1999, as a result of the purchase of the gen-
erating assets of Ontario Hydro, OPG recognized a liability
equal to the committed value of nuclear and fossil liabilities,
representing the total present value of the costs of dismantling
the nuclear and fossil production facilities at the end of their
useful lives, the total fixed cost of nuclear waste management
programs, and the variable cost portion of nuclear waste man-
agement programs associated with actual waste volumes
incurred up to April 1, 1999. At December 31, 2000, the
liability for nuclear waste management and asset removal was
$7,104 million (1999 - $6,715 million), of which $6,978
million (1999 - $6,591 million) related to nuclear decommis-
sioning and waste liabilities and $126 million (1999 - $124
million) related to non-nuclear decommissioning liabilities.
On April 1, 1999, the Province agreed that the Province or
its agent would fund certain nuclear waste management and
asset removal liabilities that were incurred prior to April 1,
1999. Details of which liabilities will be funded are being
finalized with the Province. The provincial receivable of
$2,622 million represents the Province's liability of $2,480
million as at January 1, 2000, as well as interest in the
amount of $142 million accrued during the year ended
December 31, 2000 based on a rate of 5.75% (nine months
ended December 31, 1999 - 5.75%). The interest rate is
under negotiation with the Province and is subject to change.
The impact of the finalization of the interest rate for 2000 is
not expected to result in a material difference to the liability
balance.
Segregated Funds
OPG is contributing to segregated funds to provide for or dis-
charge the remaining unfunded nuclear liabilities. It is OPG’s
intent that these funds be held outside of OPG and be used
solely for nuclear waste management and nuclear fixed asset
removal. Until such time as the legal nature of the segregated
funds are finalized, OPG is setting aside funds internally and
is managing their investment and growth distinct from its
other cash holdings. The funds are invested in high grade,
interest-bearing instruments. The nuclear waste management
and asset removal fund increased by $414 million during
2000 through the funding and interest earned on the segre-
gated fund, net of current year expenditures. OPG plans to
contribute to the segregated funds over the estimated remain-
ing lives of its nuclear generating stations.
Nuclear Risk-Sharing
OPG and senior staff at the Ontario Ministry of Finance
reached an understanding on key principles for the devel-
opment of a nuclear liability agreement under which the
Province or its agent would risk-share certain nuclear waste
management costs in the event that the estimated present
value of these costs were to exceed certain thresholds. In
order to implement the nuclear liability agreement, OPG
must negotiate a definitive agreement and obtain the nec-
essary authorizations from the Province, including any
necessary Orders in Council. Execution of this agreement
would effectively limit OPG’s exposure to significant
increases in the estimated present value costs of nuclear
waste management.
In addition to a nuclear liability agreement, the Province
has also agreed to provide to the Canadian Nuclear Safety
Commission ("CNSC", formerly the Atomic Energy Control
Board), as required by federal regulation, a guarantee that
there will be funds available to discharge 100% of the
nuclear decommissioning and waste liabilities that exist at
any point in time within OPG. This guarantee relates to the
portion of the liabilities that are not funded. In return, OPG
will pay to the Province a fee of 0.5% of the value of that
guarantee. This guarantee is expected to commence in 2001,
once the nuclear liability agreement is finalized.
Proposed Waste Management Organization
In response to a December 1998 policy statement by the
Federal Government, OPG continues its discussions with both
the Province and the Federal Government regarding the estab-
2 8
lishment of a Waste Management Organization ("WMO") to
manage all future operating expenditures for the life cycle
management of nuclear waste. The exact structure and man-
date of the WMO is under review.
The WMO would have the benefits of centralization of
technical and management skills, would aid in the develop-
ment of Canadian wide solutions to nuclear waste issues and
would be in line with corporate structures adopted across the
world for management of radioactive wastes. The Federal
Government is considering introducing draft legislation
within the next year that would establish the role of a WMO
and define government oversight responsibilities.
N u c l e a r R e c o v e r y P r o g r a m
An important element underlying OPG's commercial and
financial success is improved nuclear performance. OPG’s
expectation of improving financial performance is dependent
on increasing production of low cost nuclear energy to com-
pete in Ontario and the interconnected markets. This
includes the return to service of the four units at the Pickering
A generating station.
A comprehensive nuclear recovery plan was developed in
the fall of 1997 by Ontario Hydro. The nuclear recovery
plan was designed to improve the operating performance of
the nuclear generating stations. The projects within the
nuclear recovery program include standardizing operations
and implementing initiatives to improve accountability, man-
agement and operational control systems, maintenance and
inspection programs, regulatory compliance, performance
standards and employee training.
Expenditures related to the nuclear recovery plan during the
period from 1997 to 2004 are expected to total $1,400 mil-
lion. This estimate excludes future costs related to the Bruce
nuclear facilities subsequent to completing the transaction to
lease the Bruce A and Bruce B generating stations to Bruce
Power L.P. The new operators of the Bruce site will be
responsible for any improvement expenditure on the site after
the transaction closes. Spending on the nuclear recovery pro-
gram was $267 million during the 2000 year and $308 mil-
lion during 1999. Total expenditures since the start of the
program in 1997 were $853 million. The planned expendi-
tures on these projects are expected to total approximately
$250 million in 2001.
Under the nuclear recovery plan, the Pickering A generat-
ing station was placed in short term lay-up on December 31,
1997 and the Bruce A station was placed in longer-term lay-
up on March 31, 1998. This allowed OPG to focus its initial
recovery efforts on the remaining 12 nuclear generating units
of Darlington, Pickering B and Bruce B.
With the staffing, planning and execution of the program
well underway, attention is now focused on returning the
Pickering A station to service. The current plans call for the
return to service of the four Pickering A units at approximate-
ly six-month intervals commencing at the start of 2002. The
total project cost of returning the Pickering A units to service
is expected to be approximately $1,100 million. Total expen-
ditures since the decision in 1999 to return Pickering A to
service were $197 million. An environmental assessment
("EA") was required to determine the effect that Pickering A's
return to service will have on the environment. The CNSC
held two public hearings on the EA. Following the hearings,
the CNSC in February 2001 accepted the conclusions and rec-
ommendations of the EA. Pickering A return to service licenc-
ing hearings are tentatively scheduled for the summer of
2001.
L i q u i d i t y a n d C a p i t a l R e s o u r c e s
Cash flow from operating activities during the year ended
December 31, 2000 amounted to $1,281 million (nine
months ended December 31, 1999 - $549 million). Sufficient
cash was generated from operations in 2000 to finance work-
ing capital requirements and invest in fixed assets and pay
dividends. Cash and cash equivalents increased by $322 mil-
lion to $565 million at December 31, 2000 from $243 mil-
lion at December 31, 1999. In addition OPG had short-term
investments of $335 million at December 31, 2000.
OPG continues to invest in fixed assets to improve operat-
ing efficiencies, increase generating capacity of its existing
plant and maintain and improve service, reliability, safety
and environmental performance. The investment in fixed
assets of $585 million for the year ended December 31,
2000 compared with $450 million for the nine months
ended December 31, 1999 and $35 million during the three
months ended March 31, 1999. OPG’s contribution to the
nuclear waste management and asset removal fund of $414
million in 2000 was in addition to the Company’s invest-
ment in fixed assets.
OPG’s planned capital expenditures for 2001 are approxi-
mately $725 million. This amount includes sustaining capital
expenditures to support the continued operations of current
generating capacity such as expenditures to meet expected
emission reduction regulations, and capital expenditures to
expand generating capacity such as the Pickering A return to
service project and the nuclear recovery program. Of the total
capital plan for 2001, OPG estimates that $460 million repre-
sents expenditures for sustaining operations. For 2002, OPG's
On
ta
ri
o
Po
we
r
Ge
ne
ra
ti
on
2 9A n n u a l R e p o r t 2 0 0 0
planned capital expenditures are approximately $800 million,
of which $430 million represent sustaining expenditures.
In the future, OPG expects to seek external sources of capi-
tal such as debt in the Canadian capital market to obtain
funds required to carry out its capital program, refinance
existing debt and provide other flexibility in the funding of
future operations. In June 2000, OPG obtained investment-
grade credit ratings of A for its long-term debt from both
Canadian Bond Rating Services ("CBRS", subsequently pur-
chased by Standard & Poor’s, "S & P") and Dominion Bond
Rating Services (DBRS) and A-1 and R-1 (low) for its short-
term debt from CBRS and DBRS, respectively. As a result of
the purchase of CBRS, S & P will be reviewing OPG's rating
as part of its strategy to harmonize its rating to conform to an
S & P standard.
OPG has access to funds through a $600 million credit
facility with certain Canadian chartered banks to fund
working capital requirements and for general corporate pur-
poses. This facility may be drawn upon in either Canadian
or U.S. dollars at varying rates based on certain benchmark
rates, including a prime rate, a bankers’ acceptance rate, and
a LIBOR rate.
OPG initiated a commercial paper (CP) program in 2000.
Under the CP program, OPG has the authority to issue short-
term promissory notes up to a maximum outstanding principal
amount of $600 million in Canadian currency, or the equiva-
lent thereof in United States currency. Notes issued under the
CP program are backed by the above-noted credit facility. As at
December 31, 2000, OPG had $150 million of promissory
notes issued and outstanding under this CP program. This
program, coupled with obtaining investment grade ratings,
were part of the financing liquidity strategy to expand OPG's
capital sources in the public market. OPG will be using these
funds for working capital and general corporate purposes.
OPG’s long-term debt of $3,423 million, as at December
31, 2000 consists of $200 million of senior notes due within
one year, $2,450 million of senior notes due in the years 2002
to 2009, $750 million of subordinated notes due in the years
2010 and 2011 and $23 million in capital lease obligations.
Certain covenants applicable to any public debt issued by OPG
in the future will automatically become applicable to the notes.
R i s k M a n a g e m e n t
Overview
OPG’s risk management activities involve identifying, assess-
ing and controlling the risk associated with its portfolio of
generation assets in an effort to optimize asset returns. The
Board of Directors approves all risk management policies
prior to implementation. OPG undertakes an assessment of
its risk exposures in order to characterize such exposures and
the effects of risk management activities, including avoid-
ance, reduction, transfer and substitution. Executive manage-
ment and the Board of Directors review OPG’s residual expo-
sure to ensure it is consistent with overall strategy and corpo-
rate risk tolerance levels.
Upon Open Access, OPG will be subject to increased risk,
including market and credit risk inherent in a deregulated
market. A Risk Oversight Committee which consists of sen-
ior officers from OPG has been established to approve trans-
actions under the direction of the Board of Directors, monitor
policies and compliance issues, and ensure overall corporate
governance specifically related to market activity for OPG.
In anticipation of increased levels and complexity of market
activities, OPG is implementing a comprehensive trade cap-
ture and risk management system with related processes and
controls. These processes will include a segmentation of
portfolio activities to facilitate effective identification and
measurement of risks, and the application of appropriate posi-
tion and risk limits. The methodology used to measure these
risks will involve the use of consistent and recognized risk
measures for the monitoring of trading activities and the gen-
eration portfolio.
Industry Restructuring
Certain regulations and market rules established by the IMO
and the OEB that will govern the competitive wholesale and
retail electricity markets, including technical provisions
dealing with participants in the markets and the procure-
ment of certain ancillary services are still in a state of transi-
tion. The Minister of Energy, Science and Technology, the
Minister of Finance, the IMO and the OEB are each continu-
ing to assess and develop policy positions on various matters
that could affect OPG.
Nuclear Recovery Program
The successful implementation of the nuclear recovery program
will depend on many factors, including the discovery of any
unanticipated deficiencies or greater than anticipated deteriora-
tion to its nuclear generating assets, the ability to operate effec-
tively within the new regulatory framework governing nuclear
generation, the ability to hire and retain qualified personnel,
the ability to increase productivity and the ability to imple-
ment management and operational changes. The nuclear recov-
ery program includes a rigorous framework for managing risks
associated with nuclear operations and processes. This frame-
work addresses the major risk areas, related exposures and
impacts, and mitigation strategies in the nuclear business.
3 0
Environmental Compliance
OPG is committed to meeting all applicable environmental
legislative requirements and voluntary environmental com-
mitments. OPG’s environmental policy involves pollution
prevention, continuous environmental improvement, reduc-
tion of resource use and efficiency improvements. OPG rou-
tinely undertakes environmental compliance audits.
OPG has set and achieved an international standard for
environmental management systems. All of OPG’s nuclear
and fossil stations and hydroelectric station groups have been
ISO 14001-registered. Registration means that the stations
have put in place a comprehensive program to ensure that
they are operated in an environmentally responsible way and
that environmental performance is continually improved.
Regulatory requirements and terms and conditions issued
through environmental legislation, regulations, orders, certifi-
cates of approval and permits are managed through OPG’s
environmental management systems.
OPG utilizes emission reduction credits (ERCs) to manage
emission levels of oxides of nitrogen (NOx) and carbon diox-
ide (CO2) within the prescribed regulatory limits and volun-
tary caps. ERCs are purchased and sold with trading partners
in Canada and the United States. ERCs are created when a
source reduces emissions below the lower of previous actual
emissions or the level required by government regulation.
Electricity Price Risk
Electricity price risk is the risk that changes in the market price
of electricity will adversely impact OPG's earnings and cash
flow. Once the market opens, OPG will face price risk directly
related both to the demand and supply of generation in the
open market and transmission constraints. OPG's production
will be exposed to spot market prices, however derivative
instruments and related risk management products may be used
to mitigate its exposure to electricity prices upon Open Access.
Generation Risk
OPG is exposed to the market impacts of uncertain output
from its generating units or generation risk. The amount of
electricity generated by OPG is affected by such risks as fuel
supply, equipment malfunction, maintenance requirements,
and regulatory and environmental constraints. OPG enters
into multiple short-term and long-term fuel supply agree-
ments and long-term water use agreements, manages fuel
supply inventories, follows industry practices for mainte-
nance and outage scheduling, ensures regulatory require-
ments are met, particularly with respect to licencing of its
nuclear facilities, and manages environmental constraints
utilizing programs such as emission reduction credits.
Credit Risk
Credit risk is the risk of non-performance by contractual
counterparties. Following Open Access, substantially all of
OPG's revenues will be derived from sales through the
IMO-administered spot market. Participants in the IMO
spot market must meet IMO-mandated standards for credit-
worthiness with the result that OPG's risk for these sales is
effectively managed. OPG's other revenues will be derived
from several sources, including the sale of financial risk man-
agement products to third parties.
OPG has a counterparty credit policy, and has implement-
ed credit evaluation and collection procedures to monitor its
credit exposures. OPG manages counterparty credit risk by
monitoring and limiting its exposure to counterparties with
lower credit ratings, evaluating its counterparty credit expo-
sure on an integrated basis, and by performing periodic
reviews of the credit-worthiness of all counterparties, includ-
ing obtaining credit security for all transactions beyond
approved limits.
Foreign Exchange and Interest Rate Risk
OPG’s foreign exchange risk exposure is attributable prima-
rily to U.S. dollar denominated transactions such as the pur-
chase of fossil fuel and the purchase and sale of electricity in
U.S. markets. OPG currently manages this exposure by
periodically hedging its net U.S. dollar cash flows according
to approved risk management policies.
Interest rate exposure for OPG is limited by the fixed
rates on its long-term debt. Interest rate risk will arise
with the need to undertake new financing and with the
addition of variable rate debt. The interest rates for future
financing requirements may be hedged using derivative
instruments. The management of these risks will be under-
taken by selectively hedging in accordance with corporate
risk management policies.
M a r k e t O u t l o o k
The Marketplace
OPG’s vision is to be a premier North American energy
company focused on low-cost power generation and whole-
sale energy sales. OPG’s initial focus will be primarily in
Ontario’s electricity marketplace. In the short term, OPG
will concentrate on increasing the productivity, capacity and
cost competitiveness of its existing generating fleet. The
restoration of OPG’s nuclear generating facilities to top tier
operational performance is an integral part of this objective.
As well, the initiative to return the Pickering A generating
station to service will restore 2,060 MW of nuclear capacity
On
ta
ri
o
Po
we
r
Ge
ne
ra
ti
on
3 1A n n u a l R e p o r t 2 0 0 0
and significantly lower OPG’s overall system average pro-
duction costs. OPG is also focusing in the short term on
identifying and developing the market capabilities necessary
to maximize customer relationships and enhance the prod-
ucts and services it provides, as well as expanding the mar-
kets for its energy and related products and services once the
market opens.
Over the medium to longer term, OPG intends to selec-
tively expand its activities into regional markets, particularly
in the U.S. northeast and midwest, and to secure generating
capacity in U.S. interconnected market areas close to
Ontario. OPG will proceed on these new fronts in a bal-
anced and staged manner. OPG will rely on its operating
experience and performance improvements in its home mar-
ket, and its expertise in the sale and wheeling of power into
interconnected markets to increase revenues and to utilize
acquired assets to optimize production and performance.
OPG’s ability to compete successfully in the U.S. intercon-
nected markets will depend upon numerous factors, includ-
ing the pace of regulatory restructuring, the level of access to
these markets through regulatory licencing requirements,
limitations imposed by transmission capacity to the U.S. and
a variety of other factors including the price of electricity in
these markets, transmission costs to reach these markets and
environmental matters.
OPG expects that net income in 2001 will be affected by
such factors as increased expenditures to return to service the
Pickering A generating station, the loss of contribution of
the Bruce facility after its decontrol, a higher pension cost
due to economic and actuarial factors, the capping of a sig-
nificant portion of OPG's electricity sales at 3.8¢/kWh upon
Open Access and the potential impact related to the avail-
ability and price of fuel sources. OPG believes that its abili-
ty to improve net income over time depends largely on the
success of the nuclear recovery strategy, in particular the
return to service of the Pickering A generating station, the
realization of savings in operating expenses consistent with
the completion of the nuclear recovery strategy and the com-
pletion of decontrol transactions, and the successful imple-
mentation of OPG's growth strategies.
Open Access
Open Access, which is expected to begin in late 2001 or
early 2002, will result in significant changes in the way the
industry operates. Ontario electricity consumers will have
access to their electricity supplier of choice. Generators and
other market participants will compete with each other on
the basis of price, service quality and other differentiating
factors. Opportunities for new products and services will be
created, including those for managing the risk associated
with market price fluctuations.
After Open Access, OPG expects competitive pressures in
the Ontario market to come from companies which control
generation capacity decontrolled by OPG, intermediaries
that offer new products and services, including financial risk
management products, imports of electricity from the inter-
connected markets, generation by independent power pro-
ducers in Ontario and self generation by wholesale cus-
tomers. An important aspect of the marketplace is the
extent to which new generation is built in Ontario. This
will depend on a number of factors including actual and
anticipated price levels for electricity and natural gas, the
ability of parties to structure economic transactions, techno-
logical advances and regulatory developments.
Demand for electricity in the marketplace is expected to
increase through continued economic and population
growth, and through increasing demand for heating, air con-
ditioning and electronic infrastructure.
Market Power Mitigation
OPG expects to meet its decontrol commitments through
asset sales, asset or energy swaps, or other arrangements.
While market power mitigation effectively limits the mar-
ket share OPG can exercise in the Ontario market in
terms of generating capacity, it does allow for OPG to
grow its business through export sales and energy trading
arrangements.
OPG is committed to decontrolling selected generating
assets in advance of the deadlines required under market
power mitigation. In July 2000, OPG entered into an
agreement to lease its Bruce A and Bruce B generating sta-
tions to Bruce Power L.P., an entity controlled by British
Energy plc. The objective of the agreement is consistent
with OPG’s plans for meeting the requirement to reduce
generating supply within 10 years of open market access to
no more than 35% of the overall Ontario market's supply.
The operating lease will have an initial lease term of approx-
imately 18 years and will include options to extend the lease
for up to another 25 years. The completion of the transac-
tion, which is expected to take place in 2001, is subject to
usual closing conditions, including the necessary licences
from the CNSC and the OEB.
The lease agreement requires an initial payment of $625
million, payable in three installments. This includes $400
million, subject to closing adjustments, payable to OPG on
closing, and $225 million payable in two equal installments
of $112.5 million no later than four and six years from the
date the transaction is completed. Bruce Power will also
3 2
make annual lease payments during the initial lease term
that will consist of both fixed and variable payments. In
aggregate, the initial payment and annual lease payments to
OPG are estimated at $3.1 billion. OPG will continue to
be responsible for nuclear waste and decommissioning liabil-
ities at the Bruce site.
In early 2000, OPG announced its plans for accelerated
decontrol of a total of approximately 4,000 MW of hydro-
electric and fossil generating capacity, including the 2,100
MW oil/natural gas-fueled Lennox generating station and
the 1,100 MW coal-fired Lakeview fossil generating station.
The Province subsequently placed a moratorium on the sale
of coal-fired generating plants while it continues to assess
the potential environmental impacts of their future opera-
tion. As a result, OPG's plans for decontrol of both the
Lennox and Lakeview stations are on hold until such time as
the Province completes its review of environmental policies
on fossil-fueled generation.
O t h e r I n i t i a t i v e s
Information Technology Initiative
In November, OPG entered into an agreement to form a
joint venture with Business Transformation Services Inc.
("BTS"), a wholly-owned subsidiary of Cap Gemini Ernst &
Young, to transfer OPG's Information Services Group
("ISG") to New Horizon System Services Inc. ("New
Horizon"), a joint venture that will be owned 51% by BTS
and 49% by OPG. Approximately 600 employees within
ISG will transfer to New Horizon. The 10-year agreement is
expected to close in early 2001 and includes provisions that
allow BTS to re-assess the joint venture agreement up to
2002.
Kinectrics Inc.
In August 2000, OPG and C-SAT Technologies Inc. ("C-
SAT") announced the establishment of a new independent
science and engineering services company operating under
the name of Kinectrics Inc. This initiative marks an impor-
tant stage in the development of the former Ontario Power
Technologies division. OPG owns 90% of Kinectrics Inc.
and C-SAT owns and holds the remaining 10% non-control-
ling interest with an option to increase its investment to
50% by 2002.
Pantellos Corporation
In May, OPG joined twenty-one other North American
energy companies to form Pantellos Corporation, a provider
of e-commerce-based supply chain solutions. Pantellos will
require an initial capitalization of $100 million for the pur-
pose of developing and delivering a broad suite of technolo-
gies to create and operate an Internet-based electronic mar-
ketplace for the energy industry and its suppliers. OPG’s
share of this initial capitalization is $5 million.
L a b o u r N e g o t i a t i o n s
During the first quarter of 2000, OPG negotiated renewal
collective agreements with both major unions. The Power
Worker’s Union agreement was effective April 1, 2000, and
runs to March 31, 2002. OPG and The Society of Energy
Professionals re-opened negotiations six months prior to
expiration of the contract and negotiated renewal collective
agreements effective January 1, 2001 and running to
December 31, 2003.
Provisions related to the mobility of labour are included
within these agreements to allow OPG to facilitate decon-
trol of its generating capacity. Negotiations also resulted in
wage escalations and pension enhancements, a blanket
Purchased Services Agreement to facilitate Pickering A
re-start and an opportunity to tie staff compensation to
performance.
On
ta
ri
o
Po
we
r
Ge
ne
ra
ti
on
3 3A n n u a l R e p o r t 2 0 0 0
M a n a g e m e n t ’ s R e s p o n s i b i l i t y f o r
F i n a n c i a l R e p o r t i n g
The accompanying consolidated financial statements of Ontario Power Generation Inc. are the responsibility of management and
have been prepared in accordance with Canadian generally accepted accounting principles. Ontario Power Generation Inc. choos-
es accounting principles appropriate to the circumstances. The significant accounting policies followed by Ontario Power
Generation Inc. are described in the summary of significant accounting policies contained in Note 3 to the consolidated financial
statements. The preparation of financial statements necessarily involves the use of estimates based on management’s judgment,
particularly when transactions affecting the current accounting period cannot be finalized with certainty until future periods. The
consolidated financial statements have been properly prepared within reasonable limits of materiality and in light of information
available up to January 30, 2001.
Management maintained a system of internal controls designed to provide reasonable assurance that the assets were safeguard-
ed and that reliable financial information was available on a timely basis. The system included formal policies and procedures and
an organizational structure that provided for appropriate delegation of authority and segregation of responsibilities. An internal
audit function independently evaluated the effectiveness of these internal controls on an ongoing basis and reported its findings to
management and the Audit Committee of the Ontario Power Generation Inc. Board of Directors.
The consolidated financial statements have been examined by Ernst & Young LLP, independent external auditors appointed by
the Board of Directors. The external auditors’ responsibility is to express their opinion on whether the financial statements are
fairly presented in accordance with Canadian generally accepted accounting principles. The Auditors’ Report outlines the scope
of their examination and their opinion.
For the year ended December 31, 2000, the Ontario Power Generation Inc. Board of Directors, through the Audit
Committee, was responsible for ensuring that management fulfilled its responsibilities for financial reporting and internal con-
trols. The Audit Committee met periodically with management, the internal auditors and the external auditors to satisfy itself
that each group had properly discharged its respective responsibility, and to review the financial statements before recommending
approval by the Board of Directors. The external auditors had direct and full access to the Audit Committee, with and without
the presence of management, to discuss their audit and their findings as to the integrity of Ontario Power Generation Inc.’s finan-
cial reporting and the effectiveness of the system of internal controls.
January 30, 2001
Ronald W. Osborne Wayne M. Bingham
President and Executive Vice President and
Chief Executive Officer Chief Financial Officer

3 4
A u d i t o r s ' R e p o r t
T o t h e S h a r e h o l d e r o f O n t a r i o P o w e r G e n e r a t i o n I n c .
We have audited the consolidated balance sheets of Ontario Power Generation Inc. as at December 31, 2000 and 1999, the con-
solidated statements of income (loss), retained earnings (deficit of assets over liabilities) and cash flows of Ontario Power
Generation Inc. for the year ended December 31, 2000 and for the nine months ended December 31, 1999, and the consolidated
statements of income (loss), retained earnings (deficit of assets over liabilities) and cash flows of the electricity generating business
of Ontario Hydro (the Acquired Business) for the three months ended March 31, 1999. These consolidated financial statements
are the responsibility of the Company's management. Our responsibility is to express an opinion on these consolidated financial
statements based on our audits.
We conducted our audits in accordance with Canadian generally accepted auditing standards. Those standards require that we
plan and perform an audit to obtain reasonable assurance whether the consolidated financial statements are free of material mis-
statement. An audit includes examining, on a test basis, evidence supporting the amounts and disclosures in the consolidated
financial statements. An audit also includes assessing the accounting principles used and significant estimates made by manage-
ment, as well as evaluating the overall consolidated financial statement presentation.
In our opinion, these consolidated financial statements present fairly, in all material respects, the consolidated financial posi-
tion of Ontario Power Generation Inc. as at December 31, 2000 and 1999, the consolidated results of the operations and cash
flows of the Company for the year ended December 31, 2000 and nine months ended December 31, 1999 and the consolidated
results of operations and cash flows of the Acquired Business for the three months ended March 31, 1999 in accordance with
Canadian generally accepted accounting principles.
Chartered Accountants
Toronto, CanadaJanuary 26, 2001
On
ta
ri
o
Po
we
r
Ge
ne
ra
ti
on

3 5A n n u a l R e p o r t 2 0 0 0
A c q u i r e d B u s i n e s s(notes 1 and 3)
(millions of dollars except earnings per share)
C o n s o l i d a t e d S t a t e m e n t s o f I n c o m e ( L o s s )
Year ended December 31
2000
January 1 to March 31
1999
April 1 to December 31
1999
R E T A I N E D E A R N I N G S ( D E F I C I T O F A S S E T S
O V E R L I A B I L I T I E S ) , beginning of period (note 1) 291 – (442)
Net income (loss) 605 326 (99)
Dividends (205) (35) –
R E T A I N E D E A R N I N G S ( D E F I C I T O F A S S E T S
O V E R L I A B I L I T I E S ) , end of period 691 291 (541)
See accompanying notes to financial statements
C o n s o l i d a t e d S t a t e m e n t s o f R e t a i n e d E a r n i n g s
( D e f i c i t o f A s s e t s o v e r L i a b i l i t i e s )
A c q u i r e d B u s i n e s s(notes 1 and 3)
(millions of dollars)
Year ended December 31
2000
January 1 to March 31
1999
April 1 to December 31
1999
R E V E N U E S 5,978 4,338 1,769
O P E R A T I N G E X P E N S E S
Operation, maintenance and administration 2,186 1,770 551
Fuel 1,271 816 335
Power purchased 180 153 45
Depreciation and amortization (notes 6 and 7) 764 573 385
Property and capital taxes 379 277 7
4,780 3,589 1,323
O P E R A T I N G I N C O M E 1,198 749 446
I N T E R E S T E X P E N S E 140 134 545
I N C O M E ( L O S S ) B E F O R E I N C O M E T A X E S 1,058 615 (99)
I N C O M E T A X E S (note 4)
Current 310 214 –
Future 143 75 –
453 289 –
N E T I N C O M E ( L O S S ) 605 326 (99)
E A R N I N G S P E R C O M M O N S H A R E 2.36 1.27
C O M M O N S H A R E S O U T S T A N D I N G (millions) 256.3 256.3
See accompanying notes to financial statements

3 6
A S S E T S
C U R R E N T A S S E T S
Cash and cash equivalents (note 5) 565 243
Short-term investments 335 –
Accounts receivable 968 930
Fuel 288 424
Materials and supplies 229 201
2,385 1,798
F I X E D A S S E T S (note 6)
Property, plant and equipment 13,842 13,285
Less: accumulated depreciation 910 383
12,932 12,902
O T H E R A S S E T S
Deferred pension asset (note 16) 641 516
Fixed asset removal and nuclear waste management fund (note 7) 781 367
Long-term accounts receivable and other assets 52 27
1,474 910
16,791 15,610
See accompanying notes to financial statements
C o n s o l i d a t e d B a l a n c e S h e e t s
(millions of dollars)December 31
1999December 31
2000
On
ta
ri
o
Po
we
r
Ge
ne
ra
ti
on

3 7A n n u a l R e p o r t 2 0 0 0
C o n s o l i d a t e d B a l a n c e S h e e t s
(millions of dollars)December 31
1999December 31
2000
L I A B I L I T I E S
C U R R E N T L I A B I L I T I E S
Accounts payable and accrued charges 1,406 1,145
Short-term notes payable (note 9) 150 –
Long-term debt due within one year (note 8) 204 4
1,760 1,149
L O N G - T E R M D E B T (note 8) 3,219 3,422
O T H E R L I A B I L I T I E S
Fixed asset removal and nuclear waste management (note 7) 4,482 4,235
Other post employment benefits (note 16) 997 959
Long-term accounts payable and accrued charges 298 353
Future income tax liability (note 4) 218 75
5,995 5,622
S H A R E H O L D E R ' S E Q U I T Y
Common shares (note 11) 5,126 5,126
Retained earnings 691 291
5,817 5,417
16,791 15,610
C O N T I N G E N C I E S A N D C O M M I T M E N T S (notes 7 and 15)
See accompanying notes to financial statements
On behalf of the Board of Directors,
January 30, 2001:
William A. Farlinger Ronald W. Osborne
Chairman President and Chief Executive OfficerToronto, Canada Toronto, Canada
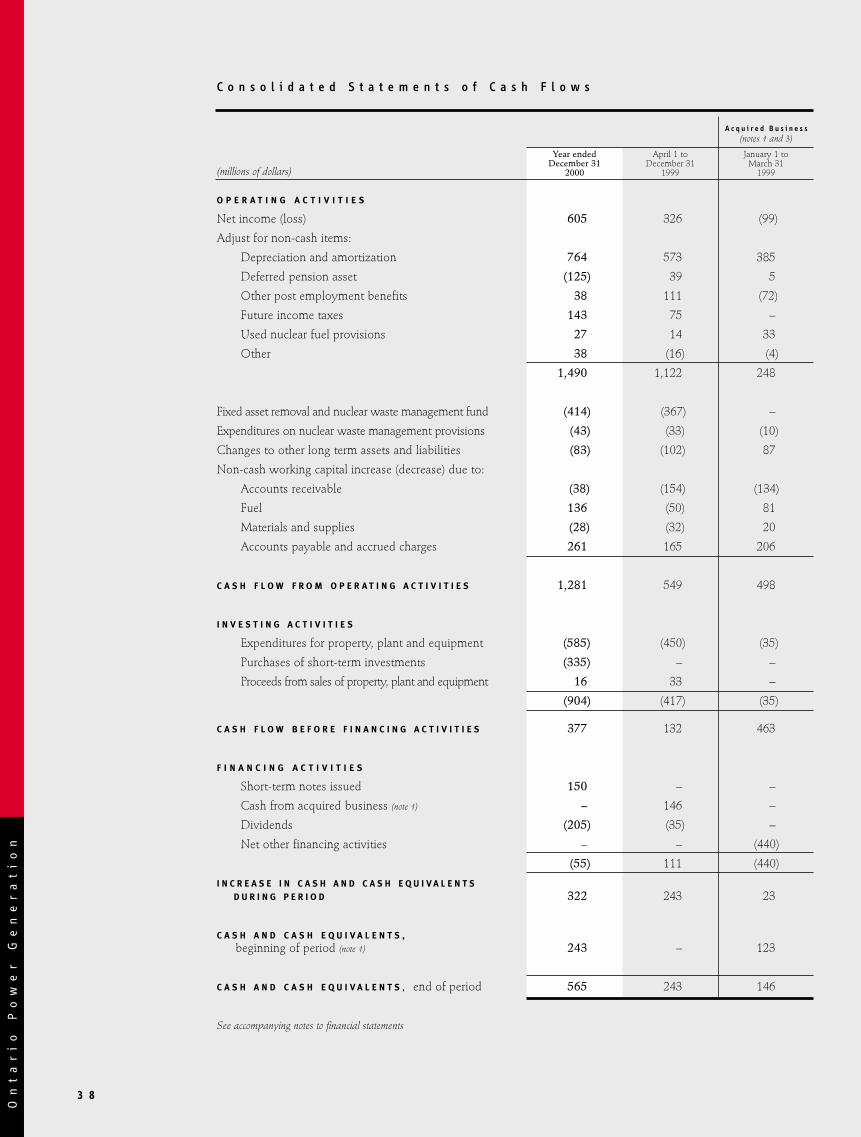
3 8
O P E R A T I N G A C T I V I T I E S
Net income (loss) 605 326 (99)
Adjust for non-cash items:
Depreciation and amortization 764 573 385
Deferred pension asset (125) 39 5
Other post employment benefits 38 111 (72)
Future income taxes 143 75 –
Used nuclear fuel provisions 27 14 33
Other 38 (16) (4)
1,490 1,122 248
Fixed asset removal and nuclear waste management fund (414) (367) –
Expenditures on nuclear waste management provisions (43) (33) (10)
Changes to other long term assets and liabilities (83) (102) 87
Non-cash working capital increase (decrease) due to:
Accounts receivable (38) (154) (134)
Fuel 136 (50) 81
Materials and supplies (28) (32) 20
Accounts payable and accrued charges 261 165 206
C A S H F L O W F R O M O P E R A T I N G A C T I V I T I E S 1,281 549 498
I N V E S T I N G A C T I V I T I E S
Expenditures for property, plant and equipment (585) (450) (35)
Purchases of short-term investments (335) – –
Proceeds from sales of property, plant and equipment 16 33 –
(904) (417) (35)
C A S H F L O W B E F O R E F I N A N C I N G A C T I V I T I E S 377 132 463
F I N A N C I N G A C T I V I T I E S
Short-term notes issued 150 – –
Cash from acquired business (note 1) – 146 –
Dividends (205) (35) –
Net other financing activities – – (440)
(55) 111 (440)
I N C R E A S E I N C A S H A N D C A S H E Q U I V A L E N T SD U R I N G P E R I O D 322 243 23
C A S H A N D C A S H E Q U I V A L E N T S ,beginning of period (note 1) 243 – 123
C A S H A N D C A S H E Q U I V A L E N T S , end of period 565 243 146
See accompanying notes to financial statements
C o n s o l i d a t e d S t a t e m e n t s o f C a s h F l o w s
A c q u i r e d B u s i n e s s(notes 1 and 3)
(millions of dollars)
Year ended December 31
2000
January 1 to March 31
1999
April 1 to December 31
1999
On
ta
ri
o
Po
we
r
Ge
ne
ra
ti
on
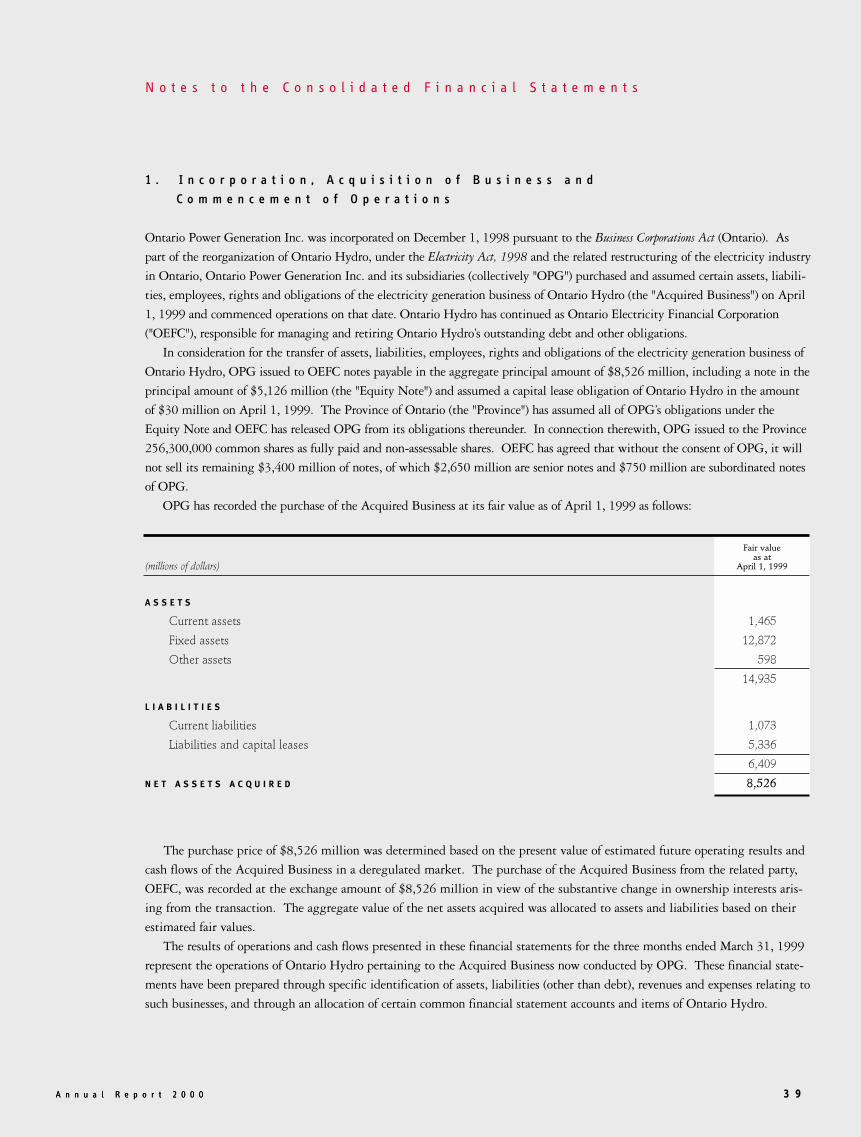
A n n u a l R e p o r t 2 0 0 0 3 9A n n u a l R e p o r t 2 0 0 0
1 . I n c o r p o r a t i o n , A c q u i s i t i o n o f B u s i n e s s a n d
C o m m e n c e m e n t o f O p e r a t i o n s
Ontario Power Generation Inc. was incorporated on December 1, 1998 pursuant to the Business Corporations Act (Ontario). As
part of the reorganization of Ontario Hydro, under the Electricity Act, 1998 and the related restructuring of the electricity industry
in Ontario, Ontario Power Generation Inc. and its subsidiaries (collectively "OPG") purchased and assumed certain assets, liabili-
ties, employees, rights and obligations of the electricity generation business of Ontario Hydro (the "Acquired Business") on April
1, 1999 and commenced operations on that date. Ontario Hydro has continued as Ontario Electricity Financial Corporation
("OEFC"), responsible for managing and retiring Ontario Hydro’s outstanding debt and other obligations.
In consideration for the transfer of assets, liabilities, employees, rights and obligations of the electricity generation business of
Ontario Hydro, OPG issued to OEFC notes payable in the aggregate principal amount of $8,526 million, including a note in the
principal amount of $5,126 million (the "Equity Note") and assumed a capital lease obligation of Ontario Hydro in the amount
of $30 million on April 1, 1999. The Province of Ontario (the "Province") has assumed all of OPG’s obligations under the
Equity Note and OEFC has released OPG from its obligations thereunder. In connection therewith, OPG issued to the Province
256,300,000 common shares as fully paid and non-assessable shares. OEFC has agreed that without the consent of OPG, it will
not sell its remaining $3,400 million of notes, of which $2,650 million are senior notes and $750 million are subordinated notes
of OPG.
OPG has recorded the purchase of the Acquired Business at its fair value as of April 1, 1999 as follows:
The purchase price of $8,526 million was determined based on the present value of estimated future operating results and
cash flows of the Acquired Business in a deregulated market. The purchase of the Acquired Business from the related party,
OEFC, was recorded at the exchange amount of $8,526 million in view of the substantive change in ownership interests aris-
ing from the transaction. The aggregate value of the net assets acquired was allocated to assets and liabilities based on their
estimated fair values.
The results of operations and cash flows presented in these financial statements for the three months ended March 31, 1999
represent the operations of Ontario Hydro pertaining to the Acquired Business now conducted by OPG. These financial state-
ments have been prepared through specific identification of assets, liabilities (other than debt), revenues and expenses relating to
such businesses, and through an allocation of certain common financial statement accounts and items of Ontario Hydro.
N o t e s t o t h e C o n s o l i d a t e d F i n a n c i a l S t a t e m e n t s
A S S E T S
Current assets 1,465
Fixed assets 12,872
Other assets 598
14,935
L I A B I L I T I E S
Current liabilities 1,073
Liabilities and capital leases 5,336
6,409
N E T A S S E T S A C Q U I R E D 8,526
Fair valueas at
April 1, 1999(millions of dollars)
4 0
In particular, a portion of Ontario Hydro’s revenues and debt, and corresponding portion of related interest and other financial
expenses, have been allocated to the Acquired Business. The financial position and operating results of OPG differ significantly
from those of the Acquired Business prior to April 1, 1999 because of changes in the regulatory environment, financing and
other factors.
2 . R e s t r u c t u r i n g o f t h e O n t a r i o E l e c t r i c i t y I n d u s t r y
The restructuring of the electricity market in Ontario is being accomplished in two stages. The first stage, the Transition Period,
began on April 1, 1999 with the reorganization of Ontario Hydro and will end with the introduction of a competitive market for
electricity. The second stage, Open Access, is expected to begin in the fall of 2001 or spring of 2002. After Open Access, cus-
tomers will have access to the electricity supplier of their choice. The transmission and distribution system in Ontario will be
open to all users in a competitive marketplace.
The Province has adopted a framework for market power mitigation designed to address issues regarding OPG’s market posi-
tion in Ontario. Under these arrangements, OPG must reduce its control over specified sources of electricity generating capacity.
OPG must relinquish effective control of at least 4,000 MW of fossil generating capacity within 42 months of Open Access, with
the option of substituting up to 1,000 MW of hydroelectric generating capacity for an equal amount of fossil generating capacity.
Within 10 years of Open Access, OPG must reduce its effective control over generation capacity to a level that is no more than
35% of the overall Ontario market’s supply.
3 . S u m m a r y o f S i g n i f i c a n t A c c o u n t i n g P o l i c i e s
Basis of Accounting
The financial statements of OPG are prepared in accordance with Canadian generally accepted accounting principles which
requires management to make estimates and assumptions that affect the reported amounts of assets, liabilities, revenues, expenses
and disclosure of contingent assets and liabilities.
Prior to April 1, 1999, Ontario Hydro was governed by the Power Corporation Act (Ontario), which provided it with broad
power to generate, supply and deliver electricity throughout Ontario. Ontario Hydro’s Board of Directors had the authority, for
rate setting purposes, to specify that an amount be included in its results of operations for a period that differed from the period
in which it would be recognized under generally accepted accounting principles for enterprises operating in a non-rate regulated
environment. In such cases, the accounting treatment was the same as its treatment for rate setting purposes.
Consolidation
The consolidated financial statements include the accounts of Ontario Power Generation Inc. and its subsidiaries. Ontario Power
Generation Inc. accounts for its interests in jointly controlled entities using the proportionate consolidation method.
Inventories
Fuel inventory is valued at the lower of average cost or net realizable value.
Materials and supplies are valued at the lower of average cost or net realizable value with the exception of specific replacement
parts which are unique to one of the nuclear or fossil generating stations. The cost of the unique replacement parts inventory is
charged to operations on a straight-line basis over the remaining life of the related facilities.
Fixed Assets and Depreciation
Property, plant and equipment acquired by OPG on April 1, 1999 were recorded at fair values. Additions to property, plant and
equipment subsequent to April 1, 1999 are recorded at cost. Interest costs incurred during construction are capitalized as part of
the cost of the asset.
Depreciation rates for the various classes of assets are based on their estimated service lives. Assets are depreciated on a straight-
line basis except for computers and transport and work equipment, which are depreciated on the declining balance basis.
Generating stations are depreciated on a straight-line basis over estimated service lives ranging from 25 to 40 years for nuclear gen-
erating stations, 40 to 50 years for fossil generating stations and 100 years for hydroelectric generating stations.
On
ta
ri
o
Po
we
r
Ge
ne
ra
ti
on
4 1A n n u a l R e p o r t 2 0 0 0
Administration and service facilities are depreciated on a straight-line basis over five to 50 years. Computers and transport
and work equipment assets are depreciated at rates varying between 9% and 40%. Any asset removal costs that have not been
specifically provided for in current or previous periods are also charged to depreciation expense.
Major application software acquisition costs are capitalized when future benefits are reasonably assured. These costs are amor-
tized over the useful life of the application software.
Fixed Asset Removal and Nuclear Waste Management
OPG recognizes a liability for fixed asset removal and nuclear waste management taking into account the time value of money
since it is able to estimate both the amount and timing of future cash expenditures on these activities. On April 1, 1999, when
the Acquired Business was transferred to OPG, the following costs were recognized as a liability:
• The present value of the costs of dismantling the nuclear and fossil production facilities at the end of their useful lives.
• The present value of the fixed cost portion of any nuclear waste management programs that are required regardless of volume of
waste generated.
• The present value of the variable cost portion of any nuclear waste management program to take into account actual waste vol-
umes incurred up to April 1, 1999.
Waste generated after April 1, 1999 will result in an increase to this liability with the corresponding amounts charged to
operations through depreciation and amortization expense or fuel expense. OPG funds the fixed asset removal and nuclear waste
management liability based on a pre-determined payment stream. This funding is segregated and used only for fixed asset
removal or nuclear waste management. It is OPG’s intent to have these funds held outside of OPG. Actual costs incurred to
operate waste management programs are applied against the segregated funds.
Revalorization arises because liabilities for used nuclear waste disposal and future fixed asset removal costs are stated in the
balance sheet on a net present value basis. The revalorization charge is the adjustment that results from restating the liabilities to
reflect the effect of inflation on the cost estimates and the time value of money effect on the future liabilities. The revalorization
charge is sensitive to movements in interest and inflation rates. Revalorization is disclosed in the financial statements as part of
depreciation and amortization.
Ongoing operating costs incurred for temporary storage of used nuclear fuel in wet fuel bays and dry storage containers during
station operating life are reflected as ongoing operating and capital expenditures.
Prior to April 1, 1999, the Acquired Business recognized decommissioning and nuclear waste liabilities over the expected
operating lives of the nuclear and fossil plants or as quantities of waste were produced. As a result, the liability as stated under
the Acquired Business was substantially lower than the liability recognized by OPG.
Revenue
Revenues are earned primarily through the sale of electricity to wholesale and large industrial customers in Ontario and to inter-
connected markets in the United States, Quebec and Manitoba. During the Transition Period, the average wholesale electricity
prices charged to Ontario customers remain fixed and customers are billed on a bundled basis. OPG distributes the funds to the
successor entities of Ontario Hydro under the terms of revenue allocation arrangements. The revenue allocation arrangements
provide relatively fixed amounts to the other businesses. The revenue allocation arrangements were designed so the undistributed
balance of funds would provide OPG with planned revenue of 4¢/kWh based on forecasted energy, together with a fixed amount
for ancillary services. Changes in forecast demand and customer mix will vary OPG’s actual revenue per kWh.
Prior to April 1, 1999, the Acquired Business operated in a rate-regulated environment. The electricity rates to customers
were established to provide power at cost. The revenues disclosed for the three months ended March 31, 1999 were determined
by an internal revenue allocation mechanism used by Ontario Hydro.
Non-energy revenues include earnings from services provided by OPG such as project management, engineering analysis and
design, construction and field maintenance of power generation facilities, the sale of various nuclear isotopes and generation by-
products, and foreign exchange gains and losses. OPG uses the percentage of completion method to recognize revenue on fixed
price contracts with a defined scope of work. For other contracts, revenue is recognized as services are provided or products are
delivered. Price escalation adjustments are recognized when they are established by specific contract terms. Commissions are rec-
ognized as earned.

4 2
Foreign Currency Translation
Current monetary assets and liabilities in foreign currencies are translated into Canadian currency at year-end rates of exchange.
Any resulting gain or loss is reflected in other revenue. Gains and losses on translation of foreign currency long-term liabilities
are deferred and amortized over the period to maturity.
Derivatives
OPG enters into various hedging instruments in order to manage foreign exchange risk through derivatives such as forward rate
agreements. When derivatives are used to manage OPG’s exposure to foreign currency movements, the revenue or expense is rec-
ognized over the life of the transaction in other revenue. Where the derivatives have been designated as a hedge, the realized
gains or losses are deferred and amortized over the life of the hedged assets or liabilities in other revenue.
Short-Term Investments
OPG enters into short-term purchases of securities under reverse repurchase agreements. Under these agreements, OPG commits
to resell the securities back to the original counterparty at a specified price and on a specified date. These securities are carried on
the balance sheet at their original cost. Reverse repurchase agreements conducted with the same counterparty are reported on a
net basis. Interest earned on reverse repurchase agreements is netted against interest expense in the Income Statement.
Income and Other Tax
OPG is responsible under the Electricity Act, 1998 for making payments in lieu of taxes (proxy taxes) to OEFC. These payments are
calculated in accordance with the Income Tax Act (Canada) and Corporations Tax Act (Ontario), and are modified by regulations made
under the Electricity Act, 1998. Prior to April 1, 1999 the Acquired Business was not required to pay income or capital taxes.
Effective January 1, 2000, OPG changed its method of accounting for income taxes from the deferral method to the liability
method of tax allocation as required by The Canadian Institute of Chartered Accountants’ Handbook Section 3465, Accounting for
Income Taxes. Under the liability method, future income taxes reflect the net tax effects of temporary differences between the car-
rying amounts of the assets and liabilities for financial reporting purposes and amounts used for income tax purposes. The defer-
ral method uses an income statement approach and records deferred taxes using current tax rates with no adjustment for subse-
quent tax rate changes. The cumulative effect as at January 1, 2000 of adopting these recommendations was not material.
Therefore, prior year financial statements have not been restated. For comparative 1999 periods, the deferred income tax compo-
nent of income tax expense is disclosed in the financial statements as future income taxes.
OPG is also required to make payments in lieu of property and school taxes on its generating assets. The amount is equal to
the difference between the amount it would be required to pay if the assets were privately owned and the amount of such taxes
that OPG actually pays on those assets.
Research and Development
Development costs related directly to the design or construction of a specific fixed asset are capitalized as part of the cost of the
asset. Research and development costs, which are incurred to discharge long-term obligations such as the nuclear waste manage-
ment liabilities, for which specific provision has already been made, are charged to the related liability. All other research and
development costs, which do not qualify for deferral, are charged to operations in the year incurred.
Pension and Other Post Employment Benefits
OPG’s post employment benefit programs include pension, group life insurance, health care, long-term disability and workers’
compensation benefits.
OPG accrues its obligations under pension and other post employment benefit (OPEB) plans. Pension fund assets are valued
using current market values. Pension and OPEB expenses and obligations are determined annually by independent actuaries
using management’s best estimates.
Pension and OPEB expenses consist of current service costs, interest and adjustments arising from plan amendments, changes
in assumptions, and experience gains or losses, which are amortized on a straight-line basis over the expected average remaining
service life of the employees covered by the plan. Pension and OPEB expenses are recorded during the year in which employees
render services.
On
ta
ri
o
Po
we
r
Ge
ne
ra
ti
on

4 3A n n u a l R e p o r t 2 0 0 0
4 . I n c o m e T a x e s
OPG became obligated to make payments in lieu of taxes on April 1, 1999. There were no income or capital taxes in the periods
prior to April 1, 1999 related to the Acquired Business.
The liability method of tax allocation was adopted by OPG effective January 1, 2000.
A reconciliation between the statutory and the effective rate of income taxes is as follows:
The sources of temporary differences and their tax effects on future income taxes were: the carrying value of fixed assets in excess
of tax value – $1,609 million (nine months ended December 31, 1999 – capital cost allowance in excess of depreciation – $66
million) and the tax value of other items in excess of carrying value – $1,391 million (nine months ended December 31, 1999 –
other items deducted for tax purposes in advance of accounting purposes – $9 million).
The amount of taxes paid for the year ended December 31, 2000, was $136 million (nine months ended December 31, 1999 –
$237 million).
Income before income taxes 1,058 615
Combined Canadian federal and provincial statutory incometax rates, including surtaxes 43.9 % 44.6 %
Statutory income tax rates applied to accounting income 464 274
Increase (decrease) in income taxes resulting from:
Large corporation tax in excess of surtax 25 19
Manufacturing and processing credit (7) (9)
Other 4 5
Reduction in future income taxes resulting from reduction in tax rates (33) –
(11) 15
Provision for income taxes 453 289
(millions of dollars)
April 1 to December 31
1999
Year ended December 31
2000
The provision for income taxes consists of:
Current 310 214
Future income tax expense relating to temporary differences 143 75
Provision for income taxes 453 289
Effective rate of income taxes 42.8 % 47.0 %
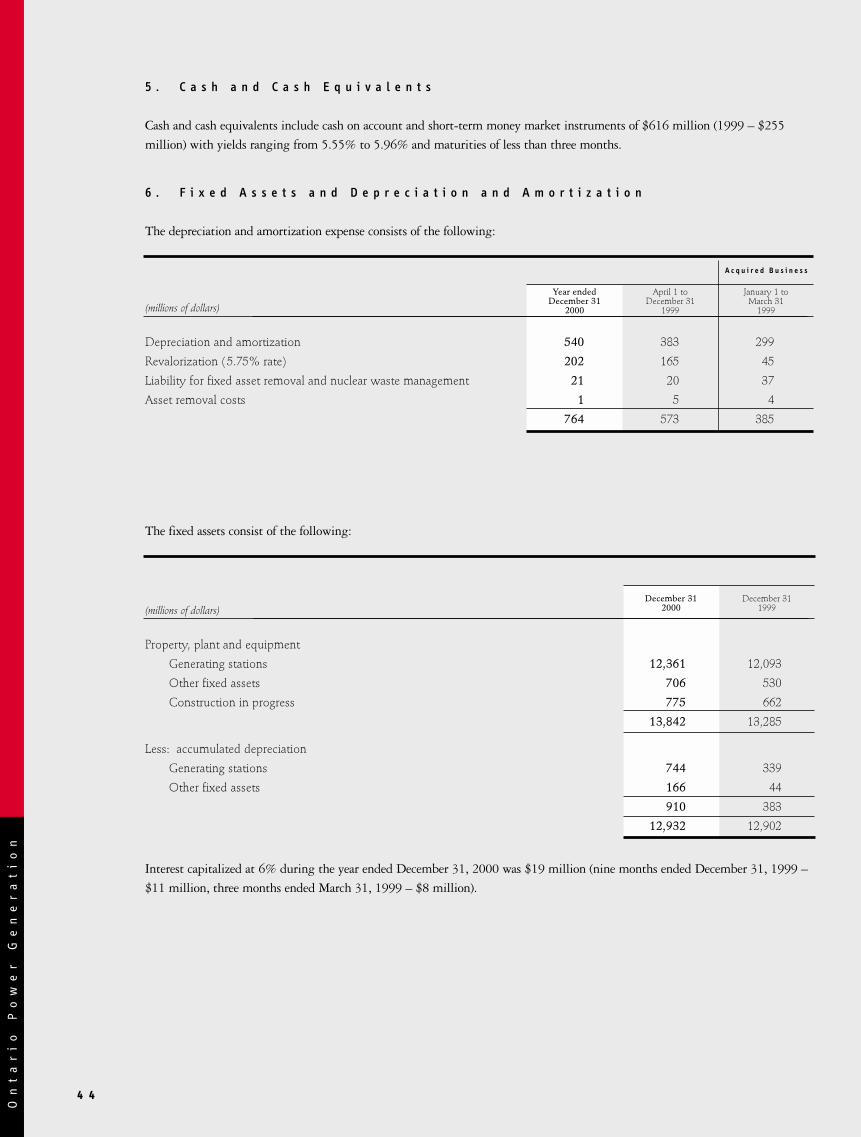
4 4
5 . C a s h a n d C a s h E q u i v a l e n t s
Cash and cash equivalents include cash on account and short-term money market instruments of $616 million (1999 – $255
million) with yields ranging from 5.55% to 5.96% and maturities of less than three months.
6 . F i x e d A s s e t s a n d D e p r e c i a t i o n a n d A m o r t i z a t i o n
The depreciation and amortization expense consists of the following:
The fixed assets consist of the following:
Interest capitalized at 6% during the year ended December 31, 2000 was $19 million (nine months ended December 31, 1999 –
$11 million, three months ended March 31, 1999 – $8 million).
Depreciation and amortization 540 383 299
Revalorization ( 5.75% rate) 202 165 45
Liability for fixed asset removal and nuclear waste management 21 20 37
Asset removal costs 1 5 4
764 573 385
(millions of dollars)
A c q u i r e d B u s i n e s s
Year ended December 31
2000
January 1 to March 31
1999
April 1 to December 31
1999
Property, plant and equipment
Generating stations 12,361 12,093
Other fixed assets 706 530
Construction in progress 775 662
13,842 13,285
Less: accumulated depreciation
Generating stations 744 339
Other fixed assets 166 44
910 383
12,932 12,902
(millions of dollars)December 31
1999December 31
2000
On
ta
ri
o
Po
we
r
Ge
ne
ra
ti
on

4 5A n n u a l R e p o r t 2 0 0 0
7 . F i x e d A s s e t R e m o v a l a n d N u c l e a r W a s t e M a n a g e m e n t
OPG’s nuclear generating stations produce nuclear waste in the form of radioactive nuclear fuel bundles along with low and inter-
mediate level radioactive waste. In addition, certain components of the plants become contaminated and therefore need to be
safely decommissioned. OPG is also required to decommission its non-nuclear facilities.
The net liability for fixed asset removal and nuclear waste management is as follows:
Liability for nuclear waste management
Used fuel disposal 3,320 3,295
Used fuel storage 937 719
Low level waste 223 213
Intermediate level waste 81 77
4,561 4,304
Liability for nuclear fixed asset removal 2,417 2,287
6,978 6,591
Liability for non-nuclear fixed asset removal 126 124
7,104 6,715
Less: provincial receivable 2,622 2,480
Fixed asset removal and nuclear waste management 4,482 4,235
(millions of dollars)December 31
1999December 31
2000
The accrual of fixed asset removal and nuclear waste management costs requires significant assumptions in their calculations,
since these programs run for several decades. The decommissioning of nuclear stations requires cash flow estimates to 2071.
The interest rate used for discounting was 5.75% (1999 – 5.75%) and cost escalation rates ranged from 2% to 3% (1999 –
2% to 4%).
Significant assumptions underlying many operational and technical factors are also used in the calculation of the accrued
liabilities and are subject to periodic review. Changes to these assumptions, as well as changes to assumptions on the timing
of the programs or the technology employed, could result in significant changes to the value of the accrued liabilities. With
programs of this duration and the evolving technology to handle the nuclear waste, there is a degree of risk surrounding the
measurement of the costs for these programs, which may increase or decrease over time.
Liability for Nuclear Waste Management Costs
The liability for nuclear waste management costs represents the cost of managing the highly radioactive used nuclear fuel
bundles as well as the cost of managing other low and intermediate level radioactive wastes generated by the nuclear sta-
tions. The current assumptions that have been used to establish the accrued used fuel costs include: long-term management
of the spent fuel bundles through deep geological disposal; an in-service date of 2025 for used nuclear fuel disposal facilities;
and an average transportation distance of 1,000 kilometres between nuclear generating facilities and the disposal facilities.
Alternatives to deep geological disposal may be technically feasible and will be explored. The increase in the accrued costs
for used nuclear fuel from current period operations is charged to fuel costs for the period.
The costs of low and intermediate level waste management include both the costs of managing such wastes during the
operation of the nuclear stations as well as the costs of ultimate long-term disposal of these wastes. The current assumptions
used to establish the accrued low and intermediate level waste management costs include: construction of a disposal facility
for low level waste to be in place by 2015; co-locating some of the intermediate level waste with low level waste starting in
2015; and co-locating the remainder of the intermediate level waste with used fuel starting in 2034. The increase in the
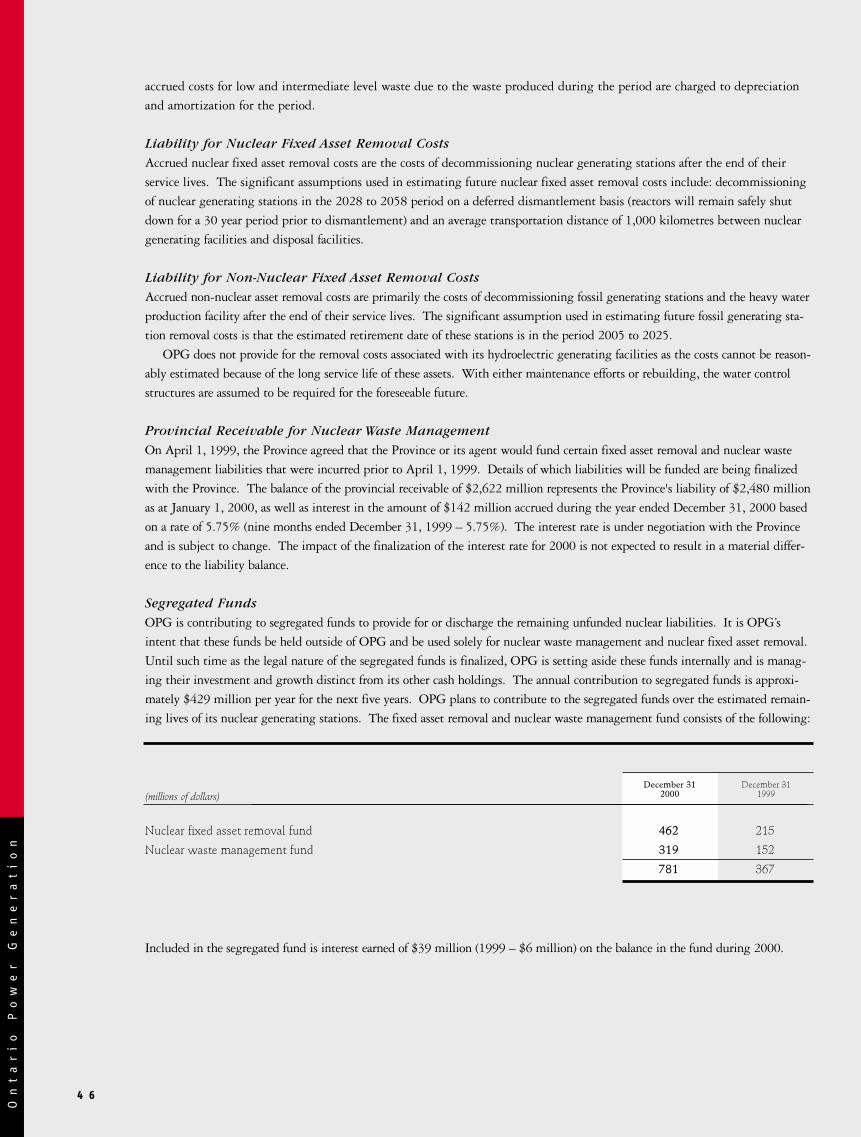
4 6
accrued costs for low and intermediate level waste due to the waste produced during the period are charged to depreciation
and amortization for the period.
Liability for Nuclear Fixed Asset Removal Costs
Accrued nuclear fixed asset removal costs are the costs of decommissioning nuclear generating stations after the end of their
service lives. The significant assumptions used in estimating future nuclear fixed asset removal costs include: decommissioning
of nuclear generating stations in the 2028 to 2058 period on a deferred dismantlement basis (reactors will remain safely shut
down for a 30 year period prior to dismantlement) and an average transportation distance of 1,000 kilometres between nuclear
generating facilities and disposal facilities.
Liability for Non-Nuclear Fixed Asset Removal Costs
Accrued non-nuclear asset removal costs are primarily the costs of decommissioning fossil generating stations and the heavy water
production facility after the end of their service lives. The significant assumption used in estimating future fossil generating sta-
tion removal costs is that the estimated retirement date of these stations is in the period 2005 to 2025.
OPG does not provide for the removal costs associated with its hydroelectric generating facilities as the costs cannot be reason-
ably estimated because of the long service life of these assets. With either maintenance efforts or rebuilding, the water control
structures are assumed to be required for the foreseeable future.
Provincial Receivable for Nuclear Waste Management
On April 1, 1999, the Province agreed that the Province or its agent would fund certain fixed asset removal and nuclear waste
management liabilities that were incurred prior to April 1, 1999. Details of which liabilities will be funded are being finalized
with the Province. The balance of the provincial receivable of $2,622 million represents the Province's liability of $2,480 million
as at January 1, 2000, as well as interest in the amount of $142 million accrued during the year ended December 31, 2000 based
on a rate of 5.75% (nine months ended December 31, 1999 – 5.75%). The interest rate is under negotiation with the Province
and is subject to change. The impact of the finalization of the interest rate for 2000 is not expected to result in a material differ-
ence to the liability balance.
Segregated Funds
OPG is contributing to segregated funds to provide for or discharge the remaining unfunded nuclear liabilities. It is OPG’s
intent that these funds be held outside of OPG and be used solely for nuclear waste management and nuclear fixed asset removal.
Until such time as the legal nature of the segregated funds is finalized, OPG is setting aside these funds internally and is manag-
ing their investment and growth distinct from its other cash holdings. The annual contribution to segregated funds is approxi-
mately $429 million per year for the next five years. OPG plans to contribute to the segregated funds over the estimated remain-
ing lives of its nuclear generating stations. The fixed asset removal and nuclear waste management fund consists of the following:
Included in the segregated fund is interest earned of $39 million (1999 – $6 million) on the balance in the fund during 2000.
Nuclear fixed asset removal fund 462 215
Nuclear waste management fund 319 152
781 367
(millions of dollars)December 31
1999December 31
2000
On
ta
ri
o
Po
we
r
Ge
ne
ra
ti
on

A n n u a l R e p o r t 2 0 0 0 4 7
Nuclear Risk-Sharing
OPG and senior staff at the Ontario Ministry of Finance reached an understanding on key principles for the development of a
nuclear liability agreement under which the Province or its agent would risk-share certain nuclear waste management costs in
the event that the estimated present value of these costs were to exceed certain thresholds. In order to implement the nuclear
liability agreement, OPG must negotiate a definitive agreement and obtain the necessary authorizations from the Province
including any necessary Orders in Council. Execution of this agreement would effectively limit OPG’s exposure to significant
increases in the estimated present value costs of nuclear waste management.
In addition to a nuclear liability agreement, the Province has also agreed to provide to the Canadian Nuclear Safety
Commission ("CNSC", formerly the Atomic Energy Control Board), as required by federal regulation, a guarantee that there
will be funds available to discharge 100% of the nuclear decommissioning and waste liabilities that exist at any point in time
within OPG. This would represent that portion of the liabilities that are not funded. In return, OPG will pay to the
Province a fee of 0.5% of the value of that guarantee. This guarantee is expected to commence in 2001, once the nuclear lia-
bility agreement is finalized.
Role of External Parties in the Management of Nuclear Wastes and Impact on Liabilities
In response to a December 1998 policy statement by the Federal Government, OPG continues its discussions with both the
Province and the Federal Government regarding the establishment of a Waste Management Organization ("WMO") to manage all
future operating expenditures for the life cycle management of nuclear waste. The exact structure and mandate of the WMO is
under review.
Segregated funds would likely be held independent of OPG with access to those funds managed and monitored by several par-
ties, including the CNSC. OPG has a requirement to contribute to those segregated funds in a pre-determined manner that will
be established based on estimates and assumptions calculated by external bodies. The Federal Government will likely introduce
draft legislation within the next year that would establish the role of a WMO and define government oversight responsibilities.
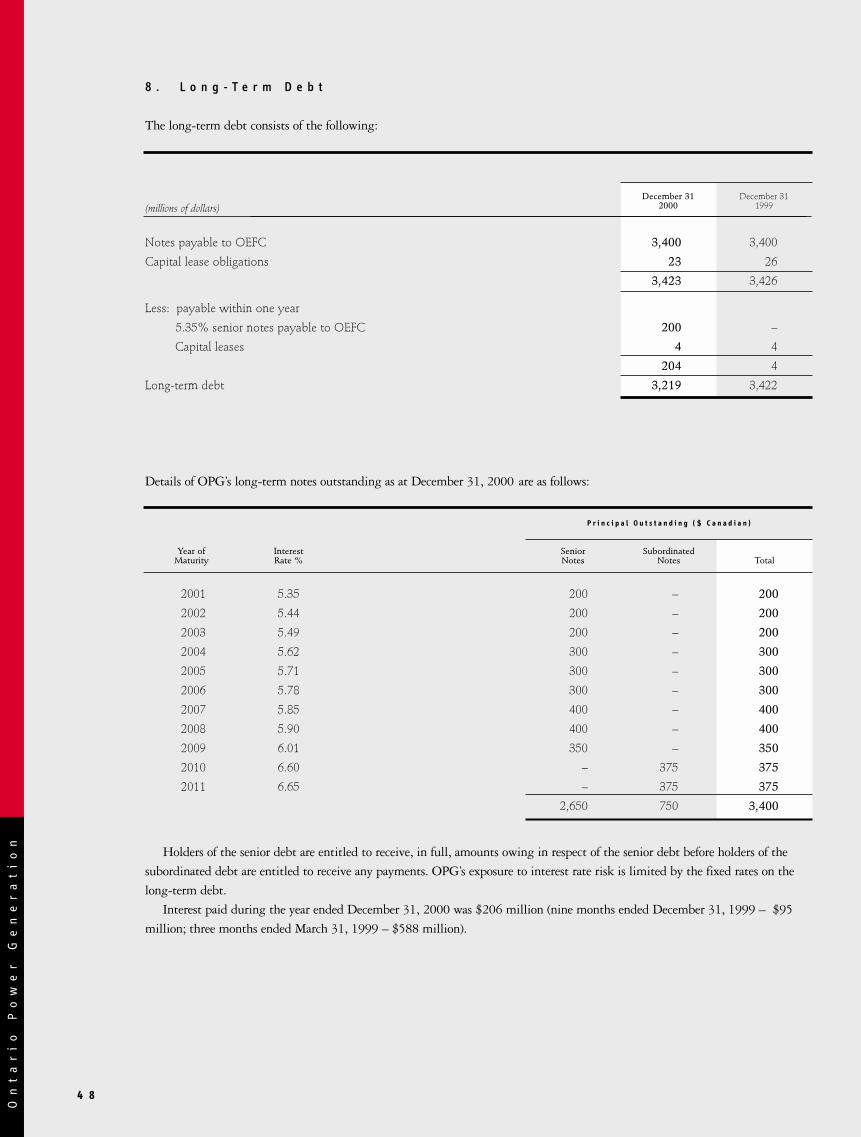
4 8
8 . L o n g - T e r m D e b t
The long-term debt consists of the following:
Details of OPG’s long-term notes outstanding as at December 31, 2000 are as follows:
Holders of the senior debt are entitled to receive, in full, amounts owing in respect of the senior debt before holders of the
subordinated debt are entitled to receive any payments. OPG’s exposure to interest rate risk is limited by the fixed rates on the
long-term debt.
Interest paid during the year ended December 31, 2000 was $206 million (nine months ended December 31, 1999 – $95
million; three months ended March 31, 1999 – $588 million).
Notes payable to OEFC 3,400 3,400
Capital lease obligations 23 26
3,423 3,426
Less: payable within one year
5.35% senior notes payable to OEFC 200 –
Capital leases 4 4
204 4
Long-term debt 3,219 3,422
(millions of dollars)December 31
1999December 31
2000
2001 5.35 200 – 200
2002 5.44 200 – 200
2003 5.49 200 – 200
2004 5.62 300 – 300
2005 5.71 300 – 300
2006 5.78 300 – 300
2007 5.85 400 – 400
2008 5.90 400 – 400
2009 6.01 350 – 350
2010 6.60 – 375 375
2011 6.65 – 375 375
2,650 750 3,400
P r i n c i p a l O u t s t a n d i n g ( $ C a n a d i a n )
SeniorNotes Total
SubordinatedNotes
Year of Maturity
InterestRate %
On
ta
ri
o
Po
we
r
Ge
ne
ra
ti
on

4 9A n n u a l R e p o r t 2 0 0 0
9 . S h o r t - T e r m C r e d i t F a c i l i t i e s
OPG maintains a credit facility for $600 million with certain Canadian chartered banks (Bank Credit Agreement) to fund work-
ing capital requirements and for general corporate purposes. This facility may be drawn upon in either Canadian or U.S. dollars
at varying rates based on certain benchmark rates, including a prime rate, a bankers’ acceptance rate, and a LIBOR rate.
OPG implemented a commercial paper (CP) program in 2000. Under the CP program, OPG has the authority to issue short-
term promissory notes up to a maximum outstanding principal amount of $600 million in Canadian currency, or the equivalent
thereof in United States currency. Notes issued under the CP program are secured under the Bank Credit Agreement. As at
December 31, 2000, OPG had issued $150 million of commercial paper at yields ranging from 5.81% to 5.89%.
1 0 . F a i r V a l u e o f F i n a n c i a l I n s t r u m e n t s , C r e d i t R i s k , a n d R i s k
M a n a g e m e n t I n s t r u m e n t s
Fair Value
The following table presents the carrying amounts and fair values of OPG's financial instruments:
(1) Year-end quoted market prices for specific or similar instruments are used to estimate the fair value of each class of financial instrument for which it is practical to estimate that value. For derivative financial instruments, the fair value is determined using pricing models that take into account the current value of the underlying instruments, the time value of money, andmid-market yield curve and volatility factors. The carrying values of cash, short-term investments, accounts receivable, bank indebtedness, short-term notes payable and accounts payableapproximate fair value because of the short maturity of those instruments.
F I N A N C I A L A S S E T S
Cash and cash equivalents 565 565 243 243
Short-term investments 335 335 – –
Accounts receivable 968 968 930 930
Fixed asset removal and nuclear waste
management fund 781 803 367 367
Long-term accounts receivable and other assets 52 52 27 27
F I N A N C I A L L I A B I L I T I E S
Accounts payable and accrued charges 1,406 1,406 1,145 1,145
Short-term notes payable 150 150 – –
Long-term debt due within one year 204 204 4 4
Long-term debt 3,219 3,188 3,422 3,270
Long-term accounts payable and accrued charges 298 298 353 353
2 0 0 0 1 9 9 9
(millions of dollars)Carrying
ValueFair
Value(1)Carrying
ValueFair
Value(1)
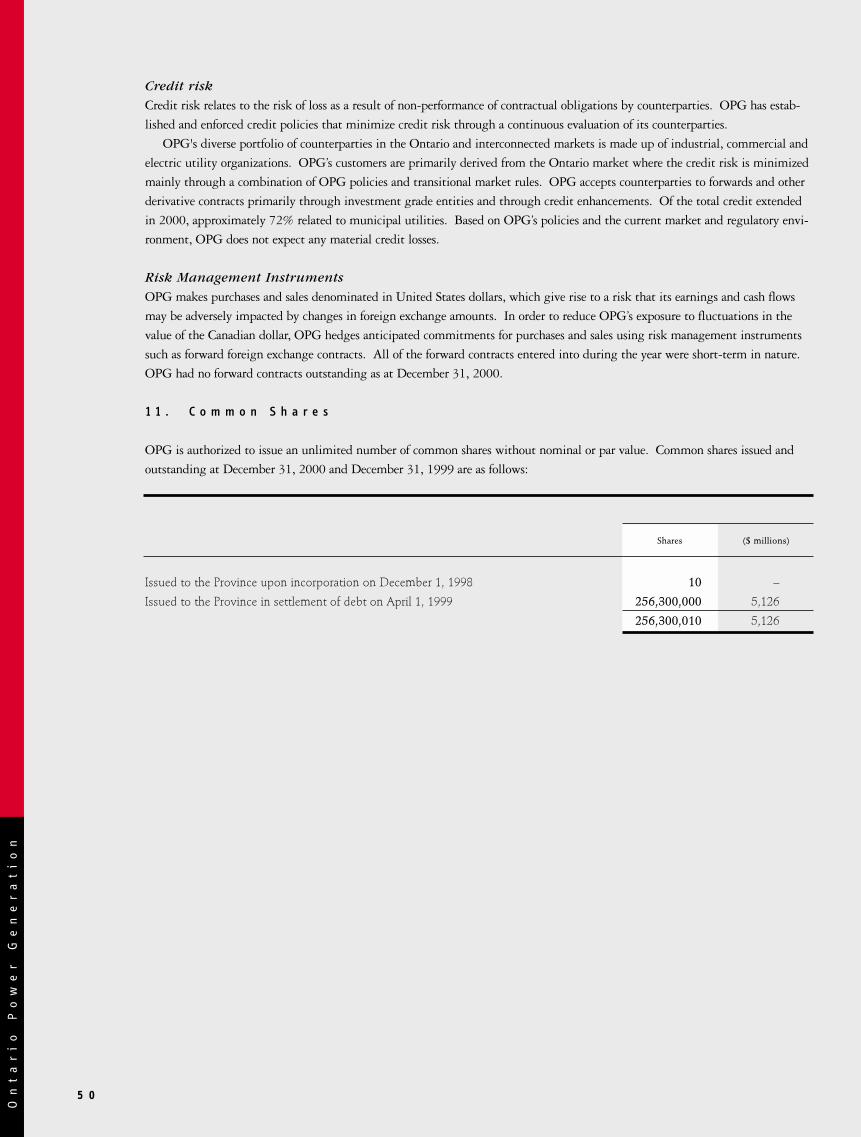
5 0
Credit risk
Credit risk relates to the risk of loss as a result of non-performance of contractual obligations by counterparties. OPG has estab-
lished and enforced credit policies that minimize credit risk through a continuous evaluation of its counterparties.
OPG's diverse portfolio of counterparties in the Ontario and interconnected markets is made up of industrial, commercial and
electric utility organizations. OPG’s customers are primarily derived from the Ontario market where the credit risk is minimized
mainly through a combination of OPG policies and transitional market rules. OPG accepts counterparties to forwards and other
derivative contracts primarily through investment grade entities and through credit enhancements. Of the total credit extended
in 2000, approximately 72% related to municipal utilities. Based on OPG’s policies and the current market and regulatory envi-
ronment, OPG does not expect any material credit losses.
Risk Management Instruments
OPG makes purchases and sales denominated in United States dollars, which give rise to a risk that its earnings and cash flows
may be adversely impacted by changes in foreign exchange amounts. In order to reduce OPG’s exposure to fluctuations in the
value of the Canadian dollar, OPG hedges anticipated commitments for purchases and sales using risk management instruments
such as forward foreign exchange contracts. All of the forward contracts entered into during the year were short-term in nature.
OPG had no forward contracts outstanding as at December 31, 2000.
1 1 . C o m m o n S h a r e s
OPG is authorized to issue an unlimited number of common shares without nominal or par value. Common shares issued and
outstanding at December 31, 2000 and December 31, 1999 are as follows:
Issued to the Province upon incorporation on December 1, 1998 10 –
Issued to the Province in settlement of debt on April 1, 1999 256,300,000 5,126
256,300,010 5,126
($ millions)Shares
On
ta
ri
o
Po
we
r
Ge
ne
ra
ti
on

5 1A n n u a l R e p o r t 2 0 0 0
1 2 . R e l a t e d P a r t y T r a n s a c t i o n s
OPG, the Province, and the other successor entities of Ontario Hydro, which include Hydro One Inc. ("Hydro One"),
Independent Electricity Market Operator ("IMO"), OEFC, and Ontario Electricity Pension Services Corporation ("OEPSC"),
which manages the pension fund on behalf of OPG, became related parties as of April 1, 1999. Prior to April 1, 1999, the
Province was a related party to Ontario Hydro and its fully integrated business units.
The transactions between OPG and related parties are in the normal course of business under normal trade terms. These
transactions are summarized below:
For the year ended December 31, 2000, payments to the Province for water rentals were $117 million (nine months ended
December 31, 1999 – $90 million, three months ended March 31, 1999 – $30 million). Payments to the Province for the debt
guarantee fee were nil for the year ended December 31, 2000 (nine months ended December 31, 1999 – nil, three months
ended March 31, 1999 – $31 million).
As at December 31, 2000, OPG had $93 million of related party receivables due from Hydro One (1999 – $90 million), $9
million of related party receivables due from the IMO (1999 – $8 million) and $2 million of related party receivables due from
OEPSC (1999 – $1 million). Related party payables due to Hydro One were $15 million as at December 31, 2000 (1999 –
$13 million).
1 3 . R e s e a r c h a n d D e v e l o p m e n t
For the year ended December 31, 2000, $39 million (nine months ended December 31, 1999 – $19 million, three months
ended March 31, 1999 – $15 million) of research and development expenses were charged to operations, and there were no
charges to accrued liabilities (nine months ended December 31,1999 – $10 million, three months ended March 31, 1999 – $2
million). Development costs of $6 million were capitalized (nine months ended December 31, 1999 – $2 million, three
months ended March 31, 1999 – nil).
1 4 . S e g m e n t e d I n f o r m a t i o n
OPG operates as a single segment business generating electricity in Ontario. Substantially all sales are in Canada. Electricity
sales to the United States were $273 million for the year ended December 31, 2000 (nine months ended December 31, 1999 –
$200 million; three months ended March 31, 1999 - $10 million). Sales to two customers represent 31% of total revenue for
the year ended December 31, 2000 (nine months ended December 31, 1999 - 30%) and 26% of accounts receivable as at
December 31, 2000 (nine months ended December 31, 1999 – 25%).
H Y D R O O N E
Electricity sales 867 – 640 –
Services 16 92 45 40
I M O
Ancillary services 102 – 75 –
O E P S C
Services 16 – 10 –
1,001 92 770 40
Y e a r e n d e d D e c e m b e r 3 1 , 2 0 0 0
(millions of dollars) RevenuesPurchasesRevenues Purchases
A p r i l 1 t o D e c e m b e r 3 1 , 1 9 9 9

5 2
1 5 . C o n t i n g e n c i e s a n d C o m m i t m e n t s
Municipal Electric Utilities (MEU)
On April 24, 1997, three MEUs (the "Applicants") issued a notice of application against Ontario Hydro in the Ontario Court
(General Division) (the "MEU Litigation"). The MEU Litigation has been certified as a class proceeding on behalf of all MEUs
in Ontario. The Applicants seek declarations that certain rates and pricing options offered by Ontario Hydro to corporations
contravened the provisions of the Power Corporation Act, (Ontario) and that these rates and pricing options improperly increased
costs to the MEUs that purchase their power from OPG. They seek recovery of the increased costs in the amount of approxi-
mately $145 million and a declaration that Ontario Hydro improperly diverted, from miscellaneous revenues, monies, in an
indeterminate amount, which should have been used to reduce the cost of power supplied to these MEUs. The Applicants are
also seeking declarations that Ontario Hydro breached legislative provisions prescribing the operation of the Reserve for
Stabilization of Rates and Contingencies and an equity account of Ontario Hydro known as the accumulated debt retirement
appropriation (the "ADR account"), and an order requiring repayment to the ADR account in the amount of $5,050 million.
The Province will indemnify OPG from and against all claims relating to the creation, treatment, payment to or from or other
dealings with the ADR account, and the financial statements of Ontario Hydro in relation to the ADR account including any
amount relating to any judgment, settlement or other payment in connection with the MEU Litigation, subject to a $20 mil-
lion deductible amount.
Request for Judicial Review
In May 1999, an application was commenced by the Inverhuron & District Ratepayers Association ("IDRA") in the Federal
Court Trial Division, requesting judicial review of the decisions of the federal Minister of the Environment, the Minister of
Fisheries and Oceans and the CNSC with regard to the Bruce used fuel dry storage facility project. The goal of the application
was to overturn the decisions pursuant to the Canadian Environmental Assessment Act ("CEAA") that would allow the project to
proceed. The application also sought to have the project referred to a review panel or mediator.
In May 2000, the Federal Court Trial Division refused the application. The IDRA appealed the Court's decision. Until the
Appeal Court renders its decision, OPG is unable to ascertain the impact of this application on its business, results of opera-
tions, financial condition or prospects. The Bruce used fuel storage facility is required within the next two to three years to
allow for the continued generation of nuclear power at the Bruce Nuclear site, given the remaining vacant storage available for
used fuel bundles.
Environment
OPG inherited legacy environmental obligations from the Acquired Business. A provision of $76 million was established as at
April 1, 1999 for such obligations. Charges of $3 million were made against this provision during the year ended December
31, 2000 (nine months ended December 31, 1999 – $6 million). Also, OPG’s current operations are subject to regulation with
respect to air, soil and water quality and other environmental matters by federal, provincial and local authorities. The cost of
obligations associated with current operations is provided for on an ongoing basis. Management believes it has made adequate
provision in its financial statements to meet OPG’s current environmental obligations.
On
ta
ri
o
Po
we
r
Ge
ne
ra
ti
on
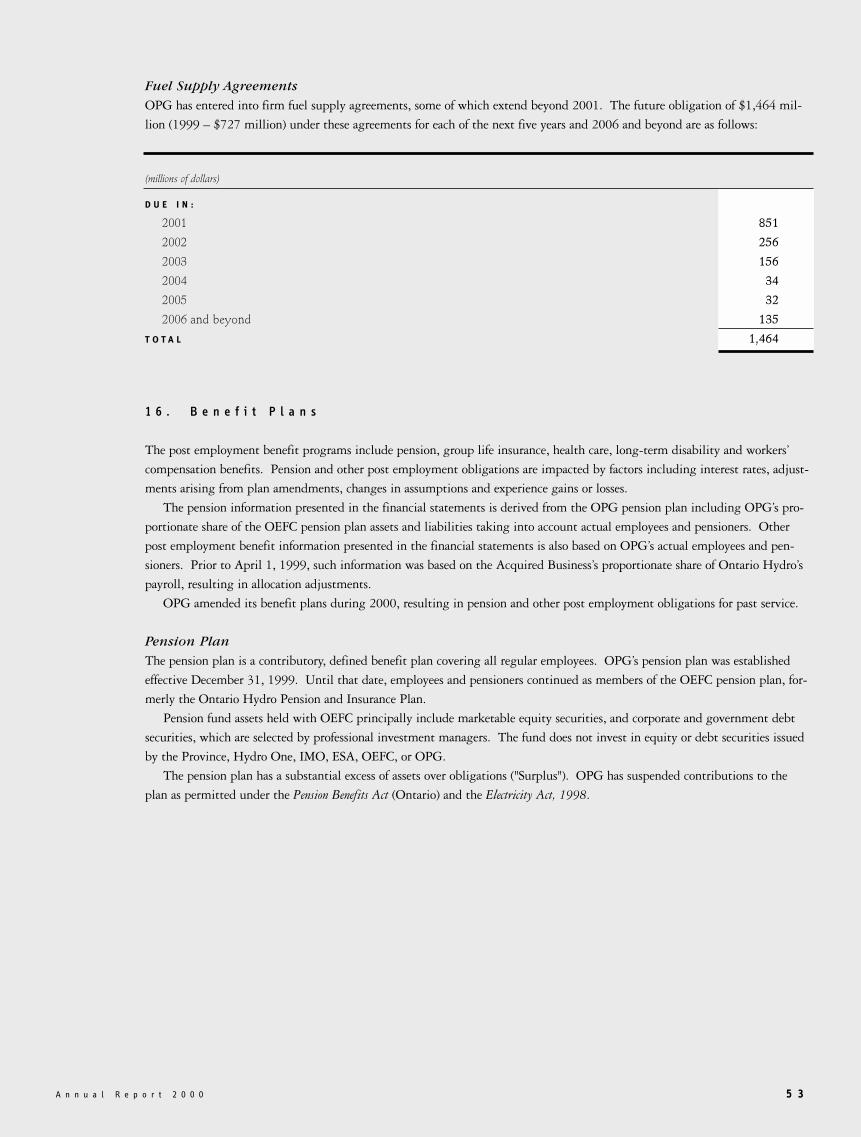
5 3A n n u a l R e p o r t 2 0 0 0
Fuel Supply Agreements
OPG has entered into firm fuel supply agreements, some of which extend beyond 2001. The future obligation of $1,464 mil-
lion (1999 – $727 million) under these agreements for each of the next five years and 2006 and beyond are as follows:
1 6 . B e n e f i t P l a n s
The post employment benefit programs include pension, group life insurance, health care, long-term disability and workers’
compensation benefits. Pension and other post employment obligations are impacted by factors including interest rates, adjust-
ments arising from plan amendments, changes in assumptions and experience gains or losses.
The pension information presented in the financial statements is derived from the OPG pension plan including OPG’s pro-
portionate share of the OEFC pension plan assets and liabilities taking into account actual employees and pensioners. Other
post employment benefit information presented in the financial statements is also based on OPG’s actual employees and pen-
sioners. Prior to April 1, 1999, such information was based on the Acquired Business’s proportionate share of Ontario Hydro’s
payroll, resulting in allocation adjustments.
OPG amended its benefit plans during 2000, resulting in pension and other post employment obligations for past service.
Pension Plan
The pension plan is a contributory, defined benefit plan covering all regular employees. OPG’s pension plan was established
effective December 31, 1999. Until that date, employees and pensioners continued as members of the OEFC pension plan, for-
merly the Ontario Hydro Pension and Insurance Plan.
Pension fund assets held with OEFC principally include marketable equity securities, and corporate and government debt
securities, which are selected by professional investment managers. The fund does not invest in equity or debt securities issued
by the Province, Hydro One, IMO, ESA, OEFC, or OPG.
The pension plan has a substantial excess of assets over obligations ("Surplus"). OPG has suspended contributions to the
plan as permitted under the Pension Benefits Act (Ontario) and the Electricity Act, 1998.
D U E I N :
2001 851
2002 256
2003 156
2004 34
2005 32
2006 and beyond 135
T O T A L 1,464
(millions of dollars)

5 4
P E N S I O N P L A N A S S U M P T I O N S
Expected return on plan assets 7.75 % 7.25 %
Rate used to discount future pension benefits 6.75 % 7.25 %
Salary schedule escalation rate 3.25 % 3.50 %
Rate of cost of living increase to pensions 2.50 % 2.50 %
Average remaining service life for employees (years) 11 12
C H A N G E I N P E N S I O N P L A N A S S E T S
Fair value of plan assets at beginning of year 7,274 7,908
Contributions by OPG – –
Contributions by the employees 33 49
Actual return on plan assets 527 1,018
Benefit payments (181) (245)
Administrative expense (11) (13)
Allocation adjustment – (1,443)
Fair value of plan assets at end of year 7,642 7,274
C H A N G E I N P R O J E C T E D P E N S I O N B E N E F I T O B L I G A T I O N
Projected benefit obligation at beginning of year 5,174 7,098
Current service cost 184 218
Past service costs 189 -
Interest on projected benefit obligation 389 359
Benefit payments (160) (192)
Net actuarial (gain) loss 440 (1,098)
Allocation adjustment – (1,211)
Projected benefit obligation at end of year 6,216 5,174
P E N S I O N P L A N S U R P L U S 1,426 2,100
R E C O N C I L I A T I O N O F P E N S I O N P L A N S U R P L U S
Pension plan surplus 1,426 2,100
Unamortized net actuarial (gain) loss (957) (1,584)
Unamortized past service costs 172 -
Deferred pension asset 641 516
(millions of dollars)December 31
1999 December 31
2000
Information about OPG’s pension plan is as follows:
On
ta
ri
o
Po
we
r
Ge
ne
ra
ti
on
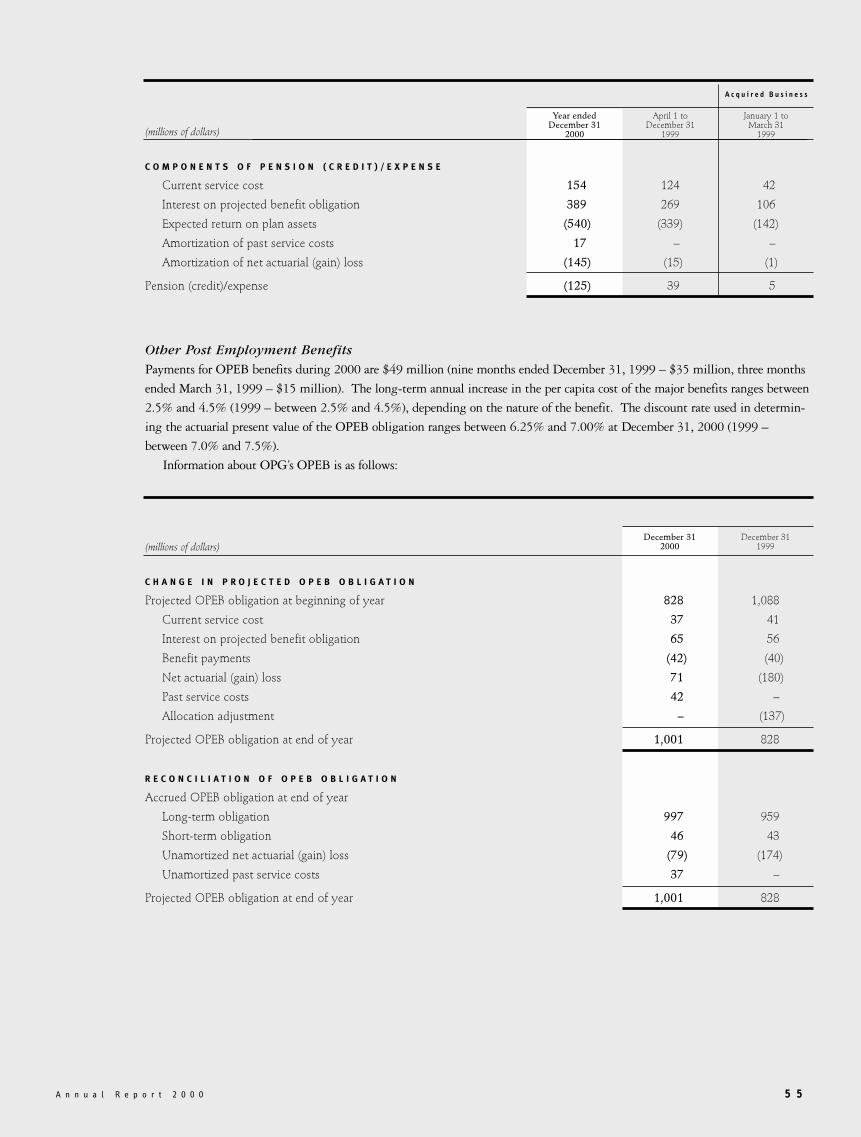
5 5A n n u a l R e p o r t 2 0 0 0
Other Post Employment Benefits
Payments for OPEB benefits during 2000 are $49 million (nine months ended December 31, 1999 – $35 million, three months
ended March 31, 1999 – $15 million). The long-term annual increase in the per capita cost of the major benefits ranges between
2.5% and 4.5% (1999 – between 2.5% and 4.5%), depending on the nature of the benefit. The discount rate used in determin-
ing the actuarial present value of the OPEB obligation ranges between 6.25% and 7.00% at December 31, 2000 (1999 –
between 7.0% and 7.5%).
Information about OPG’s OPEB is as follows:
C O M P O N E N T S O F P E N S I O N ( C R E D I T ) / E X P E N S E
Current service cost 154 124 42
Interest on projected benefit obligation 389 269 106
Expected return on plan assets (540) (339) (142)
Amortization of past service costs 17 – –
Amortization of net actuarial (gain) loss (145) (15) (1)
Pension (credit)/expense (125) 39 5
(millions of dollars)
A c q u i r e d B u s i n e s s
Year ended December 31
2000
January 1 to March 31
1999
April 1 to December 31
1999
C H A N G E I N P R O J E C T E D O P E B O B L I G A T I O N
Projected OPEB obligation at beginning of year 828 1,088
Current service cost 37 41
Interest on projected benefit obligation 65 56
Benefit payments (42) (40)
Net actuarial (gain) loss 71 (180)
Past service costs 42 –
Allocation adjustment – (137)
Projected OPEB obligation at end of year 1,001 828
R E C O N C I L I A T I O N O F O P E B O B L I G A T I O N
Accrued OPEB obligation at end of year
Long-term obligation 997 959
Short-term obligation 46 43
Unamortized net actuarial (gain) loss (79) (174)
Unamortized past service costs 37 –
Projected OPEB obligation at end of year 1,001 828
(millions of dollars)December 31
1999 December 31
2000
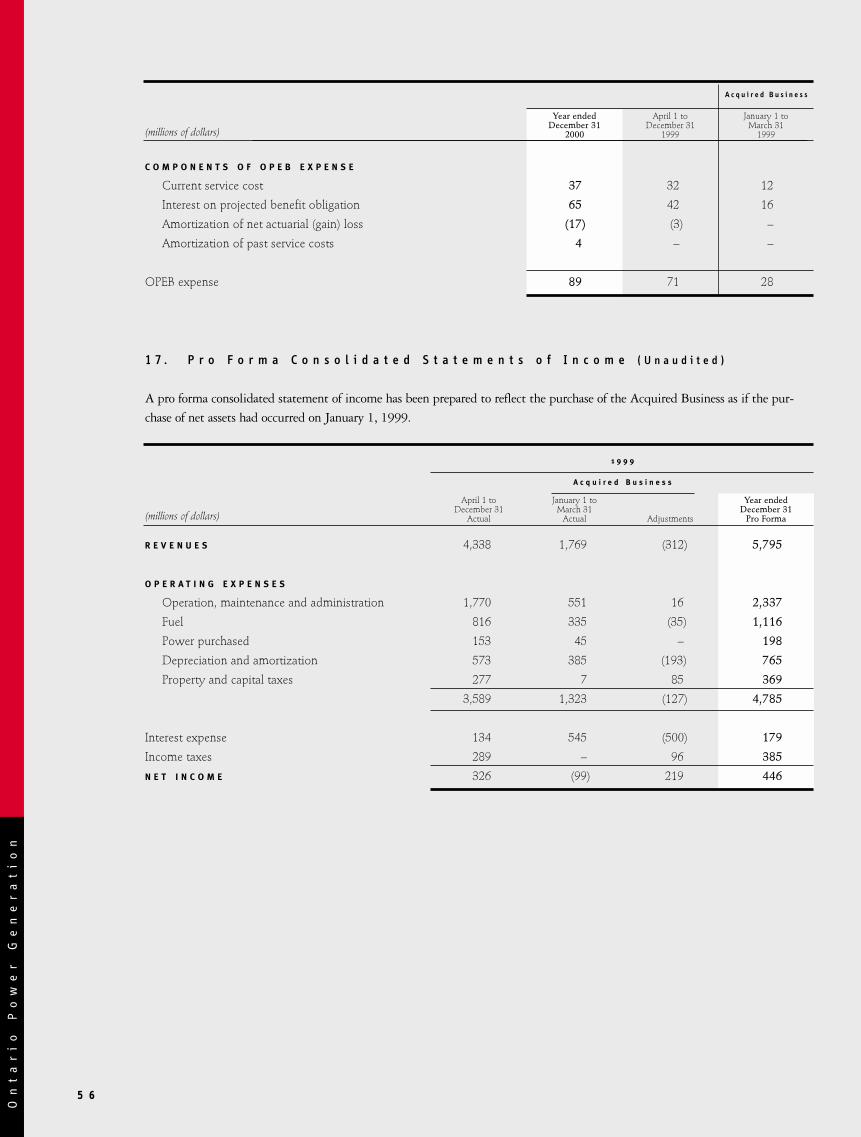
5 6
1 7 . P r o F o r m a C o n s o l i d a t e d S t a t e m e n t s o f I n c o m e ( U n a u d i t e d )
A pro forma consolidated statement of income has been prepared to reflect the purchase of the Acquired Business as if the pur-
chase of net assets had occurred on January 1, 1999.
C O M P O N E N T S O F O P E B E X P E N S E
Current service cost 37 32 12
Interest on projected benefit obligation 65 42 16
Amortization of net actuarial (gain) loss (17) (3) –
Amortization of past service costs 4 – –
OPEB expense 89 71 28
(millions of dollars)
A c q u i r e d B u s i n e s s
Year ended December 31
2000
January 1 to March 31
1999
April 1 to December 31
1999
R E V E N U E S 4,338 1,769 (312) 5,795
O P E R A T I N G E X P E N S E S
Operation, maintenance and administration 1,770 551 16 2,337
Fuel 816 335 (35) 1,116
Power purchased 153 45 – 198
Depreciation and amortization 573 385 (193) 765
Property and capital taxes 277 7 85 369
3,589 1,323 (127) 4,785
Interest expense 134 545 (500) 179
Income taxes 289 – 96 385
N E T I N C O M E 326 (99) 219 446
A c q u i r e d B u s i n e s s
(millions of dollars)
April 1 to December 31
Actual
January 1 to March 31
Actual Adjustments
Year ended December 31
Pro Forma
1 9 9 9
On
ta
ri
o
Po
we
r
Ge
ne
ra
ti
on

5 7A n n u a l R e p o r t 2 0 0 0
Basis of Presentation and Pro Forma Assumptions and Adjustments
The pro forma consolidated statement of income for the year ended December 31, 1999 is comprised of the consolidated state-
ment of income for OPG for the nine months ended December 31, 1999 and a pro forma consolidated statement of income for
the three months ended March 31, 1999 based on the consolidated statement of income of the Acquired Business. The pro forma
consolidated statement of income is not necessarily indicative of the results of operations that would have occurred had the trans-
actions taken place on the relevant dates, because of significant changes in the business and regulatory environments, financing
and other factors.
OPG is an unregulated commercial enterprise, whereas the Acquired Business was a rate-regulated entity. Since accounting
policies followed by rate regulated enterprises differ in some respects from those followed by non-rate regulated enterprises, cer-
tain of the liabilities and expenses recorded by the Acquired Business would have been recorded differently by OPG.
The pro forma consolidated statement of income for the year ended December 31, 1999 includes the following assumptions
and adjustments to the historical results of the Acquired Business:
Revenues: During the Transition Period of the Ontario electricity industry, all consumers will continue to pay their electricity
bills on a bundled basis. OPG's share of revenue out of this bundled pool in 1999 was planned to be 4¢/kWh for Ontario sales,
based on estimated demand for 1999, together with a fixed amount for ancillary services. The impact of this new revenue alloca-
tion arrangement is a reduction in revenue of $336 million for the three months ended March 31, 1999. Revenues were
increased by $24 million to reflect other adjustments including the reclassification of revenues that were previously recognized as
internal revenues and credited to operations, maintenance and administration expenses (OM&A), and foreign exchange losses pre-
viously recorded as interest expense.
OM&A: OM&A expenses for the three months ended March 31, 1999, have been adjusted by $16 million which includes the
reclassification of revenues previously recognized as internal revenues and an adjustment for certain grants in lieu of property taxes
that were previously included in OM&A expense.
Fuel: As part of the restructuring of Ontario Hydro, the obligation to fund the future costs of nuclear waste disposal and
nuclear plant decommissioning was transferred to OPG. OPG recognized the full committed liability of $6,317 million as at
April 1, 1999. As a result, the amount charged to operations for these periods with respect to the future obligation for these lia-
bilities, is less than the amount formerly charged to operations. Accordingly, for the three months ended March 31, 1999, fuel
expense has been adjusted by $35 million with respect to nuclear waste disposal.
Depreciation and amortization: The net book value of the fixed assets of the Acquired Business, which amounted to
$26,850 million, was adjusted by an amount of $13,978 million, reducing the net book value of fixed assets to their fair value of
$12,872 million as at April 1, 1999. As a result of the new asset base, depreciation and amortization expense has been reduced
by $177 million for the three months ended March 31, 1999. Other adjustments include a reduction in depreciation of $30 mil-
lion for the three months ended March 31, 1999, to reflect lower charges to current operations resulting from the recognition of
the full committed liability for nuclear plant decommissioning and an increase of $14 million related to revalorization.
Interest expense: Interest expense includes interest on debt financing. As a result of the new capitalization of OPG and lower
interest rates for OPG's long-term debt, interest expense decreased by $484 million for the three months ended March 31, 1999.
The Province no longer guarantees OPG's debt to third parties after April 1, 1999. Accordingly, OPG will not incur the provin-
cial debt guarantee fee previously included in interest expense. The elimination of this guarantee fee, which had an impact of $31
million for the three months ended March 31, 1999, is reflected in the net reduction in interest expense. An adjustment of $15
million for the three months ended March 31, 1999, was made to reclassify certain foreign exchange losses to other revenue.
Income, property and capital taxes: The Acquired Business was exempt from tax under the Income Tax Act (Canada) and the
Corporations Tax Act (Ontario). However, pursuant to the Electricity Act, 1998 OPG is required to pay to OEFC an amount
referred to as a "proxy tax". The proxy tax is generally equal to the amount of income and capital taxes OPG would be liable to
pay under the Income Tax Act (Canada) and the Corporations Tax Act (Ontario) if it were not exempt. The Electricity Act, 1998 also
provides that OPG is required to make additional payments in lieu of property tax each year to OEFC on its electricity generating
assets. Accordingly, the pro forma adjustments reflect the recognition of property and capital taxes of $85 million for the three
months ended March 31, 1999. In addition, proxy taxes in lieu of federal and Ontario income taxes plus the federal large corpo-
rations tax was recognized in the amount of $96 million for the three months ended March 31, 1999.

5 8
1 8 . D e c o n t r o l , J o i n t V e n t u r e s a n d P a r t n e r s h i p s
Leasing of Bruce Nuclear Generating Stations
On July 11, 2000, OPG entered into an agreement to lease its Bruce A and Bruce B nuclear generating facilities to Bruce Power
L.P. as part of OPG's decontrol commitment whereby it is required to reduce its share of generating capacity available in Ontario.
Bruce Power is an entity controlled by British Energy plc. The operating lease will have an initial lease term of approximately 18
years and will include options to extend the lease for up to an additional 25 years. The completion of the transaction, which is
expected to take place in 2001, is subject to usual closing conditions, including obtaining the necessary licences from the CNSC
and the Ontario Energy Board.
The lease agreement requires an initial payment of $625 million, payable in three installments. This includes $400 million,
subject to closing adjustments, payable to OPG on closing and $225 million payable in two equal installments of $112.5 mil-
lion, no later than four and six years from the date the transaction is completed. Bruce Power will also make annual lease pay-
ments during the initial lease term that will consist of both fixed and variable payments. In aggregate, the initial payment and
annual lease payments to OPG are estimated at $3.1 billion. OPG will continue to be responsible for nuclear waste and decom-
missioning liabilities at the Bruce site.
Information Technology Initiative
In November, OPG entered into an agreement to form a joint venture with Business Transformation Services Inc. ("BTS"), a
wholly-owned subsidiary of Cap Gemini Ernst & Young to transfer OPG’s Information Services Group ("ISG") to New Horizon
System Services Inc. ("New Horizon"), a joint venture that will be owned 51% by BTS and 49% by OPG. Approximately 600
employees within ISG will be transferred to New Horizon. The 10-year agreement is expected to close in early 2001 and
includes provisions that allow BTS to re-assess the joint venture agreement up to 2002.
1 9 . C o m p a r a t i v e F i g u r e s
Certain of the 1999 comparative figures have been reclassified to conform to the 2000 financial statement presentation.
On
ta
ri
o
Po
we
r
Ge
ne
ra
ti
on

5 9A n n u a l R e p o r t 2 0 0 0
O n t a r i o P o w e r G e n e r a t i o n G o v e r n a n c e
The Board of Ontario Power Generation consists of 12 direc-
tors. Ten directors are independent of management, including
the Chairman, Bill Farlinger, who is a non-executive chair.
Ron Osborne, President and CEO, and Graham Brown, Chief
Operating Officer, are members of the Board of Directors.
The Board of Directors is responsible for providing the
strategic direction and leadership for the company and has
established four permanent committees of the Board. The
Board meets approximately six times a year. Additional meet-
ings may be held if necessary.
A u d i t C o m m i t t e e
The Audit Committee is responsible for advising the Board
and making recommendations regarding publicly reported
financial information; the appropriateness of accounting poli-
cies and practices in accordance with Canadian generally
accepted accounting principles; the adequacy of the processes
for identifying and managing risks; the integrity of internal
controls; policies and practices relating to business ethics; the
appointment, terms of engagement and fees of the external
auditor; and the mandate and program of the internal auditor.
In addition, the Audit Committee may exercise, on behalf of
the Board, powers delegated to it with respect to financing
matters. The Committee meets four times a year. Additional
meetings may be held if necessary. Members: Richard
Thomson (Chair), Jalynn Bennett, Daniel Branda, David Kerr
and Brian Robbins.
H u m a n R e s o u r c e s a n d C o r p o r a t e
G o v e r n a n c e C o m m i t t e e
The Human Resources and Corporate Governance Committee
is responsible for advising the Board and making recommen-
dations regarding the appointment, annual review and remu-
neration of the President and Chief Executive Officer; succes-
sion planning; annual assessment of company performance and
incentive payments under the corporate Annual Incentive
Plan; pension plan strategy, including amendments and bene-
fits; and the annual review and remuneration, conducted by
the President and Chief Executive Officer, of senior executives.
The Committee is also responsible for the Board's governance
of the company, including recommending individuals for
appointment to the Board of Directors, the terms of reference
and membership for Board committees, and other initiatives
as required to ensure the Board delivers exemplary corporate
governance. The Committee meets four times a year.
Additional meetings may be held if necessary. Members:
Lynton Wilson (Chair), Paul Godfrey, Arthur Sawchuk and
Bill Farlinger.
E n v i r o n m e n t , H e a l t h a n d
S a f e t y C o m m i t t e e
The Environment, Health and Safety Committee is responsi-
ble for advising the Board and making recommendations
regarding the company's policies in the areas of the environ-
ment and health and safety; the adequacy of progress in
achieving compliance; the adequacy of processes for identify-
ing and managing environmental, health and safety risks and
opportunities for continual improvement; activities, trends
and developments pertaining to environmental, health, and
safety matters that have a significant impact on OPG's opera-
tions, assets and reputation; and the adequacy of processes to
ensure that the radiological risk to workers, the public and the
environment is acceptably low. The Committee meets four
times a year. Additional meetings may be held if necessary.
Members: David Kerr (Chair), Jalynn Bennett, Daniel Branda
and Brian Robbins.
N u c l e a r R e v i e w C o m m i t t e e
The Nuclear Review Committee is responsible for monitor-
ing the nuclear performance of the company, particularly
with respect to safety issues, and advising the Board on poli-
cies and strategies that ensure the safe and efficient operation
of the nuclear facilities; continual performance improvement
as measured against best practices in the international
nuclear community; compliance with existing laws and reg-
ulations that govern the nuclear facilities, including
Canadian Nuclear Safety Commission commitments; and the
scope of nuclear audit programs and the appointment of
external advisers and assessors. The Committee meets four
times a year. Additional meetings may be held if necessary.
Members: Arthur Sawchuk (Chair), Mark DeMichele,
Paul Godfrey and Brian Robbins.

6 0
On
ta
ri
o
Po
we
r
Ge
ne
ra
ti
on
O n t a r i o P o w e r G e n e r a t i o n I n c .
B o a r d o f D i r e c t o r s
M A R K D E M I C H E L E
Chairman & CEO,Urban Realty Partners
J A LY N N B E N N E T T
President,Jalynn H. Bennett& Associates Ltd.
D A N I E L B R A N D A
President,INTRIA-HP Corporation
G R A H A M B R O W N
Chief Operating Officer,Ontario Power Generation
R O N O S B O R N E
President & CEO,Ontario Power Generation
B I L L FA R L I N G E R
Chairman,Board of Directors
Ontario Power Generation
PA U L G O D F R E Y
President & CEO,Toronto Blue Jays
Baseball Club
D AV I D K E R R
President & CEO,Noranda Inc.
LY N T O N W I L S O N
Chairman,CAE Inc.
B R I A N R O B B I N S
President & CEO,EXCO Technologies Ltd.
A R T H U R S AW C H U K
Chairman,Manulife Financial
Corporation
R I C H A R D M U R R AY
T H O M S O N
Retired Chairman & CEO,The Toronto-Dominion Bank

6 1A n n u a l R e p o r t 2 0 0 0
O n t a r i o P o w e r G e n e r a t i o n I n c .
C o r p o r a t e O f f i c e r s a n d
S e n i o r M a n a g e m e n t
R I C H A R D D I C E R N I
Executive Vice President &Corporate Secretary
DAV I D D R I N K WAT E R
Executive Vice President,Law & Corporate Development
P I E R R E C H A R L E B O I S
Senior Vice President &Chief Nuclear Engineer
J O H N M AT H E R
Executive Vice President &Chief Information Officer
WAY N E B I N G H A M
Executive Vice President & Chief Financial Officer
G E N E P R E S T O N
Executive Vice President &Chief Nuclear Officer
G I S E L L E B R A N G E T
Vice President,Treasurer
J O H N M U R P H Y
Executive Vice President,Human Resources
J I M B U R P E E
Senior Vice President,Pickering A Generating Station
B R U C E B O L A N D
Senior Vice President, OPG Energy Markets
G R A H A M B R O W N
Chief Operating Officer
R O N O S B O R N E
President & Chief Executive Officer
B I L L FA R L I N G E R
Chairman

6 2
On
ta
ri
o
Po
we
r
Ge
ne
ra
ti
on
* Shown in Pickering Neighbourhood Walk photo on page 6 of Annual Report:
Back RowMaria Razo, Pickering Nuclear, Mohinder Grover, Pickering Nuclear, John Marczak, Pickering Nuclear, Andy Schwabe, Pickering Nuclear
Middle RowVanessa Hughes, Pickering Nuclear, Lawrence Celestin, Pickering Nuclear, Shabiki Celestin (Daughter ofLawrence Celestin), Vikas Suri, Darlington Nuclear, Kathy Peck, Pickering Nuclear, Dave Wallace, PickeringNuclear, Vince Chacinski, Pickering Nuclear, Katie Chacinski (Daughter of Vince Chacinski)
SeatedYvonne Sauvé, Pickering Nuclear, Cindy Kaye, Corporate Head Office, Eva Marczak, Pickering Nuclear, JackieWallace, Corporate Head Office, Amanda Wallace (Daughter of Dave and Jackie Wallace)

P L E A S E R E C Y C L E
Materials used in this report are environmentally friendly. Cover and text stocks are recycled and recyclable, with a minimum
of 10% post-consumer waste. Vegetable based inks have been used throughout. Ce rapport est également publié en français.
The head office of Ontario Power Generation Inc. is located at 700 University Avenue, Toronto, Ontario M5G 1X6;
telephone (416) 592-2555 or (877) 592-2555.
Visit Ontario Power Generation’s Internet site at www.opg.com
For more information on our products and services, visit our customer Web site at www.OPGdirect.com