
Annual Radiation Protection Report - epa.sa.gov.au · Olympic Dam BHP Billiton Limited ... This...
55
URANIUM OLYMPIC DAM Annual Radiation Protection Report July 2009 - June 2010
Transcript of Annual Radiation Protection Report - epa.sa.gov.au · Olympic Dam BHP Billiton Limited ... This...
URANIUM
OLYMPIC DAM
Annual Radiation Protection Report
July 2009 - June 2010

Olympic Dam
BHP Billiton Limited
Uranium CSG
ABN 99 007 835 761
A member of the BHP Billiton Group, which is headquartered in Australia
Registered Office: 600 Bourke Street, Melbourne, Victoria, 3000, Australia.
ABN 49 004 028 077

OLYMPIC DAM
Annual Radiation Protection Report July 2009 - June 2010
DISTRIBUTIONENVIRONMENT PROTECTION AUTHORITY (SA)
Director, Radiation Section (2 copies)
DEPARTMENT FOR ADMINISTRATIVE AND INFORMATION SERVICES
SafeWork SA
DEPARTMENT OF PRIMARY INDUSTRIES AND RESOURCES, SOUTH AUSTRALIA
Chief Inspector of Mines (2 copies)
BHP BILLITON URANIUM CSG
Manager – Corporate Affairs
BHP BILLITON OLYMPIC DAM President Uranium CSG
Vice President, Surface
Vice President, Services
Vice President, Mining
Vice President, HS
Manager, Mine Production
Manager, Mine Development
Manager, Fixed Plant and Infrastructure
Manager, Mine Technical Services
Manager, Concentrator & Hydromet
Manager, Smelter and Refinery Production
Manager, Surface Technology
Manager, Maintenance Processing
Manager, Smelter and Refinery Maintenance
Manager, Environment and Radiation
Superintendent Radiation and Occupational Hygiene
Radiation Safety Officer – Process
Senior Radiation Safety Officer - Mine
Ventilation Superintendent
Occupational Hygienist
Occupational Physician
Records Centre

This page has been intentionally left blank.

This Report has been reviewed by:
Senior Radiation Safety Officer – Process David Kruss
Senior Radiation Safety Officer – Mine James Algar
Superintendent Radiation & Occupational Hygiene Cameron Lawrence

This page has been intentionally left blank.

July 2009 - June 2010 Annual Radiation Protection Report
Table of Contents
1 INTRODUCTION ......................................................................................1
2 EMPLOYEE DOSE ASSESSMENT METHOD ........................................2 2.1 Exposure Calculation Methodology ................................................................2 2.1.1 Exposure Calculation at the Mine........................................................................2 2.1.2 Exposure calculation in the Metallurgical Plant ...................................................3 2.2 Exposure to Dose Calculations........................................................................4 3 Employee Doses.....................................................................................5 3.1 Doses to Mine Employees ................................................................................5 3.1.1 Descriptive Statistics ...........................................................................................5 3.1.2 Review of doses by work category ......................................................................6 3.1.3 Strategies for Dose Reduction...........................................................................21 3.1.4 Doses to Non-Designated Mine Employees......................................................21 3.1.5 Cumulative Five Year Dose...............................................................................24 3.2 Doses to Metallurgical Plant Employees.......................................................25 3.2.1 Descriptive Statistics .........................................................................................25 3.2.2 Review of Doses by Work Areas .......................................................................27 3.2.3 Strategies for Dose Reduction...........................................................................36 3.2.4 Doses to Non-Designated Employees...............................................................36 3.2.5 Cumulative Five Year Dose...............................................................................39 3.3 Annual Dose Trends........................................................................................41 3.4 Doses to Members of the Public ....................................................................42 3.5 Radiation Management Plan (RMP) ...............................................................43 4 CONCLUSION .......................................................................................44
APPENDIX A ....................................................................................................45
Page i

Annual Radiation Protection Report July 2009 - June 2010
List of Figures
Figure 1 - Annual Dose Distribution 2009/2010 for All Designated Employees - Mine .........................................................................................................5
Figure 2 – Doses, showing components, for Full Time Designated Mine Employees ...............................................................................................8
Figure 3 - Annual Dose Distribution for the Backfill Workgroup ......................................9 Figure 4 – Annual Dose Trends for the Backfill Workgroup ............................................9 Figure 5 – Annual Dose Distribution for the Core Processing Workgroup ....................10 Figure 6 – Annual Dose Trends for the Core Farm Workgroup ....................................10 Figure 7 – Annual Dose Distribution for the Development Workgroup..........................11 Figure 8 – Annual Dose Trends for the Development Workgroup ................................11 Figure 9 – Annual Dose Distribution for the Diamond Drilling Workgroup ....................12 Figure 10 – Annual Dose Trends for the Diamond Drilling Workgroup .........................12 Figure 11 – Annual Dose Distribution for the Electrician Workgroup ............................13 Figure 12 – Annual Dose Trends for the Electrician Workgroup ...................................13 Figure 13 – Annual Dose Distribution for the Fitter Workgroup.....................................14 Figure 14 – Annual Dose Trends for the Fitter Workgroup ...........................................14 Figure 15 – Annual Dose Distribution for the Surface Workers Workgroup ..................15 Figure 16 – Annual Dose Trends for the Surface Workers Workgroup.........................15 Figure 17 – Annual Dose Distribution for the Ore Handling Workgroup........................16 Figure 18 – Annual Dose Trends for the Ore Handling Workgroup ..............................16 Figure 19 – Annual Dose Distribution for the Production Charger Workgroup..............17 Figure 20 – Annual Dose Trends for the Production Charger Workgroup ....................17 Figure 21 – Annual Dose Distribution for the Production Driller Workgroup .................18 Figure 22 – Annual Dose Trends for the Production Driller Workgroup ........................18 Figure 23 – Annual Dose Distribution for the Raise Driller Workgroup .........................19 Figure 24 – Annual Dose Trends for the Raise Driller Workgroup ................................19 Figure 25 – Annual Dose Distribution for the Underground Services Workgroup .........20 Figure 26 – Annual Dose Trends for the Underground Services Workgroup................20 Figure 27 – Annual Dose Distribution for Non-Designated mine end employees .........22 Figure 28 – Average Dose Trends for Non-Designated Employees .............................23 Figure 29 – Annual Doses for Non-Designated employees, by source and by
Occupation .............................................................................................24 Figure 30 – Five Year Cumulative Dose Distribution Mine............................................25 Figure 31 – Annual Dose Distribution for all Metallurgical Plant employees .................27 Figure 32 – Annual dose components by workgroup ....................................................29 Figure 33 – Annual Dose Distribution for the Concentrator Workgroup ........................30 Figure 34 – Dose Trends for the Concentrator Workgroup ...........................................30 Figure 35 – Annual Dose Distribution for the Hydromet Workgroup .............................31 Figure 36 – Dose Trends for the Hydromet Workgroup ................................................31 Figure 37 – Annual Dose Distribution for the Smelter Workgroup ................................32 Figure 38 – Dose Trends for the Smelter Workgroup ...................................................32
Page ii

July 2009 - June 2010 Annual Radiation Protection Report
Figure 39 – Annual Dose Distribution for the Refinery Workgroup ...............................33 Figure 40 – Dose Trends for the Refinery Workgroup ..................................................33 Figure 41 – Annual Dose Distribution for the Maintenance/Services Workgroup .........34 Figure 42 – Dose Trends for the Maintenance/Services Workgroup ............................34 Figure 43 - Annual Dose Distribution for the Smelter Slag Handling Workgroup
Dose Histogram .....................................................................................35 Figure 44 – Dose Trends for the Smelter Slag Handling Workgroup............................35 Figure 45 – Average Dose to Non-designated Metallurgical Plant Employees.............37 Figure 46 – Annual Dose Distribution for Non-designated process plant employees ...38 Figure 47 - Non Designated Process plant dose break-up, by workgroup....................39 Figure 48 – 5 Year Cumulative Dose Distribution for Process Plant Employees..........40 Figure 49 – Mine Annual dose trend.............................................................................41 Figure 50 – Plant Annual Dose Trend...........................................................................42 Figure 51 – Total Dose Trend for Olympic Dam Village and Roxby Downs .................43
Page iii

Annual Radiation Protection Report July 2009 - June 2010
List of Tables
Table A – Statistics for designated employees, mine......................................................6 Table B – Statistics for Full Time Designated Mine Employees......................................7 Table C – Non Designated Mine Employee Statistics...................................................22 Table D – Five Year Stats .............................................................................................25 Table E – Statistics for designated employees, Metallurgical Plant ..............................26 Table F - Annual Dose Statistics by Work Areas, Full-Time Designated
Metallurgical Plant Employees ...............................................................28 Table G – Non-Designated Employees Metallurgical plant, Dose Statistics .................36 Table H – Dose Statistics For non-designated Plant employees ..................................38 Table I – Five Year Dose Statistics ...............................................................................41 Table J – Public Doses..................................................................................................42 Table K - Dust Dose Conversion Factors......................................................................45
Page iv
July 2009 - June 2010 Annual Radiation Protection Report
INTRODUCTION Page 1
1 INTRODUCTION This document is the annual report on radiation protection for BHP Billiton Olympic Dam Incorporation Pty Ltd and includes the following:
In fulfilment of clause 2.10.1, 3.8.1 and 3.10.1 of the Code of Practice and Safety Guide on Radiation Protection and Radioactive Waste Management in Mining and Processing 2005, employee dose assessments, dose calculation methodologies, dose parameters and dose conversion factors for the period 1st July 2009 to 30th June 2010 are presented. Individual personal doses and dose components for the period 1st July 2009 to 30th June 2010 are forwarded with this document on electronic media.

Annual Radiation Protection Report July 2009 - June 2010
Page 2 Exposure Calculation Methodology
2 EMPLOYEE DOSE ASSESSMENT METHOD
2.1 Exposure Calculation Methodology 2.1.1 Exposure Calculation at the Mine The main exposure pathways for Mine workers are inhalation of Radon Decay Products (RDP), irradiation by gamma radiation and inhalation of radioactive dust. Assessment of exposure from dust and RDP are based on employee time sheet/card information and measurements from the approved monitoring program.
Employee and contractor time card information is entered into one of the three time tracking databases [IRIS, SAP, Production Tracking Normal Time (Prodtrak_Normtime)] for either daily or monthly work periods. The site security database (CARDAX) is also used to determine the monthly average hours for individuals whose timesheets have not been logged into any of the other databases mentioned above. The information from CARDAX is converted into tables that can be easily imported into the IRIS database for dose calculation. Each database records employee name, employee number, occupation, date, work location and hours in location information.
Locations within the Mine are grouped into areas of ‘like air’ known as airways. The Senior Ventilation Engineer or their nominee, who is familiar with the underground environment, maintains the locations within the airways. Airways are segregated into weekly periods and new locations are mapped into their relevant airway this results in there being 13 weekly groupings each quarter covering the history of ventilation throughout the Mine.
The RDP concentration is then determined for each airway for each week using measurements from the approved monitoring program, which covers monitoring of most active work areas. For work airways not sampled in that week, an average is calculated. This average is calculated from all readings for that particular airway over the quarter.
Employee exposure to radioactive dust is calculated using quarterly occupation-based averages. The averages are obtained from monitoring performed under the approved monitoring program. An occupation-based dust concentration level is then allocated to each occupation.
The occupation-based dust concentration information and location-based RDP concentration information is then combined with the employee time card information to derive individual exposure data. Dust exposure is measured in units of Becquerel-hours per cubic metre (Bq.hr/m3) and RDP concentration is measured in units of micro Joule-hours per cubic metre (µJ.hr/m3). Exposure details are combined to give quarterly personal exposures.
The entire procedure is processed using a software program known as the Integrated Radiation Information System (IRIS). The system is designed such that the Radiation Safety Officer is required to perform checks in each step of the process. This is in addition to a built-in auditing system within the program.
Respiratory protection in the form of airstream helmets are available for all employees and are worn when tasks are identified as requiring them. They are typically worn by some workgroups such as Ore Handling Beltrunners and Services Ventilation Crew. Airstream helmets are also mandatory for identified specific tasks or in certain conditions. Routine and non-routine use of airstream helmets is monitored and logged.
July 2009 - June 2010 Annual Radiation Protection Report
EMPLOYEE DOSE ASSESSMENT METHOD Page 3
No respiratory protection factors are used in these exposure calculations, and therefore actual individual exposures will be lower than reported.
Exposure to gamma radiation is assessed using Thermo Luminescent Dosimeters (TLD’s) badges from the Australian Radiation Protection and Nuclear Safety Agency (ARPANSA) Personal Monitoring Service. TLD badges are worn for a period of three months; non-badge wearers are allocated an occupation-based average exposure.
2.1.2 Exposure calculation in the Metallurgical Plant The main exposure pathways for Metallurgical Plant workers are inhalation of radioactive dust and fumes, and irradiation by gamma radiation. Assessment of exposure from dust and fumes is based on employee time sheet/card information and measurements from the approved monitoring program. Dust exposure in the Metallurgical Plant may involve exposure to different types of dust. These dusts will differ in particle size and radionuclide composition, which will produce different dust Dose Conversion Factors (DCF's). The table of DCF’s is given in Appendix A.
Information from employee and contractor time cards or employee activity sheets is entered into IRIS via one of the three databases [IRIS (Manual), SAP, Prodtrak] containing daily or monthly information, depending on work area and occupation. From these databases a file of unique locations/occupations is obtained. Locations of the same section or similar exposure are grouped into exposure groups. A quarterly mean of dust activity is determined for each of the exposure groups based on the results of the monitoring program.
CARDAX is used to extract time sheet information for all personnel where it is not possible to get this information from the three main databases commonly used at Olympic Dam for timesheet logging (IRIS, Prodtrak and SAP).
Quarterly location/occupation dust averages are combined with time information to produce a dust exposure for each employee and each different dust type.
Exposure to gamma radiation is assessed using TLD badges from the Personal Monitoring Service of ARPANSA. TLD badges are worn for a period of three months. They are issued to all occupation groups with designated employees. The balance of employees receive the average exposure for their occupation group. TLD badges are issued to different employees every monitoring period. Employees from occupation groups which are likely to receive elevated gamma dose are issued a TLD badge each monitoring period (eg. Slag Crushers, Mill Technician, Product Packer, Slag Handling Technician, TRS Technician, Instrumentation Technician working with radiation gauges). Spare TLD badges are also kept on hand to be issued to employees upon request.
Although the exposure to RDP within the Metallurgical Plant is much less than other pathways, it is assessed in the same way as for Mine employees. The same time information used for calculation of dust exposure is used for calculating RDP exposure. All surface locations/occupations are grouped into one surface airway. A weekly average is calculated from all surface RDP measurements and is assigned to this airway. Location-based RDP concentration information is then combined with the employee time card information to derive individual weekly exposure data (µJ.hr/m3).

Annual Radiation Protection Report July 2009 - June 2010
Page 4 Exposure to Dose Calculations
2.2 Exposure to Dose Calculations Conversion of dust exposure to committed effective dose is achieved by the use of dose conversion factors, which are derived using the methodologies in ICRP68/72. The parameters physically measured to determine the factors are; particle size and radionuclide content. These measurements are undertaken in a number of areas of the Mine and Metallurgical Plant.
Analysis of the samples used to determine the radionuclide content was carried out by the Olympic Dam Analytical Laboratory. These results were used to determine dose conversion factors, which remain unchanged from last year.
Changes to existing conversion factors will only occur in the event of introduction of new processing techniques, major changes to plant or ore type or new recommendations published by the ICRP. A summary of the dose conversion factors used for 2009/2010 is given in Appendix A. Dose conversion factors have been carried over from the previous reporting year.
To calculate committed dose for airborne dust exposure, the airborne dust exposure is multiplied by the appropriate dose conversion factor. The committed doses for the different dusts are then added to give a total airborne dust dose.
Dose equivalent from RDP are calculated by multiplying the RDP exposure by the default dose conversion factor recommended by ICRP65 of 1.41 mSv.m3/mJ.hr (5 mSv/WLM).

July 2009 - June 2010 Annual Radiation Protection Report
3 Employee Doses
3.1 Doses to Mine Employees 3.1.1 Descriptive Statistics A total of 670 full-time designated Mine worker’s doses were calculated for the period 1st July 2009 to 30th June 2010. This included all BHP Billiton Olympic Dam Mine employees and associated contractors. The distribution of doses for these work classifications is given in Figure 1.
0
50
100
150
200
250
1 2 3 4 5 6 7 8 9 10 11 12 13 14 15 16 17 18 19 20 >20Dose (mSv)
No.
of W
orke
rs
0
0.1
0.2
0.3
0.4
0.5
0.6
0.7
0.8
0.9
1
Per
cent
age
of w
orke
rs a
bove
dos
e
Part-time
Ful-Time
%over
Annu
al R
epor
ting
lev
Figure 1 - Annual Dose Distribution 2009/2010 for All Designated Employees - Mine
The selection criteria for determining whether employees are categorised as ‘full- time’ or ‘part-time’ is as follows:
A ‘full-time’ Mine employee is an employee whose dose has been assessed for a total of three or more quarters in the Mine. A ‘part-time’ employee therefore has dose assessment for less than three quarters. This eliminates any unintentional biasing of the analysis of data due to short exposure periods.
The mean dose to all designated mine employees was 2.8 mSv in 2009/2010, a decrease from the 2008/2009 value of 3.4 mSv.
The mean dose for full-time designated mine workers was 2.9 mSv in 2009/2010, a decrease from the 2008/2009 value of 3.5 mSv.
The mean dose for part-time designated mine workers was 1.5 mSv in 2009/2010, a decrease from the 2008/2009 value of 3.0 mSv.
The average exposure to radon decay products (RDP) in the underground mine for 2009/2010 was just over 16% lower than in 2008/2009.
Table A consolidates the results for the exposures at the mine. Employee Doses Page 5

Annual Radiation Protection Report July 2009 - June 2010
Page 6 Doses to Mine Employees
Table A – Statistics for designated employees, mine
Full-Time Part-Time All Designated
Designated Designated Employees
Statistics
Employees Employees
Count 670 69 739 Arithmetic Mean (mSv) 2.9 1.5 2.8 90th Percentile (mSv) 4.2 1.9 4.0 Min (mSv) 0.4 0.1 0.1 Max (mSv) 7.3 2.7 7.3 Mean % Dose from RDP 58% 57% 58% Mean % Dose from Dust 5% 5% 5% Mean % Dose from Gamma 37% 38% 37%
No Mine worker received an annual dose greater than 10 mSv. The highest dose was 7.3 mSv, compared to a maximum value in 2008/2009 of 8.3 mSv.
3.1.2 Review of doses by work category Table B shows the breakdown of doses by work category for full-time designated employees.
The total number of all designated employees has decreased to 739 in the 2009/2010 year from 834 in 2008/2009 due to a reduction in workforce numbers. The primary focus of our monitoring programs has remained on the critical workgroups that are currently working in the underground mine.
Of the three major exposure pathways (gamma irradiation, inhalation of radioactive dust and inhalation of RDP), the gamma irradiation exposure levels for full-time designated workers has remained the same at 37%. While RDP has increased marginally from 57% in 2008/2009 to 58% of the total dose in 2009/2010. The dust component remained constant at around 5% of the total dose.
Average annual doses for all mine work groups have continued to decrease during the 2009/2010 year. The Raise Driller work group received the highest average dose of 4.7 mSv, a reduction from 2008/2009. The highest individual annual dose of 7.3 mSv was also received by a Raise Driller.
The dose components for all work categories are shown graphically in Figure 2

July 2009 - June 2010 Annual Radiation Protection Report
Employee Doses Page 7
Table B – Statistics for Full Time Designated Mine Employees
No. Mean Minimum Maximum 90th of (mSv) (mSv) (mSv) Percentile
WORK CATEGORY
Emp. (mSv) Backfill 7 1.5 0.6 2.1 2.1 Core Farm 6 0.7 0.5 0.7 0.7 Development 102 3.4 1.6 5.3 4.3 Diamond Driller 22 3.0 0.8 4.3 4.2 Electrician 28 2.5 1.4 5.6 4.5 Fitter 61 1.8 0.9 4.1 2.5 Mine Surface 42 1.7 0.4 3.6 3.0 Ore Handling 152 3.3 1.1 5.0 4.0 Production Charger 14 4.1 2.4 5.2 4.7 Production Drilling 32 3.5 1.6 5.3 4.4 Raise Driller 17 4.7 2.4 7.3 6.2 Services 187 2.7 0.8 5.4 3.8
RDP. RDP. % Gamma Gamma %
Dust Dust %
Average of Total Average of total Average of Total
WORK CATEGORY
(mSv) Dose (mSv) Dose (mSv) Dose Backfill 0.8 57% 0.5 35% 0.1 7% Core Farm 0.1 18% 0.2 31% 0.3 51% Development 1.9 55% 1.3 38% 0.2 6% Diamond Driller 2.0 65% 1.0 32% 0.1 3% Electrician 1.1 42% 1.3 52% 0.1 6% Fitter 1.0 54% 0.7 38% 0.2 8% Mine Surface 1.0 58% 0.6 35% 0.1 6% Ore Handling 2.1 65% 1.0 31% 0.1 4% Production Charger 2.0 50% 1.9 45% 0.2 5% Production Drilling 1.8 53% 1.5 43% 0.2 4% Raise Driller 2.9 61% 1.7 36% 0.1 3% Services 1.5 55% 1.1 39% 0.2 6%

Annual Radiation Protection Report July 2009 - June 2010
0.0
0.5
1.0
1.5
2.0
2.5
3.0
3.5
4.0
4.5
5.0
Backfill
Core Fa
rm
Develop
ment
Diamon
d Drill
er
Electric
ianFitte
r
Mine Surf
ace
Ore Han
dling
Produc
tion C
harge
r
Producti
on D
rilling
Raise D
riller
Service
s
Work Group
Dose
(mSv
)
Dust Average (mSv) RDP. Average (mSv) Gamma Average (mSv)
Figure 2 – Doses, showing components, for Full Time Designated Mine Employees
The average and maximum effective dose for the critical Mine underground workgroups and dose component trends for selected workgroups are given from Figure 3 - Figure 26.
Page 8 Doses to Mine Employees

July 2009 - June 2010 Annual Radiation Protection Report
Back Fill
The average dose to the Backfill workgroup has decreased from 1.7 mSv to 1.5 mSv whilst the maximum dose to this workgroup has increased from 1.9 mSv to 2.1 mSv. This reflects the transfer of Exact Mining employees who transfer from underground work to surface duties throughout the year.
0
0.5
1
1.5
2
2.5
3
3.5
1 2 3 4 5 6 7 8 9 10 11 12 13 14 15 16 17 18 19 20 >20
Annual Dose (mSv)
No.
of P
eopl
e
Part-TimeFull-Time
Figure 3 - Annual Dose Distribution for the Backfill Workgroup
0.0
2.0
4.0
6.0
8.0
10.0
12.0
14.0
16.0
18.0
20.0
Jul06-Jun07 Jul07-Jun08 Jul08-Jun09 Jul08-Jun09 Jul09-Jun10
Period
Dos
e (m
Sv)
Dust RDP Gamma MAX Total Dose(mSv) Figure 4 – Annual Dose Trends for the Backfill Workgroup
Employee Doses Page 9
Annual Radiation Protection Report July 2009 - June 2010
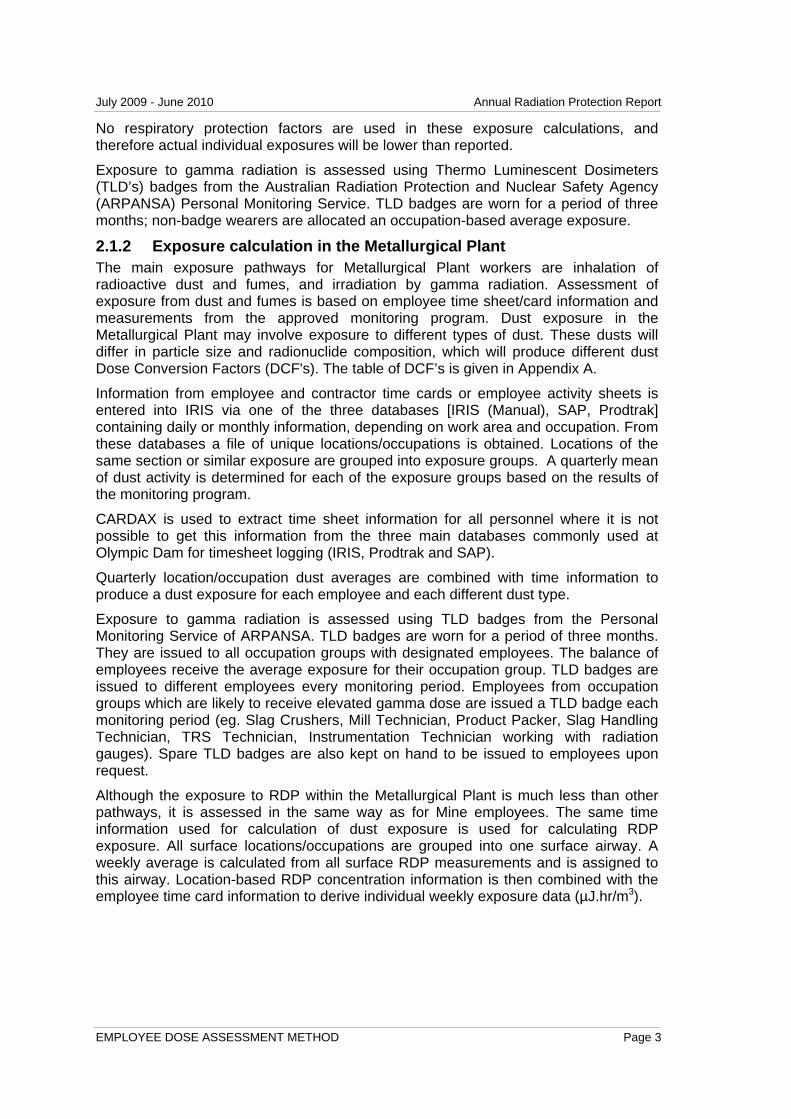
Core Processing
The average and maximum doses to Core Processing employees have remained at low levels of under 1mSv per year. Both average and maximum doses were 0.7 mSv. Dust exposure to this workgroup is in the process of review for occupational hygiene purposes.
0
1
2
3
4
5
6
7
1 2 3 4 5 6 7 8 9 10 11 12 13 14 15 16 17 18 19 20 >20
Annual Dose (mSv)
No.
of P
eopl
e
Part-TimeFull-Time
Figure 5 – Annual Dose Distribution for the Core Processing Workgroup
0.0
2.0
4.0
6.0
8.0
10.0
12.0
14.0
16.0
18.0
20.0
Jul06-Jun07 Jul07-Jun08 Jul08-Jun09 Jul08-Jun09 Jul09-Jun10
Period
Dos
e (m
Sv)
Dust RDP Gamma MAX Total Dose(mSv)
Figure 6 – Annual Dose Trends for the Core Farm Workgroup
Page 10 Doses to Mine Employees

July 2009 - June 2010 Annual Radiation Protection Report
Development
The average and maximum dose to the Development workgroup has decreased from 3.9 mSv and 6.3 mSv to 3.4 mSv and 5.3 mSv respectively. This is a result of reduced exposure to radon decay products and gamma.
0
5
10
15
20
25
30
35
40
45
50
1 2 3 4 5 6 7 8 9 10 11 12 13 14 15 16 17 18 19 20 >20
Annual Dose (mSv)
No.
of P
eopl
e
Part-TimeFull-Time
Figure 7 – Annual Dose Distribution for the Development Workgroup
0.0
2.0
4.0
6.0
8.0
10.0
12.0
14.0
16.0
18.0
20.0
Jul06-Jun07 Jul07-Jun08 Jul08-Jun09 Jul08-Jun09 Jul09-Jun10
Period
Dos
e (m
Sv)
Dust RDP Gamma MAX Total Dose(mSv)
Figure 8 – Annual Dose Trends for the Development Workgroup
Employee Doses Page 11

Annual Radiation Protection Report July 2009 - June 2010
Diamond Drilling
The average and maximum dose to the Diamond Drilling workgroup has decreased from 3.3 mSv and 4.9 mSv to 3.0 mSv and 4.3 mSv respectively. The significant reduction in dose for this workgroup over the last few years is primarily a result of decreased gamma exposures with improved site set up. Radon decay product exposures to the workgroup have also reduced in the current reporting period and continue to be a focus for the workgroup.
0
1
2
3
4
5
6
7
8
9
10
1 2 3 4 5 6 7 8 9 10 11 12 13 14 15 16 17 18 19 20 >20
Annual Dose (mSv)
No.
of P
eopl
e
Part-TimeFull-Time
Figure 9 – Annual Dose Distribution for the Diamond Drilling Workgroup
0.0
2.0
4.0
6.0
8.0
10.0
12.0
14.0
16.0
18.0
20.0
Jul06-Jun07 Jul07-Jun08 Jul08-Jun09 Jul08-Jun09 Jul09-Jun10
Period
Dos
e (m
Sv)
Dust RDP Gamma MAX Total Dose(mSv)
Figure 10 – Annual Dose Trends for the Diamond Drilling Workgroup
Page 12 Doses to Mine Employees

July 2009 - June 2010 Annual Radiation Protection Report
Electrician
The average dose to electricians has decreased slightly to 2.5 mSv while the maximum dose to this workgroup has increased from 2.6mSv in 2008/2009 to 5.6mSv. This increase for maximum exposure reflects the increased duration of time that contractor employees spent working underground.
0
2
4
6
8
10
12
14
16
18
1 2 3 4 5 6 7 8 9 10 11 12 13 14 15 16 17 18 19 20 >20
Annual Dose (mSv)
No.
of P
eopl
e
Part-TimeFull-Time
Figure 11 – Annual Dose Distribution for the Electrician Workgroup
0.0
2.0
4.0
6.0
8.0
10.0
12.0
14.0
16.0
18.0
20.0
Jul06-Jun07 Jul07-Jun08 Jul08-Jun09 Jul08-Jun09 Jul09-Jun10
Period
Dos
e (m
Sv)
Dust RDP Gamma MAX Total Dose(mSv) Figure 12 – Annual Dose Trends for the Electrician Workgroup
Employee Doses Page 13

Annual Radiation Protection Report July 2009 - June 2010
Fitter
The average dose to the Fitter workgroup has decreased from 2.0 mSv to 1.8 mSv whilst the maximum dose for Fitters has increased from 3.7 mSv to 4.1 mSv.
0
5
10
15
20
25
30
35
40
45
1 2 3 4 5 6 7 8 9 10 11 12 13 14 15 16 17 18 19 20 >20
Annual Dose (mSv)
No.
of P
eopl
e
Part-TimeFull-Time
Figure 13 – Annual Dose Distribution for the Fitter Workgroup
0.0
2.0
4.0
6.0
8.0
10.0
12.0
14.0
16.0
18.0
20.0
Jul06-Jun07 Jul07-Jun08 Jul08-Jun09 Jul08-Jun09 Jul09-Jun10
Period
Dos
e (m
Sv)
Dust RDP Gamma MAX Total Dose(mSv) Figure 14 – Annual Dose Trends for the Fitter Workgroup
Page 14 Doses to Mine Employees

July 2009 - June 2010 Annual Radiation Protection Report
Surface Workers
The average dose has decreased from 1.8 mSv to 1.7 mSv and the maximum dose has reduced from 4.4 mSv to 3.6 mSv.
0
2
4
6
8
10
12
14
16
18
20
1 2 3 4 5 6 7 8 9 10 11 12 13 14 15 16 17 18 19 20 >20
Annual Dose (mSv)
No.
of P
eopl
e
Part-TimeFull-Time
Figure 15 – Annual Dose Distribution for the Surface Workers Workgroup
0.0
2.0
4.0
6.0
8.0
10.0
12.0
14.0
16.0
18.0
20.0
Jul06-Jun07 Jul07-Jun08 Jul08-Jun09 Jul08-Jun09 Jul09-Jun10
Period
Dos
e (m
Sv)
Dust RDP Gamma MAX Tota l Dose(mSv) Figure 16 – Annual Dose Trends for the Surface Workers Workgroup
Employee Doses Page 15

Annual Radiation Protection Report July 2009 - June 2010
Ore Handling
The average dose has decreased from 3.8 mSv to 3.3 mSv while the maximum dose has also decreased from 6.9 mSv to 5.0 mSv. The decrease in the average dose is a result of minor decreases in radon decay product and gamma exposure. Average and maximum doses for the workgroup are still within historical levels.
0
20
40
60
80
100
120
1 2 3 4 5 6 7 8 9 10 11 12 13 14 15 16 17 18 19 20 >20
Annual Dose (mSv)
No.
of P
eopl
e
Part-TimeFull-Time
Figure 17 – Annual Dose Distribution for the Ore Handling Workgroup
0.0
2.0
4.0
6.0
8.0
10.0
12.0
14.0
16.0
18.0
20.0
Jul06-Jun07 Jul07-Jun08 Jul08-Jun09 Jul08-Jun09 Jul09-Jun10
Period
Dos
e (m
Sv)
Dust RDP Gamma MAX Tota l Dose(mSv) Figure 18 – Annual Dose Trends for the Ore Handling Workgroup
Page 16 Doses to Mine Employees
July 2009 - June 2010 Annual Radiation Protection Report
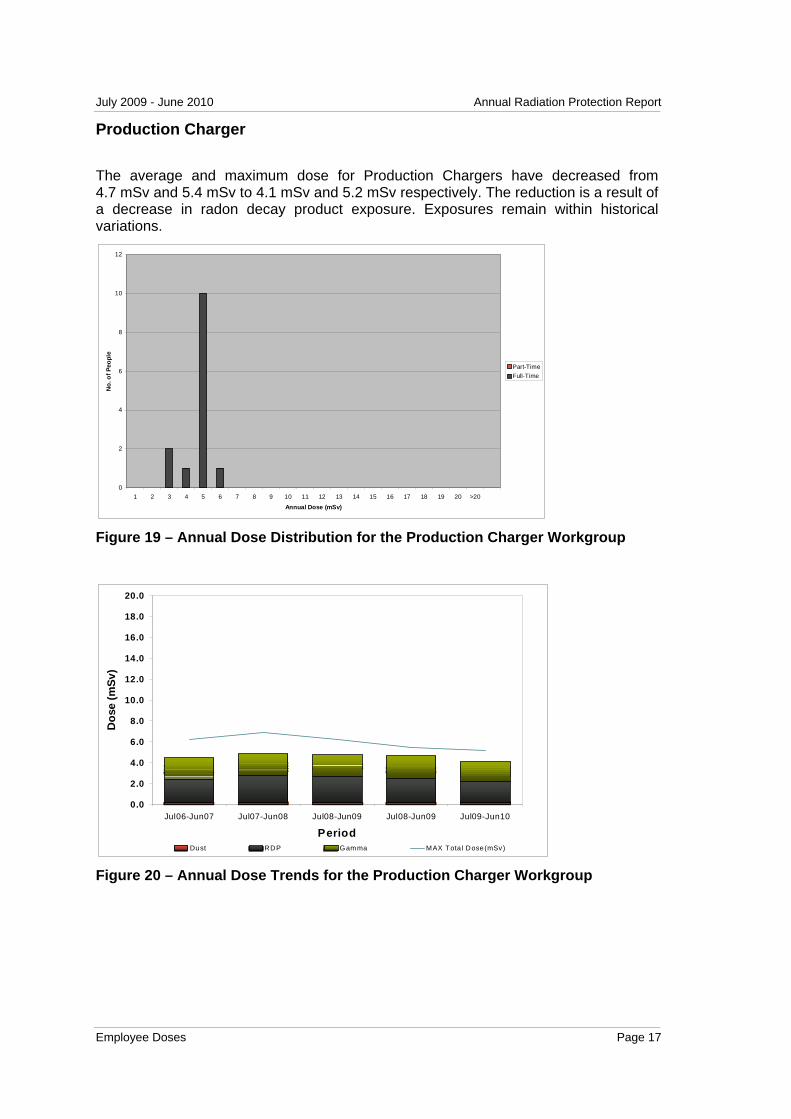
Production Charger
The average and maximum dose for Production Chargers have decreased from 4.7 mSv and 5.4 mSv to 4.1 mSv and 5.2 mSv respectively. The reduction is a result of a decrease in radon decay product exposure. Exposures remain within historical variations.
0
2
4
6
8
10
12
1 2 3 4 5 6 7 8 9 10 11 12 13 14 15 16 17 18 19 20 >20
Annual Dose (mSv)
No.
of P
eopl
e
Part-TimeFull-Time
Figure 19 – Annual Dose Distribution for the Production Charger Workgroup
0.0
2.0
4.0
6.0
8.0
10.0
12.0
14.0
16.0
18.0
20.0
Jul06-Jun07 Jul07-Jun08 Jul08-Jun09 Jul08-Jun09 Jul09-Jun10
Period
Dos
e (m
Sv)
Dust RDP Gamma MAX Tota l Dose(mSv) Figure 20 – Annual Dose Trends for the Production Charger Workgroup
Employee Doses Page 17
Annual Radiation Protection Report July 2009 - June 2010
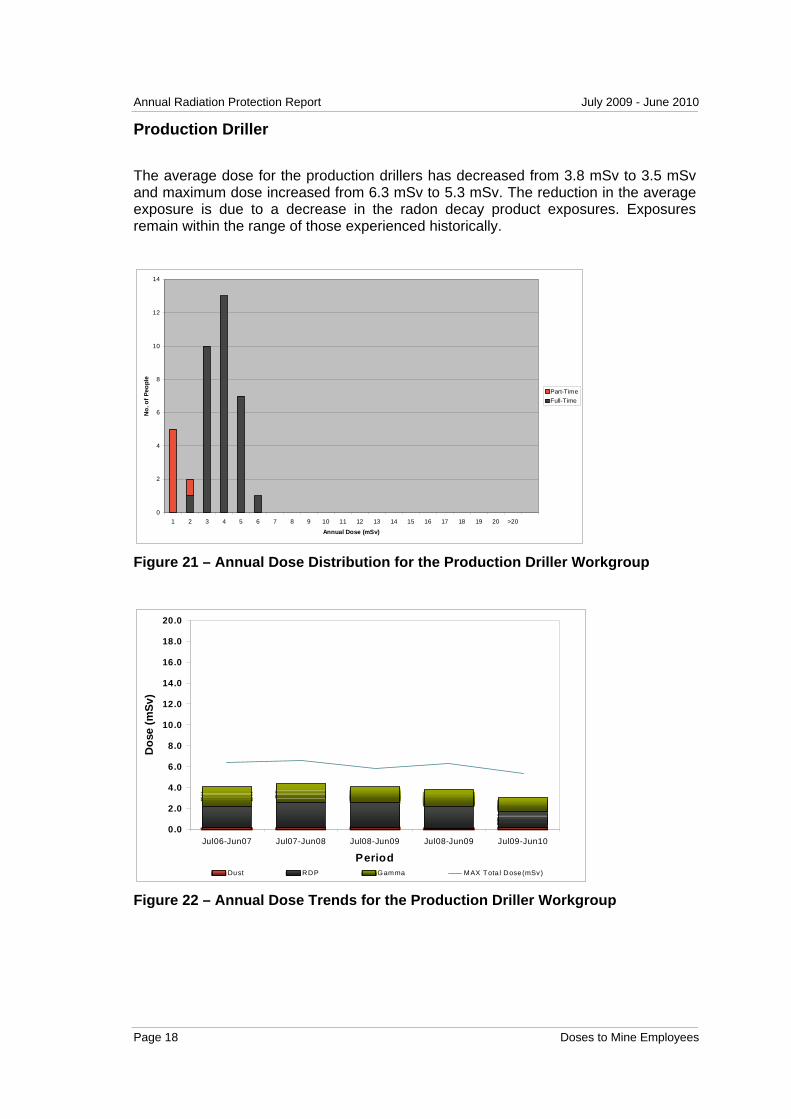
Production Driller
The average dose for the production drillers has decreased from 3.8 mSv to 3.5 mSv and maximum dose increased from 6.3 mSv to 5.3 mSv. The reduction in the average exposure is due to a decrease in the radon decay product exposures. Exposures remain within the range of those experienced historically.
0
2
4
6
8
10
12
14
1 2 3 4 5 6 7 8 9 10 11 12 13 14 15 16 17 18 19 20 >20
Annual Dose (mSv)
No.
of P
eopl
e
Part-TimeFull-Time
Figure 21 – Annual Dose Distribution for the Production Driller Workgroup
0.0
2.0
4.0
6.0
8.0
10.0
12.0
14.0
16.0
18.0
20.0
Jul06-Jun07 Jul07-Jun08 Jul08-Jun09 Jul08-Jun09 Jul09-Jun10
Period
Dos
e (m
Sv)
Dust RDP Gamma MAX Tota l Dose(mSv) Figure 22 – Annual Dose Trends for the Production Driller Workgroup
Page 18 Doses to Mine Employees

July 2009 - June 2010 Annual Radiation Protection Report
Raise Driller
The average dose has decreased from 5.2 mSv to 4.7 mSv and the maximum dose has decreased from 7.8 mSv to 7.3 mSv. Focus on radon decay product exposure continues to be the main priority for radiation exposure to this workgroup.
0
1
2
3
4
5
6
7
1 2 3 4 5 6 7 8 9 10 11 12 13 14 15 16 17 18 19 20 >20
Annual Dose (mSv)
No.
of P
eopl
e
Part-TimeFull-Time
Figure 23 – Annual Dose Distribution for the Raise Driller Workgroup
0.0
2.0
4.0
6.0
8.0
10.0
12.0
14.0
16.0
18.0
20.0
Jul06-Jun07 Jul07-Jun08 Jul08-Jun09 Jul08-Jun09 Jul09-Jun10
Period
Dos
e (m
Sv)
Dust RDP Gamma MAX Tota l Dose(mSv) Figure 24 – Annual Dose Trends for the Raise Driller Workgroup
Employee Doses Page 19

Annual Radiation Protection Report July 2009 - June 2010
Underground services
The average dose has decreased from 3.3 mSv to 2.7 mSv and the maximum dose has decreased from 8.3 mSv to 5.4 mSv. This decrease in the maximum result reflects that the previous year the maximum employee had transferred from a Smelter workgroup and most of the exposure was from their work in the Smelter. The workgroup has seen a reduction in radon decay product exposure.
0
10
20
30
40
50
60
70
80
90
100
1 2 3 4 5 6 7 8 9 10 11 12 13 14 15 16 17 18 19 20 >20
Annual Dose (mSv)
No.
of P
eopl
e
Part-TimeFull-Time
Figure 25 – Annual Dose Distribution for the Underground Services Workgroup
0.0
2.0
4.0
6.0
8.0
10.0
12.0
14.0
16.0
18.0
20.0
Jul06-Jun07 Jul07-Jun08 Jul08-Jun09 Jul08-Jun09 Jul09-Jun10
Period
Dos
e (m
Sv)
Dust RDP Gamma MAX Tota l Dose(mSv) Figure 26 – Annual Dose Trends for the Underground Services Workgroup
Page 20 Doses to Mine Employees

July 2009 - June 2010 Annual Radiation Protection Report
Employee Doses Page 21
3.1.3 Strategies for Dose Reduction There is a continuous focus on reducing dose to employees at the mine and some of these measures include;
• Approval of the new Radiation Management Plan • Implementation of continuous radon decay product monitoring equipment • Continuing use of electronic gamma dosimeter monitoring program and a trial of
new instrumentation • Extensions to the existing ventilation system • Focused radiation monitoring for the higher exposed work groups
The mine ventilation department have continued to focus on ensuring that exposure to radon decay products are minimised. This has been achieved through the following;
• Continued control over interactions in the mine through improvements in the 8 day and 3 month schedules
• The installation of the RB33 fans for additional air volumes for the Northern Rail and Cyan area is progressing and fans will be commissioned by March 2011
• The RB34 fans as an exhaust for the southern rail, CC and DSE sections of the mine have been commissioned
• RB31 intake has been extended down to the rail level (57-65 level) to cater for the exhausting of RB34
• Load sharing connection between the 45 Blues and 46 Green west area is underway. Once these areas connected extra air capacity will be given to the Blues area to improve conditions there.
An intensive program in the use of Bladewerx underground has found the instrument to be unreliable as a method of monitoring real time Radon Decay Product levels and the program has been abandoned. They will be transferred to the process plant and trialled in the Smelter for personnel real time Po-210 monitoring. It is planned to trial another radon decay product monitor already proven to work on other sites before the end of FY11. This will include a real time RDP monitoring analysis of two workgroups and a report back with control recommendations.
The Mine Radiation Team has focused on real time electronic gamma monitoring as well as general improvements to their operating systems over the last 12 months. This year has seen an increase in the utilisation of electronic gamma monitoring equipment both the dosicards and gamma watches.
3.1.4 Doses to Non-Designated Mine Employees A dose distribution for non-designated employees and contractors at the Mine is listed in Figure 27. Non-designated employees are tracked individually on the same dose calculation system as the designated employees. A summary of all non-designated employee doses is given in Table C

Annual Radiation Protection Report July 2009 - June 2010
0
100
200
300
400
500
600
1 2 3 4 5 6 7 8 9 10 11 12 13 14 15 16 17 18 19 20 >20
Annual Dose (mSv)
No.
of P
eopl
e
Figure 27 – Annual Dose Distribution for Non-Designated mine end employees
Table C – Non Designated Mine Employee Statistics
Non
Designated
Statistics
Employees
Count 917 Arithmetic Mean (mSv) 1.0 90th Percentile (mSv) 2.0 Min (mSv) 0.1 Max (mSv) 3.9 Mean % Dose from RDP 42% Mean % Dose from Dust 13% Mean % Dose from Gamma 45%
Maximum and average dose trends for all non-designated mine workers are presented in Figure 28 Figure 28 – Average Dose Trends for Non-Designated Employees.
Page 22 Doses to Mine Employees

July 2009 - June 2010 Annual Radiation Protection Report
0.0
1.0
2.0
3.0
4.0
5.0
6.0
7.0
8.0
9.0
10.0
2005/2006 2006/2007 2007/2008 2008/2009 2009/2010
Period
Dos
e (m
Sv)
0
200
400
600
800
1000
1200
1400
1600
1800
No.
of E
mpl
oyee
s
Avg Max Dose Number of workers
Figure 28 – Average Dose Trends for Non-Designated Employees
Airborne dust doses and radon decay product doses have been calculated using average airborne dust measurements, average radon decay product measurements, dose conversion factors and either an estimation of the hours worked based on a typical working roster, or actual hours. Gamma doses have been estimated based on direct personal monitoring and averages resulting from this monitoring.
Employee Doses Page 23

Annual Radiation Protection Report July 2009 - June 2010
0.0
0.5
1.0
1.5
2.0
2.5
3.0
Backfi
ll
Core Farm
Develop
ment
Diamon
d Drill
er
Electric
ian Fitter
Mine Surf
ace
Ore Han
dling
Produc
tion D
rilling
Raise D
riller
Service
s
Work Group
Dose
(mSv
)
Dust Average (mSv) RDP. Average (mSv) Gamma Average (mSv)
Figure 29 – Annual Doses for Non-Designated employees, by source and by Occupation
Figure 28 shows maximum and average dose trends for all non-designated Mine workers from 1 July 2005 to 30 June 2010.
The total number of non-designated employees has decreased from 1157 in 2008/2009 to 917 in 2009/2010. The average dose has decreased from 1.2 mSv to 1.0 mSv. Nineteen mine employees received a dose above 3 mSv, with the highest being 3.9 mSv. These employees have not been designated because they were recently engaged workers, have recently changed jobs or previously assessed as not needing to be designated.
3.1.5 Cumulative Five Year Dose As outlined in ICRP 60, the total dose of any individual radiation worker should not exceed 100 mSv in any five year period. To this end, a five year total dose has been determined for all full-time currently designated Mine workers who were employed at Olympic Dam for the previous five years. The calculation of cumulative five year effective dose includes employees who have worked for more than 18 quarters.
There were a total of 471 designated Mine workers who worked continuously at the Mine during the period 1st July 2005 to 30th June 2010. This number has increased from the 393 workers reported for the period 1st July 2004 to 30th June 2009. The maximum dose for a Mine worker is 31.3 mSv for the five year period ending 30 June 2010, as compared with 33.4 mSv for the 2003/2004 to 2008/2009 five year dose period. The arithmetic mean for the group was 14.8 mSv, a decrease from 16.6 mSv for the five year dose period 2003/2004 to 2008/2009.
The number of employees who have continuously worked for five years at the Mine has continued to increase due to an increase in staffing in general over the last few years. The distribution of doses for the cumulative five year dose is shown in Figure 30.
Page 24 Doses to Mine Employees

July 2009 - June 2010 Annual Radiation Protection Report
0
50
100
150
200
250
10 20 30 40 50 60 70 80 90 100 >100
5 Year Dose (mSv)
No.
of P
eopl
e
Figure 30 – Five Year Cumulative Dose Distribution Mine
A summary of the cumulative five year dose is given in Table D.
Table D – Five Year Stats
Cumulative 5 year Doses Equivalent Average yearly Dose
For Continuously Employed
Statistics
Designated Mine Employees Count 471 471 Arithmetic Mean (mSv) 14.8 3.0 90th Percentile (mSv) 23.2 4.6 Min (mSv) 1.7 0.3 Max (mSv) 31.3 6.3 Mean % Dose from RDP 55% Mean % Dose from Dust 13% Mean % Dose from Gamma 39%
3.2 Doses to Metallurgical Plant Employees 3.2.1 Descriptive Statistics A total of 193 full-time designated Metallurgical Plant worker’s doses were calculated for the period 1st July 2009 to 30th June 2010. This included most BHP Billiton Olympic Dam Metallurgical Plant employees and associated contractors who work full time in the plant.
Employee Doses Page 25

Annual Radiation Protection Report July 2009 - June 2010
Page 26 Doses to Metallurgical Plant Employees
In FY10 the Clark shaft which is responsible for supplying the majority of the ore to the plant suffered a failure and was out of service for approximately 7 months. The reduced ore availability allowed the Metallurgical Plant to be shutdown for extended periods to perform major maintenance. A highlight of this period was major smelter shutdown, which was originally scheduled for September 2010. The smelter was offline for approximately 4 months.
As a result of the extended shutdown, Metallurgical Plant doses (in particular the dust component) are significantly lower than normal operation as much of the exposure only occurs when the plant is operational. This had the biggest impact within the smelter area, where during the shutdown period, the dust activity concentration averaged less than 10% of the derived air concentration. Average quarterly doses during the shutdown period for all plant areas were below 0.5 mSv.
As a result of the Clark shaft incident only limited discussion of dose trends will occur in this report.
The mean dose to all designated plant employees was 1.4 mSv in 2009/2010, a decrease from the 2008/2009 value of 2.7 mSv.
The mean dose for full-time designated plant workers was 1.5 mSv in 2009/2010, a decrease from the 2008/2009 value of 3.0 mSv.
The mean dose for part-time designated plant workers was 0.8 mSv in 2009/2010, a decrease from the 2008/2009 value of 0.9 mSv.
For this period the distribution of doses is shown in Figure 31, and the statistics are given in Table E.
Table E – Statistics for designated employees, Metallurgical Plant
Full-Time Part-Time All Designated
Designated Designated Employees
Statistics
Employees Employees
Count 193 13 206 Arithmetic Mean (mSv) 1.5 0.8 1.4 90th Percentile (mSv) 2.6 1.6 2.5 Min (mSv) 0.1 0.1 0.1 Max (mSv) 3.6 2.5 3.6 Mean % Dose from RDP 10% 4% 10% Mean % Dose from Dust 68% 78% 69% Mean % Dose from Gamma 22% 17% 21%

July 2009 - June 2010 Annual Radiation Protection Report
0
20
40
60
80
100
120
1 2 3 4 5 6 7 8 9 10 11 12 13 14 15 16 17 18 19 20 >20Dose (mSv)
No.
of W
orke
rs
0.00%
10.00%
20.00%
30.00%
40.00%
50.00%
60.00%
70.00%
80.00%
90.00%
100.00%
Per
cent
age
of w
orke
rs a
bove
dos
e
Part-time
Ful-Time
%over
Annu
al R
epor
ting
lev
Figure 31 – Annual Dose Distribution for all Metallurgical Plant employees
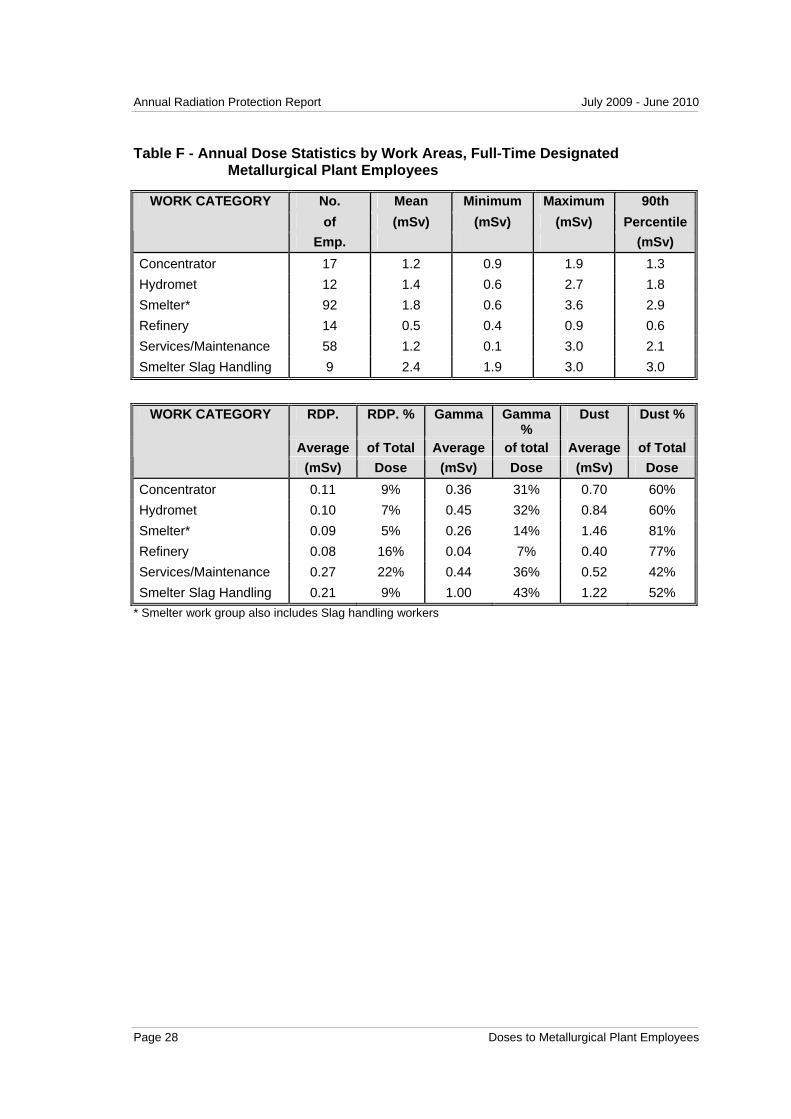
3.2.2 Review of Doses by Work Areas The analysis of doses by work area is presented in Table F. The dose statistics for the 2009/2010 year from the Metallurgical Plant areas show decrease in mean dose for all work groups except Concentrator and Services workgroups from the 2008/2009 year. Concentrator and Services mean remained constant. Maximum doses for all groups except for Services decreased.
Individual Work Areas The highest levels were recorded in the Smelter workgroup. The smelter doses have significantly decreased as a result of better control of polonium 210 in the system and extended shutdown period. The number of full-time designated employees in the Metallurgical Plant has decreased from 208 in 2008/2009 to 193 in 2009/2010.
Annual dose components for each work area can be seen in Figure 31.
Employee Doses Page 27
Annual Radiation Protection Report July 2009 - June 2010
Page 28 Doses to Metallurgical Plant Employees
Table F - Annual Dose Statistics by Work Areas, Full-Time Designated Metallurgical Plant Employees
No. Mean Minimum Maximum 90th of (mSv) (mSv) (mSv) Percentile
WORK CATEGORY
Emp. (mSv) Concentrator 17 1.2 0.9 1.9 1.3 Hydromet 12 1.4 0.6 2.7 1.8 Smelter* 92 1.8 0.6 3.6 2.9 Refinery 14 0.5 0.4 0.9 0.6 Services/Maintenance 58 1.2 0.1 3.0 2.1 Smelter Slag Handling 9 2.4 1.9 3.0 3.0
RDP. RDP. % Gamma Gamma %
Dust Dust %
Average of Total Average of total Average of Total
WORK CATEGORY
(mSv) Dose (mSv) Dose (mSv) Dose Concentrator 0.11 9% 0.36 31% 0.70 60% Hydromet 0.10 7% 0.45 32% 0.84 60% Smelter* 0.09 5% 0.26 14% 1.46 81% Refinery 0.08 16% 0.04 7% 0.40 77% Services/Maintenance 0.27 22% 0.44 36% 0.52 42% Smelter Slag Handling 0.21 9% 1.00 43% 1.22 52%
* Smelter work group also includes Slag handling workers

July 2009 - June 2010 Annual Radiation Protection Report
0.0
0.5
1.0
1.5
2.0
2.5
3.0
Concentrator Hydromet Smelter* Refinery Services/Maintenance Smelter Slag Handling
Work Group
Dose
(mSv
)
Dust Average (mSv) RDP. Average (mSv) Gamma Average (mSv)
* Smelter work group also includes Slag handling workers
Figure 32 – Annual dose components by workgroup
Annual total dose distributions and dose trends for each work area along with dose component profiles for selected workgroups can be seen in Figure 33 to Figure 42.
Employee Doses Page 29

Annual Radiation Protection Report July 2009 - June 2010
Concentrator Concentrator doses remained similar to previous reporting year as process material (source of exposure) remains in the plant regardless of operation.
0
2
4
6
8
10
12
14
1 2 3 4 5 6 7 8 9 10 11 12 13 14 15 16 17 18 19 20 >20
Annual Dose (mSv)
No.
of P
eopl
e
Part-TimeFull-Time
Figure 33 – Annual Dose Distribution for the Concentrator Workgroup
0.0
2.0
4.0
6.0
8.0
10.0
12.0
14.0
16.0
18.0
20.0
Jul06-Jun07 Jul07-Jun08 Jul08-Jun09 Jul08-Jun09 Jul09-Jun10
Period
Dos
e (m
Sv)
Dust RDP Gamma MAX Tota l Dose(mSv)
Figure 34 – Dose Trends for the Concentrator Workgroup
Page 30 Doses to Metallurgical Plant Employees

July 2009 - June 2010 Annual Radiation Protection Report
Hydromet The average dose for Hydromet workers decreased this reporting period. The main driver was the lower quantity of uranium produced, which resulted in lower dust and gamma exposures in the precipitation and calciner areas.
0
1
2
3
4
5
6
7
8
1 2 3 4 5 6 7 8 9 10 11 12 13 14 15 16 17 18 19 20 >20
Annual Dose (mSv)
No.
of P
eopl
e
Part-TimeFull-Time
Figure 35 – Annual Dose Distribution for the Hydromet Workgroup
0.0
2.0
4.0
6.0
8.0
10.0
12.0
14.0
16.0
18.0
20.0
Jul06-Jun07 Jul07-Jun08 Jul08-Jun09 Jul08-Jun09 Jul09-Jun10
Period
Dos
e (m
Sv)
Dust RDP Gamma MAX Tota l Dose(mSv)
Figure 36 – Dose Trends for the Hydromet Workgroup
Employee Doses Page 31

Annual Radiation Protection Report July 2009 - June 2010
Smelter Average doses in the smelter decreased to 1.8 mSv from 4.3 mSv. Maximum dose significantly decreased from 13.1 mSv to 3.6 mSv with the 90th percentile dose decreasing to 2.9 mSv. Action commenced in the previous reporting period to reduce the above average airborne dust activity concentration that resulted from the Flash Furnace dust recycle trial. In July 2009 personal dust activity averages had returned to activity concentrations below 50% of Derived Air Concentration (DAC).
Between November 2009 and March 2010, the Smelter was shutdown for major maintenance. During this time the personal dust exposures averages remained at or below 10% of DAC as there was no source of fume present The Smelter resumed normal operation in late March 2010 and personal dust activity concentration has been maintained below 25% of DAC.
0
10
20
30
40
50
60
1 2 3 4 5 6 7 8 9 10 11 12 13 14 15 16 17 18 19 20 >20
Annual Dose (mSv)
No.
of P
eopl
e
Part-TimeFull-Time
Figure 37 – Annual Dose Distribution for the Smelter Workgroup
0.0
2.0
4.0
6.0
8.0
10.0
12.0
14.0
16.0
18.0
20.0
Jul06-Jun07 Jul07-Jun08 Jul08-Jun09 Jul08-Jun09 Jul09-Jun10
Period
Dos
e (m
Sv)
Dust RDP Gamma MAX Tota l Dose(mSv)
Figure 38 – Dose Trends for the Smelter Workgroup
Page 32 Doses to Metallurgical Plant Employees

July 2009 - June 2010 Annual Radiation Protection Report
Refinery The Refinery workforce recorded the lowest maximum and annual average of any designated workgroup in the Metallurgical Plant, and remains at less than 1mSv.
0
2
4
6
8
10
12
14
16
1 2 3 4 5 6 7 8 9 10 11 12 13 14 15 16 17 18 19 20 >20
Annual Dose (mSv)
No.
of P
eopl
e
Part-TimeFull-Time
Figure 39 – Annual Dose Distribution for the Refinery Workgroup
0.0
2.0
4.0
6.0
8.0
10.0
12.0
14.0
16.0
18.0
20.0
Jul06-Jun07 Jul07-Jun08 Jul08-Jun09 Jul08-Jun09 Jul09-Jun10
Period
Dos
e (m
Sv)
Dust RDP Gamma MAX Tota l Dose(mSv)
Figure 40 – Dose Trends for the Refinery Workgroup
Employee Doses Page 33

Annual Radiation Protection Report July 2009 - June 2010
Maintenance/ Services The variable nature of the maximum dose is due to the fact that some of these personnel are spending time both underground and in the smelter building. The annual average dose remained at 1.2.
0
5
10
15
20
25
30
35
1 2 3 4 5 6 7 8 9 10 11 12 13 14 15 16 17 18 19 20 >20
Annual Dose (mSv)
No.
of P
eopl
e
Part-TimeFull-Time
Figure 41 – Annual Dose Distribution for the Maintenance/Services Workgroup
0.0
2.0
4.0
6.0
8.0
10.0
12.0
14.0
16.0
18.0
20.0
Jul06-Jun07 Jul07-Jun08 Jul08-Jun09 Jul08-Jun09 Jul09-Jun10
Period
Dos
e (m
Sv)
Dust RDP Gamma MAX Tota l Dose(mSv)
Figure 42 – Dose Trends for the Maintenance/Services Workgroup
Page 34 Doses to Metallurgical Plant Employees

July 2009 - June 2010 Annual Radiation Protection Report
Slag Handling The average and maximum dose to the Slag Handling workgroup has decreased this reporting period in line with reduced plant output.
0
1
2
3
4
5
6
1 2 3 4 5 6 7 8 9 10 11 12 13 14 15 16 17 18 19 20 >20
Annual Dose (mSv)
No.
of P
eopl
e
Part-TimeFull-Time
Figure 43 - Annual Dose Distribution for the Smelter Slag Handling Workgroup
Dose Histogram
0.0
2.0
4.0
6.0
8.0
10.0
12.0
14.0
16.0
18.0
20.0
Jul06-Jun07 Jul07-Jun08 Jul08-Jun09 Jul08-Jun09 Jul09-Jun10
Period
Dos
e (m
Sv)
Dust RDP Gamma MAX Total Dose(mSv)
Figure 44 – Dose Trends for the Smelter Slag Handling Workgroup
Employee Doses Page 35

Annual Radiation Protection Report July 2009 - June 2010
Page 36 Doses to Metallurgical Plant Employees
3.2.3 Strategies for Dose Reduction Significant work has been done by the Smelter team in controlling the polonium 210 within the Smelter systems to achieve the low doses during normal operations outside of the shutdown period. The experience gained during the Flash Furnace dust recycle trial in the previous year has resulted in a number of achievements. The smelter has run with increased dust recycle rates (improved copper gain, however increases Po210 activity of the dust) and improved dust leach efficiency (less Po210 gets returned to the smelter circuit). These achievements have been made whilst maintaining doses at the lowest levels seen in over 5 years (when looking at quarterly doses recorded outside of the shutdown period).
3.2.4 Doses to Non-Designated Employees Doses to the most exposed non-designated Metallurgical Plant employees have been assessed. The current time/location system collects information from the majority of BHP Billiton Olympic Dam employees and contractors on site. Only a small fraction of these workers are designated. The rest are classified as non-designated workers, however, their doses are assessed using the same dose calculation system as for designated employees. A summary of dose statistics is given in Table G.
Table G – Non-Designated Employees Metallurgical plant, Dose Statistics
Non
Designated
Statistics
Employees
Count 2143 Arithmetic Mean (mSv) 0.7 90th Percentile (mSv) 1.4 Min (mSv) 0.1 Max (mSv) 3.4 Mean % Dose from RDP. 15% Mean % Dose from Dust 55% Mean % Dose from Gamma 30%
The total number of non-designated employees decreased from 2489 in the 2008/2009 year to 2143 in the 2009/2010 year.

July 2009 - June 2010 Annual Radiation Protection Report
0.0
2.0
4.0
6.0
8.0
10.0
12.0
14.0
16.0
18.0
20.0
2005/2006 2006/2007 2007/2008 2008/2009 2009/2010
Period
Dos
e (m
Sv)
0
500
1000
1500
2000
2500
3000
3500
No.
of E
mpl
oyee
s
Avg Max Dose Number of workers
Figure 45 – Average Dose to Non-designated Metallurgical Plant Employees
The average dose has decreased to 0.7 mSv from 0.8 mSv in 2008/2009. The 90th percentile has also decreased slightly from 1.5 mSv to 1.4 mSv. The highest recorded dose for a non-designated employee was 3.4 mSv. This employee is a crane contractor who works across the surface and underground areas. This was the only non designated employee who recorded a dose over 3 mSv
The distribution of doses for 2009/2010 non-designated Metallurgical Plant employees is given in Figure 46.
Employee Doses Page 37

Annual Radiation Protection Report July 2009 - June 2010
0
200
400
600
800
1000
1200
1400
1600
1800
1 2 3 4 5 6 7 8 9 10 11 12 13 14 15 16 17 18 19 20 >20
Annual Dose (mSv)
No.
of P
eopl
e
Figure 46 – Annual Dose Distribution for Non-designated process plant employees
Dose statistics for non-designated employees working in the Metallurgical Plant areas are shown in Table H and Figure 47.
Table H – Dose Statistics For non-designated Plant employees
No. Mean Minimum Maximum Standard of (mSv) (mSv) (mSv) Deviation
WORK CATEGORY
Emp. (mSv) Concentrator 168 1.0 0.3 2.3 0.4 Hydromet 96 1.1 0.3 3.4 0.5 Smelter 228 1.2 0.2 2.7 0.5 Refinery 114 0.6 0.2 1.3 0.2 Services/Maintenance 1537 0.6 0.1 2.6 0.4
Page 38 Doses to Metallurgical Plant Employees

July 2009 - June 2010 Annual Radiation Protection Report
0.0
0.2
0.4
0.6
0.8
1.0
1.2
1.4
Concentrator Hydromet Smelter Refinery Services/Maintenance
Work Group
Dose
(mSv
)
Dust Average (mSv) RDP. Average (mSv) Gamma Average (mSv)
Figure 47 - Non Designated Process plant dose break-up, by workgroup
Airborne dust doses and radon decay product doses have been calculated using average airborne dust measurements, average positional radon decay product measurements and the relevant dose conversion factors. Gamma doses have been estimated based on direct personal monitoring and averages resulting from this monitoring. Hours are recorded by actual hours as recorded by Prodtrak, SAP, and the Cardax system. The Refinery and services/maintenance workgroups continued to record an average dose below 1 mSv during 2009/2010.
3.2.5 Cumulative Five Year Dose As outlined in ICRP 60, the total dose of any individual radiation worker should not exceed 100 mSv in any five year period. To this end, a five year total dose has been determined for all Metallurgical Plant employees who were employed at BHP Billiton Olympic Dam for the previous five years. Designated employees who have worked for more than 18 quarters are included in this analysis.
There were a total of 371 currently designated Metallurgical Plant employees who worked continuously at Olympic Dam during the period 1st July 2005 to 30th June 2010.
The maximum dose for the five year period was 32.4 mSv, compared to the value of 41.7 mSv calculated in 2008/2009. The arithmetic mean for the five year dose period for the Metallurgical Plant has decreased from 10.4 mSv to 8.3 mSv. The distribution of doses for the cumulative five year dose is shown in Figure 48.
Employee Doses Page 39

Annual Radiation Protection Report July 2009 - June 2010
0
50
100
150
200
250
300
10 20 30 40 50 60 70 80 90 100 >1005 Year Dose (mSv)
No.
of P
eopl
e
Figure 48 – 5 Year Cumulative Dose Distribution for Process Plant Employees
A summary of the cumulative five year dose is given in the Table below
Page 40 Doses to Metallurgical Plant Employees

July 2009 - June 2010 Annual Radiation Protection Report
Table I – Five Year Dose Statistics
Cumulative 5 year Doses Equivalent Average yearly Dose
For Continuously Employed
Statistics
Designated Plant Employee
Count 371 371 Arithmetic Mean (mSv) 8.3 1.7 90th Percentile (mSv) 16.5 3.3 Min (mSv) 2.4 0.5 Max (mSv) 32.4 6.5 Mean % Dose from RDP 13% Mean % Dose from Dust 67% Mean % Dose from Gamma 31%
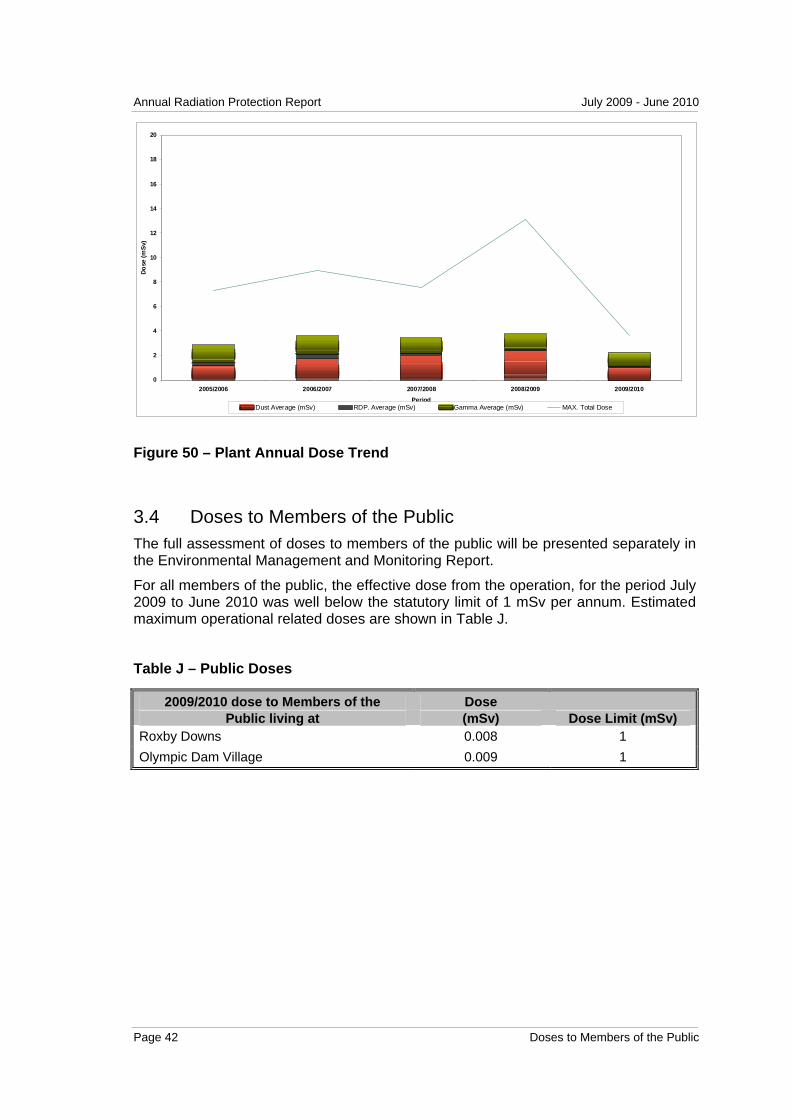
3.3 Annual Dose Trends The average total effective dose to all designated employees at the Mine and Metallurgical Plant since 2004/2005 are shown in Figure 49 and Figure 50 respectively. The annual dose for the last year has been dominated by radon decay product exposure in the Mine and by dust exposure in the Process Plant, in particular, due to polonium-210 in the Smelter.
0
2
4
6
8
10
12
14
16
18
20
2005/2006 2006/2007 2007/2008 2008/2009 2009/2010
Period
Dos
e (m
Sv)
Dust Average (mSv) RDP. Average (mSv) Gamma Average (mSv) MAX. Total Dose
Figure 49 – Mine Annual dose trend
Employee Doses Page 41
Annual Radiation Protection Report July 2009 - June 2010
0
2
4
6
8
10
12
14
16
18
20
2005/2006 2006/2007 2007/2008 2008/2009 2009/2010
Period
Dose
(mSv
)
Dust Average (mSv) RDP. Average (mSv) Gamma Average (mSv) MAX. Total Dose
Figure 50 – Plant Annual Dose Trend
3.4 Doses to Members of the Public The full assessment of doses to members of the public will be presented separately in the Environmental Management and Monitoring Report.
For all members of the public, the effective dose from the operation, for the period July 2009 to June 2010 was well below the statutory limit of 1 mSv per annum. Estimated maximum operational related doses are shown in Table J.
Table J – Public Doses
2009/2010 dose to Members of the Dose Public living at (mSv) Dose Limit (mSv)
Roxby Downs 0.008 1 Olympic Dam Village 0.009 1
Page 42 Doses to Members of the Public

July 2009 - June 2010 Annual Radiation Protection Report
0.00
0.10
0.20
0.30
0.40
0.50
0.60
0.70
0.80
0.90
1.00
1.10
1991 1992 1993 1994 1995 1996 1997 1998 1999 2000 2001 2002 2003 2004 FY05 FY06 FY07 FY08 FY09 FY10
Dos
e eq
uiva
lent
(mSv
/yr)
Roxby Downs Olympic Dam Village Detection Limit Legislative Limit
Figure 51 – Total Dose Trend for Olympic Dam Village and Roxby Downs
Shown in Figure 51 are the public dose trends for Olympic Dam Village and Roxby Downs since 1991. It is clear from the above graph that dose to the members of the public has not increased above the minimum detection limit of 0.048 mSv in all the monitoring periods.
3.5 Radiation Management Plan (RMP) During the 2009/2010 reporting period a draft Radiation Management Plan has been submitted to the Environment Protection Agency (EPA) for comment. The process of approval of these documents will be the main focus in the 2010/2011 reporting period. Until such time the existing approved Radiation Management Plan is still in use and valid.
Employee Doses Page 43

Annual Radiation Protection Report July 2009 - June 2010
Page 44 Radiation Management Plan (RMP)
4 CONCLUSION An extensive program of radiation monitoring and dose assessment is in place at Olympic Dam. The knowledge gained in the previous year during the dust recycle project at the Smelter has been applied to not only efficiently produce additional copper, but also reduce doses. The Clark shaft incident and resulting plant shutdown created abnormally low metallurgical plant doses. Doses for most areas are expected to return to normal historical levels in the following year at typical production rates
Assessment of employees’ doses for the period 1st July 2009 to 30th June 2010 has shown that, out of a total of 945 designated employees, no employee received a dose greater than 37% of the annual dose limit of 20 mSv. The average dose to all designated employees was 2.5 mSv, with a maximum dose of 7.3 mSv.
The average dose to the 3060 non-designated employees was 0.8 mSv, with a maximum dose of 3.9 mSv.

July 2009 - June 2010 Annual Radiation Protection Report
APPENDIX A Page 45
APPENDIX A Dose Conversion Factors 2009/2010
A summary of the airborne dust dose conversion factors for specific work areas can be viewed in the following table.
Table K - Dust Dose Conversion Factors
DCF Location
(µSv.m3/Bq.hr)
Smelter 7.5
Refinery / STP 5.4
SX / Precipitation / Calciners 4.5
Other* 4.1
*All other areas of Mine, Concentrator, Slag Concentrator, Hydromet and Services (Laboratories and Metallurgical Workshop)
The default RDP dose conversion factor used was 1.41 mSv.m3/mJ.hr (5 mSv/WLM).


