Annual R epor t JPMor gan Eur opean Investmen t Trust … · JPMor gan Eur opean Investmen t Trust...
94
JPMorgan European Investment Trust plc Annual Report & Accounts Year Ended 31st March 2009 Annual Report 09
Transcript of Annual R epor t JPMor gan Eur opean Investmen t Trust … · JPMor gan Eur opean Investmen t Trust...
JPMorgan European Investment Trust plc
Annual Report & Accounts Year Ended 31st March 2009
Annual Report09
GR
OW
TH
SH
AR
ES
JPMorgan European Investment Trust plc. Annual Report & Accounts 20092
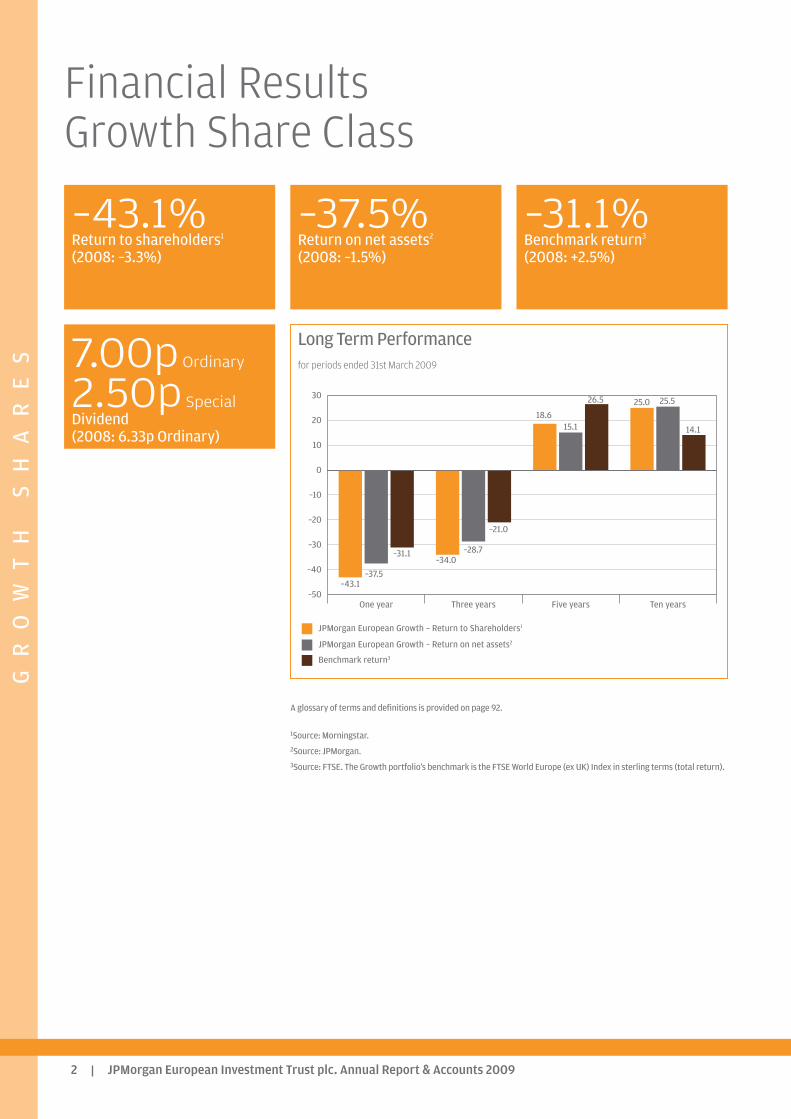
Financial ResultsGrowth Share Class
–50
–40
–30
–20
–10
0
10
20
30
Benchmark return3
JPMorgan European Growth – Return on net assets2
JPMorgan European Growth – Return to Shareholders1
Ten yearsFive yearsThree yearsOne year
–43.1–37.5
–31.1–34.0
–28.7
–21.0
18.615.1
26.5 25.0 25.5
14.1
Long Term Performancefor periods ended 31st March 2009
–43.1%Return to shareholders1
(2008: –3.3%)
–37.5%Return on net assets2
(2008: –1.5%)
–31.1%Benchmark return3
(2008: +2.5%)
7.00pOrdinary
2.50pSpecialDividend(2008: 6.33p Ordinary)
A glossary of terms and definitions is provided on page 92.
1Source: Morningstar.2Source: JPMorgan.3Source: FTSE. The Growth portfolio’s benchmark is the FTSE World Europe (ex UK) Index in sterling terms (total return).
IN
CO
ME
SH
AR
ES
JPMorgan European Investment Trust plc. Annual Report & Accounts 2009 3
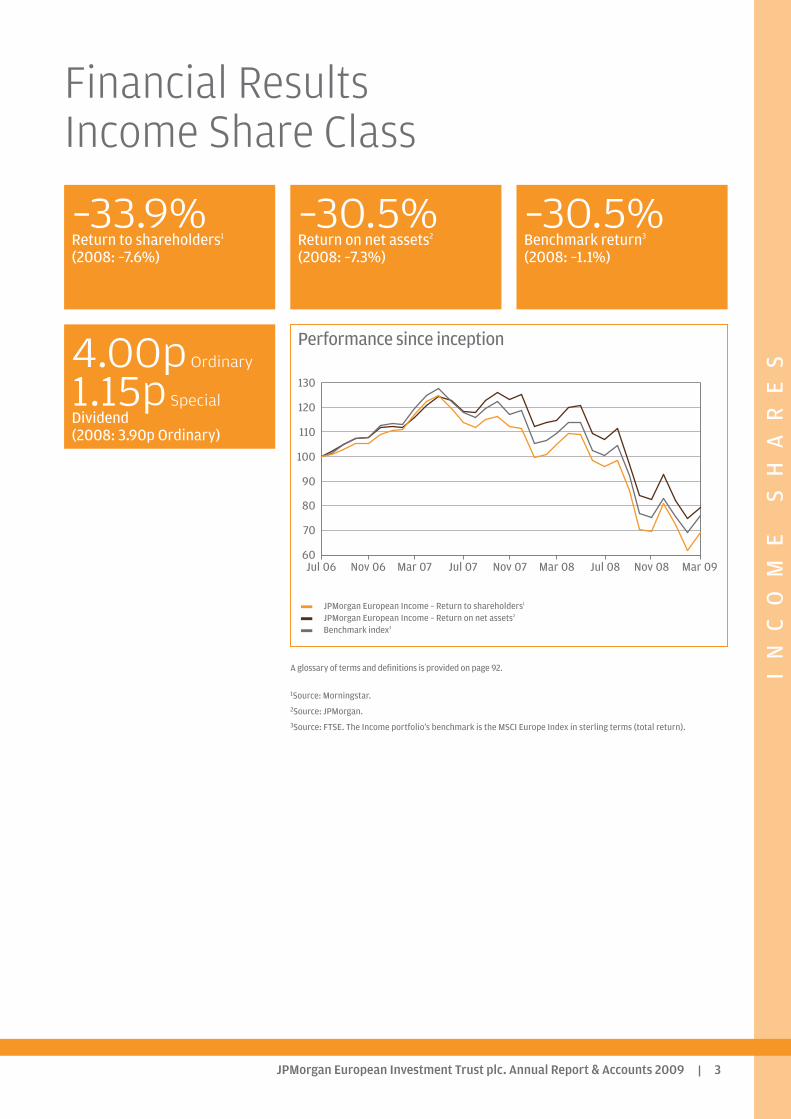
Financial ResultsIncome Share Class
60
70
80
90
100
110
120
130
Mar 09Nov 08Jul 08Mar 08Nov 07Jul 07Mar 07Nov 06Jul 06
Performance since inception
–33.9%Return to shareholders1
(2008: –7.6%)
–30.5%Return on net assets2
(2008: –7.3%)
–30.5%Benchmark return3
(2008: –1.1%)
4.00pOrdinary
1.15pSpecialDividend(2008: 3.90p Ordinary)
A glossary of terms and definitions is provided on page 92.
1Source: Morningstar.2Source: JPMorgan.3Source: FTSE. The Income portfolio’s benchmark is the MSCI Europe Index in sterling terms (total return).
JPMorgan European Income – Return to shareholders1
JPMorgan European Income – Return on net assets2
Benchmark index3

TH
EC
OM
PA
NY
JPMorgan European Investment Trust plc. Annual Report & Accounts 20094
Features
Contents
About the Company
2 Financial Results5 Chairman’s Statement
Investment Review
12 Investment Managers’ Report
Growth Shares
18 Summary of Results 19 Ten Year Financial Record 20 Ten Largest Investments 21 Portfolio Analyses 23 List of Investments 28 Income Statement 29 Balance Sheet
Income Shares
30 Summary of Results31 Ten Largest Investments32 Portfolio Analyses34 List of Investments38 Income Statement39 Balance Sheet
Directors’ Report
40 Board of Directors41 Directors’ Report49 Corporate Governance
Accounts
53 Directors’ Remuneration Report55 Directors’ Responsibilities in Respect
of the Accounts56 Independent Auditors’ Report58 Income Statement59 Statement of Total Recognised Gains
and Losses60 Reconciliation of Movements in
Shareholders’ Funds61 Balance Sheet62 Cash Flow Statement63 Notes to the Accounts
Shareholder Information
86 Information about the Company87 Capital Structure and Conversion
between Share Classes88 Shareholder Analysis – Growth89 Shareholder Analysis – Income90 Notice of Annual General Meeting92 Glossary of Terms
Objectives
Growth Capital growth from Continental European investments, by consistentoutperformance of the benchmark and a rising share price over the longer term bytaking carefully controlled risks through an investment method that is clearlycommunicated to shareholders.
Income To provide a growing income together with the potential for long-term capital growthfrom a diversified portfolio of investments in pan-European stockmarkets.
Investment Policies
Growth - To invest in a diversified portfolio of investments in the stockmarkets of
Continental Europe. - To emphasise capital growth rather than income, with the likely result that the
dividend will fluctuate. - To use borrowings to increase potential returns to shareholders. - To invest no more than 15% of the assets attributable to the Growth shares in other
UK listed investment companies (including investment trusts).
Income - To invest in a diversified portfolio of investments in pan-European stockmarkets. - To provide a growing income together with the potential for long-term capital
growth. - To manage liquidity and borrowings to increase returns to shareholders. - To invest no more than 15% of the assets attributable to the Income shares in other
UK listed investment companies (including investment trusts).
Benchmarks
Growth The FTSE World Europe (ex UK) Index in sterling terms (total return).
Income The MSCI Europe Index in sterling terms (total return).
Capital Structure
The Company has an authorised share capital of 354,328,617 Growth shares of 5peach and 114,142,765 Income shares of 2.5p each.
As at the year end 126,799,002 Growth shares and 58,502,745 Income shares werein issue.
Management Company
The Company employs JPMorgan Asset Management (UK) Limited (‘JPMAM’ or the‘Manager’) to manage its assets.

TH
EC
OM
PA
NY
JPMorgan European Investment Trust plc. Annual Report & Accounts 2009 5
Chairman’s Statement
This introductory statement is part of the Director’s report which continues on page 41.
Performance
I am sorry to report that, as a result of substantial underperformance this year, yourBoard has failed to achieve one of its foremost duties: to ensure that the net assetvalue of the Company’s Growth portfolio out-performs its benchmark index over thelong term; that is, over periods of 3 years and longer.
The net asset value of the Growth shares fell by 37.5% over the year under review(after management expenses), compared with a fall of ‘only’ 31.1% in its benchmark(the FTSE World Europe Index (ex UK), in sterling terms, with no managementexpenses). This under-performance of 6.4%, following the under-performance of4.0% last year, has dragged the relative performance of your Company over threeand five years into negative territory; a very unhappy result.
I excused the underperformance of the Growth portfolio last year on the basis thatone year’s results need not be of particular significance, since the goal is forout-performance over the long term and that there was then a healthy averageannual out-performance over the previous three, five and ten years of 0.3%, 0.8%and 1.5%, respectively. This is no longer the case. While the out-performance of theGrowth shares over ten years is still intact at an annual average of 0.9%, the recentfive and three year periods now show under-performance of 1.6% and 3.4% perannum, respectively.
The performance of the Income portfolio has also been disappointing, although it isnot yet old enough to have compiled a three year performance record. Launched inAugust 2006, over its first eight months to the year ended 31st March 2007 its netasset value rose by 16.5% compared with the 15.7% rise in its benchmark, the MSCIEurope Index, in sterling terms; a positive relative performance of 0.8%. But thenrelative performance plunged, its NAV under-performing the benchmark by 6.2% in2008. I wrote last year that “it must now begin to move ahead smartly if it is toachieve a positive capital return after three years.” But it has fallen by a further30.5% in 2009, exactly in line with the index. Overall, the Income portfolio hasunderperformed its benchmark at the rate of 1.1% per annum over its first 32 months.
The fact that the credit crunch induced the worst economic scenario since the GreatDepression, and torrid stock markets in which few, if any, long-only funds could makeabsolute returns, is an irrelevance. The material fact is the disappointing performanceof your Company relative to the market. Your Company has no mandate to dodge thedirection of equities by investing widely in other assets, although it can lessen orincrease the impact by holding cash or introducing gearing – an important factorwhich I turn to below. Whatever the circumstances, your Company invests inEuropean markets in the confident expectation that the long-run trend in their equityprices is upward and that the Manager’s skills will tilt the portfolio towards theout-performing stocks within those markets. Your Board does not necessarily expectthe Manager to produce positive relative results for shareholders each and everyyear. But it does expect it to produce positive returns over rolling three year periodsand longer. If the Manager fails to meet that expectation your Board has theobligation to consider seriously whether their re-appointment is in the best interestsof shareholders.
TH
EC
OM
PA
NY
JPMorgan European Investment Trust plc. Annual Report & Accounts 20096
The Investment Process
In my statement last year I reported that the stock-picking system used by theManagers to identify best-of-value and best-of-growth shares had resulted in suddenand significant under-performance when the credit crunch hit, causing as it didsudden and extreme loss of confidence in all financial markets. I noted that “since theprocess has shown divergence at previous climacterics (‘periods pertaining to orconstituting a critical period in human life’) your Board has instituted a review of theinvestment process to see if lessons can be learned.” The continuing impact of thecredit crunch through 2008 and in particular in the weeks following the collapse ofLehman Brothers, over the week-end of September 13th/14th , made the year anideal laboratory for conducting this review.
The factors that undermined performance in 2007/8 were exactly the factors thatundermined performance in 2008/9. These factors were that the proxies used by theprocess to identify ‘growth’ and ‘value’ shares have not shown themselves to beindicators of positive share price performance when market confidence is at a lowebb and near panic ensues. The review examined the performance over the lasttwenty years of the top quintile of ‘growth and ‘value’ shares that are specificallysought out by the process. The ‘growth’ proxy (positive individual share pricemomentum in relation to the market, catalysing purchase when confirmed by upwardearnings estimates from investment analysts) indeed identified companies whichproceeded to out-perform. The ‘value’ proxy (a low multiple of price to earnings)indeed identified companies which provided stability to the portfolio when marketswere choppy, while not stifling performance when growth shares were exuberant.But in abnormally severe downturns these proxies no longer applied. At majordownward-turning points – as in 1998, at several points during the 2000-2003 bearmarket, and in 2008 – the ‘value’ shares abandoned their role as portfolio stabilisersand fell further than the market, as did their ‘growth’ associates.
The Investment Managers’ Report on page 12 fully explains all the factors thatundermined performance this year. The matter for your Board has been to re-justifyits confidence in the stock selection process so that it can confidently, and in yourbest interests, re-appoint the Manager. In more detail, our review has revealed that,over the last twenty years at least, the process of selecting shares from the topquintile of ‘growth’ and ‘value’ shares has out-performed by an average of +2.0% intwo thirds of the 229 months since the end of 1989; and that, in fewer than one thirdof those months, over the same time frame, has under-performed by the averagelesser amount of –1.7%. This is positive evidence that the process should produceout-performance in the long run. But the review also showed that the results arevolatile over short periods. While the number of outperforming months wastwo thirds of the total over the whole twenty year period, there was significantinconsistency over rolling twelve month periods. In one year the out-performancewas in every month of the year but in four of the years out-performance was onlyachieved one third of the time. The consistency of the process thus varied widelybetween 100% and 33%. And 2008 was one of the four years when success was atthe very bottom of the range. Perhaps we can be encouraged by the fact that therewere strong recoveries in relative performance following the previous years when theprocess failed two-thirds of the time (and that there has indeed been a strongrecovery in relative performance in recent months).
Chairman’s Statement continued

TH
EC
OM
PA
NY
JPMorgan European Investment Trust plc. Annual Report & Accounts 2009 7
Your Board has concluded that this evidence is sufficiently robust to justifyconfidence in the long run success of the process. Importantly, your Board was alsoencouraged to note that the Manager is constantly testing the continuing validity ofthe proxies for ‘value’ and ‘growth’ and is constantly looking for, and back-testing,potential alternatives. It is a frequently-observed phenomenon that static systemslose their validity almost from the moment that they become accepted. So yourBoard was relieved to note that the process is dynamic; it will keep itself updated inthis regard.
The specific purpose of the review was to extract useful lessons and to implementthem for the future benefit of our shareholders. The Board is exploring two mainlessons. The first is that the main proxy used for ‘growth’ – positive share pricemomentum relative to the market – may correlate more closely with short-termmovements in stock prices rather than with the fundamental economics of a businessthat should drive long-term outperformance. The process selects upward earningsrevisions by analysts as the catalyst for buying shares with positive price momentumrather than ‘earnings growth’ itself. Perhaps expectation is more influential thanreality in the short-term, but in the long-run actual earnings growth must be thedecisive factor. This suggests that the time-measure for success is essentiallyshort-term and that success in the long term depends upon consistently stitchingtogether the series of short term successes. Price momentum and (false) expectationscan lead to excessive valuations, so the value proxy is crucial. To the extent that theprocess is a following strategy, using the rear-view mirror, it must inevitably be‘behind the curve’ at major and sudden turning points, lagging the market especiallyin periods of panic. Only human analysis and judgement can exercise foresight andthere is a danger that the existence of a strong process may inhibit this. Following thereview, your Board urged the Manager to encourage individual insights, particularlyat times of potential exuberance or despair.
Secondly, over-confidence that the process assures long term out-performance mightencourage the Investment Managers to remain fully invested and geared at all times.In a previous statement I have myself noted that “investors only had to be out ofequities for the 50 most critical months (out of the then-720 months since the end ofthe second world war) for the annualised rate of return to fall below 5%, comparedwith the return of 14% for those who remained fully invested at all times”. But theregular appearance of bear markets suggests that a process, to be rigorous andconsistently useful, should be for all seasons and especially for ones of such severitythat they threaten to undo years of out-performance. Although many politicians,bankers and commentators have noted how unforeseeable was the credit crunch(they would, wouldn’t they?), some might say it was flagged for more than a yearbefore the full consequences hit. It is not only with the benefit of hindsight, therefore,to regret that the Investment Managers’ discretion to move into cash was notexploited. The dark clouds were scrutinised at Board meetings and I apologise toshareholders for not steering those conversations more forcefully. In previous yearsthe Investment Managers’ tactical deployment of gearing has been highly effective.This year, as a consequence of positive price momentum in the first half of the year,historically-low valuations and encouraging sentiment indicators, gearing wasincreased to 110% over the summer months, just before the market crash,exacerbating the under-performance of top-quintile growth and value shares when
TH
EC
OM
PA
NY
JPMorgan European Investment Trust plc. Annual Report & Accounts 20098
the crash came. The difference between being 10% in cash or 10% geared is2 percentage points in relative performance for every 10 percentage points of marketmovement; more than enough to have turned this year’s under-performance intoout-performance.
Re-appointment of the Manager
Every year the Board reviews the performance of the Manager in each category of itsactivities. In the Board’s view there has been notable continuing progress inmarketing and shareholder communications (although some statistics still needsharpening up on the greatly-improved web-site). The administration and staff workhas been to the usual very high standard. Unlike many of its competitors, JPMorganhas emerged from a very difficult year with its brand enhanced. But, of course, themost critical factor in the Board’s decision to re-appoint the Manager is continuingevidence that it will deliver out-performance of the benchmark over the long term.Your Company must return to delivering ‘what it says on the tin’ or there must bechanges. On the basis of the supportive outcome of its review, your Board is contentto reappoint the Manager for 2009/10. It will, however, continue to monitor closelythe portfolio’s performance, and the continuing evolution of the investment process,and is prepared to take all necessary steps to ensure that the Company delivers thelevel of long-term out-performance which shareholders can justifiably expect.
Gearing
The ability to gear returns by borrowing is a key advantage that investment trusts haveover other investment fund structures. As noted above it adds to risk but, so long asequities increase in value, gearing should work to the long-term benefit ofshareholders if the timing of its deployment is well-judged. The rate of interest on theborrowing also has bearing. In 1999 the Company borrowed q35 million by way ofbank loan and in 2001 a further q100 million by way of Floating Rate Note. The interestrate on both loans was fixed by swap contracts. Given that interest rates have fallensignificantly, your Board unwound the swap arrangements last August, thankfullybefore the counterparties, Lehman Brothers and Royal Bank of Scotland, those twopillars of the financial establishment, succumbed to the Samsonian embrace of thecredit crunch. The effect has been to reduce the average interest rate payable by theCompany from over 6% to the current 2.3%. The q35 million loan is due for repaymentin December 2009 and the FRN in June 2011, at which dates decisions will be taken onwhether, and on what terms, to renew.
Discount Management
As is usually the case in troubled markets, a widening discount of share price to netasset value per share has made the fall in the total return to shareholders worse thanthe fall in net asset value alone. Total return to shareholders was -43.1% and -33.9%on the Growth and Income shares respectively, compared with the -37.5% and -30.5%falls in net asset value. The range of discounts varied widely over the year on bothclasses of share; between 3.8% and 18.1% on the Growth shares and between 2.2%and 17.7% on the Income shares.
The Company reorganised in August 2006, creating the Income shares. At the time,the Company announced a revised discount control policy under which it would
Chairman’s Statement continued

TH
EC
OM
PA
NY
JPMorgan European Investment Trust plc. Annual Report & Accounts 2009 9
repurchase shares with the aim of establishing long-term levels of discount for boththe Growth shares and Income shares at or below 5% (with debt valued at par). Thispolicy was introduced at that time in light of then benign market conditions and thediscount at which the ordinary shares were trading.
Since then, the Company has bought back 28m Income shares and 57m Growthshares. Notwithstanding the level of buybacks, the 12 month average discount forthe Income Shares has widened to 8% and, for the Growth Shares, to 10%. Marketconditions have remained volatile and the average discount of the funds in theCompany’s peer group have widened from 5.4% as at 31st July 2006 to 10.7% as at22nd May 2009.
Accordingly, and in consultation with a number of the Company’s largestshareholders, the Board has revisited the discount control policy. It remains of theview that it is important to seek to address imbalances in the supply of and demandfor the Company’s shares and to minimise thereby the volatility and absolute level ofthe discount to net asset value at which the Company’s shares trade. Whilst it remainsthe long term aim of the Company to maintain the discount on both share classes ator below 5% (with debt at fair value), in current market conditions it has beendeemed prudent, for the time being, to allow for slightly greater discounts, shouldthey develop. Nonetheless, your Board would not wish to see the discounts widenbeyond 10%. The precise level and timing of any repurchases carried out pursuant tothe policy will depend upon prevailing market conditions at the relevant time. TheBoard will continue to monitor this policy in light of market conditions.
Dividends
It has been a good year for dividends. Although that happy outcome is not a primaryobjective of the Growth portfolio, it has paid 9.5p per share on the Growth shares,giving them a yield of 8.2% on the year-end share price of 116.5p per share. Paymentshave amounted to 5.15p on the Income shares, giving them a yield of 8.5% on theyear-end share price of 60.3p. These payments were enhanced by the sum of£6.2 million recovered from previous payments of VAT on management fees, plusinterest, which, as I reported last year, the European Court of Justice had ruled wereunlawfully levied by HM Revenue and Customs. This special element of the dividendsamounted to 2.5p for the Growth shares and 1.15p for the Income shares. Withoutthese special elements the above yields would have been 6.0% and 6.6%respectively. Looking ahead, the current economic climate suggests that it may bedifficult to maintain the cash level of dividends next year, though we are confidentthat yields will remain significantly higher than those available from holding cash.The Board continues to have under review ways in which the difference in dividendpayments between the Growth and Income shares might be increased, it being feltpreferable by the Board that Income shares should, if possible, offer a moresignificant premium on yield over the Growth shares.
Board of Directors
As previously announced, there have been two changes to the Board over the year.In anticipation of Alex Zagoreos’s retirement last December, Stephen Goldman wasappointed in September. He has a wide experience of investing in European equities.
TH
EC
OM
PA
NY
JPMorgan European Investment Trust plc. Annual Report & Accounts 200910
Following 12 years at NM Rothschild Asset Management, in the pension department,where he was promoted to lead the UK Equity Research team, he joined JPMorgan in1990 as Head of the UK Portfolio Management and the European Client PortfolioManagement teams. In 2000 he moved to Credit Suisse Asset Management asManaging Director and Head of Equities for the European Region. He was responsiblefor the equity teams throughout Europe which managed both specialist and balancedmandates for both institutional and retail clients.
Your Board is fortunate in attracting a candidate of his experience and I will bedelighted to introduce Stephen to shareholders who can attend the AGM in July,when he will stand for formal election to the Board.
The Directors retiring and standing for re-election will be Ferdinand Verdonck andRobin Faber.
Annual General Meeting
Please note that the venue for the AGM has changed from that of recent years, beingheld this year at the Armourer’s Hall, 81 Coleman Street, London EC2R 5BJ onThursday, 16th July at 12 noon. A presentation by the Investment Managers will befollowed by the formal proceedings and a buffet lunch, when shareholders can meetthe Directors and Managers for informal conversation.
It would be helpful if shareholders seeking answers to detailed questions put them inwriting beforehand, addressed to the Company Secretary, JPMorgan EuropeanInvestment Trust plc, Finsbury Dials, 20 Finsbury Street, London EC2Y 9AQ.Alternatively, questions may be submitted to the Company’s website. Shareholderswho are unable to attend the meeting are encouraged to use their proxy votes.Shareholders who hold their shares through CREST are able to lodge their proxyvotes electronically.
Outlook
Arguably, the credit crunch has been the greatest specifically-financial shock to theglobal economic system in the history of the world. The unprecedented evaporationof credit has removed a substantial quantity of the fuel that powered economicgrowth over the last decade (some estimates put it at $120 trillion of lost credit, giventhat $4 trillion of assets will be written off at leverage of 30:1). Not surprisingly,therefore, the global economy could be settling into the deepest and most uniformrecession world-wide since the early nineteen thirties. I wrote in my statement lastyear that “the likelihood of a slowdown in consumer spending generally seemsinevitable” and that “the outlook for share prices in the short-term looks decidedlyuncertain.” Since then markets have fallen by some 40% with those highly-gearedsectors most affected by the credit crunch falling by 80% and more – to depths moreprofound than they plumbed at the bottom of the last bear market in 2003. Whilecorporate profits will be squeezed for as long as consumer spending is depressed, themassive injections of central funding around the world suggest that economic activitywill be buoyed and hence consumer spending will return. The comprehensiveerosion of government finances around the world creates new space for the private
Chairman’s Statement continued

TH
EC
OM
PA
NY
JPMorgan European Investment Trust plc. Annual Report & Accounts 2009 11
sector. Markets anticipate. Thus the long term outlook for shares is rosy. The financialsector is unlikely to suffer again for many years the agonies of the last twelve months.It must, as usual, lead the way out of recession and is therefore particularly attractivefor investors who can stand the volatility. The extent and timing of the upside is, ofcourse, uncertain. The economic system has been badly hurt and is fragile, not leastin the Euro area. Naturally, there will be set-backs and bear market rallies along theway. But bull markets climb a wall of worry and usually begin when the outlook isgloomiest. As long as markets settle into their normal pattern of rewardingcompanies with expanding prospects, and the access to capital to finance them, thelong term direction of share prices from here is much more likely to be up than down.Given a return to normal evaluation by the market of individual equities’ relativemerits, and with the lessons learnt from last year’s experience, your Board looksforward to the Manager’s investment process returning to deliver long termout-performance again, by continuing to select a portfolio from the best of valueand growth.
Andrew MurisonChairman 8th June 2009

TH
EC
OM
PA
NY
JPMorgan European Investment Trust plc. Annual Report & Accounts 200912
Stephen Macklow-Smith
Alexander Fitzalan Howard
Investment Managers’ Report
Performance
Last year we said that the year under review was a difficult one for equity investment.Little did we suspect that the next year would be the most difficult in 70 years, and wepropose in this report to examine in considerable detail the background to whathappened. For the Growth portfolio the NAV fell by 37.5% and the share price by43.1% (both on a total return basis) against a benchmark that fell by 31.1%. One year,however, is a very short period over which to judge what are by definition long-terminvestment assets and over three years the share price and NAV have fallen at acompound annual rate of 12.9% and 10.7% respectively against a benchmark whichhas fallen at a compound annual rate of 7.6%. Over five years the share price and NAVhave shown a compound annual growth rate of 3.5% and 2.9% respectively against abenchmark which has shown a compound annual growth rate of 4.8%. Over ten yearsthe share price and NAV have both shown a compound annual growth rate of 2.3%against a benchmark which has compounded at 1.3%. The Income portfolio saw itsshare price fall by 33.9% but the NAV matched the benchmark performance, bothfalling by 30.5%. Since launch, the share price and NAV for the Income portfolio havefallen at a compound annual rate of 10.6% and 8.4% respectively against abenchmark which has fallen at a compound annual rate of 7.3%. It goes withoutsaying that our performance is shown net of all costs involved in running theCompany, including investment management charges, whereas the performance ofthe benchmark is not hampered by those charges.
When we launched the Income portfolio we stated in the prospectus that we felt itwould deliver a yield of between 3.25% and 3.5%. Last year the Income portfolio paidan ordinary dividend of 4.0p net (a yield of 4% on the initial issue price of £1.00) and aspecial dividend of 1.15p net. One of the aims of the Income portfolio is to deliver asteadily growing stream of income over time and although we think it is unlikely thatthe level of dividend paid by the broader market is going to increase in the next yearor so, nevertheless the current yield on the Income shares of 6.9% makes the sharesattractive compared to the yields available from cash.
Up until the end of the second quarter of 2008 our process was out-performing: inthe second half of the calendar year the underlying process under-performed and theunder-performance was exacerbated by the fact that we were geared in Septemberwhen Lehman Brothers was allowed to fail and the equity market fell dramatically.
Market Background
It is only now that the full impact of the Lehman failure is becoming apparent. Thiswas not confined to the financial markets but has had a profound impact on the widereconomy, as shown by the Gross Domestic Product figures for the fourth quarter,especially those from Asia which saw a steep decline in exports. This seems to havebeen a function not only of dramatic de-stocking, as companies hoarded cash, butalso of the failure of the financial market related to letters of credit and trade finance.Coming into the Lehman debacle, dry-bulk shipping rates had halved in the previousfour months. In the space of ten weeks after the Lehman failure they collapsed by86%.
In a recent speech, Mervyn King alluded to the Lehman failure as a critical catalyst inthe banking and solvency crisis which engulfed the global economy, but went on tosay that, in his view, even if Lehman had been saved there would have been anothercatalyst. His view has now been backed up by Janet Yellen, the president of the San

TH
EC
OM
PA
NY
JPMorgan European Investment Trust plc. Annual Report & Accounts 2009 13
Francisco Federal Reserve, who said in a recent speech in New York that shedisagreed with Federal Reserve officials who argued in September that a governmentbailout of Lehman would encourage excessive risk-taking among investors. Sheadded that the impact of Lehman’s failure “was devastating . . . That’s when this crisistook a quantum leap up in terms of seriousness”. Whether this is correct or not, thefact is that before the Lehman debacle, the situation for many banks was that whilethey had toxic assets which they needed to write down, they also had profitablelending businesses in other areas and also in the case of the European banks theyhad fee-earning businesses in the area of personal savings. Once the sub-prime crisishad broken in May 2007 banks were playing for time, but the strategy was modestlysuccessful: they could generate a stream of quarterly profits from their ordinarybusinesses against which they could take write-offs on the exotica. It was evenpossible for some banks to raise new capital. After Lehman however, two thingshappened: the first was that the stream of profitable business dried up completely aseveryone in the market hoarded cash, meaning that there were no further quarterlyprofits against which to take write-offs. The second was that the Lehman failurewiped out not only the equity holders but the bond-holders as well and thiscompletely torpedoed the confidence of investors, who suddenly preferred to takean annualised yield of 0.01% on treasury bills than incur any risk at all.
In this environment the collapse in demand further undermined the domestic andcommercial real estate markets, as well as pushing many small and medium-sizedcompanies close to insolvency putting yet further pressure on the banking system, asbanks were now faced not only with write-offs on asset-backed securities, but with asudden escalation of loan-loss provisioning on their domestic and commercial loanbook, as well as on corporate lending and credit cards.
Since the collapse of Lehman we have had a series of initiatives from policy-makersand central banks around the world to try to restore confidence to financial markets,and we are waiting to see what the effect of quantitative easing will be in the US andthe UK. At the moment the impact is unclear, although it is not impossible that therewill be a modest short-term recovery in growth. The key problems remain, however,the continued deleveraging, the crisis of confidence which has brought the velocity ofmoney close to zero and the collapse in world trade. Against this background it is nothelpful to have politicians indulging in the kind of protectionist rhetoric which may intheir eyes play well with the voters but which reminds those with a sense of history ofthe mistakes made in the 1930s.
Performance attribution
The attribution analysis shown elsewhere in this report reveals a sharp dichotomybetween the performance of the Growth and Income portfolios. Both took the sametactical gearing decisions at the same time. Having not been geared into the initial fallin equity markets in the second calendar quarter of 2008, the indicators that we useto assist in timing gearing decisions showed that markets were oversold, thatvaluations were attractive, and that sentiment had become very negative. Wetherefore geared both portfolios by 10% in late July and in the early stages thisdecision was vindicated by a rise in the level of the market. When the Lehman failurewas announced, however, the market went into very sharp reverse and the rangesthat had served historically to delimit market moves in valuation, sentiment andmomentum broke emphatically to the downside. To take one example, the Composite
TH
EC
OM
PA
NY
JPMorgan European Investment Trust plc. Annual Report & Accounts 200914
Investment Managers’ Reportcontinued
Valuation Indicator which we use as a proxy for market valuation moved from being2 standard deviations cheap (a level which had served as a floor to the market in theemerging markets crisis of 1998 and again in 2003) to nearly 4 standard deviationscheap, a level it had never reached before.
Gearing
Our gearing therefore cost us performance, although we were able to use theincrease in interest rates on credit in the summer of 2008 to break the swap andenable the company to benefit from subsequent easing of monetary policy. At a stockselection level, however, the experience of the two portfolios was very different, withthe Income portfolio adding value through stock selection, while the Growthportfolio’s stock selection detracted from returns. The underlying philosophy in bothportfolios is the same, however the Income portfolio differs in implementation in acouple of important respects. First, the Income portfolio defines value using dividendyield, whereas the Growth portfolio defines value using the ratio between price andearnings. In our previous financial year, yield investing had been out of favour withinvestors and as a result the Income portfolio had under-performed. This yearhowever, investors became hungry for yield, especially as interest rates on cash andfixed income fell and therefore higher-yielding stocks did well against the broadermarket. All other metrics for measuring value under-performed however, andtherefore in the Growth portfolio our exposure to cheap stocks did not help us toout-perform the market. Not only that, but in the section of the portfolio which seeksto benefit from holding stocks exhibiting good price momentum relative to themarket, the stocks which had performed well in the first half of the calendar year –mainly in the commodities, energy, and cyclical areas, suddenly started tounder-perform in the second half, even though the news on profits which theyannounced in the third quarter was good and ahead of market estimates. At the timeof the Lehman’s failure, there was a headlong rush into supposedly defensive sectorssuch as Healthcare and Food Manufacturing, an area of the market where we wereunderweight. Because we are fairly sector-neutral, we had an exposure to financialsthroughout this period: in this area we were actually successful in picking good stocksand avoiding the disasters (especially those stocks which flirted with or fell into publicownership) however, this was not enough to offset stock selection elsewhere.
Stock Selection
This is the second successive year in which stock selection has detracted fromperformance in the Growth portfolio and this is unsatisfactory. We did do however,an enormous amount of research over the course of the year in order to refine themeasures that we use and to verify that there was no underlying problem with thesystem that we use for gauging attractiveness for individual stocks and we presentedthe results of this to the board. The conclusion was that the set-backs in 2007 and2008 did not invalidate the long-term case for buying cheap stocks with a catalyst tocrystallise out-performance and stocks exhibiting good price momentum supportedby strong positive profits progression. From a longer-term perspective, stockselection has added 1.1% of value annually to our performance in the Growthportfolio for the last 10 years. In the last five years, it has detracted 0.5% from annualperformance with a strong positive contribution in the years to March 2006 andMarch 2007 offset by weakness in the last two years. These figures tend to supportour contention that for all the problems of the last eighteen months, the longer-term
TH
EC
OM
PA
NY
JPMorgan European Investment Trust plc. Annual Report & Accounts 2009 15
track record of our investment process withstands scrutiny. It is also worthremembering that the threat of a systemic crisis in global banking is (thankfully)extremely rare and the way in which volatility spiked to unprecedented levels in 2008suggests that a recurrence of these events is extremely unlikely in any realistic timehorizon.
Market outlook
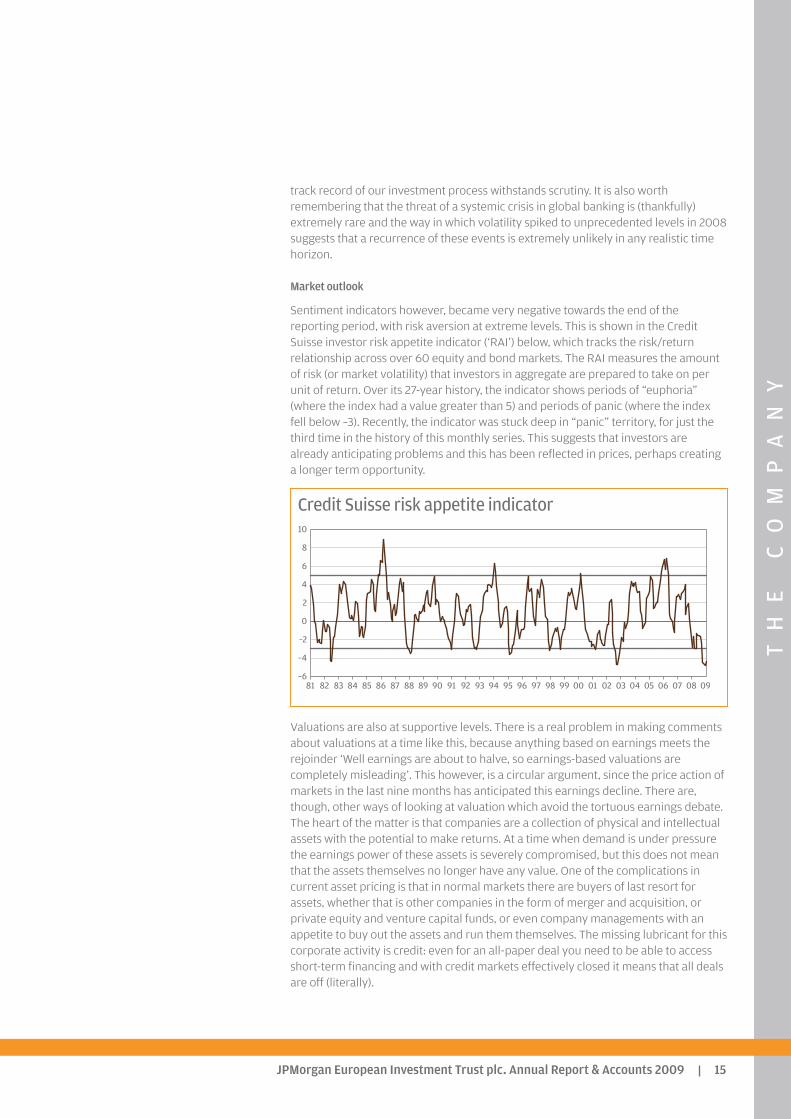
Sentiment indicators however, became very negative towards the end of thereporting period, with risk aversion at extreme levels. This is shown in the CreditSuisse investor risk appetite indicator (‘RAI’) below, which tracks the risk/returnrelationship across over 60 equity and bond markets. The RAI measures the amountof risk (or market volatility) that investors in aggregate are prepared to take on perunit of return. Over its 27-year history, the indicator shows periods of “euphoria”(where the index had a value greater than 5) and periods of panic (where the indexfell below –3). Recently, the indicator was stuck deep in “panic” territory, for just thethird time in the history of this monthly series. This suggests that investors arealready anticipating problems and this has been reflected in prices, perhaps creatinga longer term opportunity.
Credit Suisse risk appetite indicator
Valuations are also at supportive levels. There is a real problem in making commentsabout valuations at a time like this, because anything based on earnings meets therejoinder ‘Well earnings are about to halve, so earnings-based valuations arecompletely misleading’. This however, is a circular argument, since the price action ofmarkets in the last nine months has anticipated this earnings decline. There are,though, other ways of looking at valuation which avoid the tortuous earnings debate.The heart of the matter is that companies are a collection of physical and intellectualassets with the potential to make returns. At a time when demand is under pressurethe earnings power of these assets is severely compromised, but this does not meanthat the assets themselves no longer have any value. One of the complications incurrent asset pricing is that in normal markets there are buyers of last resort forassets, whether that is other companies in the form of merger and acquisition, orprivate equity and venture capital funds, or even company managements with anappetite to buy out the assets and run them themselves. The missing lubricant for thiscorporate activity is credit: even for an all-paper deal you need to be able to accessshort-term financing and with credit markets effectively closed it means that all dealsare off (literally).
–6
–4
–2
0
2
4
6
8
10
0908070605040302010099989796959493929190898887868584838281
TH
EC
OM
PA
NY
JPMorgan European Investment Trust plc. Annual Report & Accounts 200916
Investment Managers’ Reportcontinued
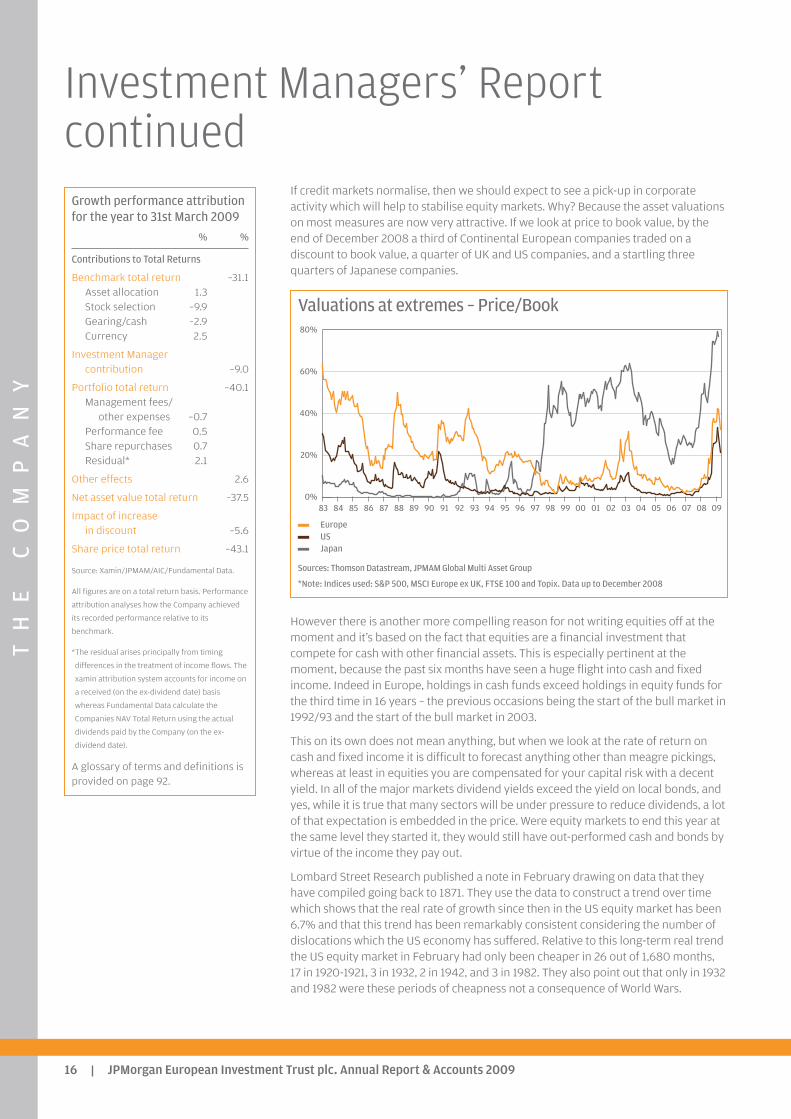
If credit markets normalise, then we should expect to see a pick-up in corporateactivity which will help to stabilise equity markets. Why? Because the asset valuationson most measures are now very attractive. If we look at price to book value, by theend of December 2008 a third of Continental European companies traded on adiscount to book value, a quarter of UK and US companies, and a startling threequarters of Japanese companies.
Valuations at extremes – Price/Book
EuropeUSJapan
Sources: Thomson Datastream, JPMAM Global Multi Asset Group
*Note: Indices used: S&P 500, MSCI Europe ex UK, FTSE 100 and Topix. Data up to December 2008
However there is another more compelling reason for not writing equities off at themoment and it’s based on the fact that equities are a financial investment thatcompete for cash with other financial assets. This is especially pertinent at themoment, because the past six months have seen a huge flight into cash and fixedincome. Indeed in Europe, holdings in cash funds exceed holdings in equity funds forthe third time in 16 years – the previous occasions being the start of the bull market in1992/93 and the start of the bull market in 2003.
This on its own does not mean anything, but when we look at the rate of return oncash and fixed income it is difficult to forecast anything other than meagre pickings,whereas at least in equities you are compensated for your capital risk with a decentyield. In all of the major markets dividend yields exceed the yield on local bonds, andyes, while it is true that many sectors will be under pressure to reduce dividends, a lotof that expectation is embedded in the price. Were equity markets to end this year atthe same level they started it, they would still have out-performed cash and bonds byvirtue of the income they pay out.
Lombard Street Research published a note in February drawing on data that theyhave compiled going back to 1871. They use the data to construct a trend over timewhich shows that the real rate of growth since then in the US equity market has been6.7% and that this trend has been remarkably consistent considering the number ofdislocations which the US economy has suffered. Relative to this long-term real trendthe US equity market in February had only been cheaper in 26 out of 1,680 months,17 in 1920-1921, 3 in 1932, 2 in 1942, and 3 in 1982. They also point out that only in 1932and 1982 were these periods of cheapness not a consequence of World Wars.
0%
20%
40%
60%
80%
090807060504030201009998979695949392919089888786858483
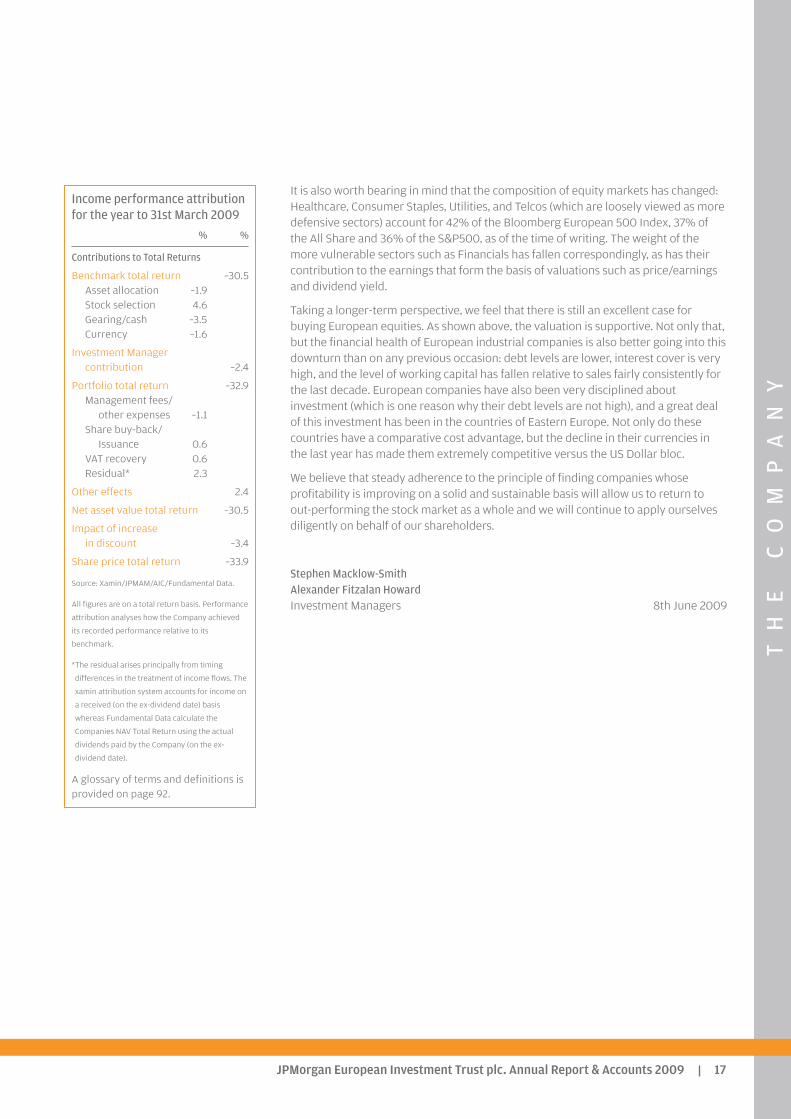
Growth performance attributionfor the year to 31st March 2009
% %
Contributions to Total Returns
Benchmark total return –31.1Asset allocation 1.3Stock selection –9.9Gearing/cash –2.9Currency 2.5
Investment Managercontribution –9.0
Portfolio total return –40.1Management fees/
other expenses –0.7Performance fee 0.5Share repurchases 0.7Residual* 2.1
Other effects 2.6
Net asset value total return –37.5
Impact of increase in discount –5.6
Share price total return –43.1
Source: Xamin/JPMAM/AIC/Fundamental Data.
All figures are on a total return basis. Performance
attribution analyses how the Company achieved
its recorded performance relative to its
benchmark.
*The residual arises principally from timing
differences in the treatment of income flows. The
xamin attribution system accounts for income on
a received (on the ex-dividend date) basis
whereas Fundamental Data calculate the
Companies NAV Total Return using the actual
dividends paid by the Company (on the ex-
dividend date).
A glossary of terms and definitions isprovided on page 92.
TH
EC
OM
PA
NY
JPMorgan European Investment Trust plc. Annual Report & Accounts 2009 17
It is also worth bearing in mind that the composition of equity markets has changed:Healthcare, Consumer Staples, Utilities, and Telcos (which are loosely viewed as moredefensive sectors) account for 42% of the Bloomberg European 500 Index, 37% ofthe All Share and 36% of the S&P500, as of the time of writing. The weight of themore vulnerable sectors such as Financials has fallen correspondingly, as has theircontribution to the earnings that form the basis of valuations such as price/earningsand dividend yield.
Taking a longer-term perspective, we feel that there is still an excellent case forbuying European equities. As shown above, the valuation is supportive. Not only that,but the financial health of European industrial companies is also better going into thisdownturn than on any previous occasion: debt levels are lower, interest cover is veryhigh, and the level of working capital has fallen relative to sales fairly consistently forthe last decade. European companies have also been very disciplined aboutinvestment (which is one reason why their debt levels are not high), and a great dealof this investment has been in the countries of Eastern Europe. Not only do thesecountries have a comparative cost advantage, but the decline in their currencies inthe last year has made them extremely competitive versus the US Dollar bloc.
We believe that steady adherence to the principle of finding companies whoseprofitability is improving on a solid and sustainable basis will allow us to return toout-performing the stock market as a whole and we will continue to apply ourselvesdiligently on behalf of our shareholders.
Stephen Macklow-SmithAlexander Fitzalan HowardInvestment Managers 8th June 2009
Income performance attributionfor the year to 31st March 2009
% %
Contributions to Total Returns
Benchmark total return –30.5Asset allocation –1.9Stock selection 4.6Gearing/cash –3.5Currency –1.6
Investment Managercontribution –2.4
Portfolio total return –32.9Management fees/
other expenses –1.1Share buy-back/
Issuance 0.6VAT recovery 0.6Residual* 2.3
Other effects 2.4
Net asset value total return –30.5
Impact of increasein discount –3.4
Share price total return –33.9
Source: Xamin/JPMAM/AIC/Fundamental Data.
All figures are on a total return basis. Performance
attribution analyses how the Company achieved
its recorded performance relative to its
benchmark.
*The residual arises principally from timing
differences in the treatment of income flows. The
xamin attribution system accounts for income on
a received (on the ex-dividend date) basis
whereas Fundamental Data calculate the
Companies NAV Total Return using the actual
dividends paid by the Company (on the ex-
dividend date).
A glossary of terms and definitions isprovided on page 92.
GR
OW
TH
SH
AR
ES
JPMorgan European Investment Trust plc. Annual Report & Accounts 200918
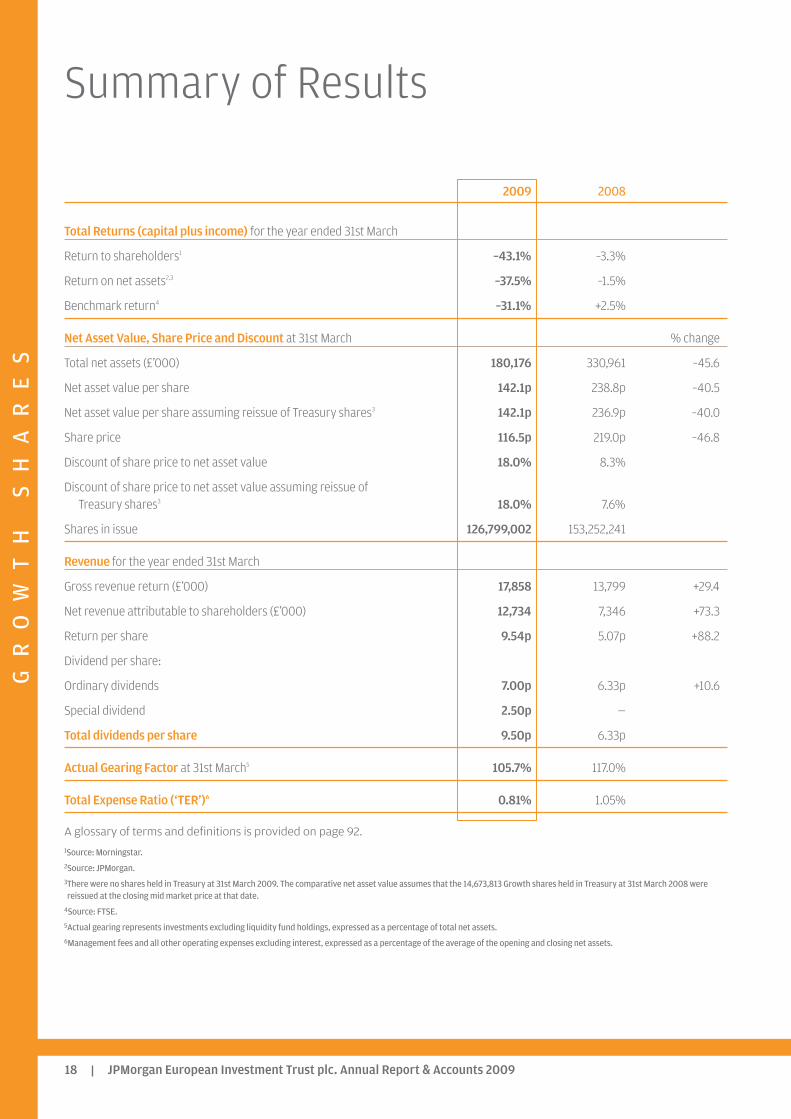
2009 2008
Total Returns (capital plus income) for the year ended 31st March
Return to shareholders1 –43.1% –3.3%
Return on net assets2,3 –37.5% –1.5%
Benchmark return4 –31.1% +2.5%
Net Asset Value, Share Price and Discount at 31st March % change
Total net assets (£’000) 180,176 330,961 –45.6
Net asset value per share 142.1p 238.8p –40.5
Net asset value per share assuming reissue of Treasury shares3 142.1p 236.9p –40.0
Share price 116.5p 219.0p –46.8
Discount of share price to net asset value 18.0% 8.3%
Discount of share price to net asset value assuming reissue of Treasury shares3 18.0% 7.6%
Shares in issue 126,799,002 153,252,241
Revenue for the year ended 31st March
Gross revenue return (£’000) 17,858 13,799 +29.4
Net revenue attributable to shareholders (£’000) 12,734 7,346 +73.3
Return per share 9.54p 5.07p +88.2
Dividend per share:
Ordinary dividends 7.00p 6.33p +10.6
Special dividend 2.50p —
Total dividends per share 9.50p 6.33p
Actual Gearing Factor at 31st March5 105.7% 117.0%
Total Expense Ratio (‘TER’)6 0.81% 1.05%
A glossary of terms and definitions is provided on page 92.
1Source: Morningstar.2Source: JPMorgan.3There were no shares held in Treasury at 31st March 2009. The comparative net asset value assumes that the 14,673,813 Growth shares held in Treasury at 31st March 2008 werereissued at the closing mid market price at that date.
4Source: FTSE. 5Actual gearing represents investments excluding liquidity fund holdings, expressed as a percentage of total net assets.6Management fees and all other operating expenses excluding interest, expressed as a percentage of the average of the opening and closing net assets.
Summary of Results
GR
OW
TH
SH
AR
ES
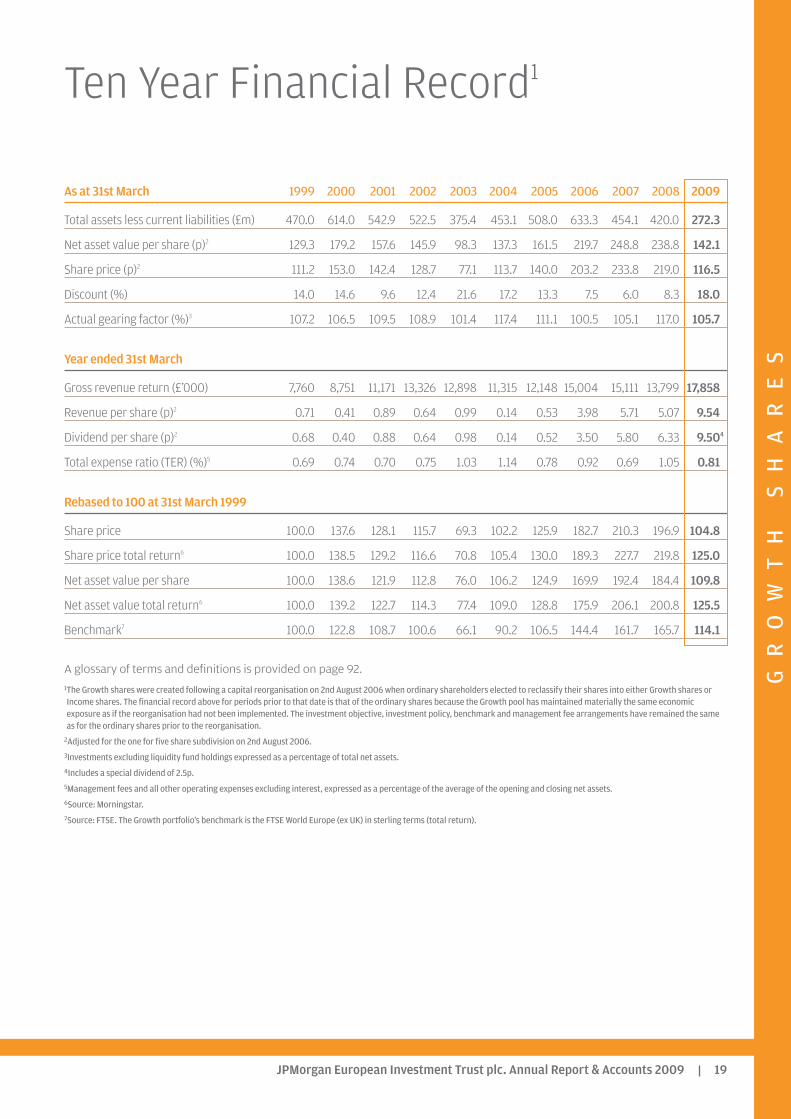
As at 31st March 1999 2000 2001 2002 2003 2004 2005 2006 2007 2008 2009
Total assets less current liabilities (£m) 470.0 614.0 542.9 522.5 375.4 453.1 508.0 633.3 454.1 420.0 272.3
Net asset value per share (p)2 129.3 179.2 157.6 145.9 98.3 137.3 161.5 219.7 248.8 238.8 142.1
Share price (p)2 111.2 153.0 142.4 128.7 77.1 113.7 140.0 203.2 233.8 219.0 116.5
Discount (%) 14.0 14.6 9.6 12.4 21.6 17.2 13.3 7.5 6.0 8.3 18.0
Actual gearing factor (%)3 107.2 106.5 109.5 108.9 101.4 117.4 111.1 100.5 105.1 117.0 105.7
Year ended 31st March
Gross revenue return (£’000) 7,760 8,751 11,171 13,326 12,898 11,315 12,148 15,004 15,111 13,799 17,858
Revenue per share (p)2 0.71 0.41 0.89 0.64 0.99 0.14 0.53 3.98 5.71 5.07 9.54
Dividend per share (p)2 0.68 0.40 0.88 0.64 0.98 0.14 0.52 3.50 5.80 6.33 9.504
Total expense ratio (TER) (%)5 0.69 0.74 0.70 0.75 1.03 1.14 0.78 0.92 0.69 1.05 0.81
Rebased to 100 at 31st March 1999
Share price 100.0 137.6 128.1 115.7 69.3 102.2 125.9 182.7 210.3 196.9 104.8
Share price total return6 100.0 138.5 129.2 116.6 70.8 105.4 130.0 189.3 227.7 219.8 125.0
Net asset value per share 100.0 138.6 121.9 112.8 76.0 106.2 124.9 169.9 192.4 184.4 109.8
Net asset value total return6 100.0 139.2 122.7 114.3 77.4 109.0 128.8 175.9 206.1 200.8 125.5
Benchmark7 100.0 122.8 108.7 100.6 66.1 90.2 106.5 144.4 161.7 165.7 114.1
A glossary of terms and definitions is provided on page 92.
1The Growth shares were created following a capital reorganisation on 2nd August 2006 when ordinary shareholders elected to reclassify their shares into either Growth shares orIncome shares. The financial record above for periods prior to that date is that of the ordinary shares because the Growth pool has maintained materially the same economicexposure as if the reorganisation had not been implemented. The investment objective, investment policy, benchmark and management fee arrangements have remained the sameas for the ordinary shares prior to the reorganisation.
2Adjusted for the one for five share subdivision on 2nd August 2006.3Investments excluding liquidity fund holdings expressed as a percentage of total net assets.4Includes a special dividend of 2.5p.5Management fees and all other operating expenses excluding interest, expressed as a percentage of the average of the opening and closing net assets.6Source: Morningstar.7Source: FTSE. The Growth portfolio’s benchmark is the FTSE World Europe (ex UK) in sterling terms (total return).
Ten Year Financial Record1
JPMorgan European Investment Trust plc. Annual Report & Accounts 2009 19
GR
OW
TH
SH
AR
ES
JPMorgan European Investment Trust plc. Annual Report & Accounts 200920
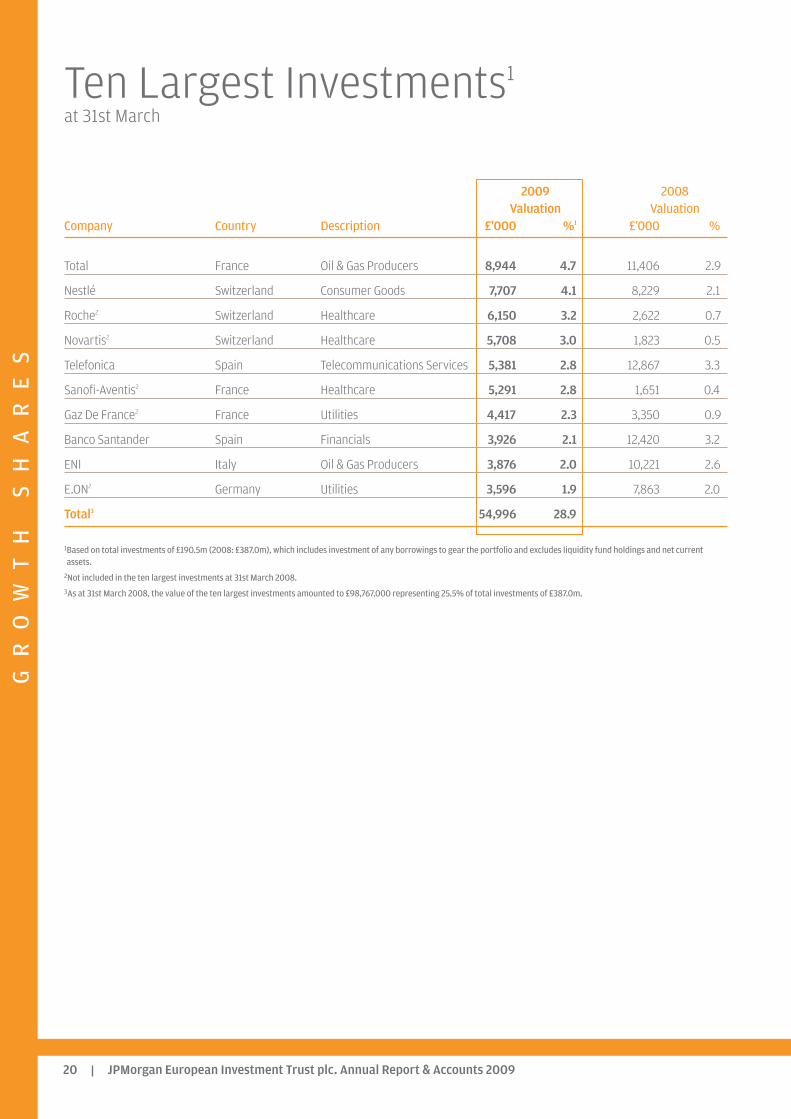
2009 2008Valuation Valuation
Company Country Description £’000 %1 £’000 %
Total France Oil & Gas Producers 8,944 4.7 11,406 2.9
Nestlé Switzerland Consumer Goods 7,707 4.1 8,229 2.1
Roche2 Switzerland Healthcare 6,150 3.2 2,622 0.7
Novartis2 Switzerland Healthcare 5,708 3.0 1,823 0.5
Telefonica Spain Telecommunications Services 5,381 2.8 12,867 3.3
Sanofi-Aventis2 France Healthcare 5,291 2.8 1,651 0.4
Gaz De France2 France Utilities 4,417 2.3 3,350 0.9
Banco Santander Spain Financials 3,926 2.1 12,420 3.2
ENI Italy Oil & Gas Producers 3,876 2.0 10,221 2.6
E.ON2 Germany Utilities 3,596 1.9 7,863 2.0
Total3 54,996 28.9
1Based on total investments of £190.5m (2008: £387.0m), which includes investment of any borrowings to gear the portfolio and excludes liquidity fund holdings and net currentassets.
2Not included in the ten largest investments at 31st March 2008.3As at 31st March 2008, the value of the ten largest investments amounted to £98,767,000 representing 25.5% of total investments of £387.0m.
Ten Largest Investments1
at 31st March
GR
OW
TH
SH
AR
ES
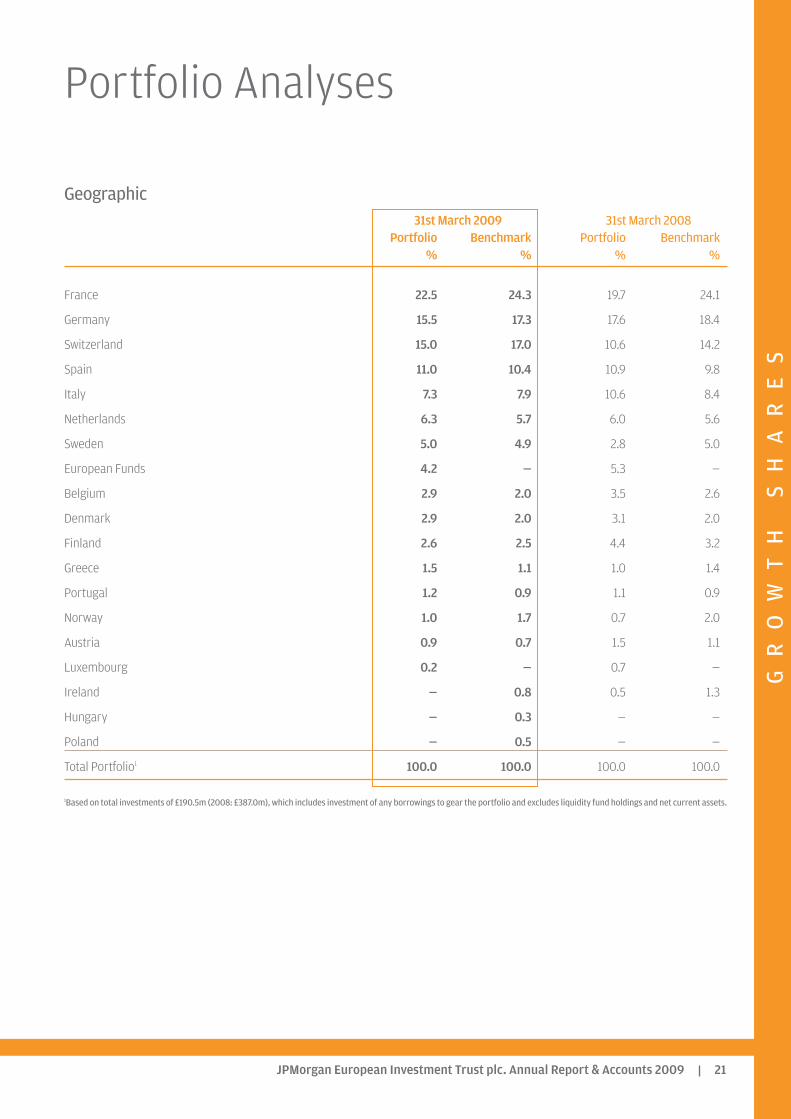
Geographic31st March 2009 31st March 2008
Portfolio Benchmark Portfolio Benchmark% % % %
France 22.5 24.3 19.7 24.1
Germany 15.5 17.3 17.6 18.4
Switzerland 15.0 17.0 10.6 14.2
Spain 11.0 10.4 10.9 9.8
Italy 7.3 7.9 10.6 8.4
Netherlands 6.3 5.7 6.0 5.6
Sweden 5.0 4.9 2.8 5.0
European Funds 4.2 — 5.3 —
Belgium 2.9 2.0 3.5 2.6
Denmark 2.9 2.0 3.1 2.0
Finland 2.6 2.5 4.4 3.2
Greece 1.5 1.1 1.0 1.4
Portugal 1.2 0.9 1.1 0.9
Norway 1.0 1.7 0.7 2.0
Austria 0.9 0.7 1.5 1.1
Luxembourg 0.2 — 0.7 —
Ireland — 0.8 0.5 1.3
Hungary — 0.3 — —
Poland — 0.5 — —
Total Portfolio1 100.0 100.0 100.0 100.0
1Based on total investments of £190.5m (2008: £387.0m), which includes investment of any borrowings to gear the portfolio and excludes liquidity fund holdings and net current assets.
Portfolio Analyses
JPMorgan European Investment Trust plc. Annual Report & Accounts 2009 21
GR
OW
TH
SH
AR
ES
JPMorgan European Investment Trust plc. Annual Report & Accounts 200922
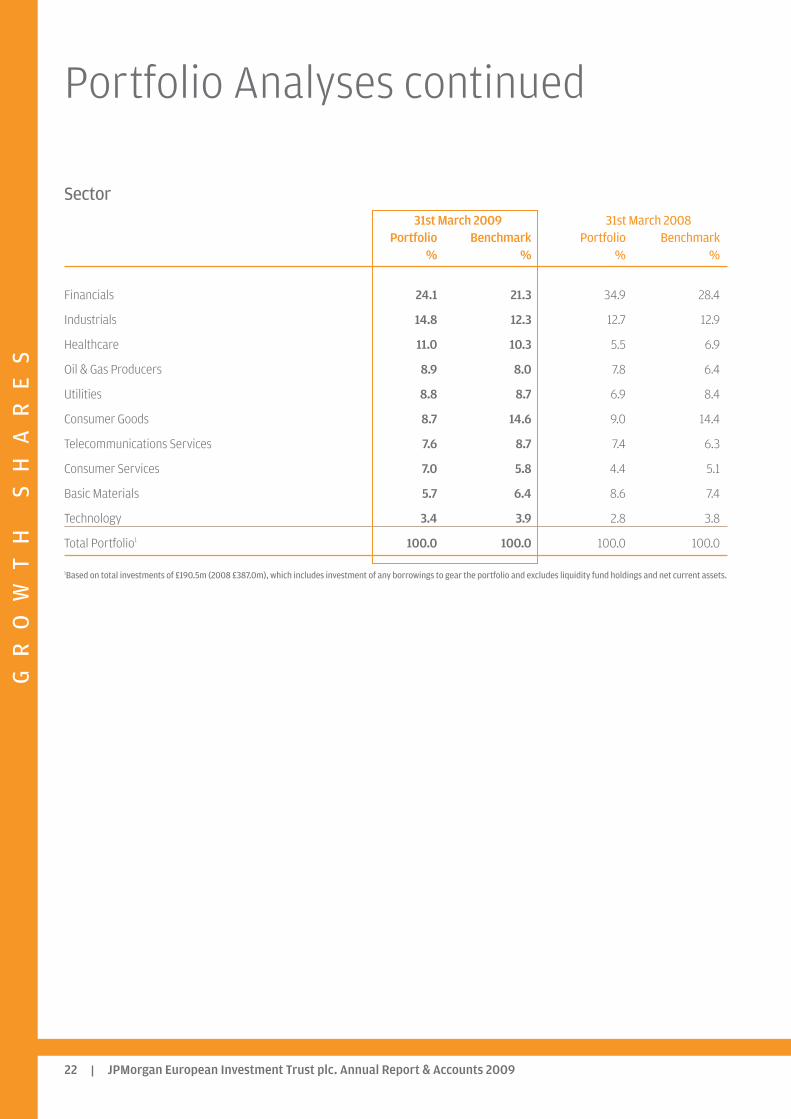
Sector31st March 2009 31st March 2008
Portfolio Benchmark Portfolio Benchmark% % % %
Financials 24.1 21.3 34.9 28.4
Industrials 14.8 12.3 12.7 12.9
Healthcare 11.0 10.3 5.5 6.9
Oil & Gas Producers 8.9 8.0 7.8 6.4
Utilities 8.8 8.7 6.9 8.4
Consumer Goods 8.7 14.6 9.0 14.4
Telecommunications Services 7.6 8.7 7.4 6.3
Consumer Services 7.0 5.8 4.4 5.1
Basic Materials 5.7 6.4 8.6 7.4
Technology 3.4 3.9 2.8 3.8
Total Portfolio1 100.0 100.0 100.0 100.0
1Based on total investments of £190.5m (2008 £387.0m), which includes investment of any borrowings to gear the portfolio and excludes liquidity fund holdings and net current assets.
Portfolio Analyses continued
GR
OW
TH
SH
AR
ES
JPMorgan European Investment Trust plc. Annual Report & Accounts 2009 23
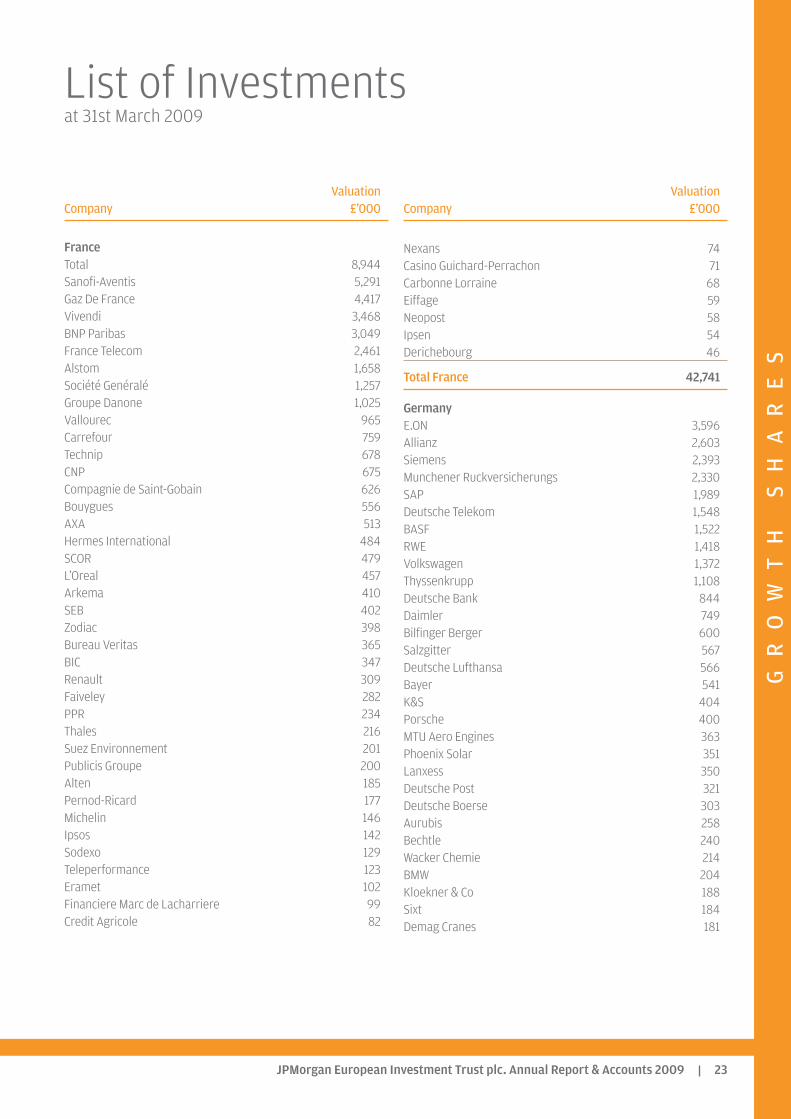
ValuationCompany £’000
FranceTotal 8,944Sanofi-Aventis 5,291Gaz De France 4,417Vivendi 3,468BNP Paribas 3,049France Telecom 2,461Alstom 1,658Société Genéralé 1,257Groupe Danone 1,025Vallourec 965Carrefour 759Technip 678CNP 675Compagnie de Saint-Gobain 626Bouygues 556AXA 513Hermes International 484SCOR 479L’Oreal 457Arkema 410SEB 402Zodiac 398Bureau Veritas 365BIC 347Renault 309Faiveley 282PPR 234Thales 216Suez Environnement 201Publicis Groupe 200Alten 185Pernod-Ricard 177Michelin 146Ipsos 142Sodexo 129Teleperformance 123Eramet 102Financiere Marc de Lacharriere 99Credit Agricole 82
ValuationCompany £’000
Nexans 74Casino Guichard-Perrachon 71Carbonne Lorraine 68Eiffage 59Neopost 58Ipsen 54Derichebourg 46
Total France 42,741
GermanyE.ON 3,596Allianz 2,603Siemens 2,393Munchener Ruckversicherungs 2,330SAP 1,989Deutsche Telekom 1,548BASF 1,522RWE 1,418Volkswagen 1,372Thyssenkrupp 1,108Deutsche Bank 844Daimler 749Bilfinger Berger 600Salzgitter 567Deutsche Lufthansa 566Bayer 541K&S 404Porsche 400MTU Aero Engines 363Phoenix Solar 351Lanxess 350Deutsche Post 321Deutsche Boerse 303Aurubis 258Bechtle 240Wacker Chemie 214BMW 204Kloekner & Co 188Sixt 184Demag Cranes 181
List of Investmentsat 31st March 2009
GR
OW
TH
SH
AR
ES
JPMorgan European Investment Trust plc. Annual Report & Accounts 200924
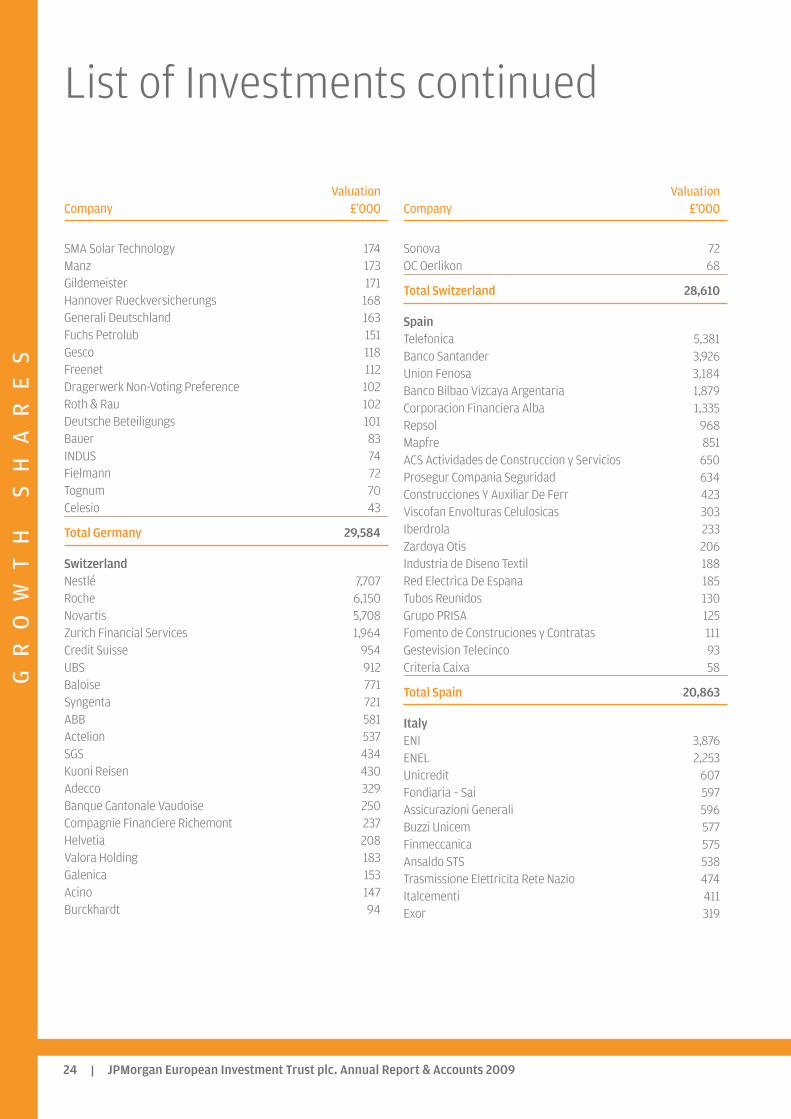
List of Investments continued
ValuationCompany £’000
SMA Solar Technology 174Manz 173Gildemeister 171Hannover Rueckversicherungs 168Generali Deutschland 163Fuchs Petrolub 151Gesco 118Freenet 112Dragerwerk Non-Voting Preference 102Roth & Rau 102Deutsche Beteiligungs 101Bauer 83INDUS 74Fielmann 72Tognum 70Celesio 43
Total Germany 29,584
SwitzerlandNestlé 7,707Roche 6,150Novartis 5,708Zurich Financial Services 1,964Credit Suisse 954UBS 912Baloise 771Syngenta 721ABB 581Actelion 537SGS 434Kuoni Reisen 430Adecco 329Banque Cantonale Vaudoise 250Compagnie Financiere Richemont 237Helvetia 208Valora Holding 183Galenica 153Acino 147Burckhardt 94
ValuationCompany £’000
Sonova 72OC Oerlikon 68
Total Switzerland 28,610
SpainTelefonica 5,381Banco Santander 3,926Union Fenosa 3,184Banco Bilbao Vizcaya Argentaria 1,879Corporacion Financiera Alba 1,335Repsol 968Mapfre 851ACS Actividades de Construccion y Servicios 650Prosegur Compania Seguridad 634Construcciones Y Auxiliar De Ferr 423Viscofan Envolturas Celulosicas 303Iberdrola 233Zardoya Otis 206Industria de Diseno Textil 188Red Electrica De Espana 185Tubos Reunidos 130Grupo PRISA 125Fomento de Construciones y Contratas 111Gestevision Telecinco 93Criteria Caixa 58
Total Spain 20,863
ItalyENI 3,876ENEL 2,253Unicredit 607Fondiaria – Sai 597Assicurazioni Generali 596Buzzi Unicem 577Finmeccanica 575Ansaldo STS 538Trasmissione Elettricita Rete Nazio 474Italcementi 411Exor 319
GR
OW
TH
SH
AR
ES
JPMorgan European Investment Trust plc. Annual Report & Accounts 2009 25
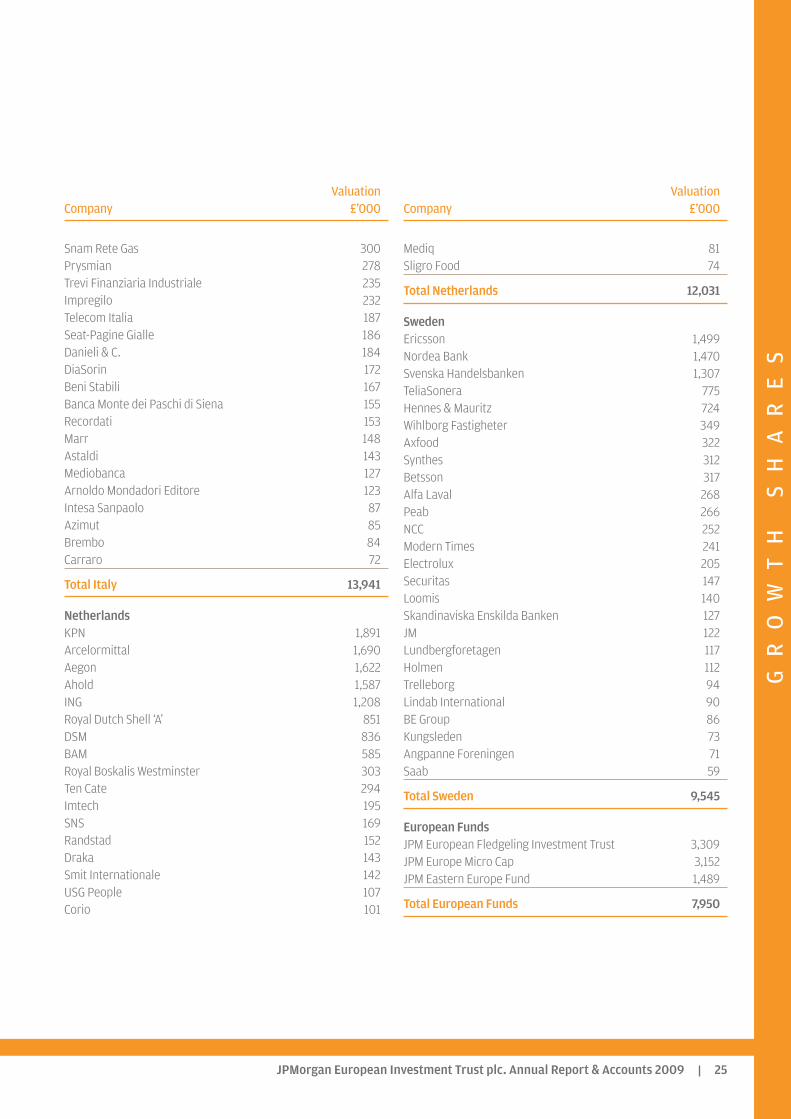
ValuationCompany £’000
Snam Rete Gas 300Prysmian 278Trevi Finanziaria Industriale 235Impregilo 232Telecom Italia 187Seat-Pagine Gialle 186Danieli & C. 184DiaSorin 172Beni Stabili 167Banca Monte dei Paschi di Siena 155Recordati 153Marr 148Astaldi 143Mediobanca 127Arnoldo Mondadori Editore 123Intesa Sanpaolo 87Azimut 85Brembo 84Carraro 72
Total Italy 13,941
NetherlandsKPN 1,891Arcelormittal 1,690Aegon 1,622Ahold 1,587ING 1,208Royal Dutch Shell ‘A’ 851DSM 836BAM 585Royal Boskalis Westminster 303Ten Cate 294Imtech 195SNS 169Randstad 152Draka 143Smit Internationale 142USG People 107Corio 101
ValuationCompany £’000
Mediq 81Sligro Food 74
Total Netherlands 12,031
SwedenEricsson 1,499Nordea Bank 1,470Svenska Handelsbanken 1,307TeliaSonera 775Hennes & Mauritz 724Wihlborg Fastigheter 349Axfood 322Synthes 312Betsson 317Alfa Laval 268Peab 266NCC 252Modern Times 241Electrolux 205Securitas 147Loomis 140Skandinaviska Enskilda Banken 127JM 122Lundbergforetagen 117Holmen 112Trelleborg 94Lindab International 90BE Group 86Kungsleden 73Angpanne Foreningen 71Saab 59
Total Sweden 9,545
European FundsJPM European Fledgeling Investment Trust 3,309JPM Europe Micro Cap 3,152JPM Eastern Europe Fund 1,489
Total European Funds 7,950
GR
OW
TH
SH
AR
ES
JPMorgan European Investment Trust plc. Annual Report & Accounts 200926
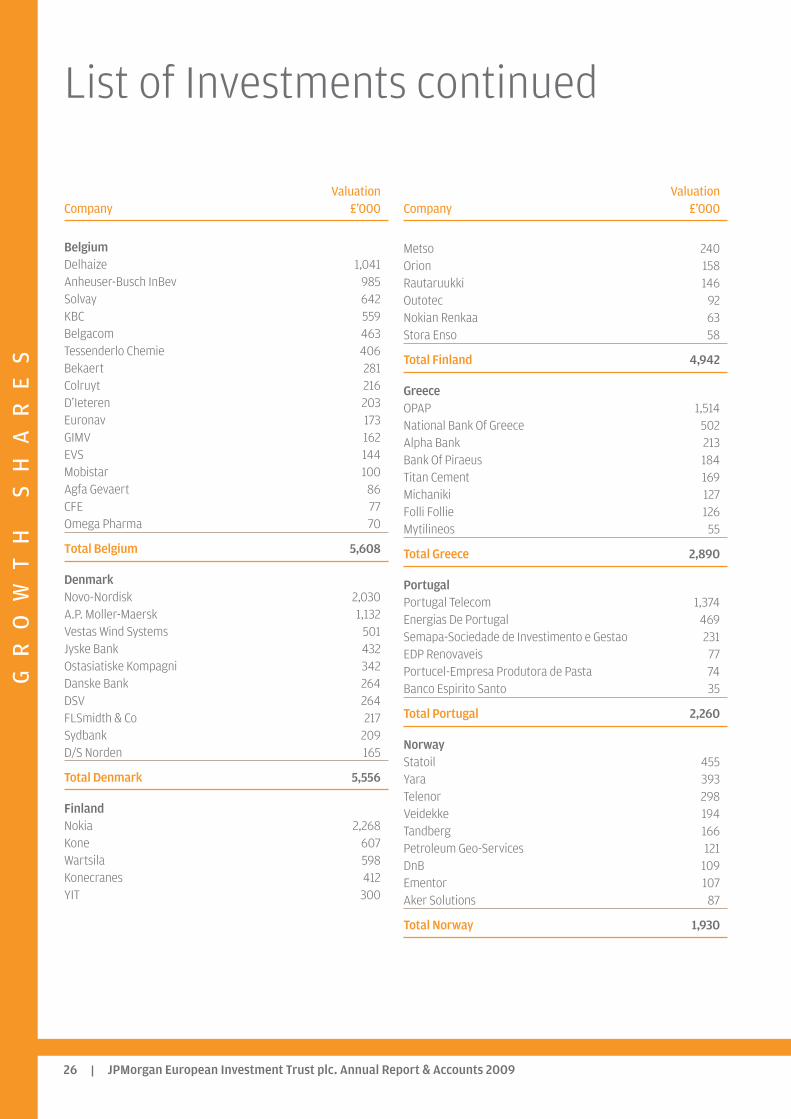
ValuationCompany £’000
BelgiumDelhaize 1,041Anheuser-Busch InBev 985Solvay 642KBC 559Belgacom 463Tessenderlo Chemie 406Bekaert 281Colruyt 216D’Ieteren 203Euronav 173GIMV 162EVS 144Mobistar 100Agfa Gevaert 86CFE 77Omega Pharma 70
Total Belgium 5,608
DenmarkNovo-Nordisk 2,030A.P. Moller-Maersk 1,132Vestas Wind Systems 501Jyske Bank 432Ostasiatiske Kompagni 342Danske Bank 264DSV 264FLSmidth & Co 217Sydbank 209D/S Norden 165
Total Denmark 5,556
FinlandNokia 2,268Kone 607Wartsila 598Konecranes 412YIT 300
ValuationCompany £’000
Metso 240Orion 158Rautaruukki 146Outotec 92Nokian Renkaa 63Stora Enso 58
Total Finland 4,942
GreeceOPAP 1,514National Bank Of Greece 502Alpha Bank 213Bank Of Piraeus 184Titan Cement 169Michaniki 127Folli Follie 126Mytilineos 55
Total Greece 2,890
PortugalPortugal Telecom 1,374Energias De Portugal 469Semapa-Sociedade de Investimento e Gestao 231EDP Renovaveis 77Portucel-Empresa Produtora de Pasta 74Banco Espirito Santo 35
Total Portugal 2,260
NorwayStatoil 455Yara 393Telenor 298Veidekke 194Tandberg 166Petroleum Geo-Services 121DnB 109Ementor 107Aker Solutions 87
Total Norway 1,930
List of Investments continued
GR
OW
TH
SH
AR
ES
JPMorgan European Investment Trust plc. Annual Report & Accounts 2009 27
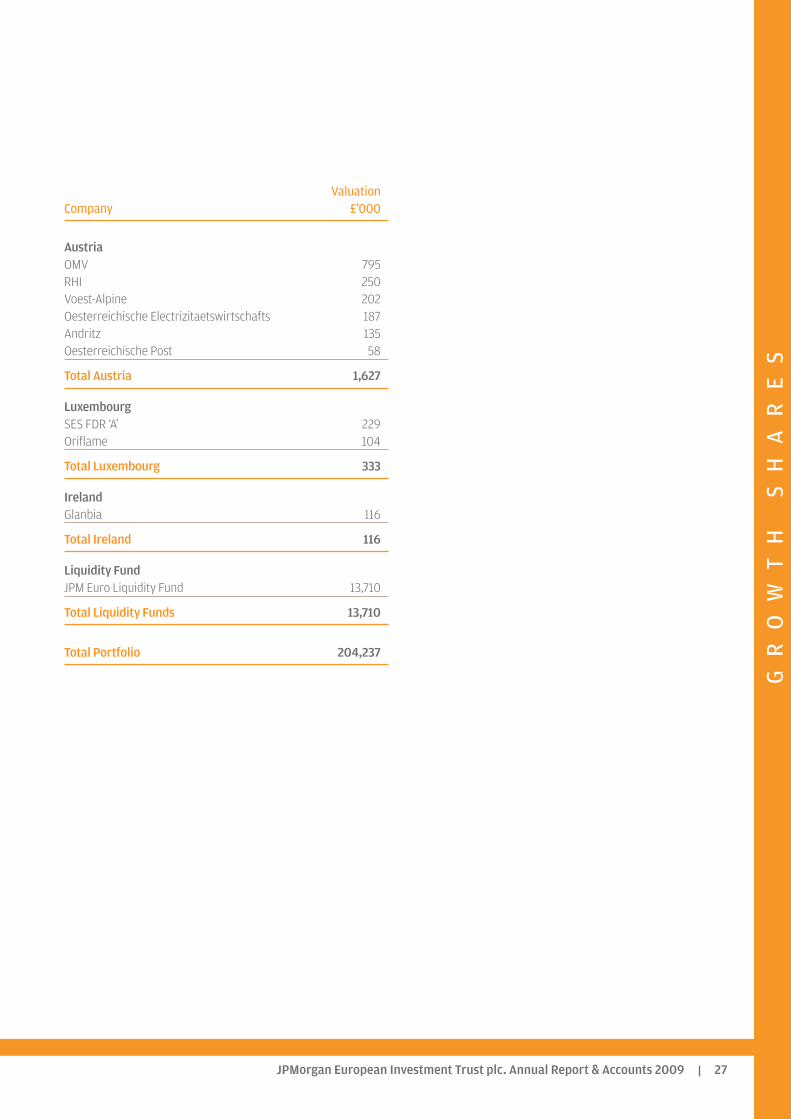
ValuationCompany £’000
AustriaOMV 795RHI 250Voest-Alpine 202Oesterreichische Electrizitaetswirtschafts 187Andritz 135Oesterreichische Post 58
Total Austria 1,627
LuxembourgSES FDR ‘A’ 229Oriflame 104
Total Luxembourg 333
IrelandGlanbia 116
Total Ireland 116
Liquidity FundJPM Euro Liquidity Fund 13,710
Total Liquidity Funds 13,710
Total Portfolio 204,237
GR
OW
TH
SH
AR
ES
JPMorgan European Investment Trust plc. Annual Report & Accounts 200928
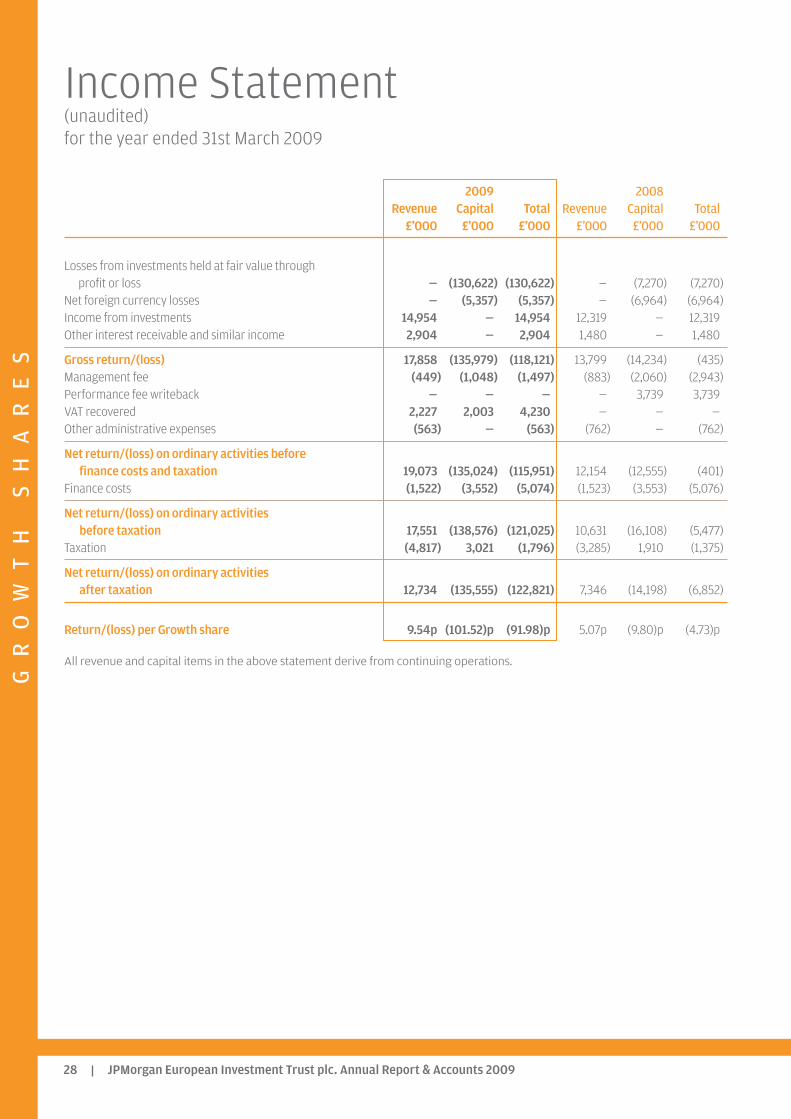
2009 2008Revenue Capital Total Revenue Capital Total
£’000 £’000 £’000 £’000 £’000 £’000
Losses from investments held at fair value through profit or loss — (130,622) (130,622) — (7,270) (7,270)
Net foreign currency losses — (5,357) (5,357) — (6,964) (6,964)Income from investments 14,954 — 14,954 12,319 — 12,319Other interest receivable and similar income 2,904 — 2,904 1,480 — 1,480
Gross return/(loss) 17,858 (135,979) (118,121) 13,799 (14,234) (435)Management fee (449) (1,048) (1,497) (883) (2,060) (2,943)Performance fee writeback — — — — 3,739 3,739VAT recovered 2,227 2,003 4,230 — — —Other administrative expenses (563) — (563) (762) — (762)
Net return/(loss) on ordinary activities before finance costs and taxation 19,073 (135,024) (115,951) 12,154 (12,555) (401)
Finance costs (1,522) (3,552) (5,074) (1,523) (3,553) (5,076)
Net return/(loss) on ordinary activities before taxation 17,551 (138,576) (121,025) 10,631 (16,108) (5,477)
Taxation (4,817) 3,021 (1,796) (3,285) 1,910 (1,375)
Net return/(loss) on ordinary activities after taxation 12,734 (135,555) (122,821) 7,346 (14,198) (6,852)
Return/(loss) per Growth share 9.54p (101.52)p (91.98)p 5.07p (9.80)p (4.73)p
All revenue and capital items in the above statement derive from continuing operations.
Income Statement(unaudited)for the year ended 31st March 2009
GR
OW
TH
SH
AR
ES
JPMorgan European Investment Trust plc. Annual Report & Accounts 2009 29
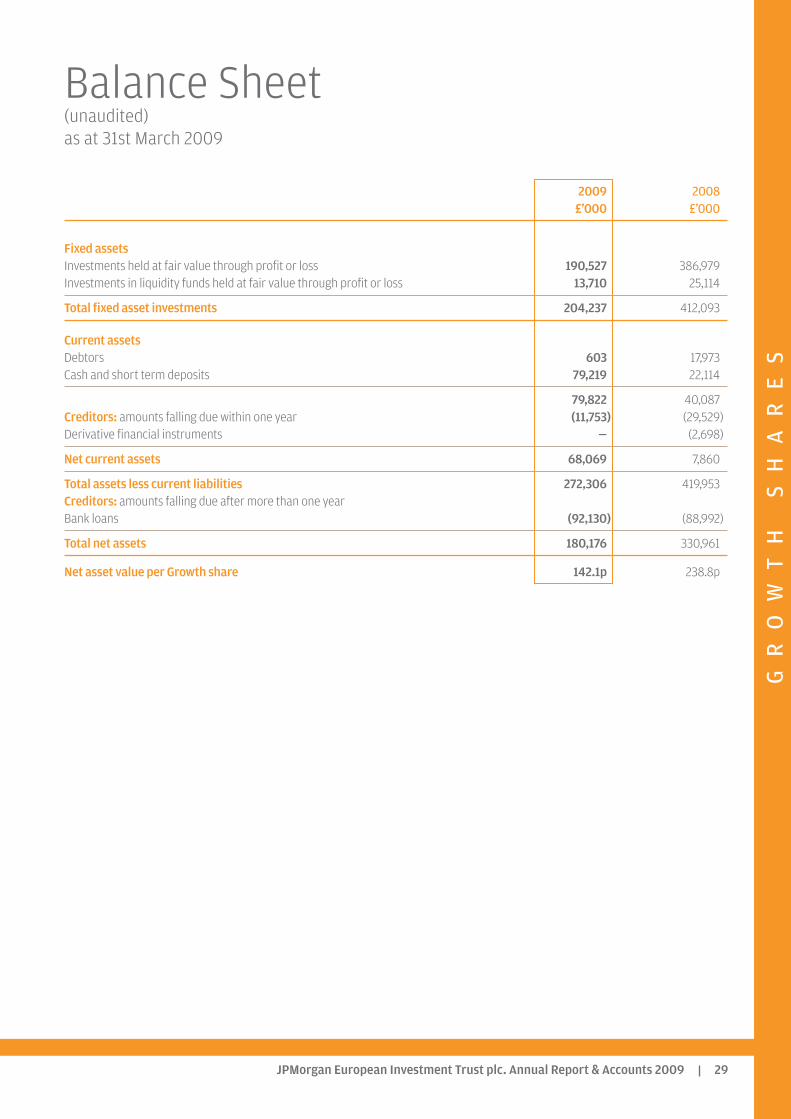
2009 2008£’000 £’000
Fixed assets Investments held at fair value through profit or loss 190,527 386,979Investments in liquidity funds held at fair value through profit or loss 13,710 25,114
Total fixed asset investments 204,237 412,093
Current assets Debtors 603 17,973Cash and short term deposits 79,219 22,114
79,822 40,087Creditors: amounts falling due within one year (11,753) (29,529)Derivative financial instruments — (2,698)
Net current assets 68,069 7,860
Total assets less current liabilities 272,306 419,953Creditors: amounts falling due after more than one year Bank loans (92,130) (88,992)
Total net assets 180,176 330,961
Net asset value per Growth share 142.1p 238.8p
Balance Sheet(unaudited)as at 31st March 2009
IN
CO
ME
SH
AR
ES
JPMorgan European Investment Trust plc. Annual Report & Accounts 200930
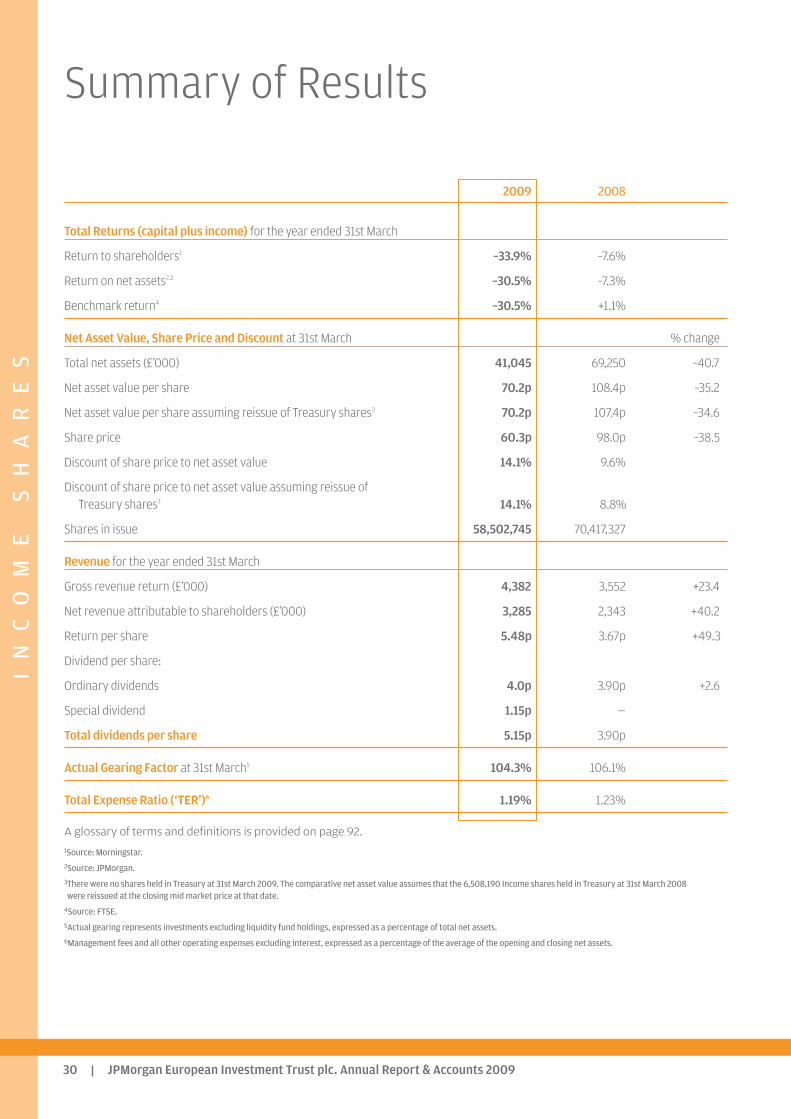
2009 2008
Total Returns (capital plus income) for the year ended 31st March
Return to shareholders1 –33.9% –7.6%
Return on net assets2,3 –30.5% –7.3%
Benchmark return4 –30.5% +1.1%
Net Asset Value, Share Price and Discount at 31st March % change
Total net assets (£’000) 41,045 69,250 –40.7
Net asset value per share 70.2p 108.4p –35.2
Net asset value per share assuming reissue of Treasury shares3 70.2p 107.4p –34.6
Share price 60.3p 98.0p –38.5
Discount of share price to net asset value 14.1% 9.6%
Discount of share price to net asset value assuming reissue of Treasury shares3 14.1% 8.8%
Shares in issue 58,502,745 70,417,327
Revenue for the year ended 31st March
Gross revenue return (£’000) 4,382 3,552 +23.4
Net revenue attributable to shareholders (£’000) 3,285 2,343 +40.2
Return per share 5.48p 3.67p +49.3
Dividend per share:
Ordinary dividends 4.0p 3.90p +2.6
Special dividend 1.15p —
Total dividends per share 5.15p 3.90p
Actual Gearing Factor at 31st March5 104.3% 106.1%
Total Expense Ratio (‘TER’)6 1.19% 1.23%
A glossary of terms and definitions is provided on page 92.
1Source: Morningstar.2Source: JPMorgan.3There were no shares held in Treasury at 31st March 2009. The comparative net asset value assumes that the 6,508,190 Income shares held in Treasury at 31st March 2008were reissued at the closing mid market price at that date.
4Source: FTSE. 5Actual gearing represents investments excluding liquidity fund holdings, expressed as a percentage of total net assets.6Management fees and all other operating expenses excluding interest, expressed as a percentage of the average of the opening and closing net assets.
Summary of Results
IN
CO
ME
SH
AR
ES
JPMorgan European Investment Trust plc. Annual Report & Accounts 2009 31
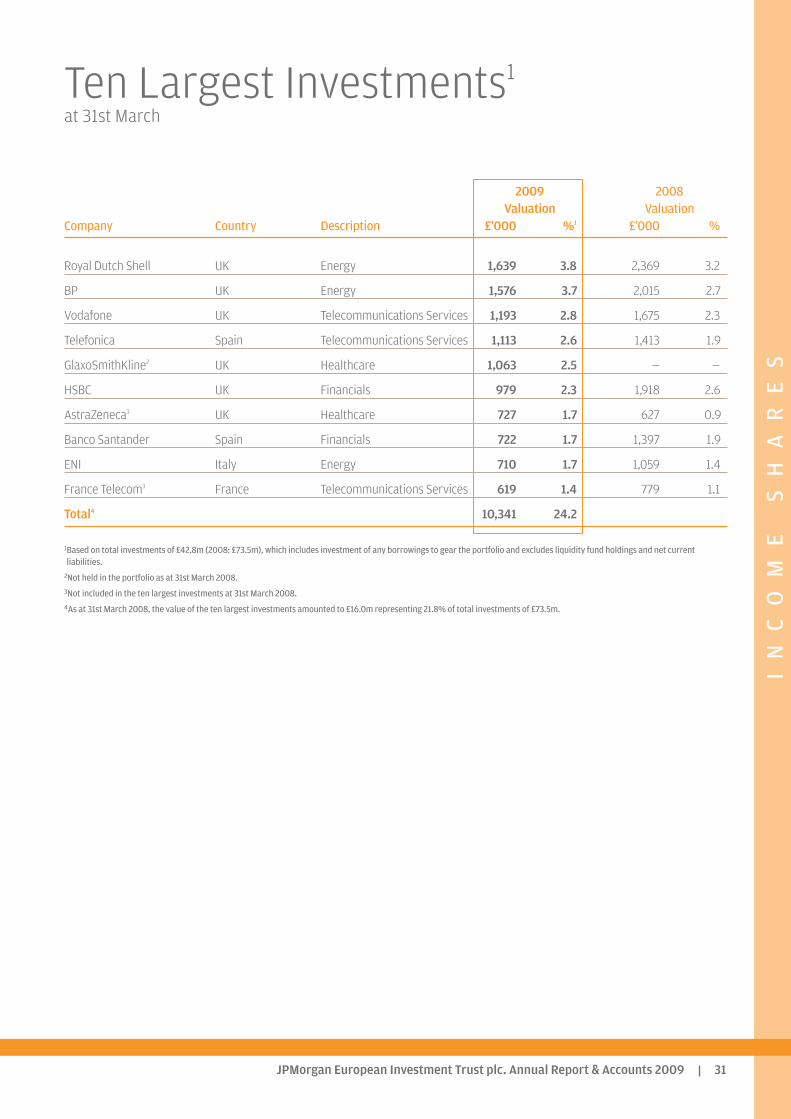
2009 2008Valuation Valuation
Company Country Description £’000 %1 £’000 %
Royal Dutch Shell UK Energy 1,639 3.8 2,369 3.2
BP UK Energy 1,576 3.7 2,015 2.7
Vodafone UK Telecommunications Services 1,193 2.8 1,675 2.3
Telefonica Spain Telecommunications Services 1,113 2.6 1,413 1.9
GlaxoSmithKline2 UK Healthcare 1,063 2.5 — —
HSBC UK Financials 979 2.3 1,918 2.6
AstraZeneca3 UK Healthcare 727 1.7 627 0.9
Banco Santander Spain Financials 722 1.7 1,397 1.9
ENI Italy Energy 710 1.7 1,059 1.4
France Telecom3 France Telecommunications Services 619 1.4 779 1.1
Total4 10,341 24.2
1Based on total investments of £42.8m (2008: £73.5m), which includes investment of any borrowings to gear the portfolio and excludes liquidity fund holdings and net currentliabilities.
2Not held in the portfolio as at 31st March 2008.3Not included in the ten largest investments at 31st March 2008.4As at 31st March 2008, the value of the ten largest investments amounted to £16.0m representing 21.8% of total investments of £73.5m.
Ten Largest Investments1
at 31st March
IN
CO
ME
SH
AR
ES
JPMorgan European Investment Trust plc. Annual Report & Accounts 200932
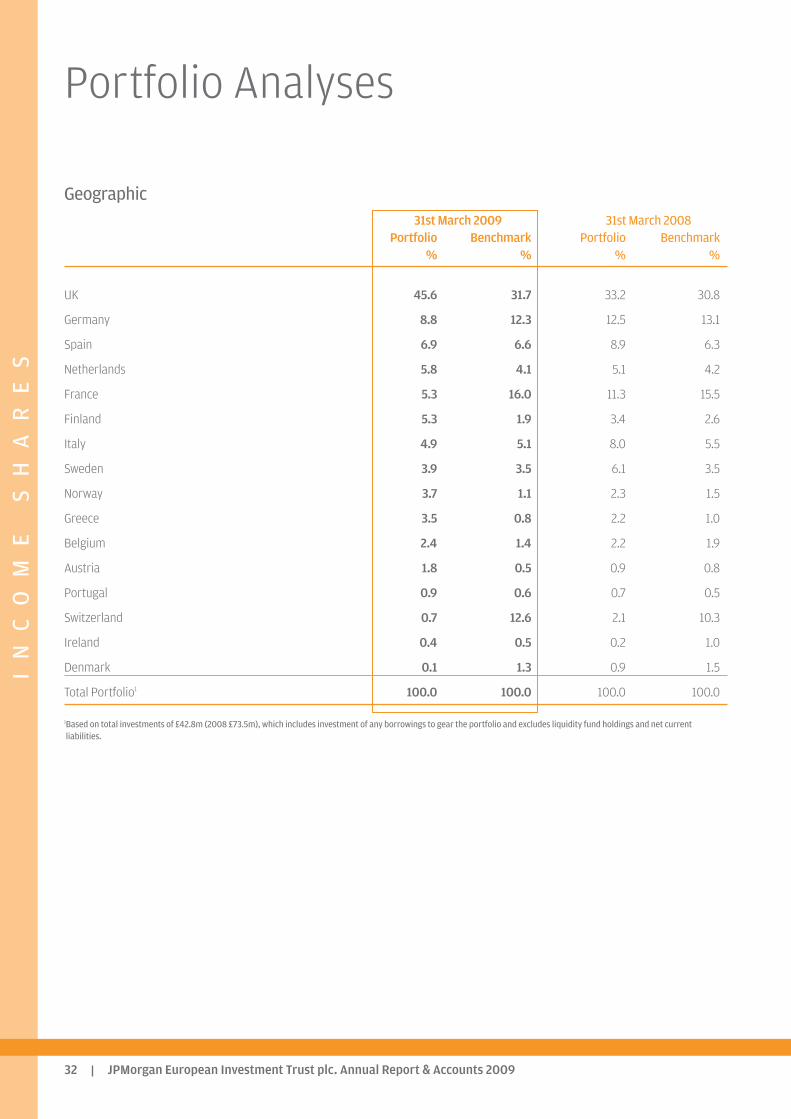
Geographic31st March 2009 31st March 2008
Portfolio Benchmark Portfolio Benchmark% % % %
UK 45.6 31.7 33.2 30.8
Germany 8.8 12.3 12.5 13.1
Spain 6.9 6.6 8.9 6.3
Netherlands 5.8 4.1 5.1 4.2
France 5.3 16.0 11.3 15.5
Finland 5.3 1.9 3.4 2.6
Italy 4.9 5.1 8.0 5.5
Sweden 3.9 3.5 6.1 3.5
Norway 3.7 1.1 2.3 1.5
Greece 3.5 0.8 2.2 1.0
Belgium 2.4 1.4 2.2 1.9
Austria 1.8 0.5 0.9 0.8
Portugal 0.9 0.6 0.7 0.5
Switzerland 0.7 12.6 2.1 10.3
Ireland 0.4 0.5 0.2 1.0
Denmark 0.1 1.3 0.9 1.5
Total Portfolio1 100.0 100.0 100.0 100.0
1Based on total investments of £42.8m (2008 £73.5m), which includes investment of any borrowings to gear the portfolio and excludes liquidity fund holdings and net currentliabilities.
Portfolio Analyses
IN
CO
ME
SH
AR
ES
JPMorgan European Investment Trust plc. Annual Report & Accounts 2009 33
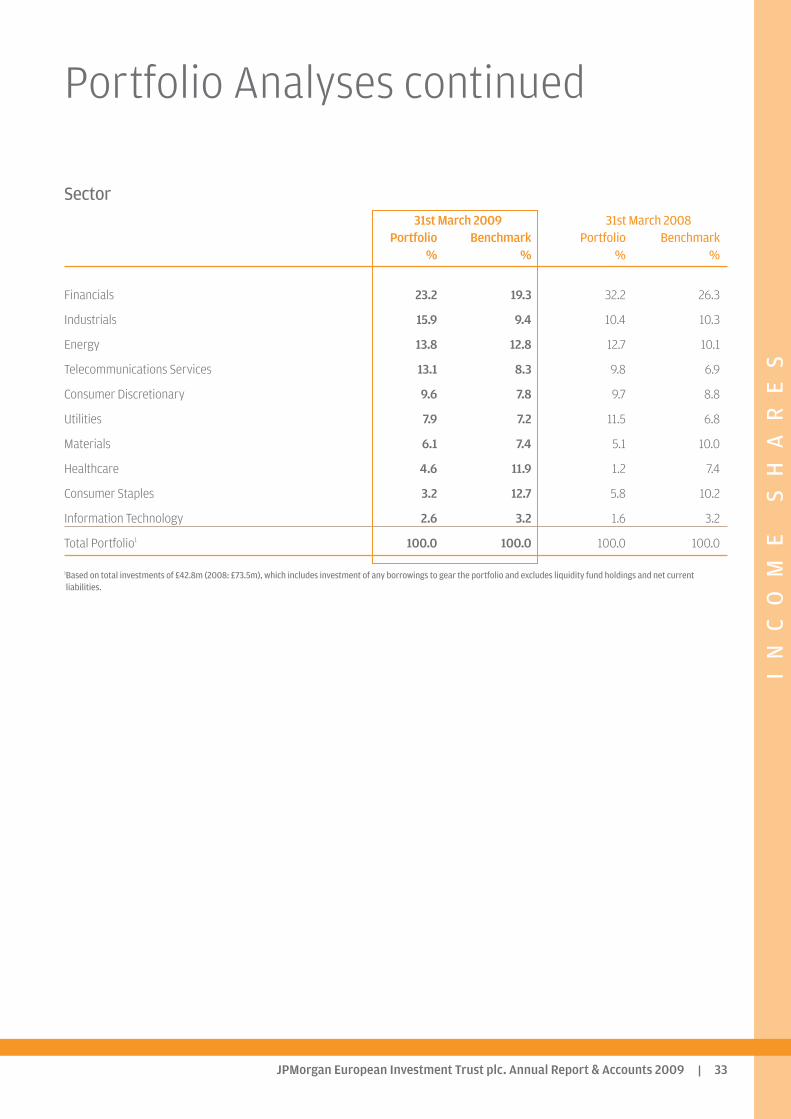
Sector31st March 2009 31st March 2008
Portfolio Benchmark Portfolio Benchmark% % % %
Financials 23.2 19.3 32.2 26.3
Industrials 15.9 9.4 10.4 10.3
Energy 13.8 12.8 12.7 10.1
Telecommunications Services 13.1 8.3 9.8 6.9
Consumer Discretionary 9.6 7.8 9.7 8.8
Utilities 7.9 7.2 11.5 6.8
Materials 6.1 7.4 5.1 10.0
Healthcare 4.6 11.9 1.2 7.4
Consumer Staples 3.2 12.7 5.8 10.2
Information Technology 2.6 3.2 1.6 3.2
Total Portfolio1 100.0 100.0 100.0 100.0
1Based on total investments of £42.8m (2008: £73.5m), which includes investment of any borrowings to gear the portfolio and excludes liquidity fund holdings and net currentliabilities.
Portfolio Analyses continued
IN
CO
ME
SH
AR
ES
JPMorgan European Investment Trust plc. Annual Report & Accounts 200934
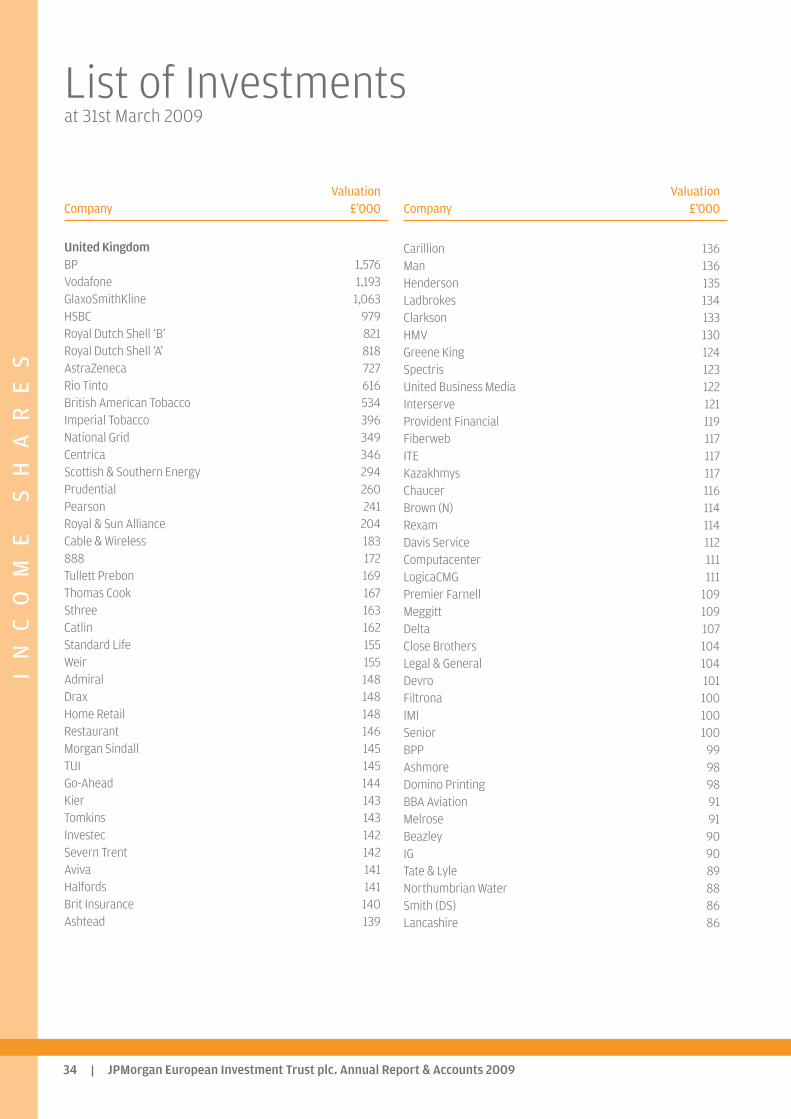
ValuationCompany £’000
United KingdomBP 1,576Vodafone 1,193GlaxoSmithKline 1,063HSBC 979Royal Dutch Shell ‘B’ 821Royal Dutch Shell ‘A’ 818AstraZeneca 727Rio Tinto 616British American Tobacco 534Imperial Tobacco 396National Grid 349Centrica 346Scottish & Southern Energy 294Prudential 260Pearson 241Royal & Sun Alliance 204Cable & Wireless 183888 172Tullett Prebon 169Thomas Cook 167Sthree 163Catlin 162Standard Life 155Weir 155Admiral 148Drax 148Home Retail 148Restaurant 146Morgan Sindall 145TUI 145Go-Ahead 144Kier 143Tomkins 143Investec 142Severn Trent 142Aviva 141Halfords 141Brit Insurance 140Ashtead 139
ValuationCompany £’000
Carillion 136Man 136Henderson 135Ladbrokes 134Clarkson 133HMV 130Greene King 124Spectris 123United Business Media 122Interserve 121Provident Financial 119Fiberweb 117ITE 117Kazakhmys 117Chaucer 116Brown (N) 114Rexam 114Davis Service 112Computacenter 111LogicaCMG 111Premier Farnell 109Meggitt 109Delta 107Close Brothers 104Legal & General 104Devro 101Filtrona 100IMI 100Senior 100BPP 99Ashmore 98Domino Printing 98BBA Aviation 91Melrose 91Beazley 90IG 90Tate & Lyle 89Northumbrian Water 88Smith (DS) 86Lancashire 86
List of Investmentsat 31st March 2009
IN
CO
ME
SH
AR
ES
JPMorgan European Investment Trust plc. Annual Report & Accounts 2009 35
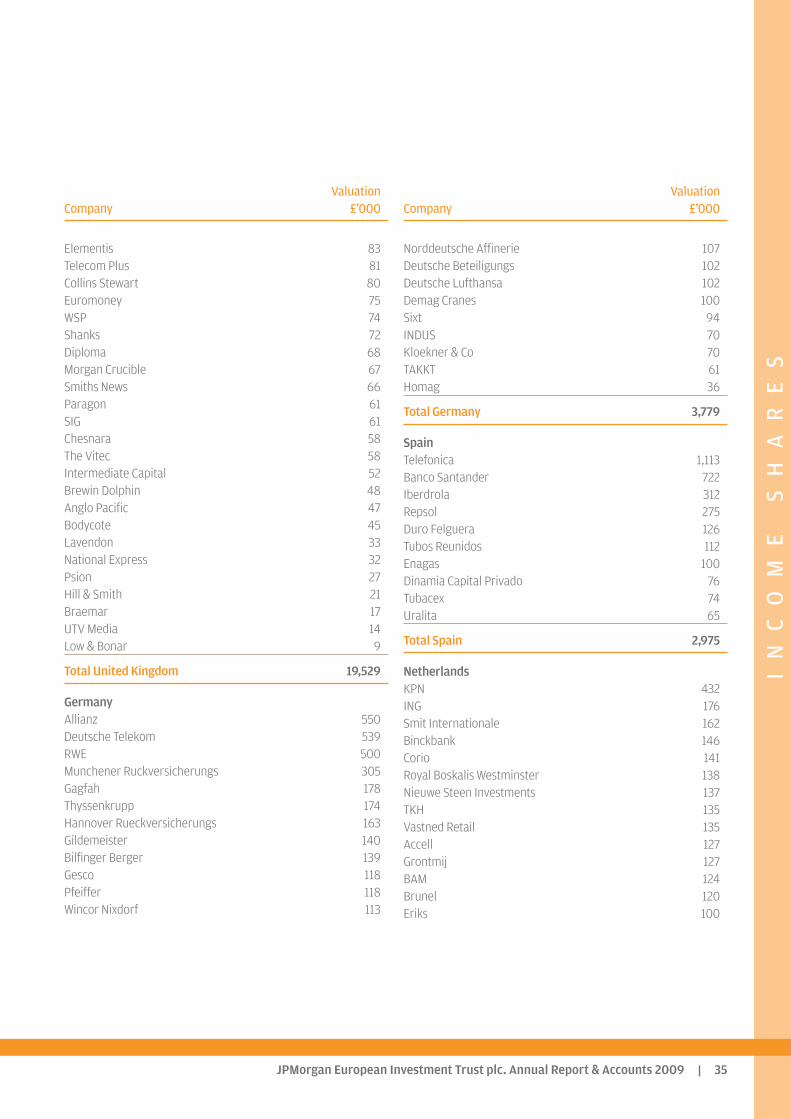
ValuationCompany £’000
Elementis 83Telecom Plus 81Collins Stewart 80Euromoney 75WSP 74Shanks 72Diploma 68Morgan Crucible 67Smiths News 66Paragon 61SIG 61Chesnara 58The Vitec 58Intermediate Capital 52Brewin Dolphin 48Anglo Pacific 47Bodycote 45Lavendon 33National Express 32Psion 27Hill & Smith 21Braemar 17UTV Media 14Low & Bonar 9
Total United Kingdom 19,529
GermanyAllianz 550Deutsche Telekom 539RWE 500Munchener Ruckversicherungs 305Gagfah 178Thyssenkrupp 174Hannover Rueckversicherungs 163Gildemeister 140Bilfinger Berger 139Gesco 118Pfeiffer 118Wincor Nixdorf 113
ValuationCompany £’000
Norddeutsche Affinerie 107Deutsche Beteiligungs 102Deutsche Lufthansa 102Demag Cranes 100Sixt 94INDUS 70Kloekner & Co 70TAKKT 61Homag 36
Total Germany 3,779
SpainTelefonica 1,113Banco Santander 722Iberdrola 312Repsol 275Duro Felguera 126Tubos Reunidos 112Enagas 100Dinamia Capital Privado 76Tubacex 74Uralita 65
Total Spain 2,975
NetherlandsKPN 432ING 176Smit Internationale 162Binckbank 146Corio 141Royal Boskalis Westminster 138Nieuwe Steen Investments 137TKH 135Vastned Retail 135Accell 127Grontmij 127BAM 124Brunel 120Eriks 100
IN
CO
ME
SH
AR
ES
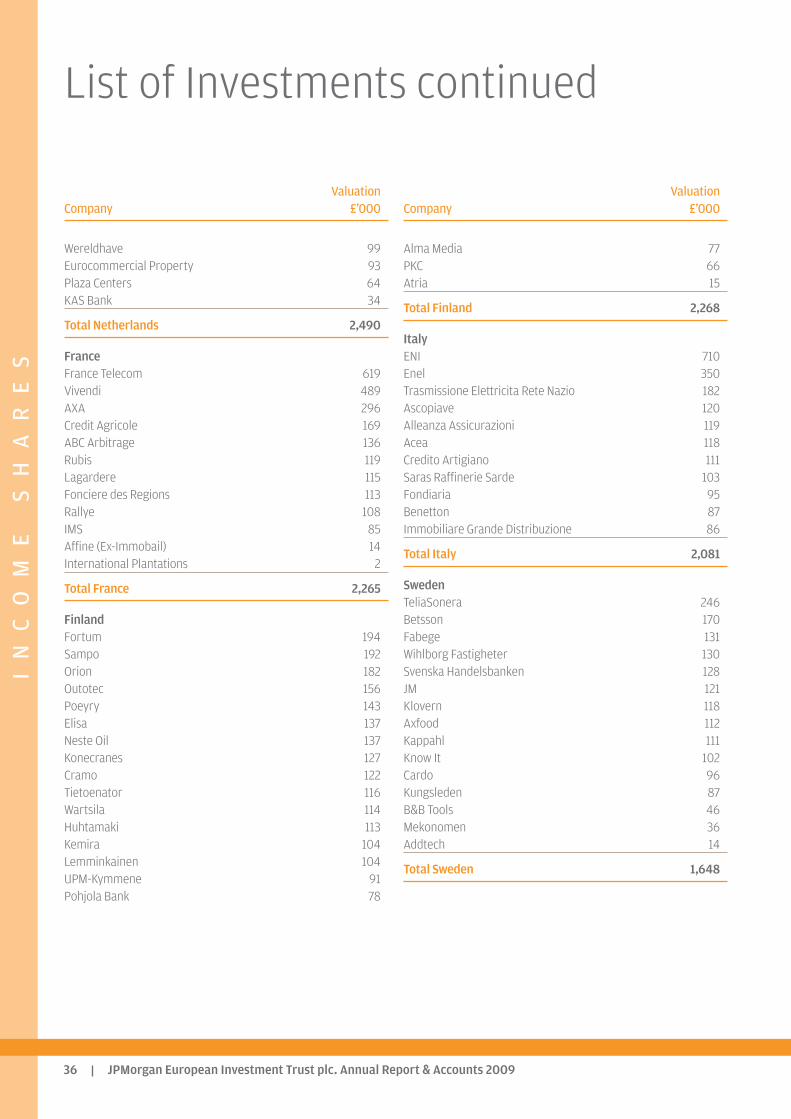
JPMorgan European Investment Trust plc. Annual Report & Accounts 200936
ValuationCompany £’000
Wereldhave 99Eurocommercial Property 93Plaza Centers 64KAS Bank 34
Total Netherlands 2,490
FranceFrance Telecom 619Vivendi 489AXA 296Credit Agricole 169ABC Arbitrage 136Rubis 119Lagardere 115Fonciere des Regions 113Rallye 108IMS 85Affine (Ex-Immobail) 14International Plantations 2
Total France 2,265
FinlandFortum 194Sampo 192Orion 182Outotec 156Poeyry 143Elisa 137Neste Oil 137Konecranes 127Cramo 122Tietoenator 116Wartsila 114Huhtamaki 113Kemira 104Lemminkainen 104UPM-Kymmene 91Pohjola Bank 78
ValuationCompany £’000
Alma Media 77PKC 66Atria 15
Total Finland 2,268
ItalyENI 710Enel 350Trasmissione Elettricita Rete Nazio 182Ascopiave 120Alleanza Assicurazioni 119Acea 118Credito Artigiano 111Saras Raffinerie Sarde 103Fondiaria 95Benetton 87Immobiliare Grande Distribuzione 86
Total Italy 2,081
SwedenTeliaSonera 246Betsson 170Fabege 131Wihlborg Fastigheter 130Svenska Handelsbanken 128JM 121Klovern 118Axfood 112Kappahl 111Know It 102Cardo 96Kungsleden 87B&B Tools 46Mekonomen 36Addtech 14
Total Sweden 1,648
List of Investments continued
IN
CO
ME
SH
AR
ES
JPMorgan European Investment Trust plc. Annual Report & Accounts 2009 37
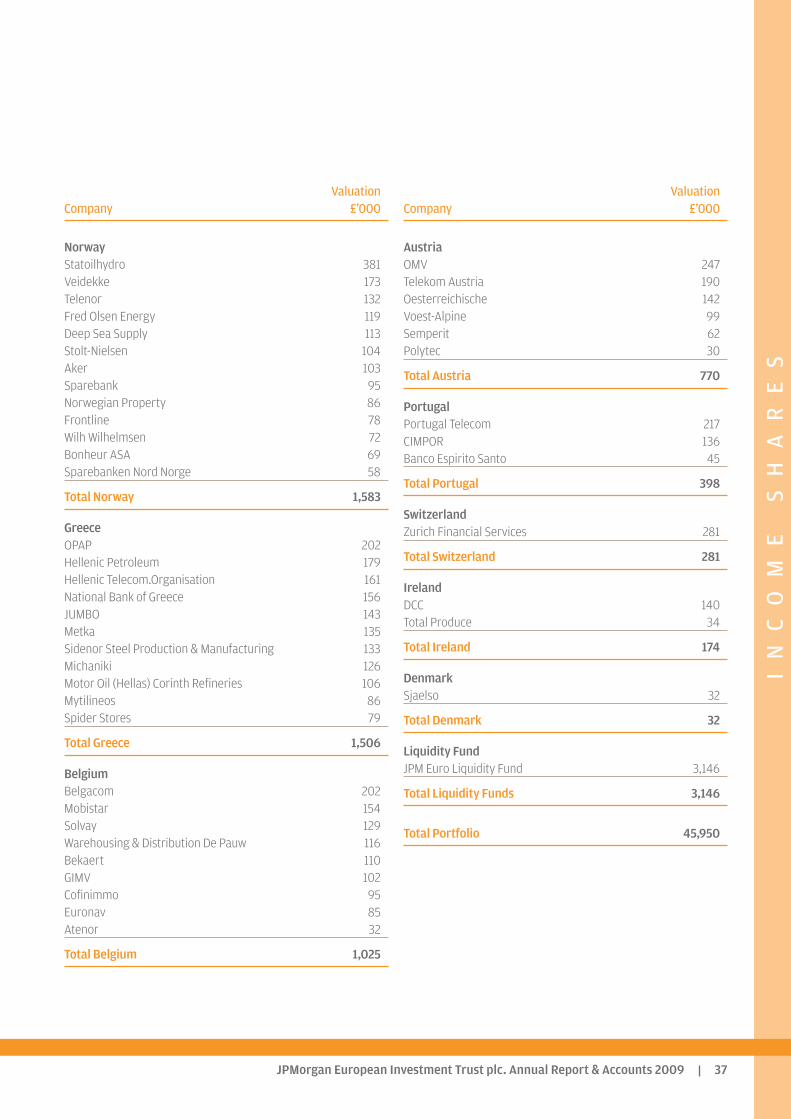
ValuationCompany £’000
NorwayStatoilhydro 381Veidekke 173Telenor 132Fred Olsen Energy 119Deep Sea Supply 113Stolt-Nielsen 104Aker 103Sparebank 95Norwegian Property 86Frontline 78Wilh Wilhelmsen 72Bonheur ASA 69Sparebanken Nord Norge 58
Total Norway 1,583
GreeceOPAP 202Hellenic Petroleum 179Hellenic Telecom.Organisation 161National Bank of Greece 156JUMBO 143Metka 135Sidenor Steel Production & Manufacturing 133Michaniki 126Motor Oil (Hellas) Corinth Refineries 106Mytilineos 86Spider Stores 79
Total Greece 1,506
BelgiumBelgacom 202Mobistar 154Solvay 129Warehousing & Distribution De Pauw 116Bekaert 110GIMV 102Cofinimmo 95Euronav 85Atenor 32
Total Belgium 1,025
ValuationCompany £’000
AustriaOMV 247Telekom Austria 190Oesterreichische 142Voest-Alpine 99Semperit 62Polytec 30
Total Austria 770
PortugalPortugal Telecom 217CIMPOR 136Banco Espirito Santo 45
Total Portugal 398
SwitzerlandZurich Financial Services 281
Total Switzerland 281
IrelandDCC 140Total Produce 34
Total Ireland 174
DenmarkSjaelso 32
Total Denmark 32
Liquidity FundJPM Euro Liquidity Fund 3,146
Total Liquidity Funds 3,146
Total Portfolio 45,950
IN
CO
ME
SH
AR
ES
JPMorgan European Investment Trust plc. Annual Report & Accounts 200938
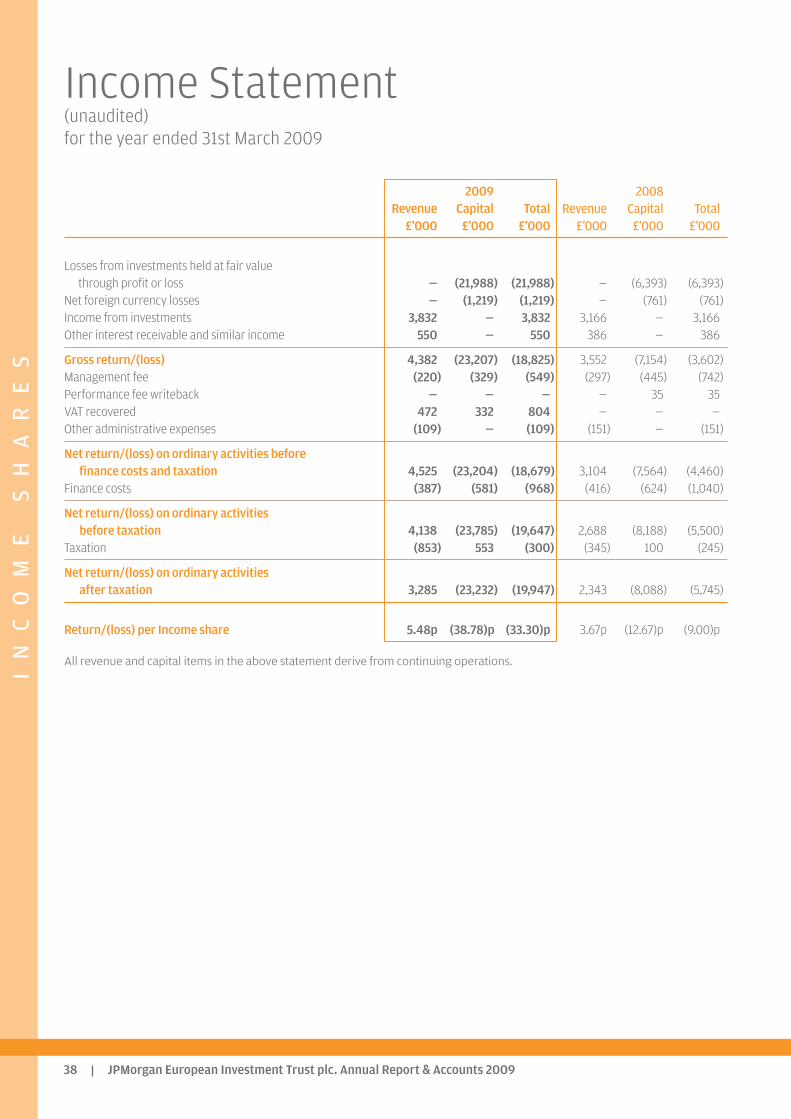
2009 2008Revenue Capital Total Revenue Capital Total
£’000 £’000 £’000 £’000 £’000 £’000
Losses from investments held at fair value through profit or loss — (21,988) (21,988) — (6,393) (6,393)
Net foreign currency losses — (1,219) (1,219) — (761) (761)Income from investments 3,832 — 3,832 3,166 — 3,166Other interest receivable and similar income 550 — 550 386 — 386
Gross return/(loss) 4,382 (23,207) (18,825) 3,552 (7,154) (3,602)Management fee (220) (329) (549) (297) (445) (742)Performance fee writeback — — — — 35 35VAT recovered 472 332 804 — — —Other administrative expenses (109) — (109) (151) — (151)
Net return/(loss) on ordinary activities before finance costs and taxation 4,525 (23,204) (18,679) 3,104 (7,564) (4,460)
Finance costs (387) (581) (968) (416) (624) (1,040)
Net return/(loss) on ordinary activities before taxation 4,138 (23,785) (19,647) 2,688 (8,188) (5,500)
Taxation (853) 553 (300) (345) 100 (245)
Net return/(loss) on ordinary activities after taxation 3,285 (23,232) (19,947) 2,343 (8,088) (5,745)
Return/(loss) per Income share 5.48p (38.78)p (33.30)p 3.67p (12.67)p (9.00)p
All revenue and capital items in the above statement derive from continuing operations.
Income Statement(unaudited)for the year ended 31st March 2009
IN
CO
ME
SH
AR
ES
JPMorgan European Investment Trust plc. Annual Report & Accounts 2009 39
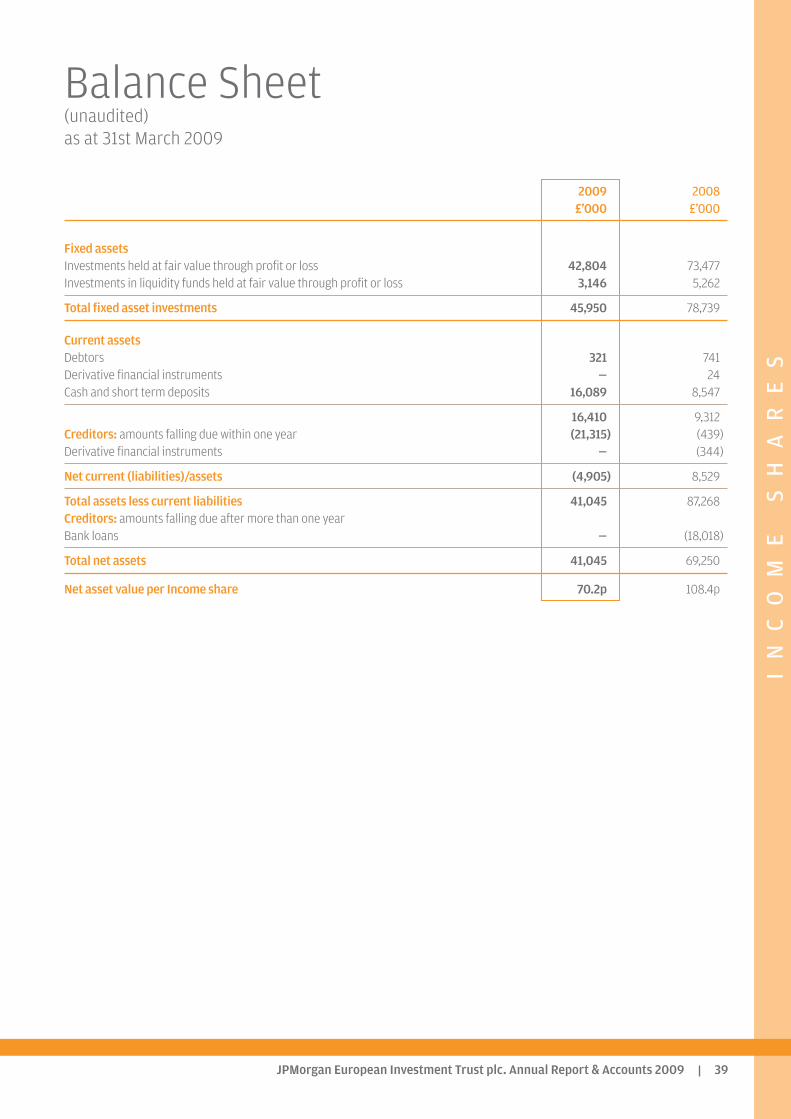
2009 2008£’000 £’000
Fixed assets Investments held at fair value through profit or loss 42,804 73,477Investments in liquidity funds held at fair value through profit or loss 3,146 5,262
Total fixed asset investments 45,950 78,739
Current assets Debtors 321 741Derivative financial instruments — 24Cash and short term deposits 16,089 8,547
16,410 9,312Creditors: amounts falling due within one year (21,315) (439)Derivative financial instruments — (344)
Net current (liabilities)/assets (4,905) 8,529
Total assets less current liabilities 41,045 87,268Creditors: amounts falling due after more than one year Bank loans — (18,018)
Total net assets 41,045 69,250
Net asset value per Income share 70.2p 108.4p
Balance Sheet(unaudited)as at 31st March 2009

TH
EC
OM
PA
NY
JPMorgan European Investment Trust plc. Annual Report & Accounts 200940
Board of Directors
Andrew Murison(Chairman of the Board and Nomination Committee)
A Director since 2002, Chairman since 2003
Previously Senior Bursar of Peterhouse, University of Cambridge and currently a directorof Aberdeen Growth Opportunities Trust plc and Hg Capital Trust plc. His qualificationsfor Board membership are long experience of financial, investment and strategicmanagement.
Robin Faber
(Chairman of the Audit Committee)
A Director since 2000
Finance director of The Ashfield Land Property Group and a director of a number ofother companies. His qualifications for Board membership are as a qualified accountantwith long experience of investment.
Stephen Goldman
A Director since September 2008
He has a wide experience of investing in European equities. Spent 12 years atNM Rothschild Asset Management, in the pension department, where he was promotedto lead the UK Equity Research team. Joined JPMorgan in 1990 as Head of the UKPortfolio Management and the European Client Portfolio Management teams. In 2000he moved to Credit Suisse Asset Management as Managing Director and Head ofEquities for the European Region. He was responsible for the equity teams throughoutEurope which managed both specialist and balanced mandates for both institutional andretail clients. Stephen is a director of Cavendish Asset Management Limited.
Stephen Russell
A Director since 2005
Spent eleven years at SLC Asset Management (now CSAM), most notably as FundManager of £5bn of equities, before joining HSBC Investment Bank as Head of Europe &UK Equity Strategy. He is currently Investment Director at Ruffer LLP. His qualificationsfor Board membership are practical experience of investment in Europe and knowledgeof both the institutional and private client markets.
Ferdinand Verdonck (Belgian)
A Director since 1998
Director of a number of Continental European companies and Phoenix investment fundsin the USA. Formerly Managing Director of the Almanij Group. His qualification for Boardmembership are many years’ experience of European finance and industry.
All Directors are members of the Audit and Nomination Committees and are considered independent of the Manager.

TH
EC
OM
PA
NY
JPMorgan European Investment Trust plc. Annual Report & Accounts 2009 41
The Directors present their report for the year ended31st March 2009.
Business Review
Business of the CompanyThe Company carries on business as an investment trust andwas approved by HM Revenue and Customs as an investmenttrust in accordance with Section 842 of the Income andCorporation Taxes Act 1988 for the year ended 31st March2008. In the opinion of the Directors, the Company hassubsequently conducted its affairs so that it should continue toqualify. The Company will continue to seek approval underSection 842 of the Income and Corporation Taxes Act 1988each year.
Approval for the year ended 31st March 2008 is subject toreview should there be any subsequent enquiry underCorporation Tax Self Assessment.
The Company is an investment company within the meaning ofSection 833 of the Companies Act 2006. The Company is not aclose company for taxation purposes.
A review of the Company’s activities and prospects is given inthe Chairman’s Statement on pages 5 to 11 and in theInvestment Managers’ Report on pages 12 to 17.
Investment Objectives, Policies and Risk Management JPMAM is responsible for management of the Company’sassets. On a day-to-day basis the assets are managed by threeinvestment managers based in London, supported by a 40strong European equity team. The Board seeks to manage theCompany’s risk by imposing various investment restrictionsand guidelines.
Growth Portfolio
Investment ObjectiveThe investment objective of the Growth portfolio is to providecapital growth from Continental European investments byconsistent out-performance of the benchmark and a risingshare price over the longer term by taking carefully controlledrisks through an investment method that is clearlycommunicated to shareholders.
Investment Policies - To invest in a diversified portfolio of investments in the
stockmarkets of Continental Europe.
- To emphasise capital growth rather than income, with thelikely result that the level of dividends will fluctuate.
- To manage liquidity and borrowings to increase returns toshareholders.
Investment Restrictions and Guidelines - The portfolio will not invest more than 15% of the assets in
any one individual stock at the time of acquisition.
- The portfolio will be no more than 120% invested in normalmarket conditions.
- The portfolio does not normally invest in unquotedinvestments and to do so requires prior Board approval.
- The portfolio does not normally enter into derivativetransactions and to do so requires prior Board approval.However, the Investment Manager has authority to carry outcurrency hedging transactions in order to mitigate currencyrisk relative to the benchmark index.
- In accordance with the Listing Rules of the UK ListingAuthority, the portfolio will not invest more than 15% of itsgross assets in other UK listed investment companies and willnot invest more than 10% of its gross assets in companies thatthemselves may invest more than 15% of gross assets in UKlisted investment companies.
Income Portfolio
Investment Objective The investment objective of the Income portfolio is to provide agrowing income together with the potential for long-termcapital growth from a diversified portfolio of investments inpan-European stockmarkets.
Investment Policies - To invest in a diversified portfolio of investments in pan
European stockmarkets.
- To provide a growing income together with the potential forlong-term capital growth.
- To manage liquidity and borrowings to increase returns toshareholders.
Investment Restrictions and Guidelines - The portfolio will not invest more than 6% of the assets in any
one individual stock at the time of acquisition.
- The portfolio will be no more than 120% invested in normalmarket conditions.
- The portfolio does not normally invest in unquotedinvestments and to do so requires prior Board approval.
- The portfolio does not normally enter into derivativetransactions and to do so requires prior Board approval.
Directors’ Report
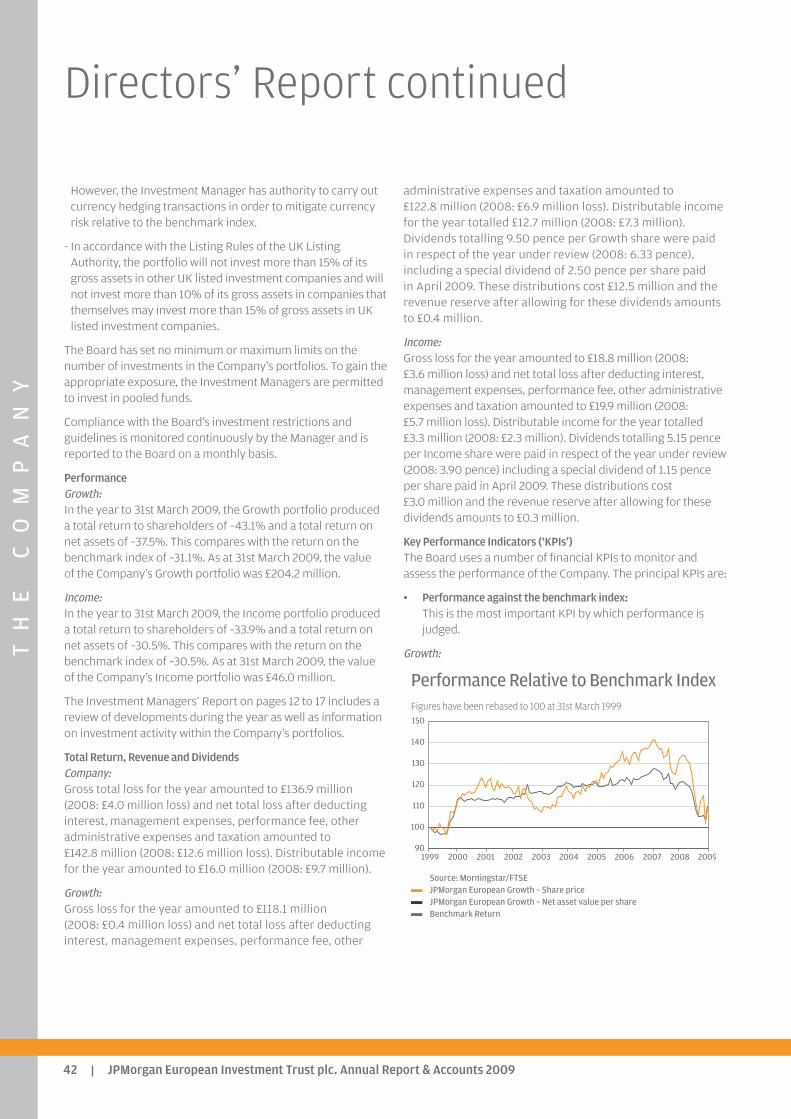
TH
EC
OM
PA
NY
JPMorgan European Investment Trust plc. Annual Report & Accounts 200942
However, the Investment Manager has authority to carry outcurrency hedging transactions in order to mitigate currencyrisk relative to the benchmark index.
- In accordance with the Listing Rules of the UK ListingAuthority, the portfolio will not invest more than 15% of itsgross assets in other UK listed investment companies and willnot invest more than 10% of its gross assets in companies thatthemselves may invest more than 15% of gross assets in UKlisted investment companies.
The Board has set no minimum or maximum limits on thenumber of investments in the Company’s portfolios. To gain theappropriate exposure, the Investment Managers are permittedto invest in pooled funds.
Compliance with the Board’s investment restrictions andguidelines is monitored continuously by the Manager and isreported to the Board on a monthly basis.
PerformanceGrowth: In the year to 31st March 2009, the Growth portfolio produceda total return to shareholders of –43.1% and a total return onnet assets of –37.5%. This compares with the return on thebenchmark index of –31.1%. As at 31st March 2009, the valueof the Company’s Growth portfolio was £204.2 million.
Income:In the year to 31st March 2009, the Income portfolio produceda total return to shareholders of –33.9% and a total return onnet assets of –30.5%. This compares with the return on thebenchmark index of –30.5%. As at 31st March 2009, the valueof the Company’s Income portfolio was £46.0 million.
The Investment Managers’ Report on pages 12 to 17 includes areview of developments during the year as well as informationon investment activity within the Company’s portfolios.
Total Return, Revenue and Dividends Company:Gross total loss for the year amounted to £136.9 million(2008: £4.0 million loss) and net total loss after deductinginterest, management expenses, performance fee, otheradministrative expenses and taxation amounted to£142.8 million (2008: £12.6 million loss). Distributable incomefor the year amounted to £16.0 million (2008: £9.7 million).
Growth: Gross loss for the year amounted to £118.1 million(2008: £0.4 million loss) and net total loss after deductinginterest, management expenses, performance fee, other
administrative expenses and taxation amounted to£122.8 million (2008: £6.9 million loss). Distributable incomefor the year totalled £12.7 million (2008: £7.3 million).Dividends totalling 9.50 pence per Growth share were paidin respect of the year under review (2008: 6.33 pence),including a special dividend of 2.50 pence per share paidin April 2009. These distributions cost £12.5 million and therevenue reserve after allowing for these dividends amountsto £0.4 million.
Income: Gross loss for the year amounted to £18.8 million (2008:£3.6 million loss) and net total loss after deducting interest,management expenses, performance fee, other administrativeexpenses and taxation amounted to £19.9 million (2008:£5.7 million loss). Distributable income for the year totalled£3.3 million (2008: £2.3 million). Dividends totalling 5.15 penceper Income share were paid in respect of the year under review(2008: 3.90 pence) including a special dividend of 1.15 penceper share paid in April 2009. These distributions cost£3.0 million and the revenue reserve after allowing for thesedividends amounts to £0.3 million.
Key Performance Indicators (‘KPIs’) The Board uses a number of financial KPIs to monitor andassess the performance of the Company. The principal KPIs are:
• Performance against the benchmark index: This is the most important KPI by which performance isjudged.
Growth:
Performance Relative to Benchmark IndexFigures have been rebased to 100 at 31st March 1999
Source: Morningstar/FTSEJPMorgan European Growth – Share priceJPMorgan European Growth – Net asset value per shareBenchmark Return
90
100
110
120
130
140
150
20092008200720062005200420032002200120001999
Directors’ Report continued
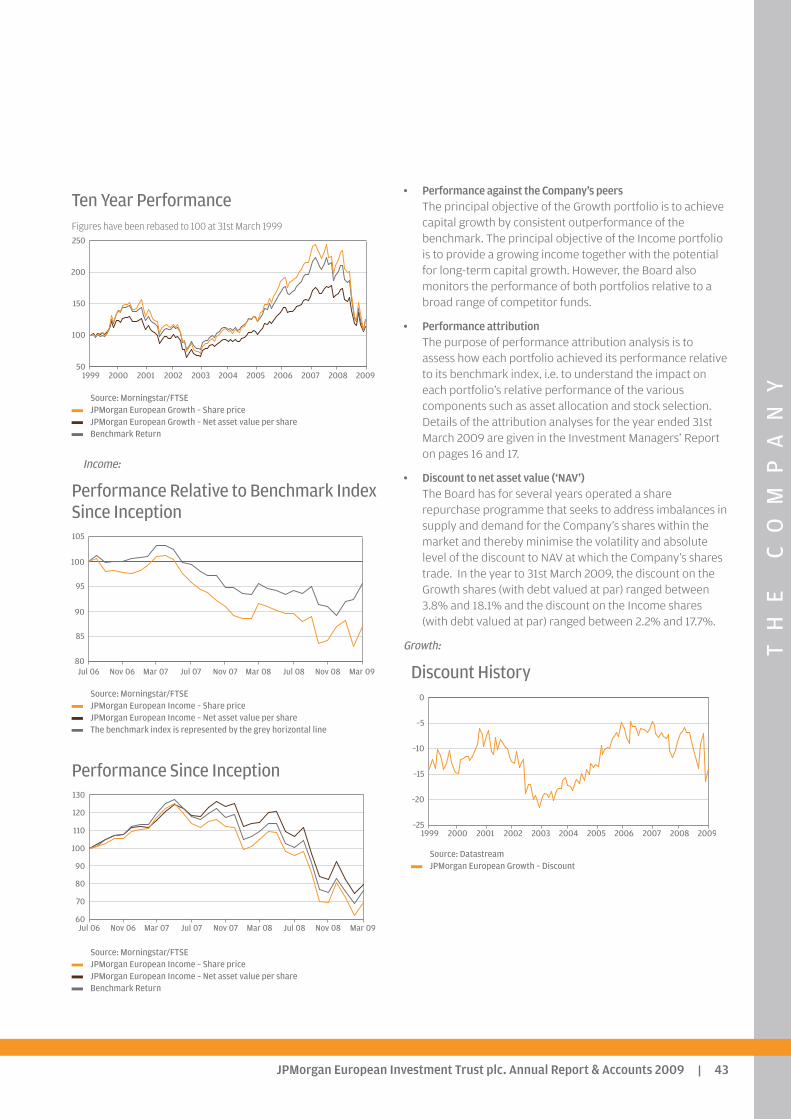
TH
EC
OM
PA
NY
JPMorgan European Investment Trust plc. Annual Report & Accounts 2009 43
Ten Year PerformanceFigures have been rebased to 100 at 31st March 1999
Source: Morningstar/FTSEJPMorgan European Growth – Share priceJPMorgan European Growth – Net asset value per shareBenchmark Return
Income:
Performance Relative to Benchmark IndexSince Inception
Source: Morningstar/FTSEJPMorgan European Income – Share priceJPMorgan European Income – Net asset value per shareThe benchmark index is represented by the grey horizontal line
Performance Since Inception
Source: Morningstar/FTSEJPMorgan European Income – Share priceJPMorgan European Income – Net asset value per shareBenchmark Return
• Performance against the Company’s peersThe principal objective of the Growth portfolio is to achievecapital growth by consistent outperformance of thebenchmark. The principal objective of the Income portfoliois to provide a growing income together with the potentialfor long-term capital growth. However, the Board alsomonitors the performance of both portfolios relative to abroad range of competitor funds.
• Performance attributionThe purpose of performance attribution analysis is toassess how each portfolio achieved its performance relativeto its benchmark index, i.e. to understand the impact oneach portfolio’s relative performance of the variouscomponents such as asset allocation and stock selection.Details of the attribution analyses for the year ended 31stMarch 2009 are given in the Investment Managers’ Reporton pages 16 and 17.
• Discount to net asset value (‘NAV’)The Board has for several years operated a sharerepurchase programme that seeks to address imbalances insupply and demand for the Company’s shares within themarket and thereby minimise the volatility and absolutelevel of the discount to NAV at which the Company’s sharestrade. In the year to 31st March 2009, the discount on theGrowth shares (with debt valued at par) ranged between3.8% and 18.1% and the discount on the Income shares(with debt valued at par) ranged between 2.2% and 17.7%.
Growth:
Discount History
Source: DatastreamJPMorgan European Growth – Discount
–25
–20
–15
–10
–5
0
20092008200720062005200420032002200120001999
60
70
80
90
100
110
120
130
Mar 09Nov 08Jul 08Mar 08Nov 07Jul 07Mar 07Nov 06Jul 06
80
85
90
95
100
105
Mar 09Nov 08Jul 08Mar 08Nov 07Jul 07Mar 07Nov 06Jul 06
50
100
150
200
250
20092008200720062005200420032002200120001999
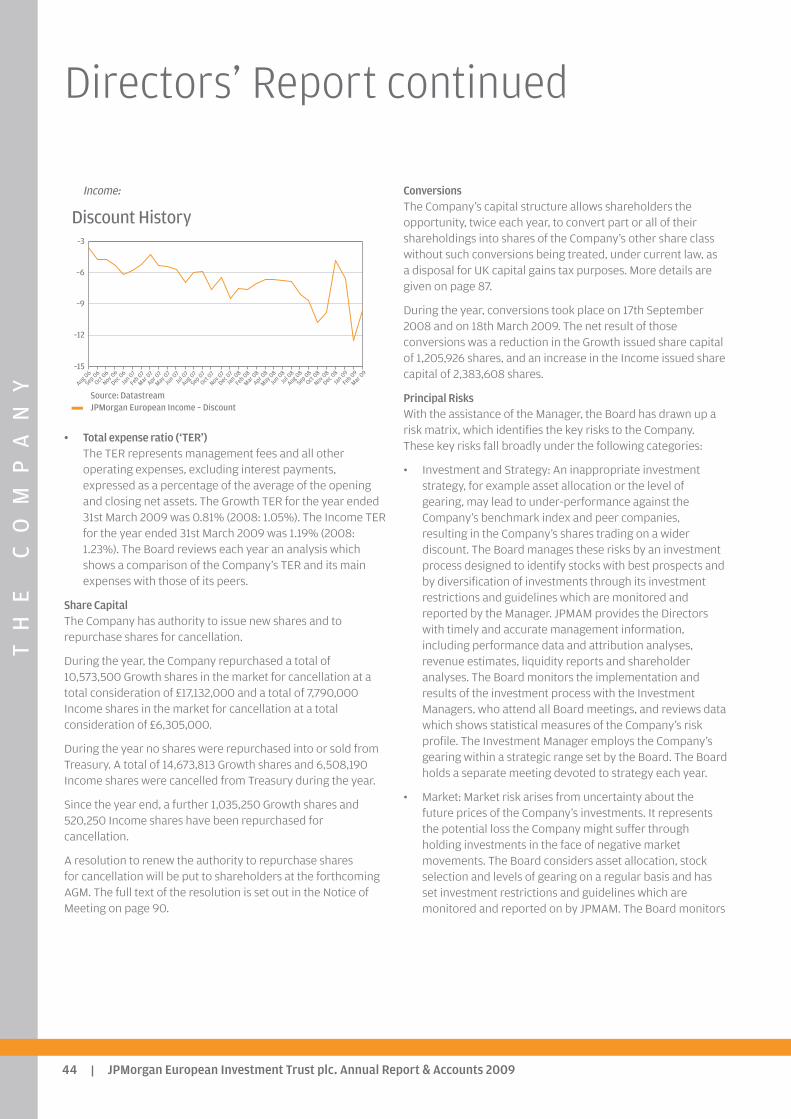
TH
EC
OM
PA
NY
JPMorgan European Investment Trust plc. Annual Report & Accounts 200944
Income:
Discount History
Source: DatastreamJPMorgan European Income – Discount
• Total expense ratio (‘TER’)The TER represents management fees and all otheroperating expenses, excluding interest payments,expressed as a percentage of the average of the openingand closing net assets. The Growth TER for the year ended31st March 2009 was 0.81% (2008: 1.05%). The Income TERfor the year ended 31st March 2009 was 1.19% (2008:1.23%). The Board reviews each year an analysis whichshows a comparison of the Company’s TER and its mainexpenses with those of its peers.
Share CapitalThe Company has authority to issue new shares and torepurchase shares for cancellation.
During the year, the Company repurchased a total of10,573,500 Growth shares in the market for cancellation at atotal consideration of £17,132,000 and a total of 7,790,000Income shares in the market for cancellation at a totalconsideration of £6,305,000.
During the year no shares were repurchased into or sold fromTreasury. A total of 14,673,813 Growth shares and 6,508,190Income shares were cancelled from Treasury during the year.
Since the year end, a further 1,035,250 Growth shares and520,250 Income shares have been repurchased forcancellation.
A resolution to renew the authority to repurchase sharesfor cancellation will be put to shareholders at the forthcomingAGM. The full text of the resolution is set out in the Notice ofMeeting on page 90.
Conversions The Company’s capital structure allows shareholders theopportunity, twice each year, to convert part or all of theirshareholdings into shares of the Company’s other share classwithout such conversions being treated, under current law, asa disposal for UK capital gains tax purposes. More details aregiven on page 87.
During the year, conversions took place on 17th September2008 and on 18th March 2009. The net result of thoseconversions was a reduction in the Growth issued share capitalof 1,205,926 shares, and an increase in the Income issued sharecapital of 2,383,608 shares.
Principal RisksWith the assistance of the Manager, the Board has drawn up arisk matrix, which identifies the key risks to the Company.These key risks fall broadly under the following categories:
• Investment and Strategy: An inappropriate investmentstrategy, for example asset allocation or the level ofgearing, may lead to under-performance against theCompany’s benchmark index and peer companies,resulting in the Company’s shares trading on a widerdiscount. The Board manages these risks by an investmentprocess designed to identify stocks with best prospects andby diversification of investments through its investmentrestrictions and guidelines which are monitored andreported by the Manager. JPMAM provides the Directorswith timely and accurate management information,including performance data and attribution analyses,revenue estimates, liquidity reports and shareholderanalyses. The Board monitors the implementation andresults of the investment process with the InvestmentManagers, who attend all Board meetings, and reviews datawhich shows statistical measures of the Company’s riskprofile. The Investment Manager employs the Company’sgearing within a strategic range set by the Board. The Boardholds a separate meeting devoted to strategy each year.
• Market: Market risk arises from uncertainty about thefuture prices of the Company’s investments. It representsthe potential loss the Company might suffer throughholding investments in the face of negative marketmovements. The Board considers asset allocation, stockselection and levels of gearing on a regular basis and hasset investment restrictions and guidelines which aremonitored and reported on by JPMAM. The Board monitors
–15
–12
–9
–6
–3
Mar 09
Feb 09
Jan 09
Dec08
Nov 08
Oct08
Sep08
Aug 08Ju
l 08
Jun 08
May08
Apr 08
Mar 08
Feb 08
Jan 08
Dec07
Nov 07
Oct07
Sep07
Aug 07Ju
l 07
Jun 07
May07
Apr 07
Mar 07
Feb 07
Jan 07
Dec06
Nov 06
Oct06
Sep06
Aug 06
Directors’ Report continued
TH
EC
OM
PA
NY
JPMorgan European Investment Trust plc. Annual Report & Accounts 2009 45
the implementation and results of the investment processwith the Manager.
• Accounting, Legal and Regulatory: In order to qualify as aninvestment trust, the Company must comply with Section842 of the Income and Corporation Taxes Act 1988(‘Section 842’). Details of the Company’s approval are givenunder ‘Business of the Company’ above. Were theCompany to breach Section 842, it might lose investmenttrust status and, as a consequence, gains within theCompany’s portfolio could be subject to Capital Gains Tax.The Section 842 qualification criteria are continuallymonitored by JPMAM and the results reported to the Boardeach month. The Company must also comply with theprovisions of The Companies Act and, since its shares arelisted on the London Stock Exchange, the UKLA ListingRules. A breach of the Companies Act could result in theCompany and/or the Directors being fined or the subjectof criminal proceedings. Breach of the UKLA Listing Rulescould result in the Company’s shares being suspendedfrom listing which in turn would breach Section 842. TheBoard relies on the services of its Company Secretary,JPMAM, and its professional advisers to ensure compliancewith The Companies Acts 1985 and 2006 and The UKLAListing Rules.
• Corporate Governance and Shareholder Relations: Detailsof the Company’s compliance with Corporate Governancebest practice, including information on relations withshareholders, are set out in the Corporate Governancereport on pages 49 to 52.
• Operational: Disruption to, or failure of, JPMAM’saccounting, dealing or payments systems or thecustodian’s records could prevent accurate reporting andmonitoring of the Company’s financial position. Details ofhow the Board monitors the services provided by JPMAMand its associates and the key elements designed toprovide effective internal control are included within theInternal Control section of the Corporate Governancereport on page 51.
• Financial: The financial risks faced by the Company includemarket risk (which comprises currency risk, interest raterisk and other price risk), liquidity risk and credit risk.Further details are disclosed in note 24 on pages 78 to 84.
Future Developments Clearly the future development of the Company is muchdependent upon the success of the Company’s investment
strategy for the two portfolios in the light of economic andequity market developments. The Investment Managersdiscuss the outlook in their report on pages 15 to 17.
Management of the Company
The Manager and Secretary is JPMorgan Asset Management(UK) Limited (‘JPMAM’). JPMAM is employed under a contractterminable on one year’s notice, without penalty. If theCompany wishes to terminate the contract on shorter notice,the balance of remuneration is payable by way ofcompensation.
JPMAM is a wholly owned subsidiary of JPMorgan Chase Bankwhich, through other subsidiaries, also provides banking,dealing and custodian services to the Company.
The Board has evaluated the performance of the Manager andconfirms that it is satisfied that the continuing appointment ofthe Manager is in the interests of shareholders as a whole. Inarriving at this view, the Board considered the investmentstrategy and process of the Manager and the support that theCompany receives from JPMAM.
Management and Performance Fee
Growth Share Class The management fee is charged at the rate of 0.45% perannum on assets less current liabilities and is calculated andpaid monthly in arrears. If the Company invests in fundsmanaged or advised by JPMAM or any of its associatedcompanies, those investments are excluded from thecalculation and therefore attract no fee.
If NAV return exceeds benchmark return plus 0.5%, the basefee in any one year rises to 0.6% for that year. In the event ofthis, a performance fee is also payable and is calculated at 20%of the excess of the NAV total return over the benchmark totalreturn plus a hurdle of 0.5%. Any performance fee earned isspread evenly over three years, with a cap of 1% of total grossassets in any one year. Any unpaid performance fee is carriedforward until paid in full (or offset against subsequent under-performance). Any under-performance is offset at the firstopportunity and must be fully offset before any performancefee can be paid. In the year to 31st March 2009, the Growthportfolio’s NAV total return underperformed the benchmarktotal return by 5.7%. This gave rise to a negative performancefee of £2,054,000. A negative performance fee of £392,000was brought forward at the beginning of the Company’sfinancial year. An underperformance amount of £2,446,000 is
TH
EC
OM
PA
NY
JPMorgan European Investment Trust plc. Annual Report & Accounts 200946
carried forward and must be fully offset before anyperformance fee can be paid.
Income Share Class The management fee is charged at the rate of 0.75% perannum on assets less current liabilities and is calculated andpaid monthly in arrears. If the Company invests in fundsmanaged or advised by JPMAM or any of its associatedcompanies, those investments are excluded from thecalculation and therefore attract no fee.
If NAV performance exceeds benchmark performance plus0.5%, a performance fee is also payable and is calculated at15% of the excess of the NAV total return over the benchmarktotal return plus the 0.5% hurdle. Any performance fee earnedis spread evenly over three years, with a cap of 0.75% of totalgross assets in any one year. Any unpaid performance fee iscarried forward until paid in full (or offset against subsequentunder-performance). Any under-performance is offset at thefirst opportunity and must be fully offset before anyperformance fee can be paid.
In the year to 31st March 2009, the Income portfolio’s NAV totalreturn underperformed the benchmark by 0.4%. This gave riseto a negative performance fee of £25,000. A negativeperformance fee of £669,000 was brought forward at thebeginning of the Company’s financial year. Anunderperformance amount of £694,000 is carried forward andmust be fully offset before any performance fee can be paid.
Going Concern The Directors believe that having considered the Company’sinvestment objectives (see page 41), risk management policies(see page 78), capital management policies and procedures(see page 84), nature of the portfolios and expenditureprojections, that the Company has adequate resources, anappropriate financial structure and suitable managementarrangements in place to continue in operational existence forthe foreseeable future. For these reasons, they consider thatthere is reasonable evidence to continue to adopt the goingconcern basis in preparing the accounts.
Payment Policy
It is the Company’s policy to obtain the best terms for allbusiness and therefore there are no standard payment terms.In general the Company agrees with its suppliers the terms onwhich business will take place and it is the Company’s policy toabide by those terms. As at 31st March 2009, the Company hadno outstanding trade creditors (2008: nil).
Directors
The Directors of the Company who held office at the end of theyear, together with their beneficial interests in the Company’sGrowth shares, are given below:
31st March 1st AprilDirectors 2009 20081
Robin Faber 10,000 10,000Andrew Murison 5,050 5,050Stephen Russell 2,050 1,902Ferdinand Verdonck 2,867 2,659Stephen Goldman 5,000 —
1Or at date of appointment.
Stephen Goldman was appointed a Director on 1st September2008. Alexander Zagoreos retired from the Board on 31stDecember 2008. None of the Directors held beneficial interestsin the Company’s Income shares at the end of the year.
Since the year end, Stephen Russell and Ferdinand Verdonckhave acquired a further 76 Growth shares and 106 Growthshares respectively.
In accordance with the Company’s Articles of Association theDirectors retiring by rotation at the Annual General Meetingwill be Robin Faber and Ferdinand Verdonck. Mr Verdonck,having served as a Director for more than nine years, standsfor annual re-election. Having been appointed since the lastAGM, Stephen Goldman must stand for election. All threeDirectors, being eligible, offer themselves for re-election/election. The Nomination Committee, having considered theirqualifications, performance and contribution to the Board andits committees, confirms that each Director continues to beeffective and demonstrates commitment to the role and theBoard recommends to shareholders that they bere-elected/elected.
An insurance policy is maintained by the Company whichindemnifies the Directors of the Company against certainliabilities arising in the conduct of their duties. There is nocover against fraudulent or dishonest actions.
Disclosure of information to Auditors
In the case of each of the persons who are Directors of theCompany at the time when this report was approved:
(a) so far as each of the Directors is aware, there is no relevantaudit information (as defined in the Companies Act) ofwhich the Company’s auditors are unaware, and
Directors’ Report continued
TH
EC
OM
PA
NY
JPMorgan European Investment Trust plc. Annual Report & Accounts 2009 47
(b) each of the Directors has taken all the steps that he oughtto have taken as a Director in order to make himself awareof any relevant audit information (as defined) and toestablish that the Company’s Auditors are aware of thatinformation.
The above confirmation is given and should be interpreted inaccordance with the provision of Section 234 ZA of theCompanies Act 1985.
Section 992 Companies Act 2006
The following disclosures are made in accordance with Section992 Companies Act 2006.
Capital StructureThe Company’s capital structure is summarised on page 4 ofthis report.
Voting Rights in the Company’s sharesDetails of the voting rights in the Company’s shares as at thedate of this report are given in note 11 to the Notice of AGM onpage 91.
Notifiable Interests in the Company’s Voting RightsAt the date of this report, the following had declared anotifiable interest in the Company’s voting rights:
% of TotalShareholders Voting Rights
1607 Capital Partners LLC 13.1Chase Nominees1,2 11.3JPMorgan Asset Management (UK) Limited 7.8Rensburg Sheppards Investment
Management Limited 4.8Tattersall Advisory Group Inc 3.9Legal & General Investment Management 3.8
The percentage of total voting rights is calculated by referenceto the share voting numbers which as at 31st March 2009 wereas follows:
Growth shares: 1.42Income shares: 0.70
1Held on behalf of JPMAM ISA and Share Plan participants.2Non-beneficial.
The rules concerning the appointment and replacement ofDirectors, amendment of the Articles of Association andpowers to issue or buy back the Company’s shares are
contained in the Articles of Association of the Company and theCompanies Acts 1985 and 2006.
There are no restrictions concerning the transfer of securitiesin the Company; no special rights with regard to controlattached to securities; no agreements between holders ofsecurities regarding their transfer known to the Company; noagreements which the Company is party to that affects itscontrol following a takeover bid; and no agreements betweenthe Company and its directors concerning compensation forloss of office.
Independent Auditors
Ernst & Young LLP have expressed their willingness to continuein office as auditors and a resolution to re-appoint them andauthorise the Directors to determine their remuneration for theensuing year will be put to shareholders at the AGM.
Annual General Meeting
NOTE: THIS SECTION IS IMPORTANT AND REQUIRES YOURIMMEDIATE ATTENTION. If you are in any doubt as to the actionyou should take, you should seek your own personal financialadvice from your stockbroker, bank manager, solicitor or otherfinancial advisor authorised under the Financial Services andMarkets Act 2000.
Resolutions relating to the following items of special businesswill be proposed at the forthcoming Annual General Meeting:
(i) Authority to repurchase the Company’s Shares (resolution 7) The authority to repurchase up to 14.99% of the Company’sissued share capital, granted by shareholders at the 2008 AGM,will expire on 16th January 2010 unless renewed at theforthcoming AGM. The Directors consider that the renewal ofthe authority is in the interests of shareholders as a whole asthe repurchase of shares at a discount to NAV enhances theNAV of the remaining shares. The Board will therefore seekshareholder approval at the AGM to renew this authority, whichwill last until 15th January 2011 or until the whole of the 14.99%has been acquired, whichever is the earlier. The full text of theresolution is set out in the Notice of Meeting on page 90.Repurchases will be made at the discretion of the Board, andwill only be made in the market at prices below the prevailingNAV per share, thereby enhancing the NAV of the remainingshares, as and when market conditions are appropriate.
(ii) Authority to make off-market purchases (resolution 8) This resolution gives the Company authority to buy its deferredshares arising on conversion of any of the Growth or Income

TH
EC
OM
PA
NY
JPMorgan European Investment Trust plc. Annual Report & Accounts 200948
shares into the other class of shares. This resolution follows therequirements of Section 164 and 165 of the UK Companies Act1985. The Deferred shares are repurchased for nominalconsideration (as they have no economic value) in order tokeep the balance sheet manageable. By law the Company canonly purchase these shares off-market if such purchase ispursuant to a contract in the form approved at a generalmeeting of the Company.
Recommendation
The Board considers that resolutions 7 and 8 are likely topromote the success of the Company and are in the bestinterests of the Company and its shareholders as a whole. TheDirectors unanimously recommend that you vote in favour ofthe resolutions as they intend to do in respect of their ownbeneficial holdings which amount in aggregate to 24,967shares representing approximately 0.01% of the voting rightsof the Company.
By order of the Board Jonathan Latter, for and on behalf of JPMorgan Asset Management (UK) Limited, Secretary 8th June 2009
Directors’ Report continued

TH
EC
OM
PA
NY
JPMorgan European Investment Trust plc. Annual Report & Accounts 2009 49
Compliance The Company is committed to high standards of corporategovernance. This statement, together with the Statement ofDirectors’ Responsibilities on page 55, indicates how theCompany has applied the principles of good governance of theFinancial Reporting Council Combined Code (the ‘CombinedCode’) and the AIC’s Code of Corporate Governance, (the ‘AICCode’), which complements the Combined Code and provides aframework of best practice for investment trusts.
The Board is responsible for ensuring the appropriate level ofcorporate governance and considers that the Company hascomplied with the best practice provisions of the CombinedCode, insofar as they are relevant to the Company’s business,and the AIC Code throughout the year under review.
Role of the Board A management agreement between the Company and JPMAMsets out the matters over which the Manager has authority. Thisincludes management of the Company’s assets and theprovision of accounting, company secretarial, administrative,and some marketing services. All other matters are reservedfor the approval of the Board. A formal schedule of mattersreserved to the Board for decision has been approved. Thisincludes determination and monitoring of the Company’sinvestment objectives and policy and its future strategicdirection, gearing policy, management of the capital structure,appointment and removal of third party service providers,review of key investment and financial data and the Company’scorporate governance and risk control arrangements.
The Board meets at least quarterly during the year andadditional meetings are arranged as necessary. Full and timelyinformation is provided to the Board to enable it to functioneffectively and to allow Directors to discharge theirresponsibilities.
There is an agreed procedure for Directors to take independentprofessional advice if necessary and at the Company’s expense.This is in addition to the access that every Director has to theadvice and services of the Company Secretary, JPMAM, which isresponsible to the Board for ensuring that Board proceduresare followed and that applicable rules and regulations arecomplied with.
Board Composition The Board, chaired by Andrew Murison, consists of fivenon-executive Directors, all of whom are regarded by theBoard as independent of the Company’s Manager, including theChairman. The Directors have a breadth of investment
knowledge, business and financial skills and experiencerelevant to the Company’s business and brief biographicaldetails of each Director are set out on page 40.
A review of Board composition and balance is included as partof the annual performance evaluation of the Board, details ofwhich may be found below. The Board has considered whethera senior independent director should be appointed and hasconcluded that, as the Board comprises entirely of non-executive directors, this is unnecessary at present. However,the Chairman of the Audit Committee leads the evaluation ofthe performance of the Chairman and is available toshareholders if they have concerns that cannot be resolvedthrough discussion with the Chairman.
Tenure Directors are initially appointed until the following AnnualGeneral Meeting when, under the Company’s Articles ofAssociation, it is required that they be elected by shareholders.Thereafter, a Director’s appointment will run for a term of threeyears. Subject to the performance evaluation carried out eachyear, the Board will agree whether it is appropriate for theDirector to seek an additional term. The Board does not believethat length of service in itself necessarily disqualifies a Directorfrom seeking re-election but, when making a recommendation,the Board will take into account the ongoing requirements ofthe Combined Code, including the need to refresh the Boardand its Committees. The Company’s Articles of Associationrequire that Directors stand for re-election at least every threeyears. Any Director who has served for a period of more thannine years will stand for annual re-election thereafter.
The terms and conditions of Directors’ appointments are setout in formal letters of appointment, copies of which areavailable for inspection on request at the Company’s registeredoffice and at the AGM.
The Board recommends the election of Stephen Goldman andthe re-election of Ferdinand Verdonck and Robin Faber, whoretire by rotation at this year’s AGM.
Meetings and Committees The Board delegates certain responsibilities and functions tocommittees. Details of membership of committees are shownwith the Directors’ profiles on page 40.
The table below details the number of Board and Committeemeetings attended by each Director. During the year therewere five full Board meetings, including a private meeting ofthe Directors to evaluate the Manager and a separate meetingdevoted to strategy. There were also two Audit Committee
Corporate Governance
TH
EC
OM
PA
NY
JPMorgan European Investment Trust plc. Annual Report & Accounts 200950
Corporate Governance continued
meetings and one meeting of the Nomination Committeeduring the year.
Audit NominationBoard Committee Committee
meetings meetings meetings Directors attended attended attended
Andrew Murison 5 2 1Robin Faber 5 2 1Stephen Goldman1 3 1 1Stephen Russell 5 2 1Ferdinand Verdonck 5 2 1Alexander E Zagoreos2 4 2 —
1Appointed a Director on 1st September 2008.2Retired from the Board on 31st December 2008.
Training and Appraisal On appointment, the Manager and Company Secretary provideall Directors with induction training. Thereafter, regularbriefings are provided on changes in regulatory requirementsthat affect the Company and Directors. Directors areencouraged to attend industry and other seminars coveringissues and developments relevant to investment trusts.
The Board conducts a formal evaluation of the Manager, itsown performance and of that of its committees and individualDirectors. Questionnaires, drawn up by the Board, arecompleted by each Director. The responses are collated andthen discussed at a private meeting. The evaluation ofindividual Directors is led by the Chairman, and the Chairmanof the Audit Committee leads the evaluation of the Chairman’sperformance. The Board as a whole evaluates the Manager, itsown performance and that of its committees.
Board Committees Nomination Committee The Nomination Committee, chaired by Andrew Murison,consists of all of the Directors and meets at least annually toensure that the Board has an appropriate balance of skills andexperience to carry out its fiduciary duties and to select andpropose suitable candidates for appointment when necessary.A variety of sources, including the use of external searchconsultants, may be used to ensure that a wide range ofcandidates is considered.
The Committee undertakes an annual performance evaluationto ensure that all members of the Board have devotedsufficient time and contributed adequately to the work of the
Board. The Committee also reviews Directors’ fees and makesrecommendations to the Board as and when appropriate.
Audit Committee The Audit Committee, chaired by Robin Faber, meets at leasttwice each year. The members of the Audit Committeeconsider that they have the requisite skills and experience tofulfil the responsibilities of the Committee.
The Committee reviews the actions and judgements of theManager in relation to the interim and annual accounts and theCompany’s compliance with the Combined Code. It reviews theterms of the management agreement and examines theeffectiveness of the Company’s internal control systems,receives information from the Managers’ Compliancedepartment and reviews the scope and results of the externalaudit, its cost effectiveness and the independence andobjectivity of the external auditors; in the Directors’ opinion,the auditors are considered independent. Representatives ofthe Company’s auditors attend the Audit Committee meetingat which the draft annual report and accounts are considered.
The Directors’ statement on the Company’s system of internalcontrol is set out below.
Both the Nomination Committee and the Audit Committeehave written terms of reference which define clearly theirrespective responsibilities, copies of which are available forinspection at the Company’s website, on request at theCompany’s registered office and at the Company’s AnnualGeneral Meeting.
Relations with Shareholders The Board regularly monitors the shareholder profile of theCompany. It aims to provide shareholders with a fullunderstanding of the Company’s activities and performanceand reports formally to shareholders twice a year by way of theannual report and accounts and the half year Report. This issupplemented by the daily publication, through the LondonStock Exchange, of the net asset value of the Company’sshares.
All shareholders are encouraged to attend the Company’sAnnual General Meeting at which the Directors andrepresentatives of the Managers are available in person tomeet with shareholders and answer their questions. Inaddition, a presentation is given by the Investment Managerswho review the Company’s performance. During the year theCompany’s brokers, the Investment Managers and JPMAM holdregular discussions with larger shareholders. The Directors are

TH
EC
OM
PA
NY
JPMorgan European Investment Trust plc. Annual Report & Accounts 2009 51
made fully aware of their views. The Chairman and Directorsmake themselves available as and when required to addressshareholder queries. The Directors may be contacted throughthe Company Secretary whose details are shown on page 86.
The Company’s Annual Report and Accounts is published intime to give shareholders at least 20 working days’ notice ofthe Annual General Meeting. Shareholders wishing to raisequestions in advance of the meeting are encouraged to writeto the Company Secretary at the address shown on page 86.Details of the Proxy voting position on each resolution will bepublished on the Company’s website shortly after the AnnualGeneral Meeting.
Internal Control The Combined Code requires the Directors, at least annually, toreview the effectiveness of the Company’s system of internalcontrol and to report to shareholders that they have done so.This encompasses a review of all controls; business, financial,operational, compliance and risk management.
The Directors are responsible for the Company’s system ofinternal control which is designed to safeguard the Company’sassets, maintain proper accounting records and ensure thatfinancial information used within the business, or published,is reliable. However, such a system can only be designed tomanage rather than eliminate the risk of failure to achievebusiness objectives and therefore can only provide reasonable,but not absolute, assurance against fraud, material mis-statement or loss.
Since investment management, custody of assets and alladministrative services are provided to the Company byJPMAM and its associates, the Company’s system of internalcontrol mainly comprises monitoring the services providedby JPMAM and its associates, including the operating controlsestablished by them, to ensure they meet the Company’sbusiness objectives. The Company does not have an internalaudit function of its own, but relies on the internal auditdepartment of JPMAM. The key elements designed to provideeffective internal control are as follows:
Financial Reporting – Regular and comprehensive review bythe Board of key investment and financial data, includingmanagement accounts, revenue projections, analysis oftransactions and performance comparisons.
Management Agreement – Appointment of a manager andcustodian regulated by the Financial Services Authority (‘FSA’),
whose responsibilities are clearly defined in a writtenagreement.
Management Systems – The Manager’s system of internalcontrol includes organisational agreements which clearlydefine the lines of responsibility, delegated authority, controlprocedures and systems. These are monitored by JPMAM’sCompliance department which regularly monitors compliancewith FSA rules.
Investment Strategy – Authorisation and monitoring of theCompany’s investment strategy and exposure limits by theBoard.
The Board, either directly or through the Audit Committee,keeps under review the effectiveness of the Company’s systemof internal control by monitoring the operation of the keyoperating controls of the Managers and its associates asfollows:
• the Board, through the Audit Committee, reviews the termsof the management agreement and receives regularreports from JPMAM’s Compliance department;
• the Board reviews the report on the internal controls andthe operations of its custodian, JPMorgan Chase Bank,which is itself independently reviewed; and
• the Directors review every six months an independentreport on the internal controls and the operations ofJPMAM.
By the means of the procedures set out above, the Boardconfirms that in accordance with the Turnball guidance, it hasreviewed the effectiveness of the Company’s system of internalcontrol for the year ended 31st March 2009, and to the date ofapproval of this Annual Report and Accounts.
Corporate Governance and Voting Policy The Company delegates responsibility for voting to JPMAM.The following is a summary of JPMAM’s policy statement oncorporate governance and voting policy which has been notedby the Board. The full policy is available from JPMAM onrequest, or can be downloaded from the internet as follows: goto www.jpmorganassetmanagement.co.uk/institutional andwithin the “Commentary & Analysis” tab you will find a sectionon Corporate Governance.

TH
EC
OM
PA
NY
JPMorgan European Investment Trust plc. Annual Report & Accounts 200952
“JPMAM is committed to delivering superior investmentperformance to its clients worldwide. We believe that one ofthe drivers of investment performance is an assessment of thecorporate governance principles and practices of thecompanies in which we invest our clients’ assets and we expectthose companies to demonstrate high standards of governancein the management of their business.
Proxy voting is an important part of the corporate governanceprocess, and we view seriously our obligation to manage thevoting rights of the shares entrusted to us as we would manageany other asset. It is the policy of JPMAM to vote in a prudentand diligent manner, based exclusively on our reasonablejudgement of what will best serve the financial interests of ourclients. So far as is practicable we will vote at all of themeetings called by companies in which we are invested.
In order to do this we have formulated detailed guidelines foreach region, which set out our stance on a variety of keycorporate governance issues, including disclosure andtransparency, board composition and independence, controlstructures, remuneration, as well as social and environmentalissues (see below). These guidelines form the basis of our proxyvoting decisions, although it should be noted that JPMAMmakes all of its voting decisions on a case by case basis, takinginto account the individual circumstances of each vote.”
Corporate Social Responsibility The following is a summary of JPMAM’s policy statement oncorporate social responsibility which has been noted by theBoard:
“We believe it is our primary duty to act in the best financialinterests of our clients and to achieve good financial returnsconsistent with an acceptable level of risk. We recognise thatnon-financial issues, such as social and environmental issues,can have an economic impact and that any company run in thelong-term interests of its shareholders will need to manageeffectively relationships with its employees, suppliers andcustomers, to behave ethically and to have regard to theenvironment and society as a whole. Our investment managerstake these factors into account as part of any investmentdecision.”
Corporate Governance continued
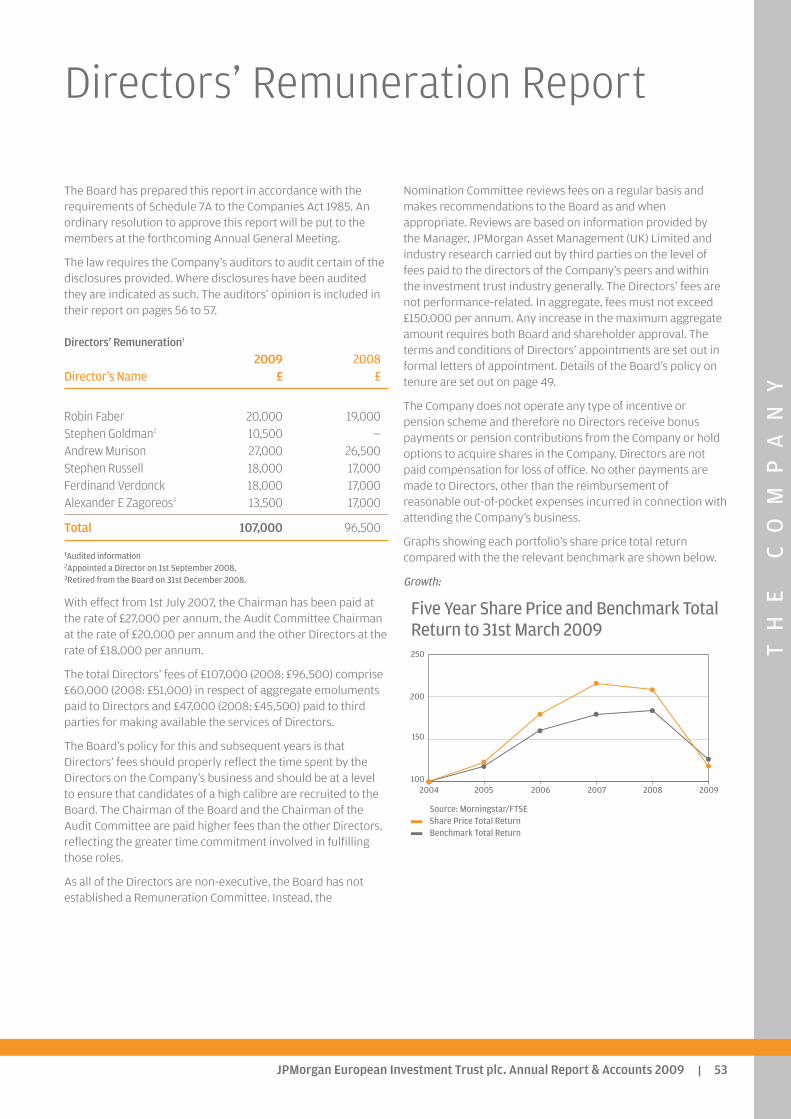
TH
EC
OM
PA
NY
JPMorgan European Investment Trust plc. Annual Report & Accounts 2009 53
The Board has prepared this report in accordance with therequirements of Schedule 7A to the Companies Act 1985. Anordinary resolution to approve this report will be put to themembers at the forthcoming Annual General Meeting.
The law requires the Company’s auditors to audit certain of thedisclosures provided. Where disclosures have been auditedthey are indicated as such. The auditors’ opinion is included intheir report on pages 56 to 57.
Directors’ Remuneration1
2009 2008Director’s Name £ £
Robin Faber 20,000 19,000Stephen Goldman2 10,500 —Andrew Murison 27,000 26,500Stephen Russell 18,000 17,000Ferdinand Verdonck 18,000 17,000Alexander E Zagoreos3 13,500 17,000
Total 107,000 96,500
1Audited information2Appointed a Director on 1st September 2008.3Retired from the Board on 31st December 2008.
With effect from 1st July 2007, the Chairman has been paid atthe rate of £27,000 per annum, the Audit Committee Chairmanat the rate of £20,000 per annum and the other Directors at therate of £18,000 per annum.
The total Directors’ fees of £107,000 (2008: £96,500) comprise£60,000 (2008: £51,000) in respect of aggregate emolumentspaid to Directors and £47,000 (2008: £45,500) paid to thirdparties for making available the services of Directors.
The Board’s policy for this and subsequent years is thatDirectors’ fees should properly reflect the time spent by theDirectors on the Company’s business and should be at a levelto ensure that candidates of a high calibre are recruited to theBoard. The Chairman of the Board and the Chairman of theAudit Committee are paid higher fees than the other Directors,reflecting the greater time commitment involved in fulfillingthose roles.
As all of the Directors are non-executive, the Board has notestablished a Remuneration Committee. Instead, the
Nomination Committee reviews fees on a regular basis andmakes recommendations to the Board as and whenappropriate. Reviews are based on information provided bythe Manager, JPMorgan Asset Management (UK) Limited andindustry research carried out by third parties on the level offees paid to the directors of the Company’s peers and withinthe investment trust industry generally. The Directors’ fees arenot performance-related. In aggregate, fees must not exceed£150,000 per annum. Any increase in the maximum aggregateamount requires both Board and shareholder approval. Theterms and conditions of Directors’ appointments are set out informal letters of appointment. Details of the Board’s policy ontenure are set out on page 49.
The Company does not operate any type of incentive orpension scheme and therefore no Directors receive bonuspayments or pension contributions from the Company or holdoptions to acquire shares in the Company. Directors are notpaid compensation for loss of office. No other payments aremade to Directors, other than the reimbursement ofreasonable out-of-pocket expenses incurred in connection withattending the Company’s business.
Graphs showing each portfolio’s share price total returncompared with the the relevant benchmark are shown below.
Growth:
Five Year Share Price and Benchmark TotalReturn to 31st March 2009
Source: Morningstar/FTSEShare Price Total ReturnBenchmark Total Return
100
150
200
250
200920082007200620052004
Directors’ Remuneration Report
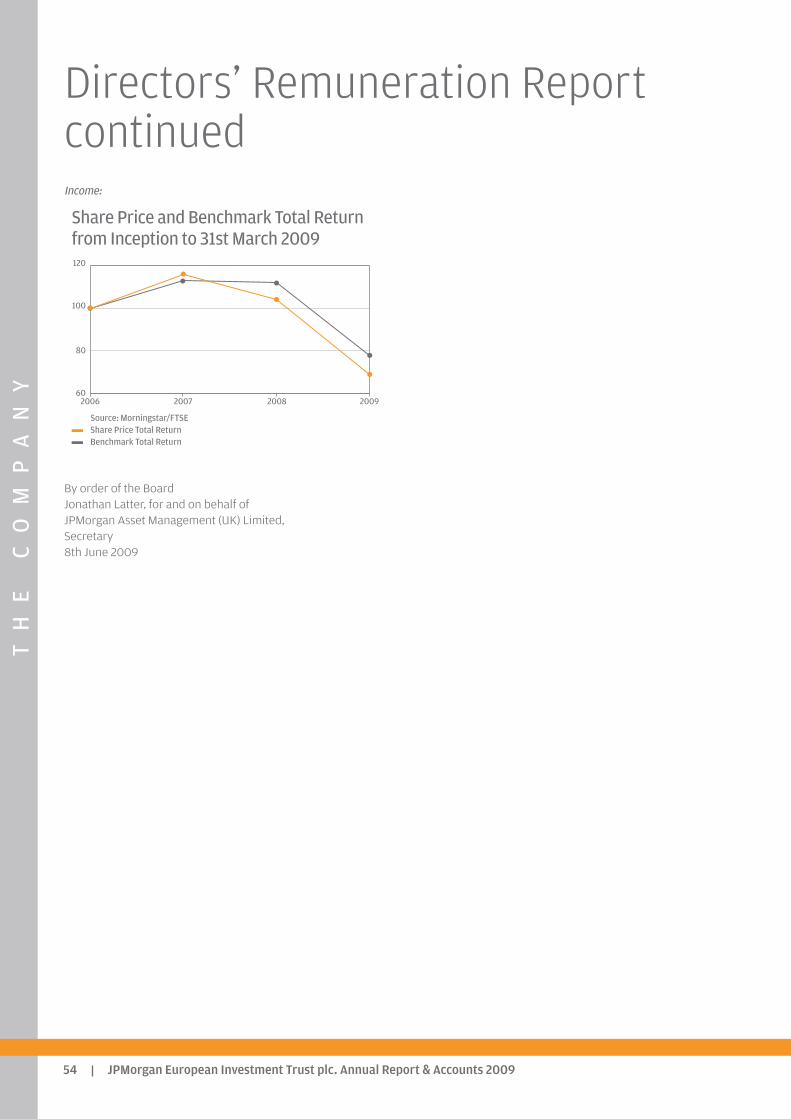
TH
EC
OM
PA
NY
JPMorgan European Investment Trust plc. Annual Report & Accounts 200954
Income:
Share Price and Benchmark Total Returnfrom Inception to 31st March 2009
Source: Morningstar/FTSEShare Price Total ReturnBenchmark Total Return
By order of the Board Jonathan Latter, for and on behalf of JPMorgan Asset Management (UK) Limited, Secretary 8th June 2009
60
80
100
120
2009200820072006
Directors’ Remuneration Reportcontinued

TH
EC
OM
PA
NY
JPMorgan European Investment Trust plc. Annual Report & Accounts 2009 55
The Directors are responsible for preparing the annual reportand the financial statements in accordance with applicable lawand regulations.
Company law requires the Directors to prepare accounts foreach financial year in accordance with United KingdomGenerally Accepted Accounting Practice which give a true andfair view of the state of affairs of the Company as at the end ofthe year and of the total return for the year. In preparing thoseaccounts, the Directors are required to:
• select suitable accounting policies and then apply themconsistently;
• make judgements and estimates that are reasonable andprudent; and
• state whether applicable accounting standards have beenfollowed, subject to any material departures disclosed andexplained in the accounts.
The Directors confirm that they comply with theserequirements.
The Directors are responsible for ensuring that properaccounting records are kept which disclose with reasonableaccuracy at any time the financial position of the Company andenable them to ensure that the accounts comply with theCompanies Act 1985. They are also responsible forsafeguarding the assets of the Company and hence for takingreasonable steps for the prevention and detection of fraud andother irregularities.
The accounts are published on the www.jpmeuropean.co.ukwebsite, which is maintained by the Company’s Manager,JPMorgan Asset Management (UK) Limited (‘JPMAM’). Themaintenance and integrity of the website maintained byJPMAM is, so far as it relates to the Company, the responsibilityof JPMAM. The work carried out by the auditors does notinvolve consideration of the maintenance and integrity of thiswebsite and, accordingly, the auditors accept no responsibilityfor any changes that have occurred to the accounts since theywere initially presented on the website. The accounts areprepared in accordance with UK legislation, which may differfrom legislation in other jurisdictions.
Statement under the Disclosure & Transparency Rules 4.1.12
The Directors each confirm to the best of their knowledge that:
(a) the financial statements, prepared in accordance withapplicable accounting standards, give a true and fair viewof the assets, liabilities, financial position and profit or lossof the Company; and
(b) this Annual Report includes a fair review of thedevelopment and performance of the business and theposition of the Company together with a description of theprincipal risks and uncertainties that they face.
For and on behalf of the BoardAndrew Murison Chairman 8th June 2009
Directors’ Responsibilities inRespect of the Accounts

TH
EC
OM
PA
NY
JPMorgan European Investment Trust plc. Annual Report & Accounts 200956
Independent Auditors’ Report to the members of JPMorganEuropean Investment Trust plc
We have audited the accounts of JPMorgan EuropeanInvestment Trust plc for the year ended 31st March 2009which comprise the Income Statement, Statement of TotalRecognised Gains and Losses, Reconciliation of Movementsin Shareholders’ Funds, Balance Sheet, and the Cash FlowStatement and the related notes 1 to 25. These accounts havebeen prepared under the accounting policies set out therein.We have also audited the information in the Directors’Remuneration Report that is described as having been audited.
This report is made solely to the Company’s members, as abody, in accordance with Section 235 of the Companies Act1985. Our audit work has been undertaken so that we mightstate to the Company’s members those matters we arerequired to state to them in an auditors’ report and for no otherpurpose. To the fullest extent permitted by law, we do notaccept or assume responsibility to anyone other than theCompany and the Company’s members as a body, for our auditwork, for this report, or for the opinions we have formed.
Respective Responsibilities of Directors and Auditors
The Directors responsibilities for preparing the Annual Report,the Directors’ Remuneration Report and the accounts inaccordance with applicable United Kingdom law andAccounting Standards (United Kingdom Generally AcceptedAccounting Practice) are set out in the Statement of Directors’Responsibilities.
Our responsibility is to audit the accounts and the part of theDirectors’ Remuneration Report to be audited in accordancewith relevant legal and regulatory requirements andInternational Standards on Auditing (UK and Ireland).
We report to you our opinion as to whether the accounts givea true and fair view, the accounts and the part of the Directors’Remuneration Report to be audited have been properlyprepared in accordance with the Companies Act 1985 and theinformation given in the Directors’ Report is consistent with theaccounts.
We also report to you if, in our opinion, the Company has notkept proper accounting records, if we have not received all theinformation and explanations we require for our audit, or ifinformation specified by law regarding Directors’ remunerationand other transactions is not disclosed.
We review whether the Corporate Governance Statementreflects the Company’s compliance with the nine provisions of
the Combined Code specified for our review by the ListingRules of the Financial Services Authority, and we report if itdoes not. We are not required to consider whether the Board’sstatements on internal control cover all risks and controls, orform an opinion on the effectiveness of the Company’scorporate governance procedures or its risk and controlprocedures.
We read other information contained in the Annual Report andconsider whether it is consistent with the audited accounts. Theother information comprises only the Financial Results,Chairman’s Statement, Investment Managers’ Report,Summaries of Results, Ten Year Financial Record, Ten LargestInvestments, Portfolio Analyses, Lists of Investments, PortfolioIncome Statements, Portfolio Balance Sheets, Board ofDirectors, Directors’ Report, Corporate Governance, theunaudited part of the Directors’ Remuneration Report,Directors’ Responsibilities in Respect of the Accounts,Information about the Company, Capital Structure andConversion between Share Classes, Shareholder Analyses,Notice of Annual General Meeting and Glossary of Terms. Weconsider the implications for our report if we become aware ofany apparent misstatements or material inconsistencies withthe accounts. Our responsibilities do not extend to any otherinformation.
Basis of audit opinion
We conducted our audit in accordance with InternationalStandards on Auditing (UK and Ireland) issued by the AuditingPractices Board. An audit includes examination, on a test basis,of evidence relevant to the amounts and disclosures in theaccounts and the part of the Directors’ Remuneration Report tobe audited. It also includes an assessment of the significantestimates and judgements made by the Directors in thepreparation of the accounts, and of whether the accountingpolicies are appropriate to the Company’s circumstances,consistently applied and adequately disclosed.
We planned and performed our audit so as to obtain allthe information and explanations which we considerednecessary in order to provide us with sufficient evidence togive reasonable assurance that the accounts and the part of theDirectors’ Remuneration Report to be audited are free frommaterial misstatement, whether caused by fraud or otherirregularity or error. In forming our opinion we also evaluatedthe overall adequacy of the presentation of information in theaccounts and the part of the Directors’ Remuneration Report tobe audited.
Independent Auditors’ Report

TH
EC
OM
PA
NY
JPMorgan European Investment Trust plc. Annual Report & Accounts 2009 57
Opinion
In our opinion:
• the accounts give a true and fair view, in accordance withUnited Kingdom Generally Accepted Accounting Practice,of the state of the Company’s affairs as at 31st March 2009and of its loss for the year then ended;
• the accounts and the part of the Directors’ RemunerationReport to be audited have been properly prepared inaccordance with the Companies Act 1985; and
• the information given in the Directors’ Report is consistentwith the accounts.
ERNST & YOUNG LLP Registered Auditor London, 8th June 2009
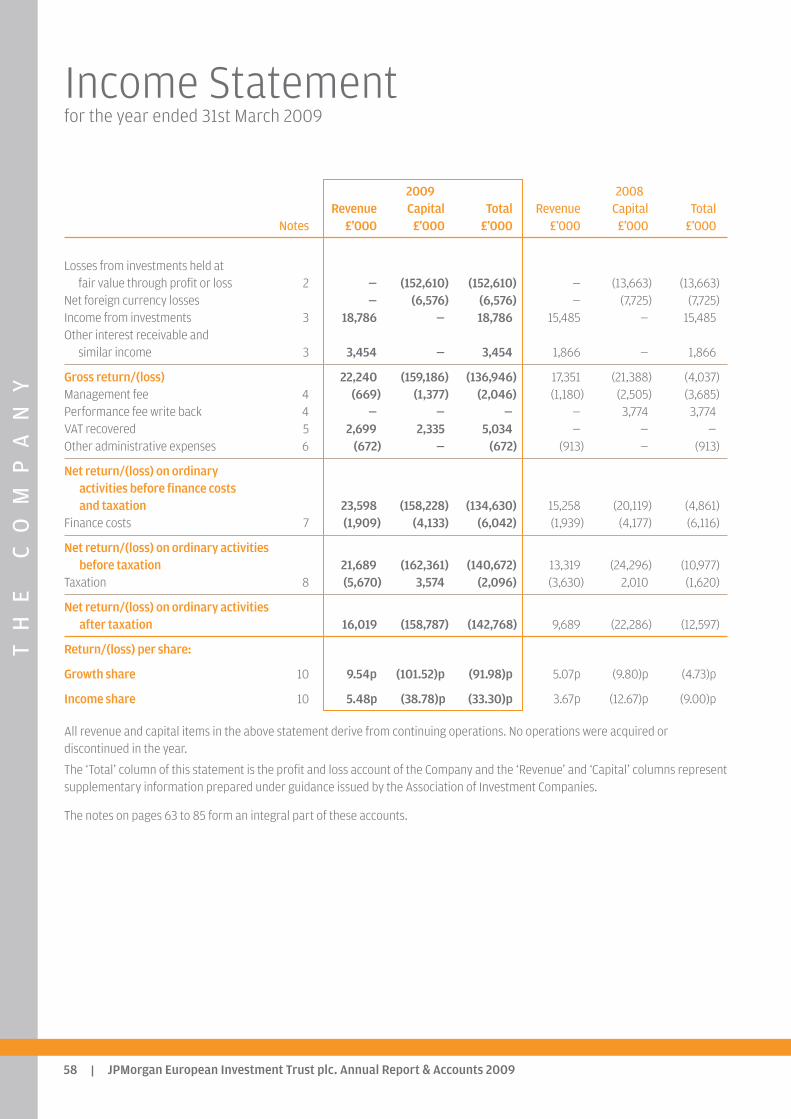
TH
EC
OM
PA
NY
JPMorgan European Investment Trust plc. Annual Report & Accounts 200958
Income Statementfor the year ended 31st March 2009
2009 2008Revenue Capital Total Revenue Capital Total
Notes £’000 £’000 £’000 £’000 £’000 £’000
Losses from investments held at fair value through profit or loss 2 — (152,610) (152,610) — (13,663) (13,663)
Net foreign currency losses — (6,576) (6,576) — (7,725) (7,725)Income from investments 3 18,786 — 18,786 15,485 — 15,485Other interest receivable and
similar income 3 3,454 — 3,454 1,866 — 1,866
Gross return/(loss) 22,240 (159,186) (136,946) 17,351 (21,388) (4,037)Management fee 4 (669) (1,377) (2,046) (1,180) (2,505) (3,685)Performance fee write back 4 — — — — 3,774 3,774VAT recovered 5 2,699 2,335 5,034 — — —Other administrative expenses 6 (672) — (672) (913) — (913)
Net return/(loss) on ordinary activities before finance costs and taxation 23,598 (158,228) (134,630) 15,258 (20,119) (4,861)
Finance costs 7 (1,909) (4,133) (6,042) (1,939) (4,177) (6,116)
Net return/(loss) on ordinary activities before taxation 21,689 (162,361) (140,672) 13,319 (24,296) (10,977)
Taxation 8 (5,670) 3,574 (2,096) (3,630) 2,010 (1,620)
Net return/(loss) on ordinary activities after taxation 16,019 (158,787) (142,768) 9,689 (22,286) (12,597)
Return/(loss) per share:
Growth share 10 9.54p (101.52)p (91.98)p 5.07p (9.80)p (4.73)p
Income share 10 5.48p (38.78)p (33.30)p 3.67p (12.67)p (9.00)p
All revenue and capital items in the above statement derive from continuing operations. No operations were acquired ordiscontinued in the year.
The ‘Total’ column of this statement is the profit and loss account of the Company and the ‘Revenue’ and ‘Capital’ columns representsupplementary information prepared under guidance issued by the Association of Investment Companies.
The notes on pages 63 to 85 form an integral part of these accounts.
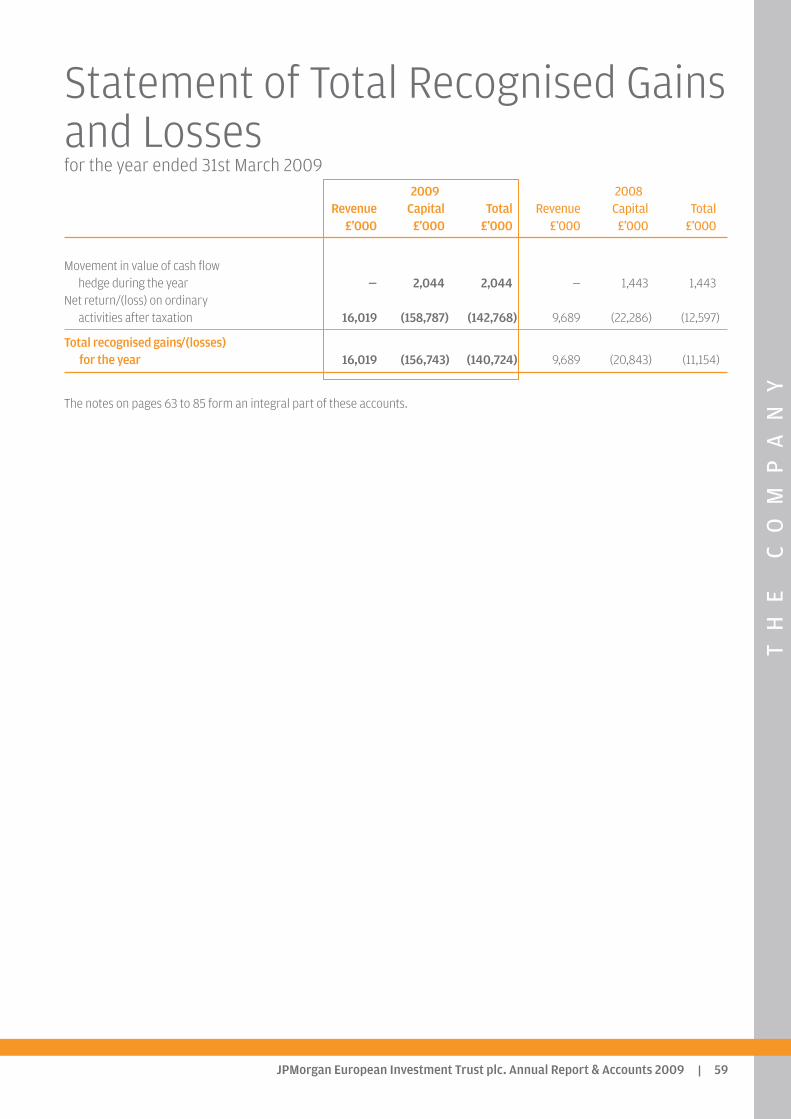
TH
EC
OM
PA
NY
JPMorgan European Investment Trust plc. Annual Report & Accounts 2009 59
2009 2008Revenue Capital Total Revenue Capital Total
£’000 £’000 £’000 £’000 £’000 £’000
Movement in value of cash flow hedge during the year — 2,044 2,044 — 1,443 1,443
Net return/(loss) on ordinary activities after taxation 16,019 (158,787) (142,768) 9,689 (22,286) (12,597)
Total recognised gains/(losses)for the year 16,019 (156,743) (140,724) 9,689 (20,843) (11,154)
The notes on pages 63 to 85 form an integral part of these accounts.
Statement of Total Recognised Gainsand Losses for the year ended 31st March 2009
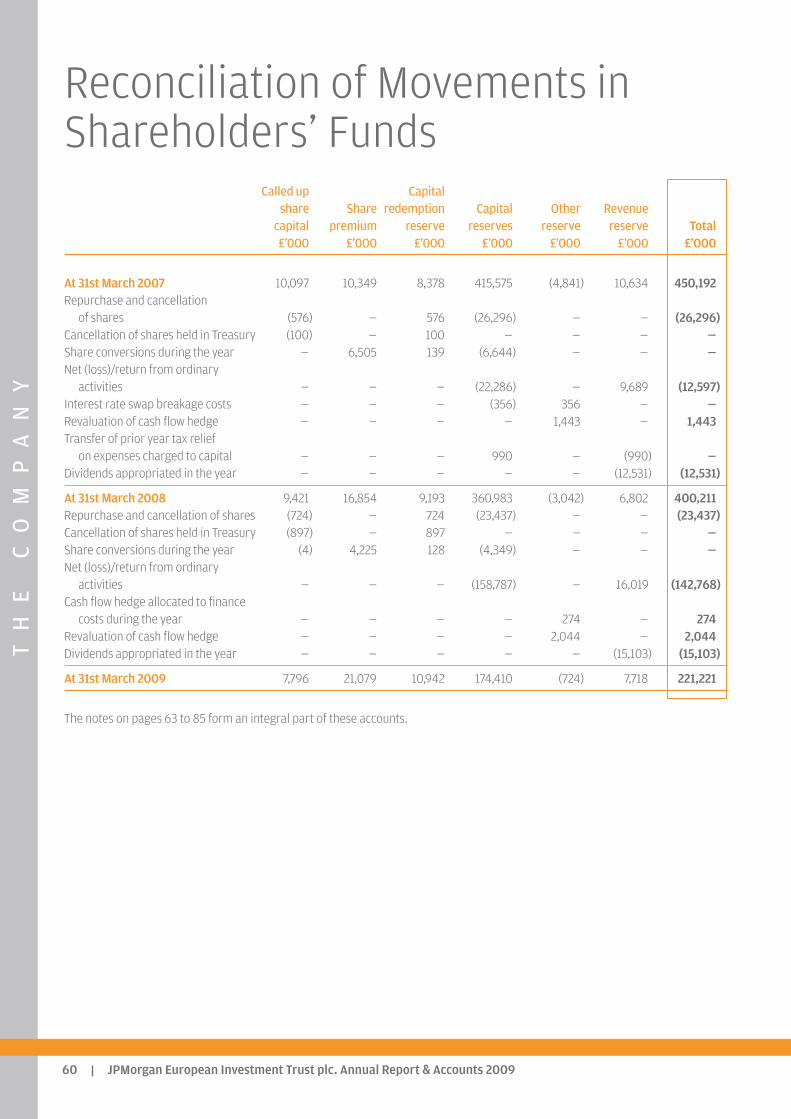
TH
EC
OM
PA
NY
JPMorgan European Investment Trust plc. Annual Report & Accounts 200960
Called up Capitalshare Share redemption Capital Other Revenue
capital premium reserve reserves reserve reserve Total£’000 £’000 £’000 £’000 £’000 £’000 £’000
At 31st March 2007 10,097 10,349 8,378 415,575 (4,841) 10,634 450,192Repurchase and cancellation
of shares (576) — 576 (26,296) — — (26,296)Cancellation of shares held in Treasury (100) — 100 — — — —Share conversions during the year — 6,505 139 (6,644) — — —Net (loss)/return from ordinary
activities — — — (22,286) — 9,689 (12,597)Interest rate swap breakage costs — — — (356) 356 — —Revaluation of cash flow hedge — — — — 1,443 — 1,443Transfer of prior year tax relief
on expenses charged to capital — — — 990 — (990) —Dividends appropriated in the year — — — — — (12,531) (12,531)
At 31st March 2008 9,421 16,854 9,193 360,983 (3,042) 6,802 400,211Repurchase and cancellation of shares (724) — 724 (23,437) — — (23,437)Cancellation of shares held in Treasury (897) — 897 — — — —Share conversions during the year (4) 4,225 128 (4,349) — — —Net (loss)/return from ordinary
activities — — — (158,787) — 16,019 (142,768)Cash flow hedge allocated to finance
costs during the year — — — — 274 — 274Revaluation of cash flow hedge — — — — 2,044 — 2,044Dividends appropriated in the year — — — — — (15,103) (15,103)
At 31st March 2009 7,796 21,079 10,942 174,410 (724) 7,718 221,221
The notes on pages 63 to 85 form an integral part of these accounts.
Reconciliation of Movements inShareholders’ Funds
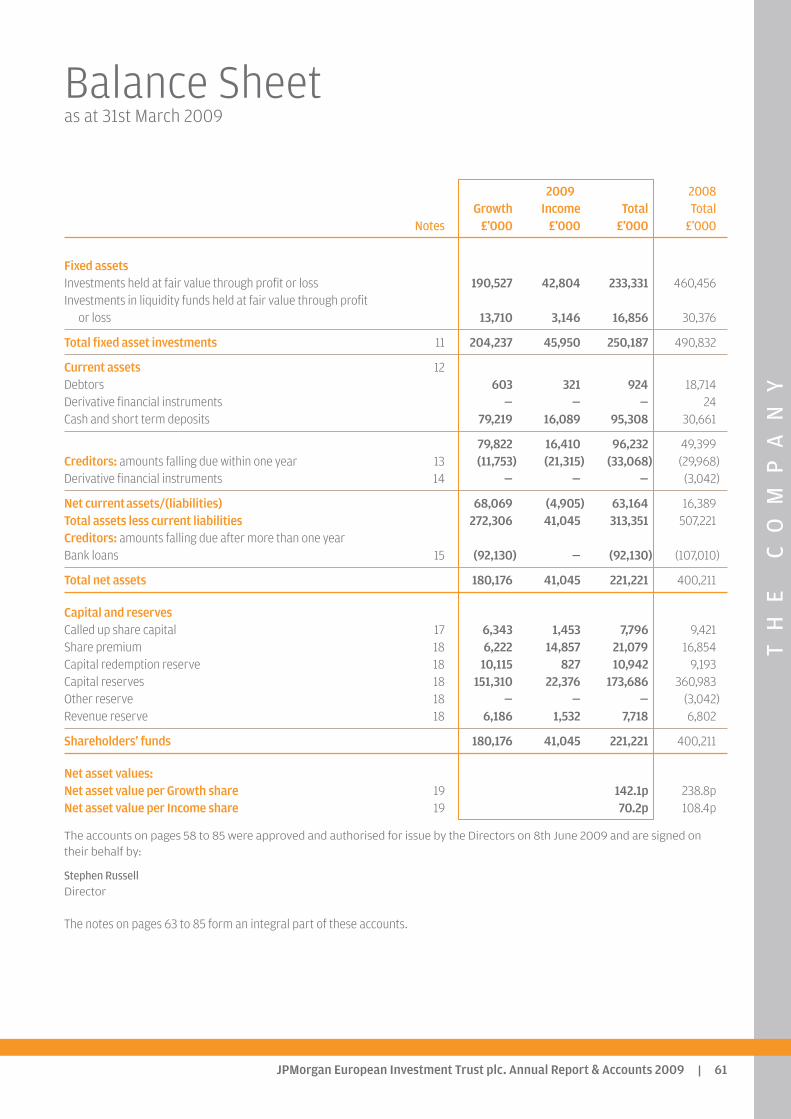
TH
EC
OM
PA
NY
JPMorgan European Investment Trust plc. Annual Report & Accounts 2009 61
2009 2008Growth Income Total Total
Notes £’000 £’000 £’000 £’000
Fixed assets Investments held at fair value through profit or loss 190,527 42,804 233,331 460,456Investments in liquidity funds held at fair value through profit
or loss 13,710 3,146 16,856 30,376
Total fixed asset investments 11 204,237 45,950 250,187 490,832
Current assets 12Debtors 603 321 924 18,714Derivative financial instruments — — — 24Cash and short term deposits 79,219 16,089 95,308 30,661
79,822 16,410 96,232 49,399Creditors: amounts falling due within one year 13 (11,753) (21,315) (33,068) (29,968)Derivative financial instruments 14 — — — (3,042)
Net current assets/(liabilities) 68,069 (4,905) 63,164 16,389Total assets less current liabilities 272,306 41,045 313,351 507,221Creditors: amounts falling due after more than one year Bank loans 15 (92,130) — (92,130) (107,010)
Total net assets 180,176 41,045 221,221 400,211
Capital and reserves Called up share capital 17 6,343 1,453 7,796 9,421Share premium 18 6,222 14,857 21,079 16,854Capital redemption reserve 18 10,115 827 10,942 9,193Capital reserves 18 151,310 22,376 173,686 360,983Other reserve 18 — — — (3,042)Revenue reserve 18 6,186 1,532 7,718 6,802
Shareholders’ funds 180,176 41,045 221,221 400,211
Net asset values:Net asset value per Growth share 19 142.1p 238.8pNet asset value per Income share 19 70.2p 108.4p
The accounts on pages 58 to 85 were approved and authorised for issue by the Directors on 8th June 2009 and are signed ontheir behalf by:
Stephen RussellDirector
The notes on pages 63 to 85 form an integral part of these accounts.
Balance Sheetas at 31st March 2009
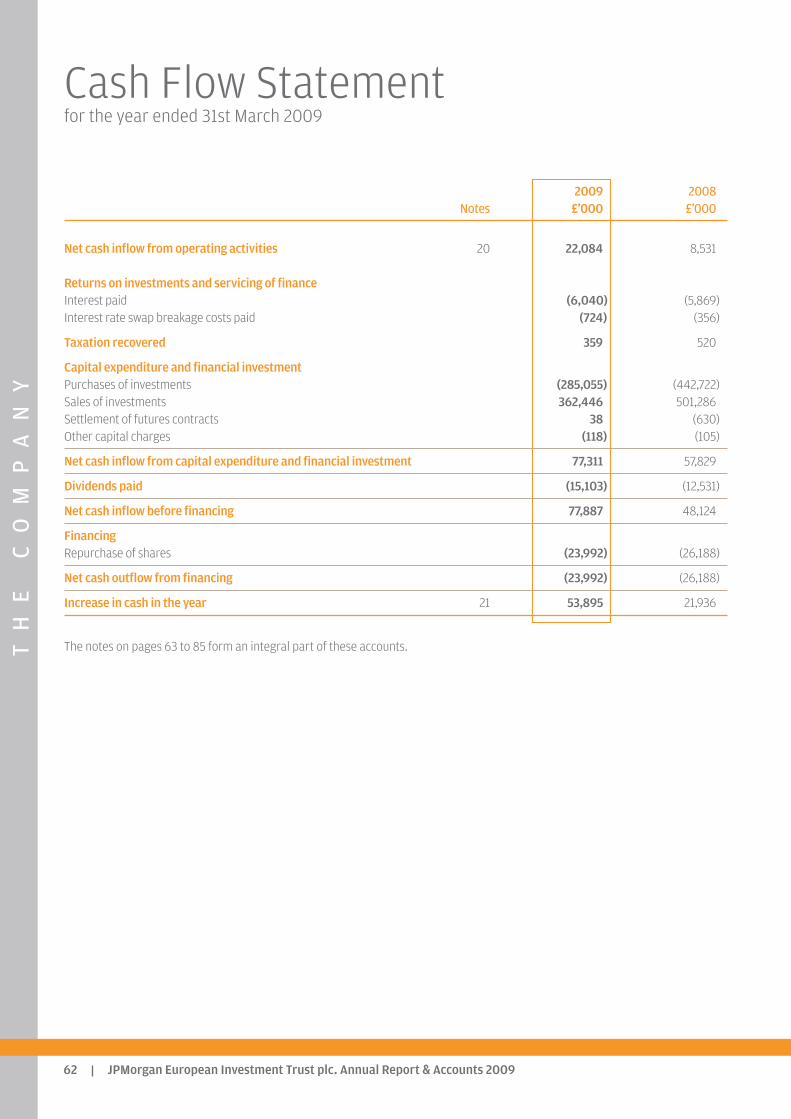
TH
EC
OM
PA
NY
JPMorgan European Investment Trust plc. Annual Report & Accounts 200962
2009 2008Notes £’000 £’000
Net cash inflow from operating activities 20 22,084 8,531
Returns on investments and servicing of finance Interest paid (6,040) (5,869)Interest rate swap breakage costs paid (724) (356)
Taxation recovered 359 520
Capital expenditure and financial investment Purchases of investments (285,055) (442,722)Sales of investments 362,446 501,286Settlement of futures contracts 38 (630)Other capital charges (118) (105)
Net cash inflow from capital expenditure and financial investment 77,311 57,829
Dividends paid (15,103) (12,531)
Net cash inflow before financing 77,887 48,124
Financing Repurchase of shares (23,992) (26,188)
Net cash outflow from financing (23,992) (26,188)
Increase in cash in the year 21 53,895 21,936
The notes on pages 63 to 85 form an integral part of these accounts.
Cash Flow Statementfor the year ended 31st March 2009

TH
EC
OM
PA
NY
JPMorgan European Investment Trust plc. Annual Report & Accounts 2009 63
1. Accounting policies(a) Basis of accounting
The accounts are prepared in accordance with the Companies Act 1985, United Kingdom Generally Accepted AccountingPractice (‘UK GAAP’) and with the Statement of Recommended Practice ‘Financial Statements of Investment Trust Companies’( the ‘SORP’) issued by the Association of Investment Companies (‘AIC’) in January 2009. The accounting policies applied tothese accounts are consistent with those applied in the accounts for the year ended 31st March 2008.
The accounts have been prepared on a going concern basis.
All of the Company’s operations are of a continuing nature.
(b) Valuation of investmentsThe Company’s business is investing in financial assets with a view to profiting from the total return in the form of income andcapital growth. This portfolio of financial assets is managed and its performance evaluated on a fair value basis in accordancewith the documented investment strategy and information about the investment portfolio is provided internally on that basisto the Company’s Board of Directors. Accordingly, upon initial recognition, the investments are designated by the Company as‘held at fair value through profit or loss’. They are included initially at fair value which is taken to be their cost, excludingexpenses incidental to the purchase which are written off in the capital column of the income statement at the time ofacquisition. Subsequently the investments are valued at fair value, which is bid market prices for listed investments.
Investments are recognised or derecognised on the trade date.
Changes in the fair value of investments held at fair value through profit or loss and gains or losses on disposal are included inthe income statement within ‘Losses from investments held at fair value through profit or loss’. Gains and losses on sales ofinvestments and exchange differences of a capital nature are accounted for in capital reserves within ‘Gains on sales ofinvestments’. Increases and decreases in the valuation of investments held at the year end are accounted for in capitalreserves within ‘Investment holding gains/(losses)’. Unrealised foreign currency losses on loans are accounted for in anunrealised reserve.
(c) IncomeDividends receivable from equity shares are included in the revenue column of the income statement on an ex-dividend basisexcept where, in the opinion of the Board, the dividend is capital in nature, in which case it is taken to capital.
UK dividends are included net of any tax credits. Overseas dividends are included gross of withholding tax.
Where the Company has elected to receive scrip dividends in the form of additional shares rather than in cash, the amount ofthe cash dividend foregone is recognised as income. Any excess in the value of the shares received over the amount of thecash dividend is recognised in capital return.
Stock lending income and interest receivable are included in the revenue column on an accruals basis.
(d) Expenses All expenses are accounted for on an accruals basis.
Expenses charged to the Company common to both pools are allocated to the pools in the same proportion as their net assetsat the month end immediately preceding the date on which the cost is to be accounted for.
Expenses charged to the Company in relation to a specific pool are charged directly to that pool, with the other pool remainingunaffected. Losses of one pool are not borne by the other.
Shareholders converting some or all of their shares into shares of the other class will bear the costs of the conversion up to amaximum of 2% of the value of the shares being converted. Any costs in excess of this cap will be borne by all theshareholders of the Company.
Notes to the Accountsfor the year ended 31st March 2009

TH
EC
OM
PA
NY
JPMorgan European Investment Trust plc. Annual Report & Accounts 200964
Notes to the Accounts continued
1. Accounting policies continued(d) Expenses continued
Expenses are allocated wholly to the revenue column of the income statement with the following exceptions:
– performance fees payable to the Manager are allocated 100% to capital in both pools.
– the management fees of the Income pool of assets are allocated 40% to the revenue column and 60% to the capitalcolumn in line with the Board’s expected split of revenue and capital return from the Income investment portfolio.
– the management fees of the Growth pool of assets are allocated 30% to the revenue column and 70% to the capitalcolumn in line with the Board’s expected split of revenue and capital return from the Growth investment portfolio.
– expenses incidental to the purchase of an investment are charged to the capital column. These expenses are commonlyreferred to as transaction costs and comprise mainly brokerage commission. In accordance with the SORP, disclosure oftransaction costs is required and can be found in note 11.
(e) Finance costsFinance costs, including any premium payable on settlement or redemption and direct issue costs, are accounted for on anaccruals basis using the effective interest method and in accordance with the provisions of FRS 25 ‘Financial Instruments:Presentation’ and FRS 26 ‘Financial Instruments: Measurement’.
– Finance costs on the Income pool of assets are allocated 40% to the revenue column and 60% to the capital column in linewith the Board’s expected split of revenue and capital return from the Income investment portfolio.
– Finance costs on the Growth pool of assets are allocated 30% to the revenue column and 70% to the capital column in linewith the Board’s expected split of revenue and capital return from the Growth investment portfolio.
(f) Financial instrumentsCash and short term deposits comprises cash and demand deposits which are readily convertible to a known amount of cashand are subject to insignificant risk of changes in value. Other receivables and payables do not carry any interest, are shortterm in nature and are accordingly stated at cost as reduced by appropriate allowances for estimated irrecoverable amounts.
Interest bearing bank loans and overdrafts are initially recorded at the proceeds received net of direct issue costs.
The Company uses interest rate swaps to hedge the cash flow risk arising from interest rate fluctuations. All interest rateswaps were designated as ‘held at fair value through profit or loss’ and have been designated as effective cash flow hedges inaccordance with the provision of FRS 26. Gains or losses arising on the fair value of cash flow hedges during the year areshown in the Reconciliation of Movements in Shareholders’ Funds and are accounted for in the ‘Other reserve’, which wascreated specifically for that purpose.
Derivative instruments are included in current assets or current liabilities in the balance sheet.
(g) Taxation Deferred tax is accounted for in accordance with FRS 19: ‘Deferred Tax’.
Deferred tax is provided on all timing differences that have originated but not reversed by the balance sheet date. Deferred taxliabilities are recognised for all taxable timing differences but deferred tax assets are only recognised to the extent that it isprobable that taxable profits will be available against which those timing differences can be utilised.
Tax is computed for each pool separately. A pool which generates taxable revenues in excess of tax deductible expenses maybenefit from the excess of tax deductible expenses in the other pool. In this instance compensation amounting to half the taxsavings in the taxable pool will be transferred to the non taxable pool.
Tax relief is allocated to expenses charged to capital on the ‘marginal basis’. On this basis, if taxable income is capable of beingentirely offset by revenue expenses, then no tax relief is transferred to capital.
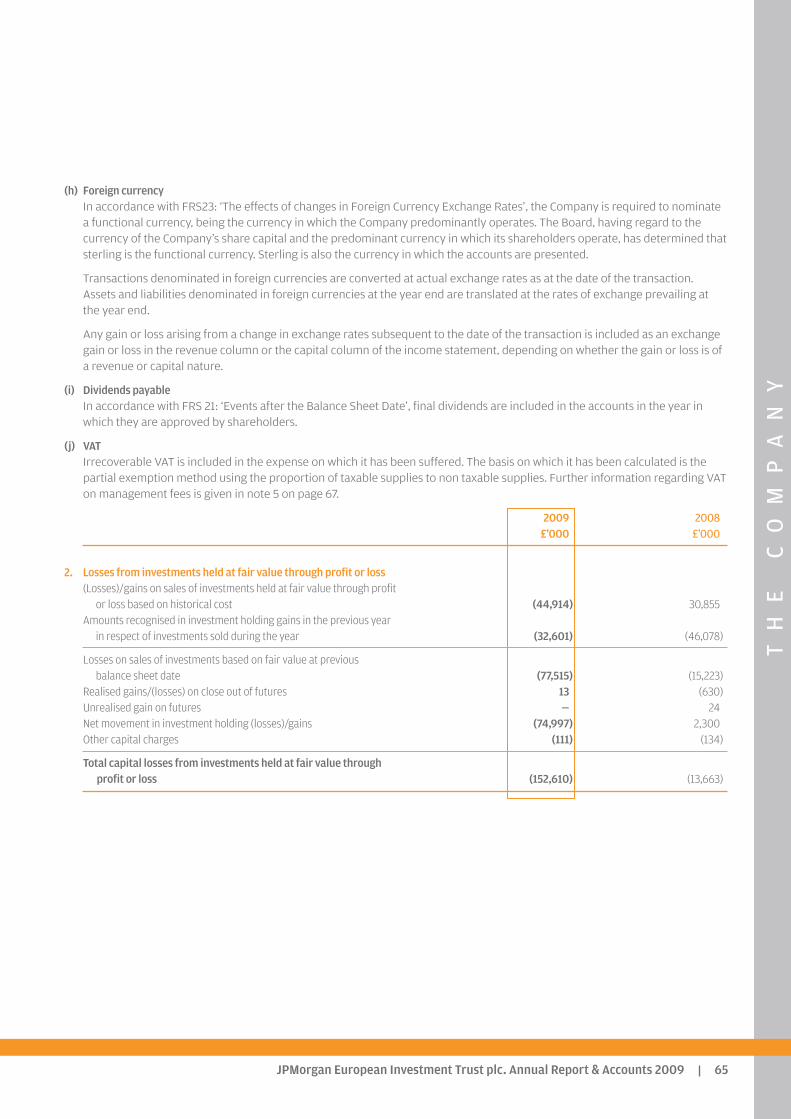
TH
EC
OM
PA
NY
JPMorgan European Investment Trust plc. Annual Report & Accounts 2009 65
(h) Foreign currencyIn accordance with FRS23: ‘The effects of changes in Foreign Currency Exchange Rates’, the Company is required to nominatea functional currency, being the currency in which the Company predominantly operates. The Board, having regard to thecurrency of the Company’s share capital and the predominant currency in which its shareholders operate, has determined thatsterling is the functional currency. Sterling is also the currency in which the accounts are presented.
Transactions denominated in foreign currencies are converted at actual exchange rates as at the date of the transaction.Assets and liabilities denominated in foreign currencies at the year end are translated at the rates of exchange prevailing atthe year end.
Any gain or loss arising from a change in exchange rates subsequent to the date of the transaction is included as an exchangegain or loss in the revenue column or the capital column of the income statement, depending on whether the gain or loss is ofa revenue or capital nature.
(i) Dividends payableIn accordance with FRS 21: ‘Events after the Balance Sheet Date’, final dividends are included in the accounts in the year inwhich they are approved by shareholders.
(j) VATIrrecoverable VAT is included in the expense on which it has been suffered. The basis on which it has been calculated is thepartial exemption method using the proportion of taxable supplies to non taxable supplies. Further information regarding VATon management fees is given in note 5 on page 67.
2009 2008 £’000 £’000
2. Losses from investments held at fair value through profit or loss (Losses)/gains on sales of investments held at fair value through profit
or loss based on historical cost (44,914) 30,855Amounts recognised in investment holding gains in the previous year
in respect of investments sold during the year (32,601) (46,078)
Losses on sales of investments based on fair value at previous balance sheet date (77,515) (15,223)
Realised gains/(losses) on close out of futures 13 (630)Unrealised gain on futures — 24Net movement in investment holding (losses)/gains (74,997) 2,300Other capital charges (111) (134)
Total capital losses from investments held at fair value throughprofit or loss (152,610) (13,663)
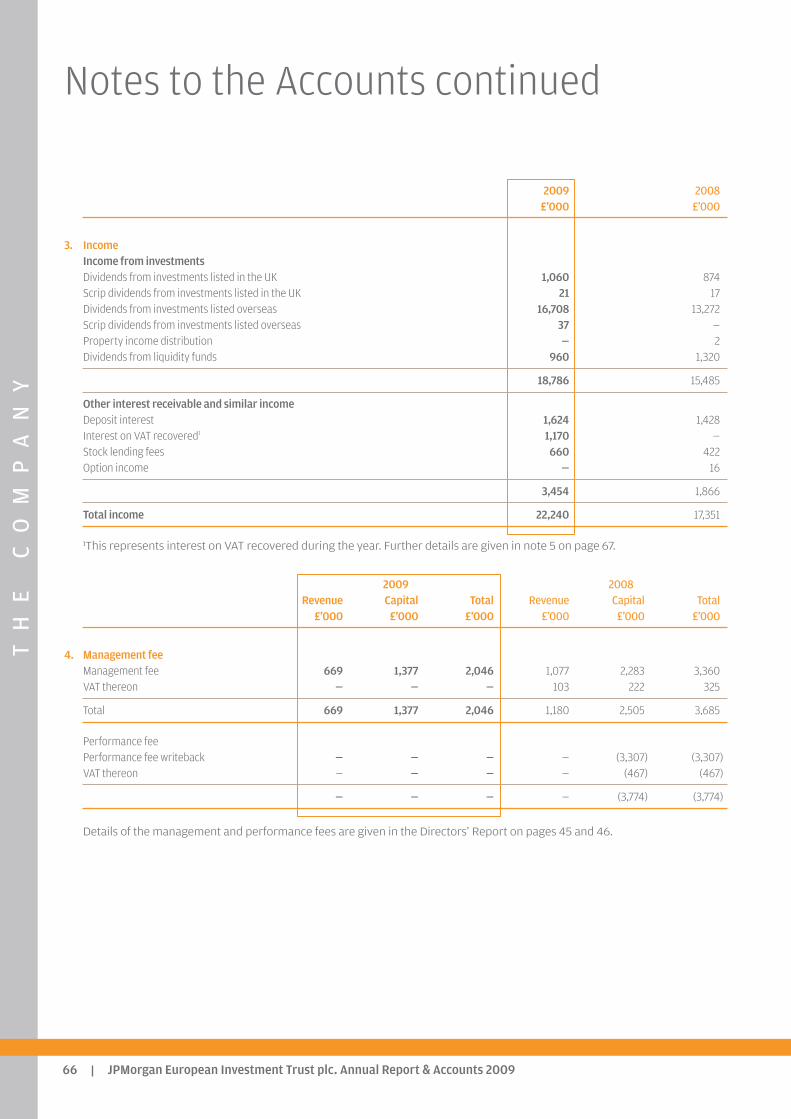
TH
EC
OM
PA
NY
JPMorgan European Investment Trust plc. Annual Report & Accounts 200966
Notes to the Accounts continued
2009 2008 £’000 £’000
3. Income Income from investmentsDividends from investments listed in the UK 1,060 874Scrip dividends from investments listed in the UK 21 17Dividends from investments listed overseas 16,708 13,272Scrip dividends from investments listed overseas 37 —Property income distribution — 2Dividends from liquidity funds 960 1,320
18,786 15,485
Other interest receivable and similar incomeDeposit interest 1,624 1,428Interest on VAT recovered1 1,170 —Stock lending fees 660 422Option income — 16
3,454 1,866
Total income 22,240 17,351
1This represents interest on VAT recovered during the year. Further details are given in note 5 on page 67.
2009 2008 Revenue Capital Total Revenue Capital Total
£’000 £’000 £’000 £’000 £’000 £’000
4. Management fee Management fee 669 1,377 2,046 1,077 2,283 3,360VAT thereon — — — 103 222 325
Total 669 1,377 2,046 1,180 2,505 3,685
Performance feePerformance fee writeback — — — — (3,307) (3,307)VAT thereon — — — — (467) (467)
— — — — (3,774) (3,774)
Details of the management and performance fees are given in the Directors’ Report on pages 45 and 46.
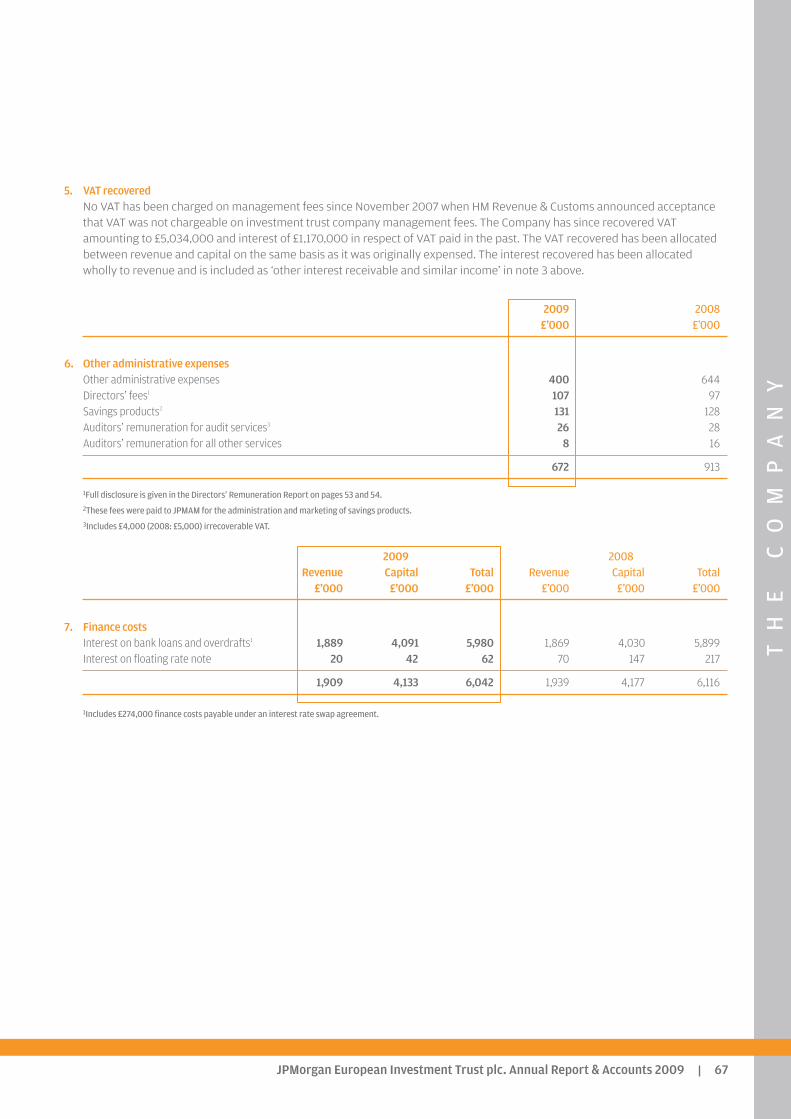
TH
EC
OM
PA
NY
JPMorgan European Investment Trust plc. Annual Report & Accounts 2009 67
5. VAT recoveredNo VAT has been charged on management fees since November 2007 when HM Revenue & Customs announced acceptancethat VAT was not chargeable on investment trust company management fees. The Company has since recovered VATamounting to £5,034,000 and interest of £1,170,000 in respect of VAT paid in the past. The VAT recovered has been allocatedbetween revenue and capital on the same basis as it was originally expensed. The interest recovered has been allocatedwholly to revenue and is included as ‘other interest receivable and similar income’ in note 3 above.
2009 2008£’000 £’000
6. Other administrative expensesOther administrative expenses 400 644Directors’ fees1 107 97Savings products2 131 128Auditors’ remuneration for audit services3 26 28Auditors’ remuneration for all other services 8 16
672 913
1Full disclosure is given in the Directors’ Remuneration Report on pages 53 and 54.2These fees were paid to JPMAM for the administration and marketing of savings products.3Includes £4,000 (2008: £5,000) irrecoverable VAT.
2009 2008 Revenue Capital Total Revenue Capital Total
£’000 £’000 £’000 £’000 £’000 £’000
7. Finance costs Interest on bank loans and overdrafts1 1,889 4,091 5,980 1,869 4,030 5,899Interest on floating rate note 20 42 62 70 147 217
1,909 4,133 6,042 1,939 4,177 6,116
1Includes £274,000 finance costs payable under an interest rate swap agreement.
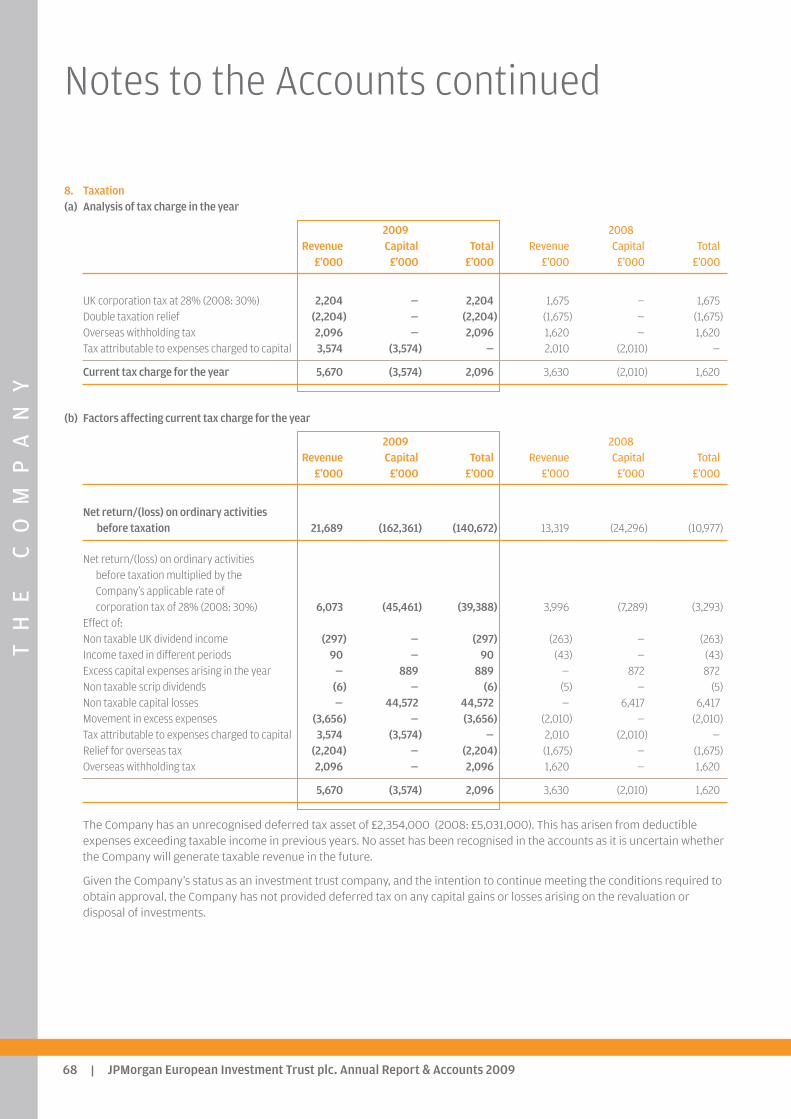
TH
EC
OM
PA
NY
JPMorgan European Investment Trust plc. Annual Report & Accounts 200968
Notes to the Accounts continued
8. Taxation(a) Analysis of tax charge in the year
2009 2008 Revenue Capital Total Revenue Capital Total
£’000 £’000 £’000 £’000 £’000 £’000
UK corporation tax at 28% (2008: 30%) 2,204 — 2,204 1,675 — 1,675Double taxation relief (2,204) — (2,204) (1,675) — (1,675)Overseas withholding tax 2,096 — 2,096 1,620 — 1,620Tax attributable to expenses charged to capital 3,574 (3,574) — 2,010 (2,010) —
Current tax charge for the year 5,670 (3,574) 2,096 3,630 (2,010) 1,620
(b) Factors affecting current tax charge for the year
2009 2008 Revenue Capital Total Revenue Capital Total
£’000 £’000 £’000 £’000 £’000 £’000
Net return/(loss) on ordinary activities before taxation 21,689 (162,361) (140,672) 13,319 (24,296) (10,977)
Net return/(loss) on ordinary activities before taxation multiplied by the Company’s applicable rate of corporation tax of 28% (2008: 30%) 6,073 (45,461) (39,388) 3,996 (7,289) (3,293)
Effect of:Non taxable UK dividend income (297) — (297) (263) — (263)Income taxed in different periods 90 — 90 (43) — (43)Excess capital expenses arising in the year — 889 889 — 872 872Non taxable scrip dividends (6) — (6) (5) — (5)Non taxable capital losses — 44,572 44,572 — 6,417 6,417Movement in excess expenses (3,656) — (3,656) (2,010) — (2,010)Tax attributable to expenses charged to capital 3,574 (3,574) — 2,010 (2,010) —Relief for overseas tax (2,204) — (2,204) (1,675) — (1,675)Overseas withholding tax 2,096 — 2,096 1,620 — 1,620
5,670 (3,574) 2,096 3,630 (2,010) 1,620
The Company has an unrecognised deferred tax asset of £2,354,000 (2008: £5,031,000). This has arisen from deductibleexpenses exceeding taxable income in previous years. No asset has been recognised in the accounts as it is uncertain whetherthe Company will generate taxable revenue in the future.
Given the Company’s status as an investment trust company, and the intention to continue meeting the conditions required toobtain approval, the Company has not provided deferred tax on any capital gains or losses arising on the revaluation ordisposal of investments.
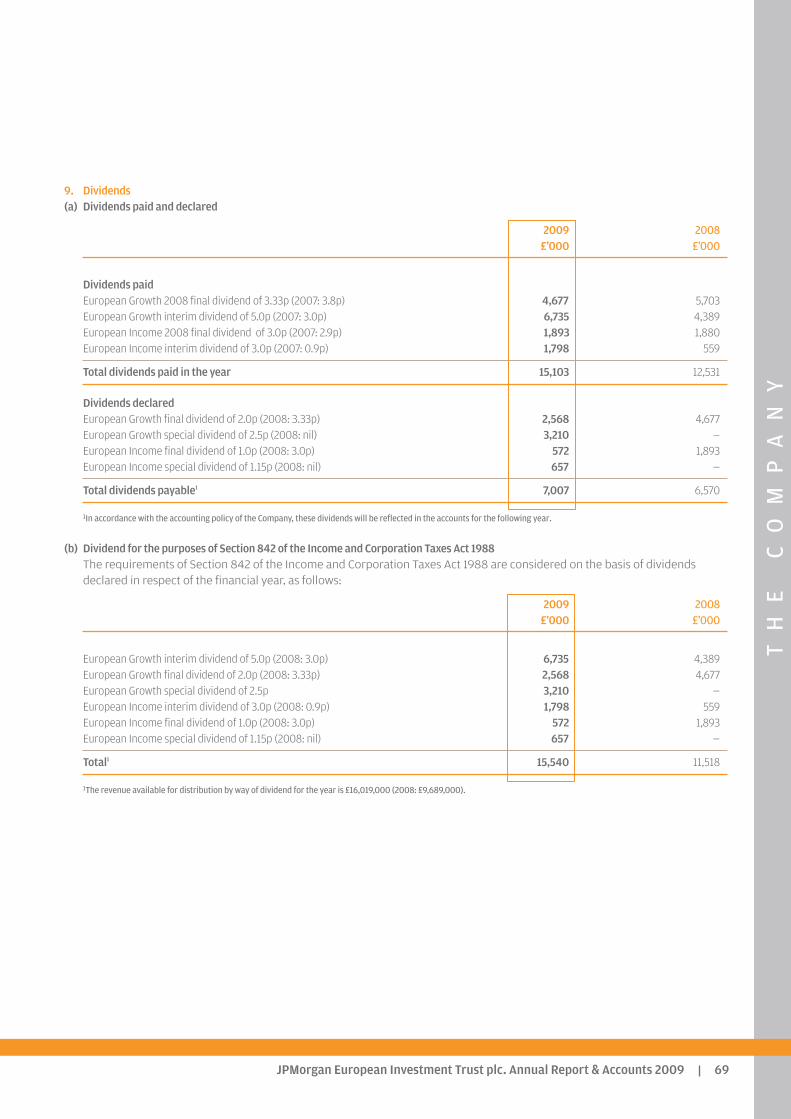
TH
EC
OM
PA
NY
JPMorgan European Investment Trust plc. Annual Report & Accounts 2009 69
9. Dividends(a) Dividends paid and declared
2009 2008£’000 £’000
Dividends paidEuropean Growth 2008 final dividend of 3.33p (2007: 3.8p) 4,677 5,703European Growth interim dividend of 5.0p (2007: 3.0p) 6,735 4,389European Income 2008 final dividend of 3.0p (2007: 2.9p) 1,893 1,880European Income interim dividend of 3.0p (2007: 0.9p) 1,798 559
Total dividends paid in the year 15,103 12,531
Dividends declaredEuropean Growth final dividend of 2.0p (2008: 3.33p) 2,568 4,677European Growth special dividend of 2.5p (2008: nil) 3,210 —European Income final dividend of 1.0p (2008: 3.0p) 572 1,893European Income special dividend of 1.15p (2008: nil) 657 —
Total dividends payable1 7,007 6,570
1In accordance with the accounting policy of the Company, these dividends will be reflected in the accounts for the following year.
(b) Dividend for the purposes of Section 842 of the Income and Corporation Taxes Act 1988The requirements of Section 842 of the Income and Corporation Taxes Act 1988 are considered on the basis of dividendsdeclared in respect of the financial year, as follows:
2009 2008£’000 £’000
European Growth interim dividend of 5.0p (2008: 3.0p) 6,735 4,389European Growth final dividend of 2.0p (2008: 3.33p) 2,568 4,677European Growth special dividend of 2.5p 3,210 —European Income interim dividend of 3.0p (2008: 0.9p) 1,798 559European Income final dividend of 1.0p (2008: 3.0p) 572 1,893European Income special dividend of 1.15p (2008: nil) 657 —
Total1 15,540 11,518
1The revenue available for distribution by way of dividend for the year is £16,019,000 (2008: £9,689,000).
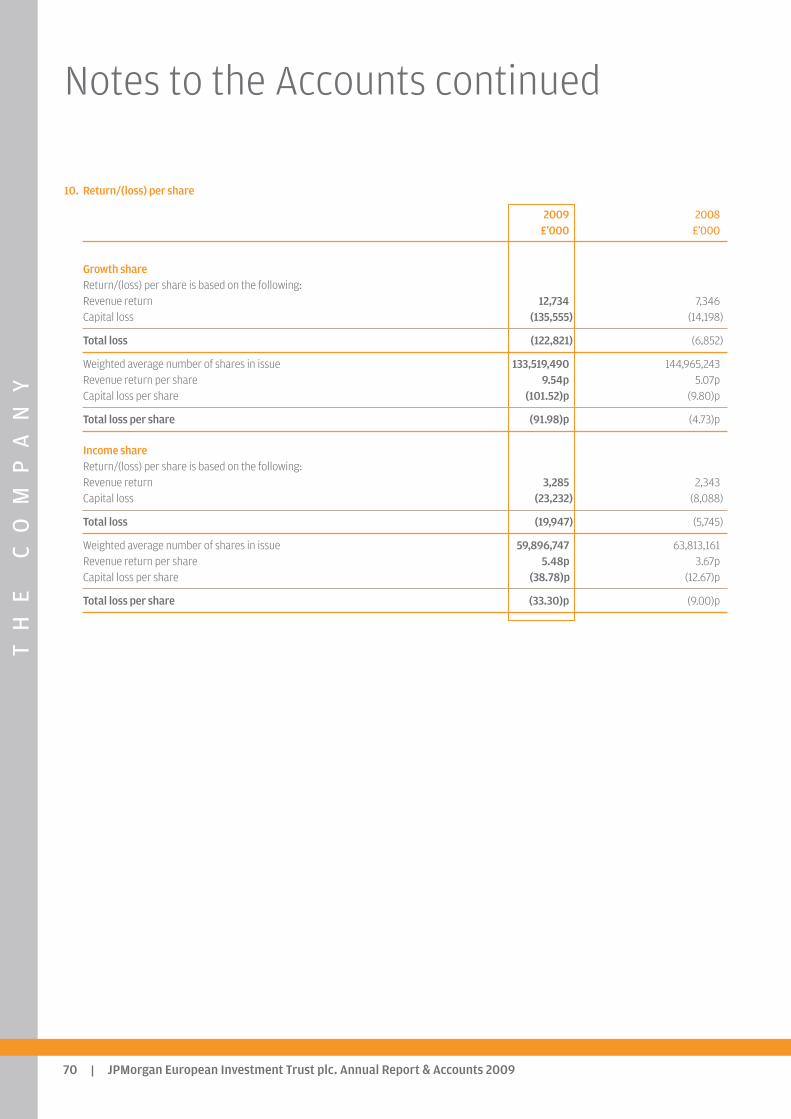
TH
EC
OM
PA
NY
JPMorgan European Investment Trust plc. Annual Report & Accounts 200970
Notes to the Accounts continued
10. Return/(loss) per share
2009 2008 £’000 £’000
Growth shareReturn/(loss) per share is based on the following:Revenue return 12,734 7,346Capital loss (135,555) (14,198)
Total loss (122,821) (6,852)
Weighted average number of shares in issue 133,519,490 144,965,243Revenue return per share 9.54p 5.07pCapital loss per share (101.52)p (9.80)p
Total loss per share (91.98)p (4.73)p
Income shareReturn/(loss) per share is based on the following:Revenue return 3,285 2,343Capital loss (23,232) (8,088)
Total loss (19,947) (5,745)
Weighted average number of shares in issue 59,896,747 63,813,161Revenue return per share 5.48p 3.67pCapital loss per share (38.78)p (12.67)p
Total loss per share (33.30)p (9.00)p
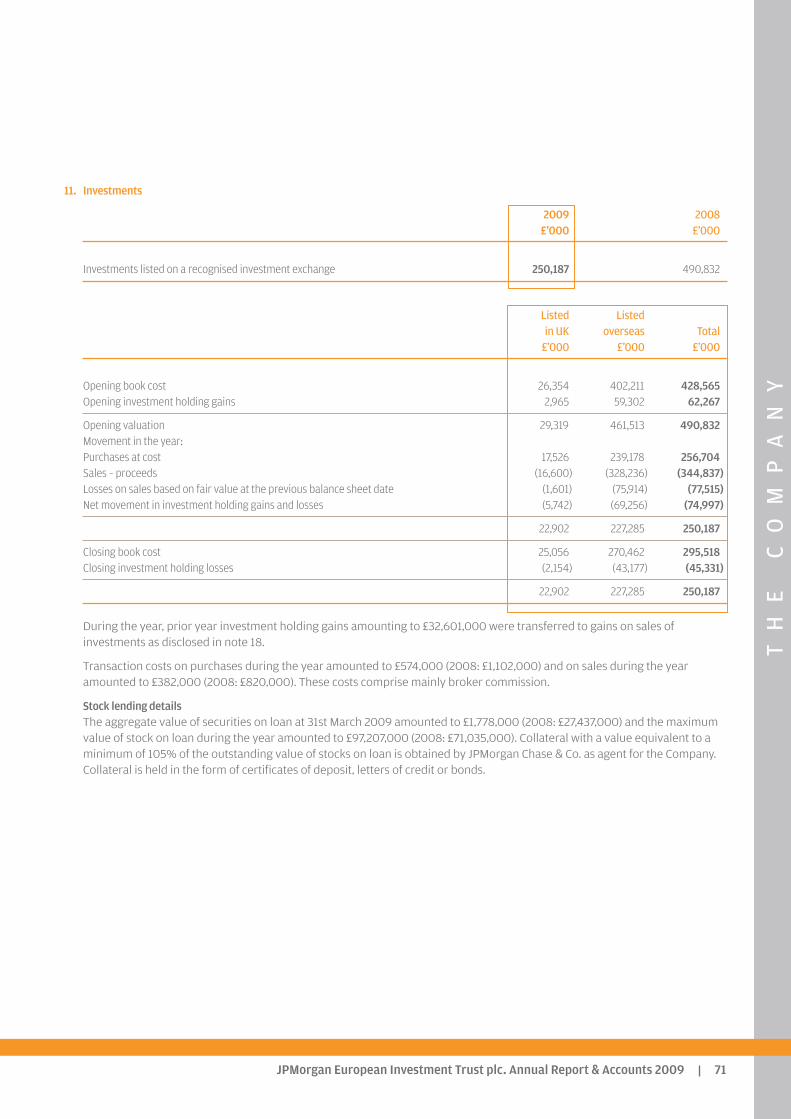
TH
EC
OM
PA
NY
JPMorgan European Investment Trust plc. Annual Report & Accounts 2009 71
11. Investments
2009 2008 £’000 £’000
Investments listed on a recognised investment exchange 250,187 490,832
Listed Listedin UK overseas Total
£’000 £’000 £’000
Opening book cost 26,354 402,211 428,565Opening investment holding gains 2,965 59,302 62,267
Opening valuation 29,319 461,513 490,832Movement in the year:Purchases at cost 17,526 239,178 256,704Sales – proceeds (16,600) (328,236) (344,837)Losses on sales based on fair value at the previous balance sheet date (1,601) (75,914) (77,515)Net movement in investment holding gains and losses (5,742) (69,256) (74,997)
22,902 227,285 250,187
Closing book cost 25,056 270,462 295,518Closing investment holding losses (2,154) (43,177) (45,331)
22,902 227,285 250,187
During the year, prior year investment holding gains amounting to £32,601,000 were transferred to gains on sales ofinvestments as disclosed in note 18.
Transaction costs on purchases during the year amounted to £574,000 (2008: £1,102,000) and on sales during the yearamounted to £382,000 (2008: £820,000). These costs comprise mainly broker commission.
Stock lending detailsThe aggregate value of securities on loan at 31st March 2009 amounted to £1,778,000 (2008: £27,437,000) and the maximumvalue of stock on loan during the year amounted to £97,207,000 (2008: £71,035,000). Collateral with a value equivalent to aminimum of 105% of the outstanding value of stocks on loan is obtained by JPMorgan Chase & Co. as agent for the Company.Collateral is held in the form of certificates of deposit, letters of credit or bonds.
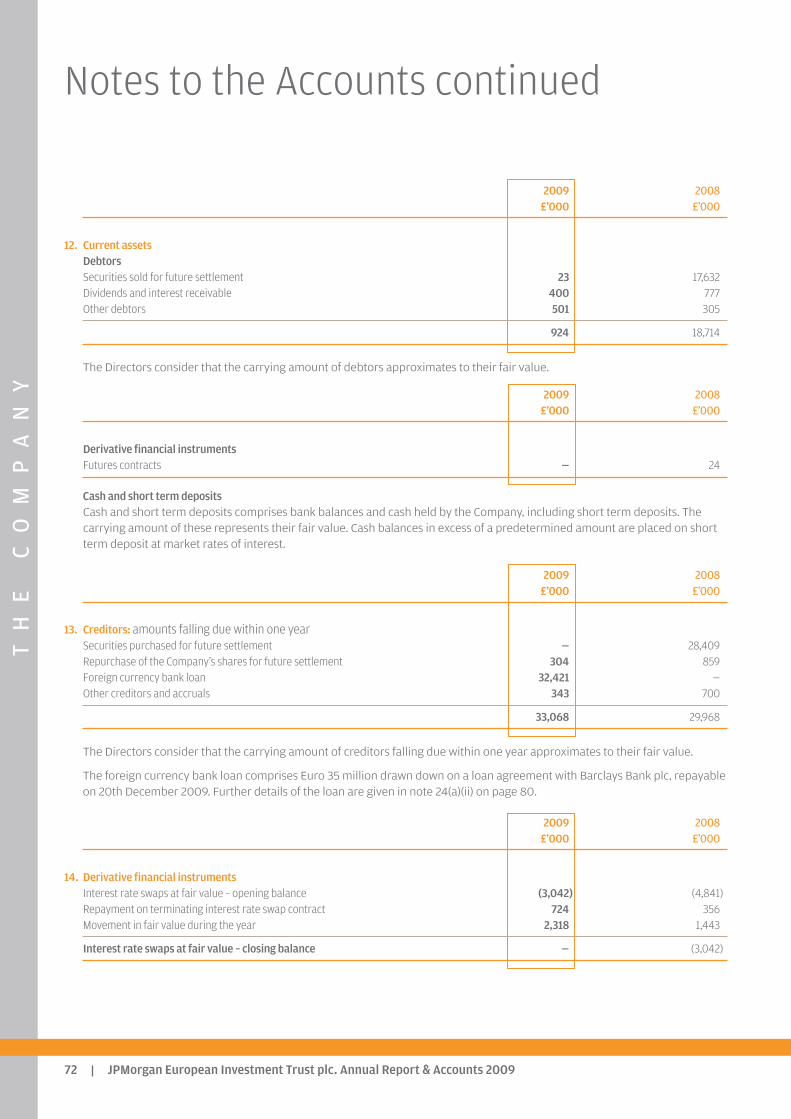
TH
EC
OM
PA
NY
JPMorgan European Investment Trust plc. Annual Report & Accounts 200972
Notes to the Accounts continued
2009 2008 £’000 £’000
12. Current assetsDebtors Securities sold for future settlement 23 17,632Dividends and interest receivable 400 777Other debtors 501 305
924 18,714
The Directors consider that the carrying amount of debtors approximates to their fair value.
2009 2008 £’000 £’000
Derivative financial instruments Futures contracts — 24
Cash and short term depositsCash and short term deposits comprises bank balances and cash held by the Company, including short term deposits. Thecarrying amount of these represents their fair value. Cash balances in excess of a predetermined amount are placed on shortterm deposit at market rates of interest.
2009 2008 £’000 £’000
13. Creditors: amounts falling due within one yearSecurities purchased for future settlement — 28,409Repurchase of the Company’s shares for future settlement 304 859Foreign currency bank loan 32,421 —Other creditors and accruals 343 700
33,068 29,968
The Directors consider that the carrying amount of creditors falling due within one year approximates to their fair value.
The foreign currency bank loan comprises Euro 35 million drawn down on a loan agreement with Barclays Bank plc, repayableon 20th December 2009. Further details of the loan are given in note 24(a)(ii) on page 80.
2009 2008 £’000 £’000
14. Derivative financial instruments Interest rate swaps at fair value – opening balance (3,042) (4,841)Repayment on terminating interest rate swap contract 724 356Movement in fair value during the year 2,318 1,443
Interest rate swaps at fair value – closing balance — (3,042)
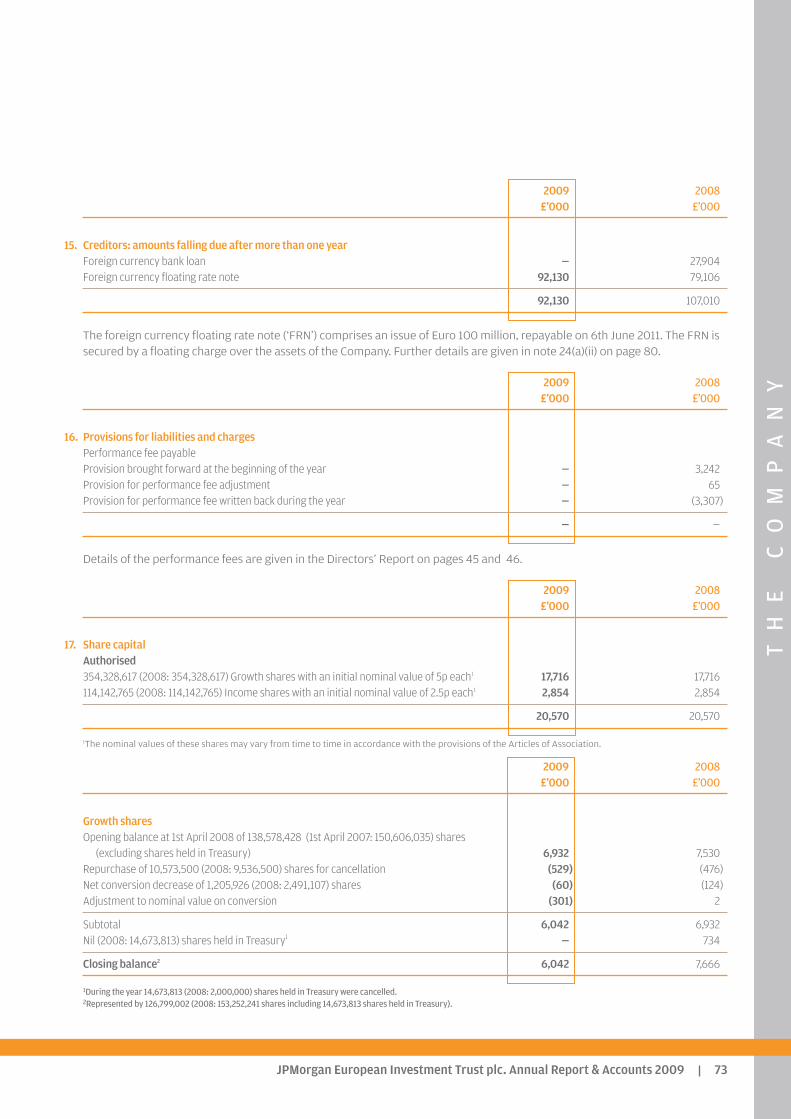
TH
EC
OM
PA
NY
JPMorgan European Investment Trust plc. Annual Report & Accounts 2009 73
2009 2008 £’000 £’000
15. Creditors: amounts falling due after more than one year Foreign currency bank loan — 27,904Foreign currency floating rate note 92,130 79,106
92,130 107,010
The foreign currency floating rate note (‘FRN’) comprises an issue of Euro 100 million, repayable on 6th June 2011. The FRN issecured by a floating charge over the assets of the Company. Further details are given in note 24(a)(ii) on page 80.
2009 2008 £’000 £’000
16. Provisions for liabilities and charges Performance fee payableProvision brought forward at the beginning of the year — 3,242Provision for performance fee adjustment — 65Provision for performance fee written back during the year — (3,307)
— —
Details of the performance fees are given in the Directors’ Report on pages 45 and 46.
2009 2008 £’000 £’000
17. Share capital Authorised354,328,617 (2008: 354,328,617) Growth shares with an initial nominal value of 5p each1 17,716 17,716114,142,765 (2008: 114,142,765) Income shares with an initial nominal value of 2.5p each1 2,854 2,854
20,570 20,570
1The nominal values of these shares may vary from time to time in accordance with the provisions of the Articles of Association.
2009 2008 £’000 £’000
Growth sharesOpening balance at 1st April 2008 of 138,578,428 (1st April 2007: 150,606,035) shares
(excluding shares held in Treasury) 6,932 7,530Repurchase of 10,573,500 (2008: 9,536,500) shares for cancellation (529) (476)Net conversion decrease of 1,205,926 (2008: 2,491,107) shares (60) (124)Adjustment to nominal value on conversion (301) 2
Subtotal 6,042 6,932Nil (2008: 14,673,813) shares held in Treasury1 — 734
Closing balance2 6,042 7,666
1During the year 14,673,813 (2008: 2,000,000) shares held in Treasury were cancelled.2Represented by 126,799,002 (2008: 153,252,241 shares including 14,673,813 shares held in Treasury).
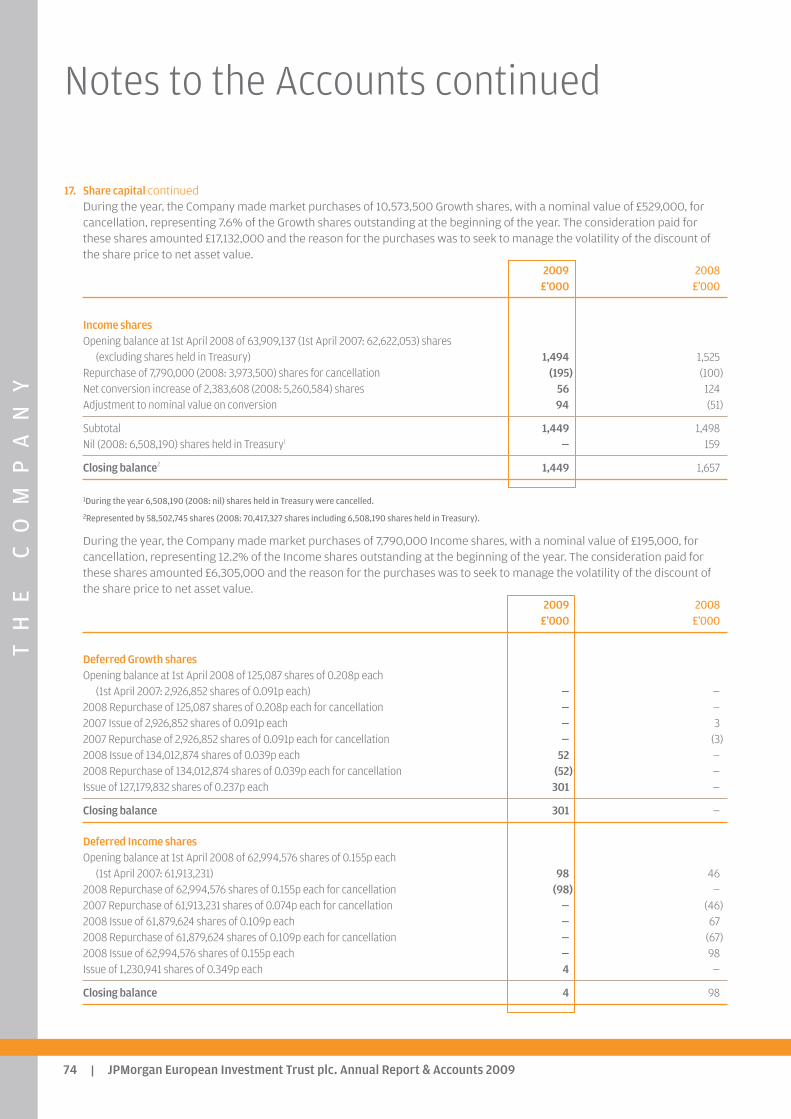
TH
EC
OM
PA
NY
JPMorgan European Investment Trust plc. Annual Report & Accounts 200974
Notes to the Accounts continued
17. Share capital continuedDuring the year, the Company made market purchases of 10,573,500 Growth shares, with a nominal value of £529,000, forcancellation, representing 7.6% of the Growth shares outstanding at the beginning of the year. The consideration paid forthese shares amounted £17,132,000 and the reason for the purchases was to seek to manage the volatility of the discount ofthe share price to net asset value.
2009 2008 £’000 £’000
Income sharesOpening balance at 1st April 2008 of 63,909,137 (1st April 2007: 62,622,053) shares
(excluding shares held in Treasury) 1,494 1,525Repurchase of 7,790,000 (2008: 3,973,500) shares for cancellation (195) (100)Net conversion increase of 2,383,608 (2008: 5,260,584) shares 56 124Adjustment to nominal value on conversion 94 (51)
Subtotal 1,449 1,498Nil (2008: 6,508,190) shares held in Treasury1 — 159
Closing balance2 1,449 1,657
1During the year 6,508,190 (2008: nil) shares held in Treasury were cancelled.
2Represented by 58,502,745 shares (2008: 70,417,327 shares including 6,508,190 shares held in Treasury).
During the year, the Company made market purchases of 7,790,000 Income shares, with a nominal value of £195,000, forcancellation, representing 12.2% of the Income shares outstanding at the beginning of the year. The consideration paid forthese shares amounted £6,305,000 and the reason for the purchases was to seek to manage the volatility of the discount ofthe share price to net asset value.
2009 2008 £’000 £’000
Deferred Growth sharesOpening balance at 1st April 2008 of 125,087 shares of 0.208p each
(1st April 2007: 2,926,852 shares of 0.091p each) — —2008 Repurchase of 125,087 shares of 0.208p each for cancellation — —2007 Issue of 2,926,852 shares of 0.091p each — 32007 Repurchase of 2,926,852 shares of 0.091p each for cancellation — (3)2008 Issue of 134,012,874 shares of 0.039p each 52 —2008 Repurchase of 134,012,874 shares of 0.039p each for cancellation (52) —Issue of 127,179,832 shares of 0.237p each 301 —
Closing balance 301 —
Deferred Income sharesOpening balance at 1st April 2008 of 62,994,576 shares of 0.155p each
(1st April 2007: 61,913,231) 98 462008 Repurchase of 62,994,576 shares of 0.155p each for cancellation (98) —2007 Repurchase of 61,913,231 shares of 0.074p each for cancellation — (46)2008 Issue of 61,879,624 shares of 0.109p each — 672008 Repurchase of 61,879,624 shares of 0.109p each for cancellation — (67)2008 Issue of 62,994,576 shares of 0.155p each — 98Issue of 1,230,941 shares of 0.349p each 4 —
Closing balance 4 98
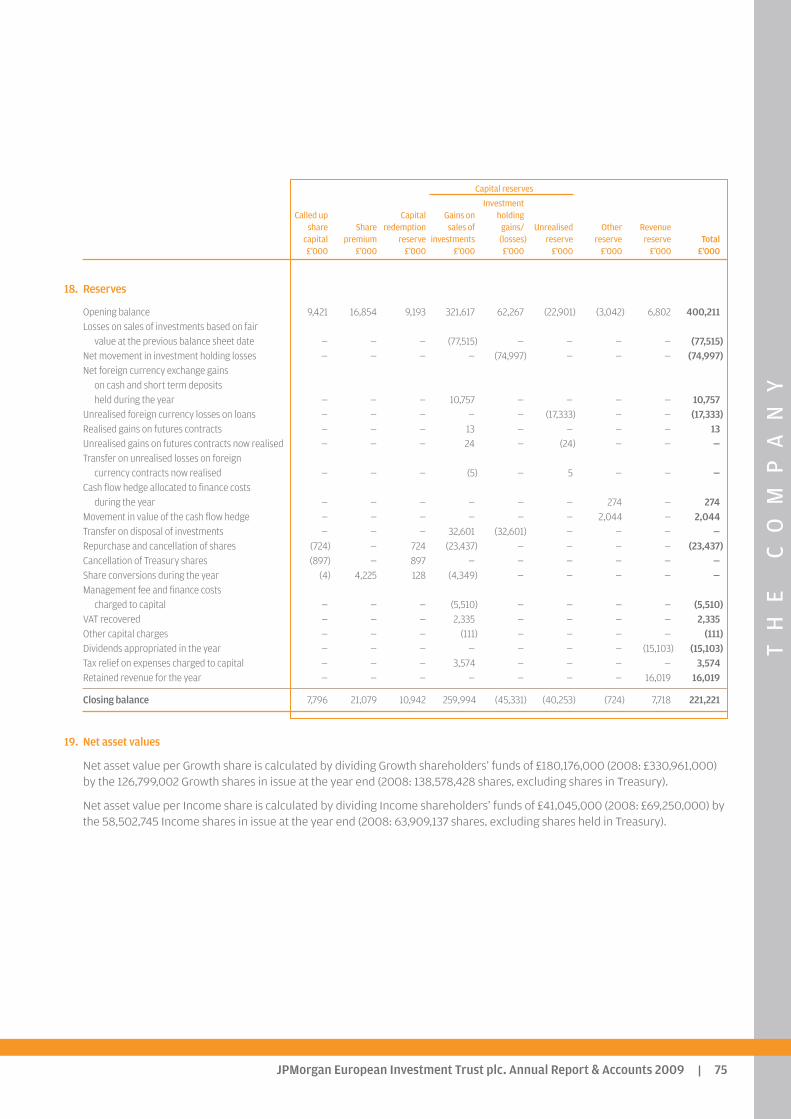
TH
EC
OM
PA
NY
JPMorgan European Investment Trust plc. Annual Report & Accounts 2009 75
Capital reserves
InvestmentCalled up Capital Gains on holding
share Share redemption sales of gains/ Unrealised Other Revenuecapital premium reserve investments (losses) reserve reserve reserve Total£’000 £’000 £’000 £’000 £’000 £’000 £’000 £’000 £’000
18. Reserves
Opening balance 9,421 16,854 9,193 321,617 62,267 (22,901) (3,042) 6,802 400,211Losses on sales of investments based on fair
value at the previous balance sheet date — — — (77,515) — — — — (77,515)Net movement in investment holding losses — — — — (74,997) — — — (74,997)Net foreign currency exchange gains
on cash and short term depositsheld during the year — — — 10,757 — — — — 10,757
Unrealised foreign currency losses on loans — — — — — (17,333) — — (17,333)Realised gains on futures contracts — — — 13 — — — — 13Unrealised gains on futures contracts now realised — — — 24 — (24) — — —Transfer on unrealised losses on foreign
currency contracts now realised — — — (5) — 5 — — —Cash flow hedge allocated to finance costs
during the year — — — — — — 274 — 274Movement in value of the cash flow hedge — — — — — — 2,044 — 2,044Transfer on disposal of investments — — — 32,601 (32,601) — — — —Repurchase and cancellation of shares (724) — 724 (23,437) — — — — (23,437)Cancellation of Treasury shares (897) — 897 — — — — — —Share conversions during the year (4) 4,225 128 (4,349) — — — — —Management fee and finance costs
charged to capital — — — (5,510) — — — — (5,510)VAT recovered — — — 2,335 — — — — 2,335Other capital charges — — — (111) — — — — (111)Dividends appropriated in the year — — — — — — — (15,103) (15,103)Tax relief on expenses charged to capital — — — 3,574 — — — — 3,574Retained revenue for the year — — — — — — — 16,019 16,019
Closing balance 7,796 21,079 10,942 259,994 (45,331) (40,253) (724) 7,718 221,221
19. Net asset values
Net asset value per Growth share is calculated by dividing Growth shareholders’ funds of £180,176,000 (2008: £330,961,000)by the 126,799,002 Growth shares in issue at the year end (2008: 138,578,428 shares, excluding shares in Treasury).
Net asset value per Income share is calculated by dividing Income shareholders’ funds of £41,045,000 (2008: £69,250,000) bythe 58,502,745 Income shares in issue at the year end (2008: 63,909,137 shares, excluding shares held in Treasury).
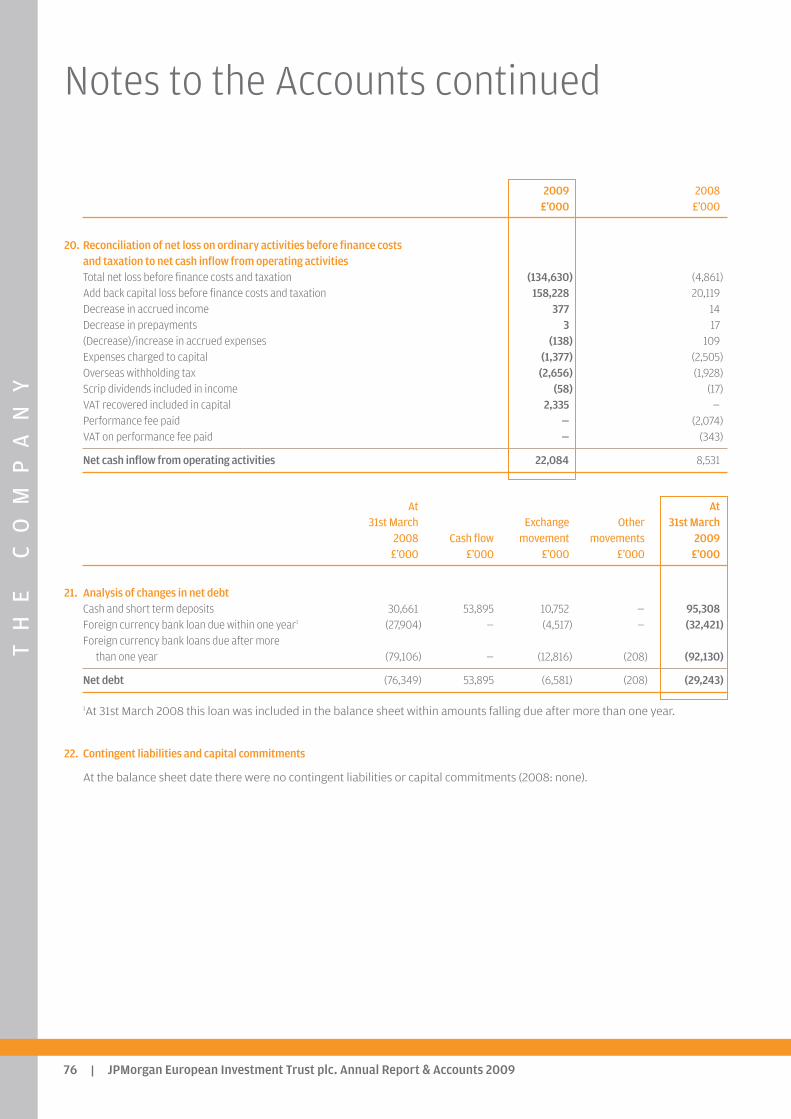
TH
EC
OM
PA
NY
JPMorgan European Investment Trust plc. Annual Report & Accounts 200976
Notes to the Accounts continued
2009 2008 £’000 £’000
20. Reconciliation of net loss on ordinary activities before finance costs and taxation to net cash inflow from operating activities Total net loss before finance costs and taxation (134,630) (4,861)Add back capital loss before finance costs and taxation 158,228 20,119Decrease in accrued income 377 14Decrease in prepayments 3 17(Decrease)/increase in accrued expenses (138) 109Expenses charged to capital (1,377) (2,505)Overseas withholding tax (2,656) (1,928)Scrip dividends included in income (58) (17)VAT recovered included in capital 2,335 —Performance fee paid — (2,074)VAT on performance fee paid — (343)
Net cash inflow from operating activities 22,084 8,531
At At31st March Exchange Other 31st March
2008 Cash flow movement movements 2009£’000 £’000 £’000 £’000 £’000
21. Analysis of changes in net debtCash and short term deposits 30,661 53,895 10,752 — 95,308Foreign currency bank loan due within one year1 (27,904) — (4,517) — (32,421)Foreign currency bank loans due after more
than one year (79,106) — (12,816) (208) (92,130)
Net debt (76,349) 53,895 (6,581) (208) (29,243)
1At 31st March 2008 this loan was included in the balance sheet within amounts falling due after more than one year.
22. Contingent liabilities and capital commitments
At the balance sheet date there were no contingent liabilities or capital commitments (2008: none).

TH
EC
OM
PA
NY
JPMorgan European Investment Trust plc. Annual Report & Accounts 2009 77
23. Transactions with the Manager
Details of the management contract are set out in the Directors’ Report on page 45. The total management fee payable toJPMorgan Asset Management (UK) Limited (‘JPMAM’) for the year was £2,046,000 (2008: £3,360,000 excluding VAT), of which£nil (2008: £nil) was outstanding at the year end .
Details of the performance fee agreements are set out in the Directors’ Report on pages 45 and 46. There is no (2008: £nil)performance fee payable to JPMorgan Asset Management (UK) Limited (‘JPMAM’) for the year and £nil (2008: £nil) wasoutstanding at the year end.
During the year £114,000 (2008: £111,000) excluding VAT was payable to JPMAM for the administration and marketing ofsavings products, of which £nil (2008: £10,000) was outstanding at the year end.
Included in other administrative expenses in note 6 on page 67 are safe custody fees amounting to £75,000 (2008:£164,000) payable to third party custodians by JPMorgan Chase & Co on behalf of the Company of which £19,000 (2008:£75,000) was outstanding at the year end.
JPMAM may carry out some of its dealing transactions through group subsidiaries. These transactions are carried out at arm’slength. The commission payable in the year was £27,000 (2008: £40,000) of which £nil (2008: £nil) was outstanding at theyear end.
Handling charges on dealing transactions amounting to £115,000 (2008: £133,000) were payable to JPMorgan Chase & Co.during the year of which £21,000 (2008: £nil) was outstanding at the year end.
The Company holds investments in funds managed by JPMAM. At 31st March 2009 these were valued at £24.8 million(2008: £51.1 million) and represented 9.9% (2008: 10.4%) of the Company’s investment portfolio. During the year the Companymade purchases of such investments with a total value of £29.2 million (2008: £36.2 million) and sales with a total value of£51.2 million (2008: £43.6 million). Income of £1.0 million (2008: £1.3 million) was received from these investments during theyear of which £4,000 (2008: £108,000) was outstanding at the year end.
The Company received £660,000 (2008: £422,000) from stock lending transactions during the year. JPMAM receivedcommissions amounting to £140,000 (2008: £106,000) in respect of these transactions of which £1,000 (2008: £7,000) wasoutstanding at the year end.
At the year end, a bank balance of £95.3 million (2008: £0.7 million) was held with JPMorgan Chase & Co. A net amount ofinterest of £1,092,000 (2008: £76,000) was received by the Company during the year from JPMorgan Chase & Co.
TH
EC
OM
PA
NY
JPMorgan European Investment Trust plc. Annual Report & Accounts 200978
Notes to the Accounts continued
24. Financial instruments’ exposure to risk and risk management policies
As an investment trust the Company invests in equities and other securities for the long term so as to secure its investmentobjective stated on the Features page for each share class. In pursuing this objective, the Company is exposed to a variety ofrisks that could result in a reduction in the Company’s net assets or a reduction in the profits available for dividends. Theserisks include market risk (comprising currency risk, interest rate risk and market price risk), liquidity risk and credit risk. TheDirectors’ policy for managing these risks is set out below. The Company Secretary, in close cooperation with the Board andthe Manager, coordinates the Company’s risk management.
The objectives, policies and processes for managing the risks and the methods used to measure the risks that are set outbelow, have not changed from those applying in the comparative year.
The Company’s financial instruments may comprise the following:
– investments in Continental European equity shares, collective investment funds with Continental European exposure andliquidity funds which are all held in accordance with the Company’s investment objective;
– short term debtors, creditors and cash arising directly from its operations;
– short term forward currency contracts for the purpose of managing exposure to fluctuations in the value of short termliabilities;
– a bank loan and an issue of floating rate notes, both denominated in Euros, the main purpose of which is to finance theCompany’s operations; and
– interest rate swaps, the purpose of which is to hedge the variability in cash flows arising from interest rate fluctuations onthe bank loan and floating rate notes.
(a) Market risk The fair value or future cash flows of a financial instrument held by the Company may fluctuate because of changes in marketprices. This market risk comprises three elements - currency risk, interest rate risk and other price risk. Information to enablean evaluation of the nature and extent of these three elements of market price risk is given in parts (i) to (iii) of this note,together with sensitivity analyses where appropriate. The Board reviews and agrees policies for managing these risks, whichpolicies have remained unchanged from those applying in the comparative year except for the cancellation of the interest rateswap contract during the year which was designated as a cash flow hedge. The Manager assesses the exposure to market riskwhen making each investment decision and monitors the overall level of market risk on the whole of the investment portfolioon an ongoing basis.
(i) Currency risk The majority of the Company’s assets, liabilities and income are denominated in currencies other than sterling (theCompany’s functional currency and the currency in which it reports). As a result, movements in exchange rates may affectthe sterling value of those items.
Management of currency risk The Manager monitors the Company’s exposure to foreign currencies on a daily basis and reports to the Board, whichmeets on at least four occasions each year. The Manager measures the risk to the Company of the foreign currencyexposure by considering the effect on the Company’s net asset value and income of a movement in the rates of exchangeto which the Company’s assets, liabilities, income and expenses are exposed. Foreign currency borrowing is used to limitthe Company’s exposure to anticipated changes in exchange rates which might otherwise adversely affect the value of theportfolio of investments. This borrowing is limited to currencies and amounts commensurate with the asset exposure tothose currencies. Income denominated in foreign currencies is converted to sterling on receipt. The Company may useshort term forward currency contracts to manage working capital requirements.
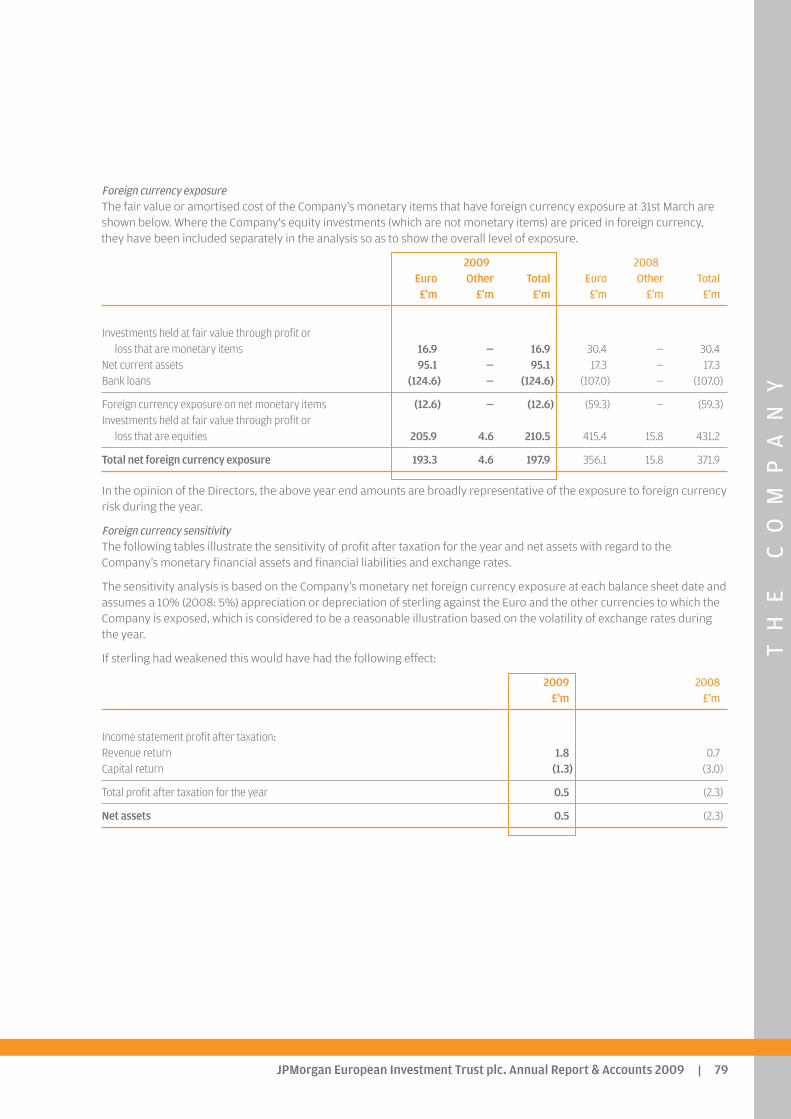
TH
EC
OM
PA
NY
JPMorgan European Investment Trust plc. Annual Report & Accounts 2009 79
Foreign currency exposure The fair value or amortised cost of the Company’s monetary items that have foreign currency exposure at 31st March areshown below. Where the Company's equity investments (which are not monetary items) are priced in foreign currency,they have been included separately in the analysis so as to show the overall level of exposure.
2009 2008Euro Other Total Euro Other Total£’m £’m £’m £’m £’m £’m
Investments held at fair value through profit orloss that are monetary items 16.9 — 16.9 30.4 — 30.4
Net current assets 95.1 — 95.1 17.3 — 17.3Bank loans (124.6) — (124.6) (107.0) — (107.0)
Foreign currency exposure on net monetary items (12.6) — (12.6) (59.3) — (59.3)Investments held at fair value through profit or
loss that are equities 205.9 4.6 210.5 415.4 15.8 431.2
Total net foreign currency exposure 193.3 4.6 197.9 356.1 15.8 371.9
In the opinion of the Directors, the above year end amounts are broadly representative of the exposure to foreign currencyrisk during the year.
Foreign currency sensitivity The following tables illustrate the sensitivity of profit after taxation for the year and net assets with regard to theCompany’s monetary financial assets and financial liabilities and exchange rates.
The sensitivity analysis is based on the Company’s monetary net foreign currency exposure at each balance sheet date andassumes a 10% (2008: 5%) appreciation or depreciation of sterling against the Euro and the other currencies to which theCompany is exposed, which is considered to be a reasonable illustration based on the volatility of exchange rates duringthe year.
If sterling had weakened this would have had the following effect:
2009 2008 £’m £’m
Income statement profit after taxation:Revenue return 1.8 0.7Capital return (1.3) (3.0)
Total profit after taxation for the year 0.5 (2.3)
Net assets 0.5 (2.3)
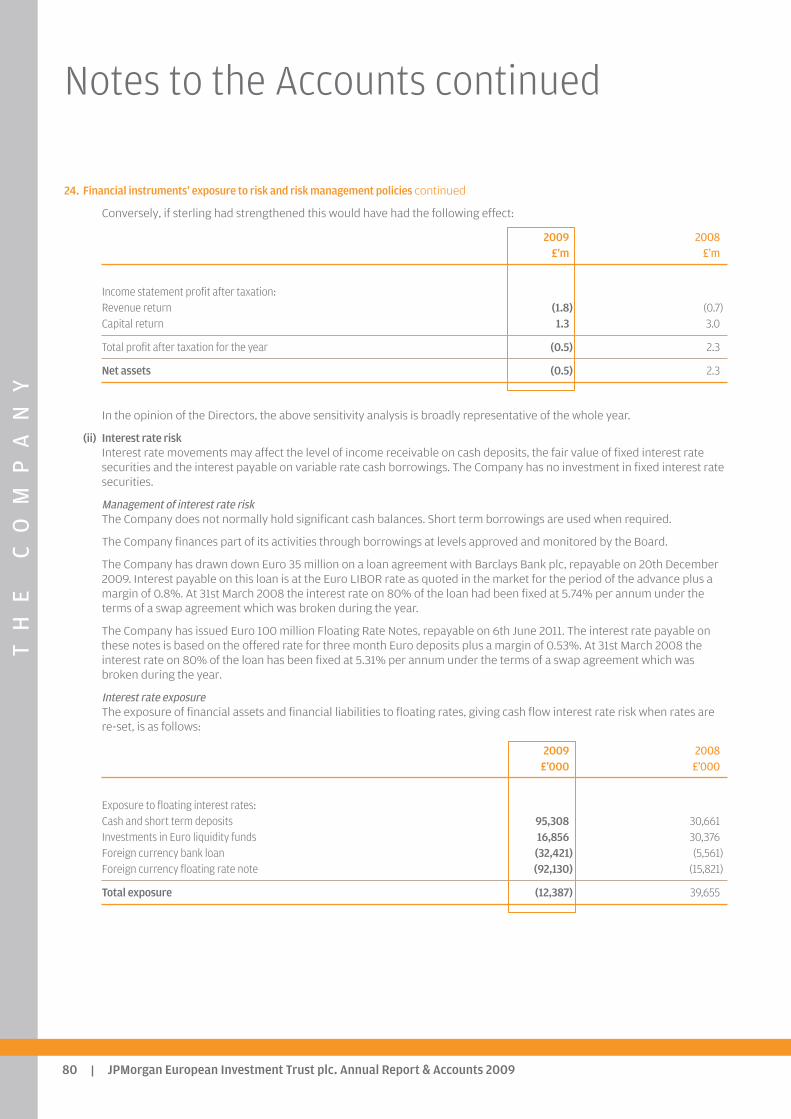
TH
EC
OM
PA
NY
JPMorgan European Investment Trust plc. Annual Report & Accounts 200980
Notes to the Accounts continued
24. Financial instruments’ exposure to risk and risk management policies continued
Conversely, if sterling had strengthened this would have had the following effect:
2009 2008 £’m £’m
Income statement profit after taxation:Revenue return (1.8) (0.7)Capital return 1.3 3.0
Total profit after taxation for the year (0.5) 2.3
Net assets (0.5) 2.3
In the opinion of the Directors, the above sensitivity analysis is broadly representative of the whole year.
(ii) Interest rate risk Interest rate movements may affect the level of income receivable on cash deposits, the fair value of fixed interest ratesecurities and the interest payable on variable rate cash borrowings. The Company has no investment in fixed interest ratesecurities.
Management of interest rate risk The Company does not normally hold significant cash balances. Short term borrowings are used when required.
The Company finances part of its activities through borrowings at levels approved and monitored by the Board.
The Company has drawn down Euro 35 million on a loan agreement with Barclays Bank plc, repayable on 20th December2009. Interest payable on this loan is at the Euro LIBOR rate as quoted in the market for the period of the advance plus amargin of 0.8%. At 31st March 2008 the interest rate on 80% of the loan had been fixed at 5.74% per annum under theterms of a swap agreement which was broken during the year.
The Company has issued Euro 100 million Floating Rate Notes, repayable on 6th June 2011. The interest rate payable onthese notes is based on the offered rate for three month Euro deposits plus a margin of 0.53%. At 31st March 2008 theinterest rate on 80% of the loan has been fixed at 5.31% per annum under the terms of a swap agreement which wasbroken during the year.
Interest rate exposure The exposure of financial assets and financial liabilities to floating rates, giving cash flow interest rate risk when rates arere-set, is as follows:
2009 2008 £’000 £’000
Exposure to floating interest rates:Cash and short term deposits 95,308 30,661Investments in Euro liquidity funds 16,856 30,376Foreign currency bank loan (32,421) (5,561)Foreign currency floating rate note (92,130) (15,821)
Total exposure (12,387) 39,655
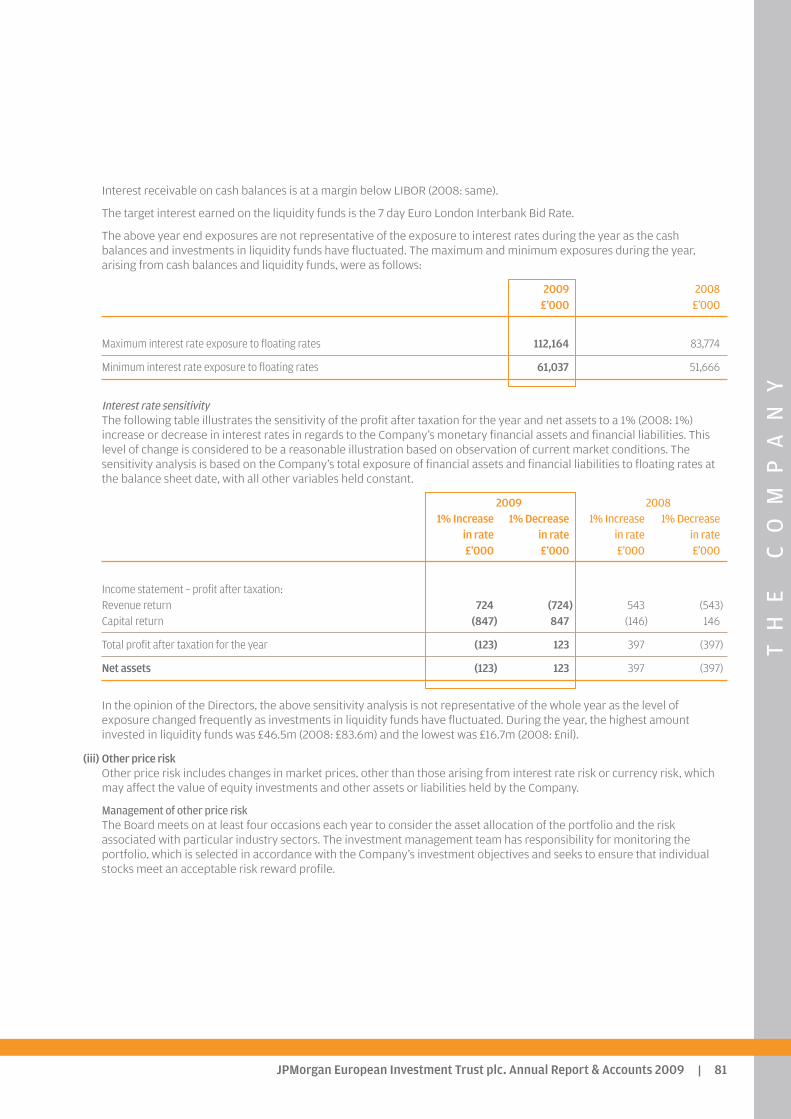
TH
EC
OM
PA
NY
JPMorgan European Investment Trust plc. Annual Report & Accounts 2009 81
Interest receivable on cash balances is at a margin below LIBOR (2008: same).
The target interest earned on the liquidity funds is the 7 day Euro London Interbank Bid Rate.
The above year end exposures are not representative of the exposure to interest rates during the year as the cashbalances and investments in liquidity funds have fluctuated. The maximum and minimum exposures during the year,arising from cash balances and liquidity funds, were as follows:
2009 2008 £’000 £’000
Maximum interest rate exposure to floating rates 112,164 83,774
Minimum interest rate exposure to floating rates 61,037 51,666
Interest rate sensitivity The following table illustrates the sensitivity of the profit after taxation for the year and net assets to a 1% (2008: 1%)increase or decrease in interest rates in regards to the Company’s monetary financial assets and financial liabilities. Thislevel of change is considered to be a reasonable illustration based on observation of current market conditions. Thesensitivity analysis is based on the Company’s total exposure of financial assets and financial liabilities to floating rates atthe balance sheet date, with all other variables held constant.
2009 20081% Increase 1% Decrease 1% Increase 1% Decrease
in rate in rate in rate in rate £’000 £’000 £’000 £’000
Income statement – profit after taxation:Revenue return 724 (724) 543 (543)Capital return (847) 847 (146) 146
Total profit after taxation for the year (123) 123 397 (397)
Net assets (123) 123 397 (397)
In the opinion of the Directors, the above sensitivity analysis is not representative of the whole year as the level ofexposure changed frequently as investments in liquidity funds have fluctuated. During the year, the highest amountinvested in liquidity funds was £46.5m (2008: £83.6m) and the lowest was £16.7m (2008: £nil).
(iii) Other price risk Other price risk includes changes in market prices, other than those arising from interest rate risk or currency risk, whichmay affect the value of equity investments and other assets or liabilities held by the Company.
Management of other price risk The Board meets on at least four occasions each year to consider the asset allocation of the portfolio and the riskassociated with particular industry sectors. The investment management team has responsibility for monitoring theportfolio, which is selected in accordance with the Company’s investment objectives and seeks to ensure that individualstocks meet an acceptable risk reward profile.
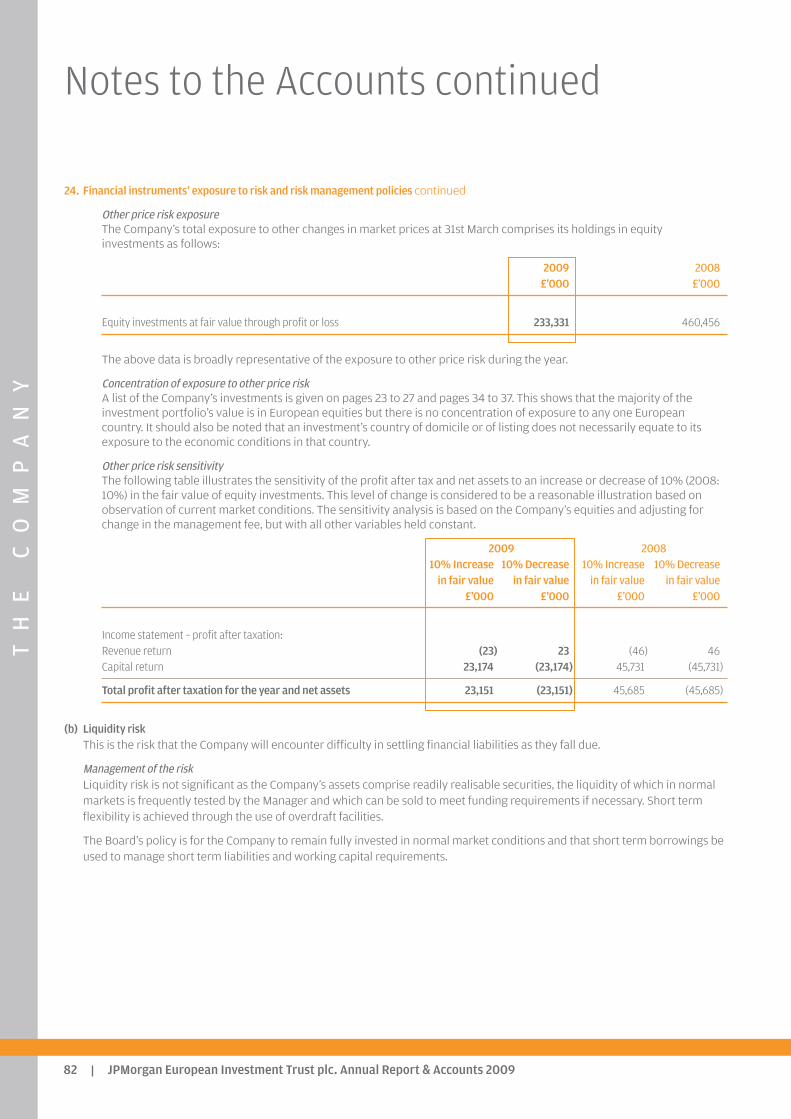
TH
EC
OM
PA
NY
JPMorgan European Investment Trust plc. Annual Report & Accounts 200982
Notes to the Accounts continued
24. Financial instruments’ exposure to risk and risk management policies continued
Other price risk exposure The Company’s total exposure to other changes in market prices at 31st March comprises its holdings in equityinvestments as follows:
2009 2008 £’000 £’000
Equity investments at fair value through profit or loss 233,331 460,456
The above data is broadly representative of the exposure to other price risk during the year.
Concentration of exposure to other price risk A list of the Company’s investments is given on pages 23 to 27 and pages 34 to 37. This shows that the majority of theinvestment portfolio’s value is in European equities but there is no concentration of exposure to any one Europeancountry. It should also be noted that an investment’s country of domicile or of listing does not necessarily equate to itsexposure to the economic conditions in that country.
Other price risk sensitivity The following table illustrates the sensitivity of the profit after tax and net assets to an increase or decrease of 10% (2008:10%) in the fair value of equity investments. This level of change is considered to be a reasonable illustration based onobservation of current market conditions. The sensitivity analysis is based on the Company’s equities and adjusting forchange in the management fee, but with all other variables held constant.
2009 200810% Increase 10% Decrease 10% Increase 10% Decrease
in fair value in fair value in fair value in fair value£’000 £’000 £’000 £’000
Income statement – profit after taxation:Revenue return (23) 23 (46) 46Capital return 23,174 (23,174) 45,731 (45,731)
Total profit after taxation for the year and net assets 23,151 (23,151) 45,685 (45,685)
(b) Liquidity risk This is the risk that the Company will encounter difficulty in settling financial liabilities as they fall due.
Management of the risk Liquidity risk is not significant as the Company’s assets comprise readily realisable securities, the liquidity of which in normalmarkets is frequently tested by the Manager and which can be sold to meet funding requirements if necessary. Short termflexibility is achieved through the use of overdraft facilities.
The Board’s policy is for the Company to remain fully invested in normal market conditions and that short term borrowings beused to manage short term liabilities and working capital requirements.
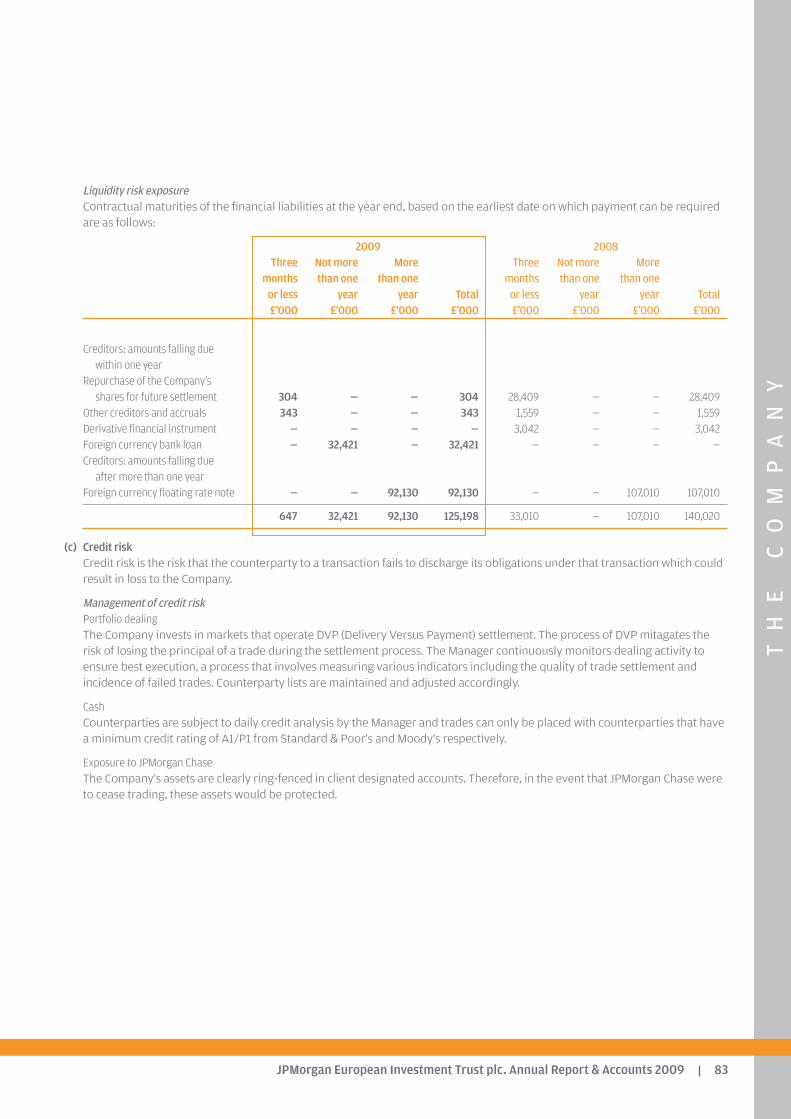
TH
EC
OM
PA
NY
JPMorgan European Investment Trust plc. Annual Report & Accounts 2009 83
Liquidity risk exposure Contractual maturities of the financial liabilities at the year end, based on the earliest date on which payment can be requiredare as follows:
2009 2008Three Not more More Three Not more More
months than one than one months than one than oneor less year year Total or less year year Total£’000 £’000 £’000 £’000 £’000 £’000 £’000 £’000
Creditors: amounts falling due within one year
Repurchase of the Company’s shares for future settlement 304 — — 304 28,409 — — 28,409
Other creditors and accruals 343 — — 343 1,559 — — 1,559Derivative financial instrument — — — — 3,042 — — 3,042Foreign currency bank loan — 32,421 — 32,421 — — — —Creditors: amounts falling due
after more than one yearForeign currency floating rate note — — 92,130 92,130 — — 107,010 107,010
647 32,421 92,130 125,198 33,010 — 107,010 140,020
(c) Credit risk Credit risk is the risk that the counterparty to a transaction fails to discharge its obligations under that transaction which couldresult in loss to the Company.
Management of credit risk Portfolio dealingThe Company invests in markets that operate DVP (Delivery Versus Payment) settlement. The process of DVP mitagates therisk of losing the principal of a trade during the settlement process. The Manager continuously monitors dealing activity toensure best execution, a process that involves measuring various indicators including the quality of trade settlement andincidence of failed trades. Counterparty lists are maintained and adjusted accordingly.
CashCounterparties are subject to daily credit analysis by the Manager and trades can only be placed with counterparties that havea minimum credit rating of A1/P1 from Standard & Poor's and Moody's respectively.
Exposure to JPMorgan ChaseThe Company's assets are clearly ring-fenced in client designated accounts. Therefore, in the event that JPMorgan Chase wereto cease trading, these assets would be protected.
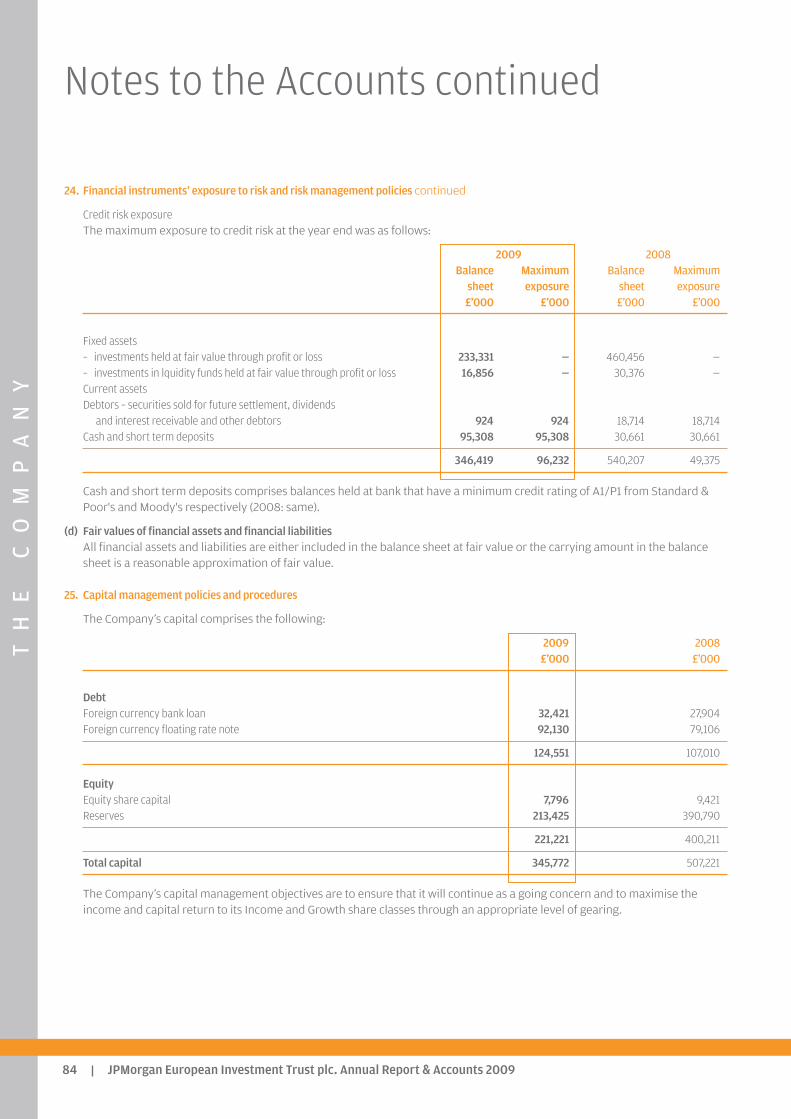
TH
EC
OM
PA
NY
JPMorgan European Investment Trust plc. Annual Report & Accounts 200984
Notes to the Accounts continued
24. Financial instruments’ exposure to risk and risk management policies continued
Credit risk exposureThe maximum exposure to credit risk at the year end was as follows:
2009 2008Balance Maximum Balance Maximum
sheet exposure sheet exposure£’000 £’000 £’000 £’000
Fixed assets– investments held at fair value through profit or loss 233,331 — 460,456 —– investments in lquidity funds held at fair value through profit or loss 16,856 — 30,376 —Current assetsDebtors – securities sold for future settlement, dividends
and interest receivable and other debtors 924 924 18,714 18,714Cash and short term deposits 95,308 95,308 30,661 30,661
346,419 96,232 540,207 49,375
Cash and short term deposits comprises balances held at bank that have a minimum credit rating of A1/P1 from Standard &Poor's and Moody's respectively (2008: same).
(d) Fair values of financial assets and financial liabilities All financial assets and liabilities are either included in the balance sheet at fair value or the carrying amount in the balancesheet is a reasonable approximation of fair value.
25. Capital management policies and procedures
The Company’s capital comprises the following:
2009 2008£’000 £’000
DebtForeign currency bank loan 32,421 27,904Foreign currency floating rate note 92,130 79,106
124,551 107,010
EquityEquity share capital 7,796 9,421Reserves 213,425 390,790
221,221 400,211
Total capital 345,772 507,221
The Company’s capital management objectives are to ensure that it will continue as a going concern and to maximise theincome and capital return to its Income and Growth share classes through an appropriate level of gearing.
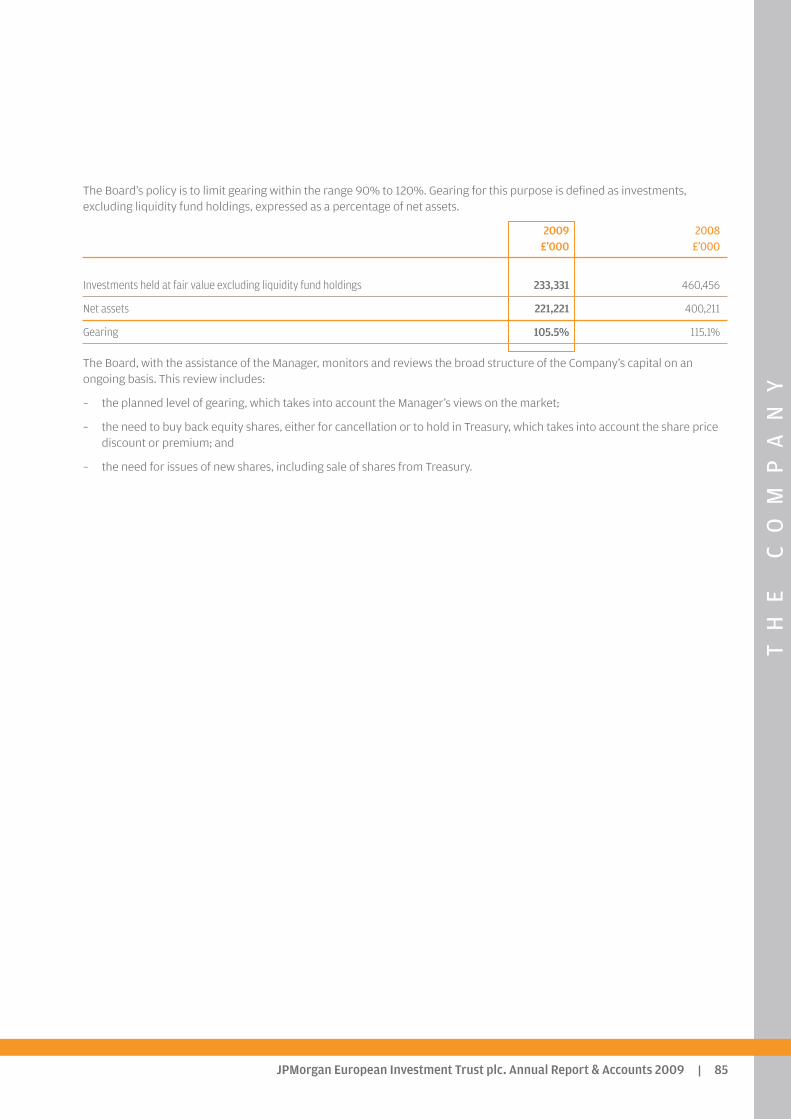
TH
EC
OM
PA
NY
JPMorgan European Investment Trust plc. Annual Report & Accounts 2009 85
The Board’s policy is to limit gearing within the range 90% to 120%. Gearing for this purpose is defined as investments,excluding liquidity fund holdings, expressed as a percentage of net assets.
2009 2008 £’000 £’000
Investments held at fair value excluding liquidity fund holdings 233,331 460,456
Net assets 221,221 400,211
Gearing 105.5% 115.1%
The Board, with the assistance of the Manager, monitors and reviews the broad structure of the Company’s capital on anongoing basis. This review includes:
– the planned level of gearing, which takes into account the Manager’s views on the market;
– the need to buy back equity shares, either for cancellation or to hold in Treasury, which takes into account the share pricediscount or premium; and
– the need for issues of new shares, including sale of shares from Treasury.
TH
EC
OM
PA
NY
JPMorgan European Investment Trust plc. Annual Report & Accounts 200986
History
JPMorgan European Investment Trust plc was formed in 1929 asThe London and Holyrood Trust Limited and was a generalinvestment trust until 1982 when the name was changed to TheFleming Universal Investment Trust. Under this name the portfoliobecame more internationally invested until November 1988, whenthe Board decided to concentrate on Continental Europeaninvestments. In 1992 shareholders approved a formal adoption ofthis specialisation. The Company adopted its current structure andname in August 2006.
Company Numbers
Company registration number: 237958 London Stock Exchange Sedol numbers: Growth: B18JK16 Income: B17XWW4
ISIN numbers: Growth: GB00B18JK166 Income: GB00B17XWW44
Bloomberg Codes: Growth: JETG LN Income: JETI LN
Market Information
The Company’s net asset value is published daily, via The LondonStock Exchange. The Company’s shares are listed on the LondonStock Exchange. The market prices are shown daily in the FinancialTimes, The Times, the Daily Telegraph, The Scotsman, TheIndependent and on the Company website atwww.jpmeuropean.co.uk, where the share prices are updatedevery fifteen minutes during trading hours.
Website
www.jpmeuropean.co.uk
Share Transactions
The Company’s shares may be dealt in directly through astockbroker or through a professional adviser acting on aninvestor’s behalf. They may also be purchased and held through theJPMorgan Investment Trust Share Plan, Individual Savings Account(ISA).
Manager and Company Secretary
JPMorgan Asset Management (UK) Limited
Company’s Registered Office
Finsbury Dials20 Finsbury StreetLondon EC2Y 9AQTelephone number: 0207 742 6000
Please contact Jonathan Latter for company secretarial andadministrative matters.
Registrars
EquinitiReference 1080 Aspect HouseSpencer RoadLancingWest Sussex BN99 6DA Telephone number: 0871 384 2319
Notifications of changes of address and enquiries regarding sharecertificates or dividend cheques should be made in writing to theRegistrars quoting reference 1080.
Registered shareholders can obtain further details on their holdingson the internet by visiting www.shareview.co.uk.
Savings Product Administrators
For queries on the JPMorgan ISA, Share Plan or Pension Account,see contact details on the back cover of this report.
Auditors
Ernst & Young LLP 1 More London Place London SE1 2AF
Brokers
Winterflood SecuritiesThe Atrium Building Cannon Bridge25 Dowgate HillLondon EC4R 2GATelephone 020 7621 0004
Information about the Company
Financial CalendarFinancial year end 31st MarchFinal results announced JuneHalf year end SeptemberHalf year results announced NovemberInterim Management Statements announced July/JanuaryDividends payable – Growth and Income April and OctoberAnnual General Meeting July
A member of the AIC

TH
EC
OM
PA
NY
JPMorgan European Investment Trust plc. Annual Report & Accounts 2009 87
Capital Structure and Conversion between Share ClassesThe Company has two share classes, each with distinctinvestment policies, objectives and underlying asset pools.Each share class is listed separately and traded on the LondonStock Exchange. This capital structure means that shareholdersmay benefit from greater investment flexibility in a tax-efficientmanner.
Capital Structure
• Growth Shares Capital growth from Continental European investments, byconsistent out-performance of the benchmark and a risingshare price over the longer term by taking carefully controlledrisks through an investment method that is clearlycommunicated to shareholders.
• Income Shares To provide a growing income together with the potential forlong-term capital growth from a diversified portfolio ofinvestments in pan-european stockmarkets.
Conversion Opportunities
Shareholders in either of the two share classes are able toconvert some or all of their shares into shares of the otherclasses without such conversion being treated, under currentlaw, as a disposal for UK capital gains tax purposes.
The conversion mechanism allows shareholders to alter theirinvestment profile to match their changing investment needs ina tax-efficient manner.
Conversion dates arise every six months on 15th Septemberand 15th March (if such a date is not a business day, then theconversion date will move to the next business day).
The Company, or its Manager, makes no administrative chargefor any of the above conversions.
Conversion between the share classes
Those who hold shares through the JPM Investment TrustShare Plan/PEP/ISA or Pension Account must submit aconversion instruction form which can be found atwww.jpmeuropean.com. Instructions for CREST holders canalso be found at this address. Those who hold shares incertificated form on the main register must complete theconversion notice printed on the reverse of their certificate.
Instructions must be received in the month of August forSeptember conversions and in the month of February forMarch conversions.
The number of shares that will arise upon conversion will bedetermined on the basis of the relative net asset values of eachshare class.
More details concerning conversion dates and conversioninstruction forms can be found on the Company’s web site:www.jpmeuropean.co.uk.
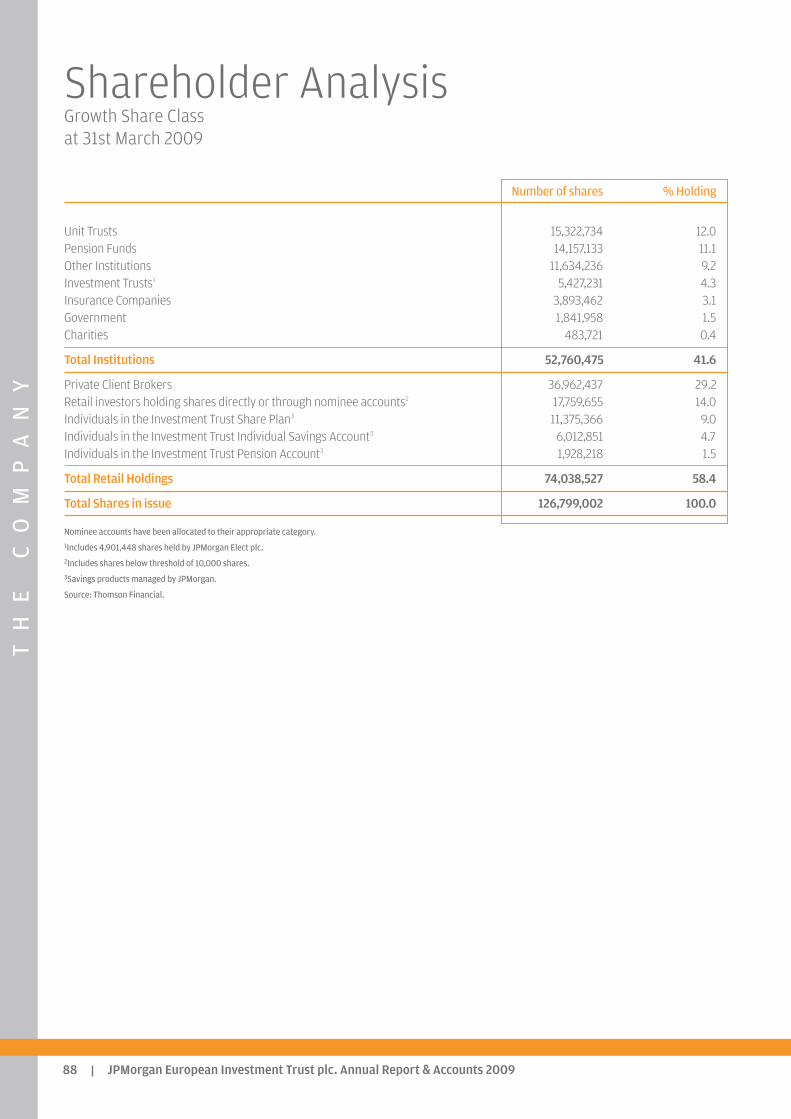
TH
EC
OM
PA
NY
JPMorgan European Investment Trust plc. Annual Report & Accounts 200988
Shareholder AnalysisGrowth Share Classat 31st March 2009
Number of shares % Holding
Unit Trusts 15,322,734 12.0Pension Funds 14,157,133 11.1Other Institutions 11,634,236 9.2Investment Trusts1 5,427,231 4.3Insurance Companies 3,893,462 3.1Government 1,841,958 1.5Charities 483,721 0.4
Total Institutions 52,760,475 41.6
Private Client Brokers 36,962,437 29.2Retail investors holding shares directly or through nominee accounts2 17,759,655 14.0Individuals in the Investment Trust Share Plan3 11,375,366 9.0Individuals in the Investment Trust Individual Savings Account3 6,012,851 4.7Individuals in the Investment Trust Pension Account3 1,928,218 1.5
Total Retail Holdings 74,038,527 58.4
Total Shares in issue 126,799,002 100.0
Nominee accounts have been allocated to their appropriate category.1Includes 4,901,448 shares held by JPMorgan Elect plc.2Includes shares below threshold of 10,000 shares. 3Savings products managed by JPMorgan.
Source: Thomson Financial.
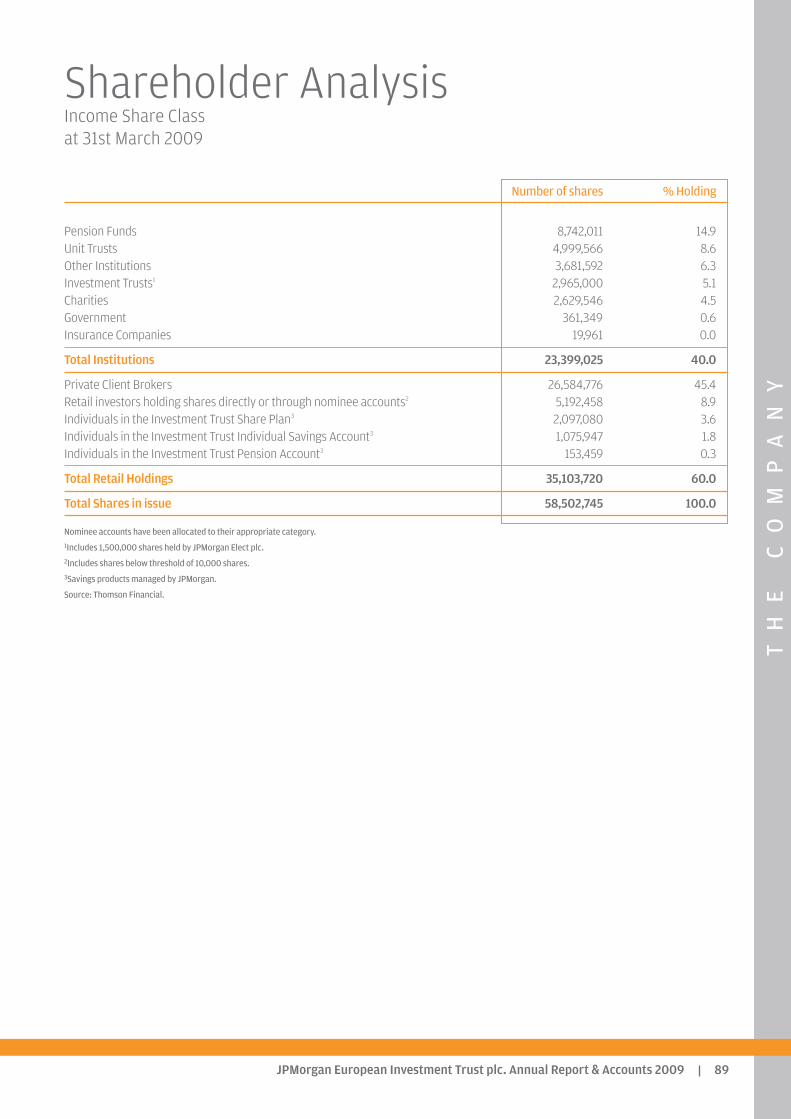
TH
EC
OM
PA
NY
JPMorgan European Investment Trust plc. Annual Report & Accounts 2009 89
Shareholder AnalysisIncome Share Classat 31st March 2009
Number of shares % Holding
Pension Funds 8,742,011 14.9Unit Trusts 4,999,566 8.6Other Institutions 3,681,592 6.3Investment Trusts1 2,965,000 5.1Charities 2,629,546 4.5Government 361,349 0.6Insurance Companies 19,961 0.0
Total Institutions 23,399,025 40.0
Private Client Brokers 26,584,776 45.4Retail investors holding shares directly or through nominee accounts2 5,192,458 8.9Individuals in the Investment Trust Share Plan3 2,097,080 3.6Individuals in the Investment Trust Individual Savings Account3 1,075,947 1.8Individuals in the Investment Trust Pension Account3 153,459 0.3
Total Retail Holdings 35,103,720 60.0
Total Shares in issue 58,502,745 100.0
Nominee accounts have been allocated to their appropriate category.1Includes 1,500,000 shares held by JPMorgan Elect plc.2Includes shares below threshold of 10,000 shares. 3Savings products managed by JPMorgan.
Source: Thomson Financial.

TH
EC
OM
PA
NY
JPMorgan European Investment Trust plc. Annual Report & Accounts 200990
Notice is hereby given that the eightieth Annual GeneralMeeting of JPMorgan European Investment Trust plc will beheld at The Armourers’ Hall, 81 Coleman Street, London EC2R5BJ on Thursday, 16th July 2009 at 12.00 noon for the followingpurposes:
1 To receive the Directors’ Report, the Annual Accounts andthe Auditors’ Report for the year ended 31st March 2009.
2 To approve the Directors’ Remuneration Report for theyear ended 31st March 2009.
3 To elect Stephen Goldman a Director of the Company.
4 To re-elect Ferdinand Verdonck a Director of the Company.
5 To re-elect Robin Faber a Director of the Company.
6 To re-appoint Ernst & Young LLP as auditors to theCompany and to authorise the Directors to determine theirremuneration for the ensuing year.
Special Business
To consider the following resolutions:
Authority to Repurchase the Company’s Shares – Special Resolution 7 THAT the Company be generally and, subject as hereinafter
appears, unconditionally authorised in accordance withSection 166 of the Companies Act 1985 (the ‘Act’) to makemarket purchases (within the meaning of Section 163 of theAct) of its issued Growth shares and Income shares (bothbeing classes of ordinary shares in the capital of theCompany)
PROVIDED ALWAYS THAT
(i) the maximum number of Growth and Income shareshereby authorised to be purchased shall be 18,851,986or 8,691,576 respectively, or, if different, that number ofGrowth and Income shares which is equal to 14.99% ofthe issued share capital of the relevant share class as atthe date of the passing of this Resolution;
(ii) the minimum price which may be paid for any Growthor Income share shall be 5p or 2.5p respectively;
(iii) the maximum price which may be paid for any ordinaryshare shall be an amount equal to 105% of the average
of the middle market quotations for a Growth or Incomeshare taken from and calculated by reference to theLondon Stock Exchange Daily Official List for the fivebusiness days immediately preceding the day on whichthe ordinary share is purchased or (b) the price of thelast independent trade; or (c) the highest currentindependent bid;
(iv) any purchase of Growth or Income shares will be madein the market for cash at prices below the prevailing netasset value per Growth or Income share (as determinedby the Directors) at the date following not more thanseven days before the date of purchase:
(v) the authority hereby conferred shall expire on15th January 2011 unless the authority is renewed at theCompany’s Annual General Meeting in 2010 or at anyother general meeting prior to such time; and
(vi) the Company may make a contract to purchase Growthor Income shares under the authority hereby conferredprior to the expiry of such authority and may make apurchase of shares pursuant to any such contractnotwithstanding such expiry.
Authority to make off-market purchases – Special Resolution 8 THAT the proposed Contingent Purchase contract between
Winterflood Securities Limited and JPMorgan EuropeanInvestment Trust plc to enable the Company to make off-market purchases of its own securities pursuant to Section164 and 165 of the Companies Act 1985 in the formproduced at the meeting and initialled by the Chairman, beand is hereby approved and the Company be and is herebyauthorised to enter into and perform such contract, but sothat the approval and authority conferred by this resolutionshall expire on the day immediately preceding the datewhich is 18 months after the passing of this resolution or, ifearlier, the next Annual General Meeting of the Company.
By order of the Board Jonathan Latter, for and on behalf of JPMorgan Asset Management (UK) Limited, Secretary. 8th June 2009
Notice of Meeting

TH
EC
OM
PA
NY
JPMorgan European Investment Trust plc. Annual Report & Accounts 2009 91
Notes These notes should be read in conjunction with the notes on thereverse of the proxy form.
1 A member entitled to attend and vote at the Meeting may appointanother person(s) (who need not be a member of the Company) toexercise all or any of his rights to attend, speak and vote at theMeeting. A member can appoint more than one proxy in relation tothe Meeting, provided that each proxy is appointed to exercise therights attaching to different shares held by him.
2 A proxy does not need to be a member of the Company but mustattend the Meeting to represent you. Your proxy could be theChairman, another director of the Company or another person whohas agreed to attend to represent you. Details of how to appointthe Chairman or another person(s) as your proxy or proxies usingthe proxy form are set out in the notes to the proxy form. If a votingbox on the proxy form is left blank, the proxy or proxies willexercise his/their discretion both as to how to vote and whetherhe/they abstain(s) from voting. Your proxy must attend theMeeting for your vote to count. Appointing a proxy or proxies doesnot preclude you from attending the Meeting and voting in person.If you attend the Meeting in person, your proxy appointment willautomatically be terminated.
3 A copy of this notice has been sent for information only to personswho have been nominated by a member to enjoy informationrights under section 146 of the Companies Act 2006 (a ‘NominatedPerson’). The rights to appoint a proxy can not be exercised by aNominated Person: they can only be exercised by the member.However, a Nominated Person may have a right under anagreement between him and the member by whom he wasnominated to be appointed as a proxy for the Meeting or to havesomeone else so appointed. If a Nominated Person does not havesuch a right or does not wish to exercise it, he may have a rightunder such an agreement to give instructions to the member as tothe exercise of voting rights.
4 Any instrument appointing a proxy, to be valid,must be lodged inaccordance with the instructions given on the proxy form.
5 You may change your proxy instructions by returning a new proxyappointment. The deadline for receipt of proxy appointments (seeabove) also applies in relation to amended instructions. Anyattempt to terminate or amend a proxy appointment received afterthe relevant deadline will be disregarded.Where two or more validseparate appointments of proxy are received in respect of thesame share in respect of the same Meeting, the one which is lastsent shall be treated as replacing and revoking the other or others.
6 To be entitled to attend and vote at the Meeting (and for thepurpose of the determination by the Company of the number ofvotes they may cast), members must be entered on the Company’sregister of members as at 6.00 p.m. two days prior to the Meeting(the ‘specified time’). If the Meeting is adjourned to a time not morethan 48 hours after the specified time applicable to the originalMeeting, that time will also apply for the purpose of determiningthe entitlement of members to attend and vote (and for thepurpose of determining the number of votes they may cast) at theadjourned Meeting. If however the Meeting is adjourned for alonger period then, to be so entitled, members must be entered onthe Company’s register of members as at 6.00 p.m. two days priorto the adjourned Meeting or, if the Company gives notice of theadjourned Meeting, at the time specified in that notice.
7 Entry to the Meeting will be restricted to shareholders, with guestsadmitted only by prior arrangement.
8 A corporation, which is a shareholder, may appoint individuals toact as its representatives and to vote in person at the Meeting (seeinstructions given on the proxy form). In order to facilitate votingby corporate representatives at the Meeting, arrangements will beput in place at the Meeting so that (i) if a corporate shareholder hasappointed the Chairman of the Meeting as its corporaterepresentative with instructions to vote on a poll in accordancewith the directions of all of the other corporate representatives forthat shareholder at the Meeting, then on a poll those corporaterepresentatives will give voting directions to the Chairman and theChairman will vote (or withhold a vote) as corporate representativein accordance with those directions; and (ii) if more than onecorporate representative for the same corporate shareholderattends the Meeting but the corporate shareholder has notappointed the Chairman of the Meeting as its corporaterepresentative, a designated corporate representative will benominated, from those corporate representatives who attend, whowill vote on a poll and the other corporate representatives will givevoting directions to that designated corporate representative.Corporate shareholders are referred to the guidance issued by theInstitute of Chartered Secretaries and Administrators on proxiesand corporate representatives (www.icsa.org.uk) for further detailsof this procedure. The guidance includes a sample form ofrepresentation letter if the Chairman is being appointed asdescribed in (i) above. Representatives should bring to the Meetingevidence of their appointment, including any authority underwhich it is signed.
9 The register of interests of the Directors and connected persons inthe share capital of the Company is available for inspection at theCompany’s registered office during usual business hours on anyweekday (Saturdays, Sundays and public holidays excepted). It willalso be available for inspection at the Annual General Meeting.
10 No Director has any contract of service with the Company.
11 As at 5th June 2009 (being the latest business day prior to thepublication of this Notice), the Company’s issued share capitalconsists of 125,763,752 Growth shares and 57,982,495 Incomeshares. Voting rights are calculated by reference to the sharevoting numbers which, as at 31st March 2009, were 1.42 (Growth)and 0.70 (Income). Therefore the total voting rights in theCompany are 219,172,274.
Electronic appointment – CREST members
CREST members who wish to appoint a proxy or proxies by utilising theCREST electronic proxy appointment service may do so for the Meetingand any adjournment(s) thereof by using the procedures described inthe CREST Manual. See further instructions on the proxy form.

TH
EC
OM
PA
NY
JPMorgan European Investment Trust plc. Annual Report & Accounts 200992
Return to Shareholders
Total return to the investor, on a mid-market price tomid-market price basis, assuming that all dividends receivedwere reinvested in the shares of the Company at the time theshares were quoted ex-dividend. Transaction costs ofreinvestment are not taken into account.
Return on Net Assets
Total return on net asset value (‘NAV’) per share, on a bid valueto bid value basis, assuming that all dividends paid out by theCompany were reinvested in the shares of the Company at theNAV per share at the time the shares were quoted ex-dividend.
Benchmark Return
Total return on the benchmark, on a mid-market value tomid-market value basis, assuming that all dividends received(net of tax) were reinvested in the shares of the underlyingcompanies at the time the shares were quoted ex-dividend.
The benchmark is a recognised index of stocks which shouldnot be taken as wholly representative of the Company’sinvestment universe. The Company’s investment strategy doesnot follow or “track” this index and consequently, there may besome divergence between the Company’s performance andthat of the stated index.
Actual Gearing Factor
Investments expressed as a percentage of shareholders’ funds.This shows the effect of gearing on the net asset value if themarket value of the portfolio was to increase by 100%.
Total Expense Ratio (TER)
Management fees and all other operating expenses, excludinginterest expressed as a percentage of the average of theopening and closing net assets.
Discount/Premium
If the share price of an investment company is lower thanthe NAV per share, the Company’s shares are said to be tradingat a discount. The discount is shown as a percentage of theNAV. The opposite of a discount is a premium. It is morecommon for an investment company to trade at a discountthan a premium.
Performance Attribution
Analysis of how the Company achieved its recordedperformance relative to its benchmark.
Performance Attribution Definitions:
Asset Allocation Effect Measures the impact of allocating assets differently to those inthe benchmark, via the portfolio’s weighting in differentcountries, sectors or asset types.
Stock Selection Effect Measures the effect of investing in securities to a greater orlesser extent than their weighting in the benchmark, or ofinvesting in securities outside of the benchmark.
Gearing/Cash EffectMeasures the impact on returns of borrowings or cashbalances on the Company’s relative performance.
Management Fees/Other Expenses
The payment of management fees and other expenses reducesthe level of total assets, and therefore has a negative effect onrelative performance.
Residual
Arises when there is a divergence between total return ascalculated by Fundamental Data (includes dividends paid outby the Investment Trust) and total return from the attributionsystems (includes dividend income received in on the stocksheld by the Investment Trust). This is a result of methodologiesand timing differences.
Share Buybacks
Measures the effect on relative performance of decreasing thenumber of shares in issue.
Glossary of Terms


JPMorgan HelplineFreephone 0800 40 30 30 or 020 7742 99998.30 am to 6.00 pm Monday to Friday
JPMorgan Pension HelplineFreephone 0800 41 31 76 or 0172 241 48889.00 am to 5.00 pm Monday to FridayPlease use this number if you have any queries relating to the Pension Account.
Your telephone call may be recorded for your security
www.jpmeuropean.co.uk