Annual Press Release Nauru v7 glg 23 Nov 16
17
Bureau of Statistics Ministry of Finance Government Offices Yaren District Phone: (674) 557.3133 Email: [email protected] http://www.spc.int/prism/nauru/ MEDIA RELEASE IMTS Release No. 01/2016 3 November 2016 This is the first public release on International Merchandise Trade Statistics (IMTS) by the Nauru Bureau of Statistics (NBS). The NBS has used partner country data and enterprise data to compile it’s IMTS on an annual basis from 2006 to 2015 and will continue doing this until such time it is able to source data from Nauru Customs 1 . Nauru’s major trading partners/countries of consignment are Australia, Fiji and New Zealand. These are the three countries from which data have been sourced and after valuation adjustments turned into Nauru’s IMTS. There is a possibility that information on some merchandise, in particular those that don’t pass through these countries have not been accounted for. Omission of data, if any, is not deemed to be significant. This release which provides statistics on exports and imports by commodity and country will help policy makers’ better plan and negotiate trade deals as well as develop relevant trade policies. Appendix 1 of the release contains 9 tables on imports, exports and re-exports and Appendix 2 contains notes to help readers better understand the terminologies used. Provisional International Merchandise Trade Statistics 2006-2015 1. Value of exports and imports Annual IMTS from 2006 to 2015 is graphed below. It shows: Exports to have grown from 2006 when it was AUD1,302 thousand dollars to AUD18,089 thousand dollars in 2015. It peaked to AUD69,850 thousand dollars in 2012 due to higher exports of phosphate. Imports to have grown steadily from 2006 when it was AUD21,435 thousand dollars to AUD124,165 thousand dollars in 2015. It peaked to AUD157,812 thousand dollars in 2013 mainly due to the construction activities on the island, as well as the presence of the Regional Processing Centre (RPC). 1 Systems are being put in place at Customs for the capture of data. 0 30,000 60,000 90,000 120,000 150,000 180,000 2006 2007 2008 2009 2010 2011 2012 2013 2014 2015p AUD'000 Chart 1: Value of exports and imports Exports FOB Imports CIF
Transcript of Annual Press Release Nauru v7 glg 23 Nov 16

Bureau of Statistics
Ministry of Finance
Government Offices
Yaren District
Phone: (674) 557.3133
Email: [email protected]
http://www.spc.int/prism/nauru/
MEDIA RELEASE
IMTS Release No. 01/2016 3 November 2016
This is the first public release on International Merchandise Trade Statistics (IMTS) by the Nauru Bureau of
Statistics (NBS). The NBS has used partner country data and enterprise data to compile it’s IMTS on an
annual basis from 2006 to 2015 and will continue doing this until such time it is able to source data from
Nauru Customs1.
Nauru’s major trading partners/countries of consignment are Australia, Fiji and New Zealand. These are the
three countries from which data have been sourced and after valuation adjustments turned into Nauru’s
IMTS. There is a possibility that information on some merchandise, in particular those that don’t pass
through these countries have not been accounted for. Omission of data, if any, is not deemed to be
significant.
This release which provides statistics on exports and imports by commodity and country will help policy
makers’ better plan and negotiate trade deals as well as develop relevant trade policies.
Appendix 1 of the release contains 9 tables on imports, exports and re-exports and Appendix 2 contains
notes to help readers better understand the terminologies used.
Provisional International Merchandise Trade Statistics
2006-2015
1. Value of exports and imports
Annual IMTS from 2006 to 2015 is graphed below. It shows:
� Exports to have grown from 2006 when it was AUD1,302 thousand dollars to AUD18,089 thousand
dollars in 2015. It peaked to AUD69,850 thousand dollars in 2012 due to higher exports of phosphate.
� Imports to have grown steadily from 2006 when it was AUD21,435 thousand dollars to AUD124,165
thousand dollars in 2015. It peaked to AUD157,812 thousand dollars in 2013 mainly due to the
construction activities on the island, as well as the presence of the Regional Processing Centre (RPC).
1
Systems are being put in place at Customs for the capture of data.
0
30,000
60,000
90,000
120,000
150,000
180,000
2006 2007 2008 2009 2010 2011 2012 2013 2014 2015p
AU
D'0
00
Chart 1: Value of exports and imports
Exports FOB Imports CIF

IMTS Release No. 01/2016 Page 2 of 17
2. Balance of trade
From a trade deficit of $20,133 thousand dollars in 2006, the deficit increased to AUD106,076 thousand
dollars in 2015. The high trade deficit between 2013 and 2015 is attributed to higher imports which
quadrupled in 2013 and continued through to 2015 due to the imports of:
� construction materials,
� machinery,
� vehicles,
� fuel,
� food, and
� cigarettes.
Trade surpluses were registered in 2008 and from 2010 to 2012 due to increased exports of phosphate.
The reasons in the movement of imports and exports will be better understood from the analysis below on
the performance of exports, re-exports and imports.
3. Performance of exports and re-exports
Data on total exports from Nauru are inclusive of re-exports.
Phosphate is the most important export of Nauru and it dominates exports. Exports of phosphate grew
from AUD1,302 thousand dollars in 2006 to AUD36,893 thousand dollars in 2008. It dropped significantly in
2009 to AUD11,564 thousand dollars due to the tampering of the conveyer belts which temporarily stopped
operation for a few months. Then from 2010 onwards exports of phosphate showed a steady growth and
peaked in 2012 when its export was AUD69,850 thousand dollars. Since then exports of phosphate is
showing a declining trend and stood at AUD14,663 thousand dollars in 2015.
-120,000
-100,000
-80,000
-60,000
-40,000
-20,000
0
20,000
40,000
2006 2007 2008 2009 2010 2011 2012 2013 2014 2015p
AU
D'0
00
Year
Chart 2: Trade Balance
0
25,000
50,000
75,000
2006 2007 2008 2009 2010 2011 2012 2013 2014 2015p
AU
D'0
00
Chart 3: Performance of exports
Phosphate Total exports Fuel
IMTS Release No. 01/2016 Page 3 of 17
Re-exports is dominated by the single most important commodity, fuel. The fuel re-export figures include
the sale of Jet A1 fuel to visiting aircraft. Data on fuel are only available from 2012 and as can be seen from
Graph 3, shows an increasing trend which is further illustrated as follows:
� 2013 shows annual growth of 111.5% since 2012,
� 2014 shows annual growth of 6.3% since 2013 and
� 2015 shows annual growth of 201.5% since 2014.
4. Performance of imports
As mentioned under value of exports and imports above, imports have grown from 2006 when it was
AUD21,435 thousand dollars to AUD124,165 thousand dollars in 2015 and peaked to AUD157,812 thousand
dollars in 2013. Most of the commodities imported show increases from 2013. By 2015 whilst many have
shown some decline, a few have continued to grow. The main reasons for the increase in imports are as
follows:
� re-construction of the RPC which had burnt down,
� construction of accommodation for the RPC security officers from Australia,
� construction settlements, other construction and repair, maintenance work, and
� the presence of more people on the island e.g. RPC residents being integrated into society, Australian
security guards, non-resident construction workers, resettled refugees and asylum seekers.
For more information refer to Table 2 in the Appendix for Imports by the Harmonized Commodity
Description and Coding System (HS) Sections and Table 7 on Principal Imports.
Commodities that have had a significant impact on the performance of imports for the period 2006 to 2015
are analysed below:
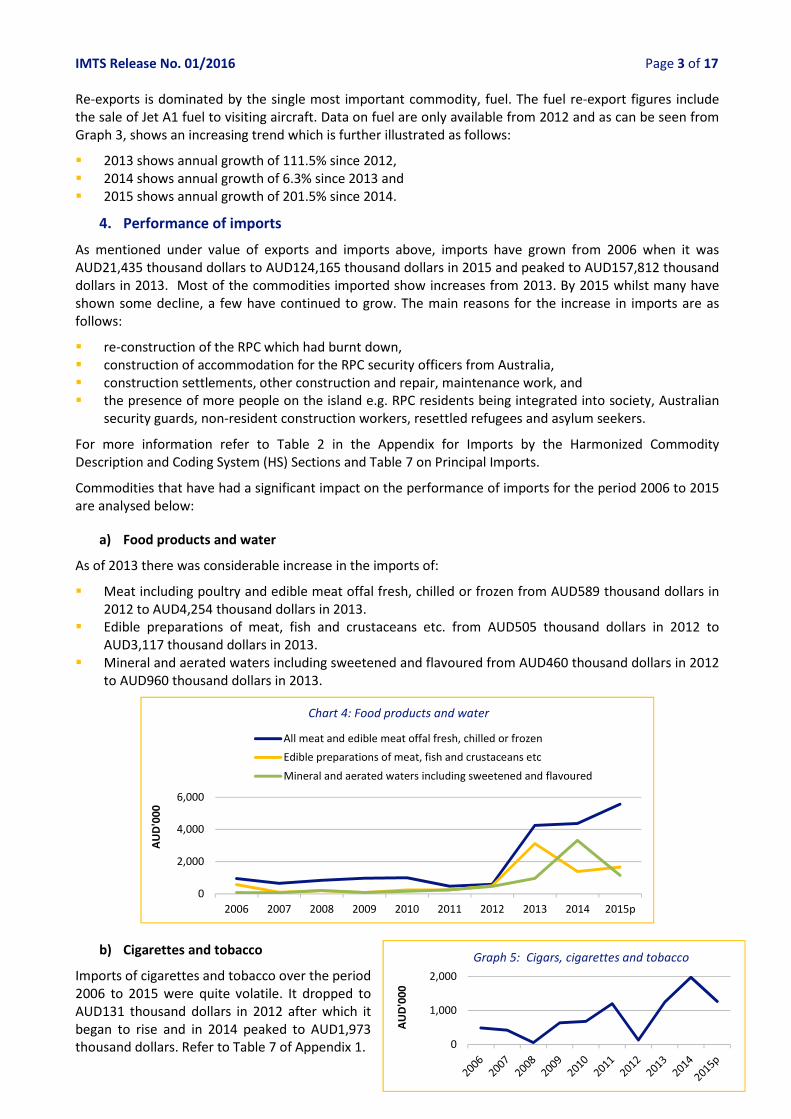
a) Food products and water
As of 2013 there was considerable increase in the imports of:
� Meat including poultry and edible meat offal fresh, chilled or frozen from AUD589 thousand dollars in
2012 to AUD4,254 thousand dollars in 2013.
� Edible preparations of meat, fish and crustaceans etc. from AUD505 thousand dollars in 2012 to
AUD3,117 thousand dollars in 2013.
� Mineral and aerated waters including sweetened and flavoured from AUD460 thousand dollars in 2012
to AUD960 thousand dollars in 2013.
b) Cigarettes and tobacco
Imports of cigarettes and tobacco over the period
2006 to 2015 were quite volatile. It dropped to
AUD131 thousand dollars in 2012 after which it
began to rise and in 2014 peaked to AUD1,973
thousand dollars. Refer to Table 7 of Appendix 1.
0
2,000
4,000
6,000
2006 2007 2008 2009 2010 2011 2012 2013 2014 2015p
AU
D'0
00
Chart 4: Food products and water
All meat and edible meat offal fresh, chilled or frozen
Edible preparations of meat, fish and crustaceans etc
Mineral and aerated waters including sweetened and flavoured
0
1,000
2,000
AU
D'0
00
Graph 5: Cigars, cigarettes and tobacco

IMTS Release No. 01/2016 Page 4 of 17
c) Petroleum oils and oils obtained from bituminous materials
Imports of fuel showed a steady growth up
until 2014 when it stood at AUD27,283
thousand dollars. In 2015 imports of fuel
dropped to AUD923 thousand dollars which is
a decline of 96.6% over 2014. A decline in the
imports of fuel was anticipated with some
construction projects completed and a
decline in the use of fuel in the phosphate
industry. However, the main contributing
factor for the decline was the stock of fuel
held by Nauru Utilities Cooperation - Tank
Farm as a result of the high import of fuel in
2014.
d) Plastics and articles of plastic
Plastics and articles of plastic showed a
steady growth up until 2013 and then by
2015 started to decline. Commodities
responsible for the increased imports were:
� rigid tubes, pipes, hoses and fittings,
� tableware and kitchenware of plastics,
� lavatory pans, flushing cisterns, bidets
and similar sanitary ware, and
� reservoirs, tanks, vats and similar
containers of plastics.
e) Construction materials
The rise in the imports in 2013 of the construction materials is attributed to the rebuilding of the RPC, as
well as the local construction projects. Key construction materials imported were the:
� prefabricated buildings,
� prefabricated structural components for building or civil engineering of cement, concrete or of artificial
stone,
� grill, netting and fencing of iron or steel, and
� towers and lattice masts of iron or steel.
� All of them show considerable increases from 2012 to 2013.
0
10,000
20,000
30,000
AU
D'0
00
Graph 6: Petroleum oils and oils obtained from
bituminous minerals
0
1,000
2,000
AU
D'0
00
Graph 7: Plastic and articles of plastic
0
20,000
40,000
60,000
2006 2007 2008 2009 2010 2011 2012 2013 2014 2015p
AU
D'0
00
Graph 8: Construction materials
Articles of stone, plaster and cement
Articles of iron or steel
Prefabricated buildings
IMTS Release No. 01/2016 Page 5 of 17
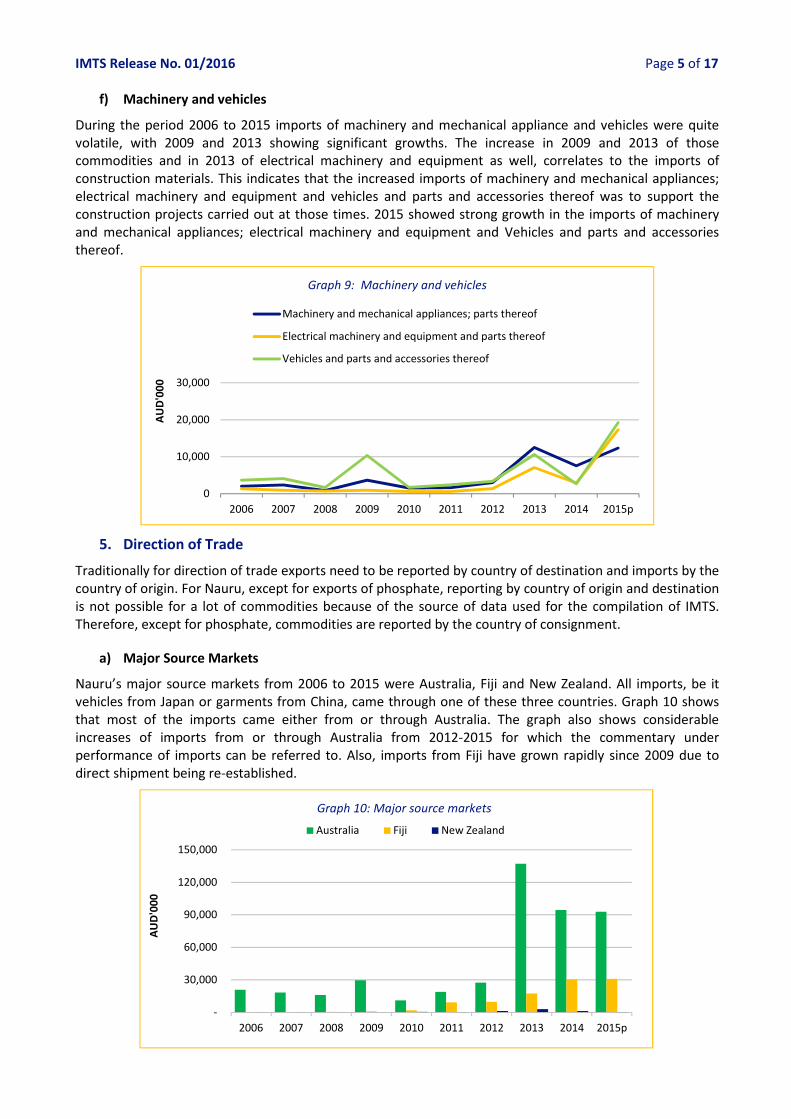
f) Machinery and vehicles
During the period 2006 to 2015 imports of machinery and mechanical appliance and vehicles were quite
volatile, with 2009 and 2013 showing significant growths. The increase in 2009 and 2013 of those
commodities and in 2013 of electrical machinery and equipment as well, correlates to the imports of
construction materials. This indicates that the increased imports of machinery and mechanical appliances;
electrical machinery and equipment and vehicles and parts and accessories thereof was to support the
construction projects carried out at those times. 2015 showed strong growth in the imports of machinery
and mechanical appliances; electrical machinery and equipment and Vehicles and parts and accessories
thereof.
5. Direction of Trade
Traditionally for direction of trade exports need to be reported by country of destination and imports by the
country of origin. For Nauru, except for exports of phosphate, reporting by country of origin and destination
is not possible for a lot of commodities because of the source of data used for the compilation of IMTS.
Therefore, except for phosphate, commodities are reported by the country of consignment.
a) Major Source Markets
Nauru’s major source markets from 2006 to 2015 were Australia, Fiji and New Zealand. All imports, be it
vehicles from Japan or garments from China, came through one of these three countries. Graph 10 shows
that most of the imports came either from or through Australia. The graph also shows considerable
increases of imports from or through Australia from 2012-2015 for which the commentary under
performance of imports can be referred to. Also, imports from Fiji have grown rapidly since 2009 due to
direct shipment being re-established.
0
10,000
20,000
30,000
2006 2007 2008 2009 2010 2011 2012 2013 2014 2015p
AU
D'0
00
Graph 9: Machinery and vehicles
Machinery and mechanical appliances; parts thereof
Electrical machinery and equipment and parts thereof
Vehicles and parts and accessories thereof
-
30,000
60,000
90,000
120,000
150,000
2006 2007 2008 2009 2010 2011 2012 2013 2014 2015p
AU
D'0
00
Graph 10: Major source markets
Australia Fiji New Zealand

IMTS Release No. 01/2016 Page 6 of 17
b) Major destinations
Nauru’s major destinations from 2006 to 2015 were:
� For re-exports of fuel, Australia
� For phosphate, Australia, India, Iran, Japan, South Korea, New Zealand, Pakistan, Philippines, Taiwan
and Thailand.
Other than fuel and phosphate, exports from Nauru went to or through Australia, Fiji and New Zealand to
the final destination. Refer Graph 11 and commentary under performance of exports. Reference can also be
made to Table 6 in the Appendix.
c) Trade by Geographical Regions
Nauru’s export analysed by
Geographical Regions show Nauru
exports going to Asia and to or
through countries in Oceania to its
final destination.
For years from 2006 to 2013 Asia
dominated, because of high exports
of phosphate to South Korea. From
2014, because of a decline in exports
of phosphate to Asia, the trend
changed to Oceania now being the
main destination for Nauru’s
phosphate.
Nauru’s imports analysed by region
show Nauru importing from or
through Oceania only.
Reference can be made to Graph 13
and commentary under performance
of imports.
-
5,000
10,000
15,000
20,000
25,000
2006 2007 2008 2009 2010 2011 2012 2013 2014 2015p
AU
D'0
00
Graph 11: Major destination
Australia Fiji India Iran Japan South Korea
New Zealand Pakistan Philippines Taiwan Thailand
0
10,000
20,000
30,000
40,000
50,000
2006 2007 2008 2009 2010 2011 2012 2013 2014 2015p
AU
D'0
00
Grapph 12: Export by Regions
Asia Oceania
0
40,000
80,000
120,000
160,000
2006 2007 2008 2009 2010 2011 2012 2013 2014 2015p
AU
D'0
00
Grapph 13: Import by Regions
Oceania

IMTS Release No. 01/2016 Page 7 of 17
The following tables on IMTS are attached:
Table 1 Balance of trade – All items
Table 2 Imports by HS Sections
Table 3 Exports by HS Sections
Table 4 Re-exports by HS Sections
Table 5 Total exports by HS Sections
Table 6 Principal exports
Table 7 Principal imports
Table 8 Balance of trade by partner countries
Table 9 Trade by region
Press Release for 2016 will come out in June 2017.
For assistance please contact Mr Ramrakha Detenamo on email [email protected]
Mr Ipia D Gadabu
Director of Statistics

IMTS Release No. 01/2016 Page 8 of 17
Appendix 1: IMTS Tables
Table 1: BALANCE OF TRADE - ALL ITEMS (AUD)
Exports FOB Imports CIF Trade Balance
Period Exports Re-exports Total
Surplus (+) / Deficit (-)
2006 1,302 na 1,302 21,435 -20,133
2007 9,339 na 9,339 18,922 -9,583
2008 36,893 na 36,893 16,617 20,276
2009 11,564 na 11,564 30,927 -19,363
2010 34,361 na 34,361 13,867 20,494
2011 50,016 na 50,016 28,641 21,375
2012 68,934 916 69,850 38,399 31,451
2013 47,943 1,937 49,880 157,812 -107,932
2014 22,810 2,059 24,869 126,184 -101,315
2015p 11,882 6,207 18,089 124,165 -106,076
Notes:
Classification used: HS 2012 from 2012
Data source: Partner countries and Enterprises
The erratic movement in exports is due to phosphate
Data on re-exports are only available from 2012
Refer to Table 6 for reasons on the increase in imports from 2013.
p denotes provisional statistics
na denotes data not available

IMTS Release No. 01/2016 Page 9 of 17
Table 2: IMPORTS BY HS SECTIONS (AUD 000)
Notes:
Classification used: HS 2012 from 2012
Data source: Partner countries and Enterprises
Refer to Table 6 for reasons on the increase in imports from 2013.
p denotes provisional statistics
IMTS Release No. 01/2016 Page 10 of 17
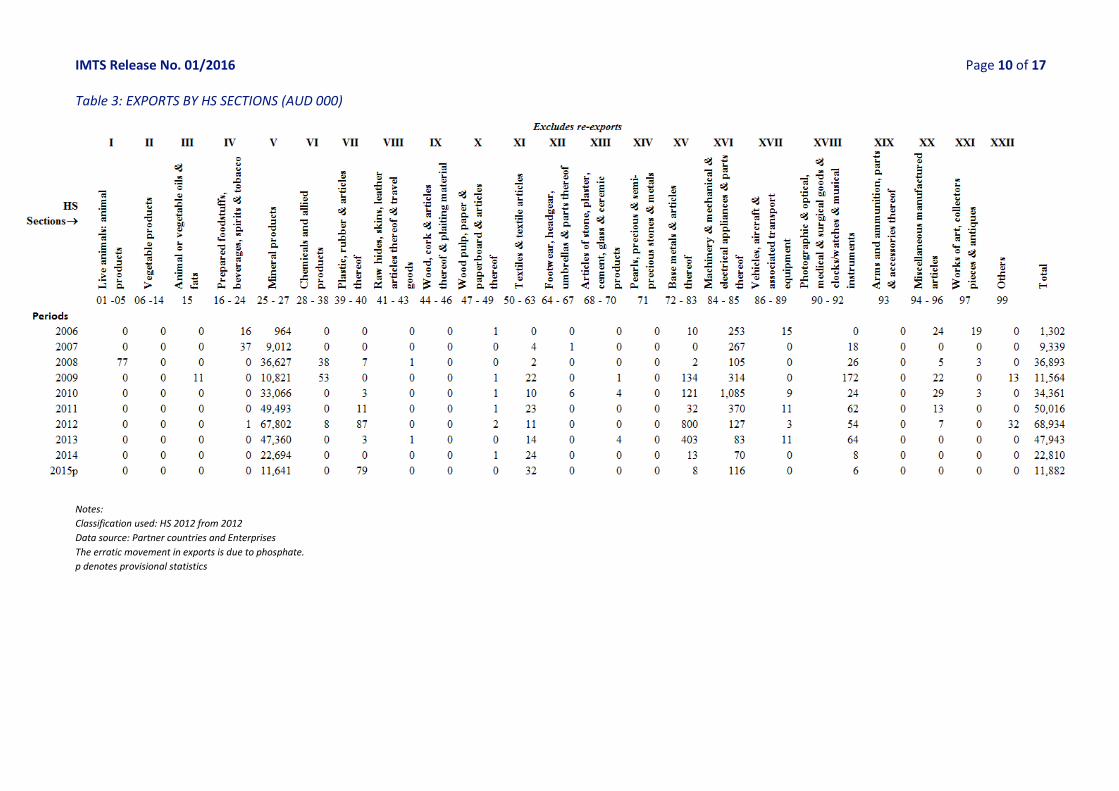
Table 3: EXPORTS BY HS SECTIONS (AUD 000)
Notes:
Classification used: HS 2012 from 2012
Data source: Partner countries and Enterprises
The erratic movement in exports is due to phosphate.
p denotes provisional statistics

IMTS Release No. 01/2016 Page 11 of 17
Table 4: RE-EXPORTS BY HS SECTIONS (AUD 000)
Notes:
Classification used: HS 2012 from 2012
Data source: Partner countries and Enterprises
Data on re-exports are only available from 2012
p denotes provisional statistics

IMTS Release No. 01/2016 Page 12 of 17
Table 5: TOTAL EXPORTS BY HS SECTIONS (AUD 000)
Notes:
Classification used: HS 2012 from 2012
Data source: Partner countries and Enterprises
p denotes provisional statistics

IMTS Release No. 01/2016 Page 13 of 17
Table 6: PRINCIPAL EXPORTS (AUD 000)
Commodity 2006 2007 2008 2009 2010 2011 2012 2013 2014 2015p
Exports
Phosphate 964 9,01
2
36,62
7
10,82
1
33,06
6
49,49
3
67,80
2
47,36
0
22,69
4 11,641
Other exports 338 327 266 743 1,295 523 1,132 583 116 241
TOTAL 1,30
2
9,33
9
36,89
3
11,56
4
34,36
1
50,01
6
68,93
4
47,94
3
22,81
0 11,882
Re-exports
Fuel na na na na na na 916 1,937 2,059 6,207
Others na na na na na na 0 0 0 0
TOTAL na na na na na na 916 1,937 2,059 2,781
Total exports and re-
exports
1,30
2
9,33
9
36,89
3
11,56
4
34,36
1
50,01
6
69,85
0
49,88
0
24,86
9 14,663
Notes:
Classification used: HS 2012 from 2012
Data source: Partner countries and Enterprises
The erratic movement in domestic exports is due to phosphate, which is the major commodity exported.
p denotes provisional statistics

IMTS Release No. 01/2016 Page 14 of 17
Table 7: PRINCIPAL IMPORTS (AUD 000)
Commodity 2006 2007 2008 2009 2010 2011 2012 2013 2014 2015p
All meat and edible meat offal fresh, chilled or frozen 952 652 843 970 996 476 589 4,254 4,372 5,573
Fish, crustaceans and molluscs fresh, chilled or frozen 0 15 30 33 33 58 22 158 789 379
Milk and cream whether or not concentrated or sweetened 105 23 144 96 148 119 291 623 1,238 822
Dairy products excl milk 146 38 37 8 12 94 182 491 873 766
Edible vegetables 97 87 71 85 85 164 326 1,317 1,747 586
Edible fruit and nuts fresh, chilled or dried; peel of citrus fruit or melons 23 15 23 43 37 98 196 1,070 1,520 479
Coffee, coffee husks etc, substitutes with coffee and tea whether or not
flavoured 87 66 30 12 0 7 4 358 1,797 299
Rice 0 0 0 19 167 223 321 399 165 118
Wheat or meslin flour and cereal flours 74 198 133 156 140 151 192 165 346 272
Grains, seeds (incl oil); copra; industrial and medicinal plants; straw and
fodder 7 22 3 5 2 153 281 168 131 5,484
Animal or vegetable fats & oils 93 16 15 19 64 29 62 27 115 143
Edible preparation of meat, fish, crustaceans etc 567 92 197 76 248 243 505 3,117 1,383 1,663
Sugar and sugar confectionery 94 241 234 189 272 257 103 308 421 283
Cocoa and cocoa preparations 20 2 8 0 13 59 124 387 299 82
Preparations of cereals, flour, starch or milk; pastry products e.g. bread,
cakes, wafers 70 74 114 184 391 416 392 1,012 2,758 736
Preparations of vegetables, fruits, nuts e.g. fruit juices, jam 47 45 83 14 99 93 136 330 647 211
Miscellaneous edible preparations e.g food preparation of flour or meal,
soups, ice cream 145 428 510 77 354 490 363 1241 3,322 492
Mineral and aerated waters including sweetened or flavoured 75 68 201 87 155 246 460 960 3,320 1,148
Beer made from malt 0 0 0 0 1 2 2 10 161 7
Spirit beverage 21 78 34 30 122 108 165 160 288 327
Residues and waste from the food industries; prepared animal fodder 9 21 54 71 8 102 294 150 235 189
Cigars, cigarettes and tobacco 488 422 55 637 678 1,202 131 1,242 1,973 1,264
Mineral products 76 148 46 52 52 58 113 413 226 296
Petroleum oils and oils obtained from bituminous minerals 865 979 3,364 184 1,184 6,568 5,488 11,897 27,283 923
Petroleum gases and other gaseous hydrocarbons 3 0 33 21 8 56 10 117 158 314
Pharmaceutical products 274 264 184 604 1068 752 1175 1,335 820 630
Paints and varnishes, painters' fillings, printing and writing ink 59 61 121 91 34 83 137 114 197 199
Essential oils and resinoids; perfumery, cosmetic and toilet preparations 110 67 20 48 16 83 63 267 1,231 76
Soap, organis surface active products, candles 67 109 53 79 95 48 59 386 730 175
Photographic or cinematographic goods 25 2 16 3 6 59 55 70 596 52
Miscellaneous chemical products e.g. insecticides, rodenticides, fungicides 69 35 64 36 65 68 177 150 573 170
Plastics and articles of plastic 113 125 61 161 166 345 580 2,012 2,027 1,762
Rubber and articles of rubber 61 122 654 128 218 444 278 389 497 217
Wood and articles of wood; wood charcoal 385 239 243 100 120 248 444 873 581 789
Paper and paperboard; articles of paper pulp, of paper or of paperboard 71 108 139 162 175 155 235 604 2,437 886
Articles of apparel and clothing accessories, 88 99 32 31 13 87 87 2,001 954 434
Footwear 32 31 3 62 11 18 63 52 412 49
Articles of stone, plaster, cement 16 52 45 18 13 50 44 15,976 1,432 1,414
Articles of iron or steel 384 207 975 273 371 783 428 1,946 1,634 945
Miscellaneous articles of base metal 78 25 49 49 28 67 151 211 252 5,930
Machinery and mechanical appliances; parts thereof 2,062 2,384 879 3,681 1,564 1,655 3,019 12,537 7,542 12,334
Electrical machinery and equipment and parts thereof 1354 968 753 971 608 613 1414 7,099 2,904 17,297
Vehicles and parts and accessories thereof 3,668 4,116 1,700 10,368 1,755 2,428 3,374 10,643 2,697 19,245
Boat and floating structures 0 41 0 0 17 9 707 7 417 39
Optical, photographic, cinematographic, measuring, checking, precision,
medical and apparatus; parts thereof 103 122 57 117 95 447 573 440 877 2,288
Prefabricated buildings 167 0 0 53 0 6 1,767 49,699 14,387 8,002
Miscellaneous manufactured articles excl prefabricated buildings 143 237 362 241 210 741 827 1,995 794 1,139
Other Imports 8,042 5,778 3,945 10,583 1,950 7,980 11,990 18,632 26,626 27,237
Total imports 21,435 18,922 16,617 30,927 13,867 28,641 38,399 157,812 126,184 124,165
Notes:
Classification used: HS 2012 from 2012 Data source: Partner countries and Enterprises
The unusual large Other Imports category contains special transactions e.g. donations/aid and commodities not classified according to trade nes.
Imports prior to 2013 were below AUD40,000. In 2013 the value of imports increased to AUD157,812, an increase of 311% when compared to
2012. Although imports in 2014 and 2015 registered declines when compared to 2013 and 2014 respectively, they were still more than
AUD100,000. The reason for the increase in 2013 and beyond is the construction activity in Nauru which led to increased imports of construction
materials, fuel, machinery and vehicles. Food and cigarette imports also show increases and this can be attributed to the presence of non-
resident construction workers and the presence of the Regional Processing Centre.
p denotes provisional statistics

IMTS Release No. 01/2016 Page 15 of 17
Table 8: BALANCE OF TRADE BY MAJOR PARTNER COUNTRIES (AUD 000)
COUNTRY 2006 2007 2008 2009 2010 2011 2012 2013 2014 2015p
Australia Exports 273 3,570 10,042 553 4,625 8,798 9,873 16,342 7,167 15,585
Imports 20,964 18,402 15,986 29,703 11,176 18,977 27,461 137,178 94,430 92,816
Balance -20,690 -14,832 -5,243 -29,150 -6,551 -10,179 -17,588 -120,836 -87,263 -77,231
Fiji Exports 22 1 - 6 - 7 112 9 2 11
Imports 395 350 545 1,059 2,051 9,218 9,668 17,465 30,448 30,845
Balance -373 -349 -545 -1,053 -2,051 -9,211 -9,556 -17,456 -30,446 -30,834
India Exports 504 694 6,884 6,829 3,568 5,210 14,980 3,017 6,615 -
Imports - - - - - - - - - -
Balance 504 694 6,884 6,829 3,568 5,210 14,980 3,017 6,615 -
Iran Exports - - - - 2,940 5,840 4,200 4,270 - -
Imports - - - - - - - - - -
Balance - - - - 2,940 5,840 4,200 4,270 - -
Japan Exports - - - - - - - - 1,817 2,490
Imports - - - - - - - - - -
Balance - - - - - - - - 1,817 2,490
South
Korea Exports 460 4,171 19,953 1,368 14,304 22,282 19,917 18,564 2,894 -
Imports - - - - - - - - - -
Balance 460 4,171 19,953 1,368 14,304 22,282 19,917 18,564 2,894 -
New
Zealand Exports 43 4 14 1,848 6,168 5,674 14,678 7,678 6,374 3
Imports 76 170 86 165 640 446 1,270 3,169 1,306 504
Balance -34 -166 -71 1,683 5,528 5,228 13,408 4,509 5,068 -501
Pakistan Exports - - - - 1,920 - - - - -
Imports - - - - - - - - - -
Balance - - - - 1,920 - - - - -
Philippines Exports - 899 - - - - - - - -
Imports - - - - - - - - - -
Balance - 899 - - - - - - - -
Taiwan Exports - - - - - - 3,190 - - -
Imports - - - - - - - - - -
Balance - - - - - - 3,190 - - -
Thailand Exports - - - 960 836 2,205 2,900 - - -
Imports - - - - - - - - - -
Balance - - - 960 836 2,205 2,900 - - -
TOTAL Exports 1,302 9,339 36,893 11,564 34,361 50,016 69,850 49,880 24,869 18,089
Imports 21,435 18,922 16,617 30,927 13,867 28,641 38,399 157,812 126,184 124,165
Balance -20,133 -9,583 20,276 -19,363 20,494 21,375 31,451 -107,932 -101,315 -106,076
Notes:
Classification used: HS 2012 from 2012
Data source: Partner countries and Enterprises
Since the source used is partner country data, the reporting by country of origin and country of destination does not hold true for this table
p denotes provisional statistics

IMTS Release No. 01/2016 Page 16 of 17
Table 9: TRADE BY REGION (AUD 000)
2006 2007 2008 2009 2010 2011 2012 2013 2014 2015p
Africa Exports 0 0 0 0 0 0 0 0 0 0
Imports 0 0 0 0 0 0 0 0 0 0
Balance 0 0 0 0 0 0 0 0 0 0
The Americas Exports 0 0 0 0 0 0 0 0 0 0
Imports 0 0 0 0 0 0 0 0 0 0
Balance 0 0 0 0 0 0 0 0 0 0
Asia Exports 964 5,764 26,837 9,157 23,568 35,537 45,188 25,851 11,326 2,490
Imports 0 0 0 0 0 0 0 0 0 0
Balance 964 5,764 26,837 9,157 23,568 35,537 45,188 25,851 11,326 2,490
Europe Exports 0 0 0 0 0 0 0 0 0 0
Imports 0 0 0 0 0 0 0 0 0 0
Balance 0 0 0 0 0 0 0 0 0 0
Oceania Exports 338 3,575 10,056 2,407 10,793 14,479 24,662 24,029 13,543 15,599
Imports 21,435 18,922 16,617 30,927 13,867 28,641 38,399 157,812 126,184 124,165
Balance -21,097 -15,347 -6,561 -28,520 -3,074 -14,162 -13,737 -133,783 -112,641 -108,566
TOTAL Exports 1,302 9,339 36,893 11,564 34,361 50,016 69,850 49,880 24,869 18,089
Imports 21,435 18,922 16,617 30,927 13,867 28,641 38,399 157,812 126,184 124,165
Balance -20,133 -9,583 20,276 19,363 20,494 21,375 31,451 -107,932 -101,315 -106,076
of which PICTs Exports 22 1 0 6 0 7 112 9 2 11
Imports 395 350 545 1,059 2,051 9,218 9,668 17,465 30,448 30,845
Balance -373 -349 -545 -1,053 -2,051 -9,211 -9,556 -17,456 -30,446 -30,834
Notes:
Classification used: HS 2012 from 2012
Data source: Partner countries and Enterprises
Since the source used is partner country data, the reporting by country of origin and country of destination does not hold true for this table
p denotes provisional statistics
IMTS Release No. 01/2016 Page 17 of 17
Appendix 2: Notes
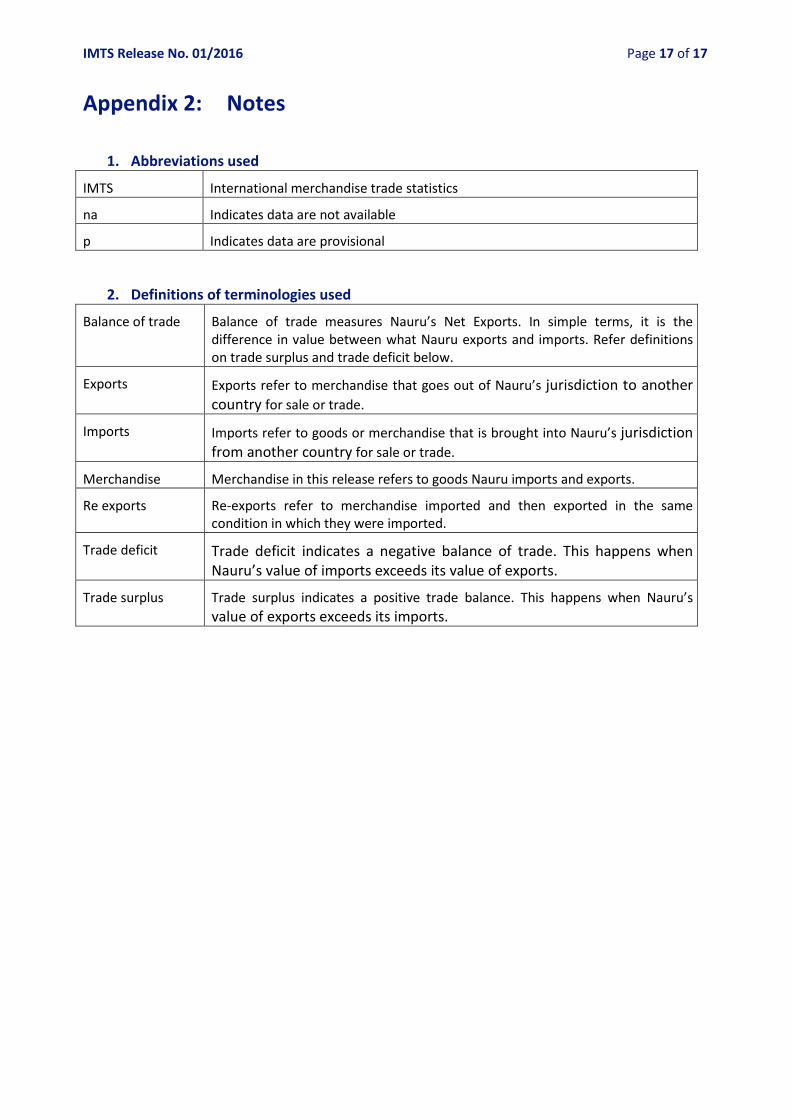
1. Abbreviations used
IMTS International merchandise trade statistics
na Indicates data are not available
p Indicates data are provisional
2. Definitions of terminologies used
Balance of trade Balance of trade measures Nauru’s Net Exports. In simple terms, it is the
difference in value between what Nauru exports and imports. Refer definitions
on trade surplus and trade deficit below.
Exports Exports refer to merchandise that goes out of Nauru’s jurisdiction to another
country for sale or trade.
Imports Imports refer to goods or merchandise that is brought into Nauru’s jurisdiction
from another country for sale or trade.
Merchandise Merchandise in this release refers to goods Nauru imports and exports.
Re exports Re-exports refer to merchandise imported and then exported in the same
condition in which they were imported.
Trade deficit Trade deficit indicates a negative balance of trade. This happens when
Nauru’s value of imports exceeds its value of exports.
Trade surplus Trade surplus indicates a positive trade balance. This happens when Nauru’s
value of exports exceeds its imports.