Annual Performance Report - DOL › sites › dolgov › files › legacy... · Most DOL employment...
49
U.S. DEPARTMENT OF LABOR FY 2017 ANNUAL PERFORMANCE REPORT
Transcript of Annual Performance Report - DOL › sites › dolgov › files › legacy... · Most DOL employment...

U.S. DEPARTMENT OF LABOR
FY 2017 ANNUAL PERFORMANCE REPORT

This page is intentionally left blank.

TABLE OF CONTENTS
Organization .................................................................................................................................... 1
Strategic Goal 1............................................................................................................................... 4 ETA Strategic Objective 1.1 ....................................................................................................... 4 VETS Strategic Objective 1.2 ..................................................................................................... 6 ODEP Strategic Objective 1.3 .................................................................................................... 8 BLS Strategic Objective 1.4 ....................................................................................................... 9 WB Strategic Objective 1.5 ...................................................................................................... 10
Strategic Goal 2............................................................................................................................. 12 OSHA Strategic Objective 2.1 .................................................................................................. 12 MSHA Strategic Objective 2.2 ................................................................................................. 14 WHD Strategic Objective 2.3 ................................................................................................... 16 EBSA Strategic Objective 2.4 ................................................................................................... 18 OFCCP Strategic Objective 2.5 ................................................................................................ 19 ILAB Strategic Objective 2.6 ................................................................................................... 20 OLMS Strategic Objective 2.7 .................................................................................................. 21
Strategic Goal 3............................................................................................................................. 23 OWCP Strategic Objective 3.1 ................................................................................................. 23 ETA Strategic Objective 3.2 ..................................................................................................... 25
Management Goal ......................................................................................................................... 28 OASAM Strategic Objective M.1 ............................................................................................. 28 OASAM Strategic Objective M.2 ............................................................................................. 29 OASAM Strategic Objective M.3 ............................................................................................. 30 OCFO Strategic Objective M.4................................................................................................. 31
Strategic Review ........................................................................................................................... 33
Other Information ......................................................................................................................... 42

This Report, as well as the Fiscal Year (FY) 2017 Agency Financial Report, can be found at http://www.dol.gov/dol/aboutdol/. If you have questions or comments regarding this Report, contact: Performance Management Center U.S. Department of Labor 200 Constitution Avenue, NW, Room S-3317 Washington, DC 20210 202-693-7120 All references to non-governmental companies or organizations, their services, products or resources in this report are offered for informational purposes and should not be construed as an endorsement by the Department of Labor of any of the companies or organizations, or their services, products or resources. The Department of Labor does not endorse, takes no responsibility for, and exercises no control over non-governmental organizations’ Web sites mentioned in this report, or their views or contents; nor does it vouch for the accuracy of the information contained on other organizations’ Web sites.

United States Department of Labor – 1 – FY 2017 Annual Performance Report
Organization
This report explains how DOL improves the lives of American workers through the management of its agencies and programs. It also satisfies the requirement of the Government Performance and Results Modernization Act of 2010 (GPRMA) to provide information on actual performance and progress in achieving goals identified in the Annual Performance Plan (APP). The Strategic Goal sections present results and plans organized by the structure laid out in the DOL FY 2018-2022 Strategic Plan (see http://www.dol.gov/dol/aboutdol/). As illustrated below, three Strategic Goals (Goal 1, etc.), one Management Goal, and eighteen Strategic and Management Objectives (1.1, etc. – each the responsibility of one DOL component agency) support realization of Secretary Acosta’s vision and achievement of DOL’s Mission. Measures and targets for FY 2017 were updated in the FY 2016 Annual Performance Report (APR), which was the Department’s FY 2018 Annual Performance Plan (APP). This FY 2017 Report serves as the FY 2019 APP, updates measures and targets for FY 2018, and establishes targets consistent with those reflected in the FY 2019 Congressional Budget Justification. Some measures are deleted or modified between reports. To present the most current information, this APR provides complete information for the budget year measures only – in this case, those retained or added in FY 2019 – including actual performance for the five preceding years, if available, plus targets for the most recent year, the current year, and the budget year. Strategic objective summary tables list applicable measures, targets, results, and status (whether or not results reached or exceed the target, indicated by Y or N). Where “baseline” appears in the target cell for new indicators, no data were available for establishing a numerical target. If results improved over the prior year but did not reach the target, “I” appears in the status cell. The last column identifies the level of success and plans to improve results.1
1 Some measures are “contextual,” i.e., they are important for management purposes but not for judging Agency performance. Contextual measures do not have targets, but they may have projections, which are marked in the target cell as [p]. Status (Y, N, or I) does not apply. Similarly, [r] indicates that results have been revised, and [e] means the results in that cell are estimated.

Organization
United States Department of Labor – 2 – FY 2017 Annual Performance Report
Vision: Helping American workers gain and hold good, safe jobs.
Mission: To foster, promote, and develop the welfare of the wage earners, job seekers, and retirees of the United States; improve working conditions; advance opportunities for profitable employment; and assure work-related benefits and rights.
Strategic Goal 1: Support the Ability of All Americans to Find Good Jobs 1.1 Create customer-focused workforce solutions for American workers.
1.2 Provide veterans, service members, and their spouses with resources and tools to gain and maintain employment.
1.3 Develop evidence-based policies, practices, and tools to foster a more inclusive workforce to increase quality employment opportunities for individuals with disabilities.
1.4 Provide timely, accurate, and relevant information on labor market activity, working conditions, and price changes in the economy.
1.5 Formulate policies and initiatives to promote the interests of working women.
Strategic Goal 2: Promote Safe Jobs and Fair Workplaces for All Americans 2.1 Secure safe and healthful working conditions for America’s workers.
2.2 Prevent fatalities, disease, and injury from mining and secure safe and healthful working conditions for America’s miners.
2.3 Secure lawful wages and working conditions for America’s workers.
2.4 Improve the security of retirement, health, and other workplace-related benefits for America’s workers and their families.
2.5 Promote fair and diverse workplaces for America’s federal contractor employees.
2.6 Promote a fair global playing field for American workers and businesses by effectively enforcing U.S. trade agreements and combating global child labor and modern slavery.
2.7 Promote union financial integrity, transparency, and democracy.
Strategic Goal 3: Administer Strong Workers’ Compensation and Benefits Programs 3.1 Provide workers’ compensation benefits for workers who are injured or become ill on the
job.
3.2 Support states’ timely and accurate benefit payments for unemployed workers.

Organization
United States Department of Labor – 3 – FY 2017 Annual Performance Report
Management Goal: Optimize the Department of Labor's Enterprise Services' Opportunities M.1 Improve human resources efficiency, effectiveness, and accountability.
M.2 Provide modern technology solutions that empower the DOL mission and serve the American public through collaboration and innovation.
M.3 Maximize DOL’s federal buying power through effective procurement management.
M.4 Safeguard fiscal integrity, and promote the effective and efficient use of resources.

United States Department of Labor – 4 – FY 2017 Annual Performance Report
Strategic Goal 1: Support the Ability of All Americans to Find Good Jobs
ETA Strategic Objective 1.1 – Create customer-focused workforce
solutions for American workers.
The Employment and Training Administration (ETA) oversees employment assistance, labor market information, and education through programs authorized by the Workforce Innovation and Opportunity Act of 2014 (WIOA) – for adults, dislocated workers, youth (including Job Corps), and targeted populations);2 Trade Adjustment Assistance (TAA) authorized by the Trade Act of 1974, as amended; Foreign Labor Certification activities authorized by the Immigration and Nationality Act; the Senior Community Service Employment Program authorized by the Older Americans Act; and Apprenticeship programs authorized by the National Apprenticeship Act. The public workforce system contributes to our nation’s global competitiveness and economic productivity by providing lifelong learning opportunities and a broad array of employment services. The workforce system provides critical services to a broad array of customers at all skill levels as well as provides services to employers. These services include career counseling, case management, assessments that identify transferable skills, and skill development. By testing and rigorously evaluating new ideas and approaches, ETA and the workforce system are committed to continuous improvement. ETA employment programs emphasize, through its funding, policy guidance and provision of technical assistance (TA) to the workforce system, skill development for job-seekers that leads to industry-recognized credentials as a means of increasing their earning potential. Beginning in July 2016,3 the WIA common measures were replaced by the six WIOA primary indicators of performance for the WIOA core programs: employment in the 2nd quarter after exit, employment in the 4th quarter after exit, median earnings in the 2nd quarter after exit, credential attainment, measurable skill gains, and effectiveness in serving employers. The Department is collecting two years of baseline data for each new WIOA primary indicator prior to setting targets. 2 WIOA supersedes the Workforce Investment Act of 1998 (WIA). 3 Most DOL employment programs are forward-funded and report performance on a Program Year (PY) that lags the Federal fiscal year by nine months (e.g., PY 2016 – July 1, 2016 to June 30, 2017). Exceptions that report on a standard fiscal year are the Apprenticeship program and the Trade Adjustment Assistance program.
Agency Priority Goal
Job Creation: Apprenticeship Expansion
Enroll 1 million new apprentices (including registered programs, industry-recognized apprenticeships, and other non-registered programs) over the next five years to enable more Americans to obtain jobs that pay a family-sustaining wage through high quality earn-and-learn opportunities. By Sept 30, 2019, DOL will enroll 280,000 new apprentices as part of the agency’s broader efforts to promote and expand apprenticeship. .

Strategic Goal 1
United States Department of Labor – 5 – FY 2017 Annual Performance Report
The Presidential Executive Order on Expanding Apprenticeships in America, signed June 15, 2017, states that “it shall be the policy of the Federal Government to provide more affordable pathways to secure, high paying jobs by promoting apprenticeships and effective workforce development programs, while easing the regulatory burden on such programs and reducing or eliminating taxpayer support for ineffective workforce development programs.” The Secretary has established a Priority Goal to support implementation of the Order to expand apprenticeships. Moreover, in order to close the skills gap and support a competitive workforce, he has instructed ETA to: 1) make apprenticeship a “go-to” and valued human capital solution to enable a larger number and variety of industries to hire skilled workers and upskill incumbent workers to meet their needs; and 2) advance modern work-based learning solutions to provide high quality alternatives to college for youths and adults. On April 18, 2017, President Trump signed Executive Order 13788, Buy American Hire American, emphasizing the importance of ensuring that American labor is hired to fill jobs. The President’s Order touches on three temporary worker programs for which the Department shares administrative or enforcement responsibilities: H-1B, H-2B, and H-2A. Within the “Hire American” directive, the Order calls on the Department to fully enforce the protections in the laws governing temporary worker visas and to prevent any abuse of these programs. Additionally, the President directed Federal agencies to review all nonimmigrant visa programs and propose new rules and guidance to eliminate fraud and abuse as part of his initiative to protect U.S. workers. A continuing challenge for the foreign labor certification programs has been balancing the quality review of applications while meeting statutory and regulatory processing timeframes in the context of shifting volumes and legislative changes. As a result of the significant increases in the filing of H-2B (temporary non-agricultural) applications in the first few weeks of Calendar Year 2016, only 25.5 percent of applications were resolved within 30 days before the date of need. In response, in FY 2017, ETA’s Office of Foreign Labor Certification (OFLC) implemented an Interoperability Plan designed to facilitate reassignment of staff to respond to shifts in application filing. As a result, timeliness of H-2B processing improved to 63.7 percent. ETA – Create customer-focused workforce solutions for American workers.
*Target reached (Y), Improved (I), or Not Reached (N)
FY/PY 2013
FY/PY 2014
FY/PY 2015
FY/PY 2016
FY/PY 2017
FY/PY 2018
FY/PY 2019
What Worked, What Didn't Work, and Program
Performance Improvement Plan
Number of Participants Engaged in Apprenticeship (OA/OWI/OJC)
Target -- -- -- -- -- Base TBD The Department issued guidance to encourage and increase engagement in Work-Based Learning and credential earning programs, including Apprenticeships. ETA will ensure the new programmatic funding stream expands, diversifies, and aligns the national apprenticeship system with workforce and education.
Result -- -- -- -- -- -- --
Status -- -- -- -- -- -- --

Strategic Goal 1
United States Department of Labor – 6 – FY 2017 Annual Performance Report
*Target reached (Y), Improved (I), or Not Reached (N)
FY/PY 2013
FY/PY 2014
FY/PY 2015
FY/PY 2016
FY/PY 2017
FY/PY 2018
FY/PY 2019
What Worked, What Didn't Work, and Program
Performance Improvement Plan
Percentage of participants engaged in work-based learning opportunities (OWI/OJC/OTAA/OA)
Target -- -- -- -- -- Base TBD
See above Result -- -- -- -- -- -- --
Status -- -- -- -- -- -- --
Percentage of participants earning credentials (OWI/OJC/OTAA/OA)
Target -- -- -- -- -- Base TBD
See above Result -- -- -- -- -- -- --
Status -- -- -- -- -- -- --
Percentage of program participants employed in the second quarter after exit (OWI/OJC/OTAA)
Target -- -- -- -- -- Base TBD ETA is currently collecting baseline data for this new WIOA measure.
Result -- -- -- -- -- -- --
Status -- -- -- -- -- -- --
Percent of H-2B Employer Applications Resolved 30 Days Before the date of need (OFLC)
Target -- -- -- Base 50.0% 60.0% 70.0% The OFLC NPC Interoperability Plan positively impacted case adjudications. OFLC addressed the January filing surge with improved processing, reducing delays and resulting in H-2B employers’ ability to hire workers more quickly. ETA will continue to adjust resources for CNPC during peak filing using transfers from the H-1B fee account and its interoperability staffing plan.
Result -- -- -- 25.5% [r] 63.7% -- --
Status -- -- -- -- Y -- --
Sources: Workforce Integrated Performance System (WIPS), Registered Apprenticeship Partners Information Data System (RAPIDS), and OFLC electronic Filing and Case Processing System
VETS Strategic Objective 1.2 – Provide veterans, service members, and their spouses with resources and tools to gain and maintain employment.
The Veterans’ Employment and Training Service (VETS) coordinates efforts to assist veterans seeking employment and employers seeking skilled workers – to provide America’s veterans better job opportunities. VETS administers several programs to meet the employment and education needs of veterans, transitioning service members, and eligible spouses. The Jobs for Veterans State Grants (JVSG) program provides funding to states for Disabled Veterans’ Outreach Program (DVOP) specialists and Local Veterans’ Employment Representative (LVER) staff. The Homeless Veterans’ Reintegration Program (HVRP) addresses one of the most vulnerable populations by reintegrating homeless veterans into society and the workforce. The Transition Assistance Program (TAP) Department of Labor Employment and Career Technical

Strategic Goal 1
United States Department of Labor – 7 – FY 2017 Annual Performance Report
Training Track (CTTT) workshops provide tools to support a successful transition from military to civilian employment. Pursuant to the Uniformed Services Employment and Reemployment Rights Act of 1994 (USERRA), VETS investigates complaints received from individuals who believe their employment or reemployment rights under USERRA were violated. DVOP specialists provide individualized career services to veterans with significant barriers to employment, transitioning service members, and to wounded, ill, or injured service members and their caretakers. VETS tracks the employment outcomes for those served by DVOP specialists, such as the employment rate in the second quarter after exit for veterans served by a DVOP specialist. This measure is newly defined by WIOA; in PY 2017-18, VETS will continue to collect baseline data. HVRP effectiveness is measured in part by the successful placement of homeless veterans into meaningful employment. VETS manages its USERRA investigations to ensure each complaint is appropriately investigated in terms of quality and timely completion. The quality of each case is determined by measuring how well VETS developed and investigated the allegations in each complaint. A sample of closed cases is reviewed quarterly; in FY 2017, 99 percent of the closed USERRA cases met VETS’ quality standard. VETS – Provide veterans, service members, and their spouses with resources and tools to gain and maintain employment.
*Target reached (Y), Improved (I), or Not Reached (N)
FY/PY 2013
FY/PY 2014
FY/PY 2015
FY/PY 2016
FY/PY 2017
FY/PY 2018
FY/PY 2019
What Worked, What Didn't Work, and Program
Performance Improvement Plan
Employment Rate (2nd quarter after exit) for veterans served by DVOP
Target -- -- -- Base Base Base TBD VETS is currently collecting baseline data for this new WIOA measure.
Result -- -- -- Base -- -- --
Status -- -- -- -- -- -- --
HVRP participant job placement rate
Target 67.0% 66.0% 65.0% 65.0% 65.0% 67.0% 67.0% Increasing the grant ceiling to $500,000 gives grantees more resources to deliver a higher quality of services to homeless veterans.
Result 64.8% 63.4% 68.7% 68.4% 66.0% -- --
Status N N Y Y Y -- --
Percent of Closed Cases Meeting the Agency's Quality Standard (Annual)
Target 84.0% 84.0% 92.0% 92.0% 95.0% 95.0% 95.0% VETS continues to improve and refine the quality of USERRA investigations. Case reviews have identified best practices, allowing the agency to put processes in place that ensure quality. In FY 2018, VETS’ compliance team will provide new guidance for an audit and review program that will use external teams to evaluate case quality.
Result 83.4% 91.5% 91.7% 95.5% 99.0% -- --
Status I Y I Y Y -- --
Sources: WIPS (Employment Rate measure), VETS-700 (HVRP Placement Rate measure), USERRA Information Management System (Closed Cases Quality measure)

Strategic Goal 1
United States Department of Labor – 8 – FY 2017 Annual Performance Report
ODEP Strategic Objective 1.3 – Develop evidence-based policies, practices, and tools to foster a more inclusive workforce to increase quality employment opportunities for individuals with disabilities.
The Office of Disability Employment Policy (ODEP) promotes policies and practices, coordinating with employers and all levels of government, to increase the number and quality of employment opportunities for individuals with disabilities. ODEP employs strategies to help employers meet their business objectives by fully integrating the skills and talents of job seekers and employees with disabilities. Additionally, ODEP uses data and evidence to promote the adoption and implementation of policy strategies and effective practices to increase the number and quality of job opportunities for people with disabilities. Based on research and evaluation, ODEP develops or identifies effective policy and practices, conducts outreach to share this critical information, and provides technical assistance to all levels of government and employers to aid them in adoption and implementation. In FY 2017, ODEP developed 43 policy outputs to assist state legislators with policy strategies for addressing disability employment in their respective states and issued 147 implementation tools to aid entities in adopting and implementing proven practices. ODEP – Develop evidence-based policies, practices, and tools to foster a more inclusive workforce to increase quality employment opportunities for individuals with disabilities.
*Target reached (Y), Improved (I), or Not Reached (N)
FY/PY 2013
FY/PY 2014
FY/PY 2015
FY/PY 2016
FY/PY 2017
FY/PY 2018
FY/PY 2019
What Worked, What Didn't Work, and Program
Performance Improvement Plan
Number of Policy Outputs
Target -- -- -- -- 23 64 64 ODEP's State Exchange on Employment and Disability (SEED) initiative is largely dependent upon state legislators and administrators adopting ODEP-generated policy. This process advanced at a more rapid pace than originally anticipated.
Result -- -- -- -- 43 -- --
Status -- -- -- -- Y -- --
Number of Implementation Tools
Target -- -- -- -- 117 70 70 ODEP leveraged partnerships with internal and external entities to address the increased demand for implementation tools by SEED and Employment First State Leadership Mentoring programs and, as a result, exceeded the original target.
Result -- -- -- -- 147 -- --
Status -- -- -- -- Y -- --
Sources: ODEP Data Management System

Strategic Goal 1
United States Department of Labor – 9 – FY 2017 Annual Performance Report
BLS Strategic Objective 1.4 – Provide timely, accurate, and relevant information on labor market activity, working conditions, and price
changes in the economy. The Bureau of Labor Statistics (BLS) is the principal federal statistical agency responsible for measuring labor market activity, working conditions, and price changes in the economy. Its mission is to collect, analyze, and disseminate some of the nation’s most sensitive and important economic data to support public and private decision-making. Like all federal statistical agencies, BLS executes its statistical mission with independence. BLS serves the general public, the U.S. Congress, DOL and other federal agencies, state and local governments, business, and labor by providing data products that are accurate, objective, relevant, timely, and accessible, and also provides technical assistance and consulting services. Policies and decisions based on BLS data affect virtually all Americans, and the wide range of BLS data products is necessary to fulfill the diverse needs of a broad customer base. BLS is committed to maintaining the highest level of scientific integrity in producing official statistics. BLS complies with the Statistical Policy Directives and the Standards and Information Quality Guidelines from OMB, as well as the National Research Council’s Principles and Practices for a Federal Statistical Agency. Together, these form the foundation for achieving and maintaining scientific integrity within and among the principal statistical agencies. BLS also conforms to the conceptual framework of the Interagency Council on Statistical Policy’s (ICSP) Guidelines for Reporting Performance by Statistical Agencies and the “Strengthening Federal Statistics” chapter of the Analytical Perspectives volume in the President’s Budget. BLS reports the full cost to produce its data products. BLS also measures accuracy, timeliness, relevance, dissemination, and mission achievement. These six criteria are common among statistical agencies because they represent critical aspects of a statistical program’s performance. Using these common concepts as a basis for measuring and reporting on statistical agency outcomes helps inform decision-makers more consistently about the performance of statistical agencies. BLS – Provide timely, accurate, and relevant information on labor market activity, working conditions, and price changes in the economy.
*Target reached (Y), Improved (I), or Not Reached (N)
FY/PY 2013
FY/PY 2014
FY/PY 2015
FY/PY 2016
FY/PY 2017
FY/PY 2018
FY/PY 2019
What Worked, What Didn't Work, and Program
Performance Improvement Plan
Percentage of timeliness targets achieved for the Principal Federal Economic Indicators (PFEIs)
Target -- 100% 100% 100% 100% 100% 100%
N/A Result 100% 100% 100% 100% 100% -- --
Status -- Y Y Y Y -- --
Percentage of accuracy targets achieved for the PFEIs
Target -- 100% 100% 100% 100% 100% 100%
N/A Result 100% 95% 100% 100% 100% -- --
Status -- N Y Y Y -- --

Strategic Goal 1
United States Department of Labor – 10 – FY 2017 Annual Performance Report
*Target reached (Y), Improved (I), or Not Reached (N)
FY/PY 2013
FY/PY 2014
FY/PY 2015
FY/PY 2016
FY/PY 2017
FY/PY 2018
FY/PY 2019
What Worked, What Didn't Work, and Program
Performance Improvement Plan
Percentage of relevance targets achieved for the PFEIs
Target -- 100% 100% 100% 100% 100% 100%
N/A Result 100% 100% 100% 100% 100% -- --
Status -- Y Y Y Y -- --
Average number of BLS website page views each month (Dissemination)
Target -- Base 17,400,000 17,000,000 16,400,000 15,600,000 15,600,000 In FY 2018, BLS will continue work on redesigning the website to ensure that BLS data products are readily accessible to its customers through the Internet and to meet users’ needs.
Result -- 17,423,845 16,965,254 16,324,885 15,514,973 -- --
Status -- -- N N N -- --
Customer satisfaction with the BLS website through the ForeSee Experience Index (Mission Achievement)
Target 75 77 77 75 76 76 76 BLS missed its target due to a 13 percent decrease in respondents to the FXI survey and lower scores particularly in the areas of content, functionality, look and feel, and navigation. Using these results to improve the website, BLS has begun to introduce new web page designs intended to improve user experience and is planning various search and navigation features and improvements.
Result 77 77 75 76 75 -- --
Status Y Y N Y N -- --
Sources: For most cross-cutting measures, internal BLS documents. For the Mission Achievement measure, the E-Government Satisfaction Index 2017 E-Gov Scores Q3: http://www.foresee.com/assets/Q3_2017_eGov_Commentary.pdf
Notes: 1/ BLS revised its performance framework in 2014. Cross-cutting measures were new beginning in FY 2014. The FY 2013 results are shown for trend-comparison purposes. 2/ In FY 2015, BLS replaced its dissemination measure due to a change in software. The FY 2014 result is shown for trend comparison purposes. 3/ In FY 2017, the E-Government Satisfaction Index (EGSI) was renamed to the ForeSee Experience Index (FXI). FXI Score is calculated on a 100 point scale.
WB Strategic Objective 1.5 – Formulate policies and initiatives to promote the interests of working women.
The Women’s Bureau (WB) conducts research to formulate practices and policies aimed at increasing economic and employment opportunities and advancement for the 74 million working women and their families in the U.S. WB identifies trends, data gaps, policy and programmatic needs, and strategic mechanisms to safeguard the interest of working women. These efforts allow WB to inform and educate individuals and organizations at the local, state, and national levels about the issues facing women in the labor force.

Strategic Goal 1
United States Department of Labor – 11 – FY 2017 Annual Performance Report
In FY 2017, WB exceeded its target for the number of policy and research deliverables, producing a total of 21 issue briefs, research papers, and other resources containing labor force statistics on working women and information on their employment rights, including state-level requirements, and federal and state-level equal pay protections. WB will improve the scope and comprehensiveness of all products and add detailed data and input from a broad array of stakeholders. WB – Formulate policies and initiatives to promote the interests of working women.
*Target reached (Y), Improved (I), or Not Reached (N)
FY/PY 2013
FY/PY 2014
FY/PY 2015
FY/PY 2016
FY/PY 2017
FY/PY 2018
FY/PY 2019
What Worked, What Didn't Work, and Program
Performance Improvement Plan
Number of Policy & Research Deliverables
Target 3 20 18 20 18 6 5 WB improved the presentation of economic and employment data on its website to allow a more individualized, interactive user experience through the application of filters. WB found that Web site traffic increased. WB will work with other agencies and parts of DOL to focus its work on the highest priority issues in FY 2018.
Result 3 21 20 21 21 -- --
Status Y Y Y Y Y -- --
Sources: WB quarterly productivity reports

United States Department of Labor – 12 – FY 2017 Annual Performance Report
Strategic Goal 2: Promote Safe jobs and Fair Workplaces for All Americans
OSHA Strategic Objective 2.1 – Secure safe and healthful working
conditions for America’s workers.
The Occupational Safety and Health Administration (OSHA) was established by the Occupational Safety and Health Act of 1970 with the mission to ensure employers provide American workers safe and healthful working conditions. OSHA ensures the safety and health of America’s workers by setting and enforcing workplace safety and health standards; delivering effective enforcement; providing training, outreach, and education; and encouraging continual improvement in workplace safety and health. Through these efforts, OSHA aims to reduce the number of worker illnesses, injuries, and fatalities and contribute to DOL’s broader goals of promoting the competitiveness of our nation’s workforce. OSHA’s compliance officers strategically prioritize enforcement resources to target high hazard industries and irresponsible employers. Corporate Wide Settlement Agreements (CSAs) and the Severe Violator Enforcement Program (SVEP) are additional tools OSHA uses to target establishments which require improvement across a number of locations. OSHA met its previous Agency Priority Goal (APG) of increasing the number of abated workplace hazards in FY 2017. Moving forward, OSHA’s new APG is to increase trenching4and excavation hazards abated by 10 percent compared to FY 2017, through inspections and compliance assistance at workplaces covered by OSHA. OSHA seeks to reduce injuries and fatalities by targeting workplaces where there are potential trenching/excavation hazards for inspections as well as outreach. OSHA will work with industry associations and the public utilities who hire a significant portion of the work to create a public-private effort to impact these fatalities. Increased inspection activity focusing on trenching/excavation hazards should result in fewer injuries and fatalities – the ultimate outcome for DOL and American workers. Safety training is a critical piece of OSHA’s strategic effort to prevent workplace fatalities, injuries, and illnesses. OSHA conducts training programs at the OSHA Training Institute (OTI), administers the OTI Education Centers Program, and administers the Outreach Training Program. In FY 2017, preliminary data shows OSHA provided training for 1,024,431 individuals. The Voluntary Protection Program (VPP) is another important component of OSHA’s compliance assistance activities. This program recognizes employers and workers who 4 A trench is defined as a narrow excavation (in relation to its length) made below the surface of the ground. In general, the depth of a trench is greater than its width, but the width of a trench (measured at the bottom) is not greater than 15 feet (4.6 m).
Agency Priority Goal
Worker Safety: Reduce Trenching and Excavation Hazards
By September 30, 2019, increase trenching and excavation hazards abated by 10 percent compared to FY 2017, through inspections and compliance assistance at workplaces covered by OSHA.

Strategic Goal 2
United States Department of Labor – 13 – FY 2017 Annual Performance Report
have implemented effective safety and health management systems and who maintain below-average injury and illness rates in their respective industries. The program also brings OSHA and employers together to cooperatively and proactively prevent future fatalities, injuries, and illnesses. In FY 2017, preliminary data indicates OSHA completed 264 VPP approvals and re-approvals. OSHA also administers and enforces twenty-two whistleblower protection statutes that protect workers who experience retaliation for reporting violations of the law. Principally, this includes Section 11(c) of the Occupational Safety and Health Act (OSH Act), which prohibits employers from retaliating against employees who bring workplace hazards to the attention of the employer or the Agency. The additional twenty-one whistleblower protection provisions protect workers in a variety of industries who speak out against unsafe and/or unlawful behavior, including violations of transportation, consumer protection, or financial reform laws. In FY 2017, OSHA completed 3,348 whistleblower investigations, awarding more than $29 million to complainants including 82 reinstatements. OSHA – Secure safe and healthful working conditions for America’s workers.
*Target reached (Y), Improved (I), or Not Reached (N)
FY/PY 2013
FY/PY 2014
FY/PY 2015
FY/PY 2016
FY/PY 2017
FY/PY 2018
FY/PY 2019
What Worked, What Didn't Work, and Program
Performance Improvement Plan
Number of hazards abated associated with trenching and excavation
Target -- -- -- -- -- -- -- OSHA will work with industry associations and public utilities to impact these fatalities and focus its inspection resources in this area.
Result -- -- -- -- -- -- --
Status -- -- -- -- -- -- --
Result -- -- 9,328 7,964 8,032 [e] -- --
Status -- -- -- -- -- -- --
Number of people trained by OSHA5
Target -- -- -- -- -- 934,270 1,208,728 OSHA external training programs contributed to the high numbers.
Result -- -- 997,708 1,046,580 1,024,431[e] -- --
Status -- -- -- -- -- -- --
New VPP Approvals
Target -- -- -- -- 59 95 155 OSHA split its previously combined measure for VPP-approvals and re-approvals into two measures to better understand the program’s reach.
Result -- -- -- -- 72 -- --
Status -- -- -- -- Y -- --
VPP Re-Approvals
Target -- -- -- -- 232 285 395
See New VPP Approvals. Result -- -- -- -- 255 -- --
Status -- -- -- -- Y -- --
5 All result data from the Directorate of Training and Education (DTE). FY 19 target includes people trained through OSHA cooperative programs and compliance assistance.

Strategic Goal 2
United States Department of Labor – 14 – FY 2017 Annual Performance Report
*Target reached (Y), Improved (I), or Not Reached (N)
FY/PY 2013
FY/PY 2014
FY/PY 2015
FY/PY 2016
FY/PY 2017
FY/PY 2018
FY/PY 2019
What Worked, What Didn't Work, and Program
Performance Improvement Plan
Whistleblower investigations completed6
Target 2,654 2,900 3,050 3,200 2,900 2,725 2,655 OSHA will continue efforts to strengthen and prioritize caseload management; use Alternative Dispute Resolution; streamline investigative process; and utilize core measures for monitoring timeliness and trends.
Result 3,083 3,146 3,273 3,307 3,348 -- --
Status Y Y Y Y Y -- --
Sources: OSHA Information System (OIS) and Integrated Management Information System (IMIS)
MSHA Strategic Objective 2.2 – Prevent fatalities, disease, and injury
from mining and secure safe and healthful working conditions for America’s miners.
The Mine Safety and Health Administration (MSHA) protects the safety and health of the nation’s miners through enforcement of the Federal Mine Safety and Health Act of 1977 (Mine Act), as amended by the Mine Improvement and New Emergency Response Act of 2006 (MINER Act). The mission of MSHA is to prevent death, disease, and injury from mining and to promote safe and healthful workplaces for the nation’s miners. MSHA’s mission is carried out through the promulgation and enforcement of mandatory safety and health standards; mandated inspections which require four complete inspections annually at active underground mines and two complete inspections annually at active surface mines; miner training; and technical compliance assistance activities. In order to prevent miner deaths, operators must have in place effective safety and health programs that are constantly evaluated to identify and eliminate mine hazards, and that provide training for all mining personnel. MSHA has undertaken a number of measures to prevent mining deaths: increased monitoring and strategic enforcement through targeted inspections at mines with identified problem areas; a Pattern of Violations (POV) program; special initiatives such as focusing on inexperienced miner and miners working alone; and outreach efforts such as "Safety Pro in a Box," which provides guidance to the metal/nonmetal mining industry on best practices and compliance responsibilities.
6 All result data from the Directorate of Whistleblower Protection Programs (DWPP)
Agency Priority Goal
Worker Safety: Reduce Miner Injuries
By September 30, 2019, reduce the reportable injury rate associated with powered haulage equipment, the primary cause of miners’ injuries, by 10 percent per year based on a rolling 5-year average per 200,000 hours worked.
Strategic Goal 2
United States Department of Labor – 15 – FY 2017 Annual Performance Report
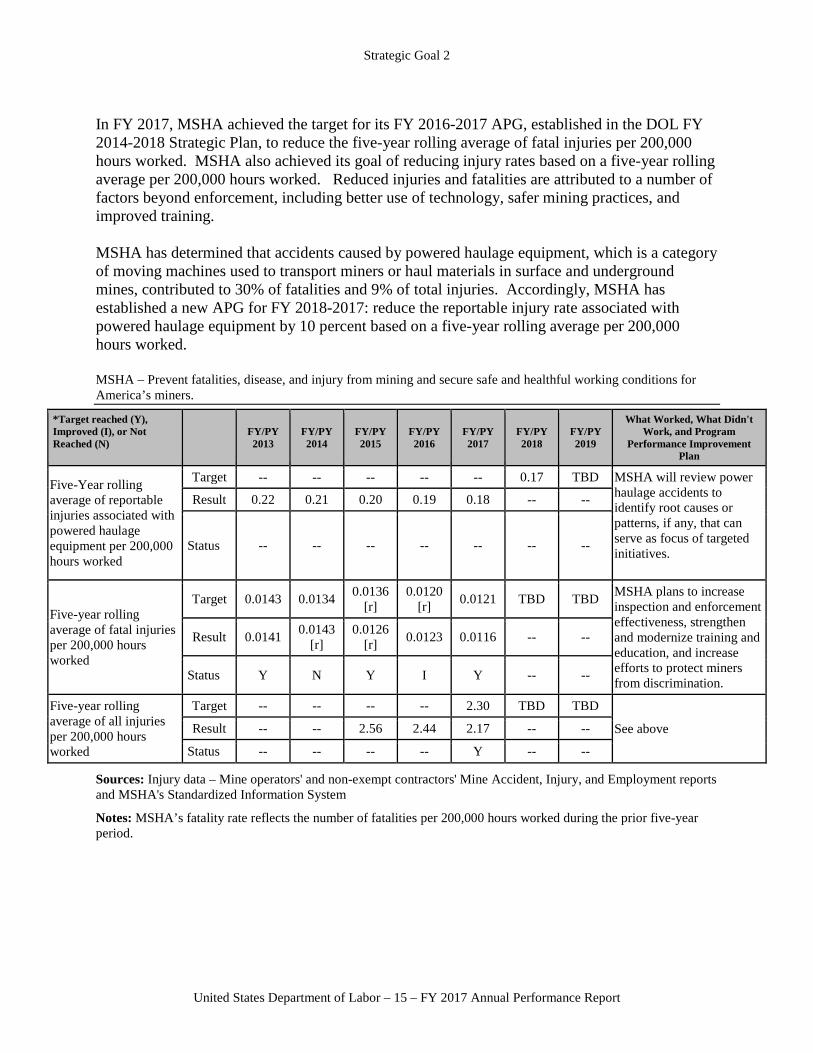
In FY 2017, MSHA achieved the target for its FY 2016-2017 APG, established in the DOL FY 2014-2018 Strategic Plan, to reduce the five-year rolling average of fatal injuries per 200,000 hours worked. MSHA also achieved its goal of reducing injury rates based on a five-year rolling average per 200,000 hours worked. Reduced injuries and fatalities are attributed to a number of factors beyond enforcement, including better use of technology, safer mining practices, and improved training. MSHA has determined that accidents caused by powered haulage equipment, which is a category of moving machines used to transport miners or haul materials in surface and underground mines, contributed to 30% of fatalities and 9% of total injuries. Accordingly, MSHA has established a new APG for FY 2018-2017: reduce the reportable injury rate associated with powered haulage equipment by 10 percent based on a five-year rolling average per 200,000 hours worked. MSHA – Prevent fatalities, disease, and injury from mining and secure safe and healthful working conditions for America’s miners.
*Target reached (Y), Improved (I), or Not Reached (N)
FY/PY 2013
FY/PY 2014
FY/PY 2015
FY/PY 2016
FY/PY 2017
FY/PY 2018
FY/PY 2019
What Worked, What Didn't Work, and Program
Performance Improvement Plan
Five-Year rolling average of reportable injuries associated with powered haulage equipment per 200,000 hours worked
Target -- -- -- -- -- 0.17 TBD MSHA will review power haulage accidents to identify root causes or patterns, if any, that can serve as focus of targeted initiatives.
Result 0.22 0.21 0.20 0.19 0.18 -- --
Status -- -- -- -- -- -- --
Five-year rolling average of fatal injuries per 200,000 hours worked
Target 0.0143 0.0134 0.0136 [r]
0.0120 [r] 0.0121 TBD TBD MSHA plans to increase
inspection and enforcement effectiveness, strengthen and modernize training and education, and increase efforts to protect miners from discrimination.
Result 0.0141 0.0143 [r]
0.0126 [r] 0.0123 0.0116 -- --
Status Y N Y I Y -- --
Five-year rolling average of all injuries per 200,000 hours worked
Target -- -- -- -- 2.30 TBD TBD
See above Result -- -- 2.56 2.44 2.17 -- --
Status -- -- -- -- Y -- --
Sources: Injury data – Mine operators' and non-exempt contractors' Mine Accident, Injury, and Employment reports and MSHA's Standardized Information System
Notes: MSHA’s fatality rate reflects the number of fatalities per 200,000 hours worked during the prior five-year period.

Strategic Goal 2
United States Department of Labor – 16 – FY 2017 Annual Performance Report
WHD Strategic Objective 2.3 – Secure lawful wages and working conditions for America’s workers.
WHD is responsible for administering and enforcing laws that establish the minimum standards for wages and working conditions. WHD enforces and administers the minimum wage, overtime, and child labor provisions of the Fair Labor Standards Act; the prevailing wage requirements and wage determination provisions of the Davis Bacon Act and Related Acts, Service Contract Act, Contract Work Hours and Safety Standards Act, Walsh-Healey Act, and Copeland Act; the wages and working conditions under the Migrant and Seasonal Agricultural Worker Protection Act; the Family and Medical Leave Act; and the Employee Polygraph Protection Act. WHD also enforces the field sanitation and temporary labor camp standards in agriculture and certain employment standards and worker protections of the Immigration and Nationality Act. Collectively, these labor standards cover most private, state, and local government employment. They protect over 135 million of America’s workers in more than 7.3 million establishments throughout the U.S. and its territories. WHD prioritizes resources by using an evidence-based, multi-pronged approach to improve compliance, including compliance assistance to employers; investigations in high-violation industries; engagement and education of private and public stakeholders; and the use of media, including social media. WHD focuses on (1) prioritizing industries with the greatest compliance problems, and (2) developing strategies that impact compliance. In FY 2017, WHD successfully increased its results for Percent of Agency-Initiated Investigations, reaching the highest percentage (51 percent) in recent history while also increasing its result in the Number of Compliance Actions. Data show that agency-initiated investigations and the strategic use of enforcement resources have achieved positive results for low-wage workers and result in greater compliance. In FY 2017, WHD also succeeded in realizing the lowest no-violation rates in recent history for both Percent of Agency-Initiated No Violation Investigations and Percent of Complaint No Violation Investigations, at 14 and 15 percent, respectively. The no-violation rates indicate that WHD is selecting effective criteria to identify employers that are, in fact, in violation. These results show that the difference between complaint and agency-initiated investigations is insignificant, with WHD agency-initiated investigations as accurate as complaint investigations in identifying employers with violations. The FY 2017 result in Percent of All Investigations in Priority Industries increased to 78 percent. This measure reflects WHD’s commitment to prioritizing enforcement resources in those industries with the most serious violations. Increasing the percentage of agency-initiated investigations, and prioritizing complaints, has increased the agency’s presence in industries that have a history of violations. In FY 2018, to reflect its commitment to compliance assistance, WHD will begin to track and report the number of outreach hours spent in compliance assistance. The goal is to increase impact through direct engagement with industry leaders and more modern compliance assistance methods.

Strategic Goal 2
United States Department of Labor – 17 – FY 2017 Annual Performance Report
WHD – Secure lawful wages and working conditions for America’s workers.
*Target reached (Y), Improved (I), or Not Reached (N)
FY/PY 2013
FY/PY 2014
FY/PY 2015
FY/PY 2016
FY/PY 2017
FY/PY 2018
FY/PY 2019
What Worked, What Didn't Work, and Program
Performance Improvement Plan
Number of Outreach Hours to Employers
Target -- -- -- -- -- Base TBD WHD will employ modern techniques that allow for a customer-centric focus and iterative product development through customer engagement.
Result -- -- -- -- -- -- --
Status -- -- -- -- -- -- --
Number of compliance actions
Target 34,231 33,635 30,500 30,500 30,500 29,500 29,500 WHD prioritizes complaints and agency-initiated compliance actions in areas with high violations. This measure does not account for differences in complexity between cases. WHD will experiment with internal measures that account for the complexity of investigations.
Result 33,146 29,483 27,915 28,589 28,771 -- --
Status N N N I I -- --
Percent of agency-initiated investigations (excludes conciliations)
Target 38% 40% 43% 45% 46% 46% 46% WHD prioritizes complaints and conducts more agency-initiated investigations in priority industries. WHD needs to continue evolving internal coordination, communication, and planning to maximize the impact of these investigations. WHD is focusing on using more nuanced data and data analytics to find and remedy the most severe and systemic violations and to ensure that investigations have greater impact.
Result 44% 44% 42% 46% 51% -- --
Status Y Y N Y Y -- --
Percent of agency-initiated no violation cases
Target 23% 22% 25% 24% 21% 21% 21% No violation rates provide limited insight into the severity of violations. WHD will be developing severity indices and associated performance measures to ensure that WHD finds the most severe and systemic violations.
Result 26% 22% 21% 19% 14% -- --
Status I Y Y Y Y -- --

Strategic Goal 2
United States Department of Labor – 18 – FY 2017 Annual Performance Report
*Target reached (Y), Improved (I), or Not Reached (N)
FY/PY 2013
FY/PY 2014
FY/PY 2015
FY/PY 2016
FY/PY 2017
FY/PY 2018
FY/PY 2019
What Worked, What Didn't Work, and Program
Performance Improvement Plan
Percent of complaint no violation cases
Target 22% 20% 21% 21% 21% 21% 21% WHD is screening complaints effectively and finding violations.
Result 21% 19% 18% 16% 15% -- --
Status Y Y Y Y Y -- --
Percent of all investigations in priority industries (excludes conciliations)
Target 75% 76% 74% 75% 75% 75% 75% WHD commits its resources in industries with evidence of violations. WHD will update the priority industries framework and associated measures to ensure that WHD is conducting investigations in industries with the most severe violations.
Result 75% 73% 74% 75% 78% -- --
Status Y N Y Y Y -- --
Sources: Wage and Hour Investigative Support and Reporting Database (WHISARD)
EBSA Strategic Objective 2.4 – Improve the security of retirement, health, and other workplace-related benefits for America’s workers and
their families.
The Employee Benefits Security Administration (EBSA) is charged with protecting more than 150 million workers, retirees and their families who are covered by nearly 694,000 private retirement plans, 2.2 million health plans, and similar numbers of other welfare benefit plans. Together, these plans hold estimated assets of $9.3 trillion. EBSA employs a comprehensive, integrated approach encompassing programs for enforcement, compliance assistance, interpretive guidance, legislation, and research. In FY 2017, the agency recovered over $1.1 billion for direct payment to plans, participants and beneficiaries. EBSA’s enforcement program seeks to detect and correct violations that result in monetary recoveries for employee benefit plans, participants and beneficiaries or in other corrective remedies including, but not limited to, significant broad-based reforms for large plans or common service providers. In FY 2015, EBSA replaced its cases closed measures with measures that track investigation timeliness. These measures have ensured the effective management of newly opened cases. EBSA focused its FY 2017 enforcement resources on National Enforcement Projects and the Major Case Enforcement Priority. The Major Case Enforcement Priority concentrates a significant portion of the agency’s enforcement resources on those cases likely to have the greatest impact on the protection of plan assets and participants’ benefits. In FY 2018, EBSA has introduced measures to evaluate the efficiency and effectiveness of investigative time.

Strategic Goal 2
United States Department of Labor – 19 – FY 2017 Annual Performance Report
EBSA – Improve the security of retirement, health, and other workplace-related benefits for America’s workers and their families.
*Target reached (Y), Improved (I), or Not Reached (N)
FY/PY 2013
FY/PY 2014
FY/PY 2015
FY/PY 2016
FY/PY 2017
FY/PY 2018
FY/PY 2019
What Worked, What Didn't Work, and Program
Performance Improvement Plan
Major Case Monetary Recoveries per Major Case Staff Day
Target -- -- -- -- -- $16,936 TBD Major Cases are an organizational priority because of their greater impact on the number of plan participants and enforcement efforts.
Result -- -- -- -- -- -- --
Status -- -- -- -- -- -- --
Monetary Recoveries on Major Cases Closed per Staff Day
Target -- -- -- -- -- $30,737 TBD
See above Result -- -- -- -- -- -- --
Status -- -- -- -- -- -- --
Percent of Delinquent Employee Contribution, Abandoned Plan, Bonding, Health-Part 7 Violation, and other Reporting and Disclosure Non-Fiduciary Breach Cases Closed or Referred for Litigation in the fiscal year within 18 Months of Case Opening
Target -- -- 71% 69% 70% 70% 70%
Both civil and criminal investigations exhibited greater efficiencies than expected.
Result -- -- 71% 76% 89% -- --
Status -- -- Y Y Y -- --
Sources: Enforcement Management System
Notes: The first and second measures are new efficiency and effectiveness measures. As these measures utilize rolling averages (that include the current year), the targets will be developed on an annual basis. The first and second measures are new efficiency and effectiveness measures. As these measures utilize rolling averages (that include the current year), the targets will be developed on an annual basis.
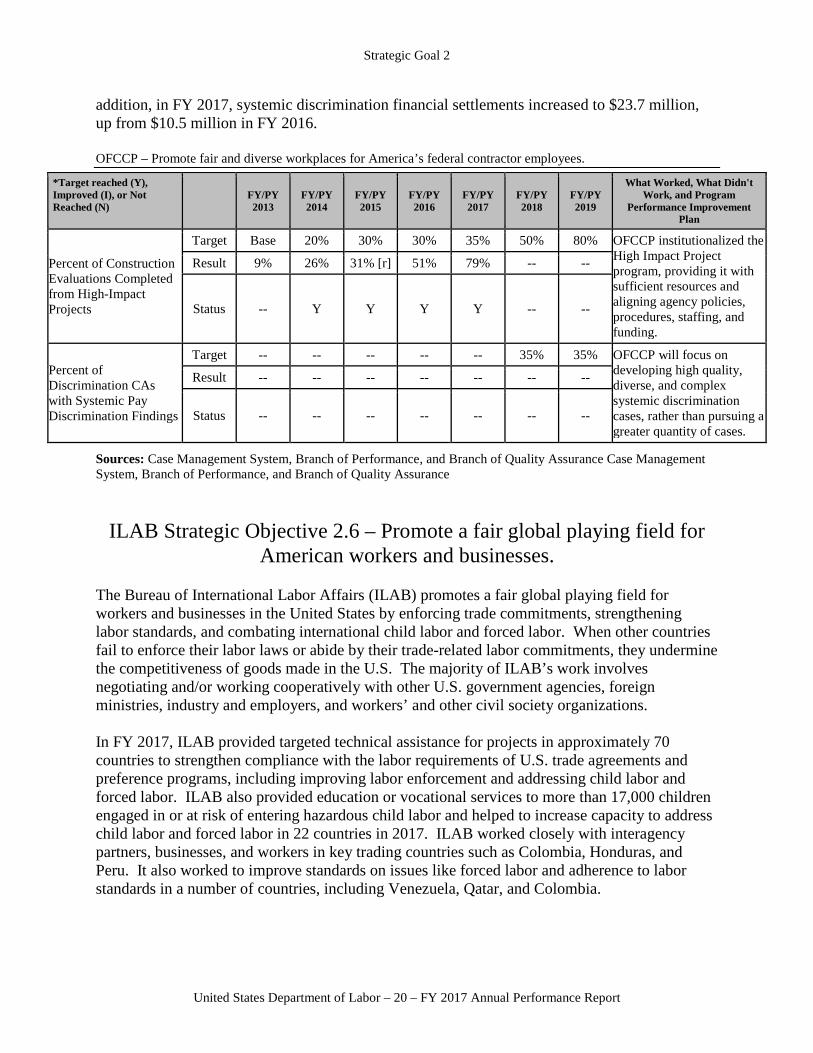
OFCCP Strategic Objective 2.5 – Promote fair and diverse workplaces for America’s federal contractor employees.
The Office of Federal Contract Compliance Programs (OFCCP) requires that employers that do business with the Federal Government comply with contractual equal employment opportunity and affirmative action requirements to ensure a fair and diverse workplace, free of discrimination and harassment. OFCCP recognizes the importance of striking a balance between its enforcement efforts and compliance assistance activity. The agency is strengthening contractor engagement through the use of additional compliance resources, tools, and national training. In FY 2017, OFCCP used its High-Impact Construction Project strategy to focus on construction projects that reach a greater number of Federal contractor and subcontractor workers. These and other strategies make OFCCP more efficient. At the end of FY 2017, OFCCP continued to achieve its quality targets with 93 percent of cases concluding without major deficiencies. In
Strategic Goal 2
United States Department of Labor – 20 – FY 2017 Annual Performance Report
addition, in FY 2017, systemic discrimination financial settlements increased to $23.7 million, up from $10.5 million in FY 2016. OFCCP – Promote fair and diverse workplaces for America’s federal contractor employees.
*Target reached (Y), Improved (I), or Not Reached (N)
FY/PY 2013
FY/PY 2014
FY/PY 2015
FY/PY 2016
FY/PY 2017
FY/PY 2018
FY/PY 2019
What Worked, What Didn't Work, and Program
Performance Improvement Plan
Percent of Construction Evaluations Completed from High-Impact Projects
Target Base 20% 30% 30% 35% 50% 80% OFCCP institutionalized the High Impact Project program, providing it with sufficient resources and aligning agency policies, procedures, staffing, and funding.
Result 9% 26% 31% [r] 51% 79% -- --
Status -- Y Y Y Y -- --
Percent of Discrimination CAs with Systemic Pay Discrimination Findings
Target -- -- -- -- -- 35% 35% OFCCP will focus on developing high quality, diverse, and complex systemic discrimination cases, rather than pursuing a greater quantity of cases.
Result -- -- -- -- -- -- --
Status -- -- -- -- -- -- --
Sources: Case Management System, Branch of Performance, and Branch of Quality Assurance Case Management System, Branch of Performance, and Branch of Quality Assurance
ILAB Strategic Objective 2.6 – Promote a fair global playing field for American workers and businesses.
The Bureau of International Labor Affairs (ILAB) promotes a fair global playing field for workers and businesses in the United States by enforcing trade commitments, strengthening labor standards, and combating international child labor and forced labor. When other countries fail to enforce their labor laws or abide by their trade-related labor commitments, they undermine the competitiveness of goods made in the U.S. The majority of ILAB’s work involves negotiating and/or working cooperatively with other U.S. government agencies, foreign ministries, industry and employers, and workers’ and other civil society organizations. In FY 2017, ILAB provided targeted technical assistance for projects in approximately 70 countries to strengthen compliance with the labor requirements of U.S. trade agreements and preference programs, including improving labor enforcement and addressing child labor and forced labor. ILAB also provided education or vocational services to more than 17,000 children engaged in or at risk of entering hazardous child labor and helped to increase capacity to address child labor and forced labor in 22 countries in 2017. ILAB worked closely with interagency partners, businesses, and workers in key trading countries such as Colombia, Honduras, and Peru. It also worked to improve standards on issues like forced labor and adherence to labor standards in a number of countries, including Venezuela, Qatar, and Colombia.

Strategic Goal 2
United States Department of Labor – 21 – FY 2017 Annual Performance Report
ILAB – Promote a fair global playing field for American workers and businesses.
*Target reached (Y), Improved (I), or Not Reached (N)
FY/PY 2013
FY/PY 2014
FY/PY 2015
FY/PY 2016
FY/PY 2017
FY/PY 2018
FY/PY 2019
What Worked, What Didn't Work, and Program
Performance Improvement Plan
Number of countries in which child labor and forced labor are systematically monitored and analyzed.
Target 155 150 144 156 142 140 140 ILAB will continue to engage its stakeholders on the issue of child labor and build relationships with foreign governments.
Result 157 150 152 159 156 -- --
Status Y Y Y Y Y -- --
Sources: Administrative records and ILAB’s annual Trade and Development Act Report
OLMS Strategic Objective 2.7 – Promote union financial integrity,
transparency, and democracy.
The Office of Labor-Management Standards (OLMS) administers the Labor-Management Reporting and Disclosure Act of 1959, as amended (LMRDA), and related laws. These laws primarily establish safeguards for union democracy and union financial integrity and require public disclosure reporting by unions, union officers, union employees, employers, labor consultants and surety companies. Timely resolution of election complaints accelerates restoration of democratic voice and a democratically operated union. In FY 2017, OLMS averaged under 65 days elapsed per case – an improvement of almost three days from FY 2016. OLMS continues to fine-tune methods for further reducing its elapsed days including use of a team-based approach for handling election cases (when resources permit) and engaging in early-involvement with the Office of the Solicitor in cases that may result in litigation. The FY 2018 target balances the changes OLMS can make to its processes with outside factors that can affect resolution of these types of cases, such as cooperation from the unions being investigated. OLMS’ investments in new technology and outreach to facilitate electronic filing of union financial reports led to continued progress as 58.0 percent of all filings were submitted electronically – almost eight percentage points higher than FY 2016. A new rule that requires electronic filing of the Form LM-3 and LM-4 reports for fiscal years beginning on or after January 2, 2017, should maintain this trend in FY 2018 and beyond.

Strategic Goal 2
United States Department of Labor – 22 – FY 2017 Annual Performance Report
OLMS – Promote union financial integrity, transparency, and democracy.
*Target reached (Y), Improved (I), or Not Reached (N)
FY/PY 2013
FY/PY 2014
FY/PY 2015
FY/PY 2016
FY/PY 2017
FY/PY 2018
FY/PY 2019
What Worked, What Didn't Work, and Program
Performance Improvement Plan
Average number of days to resolve union officer election complaints
Target 75.0 74.0 73.0 72.0 71.0 70.0 69.0 OLMS worked with the Office of the Solicitor (SOL) to streamline cross-agency communications. OLMS plans to increase early case involvement through its partnership with SOL.
Result 71.0 72.3 70.2 67.4 64.7 -- --
Status Y Y Y Y Y -- --
Percent of disclosure reports filed electronically
Target 34.5% 38.5% 44.5% 46.0% 48.0% 60.0% 70.0% OLMS successfully implemented outreach and education through seminars and the Voluntary Compliance Partnership (VCP) program. Unions that e-file but revert to paper still represent a challenge. Also, only 4 of 12 forms are available for e-filing. OLMS will continue to focus on paper filers through outreach and training. In FY18, OLMS is implementing regulations that will require electronic filing for LM-3 and LM-4 filers.
Result 42.4% 45.0% 49.0% 50.1% 58.0% -- --
Status Y Y Y Y Y -- --
Sources: Office of Labor-Management Standards electronic Labor Organization Reporting System (e.LORS) and internal data tracked by the OLMS Division of Enforcement.

United States Department of Labor – 23 – FY 2017 Annual Performance Report
Strategic Goal 3: Administer Strong Workers’ Compensation and Benefits Programs
OWCP Strategic Objective 3.1 – Provide workers’ compensation
benefits for workers who are injured or become ill on the job.
The role of the Office of Workers’ Compensation Programs (OWCP) is to provide workers’ compensation benefits for workers injured or ill on the job. OWCP implements four statutory federal workers’ compensation programs providing monetary, medical, and return-to-work benefits for work-related injuries and illnesses to federal employees, coal mine workers, nuclear weapons workers, longshore and harbor workers, contractors serving overseas, and certain other designated employee groups. The agency adjudicates claims, administers the benefit funds authorized for these purposes, and provides oversight of claims resolutions by responsible parties. In FY 2018, OWCP will continue development of the OWCP Workers’ Compensation System (OWCS), an integrated claims processing and management system for all four programs. OWCP expects the Longshore program to begin testing OWCS by the end of 2018. In FY 2018, the Federal Employees’ Compensation Act (FECA) program will focus on its new APG of reducing the overuse and rate of new opioid addictions by limiting the supply and duration of new opioid prescriptions to only what is appropriate and necessary. A major aspect of the Longshore program focuses on ensuring first payment of benefits are timely. The percentage of first payments of compensation issued for non-Defense Base Act (DBA) cases within 30 days from the date disability begins increased from 85 percent in FY 2012 to 88 percent in FY 2017. The Black Lung program has focused on maximizing productivity and managing pending claims. The implementation of prototype performance standards for claims examiners in FY 2017 led to increased productivity and a reduction in the pending claims inventory by nine percent between FY 2016 and FY 2017. The Energy program works closely with the Department of Energy, the Department of Justice, the Social Security Administration (SSA), and the National Institute for Occupational Safety and Health (NIOSH) to issue claim decisions.
Agency Priority Goal
Combat the Opioid Epidemic
By September 30, 2019, reduce the percentage of initial opioid prescriptions and duration of new opioid prescriptions for federal employees with work-related injuries by 30 percent from the FY 2016 baseline.

Strategic Goal 3
United States Department of Labor – 24 – FY 2017 Annual Performance Report
OWCP – Provide workers' compensation benefits for workers who are injured or become ill on the job. *Target reached (Y), Improved (I), or Not Reached (N)
FY/PY 2013
FY/PY 2014
FY/PY 2015
FY/PY 2016
FY/PY 2017
FY/PY 2018
FY/PY 2019
What Worked, What Didn't Work, and Program
Performance Improvement Plan
Percentage decrease in initial opioid prescriptions and duration of new opioid prescriptions for federal employees with work-related injuries
Target -- -- -- -- -- 4% 10% In FY 2018, OWCP will establish a Prescription Management Unit to review Letters of Medical Necessity written by the claimant’s physician prior to the authorization of certain opioid prescriptions.
Result -- -- -- -- -- -- --
Status -- -- -- -- -- -- --
Percent of First Payment of Compensation issued within 30 days: non-Defense Base Act cases
Target 85% 85% 85% 86% 86% 87% 87% OWCP held quarterly performance review meetings with insurance industry leaders to review performance and inform process improvements. Limitations imposed by the Longshore Case Management System (LCMS) make capturing data for non-routine cases difficult. In FY 2018, OWCP policy examiners will continue to review cases every quarter and go over them with the employers/carriers to identify opportunities to improve the notification process.
Result 87% 87% 88% 89% 88% -- --
Status Y Y Y Y Y -- --
Percent of Black Lung claims over 365 days in pending Proposed Decision and Order (PDO) inventory
Target -- -- -- -- -- 18% 15% The introduction of prototype standards for claims examiners (CEs) focused staff on managing the aged claims. The age and size of the pending claim inventory decreased. Although progress was made on reducing the aged claims inventory, OWCP was unable to eliminate the entire backlog. OWCP will increase production requirements in prototype standards for CEs, and re-engineer business processes to increase productivity and manage the pending claim inventory.
Result -- -- -- -- -- -- --
Status -- -- -- -- -- -- --
Strategic Goal 3
United States Department of Labor – 25 – FY 2017 Annual Performance Report
*Target reached (Y), Improved (I), or Not Reached (N)
FY/PY 2013
FY/PY 2014
FY/PY 2015
FY/PY 2016
FY/PY 2017
FY/PY 2018
FY/PY 2019
What Worked, What Didn't Work, and Program
Performance Improvement Plan
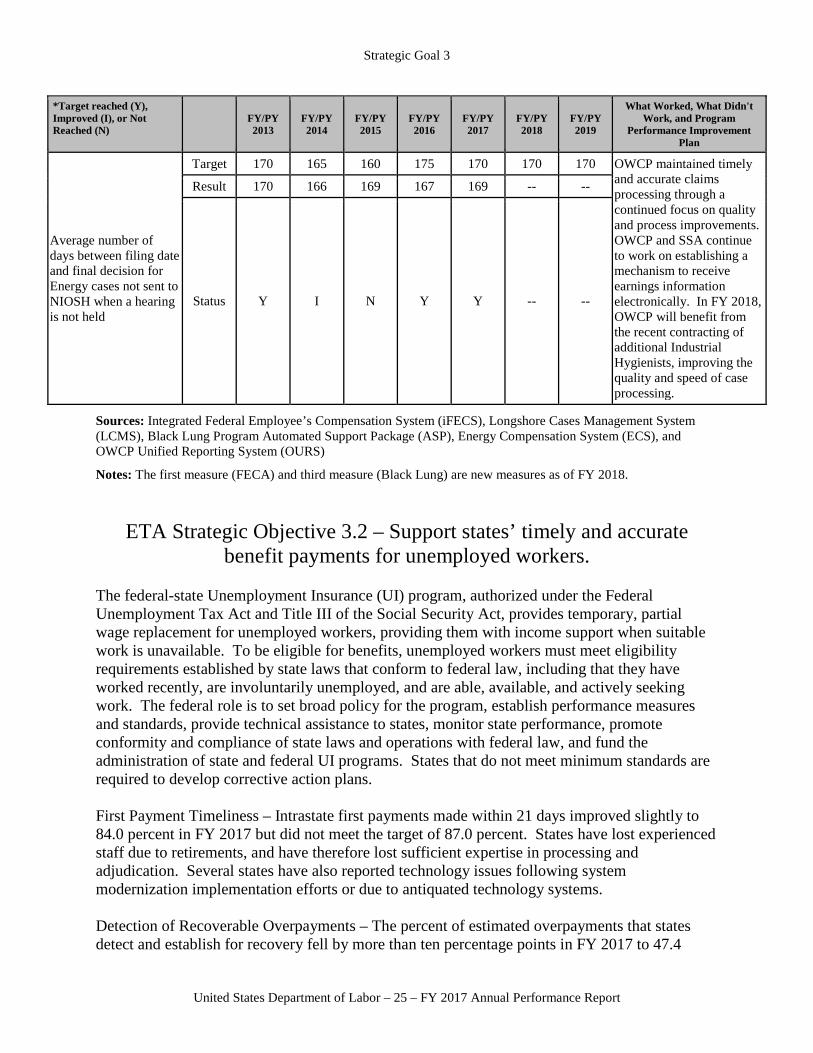
Average number of days between filing date and final decision for Energy cases not sent to NIOSH when a hearing is not held
Target 170 165 160 175 170 170 170 OWCP maintained timely and accurate claims processing through a continued focus on quality and process improvements. OWCP and SSA continue to work on establishing a mechanism to receive earnings information electronically. In FY 2018, OWCP will benefit from the recent contracting of additional Industrial Hygienists, improving the quality and speed of case processing.
Result 170 166 169 167 169 -- --
Status Y I N Y Y -- --
Sources: Integrated Federal Employee’s Compensation System (iFECS), Longshore Cases Management System (LCMS), Black Lung Program Automated Support Package (ASP), Energy Compensation System (ECS), and OWCP Unified Reporting System (OURS)
Notes: The first measure (FECA) and third measure (Black Lung) are new measures as of FY 2018.
ETA Strategic Objective 3.2 – Support states’ timely and accurate
benefit payments for unemployed workers. The federal-state Unemployment Insurance (UI) program, authorized under the Federal Unemployment Tax Act and Title III of the Social Security Act, provides temporary, partial wage replacement for unemployed workers, providing them with income support when suitable work is unavailable. To be eligible for benefits, unemployed workers must meet eligibility requirements established by state laws that conform to federal law, including that they have worked recently, are involuntarily unemployed, and are able, available, and actively seeking work. The federal role is to set broad policy for the program, establish performance measures and standards, provide technical assistance to states, monitor state performance, promote conformity and compliance of state laws and operations with federal law, and fund the administration of state and federal UI programs. States that do not meet minimum standards are required to develop corrective action plans. First Payment Timeliness – Intrastate first payments made within 21 days improved slightly to 84.0 percent in FY 2017 but did not meet the target of 87.0 percent. States have lost experienced staff due to retirements, and have therefore lost sufficient expertise in processing and adjudication. Several states have also reported technology issues following system modernization implementation efforts or due to antiquated technology systems.
Detection of Recoverable Overpayments – The percent of estimated overpayments that states detect and establish for recovery fell by more than ten percentage points in FY 2017 to 47.4

Strategic Goal 3
United States Department of Labor – 26 – FY 2017 Annual Performance Report
percent (vs. the target of 61.4 percent) for many of the same reasons cited for the drop in first payment timeliness. ETA has a comprehensive strategic plan to prevent, reduce and recover improper payments that includes identifying states with high improper payment rates for targeted technical assistance ETA estimates that the UI improper payment rate will increase in FY 2018 to 13.75 percent. The increase, in part, is tied to work search requirements that are a condition of UI eligibility. Structural issues, which are in place for policy reasons, include the requirement for certain due process steps before stopping payment of benefits. ETA – Support states' timely and accurate benefit payments for unemployed workers.
*Target reached (Y), Improved (I), or Not Reached (N)
FY/PY 2013
FY/PY 2014
FY/PY 2015
FY/PY 2016
FY/PY 2017
FY/PY 2018
FY/PY 2019
What Worked, What Didn't Work, and Program
Performance Improvement Plan
First Payment Timeliness (Unemployment Insurance)
Target 87.1% 87.1% 87.5% 87.5% 87.0% 87.0% 87.0% 36 states exceeded the target in FY 2017, six more than in FY 2016. States not meeting the target were required to establish a corrective action plan. Five states are receiving quarterly technical assistance as a result of being “At-Risk” under this measure.
Result 80.6% [r]
79.3% [r]
83.3% [r] 84.1% 84.0%
[e] -- --
Status N N I I N -- --
Detection of Recoverable Overpayments (Unemployment Insurance)
Target 51.8% 54.2% 55.3% 67.9% 61.4% 61.9% 61.9% Performance decreased in FY 2017 when two large states were not able to report data, and 16 of those states that did not meet the target were below the UI Performs minimum criteria of 50%. ETA will continue to provide enhanced oversight to “High Priority” states related to program integrity. Additionally, all states have access to tools and information to improve this measure through the UI Integrity Center.
Result 60.9% 67.1% 61.2% 57.5% 47.4% [e] -- --
Status Y Y Y N N -- --

Strategic Goal 3
United States Department of Labor – 27 – FY 2017 Annual Performance Report
*Target reached (Y), Improved (I), or Not Reached (N)
FY/PY 2013
FY/PY 2014
FY/PY 2015
FY/PY 2016
FY/PY 2017
FY/PY 2018
FY/PY 2019
What Worked, What Didn't Work, and Program
Performance Improvement Plan
Improper Payment Rate (Unemployment Insurance)
Target -- -- 11.34% 10.63% 11.55% 13.75% TBD ETA and states worked extensively to meet the IP rate target, with 22 states meeting the target. Certain factors prevented the Department from meeting the target, such as legal operational requirements to make payments when due. ETA will continue to help states implement core strategies; annually provide enhanced oversight to High Priority states; and offer the UI Integrity Center as a resource for states.
Result -- 11.57% 10.73% 11.65% 12.50%[e] -- --
Status -- -- Y N N -- --
Sources: First Payment Timeliness: ETA 9050 and 9050p reports; Detection of Recoverable Overpayments: Benefit Accuracy Measurement (BAM) survey and ETA 227 report.

United States Department of Labor – 28 – FY 2017 Annual Performance Report
Management Goal: Optimize the Department of Labor's Enterprise Services' Opportunities
OASAM Strategic Objective M.1 – Improve human resources
efficiency, effectiveness, and accountability. The Office of the Assistant Secretary for Administration and Management’s (OASAM) Human Resources Center (HRC) provides leadership, guidance, and technical expertise on all human capital areas to the Department. The Director of HRC serves as the Department’s Chief Human Capital Officer (CHCO). HRC oversees accountability reviews and implements accountability processes to improve HR efficiency, effectiveness and compliance with laws and regulations. OASAM will implement a shared services model for the delivery of DOL HR services. A realigned HR service delivery model will improve strategic human capital planning; create greater consistency in the delivery of HR products and services across the Department; reduce overall HR costs; gain efficiency in HR service delivery through economies of scale; and improve efficiency and effectiveness of HR service delivery. The implementation of an effective shared services solution for HR service delivery will permit DOL program agencies to focus time and resources on mission-oriented outcomes. Specifically, HRC will improve hiring outcomes and reduce burden on hiring managers particularly for mission critical positions.
Agency Priority Goal
Administration: Implement an Enterprise-Wide Shared Services Model
By September 30, 2019, begin implementation of an enterprise-wide shared services model for DOL core administrative functions.

Management Goal
United States Department of Labor – 29 – FY 2017 Annual Performance Report
OASAM – Improve human resources efficiency, effectiveness, and accountability. *Target reached (Y), Improved (I), or Not Reached (N)
FY/PY 2013
FY/PY 2014
FY/PY 2015
FY/PY 2016
FY/PY 2017
FY/PY 2018
FY/PY 2019
What Worked, What Didn't Work, and Program
Performance Improvement Plan
Average number of days to hire a new employee
Target 80.0 80.0 80.0 80.0 80.0 80.0 80.0 DOL instituted a policy requiring the use of Subject Matter Experts (SMEs) during the recruitment process. However, the hiring exemption process, implemented in response to the hiring freeze, added time to the hiring process. The hiring of Pathways Recent Graduates also required additional coordination. To better manage Departmental hiring, DOL plans to implement standardized recruitment plans and develop a hiring inventory tracker.
Result 75.2 86.2 91.7 108.3 108.5 -- --
Status Y N N N N -- --
Strategic Human Capital Planning: Hiring Manager Satisfaction Index Score on the (CHCO) Manager Survey
Target -- -- -- -- 80% 80% 80%
See above. Result -- -- -- 71% 78% -- --
Status -- -- -- -- I -- --
Sources: Department of Labor Online Opportunities Recruitment System; Office of Personnel Management's Chief Human Capital Officers' Managers' Satisfaction Survey
OASAM Strategic Objective M.2 – Provide modern technology solutions that empower the DOL mission and serve the American public
through collaboration and innovation. The Office of the Assistant Secretary for Administration and Management’s (OASAM) Office of the Chief Information Officer (OCIO) provides information technology leadership, products, and support for DOL. OCIO plays a critical leadership role in driving reforms in systems development, better managing technology spending, and succeeding in achieving real, measurable improvements in mission performance. OCIO provides guidance to the Department in support of government-wide directives for capital planning, IT security, information management, and enterprise architecture. OASAM will implement a shared service model for DOL IT services, products and support that leverages economies of scale, adheres to federal standards and requirements, ensures greater CIO oversight, and provides an enhanced customer experience. An IT shared services solution will allow DOL agencies and programs to operate more effectively and efficiently,

Management Goal
United States Department of Labor – 30 – FY 2017 Annual Performance Report
and focus their resources on advancing DOL’s mission. OCIO will also begin creating a common environment for the enterprise platform, including standards, processes, and governance. By leveraging a common platform, DOL will eliminate redundancies and move towards automation, increased accessibility, and enhanced security. OASAM – Provide modern technology solutions that empower the DOL mission and serve the American public through collaboration and innovation.
*Target reached (Y), Improved (I), or Not Reached (N)
FY/PY 2013
FY/PY 2014
FY/PY 2015
FY/PY 2016
FY/PY 2017
FY/PY 2018
FY/PY 2019
What Worked, What Didn't Work, and Program
Performance Improvement Plan
Enterprise Services: Percent of network and application services uptime
Target 99.00% 99.00% 99.00% 99.00% 99.00% 99.00% 99.00% DOL continues to deploy an enterprise-wide technology refresh to update/replace end of life network infrastructure equipment. DOL continues to add redundancy to mission critical systems. DOL will also consolidate and standardize equipment, process, policy, and procedures.
Result 99.98% 99.80% 99.90% 99.68% 99.86% -- --
Status Y Y Y Y Y -- --
Sources: SolarWinds (LAN); Verizon Reporting (WAN)
OASAM Strategic Objective M.3 – Maximize DOL’s federal buying power through effective procurement management.
The Office of the Assistant Secretary for Administration and Management’s (OASAM) Business Operations Center (BOC), Office of the Chief Procurement Officer (OCPO) provides leadership, guidance, and oversight of all procurement policy and services. OASAM will implement a shared services model for the delivery of DOL procurement services. By centralizing procurement functions, DOL will achieve economies of scale; gain managerial oversight and efficiencies to more rapidly implement government-wide procurement directives; enforce procurement legislation, regulation, and policies; and strategically plan customer demands. An effective shared services solution for departmental procurement services will allow DOL program agencies to focus their resources on program delivery and mission outcomes. OCPO will leverage the government’s buying power, making it possible to obtain significant reductions in the price of goods and receive better services at lower costs. OCPO will leverage government-wide buying vehicles produced by OMB’s FSSI and Category Management Initiatives. OCPO will also provide and promote DOL-wide procurement vehicles, reducing redundancy in procurement vehicles for the same services and gaining cost savings with DOL buying power. OCPO will baseline the number of DOL enterprise-wide procurement vehicles in FY 2018 and set an FY 2019 target after receiving baseline data. OCPO will execute plans to increase the use

Management Goal
United States Department of Labor – 31 – FY 2017 Annual Performance Report
of contract solutions designated as “Best In Class” (BIC) and government-wide solutions to save money, avoid wasteful and redundant contracting actions, and free up acquisition staff to accelerate procurements for high-priority mission work. In FY 2018, OCPO will establish a goal of increased spending through BIC designated contract solutions by 35%. OASAM – Maximize DOL's federal buying power through effective procurement management
*Target reached (Y), Improved (I), or Not Reached (N)
FY/PY 2013
FY/PY 2014
FY/PY 2015
FY/PY 2016
FY/PY 2017
FY/PY 2018
FY/PY 2019
What Worked, What Didn't Work, and Program
Performance Improvement Plan
Number of DOL enterprise-wide procurement vehicles
Target -- -- -- -- -- Base TBD DOL will engage programs in FY 2018 to identify their additional needs and then tailor enterprise-wide solutions appropriately.
Result -- -- -- -- -- -- --
Status -- -- -- -- -- -- --
Percentage increase in spending through Best-in-Class (BIC) solutions
Target -- -- -- -- -- 35.00% TBD DOL will execute plans to increase use of contract solutions designated as “Best In Class” (BIC) to save money and avoid wasteful and redundant contracting actions.
Result -- -- -- -- -- -- --
Status -- -- -- -- -- -- --
Sources: Acquisition Management System; Federal Procurement Data System- Next Generation
OCFO Strategic Objective M.4 – Safeguard fiscal integrity, and promote the effective and efficient use of resources.
The Office of the Chief Financial Officer (OCFO) provides financial management leadership, direction, and guidance to the Office of the Secretary of Labor and all DOL program agencies on matters arising from financial statutes, as appropriate. OCFO oversees DOL-wide accounting, financial management, the budget process, and financial system, and leads the Department’s annual audit of the Consolidated Financial Statements. Accurate and timely financial information demonstrates DOL’s accountability to stakeholders and facilitates data-driven operational, budget, and policy decisions. OCFO oversees the Department’s responsibility for internal controls by assisting program management in establishing and ensuring strong controls over all financial resources in DOL.

Management Goal
United States Department of Labor – 32 – FY 2017 Annual Performance Report
OCFO – Safeguard fiscal integrity, and promote the effective and efficient use of resources.
*Target reached (Y), Improved (I), or Not Reached (N)
FY/PY 2013
FY/PY 2014
FY/PY 2015
FY/PY 2016
FY/PY 2017
FY/PY 2018
FY/PY 2019
What Worked, What Didn't Work, and Program
Performance Improvement Plan
Number of material weaknesses eliminated.
Target 3 -- -- -- 1 2 1 OCFO collaborated with OWCP and OASAM OCIO to address the audit findings described in the FY 2015 and FY 2016 Agency Financial Report (AFR). DOL eliminated all existing material weaknesses in the FY 2017 AFR (FY 2018 result).
Result 3 -- -- -- 0 2 --
Status Y -- -- -- -- Y --
Percent of discretionary appropriations canceled after the five years period of obligation authority has expired.
Target -- -- -- -- -- 2.00% 1.95% In its quarterly certification process, OCFO posts a summary of balances that are set to cancel for program review. DOL programs could do more to increase their awareness of which obligations are no longer needed and ensure the balances are de-obligated and re-obligated on valid goods or services. To provide agencies the information necessary to more effectively obligate funds, OCFO will send a regular summary of unobligated balances of funds near cancellation to the program financial managers.
Result -- -- -- -- 1.10% -- --
Status -- -- -- -- -- -- --
Sources: Agency Financial Reports; New Core Financial Management System
Notes: The targets for the measure "number of material weaknesses eliminated" are based on previous year independent audit findings. OCFO also reports the results of this measure on a one-year lag, such that the FY 2018 result reflects the material weaknesses eliminated in FY 2017 AFR, due to publication date of the Agency Financial Report.

United States Department of Labor – 33 – FY 2017 Annual Performance Report
Strategic Review Progress Update The Government Performance and Results Act Modernization Act requires that federal agencies report to Congress on “unmet goals” annually. The Office of Management and Budget’s Circular A-11, Part 6 mandates that agencies meet this requirement through a Strategic Review. However, that OMB guidance also states: “[b]ecause agencies are currently developing new strategic goals and objectives that will be reflected in the update to the agency Strategic Plan with the President’s FY 2019 Budget, agencies may forego the reporting requirements for any current strategic objectives from the FYs 2014-2018 strategic plan that an agency determines will be substantively different or no longer aligned with the current Administration’s policy, legislative, regulatory or budgetary priorities.” Accordingly, this year’s update presents key findings organized under the new goal structure. However, it does not include assessments (e.g., Noteworthy Progress, Adequate Progress, or Area for Improvement). Also, the Management Goal strategic objectives supported by the Office of the Assistant Secretary for Administration and Management and the Office of the Chief Financial Officer were not included in this review because the plan that was in effect in FY 2017 did not have a management goal. ETA Strategic Objective 1.1
A recent evaluation suggested that intensive services funded by the Workforce Investment Act Adult and Dislocated Worker programs, which are included in career services under the Workforce Investment Opportunity Act (WIOA), were effective at increasing participants’ earnings and employment.7 Employment and earnings outcomes for workers are higher when education is closely targeted to specific occupations and industries, particularly in real work-based settings (e.g., Registered Apprenticeship, internships, on-the-job training, sectoral partnerships, firm industry cluster partnerships, and public/private/union partnerships, Career Pathways, Sector Strategies, and other work based learning programs). Strong partnerships are necessary among the public workforce system, education providers, and employers in key sectors that provide well-paying jobs. However, a major challenge is that funds are limited; only a small fraction of job seekers served by these programs receive education (as opposed to less expensive career services). Billions of dollars per year in grants provide basic employment services to tens of millions; only 10-15 percent of them receive education.8
Helping job seekers obtain the education, training, and support services needed to succeed in the labor market is one of DOL’s Top Management and Performance Challenges for FY 2017. The OIG noted that the Department “needs the right performance information to make evidence-based and data-driven decisions.”9 The transition to WIOA presents some inherent risk from a
7 McConnell, Sheena, et al, Providing Public Workforce Services to Job Seekers: 15-Month Impact Findings on the WIA Adult and Dislocated Worker Programs (Washington, DC: Mathematica Policy Research, 2016). 8 U.S. Department of Labor et al. (2014). What Works In Job Training: A Synthesis of the Evidence (http://www.dol.gov/asp/evaluation/jdt/). 9 U.S. Department of Labor Office of Inspector General (2017). “Helping Adults and Youth Obtain the Education, Training, and Support Services Needed to Succeed in the Labor Market” (https://www.oig.dol.gov/public/topchallenges/2017.pdf).

Strategic Review
United States Department of Labor – 34 – FY 2017 Annual Performance Report
performance accountability standpoint; however it also provides a great opportunity to improve the performance accountability framework, data collection and program reporting, and make information system upgrades. ETA has developed a new reporting system – the Workforce Integrated Performance System (WIPS) – for states and competitive grantees to submit data for WOIA outcomes, including new data validation capacities. DOL was recognized in the Results for America Federal Invest In What Works 2017 Index as a leading agency focused on building the infrastructure necessary to be able to use data, evidence, and evaluation in budget, policy, and management decisions. A 2012 study of the Registered Apprenticeship program found that those who complete the program earn $240,000 more than non-participants over their careers, with net social benefits of over $50,000 per completing participant.10 Approximately 90 percent of registered apprentices are employed after completing their apprenticeship programs with an average starting salary of over $60,000 – $15,000 more than for all program participants (i.e., including those who did not complete the apprenticeship). On June 15, 2015, President Trump issued Executive Order 13801, Expanding Apprenticeships in America, which authorized the Secretary of Labor to establish industry-recognized apprenticeships programs by qualified third-party certifiers. Such industry-recognized apprenticeship programs will supplement, rather than supplant, the existing registered apprenticeship system. In support of the Secretary’s goal to expand apprenticeship, close the skills gap, and support a competitive workforce, ETA will support efforts to make apprenticeship a “go-to” and valued human capital solution in any industry to ensure businesses hire and keep workers with the skills they need to compete. The Department has made implementation of the Executive Order an APG for FY 2018-19. From PY 2011 to PY 2015, the percent of Job Corps students who entered employment or enrolled in post-secondary education and/or advanced training/occupational skills training in the first quarter after exit increased from 73 percent to 78 percent.11 However, some Job Corps centers continue to face challenges with safety and security.12 To address those challenges, Job Corps is conducting unannounced visits to centers with an elevated risk profile. Many job seekers face challenges in finding employment opportunities because most jobs require a higher level of education and some form of credential, pointing to the need for different skill development strategies that focus on the attainment of industry-recognized credentials.13 The OIG Top Management and Performance Challenge identified above notes challenges states faced with reporting data on credential attainment, and whether employment is related to the services 10 Reed, Debbie, et al., An Effectiveness Assessment and Cost-Benefit Analysis of Registered Apprenticeship in 10 States (Oakland, CA: Mathematica Policy Research, 2012 (http://wdr.doleta.gov/research/FullText_Documents/ETAOP_2012_10.pdf) 11 Most DOL employment programs are forward-funded and report performance on a Program Year (PY) that lags the Federal fiscal year by nine months (e.g., PY 2016 – July 1, 2016 to June 30, 2017). Exceptions that report on a standard fiscal year are the Apprenticeship program and the Trade Adjustment Assistance program. 12 The OIG identified this as a DOL Top Management and Performance Challenge for FY 2017. https://www.oig.dol.gov/public/topchallenges/2017.pdf. 13 Table 1.3 in the Bureau of Labor Statistics (BLS) Employment Projections, 2016-2026 indicates that for 19 of the 30 fastest growing occupations, some level of post-secondary education is typically required for entry (https://www.bls.gov/news.release/ecopro.nr0.htm). Credentials include, but are not limited to, a high school diploma, GED, or other recognized equivalents, post-secondary degrees/certificates, recognized skill standards, and licensure or industry-recognized certificates.

Strategic Review
United States Department of Labor – 35 – FY 2017 Annual Performance Report
received. ETA designs grant competitions, where applicable, to specifically promote credential attainment. ETA also provides technical assistance to grantees on resources and strategies for increasing the attainment of industry-recognized credentials. For example, ETA updated its electronic tools to include information on credentials related to each occupation – from short-term certificates to apprenticeship to licensure and certifications – and the quality or value of specific certifications. ETA’s priority for the Trade Adjustment Assistance program (TAA) is to return to approximately 40-day average petition processing times according to statutory requirements, and to ensure eligible workers can apply for benefits and services as soon as possible in order to return to work in good paying jobs. Average Processing Time for completing TAA investigations was 107.8 days in FY 2017 – much longer than the statutory 40 day target. ETA has taken steps in FY 2018 to reduce processing times for investigations by adding temporary staffing. Since FY 2016, the backlog of open investigations has been reduced from over 1200 to below 210, and it’s anticipated that the numbers will continue to decline as ETA continues to modify its business processes to eliminate unnecessary tasks. Evidence suggests that wage insurance and supplements for dislocated workers may help them transition faster to new jobs.14 Since 2009, TAA has included a wage supplement in the form of Reemployment Trade Adjustment Assistance (RTAA). This benefit encourages eligible workers age 50 and older to accept new jobs more rapidly by offsetting the earnings losses from losing their previous jobs with up to $10,000 in wage supplements. These supplements go to workers who find reemployment and earn less than $50,000 a year. From PY 2010 to PY 2016, the proportion of trade participants who are receiving this benefit has increased from 3 percent to 16 percent. In PY 2016, approximately $31.2 million in RTAA benefits funds were provided to support 5,640 recipients. In FY 2017, OFLC consolidated case processing responsibilities for all program types across its three processing centers to facilitate deployment of staff to program work that is in highest demand during peak application filing periods. For example, the bulk of H-2B applications are filed within a few days of the initial date for submissions in order to “beat” the semi-annual H-2B visa cap of 33,000. To synchronize resources with demand, the Department’s FY 2018 budget requested legislative authority to establish, collect, and retain fees to cover the operating costs of the foreign labor certification programs. VETS Strategic Objective 1.2 A noteworthy achievement for VETS is the increase in the share of veterans who received intensive services from JVSG specialists – from 25 percent in PY 2011 to 88.7 percent in PY 2016. A study of American Job Centers (AJCs) found that veterans consistently receive Priority of Service (i.e., time from enrollment to first service is faster than for non-veterans); the study also found that those receiving intensive services have higher earnings than those not receiving
14 King, C., and K. Tingle, Wage Insurance and Wage Supplements: Review of the Literature and Supporting Data, (Austin, TX: Ray Marshall Center for the Study of Human Resources, 2015) http://sites.utexas.edu/raymarshallcenter/files/2016/01/Wage-Insurance-and-Wage-Supplements_Review-of-the-Literature-and-Supporting-Data.pdf. Also see Wandner, Steven, Wage Insurance as a Policy Option in the United States, (W.E. Upjohn Institute, 2016) http://www.upjohn.org/sites/default/files/pdf/wage-insurance.pdf.

Strategic Review
United States Department of Labor – 36 – FY 2017 Annual Performance Report
intensive services.15 VETS has identified a risk in their ability to track and report performance outcomes from JVSG grantees. Participant-level data for new WIOA outcome measures will be three quarters lagged and since JVSG relies upon ETA’s WIPS system for these data, it faces the same risks to performance accountability identified for ETA Strategic Objective 1.1. ODEP Strategic Objective 1.3 The Office of Disability Employment Policy (ODEP) and ETA remain committed to developing strategies designed to increase access for adults and youth with disabilities to, and the use of, American Job Centers’ services. These strategies include facilitating a partnership between the public workforce system and the health care system as part of ODEP’s efforts to keep ill and/or injured workers at work and/or return them back to work as quickly as medically possible to ensure their labor force attachment. BLS Strategic Objective 1.4 BLS reached 100 percent of the underlying timeliness, accuracy, and relevance targets for all of its Principal Federal Economic Indicators for the last five years (FY 2013-2017). In addition, BLS measures dissemination through the average number of BLS website page views each month, but in FY 2017, fell under its target of 16.4 million by averaging approximately 15.5 million page views each month. In FY 2018, BLS will continue work on redesigning the website to ensure that BLS data products are readily accessible to its customers through the Internet and to meet users’ needs. BLS also measures mission achievement by measuring customer satisfaction with the BLS website through the ForeSee Experience Index (FXI), formerly known as the E-Government Satisfaction Index; the FY 2017 year-end score was 75, which was slightly below the FY 2016 result and FY 2017 target of 76. BLS saw a 13 percent decrease in respondents to the FXI survey and lower scores particularly in the areas of content and functionality, when compared to fourth quarter results in FY 2016. BLS faces declining survey response rates, primarily due to competing surveys, less willingness on the part of respondents to participate, and concerns about safeguarding respondent confidentiality. BLS is addressing this challenge by upgrading strategic communications, offering alternative response modes to reduce burden, and using more alternative data sources. Finally, BLS continues to promote the sharing of existing economic data among BLS, the Census Bureau, and the Bureau of Economic Analysis, and to improve the nation’s economic statistical system by aligning each agency’s data outputs and developing new ways to track emerging economic trends. BLS is addressing this challenge by monitoring and responding to new developments related to data sharing. WB Strategic Objective 1.5 In FY 2017, the WB published a comprehensive catalog of women’s employment rights; updated its web-based map identifying state-level pregnancy discrimination and accommodation and
15 Thompson, Shane, et al. (2015). Veteran and Non-Veteran Job Seekers: Exploratory analysis of services and outcomes for customers of federally-funded employment services. Washington, DC: Summit Consulting. (http://www.dol.gov/asp/evaluation/completed-studies/VeteranNon-VeteranJobSeekers.pdf)

Strategic Review
United States Department of Labor – 37 – FY 2017 Annual Performance Report
workplace lactation protections; and updated its online compendium of information on federal and state-level equal pay and pay transparency protections for workers. The WB also developed a brief guide to WIOA that details strategies for improving low-income women’s access to the education and support services they need to succeed. The WB also published an issue brief with the results from the Working Women’s Survey, which collected information about women’s decisions to exit the workforce, such as family care and household responsibilities. OSHA Strategic Objective 2.1 Fall protection continues to be the number one violation cited by OSHA. Falls are the leading cause of death in the construction industry and account for 20 percent of all serious injuries. In FY 2017, OSHA continued to focus on preventing fall hazards through inspection targeting. OSHA partnered with the National Institute for Occupational Safety and Health, the Center for Protection of Workers’ Rights (CPWR), and the Department of Defense on Safety Stand-Downs, voluntary events for employers to talk directly to employees about safety. The National Campaign to Prevent Falls in Construction Final Report indicated that thousands of employers received certificates by providing over 1 million workers and over 1.5 million military and civilian personnel fall prevention training. OSHA also has national and local emphasis plans (NEPs and LEPs), as well as a Strategic Plan that directs Compliance Safety and Health Officers (CSHOs) to those establishments with the most significant risk of fall hazards. In FY 2017, preliminary data shows that OSHA conducted about 10,380 inspections of worksites as a result of these programs, and about 8,032 fall-related violations were abated. OSHA tracks two measures to monitor its effect on federal employee safety. The Federal agency total injury/illness case rate fell from 3.08 per 100 employees in FY 2010 to 2.00 in FY 2017. Federal agency lost time injury/illness rate (also per 100 employees) fell from 1.44 to 1.07 over the same period. OSHA contributed to these improved results by providing compliance assistance to federal agencies and inspections of federal establishments with high numbers of lost time cases. OSHA Whistleblower Investigations increased by 76 percent from FY 2010 to FY 2017 (from 1,904 in FY 2010 to 3,348 in FY 2017). In response to the growing demand for whistleblower investigations, OSHA realigned the program to create a stand-alone directorate. OSHA also launched the Alternative Dispute Resolution (ADR) Program in FY 2016, which allows for voluntary resolution of the complaint, and the Quality Review Tool (QRT), which is used for auditing purposes that include case file reviews. MSHA Strategic Objective 2.2 In FY 2017, the Mine Safety and Health Administration (MSHA) exceeded its APG of reducing worker fatality rates in mining. The five-year rolling average rate has fallen about nine percent over the last two years – from 0.0126 fatal injuries per 200,000 hours worked in FY 2015 to 0.0116 in FY 2017. MSHA also achieved its goal of reducing all injury rates; the five-year rolling average rate fell 15 percent over the same period – from 2.56 injuries per 200,000 hours worked in FY 2015 to 2.17 in FY 2017.

Strategic Review
United States Department of Labor – 38 – FY 2017 Annual Performance Report
MSHA is responding to changes in the coal mining industry and the demographics of MSHA’s labor force. MSHA has realigned three Coal district offices in locations where coal mining activity has declined into other coal districts and field offices. MSHA utilized voluntary reassignments and relocation incentives to reallocate personnel to other coal offices and to MSHA program areas with identified staffing needs/gaps, most notably the Metal and Nonmetal Mine Safety and Health program. The realignment also resulted in a reduction of MSHA coal inspectors and reallocation of resources to other high priority MSHA requirements. WHD Strategic Objective 2.3 WHD increased agency-initiated investigations from 27 percent of all investigations in FY 2010 to 51 percent of all investigations in FY 2017. WHD also focused its investigations and resources better than ever on workplaces with violations. The percentage of agency-initiated investigations with no violations fell to 14 percent, down from 29 percent in FY 2012, while the percentage of complaint investigations with no violations fell to 15 percent, down from 21 percent in FY 2012. This indicates that agency-initiated investigations have been as accurate as complaint-based investigations in finding employers with violations. EBSA Strategic Objective 2.4 Since FY 2015, EBSA has implemented performance measures designed to increase the effectiveness of its enforcement program, focusing on National Projects and the Major Case Enforcement Priority. In increasing the investigative time spent on Major Cases, a significant portion of the agency’s enforcement resources were concentrated on those cases likely to have the greatest impact on the protection of plan assets and participants’ benefits. In FY 2017, Major Cases produced $609 million in monetary results and accounted for 89 percent of total monetary recoveries. “Protecting Retirement, Health, and Other Benefit Plans for Workers, Retirees, and Their Families” was identified as a DOL Top Management and Performance Challenge in FY 2017. Given the number of plans that the agency oversees relative to the number of its investigators, EBSA has to devise ways to focus its available resources on investigations, audits, and other reviews that it believes will most likely result in the deterrence, detection, and correction of ERISA violations. To that end, EBSA created the Sample Investigation Program (SIP) to measure overall compliance with the civil provisions of ERISA and the impact of EBSA investigations on compliance rates of investigated employee benefit plans. Additionally, pension assets that are held in otherwise regulated entities (e.g. banks) can escape full audit scrutiny by third-party CPAs or CPA firms, who may express “no opinion” on the financial statements even if their audits raise concerns. EBSA has no enforcement authority over these third-party auditors, but is able to refer CPAs who perform significantly deficient audit work to state licensing boards for potential disciplinary action. EBSA is developing proposed changes to strengthen the requirements for limited scope audit certifications from banks and insurance companies and developing changes to the Form 5500 financial statements and schedules to improve reporting of alternative and hard‐to‐value assets and to improve group health plan reporting.

Strategic Review
United States Department of Labor – 39 – FY 2017 Annual Performance Report
While EBSA will continue to contract with qualified non-governmental organizations to provide audit services for the Thrift Savings Plan (TSP), the agency also requested $2,000,000 in FY 2018 to improve the Department’s focus and oversight in areas where weaknesses with TSP have been identified but not adequately mitigated. OFCCP Strategic Objective 2.5 In FY 2017, the Office of Federal Contract Compliance Programs (OFCCP) negotiated $23.9 million in financial remedies on behalf of more than 11,600 victims (workers) affected by discrimination. These results include resolving 19 cases of pay discrimination and recovering more than $10.7 million in back pay and salary adjustments for 1,605 workers. About one-third of OFCCP’s settlements of discrimination cases now involve issues of pay discrimination, while in prior years the agency was addressing only a handful of such cases annually.
All of the pay discrimination notices of violation issued by OFCCP in FY 2017 were related to systemic pay findings. Also, 79 percent of the construction compliance evaluations were associated with a high-impact mega construction project – up from 31 percent in FY 2015. These projects have the potential for greater success in increasing the representation of minorities, women, individuals with disabilities, and protected veterans in skilled trades through effective recruitment and training. ILAB Strategic Objective 2.6 In FY 2017, working through grantees in over 10 countries, ILAB provided education or vocational services to more than 17,000 children engaged in or at high risk of entering hazardous child labor and helped to increase capacity to address child labor and forced labor in 22 countries. In addition, ILAB promoted a fair global playing field for U.S. workers and businesses by helping improve the technical capacity of governments to enforce their labor laws in 19 countries. OLMS Strategic Objective 2.7 In FY 2017, the average number of days to resolve union election complaints was 64.7 days, the lowest in the 2012-2017 period. The percentage of targeted audits that result in a criminal case rose from 13.81 percent in FY 2012 to 18.75 percent in FY 2017. In FY 2018, OLMS will continue leveraging relationships with the 41 national and international unions participating in the Voluntary Compliance Partnership (VCP) program. This program is designed to improve compliance with filing deadlines, increase electronic filing, and ensure that unions are adequately bonded. By doing so, VCP enables investigators to devote more of their time to high priority investigations. OLMS continues to implement patches to its 17-year old electronic Labor Organization Reporting System (e-LORS), which cannot support common functions like content search. Also, much of the system was “hard-coded,” necessitating manual fixes to the source code that increase the risk of errors leading to a system crash. The system is characterized by an inflexible application architecture, constrained complex workflow processes, and the use of legacy

Strategic Review
United States Department of Labor – 40 – FY 2017 Annual Performance Report
software and database design. OLMS’ ability to fully leverage available data is hampered by the absence of an automated data analytics capability; the use of a client server architecture limits the ability to leverage cloud and mobile computing; and the risk to system security increases as the legacy application remains constant when the threat space changes. OWCP Strategic Objective 3.1 Re-employment of injured workers under the Federal Employees’ Compensation Act (FECA) program declined from 91.5 percent in FY 2012 to 88.0 percent in FY 2017 due, in part, to the expiration of the Presidential Protecting Our Workers and Ensuring Reemployment (POWER) Initiative that helped focus federal agencies on return-to-work efforts. Results for key Longshore and Energy program measures continued positive trends. First payment of compensation within 30 days for non-Defense Base Act cases rose from 85 percent in FY 2012 to 88 percent in FY 2017. For cases not sent to the National Institute for Occupational Safety and Health when a hearing was not held (approximately 70 percent of all claims), the average number of days from filing date to final decision was reduced from 177 in FY 2012 to 169 in FY 2017. The average number of days to issue Black Lung claims increased 262 days from FY 2012 to 332 days in FY 2017. However, OWCP managed to reduce pending claims by 17 percent over the past two years. The Black Lung program faces a challenge with the sustainability of the Black Lung Disability Trust Fund. The Emergency Economic Stabilization Act of 2008 extended the current coal excise tax rates of $1.10 per ton on underground-mined coal and $0.55 per ton on surface-mined coal, but this is set to expire in December 31, 2018. The OIG identified Monitoring and Managing Pharmaceuticals in the FECA Program as a Top Management and Performance Challenge in 2017. In response to a dramatic increase in claimants, prescriptions, and expenditures for compounded drugs, OWCP instituted controls for compounded medication such as two-tiered pricing structure and a prior authorization process by requiring the submission of a Letter of Medical Necessity (LMN) by the claimant’s physician prior to authorization of any compounded medication, leading to a significant decrease in costs. OWCP is currently paying approximately $2 million per month for compounded drugs. The chargeback bill to the employing agencies dropped from $3.2 billion in Chargeback Year (CBY) 2016 to $2.9 billion in CBY 2017. OWCP also implemented a LMN for new opioid prescriptions in August 2017. The OIG and DOL identified Reducing Improper Payments as a DOL Top Management and Performance Challenge and Major Management Challenge, respectively, for FY 2017. The Department is working with the Office of Personnel Management to improve communication that will address dual entitlement issues that lead to improper payments. In addition, the program is working on a Computer Matching Agreement with the Social Security Administration (SSA) to improve the Department’s ability to reduce FECA benefits when an individual is concurrently receiving benefits from SSA. OWCP recently implemented a prior authorization process that already resulted in a marked decreased in compounded drug claims. Finally, OWCP hired additional staff for FECA program integrity and contracted with a data analytics firm to assist in developing technology and tools to detect and monitor inherent risk in claims, payments, and providers.

Strategic Review
United States Department of Labor – 41 – FY 2017 Annual Performance Report
ETA Strategic Objective 3.2 To address the improper payment challenges in the Unemployment Insurance (UI) program, ETA has a continuously evolving, comprehensive strategic plan in place to work with states that targets the largest root causes of UI improper payments.16 ETA has also provided a total of $694.6 million in supplemental funding in FYs 2011-2016 to support states’ efforts in implementing core integrity activities and to support modernization of state UI information technology systems, which also contribute to their ability to ensure program integrity. Due to declining claims workloads and the resulting reductions to state administrative funding, many states have had to reduce staff and are struggling to meet program performance standards. The UI program requires timely payments of benefits once a person is found eligible and states may not stop benefits payments without required procedures. These structural factors create improper payments under the Federal definition, since the payments cannot be stopped until the proper due process is provided. In addition, there are lags in the current data sources used by states to identify individuals that continue to claim benefits after returning to work, which further contribute to the inability to prevent these types of improper payments. Finally, states are facing capacity issues in dedicating staff to conduct random work search audits. ETA designated two states as High Priority (in need of intensive technical assistance with benefit payment issues) for FY 2016 and another four states in FY 2017. On-site visits with each High Priority state are conducted by an expert review team made up of National, Regional, and State subject matter experts (SMEs) on the issue areas identified as needing improvement. Each designated state receives a formal Monitoring Report that identifies findings, areas of concern, and best practices. States are advised of the different strategies and tools and are highly encouraged to implement and use those strategies and tools to improve their program performance to be removed from this designation. State corrective actions are developed and monitored through quarterly reviews.
16 Work Search – failure of claimants to comply with the states’ work search requirements (37.5 percent of total overpayments); Benefit Year Earnings – payments to individuals who continue to claim benefits after they have returned to work (29.9 percent); and Separation – failure of employers or their third party administrators to provide timely and adequate information on the reason for an individual’s separation from employment (12.4 percent).

United States Department of Labor – 42 – FY 2017 Annual Performance Report
Other Information Quarterly Operating Plan Reviews To continually improve the efficiency and effectiveness of its programs, DOL uses results-based, data-driven management techniques. Each DOL agency prepares an annual Operating Plan that details the strategies and resources it will apply to reach goals and objectives at all levels of the organization. Departmental leaders review performance against those operating plans each quarter to monitor progress and hold agencies accountable for implementing the plans, achieving milestones, and making adjustments as needed. This review process has focused Departmental leadership on strategic management of core functions through the use of program performance and budget data. Identification and discussion of key measures; annual and seasonal targets; and how budgets, workload, and strategies affect results have helped clarify priorities and improve performance against benchmarks. Major Management Challenges The GPRMA requires that federal agencies identify and address in their APPs Major Management Challenges (MMCs) – defined as programmatic or management functions that have greater vulnerability to waste, fraud, abuse, and mismanagement and where failure to perform well could seriously affect the ability of an agency or the federal government to achieve its mission or goals. MMCs may include issues the GAO identifies as high risk or Top Management and Performance Challenges for DOL identified by the Office of Inspector General (OIG). For FY 2018, DOL has identified three MMCs: 1) Reducing Improper Payments, 2) Job Corps Center Security and Cost Control, and 3) Securing and Maintaining Legacy Information Systems.17 The Deputy Secretary is the accountable official for each of these challenges, which are described briefly below. Reducing Improper Payments As noted by OIG, “OMB has recognized the UI [Unemployment Insurance] program as being at high risk for improper payments…. Fraud continues to be a significant threat to the integrity of the UI program, as identity thieves and organized criminal groups have found ways to exploit program weaknesses.”18 To address the improper payment challenges in the UI program, the Department has a continuously evolving, comprehensive strategic plan in place to work with states that targets the largest root causes of UI improper payments. A key component of the Department’s strategic plan is the establishment of a national UI Integrity Center (Center), operated by the National Association of State Workforce Agencies (NASWA), through a cooperative agreement with the New York State Department of Labor. The Center is a state-
17 These overlap challenges on the OIG’s list (Reducing Improper Payments, Providing a Safe Learning Environment at Job Corps Centers and Securing and Managing Information Systems, respectively.) 18 Office of Inspector General (2017). Top Management and Performance Challenges Facing the U.S. Department of Labor (https://www.oig.dol.gov/public/topchallenges/2017.pdf)
Other Information
United States Department of Labor – 43 – FY 2017 Annual Performance Report
driven source of innovative program integrity strategies to address improper payments and reduce fraud in the UI program. However, the Department notes that certain structural issues inherent to the UI program, as identified in FY 2016 by an independent technical workgroup of UI subject matter experts, statisticians, and economists, hinder the reduction of a significant portion of the improper payments. These structural issues, which are in place for policy reasons, include the requirement for certain due process steps before stopping payment of benefits. These due process steps require fact finding and the opportunity to be heard by both parties. Payments are required to continue until a final determination is made. We also note that lags in current data sources used by states to identify claimants collecting benefits after returning to work create improper payments as well. OIG also notes that “the Department also remains challenged in identifying the full extent of improper payments in the FECA [Federal Employees’ Compensation Act] program, and OIG continues to have concerns regarding the completeness of the claims universe used to determine DOL’s published FECA improper payment estimates.” The concerns relate to the FECA program’s exclusion of two subsets of cases in its sampling methodology: initial payments made in the first 90 days of the compensation claim, and compensation payments made on non-imaged claims initiated prior to November 2000. As noted in the Department’s response to the OIG reports, the Agency developed this methodology in consultation with the OIG and approved by OMB. This methodology is also consistent with the Office of Personnel Management’s estimation methodology. OWCP believes that including these marginal population segments would not create a statistically significant difference in its estimation, nor would it be cost effective. Summary level information about how DOL is addressing improper payments for both programs is in the OWCP Strategic Objective 3.1 and ETA Strategic Objective 3.2 sections of the Strategic Review Progress Update in this document. Additional information about measures and remediation efforts is available in the Improper Payments Reporting Details section of the FY 2017 AFR (https://www.dol.gov/sites/default/files/media_0/_Sec/2017annualreport.pdf). Job Corps Center Security and Cost Control As noted in the Strategic Review Progress Update under ETA Strategic Objective 1.1, OIG has also identified safety and security at Job Corps centers as a DOL Top Management and Performance Challenge. ETA has taken significant steps to increase security at Job Corps Centers including implementation of a revised, Zero-Tolerance Student Conduct Policy which established higher behavioral standards, clarified the meaning of infractions, and implemented a new structure for behavioral interventions in response to minor infractions. Job Corps has taken a strategic approach to risk management to identify centers with high levels of programmatic risk. Those factors include safety, student conduct, and zero tolerance. Job Corps executed announced and unannounced assessments of centers that resulted in a record number of contractual actions. Job Corps has established the Division of Regional Operations and Program Integrity to coordinate regional operations and activities. This new division functions to ensure consistency, strengthen

Other Information
United States Department of Labor – 44 – FY 2017 Annual Performance Report
quality assurance, and improve communication and coordination across the Job Corps system. Below is a list of specific activities ETA has undertaken to increase security at Job Corps Centers:
• Implemented the new Zero Tolerance Policy, and subsequently conducted a National training on the policies changes and how to effectively monitor oversight of its implementation;
• Conducted Regional Office Center Assessments (ROCAs) and added unannounced Center Culture & Safety visits to enhance center oversight. These actions resulted in the issuance of 13 Letters of Notification, 17 Letters of Concern, 8 Cure Notices, and 1 Show Cause Letter;
• Established the National Office Division of Regional Oversight and Program Integrity (DROPI) to increase oversight;
• Established a dedicated toll-free student safety hotline for calls of an urgent nature or calls that relate to the safety and security of Job Corps students and staff;
• Implemented a new National Criminal Background Check process for applicants who request enrollment into the Job Corps program;
• Increased efforts to follow up on violations uncovered during assessments; • Increased security investments at centers; • Require potential contractors, as part of their proposal to operate a Job Corps Center, to
provide a narrative describing their approach to student safety and behavior management; • Contracting Officers are now physically located in each of ETA’s six Regions; and • Leverage the contract process and the contract itself as a vehicle to drive behavior
change, increase compliance, and measure accountability. In 2011, OIG cited numerous problems with Job Corps’ cost per student metrics. (http://www.oig.dol.gov/public/reports/oa/2011/26-11-004-03-370.pdf) To improve cost controls, ETA has revised the award and incentive fees for Job Corps Operations Contracts. Center operations contracts with a cost and technical incentive were first awarded in 2015, and currently seven are performing. It is too soon to determine the impact of the cost incentive. Since the initial awards, ETA increased the minimum cost incentive fee (for savings) from two percent to three percent and increased the maximum cost incentive fee from 3.6 percent to 4.0 percent. Cost sharing for under- or overruns was also revised from 20 percent (contractor) and 80 percent (government) to 50 percent each. Increasing the cost incentive fee and creating equity in the cost sharing will further incentivize contractors to control costs, thereby creating savings for the Government. Securing and Maintaining Legacy Information Systems Securing data and information systems is a continuing challenge for all federal agencies, including DOL. This challenge is further compounded by the presence of legacy information technology systems in DOL’s operating environment. These legacy systems represent increased risk of hardware or software failures, complications from non-support for end-of-life products, and the unacceptable lack of current security patches. Degradation of any of DOL’s mission critical systems would imperil mission delivery, with potential resulting impacts to worker safety, inviolability of sensitive economic data, or the confidentiality of citizens’ Personally

Other Information
United States Department of Labor – 45 – FY 2017 Annual Performance Report
Identifiable information. Whether the negative impacts are man-made, as is the case with hackers of an unpatched legacy system, or simply the natural failure of unsupported, irreplaceable legacy system components, the risks are significant. Given the realities outlined above and taking full account of DOL’s business environment and resource constraints, DOL remains committed to this effort to address the highest risk legacy systems, applying focused and purposeful attention to developing and implementing appropriate mitigation strategies. Program Evaluations The Chief Evaluation Office (CEO) in the Office of the Assistant Secretary for Policy works closely with agency staff to design, fund, and implement program evaluations. The results from evaluations inform policy and improve DOL’s performance-based management initiatives in support of the GPRMA. For more information see http://www.dol.gov/asp/evaluation/. Regulatory Reform Executive Order 13777 (“Enforcing the Regulatory Reform Agenda”) requires that, beginning in FY 2018, federal agencies establish targets for five performance indicators:
Measure FY 2017 Result
FY 2018 Target
Number of evaluations to identify potential EO 13771 deregulatory actions that included opportunity for public input and /or peer review 7 2
Number of EO 13771 deregulatory actions recommended by the Regulatory Reform Task Force to the agency head, consistent with applicable law
N/A 7
Number of EO 13771 deregulatory actions issued that address recommendations by the Regulatory Reform Task Force N/A 7
Number of EO 13771 regulatory actions 0 0
Number of EO 13771 deregulatory actions issued 7 7
Total incremental cost of all EO 13771 regulatory actions and EO 13771 deregulatory actions Additional Information: This measure is an OMB requirement based on the Presidential Memorandum M-17-23. The FY 2019 target will be determined in FY 2018. The incremental cost value is an annualized value applying a 7 percent discount rate and using 2016 dollars.
-$7.9 million
-$137 million