Annual Meeting of Stockholders -...
40
Annual Meeting of Stockholders Tuesday, November 14, 2006
-
Upload
vuongduong -
Category
Documents
-
view
214 -
download
0
Transcript of Annual Meeting of Stockholders -...

Annual Meeting of StockholdersTuesday, November 14, 2006

Chief Financial Officer’s UpdateDave Vellequette

© 2006 JDSU. All rights reserved. 3
Safe Harbor Statement
Certain statements in this presentation constitute forward-looking statements within the meaning of Section 27A of the Securities Act of 1934. “Forward-looking” statements are all statements made by us, other than those dealing specifically with historical matters and any statements we make about the conduct of our business or finances up to this moment. All other statements made by us are forward-looking statements which include any information provided on future business operations and guidance regarding our future financial performance. Actual results may differ materially from those projected in the forward-looking statements. Factors that could cause actual results to materially differ from those in the forward-looking statements are discussed in the Company’s Securities and Exchange Commission Filings, particularly the risk factors section of our form 10-Q for the quarter ended September 30, 2006.
This presentation includes Non-GAAP financial measures where indicated. These non-GAAP financial measures complement the Company’s consolidated financial statements presented in accordance with GAAP. However, these non-GAAP financial measures are not intended to supercede or replace the Company’s GAAP results. A detailed reconciliation of historical GAAP results to the historical non-GAAP results is provided in the “Non-GAAP Condensed Consolidated Statement of Operations” schedule to our news release announcing the financial results of the first quarter of fiscal 2006. A discussion of the GAAP measures excluded from the forward-looking non-GAAP measures is provided in the “Business Outlook” paragraph of the news release. The news release is located in the Investor Relations section of our web site at www.jdsu.com.

© 2006 JDSU. All rights reserved. 4
Fiscal 2006 Recap
Revenue Increased ~$500 millionNon-GAAP EBITDA Improved >$85 million– Three consecutive quarters of non-GAAP positive EBITDA
Achieved Targeted Cost Savings– More than $90 million on annualized basis
Aligned Product Portfolio to Enable Profitability– Impacted revenue by more than $100 million
Acquisitions Strengthened Product Portfolio– Agility, Acterna & Test-Um; First Full Year of Lightwave
Executed Convertible Offering to Extend Maturity Profile of Existing Debt

© 2006 JDSU. All rights reserved. 5
Fiscal 2005 to Fiscal 2006 Comparison
Non-GAAP Results FY05 FY06 ∆Revenue $ millions $712.2 $1,208.3 +70%Gross Margin % revenue 18.4% 35.0% +$291.4EBITDA $ millions $(70.4) $17.2 +$87.6 Net Loss $ millions $(86.9) $(23.9) +$63.0 Loss Per Share $ $(0.48) $(0.12) +$0.36
Operating Margin by Segment % revenue, & $ millions
Optical Communications -9% -6% +$9.4Comm. Test & Measurement - +14% -Advanced Optical Technologies +12% +22% +$8.2All Other (Commercial Lasers) -7% +0% +$4.1
Fiscal 2006 Achievements Set the Stage for Non-GAAP Profitability in Q107All historical Earnings Per Share Results have been restated to reflect JDSU’s recent reverse stock split

© 2006 JDSU. All rights reserved. 6
Fiscal 2005 to Fiscal 2006 Comparison
Non-GAAP Results FY05 FY06 ∆Revenue $ millions $712.2 $1,208.3 +70%Gross Margin % revenue 18.4% 35.0% +$291.4EBITDA $ millions $(70.4) $17.2 +$87.6 Net Loss $ millions $(86.9) $(23.9) +$63.0 Loss Per Share $ $(0.48) $(0.12) +$0.36
Operating Margin by Segment % revenue, & $ millions
Optical Communications -9% -6% +$9.4Comm. Test & Measurement - +14% -Advanced Optical Technologies +12% +22% +$8.2All Other (Commercial Lasers) -7% +0% +$4.1
Fiscal 2006 Achievements Set the Stage for Non-GAAP Profitability in Q107All historical Earnings Per Share Results have been restated to reflect JDSU’s recent reverse stock split

© 2006 JDSU. All rights reserved. 7
Fiscal 2005 to Fiscal 2006 Comparison
Non-GAAP Results FY05 FY06 ∆Revenue $ millions $712.2 $1,208.3 +70%Gross Margin % revenue 18.4% 35.0% +$291.4EBITDA $ millions $(70.4) $17.2 +$87.6 Net Loss $ millions $(86.9) $(23.9) +$63.0 Loss Per Share $ $(0.48) $(0.12) +$0.36
Operating Margin by Segment % revenue, & $ millions
Optical Communications -9% -6% +$9.4Comm. Test & Measurement - +14% -Advanced Optical Technologies +12% +22% +$8.2All Other (Commercial Lasers) -7% +0% +$4.1
Fiscal 2006 Achievements Set the Stage for Non-GAAP Profitability in Q107All historical Earnings Per Share Results have been restated to reflect JDSU’s recent reverse stock split

© 2006 JDSU. All rights reserved. 8
Q107 Results Show Continued Progress
$(20)
$(15)
$(10)
$(5)
$-
$5
$10
Q106 Q206 Q306 Q406 Q107
Fourth consecutive quarter of positive EBITDA
First positive net income in more than 5 years
Non-GAAP earnings per share improved:
$(5)
$-
$5
$10
Q106 Q206 Q306 Q406 Q107
Non-GAAP EBITDA
Non-GAAP Net Income
$0.03$(0.01)$(0.08)Q107Q406Q106

© 2006 JDSU. All rights reserved. 9
Reverse Stock Split Highlights Progress

© 2006 JDSU. All rights reserved. 10
Cash Continues to be a JDSU Strength
Cash, Cash Equivalents and Short Term Investments > $1.2 billion– Financial strength to restructure
our legacy and invest in our future.
Convertible Notes– $475 million issued in 2003;
• Holders may redeem in 2008.– $425 million issued in 2006;
• Net share settlement feature reduces stockholder dilution.

© 2006 JDSU. All rights reserved. 11
$100
$150
$200
$250
$300
$350
$400
Q305 Q405 Q106 Q206 Q306 Q406 Q107 Q207
Non-GAAP Revenue ($M)
Guided to +4 to +11% Revenue Growth in Q207
FY07 second quarter revenue expected to be between $332 and $352M

© 2006 JDSU. All rights reserved. 12
$100
$150
$200
$250
$300
$350
$400
Q305 Q405 Q106 Q206 Q306 Q406 Q107 Q207
Non-GAAP Revenue ($M)
Guided to +4 to +11% Revenue Growth in Q207
FY07 second quarter revenue expected to be between $332 and $352M
Management Guidance

© 2006 JDSU. All rights reserved. 13
Fiscal 2007 – CFO Priorities
Execution of Ongoing Cost Saving Initiatives– $4mn in Q207, $7mn in Q307, and $8mn in Q407– Transitioning from ‘Heavy Lifting’ to Execution Based
ImprovementsOperating Expense ControlsSystem & Process IntegrationProgress Towards Near Term Business Model
6 to 9%3.0%EBITDA2 to 5% -2.2%Operating Margin
35 to 38%36.9%Operating Expenses~40%34.7%Gross Margin
Quarterly ModelQ107 Actual

Chief Executive Officer’s UpdateKevin Kennedy

© 2006 JDSU. All rights reserved. 15
Our Purpose, Our Journey
JDSU Mission:
Turn the company to a profitable, sustainable asset
JDSU Vision:
To be valued for enabling dramatic business improvements in our customers’ deployments of optical
products and broadband services

© 2006 JDSU. All rights reserved. 16
JDSU Strategy
Enable customers’ innovation in broadband and optical markets
Shape product portfolio on profitability followed by revenue growth
Diversify our customer base and product portfolio
Reduce legacy operating complexity and manufacturing costs

© 2006 JDSU. All rights reserved. 17
Priorities Shared at Last Year’s ASM

© 2006 JDSU. All rights reserved. 18
Review of Fiscal 2006 Priorities: Summary
Action Taken / Results Being RealizedCompany Integration
Action Taken / Results Being Realized• AON portfolio grew >100% year-over-year
New Product Introduction Focus
Action Taken/Results Being Realized• ~ $90 million cost savings achieved during FY06• Consolidated North American manufacturing facilities
Manufacturing Strategy Execution
Achieved• Opportunistic convertible note offering• Reverse stock split executed
Optimize Capital Structure
Achieved in Q107• Non-GAAP earnings per share of $0.03
Return to Non-GAAP Profitability
Achieved • 3 consecutive quarters in fiscal 2006• Q107 highest non-GAAP EBITDA in > 5 years
Achieve Non-GAAP EBITDA Breakeven
© 2006 JDSU. All rights reserved. 19
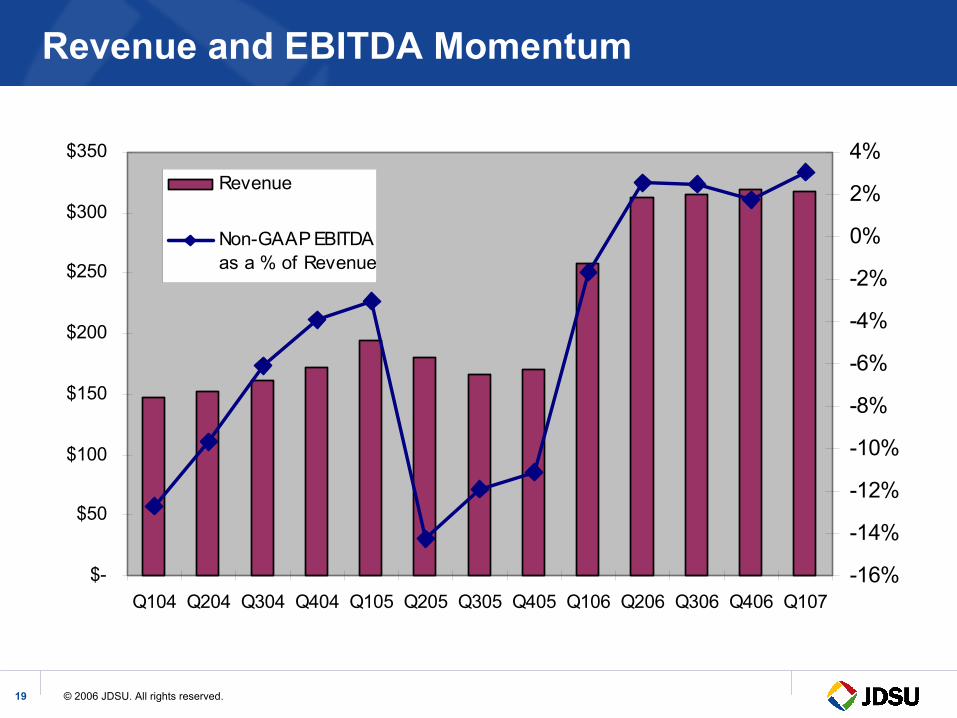
Revenue and EBITDA Momentum
$-
$50
$100
$150
$200
$250
$300
$350
Q104 Q204 Q304 Q404 Q105 Q205 Q305 Q405 Q106 Q206 Q306 Q406 Q107-16%
-14%
-12%
-10%
-8%
-6%
-4%
-2%
0%
2%
4%Revenue
Non-GAAP EBITDAas a % of Revenue

© 2006 JDSU. All rights reserved. 20
Enabling Broadband & Optical Innovation
Gas lasers, Flex tech sol’nsPhysical --> service testDevice integrationTrends
CO in transition; Flex very good; Lasers strong
Biotech, Semicon, Defense, Currency, Security, Decor
#1-3
≈ $250M
5-10%
$2.0B
Commercial and Consumer
Very good for margin structure
Telecom, Datacom, LH, Metro, Triple Play
#1-3
≈ $520M
6-12%
$2.6B
Communications T&M
Fair and improvingExecution
Telecom, Datacom, Undersea, LH, Metro, FTTxMarkets
#1JDSU Market Position*
≈ $470MJDSU Annual Rev*
5-15%Annual Growth Rate*
$3.9BTotal Market Size (Annual)*
Optical Communications
Market Segments
* Sources: Ovum-RHK, Prime Data, Frost & Sullivan, Infonetics Research, Optics Coating: A Strategic Business Report, January 2005, and internal analysis

© 2006 JDSU. All rights reserved. 21
The History of the Optical NetworkThe “Pin Drop Era” 1990-1995
WhatJDSUSells
• Passives• Source Lasers• Modulators
• Passives• Source Lasers
Band
wid
th Long Haul Metro Access• Technology = SONET/SDH &
Asynchronous• Bandwidth = 1.7G & 2.5G @ 1 λ
• Technology = SONET/SDH & Asynchronous
• Bandwidth = 400-622M @ 1λ
• Technology = Analog phone, FT1, 56K, X.25, Switched 56, T1/E1
• Bandwidth = 9.6K = 1.5M
Services = Voice, FAX, dial-up Internet, Enterprise 56K – T1
Long Haul
MetroT1
EnterpriseAccessFT1
9.6K 9.6KSMB
Home Phone
OC-3 ISPs
© 2006 JDSU. All rights reserved. 21

© 2006 JDSU. All rights reserved. 22
The History of the Optical NetworkThe “Broadband Era” 1996-2002
WhatJDSUSells
Long Haul Metro Access• Passives• Source Lasers• Receivers• Modulators• WDM TFF• AWG• EDFA
• Passives• Source Lasers• Receivers• Modulators
• 980 Pumps
AccessOC-3
ADSL 56K
IPSMB
Home Phone
Long Haul 2.5G ISPs
MetroGE
Enterprise
T1
RAN
Services = Voice, Internet, Enterprise 56K – OC-3, VoIP
Band
wid
th Long Haul Metro Access• Technology = SONET/SDH & WDM • Bandwidth = 2.5G @ 80λ & 10G @ 40 λ =
200-400G
• Technology = SONET/SDH• Bandwidth = 2.5G @ 1λ & 10G @ 1λ =
2.5-10G
• Technology = 56Kbps – T3, ISDN, ADSL, G.SHDSL, FE, 1GE
• Bandwidth = 9.6K – 10G
© 2006 JDSU. All rights reserved. 22

© 2006 JDSU. All rights reserved. 23
Long Haul 10G ISPs
Metro10G
Enterprise
Video10G
MTU
OC-48
RAN
Services = Voice, Internet, Enterprise, VoIP, IP Video, Rich Media (iTunes, youtube, …)
AccessGE
VDSL
56K
IPSMB
Phone FTTx
PON
Home Network
Curb / OSP
10G
Home STB
The History of the Optical NetworkThe “Triple and Quad Play Era” 2003 +
WhatJDSUSells
Long Haul Metro Access• Passives• Source Lasers• Receivers• Modulators• WDM TFF• AWG• EDFA
• 980 Pumps• ODM / ODM+• ROADM
• Passives• Source Lasers• Receivers• Modulators• WDM TFF• AWG• EDFA
• 980 Pumps• ODM / ODM+• ROADM
• Pumps• Passives
Long Haul Metro AccessBand
wid
th Long Haul Metro Access• Technology = WDM+ Legacy SONET/SDH • Bandwidth = 10G @ 80-160λ & 40G @ 1-
40λ = 0.8 – 1.6 T
• Technology = WDM+ Legacy SONET/SDH• Bandwidth = 10G @ 40λ = 400G
• Technology = ADSL2, VDSL, Cable, FTTx, GE, 10G
• Bandwidth = up to 10G
© 2006 JDSU. All rights reserved. 23

© 2006 JDSU. All rights reserved. 24
The History of the Optical NetworkThe “Triple and Quad Play Era” 2003 +
WhatJDSUSells
Long Haul Metro Access• Passives• Source Lasers• Receivers• Modulators• WDM TFF• AWG• EDFA
• 980 Pumps• ODM / ODM+• ROADM• SAS T&M
• Passives• Source-L• Receivers• Modulators• WDM TFF• AWG• EDFA
• 980 Pumps• ODM / ODM+• ROADM• SAS T&M• FTTx T&M• DSL T&M• Cable T&M
• Pumps• Passives• SAS T&M• FTTx T&M• DSL T&M• Cable T&M• VoIP T&M
• OSP T&M• Home Network T&M• Wireless T&M
Long Haul Metro AccessLong Haul Metro AccessBand
wid
th Long Haul Metro Access• Technology = WDM+ Legacy SONET/SDH • Bandwidth = 10G @ 80-160λ & 40G @ 1-
40λ = 0.8 – 1.6 T
• Technology = WDM+ Legacy SONET/SDH• Bandwidth = 10G @ 40λ = 400G
• Technology = ADSL2, VDSL, Cable, FTTx, GE, 10G
• Bandwidth = up to 10G
Long Haul
Metro10G
GE
VDSL
56K
IP
Enterprise
SMB
Phone
10G ISPs
Video10G
MTU
Curb / OSP
10G
Home
OC-48
RAN
Services = Voice, Internet, Enterprise, VoIP, IP Video, Rich Media (iTunes, youtube, …)
© 2006 JDSU. All rights reserved. 24
Access
FTTx
PON
Home Network
STB

© 2006 JDSU. All rights reserved. 25
The History of the Optical NetworkTe
lco
Net
wor
k
WhatJDSUSells
LH•Passives•Source Lasers•Modulators
Cable
Wireless
“Pin Drop Era” 1990-1995 “Broadband Era” 1996-2002 “Triple/Quad Play Era” 2003+Technology = AnalogService = Video
Technology = BroadbandService = Video
Technology = AnalogService = Voice
Technology = DigitalService = Voice, SMS
Technology = DigitalService = Voice, SMS, Internet, Video
Pictures, E-mail
Long Haul
Metro
Access
T1
FT1
9.6K 9.6K
Enterprise
SMB
Home Phone Internet
Long Haul
Metro
Access
GE
OC-3
ADSL 56KIP
Enterprise
SMB
Home Phone
2.5GISPs
Long Haul
MetroAccess
10G
GE
VDSL 56KIP
Enterprise
SMB
Home Phone
10G
Cable
Home FTTx
PON
MTU
10GISPs
Metro Access LH Metro Access LH Metro Access•Passives•Source Lasers
•Passives•Source Lasers•Receivers•Modulators•WDM TFF•AWG•EDFA•980 Pumps
•Passives•Source Lasers•Receivers•Modulators
•Passives•TX/RX•Modulators•WDM TFF•AWG•EDFA•980 Pumps•ODM / ODM+•ROADM•SAS T&M
•Passives•RX/RX•Modulators•WDM TFF•AWG•EDFA•980 Pumps•ODM / ODM+•ROADM•SAS T&M•FTTx T&M•DSL T&M•Cable T&M
•Pumps•Passives•SAS T&M•FTTx T&M•DSL T&M•Cable T&M•VoIP T&M•OSP T&M•Home Net T&M•Wireless T&M
Video
RANRANOC-48T1
10G
© 2006 JDSU. All rights reserved. 25

© 2006 JDSU. All rights reserved. 26
The History of the Optical NetworkTe
lco
Net
wor
k
WhatJDSUSells
LH•Passives•Source Lasers•Modulators
Cable
Wireless
“Pin Drop Era” 1990-1995 “Broadband Era” 1996-2002 “Triple/Quad Play Era” 2003+Technology = AnalogService = Video
Technology = BroadbandService = Video
Technology = AnalogService = Voice
Technology = DigitalService = Voice, SMS
Technology = DigitalService = Voice, SMS, Internet, Video
Pictures, E-mail
Long Haul
Metro
Access
T1
FT1
9.6K 9.6K
Enterprise
SMB
Home Phone Internet
Long Haul
Metro
Access
GE
OC-3
ADSL 56KIP
Enterprise
SMB
Home Phone
2.5GISPs
Long Haul
MetroAccess
10G
GE
VDSL 56KIP
Enterprise
SMB
Home Phone
10G
Cable
Home FTTx
PON
MTU
10GISPs
Metro Access LH Metro Access LH Metro Access•Passives•Source Lasers
•Passives•Source Lasers•Receivers•Modulators•WDM TFF•AWG•EDFA•980 Pumps
•Passives•Source Lasers•Receivers•Modulators
•Passives•TX/RX•Modulators•WDM TFF•AWG•EDFA•980 Pumps•ODM / ODM+•ROADM•SAS T&M
•Passives•RX/RX•Modulators•WDM TFF•AWG•EDFA•980 Pumps•ODM / ODM+•ROADM•SAS T&M•FTTx T&M•DSL T&M•Cable T&M
•Pumps•Passives•SAS T&M•FTTx T&M•DSL T&M•Cable T&M•VoIP T&M•OSP T&M•Home Net T&M•Wireless T&M
Video
RANRANOC-48T1
10G
Future AON Innovation• Access ROADMs• > 8 dimension ROADMs• Tunable Transponders• Higher-levels of integration
© 2006 JDSU. All rights reserved. 26

© 2006 JDSU. All rights reserved. 27
Optical Communications
Highlights
• #1 Market Share for 9 consecutive quarters
• Broadest Agile Optical Network portfolio including tunable lasers, ROADMs, and EDFAs
• Named a ‘Top Innovator’ by RHK
• Revenue grew 37% Yr/Yr
• Clear ROADM market leader

© 2006 JDSU. All rights reserved. 28
Communications Test & Measurement
Highlights
• Most comprehensive portfolio of broadband test instrument, systems and services – from the head-end thru the home
• #1 market share with wireline network operators
• Global, technically skilled direct sales force connected to the world’s leading service providers and network equipment manufacturers

© 2006 JDSU. All rights reserved. 29
Advanced Optical Technologies
Highlights
• Protecting 80% of the world’s currency value (≈100 countries)
• Protecting 40 Rx drugs from 11 of the top pharmaceutical companies
• Custom coatings for high performance and precision, low defects, harsh environments

© 2006 JDSU. All rights reserved. 30
Commercial Lasers & Photonic Power
Highlights
• Leader in lasers for high precision applications
• R&D 100 Award for Photonic Power technology
• Revenue grew 26% Yr/Yr

© 2006 JDSU. All rights reserved. 31
Manufacturing Strategy Execution: Progress
Exit Light Engines
Exit DLP Microdisplay
Sale of Laser Marking Business
Transfer of Manufacturing & Exit from Fuzhou
Santa Rosa Consolidation: 13
buildings to 6
Transfer of Commercial Lasers Manufacturing
Commercial and ConsumerCommunications T&M
Transfer of Manufacturing & Closure of Melbourne
Transfer of Manufacturing & Closure of Rochester
Transfer of Manufacturing & Closure of Ottawa
Transfer of Manufacturing & Closure of Ewing
Transfer of Manufacturing & Closure of Mountain Lakes
Transfer of Manufacturing & Closure of Santa Barbara
Progress to Date
Optical Communications
Market Segments
Cost Savings Achieved/Targeted
Q106 - $4mn
Q206 - $9mn
Q306 - $17mn
Q406 - $22mn
Q107 - $2mn
Q207 - $4mn
Q307 - $7mn
Q407 - $8mn

© 2006 JDSU. All rights reserved. 32
Segment Progress To Date
Diagnosis and Mobilization
CEO Transition
Acceptance of Industry Myths & Realities
Gross Margin Analysis

© 2006 JDSU. All rights reserved. 33
Segment Progress To Date
Diagnosis and Mobilization
Key Hires (Finance, IT, Operations)
Initial Optical Communications Consolidations
Beginning of Centralization of Functions
M&A Engaged
Gross Margin Improvement Program Designed
People and Deliberate Choices

© 2006 JDSU. All rights reserved. 34
Segment Progress To Date
Diagnosis and Mobilization
Gross Margin Programs Initiated
M&A Active (Acterna, Lightwave etc)
Divestitures of Non-Profitable Assets/Products
Peak of Consolidation Activity
Stabilization and Corrective Actions
People and Deliberate Choices

© 2006 JDSU. All rights reserved. 35
Segment Progress To Date
Diagnosis and Mobilization
Execution
Completion of Announced Consolidations
New Product Introductions
Gross Margin & Operating Expense Focus
Stabilization and Corrective Actions
People and Deliberate Choices
Drive to Profitability

© 2006 JDSU. All rights reserved. 36
Segment Progress To Date
Diagnosis and Mobilization
Growing Market Share
Improving Profitability
Stabilization and Corrective Actions
People and Deliberate Choices
Drive to Profitability
Momentum & Focus on Growth

© 2006 JDSU. All rights reserved. 37
Segment Progress To Date
Diagnosis and Mobilization
Commercial Lasers
Optical Communications
Advanced Optical Technologies
Communications Test & Measurement
People and Deliberate Choices
Drive to Profitability
Momentum & Focus on Growth
Stabilization and Corrective Actions

© 2006 JDSU. All rights reserved. 38
Priorities for Fiscal 2007
Maintain Profitability MomentumRevenue Growth Through Organic Product Development and Strategic AcquisitionsContinued Execution of Manufacturing StrategyContinued Company IntegrationProgress towards Target Business Model

Questions

Annual Meeting of StockholdersTuesday, November 14, 2006