Annual Management Report - SOTICA · Annual Management Report 2014 1412 Princess Street Kingston,...
84
Annual Management Report 2014 1412 Princess Street Kingston, Ontario K7M 3E5 Phone: 613-546-6613 Fax: 613-546-0436 www.communitylivingkingston.org Community Living Kingston and District is a CARF-accredited organization
Transcript of Annual Management Report - SOTICA · Annual Management Report 2014 1412 Princess Street Kingston,...

Annual Management
Report
2014
1412 Princess Street Kingston, Ontario K7M 3E5
Phone: 613-546-6613 Fax: 613-546-0436
www.communitylivingkingston.org
Community Living Kingston and District is a CARF-accredited organization

2
2
Table of Contents Item Page
Alternate Format Availability 3 Overview of Quality Improvement Process 4
Organizational Plans Strategic Plan 5 Risk Management Plan 6 Accessibility Plan 16 Technology Plan 22 Cultural Diversity Plan 26 Plan to Secure Input from Stakeholders 28 Plan to Distribute Performance 29 Improvement Information Review of All Organizational Policies 32
Satisfaction Surveys Persons Served— Community Options, 36 Residential Services, Respite, Family Home, SIL, Family Support Persons Served— Child Care Resource 38 Consultant Services Other Stakeholders— Family Members/ 41 Advocates
Characteristics of Persons Served Community Options 43 Residential Services 44 Respite 45 Child Care Resource Consultant Services 46 Supported Independent Living 47 Family Support 48 Family Home 49 Discussion 50
Effectiveness Measures Community Options 51 Residential Services 53 Respite 56 Child Care Resource Consultant Services 58 Supported Independent Living 59 Family Support 61 Family Home 63
Item Page
Efficiency Measures All Programs 65 Supplemental Measures 67 Residential Services
Service Access Measures All Programs 68
Business Function Measures Staff Injuries 72 Availability of Computer Server 74 Staff Training 76 Reduction of Unfunded Liabilities 78 Manager On-Call Response Time 80
Glossary of Terms 82
Data Integrity Assurance 83 Contact Information 84

3
Alternate Format Availability Understanding This Report
It is the goal of Community Living Kingston to ensure that everyone can access this report in a way that meets their needs. If you require this information in an alternate format, please contact Community Living Kingston and we will provide the information in a way that suits your needs.
This report is like a report card. It says what we do and how we do it. It tells you what we think we do well and what we want to do better.
If this report is hard to understand
Call Community Living Kingston and ask for the in-formation in a different format.
Ask a support worker, friend, or a family member for help if you want to know more about what this report says.
4
4
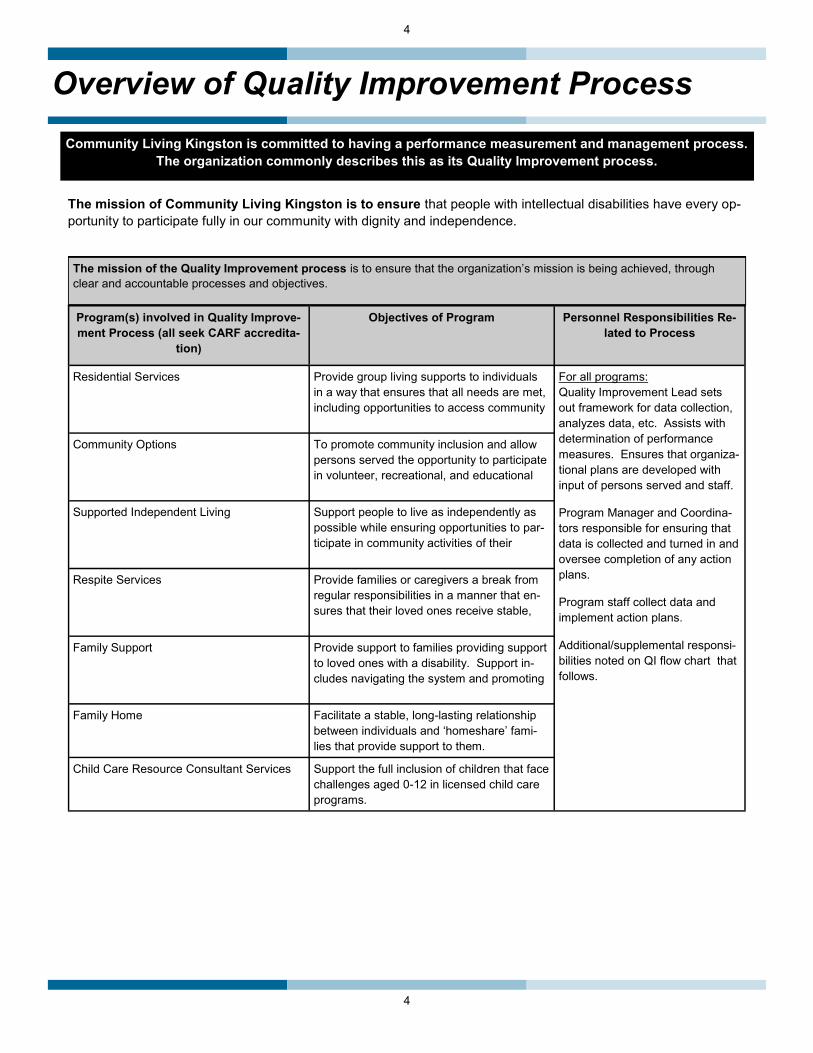
Overview of Quality Improvement Process Community Living Kingston is committed to having a performance measurement and management process.
The organization commonly describes this as its Quality Improvement process.
The mission of Community Living Kingston is to ensure that people with intellectual disabilities have every op-portunity to participate fully in our community with dignity and independence.
The mission of the Quality Improvement process is to ensure that the organization’s mission is being achieved, through clear and accountable processes and objectives.
Program(s) involved in Quality Improve-ment Process (all seek CARF accredita-
tion)
Objectives of Program Personnel Responsibilities Re-lated to Process
Residential Services Provide group living supports to individuals in a way that ensures that all needs are met, including opportunities to access community
For all programs: Quality Improvement Lead sets out framework for data collection, analyzes data, etc. Assists with determination of performance measures. Ensures that organiza-tional plans are developed with input of persons served and staff.
Program Manager and Coordina-tors responsible for ensuring that data is collected and turned in and oversee completion of any action plans.
Program staff collect data and implement action plans.
Additional/supplemental responsi-bilities noted on QI flow chart that follows.
Community Options To promote community inclusion and allow persons served the opportunity to participate in volunteer, recreational, and educational
Supported Independent Living Support people to live as independently as possible while ensuring opportunities to par-ticipate in community activities of their
Respite Services Provide families or caregivers a break from regular responsibilities in a manner that en-sures that their loved ones receive stable,
Family Support Provide support to families providing support to loved ones with a disability. Support in-cludes navigating the system and promoting
Family Home Facilitate a stable, long-lasting relationship between individuals and ‘homeshare’ fami-lies that provide support to them.
Child Care Resource Consultant Services Support the full inclusion of children that face challenges aged 0-12 in licensed child care programs.

5
Overview of Quality Improvement Process
The following flow chart outlines Community Living Kingston’s Quality Improvement process.
QIL meets with program leaders, other stakeholders to discuss possible performance indicators. All plans also reviewed.
List of possible indicators maintained in Candidate Data Plan for future review
New indicators determined and targets set or existing indicators tweaked,
targets revised as necessary.
Data collection system for each measure determined, implemented, revised
Considerations made to ensure data reliability, validity, completeness, accuracy (collectively called “data
integrity”)
Data collected at intervals previously determined
Data integrity checks conducted
Collected data is analyzed and summarized.
Summarized data shared with program leaders to determine
action plans
Summarized data, action plans distributed to stakeholders using Plan to Distribute Performance
Improvement Information
Quality Improvement information reviewed by Stakeholders
Quality Improvement Lead (QIL) leads review of Strategic Plan, Accessibility Plan, Risk Management Plan, all other
organizational plans
Start point is usually around December of each year.
Strategic Plan, Accessibility Plan, Risk
Management Plan, all other organizational plans used to
help determine potential
performance indicators.
Stakeholders invited to share feedback and ide-as with organization

6
6
Strategic Plan
Since 2007, on an annual basis, Community Living Kingston and District has completed a Strategic Plan that has focused around six core areas: Effective governance, capacity to respond, strategic partnerships, com-munications strategy, human resources strategy and financial viability. The Strategic Plans from 2007-2013, based on these core areas, can be found in past Annual Management Reports.
In early 2014, the Pressures and Priorities Committee of Community Living Kingston and District’s Board of Directors initiated a new strategic planning process. This process is highlighted by a comprehensive consul-tation process with a wide variety of the organization’s stakeholders.
It is anticipated that the Strategic Plan developed through this process will be completed in time for the Annu-al General Meeting in June 2014. Copies of this plan will be made available to all stakeholders, and will be posted on the agency’s website. Future Strategic Plans, based upon this new model, will be made available in future Annual Management Reports.
7
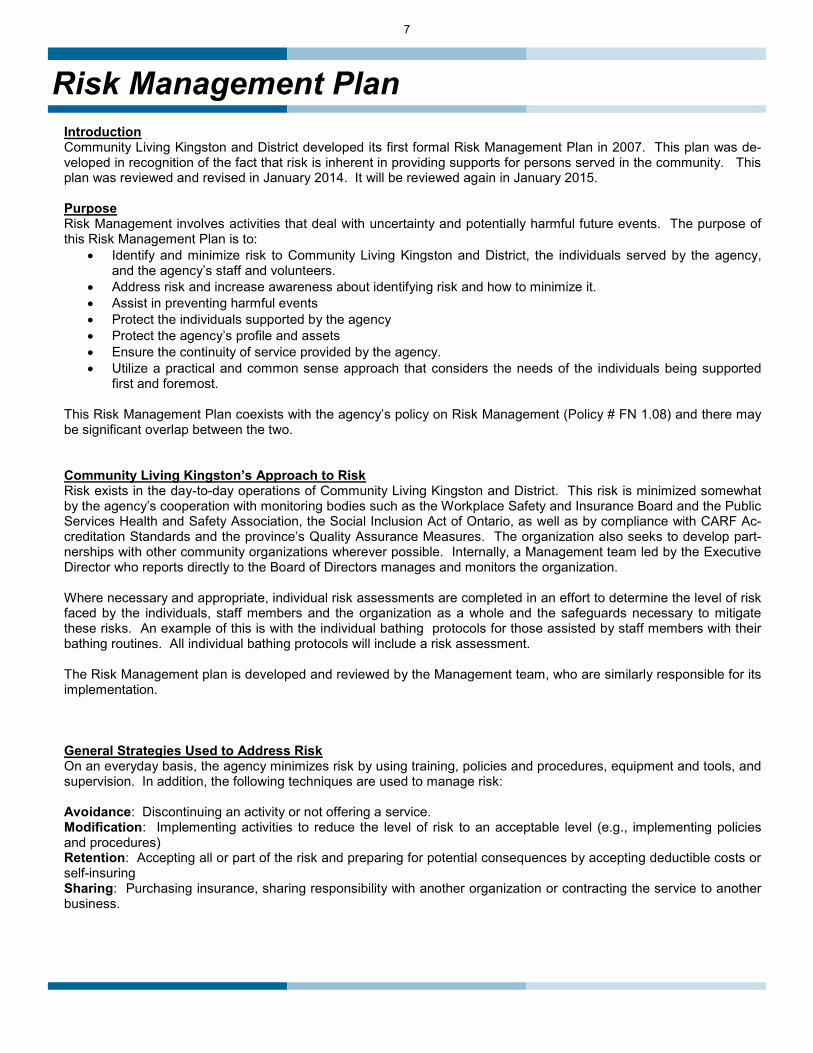
Risk Management Plan Introduction Community Living Kingston and District developed its first formal Risk Management Plan in 2007. This plan was de-veloped in recognition of the fact that risk is inherent in providing supports for persons served in the community. This plan was reviewed and revised in January 2014. It will be reviewed again in January 2015. Purpose Risk Management involves activities that deal with uncertainty and potentially harmful future events. The purpose of this Risk Management Plan is to:
Identify and minimize risk to Community Living Kingston and District, the individuals served by the agency, and the agency’s staff and volunteers.
Address risk and increase awareness about identifying risk and how to minimize it. Assist in preventing harmful events Protect the individuals supported by the agency Protect the agency’s profile and assets Ensure the continuity of service provided by the agency. Utilize a practical and common sense approach that considers the needs of the individuals being supported
first and foremost. This Risk Management Plan coexists with the agency’s policy on Risk Management (Policy # FN 1.08) and there may be significant overlap between the two. Community Living Kingston’s Approach to Risk Risk exists in the day-to-day operations of Community Living Kingston and District. This risk is minimized somewhat by the agency’s cooperation with monitoring bodies such as the Workplace Safety and Insurance Board and the Public Services Health and Safety Association, the Social Inclusion Act of Ontario, as well as by compliance with CARF Ac-creditation Standards and the province’s Quality Assurance Measures. The organization also seeks to develop part-nerships with other community organizations wherever possible. Internally, a Management team led by the Executive Director who reports directly to the Board of Directors manages and monitors the organization. Where necessary and appropriate, individual risk assessments are completed in an effort to determine the level of risk faced by the individuals, staff members and the organization as a whole and the safeguards necessary to mitigate these risks. An example of this is with the individual bathing protocols for those assisted by staff members with their bathing routines. All individual bathing protocols will include a risk assessment. The Risk Management plan is developed and reviewed by the Management team, who are similarly responsible for its implementation. General Strategies Used to Address Risk On an everyday basis, the agency minimizes risk by using training, policies and procedures, equipment and tools, and supervision. In addition, the following techniques are used to manage risk: Avoidance: Discontinuing an activity or not offering a service. Modification: Implementing activities to reduce the level of risk to an acceptable level (e.g., implementing policies and procedures) Retention: Accepting all or part of the risk and preparing for potential consequences by accepting deductible costs or self-insuring Sharing: Purchasing insurance, sharing responsibility with another organization or contracting the service to another business.

8
8
Risk Management Plan
Area of Risk Description of Potential Risk
Frequency (Likelihood)
Severity (How Bad)
Strategies and Methods Used to Manage the Risk
People
Persons Served and Families
Injuries and Accidents
Moderate Moder-ate
Strategies already in current practice and to be continued:
Policies and procedures are followed and regularly reviewed with staff.
Staff receive orientation and training in a number of areas, including safety and prevention (e.g., CPI, First Aid/CPR, Back Care, WHMIS and Q-Straint systems).
Injuries and accidents are reported and reviewed to identify any trends.
Specific interventions are noted in individual plans and Positive Behaviour Support Plans are developed as need-ed.
Individualized risk assessments developed as needed.
Policies and procedures related to client handling are in place. Policies require lifts to be used wherever possi-ble.
External and internal Health and Safety Inspections.
Bathing protocols developed for Residential Services and Community Services.
Policy related to client bathing (Operations 2.11).
Emergency signage in vehicles, safety checklist to be followed for vehicle usage
Positive Behaviour Support Plans monitored by an assigned BT and approved by psychologist.
New strategies to be introduced in 2014-15
Number of falls suffered by persons served will be tracked more closely via an addition to CLKD’s incident report procedure.
Fire safety training to be overhauled and annualized
Controlled acts training, initiated in 2013-14, to be continued and more closely monitored.
External Health and Safety inspection con-ducted at Kwik-Shred and worker co-operatives.

9
Risk Management Plan
Missing Per-sons
Low High Strategies already in current practice and to be continued:
Specific interventions developed as needed.
Missing Persons Protocol developed at Community Options
Policy related to client distress (Operations 4.05)
Manager On-Call system available to assist in these circumstances.
Serious Occurrence Report required to be filed with MCSS.
Operations Policy 4.05—Medical Emergencies and Client Distress
Annual staff review of all emergency procedures
New strategies to be introduced in 2014-15
None.
Area of Risk Description of Potential Risk
Frequency (Likelihood)
Severity (How Bad)
Strategies and Methods Used to Manage the Risk
People
Persons Served and Families
Violence and Trauma
Low Moder-ate
Strategies already in current practice and to be continued:
Staff are trained to assess safety and potential crises (CPI).
Code of Conduct used as guideline to govern behav-iour of supported individuals at Community Options.
In extreme situations, Serious Occurrence Report re-quired to be filed with MCSS.
New strategies to be introduced in 2014-15
None
10
10
Risk Management Plan
Area of Risk Description of Potential Risk
Frequency (Likelihood)
Severity (How Bad)
Strategies and Methods Used to Manage the Risk
People
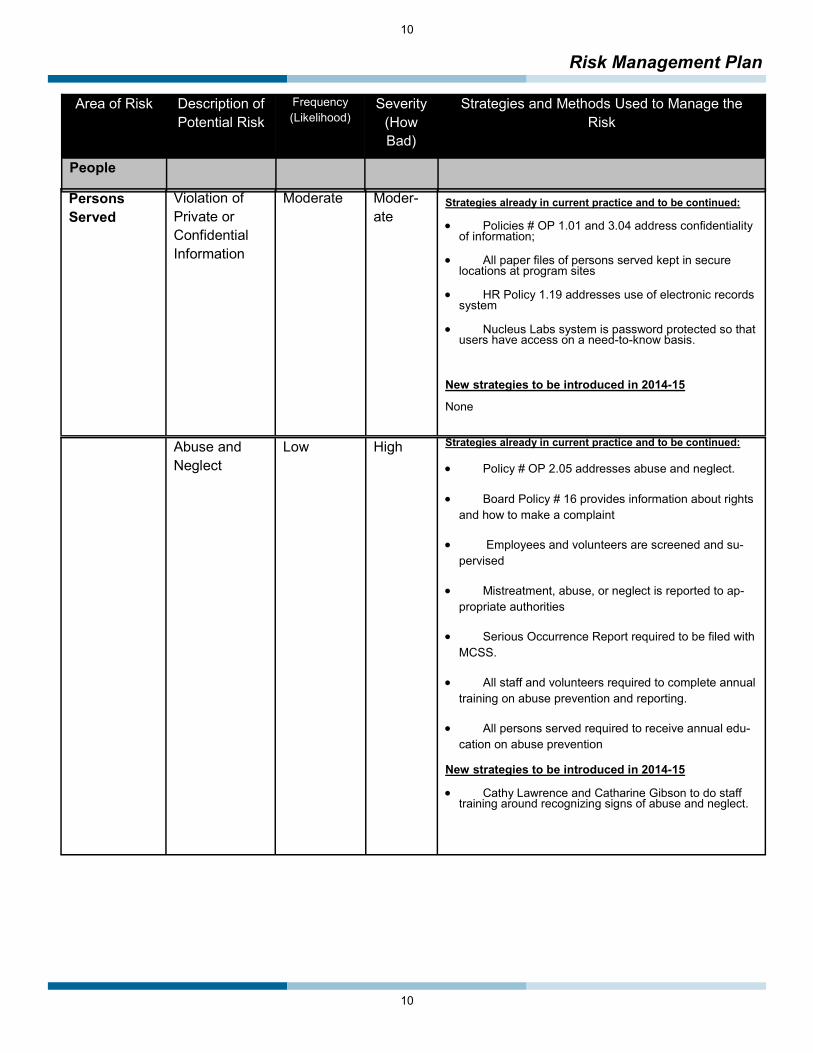
Persons Served
Violation of Private or Confidential Information
Moderate Moder-ate
Strategies already in current practice and to be continued:
Policies # OP 1.01 and 3.04 address confidentiality of information;
All paper files of persons served kept in secure locations at program sites
HR Policy 1.19 addresses use of electronic records system
Nucleus Labs system is password protected so that users have access on a need-to-know basis.
New strategies to be introduced in 2014-15
None
Abuse and Neglect
Low High Strategies already in current practice and to be continued:
Policy # OP 2.05 addresses abuse and neglect.
Board Policy # 16 provides information about rights and how to make a complaint
Employees and volunteers are screened and su-pervised
Mistreatment, abuse, or neglect is reported to ap-propriate authorities
Serious Occurrence Report required to be filed with MCSS.
All staff and volunteers required to complete annual training on abuse prevention and reporting.
All persons served required to receive annual edu-cation on abuse prevention
New strategies to be introduced in 2014-15
Cathy Lawrence and Catharine Gibson to do staff training around recognizing signs of abuse and neglect.

11
Risk Management Plan
Area of Risk Description of Potential Risk
Frequency (Likelihood)
Severity (How
Strategies and Methods Used to Manage the Risk
People Employees Injuries and
Accidents Low Low Strategies already in current practice and to be continued:
Health and Safety Committee comprised of Management and Union representatives.
Policies HR 3.01 to HR 3.15 address employee safety.
Orientation and training for staff includes safety (CPI, WHMIS) and lifting (Back Care)
Injuries are reported and reviewed for trends quarterly, with recommendations made to employer by JHSC.
WSIB coverage, Health Benefits
Policy (HR 3.13) related to Slips, Trips and Falls
Policies and procedures related to client handling are in place.
External Health and Safety Inspections
Ministry of Labour Inspections
HR Policy 3.12— Cell Phones and Driving ● All staff receive annual training on workplace violence prevention, as well as general health and safety refreshers
Emergency signage in vehicles, safety checklist to be followed for vehicle usage
New strategies to be introduced in 2014-15
MSD and back care prevention training to be addressed via video format provided by OSACH External Health and Safety inspection conduct-ed at Kwik-Shred and worker co-operatives.
Illness Low Low Strategies already in current practice and to be continued:
Flu Shot Clinic held annually
● H1N1 clinic added in 2009 and conducted an-nually if necessary
All employees have sick time for use when they are ill
Fit Testing for all employees
Policies related to Infection Control and Pan-demic Preparedness.
New strategies to be introduced in 2014-15
Fit testing efforts to be redoubled, with new trainers for each division of service; new employees to be fit tested upon hire

12
12
Risk Management Plan
Area of Risk Description of Potential Risk
Frequency (Likelihood)
Severity (How
Strategies and Methods Used to Manage the Risk
People Employees (continued)
Communicable Diseases
Low Low Strategies already in current practice and to be continued:
Employees requested to disclose any contagious diseases
Agency will pay for required immunizations as applicable to employee’s work situation
Policies HR 3.09 and 3.10 address Diseases and Infection Con-trol.
Regular updates from Health Unit provided to Employees. ● HR Policy 3.14– Respiratory Protection Program implemented
Employees informed of persons served who may have com-municable diseases, along with prevention strategies
Flu shot clinic held each year
New strategies to be introduced in 2014-15
None
Staff Turnover Low Moderate Strategies already in current practice and to be continued:
Competitive wage and benefits package
Staff Recognition Program
Formal monitoring of turnover by HR director
Leadership Development Bursary Fund
Exit interview process
Human Resources Policies and Procedures designed to ensure a safe workplace
Participation in Provincial HR strategy with OASIS and MCSS
New strategies to be introduced in 2014-15
None
Employment Prac-tices Violation
Low Moderate Strategies already in current practice and to be continued:
Human Resources Policies and Procedures
Staff Code of Conduct and Discipline Policy
Employment Standards Act
Collective Agreement with CUPE 2635
New strategies to be introduced in 2014-15
None

13
Risk Management Plan
Area of Risk Description of Potential Risk
Frequency (Likelihood)
Severity (How Bad)
Strategies and Methods Used to Manage the Risk
People
Employees (continued)
Workplace Vio-lence
Low Moderate Strategies already in current practice and to be con-tinued:
CPI Training
Positive Behaviour Support Plans
Manager on-call system to summon assistance
Cell phones at locations, emergency numbers on hand
Additional staffing at homes with high needs
Annual training around Workplace Violence Pre-vention
New strategies to be introduced in 2014-15
Workplace Violence Hazard reassessed by Health and Safety Committee
Board of Di-rectors
Criminal Activity
Fraud
Theft
Legal Requirements
Liability
Board Turnover
Low Moderate Strategies already in current practice and to be con-tinued:
Liability Insurance
Governance Policies and Procedures
Board Member Recruitment and Screening
Policy # FN 1.08 addresses many of these issues.
Board Nominating Committee; preferred representa-tion on Board
New strategies to be introduced in 2014-15
None
Community Complaints Low Moderate Strategies already in current practice and to be con-tinued:
Complaints procedure, including plain language ver-sion
Proactive communication and input
Executive Director is spokesperson for agency
Complaints may be directed to Executive Director with the expectation open dialogue
New strategies to be introduced in 2014-15
None
14
14
Risk Management Plan
Area of Risk Description of Potential Risk
Frequency (Likelihood)
Severity (How Bad)
Strategies and Methods Used to Manage the Risk
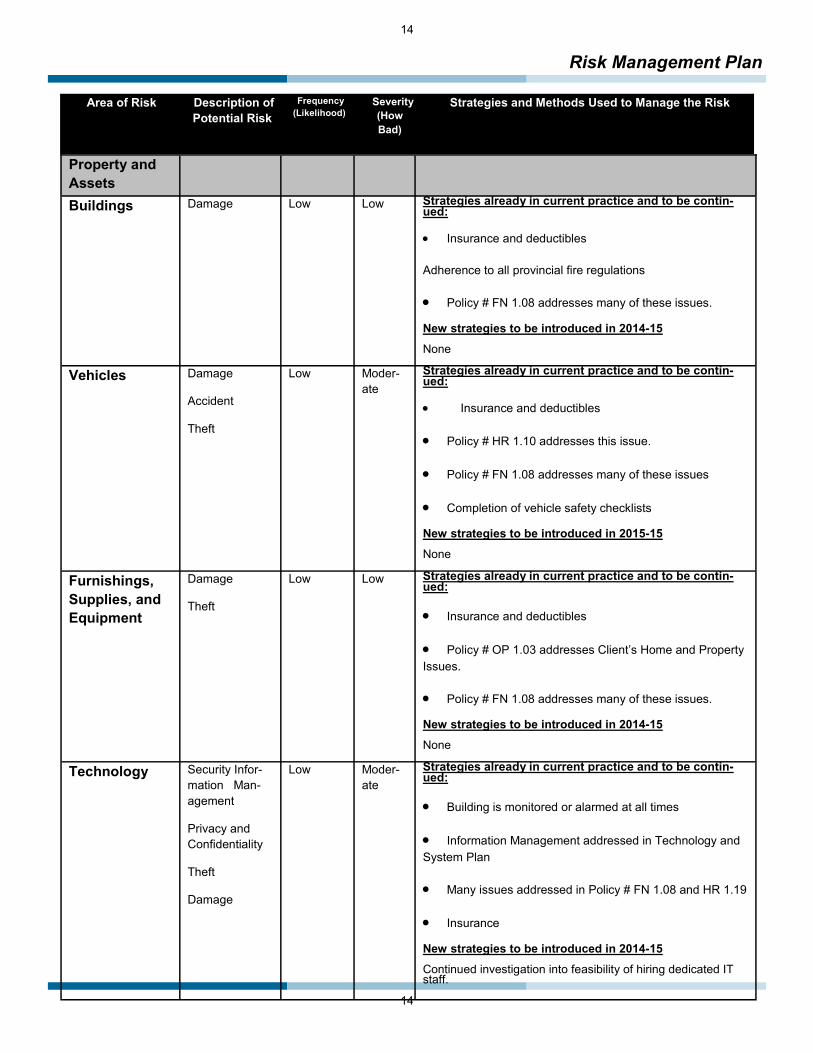
Property and Assets
Buildings Damage Low Low Strategies already in current practice and to be contin-ued:
Insurance and deductibles Adherence to all provincial fire regulations
Policy # FN 1.08 addresses many of these issues.
New strategies to be introduced in 2014-15 None
Vehicles Damage
Accident
Theft
Low Moder-ate
Strategies already in current practice and to be contin-ued:
Insurance and deductibles
Policy # HR 1.10 addresses this issue.
Policy # FN 1.08 addresses many of these issues
Completion of vehicle safety checklists
New strategies to be introduced in 2015-15 None
Furnishings, Supplies, and Equipment
Damage
Theft
Low Low Strategies already in current practice and to be contin-ued:
Insurance and deductibles
Policy # OP 1.03 addresses Client’s Home and Property Issues.
Policy # FN 1.08 addresses many of these issues.
New strategies to be introduced in 2014-15 None
Technology Security Infor-mation Man-agement
Privacy and Confidentiality
Theft
Damage
Low Moder-ate
Strategies already in current practice and to be contin-ued:
Building is monitored or alarmed at all times
Information Management addressed in Technology and System Plan
Many issues addressed in Policy # FN 1.08 and HR 1.19
Insurance
New strategies to be introduced in 2014-15 Continued investigation into feasibility of hiring dedicated IT staff.

15
Risk Management Plan
Area of Risk Description of Potential Risk
Frequency (Likelihood)
Severity (How Bad)
Strategies and Methods Used to Manage the Risk
Financial Financial Practice
Fraud
Legal Require-ments to record, report
Investment Loss-es
Low High Strategies already in current practice and to be continued:
Financial Policies and Procedures
Insurance
External audit completed annually
Experienced financial staff
Revenue Canada Audits
Policy # FN 1.08 covers all risk ex-posure
New strategies to be introduced in 2014-15 None
Organization Reputation and Profile
Negative Media Coverage
Loss of Credibil-ity
Low Moderate Strategies already in current practice and to be continued:
Avoid activities that threaten the or-ganization’s profile or may cause a negative impact on its reputation
Membership in provincial organiza-tions (Community Living Ontario)
Adherence to Goal and Vision State-ment
New strategies to be introduced in 2014-15 None
Other Poor amalgama-
tion process with Gananoque Dis-trict Association for Community Living
Low Low New strategies to be introduced in 2014-15 • Full staff training in all agency policy and procedure, including Nucleus records system.
Action Plan 2014-15 All items that are marked as Moderate or High in likelihood will be monitored and attempts will be made to continue to amend current or develop new practices to address these risks as needed.

16
16
Accessibility Plan Introduction
Community Living Kingston and District has completed formal Accessibility Plans on an annual basis since 2007.
Community Living Kingston and District’s Accessibility Plan addresses accessibility issues at our program locations and in the community at large. Community Living Kingston and District is committed to identify-ing and removing barriers that reduce the ability of persons served to fully access both our programs and the community as a whole. Community Living Kingston and District’s Accessibility Plan is designed to summarize the following:
● Those barriers that were removed or otherwise addressed by the agency in the past, specifically over the course of the past year.
● Those items that the organization still intends to address, as well as new items that have been brought to the agency’s attention. Some of these items contain firm deadlines for completion, while others do not.
Types of Barriers
Community Living Kingston and District’s Accessibility Plan encompasses ten types of barriers.
An architectural barrier is any physical factor that makes accessibility difficult for an individual. This may include narrow doorways, bathrooms that might need to be made more accessible, alarms that are not able to be heard by individuals with hearing impairments, or even something as simple as the loca-tion of furniture.
An environmental barrier is a characteristic of a setting that compromises service delivery and benefits to be gained. This may include items such as flickering lighting, noise levels, and troublesome fragranc-es.
An attitudinal barrier is a preconceived (usually negative) attitude that people have towards persons served. Examples of this may include attitudes of neighbours or other community members, or the lack of “person first” language used by agency personnel.
A financial barrier is anything that may mean that a service is restricted because of a lack of sufficient financial resources. Financial barriers may exist at the organizational level, or may be specific to funds possessed by persons served.
An employment barrier is an indication that a workplace does not provide sufficient flexibility or equip-ment to ensure a productive and satisfying workplace for employees. An employment barrier may also speak to measures that are in place to promote successful employment for persons with disabilities.
A communication barrier looks at anything that inhibits information being accessible and understandable to all. Examples may include the possible absence of devices available to persons served or personnel to be able to be understood by others, or promotional materials that are not present in formats that are easily understandable.

17
Accessibility Plan
Types of Barriers (continued)
A transportation barrier speaks to situations in which service recipients are unable to reach or partici-pate fully in services because of the lack of suitable and available transportation.
A community integration barrier is anything that may limit an individual’s ability to fully access their com-munity in a way of their choosing.
A technology barrier is related to a need of a stakeholder to access technology to ensure communica-tion or inclusion into services.
In addition to these barriers, other barriers that are not easily categorized may also be identified.
Identification of Barriers
In preparing this year’s Accessibility Plan, Community Living Kingston utilized several methods in which to identify accessibility barriers:
The organization’s 2013 Accessibility Plan was used to identify items that were already considered to have been a concern.
Individual persons served and personnel were consulted by the quality improvement lead and contributed to the identification of issues and potential ideas on how to rectify them.
● The organization’s leadership routinely identifies maintenance and property issues throughout the agency. This information was used to identify property issues that negatively impact the accessibility needs of the persons served by the agency.
The organization’s leadership is brought up to speed on accessibility issues by personnel and by persons served on an ongoing basis. The issues anecdotally identified in this manner were also useful in the creation of this plan.
Communication of Accessibility Plan
The accessibility plan will be posted on the agency website. Paper copies will be made available at all program locations and will be made available to all those who request the plan (an ad in the newsletter will alert people to this option).
Review of Accessibility Plan
Progress around the plan will be completed in six month intervals, with a progress report being posted on the agency website. A full review of the organization’s Accessibility Plan will be completed at least annually. A member of the Management team will take the lead around updates of the Accessibility Plan.

18
18
Accessibility Plan
Items Addressed In 2013-14
Program Barrier Identified/Type of Barrier Action Completed Completion Date
Community Options
The Seniors program is physically too small to meet the volume of per-sons served, resulting in crowding
and excessive noise (environmental/architectural).
A lease has been signed to procure an additional 1700 feet of space at 400 Elliott Avenue to replace the existing space. This new program is slated to
open in June of 2014.
To be finalized May 2014
Agency
Persons served have limited access to assistance with augmented com-munication systems, thus limiting
their ability to communicate (communication)
Community Options purchased an additional SMART Board to assist with accessible communication for
academic pursuits.
Six Community Options staff also participated in ASL training in 2013
Within the agency overall, this item continues to be a barrier. This item will remain standing.
May 2013 for SMART Board
Roosevelt A washroom was not fully accessible for persons served (architectural)
The shower was renovated to make it more accessi-ble to persons served September 2013
McMichael The front ramp required work in or-
der to be made more accessible (architectural)
The ramp received the required retrofits to be more accessible September 2013
Agency
Some locations do not have suffi-cient tracking systems to meet basic
accessibility needs for persons served. This is of specific concern as persons served age and their
physical needs increase (architectural)
A tracking system was put in place at Arbour-Repite and McMichael and was approved for purchase at
Options for Seniors. October 2013
All locations
There are an inadequate number of agency vehicles, especially accessi-
ble ones, limiting the community involvement of person served
(transportation, community integra-tion)
Vehicles were added at Melanie, Mowat, and Com-munity Options
This item will continue to be one of ongoing concern, and will remain on the standing items list.
October 2013
Community Some community settings lack some accessibility for individuals in wheel-
chairs. (community integration)
A portable ramp was purchased for use in the com-munity. October 2013
Co2
Persons served who use wheel-chairs cannot get though front door
comfortably or independently (architectural)
Automatic door opener installed June 2013
Arbour-Respite
There is no light on the fire alarm system for use by individuals with a hearing impairment (architectural,
communication)
A strobe light was installed August 2013
Agency Staff do not always use person-first language (attitudinal)
A policy on person-centered language was intro-duced January 2014

19
Accessibility Plan
Items Yet To Be Addressed
Standing Items The following items have been brought up repeatedly throughout the barrier identification process, though the nature of them mean that they are unlikely to be fully addressed in any given year. These items are of concern to the agency, and will continue to be over the long term. They will be carefully monitored for the foreseeable future. While some action has been taken to reduce the accessibility concern related to some of these items, further action might be necessary to fully remove the barrier.
Program Year Item
First Identified
Barrier Identified/Type of Barrier
Strategies for Removal or Prevention and Comments on Progress
Potential Cost
Timeline for Completion
Person(s) Responsible
All Locations 2007
There are an inadequate num-ber of agency vehicles, espe-cially accessible ones, limiting the community involvement of
persons served (transportation, community integration)
The agency will continue to examine the cost feasibility of acquiring additional vehicles, and deems this to be an extremely important item. However, the cost-prohibitive nature of these vehicles makes it difficult to achieve this goal.
The organization has a vehicle replacement plan to ensure that the existing vehicles can
be replaced over the coming years. However, additional vehicles must always be procured
from operating funds. It will be a challenge to simply maintain the
status quo in terms of the vehicle fleet size. It is noted that vehicles purchased in 2013 were added to the fleet without replacing vehicles due to be pulled off the road this
year.
Upwards of $60000 per
vehicle
As funds become available
Property Manager and Finance Direc-
tor
All Locations 2007
Snow and ice removal is of paramount importance, as it restricts access to and from program locations (other)
The organization implemented some new organizational strategies around snow and ice removal in the winter of 2008, which seemed to ameliorate the problems somewhat. The
agency will continue to be vigilant in this regard.
None Ongoing Property Manager
Agency 2007
Persons served have limited access to assistance with aug-
mented communication sys-tems, thus limiting their ability to communicate (communication,
assistive technology).
The organization had long dedicated the resources of two employees to assist with these issues for a total
of twenty hours a week. However, a reduction in community resources left these two employees without clinical supervision, which prompted the agency to be concerned about dedicating more
resources. Further cost reductions has effectively reduced the resources dedicated to this by half.
In some cases, staff do not have sufficient training in American Sign Language to meet the needs of per-
sons served. While the Joint Staff Education Commit-tee will pay for many applicants for such training,
some more standard training in this area for staff may necessary.
Staffing costs, potentially significant.
Ongoing
Manager, Resi-dential Services and Manager,
Community Op-tions
Agency 2007
Finances are not always suffi-cient to meet the needs and wishes of all persons served,
limiting their community partici-pation and hampering their
quality of life (financial).
This is a long-standing issue that the agency will continue to struggle with. The agency has continued to seek enhancements to funding and has been active in political activism to
attempt to remove this barrier.
None Ongoing Finance Director

20
20
Accessibility Plan
Items Yet To Be Addressed
Standing Items (continued)
Agency 2007
Agency staff are frequently not mindful of the privacy of persons
served, and do not always act sensitively towards them
(attitudinal)
Two agency staff, Cathy Lawrence and Catharine Gibson, are available to provide training in this area at
any time.
Annual staff training modules do spend some time focusing on privacy and the rights of persons served.
Staffing costs for training
As funds become
available.
Management Team
Agency 2007
Program information is available only in print and assumes a high level of literacy (communication,
assistive technology)
Several attempts to communicate rights, personal plans, etc., via video have not seen success as a result of staffing, financial, or expertise issues. The organiza-
tion has developed plain-language versions of rights statements and complaint processes, and thee has
been an agency focus on developing pictorial personal plans. However, video formats would be preferable.
Unknown Unknown Manager of Community
Options
All Programs 2011
Local Accessible Bus system has limited availability for bookings for persons served (transportation,
community integration)
Continue to cultivate good relationship with bus service and advocate for need for more services availability.
A professional working relationship between the Man-agers at Kingston Access Bus and Community Options
has continued through 2013.
None Ongoing Program Managers
All Programs 2013
Negative attitudes of neighbours, community members sometimes stigmatizes or impacts persons
served (attitudinal)
Educate community, follow-up in situations where such concerns are expressed.
Continue to increase profile of organization to empha-size agency philosophy on a wider scale.
None Ongoing Manage-
ment Team
Program Year Item
First Identified
Barrier Identified/Type of Barrier Strategies for Removal or Prevention and Comments on Progress
Potential Cost
Timeline for Completion
Person(s) Responsi-
ble

21
Accessibility Plan
Follow-Up The Accessibility Plan will be reviewed by the Management team at least twice a year. An update to the Accessibility Plan will be distributed to stakeholders in November of 2014
Requests for Reasonable Accommodations There were no requests for reasonable accommodations by stakeholders in the past year. Future requests will be identified, noted and responded to.
Other Items To Be Addressed In 2013-14 The agency aspires to address the following items in 2013-14. Items with a high priority and that appear feasible in 2013-14 have a firm target date. Other items are a lower priority and will be addressed ‘as funds become available’.
Program Year Item
First Identified
Barrier Identified/Type of Barrier Strategies for Removal or Prevention and Comments on Progress
Potential Cost
Timeline for Completion
Person(s) Responsible
Arbour 2007 The back patio and east entrance are not accessible (architectural)
Tear out cement pads and rebuild patio and east entrance using wood. $4,000
As funds become available
Property Manager
Roosevelt, Smithfield 2011 Side and patio doors are not wheel-
chair accessible (architectural) Renovate doors and surfaces to ensure wheel-
chair accessibility At least $6000
As funds become avail-
able
Property Manager
Main Office 2007
There is no light on the fire alarm sys-tem for use by individuals with a hear-ing impairment (architectural, commu-
nication).
A battery-operated light alarm will be installed.
$1,500(note: pre-
viously misidenti-
fied as $100)
As funds become available
Property Manager
Community Options, Seniors
Program, CO2
2008 Persons served who use wheelchairs
can not get through back door comfort-ably or independently. (architectural).
Install automatic doors $3,500 each As funds become available
Property Manager
Main Office 2011
Doors connecting cubicle/office area from front lobby are not automatic and
impede access of persons served (architectural)
Install automatic doors $3,500 each As funds become available
Property Manager
Co2 2013 Participant whose first language is
Farsi has limited ability to communicate with others (communication)
Recruit a student or volunteer that speaks Farsi
Purchase computer program to provide trans-lation
Find way to provide staff with some training in Farsi
Probably minimal
Achieve one outcome by
January 2015
Community Options
Staff

22
22
Technology Plan Introduction
Community Living Kingston and District relies heavily on the use of computers and electronic information to conduct its everyday business. As such, it is essential that the organization has procedures that ensure that information technology is secure and backed up on a regular basis. It is further necessary that potential threats are minimized such that access to systems is uninter-rupted as much as possible, and that all information is protected and secure.
An effective Technology Plan addresses the following areas: Hardware, Software, Security, Confidentiality, Backup Policies, Dis-aster Recovery Preparedness, Assistive Technology, and Virus Protection. This plan addresses all of those areas of concern.
Development of the Technology Plan
The technology plan was developed by Rob Christian in 2007 and has been revised at least annually since then. The technology plan will be updated again no later than March 2015.
Technology Plan for 2014-15
Area(s) of Concern Confidentiality and Security
Current Practices
Personal information is hosted on CLKD servers. The data is secure through the use of pass-words, user groups, server directory rights, and limited access points to data
CLKD uses Terminal Server and Sonic Wall software to allow remote users to access the network in a secure manner
Only those staff members with a need to access client and Human Resources data will be permitted access to information
All information in the Nucleus Labs Electronic Client Record (ECR) is password protected,
New Items Addressed None
Future Goals Goal: Fine-tuning of policies governing off-site use of ECR needs to occur. Potential Obstacles: None Persons Responsible: Peter Sproul, Steve McKellar Target Date: May 2014
Note: This item had been slated to be addressed in 2013-14, but was shifted to a later time

23
Technology Plan
Area(s) of Concern Assistive Technology
Current Practices
Any agency staff that requires assistive technology is encouraged to bring their need to the attention of their Manager, who will consult with other agency leaders and the IT staff to dis-cuss financial considerations and needed equipment.
A staff member with a hearing impairment has a BlackBerry for assistance with communica-tion issues.
SMART Boards, IPads, and touch-screen computers are available for all stakeholders at
New Items Addressed Since April 2013
A SMART Board for Community Options-1412 was purchased and operationalized in June 2013
Future Goals None
Area(s) of Concern Virus Protection
Current Practices
Network servers and all workstations are protected by virus protection software and spyware/anti-spam programs. Services are purchased and monitored from third-party vendor On-Serve.
Staff are restricted (by administrator password) from installing new programs onto CLKD com-puters.
Non-networked computers at CO2 are monitored with virus protection installed by Rob An-drews.
New Items Addressed Shifted to an upgraded virus protection called ESET .
Future Goals None.

24
24
Technology Plan
Area(s) of Concern Disaster Recovery Preparedness and Back-Up Policies
Current Practices
All data and operating system software located on Association servers are backed up daily.
All servers are imaged daily using a Terra workstation device. This imaging device is stored on-site but at a remote enclosed location in the building to minimize the opportunity of both the servers and Terra device being damaged by external factors (flood, fire, etc).
Terra device holds images going back for two weeks
Data on servers is also backed-up using a Cloud system
At the end of each month, a complete backup requiring two tapes is taken off-site for storage. Both the Terra device and tape back-up device are constantly monitored by an outside third party under the OnServe program.
The image on the Terra device allows for quicker and more efficient manner of recovery following any disaster.
CLKD IT staff, in conjunction with the outside third party are, are responsible for recovering data and technology functioning in the event of an emergency.
All users are directed to maintain company data on the network in order to ensure that the ‘crash’ of an individual workstation is insignificant in terms of lost data and workstation replacement time.
All data on Nucleus Labs ECR is secured by that company.
New Items Addressed Since April 2013
None
Future Goals None
Area(s) of Concern Hardware and Software
Current Practices
All servers located in a locked, environmentally controlled room
All servers and all 54 work stations at 1412 Princess are constantly monitored by a third-party professional
On a monthly basis, the outside third party, through OnServe, provides and Executive Summary Report to CLK IT staff. This report provides a network health score.
In the event that a workstation requires attention, is the responsibility of the user to inform the IT staff by using a “work order”. IT staff will endeavour to complete the assigned work on a timely basis
CLKD replaces and upgrades its 50+ workstation computers, smart phones, and tablets as finances permit. For rea-sons of financial economy, workstation computers are usually replaced only when they cease to function and repair costs are in excess of $75. In most cases, used off-lease computers are then purchased at an approximate cost of $150.00. The vast majority of users require only minimal computing speed, power, and storage and the off-lease re-placements easily satisfy user needs. Approximately 10 users have higher needs for computing speed/ power and as these users approach the limits of older computers, the older computers are rotated to users with lesser requirements. For these 10 users, new computer workstations are usually purchased at an approximate cost of $550 per computer.
CLKD's internet access is 10Mb/second dedicated wireless. The upload and download speeds are both 10Mb/second. This ensures the reliability and speed of internet access
Organization has photocopiers with scanning capabilities, including Optical Character Recognition format that allows for scanned documents to be edited.
SQL Database supports performance improvements to Attendance Enterprise software

25
Technology Plan
Area(s) of Concern Hardware and Software (continued)
Current Practices
Greg Farrington, Rob Christian, and Matt Luck are all internally assigned to assist with hardware/software problems.
Residential locations and CO2 connected to remote network.
Nucleus Labs system is monitored by that company, with a contract governing the agreement between them and CLK.
New Items Addressed Since April 2013
Fifteen workstation computers were replaced in 2013-14.
Upgraded version of Microsoft office purchased and installed.
Tablets, smartphones purchased to assist staff as needed to support use of Nucleus Labs ECR.
Router at main office replaced and upgraded.
Future Goals Goal: Replace at least fifteen computers. Potential Obstacles: Cost of at least $5000 Persons Responsible: Matt Luck, Greg Farrington Target Date: April 2015
Goal: Development /refinement of policies related to usage of Nucleus Labs programs needed Potential Obstacles: None Persons Responsible: Peter Sproul, Steve McKellar Target Date: May 2014 Note: This was originally slated to occur in 2013-14, but was shifted to a later time period.
Goal: Operationalize new phases of Nucleus Labs system (client scheduling and Personal Outcomes Management System). Potential Obstacles: None Persons Responsible: Management Team Target Date: April 2014
Area(s) of Concern Other– Oversight
Items Previously Ad-dressed
Hiring of new accountant had been partially designed to free up time from Finance Director and Executive Assistant to dedicate to IT issues. This has not been sufficient to meet need/demand.
Future Goals
Goal: Hiring of a dedicated IT staff Potential Obstacles: Costs are potentially significant. Persons Responsible: Peter Sproul, Matt Luck Target Date: May 2015, to be assessed on an ongoing basis.
26
26
Cultural Competence and Diversity Plan 1. Preamble Community Living Kingston believes that embracing cultural diversity in all aspects of the organization (staffing, service delivery, policy development, volunteer recruitment, etc.) enhances and strengthens the organization and improves service to individuals and families. Community Living Kingston is committed to articulating, honouring and upholding principles respecting the culture and diversity of all persons, including the stakeholders of the organization. All procedures and practices within Community Liv-ing Kingston will consistently reflect support and respect for cultural differences and richness of diversity.
Community Living Kingston will be sensitive and respectful to the culture and diversity of individuals in regard to the following:
Language
Ethnicity
Gender
Sexual Orientation
Spiritual Beliefs
Age
Socio-Economic Status
Disability
Community Living Kingston will not tolerate, under any circumstances, any actions, words, gestures or behaviour of any sort that discriminates in any manner or at any level towards a person or persons based on the aspects of diversity listed above. Policies and practices of the organization will consistently reflect this approach.
2. Overall Approach to Culture and Diversity Policy Development: Community Living Kingston maintains, and will continue to develop policy that clearly outlines the princi-ples and practices of cultural diversity. These include:
Board Policy #16, Rights of Participants
HR Policy #1.01, Staff Code of Conduct
HR Policy #1.03, Hiring
HR Policy #1.08, Harassment/Sexual Harassment
HR Policy #2.06, Cultural Competency

27
Cultural Competency and Diversity Plan
3. Specific Strategies Related to Cultural Diversity Issue Specific Initiatives: Initiatives that ensure full inclusion of cultural groups into the activities of the organization will be conduct-ed as appropriate, warranted and necessary. An illustration of this is the initiative that focuses on French Language Services and the goals therein.
Workplace and Service Delivery Accommodations: Community Living Kingston will, where reasonable and appropriate, make ac-commodations to the workplace and within service delivery to enable individuals from particular cultural backgrounds to participate fully in the activities of the organization.
Demographic Data: As a means of understanding and appreciating cultural diversity on a local level, Community Living Kingston will routinely collect and analyze data on stakeholder diversity. This will be reported in the Annual Management Report to illustrate the importance of diversity in the organization.
Agency Leadership: Community Living Kingston will strive to have at least one consumer on the Board of Directors at all times. Consumer representation at the volunteer leadership level of the organization will remain a priority for the organization.
Performance Objectives: Where appropriate, Community Living Kingston will set performance targets related to cultural diversity. This will enable the organization to have measurable objectives related to diversity. This will be reported in the Annual Manage-ment Report along with other performance measures.
Hiring Practices: Community Living Kingston will endeavour to hire staff members from various cultural backgrounds. Diversity among the staff will strengthen the organization within the human services sector and will position the Association to offer valued and individually tailored services to a diverse group of stakeholders over time.
Communications: Community Living Kingston will work to ensure that internal and external communications (newsletters, Annual Management Report, phone system, website) will remain sensitive to issues of language and presented in understandable formats. This will include developing communications in both official languages and offering written material in a manner that is sensitive to the needs and cultural background of stakeholders.
Rights of Participants: Persons served by programs of Community Living Kingston will continue to have their rights shared with them prior to the delivery of services and annually thereafter. An annual review of the organization’s performance with respect to upholding the rights of the individual will also be conducted. This will include the assurance that rights related to diversity are hon-oured and respected at all times.
Code of Conduct: The Code of Conduct for all staff members and volunteers will specifically address respect for cultural diversity.

28
28
Plan to Secure Input from Stakeholders The following plan outlines the agency’s plan to secure input from its three groups of stakeholders: Per-sons Served, Staff, and Other Stakeholders (Community Partners, Family Members, Funders, etc.).
Year Persons Served Staff Other Stakeholders
This plan was reviewed by Jeff Harrison in December 2013 and will be reviewed again no later than January 2015.
2014 and every third
year thereaf-ter
It was clear that respondents were suffering from ‘survey fa-tigue’, as long satisfaction sur-
veys had been completed for the past seven years.
To combat this, a simple one-question measure of satisfaction has been placed on a postage-
paid postcard and given to partici-pants at the time of their annual
planning meeting.
CCRCS continued to do their regular long-form survey, as it is
required by their funder.
Staff were not surveyed specifically for satisfaction in 2013-14
If surveys have not been adminis-tered to staff again since 2012, they will become the “other stakeholders”
to receive a survey in 2015.
The agency distributed a survey to elicit feedback specifically from family members and advocates.
2015 and every third
year thereaf-ter
The one-question measure of satisfaction in post card format will be continued. CCRCS will continue with their own survey
If staff have not been surveyed for satisfaction since 2012, they will be-come the ‘other stakeholders’ group
to be surveyed in 2015.
No other stakeholders will be sur-veyed.
2016 and every third
year thereaf-ter
A decision will be made on whether or not to continue with
the one-question measure of sat-isfaction in post card format, or to
do a long-form survey again. CCRCS will continue with their
own survey
Agency leaders will consider whether or not a specific staff survey should be ad-ministered again, or whether input from
staff should be generated strictly through other avenues such as meetings, focus
groups, presentations, etc.
If surveys have not been administered to staff again since 2015, they will become
the “other stakeholders” to receive a survey in 2018.
The agency will design a survey to elicit feedback specifically from
community partners.
Other stakeholders will be invited to provide feedback on an ongoing
basis using the avenues noted elsewhere.
29
Plan to Distribute Performance Improvement Information
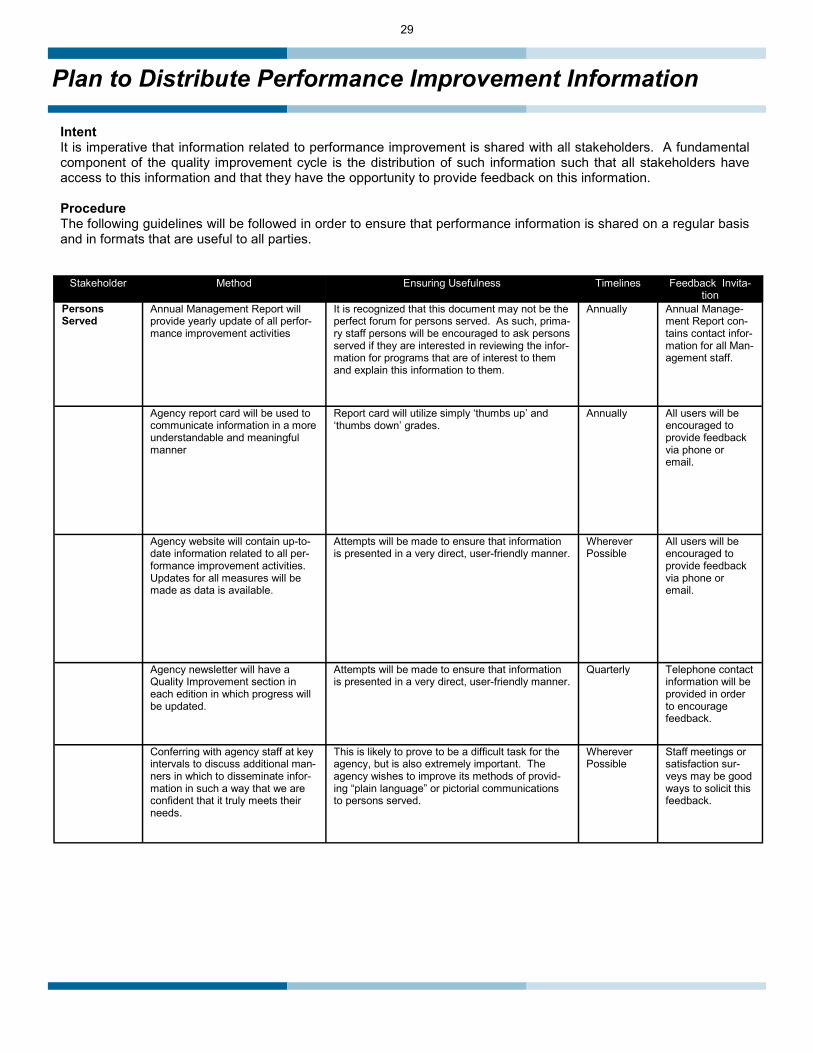
Intent It is imperative that information related to performance improvement is shared with all stakeholders. A fundamental component of the quality improvement cycle is the distribution of such information such that all stakeholders have access to this information and that they have the opportunity to provide feedback on this information. Procedure The following guidelines will be followed in order to ensure that performance information is shared on a regular basis and in formats that are useful to all parties.
Stakeholder Method Ensuring Usefulness Timelines Feedback Invita-tion
Persons Served
Annual Management Report will provide yearly update of all perfor-mance improvement activities
It is recognized that this document may not be the perfect forum for persons served. As such, prima-ry staff persons will be encouraged to ask persons served if they are interested in reviewing the infor-mation for programs that are of interest to them and explain this information to them.
Annually Annual Manage-ment Report con-tains contact infor-mation for all Man-agement staff.
Agency report card will be used to communicate information in a more understandable and meaningful manner
Report card will utilize simply ‘thumbs up’ and ‘thumbs down’ grades.
Annually All users will be encouraged to provide feedback via phone or email.
Agency website will contain up-to-date information related to all per-formance improvement activities. Updates for all measures will be made as data is available.
Attempts will be made to ensure that information is presented in a very direct, user-friendly manner.
Wherever Possible
All users will be encouraged to provide feedback via phone or email.
Agency newsletter will have a Quality Improvement section in each edition in which progress will be updated.
Attempts will be made to ensure that information is presented in a very direct, user-friendly manner.
Quarterly Telephone contact information will be provided in order to encourage feedback.
Conferring with agency staff at key intervals to discuss additional man-ners in which to disseminate infor-mation in such a way that we are confident that it truly meets their needs.
This is likely to prove to be a difficult task for the agency, but is also extremely important. The agency wishes to improve its methods of provid-ing “plain language” or pictorial communications to persons served.
Wherever Possible
Staff meetings or satisfaction sur-veys may be good ways to solicit this feedback.

30
30
Plan to Distribute Performance improvement information
Stake-holder
Method Ensuring Usefulness Timelines Feedback Invi-tation
Personnel Annual Management Report is available at all program locations. All staff will receive the report elec-tronically via com-box. All staff who request an individual copy of the report will be provided with one.
The Annual Management Report should be particularly useful to agency staff, as it con-tains information provided by them.
Annually Staff are encour-aged to contact the Quality Im-provement lead to provide feed-back.
Updates are provided at staff meet-ings as requested by staff or super-visors.
This format allows for the information to be presented directly to staff in a face-to-face forum.
Wherever Possible
Interactive na-ture of the forum invites feedback and discussion.
Agency website will contain up-to-date information related to all per-formance improvement activities. Updates for all measures will be made as data is available.
Attempts will be made to ensure that infor-mation is presented in a very direct, user-friendly manner.
Wherever Possible
All users will be encouraged to provide feed-back via phone or email.
Agency newsletter will have a Qual-ity Improvement section in each edition in which progress will be updated.
Attempts will be made to ensure that infor-mation is presented in a very direct, user-friendly manner
Quarterly Telephone con-tact information will be provided in order to en-courage feed-back.
Performance Improvement infor-mation will be posted in program locations and will be distributed via email where possible.
This information will be very “watered down” and will only provide a basic outline of tar-gets met or not met.
Wherever Possible
Ongoing updates will be compiled and shared with program staff as requested and in whatever manner makes the most sense for each team.
Ongoing updates will be delivered in what-ever format makes sense—verbal, written, presentation style, etc.
As often as pos-sible.
Potentially inter-active nature of the forum invites feedback and discussion.
Bulletin Boards and combox system in Nucleus Labs will be used to con-vey information wherever possible.
This will largely be in the same format as information distributed to program locations.
Wherever Possible

31
Plan to Distribute Performance Improvement Information
Note This plan coexists with other documents detailing the Data Collection/QI Process and that may specify the timelines by which to collect data for measures. Such documents include, but are not limited to, the Overview of the Quality Improvement Process included in the Annual Management Report. Review This plan will be reviewed by the Quality Improvement Lead on an ongoing basis. It was last updated in December 2013 and will be reviewed in January 2015.
Stakeholder Method Ensuring Usefulness Timelines Feedback Invi-tation
Other Stake-holders (Ministry, Families, Community Partners)
Annual Management Report is mailed to officials from the Ministry of Community and Social Services. Report is also available at Annual General Meeting, which is widely advertised. Notices in the newslet-ter and on the website notify all readers of the availability of the Annual Management Report to all who wish to have a copy. Alterna-tively, all concerned may access a copy of only those sections that interest them.
The Annual Management Report is very detailed and should contain all of the information desired by other stakeholders.
Annually Annual Manage-ment Report contains contact information for all management staff. Managers are available at Annual General Meeting to an-swer questions as needed.
As possible, agency website will contain up-to-date information related to all performance improve-ment activities. Updates for all measures will be made as data is available.
Information will be presented in a very direct, user-friendly manner.
Wherever Possible
All users will be encouraged to provide feed-back via phone or email.
Agency newsletter will have a Quality Improvement section in each edition in which progress in each service area will be updated.
Information will be presented in a very direct, user-friendly manner.
Quarterly Telephone con-tact information will be provided in order to en-courage feed-back.

32
32
Review of Organization’s Policies and Procedures
Best practices suggest that strong organizations ensure that the full content of their Policies and Proce-dures manual is reviewed on an annual basis. This is also required by the organization’s CARF accredita-tion. The following document outlines how this practice was completed in 2013-14.
Section 1- General
Policy Number Policy Name Review Date Action Taken
(Updated or Re-mained As Is)
Reviewed By
Resolution 01 Mission Statement March of 2014 Remained as is Executive Director Resolution 02 Membership March of 2014 Remained as is Executive Director
Board 01 Board Mandate March of 2014 Remained as is Executive Director
Board 02 Role and Responsibilities of the Board Updated Feb 2013
Implemented June 2013 Updated Board of Directors
Board 03 Individual Responsibilities of Directors Updated Feb 2013
Implemented June 2013 Updated Board of Directors
Board 04 Director's Code of Conduct Updated Feb 2013
Implemented June 2013 Updated Board of Directors Board 05 Education March of 2014 Remained as is Executive Director Board 06 Child Care Resource Consultant Services March of 2014 Remained as is Executive Director Board 07 Finance March of 2014 Remained as is Executive Director Board 08 Policy Governance Model March of 2014 Remained as is Executive Director Board 09 ODSP Trusteeship March of 2014 Remained as is Executive Director Board 10 Financial Requests March of 2014 Remained as is Executive Director Board 11 Leadership Development Bursary March of 2014 Remained as is Executive Director Board 12 Investments March of 2014 Remained as is Executive Director Board 13 Residential Services March of 2014 Remained as is Executive Director Board 14 Volunteer Involvement March of 2014 Remained as is Executive Director Board 15 Family Involvement March of 2014 Remained as is Executive Director Board 16 Rights of Participants March of 2014 Remained as is Executive Director
Board 17 Succession Planning Updated Feb 2013
Implemented June 2013 Updated Board of Directors Board 18 Ethical Code of Corporate Responsibility March of 2014 Remained as is Executive Director Board 19 Executive Director Role and Compensation March of 2014 Remained as is Executive Director
Board 20 Board Orientation, Education and Develop-
ment March of 2014 Remained as is Executive Director GA 01 Privacy March of 2014 Remained as is Executive Director
GA 02 Search Warrant, Summons, Subpoena, and
Investigations March of 2014 Remained as is Executive Director
GA 03 Prevention of Waste, Fraud, Abuse, and
Wrongdoing March of 2014 Remained as is Executive Director GA 04 Computer and Network Use March of 2014 Remained as is Executive Director GA 05 Organizational Mentoring March of 2014 Remained as is Executive Director GA 06 Logo and Trademarks March of 2014 Remained as is Executive Director

33
Review of Organization’s Policies and Procedures
Section 2– Operations
Policy Number Policy Name Review Date Action Taken
(Updated or Remained As Is) Reviewed By
1.01 Confidentiality
Jan 7 2013 Updated Manager, Service
Coordination 1.02 Fire Safety March of 2014 Reviewed, remained as is Operations Director
1.03 Home and Property of Persons Served March of 2014 Reviewed, remained as is Operations Director
1.04 Medication Monitoring and Management March of 2014 Reviewed, remained as is Operations Director 1.05 Finance of Persons Served March of 2014 Reviewed, remained as is Operations Director
1.06 Eligibility, Service Provision and Dis-
charge March of 2014 Reviewed, remained as is Operations Director 1.07 Use of Pornography by Persons Served March of 2014 Reviewed, remained as is Operations Director 1.08 Sexuality March of 2014 Reviewed, remained as is Operations Director 1.09 Visitors and Guests March of 2014 Reviewed, remained as is Operations Director 1.10 Pets and Service Animals March of 2014 Reviewed, remained as is Operations Director 1.11 Nutrition March of 2014 Reviewed, remained as is Operations Director 2.01 Individualized Planning March of 2014 Reviewed, remained as is Operations Director
2.02 French Language Services 08-Jan-14 New policy HR Director
2.03 Service Quality March of 2014 Reviewed, remained as is Operations Director 2.04 Family Home-- Full Time and Respite March of 2014 Reviewed, remained as is Operations Director 2.05 Abuse of Persons Served 03-Mar-14 Updated Operations Director 2.06 Safety and Challenging Behaviour March of 2014 Reviewed, remained as is Operations Director 2.07 Positive Behaviour Support Plans March of 2014 Reviewed, remained as is Operations Director 2.08 Use of Physical Restraint March of 2014 Reviewed, remained as is Operations Director 2.09 Safe Lifting and MSD Prevention March of 2014 Reviewed, remained as is Operations Director 2.1 Handling of Persons Served March of 2014 Reviewed, remained as is Operations Director
2.11 Bathing March of 2014 Reviewed, remained as is Operations Director
2.12 Medical Information, Decisions, and Sup-
port March of 2014 Reviewed, remained as is Operations Director 3.01 Standard Administrative Practices 22-Jan-14 Updated Operations Director
3.02 Reporting Critical Incidents March of 2014 Reviewed, remained as is Operations Director 3.03 Internal Investigation Process March of 2014 Reviewed, remained as is Operations Director 3.04 Central Client Files March of 2014 Reviewed, remained as is Operations Director 3.05 Conflict of Interest 14-Nov-13 Updated HR Director 3.06 Standards for Home Cleanliness March of 2014 Reviewed, remained as is Operations Director 3.07 Smoking March of 2014 Reviewed, remained as is Operations Director 3.08 Complaint Resolution March of 2014 Reviewed, remained as is Operations Director
3.09 Purchased Service Arrangements
Jan 7 2013 Updated Manager, Community
Options
3.10 Enhanced Support Requests-- CCRCS
March of 2014 Reviewed, remained as is Operations Director 3.11 Equipment Maintenance March of 2014 Reviewed, remained as is Operations Director 4.01 Emergency Response Process March of 2014 Reviewed, remained as is Operations Director 4.02 Evacuation March of 2014 Reviewed, remained as is Operations Director
4.03 Telephone, Bomb, and Personal Threats March of 2014 Reviewed, remained as is Operations Director 4.04 Natural Disasters and Utility Failures March of 2014 Reviewed, remained as is Operations Director
4.05 Medical Emergencies or Client Distress March of 2014 Reviewed, remained as is Operations Director 4.06 Violent and Threatening Situations March of 2014 Reviewed, remained as is Operations Director

34
34
Review of Organization’s Policies and Procedures
Section 3– Human Resources
Policy Number Policy Name Review Date Action Taken (Updated or Remained As Is) Reviewed By
1.01 Staff Code of Conduct March of 2014 Reviewed; remained as is HR Director
1.02 Criminal Reference Check March of 2014 Reviewed; remained as is HR Director
1.03 Hiring March of 2014 Reviewed; remained as is HR Director
1.04 Orientation March of 2014 Reviewed; remained as is HR Director
1.05 Staff Training March of 2014 Reviewed; remained as is HR Director
1.06 Performance Appraisals March of 2014 Reviewed; remained as is HR Director
1.07 Scheduling Hours of Work March of 2014 Reviewed; remained as is HR Director
1.08 Harassment March of 2014 Reviewed; remained as is HR Director
1.09 Alcohol and Drug Use March of 2014 Reviewed; remained as is HR Director
1.1 Vehicles, Transportation and Licensing March of 2014 Reviewed; remained as is HR Director
1.11 Benefits While On Leave March of 2014 Reviewed; remained as is HR Director
1.12 Salary Advances March of 2014 Reviewed; remained as is HR Director
1.13 Compensation for Non-Union Employees March of 2014 Reviewed; remained as is HR Director
1.14 Privacy Protection for Employees March of 2014 Reviewed; remained as is HR Director
1.15 Workplace Violence Prevention March of 2014 Reviewed; remained as is HR Director
1.16 Discipline March of 2014 Reviewed; remained as is HR Director
1.17 Attendance Management Jan 19 2014 Updated HR Director
1.18 Use of Social Media March of 2014 Reviewed; remained as is HR Director
1.19 Use of Electronic Records System for Persons
Served March of 2014 Reviewed; remained as is HR Director
2.01 Employee Assistance Program March of 2014 Reviewed; remained as is HR Director
2.02 Student and Volunteer Placement March of 2014 Reviewed; remained as is HR Director
2.03 Staff Recognition March of 2014 Reviewed; remained as is HR Director
2.04 Leave for External Work March of 2014 Reviewed; remained as is HR Director
2.05 Self-Funded Leave March of 2014 Reviewed; remained as is HR Director
2.06 Cultural Competency March of 2014 Reviewed; remained as is HR Director
2.07 Personnel Files March of 2014 Reviewed; remained as is HR Director
3.01 Occupational Health and Safety March of 2014 Reviewed; remained as is HR Director
3.02 Joint Health and Safety Committee March of 2014 Reviewed; remained as is HR Director
3.03 Duties and Responsibilities March of 2014 Reviewed; remained as is HR Director
3.04 Workplace Safety and Insurance March of 2014 Reviewed; remained as is HR Director
3.05 Early and Safe Return To Work March of 2014 Reviewed; remained as is HR Director
3.06 Workplace Inspections March of 2014 Reviewed; remained as is HR Director
3.07 Accident Investigations March of 2014 Reviewed; remained as is HR Director
3.08 Work Refusal March of 2014 Reviewed; remained as is HR Director
3.09 Communicable Diseases March of 2014 Reviewed; remained as is HR Director
3.1 Infection Control March of 2014 Reviewed; remained as is HR Director
3.11 WHMIS March of 2014 Reviewed; remained as is HR Director
3.12 Cell Phones and Driving March of 2014 Reviewed; remained as is HR Director
3.13 Slips, Trips, and Falls March of 2014 Reviewed; remained as is HR Director
3.14 Respiratory Protection Program March of 2014 Reviewed; remained as is HR Director
3.15 Pandemic Preparedness and Response Plan March of 2014 Reviewed; remained as is HR Director

35
Review of Organization’s Policies and Procedures
Section 4– Finance
Policy Number Policy Name Review Date Action Taken (Updated or Remained As Is) Reviewed By
1.01 Distribution of Financial Information March of 2014 Reviewed, remained as is Director of Finance
1.02 Conflict of Interest March of 2014 Reviewed, remained as is Director of Finance
1.03 Financial Reporting March of 2014 Reviewed, remained as is Director of Finance
1.04 Contracts March of 2014 Reviewed, remained as is Director of Finance
1.05 Officers and Signing Officers March of 2014 Reviewed, remained as is Director of Finance
1.06 Insurance Coverage 03-Jun-13 Updated Director of Finance
1.07 Capital Assets March of 2014 Reviewed, remained as is Director of Finance
1.08 Risk Management March of 2014 Reviewed, remained as is Director of Finance
2.01 Banking March of 2014 Reviewed, remained as is Director of Finance
2.02 Electronic Banking March of 2014 Reviewed, remained as is Director of Finance
2.03 Cheque Signing Authority March of 2014 Reviewed, remained as is Director of Finance
2.04 Borrowing March of 2014 Reviewed, remained as is Director of Finance
2.05 Investments March of 2014 Reviewed, remained as is Director of Finance
2.06 Trusts and Specific Purpose Funds March of 2014 Reviewed, remained as is Director of Finance
3.01 Budgets March of 2014 Reviewed, remained as is Director of Finance
3.02 Authorization to Commit Resources March of 2014 Reviewed, remained as is Director of Finance
3.03 Accounts Receivable and Invoicing March of 2014 Reviewed, remained as is Director of Finance
3.04 Cash Receipts March of 2014 Reviewed, remained as is Director of Finance
3.05 Accounts Payable and Payment Pro-
cessing March of 2014 Reviewed, remained as is Director of Finance
3.06 Travel Policy March of 2014 Reviewed, remained as is Director of Finance
3.07 Petty Cash March of 2014 Reviewed, remained as is Director of Finance
3.08 Consumer Directed Funds March of 2014 Reviewed, remained as is Director of Finance
3.09 Family Home Program March of 2014 Reviewed, remained as is Director of Finance
3.1 Payroll Processing Oct 1 2013 Updated Director of Finance
3.11 Time Sheets March of 2014 Reviewed, remained as is Director of Finance
3.12 Fundraising March of 2014 Reviewed, remained as is Director of Finance
3.13 Donations March of 2014 Reviewed, remained as is Director of Finance
3.14 Donations in Kind March of 2014 Reviewed, remained as is Director of Finance
3.15 Capital Donations Terms and Conditions March of 2014 Reviewed, remained as is Director of Finance
3.16 Hospitality March of 2014 Reviewed, remained as is Director of Finance
3.17 Purchasing and Procurement March of 2014 Reviewed, remained as is Director of Finance
3.18 Road Transportation March of 2014 Reviewed, remained as is Director of Finance
3.19 Child Care Wage Subsidy Distribution March of 2014 Reviewed, remained as is Director of Finance
3.2 Community Options Transportation January of 2014 Reviewed, remained as is Manager, Community Options
3.21 Use of Facilities by Outside Organiza-
tions March of 2014 Reviewed, remained as is Director of Finance
3.22 Purchasing Card Program-US Bank New Policy Created March 20, 2013. Implemented
June 2013 Director of Finance

36
36
Satisfaction Surveys—Persons Served (Community Options,
Family Home, Residential Services, Supported Independent Living, Family Support, Respite)
The organization’s Board of Directors will review all survey results in September 2014 as part of it’s cyclical tasks.
Survey Method At the time of their annual planning meeting, or at another opportune time, persons served and/or their families were given a postcard with one question related to satisfaction with services. This post card was pre-stamped and had the organization’s ad-dress on it. Persons served were asked to fill out the post card and mail it back to the organization. This process started in Jan-uary 2014.
This method, including the single-question format, was chosen because of the organization’s feeling that after seven years, re-spondents are suffering from a certain amount of ‘survey fatigue’. This postcard method will remain in place through 2015, with a full survey again being distributed in 2016.
Response Rate Because of the new method by which surveys are being distributed, no response rate is able to be tracked.
Response Distribution Residential Services 12.5% Community Options 75.0% SIL 12.5% Respite Services 25.0% Family Home 12.5% Family Support 25.0% Many respondents indicated that they were served by multiple programs. Therefore, the above figures will not add up to 100%
Target For all items to receive a positive rating of more than 90%. (Positive rating meaning a response of ‘mostly satisfied’ or ‘extremely satisfied’
Outcome
All items received a positive rating of 100%. Therefore, the target was achieved. Further analysis (see below) reveals that the target was met for every item in every program.
Program Percentage of Positive Responses Goal Met?
Residential Services 100% Met
Community Options 100% Met
SIL 100% Met
Respite Services 100% Met
Family Home 100% Met
Family Support 100% Met

37
Satisfaction Surveys— Persons Served (Community Options, Residential Services, SIL, Family Support, Family Home, Respite)
Limitations Survey results are based on only twenty-four responses, and need to be interpreted with the understanding that it represents a small number of individuals supported .
Key Findings/Trends The chart (below) shows the responses percentage for the question posed. On a program by program basis, the response rate between ‘extremely’ and ‘mostly’ satisfied was about the same (i.e., around 50% for each program).
Interpretation of Results/Further Outcome Analysis This is an admittedly simple satisfaction tool; as noted elsewhere, the agency’s concern around survey fatigue resulted in the de-velopment of this tool, which will be used for two consecutive years, with a full survey being completed in the subsequent third year.
The design of this tool allows for feedback to be solicited throughout the year, as opposed to in one ‘blast’ of survey distribution. Because this was developed only in early 2014, the response rates for the survey are still quite low.
Follow-Up Completed None formal has resulted from these surveys.
Proposed Action Plan Feedback will continue to be solicited through the year at the time of the annual planning meeting, using this format.
Future Monitoring This survey method will continue through 2014. The satisfaction target will remain at 90%.
Question: How satisfied are you with the services you have received
Response Percentage of Responses
Extremely Satisfied 50%
Mostly Satisfied 50%
Only Satisfied Some of the Time 0%
Not Very Satisfied 0%

38
38
Satisfaction Surveys— Persons Served— Child Care Resource Consultant Services
The organization’s Board of Directors will review all survey results in September 2014 as part of it’s cyclical tasks.
Survey Method Surveys were distributed to families using either email and a link to SurveyMonkey or a paper survey, depending on the preference of the family. Surveys were distributed in November 2013.
Response Distribution Geographic Distribution: City of Kingston 88.5% Frontenac Township 11.5% Other Areas 0%
Length of Time in Service: Less than six months 9.2% Six to twelve months 3.8% One to two years 30.8% More than two years 46.2%
Age of Child in Service: Birth to two years 3.8% Two to six years 73.1% Six to twelve years 23.1%
Target For more than 90% of respondents to indicate a satisfaction level of at least above average.
Outcome/Results: Question: Please rate your level of satisfaction with services received through CCRCS: Outstanding 65.4% Above Average 26.9% Satisfactory 7.7% Unsatisfactory 0.0% A total of 92.3% of respondents indicated their satisfaction level as at least above average. Therefore, the target was met.
Limitations: None.

39
Satisfaction Surveys— Persons Served– Child Care Resource Consultant Services
Other Results Respondents were asked a number of other questions, with the following results, with comparison to the 2012 results.
Full questions posed (respondents asked to respond ‘yes’ or ‘no’): When you first started services, was your intake completed in a timely manner? The Resource Consultant is flexible in meeting our communication needs (emails, phone calls) The information shared with me by the Resource Consultant is useful The Resource Consultant treats our family with respect and dignity I am aware that my child has an Individual Program Plan (IPP) The Resource Consultant was helpful in assisting with our child’s transition to school (if applicable) The Resource Consultant makes us aware of other services in the community as needed.
Selected Comments:
Key Findings/Trends: Overall satisfaction levels increased for the fourth consecutive year as noted in the graph at right:
- [Staff person] has become like a part of our family! - Our Resource Consultant has been one of the best supports and sources of information for us ever since we started working with her nearly 7 years ago. I don't know what we would have done (or would do) without her. - [Staff person] has been awesome with my son! She has giveaway great ideas to use at home and even sup-plied me with time books and resources to use. - [Staff person] was our resource consultant. She was always keep us informed about my daughter's progress. She has been our excellent helper and gave us a lot of guidance and feedback in helping my daughter to move forward. All in all, I'm very impress of her services!!! Job well done!!!! - [Staff person] is OUTSTANDING! She helped our daughter in so many ways and REALLY made her transition to school easy and comfortable (both for our daughter and us as parents). I've been so impressed with [staff] during our whole time, she was always extremely helpful, friendly, supportive and understanding. I honestly cannot say enough good things about her!
100.0% 100.0% 100.0% 100.0%
92.0% 92.0%
87.5%
96.2%
100.0% 100.0% 100.0% 100.0%
94.1%
84.6%
80.0%
90.0%
100.0%
Timely Intake? Flexible RC? Receive UsefulInfo?
Dignity andRespect?
IPP? Helpful SchoolTransition?
Aware of otherservices?
Percentage of Respondents Indicating Satisfaction
2012-13 2013-14
86.70% 87.20%
92% 92.30%
85.00%
90.00%
95.00%
100.00%
2010-11 2011-12 2012-13 2013-14
Overall Satisfaction Level, CCRCS Surveys
40
40
Satisfaction Surveys— Persons Served– Child Care Resource Consultant Services
Discussion: For a number of reasons, response rates were not formally tracked this year.
The percentage of respondents who rated services as outstanding increased by 9.4% this year.
As has consistently been the case, satisfaction levels did not vary based upon the demographic variables measured.
Follow-Up Completed: None specific, other than to ensure strong program practices and responsive services
Proposed Action Plan: No formal action plan is required around any segment of what was measured, given the high satisfaction levels evident.
Future Monitoring: Consumer satisfaction will again be measured in late 2014, with the overall satisfaction level targeted at 90%.

41
Satisfaction Surveys— Other Stakeholders— Family Members/Advocates
The organization’s Board of Directors will review all survey results in September 2014 as part of it’s cyclical tasks.
Survey Method Surveys were sent to families in a manner that fit their correspondence preference: Either an email with a link to the website Sur-veyMonkey.com, or via a paper survey.
Response Rate The response rate was not tracked for this survey. Anecdotally, the total number of responses was very light, which was disap-pointing to the agency.
Target For each item to have a positive response rate of at least 85%
Outcome/Results: As noted in the chart below, every item had a positive response rate of at least 87.5%. Therefore, the target was reached.
Relationship to Consumer: Family Member 87.5% Advocate/Friend 12.5%
Program(s) Involved (multiple could be chosen): SIL 40.0% Community Options 40.0% Residential Services 30.0% Respite 20.0% I’m Not Sure 10.0% Family Home 0.0%
Question Mostly Yes Mostly No I am always treated with respect by the staff members at Community
Living Kingston 100% 0% My input and opinion is valued by Community Living Kingston and I
have the opportunity to express those opinions 100% 0% Community Living Kingston addresses my questions or concerns
quickly 100% 0% The services offered by Community Living Kingston promote inde-
pendence 100% 0% The services offered by Community Living Kingston help my family
member/friend to be more included in the community 100% 0% I understand and am included in the planning process that happens
with my family member/friend each year 87.50% 12.50% The planning process that happens each year with my family mem-
ber/friend is valuable and important 87.50% 12.50% Program locations and the main office are clean and welcoming 100% 0%
Newsletters, pamphlets, and the website are informative and easy to read 100% 0%

42
42
Satisfaction Surveys— Other Stakeholders– Family Members/Advocates
Selected Comments: - Wonderful, caring staff and the respect they show to their clients - Excellent care provided by staff - Community Living really cares about the individual client and their needs, it never seems to be about money. It is all about what is best for the individual and programs are perfectly tailored - Make the building more accessible for people who use wheelchairs
Discussion: The overall response pattern was very strong, and this, combined with the comments, suggests a high level of satisfaction with services. The low overall number of responses is disappointing and makes it difficult to figure out how meaningful the data is, however.
Action Plan: If there is anything to be taken from the survey results, it is that the importance of the planning process is still not felt by all family members/advocates, which is an ongoing struggle on the agency's part. Further attention will need to be paid to encouraging family members to be more invested in the survey process.
Further Monitoring: Family members/advocates are not due to be formally surveyed again until at least 2016.

43
Community Options Division— Characteristics of Persons Served
Number of Persons Served: 133
Demographic Information
Barriers
Note: For Communication and Transportation, percentages may add up to more than 100%, as multiple categories could be selected if applicable.
62.41%
37.59%
0.00%
10.00%
20.00%
30.00%
40.00%
50.00%
60.00%
70.00%
Male Female
Gender of Persons Served
25.56%30.83%
16.54% 14.29%11.28%
1.50%0.00%
5.00%
10.00%
15.00%
20.00%
25.00%
30.00%
35.00%
19-29 30-39 40-49 50-59 60-69 70+
Age of Persons Served
10.53% 11.28%
80.45%
9.77%0.00%
10.00%20.00%30.00%40.00%50.00%60.00%70.00%80.00%90.00%
Gestural AlternativeLanguage
Verbal Non-Verbal
Communication Style of Persons Served
27.13%
15.50%
30.23%27.13%
0.00%
5.00%
10.00%
15.00%
20.00%
25.00%
30.00%
35.00%
High Level Limited Moderate None
Family Involvement with Persons Served
36.09%27.07%
11.28%
67.67%
0.00%
10.00%
20.00%
30.00%
40.00%
50.00%
60.00%
70.00%
80.00%
Accessible Public Transit Walk/Bike ProvidedRides
Type of Transportation Accessed By Persons Served

44
44
Residential Services Division— Characteristics of Persons Served
Number of Persons Served: 52
Demographic Information
Barriers
73.08%
26.92%
0.00%10.00%20.00%30.00%40.00%50.00%60.00%70.00%80.00%
Male Female
Gender of Persons Served
3.85%12.82%
21.15%
34.62%
25.00%
5.77%0.00%
5.00%
10.00%
15.00%
20.00%
25.00%
30.00%
35.00%
40.00%
19-29 30-39 40-49 50-59 60-69 70+
Age of Persons Served
Note: For Communication and Transportation, percentages may add up to more than 100%, as multiple categories could be selected if applicable.
26.92% 25.00%
59.62%
17.31%0.00%
10.00%20.00%30.00%40.00%50.00%60.00%70.00%
Gestural AlternativeLanguage
Verbal Non-Verbal
Communication Style of Persons Served
25.00% 25.00% 9.62%
96.15%
0.00%10.00%20.00%30.00%40.00%50.00%60.00%70.00%80.00%90.00%
100.00%
Accessible Public Transit Walk/Bike ProvidedRides
Transportation of Persons Served
25.49% 23.53%
33.33%
17.65%
0.00%
5.00%
10.00%
15.00%
20.00%
25.00%
30.00%
35.00%
High Level Limited Moderate None
Family Involvement with Persons Served

45
Respite Services— Characteristics of Persons Served
Demographic Information
Number of Persons Served: 57
Barriers
61.40%
38.60%
0.00%
10.00%
20.00%
30.00%
40.00%
50.00%
60.00%
70.00%
Male Female
Gender of Persons Served
21.05%15.79%
26.32%
15.79%12.28%
7.02% 0.00% 1.75%0.00%
5.00%
10.00%
15.00%
20.00%
25.00%
30.00%
Lessthan
13
13-19 20-29 30-39 40-49 50-59 60-69 70+
Age of Persons Served
61.40%
42.11%
0.00%
10.00%
20.00%
30.00%
40.00%
50.00%
60.00%
70.00%
Family Home Group
Type of Respite Accessed
1.75%
15.79%19.30%
3.51%0.00%
5.00%
10.00%
15.00%
20.00%
25.00%
Gestural AlternativeLanguage
Verbal Non-Verbal
Communication Style of Persons Served
5.26%
29.82%
7.41%0.00%
5.00%
10.00%
15.00%
20.00%
25.00%
30.00%
35.00%
Accessible Provided Rides Walk/Bike
Transportation for Persons Served
80.00%
15.00% 5.00%0.00%
20.00%
40.00%
60.00%
80.00%
100.00%
High Moderate None
Family Involvement with Persons Served

46
46
Child Care Resource Consultant Services— Characteristics of Persons Served
Demographic Information
Barriers
Persons served are included in each and every category that applies. As a result, percentages will add up to more than 100%. This information contains only a sampling of the barriers of persons served and is not meant to be exhaustive. In general, program staff attempted to identify the most pertinent categories in which to include persons served. As a result, persons served may not be included in every category that technically describes all of the barriers that they may face. In addition, it must be noted that the barriers are those noted at the time of referral and may not include any subsequent barriers or diagnoses. As such, it is suggested that these barriers may be underreported (this is especially true of autism supports, where diag-noses may happen after a child has entered service).
Number of Persons Served: 200 Note: For all demographics and barriers, data is not compared to previous years. This is because of a new data-management system implemented in 2013-14, which may yield slightly different results to previous de-mographic data. Comparative data will again be available in 2015, after multiple years of data have been accrued in the new system.
67.50%
32.50%
0.00%
10.00%
20.00%
30.00%
40.00%
50.00%
60.00%
70.00%
80.00%
Male Female
Gender of Persons Served
99.00%
1.00%0.00%
10.00%20.00%30.00%40.00%50.00%60.00%70.00%80.00%90.00%
100.00%
Under 13 Over 13
Age of Persons Served
Note: Preferred age categories for this analysis are 0-2, 2-4, 4-6, and 6+. These were unavailable from our rec-ords management system at the time of this report.
13.00% 12.50%
52.00%
8.00%0.00%
10.00%
20.00%
30.00%
40.00%
50.00%
60.00%
Gestural Alternative Verbal Non-Verbal
Communication Style of Persons Served
6.50%
35.00%
4.50%
27.50%
0.00%
5.00%
10.00%
15.00%
20.00%
25.00%
30.00%
35.00%
40.00%
Behaviour Autism Sensory Speech andLanguage
Significant Barriers of Persons Served

47
Supported Independent Living Program— Characteristics of Persons Served Number of Persons Served: 72 (includes Bayswater program and individuals supported in long-term care)
Demographic Information
Barriers
1.39%
26.39% 23.61%
11.11%
20.83%
9.72% 6.94%0.00%
5.00%
10.00%
15.00%
20.00%
25.00%
30.00%
Under19
19-29 30-39 40-49 50-59 60-69 70+
Age of Persons Served
55.56%44.44%
0.00%
10.00%
20.00%
30.00%
40.00%
50.00%
60.00%
Male Female
Gender of Persons Served
18.06%
65.28%
0.00%
10.00%
20.00%
30.00%
40.00%
50.00%
60.00%
70.00%
Alternative Language Verbal
Communication Style of Persons Served
Note: For Communication and Transportation, percentages may add up to more than 100%, as multiple categories could be selected if applicable.
11.11%
47.22% 44.44% 50.00%
0.00%
10.00%
20.00%
30.00%
40.00%
50.00%
60.00%
Access Public Transit ProvidedRides
Walk/Bike
Transportation of Persons Served
20.75%
34.62% 30.19%
15.09%
0.00%
10.00%
20.00%
30.00%
40.00%
High Level Limited Moderate None
Family Involvement with Persons Served

48
48
Family Support Program— Characteristics of Persons Served
Demographic Information
Barriers
Note: For all demographics and barriers, data is not compared to previous years. This is because of a new data-management system implemented in 2013-14, which may yield slightly different results to previous demographic data. Comparative data will again be available in 2015, after multiple years of data have been accrued in the new system.
63.08%
36.92%
0.00%
10.00%
20.00%
30.00%
40.00%
50.00%
60.00%
70.00%
Male Female
Gender of Persons Served
Number of Persons Served: 279
48.75%
31.54%
10.04% 5.38% 2.51% 1.43%
36.00%
0.00%
10.00%
20.00%
30.00%
40.00%
50.00%
60.00%
Under 19 19-29 30-39 40-49 50-59 60-69 70+
Age of Persons Served
Note: For Communication and Transportation, percentages may add up to more (or less) than 100%, as multiple categories could be selected if applicable.
3.58% 5.02%
52.33%
0.00%
10.00%
20.00%
30.00%
40.00%
50.00%
60.00%
Gestural AlternativeLanguage
Verbal
Communication Style of Persons Served
2.88%
40.86%
16.13%8.24%
0.00%
5.00%
10.00%
15.00%
20.00%
25.00%
30.00%
35.00%
40.00%
45.00%
Accessible Provided Rides Public Transit Walk or Bike
Transportation Accessed By Persons Served
36.00%
6.10%
23.66%
34.05%
6.45% 9.32%
0.00%
5.00%
10.00%
15.00%
20.00%
25.00%
30.00%
35.00%
40.00%
20s 30s 40s 50s 60s 70s+
Age of Primary Caregiver

49
Family Home Program— Characteristics of Persons Served
Number of Persons Served: 20
Demographic Information
Barriers
Note: For all demographics and barriers, data is not compared to previous years. This is because of a new data-management system implemented in 2013-14, which may yield slightly different results to previous demographic data. Comparative data will again be available in 2015, after multiple years of data have been accrued in the new system.
65.00%
35.00%
0.00%
10.00%
20.00%
30.00%
40.00%
50.00%
60.00%
70.00%
Male Female
Gender of Persons Served
5.00%
40.00%
25.00%
0.00%
20.00%
5.00% 5.00%0.00%5.00%
10.00%15.00%20.00%25.00%30.00%35.00%40.00%45.00%
Under19
19-29 30-39 40-49 50-59 60-69 70+
Age of Persons Served
Note: For Communication and Transportation, percentages may add up to more than 100%, as multiple categories could be selected if applicable.
15.00% 15.00% 5.00%
55.00%
0.00%
10.00%
20.00%
30.00%
40.00%
50.00%
60.00%
Gestural AlternativeLanguage
Non-Verbal Verbal
Communication Style of Persons Served
35.00%
65.00%
15.00%0.00%
10.00%
20.00%
30.00%
40.00%
50.00%
60.00%
70.00%
Accessible Provided Rides Public Transit
Transportation Accessed by Persons Served
55.00%
10.00% 5.00% 10.00%0.00%
10.00%
20.00%
30.00%
40.00%
50.00%
60.00%
High Level Medium Limited None
Family Involvement With Persons Served

50
50
Characteristics of Persons Served– Discussion
For all demographics and barriers, please note that data is not compared to previous years, as had been previously done. This is because of a new data management system implemented in 2013-14, which may have yielded slightly different results to previous demographic data. Comparative data will again be available in 2015, as multiple years of data in the new system will be available.
Other areas to consider:
Each program is given some amount of leeway in what they would like to measure and how to interpret the categories to be measured.
In the Respite program, individuals may receive both Family Home and Group respite, which would account for the total of higher than 100% in ‘type of respite received’.
In some barriers categories, results may not add up to 100% due to a) multiple categories be-ing selected for one individual; b) missing data or c) other categories not listed in the chart
In the Family Support program, overall numbers used to be reflective of the number of families served; with the new system, each individual is recorded separately. This would mean that a family with three supported children, which would once have been one ‘family’ served, would now be recorded as three individuals served.
Mobility barriers are not included in this year’s statistics, as they were unavailable from the new data management system at the time of this report. They will again be recorded next year.

51
Community Options Division— Effectiveness Measures
This item does have linkages back to the organization’s Strategic Plan. One of the plan’s strategic di-rections is related to strategic partnerships. Helping persons served access their communities de-mands that the program have strong partnerships with other community agencies, including potential volunteer opportunities for persons served..
Objective: To increase the extent to which persons served are involved in their community.
Rationale: The foundation of the Community Options program involves ensuring that person served have access to work that is meaningful to them, whether volunteer or paid. This is a key component of community involve-ment.
Indicator Applied To Time of Meas-urement
Follow-Up Intervals
Data Source Obtained By Target
Percentage of Per-sons Served with Active, Ongoing Volunteer Work
All Persons Served at Com-munity Options
April 1, 2013-March 31, 2014
Every three months
Participant Sched-ules, Community Options.
Quality Improve-ment Lead
More than 75%
Outcome (Results):
Averaged over the four measurement periods, 69.3% of persons served had active, ongoing volunteer (or paid) work. Therefore, the target was not reached.
Limitations: None
Key Findings/Trends: As noted in the chart (right), vol-unteer activity was highest in July of 2013, and decreased by the end of the recording year.
72.36%
68.50%
69.84%
65.90%
62.00%
64.00%
66.00%
68.00%
70.00%
72.00%
74.00%
Jul-13 Aug-13Sep-13 Oct-13Nov-13Dec-13 Jan-14 Feb-14 Mar-14
Apr-14
Percentage of Persons Served with Paid or Volunteer Work
52
52
Community Options Division— Effectiveness Measures
Discussion of Results Two factors probably account for the decrease over the course of the year: First, a handful of partici-pants left the program, and new participants entered the program. Many of these new participants did not have a significant amount of funding, which can impact the activities available to them (pursing work opportunities is often more support-intensive than recreational activities). Second, the individual choice of some participants may have dictated that they did not wish to pursue work opportunities.
Follow-Up Completed This was the first year of analysis for this measure, so no formal follow-up has been completed.
Proposed Action Plan To continue to encourage participants to pursue volunteer opportunities as a piece of their Community Options activities.
To look continue to look for new volunteer partnerships in the community.
To attempt to be flexible enough to allow participants with limited funding to still have the opportunity to pursue desired work opportunities; students and volunteers may be one option by which to achieve this.
Future Monitoring This measure will continue in 2014-15, with the same target.
Target for 2014-15: More than 75% of persons served will have active and ongoing work opportunities as part of their schedule.

53
Residential Services Division— Effectiveness Measures
This item does have linkages back to the organization’s Strategic Plan. One of the plan’s strategic di-rections is related to strategic partnerships. Helping persons served access their communities de-mands that the program have strong partnerships with other community agencies.
Objective: To increase the amount of non-familial unpaid supports accessed by individuals supported in the Resi-dential Services Division.
Rationale: It is an integral component of the philosophy of Community Living Kingston and District that individuals served benefit from the development of “natural” community based supports that are beyond the more artificial supports provided by paid agency staff. As such the Residential Services Division would like to further develop these unpaid supports.
Indicator Applied To Time of Meas-urement
Follow-Up Interval
Data Source Obtained By
Target
Percentage of Persons Served who receive more than five hours a month of unpaid sup-ports.
All Persons Served in Residential Ser-vices Division
April 1, 2013-March 31, 2014
Every Three Months
Hours as tracked by staff at individual program locations
Quality Im-provement Lead
More than 50%.
Outcome (Results): 32.7% of persons served averaged five hours per month of unpaid support. Therefore, the target was not reached.
Limitations: None.
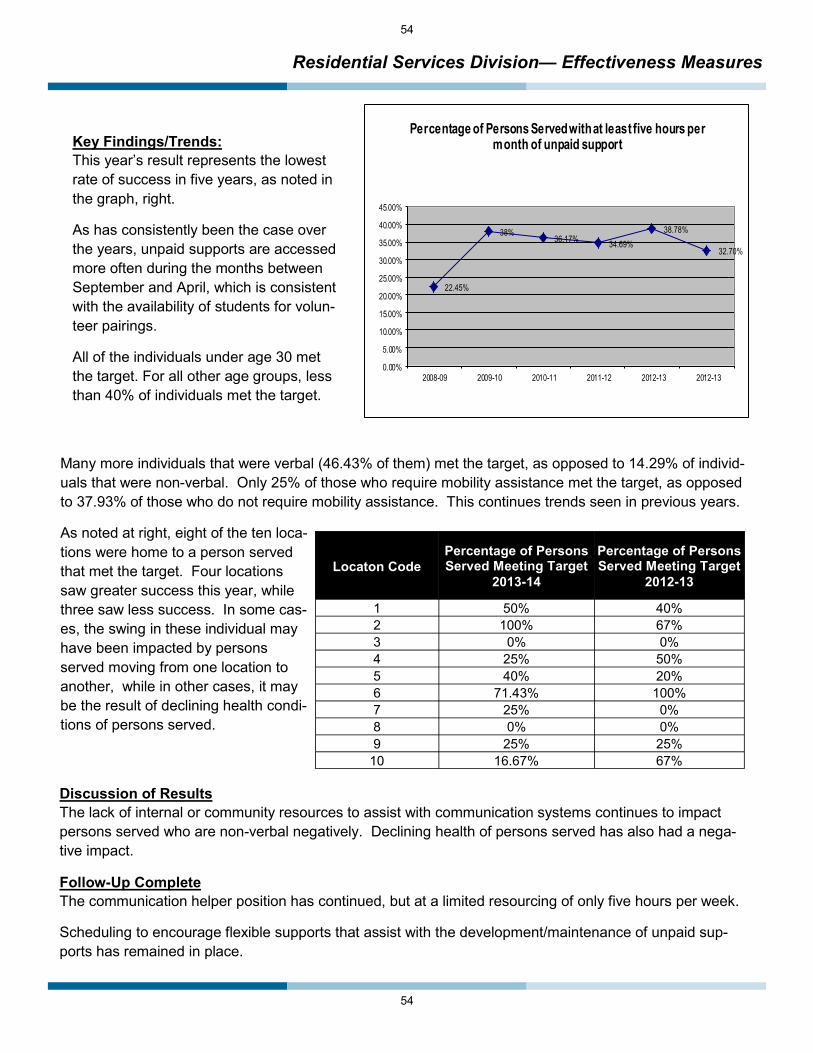
54
54
Residential Services Division— Effectiveness Measures
Key Findings/Trends: This year’s result represents the lowest rate of success in five years, as noted in the graph, right.
As has consistently been the case over the years, unpaid supports are accessed more often during the months between September and April, which is consistent with the availability of students for volun-teer pairings.
All of the individuals under age 30 met the target. For all other age groups, less than 40% of individuals met the target.
22.45%
38%36.17% 34.69%
38.78%
32.70%
0.00%
5.00%
10.00%
15.00%
20.00%
25.00%
30.00%
35.00%
40.00%
45.00%
2008-09 2009-10 2010-11 2011-12 2012-13 2012-13
Percentage of Persons Served with at least five hours per month of unpaid support
Many more individuals that were verbal (46.43% of them) met the target, as opposed to 14.29% of individ-uals that were non-verbal. Only 25% of those who require mobility assistance met the target, as opposed to 37.93% of those who do not require mobility assistance. This continues trends seen in previous years.
As noted at right, eight of the ten loca-tions were home to a person served that met the target. Four locations saw greater success this year, while three saw less success. In some cas-es, the swing in these individual may have been impacted by persons served moving from one location to another, while in other cases, it may be the result of declining health condi-tions of persons served.
Locaton Code Percentage of Persons Served Meeting Target
2013-14
Percentage of Persons Served Meeting Target
2012-13
1 50% 40% 2 100% 67% 3 0% 0% 4 25% 50% 5 40% 20% 6 71.43% 100% 7 25% 0% 8 0% 0% 9 25% 25%
10 16.67% 67%
Discussion of Results The lack of internal or community resources to assist with communication systems continues to impact persons served who are non-verbal negatively. Declining health of persons served has also had a nega-tive impact.
Follow-Up Complete The communication helper position has continued, but at a limited resourcing of only five hours per week.
Scheduling to encourage flexible supports that assist with the development/maintenance of unpaid sup-ports has remained in place.

55
Residential Services Division— Effectiveness Measures
Follow-Up Complete The communication helper position has continued, but at a limited resourcing of only five hours per week.
Scheduling to encourage flexible supports that assist with the development/maintenance of unpaid sup-ports has remained in place.
Proposed Action Plan: Continue to resource communication helper position in any way possible, given other resource needs.
Scheduling will continue to be flexible to allow for such supports to be encouraged.
Future Monitoring: This measure will continue in its current form.
Targets for 2014-15: More than 50% of persons served will access at least five hours of non-familial un-paid supports each month.

56
56
Respite Services— Effectiveness Measures Objective: To increase usage of the respite house. [“In Use” means any instance in which the main floor of the respite house is occupied for Respite purposes. This includes any instances in which the house is occupied by us-ing funds budgeted to Community Living Kingston and District and instances in which the house is occupied for use under private arrangement.]
Rationale: The respite house was designed to provide much needed respite for individuals and their families. A goal of the program is to optimize the use of this location such that these respite needs are met. Staff in Respite Services are encouraged to be creative in facilitating ways in which to ensure that the house can be used so as to achieve this goal. Note: Until 2013-14, this was considered an ‘efficiency’ measure. It has been switched to an effectiveness measure and meets the parameters of such.
Indicator Applied To Time of Meas-urement
Follow-Up Interval
Data Source Obtained By
Target
Percentage of Days that the Respite House is Utilized.
Respite House
April 1, 2013-March 31, 2014
Annually Data Provided By Coordinator of Respite Ser-vices
Quality Improve-ment Lead
More Than 90%.
Outcome (Results): The respite house was used 93.97% of the time in 2013-14. Therefore, the target was met.
Limitations: None. Previous concerns with the data collection system were mitigated by switching to a ‘percentage of days used’ measure rather than a more complex formula previously used.
Key Findings/Trends:
Usage rates were over 90% in nine of twelve months. January and February were periods with the lowest usage, at around 83% in both months. December, which had previously been a month with low usage, was at 93% this year (compared to 77% in the previ-ous month)
The ‘family’ stay and private respite stays accounted for the majority of usage in 2013-14. Because the da-ta collection system was changed slightly this year, it is not compared to other years.
0.00%10.00%20.00%30.00%40.00%50.00%
Usage of Respite Home by User Group, 2013-14

57
Respite Services— Effectiveness Measures
Key Findings/Trends (continued): As noted in the graph at right, this year’s rate of usage is the highest since this data started being tracked.
Discussion of Results: There has been a significant increase in the amount of usage on weekdays and on statutory holidays, when the location otherwise sat vacant This was noted especially in the change in usage in De-cember, as the location was used through the traditionally quiet holiday period.
Follow-Up Completed The program has been very creative around finding weekday and holiday usage for the location for private and emergency respite usage.
The family of service users has also had the opportunity to use the location more frequently.
Proposed Action Plan To continue to promote the use of the location as a respite option for those with private/individualized funding.
Future Monitoring The organization will continue to monitor this, with a continued target of 90% usage.
Target for 2014-15: The organization’s respite house will be used more than 90% of the time.
77.78%78.96%
80.00%
76.43%
81.91%83.79%
88.35%
93.97%
75.00%
80.00%
85.00%
90.00%
95.00%
2006-07
2007-08
2008-09
2009-10
2010-11
2011-12
2012-13
2013-14
Total usage of Respite House

58
58
Child Care Resource Consultant Services— Effectiveness Measures
This item is linked to the organization’s overall philosophy and values and mission statement. The abil-ity to ensure that persons served are included in the community is first tested in settings such as child care centres when persons served are very young.
Objective To ensure that centres are more successful at including children with disabilities into their programs.
Rationale This is the key function of the CCRCS program.
Indicator Applied To Time of Measurement
Follow-Up Interval
Data Source Obtained By
Target
Percentage of Centres indicating that CCRCS services are helping them better include children with disabilities.
All Centres serviced by the program
April 1, 2013-March 31, 2015
Annually Survey Results Quality Improvement Lead.
Greater than 90%.
Discussion Unfortunately, barriers related to data collection prevented the program from being able to reliably measure this indicator this year. As such, it is impossible to assess whether or not the target was met.
Renewed efforts to reliably collect data will be implemented in April 2014; the target for this measure will remain as noted above.

59
Supported Independent Living Program— Effectiveness Measures
This item does have linkages back to the organization’s Strategic Plan. One of the plan’s strategic directions is related to strategic partnerships. Helping persons served access their communities demands that the program have strong partnerships with other community agencies.
Objective: To ensure access to community supports. For the purposes of this measure, “community supports” will mean that persons served have access to a community volunteer or are themselves volunteers in the community.
Rationale: It is a foundation of Community Living Kingston and District, including SIL, that persons served have access to their communities. As such, it is vital that such community access be continually assessed.
Outcome (Results):
34.7%% of persons served had access to the defined community supports. Therefore, the target was not met.
Limitations: None.
Key Findings/Trends:
This was a slight improvement over last year, but was still lower than several preceding years (2010: 34.6%; 2011: 42.31%; 2012: 52.94%; 2013: 34.6%).
An analysis of the data suggests that there are no demographic factors impacting on meeting the target.
Just over 17% of persons served had a volunteer, while 21.7% were themselves volunteers. A small num-ber fell into both categories.
Indicator Applied To Time of Measure-
ment
Follow-Up Intervals
Data Source Obtained By
Target
Percentage of Per-sons Served In-volved Who Had Access to Communi-ty Supports.
All Persons Served by Supported Independent Living.
April 1, 2013-March 31, 2014
Annually SIL Demographics Information.
Quality Im-provement Lead
More than 40%

60
60
Supported Independent Living Program— Effectiveness Measures
Discussion of Results: Two years ago, over 40% of individuals had a volunteer; the current rate is approximately half of that.
Follow-up Completed: Program staff have made volunteer requests to the Volunteer Coordinator.
Program staff have assisted persons served to find volunteer employment as desired.
Proposed Action Plan: To continue with the follow-up steps noted last year.
Future Monitoring:
This measure will continue to be assessed with a decreased goal from last year.
Target for 2014-15: At least 40% of persons served will have access to community supports in the form of a volunteer or their own volunteer employment.

61
Family Support Program— Effectiveness Measures
Objective: To assure that families have access to qualified respite workers.
Rationale: While Community Living Kingston and District does not directly employ workers who provide service to families through private funding, the agency does play an integral role in attempting to recruit potential workers. Families have long identified that the recruitment of potential workers is a function with which they struggle, but which is of vital importance to them. The Family Support program considers the successful provision of assistance in this matter to be of the fore-most importance. In addition, the Family Support program attempts to assist families to make connections with quali-fied workers wherever possible. The respiteservices.com website is integral to the program’s efforts in this regard.
There are two indicators used for this measure:
Indicator Applied To Time of Measure-
ment
Follow-Up Interval
Data Source Obtained By Target
Number of Days elapsed between families signed up to respiteservices.com
All potential fami-lies
April 1, 2013-March 31, 2014
Annually Respite Coordinator, respiteservices.com
Quality Im-provement Lead
Less than 12 days
Indicator Applied To Time of Measure-
ment
Follow-Up Interval
Data Source Obtained By Target
Number of Days elapsed between workers signed up to respiteservices.com
All registered work-ers
April 1, 2013-March 31, 2014
Annually Respite Coordinator, respiteservices.com
Quality Im-provement Lead
Less than 12 days
Outcome (Results):
A new worker was registered once every 9.61 days. Therefore, the target was reached.
A new family was registered once every 12.58 days. Therefore, the target was not reached.
Limitations:
None
Key Findings/Trends:
As noted in the chart (right), an improvement was noted in both sets of registrations this year, with the worker registra-tions increasing significantly..
Year Number of Days Between Worker
Registrations
2007-08 5.9
2008-09 12.58
2009-10 12.58
2010-11 14.04
2011-12 16.64 2012-13 14.03 2013-14 9.61
Year Number of Days Between Family
Registrations
2007-08 6.2
2008-09 10.74
2009-10 9.13
2010-11 8.9
2011-12 7.78 2012-13 14.03 2013-14 12.58

62
62
Family Support Program— Effectiveness Measures
Discussion of Results: Limited funds available to families may still be negatively impacting family registrations somewhat, as it may create less urgency for families to sign up for this type of services. Worker registrations may have improved because of more awareness of the site, as well as a difficult economy that prompts workers to seek additional avenues for em-ployment.
This program continues to be overseen by the Respite/Family Home Coordinator, although there is no specific time dedicated to them to perform these duties.
Follow-up Completed: Continuing to make the community aware of the website resource continued, including use of flyers, newsletters, transition meetings, etc.
Proposed Action Plan: To continue with these avenues to make the community aware of the resource.
Future Monitoring: The program will continue to study this measure, with the same targets as last year.
Targets for 2014-15:
Worker Target: A worker will register for the program at least once every twelve days.
Family Target: A family will register for the program at least once every twelve days.

63
Family Home Program— Effectiveness Measures
Objective: To ensure continuity of Family Home living arrangements.
Definitions: A “discontinuation” is defined as any Family Home living arrangement that is ended. A discontinuation can be initiated by the Family Home provider, by the person being supported by the Family Home Pro-gram, or by Community Living Kingston and District. An occurrence in which an arrangement is discontin-ued as a result of relocation to an other community on the part of the Family Home provider or the person being supported is not considered a discontinuation. A discontinuation is also not deemed to have oc-curred if the person being supported “graduates” from the Family Home arrangement to a more independ-ent living situation or if they move to live with natural family by mutual choice.
Rationale: It is a fundamental assumption of the Family Home program that individuals being supported by the pro-gram benefit from long-term, stable living environments. As such, the agency goes to great lengths to re-cruit and train new families and to support all parties during the course of the arrangement in order to fur-ther this stability.
Indicator Applied To Time of Measure-ment
Follow-Up Interval
Data Source Obtained By
Target
Percentage of Per-sons Served Who Do Not Have a Dis-continued Family Home Arrangement
All Persons Served in a Family Home Arrangement.
April 1, 2013-March 31, 2014
Annually Coordinator, Family Home Program
Quality Improve-ment Lead
More than 80%
Outcome: In 2012-13, 95.5% of persons served did not have a discontinued Family Home arrangement. Therefore, the target was met. Limitations: None.

64
64
Family Home Program— Effectiveness Measures
Key Findings/Trends:
As noted in the graph (right), this a very successful year in meeting the target. There was only one discontinuation this year.
Discussion of Results: The only discontinuation this year was largely due to the declining health of the person served, who required a living arrangement that allowed for more intensive sup-ports.
Follow-up Completed: The program has continued to be very successful at maintaining family home living situations. Flexibility in providing supports and attempting to ensure adequate respite are the usual measures taken to promote this stability.
Proposed Action Plan: As it has long been, the program will continue to try to provide maximum flexibility and responsiveness to try to maintain these arrangements.
Future Monitoring:
The program will continue to study this measure, with an increased target.
Target for 2014-15: More than 90% of persons served will not experience the discontinuation of a Family Home arrangement.
75%
78.95%
90.47%92%
83.40%
88.89%
100%
95.50%
70%
75%
80%
85%
90%
95%
100%
2006-07 2007-08 2008-09 2009-10 2010-11 2011-12 2012-13 2013-14
Percentage of Persons Served Not Experiencing a Discontinued Family Home Arrangement
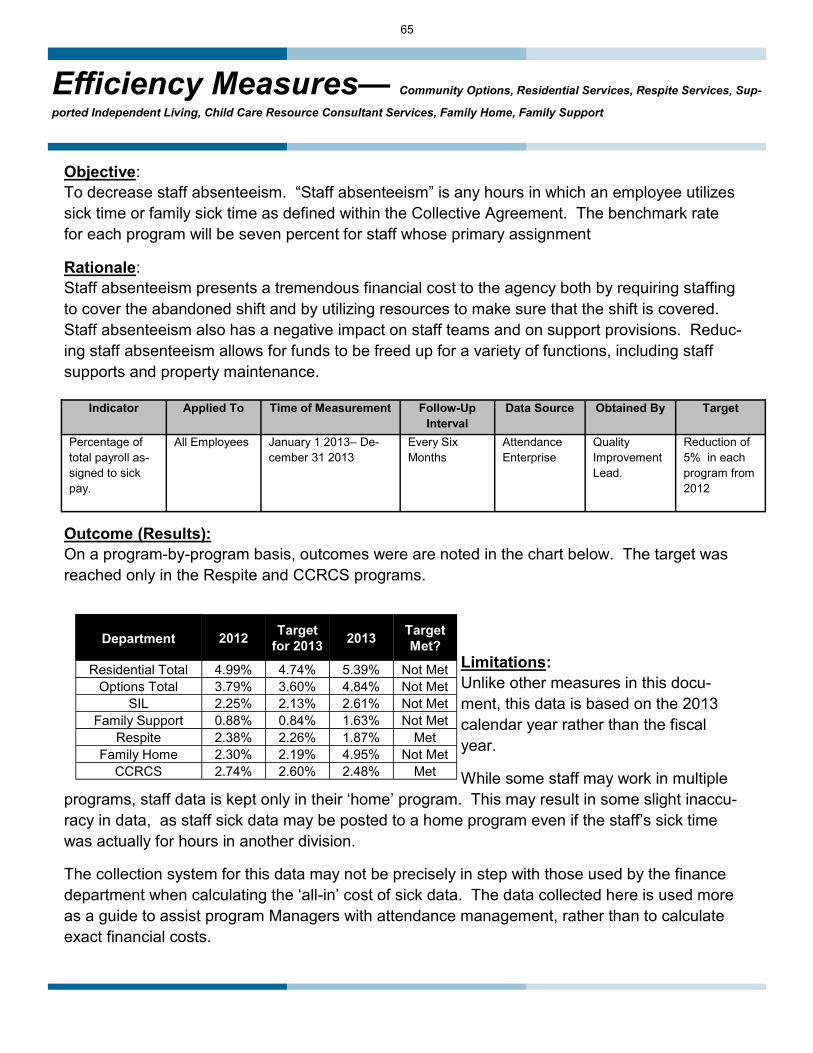
65
Efficiency Measures— Community Options, Residential Services, Respite Services, Sup-
ported Independent Living, Child Care Resource Consultant Services, Family Home, Family Support
Objective: To decrease staff absenteeism. “Staff absenteeism” is any hours in which an employee utilizes sick time or family sick time as defined within the Collective Agreement. The benchmark rate for each program will be seven percent for staff whose primary assignment
Rationale: Staff absenteeism presents a tremendous financial cost to the agency both by requiring staffing to cover the abandoned shift and by utilizing resources to make sure that the shift is covered. Staff absenteeism also has a negative impact on staff teams and on support provisions. Reduc-ing staff absenteeism allows for funds to be freed up for a variety of functions, including staff supports and property maintenance.
Indicator Applied To Time of Measurement Follow-Up Interval
Data Source Obtained By Target
Percentage of total payroll as-signed to sick pay.
All Employees January 1 2013– De-cember 31 2013
Every Six Months
Attendance Enterprise
Quality Improvement Lead.
Reduction of 5% in each program from 2012
Outcome (Results): On a program-by-program basis, outcomes were are noted in the chart below. The target was reached only in the Respite and CCRCS programs.
Limitations: Unlike other measures in this docu-ment, this data is based on the 2013 calendar year rather than the fiscal year.
While some staff may work in multiple programs, staff data is kept only in their ‘home’ program. This may result in some slight inaccu-racy in data, as staff sick data may be posted to a home program even if the staff’s sick time was actually for hours in another division.
The collection system for this data may not be precisely in step with those used by the finance department when calculating the ‘all-in’ cost of sick data. The data collected here is used more as a guide to assist program Managers with attendance management, rather than to calculate exact financial costs.
Department 2012 Target for 2013 2013 Target
Met?
Residential Total 4.99% 4.74% 5.39% Not Met Options Total 3.79% 3.60% 4.84% Not Met
SIL 2.25% 2.13% 2.61% Not Met Family Support 0.88% 0.84% 1.63% Not Met
Respite 2.38% 2.26% 1.87% Met Family Home 2.30% 2.19% 4.95% Not Met
CCRCS 2.74% 2.60% 2.48% Met

66
66
Efficiency Measures— Community Options, Residential Services, Respite Services, Supported Independent Living, Child Care Resource Consultant Services, Family
Home, Family Support
Key Findings/Trends Sick levels actually increased in several programs this year. Anecdotally, it is noted that there were a number of one-off, but major health issues experienced by employees that would have resulted in higher sick usage. In addition, flu bug swept through program locations in December and caused significant, but legitimate absenteeism. This included the actual closure of the Community Options program for two days.
As is consistently the case, the two programs with the highest level of sick pay were Residential and Community Options, which are also the two programs that have the highest level of direct contact with persons served.
Follow-Up Completed The Attendance Management program put in place in March of 2011 has been continued, which includes the increased monitoring of sick time use, bi-annual reporting of sick usage to HR and program manag-ers, and bi-annual follow-up with employees whose attendance is of concern.
Proposed Action Plan To continue with the implemented Attendance Management program.
Future Monitoring This measure will continue, with the target for each program’s sick attendance not to exceed figures from the 2012 calendar year (this year will continue to serve as the program benchmark).
Target for 2014-15: Each program will maintain or reduce sick time from their 2012 calendar year.

67
Residential Services Division— Supplemental Measures
Objective: To decrease medication errors.
Rationale: Medication administration is a vital clinical and organizational responsibility of the agency. It has a profound impact on the continued good health and quality of life of persons served by the agency. Medication errors have a negative impact on the health and quality of life so mentioned. Similarly, medication errors have a negative impact on the use of the agency’s resources, including the time and expense involved in following up on errors, reporting errors, and providing proper training to prevent future errors. For this myriad of rea-sons, it is a fundamental area of continued concern for the agency.
Discussion: The organization has studied medication errors formally for about eight years. This is slated to continue, and staff continue to file medication error reports as they come up. However, no data is currently available for analysis, as reporting has been switched over to our electronic client record, and the functions that allow for aggregating and analyzing data are yet operationalized. It is anticipated that this should be up and running by July of 2014.

68
68
Service Access Measures— All Programs
Objective: To ensure that families receive service as quickly as possible after referral.
Rationale: Community Living Kingston and District strives to engage families in services as quickly as possible after referral and confirmed funding. This is key to the organization being responsive to community pressures and needs of families and persons served.
Target Periods: The target periods for each department vary slightly; for CCRCS, 28 days matches funder targets and is a historical marker long used by the program. For Family Support, 40 days is a historical marker for the program. For all other programs, 60 days matches targets in place provincially to fill base-funded vacancies, and is therefore a sensible target across the board.
Indicator Applied To Time of Measure-ment
Follow-Up Interval
Data Source Obtained By Target
Percentage of Per-sons Served In Ser-vice within targeted time from referral
All New Refer-rals
April 1, 2013–March 31, 2014
Annually Nucleus Labs ECR
Quality Im-provement Lead
More Than 50% for CCRCS; More than 67% for all other programs.
Results: Across the agency, 64.7% of persons served commenced service within the targeted range for their pro-gram.
Results for each program follow on subsequent pages:

69
Service Access Measures— All Programs
Program Child Care Resource Consultant Services
Indicator Percentage of Persons served in receipt of service within 28 days of referral
Target
At least 50%
Actual Results 68%. The target was met.
Limitations None
Note: Data is applied to all persons served referred to the program. The time of measurement was April 1, 2013-March 31, 2014. The follow-up period on this measure is annually. The data source is the Nucleus Labs ECR. Data is obtained by the Quality Improvement Lead.
Program Family Home
Indicator Percentage of Persons served in receipt of service within 60 days of referral
Target
At least 67%
Actual Results 100%. The target was met.
Limitations None
Note: Data is applied to all persons served referred to the program. The time of measurement was April 1, 2013-March 31, 2014. The follow-up period on this measure is annually. The data source is the Nucleus Labs ECR. Data is obtained by the Quality Improvement Lead.
Program Respite
Indicator Percentage of Persons served in receipt of service within 60 days of referral
Target
At least 67%.
Actual Results 43.75%. The target was not met.
Limitations None
Note: Data is applied to all persons served referred to the program. The time of measurement was April 1, 2013-March 31, 2014. The follow-up period on this measure is annually. The data source is the Nucleus Labs ECR. Data is obtained by the Quality Improvement Lead.

70
70
Service Access Measures— All Programs
Program Family Support Program
Indicator Percentage of Persons served in receipt of service within 40 days of referral
Target
At least 67%
Actual Results 91.3%. The target was met.
Limitations None
Note: Data is applied to all persons served referred to the program. The time of measurement was April 1, 2013-March 31, 2014. The follow-up period on this measure is annually. The data source is the Nucleus Labs ECR. Data is obtained by the Quality Improvement Lead.
Program Community Options
Indicator Percentage of Persons served in receipt of service within 60 days of referral
Target
At least 67%
Actual Results 80%. The target was met.
Limitations None
Note: Data is applied to all persons served referred to the program. The time of measurement was April 1, 2013-March 31, 2014. The follow-up period on this measure is annually. The data source is the Nucleus Labs ECR. Data is obtained by the Quality Improvement Lead.
Program Residential Services
Indicator Percentage of Persons served in receipt of service within 60 days of referral
Target
At least 67%.
Actual Results 100%. The target was met
Limitations None.
Note: Data is applied to all persons served referred to the program. The time of measurement was April 1, 2013-March 31, 2014. The follow-up period on this measure is annually. The data source is the Nucleus Labs ECR. Data is obtained by the Quality Improvement Lead.

71
Service Access Measures— All Programs
Program Supported Independent Living
Indicator Percentage of Persons served in receipt of service within 60 days of referral
Target
At least 67%.
Actual Results 100%. The target was met.
Limitations None
Note: Data is applied to all persons served referred to the program. The time of measurement was April 1, 2013-March 31, 2014. The follow-up period on this measure is annually. The data source is the Nucleus Labs ECR. Data is obtained by the Quality Improvement Lead.
Key Findings/Trends/Discussion CCRCS (50) and Family Support (45) had by far the most referrals. There were 25 referrals for respite, eleven for Community Options, two for Family Home, and one each for Residential and SIL.
All programs except for the respite program met their targets. In respite, those referred for Family Home respite met the target 37.5% of the time, while those referred for group respite met the target 50% of the time. Respite is one of the only programs where referrals might come forward without funding attached, which impedes the process significantly. In addition, recruitment for Family Home respite can take time to play out, and group respite availability at the Arbour Crescent location is somewhat limited.
In most other cases, referrals are not brought forward without funding or a reasonable promise of service being attached (Community Options can, in some cases, be an exception, as families without funding may self-initiate a referral while going through the DSO process for Passport funding). This means that any barriers to quick service in all programs besides respite are largely internal in nature.
Follow-Up Completed The organization is quite pleased at these results; there was a significant leap in the speed with which referrals were completed in Family Support and CCRCS, by far the biggest programs in the organization that would be impacted by this sort of measure.
In 2014, Community Options introduced a new assessment period as the first steps to service after refer-ral, which is essentially a short-term period in which the needs of the individual and the program’s ability to meet those needs are matched. This has been fairly successful in getting services up and running quickly for persons served.
Proposed Action Plan To continue with current practices, including assessment period at Community Options, as noted above.
Future Monitoring Target periods will remain in place as is. All programs will have a goal of having 67% of individuals com-mence service in the target period for their programs.

72
72
Business Function Measures— Instances of Staff Injury
This measure was developed based on themes identified in the organization’s Health and Safety reports, Risk Management plans, HR reports, Finance Reports, and outside Health and Safety Inspections
Objective: To reduce the number of work-related staff injuries.
Rationale: Staff injuries are frequently indicative of Health and Safety concerns in the workplace. Any patterns or trends in the occurrence of staff injuries should be studied by the employer and the bargaining unit of the employees to ensure that any Health and Safety concerns that arise are addressed.
Indicator Applied To Time of Meas-urement
Follow-Up Interval
Data Source Obtained By
Target
Number of Staff Suffering a WSIB-Reportable Inju-ry
All Staff, Community Living Kingston
April 1 2013-March 31 2014
Annually Super HR Rec-ords of Staff Injury
Quality Improve-ment Lead
Less than 6.*
**Note: This target was previously measured as a percentage of the workforce, but the organization opted to change it to measurement using actual number of injuries instead.
Outcome (Results): There were five WSIB-reportable injuries in 2013-14. Therefore, the target was met.
Limitations: None.
Key Findings/Trends: The total of five injuries was slightly higher than 2012-13, but is still lower than most previous years (see chart, below).
12
109 9
5
11
14
4
7
11
45
0
2
4
6
8
10
12
14
16
2002-03 2003-04 2004-05 2005-06 2006-07 2007-08 2008-09 2009-10 2010-11 2011-12 2012-13 2013-14
Number of Staff Injuries Per Year
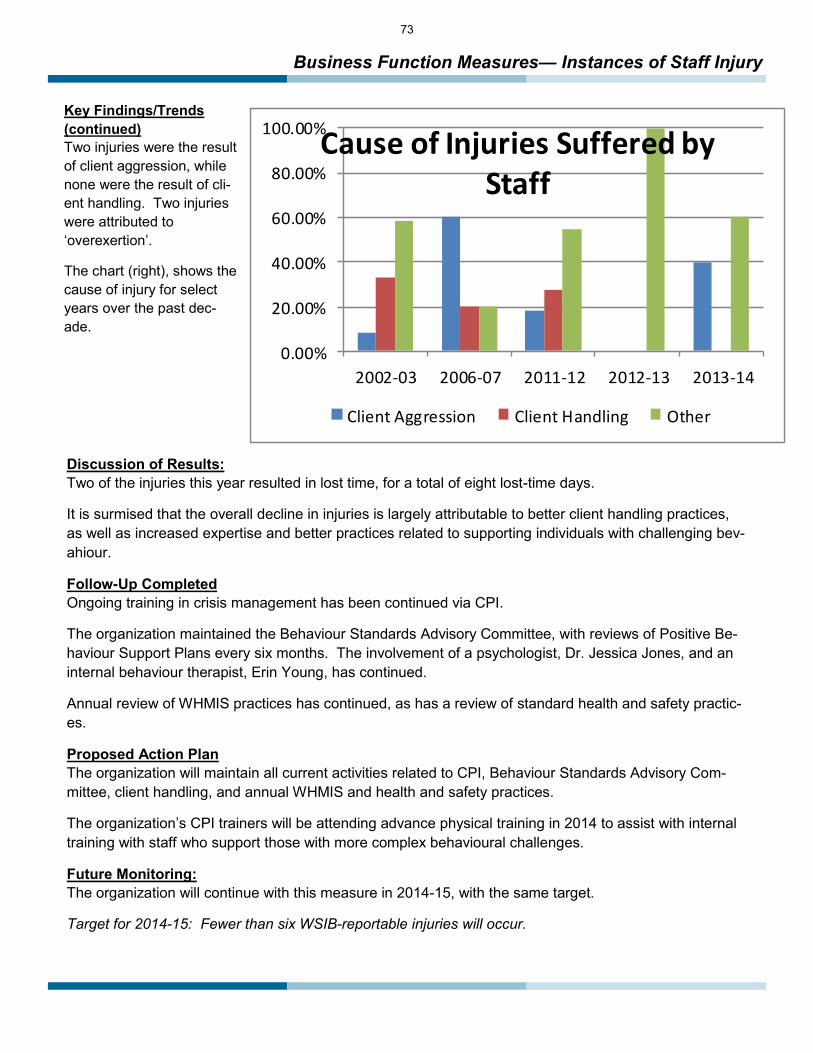
73
Business Function Measures— Instances of Staff Injury
Key Findings/Trends (continued) Two injuries were the result of client aggression, while none were the result of cli-ent handling. Two injuries were attributed to ‘overexertion’.
The chart (right), shows the cause of injury for select years over the past dec-ade.
Discussion of Results: Two of the injuries this year resulted in lost time, for a total of eight lost-time days.
It is surmised that the overall decline in injuries is largely attributable to better client handling practices, as well as increased expertise and better practices related to supporting individuals with challenging bev-ahiour.
Follow-Up Completed Ongoing training in crisis management has been continued via CPI.
The organization maintained the Behaviour Standards Advisory Committee, with reviews of Positive Be-haviour Support Plans every six months. The involvement of a psychologist, Dr. Jessica Jones, and an internal behaviour therapist, Erin Young, has continued.
Annual review of WHMIS practices has continued, as has a review of standard health and safety practic-es.
Proposed Action Plan The organization will maintain all current activities related to CPI, Behaviour Standards Advisory Com-mittee, client handling, and annual WHMIS and health and safety practices.
The organization’s CPI trainers will be attending advance physical training in 2014 to assist with internal training with staff who support those with more complex behavioural challenges.
Future Monitoring: The organization will continue with this measure in 2014-15, with the same target.
Target for 2014-15: Fewer than six WSIB-reportable injuries will occur.
0.00%
20.00%
40.00%
60.00%
80.00%
100.00%
2002-03 2006-07 2011-12 2012-13 2013-14
Cause of Injuries Suffered by Staff
Client Aggression Client Handling Other

74
74
Business Function Measures— Availability of Computer Server
This measure was designed primarily based on the contents of the organization’s Technology Plan.
Objective: To ensure constant access to electronically stored information (internet, Electronic Client Records, agency email, central file storage drive).
Rationale: Having ongoing access to networked resources is vital to the business function of the agency. Interruptions to this access create inefficiencies in service that are a waste of resources and that cause potential service disruptions.
Indicator Applied To Time of Measure-
ment
Follow-Up In-terval
Data Source
Obtained By Target
Percentage of Work Days in Which Ac-cess to Electronical-ly stored information are Available Without Interrup-tion.
All Computer Sta-tions, 1412 Princess Street Location
April 1, 2013 to March 31, 2014
Every Six Months Reports From Designated IT Staff.
Quality Im-provement Lead
Greater Than 96%
Outcome (Results): Network resources were available without interruption on 98.02%of work days. Therefore, the target was reached.
Limitations: None.
Key Findings/Trends and Discussion of Results: There were seven work days where service was interrupted. Two occasions were the result of the unavaila-bility of the electronic client record. Five occasions were in the month of December, where a weather-related power surge resulted in network problems.. The chart below outlines ongoing network access over the past few years. This year showed an improve-ment over 2012-13.
97.22% 97.35%
98.83%
97.81%98.25%
96.05%
98.02%
94.50%95.00%95.50%96.00%96.50%97.00%97.50%98.00%98.50%99.00%99.50%
2007-08 2008-09 2009-10 2010-11 2011-12 2012-13 2013-14
Percentage of Work Days in Which Networked Resources Were Available Without Interruption

75
Business Function Measures— Availability of Computer Server
Follow-up Completed: The organization has an ongoing service agreement with OnServe to assist with the monitoring and maintenance of the agency’s computer resources.
The Nucleus Labs ECR was introduced in March 2013, reducing the dependency on the internal server itself, as it is a web-based system.
Proposed Action Plan: The organization will continue it’s service agreement with OnServe.
A full switch towards the use of Nucleus Labs ECR for all documentation has largely been ac-complished.
To continue to look into the development of a dedicated IT position for the agency.
Future Monitoring: Given the importance of technology in the day-to-day completion of everyday duties, this will continued to be monitored in 2014-15, with a slightly elevated target..
Target for 2014-15: Uninterrupted access to networked resources and internet/ECR will be available 97% of the time.

76
76
Business Function Measures— Staff Training
This measure was designed based on themes identified in the organization’s Health and Safety Reports, Risk Man-agement Plan, and in accordance with the requirements of the organization’s primary funder.
Objective: To ensure that staff are up-to-date in CPR and crisis intervention (CPI) training.
Rationale: These training programs are of utmost importance. CPR training ensures that staff have basic skills to deal with overall health and first aid concerns. CPI training ensures that staff have the basic skills needed to ver-bally deescalate agitated individuals. Current certification is required of direct service employees by the Ministry of Community and Social Services. While the agency takes great pains to ensure that this training is always up to date, it can be difficult to ensure because of the large size of the organization’s staff pool.
Indicator Applied To Time of Measurement Follow-Up Inter-val
Data Source Obtained By Target
Percentage of Employees with Current Certification in CPI
All Active Employees
As of March 31, 2014 Annually, with scheduling per-sonnel reviewing more frequently to schedule training
HR Database Report
Quality Im-provement Lead
.
Greater than 90%
Percentage of Employees with Current Certifications in CPR.
All Active Employees
As of March 31, 2014 Annually, with scheduling per-sonnel reviewing more frequently to schedule training
HR Database Report
Quality Im-provement Lead
Greater than 90%
Outcome (Results): As of March 31st, 85.8% of staff had a current certification in CPI. Therefore, the target was not reached.
As of March 31st, 91.5% of staff had a current certification in CPR/First Aid. Therefore, the target was not reached. Limitations: Doing such measurements at a single point in time does not necessarily indicate situations where a staff person may have had a lapsed certification at some point during the year.
Key Findings/Trends The current rate of certification is lower for CPI than it has been in previous years. However, training has already been scheduled for early May 2014 to update those missing certification.
Discussion of Results The size of the staff team is a barrier to achieving both types of training. CPR, having to be done through an out-side trainer, requires additional work to schedule. However, the workload of the CPI trainers, who complete the training in addition to their regular duties, also presents challenges.

77
Business Function Measures— Staff Training
Follow-Up Completed: Training needs have been assessed by the scheduling department at various points in time and have been followed up on accordingly.
The organization is considering sending more staff to ‘community’ training in CPR, as opposed to CLK-specific training, in an attempt to keep up with training needs.
Proposed Action Plan: The HR department will continue to regularly supply program Managers and the scheduling department with an updated list of training needs.
Future Monitoring: The organization will continue to monitor this, with the same goal as last year.
Target for 2014-15: More than 90% of staff will have current certification in both CPI and CPR/First Aid at all measured points in time.

78
78
Business Function Measures— Reduction of Unfunded Liabilities
Note: This measure was developed based on themes in the organization’s Finance reports and Risk Management plan, along with recommendations based in an outside auditor’s report.
Objective: To decrease unfunded liabilities related to employee accruals (vacation and lieu time).
Rationale: The organization is obligated to have funds available to pay out such accruals, and it is thus extremely important that the accruals be at a manageable level. On another scale, the organization is required to pay out employee accruals whenever they leave the organization’s employ. This can put tremendous strain on the operating budget of the organization.
Indicator Applied To Time of Measurement
Follow-Up
Interval
Data Source
Obtained By
Target
Percentage of Full-Time Em-ployees with less than 240 accu-mulated vacation and lieu hours.
All Full-Time Em-ployees
April 1 2013-March 31, 2014
Annually Finance Reports
Quality Improve-ment Lead
More than 80%.
Outcome (Results): As of April 1, 2014, 67.08% of the organization’s full-time employees had less than 240 hours of accruals. Therefore, the target was not reached. Limitations: Point-in-time measurements may not represent goal status through the course of the year.
Key Findings/Trends: Over 73% of employees who exceeded the accruals target were staff that did not require replacement when off.
As has consistently been the case, all but one of the staff exceeding the accruals target were staff of ten or more years of service, who accrue significant amounts of time off. The only exception to this is an employ-ee who just returned from maternity and had been accruing vacation time while on leave.
In 2012-13, 78.21% of employees were under the accruals target, so this year represents a step backwards around the management of this issue.

79
Business Function Measures— Reduction of Unfunded Liabilities
Discussion of Results: While the majority of staff exceeding the accrual targets do not require replacement when off, heavy workloads and reduced staffing complements have somewhat inhibited their ability to easily take time off.
Managing the accruals issue is consistently reminded to program Managers, who have made attempts to work with staff to reduce accruals.
Follow-up Completed: Managing the accruals issue is consistently reminded to program Managers, who have made attempts to work with staff to reduce accruals.
The Board of Directors has been regularly updated around progress.
Proposed Action Plan:
To continue to encouraging/requiring employees to reduce accrual banks.
To continue to have the Board of Directors involved in monitoring this target.
Future Monitoring:
This will continue to be monitored in 2014-15 with the same target.
Target for 2014-15: More than 80% of full-time staff will have accruals of less than 240 hours.

80
80
Business Function Measures— Manager On-Call Response Time
Note: This measure was originally developed based on information brought forward by the organization’s staff and their bargaining unit, CUPE 2635.
Objective: To ensure quick response to all calls that go to the Manager On-Call system.
Rationale: This system is designed to ensure that a member of the Management team is aware of emerging situations as quickly as possible. The system is essential to ensuring that staff receive direction and support in chal-lenging situations, and to ensure that the organization is reporting situations to MCSS or the police as neces-sary.
Indicator Applied To Time of Measurement Follow-Up Interval
Data Source Obtained By
Target
Percentage of calls responded to in six minutes or less
All Calls to Manager On-Call System
April 1, 2013 to March 31, 2014
Annually On-call reports from Alliance Wireless.
Quality Improve-ment Lead
More than 75%
Outcome (Results): 84.62% of calls were responded to within six minutes. Therefore, the target was not reached. Limitations: None
Key Findings/Trends: As noted in the graph, right, this result represents a notable improvement over the past two years..
The average response time was 4.44 minutes, which is much shorter than previous years (2013: 6.29 minutes; 2012: 13.88 minutes; 2011: 6.33 minutes)
There were 52 calls to the Manager On-Call system in 2013-14, down from 64 the previous year.
88.24%
44%
65.63%
84.62%
40.00%
55.00%
70.00%
85.00%
2010-11 2011-12 2012-13 2013-14
Percentage of calls responded to within six minutes

81
Business Function Measures— Manager On-Call Response Time
Discussion of Results: This response rate is a significant improvement over the results from the past two years. It is especially heartening given that the Management team was reduced by one member during the year due to an un-expected leave.
The number of occurrences where the system was used incorrectly (e.g., calls for scheduling or non-emergencies) anecdotally appears to be minimal.
Call response was more evenly distributed amongst the Management team than in previous years.
Follow-up Completed: As noted in previous years, the organization has continued to supply the answering service with a priori-tized list of Managers to call based on their availability on a given day. This list is generated by the Management team each week and forwarded to the answering service on a weekly basis.
Program Coordinators have also, on occasion, proactively distributed information about possible issues to the Management team in advance of weekends, providing for more informed response to calls.
Proposed Action Plan: The organization will continue to provide this list to the answering service on a weekly basis.
Future Monitoring:
The organization will continue to monitor this measure, with the same target.
Target for 2014-15: At least 75% of calls to the Manager On-Call system will be responded to within six minutes.

82
82
Glossary Of Terms
Outcome/Results: A description of whether or not the target was achieved.
Limitations: Any vulnerabilities in the method of collecting and/or analyzing the data which may impact the outcome.
Key Findings/Trends: A description of any noteworthy information that may have been uncovered when analyzing the data, including a comparison of data over time.
Discussion of Results: An explanation of those factors that may have contributed to the results.
Follow-Up Completed: Any actions already taken to address the item being measured. Any action plans from the previous year are addressed here.
Proposed Action Plan: Those improvements that the agency intends to make in order to achieve the targets or otherwise improve service. The action plan may also involve changing the method by which data is collected or analyzed.
Future Monitoring: A brief description of what the agency intends to do for the next year with regards to this measure.
Measure: The specific area being studied on which data is being collected.
Target: The level to which the program aspires to reach. Unless otherwise specified, the target is based on the results from the previous year’s data.
A Note About Characteristics of Persons Served
Throughout the following report, each program has compiled a summary of the characteristics of the persons served by that program. Except where noted, this summary includes all of the persons served by the program in the past year, including those who may not be active with the program at the time of the report.
Types of Measures Effectiveness: A measure that looks at direct impact of our services on the persons served
Efficiency: A measure that looks at different aspects of resource use such as dollars spent or use of staff time Service Access: A measure that looks at some aspect of the barriers involved in getting into our services
Satisfaction: A measure that looks at the extent to which persons served and other stakeholders are happy with the services that we provide.
Business Function: A measure that looks at some function of the administrative aspects of the agency

83
Data Integrity Assurance
A great deal of time and effort goes into collecting the data that is summarized in the preceding pages. However, the collection and summarizing of the data is meaningless if the collected data lacks integrity. A strong agency uses its data to assist in organizational decision-making. Simply put, data that is not accurate or consistent means that this decision making is being done with bad information. As a result, the right decisions cannot be made. Fortunately, some simple processes can ensure the integrity of the organization’s data. Some of Community Living Kingston’s processes are not-ed below.
Reliability is meant to ensure that data is collected consistently and in a way that could be reproduced at another time and by other people. Because the organization does not use standardized tests or measures that can ensure reliability, other steps have been taken: ● Very few personnel are entrusted to tracking data. This tighter circle of staff limits misinterpretation. ● For all self-reporting measures with some amount of subjectivity, discussions have occurred as to how to ensure that data is coded properly. ● Most data is gleaned directly from internal documents such as Medication Error Reports or Finance or HR Reports, virtually eliminating any danger of the data not being collected the same way on another occasion. Much data is provided directly from the Nucleus Labs system, which can run reports directly from its system. ● Unless otherwise noted, data measures all persons served, not just a sample. This means that reliability issues related to data sampling are not a factor.
Validity simply suggests that the your data measures what it intends to measure. ● The organization’s data is reflective of the needs of stakeholders as gleaned from ISAs and plans, and is reflective of the agency’s mission and values. ● The organization’s focus is not clinical in nature. It depends on the face validity of it’s measure— that is, does common sense indicate that the measure makes sense to address the area of concern? This face validity is achieved by having various parties from outside the program review measures to determine if they seem to make sense. This is also done on all satisfaction survey items, where persons from outside the agency are sometimes used to determine face validity.
Completeness means that the data is as complete as possible and that obtainable data is not missing, be it intentionally or unintentionally. Incomplete data has little value, as it may exclude entire groups of persons served or may be missing data that will greatly influence success towards missing a target. ● The number of client records in all spreadsheets is routinely checked against the overall list of persons served to ensure that data is complete. ● All programs have an indicator and no groups are missing from data collection or analysis. ● All attempts are made to find any missing data. Any data that continues to be missing is properly coded in Excel (using the #n/a function, where Excel is still used) so that the program can process the available data properly. For data accessed from the Nucleus Labs system, reports are run that allow the Quality Improvement Lead to identify persons served for whom data is missing.
Accuracy simply means that all data is recorded properly and that any errors are caught and corrected. ● Spot checks are completed by the Quality Improvement Manager to ensure accuracy. This includes a review of distribution of values. ● Where Excel is used, a frequency distribution of values is run in Excel to look for any values suspected of being inaccurate or outside of the normal distribution.
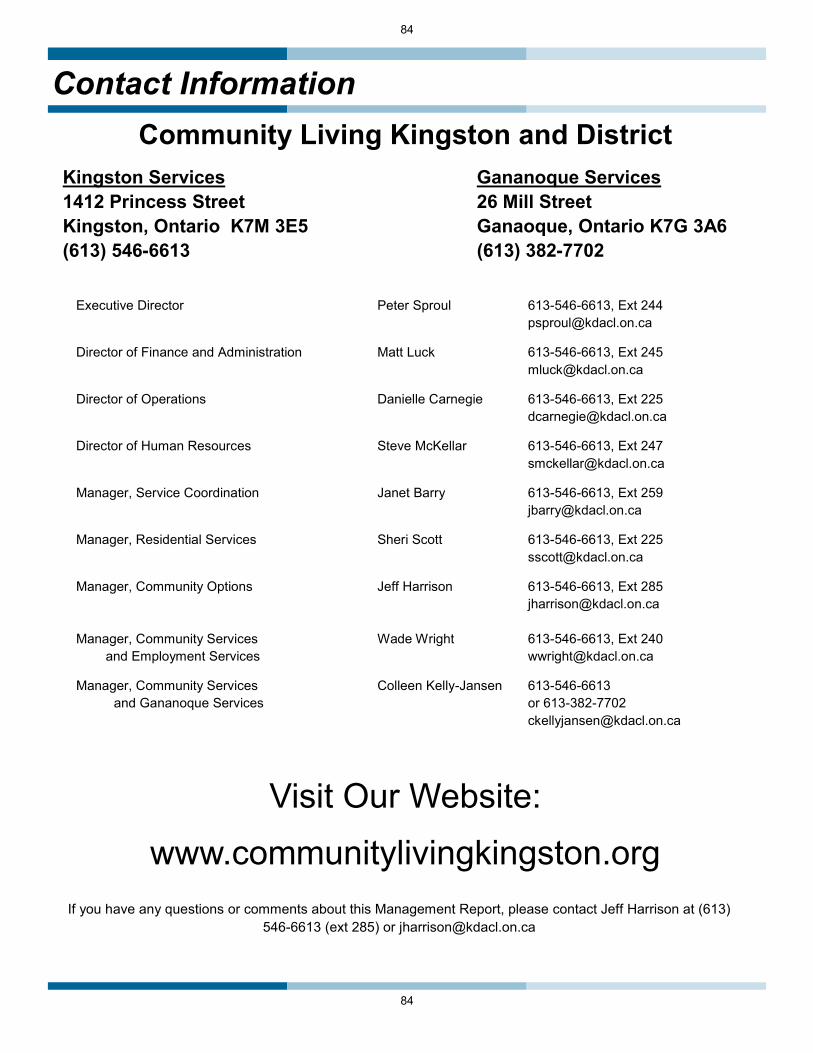
84
84
Contact Information
Community Living Kingston and District Kingston Services Gananoque Services 1412 Princess Street 26 Mill Street Kingston, Ontario K7M 3E5 Ganaoque, Ontario K7G 3A6 (613) 546-6613 (613) 382-7702
Executive Director Peter Sproul 613-546-6613, Ext 244 [email protected]
Director of Finance and Administration Matt Luck 613-546-6613, Ext 245 [email protected]
Director of Operations Danielle Carnegie 613-546-6613, Ext 225 [email protected]
Director of Human Resources Steve McKellar 613-546-6613, Ext 247 [email protected]
Manager, Service Coordination Janet Barry 613-546-6613, Ext 259 [email protected]
Manager, Residential Services Sheri Scott 613-546-6613, Ext 225 [email protected]
Manager, Community Options Jeff Harrison 613-546-6613, Ext 285 [email protected] Manager, Community Services Wade Wright 613-546-6613, Ext 240 and Employment Services [email protected]
Manager, Community Services Colleen Kelly-Jansen 613-546-6613 and Gananoque Services or 613-382-7702 [email protected]
Visit Our Website: www.communitylivingkingston.org
If you have any questions or comments about this Management Report, please contact Jeff Harrison at (613) 546-6613 (ext 285) or [email protected]