Annual Literacy Program Report - SiMERR
24
Annual Literacy Program Report 2011 (revised 16 August 2012) The SiMERR National Research Centre The University of New England ARMIDALE NSW
Transcript of Annual Literacy Program Report - SiMERR

Annual Literacy Program Report
2011
(revised 16 August 2012)
The SiMERR National Research Centre
The University of New England
ARMIDALE NSW

QuickSmart Literacy Report 2011 i
Table Of Contents
Acknowledgements 2
1 QuickSmart in 2011 3
2 Background 4
2.1 Purpose of QuickSmart 4
2.2 QuickSmart program description 4
3 Overall QuickSmart results 6
3.1 Results on the OZCAAS assessments 6
3.1.1 Combined OZCAAS Analysis 7
3.1.2 OZCAAS By Demographics 11
3.1.3 Students who were unable to complete the pre-intervention test 16
3.1.4 Conclusion for OZCAAS Testing 17
3.2 Independent Assessments 17
3.2.1 Why they are used 17
3.2.2 Results on the PAT Assessments 17
3.2.3 Results on the Victorian On-Demand VCAA Assessment 18
4 Conclusion to Report 20
5 APPENDIX – Cluster Results 21
5.1 Standardised Test results by cluster – (Scale scores for PAT, VELS levels for VCAA On-Demand Tests) 2011 21
5.2 PAT results – All Students (Scale scores) 2011 22
5.3 National Literacy PAT Improvement of QuickSmart Students for 2011 23
LIST of Tables
Table 1: OZCAAS Level 3 Words results - all students 2011 7 Table 2: OZCAAS Comprehension Level 2 - all students 2011 8 Table 3: OZCAAS Essential Words - all students 2011 8 Table 4: OZCAAS Level 1 Words - all students 2011 9 Table 5: OZCAAS Comprehension Level 1 - all students 2011 10 Table 6: OZCAAS Level 2 Words - all students 2011 10 Table 7: OZCAAS Essential Words results – all students by gender 2011 11 Table 8: OZCAAS Level 1 Words results – all students by gender 2011 11 Table 9: OZCAAS Comprehension Level 1 results – all students by gender 2011 12 Table 10: OZCAAS Level 2 Words results – all students by gender 2011 12 Table 11: OZCAAS Comprehension Level 2 results – all students by gender 2011 13 Table 12: OZCAAS Level 3 Words results – all students by gender 2011 13 Table 13: OZCAAS results - Indigenous students 2011 14 Table 14: OZCAAS results where no pre-test data was available - 2011 16 Table 15: PAT results - (Scale scores) 2011 17 Table 16: PAT results - By Gender (Scale scores) 2011 18 Table 17: PAT results - Indigenous (Scale scores) 2011 18 Table 18: VCAA results - (VELS scores) 2011 19

QuickSmart Literacy Annual Report for 2011 2
Acknowledgements
This report has been compiled by our statistician, Dr Stefan Horarik and Executive Assistant, June Billings. It would not be possible to do this reporting without the support of the rest of the QuickSmart team in SiMERR who have helped with proof reading and interpreting the data.
QuickSmart Literacy Annual Report for 2011 3
1 QuickSmart in 2011
In 2011, the QuickSmart team at the University of New England received data from 331 students who participated in QuickSmart Literacy lessons and 139 average-achieving comparison peers. These students were drawn from 2 clusters of schools from around Australia as well as other trial schools in NSW and Tasmania. Further data were also submitted for independent analysis to the Northern Territory (NT) Department of Education and Training by NT schools.
The analyses presented in this report provide information about students’ performance on the Cognitive Aptitude Assessment System (OZCAAS) and on standardised test measures, specifically the Progressive Achievement Tests in Vocabulary and Comprehension (ACER, 2008) and the VCAA On-Demand tests used by some schools in Victoria. Further investigation of the data provided in this report examines the results in terms of gender and for the participating Indigenous students.
QuickSmart Literacy Annual Report for 2011 4
2 Background
2.1 Purpose of QuickSmart
The prime purpose of the QuickSmart program is to reverse the trend of ongoing poor academic performance for students who have been struggling at school and who are caught in a cycle of continued failure. These targeted students experience significant and sustained difficulties in basic mathematics and/or literacy, and have a profile of low progress despite attempts to overcome their learning problems. Many such students have not drawn lasting benefits from other in-class and withdrawal instructional activities.
The QuickSmart professional learning program is designed for classroom teachers, special needs support teachers, and paraprofessionals to learn how to work with, and significantly improve, the learning outcomes in basic mathematics and literacy skills of under-achieving students in the middle years of schooling. The program features professional learning and support for working in a small class instructional setting with two students, using a specially constructed teaching program supported by extensive material and computer-based resources.
2.2 QuickSmart program description
The QuickSmart Numeracy and Literacy interventions were developed through the National Centre of Science, Information and Communication Technology and Mathematics Education for Rural and Regional Australia (SiMERR) at the University of New England, Armidale. The QuickSmart programs have been under development and continuous improvement since 2001.
The intervention is called QuickSmart to encourage students to become quick in their response speed and smart in their understanding and strategy use. In QuickSmart, the aim is to improve students’ information retrieval times to levels that free working-memory capacity from an excessive focus on mundane or routine tasks. In this way, students are able to engage meaningfully with more demanding cognitive activities. In these interventions, automaticity is fostered; time, accuracy and understanding are incorporated as key dimensions of learning; and an emphasis is placed on ensuring maximum student on-task time. QuickSmart lessons develop learners’ abilities to monitor their academic learning and set realistic goals for themselves.
Comprehension skills are emphasised in the QuickSmart Literacy program. The three-lesson cycle shown in Figure 1 indicates how this program focuses on the individual piece of text.

QuickSmart Literacy Annual Report for 2011 5
Figure 1: Literacy lesson structures
During the first lesson, the meaning of the text is emphasised and discussed. The structure of the second QuickSmart lesson type is repeated between three and six times to provide support and practice in basic literacy skills. Finally the third type of lesson is used to ensure students can convey their comprehension of the passage.

QuickSmart Literacy Annual Report for 2011 6
3 Overall QuickSmart results
Two major sets of analyses quantify the benefits of the QuickSmart program. The first analysis examines data from speed and accuracy OZCAAS measures related to reading skills that were collected at the beginning and end of the QuickSmart program. These results represent a direct measure of the work of QuickSmart instructors and reflect the primary focus of the QuickSmart lessons.
The second set of analyses concern the results of independent tests. Most schools have utilised the PAT (Progressive Achievement Test) assessments in Vocabulary and Reading Comprehension. These are standardised tests developed by the Australian Council for Education Research (ACER). The PAT is an independent test taken prior to commencement of QuickSmart and at the completion of the program. Students’ PAT results provide information about how the knowledge, skills and attitudes developed in QuickSmart are used and how they transfer to other broad areas of reading skill. Some schools in Victoria used the On-Demand Testing designed by Victorian Curriculum and Assessment Authority (VCAA) instead of PAT.
The results from these analyses are reported below in separate sections and include analyses of the data by gender and for participating Indigenous students.
3.1 Results on the OZCAAS assessments
Six tests measured students’ speed and accuracy both before QuickSmart began and at the end of the program. The tests were: (1) Essential Words; (2) Level 1 Words; (3) Sentence Understanding Level 1; (4) Level 2 Words; (5) Sentence Understanding Level 2; (6) Level 3 Words. To assist with interpretation of these results, Level 3 Words and Comprehension Level 2 are shown first, as these tests show the effect of the program most clearly. It is important to note that interpretation of results in some tests (e.g., Essential Words) can be impacted by a ‘ceiling effect’ as many students record strong results at pre-test which do not leave much room for improvement. The OZCAAS results recorded for average-achieving comparison students should also be interpreted with the knowledge that many of these students’ results are constrained by a ceiling effect.
Average results from all Literacy students are presented in Tables 1 to 6 below. A detailed discussion of Tables 1 and 2 are provided for clarification purposes and as a model for understanding the results provided in Tables 3 to 6. Note that the p-values included in tables in this report represent the probability or likelihood that there is no difference between mean scores for pre-intervention and post-intervention results. If this value is less than 0.05 this difference is considered statistically significant. This means that there is a less than 5% probability that the result was obtained by chance. If the p-value is more than 0.05 the two means may still be importantly different, however, there is an increased possibility that chance factors influenced the result. In our analyses this sometimes happens when the number of students in the group is quite small (as is often the case for comparison students).

QuickSmart Literacy Annual Report for 2011 7
3.1.1 Combined OZCAAS Analysis
3.1.1.1 Level 3 Words
Table 1: OZCAAS Level 3 Words results - all students 2011
CAAS Operation N Pre-Mean
Pre-SD Post-Mean
Post-SD
Gain p Effect size
Level 3 Words QS (speed secs)
131 4.877 3.404 2.988 2.671 -1.888 <0.001* -0.617
Level 3 Words COMP (speed secs)
67 3.098 2.502 2.28 1.488 -0.818 0.001* -0.397
Level 3 Words QS (accuracy %)
131 46.496 27.693 68.311 24.573 21.816 <0.001* 0.833
Level 3 Words COMP (accuracy %)
67 73.19 21.526 81.096 16.498 7.906 <0.001* 0.412
Level 3 Words Speed Level 3 Words Accuracy
On the Level 3 Words test, there were paired data for 131 QuickSmart students and 67 comparison students. The desired criterion for response speed on the OZCAAS assessments for words is between 1 and 2 seconds as an indication of automaticity. The decrease in time on these difficult words for QuickSmart students is almost 1.9 seconds, which is a strong result. The effect size for this result is -0.617, which indicates very strong improvement. (Note the negative number means that the post-test time is lower than the pre-test time which is the desired pattern of improvement).
Effect size statistics can be understood based on the work of Hattie (Hattie, J. (2009). Visible Learning: A synthesis of over 800 meta-analyses relating to achievement. London: Routledge) such that:
Effect sizes below 0.2 are considered poor, with an appropriate range of growth over an academic year for a student cohort established as within the range of 0.2 to 0.4;
Effect size scores of 0.4 to 0.6 are considered strong;
Effect sizes between 0.6 and 0.8 are considered very strong; and
Effect size scores above 0.8 represent substantial improvement of the order of approximately three years’ growth.
In terms of accuracy, the QuickSmart students’ average scores have improved by over 21.8 percentage points, which is a very strong result. The effect size is 0.833, which indicates substantial improvement for the QuickSmart group.
Table 1 shows that when compared to the scores of the comparison students QuickSmart students’ scores indicate substantial improvement in terms of speed and accuracy in Level 3 words.

QuickSmart Literacy Annual Report for 2011 8
3.1.1.2 Comprehension Level 2
Table 2: OZCAAS Comprehension Level 2 - all students 2011
CAAS Operation N Pre-Mean
Pre-SD
Post-Mean
Post-SD
Gain p Effect size
Comprehension Level 2 QS (speed secs)
253 7.977 3.49 5.886 2.963 -2.092 <0.001* -0.646
Comprehension Level 2 COMP (speed secs)
121 6.479 2.845 5.365 2.336 -1.114 <0.001* -0.428
Comprehension Level 2 QS (accuracy %)
253 81.347 17.688 89.655 13.675 8.308 <0.001* 0.526
Comprehension Level 2 COMP (accuracy %)
121 90.783 9.502 93.76 7.314 2.977 0.001* 0.351
Comprehension Level 2 Speed Comprehension Level 2 Accuracy
On the Comprehension Level 2 test, there were paired data for 253 QuickSmart students and 121 comparison students. This test required students to choose the best alternative for two words to complete a sentence. It is a test of sentence-level cloze reading skills. The desired criterion for response speed on the OZCAAS assessments for comprehension is between 3 and 4 seconds as an indication of automaticity. The decrease in time for QuickSmart students is 2.092 seconds, which is a strong result. The effect size for this result is -0.646, which indicates very strong improvement.
In terms of accuracy, the QuickSmart students’ average scores have improved by more than 8.3 percentage points, which is a very strong result. The effect size is 0.526, which indicates strong improvement for the QuickSmart group.
Table 2 shows that when compared to the scores of the comparison students, QuickSmart students’ scores indicate substantial improvement in terms of speed and accuracy in comprehension.
3.1.1.3 Essential Words
Table 3: OZCAAS Essential Words - all students 2011
CAAS Operation N Pre-Mean
Pre-SD Post-Mean
Post-SD
Gain p Effect size
Essential words QS (speed)
250 1.183 0.779 0.758 0.304 -0.425 <0.001* -0.718
Essential words Comp (speed)
112 0.972 0.553 0.799 0.318 -0.173 0.001* -0.384
Essential words QS (acc)
250 97.173 8.332 99.319 3.131 2.146 <0.001* 0.341
Essential words Comp (acc)
112 99.107 4.66 99.9 0.745 0.793 0.079 0.238

QuickSmart Literacy Annual Report for 2011 9
Essential Words Speed Essential Words Accuracy
The results for Essential Words, the most commonly used words that should be known by middle school students, indicate a stronger improvement for the QuickSmart students. However, the accuracy results show a strong ceiling effect as the results were already at a high level at pre-test for both groups.
3.1.1.4 Level 1 Words
Table 4: OZCAAS Level 1 Words - all students 2011
CAAS Operation N Pre-Mean
Pre-SD Post-Mean
Post-SD
Gain p Effect size
Level 1 Words QS (speed secs)
282 1.876 1.666 1.099 0.875 -0.777 <0.001* -0.584
Level 1 Words COMP (speed secs)
121 1.132 1.174 1.005 1.248 -0.127 0.003* -0.105
Level 1 Words QS (accuracy %)
282 87.699 16.382 97.18 6.935 9.48 <0.001* 0.754
Level 1 Words COMP (acc %)
121 97.693 6.13 98.99 3.017 1.298 0.008* 0.269
Level 1 Words Speed Level 1 Words Accuracy
The results for Level 1 Words indicate a very strong improvement for the QuickSmart students. The diagrams illustrate the narrowing of the gap between the QuickSmart students and comparison students.
QuickSmart Literacy Annual Report for 2011 10
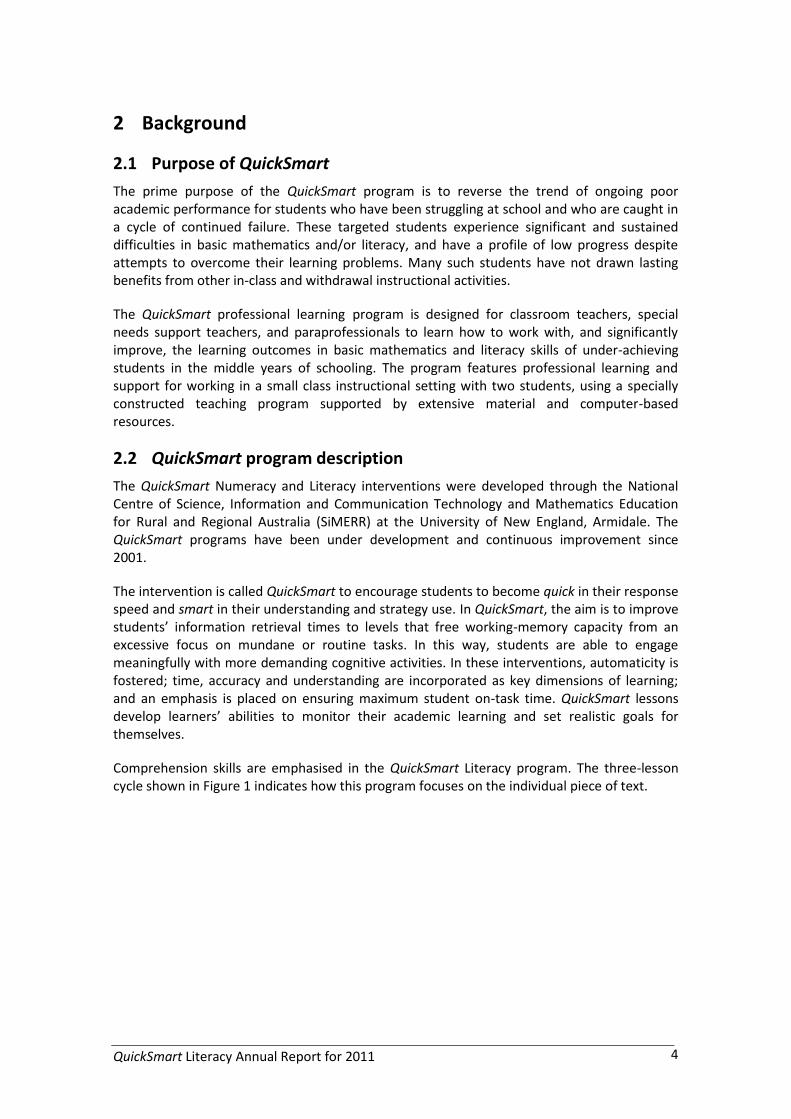
3.1.1.5 Comprehension Level 1
Table 5: OZCAAS Comprehension Level 1 - all students 2011
CAAS Operation N Pre-Mean
Pre-SD Post-Mean
Post-SD
Gain p Effect size
Comprehension Level 1 QS (speed secs)
272 5.299 2.774 3.579 2.125 -1.72 <0.001* -0.696
Comprehension Level 1 COMP (speed secs)
121 3.593 1.313 3.188 1.417 -0.405 0.001* -0.296
Comprehension Level 1 QS (accuracy %)
272 93.26 12.063 97.643 5.612 4.383 <0.001* 0.466
Comprehension Level 1 COMP (accuracy %)
121 98.205 4.792 98.944 3.18 0.739 0.159 0.182
Comprehension Level 1 Speed Comprehension Level 1 Accuracy
The results for Comprehension Level 1 indicate a very strong improvement for the QuickSmart students. The diagrams illustrate the narrowing of the gap between the QuickSmart students and comparison students.
3.1.1.6 Level 2 Words
Table 6: OZCAAS Level 2 Words - all students 2011
CAAS Operation N Pre-Mean
Pre-SD Post-Mean
Post-SD
Gain p Effect size
Level 2 Words QS (speed secs)
245 2.806 2.141 1.853 1.802 -0.952 <0.001* -0.481
Level 2 Words COMP (speed secs)
113 1.579 1.105 1.214 0.609 -0.365 <0.001* -0.409
Level 2 Words QS (accuracy %)
245 70.726 26.262 88.678 14.861 17.952 <0.001* 0.841
Level 2 Words COMP (acc %)
113 90.73 9.619 94.788 7.848 4.058 <0.001* 0.462
Level 2 Words Speed Level 2 Words Accuracy

QuickSmart Literacy Annual Report for 2011 11
The results for Level 2 Words indicate a significant improvement for the QuickSmart students. The diagrams illustrate the narrowing of the gap between the QuickSmart students and comparison students as a result of the QuickSmart intervention.
3.1.2 OZCAAS By Demographics
3.1.2.1 Essential words by Gender
The following tables show an analysis of OZCAAS results for each test by gender (Tables 7, 8, 9, 10, 11, 12) and for Indigenous students (Table 13).
Table 7: OZCAAS Essential Words results – all students by gender 2011
Group N Pre-Mean
Pre-SD Post-Mean
Post-SD Gain p Effect size
Male QS (speed) 141 1.209 0.809 0.73 0.256 -0.479 <0.001* -0.798
Male COMP (speed) 51 0.929 0.536 0.835 0.365 -0.093 0.168 -0.204
Female QS (speed) 109 1.15 0.742 0.795 0.354 -0.355 <0.001* -0.611
Female COMP (speed) 61 1.008 0.568 0.768 0.271 -0.24 0.003* -0.539
Male QS (accuracy) 141 96.272 10.117 99.333 2.812 3.061 <0.001* 0.412
Male COMP (accuracy) 51 99.02 4.901 99.89 0.784 0.87 0.218 0.248
Female QS (accuracy) 109 98.338 4.993 99.301 3.515 0.963 0.025* 0.223
Female COMP (accuracy) 61 99.18 4.489 99.908 0.717 0.728 0.218 0.226
The results of QuickSmart students show that in both speed and accuracy the males have improved slightly more than females.
3.1.2.2 Level 1 Words by Gender
Table 8: OZCAAS Level 1 Words results – all students by gender 2011
Group N Pre-Mean
Pre-SD Post-Mean
Post-SD Gain p Effect size
Male QS (speed) 162 1.904 1.543 1.103 0.749 -0.801 <0.001* -0.66
Male COMP (speed) 53 1.28 1.696 1.148 1.84 -0.132 0.038* -0.074
Female QS (speed) 120 1.838 1.825 1.092 1.024 -0.746 <0.001* -0.504
Female COMP (speed) 68 1.016 0.452 0.893 0.365 -0.123 0.033* -0.299
Male QS (accuracy) 162 86.085 18.292 96.664 8.17 10.579 <0.001* 0.747
Male COMP (accuracy) 53 96.823 8.178 98.643 3.184 1.821 0.042* 0.293
Female QS (accuracy) 120 89.879 13.141 97.877 4.734 7.998 <0.001* 0.81
Female COMP (accuracy) 68 98.371 3.785 99.26 2.875 0.89 0.086 0.265
The results of QuickSmart students show that in terms of gain scores related to both speed and accuracy the males have improved slightly more than females.

QuickSmart Literacy Annual Report for 2011 12
3.1.2.3 Comprehension Level 1 by Gender
Table 9: OZCAAS Comprehension Level 1 results – all students by gender 2011
Group N Pre-Mean
Pre-SD Post-Mean
Post-SD Gain p Effect size
Male QS (speed) 155 5.507 2.855 3.778 2.29 -1.73 <0.001* -0.668
Male COMP (speed) 54 3.682 1.306 3.515 1.27 -0.167 0.235 -0.13
Female QS (speed) 117 5.023 2.65 3.315 1.862 -1.708 <0.001* -0.746
Female COMP (speed) 67 3.521 1.323 2.925 1.483 -0.596 0.002* -0.424
Male QS (accuracy) 155 92.926 12.671 97.275 6.533 4.349 <0.001* 0.431
Male COMP (accuracy) 54 97.922 5.962 98.531 4.111 0.609 0.549 0.119
Female QS (accuracy) 117 93.702 11.245 98.131 4.06 4.429 <0.001* 0.524
Female COMP (accuracy) 67 98.433 3.618 99.276 2.136 0.843 0.084 0.284
The results of QuickSmart students show that in terms of gain scores for speed the males have improved slightly more than females and the females improved slightly more in accuracy. However these differences are minor.
3.1.2.4 Level 2 Words by Gender
Table 10: OZCAAS Level 2 Words results – all students by gender 2011
Group N Pre-Mean
Pre-SD Post-Mean
Post-SD Gain p Effect size
Male QS (speed) 144 2.781 2.065 1.907 1.839 -0.874 <0.001* -0.447
Male COMP (speed) 51 1.416 0.849 1.251 0.64 -0.165 0.046* -0.22
Female QS (speed) 101 2.842 2.254 1.777 1.755 -1.064 <0.001* -0.527
Female COMP (speed) 62 1.713 1.269 1.184 0.585 -0.529 <0.001* -0.536
Male QS (accuracy) 144 69.712 27.726 87.776 16.259 18.064 <0.001* 0.795
Male COMP (accuracy) 51 91.502 9.447 96.104 5.926 4.602 <0.001* 0.584
Female QS (accuracy) 101 72.172 24.082 89.965 12.571 17.793 <0.001* 0.926
Female COMP (accuracy) 62 90.095 9.79 93.706 9.037 3.611 0.003* 0.383
The results of QuickSmart students show that in speed the females have improved slightly more than males, but in accuracy the genders performed equally well.

QuickSmart Literacy Annual Report for 2011 13
3.1.2.5 Comprehension Level 2 by Gender
Table 11: OZCAAS Comprehension Level 2 results – all students by gender 2011
Group N Pre-Mean
Pre-SD Post-Mean
Post-SD Gain p Effect size
Male QS (speed) 150 8.13 3.335 5.962 2.925 -2.167 <0.001* -0.691
Male COMP (speed) 52 6.326 2.946 5.692 2.51 -0.634 0.089 -0.232
Female QS (speed) 103 7.756 3.709 5.774 3.028 -1.981 <0.001* -0.585
Female COMP (speed) 69 6.595 2.782 5.119 2.182 -1.476 <0.001* -0.59
Male QS (accuracy) 150 80.621 19.249 89.273 13.643 8.652 <0.001* 0.519
Male COMP (accuracy) 52 89.533 11.321 94.117 7.841 4.585 0.001* 0.471
Female QS (accuracy) 103 82.403 15.159 90.21 13.769 7.807 <0.001* 0.539
Female COMP (accuracy) 69 91.725 7.817 93.49 6.938 1.765 0.098 0.239
The results of QuickSmart students show that in terms of gain scores for both speed of response and accuracy the males have improved slightly more than the females.
3.1.2.6 Level 3 Words by Gender
Table 12: OZCAAS Level 3 Words results – all students by gender 2011
Group N Pre-Mean
Pre-SD Post-Mean
Post-SD Gain p Effect size
Male QS (speed) 82 4.955 3.762 2.936 2.496 -2.019 <0.001* -0.632
Male COMP (speed) 34 2.751 2.085 2.238 1.13 -0.513 0.05* -0.306
Female QS (speed) 49 4.745 2.735 3.076 2.965 -1.669 0.003* -0.585
Female COMP (speed) 33 3.456 2.858 2.324 1.801 -1.132 0.005* -0.474
Male QS (accuracy) 82 46.102 27.809 68.205 26.166 22.102 <0.001* 0.819
Male COMP (accuracy) 34 70.612 23.828 80.259 16.046 9.647 0.003* 0.475
Female QS (accuracy) 49 47.153 27.772 68.49 21.908 21.336 <0.001* 0.853
Female COMP (accuracy) 33 75.845 18.864 81.958 17.156 6.112 0.039* 0.339
The results of QuickSmart students show that in terms of gain scores for both speed of response and accuracy the males have improved slightly more than the females.
QuickSmart Literacy Annual Report for 2011 14
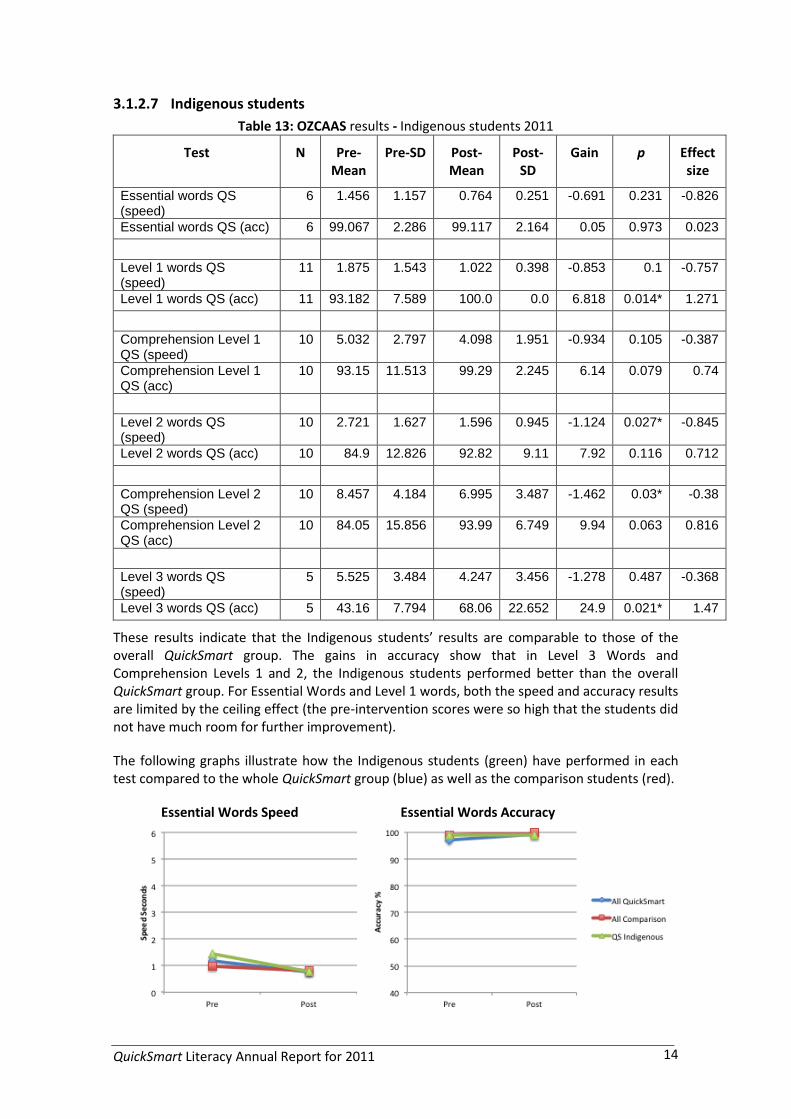
3.1.2.7 Indigenous students
Table 13: OZCAAS results - Indigenous students 2011
Test N Pre-Mean
Pre-SD Post-Mean
Post-SD
Gain p Effect size
Essential words QS (speed)
6 1.456 1.157 0.764 0.251 -0.691 0.231 -0.826
Essential words QS (acc) 6 99.067 2.286 99.117 2.164 0.05 0.973 0.023
Level 1 words QS (speed)
11 1.875 1.543 1.022 0.398 -0.853 0.1 -0.757
Level 1 words QS (acc) 11 93.182 7.589 100.0 0.0 6.818 0.014* 1.271
Comprehension Level 1 QS (speed)
10 5.032 2.797 4.098 1.951 -0.934 0.105 -0.387
Comprehension Level 1 QS (acc)
10 93.15 11.513 99.29 2.245 6.14 0.079 0.74
Level 2 words QS (speed)
10 2.721 1.627 1.596 0.945 -1.124 0.027* -0.845
Level 2 words QS (acc) 10 84.9 12.826 92.82 9.11 7.92 0.116 0.712
Comprehension Level 2 QS (speed)
10 8.457 4.184 6.995 3.487 -1.462 0.03* -0.38
Comprehension Level 2 QS (acc)
10 84.05 15.856 93.99 6.749 9.94 0.063 0.816
Level 3 words QS (speed)
5 5.525 3.484 4.247 3.456 -1.278 0.487 -0.368
Level 3 words QS (acc) 5 43.16 7.794 68.06 22.652 24.9 0.021* 1.47
These results indicate that the Indigenous students’ results are comparable to those of the overall QuickSmart group. The gains in accuracy show that in Level 3 Words and Comprehension Levels 1 and 2, the Indigenous students performed better than the overall QuickSmart group. For Essential Words and Level 1 words, both the speed and accuracy results are limited by the ceiling effect (the pre-intervention scores were so high that the students did not have much room for further improvement).
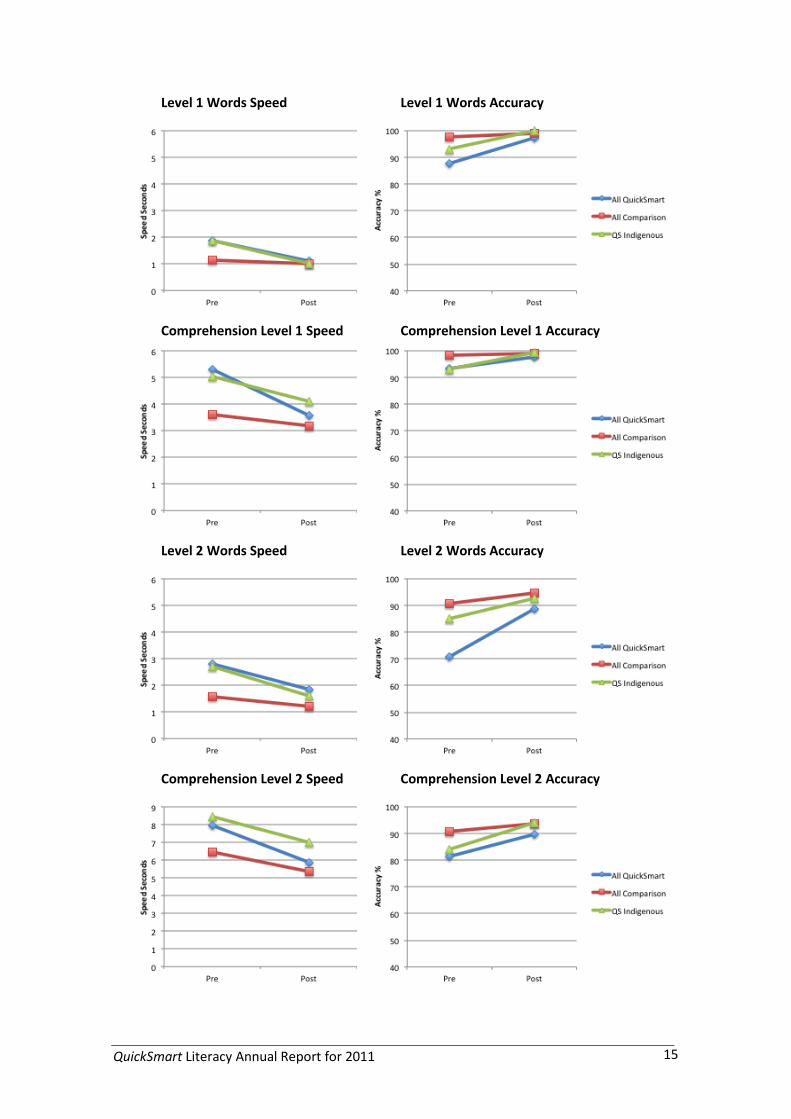
The following graphs illustrate how the Indigenous students (green) have performed in each test compared to the whole QuickSmart group (blue) as well as the comparison students (red).
Essential Words Speed Essential Words Accuracy
QuickSmart Literacy Annual Report for 2011 15
Level 1 Words Speed Level 1 Words Accuracy
Comprehension Level 1 Speed Comprehension Level 1 Accuracy
Level 2 Words Speed Level 2 Words Accuracy
Comprehension Level 2 Speed Comprehension Level 2 Accuracy

QuickSmart Literacy Annual Report for 2011 16
Level 3 Words Speed Level 3 Words Accuracy
3.1.3 Students who were unable to complete the pre-intervention test
To complete this section on OZCAAS results, it is important to note that there were 23 students who the instructors confirmed were not able to complete all the OZCAAS pre-tests. In such cases Instructors were advised not to continue collecting data as doing so would have confronted these students dramatically with their weaknesses at the beginning of the program. A mark of the success of QuickSmart is that many of these students were able to complete all OZCAAS assessments at the end of the program. These students’ results could not be included in the previous analyses and are presented in Table 14 below.
Table 14: OZCAAS results where no pre-test data was available - 2011
N Mean Std. Deviation
Essential words QS (speed) 12 0.77 0.21 Essential words QS (acc) 12 99.14 2.01 Level 1 words QS (speed) 4 0.79 0.25 Level 1 words QS (acc) 4 97.28 3.15 Comprehension Level 1 QS (speed) 10 4.921 1.671 Comprehension Level 1 QS (acc) 10 96.56 4.953 Level 2 words QS (speed) 22 2.519 1.48 Level 2 words QS (acc) 22 80.723 21.231 Comprehension Level 2 QS (speed) 22 6.866 3.408 Comprehension Level 2 QS (acc) 22 83.273 14.337 Level 3 words QS (speed) 23 4.18 3.03 Level 3 words QS (acc) 23 61.08 25.41
The results in Table 14 are impressive given that these students did not have the skills or confidence to complete the OZCAAS pre-tests. In Level 2 words and Comprehension Level 1, the average response rates were within a second of the goal range and accuracy above 83%. Even though some of these students may not have progressed to Level 3 Words during QuickSmart lessons, their results are encouraging with response speeds below 4.2 seconds and accuracy over 61% at post-test. It is likely that part of this improvement may be due to the fact that: (1) students have increased their ability to benefit from classroom instruction; and (2) students’ overall improved levels of confidence may have led to a ‘have a go attitude’ that was not present at the beginning of the QuickSmart program.
QuickSmart Literacy Annual Report for 2011 17
3.1.4 Conclusion for OZCAAS Testing
Overall, the QuickSmart students showed strong growth in their understanding and use of reading skills. In all levels, they either closed the gap between them and the comparison group of average-achieving peers or narrowed this gap to a very small margin. Such growth is critical for these students as reading is a vital skill underpinning learning in general. This improvement provides the foundation for students to improve in other areas related to the application of reading skills that are not specifically taught in QuickSmart.
Some small differences between male and female students were observed. Females performed slightly better in Level 2 Words speed and accuracy. Males performed slightly better in most other tests. These differences, however, are too small to warrant further investigation.
Indigenous students had lower starting and finishing points in all assessment but their overall improvement is significant.
3.2 Independent Assessments
3.2.1 Why they are used
The QuickSmart pre and post assessments include use of independent tests to demonstrate whether the students are able to take the basic knowledge and strategies taught in QuickSmart and apply these to higher-level literacy tasks.
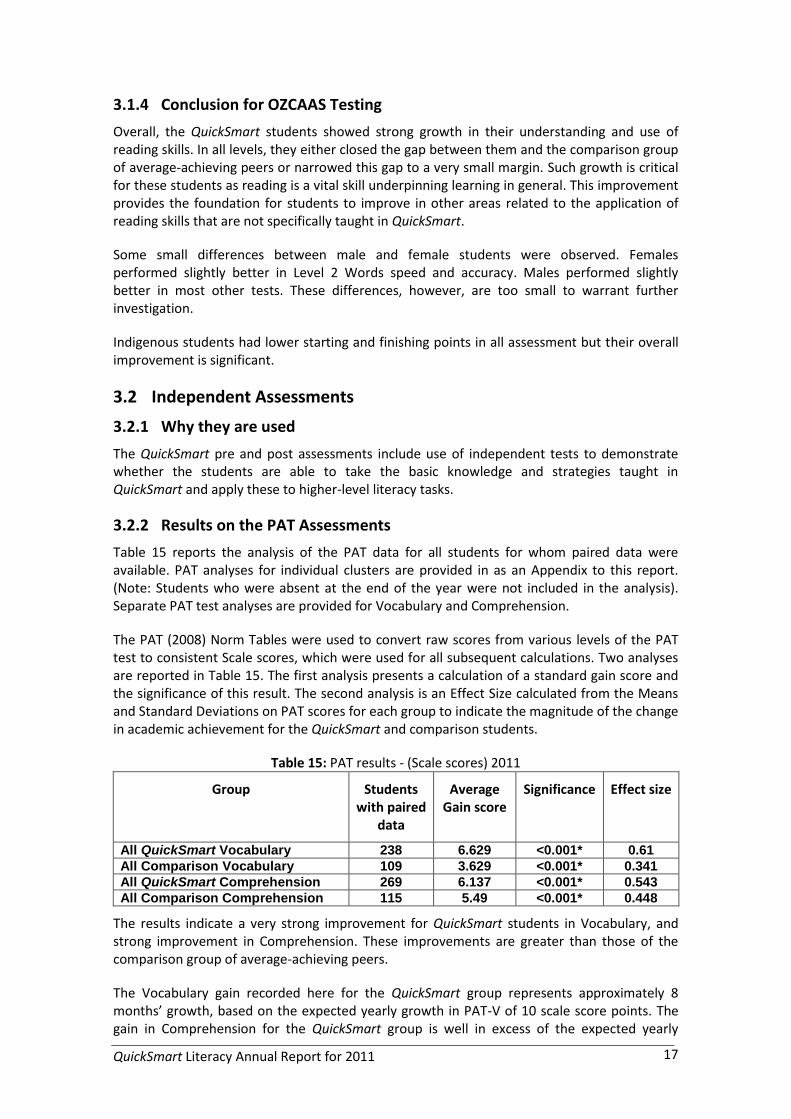
3.2.2 Results on the PAT Assessments
Table 15 reports the analysis of the PAT data for all students for whom paired data were available. PAT analyses for individual clusters are provided in as an Appendix to this report. (Note: Students who were absent at the end of the year were not included in the analysis). Separate PAT test analyses are provided for Vocabulary and Comprehension.
The PAT (2008) Norm Tables were used to convert raw scores from various levels of the PAT test to consistent Scale scores, which were used for all subsequent calculations. Two analyses are reported in Table 15. The first analysis presents a calculation of a standard gain score and the significance of this result. The second analysis is an Effect Size calculated from the Means and Standard Deviations on PAT scores for each group to indicate the magnitude of the change in academic achievement for the QuickSmart and comparison students.
Table 15: PAT results - (Scale scores) 2011
Group Students with paired
data
Average Gain score
Significance Effect size
All QuickSmart Vocabulary 238 6.629 <0.001* 0.61
All Comparison Vocabulary 109 3.629 <0.001* 0.341
All QuickSmart Comprehension 269 6.137 <0.001* 0.543
All Comparison Comprehension 115 5.49 <0.001* 0.448
The results indicate a very strong improvement for QuickSmart students in Vocabulary, and strong improvement in Comprehension. These improvements are greater than those of the comparison group of average-achieving peers.
The Vocabulary gain recorded here for the QuickSmart group represents approximately 8 months’ growth, based on the expected yearly growth in PAT-V of 10 scale score points. The gain in Comprehension for the QuickSmart group is well in excess of the expected yearly
QuickSmart Literacy Annual Report for 2011 18
growth of students’ scores as measured on the PAT-C assessment of between 4 and 5 scale score points.
Table 16 reports the same information as Table 15 but shows a comparison of males and females included in the QuickSmart program.
Table 16: PAT results - By Gender (Scale scores) 2011
Gender Students with paired data
Average Gain score
Significance Effect size
Vocabulary – QS Male 144 6.324 <0.001* 0.565
Vocabulary – Comp Male 46 2.726 0.043* 0.236
Vocabulary – QS Female 94 7.097 <0.001* 0.684
Vocabulary – Comp Female 63 4.289 <0.001* 0.432
Comprehension – QS Male 154 5.679 <0.001* 0.506
Comprehension – Comp Male 52 4.402 0.003* 0.353
Comprehension – QS Female 115 6.752 <0.001* 0.594
Comprehension – Comp Female
63 6.387 <0.001* 0.525
The results indicate that female QuickSmart students performed slightly better in both vocabulary and comprehension compared to male QuickSmart students.
Table 17 reports the same information as Table 15 but does so for the scores of Indigenous students included in the QuickSmart program.
Table 17: PAT results - Indigenous (Scale scores) 2011
Group Students with paired data
Average Gain score
Significance Effect size
Indigenous QS Vocab 14 6.421 0.015* 0.556
All Comparison Vocab 109 3.629 <0.001* 0.341
Indig QS Comprehension 15 3.72 0.156 0.431
All Comparison Comprehension 115 5.49 <0.001* 0.448
Once again these results show strong improvement for the Indigenous students who participated in QuickSmart for Vocabulary. While starting at a lower base, these students were able to report a rate of growth almost equivalent to the total cohort of QuickSmart students and in excess of that achieved by the comparison group. The Indigenous students’ Comprehension results also show a strong improvement, although not as strong as that shown by the rest of the QuickSmart group or the comparison group.
3.2.3 Results on the Victorian On-Demand VCAA Assessment
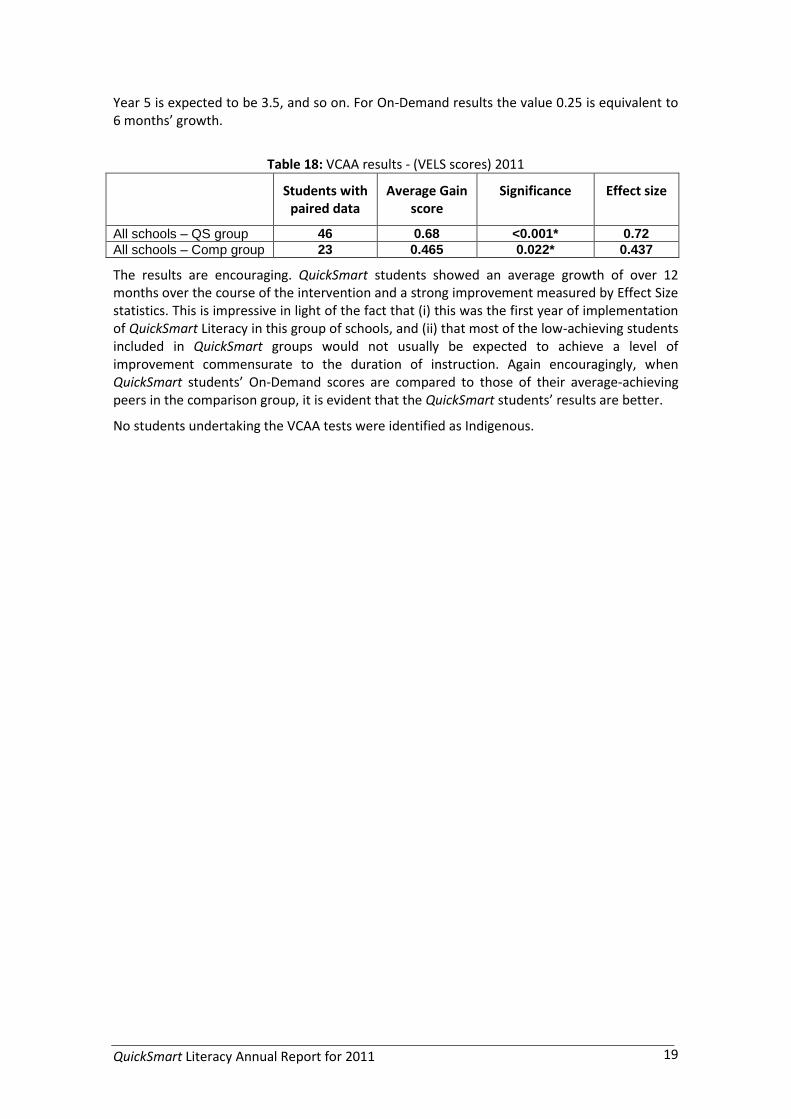
Table 18 reports the analysis of the VCAA data for all students for whom paired data were available. VCAA analyses for relevant Victorian clusters are provided as an Appendix to this report. (Note: Students who were absent at the end of the year were not included in the analysis).
When reviewing these results, it should be kept in mind that the scale of the On-Demand test is restricted, with most students’ scores expected to lie between 2 and 3.5. This restricted range is an artefact of the scaling used in these tests. Specifically, students’ achievement at the end of Year Four is pegged to an On-Demand test score of 3.0 and achievement at the end of
QuickSmart Literacy Annual Report for 2011 19
Year 5 is expected to be 3.5, and so on. For On-Demand results the value 0.25 is equivalent to 6 months’ growth.
Table 18: VCAA results - (VELS scores) 2011
Students with paired data
Average Gain score
Significance Effect size
All schools – QS group 46 0.68 <0.001* 0.72
All schools – Comp group 23 0.465 0.022* 0.437
The results are encouraging. QuickSmart students showed an average growth of over 12 months over the course of the intervention and a strong improvement measured by Effect Size statistics. This is impressive in light of the fact that (i) this was the first year of implementation of QuickSmart Literacy in this group of schools, and (ii) that most of the low-achieving students included in QuickSmart groups would not usually be expected to achieve a level of improvement commensurate to the duration of instruction. Again encouragingly, when QuickSmart students’ On-Demand scores are compared to those of their average-achieving peers in the comparison group, it is evident that the QuickSmart students’ results are better.
No students undertaking the VCAA tests were identified as Indigenous.
QuickSmart Literacy Annual Report for 2011 20
4 Conclusion to Report
The support provided by the Schools and Clusters has been critical in making more positive the hopes and aspirations of more than 270 students. This report has focused on the quantitative aspects of the program. In all analyses, the data report a narrowing of the achievement gap between QuickSmart students and their average-performing comparison group peers. Impressive effect sizes have been reported as well as highly significant gains on the part of individual students who, in some cases, could not complete the full suite of pre-test assessments.
Additionally, substantial qualitative data (reported in school presentations during professional workshops 2 and 3) indicate that QuickSmart students gained a new confidence in the area of literacy learning. Many stories within the corpus of qualitative data document improvements for QuickSmart students not only in relation to their performance in class, but also with regard to students’ attitudes to school, their attendance rates and levels of academic confidence both inside and outside the classroom.
The data collected to date from thousands of QuickSmart students indicate that the narrowing of the achievement gap between QuickSmart and comparison students results in low-achieving students proceeding with their studies more successfully by learning to ‘trust their heads’ in the same ways that effective learners do. Importantly, previous QuickSmart studies (references at http://www.une.edu.au/simerr/quicksmart/pages/qsresearchpublications.php) demonstrate that QuickSmart students can maintain the gains made during the program for years after they completed the program. Analyses have consistently identified impressive statistically significant end-of-program and longitudinal gains in terms of probability measures and effect sizes that mirror the qualitative improvements reported by teachers, paraprofessionals, parents and QuickSmart students.
If you have any questions concerning this report or QuickSmart please contact us at the SiMERR National Centre at UNE on (02) 67735065.
Professor John Pegg Associate Professor Lorraine Graham

QuickSmart Literacy Annual Report for 2011 21
5 APPENDIX – Cluster Results
5.1 Standardised Test results by cluster – (Scale scores for PAT, VELS levels for VCAA On-Demand Tests) 2011
Cluster of Schools Pre-Intervention Post-Intervention
N Mean SD Mean SD Gain p Effect size
Horsham Vocab – QS Group 76 108.888 10.661 115.809 10.901 6.921 <0.001* 0.642
Horsham Vocab – Comp Group 36 124.197 13.17 127.708 10.942 3.511 0.009* 0.29
Horsham Comprehension – QS Group 75 111.435 14.573 118.156 14.948 6.721 <0.001* 0.455
Horsham Comprehension – Comp Group 36 130.292 12.366 133.619 12.0 3.327 0.016* 0.273
Outer East Melb Vocab – QS Group 130 107.383 10.814 113.864 11.068 6.481 <0.001* 0.592
Outer East Melb Vocab – Comp Group 60 119.827 10.029 122.91 8.72 3.083 0.007* 0.328
Outer East Melb Comprehension – QS Group
130 111.612 9.205 116.702 10.038 5.09 <0.001* 0.529
Outer East Melb Comprehension – Comp Group
62 122.708 9.859 129.018 11.874 6.31 <0.001* 0.578
VCAA Outer East Melb - QS Group 46 2.622 0.841 3.302 1.039 0.68 <0.001* 0.72
VCAA Outer East Melb - Comp Group 23 3.748 0.986 4.213 1.136 0.465 0.022* 0.437
Note 1: only students who did both ‘pre’ and ‘post’ test are included in the table.
QuickSmart Literacy Annual Report for 2011 22
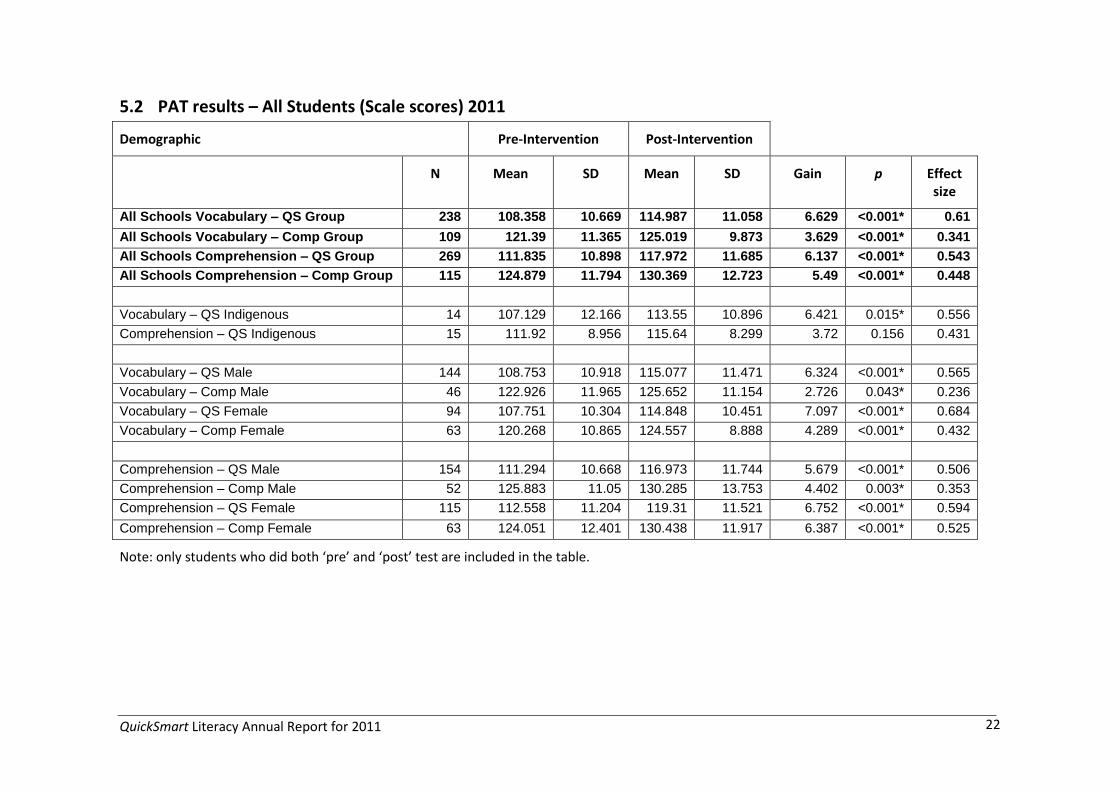
5.2 PAT results – All Students (Scale scores) 2011
Demographic Pre-Intervention Post-Intervention
N Mean SD Mean SD Gain p Effect size
All Schools Vocabulary – QS Group 238 108.358 10.669 114.987 11.058 6.629 <0.001* 0.61
All Schools Vocabulary – Comp Group 109 121.39 11.365 125.019 9.873 3.629 <0.001* 0.341
All Schools Comprehension – QS Group 269 111.835 10.898 117.972 11.685 6.137 <0.001* 0.543
All Schools Comprehension – Comp Group 115 124.879 11.794 130.369 12.723 5.49 <0.001* 0.448
Vocabulary – QS Indigenous 14 107.129 12.166 113.55 10.896 6.421 0.015* 0.556
Comprehension – QS Indigenous 15 111.92 8.956 115.64 8.299 3.72 0.156 0.431
Vocabulary – QS Male 144 108.753 10.918 115.077 11.471 6.324 <0.001* 0.565
Vocabulary – Comp Male 46 122.926 11.965 125.652 11.154 2.726 0.043* 0.236
Vocabulary – QS Female 94 107.751 10.304 114.848 10.451 7.097 <0.001* 0.684
Vocabulary – Comp Female 63 120.268 10.865 124.557 8.888 4.289 <0.001* 0.432
Comprehension – QS Male 154 111.294 10.668 116.973 11.744 5.679 <0.001* 0.506
Comprehension – Comp Male 52 125.883 11.05 130.285 13.753 4.402 0.003* 0.353
Comprehension – QS Female 115 112.558 11.204 119.31 11.521 6.752 <0.001* 0.594
Comprehension – Comp Female 63 124.051 12.401 130.438 11.917 6.387 <0.001* 0.525
Note: only students who did both ‘pre’ and ‘post’ test are included in the table.

QuickSmart Literacy Annual Report for 2011 23
5.3 National Literacy PAT Improvement of QuickSmart Students for 2011
The Australian Council for Educational Research (ACER) PAT tests use a framework for describing results against national Australian norms. This technique applies stanine scores that divide the population using a scale of 1 to 9.
A stanine score of:
1 represents performance in the bottom 4% of the population,
2 represents performance in the lower or 4-10% of the population
3 represents performance in the lower or top 11-22% of the population
4 represents performance in the lower 23-39% of the population
5 represents performance in middle 40-59% of the population
6 represents performance in the higher 60-76% of the population
7 represents performance in the higher77-88% of the population
8 represents performance in the higher 89-96% of the population
9 represents performance in the top 4% of the population.
It is particularly difficult to move students out of the lower stanine bands. The results above show that QuickSmart has been quite successful in moving students into higher bands, as measured by the various PAT.


![Balanced literacy program[1][1]](https://static.fdocuments.us/doc/165x107/5491f03fb479591a7b8b4760/balanced-literacy-program11.jpg)