Annual Housing Report · 2019-10-30 · 1 Over the last 11 years, the Federal Housing Finance...
52
Annual Housing Report Division of Housing Mission & Goals ANNUAL HOUSING REPORT JANUARY 1, 2018 – DECEMBER 31, 2018 RELEASE DATE: OCTOBER 30, 2019
Transcript of Annual Housing Report · 2019-10-30 · 1 Over the last 11 years, the Federal Housing Finance...
1 | P a g e
A n n u a l H o u s i n g R e p o r t
Division of Housing Mission & Goals
ANNUAL HOUSING REPORT JANUARY 1, 2018 – DECEMBER 31, 2018 RELEASE DATE: OCTOBER 30, 2019

i
A n n u a l H o u s i n g R e p o r t
Introduction 1
Housing Goals 4
I. Housing Goals – Introduction 4
II. 2018 Housing Goals Performance 5
Enterprise Data Compared to Market Data 10
Multifamily Housing 16
Duty to Serve Underserved Markets 18
Affordable Housing Allocations 26
Monthly Survey of Mortgage Markets (National Mortgage Database) 27
Subprime and Nontraditional Loans 29
Higher-Priced Mortgage Loans 30
Public Access to Mortgage Information 32
Appendix A: Preliminary Determination Letters: Enterprise 2018 Housing Goals Performance 33
Appendix B: Subprime and Nontraditional Loans 38
Appendix C: Higher-Priced Mortgage Loans 42 I. Purchase Price 43
II. Combined Loan-to-Value Ratio 43
III. Product Type 44
IV. Term at Origination 45
V. Interest Rate at Origination 45

ii
A n n u a l H o u s i n g R e p o r t
VI. Credit Score 46
VII. Borrower Income Ratio 47
VIII. Tract Income Ratio 47
IX. 2010 Census Tract/Percent Minority 48
X. Purpose of Loan 49
XI. Federal Guarantee 49

1
A n n u a l H o u s i n g R e p o r t
Introduction
The Federal National Mortgage Association (Fannie Mae) and the Federal Home Loan Mortgage Corporation (Freddie Mac) perform important roles under their charters in providing a stable source of housing finance that supports access to mortgage credit for low- and moderate-income families, as well as those in underserved areas.1 Over the last 11 years, the Federal Housing Finance Agency (FHFA) has encouraged Fannie Mae and Freddie Mac (the Enterprises) to engage in a number of initiatives that help identify obstacles to accessing mortgage credit, analyze potential solutions, and develop appropriate strategies to improve and maintain availability of credit for housing in a safe and sound manner.
The Federal Housing Enterprises Financial Safety and Soundness Act of 1992 (Safety and Soundness Act) requires that FHFA establish several annual housing goals for both single-family and multifamily mortgages purchased by the Enterprises. As required, FHFA established housing goals for the Enterprises for 2018 through 2020 in a final rule published in the Federal Register on February 12, 2018.2 The housing goals include separate affordable housing categories for single-family and multifamily mortgages.
FHFA oversees the Enterprises’ annual housing goals requirements. FHFA’s assessment of the Enterprises’ performance against the 2018 single-family housing goals involves a two-step process: (1) an evaluation of each Enterprise’s actual performance against benchmark levels set by FHFA; and (2) an evaluation of actual
1 See Federal National Mortgage Association Charter Act, 12 U.S.C. § 1716, and Federal Home Loan Mortgage Corporation Act, 12 U.S.C. § 1451 Note. 2 See 83 Fed. Reg. 5878 (Feb. 12, 2018), codified at 12 CFR part 1282.
Mission and Role
FHFA was established by the Housing and Economic Recovery Act of 2008 (HERA) and is responsible for the effective supervision, regulation, and housing mission oversight of Fannie Mae, Freddie Mac, and the Federal Home Loan Bank (Bank or FHLBank) System, which includes 11 FHLBanks and the Office of Finance. FHFA’s mission is to ensure that the regulated entities operate in a safe and sound manner so that they serve as a reliable source of liquidity and funding for housing finance and community investment. Since 2008, FHFA has also served as conservator of Fannie Mae and Freddie Mac, as described in the Strategic Plan for the Conservatorships of Fannie Mae and Freddie Mac.

2
A n n u a l H o u s i n g R e p o r t
performance against market performance based on analysis of public loan origination data submitted under the Home Mortgage Disclosure Act (HMDA). FHFA’s assessment of the Enterprises’ performance against the 2018 multifamily goals involves an evaluation of actual performance against benchmark levels. There is no market comparison for the multifamily goals.
Apart from the housing goals, FHFA, in its role as conservator, sets expectations for the Enterprises in its annual Conservatorship Scorecard. The Enterprises undertook various initiatives in 2018 to identify obstacles to borrowers, analyze potential solutions, assess market opportunities, and test promising solutions through pilot initiatives. Annual Conservatorship Scorecards set specific objectives within the overall Strategic Plan for the Conservatorships of Fannie Mae and Freddie Mac.3 The Enterprises pursued activities affecting both homeownership and rental housing.4
In December 2016, FHFA published a final rule to establish a Duty to Serve program that impacts both homeownership and rental housing, pursuant to the Duty to Serve requirements in the Safety and Soundness Act.5 The rule requires the Enterprises to serve very low-, low-, and moderate-income families in three underserved markets: manufactured housing, affordable housing preservation, and rural housing. The rule creates a planning, implementation, and assessment process that occurs in three-year cycles and is designed to encourage greater and more liquid mortgage investments by private capital in underserved markets. The Enterprises completed development of their Underserved Markets Plans in 2017 and implementation of the Plans started in 2018. The Duty to Serve section of this Report describes the planning process and the Plans submitted by the Enterprises.
The Enterprises also make contributions to two funds specifically for affordable housing: the National Housing Trust Fund and the Capital Magnet Fund. The contributions follow a statutory formula, and the funds are allocated at the state and federal levels to address affordable housing needs that are not otherwise served fully by private capital sources. The section of this Report on these affordable housing allocations provides more information about these funds.
In addition to describing the affordable housing activities of the Enterprises during 2018, this
3 See https://www.fhfa.gov/AboutUs/Reports/ReportDocuments/StratPlan_Final_1292018.pdf. 4 2018 Scorecard Progress Report, https://www.fhfa.gov/AboutUs/Reports/ReportDocuments/2018-Scorecard-Progress-Report.pdf. 5 See 81 Fed. Reg. 96242 (Dec. 29, 2016), codified at 12 CFR part 1282; 12 U.S.C. § 4565.

3
A n n u a l H o u s i n g R e p o r t
Report provides information on single-family loan purchases by the Enterprises by race or ethnicity, gender, census tract median income, fixed-rate vs. adjustable-rate, loan-to-value ratio, and credit score. The Report also discusses subprime, nontraditional, and higher-priced mortgage loans.6 In addition, the Report discusses the Enterprises’ 2018 Public Use Database.
6 The Safety and Soundness Act requires reporting of these categories. See 12 U.S.C. § 4544.

4
A n n u a l H o u s i n g R e p o r t
Housing Goals
I. Housing Goals – Introduction
The Safety and Soundness Act requires FHFA to establish annual housing goals for both single-family and multifamily mortgages purchased by Fannie Mae and Freddie Mac.7 The housing goals are one measure of the extent to which the Enterprises are meeting their public purposes, which include “an affirmative obligation to facilitate the financing of affordable housing for low- and moderate-income families in a manner consistent with their overall public purposes, while maintaining a strong financial condition and a reasonable economic return.”8
The Enterprises have continued to support a stable and liquid national market for residential mortgage financing. FHFA continues to establish annual housing goals for the Enterprises and assesses their performance against the housing goals each year.9 FHFA established housing goals for the Enterprises for 2018 through 2020 in a final rule published in the Federal Register on February 12, 2018.10 FHFA established the following goals and subgoals for mortgages on single-family, owner-occupied housing and mortgages on multifamily housing:
Single-family Goals and Subgoal
1. A low-income home purchase goal for home purchase mortgages to families with incomes no greater than 80 percent of area median income (AMI);
2. A very low-income home purchase goal for home purchase mortgages to families with
incomes no greater than 50 percent of AMI;
3. A low-income areas home purchase subgoal for home purchase mortgages to families living in census tracts with tract incomes no greater than 80 percent of AMI, or families with incomes no greater than 100 percent of AMI who live in census tracts with a minority population of 30 percent or more and a tract median income of less than 100 percent of AMI;
7 See 12 U.S.C. § 4561(a). 8 See 12 U.S.C. § 4501(7). 9 Under 12 U.S.C. § 4544(b)(1)(A)(i), FHFA is required to discuss in the annual housing report whether and how each Enterprise is achieving the annual housing goals. 10 See 83 Fed. Reg. 5878 (Feb. 12, 2018), codified at 12 CFR part 1282.

5
A n n u a l H o u s i n g R e p o r t
4. A low-income areas home purchase goal for mortgages that meet the criteria under the low-income areas home purchase subgoal described above, as well as home purchase mortgages to families with incomes no greater than 100 percent of AMI who live in a federally-declared disaster area; and
5. A low-income refinance goal for refinance mortgages to families with incomes no
greater than 80 percent of AMI.
Multifamily Goal and Subgoals
1. A low-income multifamily goal for rental units in multifamily properties affordable to families with incomes no greater than 80 percent of AMI; 2. A very low-income multifamily subgoal for rental units in multifamily properties affordable to families with incomes no greater than 50 percent of AMI; and 3. A small multifamily low-income subgoal for rental units in multifamily properties with 5-50 units affordable to families with incomes no greater than 80 percent of AMI.
II. 2018 Housing Goals Performance
Based on FHFA’s preliminary determinations, the Enterprises’ purchases of mortgages exceeded the benchmarks for all of the housing goals for 2018, as described in further detail below. The sections below explain the structure of the housing goals and provide the detailed performance of each Enterprise based on the preliminary determinations.
A. 2018 Housing Goals Performance – Single-Family
The single-family housing goal levels for 2018 through 2020 are expressed as percentages of each Enterprise’s purchases of mortgages on single-family owner-occupied properties. FHFA established separate single-family home purchase and refinance goals.
For the single-family housing goals for 2018 through 2020, an Enterprise achieves a goal if its performance meets or exceeds at least one of the following:
• The specific benchmark levels established in FHFA’s February 12, 2018 final rule; or

6
A n n u a l H o u s i n g R e p o r t
• The “market,” which is defined as the share of conventional, conforming mortgage originations that qualified for the goal based on FHFA’s analysis of Home Mortgage Disclosure Act (HMDA) data.
The benchmark serves as a prospective goal that the Enterprises can plan for, while the market level calculation serves as a retrospective look at the year.
FHFA analyzes the single-family mortgage market by calculating the share of home purchase or refinance mortgages originated in the primary mortgage market that qualified for the goal in that year. The market level figures are defined as HMDA-reported conventional loans on owner-occupied properties with principal balances less than or equal to the Enterprises’ conforming loan limits. Therefore, the market level figures11 exclude loans insured or guaranteed by the federal government, such as the Federal Housing Administration (FHA), U.S. Department of Veterans Affairs (VA), and U.S. Department of Agriculture Rural Housing Service (RHS). FHFA bases these calculations on its analysis of public HMDA data that is made available by the Consumer Financial Protection Bureau (CFPB) based on data submitted to the Federal Financial Institutions Examination Council (FFIEC) by primary market mortgage originators. Typically, public HMDA data is released well after the end of the calendar year.
FHFA has preliminarily determined that both Enterprises achieved all of the single-family housing goals in 2018, as shown in Tables 1 and 2 below.
11 FHFA defines the market level figures to include the same kinds of loans that are counted in determining Enterprise performance on the housing goals.

7
A n n u a l H o u s i n g R e p o r t
Fannie Mae – Single-Family
Table 1: Fannie Mae Single-Family Housing Goals and Preliminary Determination of 2018 Performance
Benchmark Level
Market Level
FHFA Preliminary Determination of
Fannie Mae’s 2018 Performance
Low-Income Home Purchase Goal 24% 25.5% 28.2%
Very Low-Income Home Purchase Goal 6% 6.5% 6.7%
Low-Income Areas Home Purchase Goal 18% 22.6% 25.1%
Low-Income Areas Home Purchase Subgoal 14% 18.0% 20.1%
Low-Income Refinance Goal 21% 30.7% 31.2%
Freddie Mac – Single-Family
Table 2: Freddie Mac Single-Family Housing Goals and Preliminary Determination of 2018 Performance
Benchmark Level
Market Level
FHFA Preliminary Determination of
Freddie Mac’s 2018 Performance
Low-Income Home Purchase Goal 24% 25.5% 25.8%
Very Low-Income Home Purchase Goal 6% 6.5% 6.3%
Low-Income Areas Home Purchase Goal 18% 22.6% 22.6%
Low-Income Areas Home Purchase Subgoal 14% 18.0% 17.3%
Low-Income Refinance Goal 21% 30.7% 27.3%
FHFA has notified Fannie Mae and Freddie Mac of the agency’s preliminary determination that each Enterprise met all single-family housing goals in 2018 (see Appendix A). Following receipt of each Enterprise’s response (if any) to the preliminary determination letter, FHFA will make a final determination of that Enterprise’s performance on the housing goals for 2018.

8
A n n u a l H o u s i n g R e p o r t
B. 2018 Housing Goal Performance - Multifamily
FHFA establishes the multifamily goals as minimum numbers of multifamily units qualifying for the goals. FHFA does not perform a retrospective market share analysis because there is no comprehensive multifamily market data comparable to single-family HMDA data. Prior to 2015, FHFA had set multifamily housing goals at different levels for each Enterprise, but the final rule published in 2015 established identical multifamily housing goals for both Enterprises for 2015 through 2017. The 2018 final rule continued the practice of establishing identical multifamily goals for 2018 through 2020.
FHFA has preliminarily determined that both Enterprises achieved all of the multifamily housing goals in 2018, as shown in Tables 3 and 4 below.
Fannie Mae – Multifamily Table 3: Fannie Mae Multifamily Housing Goals and Preliminary Determination of 2018
Performance
Benchmark Level FHFA Preliminary
Determination of Fannie Mae’s 2018 Performance
Low-Income Multifamily Goal 315,000 421,813
Very Low-Income Multifamily Subgoal 60,000 80,891
Small Multifamily Low-Income Subgoal 10,000 11,890
Freddie Mac – Multifamily Table 4: Freddie Mac Multifamily Housing Goals and Preliminary Determination of 2018
Performance
Benchmark Level FHFA Preliminary
Determination of Freddie Mac’s 2018 Performance
Low-Income Multifamily Goal 315,000 474,062
Very Low-Income Multifamily Subgoal 60,000 105,612
Small Multifamily Low-Income Subgoal 10,000 39,353
FHFA has notified Fannie Mae and Freddie Mac of the agency’s preliminary determination that each Enterprise met all multifamily housing goals in 2018 (see Appendix A). Following receipt

9
A n n u a l H o u s i n g R e p o r t
of each Enterprise’s response (if any) to the preliminary determination letter, FHFA will make a final determination of that Enterprise’s performance on the housing goals for 2018.
10
A n n u a l H o u s i n g R e p o r t
Enterprise Data Compared to Market Data
In its 2018 Annual Mortgage Report, Fannie Mae reported that it acquired $416.7 billion of loans on single-family, owner-occupied housing.16 In Freddie Mac’s 2018 Annual Mortgage Report, Freddie Mac reported that it acquired $287.0 billion of such loans.17 Tables 5 through 9 below show various characteristics of the mortgages purchased by Fannie Mae and Freddie Mac in 2018 and the corresponding characteristics of mortgages originated in the conventional, conforming primary market, as determined by FHFA’s analysis of publicly-available HMDA data.18
The tables reflect the Enterprises’ acquisitions of conventional home purchase and refinance mortgages on single-family, owner-occupied properties. Loans for which information was missing or not provided are not included in this analysis. The market figures in these tables refer to the conventional conforming market including both Enterprise and non-Enterprise loans, measured by HMDA-reported loans originated each year on owner-occupied properties with principal balances less than or equal to the Enterprises’ conforming loan limits, excluding any loans insured or guaranteed by the federal government, such as FHA, VA, or RHS loans.
Table 5 shows the distribution of Enterprise mortgages acquired and the distribution of originations in the conventional, conforming market by borrower income in 2017 and 2018.
16 See http://www.fanniemae.com/resources/file/aboutus/pdf/2018ahar.pdf. 17 See http://www.freddiemac.com/about/pdf/2018_Freddie_Mac_AHAR.pdf and https://www.fhfa.gov/PolicyProgramsResearch/Programs/AffordableHousing/Documents/Fred_M_Goals/ahdr_fhfa_tables_qtly_20184Q.pdf. 18 Under 12 U.S.C. § 4544(b)(3), FHFA is required to “aggregate and analyze data on income, race, and gender by census tract and other relevant classifications, and compare such data with larger demographic, housing, and economic trends.”

11
A n n u a l H o u s i n g R e p o r t
Table 5: Enterprise Acquisitions of Mortgages on Single-Family Owner-Occupied Properties by Borrower Income, and Corresponding Shares of the Conventional, Conforming Market
Home Purchase
2017 2018
Borrower Income Ratio* Market Fannie Mae Freddie Mac Market Fannie Mae Freddie Mac
<=50% 5.9% 5.9% 5.7%
6.5% 6.7% 6.3%
>50% to <=60% 5.3% 5.7% 4.9% 5.5% 6.3% 5.6%
>60% to <=80% 13.1% 14.0% 12.6% 13.5% 15.2% 13.8%
>80% to <=100% 13.3% 13.7% 13.5% 13.3% 14.7% 14.2%
>100% to <=120% 12.1% 12.2% 12.7% 11.7% 12.3% 12.9%
>120% 50.4% 48.6% 50.6% 49.5% 44.7% 47.2%
Totals 100.0% 100.0% 100.0% 100.0% 100.0% 100.0%
Refinance 2017 2018
Borrower Income Ratio* Market Fannie Mae Freddie Mac Market Fannie Mae Freddie Mac
<=50% 7.2% 6.9% 6.9% 9.7% 9.5% 7.8%
>50% to <=60% 5.2% 5.1% 5.0% 6.3% 6.5% 5.7%
>60% to <=80% 13.0% 12.8% 12.9% 14.6% 15.2% 13.8%
>80% to <=100% 13.9% 13.7% 13.9% 14.3% 14.7% 14.7%
>100% to <=120% 12.5% 12.6% 12.7% 12.3% 12.8% 13.1%
>120% 48.2% 48.9% 48.6% 42.8% 41.3% 44.9%
Totals 100.0% 100.0% 100.0% 100.0% 100.0% 100.0%
*Borrower Income Relative to Area Median Income Source: FHFA analysis of 2017 and 2018 Enterprise and Home Mortgage Disclosure Act (HMDA) data. Percentages may not add to 100.0% due to rounding.

12
A n n u a l H o u s i n g R e p o r t
Table 6 below shows the distribution of Enterprise mortgages acquired and the originations distribution in the conventional, conforming market by race/ethnicity of the borrower(s) in 2017 and 2018.
Table 6: Enterprise Acquisitions of Mortgages on Single-Family Owner-Occupied Properties by Borrower Race/Ethnicity, and Corresponding Shares of the Conventional,
Conforming Market Home Purchase
2017 2018
Race/Ethnicity of Borrower(s) Market Fannie
Mae Freddie
Mac Market Fannie Mae
Freddie Mac
Hispanic or Latino 8.1% 9.5% 8.2% 9.2% 10.8% 8.8% American Indian/Alaskan Native 0.2% 0.3% 0.2% 0.2% 0.2% 0.2% Asian 8.2% 7.6% 8.1% 7.6% 6.9% 7.3%
African American 3.8% 4.0% 3.2% 4.1% 4.7% 3.5% Native Hawaiian/Pacific Islander 0.2% 0.3% 0.2% 0.1% 0.2% 0.1% Non-Hispanic White Alone 78.8% 77.8% 78.0% 77.7% 76.5% 76.8% Two or More Races 0.6% 0.5% 2.2% 1.0% .7% 2.2% Totals 100.0% 100.0% 100.0% 100.0% 100.0% 100.0%
Refinance
2017 2018
Race/Ethnicity of Borrower(s) Market Fannie Mae
Freddie Mac Market Fannie
Mae Freddie
Mac Hispanic or Latino 10.3% 11.1% 10.2% 10.0% 11.6% 9.7% American Indian/Alaskan Native 0.3% 0.3% 0.2% 0.3% 0.3% 0.2%
Asian 5.3% 5.6% 5.1% 4.4% 4.5% 4.1%
African American 4.9% 4.9% 4.3% 5.0% 5.7% 4.6% Native Hawaiian/Pacific Islander 0.4% 0.4% 0.3% 0.2% 0.3% 0.2%
Non-Hispanic White Alone 78.2% 77.1% 78.0% 79.3% 76.9% 79.2%
Two or More Races 0.5% 0.5% 1.9% 0.7% 0.7% 1.9%
Totals 100.0% 100.0% 100.0% 100.0% 100.0% 100.0% Source: FHFA analysis of 2017 and 2018 Enterprise and Home Mortgage Disclosure Act (HMDA) data. Percentages may not add to 100.0% due to rounding.

13
A n n u a l H o u s i n g R e p o r t
Table 7 below shows the distribution of Enterprise mortgages acquired and the originations distribution in the conventional, conforming market by gender of borrower in 2017 and 2018.
Table 7: Enterprise Acquisitions of Mortgages on Single-Family Owner-Occupied Properties by Borrower Gender, and Corresponding Shares of the Conventional,
Conforming Market Home Purchase
2017 2018
Gender of Borrower(s) Market Fannie Mae
Freddie Mac Market Fannie
Mae Freddie
Mac One Borrower (Male) 31.8% 32.1% 32.1% 31.7% 32.6% 32.7% One Borrower (Female) 22.8% 23.4% 22.3% 22.6% 24.1% 23.0% Co-Borrowers (All Male) 1.4% 1.5% 1.7% 1.5% 1.7% 1.6% Co-Borrowers (All Female) 1.2% 1.4% 1.4% 1.3% 1.6% 1.5% Co-Borrowers (Male and Female) 42.8% 41.5% 42.6% 42.9% 40.0% 41.1% Totals 100.0% 100.0% 100.0% 100.0% 100.0% 100.0%
Refinance
2016 2017
Gender of Borrower(s) Market Fannie Mae
Freddie Mac Market Fannie
Mae Freddie
Mac One Borrower (Male) 29.2% 29.6% 29.3% 29.1% 31.1% 30.7% One Borrower (Female) 23.5% 23.6% 22.9% 24.2% 25.8% 23.8% Co-Borrowers (All Male) 0.9% 1.0% 1.0% 0.9% 1.0% 1.0% Co-Borrowers (All Female) 0.9% 1.0% 1.0% 1.0% 1.1% 1.1% Co-Borrowers (Male and Female) 45.6% 44.8% 45.8% 44.8% 41.0% 43.5% Totals 100.0% 100.0% 100.0% 100.0% 100.0% 100.0%
Source: FHFA analysis of 2017 and 2018 Enterprise and Home Mortgage Disclosure Act (HMDA) data. Percentages may not add to 100.0% due to rounding.

14
A n n u a l H o u s i n g R e p o r t
Table 8 below shows the Enterprises’ mortgage purchases distribution and the originations distribution in the conventional, conforming market by the minority share of the population in the census tract in 2017 and 2018.
Table 8: Enterprise Acquisitions of Mortgages on Single-Family Owner-Occupied Properties by Minority Share of Census Tract, and Corresponding Shares of the
Conventional, Conforming Market Home Purchase
2017 2018
Minority Share of Census Tract Population
Market Fannie Mae
Freddie Mac Market Fannie
Mae Freddie
Mac
<10% 25.3% 22.5% 24.0% 26.1% 22.6% 23.6% >=10% to <20% 26.0% 26.0% 26.3% 25.6% 25.5% 26.2% >=20% to <30% 16.1% 16.6% 16.4% 15.7% 16.2% 16.5% >=30% to <50% 17.8% 18.9% 18.2% 17.5% 18.6% 18.5% >=50% to <80% 10.9% 11.7% 11.2% 10.8% 12.1% 11.3% >=80% 4.0% 4.3% 4.0% 4.2% 5.1% 4.0% Totals 100.0% 100.0% 100.0% 100.0% 100.0% 100.0%
Refinance
2017 2018
Minority Share of Census Tract Population
Market Fannie Mae
Freddie Mac Market Fannie
Mae Freddie
Mac
<10% 24.7% 21.9% 23.9% 27.6% 22.3% 25.4% >=10% to <20% 23.0% 23.0% 23.6% 23.1% 22.6% 23.7% >=20% to <30% 14.7% 15.2% 15.0% 14.2% 14.8% 14.8% >=30% to <50% 17.8% 18.7% 17.9% 16.6% 18.3% 17.4% >=50% to <80% 13.0% 13.8% 12.9% 12.0% 14.0% 12.3% >=80% 6.8% 7.5% 6.7% 6.6% 8.0% 6.4% Totals 100.0% 100.0% 100.0% 100.0% 100.0% 100.0%
Source: FHFA analysis of 2017 and 2018 Enterprise and Home Mortgage Disclosure Act (HMDA) data. Percentages may not add to 100.0% due to rounding.

15
A n n u a l H o u s i n g R e p o r t
Table 9 below shows the Enterprises’ mortgage purchases distribution and the originations distribution in the conventional, conforming market by the median income level of the population in the census tract in 2017 and 2018.
Table 9: Enterprise Acquisitions of Mortgages on Single-Family Owner-Occupied Properties by Census Tract Median Income Relative to Area Median Income, and Corresponding Shares
of the Conventional, Conforming Market
Home Purchase
2017 2018
Census Tract Income Ratio* Market Fannie
Mae Freddie
Mac Market Fannie Mae
Freddie Mac
<=60% 4.2% 4.5% 4.0% 4.3% 4.9% 4.0%
>60% to <=80% 9.7% 10.3% 9.3% 10.4% 11.2% 9.8%
>80% to <=100% 19.5% 19.6% 19.1% 20.8% 20.7% 20.1%
>100% to <=120% 23.6% 23.3% 23.4% 23.8% 23.2% 23.5%
>120% 42.9% 42.4% 44.2% 40.7% 40.1% 42.7%
Totals 100.0% 100.0% 100.0% 100.0% 100.0% 100.0%
Refinance
2017 2018
Census Tract Income Ratio* Market Fannie
Mae Freddie
Mac Market Fannie Mae
Freddie Mac
<=60% 4.4% 4.4% 4.1% 4.5% 4.7% 4.3%
>60% to <=80% 10.7% 10.4% 10.2% 11.2% 11.5% 10.9%
>80% to <=100% 21.0% 20.3% 20.6% 22.6% 22.0% 22.2%
>100% to <=120% 24.1% 23.6% 24.1% 24.4% 23.9% 24.6%
>120% 39.9% 41.2% 41.0% 37.3% 37.9% 38.0%
Totals 100.0% 100.0% 100.0% 100.0% 100.0% 100.0%
*Median income of the census tract relative to Area Median Income (AMI). Source: FHFA analysis of 2017 and 2018 Enterprise and Home Mortgage Disclosure Act (HMDA) data. Percentages may not add to 100.0% due to rounding.

16
A n n u a l H o u s i n g R e p o r t
Multifamily Housing
As conservator of the Enterprises, FHFA establishes a yearly cap in the Conservatorship Scorecard that limits the amount of conventional, market-rate multifamily loans that each Enterprise can purchase. The multifamily cap furthers FHFA’s conservatorship goals of maintaining the presence of the Enterprises as a backstop for the multifamily finance market while not impeding the participation of private capital. The 2018 Conservatorship Scorecard set the cap for each Enterprise at $35 billion to reflect what FHFA considered an appropriate market share for the Enterprises during normal market conditions.19 FHFA, however, excluded certain loans eligible for housing goals credit and other categories of transactions in the underserved market from counting toward the multifamily cap to allow the Enterprises to provide greater support for the underserved market in which there historically has been minimal participation of private capital.20
FHFA designed exclusions from the 2018 cap to support affordable and underserved multifamily segments of the multifamily market that the private sector does not serve adequately:
• subsidized affordable housing, • manufactured housing communities, • affordable units in small multifamily properties between 5 and 50 units, • affordable properties in rural areas, • affordable units in seniors’ assisted living properties, • energy and water efficiency improvements in Enterprise-financed properties, and • market-rate units that are affordable to very low-, low-, and moderate-income tenants in
standard, high-cost, very-high cost, and extremely-high cost rental markets.21
In 2018, the Enterprises actively managed their loan production consistent with the multifamily Conservatorship Scorecard objectives. Fannie Mae’s total multifamily finance activity for the year was approximately $65.38 billion, with $29.76 billion within the cap and $35.62 billion in
19 2018 Scorecard for Fannie Mae, Freddie Mac, and Common Securitization Solutions, available at https://www.fhfa.gov/AboutUs/Reports/ReportDocuments/2018-Scorecard-12212017.pdf. 20 2018 Scorecard Progress Report, p. 8-10, available at https://www.fhfa.gov/AboutUs/Reports/ReportDocuments/2018-Scorecard-Progress-Report.pdf. 21 Income thresholds for affordability in renter markets are defined as: standard renter markets at 60 percent of AMI or below; high-cost renter markets at 80 percent of AMI or below; very high-cost renter markets at 100 percent of AMI or below; and extremely high-cost renter markets at 120 percent of AMI or below.

17
A n n u a l H o u s i n g R e p o r t
the excluded categories. Freddie Mac’s total multifamily finance activity for the year was approximately $77.47 billion, with $32.57 billion within the cap and $44.90 billion in the excluded categories.
The 2018 Conservatorship Scorecard also required the Enterprises to explore opportunities to further support liquidity in multifamily workforce housing. During 2018, the Enterprises conducted research on how the Enterprises could help preserve workforce housing for low- and moderate-income households. Both Enterprises examined the value of an industry definition for workforce housing, researched the need for workforce housing in various markets, assessed the availability of capital in the workforce housing space, and explored potential partnerships, pilot programs, and initiatives to serve the workforce housing market. In June 2018, FHFA held a workshop with stakeholders to discuss the issue. As a result of the workshop, the Enterprises heard directly from workforce housing stakeholders who provided insights into various needs related to workforce housing preservation. These efforts resulted in research and partnerships by the Enterprises focused on workforce housing.
The 2018 Conservatorship Scorecard also required the Enterprises to continue to gather and report to FHFA information needed to inform policy decisions regarding single-family rentals and assist FHFA in assessing single-family rental strategies. As a result of these efforts, FHFA announced in August 2018 that the Enterprises would conclude their single-family rental pilot programs and terminate their participation in the single-family rental market except through their previously existing investor programs – Fannie Mae’s Multiple Financed Properties and Freddie Mac’s Investment Property Mortgages.

18
A n n u a l H o u s i n g R e p o r t
Duty to Serve Underserved Markets
The Safety and Soundness Act establishes a duty for Fannie Mae and Freddie Mac to serve very low-, low-, and moderate-income families in three underserved markets — manufactured housing, affordable housing preservation, and rural housing. 22 Specifically, the Act directs the Enterprises to improve the distribution and availability of mortgage financing in each of these markets and provide leadership to the market by developing loan products and underwriting guidelines, conducting outreach, and making loan purchases and investments.
FHFA’s Duty to Serve regulation implements these statutory requirements.23 Under the regulation, each Enterprise is required to submit an Underserved Markets Plan (Plan) for review and non-objection. The Plan covers a three-year period and describes, for each market, the activities and objectives the Enterprise will carry out to meet its Duty to Serve obligations in each underserved market. The regulation lists the specific activities in each of the three underserved markets that are eligible to receive credit. Following a public input process, and FHFA’s non-objection, the Enterprises’ first Plans covering 2018 to 2020 went into effect on January 1, 2018.24
FHFA monitored the Enterprises’ Duty to Serve implementation throughout 2018 through review of quarterly reports submitted by the Enterprises, among other activities. In March 2019, the Enterprises submitted annual reports to FHFA detailing their actions and progress toward achieving the objectives during 2018.
The Safety and Soundness Act requires FHFA to evaluate annually the Enterprises’ compliance with their Duty to Serve obligations and rate their performance for each undeserved market.25 The Duty to Serve regulation provides a framework for FHFA’s method for evaluating and rating the Enterprises’ compliance with their duty to serve, which is further specified in separate FHFA Evaluation Guidance. The guidance provides for FHFA to evaluate and rate the Enterprises’ performance under their Plans using a three-part process: 1) a quantitative assessment of whether
22 See 12 U.S.C. § 4565. 23 See 81 Fed. Reg. 96242 (Dec. 29, 2016), codified at 12 CFR part 1282. 24 The Enterprises’ final 2018-2020 Duty to Serve Underserved Markets Plans can be found at https://www.fhfa.gov/PolicyProgramsResearch/Programs/Documents/Fannie-Mae-Revised-Underserved-Markets-Plan-2018.pdf for Fannie Mae and at https://www.fhfa.gov/PolicyProgramsResearch/Programs/Documents/Freddie-Mac_Revised-Underserved-Markets-Plan-2018.pdf for Freddie Mac. 25 See 12 U.S.C. § 4565(d).

19
A n n u a l H o u s i n g R e p o r t
the Enterprise achieved the objectives in its Plan; 2) a qualitative assessment of the impact of the Enterprise’s performance of its Plan objectives on affordable housing needs in the underserved markets; and 3) an assessment of extra credit-eligible activities undertaken by the Enterprises. This assessment results in a determination of whether an Enterprise has complied with its Duty to Serve obligations in each market and their impact.
FHFA has evaluated Fannie Mae’s and Freddie Mac’s year-one performance under their initial Underserved Markets Plans. The Agency has determined that each Enterprise complied with its duty to serve requirements in all three underserved markets. In addition, FHFA finds that each Enterprise performed a satisfactory job of increasing the liquidity and distribution of available capital in each of the three underserved markets. Significant challenges exist in these markets and while both Enterprises initiated numerous activities to address these challenges, it is difficult to assess whether there was a meaningful impact based on a single year of Enterprise engagement. Due to the difficulty of measuring and rating impact from this single year, FHFA has not determined more granular ratings for 2018. Additional information about the Enterprises’ 2018 activities is available on the Duty to Serve webpage on FHFA.gov.26
In 2018, both Enterprises made progress on early steps towards increasing liquidity and the distribution and availability of mortgage capital in distinct segments of the underserved markets. Highlights and challenges of selected activities are discussed below.
In the manufactured housing market, both Enterprises took steps to improve liquidity for manufactured housing titled as real property, including by building relationships with the manufactured housing industry. Fannie Mae, in particular, significantly increased its purchases of loans on manufactured housing titled as real estate in 2018, by 26 percent year-over-year.
Both Enterprises introduced programs supporting manufactured homes that have characteristics similar to that of site-built housing. While it is possible that these programs will expand demand from populations who would not have considered manufactured housing in the past, the manufactured housing industry has been slow to respond to these programs and FHFA has not yet seen evidence of demand for these higher-end units from low- and moderate-income households.
Both Enterprises also laid the groundwork to increase liquidity for manufactured housing titled
26 https://www.fhfa.gov/PolicyProgramsResearch/Programs/Pages/Duty-to-Serve.aspx

20
A n n u a l H o u s i n g R e p o r t
as personal property, or chattel loans. Each Enterprise conducted research and outreach to inform a potential pilot, including by studying credit, servicing, data, consumer protection, and other standards that the Enterprise could apply if it purchased these loans in the future.
The Enterprises’ manufactured housing loan purchase activities are constrained in part by state laws governing the titling of manufactured housing, which are beyond the Enterprises’ control. Efforts in recent years to expand the share of the manufactured housing market that is titled as real estate, rather than as personal property, have been largely unsuccessful.
Both Enterprises also took actions to increase liquidity for manufactured housing communities that provide for tenant pad lease protections, or that are owned by their residents or nonprofit organizations. Fannie Mae launched a loan purchase program that provides pricing incentives for manufactured housing communities that incorporate the tenant pad lease protections specified in the Duty to Serve regulation. Each Enterprise also introduced a loan purchase pilot or program specifically tailored to the financing needs of resident-owned communities.
In the affordable housing preservation market, both Enterprises supported the preservation and renovation of distressed public housing units by purchasing loans on properties participating in the U.S. Department of Housing and Urban Development’s (HUD’s) Rental Assistance Demonstration. Freddie Mac also increased its support for financing for small multifamily buildings (generally those with 50 or fewer units), which are a critical source of unsubsidized or naturally occurring affordable housing, but face unique financing challenges, including a lack of liquidity in the secondary market. Freddie Mac introduced two programs that provide liquidity for small multifamily loans made by small financial institutions. Freddie Mac also introduced a program that streamlines origination requirements for small multifamily preservation transactions (less than $10 million).
The Enterprises’ actions were constrained by the legal and financial complexities inherent in preserving subsidized multifamily housing. For example, each Enterprise pursued a subordination agreement with the U.S. Department of Agriculture (USDA) that each Enterprise finds necessary for it to provide financing for the recapitalization and preservation of properties subsidized by USDA’s Section 515 program for affordable rural multifamily housing.27
27 Under the Section 515 Program, USDA provides low-interest loans to developers of affordable housing. These properties typically receive additional rental assistance from USDA. In the future, many Section 515 properties will require additional funds for rehabilitation, but to be financially feasible this additional financing must be structured in a way that allows these properties to continue receiving USDA rental assistance.

21
A n n u a l H o u s i n g R e p o r t
However, neither Enterprise has been able to reach agreement with USDA on a subordination structure. Fannie Mae is continuing to work with USDA on a Section 515 preservation loan product. Fannie Mae will also attempt a new strategy of providing capacity building and technical assistance to owners of properties subsidized by Section 515.
The Enterprises also supported loans that preserve the affordability of housing for homebuyers. Their activities included support for long-term affordable and sustainable homeownership through shared equity programs. Prior to 2018, Freddie Mac’s policies did not address many of the shared equity structures in today’s market. In 2018, Freddie Mac studied challenges in the shared equity market and began to design solutions, including by creating a program that supports lending in Community Land Trusts. Fannie Mae built on its established shared equity programs by adding support for limited equity cooperatives. While both Enterprises made meaningful progress in 2018 towards supporting the shared equity market, Fannie Mae did not achieve its loan purchase target and Freddie Mac fell short on its planned lender outreach.
Fannie Mae also increased its support for loans that fund the purchase or rehabilitation of distressed properties.28 Fannie Mae provided liquidity for this segment by acquiring loans made to borrowers who purchased a distressed property. Fannie Mae also enhanced its renovation loan product, aligning it more closely with the market standards established by FHA’s rehabilitation loan program, and created a pilot program that allows nonprofits to utilize renovation loans. These actions promote the renovation of distressed housing, neighborhood revitalization and stabilization, and the capability of owner-occupants to compete with investors to purchase distressed properties.
Neither Enterprises’ efforts to support residential economic diversity were significantly impactful. Fannie Mae’s 2018 loan product changes were not closely targeted toward promoting affordable housing in high opportunity areas or of mixed-income housing in areas of concentrated poverty. The quality of Freddie Mac’s published research on residential economic diversity varied dramatically. While Freddie Mac’s paper on state Qualified Allocation Plan definitions of high opportunity areas required detailed research and expanded the field’s knowledge, its paper on promoting affordable housing in high opportunity areas did little to
28 The Duty to Serve regulation provides for credit in the Affordable Housing Preservation market for Enterprise activities connected to the purchase or rehabilitation of homes eligible for a short sale, homes eligible for a foreclosure sale, or a property that a lender acquires as the result of foreclosure (sometimes referred to as ‘‘Real Estate Owned’’ or ‘‘REO’’). (12 CFR 1282.34(d)(7)).

22
A n n u a l H o u s i n g R e p o r t
advance the field’s knowledge about this underserved market need.29
Notable accomplishments in the rural housing market included both Enterprises’ commitment of Low-Income Housing Tax Credit (LIHTC) equity investments. FHFA approved the Enterprises’ limited re-entry into the LIHTC equity market at the end of 2017, with each Enterprise’s activity in this market limited to $500 million in investments per year.
Overall, Fannie Mae committed $118 million in LIHTC equity to rural areas in 2018, supporting 42 properties, 13 of which were in high-needs rural regions such as Middle Appalachia or the Lower Mississippi Delta, as shown in Table 10 below. Fannie Mae also made four LIHTC equity investments supporting housing for Native Americans on tribal land. Freddie Mac committed $73 million in LIHTC equity to rural areas, supporting 17 properties, five of which are in high-needs rural regions. Freddie Mac did not make any investments in 2018 that supported high-needs rural populations.30 Freddie Mac relied solely on proprietary funds to make its LIHTC equity investments, while Fannie Mae relied on both proprietary and multi-investor funds to make its investments.
Table 10: Enterprise 2018 LIHTC Equity Investments in Rural Areas
Fannie Mae Freddie Mac All Rural Areas $118.0 million
42 properties $72.8 million 17 properties
High-Needs Rural Regions $29.7 million 13 properties
$35.0 million 5 properties
High-Needs Rural Populations $27.2 million 4 properties
$0 million
Each Enterprise’s investments supporting high-needs rural regions and high-needs are subsets of its investments in all rural areas. The Duty to Serve regulation defines high-needs rural regions as the following regions, provided they are in a rural area: Lower Mississippi Delta, Middle Appalachia, a colonia, or a county with persistent poverty. The regulation defines high-needs rural populations as the following populations provided they are located in a rural area: members of a Federally recognized Indian tribe located in an Indian area, or agricultural workers. See 12 CFR 1282.1.
Both Enterprises also laid the groundwork to provide greater liquidity for single-family
29 Freddie Mac Multifamily and National Housing Trust, “Opportunity Incentives in LIHTC Qualified Allocation Plans,” (2018), https://mf.freddiemac.com/docs/Opportunity_Incentives_in_LIHTC_Qualified_Allocation_Plans.pdf; Freddie Mac Multifamily, “Affordable Housing in High Opportunity Areas,” (2018), https://mf.freddiemac.com/docs/Affordable_Housing_in_High_Opportunity_Areas.pdf 30 High-needs rural populations and high-needs rural regions are defined in Table 10 (“Enterprise 2018 LIHTC Equity Investments in Rural Areas”).

23
A n n u a l H o u s i n g R e p o r t
mortgages in high-needs rural regions and to high-needs rural populations. Both Enterprises exceeded the 2018 targets in their Plans for loan purchases in high-needs rural regions. Fannie Mae announced it will allow appraisal waivers for low- and moderate-income borrowers in high-needs rural regions if the borrower receives a home inspection, which will eliminate a common barrier to lending in these regions while protecting borrowers against unanticipated post-purchase repairs. Freddie Mac conducted research and outreach to inform development of sweat equity and renovation loan products for use in high-needs rural regions.
Fannie Mae committed significant resources to establishing its Initiative for Native American Homeownership, which will address challenges involved in providing conventional mortgage financing on tribal lands. However, the legal complexities of land ownership on Native American lands remain as a major barrier to expanding mortgage lending in these areas.
Despite the progress made by each Enterprise in addressing the needs of the rural housing market, FHFA sees opportunity for each Enterprise to improve in 2019 and beyond. Fannie Mae made minimal progress in 2018 towards its goal of purchasing bulk loans in rural areas from small financial institutions. Fannie Mae’s actions to promote liquidity for small multifamily loans made by small financial institutions were also insufficiently targeted towards these institutions, and will instead primarily benefit larger institutions. Likewise, Freddie Mac’s actions connected to single-family rentals in rural areas were not sufficiently focused on smaller rural owners, operators, or lenders, and were instead primarily targeted at segments of the single-family rental market that already have sufficient liquidity.31
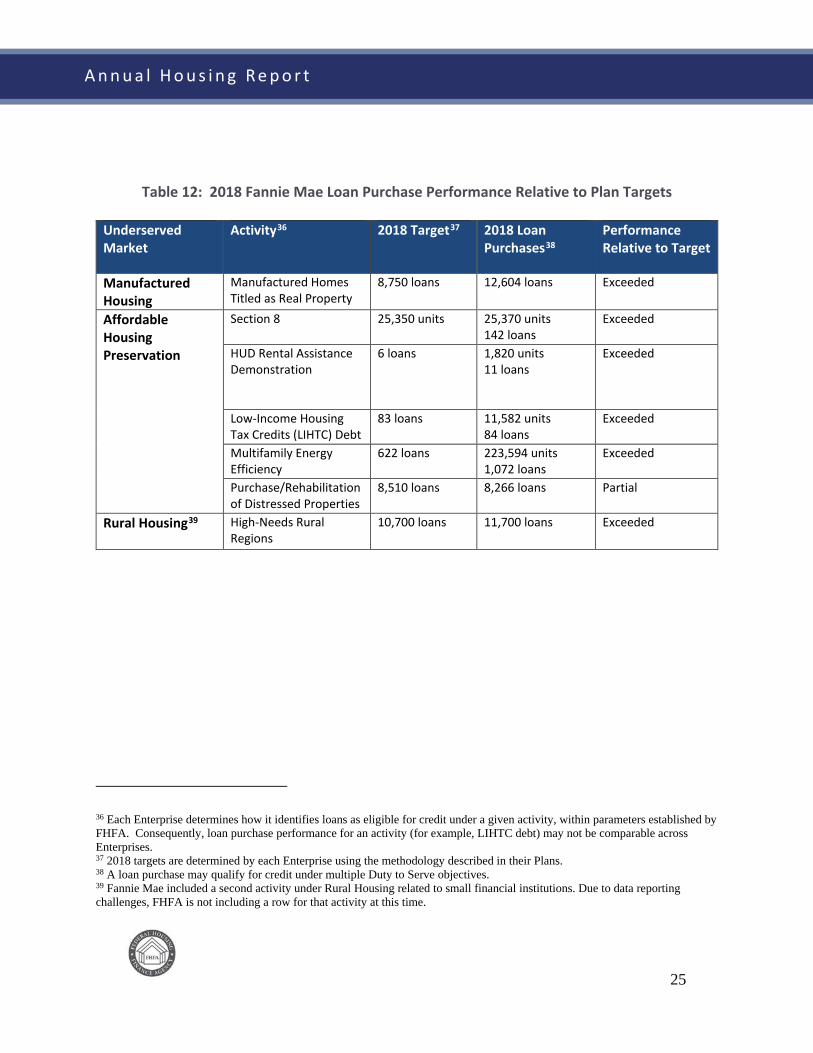
Tables 11 and 12 below provide additional details on loan purchase performance for both Enterprises relative to the targets established in their Underserved Markets Plans.
In 2020, each Enterprise will, after an opportunity for public comment, submit to FHFA for non-objection its second Underserved Markets Plan covering 2021-2023.
31 In August 2018, FHFA directed both Enterprises to terminate their participation in the single-family rental market except through their previously existing investor programs.

24
A n n u a l H o u s i n g R e p o r t
Table 11: 2018 Freddie Mac Loan Purchase Performance Relative to Plan Targets
Underserved Market
Activity32 2018 Target33 2018 Loan Purchases34
Performance Relative to Target
Manufactured Housing
Manufactured Homes Titled as Real Property
3,075 loans 3,601 loans Exceeded
Affordable Housing Preservation
Section 8 16,750 units or 110 properties
27,241 units 341 properties
Exceeded
HUD Rental Assistance Demonstration
750 units or 10 properties
1,161 units 11 properties
Exceeded
Low-Income Housing Tax Credits (LIHTC) Debt
20,500 units or 150 properties
41,926 units 306 properties
Exceeded
Financing of Small Multifamily Rental Properties
Either 1 transaction or $100 million
1 transaction $418 million
Exceeded
Support for Residential Economic Diversity: Additional Activity
2,600 units or 25 properties
3,647 units 39 properties
Exceeded
Rural Housing35 High-Needs Rural Regions
7,900 loans 8,754 loans Exceeded
32 Each Enterprise determines how it identifies loans as eligible for credit under a given activity, within parameters established by FHFA. Consequently, loan purchase performance for an activity (for example, LIHTC debt) may not be comparable across Enterprises. 33 2018 targets are determined by each Enterprise using the methodology described in its Plan. 34 A loan purchase may qualify for credit under multiple Duty to Serve objectives. 35 Freddie Mac included a second activity under Rural Housing related to small financial institutions. Due to data reporting challenges, FHFA is not including a row for that activity at this time.
25
A n n u a l H o u s i n g R e p o r t
Table 12: 2018 Fannie Mae Loan Purchase Performance Relative to Plan Targets
Underserved Market
Activity36 2018 Target37 2018 Loan Purchases38
Performance Relative to Target
Manufactured Housing
Manufactured Homes Titled as Real Property
8,750 loans 12,604 loans Exceeded
Affordable Housing Preservation
Section 8 25,350 units 25,370 units 142 loans
Exceeded
HUD Rental Assistance Demonstration
6 loans 1,820 units 11 loans
Exceeded
Low-Income Housing Tax Credits (LIHTC) Debt
83 loans 11,582 units 84 loans
Exceeded
Multifamily Energy Efficiency
622 loans 223,594 units 1,072 loans
Exceeded
Purchase/Rehabilitation of Distressed Properties
8,510 loans 8,266 loans Partial
Rural Housing39 High-Needs Rural Regions
10,700 loans 11,700 loans Exceeded
36 Each Enterprise determines how it identifies loans as eligible for credit under a given activity, within parameters established by FHFA. Consequently, loan purchase performance for an activity (for example, LIHTC debt) may not be comparable across Enterprises. 37 2018 targets are determined by each Enterprise using the methodology described in their Plans. 38 A loan purchase may qualify for credit under multiple Duty to Serve objectives. 39 Fannie Mae included a second activity under Rural Housing related to small financial institutions. Due to data reporting challenges, FHFA is not including a row for that activity at this time.

26
A n n u a l H o u s i n g R e p o r t
Affordable Housing Allocations
As stated in FHFA’s June 2019 Annual Report to Congress, the Safety and Soundness Act requires each Enterprise to set aside in each fiscal year an amount equal to 4.2 basis points (0.042 percent) for each dollar of the unpaid principal balance of its total new business purchases. The Enterprises must allocate or otherwise transfer 65 percent of the amount set aside to HUD to fund the Housing Trust Fund (HTF) and 35 percent to the Treasury Department to fund the Capital Magnet Fund (CMF). FHFA is not involved in the administration of either the HTF or the CMF.
The HTF is designed to assist states in meeting the housing needs of the lowest income families. It provides funds to preserve, rehabilitate, and construct housing for extremely low- and very low-income families. HUD allocates funds to states by formula, and states allocate funds to projects. Each state must use at least 80 percent of its funds for rental housing, while up to 10 percent may go to homeownership activities for first-time homebuyers.
The CMF is a special account within the Community Development Financial Institutions (CDFI) Fund designed to increase investment in affordable housing, economic development, and community service facilities in low-income or underserved rural areas. The CMF awards funds competitively to community development financial institutions and qualified nonprofits and aims to attract private capital to economically distressed communities, including underserved rural areas. Funded projects include affordable housing activities, as well as related economic development activities and community service facilities.
For purposes of the HTF and CMF set asides and allocations, Fannie Mae’s total new business purchases in 2018 amounted to $512 billion. As a result, total affordable housing allocation payments of $215 million were made in April 2019. Freddie Mac’s total new business purchases in 2018 amounted to $385.2 billion. As a result, total affordable housing allocation payments of $161.7 million were made in April 2019.

27
A n n u a l H o u s i n g R e p o r t
Monthly Survey of Mortgage Markets (National Mortgage Database)
The Safety and Soundness Act requires FHFA to conduct a monthly survey of mortgage markets to collect information on the characteristics of individual mortgages, both those eligible for and those ineligible for Enterprise purchase.40 The statute requires FHFA to collect the following information for each loan: (1) the price of the house securing the mortgage; (2) the loan-to-value ratio of the mortgage (including secondary financing); (3) the terms of the mortgage; (4) the creditworthiness of the borrower or borrowers; and (5) whether the mortgage (if eligible) was purchased by an Enterprise. The statute also requires FHFA to collect information on the loan and borrower characteristics of subprime mortgages and nontraditional mortgages eligible for purchase by the Enterprises, including the creditworthiness of borrowers and other information needed to determine whether these borrowers could have qualified for prime loans.
At the time Congress enacted HERA, there was no single data source containing all of the items required to comply with the Safety and Soundness Act. As a result, FHFA initiated the development of the National Mortgage Database (NMDB®) program to comply with these requirements. In November 2012, FHFA announced a partnership with the CFPB to develop the NMDB.
The core NMDB provides comprehensive information about the U.S. mortgage market based upon a 5 percent nationally representative sample of single-family, first lien mortgages outstanding as of 1998, as represented in the files of a national credit bureau. The NMDB program also includes data from a nationally representative quarterly survey of new borrowers drawn from a subset of new mortgages added to the core NMDB, the National Survey of Mortgage Originations (NSMO). Finally, the NMDB program includes data drawn from a second survey of a representative sample of borrowers in mortgage distress conducted annually, the American Survey of Mortgage Borrowers (ASMB).
FHFA continues to establish strong information security systems and protocols and continues to review and evaluate every aspect of these systems and protocols to ensure that the statutory objectives of the NMDB are achieved.
40 See 12 U.S.C. § 4544(c).

28
A n n u a l H o u s i n g R e p o r t
FHFA published or updated the following based on the NMDB since issuing the last Annual Housing Report:
• National Survey of Mortgage Originations Public Use File released on November 8, 2018, after a privacy review by the Census Bureau and updated on February 12, 2019, which provides data from the NSMO survey and additional administrative data for sample mortgages originated from 2013 to 2016.
• National Survey of Mortgage Originations Technical Documentation, NMDB Technical Report 2, updated on November 8, 2018, and February 12, 2019, which provides background information on how NSMO was developed and the codebook and tabulations for the NSMO Public Use File.
• National Statistics for New Residential Mortgages in the United States published on December 12, 2018, and updated on August 27, 2019, which provides the first set of national statistics derived from the NMDB as a step towards implementing the monthly mortgage market survey public data disclosure required by HERA.
• National Delinquency Rates in the United States published on December 20, 2018, and updated on February 26, 2019, June 3, 2019, and August 27, 2019, which provides the national delinquency rates for the United States based on the NMDB.

29
A n n u a l H o u s i n g R e p o r t
Subprime and Nontraditional Loans
The Safety and Soundness Act requires FHFA to “identify the extent to which each [E]nterprise is involved in mortgage purchases and secondary market activities involving subprime and nontraditional loans”41 and to “compare the characteristics of subprime and nontraditional loans both purchased and securitized by each [E]nterprise to other loans purchased and securitized by each [E]nterprise.”42 The Safety and Soundness Act does not define the words “subprime” or “nontraditional,” and there is no universally accepted definition for what is considered a subprime or nontraditional loan. In the absence of such definitions, FHFA has provided information on a number of the characteristics that are sometimes used to identify subprime and nontraditional loans. On May 6, 2013, FHFA directed Fannie Mae and Freddie Mac not to purchase interest-only loans, negative amortization loans, loans with terms longer than 30 years, or loans with points and fees exceeding the thresholds established by the Qualified Mortgage rule. This directive became effective on January 10, 2014.43
Appendix B of this Report provides a breakdown of the characteristics of mortgage products purchased by the Enterprises in 2017 and 2018, including information on mortgage product types, loan-to-value ratios, credit scores, and whether loans are fully amortizing.
41 See 12 U.S.C. § 4544(b)(4). 42 See 12 U.S.C. § 4544(b)(5). 43 See http://www.fhfa.gov/Media/PublicAffairs/Pages/FHFA-Limiting-Fannie-Mae-and-Freddie-MacLoan-Purchases-to-Qualified-Mortgages.aspx.

30
A n n u a l H o u s i n g R e p o r t
Higher-Priced Mortgage Loans
The Safety and Soundness Act requires FHFA to “compare the characteristics of high-cost loans purchased and securitized [by each Enterprise], where such securities are not held on portfolio to loans purchased and securitized, where such securities are either retained on portfolio or repurchased by the [E]nterprise, including such characteristics as (A) the purchase price of the property that secures the mortgage; (B) the loan-to-value ratio of the mortgage, which shall reflect any secondary liens on the relevant property; (C) the terms of the mortgage; (D) the creditworthiness of the borrower; and (E) any other relevant data, as determined by the Director.”44 The Safety and Soundness Act also requires that FHFA release the high-cost loan characteristics data to the public.45 However, the Safety and Soundness Act does not define the term “high-cost loan,” nor does any legislative history state the intent of this provision. After considering various options, FHFA decided to define “high-cost loan” in this context as a loan with a HMDA-reportable “rate spread” that is 150 basis points or more above the Average Prime Offer Rate (APOR).46 In other contexts, FHFA refers to loans exceeding this rate-spread threshold as “higher-priced mortgage loans.”47 To ensure consistency, the Report uses the “higher-priced” terminology when referring to “high-cost loans.” In 2018, 3.8 percent of all single-family loans purchased by the Enterprises were higher-priced mortgage loans.
For Enterprise mortgage purchases in 2018, the tables in Appendix C show the number of higher-priced mortgage loans in securities compared to the number of higher-priced mortgage loans retained in portfolio at year-end by each Enterprise.48 The tables identify this information according to the following loan characteristics: purchase price, loan-to-value ratio, product type,
44 See 12 U.S.C. § 4544(b)(6). 45 See 12 U.S.C. § 4546(d)(2). 46 See 76 Fed. Reg. 60031 (Sept. 28, 2011) (defining “high-cost loan” for purposes of 12 U.S.C. §§ 4544(b)(6) and 4546(d)(2)). 47 CFPB has defined “higher-priced mortgage loan” in the same way for most mortgages, although the CFPB definition sets higher rate spread cut-offs for jumbo mortgages (250 basis points or more above the APOR) and for subordinate lien mortgages (350 basis points or more above the APOR). See 12 CFR § 1026.35(a). In amending the Truth in Lending Act, the Home Ownership and Equity Protection Act (HOEPA), 15 U.S.C. § 1602(bb), established a separate category of loans designated as “high-cost mortgages.” Mortgages on primary residences that exceed the applicable mortgage interest rate and total point and fee thresholds established under HOEPA are not eligible for sale to the Enterprises. 48 Loans identified as “retained in the portfolio” are generally loans that the Enterprises hold as assets in their mortgage portfolios. Examples of these loans would be loans that are not eligible for securitization, defaulted loans purchased out of mortgage-backed securities, and loans that the Enterprises purchase directly either to hold in portfolio and/or to aggregate for securitization at a future date. Loans identified as “not held in the portfolio” are generally loans that the Enterprises have pooled into mortgage-backed securities and sold to investors.

31
A n n u a l H o u s i n g R e p o r t
term at origination, interest rate at origination, credit score, borrower income ratio, tract income ratio, census tract demographics, purpose of the loan, and federal guarantee status.49
49 These loan characteristics are further described in FHFA’s September 28, 2011, Notice of Order. See 76 Fed. Reg. 60031.

32
A n n u a l H o u s i n g R e p o r t
Public Access to Mortgage Information
The Safety and Soundness Act requires FHFA to make available to the public loan-level data submitted by the Enterprises on the loans they purchase, except for certain proprietary information and borrower privacy information.50 The Safety and Soundness Act also requires FHFA to make available to the public loan data elements reported under HMDA at the census tract level for loans purchased by the Enterprises. In addition, the Safety and Soundness Act requires FHFA to make available to the public certain high-cost securitized loan data collected by the Enterprises to compare the characteristics of high-cost loans the Enterprises purchase and securitize.51 The Safety and Soundness Act requires FHFA to release the above-referenced data by September 30 of the year following the year the Enterprises acquired the mortgages. On September 23, 2019, FHFA posted on its website an interim release of data for 2018 through its Public Use Database (PUDB), pending an update based on receipt of additional data fields that reflect new 2018 reporting requirements under HMDA.52
50 See 12 U.S.C. §§ 4543, 4546. 51 See 12 U.S.C. §§ 4544(b)(6), 4546(d). See also Appendix C for the analysis of the higher-priced securitized loan data for 2015. 52 See http://www.fhfa.gov/DataTools/Downloads/Pages/Public-Use-Databases.aspx.

33
A n n u a l H o u s i n g R e p o r t
Appendix A: Preliminary Determination Letters: Enterprise 2018 Housing Goals Performance
The file also contains approximately 100 supplementary data elements about the sample mortgages and borrowers, such as: - Loan-to-value ratio at origination, - Debt-to income ratio at origination, - Quarterly VantageScore 3.0 credit scores of borrowers, and - Qua

34
A n n u a l H o u s i n g R e p o r t
September 30, 2019 Mr. Hugh R. Frater President and Chief Executive Officer Federal National Mortgage Association 1100 15th St., NW Washington, D.C. 20005 Re: Preliminary Determination of Fannie Mae’s 2018 Housing Goals Performance Dear Mr. Frater: The Federal Housing Finance Agency (FHFA) has reviewed Fannie Mae’s performance under the Enterprise housing goals for 2018 and is providing this notice of FHFA’s preliminary determination under 12 USC 4566. Fannie Mae must meet a number of single-family housing goals under 12 CFR 1282.12. FHFA evaluated Fannie Mae’s performance on the single-family housing goals for 2018 based on the following numbers:
Single-Family Housing Goals Goal Target – 2018 Market level – 2018 FHFA Preliminary
Determination of Fannie Mae’s 2018 Performance
Low-Income Home Purchase Goal 24% 25.5% 28.2%
Very Low-Income Home Purchase Goal 6% 6.5% 6.7%
Low-Income Areas Home Purchase Goal 18% 22.6% 25.1%
Low-Income Areas Home Purchase Subgoal 14% 18.0% 20.1%
Low-Income Refinance Goal 21% 30.7% 31.2%

35
A n n u a l H o u s i n g R e p o r t
For each housing goal, the percentage shown above reflects the proportion of mortgages that met the criteria for that goal. The home purchase goals are based on Fannie Mae’s acquisitions of purchase money mortgages, while the refinance goal is based on Fannie Mae’s acquisitions of refinance mortgages.
Based on the above information, FHFA has preliminarily determined that Fannie Mae achieved each of the single-family goals for 2018.
Fannie Mae must also meet a number of multifamily housing goals under 12 CFR 1282.13. FHFA evaluated Fannie Mae’s performance on the multifamily housing goals for 2018 based on the following numbers:
Multifamily Housing Goals Goal Target – 2018 FHFA Preliminary
Determination of Fannie Mae’s 2018 Performance
Low-Income Multifamily Goal
315,000 421,813
Very Low-Income Multifamily Subgoal
60,000 80,891
Small Multifamily (5-50 unit) Low-Income Subgoal
10,000 11,890
Based on this information, FHFA has preliminarily determined that Fannie Mae achieved each of the multifamily housing goals for 2018.
Under the Safety and Soundness Act, Fannie Mae has 30 days to submit any documentation it wishes FHFA to consider in making a final determination about Fannie Mae’s compliance with the housing goals for 2018.
If you have any questions, please contact Ted Wartell, Manager, Office of Housing and Community Investment, Division of Housing Mission and Goals, at [email protected] or 202-649-3157.
Sincerely,
Mark A. Calabria

36
A n n u a l H o u s i n g R e p o r t
September 30, 2019 Mr. David Brickman Chief Executive Officer Federal Home Loan Mortgage Corporation 8200 Jones Branch Drive McLean, VA 22103-3107 Re: Preliminary Determination of Freddie Mac’s 2018 Housing Goals Performance Dear Mr. Brickman: The Federal Housing Finance Agency (FHFA) has reviewed Freddie Mac’s performance under the Enterprise housing goals for 2018 and is providing this notice of FHFA’s preliminary determination under 12 USC 4566. Freddie Mac must meet a number of single-family housing goals under 12 CFR 1282.12. FHFA evaluated Freddie Mac’s performance on the single-family housing goals for 2018 based on the following numbers:
Single-Family Housing Goals Goal Target – 2018 Market level – 2018
FHFA Preliminary Determination of Freddie Mac’s 2018 Performance
Low-Income Home Purchase Goal 24% 25.5% 25.8%
Very Low-Income Home Purchase Goal 6% 6.5% 6.3%
Low-Income Areas Home Purchase Goal 18% 22.6% 22.6%
Low-Income Areas Home Purchase Subgoal 14% 18.0% 17.3%
Low-Income Refinance Goal 21% 30.7% 27.3%

37
A n n u a l H o u s i n g R e p o r t
For each housing goal, the percentage shown above reflects the proportion of mortgages that met the criteria for that goal. The home purchase goals are based on Freddie Mac’s acquisitions of purchase money mortgages, while the refinance goal is based on Freddie Mac’s acquisitions of refinance mortgages. Based on the above information, FHFA has preliminarily determined that Freddie Mac achieved each of the single-family goals for 2018. Freddie Mac must also meet a number of multifamily housing goals under 12 CFR 1282.13. FHFA evaluated Freddie Mac’s performance on the multifamily housing goals for 2018 based on the following numbers:
Multifamily Housing Goals Goal Target – 2018 FHFA Preliminary Determination of Freddie Mac’s 2018 Performance
Low-Income Multifamily Goal 315,000 474,062
Very Low-Income Multifamily Subgoal 60,000 105,612
Small Multifamily (5-50 unit) Low-Income Subgoal 10,000 39,353
Based on this information, FHFA has preliminarily determined that Freddie Mac achieved each of the multifamily housing goals for 2018. Under the Safety and Soundness Act, Freddie Mac has 30 days to submit any documentation it wishes FHFA to consider in making a final determination about Freddie Mac’s compliance with the housing goals for 2018. If you have any questions, please contact Ted Wartell, Manager, Office of Housing & Community Investment, Division of Housing Mission & Goals, at [email protected] or 202-649-3157. Sincerely,
Mark A. Calabria
status of the mortgages.

38
A n n u a l H o u s i n g R e p o r t
Appendix B: Subprime and Nontraditional Loans
I. Overview of Single-Family Mortgages Acquired by the Enterprises
Excluding second liens and reverse mortgages, Fannie Mae and Freddie Mac acquired $756.0 billion of single-family loans in 2018 (see Table B1 below), a decrease of 11.64 percent from the $855.5 billion in single-family loans the Enterprises acquired in 2017. These totals include loans that collateralize mortgage-backed securities guaranteed by either Enterprise and loans purchased for cash. While Tables 1 through 9 above report on only owner-occupied single-family purchases, this Appendix reports on both owner-occupied and investor-owned single-family purchases.
Fully amortizing mortgages comprised 100 percent of the single-family loans acquired by the Enterprises in 2018, per conservatorship guidance. Fully amortizing fixed-rate mortgages accounted for 98.47 percent of combined acquisitions, an increase from 97.27 percent in 2017 (see Table B1 below). Fully amortizing hybrid adjustable-rate mortgages accounted for 1.49 percent of 2018 acquisitions, a decrease from 2.6 percent in 2017. The Enterprises did not acquire any interest-only mortgages in 2018, as was the case in 2017.

39
A n n u a l H o u s i n g R e p o r t
Table B1. Single-Family Mortgages Acquired by Fannie Mae and Freddie Mac in 2017 and 2018 by Product Type ($ in millions)1,2
2017 2018
Product Type
Fully Amortizing ($)
Fully Amortizing (%)
Fully Amortizing ($)
Fully Amortizing (%)
Fixed-Rate Mortgages $832,147.8 97.27% $744,389.4 98.47%
ARMS–Traditional $844.9 0.10% $42.3 0.01%
ARMS-Hybrid $22,254.3 2.60% $11,238.8 1.49%
Balloon Mortgages $0.0 0.00% $0.0 0.00%
Other Mortgages3 $247.8 0.03% $281.2 0.04%
Total $855,494.8 100.00% $755,951.7 100.00% 1 Includes mortgages purchased for cash and financed with guaranteed mortgage-backed securities. Excludes second liens and reverse mortgages. 2 Percentages may be zero due to rounding. 3 Other and unidentified product types. Includes Fixed-Rate Other and Other ARM. “Fixed-Rate Other” is fixed-rate mortgages with a term other than 40, 30, 20, or 15 years. “Other ARM” is ARMs with a structure other than 3/1, 5/1, 7/1, or 10/1.
Source: Federal Housing Finance Agency based on information from Fannie Mae and Freddie Mac.

40
A n n u a l H o u s i n g R e p o r t
The distribution of the loan-to-value ratios of single-family mortgages acquired by Fannie Mae and Freddie Mac in 2018 showed some changes from 2017 (see Table B2 below). The combined share of loans with loan-to-value ratios above 95 percent increased from 4.16 percent in 2017 to 6.32 percent in 2018. Mortgages with loan-to-value ratios of 80 percent or below decreased from 69.73 percent of loans acquired in 2017 to 64.65 percent of loans acquired in 2018.
Table B2. Single-Family Mortgages Acquired by Fannie Mae and Freddie Mac in 2017 and 2018 by Loan-to-Value Ratio Group ($ in millions)1
2017 2018
Loan-to-Value Ratio Group
Fully Amortizing
($)
Fully Amortizing
(%)
Fully Amortizing
($)
Fully Amortizing
(%)
0-70 % $257,661.5 30.12% $200,434.6 26.51%
70.1-80 % $338,868.1 39.61% $288,333.1 38.14%
80.1-90 % $105,317.4 12.31% $99,485.8 13.16%
90.1-95 % $118,065.5 13.80% $119,947.7 15.87%
95.1-100 % $33,592.0 3.93% $47,252.2 6.25%
>100% $1,986.3 0.23% $516.3 0.07%
Total $855,490.8 100.00% $755,969.7 100.00%
1 Includes mortgages purchased for cash and financed with guaranteed mortgage-backed securities. Excludes second liens and reverse mortgages. Source: Federal Housing Finance Agency based on information from Fannie Mae and Freddie Mac
II. Acquisitions of Nontraditional Mortgages
The Enterprises did not acquire any interest-only fixed-rate mortgages in 2018 or 2017. The Enterprises did not acquire any interest-only hybrid adjustable-rate mortgages in 2018 or 2017. Nor did the Enterprises acquire any negative amortization mortgages in 2018 or 2017.

41
A n n u a l H o u s i n g R e p o r t
III. Acquisitions of Mortgages with Lower Credit Scores
There was some change in the distribution of the borrower credit (FICO) scores of single-family mortgages acquired by Fannie Mae and Freddie Mac in 2018 (see Table B3 below). The share of loans with credit scores below 620 decreased from 0.57 percent in 2017 to 0.30 percent in 2018. Loans with credit scores between 620 and 659 increased from 4.79 percent of loans acquired in 2017 to 4.97 percent of loans acquired in 2018.
Table B3: Single-Family Mortgages Acquired by Fannie Mae and Freddie Mac in 2017 and 2018 by FICO Score Group ($ in millions)1
2017 2018
FICO Score Group
Fully Amortizing ($)
Fully Amortizing (%)
Fully Amortizing ($)
Fully Amortizing (%)
0-619 $4,889.9 0.57% $2,272.7 0.30%
620-659 $40,949.8 4.79% $37,514.6 4.97%
660-719 $204,849.6 23.96% $181,721.2 24.05%
720-749 $160,011.7 18.72% $145,757.4 19.29%
750+ $444,091.1 51.95% $388,245.0 51.39%
Total $854,792.1 100.00% $755,510.9 100.00%
1 Includes mortgages purchased for cash and financed with guaranteed mortgage-backed securities. Excludes second liens and reverse mortgages. Totals in this table do not equal the totals in Table B1 because some loans acquired by the Enterprises do not have FICO Score Group information.
Source: Federal Housing Finance Agency based on information from Fannie Mae and Freddie Mac

42
A n n u a l H o u s i n g R e p o r t
Appendix C: Higher-Priced Mortgage Loans
As discussed in the Higher-Priced Mortgage Loans section of this Report, because the Safety and Soundness Act does not define the term “high-cost loan,” FHFA determined that it would define “high-cost loan” by whether its HMDA-reportable rate spread is 150 basis points or more above the APOR. In other contexts, FHFA refers to such loans as “higher-priced mortgage loans.”
In 2018, 3.8 percent of all single-family loans purchased by the Enterprises were higher-priced mortgage loans. The tables below show the number of higher-priced mortgage loans purchased and securitized by an Enterprise in 2018 that were not held by each Enterprise at year-end compared to the number of higher-priced mortgage loans purchased and securitized by an Enterprise in 2018 that were retained on portfolio at year-end by each Enterprise for 2018.
The Safety and Soundness Act requires FHFA to compare the characteristics of high-cost loans purchased and securitized by each Enterprise “where such securities are not held on portfolio to loans purchased and securitized, where such securities are either retained on portfolio or repurchased by the [E]nterprise.” The comparisons should include “such characteristics as— (A) the purchase price of the property that secures the mortgage; (B) the loan-to-value ratio of the mortgage, which shall reflect any secondary liens on the relevant property; (C) the terms of the mortgage; (D) the creditworthiness of the borrower; and (E) any other relevant data, as determined by the Director.”49 Terms of a mortgage include product type, whether a fixed-rate mortgage (FRM) or an adjustable-rate mortgage (ARM), term (or length) of the mortgage at origination, amortization term, and interest rate at origination. Other relevant data included for comparative analysis are borrower income ratio, census tract income ratio, 2010 census tract/percent minority, purpose of loan, and whether the loan has a federal guarantee.
49 See 12 U.S.C. § 4544(b)(6).

43
A n n u a l H o u s i n g R e p o r t
I. Purchase Price
Table C1 below shows the comparison based on purchase price for the higher-priced mortgage loans that were purchased and securitized by an Enterprise in 2018.
Table C1: Purchase Price (2018)
Purchase Price
Fannie Mae Freddie Mac
In Portfolio at Year-End?
Totals
In Portfolio at Year-End?
Totals Not Held Retained Not Held Retained
Loans Percent Loans Percent Loans Percent Loans Percent Loans Percent Loans Percent <= $417,000 70,209 92.0 5,925 78.7 76,134 90.8 17,174 91.9 8,401 96.6 25,575 93.4 > $417,000, <= $625,500 4,736 6.2 1,200 15.9 5,936 7.1 1,271 6.8 234 2.7 1,505 5.5 > $625,500, <= $729,750 630 0.8 197 2.6 827 1.0 107 0.6 28 0.3 135 0.5 > $729,750 735 1.0 204 2.7 939 1.1 130 0.7 37 0.4 167 0.6 Totals 76,310 100.0 7,526 100.0 83,836 100.0 18,682 100.0 8,700 100.0 27,382 100.0
II. Combined Loan-to-Value Ratio Table C2 below shows the comparison based on the combined loan-to-value ratio of the mortgages, including secondary liens, for the higher-priced mortgage loans that were purchased and securitized by an Enterprise in 2018.
Table C2: Combined LTV (or LTV if missing) (2018)
Combined LTV (or LTV if missing)
Fannie Mae Freddie Mac In Portfolio at Year-End?
Totals In Portfolio at Year-End?
Totals Not Held Retained Not Held Retained Loans Percent Loans Percent Loans Percent Loans Percent Loans Percent Loans Percent
0% < LTV <= 60% 5,592 7.3 529 7.0 6,121 7.3 1,870 10.0 702 8.1 2,572 9.4 60% < LTV <= 80% 21,294 27.9 2,686 35.7 23,980 28.6 6,024 32.2 3,496 40.2 9,520 34.8 80% < LTV <= 90% 7,312 9.6 1,249 16.6 8,561 10.2 986 5.3 656 7.5 1,642 6.0 90% < LTV <= 95% 16,863 22.1 1,904 25.3 18,767 22.4 5,951 31.9 2,788 32.0 8,739 31.9 LTV > 95% 25,249 33.1 1,158 15.4 26,407 31.5 3,840 20.6 1,054 12.1 4,894 17.9 Missing 0 0.0 0 0.0 0 0.0 11 0.1 4 0.0 15 0.1 Totals 76,310 100.0 7,526 100.0 83,836 100.0 18,682 100.0 8,700 100.0 27,382 100.0

44
A n n u a l H o u s i n g R e p o r t
Table C2a below shows the distribution based on combined loan-to-value ratio for the higher-priced fixed-rate mortgage loans that were purchased and securitized by an Enterprise in 2018.
Table C2a: Combined LTV (or LTV if missing) of Fixed-Rate Mortgages (2018)
Combined LTV (or LTV if missing)
Fannie Mae Freddie Mac
In Portfolio at Year-End?
Totals
In Portfolio at Year-End?
Totals Not Held Retained Not Held Retained
Loans Percent Loans Percent Loans Percent Loans Percent Loans Percent Loans Percent 0% < LTV <= 60% 5,548 7.3 528 7.0 6,076 7.3 1,851 9.9 701 8.1 2,552 9.3 60% < LTV <= 80% 21,227 27.9 2,686 35.7 23,913 28.6 6,000 32.2 3,484 40.2 9,484 34.7 80% < LTV <= 90% 7,300 9.6 1,249 16.6 8,549 10.2 983 5.3 654 7.5 1,637 6.0 90% < LTV <= 95% 16,851 22.1 1,904 25.3 18,755 22.4 5,947 31.9 2,778 32.0 8,725 32.0 LTV > 95% 25,249 33.1 1,158 15.4 26,407 31.5 3,840 20.6 1,054 12.1 4,894 17.9 Missing 0 0.0 0 0.0 0 0.0 11 0.1 4 0.0 15 0.1 Totals 76,175 100.0 7,525 100.0 83,700 100.0 18,632 100.0 8,675 100.0 27,307 100.0
III. Product Type
Table C3 below shows the comparison based on product type for the higher-priced mortgage loans that were purchased and securitized by an Enterprise in 2018.
Table C3: Product Type (2018)
Product Type
Fannie Mae Freddie Mac
In Portfolio at Year-End?
Totals
In Portfolio at Year-End?
Totals Not Held Retained Not Held Retained
Loans Percent Loans Percent Loans Percent Loans Percent Loans Percent Loans Percent FRM 76,175 99.8 7,525 100.0 83,700 99.8 18,632 99.7 8,675 99.7 27,307 99.7 ARM 135 0.2 1 0.0 136 0.2 50 0.3 25 0.3 75 0.3 Totals 76,310 100.0 7,526 100.0 83,836 100.0 18,682 100.0 8,700 100.0 27,382 100.0

45
A n n u a l H o u s i n g R e p o r t
IV. Term at Origination
Table C4 below shows the comparison based on term at origination for the higher-priced mortgage loans that were purchased and securitized by an Enterprise in 2018.
Table C4: Term at Origination (2018)
Term at Origination
Fannie Mae Freddie Mac
In Portfolio at Year-End?
Totals
In Portfolio at Year-End?
Totals Not Held Retained Not Held Retained
Loans Percent Loans Percent Loans Percent Loans Percent Loans Percent Loans Percent 30 Years 67,462 88.4 7,032 93.4 74,494 88.9 14,739 78.9 7,498 86.2 22,237 81.2 15 Years 4,414 5.8 113 1.5 4,527 5.4 3,130 16.8 126 1.4 3,256 11.9 All Others 4,434 5.8 381 5.1 4,815 5.7 813 4.4 1,076 12.4 1,889 6.9 Totals 76,310 100.0 7,526 100.0 83,836 100.0 18,682 100.0 8,700 100.0 27,382 100.0
V. Interest Rate at Origination
Tables C5 and C5a below show the comparison based on the interest rate at origination for the higher-priced mortgage loans and higher-priced fixed-rate mortgage loans, respectively, that were purchased and securitized by an Enterprise in 2018.
Table C5: Interest Rate at Origination (2018)
Interest Rate at Origination
Fannie Mae Freddie Mac
In Portfolio at Year-End?
Totals
In Portfolio at Year-End?
Totals Not Held Retained Not Held Retained
Loans Percent Loans Percent Loans Percent Loans Percent Loans Percent Loans Percent < 4.0% 528 0.7 2 0.0 530 0.6 28 0.1 2 0.0 30 0.1 >= 4.0%, < 4.5% 5,419 7.1 150 2.0 5,569 6.6 1,404 7.5 127 1.5 1,531 5.6 >= 4.5%, < 5.0% 12,164 15.9 1,233 16.4 13,397 16.0 2,860 15.3 719 8.3 3,579 13.1 >= 5.0%, < 5.5% 23,612 30.9 1,947 25.9 25,559 30.5 5,924 31.7 2,983 34.3 8,907 32.5 >= 5.5%, < 6.0% 24,559 32.2 2,898 38.5 27,457 32.8 6,220 33.3 3,945 45.3 10,165 37.1 >= 6.0%, < 6.5% 8,859 11.6 1,269 16.9 10,128 12.1 1,947 10.4 906 10.4 2,853 10.4 >= 6.5%, < 7.0% 1,169 1.5 27 0.4 1,196 1.4 299 1.6 18 0.2 317 1.2 >= 7.0%, < 7.5% 0 0.0 0 0.0 0 0.0 0 0.0 0 0.0 0 0.0 >= 7.5%, < 8.0% 0 0.0 0 0.0 0 0.0 0 0.0 0 0.0 0 0.0 >= 8.0% 0 0.0 0 0.0 0 0.0 0 0.0 0 0.0 0 0.0 Totals 76,310 100.0 7,526 100.0 83,836 100.0 18,682 100.0 8,700 100.0 27,382 100.0

46
A n n u a l H o u s i n g R e p o r t
Table C5a: Interest Rate at Origination of Fixed-Rate Mortgages (2018)
Interest Rate at Origination
Fannie Mae Freddie Mac
In Portfolio at Year-End?
Totals
In Portfolio at Year-End?
Totals Not Held Retained Not Held Retained
Loans Percent Loans Percent Loans Percent Loans Percent Loans Percent Loans Percent < 4.0% 525 0.7 2 0.0 527 0.6 28 0.2 2 0.0 30 0.1 >= 4.0%, < 4.5% 5,384 7.1 150 2.0 5,534 6.6 1,390 7.5 112 1.3 1,502 5.5 >= 4.5%, < 5.0% 12,078 15.9 1,233 16.4 13,311 15.9 2,832 15.2 711 8.2 3,543 13.0 >= 5.0%, < 5.5% 23,601 31.0 1,946 25.9 25,547 30.5 5,916 31.8 2,981 34.4 8,897 32.6 >= 5.5%, < 6.0% 24,559 32.2 2,898 38.5 27,457 32.8 6,220 33.4 3,945 45.5 10,165 37.2 >= 6.0%, < 6.5% 8,859 11.6 1,269 16.9 10,128 12.1 1,947 10.4 906 10.4 2,853 10.4 >= 6.5%, < 7.0% 1,169 1.5 27 0.4 1,196 1.4 299 1.6 18 0.2 317 1.2 >= 7.0%, < 7.5% 0 0.0 0 0.0 0 0.0 0 0.0 0 0.0 0 0.0 >= 7.5%, < 8.0% 0 0.0 0 0.0 0 0.0 0 0.0 0 0.0 0 0.0 >= 8.0% 0 0.0 0 0.0 0 0.0 0 0.0 0 0.0 0 0.0 Totals 76,175 100.0 7,525 100.0 83,700 100.0 18,632 100.0 8,675 100.0 27,307 100.0
VI. Credit Score Tables C6 and C6a below show the comparison based on credit score for the higher-priced mortgage loans and higher-priced fixed-rate mortgage loans, respectively,that were purchased and securitized by an Enterprise in 2018.49
Table C6: Credit Score (2018)
Credit Score
Fannie Mae Freddie Mac
In Portfolio at Year-End?
Totals
In Portfolio at Year-End?
Totals Not Held Retained Not Held Retained
Loans Percent Loans Percent Loans Percent Loans Percent Loans Percent Loans Percent Less than 620 62 0.1 5 0.1 67 0.1 567 3.0 217 2.5 784 2.9 620 - < 660 19,834 26.0 1,843 24.5 21,677 25.9 3,976 21.3 1,665 19.1 5,641 20.6 660 - < 700 24,327 31.9 2,307 30.7 26,634 31.8 5,988 32.1 2,776 31.9 8,764 32.0 700 - < 760 20,430 26.8 2,028 26.9 22,458 26.8 5,247 28.1 2,465 28.3 7,712 28.2 760 or Greater 11,569 15.2 1,333 17.7 12,902 15.4 2,890 15.5 1,570 18.0 4,460 16.3 Missing/Bad 88 0.1 10 0.1 98 0.1 14 0.1 7 0.1 21 0.1 Totals 76,310 100.0 7,526 100.0 83,836 100.0 18,682 100.0 8,700 100.0 27,382 100.0
49 Credit scores referred to in tables are Classic FICO scores.

47
A n n u a l H o u s i n g R e p o r t
Table C6a: Credit Score of Fixed-Rate Mortgages (2018)
Credit Score
Fannie Mae Freddie Mac
In Portfolio at Year-End?
Totals
In Portfolio at Year-End?
Totals Not Held Retained Not Held Retained
Loans Percent Loans Percent Loans Percent Loans Percent Loans Percent Loans Percent Less than 620 60 0.1 5 0.1 65 0.1 567 3.0 217 2.5 784 2.9 620 - < 660 19,825 26.0 1,842 24.5 21,667 25.9 3,973 21.3 1,664 19.2 5,637 20.6 660 - < 700 24,314 31.9 2,307 30.7 26,621 31.8 5,980 32.1 2,774 32.0 8,754 32.1 700 - < 760 20,376 26.7 2,028 27.0 22,404 26.8 5,221 28.0 2,455 28.3 7,676 28.1 760 or Greater 11,512 15.1 1,333 17.7 12,845 15.3 2,877 15.4 1,558 18.0 4,435 16.2 Missing/Bad 88 0.1 10 0.1 98 0.1 14 0.1 7 0.1 21 0.1 Totals 76,175 100.0 7,525 100.0 83,700 100.0 18,632 100.0 8,675 100.0 27,307 100.0
VII. Borrower Income Ratio
Table C7 below shows the comparison based on borrower income relative to AMI for the higher-priced mortgage loans that were purchased and securitized by an Enterprise in 2018.
Table C7: Borrower Income Ratio (2018)
Borrower Income Ratio
Fannie Mae Freddie Mac
In Portfolio at Year-End? Totals
In Portfolio at Year-End? Totals
Not Held Retained Not Held Retained
Loans Percent Loans Percent Loans Percent Loans Percent Loans Percent Loans Percent
>= 0%, <= 50% 7,853 10.3 370 4.9 8,223 9.8 1,631 8.7 1,228 14.1 2,859 10.4
> 50%, <= 80% 23,559 30.9 1,434 19.1 24,993 29.8 4,929 26.4 3,156 36.3 8,085 29.5
> 80% 44,566 58.4 5,669 75.3 50,235 59.9 11,765 63.0 3,970 45.6 15,735 57.5
Not Applicable 332 0.4 53 0.7 385 0.5 357 1.9 346 4.0 703 2.6
Totals 76,310 100.0 7,526 100.0 83,836 100.0 18,682 100.0 8,700 100.0 27,382 100.0
VIII. Tract Income Ratio
Table C8 below shows the comparison based on the tract income ratio, which is the ratio of the

48
A n n u a l H o u s i n g R e p o r t
2010 census tract median income to the 2010 local AMI, for the higher-priced mortgage loans that were purchased and securitized by an Enterprise in 2018.
Table C8: Tract Income Ratio (2018)
Tract Income Ratio
Fannie Mae Freddie Mac
In Portfolio at Year-End?
Totals
In Portfolio at Year-End?
Totals Not Held Retained Not Held Retained
Loans Percent Loans Percent Loans Percent Loans Percent Loans Percent Loans Percent <= 80% 22,886 30.0 1,607 21.4 24,493 29.2 5,139 27.5 2,978 34.2 8,117 29.6 > 80%, <= 120% 35,748 46.8 3,403 45.2 39,151 46.7 8,726 46.7 4,045 46.5 12,771 46.6 > 120% 17,611 23.1 2,515 33.4 20,126 24.0 4,807 25.7 1,672 19.2 6,479 23.7 Missing 65 0.1 1 0.0 66 0.1 10 0.1 5 0.1 15 0.1 Totals 76,310 100.0 7,526 100.0 83,836 100.0 18,682 100.0 8,700 100.0 27,382 100.0
IX. 2010 Census Tract/Percent Minority
Table C9 below shows the comparison based on the composition of minority population in a census tract where the property securing a loan is located, for the higher-priced mortgage loans that were purchased and securitized by an Enterprise in 2018.
Table C9: Percent Minority in Census Tract (2018)
Percent Minority in
Census Tract
Fannie Mae Freddie Mac
In Portfolio at Year-End?
Totals
In Portfolio at Year-End?
Totals Not Held Retained Not Held Retained
Loans Percent Loans Percent Loans Percent Loans Percent Loans Percent Loans Percent 0% - < 10% 12,496 16.4 1,238 16.4 13,734 16.4 3,273 17.5 1,881 21.6 5,154 18.8 10% - < 30% 24,690 32.4 2,598 34.5 27,288 32.5 6,140 32.9 2,797 32.1 8,937 32.6 30% - 100% 39,118 51.3 3,690 49.0 42,808 51.1 9,267 49.6 4,022 46.2 13,289 48.5 Missing 6 0.0 0 0.0 6 0.0 2 0.0 0 0.0 2 0.0 Totals 76,310 100.0 7,526 100.0 83,836 100.0 18,682 100.0 8,700 100.0 27,382 100.0

49
A n n u a l H o u s i n g R e p o r t
X. Purpose of Loan
Table C10 below shows the comparison based on the purpose of the loan, whether for home purchase, refinancing of an existing loan, or other, for the higher-priced mortgage loans that were purchased and securitized by an Enterprise in 2018.
Table C10: Loan Purpose (2018)
Loan Purpose
Fannie Mae Freddie Mac
In Portfolio at Year-End?
Totals
In Portfolio at Year-End?
Totals Not Held Retained Not Held Retained
Loans Percent Loans Percent Loans Percent Loans Percent Loans Percent Loans Percent Purchase 58,502 76.7 5,438 72.3 63,940 76.3 12,400 66.4 6,115 70.3 18,515 67.6 Refinance/Other 17,808 23.3 2,088 27.7 19,896 23.7 6,282 33.6 2,585 29.7 8,867 32.4 Totals 76,310 100.0 7,526 100.0 83,836 100.0 18,682 100.0 8,700 100.0 27,382 100.0
XI. Federal Guarantee
Table C11 below shows the comparison based on whether the loan is federally guaranteed or insured, for example by FHA, VA, or RHS, for the higher-priced mortgage loans that were purchased and securitized by an Enterprise in 2018.
Table C11: Federal Guarantee
Federal Guarantee
Fannie Mae Freddie Mac
In Portfolio at Year-End?
Totals
In Portfolio at Year-End?
Totals Not Held Retained Not Held Retained
Loans Percent Loans Percent Loans Percent Loans Percent Loans Percent Loans Percent No 76,304 100.0 7,526 100.0 83,830 100.0 18,668 99.9 8,663 99.6 27,331 99.8 Yes 6 0.0 0 0.0 6 0.0 14 0.1 37 0.4 51 0.2 Totals 76,310 100.0 7,526 100.0 83,836 100.0 18,682 100.0 8,700 100.0 27,382 100.0


![[Survey] Public Attitudes on Fannie Mae, Freddie Mac & Housing Reform](https://static.fdocuments.us/doc/165x107/54bfcc984a795996348b45fc/survey-public-attitudes-on-fannie-mae-freddie-mac-housing-reform.jpg)