Annual Grasses Preserved as Silage: Fermentation ... · Fermentation Characteristics, Nutritive...
96
Annual Grasses Preserved as Silage: Fermentation Characteristics, Nutritive Value, and Quality North Carolina Cooperative Extension North Carolina Agricultural Research Service Technical Bulletin 333 November 2013
-
Upload
truongcong -
Category
Documents
-
view
223 -
download
1
Transcript of Annual Grasses Preserved as Silage: Fermentation ... · Fermentation Characteristics, Nutritive...

Annual Grasses Preserved as Silage:Fermentation Characteristics,Nutritive Value, and Quality
North Carolina Cooperative ExtensionNorth Carolina Agricultural Research ServiceTechnical Bulletin 333November 2013


Fermentation Characteristics, Nutritive Value, and Quality 1
Annual Grasses Preserved as Silage:Fermentation Characteristics, Nutritive Value, and Quality
J. C. Burns, Professor, Departments of Crop Science and Animal Science, North Carolina State University; Collaborator, U.S. Department of Agriculture—Agricultural Research Service.E. S. Leonard, Research Analyst, Department of Crop Science, North Carolina State University and U.S. Department of Agriculture—Agricultural Research Service
Technical Bulletin 333North Carolina Cooperative Extension ServiceNorth Carolina Agricultural Research ServiceCollege of Agriculture and Life SciencesNorth Carolina State University
The research reported in this publication was funded by the North Carolina Agricultural Research Service (NCARS) and by the United States Department of Agricultural, Agricultural Research Service (USDA-ARS), as part of a joint forage-animal research program. Mention of trade name, proprietary products, or specific equipment does not constitute a guarantee or warranty by either NCARS or USDA-ARS and does not imply its approval to the exclusion of other products that may be suitable.
Cover photographs courtesy of the NCARS and USDA–ARS.

2 Annual Grasses Preserved as Silage:

Fermentation Characteristics, Nutritive Value, and Quality 3
Contents
Abstract ....................................................................................................................................................................................................... 5
Introduction ............................................................................................................................................................................................ 6
I. Warm-Season AnnualsExperiment 1. Temperate Corn Dekalb 689 Compared with Two Tropical Corn Silages: Ensiling Characteristics, Nutritive Value, and Quality .................................................................................................. 7Experiment 2. Temperate Corn Pioneer 3154 Compared with Two Tropical Corn Silages: Ensiling Characteristics, Nutritive Value, and Quality .................................................................................................. 11Experiment 3. Temperate Corn Pioneer 31G20 Compared with Two Tropical Corn Silages: Ensiling Characteristics, Nutritive Value and Quality ................................................................................................... 15Experiment 4. Tropical Corn Planted and Ensiled on Differing Dates: Steer Intake, Digestibility, and Preference .................................................................................................................................................................................... 22Experiment 5. Temperate and Tropical Corn Compared with Forage-type Sorghums when Preserved as Silage: Ensiling Characteristics, Nutritive Value, and Quality .................................................... 32
II. Cool-Season AnnualsExperiment 6. Barley and Triticale Preserved as Silage: Ensiling Characteristics, Nutritive Value, and Quality............................................................................................................................................................................................. 37Experiment 7. Ensiled Small Grain Following Tropical Corn at Two Planting Rates: Fermentation Characteristics and Nutritive Value ........................................................................................................ 40
III. Double Cropping AssociationsExperiment 8. Temperate and Tropical Corn Following Small Grain Harvested for Silage: Fermentation Characteristics and Nutritive Value ........................................................................................................ 45Experiment 9. Ensiled Temperate and Tropical Corn in a Double Cropping System: Morphology, Fermentation Characteristics, and Steer Preference. .................................................................... 49
IV. Preference Evaluations of Warm-Season AnnualsExperiment 10. Tropical Corn Silages of Different Cultivars and Maturities: Fermentation Characteristics, Nutritive Value, and Preference .......................................................................................................... 55Experiment 11. Silages of Temperate and Tropical Corns, Forage Sorghums, and Pearlmillet: Steer Preference ............................................................................................................................................................................. 60Experiment 12. Corn and Sorghum Forage Types and Cultivars Ensiled at Differing Maturities: Steer Preference .................................................................................................................................................... 68Experiment 13. Temperate or Tropical Corn Silages Ensiled at Four Maturities: Steer Preference 77

4 Annual Grasses Preserved as Silage:
Appendices
I. General Standard Procedures of ExperimentationGP-1. Planting and ensiling process .................................................................................................................................... 85GP-2. Dry matter intake and apparent whole-tract digestibility.......................................................................... 85GP-3. Masticate collection and processing ..................................................................................................................... 86GP-4. Particle size determination............................................................................................................................................. 87GP-5. Preference determination ............................................................................................................................................. 87GP-6. Laboratory analysis........................................................................................................................................................... 87GP-7. Statistical analysis................................................................................................................................................................ 88
II. References and Recent Related Publications ....................................................................................................... 88
III. Supplemental Data .................................................................................................................................................................... 89
Fermentation Characteristics, Nutritive Value, and Quality 5
Abstract
This bulletin brings together 13 independent experi-ments that address aspects of fermentation (pH and fatty acid production), nutritive value (laboratory estimates of dry matter disappearance and chemi-cal composition), and quality (animal responses) of cool-season and warm-season annual forages preserved as silage. Although we conducted each experiment independently, those with similar ob-jectives have been grouped and appear under four section headings. Our focus in this bulletin is the evaluation of temperate corn and tropical corn cul-tivars with lesser research directed to small grains, forage sorghum, and pearlmillet as silages.
Our intent in producing this bulletin is to make available original research data in a summarized format, with associated methodology, for future reference. A brief Results and Discussion section has been included for each experiment followed by a Summary section highlighting the major findings. Consequently, the interested reader is directed to the Summary and Conclusions section of each experi-ment for an assessment of the findings that is not reiterated elsewhere.

6 Annual Grasses Preserved as Silage:
Introduction
Animal production enterprises that require a large, reliable source of forage of maximum nutritive value have frequently included either annual warm-season or cool-season forages, or both, in their production systems. These annuals, generally preserved as silage for animal production systems, can be advantageous-ly produced in the U.S. mid-Atlantic and farther south by taking advantage, in the case of cool-season grass, of the moderate winter, and in the case of warm-season grass, of the hot, humid summers with generally favorable rainfall.
Of the annual warm-season grasses, corn (Zea mays L.) has been the primary choice because of its ease of production, harvesting, and preservation as excellent quality silage as well as maintaining maxi-mum nutritive value. Annual sorghums [Sorghum bicolor (L.) Moench] and millets [Pennisetum ameri-canum (L.) Leeke, formerly P. glaucum (L.) R, Br] have also played a role, but are frequently lacking in nutritive value.
The small grains, or annual cool-season grasses, consisting of wheat (Triticum aestivum L. emend. Thell.), triticale (XTriticosecale Wittmack), barley (Hordeum vulgare L.), and oats (Avena sativa L.), have all been grown and preserved as silage with wheat, triticale, and barley generally preferred be-cause of their yield potentials. Oats, however, have also had an important role.
The potential of double cropping with cool-season and warm-season annuals grown in sequence, or double cropping with warm-season annuals grown in sequence on the same land resource, offers eco-nomic advantages in terms of nutrient production. The residual impact of one crop on the subsequent crop in a double cropping system warrants some consideration.
Of the corn cultivars used for silage, the adapt-ed, temperate ones have generally served this role. Tropical corn cultivars, however, are also available that can be planted later and have provided a viable silage for producing animals. Generally, tropical corn cultivars have a lesser grain component but greater fiber concentration in the forage component than temperate cultivars, but tropical cultivars are noted for greatest forage yields. The agronomics and forage
potential of tropical corn across the southeastern United States has been the subject of a Southern Regional Symposium and worthy of examining (Teare and Brown, 1991).
In the Upper South, where the summer growing season is shorter compared with the Lower South, double cropping with a small grain followed by corn can be readily practiced. The maturity of small grains, generally in the boot- to late-boot stage, oc-curs early enough to permit the planting of either temperate or tropical corn cultivars. In cases where a small grain harvest is delayed until seed-set, suf-ficient variation occurs in tropical corn cultivars to permit planting into mid-June. In Section I of this bulletin, we compare ensiling characteristics, nutri-tive value, and quality of several adapted temperate corn cultivars with that of various alternative annual forages when preserved as silage. Forages compared include several tropical corn cultivars, forage sor-ghum, and pearlmillet. In Section II, we examine the ensiling characteristics, nutritive value, and quality of two prominent small grains. And in Section III, we consider small grains and corn responses when grown in a double cropping setting. Also, we report in Section IV the results of independent experiments conducted to compare only animal preference among selected cultivars.
Our main focus in this bulletin is to provide a record of data obtained from several different experi-ments on the evaluation of these selected annual cool-season and warm-season grasses that might contribute to improved animal daily performance during stressful periods. Only the main points have been highlighted in the Results and Discussion sec-tion and in the Summary and Conclusions section. The general procedures used in conducting the research presented in this bulletin are provided in the Appendices. Throughout the bulletin, “nutritive value” refers to laboratory estimates of in vitro dry matter disappearance and the chemical composi-tion of the forage (such as crude protein and neutral detergent fiber), and “quality” refers to animal responses (such as dry matter intake, dry matter di-gestibility, masticate characteristics, and preference).

Fermentation Characteristics, Nutritive Value, and Quality 7
I. Warm-Season Annuals
Experiment 1. Temperate Corn Dekalb 689 Compared with Two Tropical Corn Silages: Ensiling Characteristics, Nutritive Value, and Quality
Temperate corn cultivars are the primary source of corn for silage in the United States. Our objective in this experiment was to compare the nutritive value and quality of the adapted temperate corn cultivar Dekalb 689 with two tropical corn cultivars when preserved as silage.
Materials and MethodsThree corn cultivars were planted, grown, and harvested using conventional procedures. These cul-tivars were evaluated:
Temperate corn:1. Dekalb 689
Tropical corn (TP):2. Dekalb 678C (TP-1)3. Pioneer X304C (TP-2)
All forages were preserved in upright experimen-tal silos (Appendix GP-1) and were not disturbed for at least 60 days following ensiling so fermentation could proceed to completion.
Digestion (Experiment 1A) and mastication (Experiment 1B) experiments were conducted us-ing steers in a randomized complete block design. In Experiment 1A, three steers were used per treat-ment—being blocked by weight in groups of three (range of 538 to 611 pounds; mean = 603 pounds) and assigned at random within group to a treat-ment (Appendix GP-2). In Experiment 1B, silages were evaluated by three to five steers, depending on treatment (Appendix GP-3). All as-fed, weighback, masticate, and fecal samples were analyzed according to standard procedures (Appendix GP-6), and data were analyzed statistically according to the experi-mental design (Appendix GP-7).
Results and DiscussionExperiment 1AAt ensiling, the dry matter concentrations of the silages were similar, averaging 42.7%. Following fermentation, the pH, ethanol, and fatty acids con-centrations were likewise similar among forages (Table 1.1). Although the lactic acid concentrations of the two tropical cultivars were similar, differences approached significance (P = 0.06) and the tropical cultivar average concentration was greater than that of the temperate corn.
Steers digested the dry matter of temperate corn silage greater than the two tropicals, which were sim-ilar in dry matter digestibility. But steers digested the cellulose of temperate corn lesser than they digested that of tropical cultivars (Table 1.2). The lesser diges-tion of hemicellulose for the temperate corn versus tropical corn also approached significance (P = 0.06).
The nutritive value of the as-fed temperate corn silage was generally greater compared with that of the tropical corns, the temperate corn having greater in vitro dry matter disappearance and crude protein and lesser acid detergent fiber and cellulose (Table 1.3). Also, some selective consumption was evident by the magnitude of the difference values (weigh-back concentration minus as-fed concentration). The greatest selectivity, however, was noted for TP-2 (Pioneer X304C).
Fecal composition reflects the greater crude protein (CP) concentration of the as-fed temperate corn silage, being greater compared with the tropi-cal corns, which were similar (Table 1.4). Particle size distribution of the feces, however, was similar among all cultivars (data are shown with masticate in Figure 1.1).
Experiment 1B The masticate dry matter was similar among all three corn cultivars, averaging 16.9%, and median particle size was similar among the silages (Table 1.5). The whole masticate reflects the nutritive value of the as-fed temperate silage (Table 1.3), being great-er in in vitro dry matter disappearance and crude

8 Annual Grasses Preserved as Silage:
protein and lesser in neutral detergent fiber than the whole masticate from tropical corn silages. This was also evident for all three particle-size classes. The proportions of the whole masticate that composed the large, medium, and small particle sizes were generally similar among the three corn silages. The distribution of masticate and fecal particles for each sieve size can be viewed in Figure 1.1.
Summary and Conclusion• AllsilagesensiledwellwithpHmeasuresof≤4.3
and were readily eaten by steers.• Steersdigestedthedrymatterofthetemper-
ate cultivar (Dekalb 689) greater than that of the tropical cultivars (Dekalb 678C and Pioneer X304C).
• Thenutritivevalueoftheas-fedandthemas-ticated silage generally reflected the greater digestibility of the temperate silage dry matter.
Table 1.1. Dry matter (DM) and fermentation characteristics of temperate and tropical corn silages (DM basis).
Cultivar DM pH EthanolFatty Acids
Acetic Propionic Lactic Butyric% ————————%————————
Temperate corn (TM):Dekalb 689 44.51 4.3 0.18 0.79 0.029 2.53 0.004
Tropical corn (TP):Dekalb 678C (TP-1) 41.8 4.1 0.25 1.26 0.020 5.02 —Pioneer X304C (TP-2) 41.9 4.0 0.41 1.04 0.028 4.97 —
Significance (P):Treatment 0.66 0.15 0.63 0.62 0.58 0.11
TM vs. TP 0.42 0.08 0.51 0.43 0.55 0.06TP-1 vs. TP-2 0.98 0.66 0.53 0.66 0.44 0.95
1 Each value is the mean of two samples (replicates 1 and 2 pooled, and 3 and 4 pooled).
Table 1.2. Dry matter (DM) and neutral detergent fiber (NDF) digestibility and digestibilities of associated fiber fractions1 of temperate and tropical corn preserved as silages, Experiment 1A (DM basis).
Cultivar DM NDFFiber Fractions
ADF HEMI CELL———————————%————————————-
Temperate corn (TM): Dekalb 689 59.82 34.8 36.0 33.5 39.0
Tropical corn (TP):Dekalb 678C (TP-1) 55.5 44.2 42.6 46.2 48.2Pioneer X304C (TP-2) 55.7 39.5 36.1 43.3 42.7
Significance (P):Treatment 0.01 0.15 0.14 0.13 0.07
TM vs. TP 0.01 0.09 0.26 0.06 0.05TP-1 vs. TP-2 0.83 0.27 0.09 0.59 0.12
1 ADF = acid detergent fiber; HEMI = hemicellulose; CELL = cellulose.2 Each value is the mean of three steers.

Fermentation Characteristics, Nutritive Value, and Quality 9
Table 1.3. In vitro dry matter disappearance (IVDMD) and associated nutritive value1 of as fed (AF) temperate and tropical corn preserved as silages, Experiment 1A (dry matter basis).
CultivarIVDMD CP NDF Fiber Fractions
AF DV2 AF DV AF DV ADF HEMI CELL Lignin—————————————— % ——————————————
Temperate corn (TM):Dekalb 689 68.23 -1.2 8.1 -0.1 46.0 2.0 23.4 22.6 19.0 4.0
Tropical corn (TP):Dekalb 678C (TP-1) 57.3 1.9 7.3 -1.1 58.2 2.4 32.0 26.2 25.9 5.5Pioneer X304C (TP-2) 59.9 -5.3 7.5 -1.5 55.3 11.9 29.1 26.2 23.7 4.9
Significance (P):Treatment 0.05 0.06 0.02 0.03 0.15 0.05 0.07 0.33 0.06 0.14
TM vs. TP 0.03 0.78 0.01 0.02 0.08 0.12 0.04 0.18 0.03 0.09TP-1 vs. TP-2 0.30 0.02 0.11 0.26 0.52 0.03 0.24 0.99 0.21 0.29
1 CP = crude protein; NDF = neutral detergent fiber; ADF = acid detergent fiber; HEMI = hemicellulose; CELL = cellulose.2 DV = difference value (weighback concentration minus AF concentration).3 Each value is the mean of two samples (replicate 1 and 2 pooled and 3 and 4 pooled).
Table 1.4. Composition1 of feces from steers fed temperate and tropical corn silages (dry matter basis).
Cultivar CP NDFFiber Fractions
ADF HEMI CELL Lignin————————— %—————————
Temperate corn (TM):Dekalb 689 10.32 73.3 37.1 36.3 28.7 7.7
Tropical corn (TP):Dekalb 678C (TP-1) 8.9 73.2 41.5 31.7 30.2 10.0Pioneer X304C (TP-2) 9.1 73.9 41.2 32.7 29.9 10.3
Significance (P):Treatment 0.08 0.73 0.02 <0.01 0.31 <0.01
TM vs. TP 0.03 0.79 0.01 <0.01 0.15 <0.01TP-1 vs. TP-2 0.73 0.48 0.76 0.11 0.75 0.28
1CP = crude protein; NDF = neutral detergent fiber; ADF = acid detergent fiber; HEMI = hemicellulose; CELL = cellulose.2 Each value is the mean of three steers.

10 Annual Grasses Preserved as Silage:Ta
ble
1.5.
Mas
ticat
e dr
y m
atte
r (D
M),
med
ian
part
icle
siz
e (M
PS),
and
part
icle
-siz
e cl
asse
s an
d as
soci
ated
nut
ritiv
e va
lue1 o
f tem
pera
te a
nd tr
opic
al
corn
pre
serv
ed a
s si
lage
s, E
xper
imen
t 1B
(DM
bas
is).
Culti
var
Who
le M
astic
ate
Part
icle
-siz
e cl
asse
s2
Larg
eM
ediu
mSm
all
DM
MPS
IVD
MD
CPN
DF
Prop
3IV
DM
DN
DF
Prop
IVD
MD
ND
FPr
opIV
DM
DN
DF
%m
m--
----
----
----
----
----
----
----
----
----
----
----
----
----
--- %
----
----
----
----
----
----
----
----
----
----
----
----
----
----
-Te
mpe
rate
cor
n (T
M):
Dek
alb
689
18.1
42.
170
.07.
745
.658
.965
.750
.726
.270
.339
.714
.983
.316
.0Tr
opic
al c
orn
(TP)
:D
ekal
b 67
8C (T
P-1)
17.5
2.3
60.8
6.5
58.5
64.9
50.0
63.8
25.2
64.0
52.3
9.9
77.5
29.1
Pion
eer X
304C
(TP-
2)15
.12.
056
.86.
562
.250
.950
.567
.736
.158
.559
.313
.069
.539
.9Si
gnifi
canc
e (P
):Tr
eatm
ent
0.54
0.39
<0.0
10.
030.
040.
23<0
.01
<0.0
10.
120.
03<0
.01
0.20
0.02
<0.0
1TM
vs.
TP0.
440.
77<0
.01
0.01
0.02
0.86
<0.0
1<0
.01
0.28
0.01
<0.0
10.
170.
01<0
.01
TP-1
vs.
TP-2
0.40
0.21
0.10
0.97
0.50
0.10
0.01
0.22
0.06
0.13
0.06
0.29
0.06
0.04
1 IV
DM
D =
in v
itro
dry
mat
ter d
isap
pear
ance
; CP
= cr
ude
prot
ein;
ND
F =
neut
ral d
eter
gent
fibe
r.2 La
rge
= ≥
1.7
mm
; med
ium
= <
1.7
and
≥ 0
.5 m
m; s
mal
l = <
0.5
mm
. 3 Pr
op =
pro
port
ion
of w
hole
mas
ticat
e D
M.
4 Ea
ch v
alue
is th
e m
ean
of th
ree
to fi
ve s
teer
s.
Figure 1.1. Particle size distribution of masticate and feces dry matter of temperate (TM = Dekalb 689) and tropical (TP-1 = Dekalb 678C and TP-2 = Pioneer X304C) corn silages (dry matter basis).
Fermentation Characteristics, Nutritive Value, and Quality 11
Experiment 2. Temperate Corn Pioneer 3154 Compared with Two Tropical Corn Silages: Ensiling Characteristics, Nutritive Value, and Quality
Temperate corn cultivars make up the primary source of corn for silage in the United States. Our objective in this experiment was to compare the nutritive value and quality of the adapted temperate corn cultivar Pioneer 3154 with two tropical corn cultivars when preserved as silage.
Material and MethodsThree corn cultivars were planted, grown, and harvested using conventional procedures. These cul-tivars were evaluated:
Temperate corn:1. Pioneer 3154
Tropical corn:2. Dekalb 678C (TP-1)3. Pioneer X304C (TP-2)
All forages were preserved in upright experimen-tal silos (Appendix GP-1) and were not disturbed for at least 60 days following ensiling so fermentation could proceed to completion.
Digestibility (Experiment 2A) and mastication (Experiment 2B) experiments were conducted us-ing steers in a randomized complete block design. In Experiment 2A, four steers were used per treat-ment, being blocked in groups of three by weight (range of 482 to 609 pounds, mean = 555 pounds) and assigned at random within group to a treatment (Appendix GP-2). In Experiment 2B, silages were evaluated by six steers (Appendix GP-3). All as-fed, weighback, masticate, and fecal samples were ana-lyzed according to standard procedures (Appendix GP-6), and data were analyzed statistically according to the experimental design (Appendix GP-7).
Results and DiscussionExperiment 2AAt ensiling, the morphology of the temperate corn differed appreciably from that of the tropical culti-vars, which were generally similar (not compared
statistically, Table 2.1). Dry matter of the ensiled corn forage was greater for the temperate corn, averag-ing 33.2% compared with 26.1% for the tropical corn forages, which were similar (Table 2.2). Silages fer-mented well with pH measures of 4.1 and below. The temperate silage produced lesser propionic and lactic acids compared with the tropical silages, which were similar. The more favorable pH noted for silages in this experiment—compared with the pH of silages in Experiment 1—is, in part, attributed to greater mois-ture concentrations at ensiling, which probably aided packing, thereby excluding more oxygen. This is re-flected in greater concentrations of lactic acid in this experiment compared with those in Experiment 1.
Steers digested the dry matter of the three corn silages similarly, as well as the neutral detergent fiber and its constituent fiber fractions (Table 2.3). This finding is consistent with the nutritive value of the as-fed silage being similar in average in vitro true dry matter disappearance (76%), crude protein (9%), and neutral detergent fiber (52%) (Table 2.4).
Composition of fecal samples reveals a greater con-centration of crude protein from tropical corn silages compared with temperate and consistent with the rela-tionship of the as-fed silages (Table 2.5 and Table 2.3). The neutral detergent fiber and its constituents were similar in concentration among the three corn silages.
Experiment 2BExamination of masticate reveals no difference in dry matter concentration, median particle size, or nutri-tive value among the three silages (Table 2.6). This is also the case among cultivars within each particle-size class. The noted exception, however, was the lesser in vitro true dry matter disappearance of tem-perate corn silage within each class. The particle-size distribution of masticate dry matter reveals the gen-eral similarity of the two tropical cultivars compared with a different distribution noted for the temperate corn silage (Figure 2.1).
Summary and Conclusions • Asexpected,temperatecornhadagreaterpro-
portion of its dry matter as ear (51.3%) when compared with tropical cultivars (36.9% to 37.4%).

12 Annual Grasses Preserved as Silage:
Figure 2.1. Particle size distribution of masticate dry matter of temperate (TM = Pioneer 3154) and Tropi-cal (TP-1 = Dekalb 678; TP-2 = Pioneer X304C) corn silages.
• AllsilagesfermentedwellwithpHmeasuresof≤4.1 and were readily eaten by steers.
• Steersdigestedthedrymatterandneutralde-tergent fiber and its fiber constituents similarly regardless of corn type.
• Thesimilarityindrymatterdigestibilityamongcultivars was generally reflected in the nutritive value of both the as-fed silage and the masticate.
Table 2.1. Morphology of temperate and tropical corn cultivars evaluated in Experiments 2A and 2B.
Cultivar
Forage Ear
Leaf Sheath Stalk Tassel Ear Grain Cob Husk
————% of Total Plant ———— —% of Total Ear—
Temperate corn:
Pioneer 3154 11.21 7.2 29.9 0.5 51.3 72.2 16.6 11.2
Tropical corn:
Dekalb 678C 19.0 10.6 31.7 1.3 37.4 39.0 24.6 36.4
Pioneer X304C 18.7 10.4 32.5 1.5 36.9 52.4 20.4 27.21Each value is the average of 10 stalks and the mean of five samples.

Fermentation Characteristics, Nutritive Value, and Quality 13
Table 2.3. Dry matter (DM) digestibility and digestibilities of neutral detergent fiber (NDF) and fiber fractions1 of temperate and tropical corn silages, Experiment 2A (DM basis).
Cultivar DM NDF
Fiber Fractions1
ADF HEMI CELL
——————— % ——————
Temperate corn (TM):
Pioneer 3154 62.52 52.6 51.4 53.9 56.5
Tropical corn (TP):
Dekalb 678C (TP-1) 61.6 49.5 52.2 45.5 58.5
Pioneer X304C (TP-2) 66.8 51.2 55.6 44.9 61.3
Significance (P):
Treatment 0.19 0.81 0.61 0.27 0.61
TM vs. TP 0.50 0.60 0.52 0.12 0.43
TP-1 vs. TP-2 0.10 0.74 0.46 0.91 0.571 ADF = acid detergent fiber; HEMI = hemicellulose; CELL = cellulose.2 Each value is the mean of four steers.
Table 2.2. Dry matter (DM) and fermentation characteristics of ensiled temperate and tropical corn fed in Experiments 2A and 2B (DM basis).
Cultivar DM pH
Alcohols Fatty Acids
Ethanol Methanol Acetic Propionic Lactic Butyric
% ——————————— % ———————————
Temperate corn (TM):
Pioneer 3154 33.21 4.1 0.54 0.002 0.79 0.026 4.48 0.009
Tropical corn (TP):
Dekalb 678C (TP-1) 25.6 3.8 1.07 0.030 1.25 0.068 6.57 -
Pioneer X304C (TP-2) 26.6 3.9 0.41 0.009 1.22 0.080 7.04 0.025
Significance (P):
Treatment 0.01 0.14 0.76 0.16 0.38 0.08 0.05 0.50
TM vs. TP <0.01 0.07 0.82 0.15 0.21 0.05 0.03 0.85
TP-1 vs. TP-2 0.21 0.66 0.53 0.14 0.93 0.42 0.40 0.301 Each value is the mean of four samples.

14 Annual Grasses Preserved as Silage:
Table 2.4. In vitro true dry matter disappearance (IVTD) and associated nutritive value1 of as fed (AF) temperate and tropical corn silages, Experiment 2A (dry matter basis).
Cultivar IVTD CP NDF
Fiber Fractions
ADF HEMI CELL Lignin
—————————— % ——————————
Temperate corn (TM):
Pioneer 3154 73.72 7.7 54.0 29.3 24.6 24.2 4.7
Tropical corn (TP):
Dekalb 678C (TP-1) 76.0 9.7 52.8 31.1 21.7 26.3 4.5
Pioneer X304C (TP-2) 78.0 9.5 48.2 28.1 20.1 23.6 4.3
Significance (P):
Treatment 0.11 0.20 0.29 0.43 0.07 0.36 0.50
TM vs. TP 0.07 0.11 0.29 0.87 0.04 0.63 0.35
TP-1 vs. TP-2 0.21 0.83 0.24 0.25 0.22 0.22 0.521 CP = crude protein; NDF = neutral detergent fiber; ADF = acid detergent fiber; HEMI = hemicellulose; CELL = cellulose.2 Each value is the mean of two samples (replicates 1 and 2 pooled and replicates 3 and 4 pooled).
Table 2.5. Composition1 of feces from steers fed temperate and tropical corn silages, Experiment 2A (dry matter basis).
Cultivar CP NDF
Fiber Fractions
ADF HEMI CELL Lignin
———————— % ————————
Temperate corn (TM):
Pioneer 3154 8.12 68.0 37.7 30.3 27.6 8.5
Tropical corn (TP):
Dekalb 678C (TP-1) 9.1 69.0 38.6 30.4 28.4 8.8
Pioneer X304C (TP-2) 9.6 70.2 37.5 32.8 27.3 8.6
Significance (P):
Treatment 0.01 0.39 0.15 0.16 0.62 0.90
TM vs. TP <0.01 0.26 0.45 0.27 0.83 0.70
TP-1 vs. TP-2 0.20 0.45 0.07 0.10 0.36 0.811 CP = crude protein; NDF = neutral detergent fiber; ADF = acid detergent fiber; HEMI = hemicellulose; CELL = cellulose.2 Each value is the mean of four steers.

Fermentation Characteristics, Nutritive Value, and Quality 15
Tabl
e 2.
6. M
astic
ate
dry
mat
ter (
DM
), m
edia
n pa
rtic
le s
ize
(MPS
), an
d pa
rtic
le-s
ize
clas
ses
and
asso
ciat
ed n
utri
tive
valu
e1 of t
empe
rate
and
tr
opic
al c
orn
pres
erve
d as
sila
ges,
Exp
erim
ent 2
B (D
M b
asis
).
Culti
var
Who
le M
astic
ate
Part
icle
-siz
e cl
asse
s2
Larg
eM
ediu
mSm
all
DM
MPS
IVTD
CPN
DF
Prop
3IV
TDN
DF
Prop
IVTD
ND
FPr
opIV
TDN
DF
%m
m—
——
——
——
——
——
——
——
——
——
— %
——
——
——
——
——
——
——
——
——
——
Tem
pera
te c
orn
(TM
):Pi
onee
r 315
413
.54
2.44
74.3
7.5
52.7
65.6
72.8
55.2
25.5
73.6
52.4
8.9
79.8
37.7
Trop
ical
cor
n (T
P):
Dek
alb
678C
(TP-
1)11
.93.
1775
.68.
957
.876
.874
.758
.517
.876
.952
.15.
486
.231
.2Pi
onee
r X30
4C (T
P-2)
11.7
3.17
74.8
9.1
56.6
77.0
73.5
59.1
16.9
75.6
52.4
6.1
86.5
30.4
Sign
ifica
nce
(P):
Trea
tmen
t0.
240.
210.
750.
170.
310.
190.
050.
500.
230.
060.
980.
110.
010.
27TM
vs.
TP0.
130.
110.
580.
090.
180.
100.
040.
290.
120.
030.
950.
06<0
.01
0.15
TP-1
vs.
TP-2
0.79
0.99
0.68
0.77
0.70
0.97
0.06
0.84
0.82
0.15
0.89
0.53
0.51
0.84
1 IV
TD =
in v
itro
true
dry
mat
ter d
isap
pear
ance
; CP
= cr
ude
prot
ein;
ND
F =
neut
ral d
eter
gent
fibe
r.2 La
rge
= ≥
1.7
mm
; med
ium
= <
1.7
and
≥ 0
.5 m
m; s
mal
l = <
0.5
mm
. 3 Pr
op =
pro
port
ion
of w
hole
mas
ticat
e D
M.
4 Ea
ch v
alue
is th
e m
ean
of th
ree
stee
rs.
Experiment 3. Temperate Corn Pioneer 31G20 Compared with Two Tropical Corn Silages: Ensiling Characteristics, Nutritive Value, and Quality
Temperate corn cultivars make up the primary source of corn for silage in the United States. Our objective in this experiment was to compare the nutritive value and quality of the adapted temperate corn cultivar Pioneer 31G20 with two tropical corn cultivars when preserved as silage.
Materials and MethodsThree corn cultivars were planted, grown, and harvested using conventional procedures. The ex-periment was conducted for two years with each year presented separately. These cultivars were evaluated:
Temperate corn:1. Pioneer 31G20
Tropical corn (TP):2. Dekalb XL660 (TP-1)3. Pioneer 3098 (TP-2)
All forages were preserved in upright experimen-tal silos (Appendix GP-1) both years and were not disturbed for at least 60 days following ensiling. This permitted fermentation to proceed to completion. At harvest in Year 1, plants of each cultivar were sepa-rated into morphological components of leaf, sheath, stalk, tassel, and ear. Each ear was further separated into grain, cob, and husk. All parts were oven-dried and expressed as a percent of the total plant dry mat-ter (Appendix GP-1).
Dry matter intake and digestibility were deter-mined in both years using steers in a randomized complete block design. In Year 1, three steers were used per treatment, being blocked in groups of three by weight (mean = 679.7 ± 22 pounds), and were fed an average of 13.1% in excess during the intake phase. In Year 2, four steers were used per treatment, being blocked in groups of three by weight (mean = 543 ± 35 pounds), and were fed an average of 12.7% in excess during the intake phase (Appendix GP -2). In both years, all as-fed, weighback, and fecal sam-
16 Annual Grasses Preserved as Silage:
ples were analyzed according to standard procedures (Appendix GP -6), and data were analyzed statistical-ly according to the experimental design (Appendix GP -7).
Results and DiscussionYear 1The morphological differences between the temper-ate and tropical cultivars were noted primarily in the ear component. The ear accounted for about 52% of the temperate corn cultivar compared with a mean of about 35% for the two tropical cultivars (Table 3.1). Although the percentage of dry matter at feed-ing differed among the silages, with temperate corn greatest, all silages fermented well with pH measures of≤4.6(Table3.2).Themajordifferenceinfattyacidproduction was noted for lactic acid, of which the tropical cultivars had greater concentrations than temperate corn (Table 4.2).
Dry matter intake was similar and surprisingly greatest for the tropical silages (mean = 2.19 pounds per 100 pounds of body weight) compared with the temperate cultivar (1.79 pounds per 100 pounds of body weight; Table 3.3). Digestibilities of the dry matter, however, were similar among cultivars (mean 62.3%). Digestible intakes reflect the dry matter intake being greatest for the tropical corn cultivars (which were similar) compared with the temperate cultivar.
Examination of the as-fed silage indicates that the temperate corn cultivar was greatest in nutritive val-ue (greatest in in vitro true dry matter disappearance and least in neutral detergent fiber and its constitu-ent fiber fractions and crude protein) compared with the tropical cultivars, which generally were similar (Table 3.4). This, relative to dry matter intake, may indicate some degree of off odor or flavor associated with the fermented temperate corn. Examination of the fecal dry matter composition indicates greater crude protein and lesser neutral detergent fiber, and its constituents acid detergent fiber and lignin, from temperate corn than tropical corn (Table 3.5). This would generally be associated with greater nutri-tive value and quality and further indicates that the fermentation of the temperate corn cultivar was pos-sibly limiting steer acceptance and intake.
Year 2When ensiled, the dry matter of the corn forage averaged 31.5% with no difference among cultivars (Table 3.6). The pH measures of all silages were ad-equate, indicating good fermentation, with the pH of the temperate cultivar lesser than the mean pH of the two tropicals. Silage of the temperate cultivar had greater concentrations of methanol and lactic acid, but lesser isobutyric acid, than the tropical silages. However, both methanol and isobutyric concentra-tions were small.
Steers consumed all three silages similarly, aver-aging 1.83 pounds of dry matter per 100 pounds of body weight. Also, dry matters of all three silages were digested similarly, averaging 61.1%. The tropi-cal silages averaged greater in the digestibility of neutral detergent fiber, acid detergent fiber, hemicel-lulose, and cellulose than did the temperate silage. These greater digestibilities occurred in the tropical silages—with greater digestible intake of neutral de-tergent fiber, acid detergent fiber, hemicellulose and cellulose, with TP-2 (Pioneer 3098) greater in these than TP-1 (Dekalb XL660), as summarized in Table 3.7.
The as-fed temperate silage was generally greater in nutritive value (greater in in vitro true dry matter disappearance and crude protein and lesser in neu-tral detergent fiber and the fiber fractions) than the silages from tropical cultivars (Table 3.8). Further, TP-2 was generally of greater nutritive value than TP-1. Difference values (weighback concentration minus as-fed concentration) further indicate that some selective consumption occurred, but consump-tion was generally similar among the three silages.
Fecal composition reflects, but to a lesser degree, the greater nutritive value of the temperate cultivar, being greater in crude protein and lesser in acid de-tergent fiber and lignin concentration (Table 3.9). No differences were noted between the tropical cultivars in fecal composition.
More recent cultivar releases, such as P2088YHR or P1745BVT or the tropical P30F35HR, warrant as-sessment for their dry matter yield potentials.
Fermentation Characteristics, Nutritive Value, and Quality 17
Summary and ConclusionsYear 1• Temperatecornhadthegreatestproportionof
ear and the least of stem and husk components.• AllthreesilagesfermentedwellwithpHmea-
suresof≤4.6,althoughtemperatecorngenerallystabilizesatapHof≤3.9.
• Steersconsumedthetwotropicalsilagessimilar-ly (mean = 2.19 pounds per 100 pounds of body weight), and greater than they consumed tem-perate corn silage (1.79 pounds per 100 pounds of body weight), but all three silages had similar dry matter digestibilities (mean = 62.3%).
• Thenutritivevalueofthetemperatesilagewasgreater than that of the tropical silages, indi-
cating possible fermentation problems, which reduced temperate silage dry matter intake.
Year 2• Steersconsumedanddigestedthetemperateand
tropical silages similarly, eating an average of 1.83 pounds per 100 pounds of body weight with a digestibility of 61%.
• Steersdigestedtheneutraldetergentfiberanditsconstituent fiber fractions of the silage dry mat-ter greater in the tropical corn compared with the temperate corn, resulting in greater digestible intakes of each constituent.
Table 3.1. Morphology of temperate and tropical corn cultivars, Year 1 (dry matter basis).
Cultivar
Forage Ear
Leaf Sheath Tassel Husk Dead Ear Grain Cob
—————% of Total Plant ————— —% of Total Ear—
Temperate corn:
Pioneer 31G20 15.61 25.1 0.5 6.6 0.1 52.1 81.7 18.3
Tropical corn:
Dekalb XL660 (TP-1) 16.1 36.6 1.0 11.2 1.9 33.2 80.7 19.3
Pioneer 3098 (TP-2) 13.9 33.9 1.3 8.0 3.5 39.4 80.2 19.81 Values represent a composite sample.
Table 3.2. Dry matter (DM) and fermentation characteristics of ensiled temperate and tropical corn (DM basis).
Cultivar DM pH
Alcohols Fatty Acids
Ethanol Methanol Acetic Propionic Lactic Butyric Isobutyric
% —————————————— %——————————————
Temperate corn (TM):
Pioneer 31G20 26.01 4.5 0.05 0.03 1.45 0.14 1.59 0.22 0.03
Tropical corn (TP):
Dekalb XL660 (TP-1) 22.6 4.6 0.03 0.05 1.37 0.08 2.67 0.04 0.02
Pioneer 3098 (TP-2) 25.9 4.4 0.03 0.03 0.99 0.03 3.92 0.05 0.02
Significance (P):
Treatment <0.01 0.38 0.69 0.02 0.37 0.02 0.06 0.08 0.82
TM vs. TP 0.01 0.89 0.42 0.03 0.35 0.01 0.04 0.04 0.08
TP-1 vs. TP-2 <0.01 0.19 0.88 0.02 0.29 0.13 0.13 0.88 0.621 Each value is the mean of three samples.

18 Annual Grasses Preserved as Silage:
Table 3.3. Dry matter (DM) intake (DMI), digestibilities and digestible intakes of DM and associated nutritive value of temperate and tropical corn preserved as silage, Year 1 (DM basis).
Cultivar DMI
Digestibilities1 Digestible Intakes
DM NDF ADF HEMI CELL DM NDF ADF HEMI CELL
lb/100 lb2 ———————%——————— ————— lb/100 lb2 —————
Temperate corn (TM):
Pioneer 31G20 1.793 63.7 48.3 50.8 45.2 54.7 1.14 0.45 0.26 0.18 0.25
Tropical corn (TP):
Dekalb XL660 (TP-1) 2.12 60.1 55.0 59.9 47.7 63.3 1.22 0.65 0.41 0.24 0.37
Pioneer 3098 (TP-2) 2.25 63.1 51.6 51.4 52.0 57.7 1.42 0.65 0.37 0.28 0.36
Significance (P):
Treatment 0.02 0.47 0.36 0.25 0.23 0.36 0.09 0.08 0.08 0.07 0.09
TM vs. TP 0.01 0.39 0.21 0.26 0.19 0.24 0.09 0.04 0.04 0.05 0.04
TP-1 vs. TP-2 0.26 0.34 0.46 0.16 0.31 0.35 0.13 0.97 0.49 0.24 0.771 NDF = neutral detergent fiber; ADF = acid detergent fiber; HEMI = hemicellulose; CELL = cellulose.2 Body weight basis.3 Each value is the mean of three steers.
Table 3.4. In vitro true dry matter disappearance (IVTD) and associated nutritive value1 of as-fed (AF) temperate and tropical corn silages, Year 1 (dry matter basis).
Cultivar
IVTD CP NDF Fiber fractions
AF DV2 AF DV AF DV ADF HEMI CELL Lignin
————————————————% ——————————————
Temperate corn (TM):
Pioneer 31G20 79.33 1.5 9.1 -1.2 50.9 -3.5 28.4 22.6 25.1 2.9
Tropical corn (TP):
Dekalb XL660 (TP-1) 71.8 -0.5 9.9 0.0 57.6 -0.5 33.1 24.5 28.6 1.5
Pioneer 3098 (TP-2) 71.9 -3.2 9.9 -1.0 55.9 2.3 32.1 23.8 27.6 4.0
Significance (P):
Treatment <0.01 0.20 0.07 0.17 <0.01 0.41 <0.01 0.01 <0.01 <0.01
TM vs. TP <0.01 0.14 0.03 0.22 <0.01 0.25 <0.01 0.01 <0.01 <0.01
TP-1 vs. TP-2 0.89 0.27 0.95 0.13 0.06 0.52 0.11 0.13 0.09 0.011 CP = crude protein; NDF = neutral detergent fiber; ADF = acid detergent fiber; HEMI = hemicellulose; CELL = cellulose.2 DV = difference value (weighback concentration minus AF concentration).3 Each value is the mean of three samples.
Fermentation Characteristics, Nutritive Value, and Quality 19
Table 3.5. Chemical composition1 of feces from steers fed temperate and tropical corn silages, Year 1 (dry matter basis).
Cultivar CP NDF
Fiber Fractions
ADF HEMI CELL Lignin
———————— % ————————
Temperate corn (TM):
Pioneer 31G20 12.72 66.0 34.7 31.3 28.0 6.1
Tropical corn (TP):
Dekalb XL660 (TP-1) 11.1 69.9 37.2 32.7 28.8 7.7
Pioneer 3098 (TP-2) 10.3 71.4 41.3 30.2 30.2 8.3
Significance (P):
Treatment 0.07 0.01 0.01 0.13 0.17 <0.01
TM vs. TP 0.04 <0.01 0.01 0.89 0.15 <0.01
TP-1 vs. TP-2 0.34 0.13 0.02 0.06 0.25 0.071 CP = crude protein; NDF = neutral detergent fiber; ADF = acid detergent fiber; HEMI = hemicellulose; CELL = cellulose.2 Each value is the mean of three steers.
Table 3.6. Dry matter (DM) and fermentation characteristics of temperate and tropical corn silages, Year 2 (DM basis).
Cultivar DM pH
Alcohols Fatty Acids
Ethanol Methanol Acetic Propionic Lactic Butyric Isobutyric
% —————————————% —————————————
Temperate corn (TM)1:
Pioneer 31G20 32.1 3.9 0.63 0.03 1.29 0.01 3.78 0.02 <0.01
Tropical corn (TP)2 :
Dekalb XL660 (TP-1) 29.9 4.2 0.10 <0.01 1.49 <0.01 2.25 0.01 0.02
Pioneer 3098 (TP-2) 32.4 4.2 0.10 0.01 1.34 0.05 2.18 0.02 0.01
Significance (P):
Treatment 0.24 0.03 0.27 0.11 0.63 0.04 0.12 0.44 0.02
TM vs. TP 0.43 0.01 0.12 0.05 0.42 0.28 0.05 0.46 0.01
TP-1 vs. TP-2 0.13 0.46 0.99 0.61 0.50 0.02 0.92 0.31 0.09
1 Each value is the mean of four samples.2 Each value is the mean of three samples.

20 Annual Grasses Preserved as Silage:
Table 3.7. Dry matter (DM) intake (DMI), digestibilities and digestible intakes of DM and associated nutritive value1 of temperate and tropical corns preserved as silage, Year 2 (DM basis).
Cultivar DMI
Digestibilities Digestible Intakes
DM NDF ADF HEMI CELL DM NDF ADF HEMI CELL
lb/100 lb2 ———————% ———————- ————— lb/100 lb2 —————
Temperate corn (TM):
Pioneer 31G20 1.843 62.5 37.6 40.9 33.5 46.8 1.15 0.29 0.17 0.12 0.18
Tropical corn (TP) :
Dekalb XL660 (TP-1) 1.89 61.7 53.8 54.8 52.5 59.8 1.17 0.62 0.35 0.27 0.34
Pioneer 3098 (TP-2) 1.76 59.2 47.1 48.7 45.1 53.4 1.05 0.46 0.27 0.20 0.26
Significance (P):
Treatment 0.84 0.31 0.02 0.03 0.02 0.05 0.72 0.01 0.01 0.01 0.02
TM vs. TP 0.93 0.30 0.01 0.02 0.01 0.03 0.74 0.01 0.01 0.01 0.01
TP-1 vs. TP-2 0.57 0.25 0.16 0.16 0.17 0.16 0.48 0.08 0.09 0.06 0.08
MSD4 0.60 5.4 10.3 9.5 11.9 10.2 0.42 0.18 0.10 0.08 0.101 NDF = neutral detergent fiber; ADF = acid detergent fiber; HEMI = hemicellulose; CELL = cellulose.2 Body weight basis.3 Each value is the mean of four steers.4 MSD = minimum significant difference from the Waller-Duncan k-ratio (k = 100) t-test and can be used to compare any two treatments.
Table 3.8. In vitro dry matter disappearance (IVDMD) and associated nutritive value1 of as-fed (AF) temperate and tropical corn silages, Year 2 (dry matter basis).
Cultivar
IVDMD CP NDF Fiber Fractions
AF DV2 AF DV AF DV ADF HEMI CELL Lignin
———————————————- % ———————————————
Temperate corn (TM):
Pioneer 31G20 81.53 -2.3 7.7 -0.9 42.7 3.5 23.4 19.3 20.8 2.3
Tropical corn (TP) :
Dekalb XL660 (TP-1) 70.4 -3.4 6.5 -0.1 61.5 2.9 34.0 27.5 30.4 3.9
Pioneer 3098 (TP-2) 72.6 -8.1 7.4 -0.8 56.6 11.7 31.5 25.1 27.6 3.7
Significance (P):
Treatment <0.01 0.06 <0.01 0.25 <0.01 0.30 <0.01 <0.01 <0.01 <0.01
TM vs. TP <0.01 0.09 0.01 0.27 <0.01 0.48 <0.01 <0.01 <0.01 <0.01
TP-1 vs. TP-2 <0.01 0.06 <0.01 0.20 0.02 0.17 0.04 0.01 0.01 0.19
MSD4 1.0 5.1 0.5 1.3 3.5 15.3 2.2 1.4 1.8 0.41 CP = crude protein; NDF = neutral detergent fiber; ADF = acid detergent fiber; HEMI = hemicellulose; CELL = cellulose.2 DV = difference value (weighback concentration minus AF concentration).3 Each value is the mean of four samples.4 MSD = minimum significant difference from the Waller-Duncan k-ratio (k = 100) t-test and can be used to compare any two treatments.

Fermentation Characteristics, Nutritive Value, and Quality 21
Table 3.9. Chemical composition1 of feces from steers fed temperate and tropical corn silages, Year 2 (dry matter basis).
CultivarCP NDF
Fiber Fractions
ADF HEMI CELL Lignin
———————— % ————————
Temperate corn (TM):
Pioneer 31G20 11.22 69.6 36.4 33.2 29.6 6.1
Tropical corn (TP) :
Dekalb XL660 (TP-1) 9.8 70.0 37.2 32.9 29.5 7.1
Pioneer 3098 (TP-2) 9.9 70.3 37.7 32.7 30.0 7.4
Significance (P):
Treatment 0.01 0.70 0.12 0.51 0.79 0.03
TM vs. TP <0.01 0.46 0.06 0.30 0.80 0.01
TP-1 vs. TP-2 0.87 0.74 0.37 0.67 0.54 0.52
MSD3 0.9 2.5 1.4 1.2 2.1 0.91 CP = crude protein; NDF = neutral detergent fiber; ADF = acid detergent fiber; HEMI = hemicellulose; CELL = cellulose.2 Each value is the mean of four steers.3 MSD = minimum significant difference from the Waller-Duncan k-ratio (k = 100) t-test and can be used to compare any two treatments.
22 Annual Grasses Preserved as Silage:
Experiment 4. Tropical Corn Planted and Ensiled on Differing Dates: Steer Intake, Digestibility, and Preference
Plant composition and morphology at time of ensil-ing may alter fermentation characteristics and hence the quality of the silage. This in turn may alter the preference exhibited by animals. Our objective in this experiment was to determine the silage quality and any preference steers demonstrate for a tropical corn when planted and harvested at differing dates, compared with an adapted temperate corn used as a standard.
Materials and MethodsConventional field planting of an adapted temperate corn (Pioneer 3156) and plantings of a tropical corn (made in May and June and ensiled in September and October) provided the experimental silages. The following five silage treatments were evaluated for relative preference:
Temperate corn:1. Pioneer 3156 (Standard) planted April 20 and
ensiled August 16
Tropical corn—Pioneer X304C:2. Planted May 23 and ensiled September 83. Planted May 23 and ensiled September 224. Planted June 26 and ensiled September 255. Planted June 26 and ensiled October 18
Forage for the intake and digestion phase (Experiment 4A) was harvested with a conventional forage chopper and stored in upright experimental silos (Appendix GP-1) at the NC State University Forage Animal Metabolism Unit, Raleigh, NC. Forages for the preference phase (Experiment 4B) were ensiled in plastic buckets serving as miniature silos (Appendix GP-1). In the intake and digestion phase, 15 steers (mean weight = 588 ± 50 pounds) were used in a randomized complete block design with three steers per treatment. The steers were grouped by weight into three sets of five each and randomly assigned within group to each of the five silage treatments, which were conducted according to standard procedures (GP-2). Animals were fed an average of 13.3% in excess.
The preference phase (Experiment 4B) consisted of a series of eight 30-minute preference evaluations involving both two-treatment and three-treatment comparisons (Appendix GP-5). Each evaluation was conducted as a randomized complete block design with four steer (weight range of 1,000 to 1,400 pounds) replicates. The total dry matter in-take was determined, and the intake rate (grams/minute) calculated. All as-fed, weighback, and fe-cal samples were analyzed according to standard procedures (Appendix GP-6), and data were statisti-cally analyzed according to the experimental design (Appendix GP-7).
Results and DiscussionThe morphology and yield potential of the temperate and tropical cultivars used for dry matter intake and digestibility estimates indicate appreciable differences among the treatments (Table 4.1). As expected, the temperate corn had the greatest proportion of the whole plant dry matter as ear, regardless of when the tropical cultivar was planted and harvested. When the tropical cultivar was planted in June and harvested in October, it had the greater proportion of ear and the grain fraction (79.3%) was comparable to that of the temperate cultivar (84.2%). Greatest dry matter yield occurred for the tropical cultivar when planted in May and harvested in September (Table 4.1).
Experiment 4A (Intake and Digestion)At feeding, the dry matter of the temperate silage (ensiled in upright silos) was greatest at 43% with the other four treatments ranging between 21% and 30% (Table 4.2). However, all silages fermented well withpHmeasuresof≤4.2.Noteworthyinthesesilages was the general lack of propionic acid, as well as minimal concentrations of butyric acid and methanol.
Although fermentation characteristics differed among silages, steer dry matter intake and digestibil-ity of dry matter and neutral detergent fiber and its fractions were not altered by corn type or by plant-ing and harvesting dates (Table 4.3). The digestible intakes of neutral detergent fiber and its fractions did differ between temperate and tropical corn, with the temperate corn least for all fractions. The associated fecal composition also reflects differences between

Fermentation Characteristics, Nutritive Value, and Quality 23
temperate and tropical corn silages. Crude protein concentrations of feces from tropical corn were greater than those of feces from temperate corn, but the fiber and its fractions were lesser in feces from tropical corn (Table 4.4).
The as-fed silages varied in most constituents between the temperate corn silage and tropical corn silages with the temperate corn silage greater in nutritive value (Table 4.5). Within the tropical corn silages, the May planted silages were generally of lesser nutritive value than the June planted silages, whereas nutritive value was not altered by date of harvest. The difference values indicate that selective consumption may have occurred for the temperate corn, whereas little selectivity is evident for the tropi-cal corns (Table 4.5).
Characterization of the masticate, which repre-sents each animal’s diet, indicates similar particle size among all corn silages, but the temperate corn silage masticate was generally greater in nutritive value (Table 4.6). The noted exception is less crude pro-tein in temperate corn silage versus the tropical corn silages. Temperate corn silage had a similar propor-tion of the masticate dry matter as large and medium particle sizes, as did the tropical silages, but the tem-perate had a greater proportion of small particles. The nutritive value of the various particle-size classes also varied, both between temperate and tropical corn si-lages and among the tropical silages (Table 4.6).
Experiment 4B (Preference Phase)Although the dry matter of the silages used for pref-erence evaluation differed among the treatments, all ensiledwellwithpHmeasuresof≤3.9(Table4.7).Forage harvested in October generally had the great-est dry matter concentrations at feeding compared with the September harvest. Differences were evident for a number of the fermentation products. Most notable were the greater ethanol concentrations for the May-planted silage harvested in October and the greater lactic acid concentration in the June-planted silage harvested in September.
In all four preference evaluations that compared the temperate corn with the tropical corn, regard-less of the tropical corn treatment, the temperate
was greatly preferred (Table 4.8). Furthermore, no differences were noted between the tropical corns that could be related to their treatment in any of the comparisons.
Comparisons within the tropical corn silages revealed preference for the October-harvested for-age when planted in June versus May (Evaluation 6, Table 4.9) and when both were planted in June but harvested in October (Evaluation 8, Table 4.9).
Examination of the nutritive value of the five silages indicates that the temperate corn silage was superior (greater in vitro true dry matter disap-pearance and lesser in neutral detergent fiber and constituent fiber fractions) to the tropical corn regardless of planting or harvest date (Table 4.10). Within the tropical corn silage treatments, a plant-ing-date by harvest-date interaction was generally present for all variables, but this was mainly associat-ed with a magnitude shift and not to crossovers, and consequently of little concern (Table 4.10). The strik-ing difference within the tropical corn silages and their treatments was the greater nutritive value of the June-planted forage harvested in October compared with the other treatments. These differences in nutri-tive value are consistent with each silage’s relative rank in the preference evaluations.
Summary and Conclusion• Thetemperatecornsilageandthetropicalcorn
silages from four different treatments all were well preserved with desirable fermentation characteristics.
• Temperatecornsilagewasconsumedsimilarlyto the tropical corn silages, but temperate silage was strongly preferred when animals were given a choice over the tropical corn silages.
• Amongthetropicalcornsilages,cornplantedinJune and harvested in October was generally pre-ferred over May planting or September harvests. Silage quality, however, was similar among all silages.
• Silagesmadefromanyofthetreatmentsevaluat-ed can provide a useful feed source for ruminant production systems.

24 Annual Grasses Preserved as Silage:
Table 4.1. Morphology, height, and dry matter yield of temperate and tropical corn preserved as silage and fed in Experiments 4A (dry matter basis).
Silage Forage1 Ear1
Height2 Yield2
Leaf Stalk Tassel Husk Dead Ear Grain Cob————— % of Total Plant ————- — % of Ear — ft ton/ac
Temperate corn (TM):Pioneer 3156 4.9 26.2 0.4 8.8 4.0 55.7 84.2 15.8 10.2a 6.0b
Tropical corn (TP; Pioneer X304C):Planted May 23:
Harvested Sept. 8 19.1 56.4 1.8 9.8 3.7 9.2 40.7 59.3 9.0b 5.6b
Harvested Sept. 22 14.0 49.7 1.2 10.0 3.2 21.9 68.3 31.7 9.6a 7.8a
Planted June 26:Harvested Sept. 25 18.8 35.3 1.4 15.0 0.3 29.2 63.7 36.3 7.9c 4.4c
Harvested Oct. 18 12.3 30.5 0.9 9.3 2.6 44.4 79.3 20.7 8.5bc 4.3c
Significance (P):Treatment - - - - - - - - <0.01 <0.01MSD3 - - - - - - - - 0.70 0.9
1 Each value is the composite of 10 plants.2 Each value is the average of two sample strips and the mean of three replicates. Means with same
superscript are similar.3 MSD = minimum significant difference from the Waller-Duncan k-ratio (k = 100) t-test and can be used
to compare any two treatments.
Table 4.2. Dry matter (DM) at feeding and fermentation characteristics of temperate corn silage and tropical corn silages planted and harvested at different dates, Experiment 4A (DM basis).
SilageDM
pHAlcohols Fatty Acids
Ethanol Methanol Acetic Propionic Lactic Butyric% ———————————% ———————————
Temperate corn (TM): Pioneer 3156 43.51 4.2 0.19 - 0.70 - 2.41 0.01
Tropical corn (TP; Pioneer X304C):Planted May 23 (PM):
Harvested Sept. 8 (H1) 20.7 3.7 1.33 - 2.09 0.01 9.19 -Harvested Sept. 22 (H2) 22.6 3.8 1.25 - 1.74 - 7.61 -
Planted June 26 (PJ):Harvested Sept. 25 (H1) 22.2 3.7 1.22 0.02 1.81 - 8.00 -Harvested Oct. 18 (H2) 30.4 3.9 0.27 - 1.55 0.01 5.45 0.01
Significance (P):Treatment <0.01 <0.01 <0.01 <0.01 <0.01
TM vs. TP <0.01 <0.01 <0.01 <0.01 <0.01PM vs. PJ <0.01 0.39 0.01 0.13 0.01PM: H1 vs. H2 0.13 0.44 0.75 0.12 0.04PJ: H1 vs. H2 <0.01 0.03 <0.01 0.23 <0.01
MSD2 2.4 0.14 0.48 0.45 1.371 Each value is the mean of three replicate samples.2 MSD = minimum significant difference from the Waller-Duncan k-ratio (k = 100) t-test and can be used
to compare any two treatments.

Fermentation Characteristics, Nutritive Value, and Quality 25
Table 4.3. Dry matter (DM) intake (DMI), digestibilities and digestible intakes of DM and associated nutritive value1 of temperate corn silage and tropical corn silages planted and harvested on different dates, Experiment 4A (DM basis).
SilageDMI
Digestibilities Digestible Intakes
DM NDF ADF HEMI CELL DM NDF ADF HEMI CELL
lb/100 lb2 —————— %—————— ————— lb/100 lb2 —————
Temperate corn (TM) :
Pioneer 3156 1.803 67.0 42.7 42.0 43.0 48.6 1.21 0.29 0.14 0.15 0.15
Tropical corn (TP; Pioneer X304C):
Planted May 23 (PM):
Harvested Sept. 8 (H1) 1.79 60.9 54.9 57.0 52.1 62.2 1.09 0.62 0.37 0.25 0.35
Harvested Sept. 22 (H2) 1.80 60.7 52.2 54.1 49.5 57.4 1.09 0.56 0.33 0.23 0.29
Planted June 26 (PJ):
Harvested Sept. 25 (H1) 1.96 59.5 47.1 50.1 43.4 57.0 1.16 0.50 0.29 0.22 0.30
Harvested Oct. 18 (H2) 1.92 67.1 53.9 55.4 53.3 60.5 1.29 0.50 0.27 0.24 0.26
Significance (P):
Treatment 0.57 0.48 0.56 0.39 0.71 0.38 0.50 0.03 0.01 0.17 <0.01
TM vs. TP 0.53 0.27 0.19 0.08 0.38 0.08 0.63 <0.01 <0.01 0.02 <0.01
PM vs. PJ 0.15 0.53 0.61 0.62 0.65 0.83 0.16 0.17 0.04 0.64 0.07
PM: H1 vs. H2 0.94 0.97 0.75 0.72 0.77 0.50 0.95 0.49 0.40 0.58 0.08
PJ: H1 vs. H2 0.72 0.20 0.43 0.52 0.34 0.62 0.36 0.99 0.65 0.62 0.27
MSD4 0.37 15.3 23.3 21.7 25.6 18.9 0.35 0.19 0.10 0.10 0.071 NDF = neutral detergent fiber; ADF = acid detergent fiber; HEMI = hemicellulose; CELL = cellulose.2 Body weight basis.3 Each value is the mean of three steers.4 MSD = minimum significant difference from the Waller-Duncan k-ratio (k = 100) t-test and can be used to compare any
two treatments.

26 Annual Grasses Preserved as Silage:
Table 4.4. Chemical composition1 of feces from steers fed temperate corn silage and tropical corn silages planted and harvested on different dates, Experiment 4A (dry matter basis)
SilageCP NDF
Fiber Fractions
ADF HEMI CELL Lignin
———————— % ————————
Temperate corn (TM):
Pioneer 3156 15.42 64.3 31.8 32.5 25.5 5.0
Tropical corn (TP; Pioneer X304C):
Planted May 23 (PM):
Harvested Sept. 8 (H1) 12.3 70.5 38.3 32.2 30.3 6.6
Harvested Sept. 22 (H2) 12.0 70.7 37.9 32.7 29.7 6.6
Planted June 26 (PJ):
Harvested Sept. 25 (H1) 12.9 69.8 35.7 34.1 27.8 6.6
Harvested Oct. 18 (H2) 13.0 64.7 32.1 32.6 25.7 5.3
Significance (P):
Treatment 0.02 <0.01 <0.01 0.13 0.01 <0.01
TM vs. TP <0.01 <0.01 <0.01 0.47 0.01 <0.01
PM vs. PJ 0.20 0.01 <0.01 0.09 <0.01 0.03
PM: H1 vs. H2 0.68 0.93 0.71 0.46 0.60 0.87
PJ: H1 vs. H2 0.93 0.01 0.01 0.06 0.90 0.01
MSD3 2.0 3.2 2.1 1.7 2.7 0.81 CP = crude protein; NDF = neutral detergent fiber; ADF = acid detergent
fiber; HEMI = hemicellulose; CELL = cellulose.2 Each value is the mean of three steers.3 MSD = minimum significant difference from the Waller-Duncan k-ratio (k =
100) t-test and can be used to compare any two treatments.

Fermentation Characteristics, Nutritive Value, and Quality 27
Table 4.5. In vitro true dry matter disappearance (IVTD) and associated nutritive value1 of as-fed (AF) temper-ate corn silage and tropical corn silages planted and harvested on different dates, Experiment 4A (dry matter basis).
Silage
IVTD CP NDF Fiber fractions
AF DV2 AF DV AF DV ADF HEMI CELL Lignin
——————————————— % ———————————————-
Temperate corn (TM):
Pioneer 3156 81.13 -16.1 7.5 -1.2 42.7 28.7 21.5 21.2 19.5 1.4
Tropical corn (TP; Pioneer X304C):
Planted May 23 (PM):
Harvested Sept. 8 (H1) 70.6 2.2 9.3 2.9 62.6 -4.3 35.8 26.8 31.8 2.8
Harvested Sept. 22 (H2) 70.4 1.0 8.9 1.1 59.2 -1.4 33.5 25.6 28.4 2.6
Planted June 26 (PJ):
Harvested Sept. 25 (H1) 76.3 -1.6 9.7 1.0 54.3 0.4 29.3 24.9 26.7 1.9
Harvested Oct. 18 (H2) 76.1 1.8 8.5 0.8 48.7 -0.6 25.0 23.6 22.5 1.8
Significance (P):
Treatment <0.01 <0.01 <0.01 0.39 <0.01 <0.01 <0.01 <0.01 <0.01 <0.01
TM vs. TP <0.01 <0.01 <0.01 0.12 <0.01 <0.01 <0.01 <0.01 <0.01 <0.01
PM vs. PJ <0.01 0.39 0.79 0.44 <0.01 0.28 <0.01 0.01 <0.01 <0.01
PM: H1 vs. H2 0.91 0.63 0.26 0.37 0.26 0.42 0.33 0.21 0.09 0.5
PJ: H1 vs. H2 0.94 0.20 <0.01 0.92 0.09 0.76 0.09 0.17 0.05 0.81
MSD4 4.6 5.4 0.7 5.3 6.5 7.4 5.0 2.0 4.1 0.41 CP = crude protein; NDF = neutral detergent fiber; ADF = acid detergent fiber; HEMI = hemicellulose; CELL =
cellulose.2 DV = difference value (weighback concentration minus AF concentration).3 Each value is the mean of three samples.4 MSD = minimum significant difference from the Waller-Duncan k-ratio (k = 100) t-test and can be used to com-
pare any two treatments.

28 Annual Grasses Preserved as Silage:Ta
ble
4.6.
Who
le-m
astic
ate
dry
mat
ter (
DM
), m
edia
n pa
rtic
les
size
(MPS
), pa
rtic
le-s
ize
clas
ses1 a
nd a
ssoc
iate
d nu
triti
ve v
alue
2 of t
empe
rate
co
rn s
ilage
and
trop
ical
cor
n si
lage
s pl
ante
d an
d ha
rves
ted
on d
iffer
ent d
ates
, Exp
erim
ent 4
A (D
M b
asis
).
Sila
ge
Who
le M
astic
ate
Part
icle
-siz
e cl
asse
s
Larg
eM
ediu
mSm
all
DM
MPS
IVTD
CPN
DF
Prop
3IV
TDN
DF
Prop
IVTD
ND
FPr
opIV
TDN
DF
%m
m—
——
——
——
——
——
——
——
——
% —
——
——
——
——
——
——
——
——
-
Tem
pera
te c
orn
(TM
):
Pio
neer
315
6 20
.04
3.5
82.6
6.8
40.1
70.3
78.1
46.1
16.3
81.5
38.9
13.4
94.9
10.2
Trop
ical
cor
n (T
P; P
ione
er X
304C
):
Plan
ted
May
23
(PM
):
Har
vest
ed S
ept.
8 (H
1)10
.72.
972
.98.
061
.674
.671
.063
.819
.375
.257
.86.
179
.941
.6
Har
vest
ed S
ept.
22 (H
2)11
.63.
172
.87.
858
.670
.969
.363
.018
.674
.954
.810
.586
.032
.3
Plan
ted
June
26
(PJ)
:
Har
vest
ed S
ept.
25 (H
1)11
.73.
576
.38.
656
.176
.473
.960
.116
.178
.452
.07.
590
.027
.5
Har
vest
ed O
ct. 1
8 (H
2)15
.13.
378
.17.
648
.570
.374
.555
.119
.079
.944
.710
.791
.220
.0
Sign
ifica
nce
(P):
Trea
tmen
t<0
.01
0.26
<0.0
1<0
.01
<0.0
10.
16<0
.01
<0.0
10.
22<0
.01
<0.0
1<0
.01
<0.0
1<0
.01
TM v
s. TP
<0.0
10.
28<0
.01
<0.0
1<0
.01
0.24
<0.0
1<0
.01
0.18
<0.0
1<0
.01
<0.0
1<0
.01
<0.0
1
PM v
s. PJ
<0.0
10.
08<0
.01
0.09
<0.0
10.
77<0
.01
<0.0
10.
27<0
.01
<0.0
10.
53<0
.01
<0.0
1
PM: H
1 vs
. H2
0.04
0.53
0.92
0.42
0.01
0.23
0.02
0.39
0.72
0.62
0.01
0.02
0.03
<0.0
1
PJ: H
1 vs
. H2
<0.0
10.
460.
01<0
.01
<0.0
10.
050.
32<0
.01
0.11
0.03
<0.0
10.
090.
68<0
.01
MSD
50.
80.
71.
10.
32.
07.
41.
21.
74.
51.
12.
13.
75.
44.
31 L
arge
= >
1.7
mm
; med
ium
= ≤
1.7m
m a
nd >
0.5m
m; s
mal
l < 0
.5 m
m.
2 IV
TD =
in v
itro
true
dry
mat
ter d
isap
pear
ance
; CP
= cr
ude
prot
ein;
ND
F =
neut
ral d
eter
gent
fibe
r.3 Pr
op =
pro
port
ion
of d
ry m
atte
r.
4 Ea
ch v
alue
is th
e m
ean
of s
ix s
teer
s.5 M
SD =
min
imum
sig
nific
ant d
iffer
ence
from
the
Wal
ler-
Dun
can
k-ra
tio (k
= 1
00) t
-tes
t and
can
be
used
to c
ompa
re a
ny tw
o tr
eatm
ents
.

Fermentation Characteristics, Nutritive Value, and Quality 29
Table 4.7. Dry matter (DM) and fermentation characteristics of temperate corn silage and tropical corn silages planted and harvested on different dates and evaluated for preference, Experiment 4B (DM basis).
SilageDM
pH
Alcohols Fatty Acids
Ethanol Methanol Acetic Propionic Lactic Butyric Isobutyric
% ————————————— % —————————————
Temperate corn (TM):
Pioneer 3156 34.61 3.82 2.562 0.022 1.302 0.052 5.252 0.052 0.022
Tropical corn (TP; Pioneer X304C):
Planted May 23 (PM):
Harvested Sept. 8 (H1) 26.3 3.8 2.63 0.04 1.92 0.04 6.61 0.02 0.03
Harvested Sept. 22 (H2) 35.5 3.8 4.19 0.02 1.25 0.08 5.68 0.01 0.02
Planted June 26 (PJ):
Harvested Sept. 25 (H1) 19.8 3.7 2.72 0.52 2.31 0.04 8.79 0.01 0.05
Harvested Oct. 18 (H2) 35.2 3.9 0.70 0.02 1.43 0.01 5.11 0.01 0.01
Significance (P):
Treatment - 0.01 <0.01 0.01 <0.01 <0.01 <0.01 0.03 0.27
TM vs. TP - 0.14 0.98 0.01 <0.01 0.17 <0.01 <0.01 0.90
PM vs. PJ - 0.01 <0.01 0.03 0.01 <0.01 0.03 0.47 0.78
PM: H1 vs. H2 - 0.02 0.24 <0.01 <0.01 0.20 <0.01 0.38 0.06
Interaction - 0.68 <0.01 0.06 0.27 <0.01 <0.01 0.95 0.221 Values for DM are the composite of four samples (replicates). 2Values are the mean of four samples.
30 Annual Grasses Preserved as Silage:Ta
ble
4.8.
Pre
fere
nce
eval
uatio
ns1 c
ompa
ring
tem
pera
te c
orn
sila
ge a
nd v
ario
us tr
opic
al c
orn
sila
ges
plan
ted
and
harv
este
d on
diff
eren
t dat
es,
Expe
rim
ent 4
B (d
ry m
atte
r bas
is).
Sila
geEv
alua
tion
1Ev
alua
tion
2Ev
alua
tion
3Ev
alua
tion
4D
MI2
Tim
eRa
teD
MI
Tim
eRa
teD
MI
Tim
eRa
teD
MI
Tim
eRa
teg
min
g/m
ing
min
g/m
ing
min
g/m
ing
min
g/m
inTe
mpe
rate
cor
n (T
M):
Pio
neer
315
6 97
0a12
.1a
87.8
a1,
015a
10.9
a10
4ab1,
136a
12.6
a93
.5a
1,05
3a11
.6a
101.
5a
Trop
ical
cor
n (T
P; P
ione
er X
304C
):Pl
ante
d M
ay 2
3 (P
M):
Har
vest
ed S
ept.
8 (H
1)11
1b1.
5b14
4a20
b0.
4b29
a
Har
vest
ed S
ept.
22 (H
2)44
b0.
5b34
b89
b1.
0b13
7a
Plan
ted
June
26
(PJ)
:H
arve
sted
Sep
t. 25
(H1)
119b
0.5b
56a
5b0.
1b20
.5a
Har
vest
ed O
ct. 1
8 (H
2)22
0b1.
4b16
8a26
b0.
2b32
.6a
Sign
ifica
nce
(P):
Trea
tmen
t<0
.01
<0.0
10.
19<0
.01
<0.0
10.
07<0
.01
<0.0
10.
51<0
.01
<0.0
10.
14M
SD3
294
4.9
113
228
3.9
115
319
4.8
242
185
3.3
91 Ea
ch v
alue
is th
e m
ean
of fo
ur s
teer
s. M
eans
with
sam
e su
pers
crip
t are
sim
ilar.
2 D
MI =
dry
mat
ter i
ntak
e.3 M
SD =
min
imum
sig
nific
ant d
iffer
ence
from
the
Wal
ler-
Dun
can
k-ra
tio (k
= 1
00) t
-tes
t and
can
be
used
to c
ompa
re a
ny tw
o tr
eatm
ents
Tabl
e 4.
9. P
refe
renc
e ev
alua
tions
com
pari
ng tw
o si
lage
s at
a ti
me
of a
trop
ical
cor
n pl
ante
d an
d ha
rves
ted
on d
iffer
ent d
ates
, Exp
erim
ent 4
B (d
ry
mat
ter b
asis
).
Sila
ge1
Eval
uatio
n 5
Eval
uatio
n 6
Eval
uatio
n 7
Eval
uatio
n 8
DM
I2Ti
me
Rate
DM
ITi
me
Rate
DM
ITi
me
Rate
DM
ITi
me
Rate
gm
ing/
min
gm
ing/
min
gm
ing/
min
gm
ing/
min
Plan
ted
May
23
(PM
):H
arve
sted
Sep
t. 8
(H1)
6093
8.4
115.
766
18.
798
.6H
arve
sted
Sep
t. 22
(H2)
319
4.7
100.
557
78.
893
.3Pl
ante
d Ju
ne 2
6 (P
J):
Har
vest
ed S
ept.
25 (H
1)18
31.
376
.845
0.6
37.8
Har
vest
ed O
ct. 1
8 (H
2)83
69.
411
611
3514
.481
.7Si
gnifi
canc
e (P
):Tr
eatm
ent
0.21
0.12
0.19
0.03
0.12
0.12
0.73
0.98
0.87
<0.0
1<0
.08
0.12
1 Pi
onee
r X30
4C.
2 DM
I = d
ry m
atte
r int
ake.
3 Ea
ch v
alue
is th
e m
ean
of fo
ur s
teer
s.

Fermentation Characteristics, Nutritive Value, and Quality 31
Table 4.10. In vitro true dry matter disappearance (IVTD) and nutritive value1 of temperate and tropical silages fed in eight preference evaluations, Experiment 4B (dry matter basi
SilageIVTD CP NDF
Fiber Fractions
ADF HEMI CELL Lignin
——————————— % ——————————-
Temperate corn (TM):
Pioneer 3156 83.12 8.2 40.1 20.1 18.0 16.6 3.1
Tropical corn (TP; Pioneer X304C):
Planted May 23 (PM):
Harvested Sept. 8 (H1) 72.5 9.2 51.9 33.1 23.1 26.1 6.1
Harvested Sept. 22 (H2) 73.8 10.3 50.3 30.6 21.5 23.7 6.1
Planted June 26 (PJ):
Harvested Sept. 25 (H1) 68.1 9.1 62.5 40.1 23.9 32.2 6.9
Harvested Oct. 18 (H2) 77.7 7.3 46.9 26.9 19.9 21.2 5.1
Significance (P):
Treatment <0.01 <0.01 <0.01 <0.01 <0.01 <0.01 <0.01
TM vs. TP <0.01 0.01 <0.01 <0.01 <0.01 <0.01 <0.01
PM vs. PJ 0.81 <0.01 <0.01 0.02 0.67 0.01 0.34
PM: H1 vs. H2 <0.01 0.13 <0.01 <0.01 0.01 <0.01 <0.01
Interaction <0.01 <0.01 <0.01 <0.01 0.17 <0.01 <0.011 CP = crude protein; NDF = neutral detergent fiber; ADF = acid detergent fiber; HEMI = hemicellulose;
CELL = cellulose.2 Each value is the mean of four samples.

32 Annual Grasses Preserved as Silage:
Experiment 5. Temperate and Tropical Corn Compared with Forage-type Sorghums when Preserved as Silage: Ensiling Characteristics, Nutritive Value, and Quality
Although corn has generally been the preferred annual forage for conservation as silage, forage sor-ghum also has great potential in the Southeast. One major advantage of sorghums is their adaptation to withstand periods of drought and still produce desir-able dry matter yields of acceptable forage quality. Our objective in this experiment was to compare silages from both temperate and tropical corn with silage from an intermediate normal forage sorghum and a forage sorghum selected for greater sugar concentration.
Materials and MethodsConventional planting practices were used to establish stands of two corn cultivars and two forage-sorghum cultivars as designated below:
Corn:1. Temperate corn silage—Pioneer 31562. Tropical corn silage—Pioneer X304C
Forage sorghum:3. Intermediate, normal sorghum silage—Pioneer
841F4. Sweeter sorghum silage—Brandies
The four cultivars were planted in adjacent fields, side dressed with 100 pounds of nitrogen per acre, cut for silage at the hard-dough (dent) stage with a conventional field chopper, and ensiled in upright experimental silos (Appendix GP-1). The experi-mental silos were not disturbed for at least 60 days so fermentation could proceed to completion.
The experimental silages were evaluated for dry matter intake and digestibility (Experiment 5A) and masticate characteristics (Experiment 5B). Steers were used in a randomized complete block design in both experiments with three steers (replicates) per treatment in the intake and digestion experiment and six steers per treatment in the mastication experi-ment (Appendix GP-2 and GP-3). In the intake and
digestion experiment, steers (mean weight = 619 ± 73 pounds) were fed at 12.8% excess.
All as-fed, weighback, masticate, and fecal samples were analyzed according to standard procedures (Appendix GP-6), and the data were statistically analyzed according to the experimental design (Appendix GP-7).
Results and DiscussionTropical corn had the greatest height and conse-quently greatest dry matter yield compared with the other forages (Table 5.1). The two sorghums yielded similarly and least compared with corn. The silages differed in dry matter concentration, with the corn silage dry matter being greater than that of the sor-ghums (Table 5.1). However, the pH measures of all silages were 3.9 or less, indicating acceptable fermen-tation. Some differences were noted between corn and sorghum silages and cultivars within each, but silages of all cultivars were dominated by acetic and lactic acid production (Table 5.1). Isobutyric was de-tected, but concentrations were less than 0.007% and were ignored.
Experiment 5A Steers consumed corn and sorghum silages simi-larly, averaging 1.83 pounds per 100 pounds of body weight (Table 5.2). However, within the forage sorghums, steers consumed normal forage sorghum silage greater than sweeter forage sorghum silage. Steers, on average, digested corn and forage sorghum silages similarly (mean = 62.4%), but digested tem-perate corn silage greater than tropical corn silage and sweet forage sorghum silage greater than normal forage sorghum silage (Table 5.2). The neutral deter-gent fiber and its fiber fractions were more digestible in silages of forage sorghum than in silages of corn. Within the corn silages, these fractions were more digestible in tropical corn than in temperate corn, whereas the two sorghum silages were generally similar. These same relationships were also present for the digestible intakes.
The in vitro true dry matter disappearance of the as-fed silages was similar between corn and sorghum silages. Temperate corn silage, however, was of great-

Fermentation Characteristics, Nutritive Value, and Quality 33
er nutritive value than sorghum silage. Within the corn silages, temperate silage was generally superior in nutritive value than tropical silage. And within the sorghum silages, the sweeter cultivar was generally superior to the normal.
The differences in how steers digested silages—be-tween corn and forage sorghum, between temperate and tropical corn, and between normal and sweeter forage sorghum—is evident in fecal composition (Table 5.4).
Experiment 5B.Masticate of the silages revealed that upon ingestion, steers incorporated saliva similarly for both corn and sorghum silages as dry matter concentrations of the whole masticates were similar (Table 5.5). Within the corn silages, however, dry matter concentration was greater for temperate corn than for tropical corn si-lage. Median particle size was greater for corn silages than for sorghum silages, and the normal sorghum silage was chewed more than the sweeter sorghum silage.
The nutritive value of the masticated silages differed only in crude protein between corn and sorghum silages, with forage sorghum silage being greatest in crude protein. However, silages of culti-vars within the corn and sorghum classes generally differed in crude protein and neutral detergent fiber.
Further, the proportion of the whole-masticates dry matter that consisted of large- and medium-size particles differed between corn and sorghum silages, whereas the proportion of smaller particles was simi-lar. The distribution of masticate dry matter across sieve sizes is presented for each silage in Figure 5.1. Associated with the difference in particle size among cultivar silages were also nutritive value differences (Table 5.4). Although numerous differences oc-curred, in many cases these were small and probably of limited biological importance.
Summary and Conclusion• Bothcornsilagesandforagesorghumsilages
preserved well with pH measures of 3.9 or less and with acetic and lactic acids dominating.
• Steersconsumedbothcornandforagesorghumsilages similarly, averaging 1.83 pounds of dry matter per 100 pounds of body weight.
• Drymatterdigestibilitiesofcornandforagesorghum silages were similar at 62%, but tropi-cal corn was digested lesser than temperate corn even though digestible intakes were similar.
• Thecriteriaforselectingeithercornorforagesorghum for preservation as silage may need to be based as much on adaptation to the environ-ment for acceptable dry matter production as it is based on forage quality.
Figure 5.1. Particle size distribution of masticate dry matter of corn and sorghum silages (temperate corn = Pioneer 3156; tropical corn = Pioneer X304C; normal sorghum = Pioneer 841F; sweeter sorghum = Brandies).
34 Annual Grasses Preserved as Silage:
Table 5.1. Dry matter (DM) yield and fermentation characteristics of ensiled corn and forage sorghum, Experiments 5A and 5B (DM basis).
Silage1Height Yield DM
pH
Alcohols Fatty Acids
Ethanol Methanol Acetic Propionic Lactic
ft ton/ac % ——————————- % —————————-
Corn (CN):
Temperate (TM) 8.72 6.542 29.53 3.73 2.143 0.033 1.273 0.043 5.613
Tropical (TP) 12.2 8.61 24.9 3.9 0.61 0.03 1.53 0.00 7.06
Forage Sorghum (FS):
Normal (NS) 4.9 3.79 24.9 3.8 0.94 0.04 1.26 0.01 8.13
Sweeter (SS) 7.5 4.59 27.3 3.9 1.09 0.03 2.58 0.01 5.60
Significance (P):
Treatment <0.01 <0.01 0.01 0.12 <0.01 0.05 <0.01 <0.01 0.01
CN vs. FS <0.01 <0.01 <0.01 0.05 <0.01 0.85 0.02 <0.01 0.04
TM vs. TP <0.01 <0.01 0.13 0.49 <0.01 0.01 <0.01 0.04 0.22
NS vs. SS <0.01 0.18 0.04 0.21 0.12 0.25 <0.01 0.59 <0.011 Temperate = Pioneer 3156; Tropical = Pioneer X304C; Normal = Intermediate Pioneer 841F; Sweeter = Brandies. 2 Each value is the mean of six harvest strips.3 Each value is the mean of three replicate samples.
Table 5.2. Dry matter (DM) intake (DMI), digestibilities, and digestible intakes of DM and associated nutritive value1 of corn and forage sorghum preserved as silage, Experiment 5A (DM basis).
Silage2DMI
Digestibilities Digestible Intakes
DM NDF ADF HEMI CELL DM NDF ADF HEMI CELL
lb/100 lb3 ——————— % ——————— ——————— lb/100 lb3—————
Corn (CN):
Temperate (TM) 1.994 64.0 20.8 16.7 23.5 24.8 1.27 0.13 0.06 0.07 0.07
Tropical (TP) 1.76 59.8 47.1 46.4 47.9 52.5 1.06 0.45 0.27 0.18 0.25
Forage Sorghum (FS):
Normal (NS) 2.06 61.4 49.1 49.6 48.2 57.5 1.26 0.50 0.31 0.19 0.29
Sweeter (SS) 1.50 64.5 53.2 55.5 49.7 62.3 0.97 0.43 0.27 0.16 0.25
Significance (P):
Treatment 0.16 0.02 <0.01 <0.01 0.03 <0.01 0.21 <0.01 <0.01 0.01 <0.01
CN vs. FS 0.57 0.23 <0.01 <0.01 0.04 <0.01 0.66 <0.01 <0.01 0.03 <0.01
TM vs. TP 0.35 0.01 <0.01 <0.01 0.02 <0.01 0.20 <0.01 <0.01 <0.01 <0.01
NS vs. SS 0.05 0.04 0.32 0.08 0.85 0.05 0.10 0.09 0.12 0.24 0.091 NDF = neutral detergent fiber; ADF = acid detergent fiber; HEMI = hemicellulose; CELL = cellulose.2 Temperate = Pioneer 3156; Tropical = Pioneer X304C; Normal = Intermediate Pioneer 841F; Sweeter = Brandies.3 Body weight basis.4 Each value is the mean of three steers.
Fermentation Characteristics, Nutritive Value, and Quality 35
Table 5.3. In vitro true dry matter disappearance (IVTD) and associated nutritive value1 of as-fed (AF) corn and forage sorghum preserved as silage, Experiment 5A (dry matter basis).
Silage2
IVTD CP NDF Fiber fractions
AF DV3 AF DV AF DV ADF HEMI CELL Lignin
————————————————— % -—————————————————
Corn (CN):
Temperate (TM) 79.84 -0.9 9.0 -1.0 33.3 2.7 18.3 15.0 15.2 2.8
Tropical (TP) 71.6 -0.4 7.3 -0.3 54.8 3.0 33.2 21.5 26.9 5.6
Forage Sorghum (FS):
Normal (NS) 74.1 0.9 11.8 -0.7 49.7 0.1 30.6 19.1 24.3 5.2
Sweeter (SS) 76.6 -1.7 6.0 -0.2 54.3 1.5 32.9 21.4 26.5 5.0
Significance (P):
Treatment 0.02 0.96 <0.01 0.16 <0.01 0.96 <0.01 <0.01 <0.01 <0.01
CN vs. FS 0.78 0.93 <0.01 0.39 <0.01 0.93 <0.01 <0.01 <0.01 <0.01
TM vs. TP <0.01 0.93 <0.01 0.08 <0.01 0.93 <0.01 <0.01 <0.01 <0.01
NS vs. SS 0.21 0.63 <0.01 0.19 <0.01 0.63 0.06 0.01 0.03 0.321 CP = crude protein; NDF = neutral detergent fiber; ADF = acid detergent fiber; HEMI = hemicellulose; CELL = cellulose.2 Temperate = Pioneer 3156; Tropical = Pioneer X304C; Normal = Intermediate Pioneer 841F; Sweeter = Brandies.3 DV = difference value (weighback concentration minus AF concentration).4 Each value is the mean of three samples.
Table 5.4. Chemical composition1 of feces from steers fed corn and forage sorghum preserved as silage, Experiment 5A (dry matter basis).
Silage2CP NDF
Fiber Fractions
ADF HEMI CELL Lignin
—————————— % ——————————
Corn (CN):
Temperate (TM) 12.83 71.0 38.6 32.4 29.4 7.9
Tropical (TP) 9.9 72.9 43.1 29.9 31.2 10.3
Forage Sorghum (FS):
Normal (NS) 13.1 64.8 39.4 25.5 26.4 10.3
Sweeter (SS) 11.2 70.2 39.9 30.3 27.5 9.4
Significance (P):
Treatment <0.01 <0.01 0.02 <0.01 <0.01 0.01
CN vs. FS 0.04 <0.01 0.14 <0.01 <0.01 0.11
TM vs. TP <0.01 0.09 <0.01 0.01 0.03 0.01
NS vs. SS 0.01 <0.01 0.60 <0.01 0.14 0.181 CP = crude protein; NDF = neutral detergent fiber; ADF = acid detergent
fiber; HEMI = hemicellulose; CELL = cellulose.2 Temperate = Pioneer 3156; Tropical = Pioneer X304C; Normal = Intermedi-
ate Pioneer 841F; Sweeter = Brandies. 3 Each value is the mean of three steers.

36 Annual Grasses Preserved as Silage:Ta
ble
5.5.
Who
le-m
astic
ate
dry
mat
ter (
DM
), m
edia
n pa
rtic
les
size
(MPS
), pa
rtic
le-s
ize
clas
ses1 a
nd a
ssoc
iate
d nu
triti
ve v
alue
2 of c
orn
and
fora
ge
sorg
hum
pre
serv
ed a
s si
lage
, Exp
erim
ent 5
B (D
M b
asis
).
Sila
ge3
Who
le M
astic
ate
Part
icle
-siz
e cl
asse
s
Larg
eM
ediu
mSm
all
DM
MPS
IVTD
CPN
DF
Prop
4IV
TDN
DF
Prop
IVTD
ND
FPr
opIV
TDN
DF
%m
m—
——
——
——
——
——
——
——
——
——
——
% —
——
——
——
——
——
——
——
——
——
—
Corn
(CN
):
Tem
pera
te (T
M)
16.0
53.
581
.27.
936
.377
.278
.843
.812
.282
.834
.110
.793
.413
.6
Trop
ical
(TP)
12.4
3.3
71.3
6.3
56.6
77.1
69.6
59.6
15.7
74.6
49.3
7.2
86.5
25.9
Fora
ge S
orgh
um (F
S):
Nor
mal
(NS)
13.8
2.3
75.1
10.0
47.5
67.5
73.8
49.4
22.9
74.9
46.7
9.6
85.6
25.7
Swee
ter (
SS)
14.7
2.7
77.8
5.8
51.9
73.9
75.1
55.4
19.6
78.4
47.1
6.5
85.3
29.9
Sign
ifica
nce
(P):
Trea
tmen
t<0
.01
<0.0
1<0
.01
<0.0
1<0
.01
<0.0
1<0
.01
<0.0
1<0
.01
<0.0
1<0
.01
<0.0
1<0
.01
<0.0
1
CN v
s. FS
0.97
<0.0
10.
840.
010.
21<0
.01
0.66
0.33
<0.0
1<0
.01
<0.0
10.
25<0
.01
<0.0
1
TM v
s. TP
<0.0
10.
25<0
.01
<0.0
1<0
.01
0.96
<0.0
1<0
.01
0.01
<0.0
1<0
.01
0.01
<0.0
1<0
.01
NS
vs. S
S0.
120.
040.
06<0
.01
0.04
0.01
0.08
<0.0
10.
01<0
.01
0.72
0.01
0.76
0.06
1 Lar
ge =
> 1
.7m
m; m
ediu
m =
≤1.
7mm
and
>0.
5mm
; sm
all <
0.5
mm
.2
IVTD
= in
vitr
o tr
ue d
ry m
atte
r dis
appe
aran
ce; C
P =
crud
e pr
otei
n; N
DF
= ne
utra
l det
erge
nt fi
ber.
3 Te
mpe
rate
= P
ione
er 3
156;
Tro
pica
l = P
ione
er X
304C
; Nor
mal
= In
term
edia
te P
ione
er 8
41F;
Sw
eete
r = B
rand
ies.
4 Pr
op =
pro
port
ion
of d
ry m
atte
r.
5 Ea
ch v
alue
is th
e m
ean
of s
ix s
teer
s.

Fermentation Characteristics, Nutritive Value, and Quality 37
Section II. Cool-Season Annuals
Winter annual forages provide the opportunity to double crop our land resources. Summer annu-als, such as corn or sorghum, can be planted in the spring and followed by winter annuals seeded after the harvest of the annual summer crop. This system requires, however, that the winter annual crop be harvested early enough in the spring to permit plan-ning of the subsequent summer annual crop. This generally is most easily accomplished if the winter annual crop can be removed and preserved as silage.
Experiment 6. Barley and Triticale Preserved as Silage: Ensiling Characteristics, Nutritive Value, and Quality
Our objective in this experiment was to evaluate and compare the ensiling potential, nutritive value, and quality of barley and triticale when preserved as silage.
Materials and MethodsUniform stands of Starling barley and the hybrid triticale 498 provided the experimental forages which were evaluated in each of two years. The stands were established each year in the fall following normal planting practice. Both forages were top-dressed each year in early February with 70 pounds of nitrogen per acre. The forages were harvested by mid-April with a conventional field chopper set to leave a 3-inch stubble. The chopped forage was blown into a self-unloading wagon and transported to the NC State University Forage Animal Metabolism Unit, Raleigh, NC, where it was packed into upright ex-perimental silos according to standard procedures (Appendix GP-1).
The barley and triticale ensiled the spring of each year was evaluated that following fall for intake and digestibility (Appendix GP-2). Steers were used in a randomized complete block design to evaluate the silages each year. In Year 1, six steers (mean weight = 504 ± 39 pounds) were used and fed at an average of 13.8% in excess. In Year 2, eight steers (mean weight
= 501 ± 47.6 pounds) were used and fed at an aver-age of 13.1 % in excess.
All as-fed, weighback, and fecal samples were analyzed according to normal procedure (Appendix GP-6), and the data were statistically analyzed ac-cording to the experimental design (Appendix GP-7).
Results and DiscussionFermentation CharacteristicsThe dry matter of the forages at ensiling differed in Year 1 with barley being least (Table 6.1). The pH measures of the Year 1 silages were similar, but the triticale silage was generally least in alcohol and fatty acid concentrations. These differences in alcohol and fatty acid concentrations were not noted in Year 2, in which dry matter at ensiling was similar at 29.3% and, consequently, other variables were also similar. The differences noted in Year 1 appear to be related to the greater dry matter of triticale at ensiling.
Intake and DigestibilityIn Year 1, steers consumed the barley and triticale similarly (2.21 pounds per 100 pounds of body weight), but digested barley greater (P = 0.01) than triticale (Table 6.2). Digestibility of neutral detergent fiber (NDF), acid detergent fiber (ADF), and cellu-lose (CELL) was also greater in barley than triticale. Digestible intakes, however, were not altered. In Year 2, intakes by steers were similar (1.87 pounds per 100 pounds of body weight), as noted in Year 1, but aver-aged lower. Also, steers digested dry matter similarly in Year 2 with greater digestibility for triticale noted for NDF, hemicellulose (HEMI), and CELL, and gen-erally opposite that reported in Year 1.
Fecal composition between the silages was gener-ally similar in both years. Some differences occurred, but these differences were rather small and probably of little biological importance (Table 6.3).
Examination of the as-fed silages revealed little differences in nutritive value between barley and triticale in Year 1, whereas in Year 2, barley was gen-

38 Annual Grasses Preserved as Silage:
erally of greater nutritive value than triticale (Table 6.4). Difference value (weighback concentration mi-nus as-fed concentration) for in vitro true dry matter disappearance, crude protein, and neutral detergent fiber indicated that some selective consumption may have occurred, but no differences were noted be-tween small grain species in either year (Table 6.4).
Summary and Conclusions• BarleyandtriticaleensiledwellwithpHmea-
sures of the fermented silages of 4.3 or less.
Table 6.1. Ensiling characteristics of barley and triticale silages (dry matter basis).
SilageDM1
pHAlcohols Fatty Acids
Ethanol Methanol Acetic Propionic Lactic Butyric Isobutyric% —————————————— % ——————————————
Year 12:Barley 30.0 4.3 0.55 0.018 3.28 0.46 4.41 0.54 0.010Triticale 46.4 4.2 0.09 0.007 0.94 0.02 3.41 0.02 0.007
Significance (P): <0.01 0.25 <0.01 0.05 <0.01 <0.01 0.13 <0.01 0.63Year 23:
Barley 29.3 3.7 1.21 0.037 2.15 0.07 8.92 0.10 0.004Triticale 29.7 3.8 1.03 0.029 2.37 0.07 8.73 0.10 0.013
Significance (P): 0.43 0.48 0.66 0.08 0.16 0.10 0.70 0.55 0.131 DM = dry matter 2 Each value is the mean of three replicate samples.3 Value for DM is the mean of four samples, and the other values are the mean of three samples.
Table 6.2. Dry matter (DM) intake (DMI), digestibilities, and digestible intakes of DM and associated nutritive value1 of barley and triticale silages (DM basis).
SilageDMI
Digestibilities Digestible IntakesDM NDF ADF HEMI CELL DM NDF ADF HEMI CELL
lb/100 lb2 ———————— % ——————— ——————- lb/100 lb2 —————Year 13:
Barley 2.30 69.4 58.1 58.3 57.9 64.9 1.59 0.73 0.44 0.28 0.42Triticale 2.12 60.6 48.0 46.9 49.5 54.3 1.29 0.55 0.32 0.23 0.32
Significance (P): 0.68 0.01 0.01 0.03 0.06 0.01 0.33 0.27 0.20 0.40 0.27Year 24:
Barley 2.10 65.1 55.3 56.4 53.9 64.3 1.40 0.62 0.36 0.26 0.35Triticale 1.65 66.3 64.0 64.2 63.8 72.5 1.06 0.59 0.36 0.23 0.35
Significance (P): 0.09 0.44 0.02 0.10 0.01 0.01 0.05 0.61 0.91 0.32 0.931 NDF = neutral detergent fiber; ADF = acid detergent fiber; HEMI = hemicellulose; CELL = cellulose.2 Body weight basis.3 Each value is the mean of three steers.4 Values for DMI are the mean of four steers and the other values the mean of three steers.
• Drymatterintakesofthetwosilagesweregener-ally similar, with dry matter digestibility greater for barley in Year 2 but similar to triticale in Year 1.
• Digestibleintakesofdrymatterandnutritivevalue constituents were generally similar be-tween the two silages.
• Barleyandtriticale,bothwinterannualgrasses,can be ensiled and serve as a feed source in ru-minant production systems.

Fermentation Characteristics, Nutritive Value, and Quality 39
Table 6.3. Chemical composition1 of feces from steers fed barley and triticale silages (dry matter basis).
SilageCP NDF
Fiber Fractions
ADF HEMI CELL Lignin
—————————— % ——————————
Year 12:
Barley 8.7 71.1 42.2 28.9 30.5 10.5
Triticale 9.4 69.4 41.2 28.2 30.6 9.5
Significance (P): 0.13 0.04 0.11 0.16 0.87 0.02
Year 23:
Barley 9.9 70.7 39.4 31.3 27.7 10.6
Triticale 10.2 69.1 41.3 27.8 27.3 12.3
Significance (P): 0.68 0.24 0.11 0.03 0.49 <0.011 CP = crude protein; NDF = neutral detergent fiber; ADF = acid detergent fiber;
HEMI = hemicellulose; CELL = cellulose.2 Each value is the mean of three steers.3 Each value is the mean of four steers.
Table 6.4. In vitro true dry matter disappearance (IVTD) and associated nutritive value1 of as-fed (AF) barley and triticale silages (dry matter basis).
Silage
IVTD CP NDF Fiber fractions
AF DV2 AF DV AF DV ADF HEMI CELL Lignin
—————————————————— % ——————————————————
Year 13:
Barley 68.0 0.8 9.6 -0.6 54.3 -0.7 33.0 21.3 28.1 4.6
Triticale 69.3 -1.3 8.5 -0.3 54.6 2.7 32.6 21.9 28.0 4.4
Significance (P): 0.29 0.63 0.04 0.34 0.89 0.55 0.77 0.39 0.94 0.24
Year 24:
Barley 73.3 -2.1 8.7 -1.2 53.7 4.5 30.9 22.8 26.3 4.1
Triticale 68.8 -3.1 10.7 -1.5 59.7 5.1 36.2 23.5 31.2 4.7
Significance (P): 0.01 0.75 <0.01 0.72 <0.01 0.87 <0.01 0.03 <0.01 0.021 CP = crude protein; NDF = neutral detergent fiber; ADF = acid detergent fiber; HEMI = hemicellulose; CELL = cellulose.2 DV = difference value (weighback concentration minus AF concentration).3 Each value is the mean of three samples.4 Each value is the mean of four samples.

40 Annual Grasses Preserved as Silage:
Experiment 7. Ensiled Small Grain Following Tropical Corn at Two Planting Rates: Fermentation Characteristics and Nutritive Value
In double cropping systems, carryover effects from the previous crop can influence the subsequent crop. This influence could take the form of altered growth, which can alter dry matter yield and its associated nutritive value. Our objective in this experiment was to examine fermentation products and the nutri-tive value of a barley and a triticale silage following a corn crop that was planted at two populations: 15,000 and 30,000 plants per acre.
Materials and MethodsFollowing harvest of the corn crop, barley and triti-cale were seeded in three replicates the same fall following standard procedures (Appendix GP-1). This planting provided the experimental forages and was repeated a second year. Both forages were top-dressed each year with 70 pounds of nitrogen per acre. The forages were harvested by early May from the three replicates. A strip 3 feet wide by 40 feet long was cut to a 3-inch stubble, passed through a conven-tional field chopper, and ensiled in miniature silos (Appendix GP-1).
At opening, each miniature silo was emptied, mixed, and sampled, and the samples were ana-lyzed for fermentation products and nutritive value constituents according to standard procedures (Appendix GP-6). The data were statistically analyzed as a randomized complete block design (Appendix GP-7).
Results and DiscussionDry matter concentrations in Year 1 differed among treatments as did pH and concentrations of metha-nol, propionic, lactic, butyric, and isobutyric acids (Table 7.1). Most of the differences, however, were between species (barley and triticale), with differ-ences within species (between cultivars or corn plant populations) generally lacking. All silages were well preservedwithpHmeasuresof≤4.9forbarleyand≤4.4 for triticale.
The nutritive value of the small grains also differed as noted for each variable (Table 7.2). As reported
for fermentation characteristics, the differences were essentially all associated with small grain species. Barley was greater in in vitro true dry matter dis-appearance and crude protein and least in neutral detergent fiber and its constituent fiber fractions. Differences were generally lacking among treatments or between corn plant populations within either bar-ley or triticale.
In Year 2, dry matter concentrations of the silages ranged from 29.7% to 32.7% (Table 7.3) and much less than in Year 1 (range of 39% to 48%). Treatments differed, but the differences were minimal and as-sociated mainly with species. Contrary to Year 1, no differences were evident between cultivars for any of the other variables. Similar to Year 1, no differences were noted within cultivar due to corn cultivar or planting population.
The nutritive value of the barley and triticale silag-es in Year 2 reflect Year 1 in that barley had greatest in vitro true dry matter disappearance and least neu-tral detergent fiber and its fiber constituents (Table 7.4). In Year 2, barley following Pioneer 3098 corn planted at 30,000 plants per acre was least in in vitro dry matter disappearance and greatest in neutral detergent fiber compared with the other three treat-ments. This indicates some potential reduction in silage quality. Triticale showed no differences among the prior corn treatments.
Summary and Conclusions• Ingeneral,bothbarleyandtriticalefermented
well and the silages were stable.• Neithersmallgrainwasalteredineitherfermen-
tation characteristics or nutritive value when planted following tropical corn regardless of corn plant population.
• Barleyappearstobeofgreaternutritivevaluecompared with triticale.
Fermentation Characteristics, Nutritive Value, and Quality 41
Tabl
e 7.
1. E
nsili
ng c
hara
cter
istic
s of
bar
ley
and
triti
cale
whe
n gr
own
follo
win
g co
rn p
revi
ousl
y pl
ante
d at
two
popu
latio
ns,
Year
1 (d
ry m
atte
r bas
is).
Trea
tmen
tD
M3
pHA
lcoh
ols
Fatt
y A
cids
Smal
l Gra
inFo
llow
ing
Corn
Culti
var1
Popu
latio
n2Et
hano
lM
etha
nol
Ace
ticPr
opio
nic
Lact
icBu
tyri
cIs
obut
yric
%—
——
——
——
——
——
——
— %
——
——
——
——
——
——
—Ba
rley:
DKX
L660
1542
.44
4.7
1.60
0.08
0.56
0.04
2.10
0.89
0.03
3039
.74.
81.
940.
100.
590.
052.
251.
070.
02PN
3098
1539
.14.
71.
910.
130.
430.
182.
351.
470.
0530
39.6
4.9
1.71
0.13
0.54
0.13
2.50
1.14
0.04
Triti
cale
:D
KXL6
6015
47.2
4.3
1.88
0.05
0.48
-3.
790.
060.
0230
47.2
4.3
2.11
0.03
0.50
-3.
710.
020.
01PN
3098
1547
.64.
31.
680.
070.
44t5
3.49
0.09
0.02
3047
.64.
41.
420.
030.
32-
2.67
0.03
0.01
Sign
ifica
nce
(P):
Trea
tmen
t<0
.01
<0.0
10.
97<0
.01
0.18
0.02
0.01
<0.0
1<0
.01
MSD
63.
20.
42.
240.
050.
250.
121.
170.
350.
011 D
K =
Dek
alb;
PN
= P
ione
er.
2 15
= 15
,000
; 30
= 30
,000
pla
nts
per a
cre.
3 D
M =
dry
mat
ter.
4 Eac
h va
lue
is th
e m
ean
of th
ree
sam
ples
.5 t
= tr
ace.
6 M
SD =
min
imum
sig
nific
ant d
iffer
ence
from
the
Wal
ler-
Dun
can
k-ra
tio (k
= 1
00) t
-tes
t and
can
be
used
to c
ompa
re a
ny tw
o tr
eat-
men
ts.

42 Annual Grasses Preserved as Silage:
Table 7.2. In vitro true dry matter disappearance (IVTD) and nutritive value1 of barley and triticale silages following corn previously planted at two populations, Year 1 (dry matter basis).
Treatment
IVTD CP NDF
Fiber Fractions
Small Grain
Following Corn
Cultivar2 Population3ADF HEMI CELL Lignin
———————————— % ———————————-
Barley:
DKXL660 15 72.04 8.2 51.1 32.5 18.6 27.0 3.8
30 70.8 8.1 52.6 33.6 19.0 29.0 4.1
PN3098 15 69.3 8.5 54.2 35.2 19.0 30.2 4.2
30 70.4 8.3 52.9 34.3 18.5 29.4 4.2
Triticale:
DKXL660 15 62.7 6.7 65.0 42.0 23.0 37.0 5.2
30 63.1 6.3 64.7 41.9 22.8 36.2 5.1
PN3098 15 61.3 6.2 67.1 43.9 23.2 37.3 5.2
30 61.1 6.1 66.6 42.7 23.9 36.6 5.2
Significance (P):
Treatment <0.01 <0.01 <0.01 <0.01 <0.01 <0.01 <0.01
MSD5 4.2 0.9 5.0 3.9 1.5 3.9 0.51 CP = crude protein; NDF = neutral detergent fiber; ADF = acid detergent fiber; HEMI = hemicellulose;
CELL = cellulose.2 DK = Dekalb; PN = Pioneer.3 15 = 15,000; 30 = 30,000 plants per acre.4 Each value is the mean of three samples.5 MSD = minimum significant difference from the Waller-Duncan k-ratio (k = 100) t-test and can be used
to compare any two treatments.

Fermentation Characteristics, Nutritive Value, and Quality 43
Tabl
e 7.
3. E
nsili
ng c
hara
cter
istic
s of
bar
ley
and
triti
cale
whe
n gr
own
follo
win
g co
rn p
revi
ousl
y pl
ante
d at
two
popu
latio
ns, Y
ear 2
(dry
m
atte
r bas
is).
Trea
tmen
t
DM
3pH
Alc
ohol
sFa
tty
Aci
ds
Smal
l Gra
ins
Follo
win
g Co
rn
Culti
var1
Popu
latio
n2Et
hano
lM
etha
nol
Ace
ticPr
opio
nic
Lact
icBu
tyri
cIs
obut
yric
%—
——
——
——
——
——
——
— %
——
——
——
——
——
——
—
Barle
y:
DKX
L660
1530
.54
4.0
4.36
0.04
1.2
t54.
83t
0.02
3029
.74.
14.
150.
031.
14t
4.30
t0.
02
PN30
9815
30.4
4.1
3.48
0.05
1.19
-4.
330.
010.
03
3030
.74.
23.
680.
041.
27-
4.03
0.01
0.02
Triti
cale
:
DKX
L660
1531
.64.
14.
270.
041.
34-
3.72
t0.
03
3031
.04.
14.
590.
041.
22t
4.72
0.01
0.03
PN30
9815
31.9
4.2
3.89
0.04
1.44
-3.
890.
010.
02
3032
.74.
23.
360.
041.
360.
013.
900.
040.
03
Sign
ifica
nce
(P):
Trea
tmen
t0.
030.
460.
710.
430.
180.
370.
480.
480.
21
MSD
61.
80.
22.
480.
020.
310.
021.
730.
050.
021 D
K =
Dek
alb;
PN
= P
ione
er.
2 15
= 15
,000
; 30
= 30
,000
pla
nts
per a
cre.
3 D
M =
dry
mat
ter.
4 Eac
h va
lue
is th
e m
ean
of th
ree
sam
ples
.5 t
= tr
ace.
6 M
SD =
min
imum
sig
nific
ant d
iffer
ence
from
the
Wal
ler-
Dun
can
k-ra
tio (k
= 1
00) t
-tes
t and
can
be
used
to c
ompa
re a
ny tw
o tr
eatm
ents
.
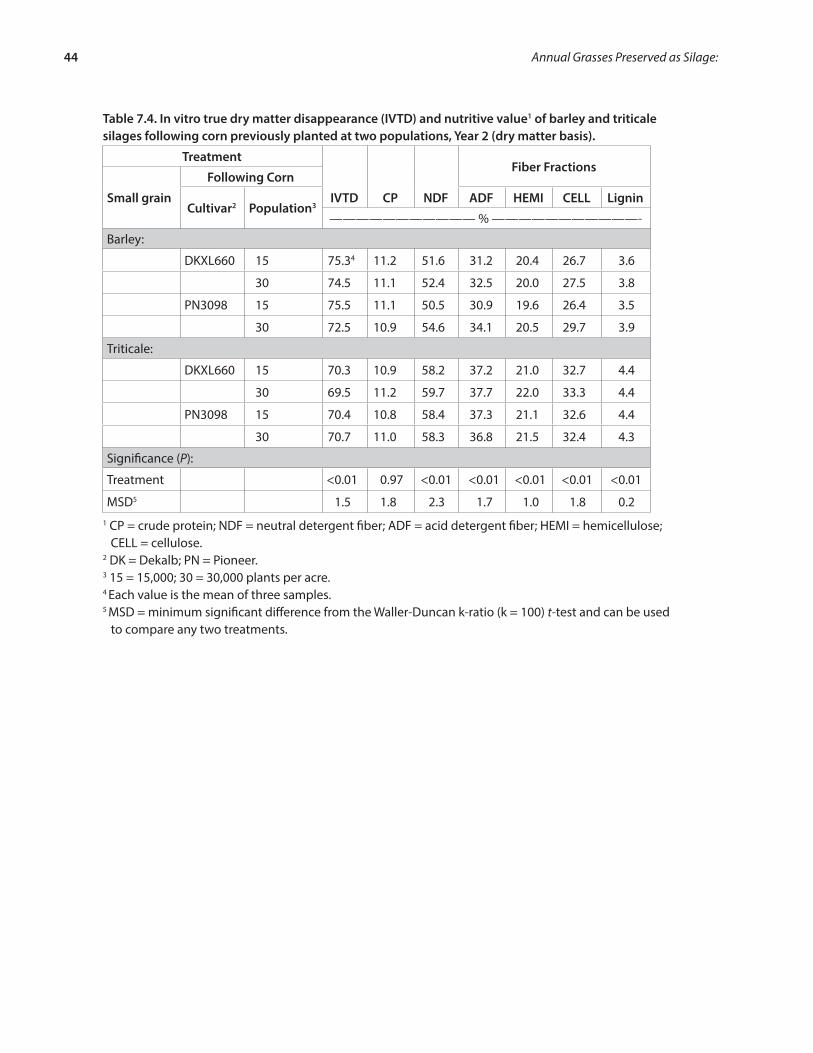
44 Annual Grasses Preserved as Silage:
Table 7.4. In vitro true dry matter disappearance (IVTD) and nutritive value1 of barley and triticale silages following corn previously planted at two populations, Year 2 (dry matter basis).
Treatment
IVTD CP NDF
Fiber Fractions
Small grain
Following Corn
Cultivar2 Population3ADF HEMI CELL Lignin
——————————— % ———————————-
Barley:
DKXL660 15 75.34 11.2 51.6 31.2 20.4 26.7 3.6
30 74.5 11.1 52.4 32.5 20.0 27.5 3.8
PN3098 15 75.5 11.1 50.5 30.9 19.6 26.4 3.5
30 72.5 10.9 54.6 34.1 20.5 29.7 3.9
Triticale:
DKXL660 15 70.3 10.9 58.2 37.2 21.0 32.7 4.4
30 69.5 11.2 59.7 37.7 22.0 33.3 4.4
PN3098 15 70.4 10.8 58.4 37.3 21.1 32.6 4.4
30 70.7 11.0 58.3 36.8 21.5 32.4 4.3
Significance (P):
Treatment <0.01 0.97 <0.01 <0.01 <0.01 <0.01 <0.01
MSD5 1.5 1.8 2.3 1.7 1.0 1.8 0.21 CP = crude protein; NDF = neutral detergent fiber; ADF = acid detergent fiber; HEMI = hemicellulose;
CELL = cellulose.2 DK = Dekalb; PN = Pioneer.3 15 = 15,000; 30 = 30,000 plants per acre.4 Each value is the mean of three samples.5 MSD = minimum significant difference from the Waller-Duncan k-ratio (k = 100) t-test and can be used
to compare any two treatments.

Fermentation Characteristics, Nutritive Value, and Quality 45
Section III. Double Cropping Associations
In double cropping systems, characteristics of the previous crop can influence the following crop. This influence may take the form of altered growth, which may alter dry matter yield and its associated nutri-tive value. The major opportunity for such carryover effects would be best observed when corn (rapid grower) is immediately planted into small grain stubble as opposed to small grain seeded into corn stubble. In the latter case, the growth of small grain proceeds slowly during the winter.
Experiment 8. Temperate and Tropical Corn Following Small Grain Harvested for Silage: Fermentation Characteristics and Nutritive Value
Our objective in this experiment was to examine fer-mentation products and the silage nutritive value of temperate and tropical corn at two plant populations following the production of either barley or triticale.
Material and MethodsFollowing harvest of the barley (May 9) and triticale (May 19), three corn cultivars were planted at two planting rates. The temperate corn was planted (April 17) using conventional methods and ensiled (August 3). The two tropical cultivars were planted (June 8) into the same plot area as the previous small grains and ensiled (September 28 or 29) giving the follow-ing ten treatments:
Temperate corn (Pioneer 31G20):1. Planted at 15,000 plants per acre2. Planted at 30,000 plants per acre
Tropical corn following barley:3. Dekalb XL660 planted at 15,000 plants per acre4. Pioneer 3098 planted at 15,000 plants per acre5. Dekalb XL660 planted at 30,000 plants per acre6. Pioneer 3098 planted at 30,000 plants per acre
Tropical corn following triticale:7. Dekalb XL660 planted at 15,000 plants per acre8. Pioneer 3098 planted at 15,000 plants per acre
9. Dekalb XL660 planted at 30,000 plants per acre10. Pioneer 3098 planted at 30,000 plants per acre
Corn plantings were made in 14 feet wide by 25 feet long plots in a randomized complete block de-sign with three replicates. All plantings received 70 pounds of nitrogen per acre as a side dress. A ran-dom, 10-foot length was cut in early October from each plot and hand fed through a forage chopper, and each treatment was ensiled in miniature silos (Appendix GP-1). The exception was the temperate corn—for which the forages from the two plant pop-ulation treatments were combined prior to chopping, thoroughly mixed after chopping, and ensiled as one treatment, resulting in nine treatments.
At opening, each miniature silo was emptied, mixed, sampled, and samples analyzed for fermen-tation products and nutritive value constituents according to standard procedures (Appendix GP-6). The data were statistically analyzed as a randomized complete block design (Appendix GP-7).
Results and DiscussionDry matter concentrations of the silages differed among treatments. However, all treatments ensiled wellwithsimilarpHmeasuresof≤3.8(Table8.1).Ingeneral, dry matter differences were mainly cultivar related with temperate corn being greatest but simi-lar to most of the treatments within Pioneer 3098 and greater than the Dekalb XL660 silages. Ethanol concentrations differed, which was mainly associated with Pioneer 3098 silage following triticale. Acetic acid concentrations differed among silages and were mainly cultivar related with temperate silage least compared with Dekalb XL660, and Dekalb XL660 was generally similar with Pioneer 3098. The excep-tion was the Pioneer 3098 treatment at 30,000 plants per acre and following triticale. It is noteworthy that propionic and isobutyric acids were essentially ab-sent in all silages.
The nutritive value differed among the silages, being related essentially to cultivar as opposed to

46 Annual Grasses Preserved as Silage:
treatments within cultivars. Temperate corn silage was greatest in in vitro true dry matter disappear-ance and lesser in neutral detergent fiber and its fiber constituents (Table 8.2). The two tropical corn silages were generally similar in nutritive value with little difference among treatments within cultivar.
Summary and Conclusions• AllsilagesensiledwellwithfinalpHmeasuresof
≤3.8.• Followingbarleyortriticaleinadoublecropping
system did not alter temperate or tropical corn fermentation responses or the nutritive value of either resulting silage.
• Plantingcornateither15,000or30,000plantsper acre did not alter fermentation characteris-tics or nutritive value of the resulting silages.
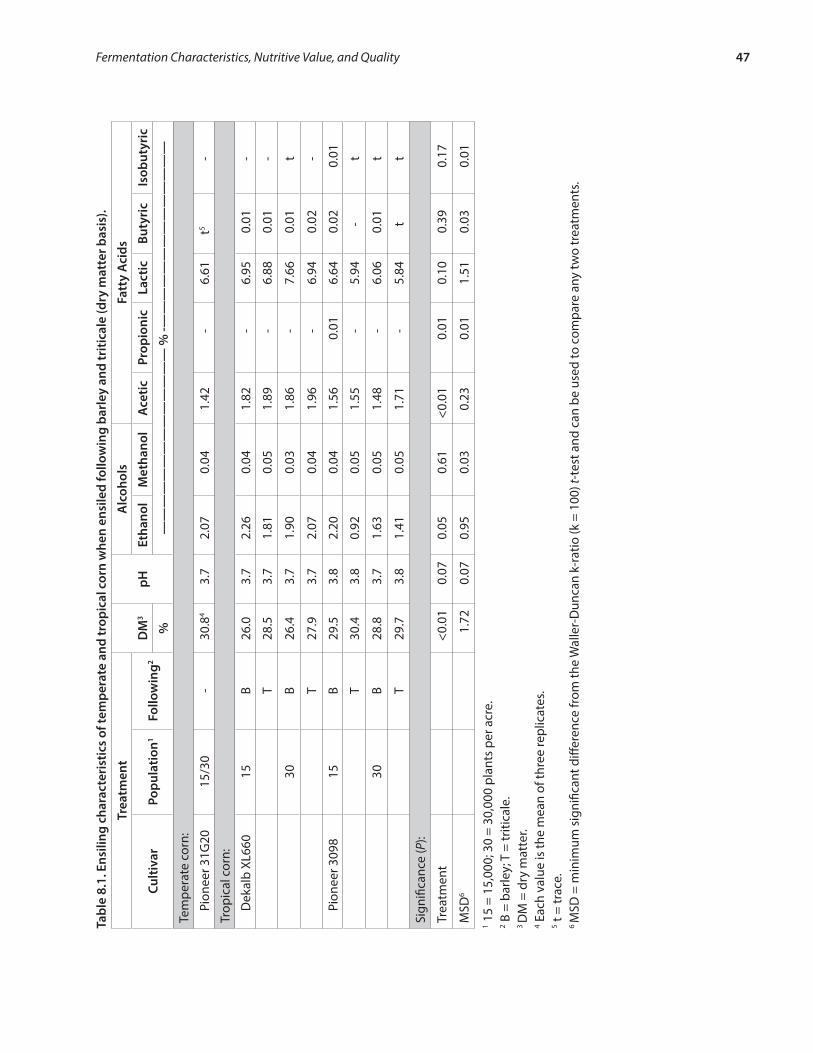
Fermentation Characteristics, Nutritive Value, and Quality 47
Tabl
e 8.
1. E
nsili
ng c
hara
cter
istic
s of
tem
pera
te a
nd tr
opic
al c
orn
whe
n en
sile
d fo
llow
ing
barl
ey a
nd tr
itica
le (d
ry m
atte
r bas
is).
Trea
tmen
t
DM
3pH
Alc
ohol
sFa
tty
Aci
ds
Culti
var
Popu
latio
n1Fo
llow
ing2
Etha
nol
Met
hano
lA
cetic
Prop
ioni
cLa
ctic
Buty
ric
Isob
utyr
ic
%—
——
——
——
——
——
——
— %
-——
——
——
——
——
——
——
Tem
pera
te c
orn:
Pion
eer 3
1G20
15/3
0-
30.8
43.
72.
070.
041.
42-
6.61
t5-
Trop
ical
cor
n:
Dek
alb
XL66
015
B26
.03.
72.
260.
041.
82-
6.95
0.01
-
T28
.53.
71.
810.
051.
89-
6.88
0.01
-
30B
26.4
3.7
1.90
0.03
1.86
-7.
660.
01t
T27
.93.
72.
070.
041.
96-
6.94
0.02
-
Pion
eer 3
098
15B
29.5
3.8
2.20
0.04
1.56
0.01
6.64
0.02
0.01
T30
.43.
80.
920.
051.
55-
5.94
-t
30B
28.8
3.7
1.63
0.05
1.48
-6.
060.
01t
T29
.73.
81.
410.
051.
71-
5.84
tt
Sign
ifica
nce
(P):
Trea
tmen
t<0
.01
0.07
0.05
0.61
<0.0
10.
010.
100.
390.
17
MSD
61.
720.
070.
950.
030.
230.
011.
510.
030.
011 1
5 =
15,0
00; 3
0 =
30,0
00 p
lant
s pe
r acr
e.2 B
= b
arle
y; T
= tr
itica
le.
3 D
M =
dry
mat
ter.
4 Eac
h va
lue
is th
e m
ean
of th
ree
repl
icat
es.
5 t =
trac
e.6 M
SD =
min
imum
sig
nific
ant d
iffer
ence
from
the
Wal
ler-
Dun
can
k-ra
tio (k
= 1
00) t
-tes
t and
can
be
used
to c
ompa
re a
ny tw
o tr
eatm
ents
.

48 Annual Grasses Preserved as Silage:
Table 8.2. In vitro true dry matter disappearance (IVTD) and nutritive value1 of temperate and tropical corn when ensiled following barley and triticale (dry matter basis)
TreatmentIVTD CP NDF
Fiber Fractions
Cultivar Population2 Following3ADF HEMI CELL Lignin
————————————— % —————————————
Temperate corn:
Pioneer 31G20 15/30 - 78.34 7.4 45.2 25.5 19.8 23.0 2.4
Tropical corn:
Dekalb XL660 15 B 70.5 6.9 57.5 33.3 24.2 29.2 3.3
T 72.1 6.8 55.6 32.0 23.6 28.0 3.0
30 B 70.2 6.6 58.6 34.3 24.3 29.6 3.5
T 69.2 6.8 57.9 33.6 34.3 30.0 3.5
Pioneer 3098 15 B 70.1 7.3 56.1 32.2 23.9 27.9 3.4
T 69.3 6.4 56.7 32.9 23.8 29.4 3.8
30 B 67.5 6.8 58.7 34.5 24.1 30.5 4.0
T 68.4 6.6 58.7 34.5 24.2 31.0 3.9
Significance (P):
Treatment <0.01 0.26 <0.01 <0.01 <0.01 <0.01 <0.01
MSD5 2.9 1.1 3.4 2.5 1.1 2.6 0.5
1 CP = crude protein; NDF = neutral detergent fiber; ADF = acid detergent fiber; HEMI = hemicellulose; CELL = cellulose.2 15 = 15,000; 30 = 30,000 plants per acre.3 B = barley; T = triticale.4 Each value is the mean of three replicates.5 MSD = minimum significant difference from the Waller-Duncan k-ratio (k = 100) t-test and can be used to compare
any two treatments.

Fermentation Characteristics, Nutritive Value, and Quality 49
Experiment 9. Ensiled Temperate and Tropical Corn in a Double Cropping System: Morphology, Fermentation Characteristics, and Steer Preference
This experiment is an expansion of Experiment 8 in which a temperate and two tropical corn cultivars, planted at two populations following small grains, were ensiled and evaluated for fermentation products and nutritive value. Our objectives in this experi-ment were to further describe the morphology of the cultivars in Experiment 8 and to determine if fer-mentation products or nutritive value altered steer preference.
Material and MethodsFollowing harvests of barley and triticale, planting and harvesting of a temperate and two tropical corns using conventional methods were conducted on dates comparable to the dates noted in Experiment 8. Plantings were made following small grain harvest as noted in Experiment 8. The following ten silage treat-ments resulted and were used for experimentation:
Temperate corn (Pioneer 31G20):1. Planted at 15,000 plants per acre2. Planted at 30,000 plants per acre
Tropical corn following barley:3. Dekalb XL660 planted at 15,000 plants per acre4. Pioneer 3098 planted at 15,000 plants per acre5. Dekalb XL660 planted at 30,000 plants per acre6. Pioneer 3098 planted at 30,000 plants per acre
Tropical corn following triticale:7. Dekalb XL660 planted at 15,000 plants per acre8. Pioneer 3098 planted at 15,000 plants per acre9. Dekalb XL660 planted at 30,000 plants per acre
10. Pioneer 3098 planted at 30,000 plants per acre
Corn plantings were made in 14-foot wide by 25-foot long plots in a randomized complete block design with three replications that were previously occupied by small grains. A random 10-foot length was cut in early October from each plot. Five stalks were randomly selected from each plot and used
for morphological determination (Appendix GP-1). The cut forages were then hand-fed through a forage chopper and ensiled in miniature silos (Appendix GP-1).
The stalks selected for morphological determina-tion were separated into leaf, stem, tassel, husk, and ear (grain and cob) components. Each was expressed as a percent of the whole-stalk dry matter. The ear was further separated into the grain and cob compo-nents and expressed as a percent of the total ear.
At feeding, each miniature silo was opened and the contents emptied, thoroughly mixed, and sam-pled. The samples were analyzed for fermentation products and nutritive value constituents according to standard procedures (Appendix GP-6).
Six separate 30-minute preference evaluations involving two, three, and four treatment compari-sons were conducted. Each evaluation was conducted as a randomized complete block design with six steer (weight range of 1,430 to 2,150 pounds) repli-cates. The total dry matter intake and feeding times were recorded, and the intake rate (grams/minute) was calculated. The data were statistically analyzed according to the experimental design (Appendix GP-7).
Results and DiscussionMorphology of the three corn cultivars planted to the two population densities differed in the propor-tion of whole-plant dry matter present as leaf, stem, husk, and ear (Table 9.1). Although a few exceptions occurred, generally differences in these plant frac-tions were attributed to cultivar differences and not to planting density or to the preceding small grain.
Dry matter at opening of silos was greatest for the temperate corn silage, whereas that of the tropical corn silage was lesser and generally similar among treatments within cultivar (Table 10.2). Forage from all 10 treatments fermented well with similar pH measures of 3.8 to 4.0. Differences were noted among treatments in ethanol, methanol, lactic, and butyric acid concentrations, and these differences were gen-erally between temperate and tropical corn silages. Some exceptions were noted, but no trends were evident.
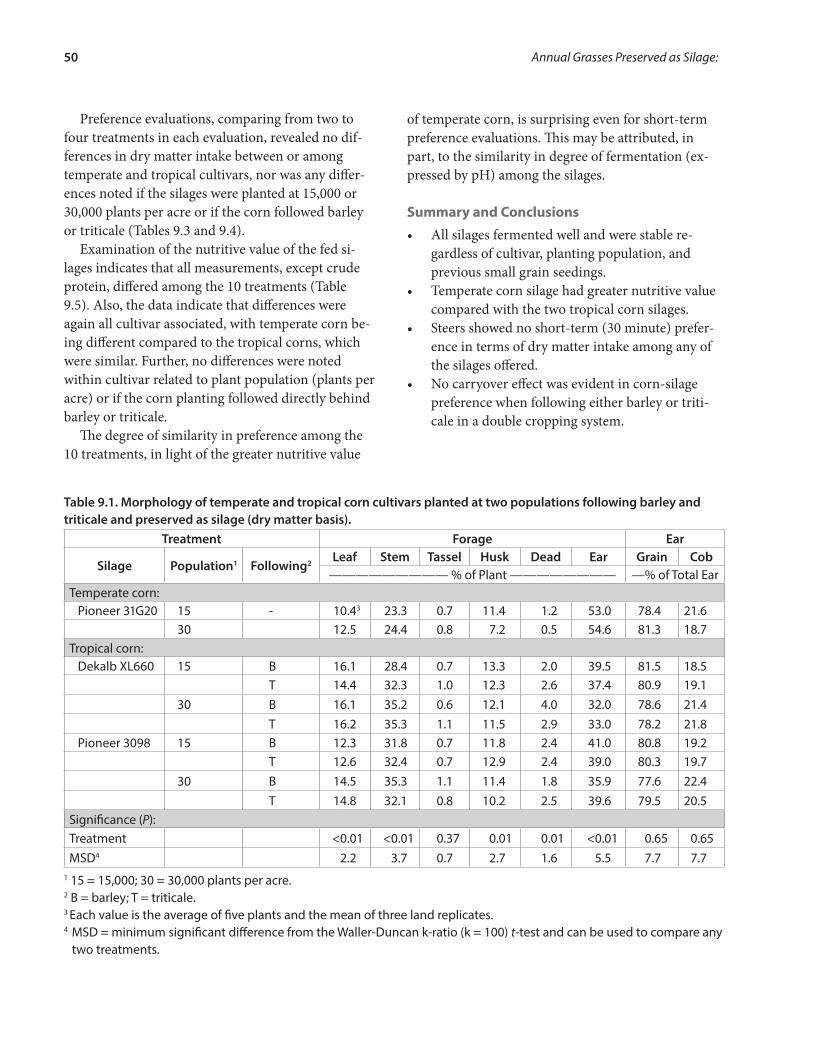
50 Annual Grasses Preserved as Silage:
Preference evaluations, comparing from two to four treatments in each evaluation, revealed no dif-ferences in dry matter intake between or among temperate and tropical cultivars, nor was any differ-ences noted if the silages were planted at 15,000 or 30,000 plants per acre or if the corn followed barley or triticale (Tables 9.3 and 9.4).
Examination of the nutritive value of the fed si-lages indicates that all measurements, except crude protein, differed among the 10 treatments (Table 9.5). Also, the data indicate that differences were again all cultivar associated, with temperate corn be-ing different compared to the tropical corns, which were similar. Further, no differences were noted within cultivar related to plant population (plants per acre) or if the corn planting followed directly behind barley or triticale.
The degree of similarity in preference among the 10 treatments, in light of the greater nutritive value
of temperate corn, is surprising even for short-term preference evaluations. This may be attributed, in part, to the similarity in degree of fermentation (ex-pressed by pH) among the silages.
Summary and Conclusions• Allsilagesfermentedwellandwerestablere-
gardless of cultivar, planting population, and previous small grain seedings.
• Temperatecornsilagehadgreaternutritivevaluecompared with the two tropical corn silages.
• Steersshowednoshort-term(30minute)prefer-ence in terms of dry matter intake among any of the silages offered.
• Nocarryovereffectwasevidentincorn-silagepreference when following either barley or triti-cale in a double cropping system.
Table 9.1. Morphology of temperate and tropical corn cultivars planted at two populations following barley and triticale and preserved as silage (dry matter basis).
Treatment Forage Ear
Silage Population1 Following2 Leaf Stem Tassel Husk Dead Ear Grain Cob————————— % of Plant ———————— —% of Total Ear
Temperate corn: Pioneer 31G20 15 - 10.43 23.3 0.7 11.4 1.2 53.0 78.4 21.6
30 12.5 24.4 0.8 7.2 0.5 54.6 81.3 18.7Tropical corn: Dekalb XL660 15 B 16.1 28.4 0.7 13.3 2.0 39.5 81.5 18.5
T 14.4 32.3 1.0 12.3 2.6 37.4 80.9 19.130 B 16.1 35.2 0.6 12.1 4.0 32.0 78.6 21.4
T 16.2 35.3 1.1 11.5 2.9 33.0 78.2 21.8 Pioneer 3098 15 B 12.3 31.8 0.7 11.8 2.4 41.0 80.8 19.2
T 12.6 32.4 0.7 12.9 2.4 39.0 80.3 19.730 B 14.5 35.3 1.1 11.4 1.8 35.9 77.6 22.4
T 14.8 32.1 0.8 10.2 2.5 39.6 79.5 20.5Significance (P):Treatment <0.01 <0.01 0.37 0.01 0.01 <0.01 0.65 0.65MSD4 2.2 3.7 0.7 2.7 1.6 5.5 7.7 7.7
1 15 = 15,000; 30 = 30,000 plants per acre.2 B = barley; T = triticale.3 Each value is the average of five plants and the mean of three land replicates. 4 MSD = minimum significant difference from the Waller-Duncan k-ratio (k = 100) t-test and can be used to compare any
two treatments.
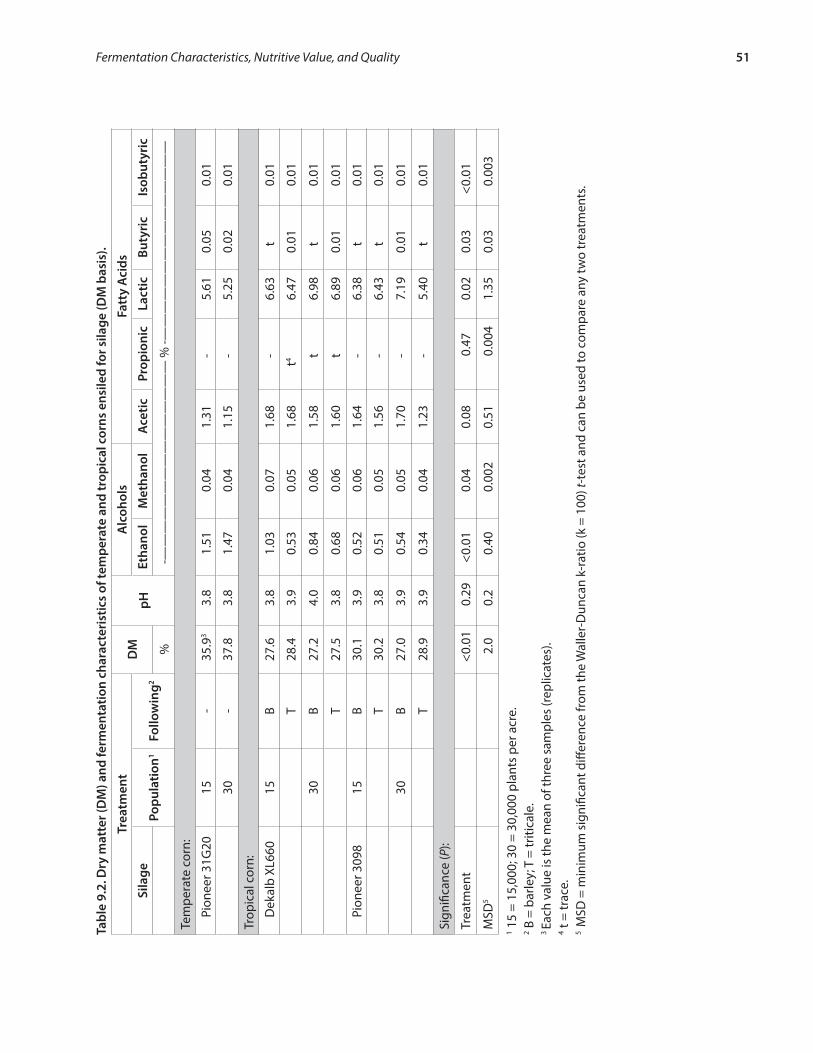
Fermentation Characteristics, Nutritive Value, and Quality 51
Tabl
e 9.
2. D
ry m
atte
r (D
M) a
nd fe
rmen
tatio
n ch
arac
teri
stic
s of
tem
pera
te a
nd tr
opic
al c
orns
ens
iled
for s
ilage
(DM
bas
is).
Trea
tmen
tD
MpH
Alc
ohol
sFa
tty
Aci
ds
Sila
gePo
pula
tion1
Follo
win
g2Et
hano
lM
etha
nol
Ace
ticPr
opio
nic
Lact
icBu
tyri
cIs
obut
yric
%-—
——
——
——
——
——
——
——
% -—
——
——
——
——
——
——
——
Tem
pera
te c
orn:
Pion
eer 3
1G20
15-
35.9
33.
81.
510.
041.
31-
5.61
0.05
0.01
30-
37.8
3.8
1.47
0.04
1.15
-5.
250.
020.
01
Trop
ical
cor
n:
Dek
alb
XL66
015
B27
.63.
81.
030.
071.
68-
6.63
t0.
01
T28
.43.
90.
530.
051.
68t4
6.47
0.01
0.01
30B
27.2
4.0
0.84
0.06
1.58
t6.
98t
0.01
T27
.53.
80.
680.
061.
60t
6.89
0.01
0.01
Pion
eer 3
098
15B
30.1
3.9
0.52
0.06
1.64
-6.
38t
0.01
T30
.23.
80.
510.
051.
56-
6.43
t0.
01
30B
27.0
3.9
0.54
0.05
1.70
-7.
190.
010.
01
T28
.93.
90.
340.
041.
23-
5.40
t0.
01
Sign
ifica
nce
(P):
Trea
tmen
t<0
.01
0.29
<0.0
10.
040.
080.
470.
020.
03<0
.01
MSD
52.
00.
20.
400.
002
0.51
0.00
41.
350.
030.
003
1 15
= 15
,000
; 30
= 30
,000
pla
nts
per a
cre.
2 B =
bar
ley;
T =
triti
cale
.3 Ea
ch v
alue
is th
e m
ean
of th
ree
sam
ples
(rep
licat
es).
4 t =
trac
e.5
MSD
= m
inim
um s
igni
fican
t diff
eren
ce fr
om th
e W
alle
r-D
unca
n k-
ratio
(k =
100
) t-t
est a
nd c
an b
e us
ed to
com
pare
any
two
trea
tmen
ts.

52 Annual Grasses Preserved as Silage:Ta
ble
9.3.
Pre
fere
nce
eval
uatio
ns (E
valu
atio
ns 1
thru
3) c
ompa
ring
tem
pera
te c
orn
and
vari
ous
trop
ical
cor
n si
lage
s pl
ante
d at
two
popu
latio
ns fo
llow
ing
barl
ey a
nd tr
itica
le (d
ry m
atte
r bas
is).
Trea
tmen
tEv
alua
tion
1Ev
alua
tion
2Ev
alua
tion
3Si
lage
Popu
latio
n1Fo
llow
ing2
DM
I3Ti
me
Rate
DM
ITi
me
Rate
DM
ITi
me
Rate
gm
ing/
min
gm
ing/
min
gm
ing/
min
Tem
pera
te c
orn:
Pion
eer 3
1G20
15-
3374
3.1
79.5
30-
5694
4.5
106.
9Tr
opic
al c
orn:
Dek
alb
XL66
015
B T25
23.
111
7.0
4434
4.5
94.5
30B
395
4.4
85.5
303
3.0
95.2
TPi
onee
r 309
815
B47
24.
610
6.6
195
2.6
68.1
T30
B29
03.
312
0.4
497
5.3
94.0
TSi
gnifi
canc
e (P
):Tr
eatm
ent
0.56
0.67
0.70
0.33
0.78
0.60
0.31
0.45
0.44
MSD
552
35.
012
0.9
460
4.9
89.2
444
5.0
51.5
1 15 =
15,
000;
30
= 30
,000
pla
nts
per a
cre.
2 B =
bar
ley;
T =
triti
cale
.3 D
MI =
dry
mat
ter i
ntak
e.4 Ea
ch v
alue
is th
e m
ean
of s
ix s
teer
s.5 M
SD =
min
imum
sig
nific
ant d
iffer
ence
from
the
Wal
ler-
Dun
can
k-ra
tio (k
= 1
00) t
-tes
t and
can
be
used
to c
ompa
re a
ny tw
o tr
eatm
ents
.

Fermentation Characteristics, Nutritive Value, and Quality 53
Tabl
e 9.
4. P
refe
renc
e ev
alua
tions
(Eva
luat
ions
4 th
ru 6
) com
pari
ng te
mpe
rate
cor
n an
d va
riou
s tr
opic
al c
orn
sila
ges
plan
ted
at tw
o po
pula
tions
follo
win
g ba
rley
and
triti
cale
(dry
mat
ter b
asis
).Tr
eatm
ent
Eval
uatio
n 4
Eval
uatio
n 5
Eval
uatio
n 6
Fora
gePo
pula
tion1
Follo
win
g2D
MI3
Tim
eRa
teD
MI
Tim
eRa
teD
MI
Tim
eRa
teg
min
g/m
ing
min
g/m
ing
min
g/m
inTe
mpe
rate
cor
n:Pi
onee
r 31G
2015
-32
942.
718
0.8
1784
1.8
159.
830
-61
14.
810
9.3
Trop
ical
cor
n:D
ekal
b XL
660
15B
227
2.3
158.
744
14.
395
.148
645.
310
1.3
T88
08.
412
1.8
30B T
371
4.0
85.7
498
4.9
95.6
Pion
eer 3
098
15B T
675
6.1
103.
930
B TSi
gnifi
canc
e (P
):Tr
eatm
ent
0.30
0.46
0.67
0.25
0.16
0.08
0.95
0.86
0.51
MSD
451
94.
624
0.5
705
5.5
35.5
--
-1 15
= 1
5,00
0; 3
0 =
30,0
00 p
lant
s pe
r acr
e.2 B
= b
arle
y; T
= tr
itica
le.
3 D
MI =
dry
mat
ter i
ntak
e.4 Ea
ch v
alue
is th
e m
ean
of s
ix s
teer
s.5 M
SD =
min
imum
sig
nific
ant d
iffer
ence
from
the
Wal
ler-
Dun
can
k-ra
tio (k
= 1
00) t
-tes
t and
can
be
used
to c
ompa
re a
ny tw
o tr
eatm
ents
.

54 Annual Grasses Preserved as Silage:
Table 9.5. In vitro true dry matter disappearance (IVTD) and nutritive value1 of temperate and tropical corn silages planted at two populations following barley and triticale (dry matter basis).
TreatmentIVTD CP NDF
Fiber Fractions
Silage Population2 Following3 ADF HEMI CELL Lignin—————————————%————————————
Temperate corn:Pioneer 31G20 15 - 83.84 7.9 41.6 22.3 19.3 19.7 2.0
30 - 84.4 8.1 39.4 20.7 18.7 18.5 1.8Tropical corn:
Dekalb XL660 15 B 74.1 8.4 51.9 29.1 22.9 25.9 2.9T 73.9 8.6 51.8 28.7 23.1 25.5 3.0
30 B 75.5 9.0 50.5 28.2 22.3 25.0 2.7T 72.3 7.6 52.9 30.1 22.8 26.8 3.1
Pioneer 3098 15 B 73.9 8.9 51.3 29.0 22.3 25.5 3.1T 72.4 8.3 51.6 29.2 22.4 25.7 3.2
30 B 74.5 9.4 48.9 27.5 21.4 24.2 2.9T 73.9 8.7 48.6 27.4 21.2 24.1 2.9
Significance (P):Treatment <0.01 0.17 <0.01 <0.01 0.02 <0.01 <0.01MSD5 4.4 1.7 6.9 4.3 2.8 3.5 0.6
1 CP = crude protein; NDF = neutral detergent fiber; ADF = acid detergent fiber; HEMI = hemicellulose; CELL = cellulose.2 15 = 15,000; 30 = 30,000 plants per acre.3 B = barley; T = triticale.4 Each value is the mean of three samples.5 MSD = minimum significant difference from the Waller-Duncan k-ratio (k = 100) t-test and can be used to compare
any two treatments.

Fermentation Characteristics, Nutritive Value, and Quality 55
Section IV. Preference Evaluations of Warm-Season Annuals
Ruminants, when offered the opportunity, will selec-tively consume their daily diet. Grazing animals will initially select a diet greater in green leaf and select against dead and stemmy tissue. As the opportunity to select decreases, the time of grazing will generally increase but daily dry matter intake will remain con-stant or decrease. In confined feeding, animals will also selectively consume their daily diet if given the opportunity. Generally, the total mixed ration (TMR) avoids a large degree of selectivity with the idea that each mouthful ingested will be similar in nutritive value. When feeding a chopped hay to avoid some degree of selectivity, the unconsumed feed (weigh-back) will frequently be characterized by stemmy tissue. It is interesting to note that the degree of se-lective consumption will vary from animal to animal. In steer trials in which chopped hays have been fed, one can observe a range in weighback characteristics that varies—with some animals consuming essen-tially all the offered feed, some animals leaving a mat of weighback consisting of some leaf but generally with a preponderance of stem, some animals leaving a range of stemmy tissue, and some animals leaving only the heavy stems (which are generally identified as basal stems) of the harvested forage.
Clearly, ruminants preferentially select based on both nutritive value (composition) as well as on physical properties. In the case of fermented forage, the conventional nutritive value characteristics have been converted, in part, into end products of fermen-tation that have their own characteristics and affect animal preference. Our general objectives in this sec-tion were to determine the degree of steer preference for various silages based on silage type (species) or on imposed management differentials (such as plant-ing and harvesting times). The specific objectives for the following experiments are stated after each experiment title.
Experiment 10. Tropical Corn Silages of Different Cultivars and Maturities: Fermentation Characteristics, Nutritive Value, and Preference
In a small grain and corn double cropping system, the development or intended use of the small grain crop may delay the date that the subsequent corn crop can be planted. Our objectives in this experi-ment were to determine the changes in fermentation characteristics and nutritive value of two tropical corn cultivars planted at increasing two-week delays and to determine any subsequent preference by steers for the silage.
Materials and MethodsThree corn cultivars consisting of the temperate cul-tivar Pioneer 3154 and two tropical cultivars, Dekalb 678C and Pioneer X304C, served as the experi-mental forages. The following nine treatments were evaluated:
Temperate corn—Pioneer 3154:1. Planted May 15
Tropical corn—Dekalb 678C:2. Planted May 153. Planted June 14. Planted June 155. Planted July 1
Tropical corn—Pioneer X304C:6. Planted May 157. Planted June 18. Planted June 159. Planted July 1
All plantings were made and managed according to standard procedures. The temperate forage was cut September 3, and all of the tropical corn treatments were cut October 23. Forage was passed through a conventional field chopper and ensiled in miniature silos according to standard procedures (Appendix GP-1) for use in preference trials. The miniature silos

56 Annual Grasses Preserved as Silage:
were stored undisturbed for a minimum of 60 days prior to opening.
The nine experimental silages were evaluated for preference in five evaluations. Each evaluation con-sisted of a randomized complete block design using three steer replicates. Samples were obtained from each replicate, all were processed according to stan-dard procedures (Appendix GP-6), and the data were statistically analyzed according to the experimental design (GP-7).
Results and DiscussionPercent dry matter at harvest differed among treat-ments with temperate corn greatest at 49.6%. Little change in percent dry matter was noted among the May 15, June 1, and June 15 planting dates within a tropical cultivar or between cultivars. Corn planted July 1, however, was much lesser in dry matter, which is associated with the reduced degree of maturity. All silages ensiled well though, with desirable pH mea-suresof≤4.0.Ethanolproduction,aswellasaceticand lactic acid concentrations, varied among treat-ments (Table 10.1). The major differences occurred between the temperate corn silage and the tropical silages, with the temperate corn silage greatest in ethanol and least in acetic and lactic acids. Some dif-ferences were evident within the tropical corn silages among planting dates, but differences were few.
When steer preferences between the two tropi-cal corn silages were compared for the May 15 (Evaluation 1), June 1 (Evaluation 2), and July 1 (Evaluation 3) planting dates, only silage from the July 1 planting showed a difference (Table 10.2). Clearly Dekalb 678C was preferred over Pioneer X304C. The comparison of the silages planted at different dates within Dekalb 678C (Evaluation 4) indicated that the July 1 planted silage was preferred over the earlier plantings. This comparison within Pioneer X304C was not conducted because of insuf-ficient silage. Comparison of the May 15 planting of temperate corn with the two tropical silages plant-ed on the same date showed no difference overall, However, the minimum significant difference test (MSD) indicates that the temperate was preferred over the tropical Pioneer X304C.
The nutritive value of the nine silages indicates differences among them in all constituents except crude protein (Table 10.3). As expected, temperate corn silage was greatest in in vitro dry matter disap-pearance and least in neutral detergent fiber and its constituent fiber fractions. This concurs with the short-term dry matter intake noted in the preference evaluation (Evaluation 5, Table 10.2). Within the tropical corn silages, Dekalb 678C planted July 1 had greatest in vitro dry matter disappearance compared with the May 15 and June 15 plantings and was also preferred (Evaluation 4, Table 10.2).
Summary and Conclusions• Allcornsilages,regardlessofcultivarandplant-
ing date, ensiled well and resulted in stable silages.
• Steersshowednopreferencebetweentropicalsilages planted May 15 and June 1 but preferred silage of Dekalb 678C over that of Pioneer X304C when planted July 1.
• WithinDekalb678C,theJulyplantingwaspre-ferred over plantings made May 15 and June 1.

Fermentation Characteristics, Nutritive Value, and Quality 57
Table 10.1. Dry matter (DM) and fermentation characteristics of temperate corn and tropical corn cultivars planted on four dates (DM basis).
Cultivars Planting DateDM
pHEthanol
Fatty Acids
Acetic Propionic Lactic
% ———————— %————————
Temperate corn:
Pioneer 3154 May 15 49.61 4.0 0.45 0.47 0.03 2.67
Tropical corn:
Dekalb 678C May 15 38.7 4.0 0.22 0.91 0.04 3.50
June 1 39.0 4.0 0.11 0.75 0.03 3.49
June 15 41.0 4.0 0.19 0.90 0.02 3.81
July 1 30.2 3.9 0.22 1.07 0.04 3.82
Pioneer X304C May 15 38.5 3.9 0.31 0.85 0.03 3.65
June 1 36.5 4.0 0.15 0.80 0.02 3.17
June 15 38.3 4.0 0.10 1.10 0.02 3.71
July 1 31.2 3.9 0.16 1.14 0.03 4.12
Significance (P):
Treatment <0.01 0.02 <0.01 <0.01 0.46 0.01
MSD2 4.0 0.1 0.09 0.19 0.03 0.641 Each value is the mean of three replicates.2 MSD = minimum significant difference from the Waller-Duncan k-ratio (k = 100) t-test and can be
used to compare any two treatments.

58 Annual Grasses Preserved as Silage:Ta
ble
10.2
. Pre
fere
nce
eval
uatio
ns (E
valu
atio
ns 1
thru
5) b
etw
een
and
amon
g te
mpe
rate
and
trop
ical
cul
tivar
s pl
ante
d at
diff
erin
g da
tes
(dry
mat
ter
basi
s).
Culti
vars
Plan
ting
Dat
e
Eval
uatio
n 11
Eval
uatio
n 21
Eval
uatio
n 31
Eval
uatio
n 41
Eval
uatio
n 52
DM
I3Ti
me
Rate
DM
ITi
me
Rate
DM
ITi
me
Rate
DM
ITi
me
Rate
DM
ITi
me
Rate
gm
ing/
min
gm
ing/
min
gm
ing/
min
gm
ing/
min
gm
ing/
min
Tem
pera
te c
orn:
Pion
eer 3
154
May
15
1595
a9.
2a16
0.7a
Trop
ical
cor
n:
Dek
alb
678C
May
15
1283
8.9
138.
548
3a4.
1ab13
8.0a
June
116
0014
.112
2.5
400a
3.0b
89.8
a
June
15
920ab
6.6a
111.
0a
July
126
6715
.018
1.0
1817
b11
.6a
157.
5a
Pion
eer X
304C
May
15
1100
7.9
182.
1
June
193
37.
712
0.4
June
15
570b
3.4a
92.0
a
July
111
70.
617
1.1
Sign
ifica
nce
(P):
Trea
tmen
t0.
840.
870.
390.
350.
350.
820.
03<0
.01
0.96
0.01
0.06
0.22
0.12
0.16
0.41
MSD
4-
--
--
--
--
820
7.6
93.6
1022
6.5
122.
31 Ea
ch v
alue
is th
e m
ean
of th
ree
repl
icat
es.
2 Ea
ch v
alue
is th
e m
ean
of fo
ur to
six
repl
icat
es.
3 D
MI =
dry
mat
ter i
ntak
e.4 M
SD =
min
imum
sig
nific
ant d
iffer
ence
from
the
Wal
ler-
Dun
can
k-ra
tio (k
= 1
00) t
-tes
t and
can
be
used
to c
ompa
re a
ny tw
o tr
eatm
ents
(mea
ns w
ith th
e sa
me
supe
rscr
ipt a
re s
imila
r).

Fermentation Characteristics, Nutritive Value, and Quality 59
Table 10.3. In vitro dry matter disappearance (IVDMD) and nutritive value1 of silages of temperate corn and tropical corn cultivars planted on four dates (dry matter basis).
CultivarsPlanting
Date
IVDMD CP NDF
Fiber Fractions
ADF HEMI CELL Lignin
———————————— % ———————————
Temperate corn:
Pioneer 3154 May 15 71.02 8.0 42.5 21.1 21.4 17.4 3.1
Tropical corn:
Dekalb 678C May 15 55.9 7.3 63.6 34.5 29.1 27.7 6.4
June 1 58.0 7.9 60.5 32.9 27.6 26.4 5.7
June 15 62.5 7.3 52.7 28.6 24.1 23.6 4.4
July 1 63.3 8.0 56.2 28.9 27.3 24.3 4.4
Pioneer X304C May 15 52.9 7.2 65.2 34.7 30.4 28.3 60
June 1 55.7 7.4 61.2 33.0 28.2 27.2 5.5
June 15 57.9 7.5 58.3 31.2 27.1 25.7 4.7
July 1 60.7 8.2 54.7 27.7 27.1 22.7 4.6
Significance (P):
Treatment <0.01 0.36 <0.01 <0.01 <0.01 <0.01 <0.01
MSD3 4.4 1.5 7.9 4.6 4.7 3.7 1.11 CP = crude protein; NDF = neutral detergent fiber; ADF = acid detergent fiber; HEMI = hemicellulose;
CELL = cellulose.2 Each value is the mean of three replicates.3 MSD = minimum significant difference from the Waller-Duncan k-ratio (k = 100) t-test and can be
used to compare any two treatments.
60 Annual Grasses Preserved as Silage:
Experiment 11. Silages of Temperate and Tropical Corns, Forage Sorghums, and Pearlmillet: Steer Preference
Corn, sorghum, and pearlmillet generally differ in morphology and in nutritive value representing extremes in proportions of leaf, stem, and grain. Our objectives in this two-year experiment were to determine if wide differences in morphology and subsequent fermentation characteristics would change silage nutritive value and if changes would be a major factor in altering steer preference for one silage over another.
Materials and MethodsA small plot experiment consisting of six forages seeded in 14-foot wide by 25-foot long plots in a ran-domized complete block design with four replicates served as the experimental forages. The plots were planted and harvested by conventional methods. The forage at harvest was packed into miniature silos using standard procedures (Appendix GP-1). The following six forages were ensiled and their silages evaluated in a series of preference evaluations:
Corn:Temperate corn:1. Pioneer 3156 (harvested September 17)Tropical corn:2. Pioneer 3098 (harvested September 30)3. Pioneer X304C (harvested September 30)
Forage sorghum:4. Intermediate normal—Pioneer 841F (harvested
September 17)5. Sweet sorghum—Brandies (harvested October
28)
Millet:6. Pearlmillet—Hybrid 3-mil-X (harvested
September 17)
A series of seven short-term preference evalu-ations involving two- and three-way comparisons were conducted (Appendix GP-5) using 500- to 800-pound steers. Each evaluation was conducted
as a randomized complete block design with four steer replicates. Each evaluation was conducted for 30 minutes. Silage intake and time devoted to eating were recorded, and total dry matter intake and intake rate (grams/minute) were determined.
A sample of each silage replicate (miniature silo) was obtained prior to feeding and analyzed for dry matter, fermentation characteristics, and nutritive value (Appendix GP-6). Data were analyzed statisti-cally according to the experimental design. When more than two treatment comparisons were made in an evaluation, a minimum significant difference was determined and included in the data table to separate differences among treatments (Appendix GP-7). This experiment was conducted over two years with each year presented separately.
Year 1Results and DiscussionThe morphological components of the representative cultivars evaluated in this experiment indicate a wide range in differences (Table 11.1). When expressed as a proportion of the total plant dry matter, temper-ate corn, of the three corn cultivars evaluated, had the least leaf and stalk but the most ear compared with tropical corns. Tropical corns were similar in morphology. The sorghums had similar propor-tion of leaf, but the normal forage sorghum (Pioneer 841F) had a greater proportion of head and lesser stem compared with Brandies sorghum. Pearlmillet, on the other hand, resembled Brandies sorghum in morphological components.
Dry matter concentration at ensiling var-ied among the representative cultivars with the corn silages greater than the forage sorghums and pearlmillet least (Table 11.2). However, all forages fermentedwellwithpHmeasuresof≤3.9.Althougha number of differences were noted among cultivars in fermentation characteristics, those characteristics most noticeable are the greatest ethanol concentra-tions in the Brandies sorghum silage and greatest concentrations of acetic and lactic acids present in the pearlmillet silage.
Among the temperate and tropical corn cultivars, steers preferred Pioneer X304C over 3098 tropical
Fermentation Characteristics, Nutritive Value, and Quality 61
corn and 3156 temperate corn (Table 11.3). No dif-ferences in preference, however, were noted among the forage sorghums and pearlmillet or between temperate corn and the forage sorghums. In two-way preference evaluations, steers showed no significant preference between the two tropical corns, forage sorghums, or between tropical corn and pearlmillet or temperate corn and pearlmillet (Table 11.4).
A number of differences, as measured by nutritive value, existed among the cultivars evaluated (Table 11.5). But these nutritive differences, along with dif-ferences in fermentation characteristics (Table 11.2), apparently had little influence on animal acceptance. Steers in general showed little preference among or between the various silages evaluated.
Summary and Conclusions• AllsixsilagesensiledwellwithdesirablepH
measuresof≤3.9.• Fermentationcharacteristicsandnutritivevalue
differed appreciably among the six silages but apparently not of sufficient magnitudes to alter steer preference.
• Amongthecorncultivars,steerspreferredthetropical Pioneer X304C over the other tropical (Pioneer 3098) and temperate (Pioneer 3156) cultivars.
• Theseresultswouldsupportuseofanyofthecultivars as a potential forage silage.
Year 2Results and DiscussionThe cultivars varied in dry matter concentration at ensiling with the corn cultivars generally greater compared with the sorghums or pearlmillet (Table 11.6). However, all six silages fermented well with pH measuresof≤4.0,althoughsomesignificantdiffer-ences were noted.
Although many differences were noted among the fermentation characteristics, except for butyric and isobutyric acid concentrations, the noted dif-ferences are the greater concentration of ethanol in the Brandies sorghum followed at some distance by temperate corn, with the least ethanol found in the tropical corns (Table 11.6). Also, the Brandies sor-
ghum had the greatest concentrations of lactic acid followed by pearlmillet and the corns.
Steer preference, whether in the three-way com-parisons (Table 11.7) or two-way comparisons (Table 11.8), was always in favor of temperate corn with greatest dry matter intake and time devoted to eating. No preference was noted between the two tropical corns, whereas the intermediate sorghum was generally preferred over Brandies sorghum (exception is Evaluation 2, Table 11.7). It is noted that of theses six silages, four (Pioneer 3156 and X304C corn and Pioneer 841F and Brandies forage sorghum) were evaluated for dry matter intake and digestibility (See Experiment 5A, Table 5.2).The strong preference for temperate corn silage over the other silages is evident when examining the in vitro true dry matter disappearance and composition of the silages (Table 11.9). Temperate corn has the greatest in vitro true dry matter disappearance and the least neutral detergent fiber compared with the other silages.
Summary and Conclusions• Allsixforagesfermentedwellresultinginstable
silages with pH measures of 4.0 or less.• Silagesoftemperatecornweregenerallypre-
ferred over the silages of the other cultivars.• Nopreferencewasdemonstratedforsilagefrom
one tropical corn over the other tropical corn.• Silageofintermediateforagesorghumwas
generally preferred over silage of Brandies for-age sorghum, but differences were not always significant.
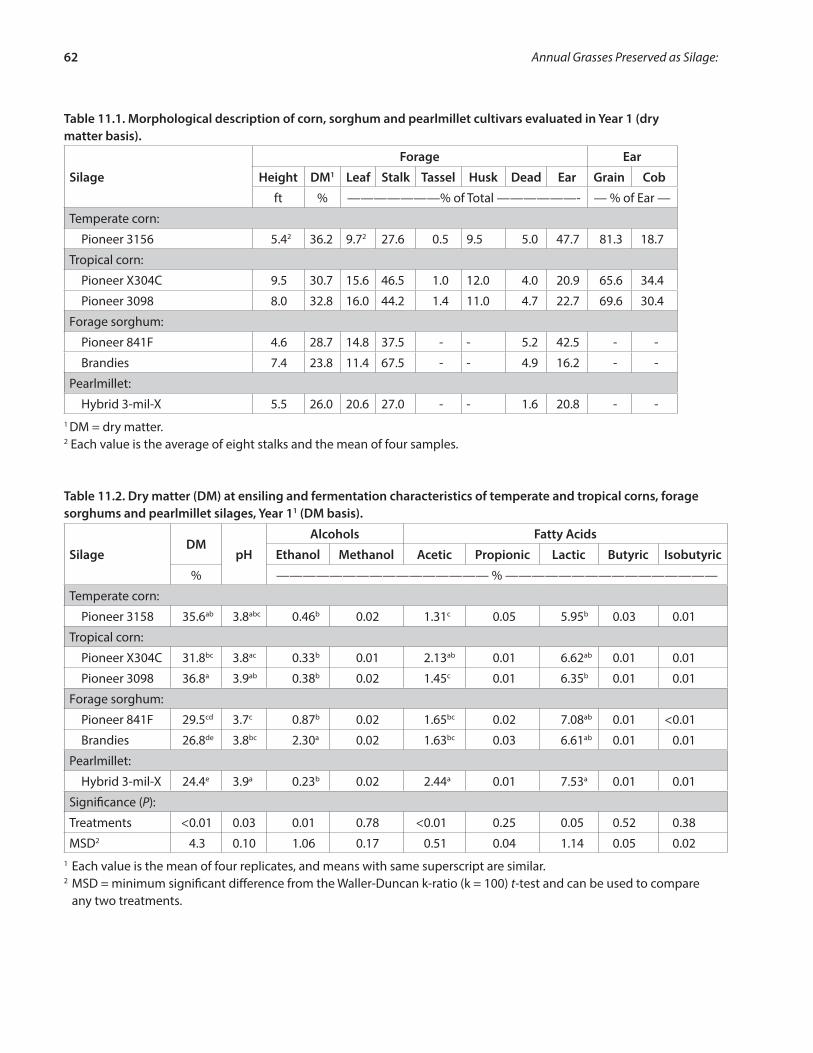
62 Annual Grasses Preserved as Silage:
Table 11.1. Morphological description of corn, sorghum and pearlmillet cultivars evaluated in Year 1 (dry matter basis).
Silage
Forage Ear
Height DM1 Leaf Stalk Tassel Husk Dead Ear Grain Cob
ft % ———————% of Total ——————- — % of Ear —
Temperate corn:
Pioneer 3156 5.42 36.2 9.72 27.6 0.5 9.5 5.0 47.7 81.3 18.7
Tropical corn:
Pioneer X304C 9.5 30.7 15.6 46.5 1.0 12.0 4.0 20.9 65.6 34.4
Pioneer 3098 8.0 32.8 16.0 44.2 1.4 11.0 4.7 22.7 69.6 30.4
Forage sorghum:
Pioneer 841F 4.6 28.7 14.8 37.5 - - 5.2 42.5 - -
Brandies 7.4 23.8 11.4 67.5 - - 4.9 16.2 - -
Pearlmillet:
Hybrid 3-mil-X 5.5 26.0 20.6 27.0 - - 1.6 20.8 - -1 DM = dry matter.2 Each value is the average of eight stalks and the mean of four samples.
Table 11.2. Dry matter (DM) at ensiling and fermentation characteristics of temperate and tropical corns, forage sorghums and pearlmillet silages, Year 11 (DM basis).
SilageDM
pH
Alcohols Fatty Acids
Ethanol Methanol Acetic Propionic Lactic Butyric Isobutyric
% ———————————————— % ————————————————
Temperate corn:
Pioneer 3158 35.6ab 3.8abc 0.46b 0.02 1.31c 0.05 5.95b 0.03 0.01
Tropical corn:
Pioneer X304C 31.8bc 3.8ac 0.33b 0.01 2.13ab 0.01 6.62ab 0.01 0.01
Pioneer 3098 36.8a 3.9ab 0.38b 0.02 1.45c 0.01 6.35b 0.01 0.01
Forage sorghum:
Pioneer 841F 29.5cd 3.7c 0.87b 0.02 1.65bc 0.02 7.08ab 0.01 <0.01
Brandies 26.8de 3.8bc 2.30a 0.02 1.63bc 0.03 6.61ab 0.01 0.01
Pearlmillet:
Hybrid 3-mil-X 24.4e 3.9a 0.23b 0.02 2.44a 0.01 7.53a 0.01 0.01
Significance (P):
Treatments <0.01 0.03 0.01 0.78 <0.01 0.25 0.05 0.52 0.38
MSD2 4.3 0.10 1.06 0.17 0.51 0.04 1.14 0.05 0.021 Each value is the mean of four replicates, and means with same superscript are similar.2 MSD = minimum significant difference from the Waller-Duncan k-ratio (k = 100) t-test and can be used to compare
any two treatments.

Fermentation Characteristics, Nutritive Value, and Quality 63
Table 11.3. Preference evaluations (Evaluations 1 thru 3) comparing silages of three cultivars at a time, Year 11 (dry matter basis).
Silage
Evaluation 1 Evaluation 2 Evaluation 3
DMI2 Time Rate DMI Time Rate DMI Time Rate
g min g/min g min g/min g min g/min
Temperate corn:
Pioneer 3156 63b 0.9b 109.1 125 2.8 49.3
Tropical corn:
Pioneer X304C 913a 11.4a 79.9
Pioneer 308 117b 1.3b 113.9
Forage sorghum:
Pioneer 841F 1,137 6.7 132.4a 925 9.1 83.5
Brandies 235 3.1 55.7ab 415 4.7 74.5
Pearlmillet:
Hybrid 3-mil-X 170 3.3 27.3b
Significance (P):
Treatments <0.01 <0.01 0.88 0.30 0.62 0.06 0.43 0.53 0.69
MSD3 288 3.5 199 1,685 11.0 93.3 1,576 14.9 108.91 Each value is the mean of four replicates, and means with the same superscript are similar.2 DMI = dry matter intake.3 MSD = minimum significant difference from the Waller-Duncan k-ratio (k = 100) t-test and can be used to compare
any two treatments.
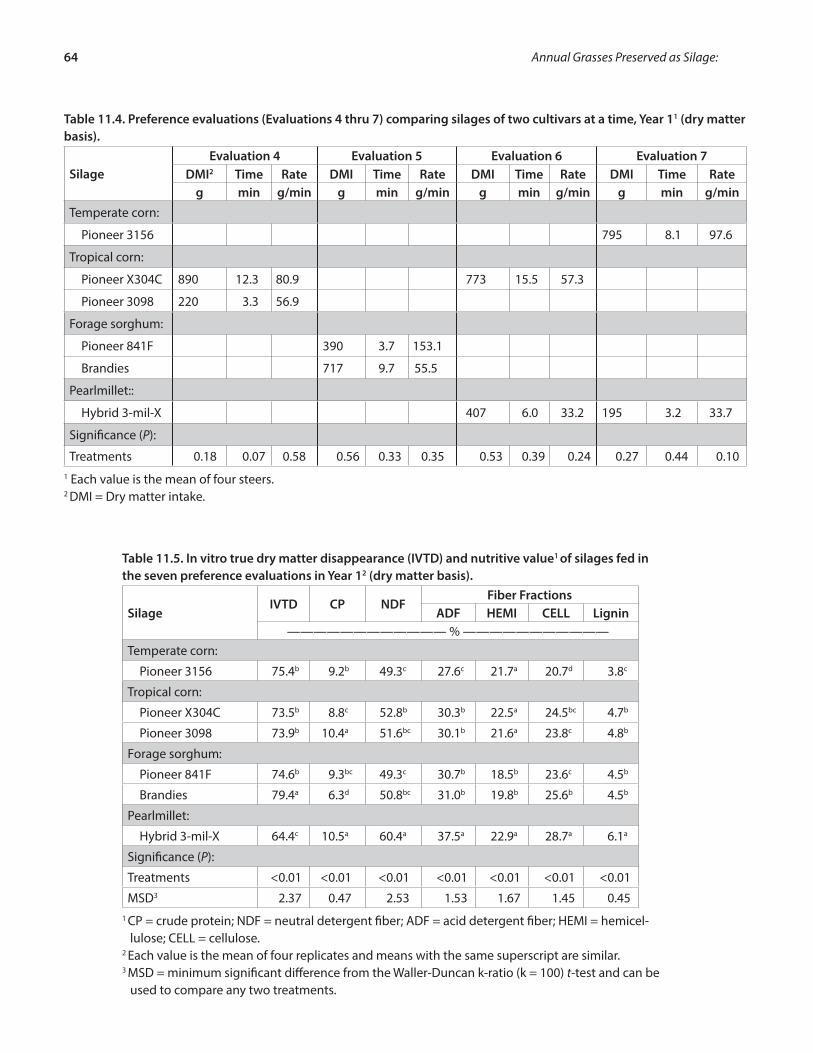
64 Annual Grasses Preserved as Silage:
Table 11.4. Preference evaluations (Evaluations 4 thru 7) comparing silages of two cultivars at a time, Year 11 (dry matter basis).
SilageEvaluation 4 Evaluation 5 Evaluation 6 Evaluation 7
DMI2 Time Rate DMI Time Rate DMI Time Rate DMI Time Rateg min g/min g min g/min g min g/min g min g/min
Temperate corn:
Pioneer 3156 795 8.1 97.6
Tropical corn:
Pioneer X304C 890 12.3 80.9 773 15.5 57.3
Pioneer 3098 220 3.3 56.9
Forage sorghum:
Pioneer 841F 390 3.7 153.1
Brandies 717 9.7 55.5
Pearlmillet::
Hybrid 3-mil-X 407 6.0 33.2 195 3.2 33.7
Significance (P):
Treatments 0.18 0.07 0.58 0.56 0.33 0.35 0.53 0.39 0.24 0.27 0.44 0.101 Each value is the mean of four steers.2 DMI = Dry matter intake.
Table 11.5. In vitro true dry matter disappearance (IVTD) and nutritive value1 of silages fed in the seven preference evaluations in Year 12 (dry matter basis).
SilageIVTD CP NDF
Fiber FractionsADF HEMI CELL Lignin
———————————— % ———————————Temperate corn:
Pioneer 3156 75.4b 9.2b 49.3c 27.6c 21.7a 20.7d 3.8c
Tropical corn:
Pioneer X304C 73.5b 8.8c 52.8b 30.3b 22.5a 24.5bc 4.7b
Pioneer 3098 73.9b 10.4a 51.6bc 30.1b 21.6a 23.8c 4.8b
Forage sorghum:
Pioneer 841F 74.6b 9.3bc 49.3c 30.7b 18.5b 23.6c 4.5b
Brandies 79.4a 6.3d 50.8bc 31.0b 19.8b 25.6b 4.5b
Pearlmillet:
Hybrid 3-mil-X 64.4c 10.5a 60.4a 37.5a 22.9a 28.7a 6.1a
Significance (P):
Treatments <0.01 <0.01 <0.01 <0.01 <0.01 <0.01 <0.01
MSD3 2.37 0.47 2.53 1.53 1.67 1.45 0.451 CP = crude protein; NDF = neutral detergent fiber; ADF = acid detergent fiber; HEMI = hemicel-
lulose; CELL = cellulose.2 Each value is the mean of four replicates and means with the same superscript are similar.3 MSD = minimum significant difference from the Waller-Duncan k-ratio (k = 100) t-test and can be
used to compare any two treatments.
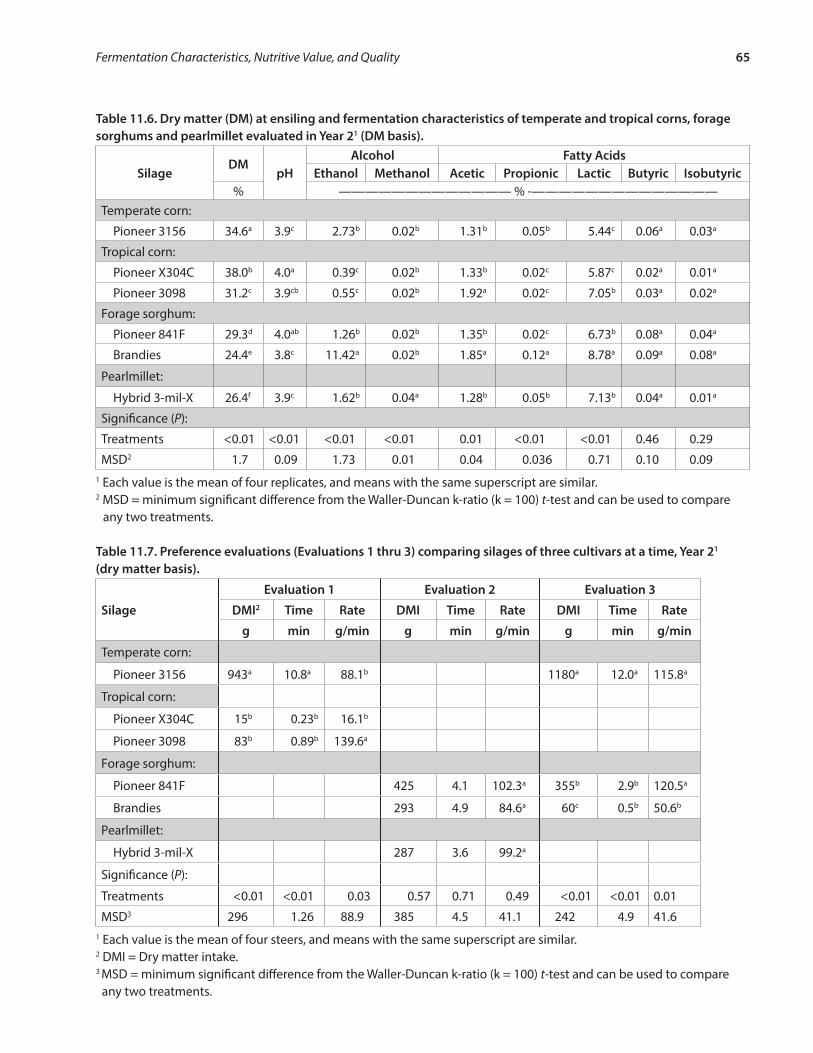
Fermentation Characteristics, Nutritive Value, and Quality 65
Table 11.6. Dry matter (DM) at ensiling and fermentation characteristics of temperate and tropical corns, forage sorghums and pearlmillet evaluated in Year 21 (DM basis).
SilageDM
pHAlcohol Fatty Acids
Ethanol Methanol Acetic Propionic Lactic Butyric Isobutyric% ————————————— % -——————————————
Temperate corn:
Pioneer 3156 34.6a 3.9c 2.73b 0.02b 1.31b 0.05b 5.44c 0.06a 0.03a
Tropical corn:
Pioneer X304C 38.0b 4.0a 0.39c 0.02b 1.33b 0.02c 5.87c 0.02a 0.01a
Pioneer 3098 31.2c 3.9cb 0.55c 0.02b 1.92a 0.02c 7.05b 0.03a 0.02a
Forage sorghum:
Pioneer 841F 29.3d 4.0ab 1.26b 0.02b 1.35b 0.02c 6.73b 0.08a 0.04a
Brandies 24.4e 3.8c 11.42a 0.02b 1.85a 0.12a 8.78a 0.09a 0.08a
Pearlmillet:
Hybrid 3-mil-X 26.4f 3.9c 1.62b 0.04a 1.28b 0.05b 7.13b 0.04a 0.01a
Significance (P):
Treatments <0.01 <0.01 <0.01 <0.01 0.01 <0.01 <0.01 0.46 0.29
MSD2 1.7 0.09 1.73 0.01 0.04 0.036 0.71 0.10 0.091 Each value is the mean of four replicates, and means with the same superscript are similar.2 MSD = minimum significant difference from the Waller-Duncan k-ratio (k = 100) t-test and can be used to compare
any two treatments.
Table 11.7. Preference evaluations (Evaluations 1 thru 3) comparing silages of three cultivars at a time, Year 21 (dry matter basis).
Silage
Evaluation 1 Evaluation 2 Evaluation 3
DMI2 Time Rate DMI Time Rate DMI Time Rate
g min g/min g min g/min g min g/min
Temperate corn:
Pioneer 3156 943a 10.8a 88.1b 1180a 12.0a 115.8a
Tropical corn:
Pioneer X304C 15b 0.23b 16.1b
Pioneer 3098 83b 0.89b 139.6a
Forage sorghum:
Pioneer 841F 425 4.1 102.3a 355b 2.9b 120.5a
Brandies 293 4.9 84.6a 60c 0.5b 50.6b
Pearlmillet:
Hybrid 3-mil-X 287 3.6 99.2a
Significance (P):
Treatments <0.01 <0.01 0.03 0.57 0.71 0.49 <0.01 <0.01 0.01
MSD3 296 1.26 88.9 385 4.5 41.1 242 4.9 41.61 Each value is the mean of four steers, and means with the same superscript are similar.2 DMI = Dry matter intake.3 MSD = minimum significant difference from the Waller-Duncan k-ratio (k = 100) t-test and can be used to compare
any two treatments.
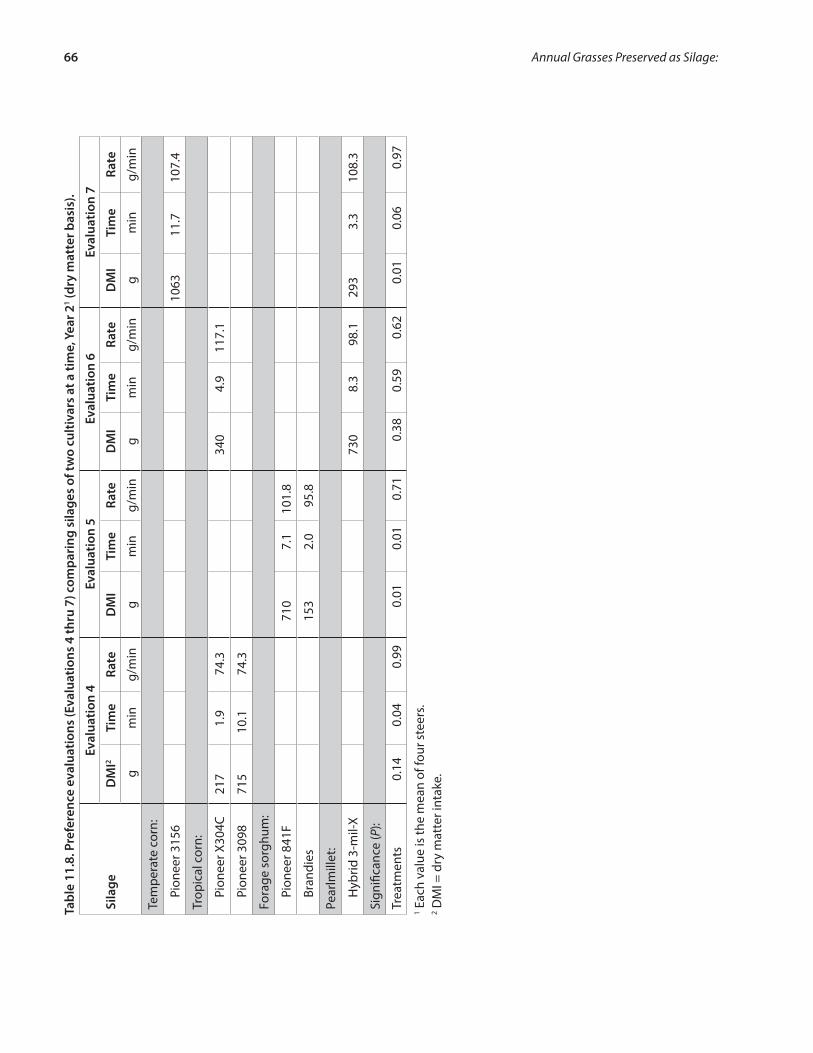
66 Annual Grasses Preserved as Silage:Ta
ble
11.8
. Pre
fere
nce
eval
uatio
ns (E
valu
atio
ns 4
thru
7) c
ompa
ring
sila
ges
of tw
o cu
ltiva
rs a
t a ti
me,
Yea
r 21 (d
ry m
atte
r bas
is).
Sila
ge
Eval
uatio
n 4
Eval
uatio
n 5
Eval
uatio
n 6
Eval
uatio
n 7
DM
I2Ti
me
Rate
DM
ITi
me
Rate
DM
ITi
me
Rate
DM
ITi
me
Rate
gm
ing/
min
gm
ing/
min
gm
ing/
min
gm
ing/
min
Tem
pera
te c
orn:
Pion
eer 3
156
1063
11.7
107.
4
Trop
ical
cor
n:
Pion
eer X
304C
217
1.9
74.3
340
4.9
117.
1
Pion
eer 3
098
715
10.1
74.3
Fora
ge s
orgh
um:
Pion
eer 8
41F
710
7.1
101.
8
Bran
dies
153
2.0
95.8
Pear
lmill
et:
Hyb
rid 3
-mil-
X73
08.
398
.129
33.
310
8.3
Sign
ifica
nce
(P):
Trea
tmen
ts0.
140.
040.
990.
010.
010.
710.
380.
590.
620.
010.
060.
971 E
ach
valu
e is
the
mea
n of
four
ste
ers.
2 DM
I = d
ry m
atte
r int
ake.

Fermentation Characteristics, Nutritive Value, and Quality 67
Table 11.9. In vitro true dry matter disappearance (IVTD) and nutritive value1 of silages fed in the seven preference evaluations in Year 22 (dry matter basis).
Silage IVTD CP NDF
Fiber Fractions
ADF HEMI CELL Lignin
———————————— % ————————————
Temperate corn:
Pioneer 3156 83.1a 8.24a 40.1c 20.1e 18.0b 16.6c 3.1f
Tropical corn:
Pioneer X304C 74.8bc 8.37a 48.8b 29.0c 22.4a 23.4b 5.2c
Pioneer 3098 75.3bc 8.42a 49.2b 29.1c 22.5a 23.6b 4.9d
Forage sorghum:
Pioneer 841F 77.4b 8.56a 36.3d 22.5b 15.1c 17.7c 3.9e
Brandies 71.4c 5.43b 57.5a 36.7b 23.9a 29.5a 6.0b
Pearlmillet:
Hybrid 3-mil-X 66.4d 7.82 60.1a 38.5a 23.5a 30.6a 6.6a
Significance (P):
Treatments <0.01 <0.01 <0.01 <0.01 <0.01 <0.01 <0.01
MSD3 4.51 0.86 2.74 1.51 1.48 1.27 0.211 CP = crude protein; NDF = neutral detergent fiber; ADF = acid detergent fiber; HEMI
= hemicellulose; CELL = cellulose.2 Each value is the mean of four replicates, and means with the same superscript are
similar.3 MSD = minimum significant difference from the Waller-Duncan k-ratio (k = 100) t-
test and can be used to compare any two treatments.

68 Annual Grasses Preserved as Silage:
Experiment 12. Corn and Sorghum Forage Types and Cultivars Ensiled at Differing Maturities: Steer Preference
The morphology and nutritive value of forages change with advancing maturity. This is especially evident for forages that produce a grain component, as occurs with corn, sorghum, and millets. Increasing the grain components further alters ensiling char-acteristics such as volatile fatty acid concentrations. In this experiment, we evaluated the preference by steers for a temperate corn, four tropical corn cul-tivars, and a sweet forage sorghum cultivar when ensiled at several maturities.
Material and MethodsA small-plot experiment was conducted consist-ing of six forage cultivars planted in 14-foot wide by 25-foot long plots in a randomized complete block design with three replicates. These plots provided the experimental forage. The plots were planted and harvested by conventional methods and the forage packed into miniature silos using standard proce-dures (Appendix GP-1). The silos were stored under cover, being undisturbed for at least 60 days prior to opening, and the silages were used in a series of pref-erence evaluations.
The forages consisted of the temperate corn Pioneer 3156; tropical corns Dekalb 678C, Pioneer X304C, Dekalb 660XL, and Pioneer 3098; and Brandies forage sorghum. Each cultivar was planted early or late and harvested early or late, or both, giv-ing 19 treatment combinations as delineated in Table 12.1. The early-harvested corn was ensiled in the early-milk stage and the late-harvested corn ensiled in the late-dent stage. The early harvested Brandies sorghum was ensiled in the boot stage and the late-harvested sorghum was ensiled when fully headed. At time of harvest, estimates of forage height (10 measurements per plot) and dry matter yield (10-foot strips) were obtained, and samples (five stalks per plot) were taken and separated into morphologi-cal components.
A series of short-term preference evaluations were conducted (Appendix GP-5). Because of limited
quantities of silage, especially of those that are gen-erally preferred, comparisons were initially limited with priority given to preference evaluations among management strategies (seeding date and harvest date) within cultivar. Preference was determined with steers weighing 500 to 800 pounds. Each evalu-ation was conducted as a randomized block design with five steer replicates. Each evaluation was con-ducted for 30 minutes, silage intake and time devoted to eating were recorded, and total dry matter intake and intake rate (grams/minute) determined.
At feeding the silos were opened and any surface mold removed. A sample of each silage replicate (miniature silo) was obtained and analyzed for dry matter, fermentation characteristics, and nutri-tive value (Appendix GP-6). Data were analyzed statistically according to the experimental design (Appendix GP-7). When more than two treatment comparisons were made in an evaluation, a mini-mum significant difference was determined and included in the data table to separate difference among treatments (Appendix GP-7).
Results and DiscussionThe height, yield potential, and morphological description of the 19 silages evaluated in this experi-ment reveal the wide degree of variation present (Table 12.2). Dry matter concentration and fermen-tation characteristics were also generally different (P < 0.01) among experimental silages and consis-tent with the ranges in planting and harvesting date (Table 12.2).
Dry matter differences ranged from a least of about 19% (Treatments 4, 8, and 16) to the great-est of about 42% (Treatment 1; Table 12.3). The pH measuresofallsilages,however,were≤4.0—rangingfrom 3.7 for Pioneer X304C silage planted early and ensiled early (Treatment 8) to 4.0 for temperate corn silage also planted early and ensiled early (Treatment 1). The pH measures of all silages indicate a stable preservation. Ethanol was produced in all silages, with the least concentrations present in temperate corn (Treatment 1) and the most in Brandies for-age sorghum (Table 12.3, Treatments 18 and 19).
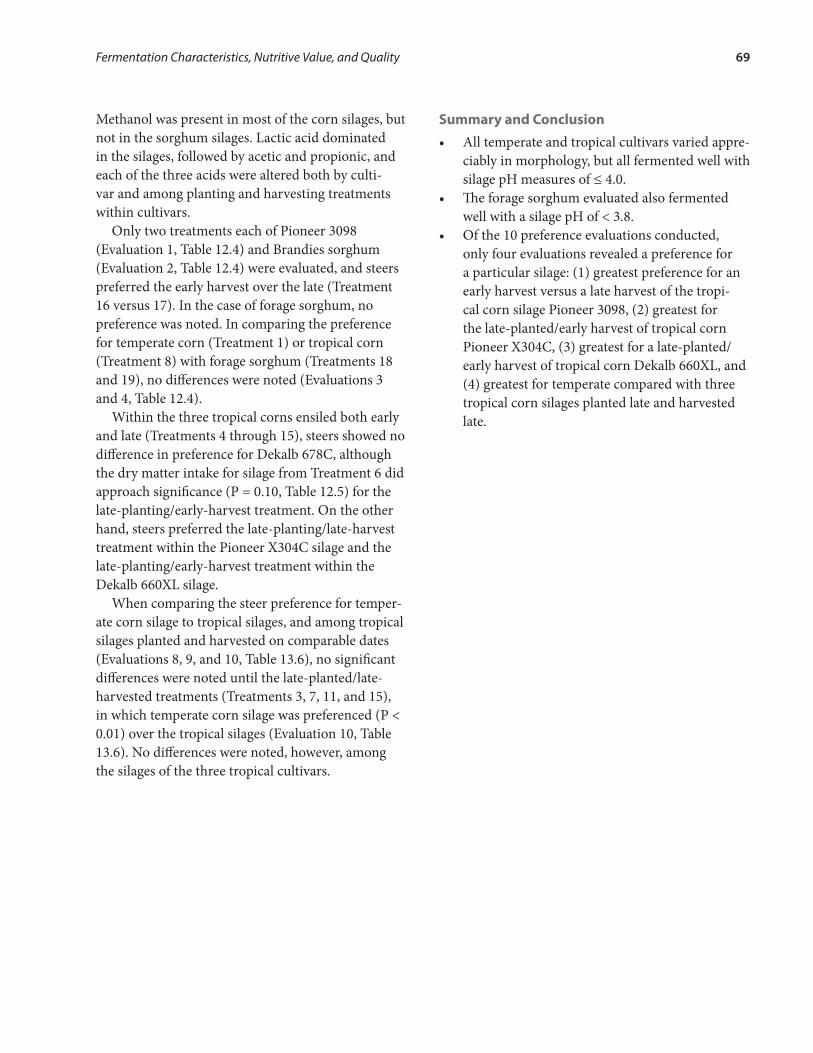
Fermentation Characteristics, Nutritive Value, and Quality 69
Methanol was present in most of the corn silages, but not in the sorghum silages. Lactic acid dominated in the silages, followed by acetic and propionic, and each of the three acids were altered both by culti-var and among planting and harvesting treatments within cultivars.
Only two treatments each of Pioneer 3098 (Evaluation 1, Table 12.4) and Brandies sorghum (Evaluation 2, Table 12.4) were evaluated, and steers preferred the early harvest over the late (Treatment 16 versus 17). In the case of forage sorghum, no preference was noted. In comparing the preference for temperate corn (Treatment 1) or tropical corn (Treatment 8) with forage sorghum (Treatments 18 and 19), no differences were noted (Evaluations 3 and 4, Table 12.4).
Within the three tropical corns ensiled both early and late (Treatments 4 through 15), steers showed no difference in preference for Dekalb 678C, although the dry matter intake for silage from Treatment 6 did approach significance (P = 0.10, Table 12.5) for the late-planting/early-harvest treatment. On the other hand, steers preferred the late-planting/late-harvest treatment within the Pioneer X304C silage and the late-planting/early-harvest treatment within the Dekalb 660XL silage.
When comparing the steer preference for temper-ate corn silage to tropical silages, and among tropical silages planted and harvested on comparable dates (Evaluations 8, 9, and 10, Table 13.6), no significant differences were noted until the late-planted/late-harvested treatments (Treatments 3, 7, 11, and 15), in which temperate corn silage was preferenced (P < 0.01) over the tropical silages (Evaluation 10, Table 13.6). No differences were noted, however, among the silages of the three tropical cultivars.
Summary and Conclusion• Alltemperateandtropicalcultivarsvariedappre-
ciably in morphology, but all fermented well with silagepHmeasuresof≤4.0.
• Theforagesorghumevaluatedalsofermentedwell with a silage pH of < 3.8.
• Ofthe10preferenceevaluationsconducted,only four evaluations revealed a preference for a particular silage: (1) greatest preference for an early harvest versus a late harvest of the tropi-cal corn silage Pioneer 3098, (2) greatest for the late-planted/early harvest of tropical corn Pioneer X304C, (3) greatest for a late-planted/early harvest of tropical corn Dekalb 660XL, and (4) greatest for temperate compared with three tropical corn silages planted late and harvested late.

70 Annual Grasses Preserved as Silage:
Table 12.1. Description of treatments designating early (E) and late (L) dates for both planting and harvesting of each cultivar used in preference evaluations.
ForageTreatment Plant Harvest
No. Description1 Early Late Early LateTemperate corn:
Pioneer 3156 1 E/E Apr 20 - Aug 16 -
2 L/E - June 1 Aug 23 -
3 L/L - June 1 - Sept 6
Tropical corn:
Dekalb 678C 4 E/E May 25 - Aug 30 -
5 E/L May 25 - - Sept 21
6 L/E - June 15 Sept 14 -
7 L/L - June 15 - Oct 6
Pioneer X304C 8 E/E May 25 - Aug 30 -
9 E/L May 25 - - Sept 21
10 L/E - June 15 Sept 14 -
11 L/L - June 15 - Oct 6
DeKalb 660XL 12 E/E May 25 - Aug 30 -
13 E/L May 25 - - Sept 21
14 L/E - June 15 Sept 14 -
15 L/L - June 15 - Oct 6
Pioneer 3098 16 L/E - June 20 Sept 6 -
17 L/L - June 20 - Oct 6
Forage sorghum:
Brandies 18 E/E May 26 - Sept 14 -
19 E/L May 26 - - Oct 191E = early and L = late, which refers to plant/harvest sequence; i.e., E/L is read “planted early and harvested late.”

Fermentation Characteristics, Nutritive Value, and Quality 71
Tabl
e 12
.2. H
eigh
t, yi
eld
and
mor
phol
ogic
al c
ompo
nent
s of
cor
n an
d so
rghu
m c
ultiv
ar u
sed
in s
ilage
eva
luat
ions
(dry
mat
ter b
asis
).
Fora
geTr
eatm
ent
Hei
ght
Yiel
dFo
rage
Ear
No.
Des
c. 1
Leaf
Stal
kTa
ssel
Hus
kD
ead
Ear (
Hea
d)G
rain
Cob
ftto
ns/a
c—
——
——
——
——
— %
of t
otal
dry
mat
ter —
——
——
——
% o
f Ear
—-
Tem
pera
te c
orn:
Pion
eer 3
156
1E/
E9.
226.
33.
228
.20.
58.
17.
752
.383
.316
.7
2L/
E8.
34.
624
.335
.61.
216
.30.
122
.547
.452
.6
3L/
L8.
05.
318
.348
.10.
411
.70.
321
.257
.942
.1
Trop
ical
cor
n:
Dek
alb
678C
4
E/E
9.3
5.1
22.6
46.5
1.2
15.2
0.6
13.9
40.9
59.1
5E/
L7.
67.
117
.932
.40.
812
.10.
935
.971
.328
.7
6L/
E7.
64.
121
.340
.01.
417
.10.
619
.648
.851
.2
7L/
L8.
65.
512
.726
.70.
613
.41.
645
.078
.321
.7
Pion
eer X
304C
8
E/E
11.1
5.1
21.2
55.0
1.2
12.5
2.0
8.1
45.2
54.8
9E/
L10
.07.
814
.746
.01.
010
.13.
524
.775
.025
.0
10L/
E9.
55.
218
.848
.61.
713
.01.
316
.650
.249
.8
11L/
L10
.47.
09.
735
.81.
09.
84.
439
.380
.020
.0
Dek
alb
660X
L 12
E/E
8.8
4.8
24.3
47.9
1.5
13.1
2.9
10.3
44.4
55.6
13E/
L7.
76.
918
.236
.51.
110
.94.
428
.973
.326
.7
14L/
E7.
64.
520
.431
.91.
617
.10.
628
.466
.733
.3
15L/
L9.
06.
213
.628
.41.
110
.52.
643
.883
.016
.3
Pion
eer 3
098
16L/
E7.
93.
521
.744
.92.
316
.60.
514
.041
.158
.9
17L/
L8.
94.
213
.731
.21.
210
.21.
841
.979
.021
.0
Fora
ge s
orgh
um:
Bran
dies
18E/
E7.
44.
819
.575
.6-
-3.
5(1
.4)
--
19E/
L9.
27.
113
.272
.8-
-2.
7(1
1.3)
--
Sign
ifica
nce
(P):
Trea
tmen
t<0
.01
<0.0
1<0
.01
<0.0
1<0
.01
<0.0
1<0
.01
<0.0
1(0.
02)
<0.0
1<0
.01
MSD
30.
51.
13.
46.
50.
42.
98.
05.
514
.58.
51
Des
c. =
des
crip
tion,
E =
early
, and
L =
late
, whi
ch re
fers
to p
lant
/har
vest
seq
uenc
e; i.
e., E
/L is
read
“pla
nted
ear
ly a
nd h
arve
sted
late
.” See
Ta
ble
12.1
for d
etai
ls.
2 Eac
h va
lue
is th
e av
erag
e of
five
sta
lks
and
the
mea
n of
thre
e re
plic
ates
.3
MSD
= m
inim
um s
igni
fican
t diff
eren
ce fr
om th
e W
alle
r-D
unca
n k-
ratio
(k =
100
) t-t
est a
nd c
an b
e us
ed to
com
pare
any
two
trea
tmen
ts.

72 Annual Grasses Preserved as Silage:Ta
ble
12.3
. Dry
mat
ter (
DM
) and
ferm
enta
tion
char
acte
rist
ics
of e
ach
sila
ge u
sed
in p
refe
renc
e ev
alua
tions
(DM
bas
is).
Sila
ge
Trea
tmen
tD
MpH
Alc
ohol
sFa
tty
Aci
ds
No.
Des
c.1
Etha
nol
Met
ha-
nol
Ace
ticPr
opio
nic
Lact
icBu
tyri
cIs
obut
yric
%—
——
——
——
——
——
——
——
% —
——
——
——
——
——
——
—Te
mpe
rate
cor
n:Pi
onee
r 315
61
E/E
42.4
24.
00.
820.
020.
790.
032.
970.
290.
012
L/E
23.7
3.7
4.66
0.05
1.99
0.12
8.15
0.01
0.00
3L/
L27
.33.
83.
860.
031.
650.
127.
510.
000.
01Tr
opic
al c
orn:
Dek
alb
678C
4
E/E
19.9
3.7
3.03
0.06
1.67
0.08
9.72
0.01
0.00
5E/
L27
.73.
81.
250.
031.
940.
017.
800.
000.
006
L/E
20.6
3.8
3.76
0.03
1.40
0.07
8.71
0.00
0.00
7L/
L27
.63.
81.
050.
021.
560.
006.
800.
000.
00Pi
onee
r X30
4C
8E/
E19
.33.
73.
010.
052.
190.
099.
690.
020.
009
E/L
27.3
3.8
1.88
0.03
2.24
0.04
7.53
0.00
0.00
10L/
E21
.33.
82.
730.
001.
500.
098.
610.
000.
0211
L/L
30.7
3.8
1.95
0.01
1.61
0.06
6.45
0.00
0.00
Dek
alb
660X
L 12
E/E
20.2
3.7
2.22
0.05
2.40
0.04
10.5
90.
010.
0113
E/L
27.5
3.8
1.55
0.03
1.73
0.04
8.11
0.00
0.00
14L/
E23
.63.
82.
480.
042.
440.
069.
300.
040.
0015
L/L
30.7
3.8
0.97
0.03
1.93
0.01
6.51
0.00
0.00
Pion
eer 3
098
16L/
E19
.63.
72.
560.
021.
970.
009.
480.
000.
0017
L/L
25.5
3.8
1.30
0.00
1.67
0.03
7.46
0.00
0.00
Fora
ge s
orgh
um:
Bran
dies
(Sw
eet)
18E/
E16
.43.
76.
430.
002.
330.
1012
.29
0.00
0.00
19E/
L22
.13.
75.
210.
002.
920.
118.
020.
000.
03Si
gnifi
canc
e (P
):Tr
eatm
ent
<0.0
1<0
.01
<0.0
10.
03<0
.01
<0.0
1<0
.01
<0.0
10.
58M
SD3
1.8
0.07
1.10
0.05
0.56
0.05
0.88
0.04
0.05
14D
esc.
= d
escr
iptio
n, E
= ea
rly, a
nd L
= la
te, w
hich
refe
rs to
pla
nt/h
arve
st s
eque
nce;
i.e.
, E/L
is re
ad “p
lant
ed e
arly
and
har
vest
ed la
te.”
See
Tabl
e 12
.1 fo
r det
ails
.2
4 Each
val
ue is
the
mea
n of
thre
e re
plic
ates
.3
4 MSD
= m
inim
um s
igni
fican
t diff
eren
ce fr
om th
e W
alle
r-D
unca
n k-
ratio
(k =
100
) t-t
est a
nd c
an b
e us
ed to
com
pare
any
two
trea
t-m
ents
.

Fermentation Characteristics, Nutritive Value, and Quality 73
Tabl
e 12
.4. P
refe
renc
e ev
alua
tions
(Eva
luat
ions
1 th
ru 4
) com
pari
ng e
ither
two
or th
ree
tem
pera
te a
nd tr
opic
al c
orn
or fo
rage
sor
ghum
sila
ges
at a
tim
e (d
ry m
atte
r bas
is)
Sila
ge
Trea
tmen
tEv
alua
tion
1Ev
alua
tion
2Ev
alua
tion
3Ev
alua
tion
4
No.
Des
c.1
DM
I2Ti
me
Rate
DM
ITi
me
Rate
DM
ITi
me
Rate
DM
ITi
me
Rate
gm
ing/
min
gm
ing/
min
gm
ing/
min
gm
ing/
min
Tem
pera
te c
orn:
Pion
eer 3
156
1E/
E23
235.
334
.0
Trop
ical
cor
n:
Pion
eer X
304C
8E/
E14
632.
347
.1
Pion
eer 3
098
16L/
E49
236.
676
.1
Pion
eer 3
098
17L/
L22
0.4
14.5
Fora
ge s
orgh
um:
Bran
dies
18E/
E42
835.
584
.320
63.
559
.740
05.
656
.5
Bran
dies
19E/
L15
81.
853
.016
82.
473
.411
20.
635
.6
Sign
ifica
nce
(P):
Trea
tmen
ts<0
.01
<0.0
10.
040.
150.
110.
250.
880.
480.
240.
300.
210.
87
MSD
4-
--
--
-35
26.
255
.648
46.
710
7.3
1 D
esc.
= d
escr
iptio
n, E
= ea
rly, a
nd L
= la
te, w
hich
refe
rs to
pla
nt/h
arve
st s
eque
nce;
i.e.
, E/L
is re
ad “p
lant
ed e
arly
and
har
vest
ed la
te.” S
ee T
able
12.
1 fo
r de
tails
.2 D
MI =
dry
mat
ter i
ntak
e3
Each
val
ue is
the
mea
n of
five
ste
ers.
4 M
SD =
min
imum
sig
nific
ant d
iffer
ence
from
the
Wal
ler-
Dun
can
k-ra
tio (k
= 1
00) t
-tes
t and
can
be
used
to c
ompa
re a
ny tw
o tr
eatm
ents
.

74 Annual Grasses Preserved as Silage:
Table 12.5. Preference evaluations (Evaluations 5 thru 7) comparing four tropical corn silages within each of three tropical corn cultivars1 (dry matter basis)
Silage
Treatment Evaluation 5 Evaluation 6 Evaluation 7
No. Desc.2DMI3 Time Rate DMI Time Rate DMI Time Rate
g min g/min g min g/min g min g/min
Tropical Corn:
Dekalb 678C 4 E/E 256ab 5.5a 77.0a
5 E/L 298ab 5.8a 142.7a
6 L/E 494a 6.6a 72.3a
7 L/L 48b 0.2a 100.5a
Pioneer X304C 8 E/E 154b 1.4b 35.4a
9 E/L 24b 0.5b 17.1a
10 L/E 274ab 4.0ab 59.3a
11 L/L 598a 8.4a 56.6a
Dekalb 660XL 12 E/E 28b 0.4b 56.4a
13 E/L 16b 0.1b 28.3a
14 L/E 554a 7.7a 71.2a
15 L/L 110b 2.0b 11.7a
Significance (P):
Treatments 0.10 0.32 0.74 0.05 0.03 0.40 <0.01 <0.01 0.40
MSD4 396 9.5 199 431 5.6 72.5 256 3.3 98.81 Each value is the mean of five steers and means with same superscript are similar.2 Desc. = description, E = early, and L = late, which refers to plant/harvest sequence; i.e., E/L is read “planted early and har-
vested late.” See Table 12.1 for details.3 DMI = dry matter intake.4 MSD = minimum significant difference from the Waller-Duncan k-ratio (k = 100) t-test and can be used to compare any
two treatments.

Fermentation Characteristics, Nutritive Value, and Quality 75
Table 12.6. Preference evaluations (Evaluations 8 thru 10) comparing four silages consisting of one temperate and three tropical corn silages1 (dry matter basi
Silage
Treatment Evaluation 8 Evaluation 9 Evaluation 10
No. Desc.2DMI3 Time Rate DMI Time Rate DMI Time Rate
g min g/min g min g/min g min g/min
Temperate corn:
Pioneer 3156 1 E/E 454a 6.3a 43.2ab
2 L/E 178a 2.4a 110.6a
3 L/L 750a 9.3a 82.0a
Tropical corn:
Dekalb 678C 5 E/L 222a 3.2a 71.9a
6 L/E 448a 6.9a 91.5a
7 L/L 250b 3.2b 43.8a
Dekalb X304C 9 E/L 6a 0.1a 1.0b
10 L/E 90a 0.7a 26.6a
11 L/L 12b 0.1b 69.0a
Dekalb 660XL 13 E/L 160a 1.7a 36.1ab
14 L/E 144a 1.5a 37.7a
15 L/L 36b 0.4b 18.2a
Significance (P):
Treatments 0.30 0.26 0.12 0.18 0.11 0.27 <0.01 <0.01 0.62
MSD4 594 7.9 66.0 413 6.1 123.4 329 4.3 1421 Each value is the mean of five steers and means with same the superscript are similar.2 Desc. = description, E = early, and L = late, which refers to plant/harvest sequence; i.e., E/L is read “planted early and har-
vested late.” See Table 12.1 for details.3 DMI = dry matter intake.4 MSD = minimum significant difference from the Waller-Duncan k-ratio (k = 100) t-test and can be used to compare any two
treatments.

76 Annual Grasses Preserved as Silage:
Table 12.7 In vitro true dry matter disappearance (IVTD) and nutritive value1 of the silages used in preference evaluations (dry matter basis).
Silage
Treatment
IVTD CP NDF
Fiber Fractions
No. Desc.2ADF HEMI CELL Lignin
———————————— % ————————————
Temperate corn:
Pioneer 3156 1 E/E 86.93 5.9 30.4 14.1 16.4 13.5 1.2
2 L/E 74.0 10.9 58.9 31.5 27.3 29.6 3.0
3 L/L 75.5 10.6 51.0 26.4 24.6 24.6 2.7
Tropical corn:
Dekalb 678C 4 E/E 73.0 9.8 61.8 34.6 27.2 32.2 3.4
5 E/L 78.6 8.9 47.0 24.8 22.2 23.3 2.5
6 L/E 74.6 8.9 58.6 32.6 25.9 30.4 3.2
7 L/L 79.4 8.3 40.9 21.3 19.6 19.5 2.0
X304C 8 E/E 67.7 9.3 65.2 37.7 27.5 34.2 3.9
9 E/L 74.9 8.4 51.6 27.6 24.0 25.4 3.0
10 L/E 73.5 8.7 59.2 33.1 26.1 30.7 3.3
11 L/L 77.4 7.5 44.2 22.9 21.3 21.3 2.3
Dekalb 660XL 12 E/E 70.6 10.4 63.0 35.9 27.0 33.2 3.5
13 E/L 76.8 9.6 49.1 26.3 22.9 24.3 2.6
14 L/E 75.6 9.8 54.0 29.5 24.5 27.8 2.7
15 L/L 80.2 9.0 39.2 20.2 19.0 18.6 1.8
Pioneer 3098 16 L/E 73.1 10.1 61.7 34.9 26.8 32.5 3.3
14 L/L 76.1 8.9 46.7 25.4 21.3 22.6 2.7
Forage sorghum:
Brandies 18 E/E 73.5 8.1 62.4 36.2 26.2 33.8 3.4
19 E/L 77.3 5.9 50.7 28.6 22.1 26.4 2.9
Significance (P):
Treatments <0.01 <0.01 <0.01 <0.01 <0.01 <0.01 <0.01
MSD4 3.0 1.0 4.0 2.4 2.1 2.0 0.31 CP = crude protein; NDF = neutral detergent fiber; ADF = acid detergent fiber; HEMI = hemicellulose;
CELL = cellulose.2 Desc. = description, E = early, and L = late, which refers to plant/harvest sequence; i.e., E/L is read
“planted early and harvested late.” See Table 12.1 for details.3 Each value is the mean of three replicates.4 MSD = minimum significant difference from the Waller-Duncan k-ratio (k = 100) t-test and can be used
to compare any two treatments.

Fermentation Characteristics, Nutritive Value, and Quality 77
Experiment 13. Temperate or Tropical Corn Silages Ensiled at Four Maturities: Steer Preference
As noted in Experiment 12, the morphology and nutritive value of forages change with advanc-ing maturity. Further, forages that produce a grain component and are ensiled can have their ensiling characteristics appreciably altered, resulting in dif-fering fermentation products and possibly different quality of the resulting silage. This dynamic is likely to occur with corn during ear formation and filling. Our objectives in this experiment were to compare temperate and tropical corn cultivars and maturities within each cultivar during ear development, and to determine any effect on fermentation characteristics, nutritive value, and preference by steers.
Materials and MethodsA small-plot experiment was conducted consisting of four forages planted in 14-foot wide by 25-foot long plots in a randomized complete block design with three replicates, which provided the experimen-tal forages. The plots were planted and harvested by conventional methods and packed into miniature si-los using standard procedures (Appendix GP-1). The silos were stored under cover being undisturbed for at least 60 days prior to opening, and the silages were used in a series of preference evaluations.
The forages evaluated consisted of the temperate corn Pioneer 3156 and the tropical corn cultivars Dekalb 678C, Pioneer X304C, Dekalb 660XL, and Pioneer 3098. Each cultivar was planted early and late and each planting harvested early and late, re-sulting in a total of 20 treatment combinations as delineated in Table 13.1 The early-harvested corn was ensiled in the early-milk stage and the late-har-vested corn ensiled in the late-dent stage. At time of harvest, estimates of forage height (10 measurements per plot) and dry matter yields (10-foot strip) were obtained and intact stalks (five per plot) were sepa-rated into morphological components.
A series of short-term preference evaluations were conducted with steers weighing 500 to 800 pounds (Appendix GP-5). Each evaluation was conducted
as a randomized complete block design with five steer replicates. Each evaluation was conducted for 30 minutes, silage intake and time devoted to eating were recorded, and total dry matter intake and intake rate (grams/minute) were determined.
At feeding, the silos were opened and any sur-face mold removed. A sample of each silage replicate (miniature silo) was obtained and analyzed for dry matter, fermentation characteristics, and nutri-tive value (Appendix GP-6). Data were analyzed statistically according to the experimental design (Appendix GP-7). When more than two treatments were compared in an evaluation, a minimum signifi-cant difference was determined and included in the data table to separate differences among treatment means (Appendix GP-7).
Results and DiscussionThe adapted temperate corn cultivars and the four tropical cultivars subjected to the four management strategies of early and late planting and early and late harvesting (Table 13.1) resulted in considerable variation. Dry matter at harvest ranged from 21.1% to 38.1%, cultivar height from 7.1 to 11.2 feet, and dry matter yields from 3.6 to 7.5 tons per acre (Table 13.2). In general, the temperate cultivar was shorter and had least dry matter yield compared with the tropical cultivars—consistent with expectations. The nutritive value of the whole plant at harvest and the in vitro true dry matter digestion, crude protein, and neutral detergent fiber of the morphological compo-nents of the forage at harvest (prior to fermentation) are reported in Appendix Tables (AT)1, 2, 3, and 4, respectively, for the interested reader and will not be discussed further.
AllsilagesfermentedwellwithpHmeasuresof≤3.9, although dry matter concentrations ranged from 19.9 to 35.2% (Table 13.3). Alcohol was present with ethanol dominating and ranging from 0.6 to 5.8%, with some presence of methanol (ranging from 0.04 to 0.08%). The major fatty acid produced was lactic followed by acetic, with propionic, butyric, and iso-butyric acid concentrations being variable—ranging from a trace to about 0.1%. These factors all contrib-uted to stable silages.

78 Annual Grasses Preserved as Silage:
Preference demonstrated by steers when of-fered the silage from each of the four early and late management options within each cultivar was not altered (Table 13.4). This indicates that the early- and late-planted and early- and late-harvested strate-gies were not of major concern for subsequent silage acceptance.
A comparison of preference among the adapted temperate cultivar (Pioneer 3156) and three of the four tropical cultivars (Dekalb 678C, Pioneer X304C, and Dekalb 660XL), within each of the four manage-ment strategies, revealed no difference in dry matter intake for the two early-planted treatments (Table 13.5). However, the two late-planted treatments had greatest dry matter intake for the adapted temperate corn, whether harvested early or late (Table 13.5). In the late-planted and early-harvested treatment, steers consumed less but similar amounts of the tropical cultivar Dekalb 660XL.
When the same cultivars were compared, but with Pioneer 3098 included and Dekalb 678C omitted, no difference in silage preference was noted for the early-planted/early-harvested management, but dif-ferences were noted in the other three managements (Table 13.6). The temperate corn silage was preferred over the tropical cultivars in the other three man-agements, but preference was similar to the tropical cultivar, Dekalb 660XL.
Examination of the nutritive value of the various silages indicated that the temperate adapted corn (Pioneer 3156) was greater in in vitro true dry mat-ter disappearance and lesser in neutral detergent fiber and its fiber constituents than the tropical corn silages, which is consistent with demonstrated steer preference (Tables 13.7, 13.5, and 13.6). This differ-ence in nutritive value is attributed mainly to the larger proportion of the temperate plant consisting of ears. The nutritive value of the tropical cultivars (Table 13.7) also varied among the cultivars but gen-erally had little influence on steer preference.
Summary and Conclusion• Adaptedtemperatecornwasshorterandyielded
less dry matter per acre than the tropical culti-vars, but had a greater proportion of total ear.
• Allcorncultivarsensiledwellinminiaturesilos,regardless of planting and harvest managements, withpHmeasuresof≤3.9uponopening.
• Managementstrategiesevaluatedwithineachcorn cultivar did not alter steer preference for the resulting silage.
• Inthesilagefromcultivarscomparedintheearly-planted and late-harvested and late-planted managements, animal preference differed, with the adapted temperate cultivars generally pre-ferred over the tropical cultivars. But preference for the temperate cultivar was not always signifi-cantly greater compared to the tropical Dekalb 660XL.
• Thecorncultivarsevaluatedprovideconsid-erable management flexibility in production systems. Temperate corn silage, however, is gen-erally of greater nutritive value compared with tropical corn but will yield lesser in dry matter produced per acre.
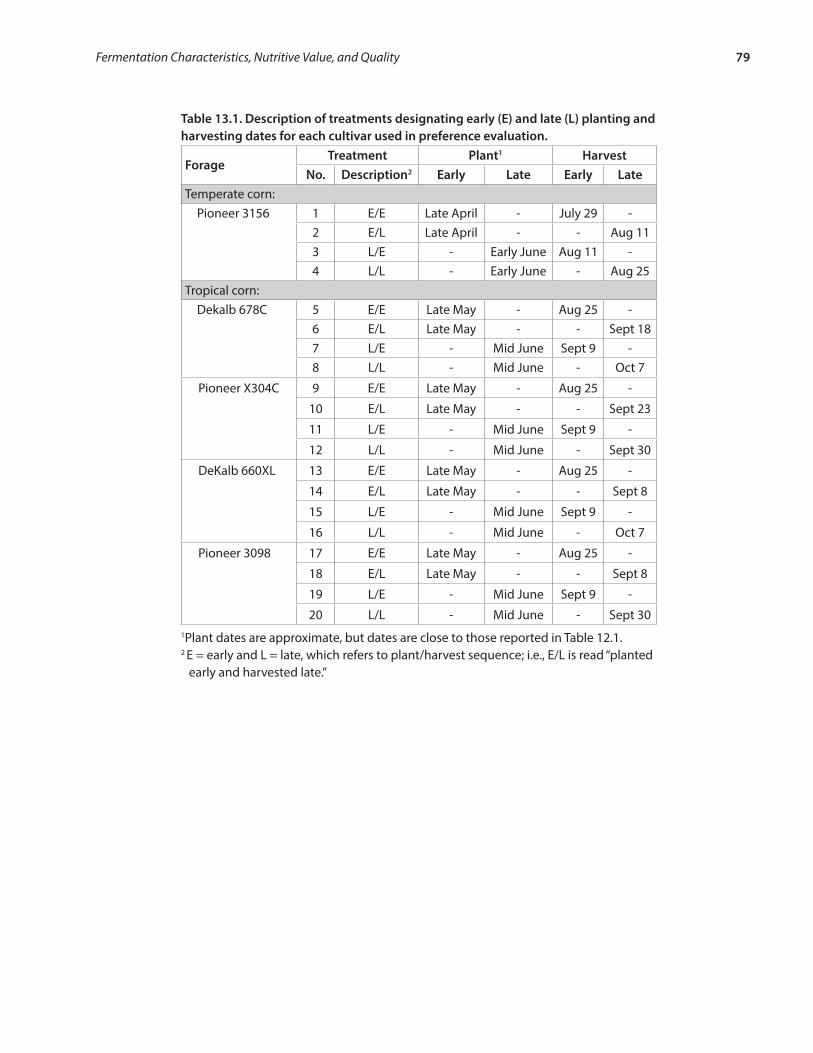
Fermentation Characteristics, Nutritive Value, and Quality 79
Table 13.1. Description of treatments designating early (E) and late (L) planting and harvesting dates for each cultivar used in preference evaluation.
ForageTreatment Plant1 Harvest
No. Description2 Early Late Early LateTemperate corn:
Pioneer 3156 1 E/E Late April - July 29 -2 E/L Late April - - Aug 113 L/E - Early June Aug 11 -4 L/L - Early June - Aug 25
Tropical corn:Dekalb 678C 5 E/E Late May - Aug 25 -
6 E/L Late May - - Sept 187 L/E - Mid June Sept 9 -8 L/L - Mid June - Oct 7
Pioneer X304C 9 E/E Late May - Aug 25 -
10 E/L Late May - - Sept 23
11 L/E - Mid June Sept 9 -
12 L/L - Mid June - Sept 30
DeKalb 660XL 13 E/E Late May - Aug 25 -
14 E/L Late May - - Sept 8
15 L/E - Mid June Sept 9 -
16 L/L - Mid June - Oct 7
Pioneer 3098 17 E/E Late May - Aug 25 -
18 E/L Late May - - Sept 8
19 L/E - Mid June Sept 9 -
20 L/L - Mid June - Sept 301Plant dates are approximate, but dates are close to those reported in Table 12.1.2 E = early and L = late, which refers to plant/harvest sequence; i.e., E/L is read “planted
early and harvested late.”

80 Annual Grasses Preserved as Silage:Ta
ble1
3.2.
Hei
ght,
dry
mat
ter (
DM
) yie
ld a
nd m
orph
olog
ical
des
crip
tion
of te
mpe
rate
and
trop
ical
cor
n cu
ltiva
rs e
valu
ated
(DM
bas
is).
Fora
geTr
eatm
ent
DM
3H
eigh
t4Yi
eld3
Fora
ge1
Ear (
Hea
d)1
No.
Des
c.2
Leaf
Stem
Tass
elH
usk
Dea
dEa
r (H
ead)
Gra
inCo
b%
ftto
ns/a
cre
——
——
——
— %
of t
otal
dry
mat
ter —
——
——
——
% o
f Ear
tota
l —Te
mpe
rate
cor
n:Pi
onee
r 315
61
E/E
27.8
7.3
4.3
11.0
29.3
0.6
13.4
0.9
44.8
77.0
23.0
2E/
L26
.88.
05.
37.
822
.10.
38.
93.
857
.183
.116
.93
L/E
26.0
7.1
3.6
19.8
40.8
0.9
11.0
0.3
27.2
68.4
31.6
4L/
L36
.48.
25.
112
.134
.10.
710
.42.
240
.577
.322
.7Tr
opic
al c
orn:
Dek
alb
678C
5E/
E24
.09.
34.
919
.050
.11.
715
.61.
412
.236
.463
.66
E/L
30.2
9.1
7.5
16.7
45.0
1.3
14.1
5.2
17.7
70.3
29.7
7L/
E21
.19.
44.
517
.952
.31.
315
.90.
312
.339
.460
.68
L/L
34.0
9.3
6.8
10.3
34.5
0.9
13.2
4.4
36.7
74.5
25.5
Pion
eer X
304C
9E/
E27
.210
.36.
020
.063
.82.
36.
36.
11.
5-
-10
E/L
33.8
10.5
6.8
10.5
55.7
1.1
10.0
9.9
12.8
64.7
35.3
11L/
E21
.811
.25.
116
.762
.81.
711
.10.
77.
025
.574
.512
L/L
34.8
10.9
7.2
10.1
50.3
1.2
9.1
6.5
22.8
69.1
30.9
DeK
alb
660X
L13
E/E
29.7
10.1
5.7
18.8
59.5
1.9
9.0
4.8
6.0
42.2
57.8
14E/
L31
.410
.27.
016
.153
.61.
910
.09.
68.
864
.835
.215
L/E
23.9
9.2
5.0
19.2
48.2
1.6
13.4
0.8
16.8
57.1
42.9
16L/
L33
.79.
05.
810
.840
.21.
49.
58.
329
.877
.622
.4Pi
onee
r 309
817
E/E
30.0
10.2
6.8
17.2
51.4
2.2
11.3
5.6
12.3
52.6
47.4
18E/
L34
.09.
77.
012
.942
.71.
78.
98.
625
.273
.726
.319
L/E
25.3
10.1
6.0
18.0
58.0
1.8
9.6
2.5
10.1
52.1
47.9
20L/
L38
.110
.27.
29.
146
.31.
59.
07.
826
.372
.927
.1Si
gnifi
canc
e (P
):Tr
eatm
ent
<0.0
1<0
.01
<0.0
1<0
.01
<0.0
1<0
.01
<0.0
1<0
.01
<0.0
1<0
.01
<0.0
1M
SD5
3.8
0.8
1.1
3.4
7.8
0.4
3.1
2.7
7.9
10.7
10.7
1 Ea
ch v
alue
is th
e av
erag
e of
five
sta
lks
per p
lot a
nd th
e m
ean
of th
ree
repl
icat
es.
2 D
esc.
= d
escr
iptio
n, E
= ea
rly, a
nd L
= la
te, w
hich
refe
rs to
pla
nt/h
arve
st s
eque
nce;
i.e.
, E/L
is re
ad “p
lant
ed e
arly
and
har
vest
ed la
te.” S
ee T
able
13
.1 fo
r det
ails
.3 E
ach
valu
e is
the
mea
n of
thre
e re
plic
ates
.4 E
ach
valu
e is
the
aver
age
of 1
0 m
easu
rem
ents
per
plo
t and
the
mea
n of
thre
e re
plic
ates
5 M
SD =
min
imum
sig
nific
ant d
iffer
ence
from
the
Wal
ler-
Dun
can
k-ra
tio (k
= 1
00) t
-tes
t and
can
be
used
to c
ompa
re a
ny tw
o tr
eatm
ents
.

Fermentation Characteristics, Nutritive Value, and Quality 81
Tabl
e 13
.3. D
ry m
atte
r (D
M) a
nd fe
rmen
tatio
n ch
arac
teri
stic
s of
eac
h si
lage
use
d in
pre
fere
nce
eval
uatio
n (D
M b
asis
).
Sila
geTr
eatm
ent
DM
pHA
lcoh
ols
Fatt
y A
cids
No.
Des
c.1
Etha
nol
Met
hano
lA
cetic
Prop
ioni
cLa
ctic
Buty
ric
Isob
utyr
ic%
——
——
——
——
——
——
——
— %
——
——
——
——
——
——
——
Tem
pera
te c
orn:
Pion
eer 3
156
1E/
E27
.12
3.7
4.02
0.07
2.01
0.05
7.43
0.01
0.01
2E/
L30
.43.
82.
210.
051.
780.
025.
970.
130.
023
L/E
21.3
3.7
6.07
0.08
1.94
0.00
10.0
50.
010.
014
L/L
34.5
3.8
2.09
0.04
1.16
t5.
940.
020.
02Tr
opic
al c
orn:
Dek
alb
678C
5E/
E24
.83.
71.
260.
071.
780.
009.
530.
010.
026
E/L
28.7
3.8
0.91
0.07
1.83
0.00
6.87
0.01
0.01
7L/
E19
.93.
74.
860.
092.
130.
0210
.08
0.04
0.01
8L/
L35
.23.
82.
640.
041.
240.
006.
21t
tPi
onee
r X30
4C9
E/E
26.4
3.7
1.02
0.07
2.06
0.00
8.58
0.04
0.02
10E/
L31
.73.
82.
890.
051.
470.
006.
650.
010.
0111
L/E
21.5
3.7
2.78
0.05
1.77
0.00
8.86
0.01
t12
L/L
31.1
3.8
1.21
0.05
1.75
t7.
730.
010.
01D
eKal
b 66
0XL
13E/
E27
.73.
81.
250.
071.
560.
017.
570.
020.
0214
E/L
30.2
3.7
3.83
0.05
1.36
t7.
230.
010.
0115
L/E
22.8
3.8
3.67
0.08
1.61
0.01
8.92
t0.
0116
L/L
33.1
3.8
5.76
0.06
1.77
0.00
6.19
t0.
01Pi
onee
r 309
817
E/E
27.8
3.8
1.19
0.07
1.62
0.00
7.95
0.08
50.
0118
E/L
32.3
3.8
1.86
0.06
1.24
t7.
060.
020.
0119
L/E
23.6
3.8
3.21
0.07
1.48
t8.
880.
010.
0120
L/L
34.6
3.9
0.62
0.04
1.33
t6.
26t
0.01
Sign
ifica
nce
(P):
Trea
tmen
t<0
.01
<0.0
1<0
.01
<0.0
1<0
.01
0.41
<0.0
1<0
.01
<0.0
1M
SD3
1.6
0.04
1.13
0.02
0.45
0.05
0.68
0.05
0.01
1 D
esc.
= d
escr
iptio
n, E
= ea
rly, a
nd L
= la
te, w
hich
refe
rs to
pla
nt/h
arve
st s
eque
nce;
i.e.
, E/L
is re
ad “p
lant
ed e
arly
and
har
vest
ed la
te.” S
ee
Tabl
e 13
.1 fo
r det
ails
.2 E
ach
valu
e is
the
mea
n of
thre
e re
plic
ates
.3
t = tr
ace
4 M
SD =
min
imum
sig
nific
ant d
iffer
ence
from
the
Wal
ler-
Dun
can
k-ra
tio (k
= 1
00) t
-tes
t and
can
be
used
to c
ompa
re a
ny tw
o tr
eatm
ents
.

82 Annual Grasses Preserved as Silage:
Tabl
e 13
.4. P
refe
renc
e ev
alua
tion
of s
ilage
s am
ong
the
four
man
agem
ent s
trat
egie
s w
ithin
eac
h cu
ltiva
r1 (dry
mat
ter b
asis
).
Trea
tmen
t2
Tem
pera
teTr
opic
al
Pion
eer 3
156
Dek
alb
678C
Pion
eer X
304C
Dek
alb
660X
LPi
onee
r 309
8
DM
I3Ti
me
Rate
DM
ITi
me
Rate
DM
ITi
me
Rate
DM
ITi
me
Rate
DM
ITi
me
Rate
gm
ing/
min
gm
ing/
min
gm
ing/
min
gm
ing/
min
gm
ing/
min
E/E
288
3.4
38.7
243
2.9
113.
522
23.
169
.713
91.
768
.620
52.
264
.9
E/L
430.
313
2.9
126
1.7
86.3
216
2.4
76.0
155
1.7
17.9
193
2.3
53.2
L/E
200
2.1
68.6
600.
883
.024
12.
678
.528
83.
869
.427
82.
814
9.4
L/L
386
3.5
113.
135
94.
350
.287
0.8
77.0
201
2.7
30.7
165
1.8
42.9
Sign
ifica
nce
(P):
Trea
tmen
t0.
310.
390.
310.
270.
340.
470.
780.
610.
990.
850.
810.
210.
910.
960.
44
MSD
446
85.
513
6.8
402
5.1
104.
747
16.
211
4.2
534
6.9
72.1
473
5.7
190.
71 E
ach
valu
e is
the
mea
n of
five
ste
ers.
2 E =
ear
ly a
nd L
= la
te, w
hich
refe
rs to
pla
nt/h
arve
st s
eque
nce;
i.e.
, E/L
is re
ad “p
lant
ed e
arly
and
har
vest
ed la
te.” S
ee T
able
13.
1 fo
r det
ails
.3 D
MI =
sho
rt-t
erm
dry
mat
ter i
ntak
e.4 M
SD =
min
imum
sig
nific
ant d
iffer
ence
from
the
Wal
ler-
Dun
can
k-ra
tio (k
= 1
00) t
-tes
t and
can
be
used
to c
ompa
re a
ny tw
o tr
eatm
ents
.
Tabl
e 13
.5. P
refe
renc
e ev
alua
tion
of s
ilage
s fr
om a
tem
pera
te a
nd th
ree
trop
ical
cor
n cu
ltiva
rs w
ithin
eac
h of
four
man
agem
ent
stra
tegi
es1 o
f ear
ly p
lant
ing
(E-p
lant
), ea
rly
cutt
ing
(E-c
ut),
late
pla
ntin
g (L
-pla
nt) a
nd la
te c
uttin
g (L
-cut
) (d
ry m
atte
r bas
is).
Trea
tmen
t
E-pl
ant/
E-cu
tE-
plan
t/L-
cut
L-pl
ant/
E-cu
tL-
plan
t/L-
cut
DM
I2Ti
me
Rate
DM
ITi
me
Rate
DM
ITi
me
Rate
DM
ITi
me
Rate
gm
ing/
min
gm
ing/
min
gm
ing/
min
gm
ing/
min
Tem
pera
te c
orn:
Pion
eer 3
156
2722
2.6
62.8
298a
2.4a
98.3
a47
2a4.
7a10
0.1a
552a
4.8a
121.
9a
Trop
ical
cor
n:
Dek
alb
678C
550.
651
.313
2a1.
1b51
.1a
0b0.
0b0.
0b49
b0.
7b65
.7a
Pion
eer X
304C
264
3.1
94.7
76a
0.8b
64.7
a52
b0.
7b60
.9ab
13b
0.1b
23.5
a
Dek
alb
660X
L32
73.
870
.340
5a4.
7a89
.8a
297a
3.1a
78.9
a40
b0.
5b70
.6a
Sign
ifica
nce
(P):
Trea
tmen
t0.
290.
200.
570.
140.
050.
60<0
.01
<0.0
10.
02<0
.01
<0.0
10.
28
MSD
337
53.
786
.435
83.
110
7.3
193
1.7
61.2
106
1.3
124.
51 E
ach
valu
e is
the
mea
n of
five
ste
ers,
and
mea
ns w
ith th
e sa
me
supe
rscr
ipt a
re s
imila
r.2 D
MI =
dry
mat
ter i
ntak
e.3 M
SD =
min
imum
sig
nific
ant d
iffer
ence
from
the
Wal
ler-
Dun
can
k-ra
tio (k
= 1
00) t
-tes
t and
can
be
used
to c
ompa
re a
ny tw
o tr
eatm
ents
.

Fermentation Characteristics, Nutritive Value, and Quality 83
Tabl
e 13
.6. P
refe
renc
e ev
alua
tion
of s
ilage
s fr
om a
tem
pera
te a
nd th
ree
trop
ical
cor
n cu
ltiva
rs w
ithin
eac
h of
four
man
agem
ent
stra
tegi
es1 in
volv
ing
earl
y pl
antin
g (E
-pla
nt),
earl
y cu
ttin
g (E
-cut
), la
te p
lant
ing
(L-p
lant
) and
late
cut
ting
(L-c
ut) (
dry
mat
ter b
asis
).
Trea
tmen
t
E-pl
ant/
E-cu
tE-
plan
t/L-
cut
L-pl
ant/
E-cu
tL-
plan
t/L-
cut
DM
I2Ti
me
Rate
DM
ITi
me
Rate
DM
ITi
me
Rate
DM
ITi
me
Rate
gm
ing/
min
gm
ing/
min
gm
ing/
min
gm
ing/
min
Tem
pera
te c
orn:
Pion
eer 3
156
299
2.2
98.4
437a
3.5ab
96.1
ab38
2a4.
7a83
.3a
517a
4.9a
106.
6a
Trop
ical
cor
n:
Pion
eer 3
098
245
2.9
93.4
39b
0.4bc
39.1
b63
b0.
7b69
.2a
0b0.
0b0.
0b
Pion
eer X
304C
841.
017
.544
b0.
3c23
4.3a
50b
0.6b
30.5
a10
b0.
1b45
.8ab
Dek
alb
660X
L10
51.
170
.127
2ab3.
7a77
.6ab
122b
1.3b
95.8
a16
5b2.
0b68
.0ab
Sign
ifica
nce
(P):
Trea
tmen
t0.
610.
670.
350.
050.
040.
080.
01<0
.01
0.32
<0.0
10.
040.
15
MSD
351
75.
012
7.5
350
3.1
170.
317
61.
791
.227
03.
510
3.5
1 Eac
h va
lue
is th
e m
ean
of fi
ve s
teer
s, an
d m
eans
with
sam
e th
e su
pers
crip
t are
sim
ilar.
2 D
MI =
dry
mat
ter i
ntak
e.3
MSD
= m
inim
um s
igni
fican
t diff
eren
ce fr
om th
e W
alle
r-D
unca
n k-
ratio
(k =
100
) t-t
est a
nd c
an b
e us
ed to
com
pare
any
two
trea
t-m
ents
.

84 Annual Grasses Preserved as Silage:
Table 13.7 In vitro true dry matter disappearance (IVTD) and nutritive value1 of the experimental silages used in preference evaluations (dry matter basis).
Forage
TreatmentIVTD CP NDF
Fiber Fractions
No. Desc.2ADF HEMI CELL Lignin
——————————— % ———————————
Temperate corn:
Pioneer 3156 1 E/E 77.73 7.9 40.7 23.8 16.8 19.9 1.0
2 E/L 77.7 7.4 40.7 22.8 17.9 18.8 0.9
3 L/E 72.4 9.9 50.2 29.2 20.9 25.7 1.6
4 L/L 75.3 9.0 44.4 24.1 20.3 21.3 1.1
Tropical corn:
Dekalb 678C 5 E/E 71.0 7.5 56.4 34.1 22.3 30.0 2.4
6 E/L 68.5 7.8 55.2 31.5 23.7 27.5 2.2
7 L/E 67.5 9.3 59.5 36.3 23.2 31.7 2.8
8 L/L 71.2 7.6 49.0 27.8 21.2 24.2 2.2
Pioneer X304C 9 E/E 66.5 7.0 59.4 35.7 23.7 31.3 2.4
10 E/L 61.6 6.9 60.9 35.4 25.5 30.4 3.3
11 L/E 64.5 7.6 61.6 37.4 24.2 32.2 3.3
12 L/L 62.5 7.4 57.1 33.9 23.2 28.9 3.6
DeKalb 660XL 13 E/E 66.6 7.0 59.5 35.9 23.6 31.6 2.4
14 E/L 64.9 6.5 60.4 35.1 25.3 30.7 2.9
15 L/E 68.6 8.7 60.8 36.6 24.2 32.4 2.4
16 L/L 67.2 8.6 54.1 31.5 22.6 27.2 2.7
Pioneer 3098 17 E/E 67.9 6.7 61.3 35.9 25.5 31.7 3.0
18 E/L 68.6 6.7 56.0 62.1 23.9 27.6 3.1
19 L/E 66.0 8.1 61.4 36.9 24.4 32.3 3.2
20 L/L 67.5 7.8 54.6 31.3 23.5 27.3 3.0
Significance (P):
Treatments <0.01 <0.01 <0.01 <0.01 <0.01 <0.01 <0.01
MSD4 2.9 0.8 3.6 2.3 1.5 1.9 0.51 CP = crude protein; NDF = neutral detergent fiber; ADF = acid detergent fiber; HEMI = hemicellulose; CELL
= cellulose.2 Desc. = description, E = early, and L = late, which refers to plant/harvest sequence; i.e., E/L is read “planted
early and harvested late.” See Table 13.1 for details.3 Each value is the mean of three samples.4 MSD = minimum significant difference from the Waller-Duncan k-ratio (k = 100) t-test and can be used to
compare any two treatments.
Fermentation Characteristics, Nutritive Value, and Quality 85
Appendices
I. General Standard Procedures of Experimentation
Each general procedure (GP) followed in conduct-ing the various experiments presented in this bulletin are noted below and are not repeated elsewhere. Departure or specific details related to any one ex-periment are noted under the Materials and Methods section of each experiment with reference to the ap-propriate general procedures outlined below. Animal experiments were conducted primarily in the months of October through April, but occasionally an experi-ment was extended into May. This practice avoided the potential negative influences of elevated tempera-tures on animal behavior during the hot summer months.
GP-1. Planting and Ensiling ProcessAll plantings were conducted similarly using con-ventional procedures. Row-crop plantings were top-dressed at establishment according to soil test and side dressed with 80 to 100 pounds of nitrogen per acre. Small grain seedings were also top-dressed at establishment and received 70 pounds of N per acre to initiate spring growth. In experiments in which estimates of dry matter intake or dry mat-ter digestibility were obtained, the cultivars to be evaluated were planted in adjacent fields using conventional procedures. When only preference esti-mates were obtained, the experimental cultivars were planted in small plots measuring 14 feet wide by 24 feet long. The small plots were laid out in a random-ized complete block design with three field replicates. Generally the warm-season annual forages were en-siled in the hard-dough or dent stage. In experiments where planting and harvesting dates were variables, the late-planted/early harvested treatments were cut in the late-milk stage and the early-planted/late-har-vested treatments cut in the hard-dough stage.
Forages in the field plantings were harvested with a conventional field chopper, blown into a self-unloading wagon, and transported to the NC State University Forage Animal Metabolism Unit, Raleigh,
NC, for ensiling in upright experimental silos. The fiberglass silos were lined with plastic, the forage packed by tramping, and the plastic liner tied off at the top.
Forages from the small plots were cut by hand (random 10-foot-long sample from each replicate), passed through a conventional field chopper, mixed, and placed in miniature silos. These consisted of plastic buckets 11 inches in diameter and 14 inches deep. The forage was packed by tramping and capped with a plastic lid fitted with a gas-release valve. These miniature silos were then stored in a barn until opened at feeding.
Both the upright silos and the miniature silos re-mained undisturbed for at least 60 days after ensiling to accommodate complete fermentation. At initiation of an experiment, the appropriate silos were opened and any surface mold removed in preparation for feeding.
GP-2. Dry Matter Intake and Apparent Whole-tract DigestibilitySilages were evaluated using steers at the NC State University Forage-Animal Metabolism Unit, Raleigh, NC, in an animal facility consisting of a metal struc-ture partitioned into three areas. On one end is a feed preparation area. The middle is an enclosed, but well-ventilated central area equipped with di-gestion crates. This area has temperature control designed to keep the ambient air between 50°F and 85°F. The third section, on the opposite end from the feed preparation area, is fitted with a raised, basket weave, metal platform equipped with electronic gates (American Calan Inc., Northwood, NH) to control animal access to mangers for individual intake mea-surements. This intake area is beneath an extension of the roof with three open sides. In the intake phase, each animal wore a collar electronically keyed to allow access to only one manger, but each had free access to trace mineralized salt and water and could lounge with other animals. Prior to each experiment, animals were conditioned to the electronic gates

86 Annual Grasses Preserved as Silage:
before random assignment to the appropriate silage treatment.
The intake phase of an experiment consisted of a 28-day period, allowing the first 14 days for ad-justment to potential differences in fermentation characteristics of the silage and the last 14 days to estimate daily dry matter intake (Burns et al., 1994). A recorded weight of silage was fed twice daily allow-ing about 13% to 15% in excess. A daily sample of the fed silage (as-fed) was obtained for each animal, and composites were made on a weekly basis. The uncon-sumed silage (weighback) was weighed twice daily, saved separately for each animal-treatment combina-tion, and composited each week.
The digestibility phase consisted of 12 days when immediately following an intake period (steers previ-ously adjusted to the diet) or 19 days for a separate digestibility evaluation. In either case, animals were moved into digestion crates and the digestibility phase was initiated. The digestibility phase con-sisted of a 14-day adjustment period followed by a 5-day total fecal and urine (if applicable) collection (Cochran and Galyean, 1994). A recorded weight of silage was fed twice daily at about 15% excess. A daily sample of the fed silage was obtained, and weighback saved separately for each animal-treatment combina-tion, frozen, and the daily samples composited for the 5-day collection period.
Feces were collected on a plastic sheet placed on the floor immediately in back of each digestion crate. Feces were removed periodically throughout the day, and the daily total weight of feces recorded for each of five consecutive days. Feces were thoroughly mixed daily, and 5% of the fresh weight was placed in a freezer (5°F). When part of the experimental objectives, a second sample was obtained, placed in a freezer for freeze-drying, and subsequent particle size was determined as explained in GP-4.
The weekly silage samples from the 14-day intake phase, the 5-day composite silage and fecal samples from the digestibility phase, and the associated weighback samples from the intake and digestibility phases were first thawed and prepared for subsam-pling. The samples were thoroughly mixed, and those to be analyzed for fermentation characteristics were
subsampled and extracted while wet. Silages for nutritive value determination were freeze-dried, and fecal samples for chemical composition were oven-dried. Dry matter determinations were obtained at drying when appropriate. The samples were then thoroughly mixed and a 300- to 500-gram subsample ground in a Wiley Mill to pass a 1-mm screen and stored in a freezer (silage samples) or at room tem-perature (fecal samples) until analyzed. The samples for feces particle-size determination remained in the freezer (5°F) until freeze-dried and were dry sieved as noted below for the masticate.
In experiments using a randomized complete block design, the digestion phase followed the intake phase and completed the experiment for each ani-mal. However, in Latin square-designs, once animals completed one period, they returned to the intake facility following the digestion phase to begin the next period.
GP-3. Masticate Collection and Processing.Mature, esophageally-fistulated, grade British-bred steers (800 to 1,400 pounds) were generally used and fed a standard silage about five days before initiation of an experiment. After adjustment to treatments (offered the previous afternoon), collections gener-ally occurred about 9:00 a.m. and 3:00 a.m. on two consecutive days. Animals were offered about 10 pounds of silage at each collection. The esophageal cannulas were removed and boluses collected by hand to ensure complete collection. The first five to six boluses were discarded, and the following 10 to 15 were collected. If chewing behavior was de-termined, the chews per bolus were recorded and each bolus was handled separately, and a fresh- and freeze-dried weight was obtained of each bolus prior to mixing. Otherwise the boluses were placed on a large plastic tray, gently mixed, placed into two plastic bags, and immediately quick-frozen in liq-uid nitrogen (-319°F). The boluses were stored in a freezer (5°F) until freeze-dried and then returned to the freezer until analyzed. The dried boluses were sampled for chemical analyses and for particle-size determination.

Fermentation Characteristics, Nutritive Value, and Quality 87
GP-4. Particle Size DeterminationParticle size estimates of the boluses were obtained by passing two subsamples of 15 grams each through a Fritsch Vibrator system (Fritsch Analysette, the Tekmor Co., Cincinnati, OH). Nine particle sizes were weighed consisting of dry matter retained on 5.60-, 4.00-, 2.80-, 1.70-, 1.00-, 0.50-, 0.25-, and 0.125-mm sieves and that which passed through the 0.125-mm sieve (<0.125 mm). The dry weight was recorded for the material retained on each sieve and that which passed through the 0.125-mm sieve, and percentage of cumulative particle weight over-size was determined and used to calculate median particle size (Fisher et al., 1988). Samples were com-posited across days and feeding times for each sieve size. Particle size estimates of feces were also deter-mined as noted above for masticates, except only one subsample was passed through the sieves. Sieved samples of both masticate and feces were stored ei-ther separately by individual sieve size, or composites were made to form three particle-size classes of large (≥1.7 mm), medium (<1.7 and ≥0.50 mm), and small (<0.50 mm) prior to chemical analyses. The com-posite samples were ground in a cyclone mill (Udy Corp., Fort Collins, CO) to pass a 1-mm screen and stored in a freezer until analyzed.
GP-5 Preference Determination Preference experiments were conducted in pens us-ing individual steers. Prior to an experiment, animals were offered a meal of each of the experimental silages to allow an association of each silage with any post-ingestive feedback produced by the forage.
In each preference evaluation comparing two silages, steers were fed in pens (8 ×13 feet) and of-fered about 15 pounds of each of the two silages for about 30 minutes. A maximum of four mangers could be accommodated within a larger pen (16 × 26 feet) allowing the maximum of four silages to be evaluated at any one time. The silages were random-ized at presentation. The left-right position was also randomized when fed in pairs, or all positions were randomized when fed in groups of three or four. A video recorder was used to estimate total time
spent at each feeder in order to calculate intake rate, which was determined by dividing weight of silage consumed by minutes at a feeder. In all preference evaluations, care was taken to collect representative samples of the as-fed silage and weighback and also to prevent total consumption of the more preferred silages from the manger.
GP-6. Laboratory AnalysisNutritive value for all as-fed, weighback, masticate, and feces samples, as appropriate for the various ex-periments, was analyzed either fresh or after drying (freeze-drying or oven-drying, as appropriate) by wet chemistry and reported, or used to develop calibra-tion equations in association with the prediction of nutritive value using near-infrared reflectance spec-troscopy (NIRS).
Fermentation characteristics of the silages were determined on preserved (frozen) samples accord-ing to Burns and Fisher (2012). In vitro dry matter disappearance was determined using a modification of the method by Tilley and Terry (1963), and in vitro true dry matter disappearance was determined by 48-hour fermentation in a batch fermentation vessel (Ankom Technology Corp., Fairport, NY) with artificial saliva and rumen inoculum accord-ing to Burns and Cope (1974). In vitro fermentation was terminated with neutral detergent solution in an Ankom 200 fiber analyzer (Ankom Technology Corp., Fairport, NY) to remove the residual micro-bial dry matter. Ruminal inoculum was obtained from a mature rumen-fistulated steer generally fed a mixed alfalfa (Medicago sativa L.) and orchard-grass (Dactylis glomerata L.) hay. Total nitrogen was determined colorimetrically (AOAC, 1990) with a Technicon Autoanalyzer (Bran and Luebbe, Buffalo, IL), and crude protein was estimated as 6.25 times the nitrogen concentration. Fiber fractions, consist-ing of neutral detergent fiber (NDF), acid detergent fiber (ADF), lignin, and ash, were estimated using re-agents according to Van Soest and Robertson (1980). Hemicellulose was determined by difference (NDF minus ADF) as was cellulose, depending on proce-dures used.

88 Annual Grasses Preserved as Silage:
GP-7. Statistical AnalysisThe data from the intake, digestion, and masticate phases and from preference evaluations for the various experiments were analyzed and generally presented as least square means. These were obtained from the application of mixed model or generalized least squares methodology, as appropriate, based on the design for the particular experiment. Particle siz-es, when determined, were expressed as percentages of cumulative particle weight oversize (sum of dry matter weight on each sieve vs. weight from all larger sieves) and were used to determine mean and me-dian particle size (Fisher et al., 1988). Means for all variables found significant in each intake and digest-ibility and mastication experiment were compared by either trend analysis with a set of polynomial orthog-onal contrasts or by a set of meaningful comparisons using orthogonal contrasts, as appropriate, within the mixed model analysis of variance. A minimum sig-nificant difference was frequently included to assist the reader in determining differences between indi-vidual treatments. When comparisons exceeded two in the preference evaluations, differences were based on the minimum significant difference value.
II. References and Recent Related Publications
ReferencesAssociation of Official Analytical Chemists.
1990. Official Methods of Analysis. 15th ed., Arlington,VA.
Burns, J.C., and W.A. Cope. 1974. Nutritive value of crownvetch forage as influenced by structural constituents and phenolic and tannin com-pounds. Agron. J. 66:195-200.
Burns, J.C., and D.S. Fisher. 2012. Intake and digest-ibility of big bluestem hay and baleage. Crop Sci. 52:2413-2420.
Burns, J.C., K.R. Pond, and D.S. Fisher. 1994. Measurements of intake. p. 494-532. In G.C. Fahey, Jr. et al. (ed.) Forage quality, evaluation, and utilization. ASA, CSSA, and SSSA, Madison, WI.
Cochran, R.C., and M.L. Galyean. 1994. Measurements of in vivo forage digestion by ru-minants. p. 613-643. In G.C. Fahey, Jr. et al. (ed.)
Forage quality, evaluation, and utilization. ASA, CSSA, and SSSA, Madison, WI.
Fisher, D.S., J.C. Burns, and K.R. Pond. 1988. Estimation of mean and median particle size of ruminant diets. J. Dairy Sci. 71:518-524.
Teare, I.D., and E. Brown (ed.) 1991. Proceedings Southern Regional Tropical Corn Symposium, Quincy, FL. 27-28 June, 1991. Potash and Phosphate Institute/Foundation for Agronomic Research.Technical Bulletin 1991-3. Potash and Phosphate Institute Atlanta, GA, 30329.
Tilley, J., and R.A. Terry. 1963. A two-stage technique for in vitro digestion of forage crops. J. Br. Grassl. Soc. 18:104-111.
Van Soest, P.J., and J.B. Robertson. 1980. Systems of analysis for evaluating fibrous feeds. p. 49-60. In W.J. Pigden et al. (ed.) Standardization of analytical methodology for feeds. International Development Res. Center, Ottowa, Canada.
Recent Related Publications Huntington, G.B., and J.C. Burns. 2007. Afternoon
harvest increases readily fermentable carbo-hydrate concentration and voluntary intake of gamagrass and switchgrass baleage by steers. J. Anim. Sci. 85: 276-284.
Huntington, G.B., and J.C. Burns. 2008. The interac-tion of harvest time of day of switchgrass hay and ruminal degradability of supplemental protein fed to beef steers. J. Anim. Sci. 86:159-166
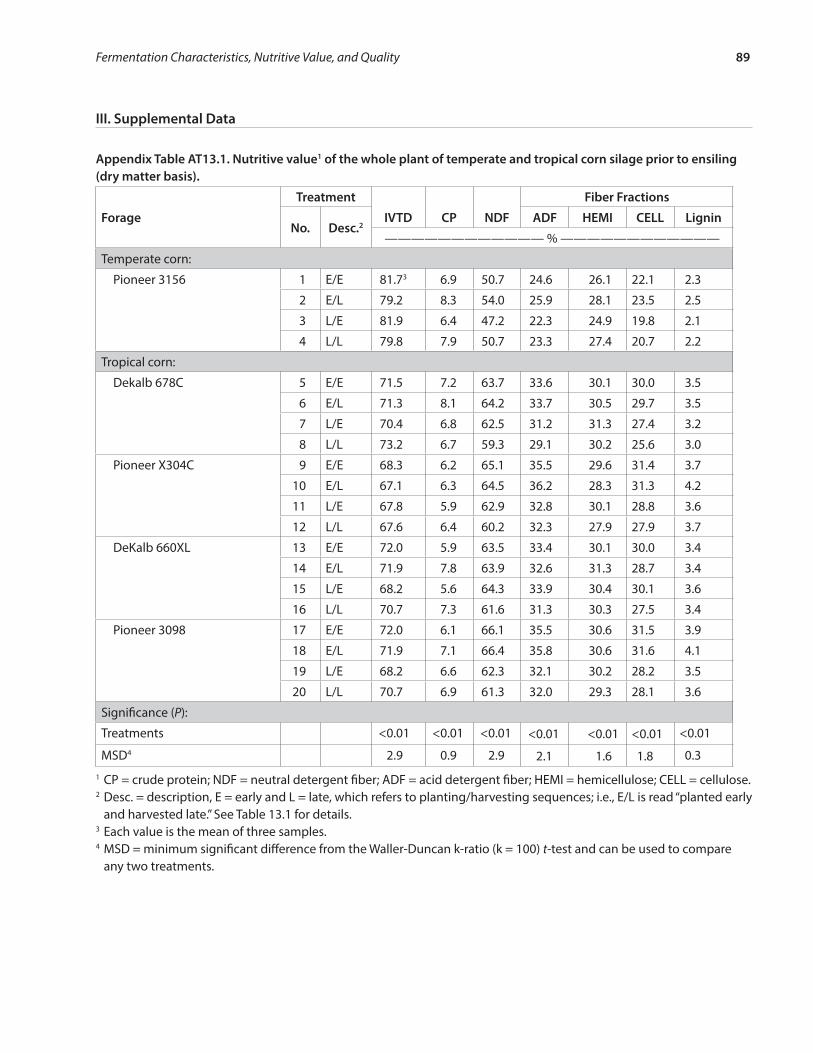
Fermentation Characteristics, Nutritive Value, and Quality 89
III. Supplemental Data
Appendix Table AT13.1. Nutritive value1 of the whole plant of temperate and tropical corn silage prior to ensiling (dry matter basis).
Forage
Treatment
IVTD CP NDF
Fiber Fractions
No. Desc.2ADF HEMI CELL Lignin
———————————— % ————————————
Temperate corn:
Pioneer 3156 1 E/E 81.73 6.9 50.7 24.6 26.1 22.1 2.3
2 E/L 79.2 8.3 54.0 25.9 28.1 23.5 2.5
3 L/E 81.9 6.4 47.2 22.3 24.9 19.8 2.1
4 L/L 79.8 7.9 50.7 23.3 27.4 20.7 2.2
Tropical corn:
Dekalb 678C 5 E/E 71.5 7.2 63.7 33.6 30.1 30.0 3.5
6 E/L 71.3 8.1 64.2 33.7 30.5 29.7 3.5
7 L/E 70.4 6.8 62.5 31.2 31.3 27.4 3.2
8 L/L 73.2 6.7 59.3 29.1 30.2 25.6 3.0
Pioneer X304C 9 E/E 68.3 6.2 65.1 35.5 29.6 31.4 3.7
10 E/L 67.1 6.3 64.5 36.2 28.3 31.3 4.2
11 L/E 67.8 5.9 62.9 32.8 30.1 28.8 3.6
12 L/L 67.6 6.4 60.2 32.3 27.9 27.9 3.7
DeKalb 660XL 13 E/E 72.0 5.9 63.5 33.4 30.1 30.0 3.4
14 E/L 71.9 7.8 63.9 32.6 31.3 28.7 3.4
15 L/E 68.2 5.6 64.3 33.9 30.4 30.1 3.6
16 L/L 70.7 7.3 61.6 31.3 30.3 27.5 3.4
Pioneer 3098 17 E/E 72.0 6.1 66.1 35.5 30.6 31.5 3.9
18 E/L 71.9 7.1 66.4 35.8 30.6 31.6 4.1
19 L/E 68.2 6.6 62.3 32.1 30.2 28.2 3.5
20 L/L 70.7 6.9 61.3 32.0 29.3 28.1 3.6
Significance (P):
Treatments <0.01 <0.01 <0.01 <0.01 <0.01 <0.01 <0.01
MSD4 2.9 0.9 2.9 2.1 1.6 1.8 0.31 CP = crude protein; NDF = neutral detergent fiber; ADF = acid detergent fiber; HEMI = hemicellulose; CELL = cellulose.2 Desc. = description, E = early and L = late, which refers to planting/harvesting sequences; i.e., E/L is read “planted early
and harvested late.” See Table 13.1 for details. 3 Each value is the mean of three samples.4 MSD = minimum significant difference from the Waller-Duncan k-ratio (k = 100) t-test and can be used to compare
any two treatments.
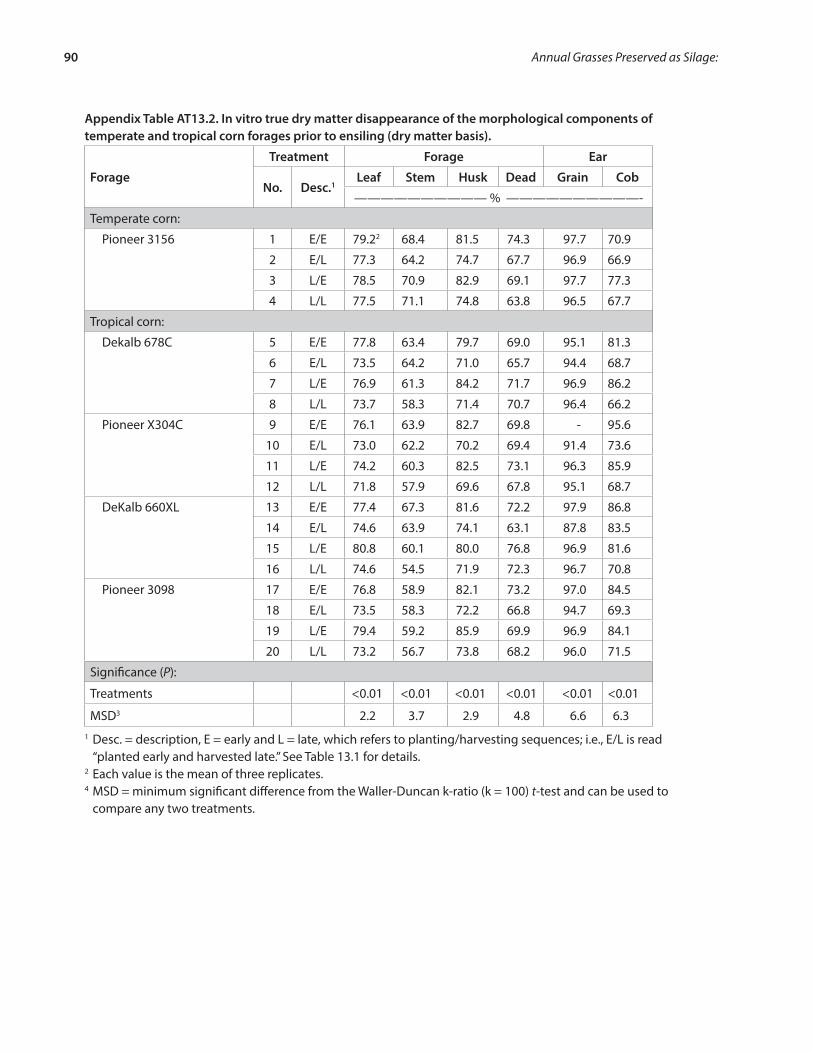
90 Annual Grasses Preserved as Silage:
Appendix Table AT13.2. In vitro true dry matter disappearance of the morphological components of temperate and tropical corn forages prior to ensiling (dry matter basis).
Forage
Treatment Forage Ear
No. Desc.1Leaf Stem Husk Dead Grain Cob
—————————— % ——————————-
Temperate corn:
Pioneer 3156 1 E/E 79.22 68.4 81.5 74.3 97.7 70.9
2 E/L 77.3 64.2 74.7 67.7 96.9 66.9
3 L/E 78.5 70.9 82.9 69.1 97.7 77.3
4 L/L 77.5 71.1 74.8 63.8 96.5 67.7
Tropical corn:
Dekalb 678C 5 E/E 77.8 63.4 79.7 69.0 95.1 81.3
6 E/L 73.5 64.2 71.0 65.7 94.4 68.7
7 L/E 76.9 61.3 84.2 71.7 96.9 86.2
8 L/L 73.7 58.3 71.4 70.7 96.4 66.2
Pioneer X304C 9 E/E 76.1 63.9 82.7 69.8 - 95.6
10 E/L 73.0 62.2 70.2 69.4 91.4 73.6
11 L/E 74.2 60.3 82.5 73.1 96.3 85.9
12 L/L 71.8 57.9 69.6 67.8 95.1 68.7
DeKalb 660XL 13 E/E 77.4 67.3 81.6 72.2 97.9 86.8
14 E/L 74.6 63.9 74.1 63.1 87.8 83.5
15 L/E 80.8 60.1 80.0 76.8 96.9 81.6
16 L/L 74.6 54.5 71.9 72.3 96.7 70.8
Pioneer 3098 17 E/E 76.8 58.9 82.1 73.2 97.0 84.5
18 E/L 73.5 58.3 72.2 66.8 94.7 69.3
19 L/E 79.4 59.2 85.9 69.9 96.9 84.1
20 L/L 73.2 56.7 73.8 68.2 96.0 71.5
Significance (P):
Treatments <0.01 <0.01 <0.01 <0.01 <0.01 <0.01
MSD3 2.2 3.7 2.9 4.8 6.6 6.31 Desc. = description, E = early and L = late, which refers to planting/harvesting sequences; i.e., E/L is read
“planted early and harvested late.” See Table 13.1 for details.2 Each value is the mean of three replicates.4 MSD = minimum significant difference from the Waller-Duncan k-ratio (k = 100) t-test and can be used to
compare any two treatments.

Fermentation Characteristics, Nutritive Value, and Quality 91
Appendix Table AT13.3. Crude protein concentration of the morphological components of temperate and tropical corn forages prior to ensiling (dry matter basis).
Forage
Treatment Forage Ear
No. Desc.1Leaf Stem Husk Dead Grain Cob
—————————— % —————————-
Temperate corn:
Pioneer 3156 1 E/E 14.52 2.9 4.0 7.6 10.0 3.9
2 E/L 10.2 2.4 3.1 4.4 9.1 2.8
3 L/E 15.3 4.5 5.3 6.5 11.5 7.7
4 L/L 13.3 4.5 4.9 9.0 11.8 4.1
Tropical corn:
Dekalb 678C 5 E/E 13.8 3.8 6.0 6. 15.6 11.5
6 E/L 11.1 4.1 4.6 5.7 14.0 5.9
7 L/E 16.3 4.4 6.5 8.0 16.1 12.8
8 L/L 11.4 3.6 3.2 7.0 11.6 3.0
Pioneer X304C 9 E/E 11.8 4.3 7.5 4.5 - 14.6
10 E/L 9.5 3.9 5.1 5.6 14.2 7.6
11 L/E 14.2 3.5 5.6 5.9 17.7 12.4
12 L/L 10.3 4.2 3.8 6.6 13.1 4.9
DeKalb 660XL 13 E/E 11.8 3.6 6.0 4.6 13.1 9.4
14 E/L 10.2 3.9 5.3 4.3 10.3 8.6
15 L/E 14.9 4.2 5.5 7.7 14.5 8.9
16 L/L 11.0 4.3 4.7 6.9 12.5 5.2
Pioneer 3098 17 E/E 11.7 3.6 4.6 4.6 13.0 8.9
18 E/L 10.3 3.7 4.0 5.1 12.9 6.2
19 L/E 13.7 4.5 5.5 5.1 15.3 9.7
20 L/L 9.7 4.5 3.6 6.1 13.7 5.3
Significance (P):
Treatments <0.01 0.01 <0.01 <0.01 <0.01 <0.01
MSD3 1.7 1.3 1.0 1.9 2.4 2.71 Desc. = description, E = early, and L = late, which refers to planting/harvesting sequences; i.e., E/L is read “planted early and harvested late.” See Table 13.1 for details.2 Each value is the mean of three replicates.3 MSD = minimum significant difference from the Waller-Duncan k-ratio (k = 100) t-test and can be used to
compare any two treatments.

92 Annual Grasses Preserved as Silage:
Appendix Table AT13.4. Neutral detergent fiber concentration of the morphological components of tem-perate and tropical corn forages prior to ensiling (dry matter basis).
Forage
Treatment Forage Ear
No. Desc.1Leaf Stem Husk Dead Grain Cob
—————————— % —————————--
Temperate corn:
Pioneer 3156 1 E/E 61.82 66.9 68.1 67.9 18.5 75.6
2 E/L 62.4 72.2 77.2 73.2 18.5 78.5
3 L/E 62.6 61.2 59.5 71.5 18.7 68.0
4 L/L 61.5 58.7 70.2 66.4 22.3 75.9
Tropical corn:
Dekalb 678C 5 E/E 64.5 65.4 67.7 72.8 29.8 61.2
6 E/L 65.2 63.5 73.7 73.9 30.0 73.5
7 L/E 64.7 68.3 64.5 66.1 23.3 57.1
8 L/L 64.7 69.6 79.3 70.8 25.3 78.3
Pioneer X304C 9 E/E 65.3 64.6 62.1 75.0 - 36.0
10 E/L 64.2 64.6 73.2 73.6 25.6 67.1
11 L/E 66.3 65.7 63.6 71.5 30.1 53.9
12 L/L 62.4 63.7 76.1 71.2 27.3 71.4
DeKalb 660XL 13 E/E 66.1 63.7 64.1 74.0 20.7 54.6
14 E/L 64.7 62.3 69.5 81.8 42.2 53.0
15 L/E 64.1 69.7 68.9 69.0 27.3 62.8
16 L/L 66.7 72.7 77.4 75.1 24.3 74.1
Pioneer 3098 17 E/E 66.4 70.1 69.2 74.3 24.6 58.4
18 E/L 65.9 69.3 79.2 77.1 25.5 71.5
19 L/E 64.2 70.2 66.4 78.7 26.9 61.2
20 L/L 65.0 67.2 80.3 75.1 25.6 72.1
Significance (P):
Treatments <0.01 <0.01 <0.01 <0.01 0.07 <0.01
MSD3 2.5 3.5 3.4 4.8 16.4 10.11 Desc. = description, E = early, and L = late, which refers to planting/harvesting sequences; i.e., E/L is read
“planted early and harvested late.” See Table 13.1 for details.2 Each value is the mean of three replicates.3 MSD = minimum significant difference from the Waller-Duncan k-ratio (k = 100) t-test and can be used to
compare any two treatments.


Distributed in furtherance of the acts of Congress of May 8 and June 30, 1914. North Carolina State University and North Carolina A&T State University commit themselves to positive action to secure equal opportunity regardless of race, color, creed national ori-gin, religion, sex, age, or disability. In addition, the two Universities welcome all persons without regard to sexual orientation. North Carolina State University, North Carolina A&T State University, U. S. Department of Agriculture, and local governments cooperating.
Published by NORTH CAROLINA COOPERATIVE EXTENSION SERVICE andNORTH CAROLINA AGRICULTURAL RESEARCH SERVICE
14-CALS-405311/2013—VB/BS—200
TB-333