Annual General Meeting - Keppel REIT...Apr 23, 2019 · Asset swap of Keppel Towers and GE Tower...
24
Annual General Meeting 23 April 2019
Transcript of Annual General Meeting - Keppel REIT...Apr 23, 2019 · Asset swap of Keppel Towers and GE Tower...

Annual General Meeting
23 April 2019

2
• Overview 3
• Driving Performance 5
• Acquisition in Seoul 17
Outline
IMPORTANT NOTICE: The past performance of Keppel REIT is not necessarily indicative of its future performance. Certain statements made in this presentation may not be based on historical information or facts and may be
“forward-looking” statements due to a number of risks, uncertainties and assumptions. Representative examples of these factors include (without limitation) general industry and economic conditions, interest rate trends, cost of
capital and capital availability, competition from similar developments or shifts in expected levels of property rental income, changes in operating expenses, including employee wages, benefits and training, property expenses
and governmental and public policy changes, and the continued availability of financing in the amounts and terms necessary to support future business.
Prospective investors and unitholders of Keppel REIT (“Unitholders”) are cautioned not to place undue reliance on these forward-looking statements, which are based on the current view of Keppel REIT Management Limited, as
manager of Keppel REIT (the “Manager”) on future events. No representation or warranty, express or implied, is made as to, and no reliance should be placed on, the fairness, accuracy, completeness or correctness of the
information, or opinions contained in this presentation. None of the Manager, the trustee of Keppel REIT or any of their respective advisors, representatives or agents shall have any responsibility or liability whatsoever (for
negligence or otherwise) for any loss howsoever arising from any use of this presentation or its contents or otherwise arising in connection with this presentation. The information set out herein may be subject to updating,
completion, revision, verification and amendment and such information may change materially. The value of units in Keppel REIT (“Units”) and the income derived from them may fall as well as rise. Units are not obligations of,
deposits in, or guaranteed by, the Manager or any of its affiliates. An investment in Units is subject to investment risks, including the possible loss of the principal amount invested.
Investors have no right to request the Manager to redeem their Units while the Units are listed. It is intended that Unitholders may only deal in their Units through trading on Singapore Exchange Securities Trading Limited (“SGX-
ST”). Listing of the Units on SGX-ST does not guarantee a liquid market for the Units.

3
Marina Bay
Financial Centre One Raffles
Quay
Ocean Financial
Centre
Large Portfolio of
Premium Office Assets
Over $8 billion of
Grade A commercial assets
pan-Asia
Strong Portfolio
Occupancy and WALE
High portfolio committed
occupancy and long WALE
provides income resilience
Commitment to
Sustainability
BCA Green Mark Platinum
award for all Singapore assets;
5 Stars NABERS Energy rating
for most Australian assets
Young and Green Commercial Assets
3

4
Milestones since Listing
2006
2007
2009
2010
2011
2012
2013
2014
2015
2016
2017
2018
2019
Listed on
SGX
with over
$600m AUM
Maiden
Acquisition:
One Raffles
Quay
Increased
stake to 99.9%
for Ocean
Financial
Centre
Acquired
one-third of
MBFC
Tower 3
Divested
stake in
Prudential
Tower
Divested
77 King Street in
Sydney
Divested 20%
minority stake in
Ocean Financial
Centre
Increased
Stake in
Prudential
Towers
Acquired
50% of
8 Chifley
Square
Acquired
87.5% of
Ocean
Financial
Centre
Acquired 50% of
David Malcom Justice
Centre, Perth, and
8 Exhibition Street,
Melbourne
Acquired three
retail units at
8 Exhibition Street
Acquired 50% of
311 Spencer Street
development in
Melbourne
Expanded
footprint to
South Korea
with 99.38% of
T Tower
$8.4b
AUM
Expanded footprint
to Australia with
77 King Street and
275 George Street
Asset swap of
Keppel Towers
and GE Tower
for one-third of
MBFC Phase 1

Driving
Performance
Marina Bay Financial Centre,
Singapore

6
FY 2018 Highlights
(1) Include capital gains distribution of $3.0 million for 4Q 2018.
(2) For the Singapore office leases concluded in FY 2018 and based on a simple average calculation.
(3) Based on simple average calculation of CBRE Pte. Ltd.’s quarterly rents for Grade A offices in Singapore CBD in 2018
(1Q 2018: $9.70 psf pm, 2Q 2018: $10.10 psf pm, 3Q 2018: $10.45 psf pm, 4Q 2018: $10.80 psf pm)
Average signing rent for
Singapore office leases
~$11.10(2) psfabove Grade A core CBD market average
of $10.26(3) psf
Leases Committed
2,853,100 sf(Attributable area ~1,227,100 sf)
Portfolio Committed Occupancy
98.4%
Portfolio WALE
5.9 years
Distributable Income
$189.0 m(1)
Distribution per Unit
5.56 cents
Aggregate Leverage
36.3%

Proactive Leasing Strategy
Sources: (1) CBRE, 4Q 2018 (2) JLL, end September 2018
Note: Based on committed attributable area
High Portfolio Committed Occupancy (as at 31 December 2018)
▪ Committed occupancies as at end-2018 remain healthy and above market average
100.0% 96.1% 99.9% 96.1% 99.3% 98.7% 100.0% 100.0% 98.4%
Bugis JunctionTowers
OceanFinancialCentre
Marina BayFinancialCentre
One RafflesQuay
275 GeorgeStreet,
Brisbane
8 ExhibitionStreet,
Melbourne
8 ChifleySquare,Sydney
David MalcolmJustice Centre,
Perth
Portfolio
Singapore’s core CBD
average occupancy: 94.8%(1)
Australia’s national CBD
average occupancy: 90.9%(2)
Singapore
98.1%
Australia
99.4%
Overall
98.4%
7

2.5%
4.0%
4.5%
6.6%
2.5%
3.4%
5.3%
3.0%
4.1%
4.1%
Queensland GasCompany (subsi of Shell)
Drew & Napier
UBS
Telstra
BNP Paribas
Enterprise Singapore
Ernst & Young
Standard Chartered
Government of WesternAustralia
DBS
8
Diversified Tenant Base
Top 10 Tenants Profile of Tenant Base
Note: All data as at 31 December 2018 and based on portfolio committed NLA.
(1) Tenants with multiple leases were accounted as one tenant.
336(1)tenants in total
Banking, insurance & financial services
Government agency
TMT
Energy, natural resources, shipping and marine
Legal
Accounting & consultancy services
Real estate & property services
Services
Retail and F&B
Hospitality & leisure
Others
40.1% of NLA 37.8% of gross rent
Government of Western
Australia
Queensland Gas Company
(subsi of Shell)
Ocean Financial
Centre
Marina Bay
Financial Centre
One Raffles Quay
275 George Street
8 Exhibition Street
David Malcolm
Justice Centre
Bugis Junction Towers
4.6%

9
Well-Spread Lease Expiry Profile
Note: All data as at 31 December 2018 and based on committed attributable area
▪ Long overall portfolio WALE of 5.9 years
▪ Top 10 tenants’ WALE was 8.2 years
Portfolio Lease Expiry Profile(as at 31 December 2018)
4.2%8.2%
16.7% 18.5%
6.5%
44.3%
0.4% 3.5%7.5%
0.0%4.0%
7.7%
2019 2020 2021 2022 2023 2024 andbeyond
Expiring leases Rent review leases

10
Unit Buy-Back Programme
▪ Buying back Units below NAV
is accretive to Unitholders and
is part of proactive capital
management strategy
▪ As at 31 March 2019, purchased
and cancelled 34.0 million
issued Units since the initiation
of Unit buy-back programme in
3Q 2018
3.50m
1.78m
-
5.36m4.08m
13.56m
2.50m3.25m
Jul2018
Aug2018
Sep2018
Oct2018
Nov2018
Dec2018
Jan2019
Feb2019
Monthly Unit Buy-Back Volume(since initiation of programme)

11
(1) As at 31 December 2018.
(2) This takes into account commitments received as at 31 March 2019 to refinance the remaining loans that are due in 2019.
▪ Refinancing remaining loans due in 2019
with commitments received as at 31 March 2019
▪ Extended weighted average term to maturity
from 2.8 years(1) to 3.3 years(2) in 1Q 2019
▪ Lowered aggregate leverage from 36.3%(1) to
35.7% after repayment of loans in 1Q 2019
Proactive Capital Management
91%
9%
Fixed-RateBorrowings
Floating-RateBorrowings
Managing interest rate exposure(as at 31 March 2019)
All-in Interest Rate: 2.88%(as at 31 March 2019)

▪ Issued 5-year convertible bonds on 10 April
2019 at coupon rate of 1.90% to lower
interest costs and diversify funding sources
▪ Estimated interest savings of
approximately $1.5-2.0 million p.a.
compared to a new loan in current high
interest rate environment
Convertible Bonds
Issue Size $200.0 m
Coupon Rate 1.9% p.a.
Conversion Premium 12.5%
Maturity 5 year
$650m
$360m
$608m$489m
$698m
$50m
$75m
$538m(1)
$127m(2)
$200m
2019 2020 2021 2022 2023 2024
Bank loans $50m 7-year MTN at 3.15%
(Issued in February 2015)$75m 7-year MTN at 3.275%
(Issued in April 2017)$200m 5-year convertible bonds at 1.9%
(Issued in April 2019)
Debt Maturity Profile(as at 31 Mar 2019, assuming convertible bonds were issued in 1Q 2019)
21%
11%
21%
16%
31%
Convertible Bonds
(1) Received commitments to refinance these loans.
(2) $127.0 million loan repayment through working capital optimisation efforts and with part of the proceeds from the sale of a 20% stake in Ocean Financial Centre.
12

13
Unlocking Capital Gains
▪ Divested 20% stake in Ocean Financial Centre to Allianz
▪ Keppel REIT maintains controlling stake of 79.9%
▪ Unlocking capital gains while maintaining exposure to
strengthening Singapore Grade A office market
(1) The net proceeds received amounted to approximately $439.3 million, based on 20% of OPLLP’s adjusted net asset
value on the date of completion of the divestment (subject to final adjustments).
(2) Based on 20% of the historical purchase price of $2,298.8 million for Keppel REIT’s 99.9% ownership.
(3) Computed based on the pro-rated difference between agreed property value and historical purchase price of Ocean
Financial Centre.
Partial divestment of
Ocean Financial Centre
as part of
portfolio optimisation
20% of Ocean Financial Centre
Sale Price(1) $537.3 m
Purchase Price(2) $460.2 m
Capital Gain(3) $77.1 m
Net Asset-level Return 8.3%

14
311 Spencer Street Development
▪ Average NPI Yield: 6.4%(1)
▪ Stable income stream:
30-year lease with fixed annual rental
escalations
▪ Enhanced tenancy profile:
Freehold Grade A office tower will be
headquarters for the Victoria Police,
a AAA-rated tenant
▪ Construction of freehold Grade A office tower is in progress in Melbourne
▪ 30-year lease to the Victoria Police will commence in 1H 2020 and contribute
steady income
(1) Stable average yield based on the expected net property income of the building for
the first 15 years of the lease to the tenant, over the consideration. Artist’s Impression Development in Progress

15
Future-Proofing Assets
Initiatives carried out to
rejuvenate asset
Before After
Artist’s impression after foyer upgrade
8 Exhibition Street,
Melbourne
Artist’s impression after foyer upgrade
275 George Street,
Brisbane
Initiatives planned to
improve amenities
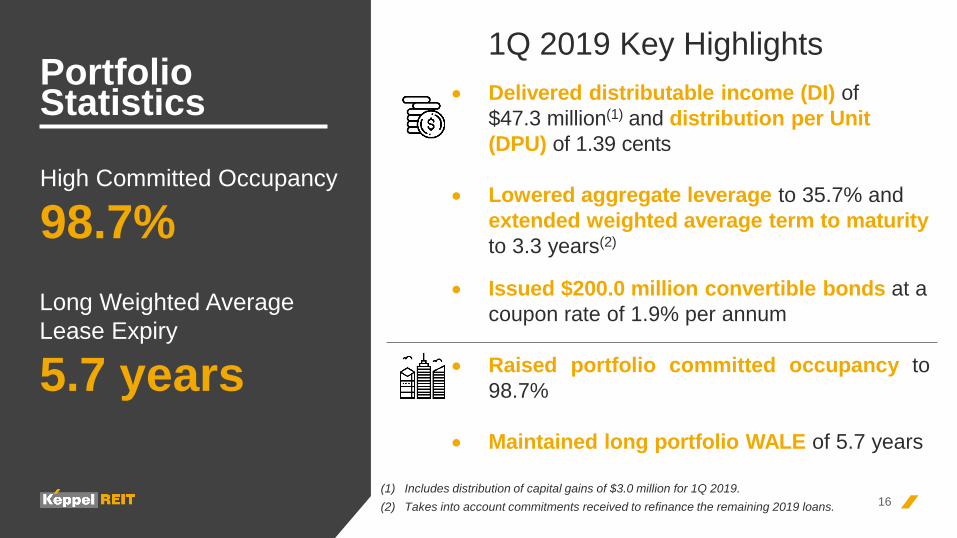
• Delivered distributable income (DI) of
$47.3 million(1) and distribution per Unit
(DPU) of 1.39 cents
• Lowered aggregate leverage to 35.7% and
extended weighted average term to maturity
to 3.3 years(2)
• Issued $200.0 million convertible bonds at a
coupon rate of 1.9% per annum
• Raised portfolio committed occupancy to
98.7%
• Maintained long portfolio WALE of 5.7 years
16
High Committed Occupancy
98.7%
Portfolio Statistics
1Q 2019 Key Highlights
(1) Includes distribution of capital gains of $3.0 million for 1Q 2019.
(2) Takes into account commitments received to refinance the remaining 2019 loans.
Long Weighted Average
Lease Expiry
5.7 years
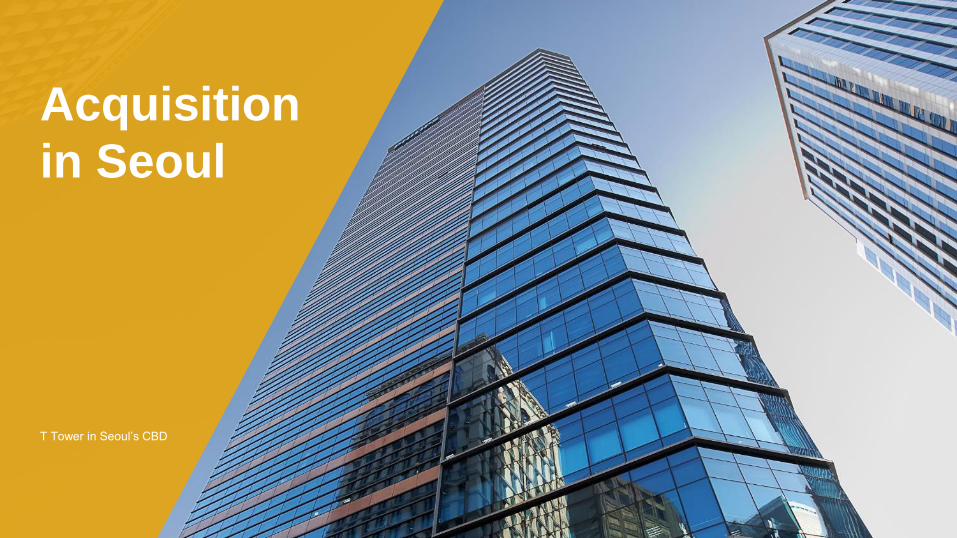
T Tower in Seoul’s CBD
Acquisition
in Seoul

18
Transaction Overview
▪ Acquiring 99.38%(1) of T Tower, a freehold Grade A office
building in Seoul’s central business district (CBD)
▪ Entry into Seoul which has a deep office market with
favourable fundamentals
▪ Ability to leverage Keppel Capital’s on-the-ground presence
and experience to seek opportunities for growth
T Tower in Seoul’s CBD
Land Tenure Freehold
Building Completion 2010
Attributable NLA 226,945 sf
Occupancy 100% committed
WALE 2.8 years
No. of Tenants 11
(1) The remaining 0.62% stake will be acquired by Keppel Capital Investment Holdings Pte. Ltd., a wholly-owned subsidiary of
Keppel Capital Holdings Pte. Ltd. (Keppel Capital)

19
Transaction Overview (Cont’d)
99.38% of T Tower KRW $
Independent Valuation by
Cushman & Wakefield(1)259.0b 309.0m
Agreed Property
Value(1,3)252.6b 301.4m
Transaction Costs(1) 11.5b 13.7m
Total Acquisition
Consideration(1) 141.1b(4) 168.3m
▪ DPU-accretive acquisition with NPI yield of
4.7% is part of ongoing portfolio optimisation
efforts to improve portfolio yield
▪ Agreed property value of KRW 252.6 billion(1,3)
(approximately $301.4 million) is 2.5% lower
than independent valuation by Cushman &
Wakefield
▪ Acquisition is expected to complete in 2Q 2019
and will be funded by debt, including proceeds
from issuance of 1.90% convertible bonds(2)
(1) Based on an approximate 99.38% interest in T Tower and an exchange rate of KRW 1,000 to $1.193 as at 18 April 2019.
(2) As announced by the Manager on 10 April 2019.
(3) Equivalent to KRW 20.2 million/pyeong (py), based on attributable Gross Floor Area of 444,979 sf and conversion of 1 py to 35.6 sf.
(4) After taking into account the attributable share of the adjusted net tangible liabilities of KRW 123.0 billion ($146.8 million) to be assumed from the asset.

20
Video of T Tower in Seoul
Click to view property video

21
Merits of Acquisition
1 Entry into Seoul which has a deep office market with favourable fundamentals
2 Freehold Grade A commercial building in the CBD
3 DPU-accretive acquisition
4 Geographical and income diversification
5 Leverage Keppel Capital’s on-the-ground presence and experience in South Korea

22
DPU-Accretive Acquisition
FOR ILLUSTRATIVE PURPOSES ONLY: Pro forma financial effects of the acquisition on DPU
▪ Acquisition of T Tower brings 2.5%(1) DPU accretion on a pro forma basis for FY 2018
Pro Forma Impact
of the AcquisitionBefore(FY 2018)
After(Assuming acquisition was completed on 1 January 2018)
DPU 5.56 cents 5.70 cents
DPU Accretion +2.5%
Pro Forma Impact
of the AcquisitionBefore(FY 2018)
Before(Assuming the divestment of a
20% stake in Ocean Financial
Centre was completed on 1 January
2018)
After(Assuming the acquisition of T
Tower and the divestment of a 20%
stake in Ocean Financial Centre
were completed on 1 January 2018)
DPU 5.56 cents 5.44 cents 5.57 cents
(1) Pro forma effect on FY 2018 DPU, assuming acquisition was completed on 1 January 2018.

23
Pan-Asia REIT with Premium Office Portfolio
14.0%Australia
Ocean Financial
Centre
79.9% Interest
Marina Bay
Financial Centre
33.3% Interest
One Raffles Quay
33.3% Interest
Bugis Junction
Towers
100% Interest
8 Chifley Square,
Sydney
50% Interest
8 Exhibition Street,
Melbourne
50% Interest
275 George Street,
Brisbane
50% Interest
David Malcolm
Justice Centre,
Perth
50% Interest
311 Spencer Street,
Melbourne
50% Interest
(Under development)
Note: Based on total assets under management of approximately $8.4 billion as at 31 March 2019, assuming acquisition of T Tower was completed in 1Q 2019.
82.4%Singapore
3.6%South Korea
T Tower, Seoul
99.38% Interest
(Pending Completion)
$8.4b portfolio of 10 prime commercial assets
in key business districts of Singapore, Australia and South Korea

24
Thank You


![MELBOURNE CBD - Microsoft · 2017. 9. 28. · Mirvac/Suntec REIT - Q2 2020 - 43% committed. 311 Spencer St - 65,000m² [Victroria Police] Keppel REIT/Cbus Property - Q3 2020 - 100%](https://static.fdocuments.us/doc/165x107/60d6115ac5562c06726888a8/melbourne-cbd-microsoft-2017-9-28-mirvacsuntec-reit-q2-2020-43-committed.jpg)