ANNUAL FINANCIAL STATEMENTS · The financial statements set out the financial performance,...
135
ANNUAL FINANCIAL STATEMENTS 2016 - 2017
Transcript of ANNUAL FINANCIAL STATEMENTS · The financial statements set out the financial performance,...

ANNUALFINANCIAL
STATEMENTS2 0 1 6 - 2 0 1 7

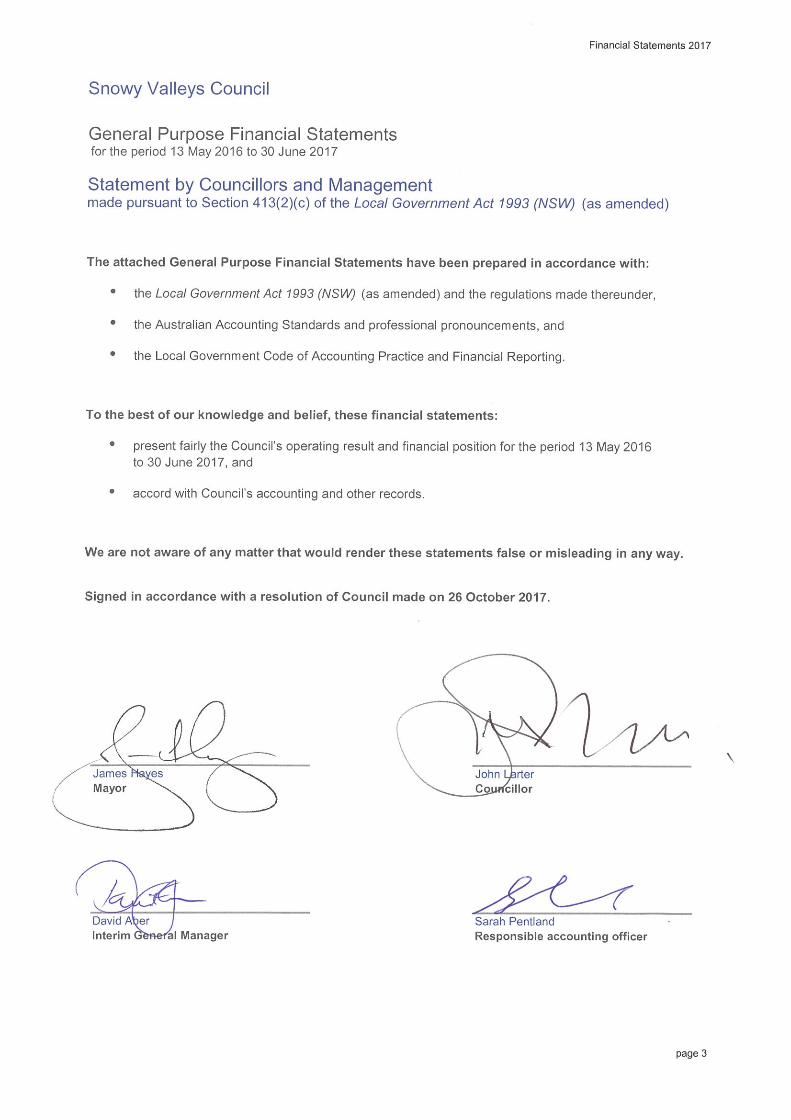
Snowy Valleys Council GENERAL PURPOSE FINANCIAL STATEMENTS for the period 13 May 2016 to 30 June 2017
Leading, engaging & supportingstrong & vibrant communities

Financial Statements 2017
page 1
Snowy Valleys Council
General Purpose Financial Statements for the period 13 May 2016 to 30 June 2017
Contents
1. Understanding Council’s Financial Statements
2. Statement by Councillors and Management
3. Primary Financial Statements:
– Income Statement– Statement of Comprehensive Income– Statement of Financial Position– Statement of Changes in Equity– Statement of Cash Flows
4. Notes to the Financial Statements
5. Independent Auditor’s Reports:
– On the Financial Statements (Sect 417 [2]) – On the Conduct of the Audit (Sect 417 [3])
Overview
(i) These financial statements are General Purpose Financial Statements and cover the operations forSnowy Valleys Council.
(ii) Snowy Valleys Council is a body politic of NSW, Australia – being constituted as a local government areaby proclamation and is duly empowered by the Local Government Act 1993 (LGA).
Council’s guiding principles are detailed in Chapter 3 of the LGA and includes:
principles applying to the exercise of functions generally by council,
principles to be applied when making decisions,
principles of community participation,
principles of sound financial management, and
principles for strategic planning relating to the development of an integrated planning and reporting framework.
A description of the nature of Council’s operations and its principal activities are provided in Note 2(b).
(iii) All figures presented in these financial statements are presented in Australian currency.
(iv) These financial statements were authorised for issue by the Council on 26 October 2017.Council has the power to amend and reissue these financial statements.
Page
4
67
5
2
3
8
9
8285

Financial Statements 2017_
Snowy Valleys Council
General Purpose Financial Statements for the period 13 May 2016 to 30 June 2017
Understanding Council’s Financial Statements
page 2
Introduction
Each year, individual local governments across New South Wales are required to present a set of audited financial statements to their council and community. What you will find in the statements
The financial statements set out the financial performance, financial position and cash flows of Council for the period 13 May 2016 to 30 June 2017. The format of the financial statements is standard across all NSW Councils and complies with both the accounting and reporting requirements of Australian Accounting Standards and requirements as set down by the Office of Local Government. About the Councillor/Management Statement
The financial statements must be certified by senior staff as ‘presenting fairly’ the Council’s financial results for the reporting period and are required to be adopted by Council – ensuring both responsibility for and ownership of the financial statements. About the primary financial statements
The financial statements incorporate five ‘primary’ financial statements: 1. The Income Statement
Summarises Council's financial performance for the reporting period, listing all income and expenses. 2. The Statement of Comprehensive Income
Primarily records changes in the fair value of Council's Infrastructure, Property, Plant and Equipment. 3. The Statement of Financial Position
A 30 June snapshot of Council's financial position indicating its assets, liabilities and “net wealth”. 4. The Statement of Changes in Equity
The overall change for the reporting period (in dollars) of Council’s “net wealth”.
5. The Statement of Cash Flows
Indicates where Council's cash came from and where it was spent.
About the Notes to the Financial Statements The Notes to the Financial Statements provide greater detail and additional information on the five primary financial statements. About the Auditor’s Reports Council’s annual financial statements are required to be audited by the NSW Audit Office. In NSW the auditor provides 2 audit reports: 1. an opinion on whether the financial statements
present fairly the Council’s financial performance and position, and
2. their observations on the conduct of the audit, including commentary on the Council’s financial performance and financial position.
Who uses the financial statements? The financial statements are publicly available documents and must be presented at a Council meeting between seven days and five weeks after the date of the Audit Report. The public can make submissions to Council up to seven days subsequent to the public presentation of the financial statements. Council is required to forward an audited set of financial statements to the Office of Local Government.

Financial Statements 2017
This statement should be read in conjunction with the accompanying notes. page 4
Snowy Valleys Council
Income Statement for the period 13 May 2016 to 30 June 2017
$ ’000
Income from continuing operationsRevenue:Rates and annual chargesUser charges and feesInterest and investment revenueOther revenuesGrants and contributions provided for operating purposesGrants and contributions provided for capital purposesOther income:Net share of interests in joint ventures andassociates using the equity method
Total income from continuing operations
Expenses from continuing operationsEmployee benefits and on-costsBorrowing costsMaterials and contractsDepreciation and amortisationOther expensesNet losses from the disposal of assets
Total expenses from continuing operations
Operating result from continuing operations
Discontinued operations
Net profit/(loss) from discontinued operations
Net operating result for the period
Gain on local government amalgamation
Assets and liabilities transferred from former councils
Net result for the period
Net operating result attributable to CouncilNet operating result attributable to non-controlling interests
Net operating result for the period before grants andcontributions provided for capital purposes
Original budget as approved by Council – refer Note 16
603,949
3e,f
4d
4b4c
3b
19
4a
3e,f
16,704
800
Notes
3a
3c
2,271
62,520
8,344 12,324 20,205
–
(3,047)
3d
24
54e
18,576
9,051
28 594,898
603,949
–
1
9,051
71,571
Actual
–
12,098 19,107
21,130 1,513 1,019
13/5/16 to 30/6/17

Financial Statements 2017
This statement should be read in conjunction with the accompanying notes. page 5
Snowy Valleys Council
Statement of Comprehensive Income for the period 13 May 2016 to 30 June 2017
$ ’000
Net result for the period (as per Income Statement)
Other comprehensive income:
Amounts which will not be reclassified subsequently to the operating result
Gain (loss) on revaluation of I,PP&ETotal items which will not be reclassified subsequentlyto the operating result
Amounts which will be reclassified subsequently to the operating resultwhen specific conditions are metNil
Total items which will be reclassified subsequentlyto the operating result when specific conditions are met
Total other comprehensive income for the period
Total comprehensive income for the period
Total comprehensive income attributable to CouncilTotal comprehensive income attributable to non-controlling interests
1,757 20b (ii)
Actual 13/5/16
to 30/6/17
1,757
–
605,706
1,757
603,949
Notes
605,706
–

Financial Statements 2017
This statement should be read in conjunction with the accompanying notes. page 6
Snowy Valleys Council
Statement of Financial Position as at 30 June 2017
$ ’000
ASSETSCurrent assetsCash and cash equivalentsInvestmentsReceivablesInventoriesOtherNon-current assets classified as ‘held for sale’Total current assets
Non-current assetsInvestmentsReceivablesInventoriesInfrastructure, property, plant and equipmentInvestments accounted for using the equity methodInvestment propertyIntangible assetsTotal non-current assets
TOTAL ASSETS
LIABILITIESCurrent liabilitiesPayablesIncome received in advanceBorrowingsProvisionsTotal current liabilities
Non-current liabilitiesPayablesIncome received in advanceBorrowingsProvisionsTotal non-current liabilities
TOTAL LIABILITIES
Net assets
EQUITYRetained earningsRevaluation reserves
Total equity
–
20
5,746
72
237
–
625,531
1010
25
–
567,336
36,084
2017
–
147
9,088
2,159
568,800
49
605,706
10
–
10
10
10
1010
20
7
1419
8
6a6b
22
Notes
9
7
6b
8
8
1,080
Actual
560 6,726
13,240
56,731
1,757
605,706
603,949
10,737 312
10,425
–
19,825
1,183
Financial Statements 2017
This statement should be read in conjunction with the accompanying notes. page 7
Snowy Valleys Council
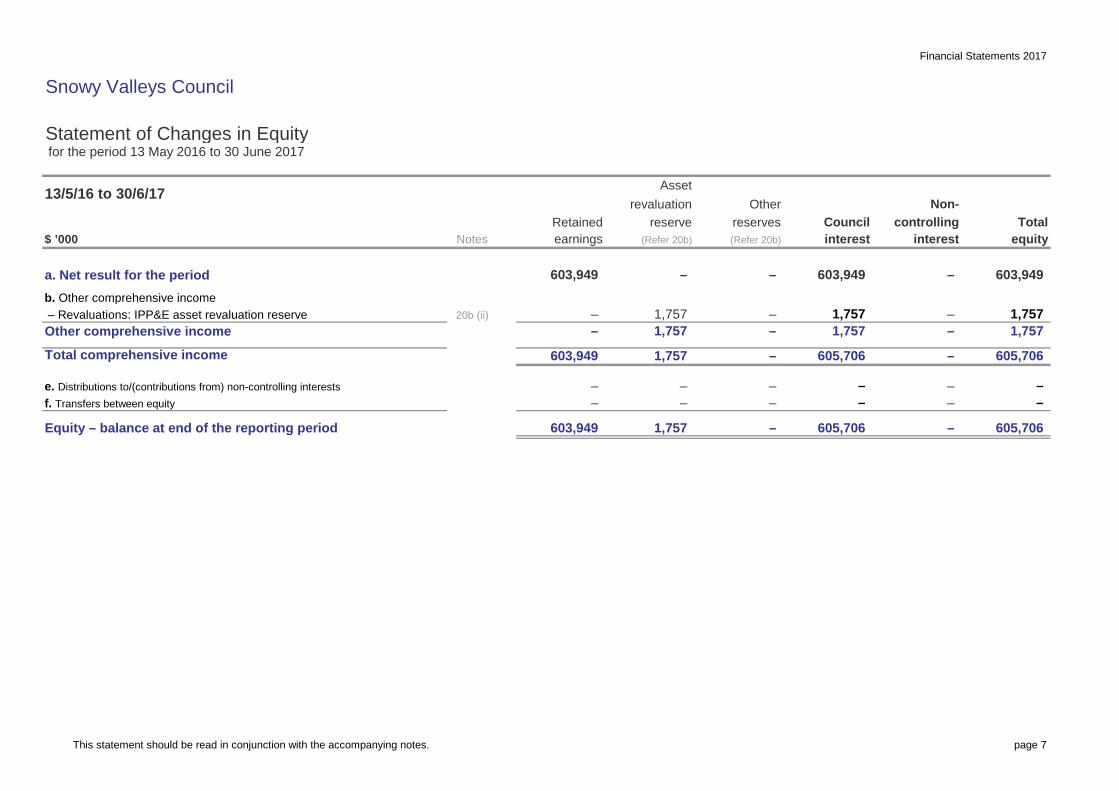
Statement of Changes in Equity for the period 13 May 2016 to 30 June 2017
$ ’000
a. Net result for the periodb. Other comprehensive income – Revaluations: IPP&E asset revaluation reserveOther comprehensive incomeTotal comprehensive income
e. Distributions to/(contributions from) non-controlling interestsf. Transfers between equity
Equity – balance at end of the reporting period
13/5/16 to 30/6/17
reserves(Refer 20b)
1,757
603,949
1,757
–
603,949 1,757 605,706 – 605,706
–
–
– – – –
605,706 –
– –
603,949 1,757 605,706 –
– – –
– 1,757 1,757 – – – 20b (ii) – 1,757 1,757 –
– 603,949 – 603,949 –
Retained reserve Council controlling TotalNotes earnings (Refer 20b) interest interest
revaluation Other Non-
equity
Asset
–
Financial Statements 2017
This statement should be read in conjunction with the accompanying notes. page 8
Snowy Valleys Council
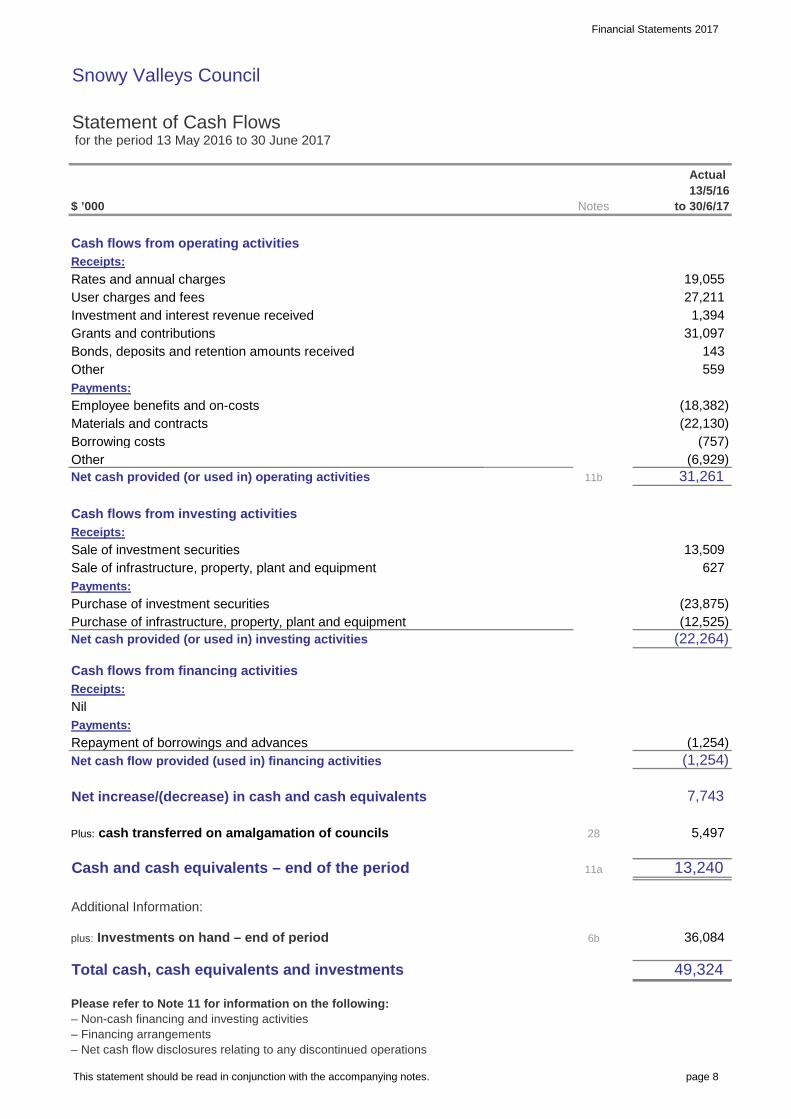
Statement of Cash Flows for the period 13 May 2016 to 30 June 2017
$ ’000
Cash flows from operating activitiesReceipts:Rates and annual chargesUser charges and feesInvestment and interest revenue receivedGrants and contributionsBonds, deposits and retention amounts receivedOtherPayments:Employee benefits and on-costsMaterials and contractsBorrowing costsOtherNet cash provided (or used in) operating activities
Cash flows from investing activitiesReceipts:Sale of investment securitiesSale of infrastructure, property, plant and equipmentPayments:Purchase of investment securitiesPurchase of infrastructure, property, plant and equipmentNet cash provided (or used in) investing activities
Cash flows from financing activitiesReceipts:NilPayments:Repayment of borrowings and advancesNet cash flow provided (used in) financing activities
Net increase/(decrease) in cash and cash equivalents
Plus: cash transferred on amalgamation of councils
Cash and cash equivalents – end of the period
Additional Information:
plus: Investments on hand – end of period
Total cash, cash equivalents and investments
Please refer to Note 11 for information on the following:– Non-cash financing and investing activities– Financing arrangements– Net cash flow disclosures relating to any discontinued operations
31,261
13,509 627
(18,382)
13/5/16 to 30/6/17
1,394
7,743
(1,254)
49,324
36,084
11b
11a
6b
28
13,240
19,055
31,097
27,211
143
(757) (22,130)
(23,875)
Notes
5,497
(1,254)
(6,929)
559
(22,264) (12,525)
Actual

Financial Statements 2017
page 9
Snowy Valleys Council
Notes to the Financial Statements for the period 13 May 2016 to 30 June 2017
Contents of the notes accompanying the financial statements
Details
Summary of significant accounting policiesCouncil functions/activities – financial informationCouncil functions/activities – component descriptionsIncome from continuing operationsExpenses from continuing operationsGains or losses from the disposal of assetsCash and cash equivalent assetsInvestmentsRestricted cash, cash equivalents and investments – detailsReceivablesInventories and other assetsInfrastructure, property, plant and equipmentExternally restricted infrastructure, property, plant and equipmentInfrastructure, property, plant and equipment – current period impairmentsPayables, borrowings and provisionsDescription of (and movements in) provisionsStatement of cash flows – additional informationCommitments for expenditureStatement of performance measures:13a Local government industry indicators (consolidated)13b Local government industry indicators (by fund)Investment propertiesFinancial risk managementMaterial budget variationsStatement of developer contributionsContingencies and other liabilities/assets not recognisedInterests in other entities
Financial result and financial position by fund‘Held for sale’ non-current assets and disposal groupsEvents occurring after the reporting dateDiscontinued operationsIntangible assetsReinstatement, rehabilitation and restoration liabilitiesFair value measurementLocal Government amalgamation
Additional council disclosures
Council information and contact details
n/a – not applicable
51
40
35
3637
46
44
45
41
2(a)
32(b)
6(b)
5
23
26
Note
22
14
10(a)10(b)
17
6(a)
4
6(c)
9(c)
11
24
Page
1
25
19
1516
20
21
50
49
43
44 n/a
18
1213
10232425
78
9(a)9(b)
29
31
36
47
58
52
81
6968
66
71
68 n/a
28 78
52 n/a
61
55 n/a
67
56
64
63Retained earnings, revaluation reserves, changes in accounting policies, changes in accounting estimates and errors
27

Financial Statements 2017_
Snowy Valleys Council
Notes to the Financial Statements for the period 13 May 2016 to 30 June 2017
Note 1. Summary of significant accounting policies
page 10
The principal accounting policies adopted in the preparation of these consolidated financial statements are set out below. These policies have been consistently applied to all the periods presented, unless otherwise stated. (a) Basis of preparation The local government (Council Amalgamations) Proclamation 2016 (‘the Proclamation’) under the Local Government Act 1993 (NSW) transferred the assets and liabilities of former councils: Tumut Shire Council Tumbarumba Shire Council to Snowy Valleys Council as at 12 May 2016. Pursuant to the Proclamation, financial statements have been prepared for the period commencing on the date of establishment of Snowy Valleys Council, being 13 May 2016 and ending on 30 June 2017. Future reporting periods will be from 1 July to 30 June of the relevant years. Assets and liabilities of Tumut Shire Council and Tumbarumba Shire Council have been recognised by the Snowy Valleys Council at the carrying amount recorded by the former council.
Snowy Valleys Council believes the carrying amounts are not materially different from their fair values as at the date of transfer 12 May 2016, with the exception of water and sewer infrastructure. An independent revaluation of water and sewer infrastructure was performed as at 30 June 2017 with adjustments made based on unit rates, provided by the valuer applicable for transfer date, to recognise these assets at fair value as at the date of transfer. The fair value of the net assets has been shown as a gain on local government amalgamation in the income statement and further information is provided in Note 28. These general purpose financial statements have been prepared in accordance with Australian Accounting Standards and Australian Accounting Interpretations, the Local Government Act 1993 (NSW) and Regulations, and the Local Government Code of Accounting Practice and Financial
Reporting. Council is a not for-profit entity for the purpose of preparing these financial statements. (i) New and amended standards adopted by
Council There have been no new accounting standards adopted in this period’s financial statements which have had any material impact on reported financial position, performance or cash flows. (ii) Early adoption of standards Council has not elected to apply any pronouncements before their operative date in the annual reporting period beginning 13 May 2016. (iii) Historical cost convention These financial statements have been prepared under the historical cost convention, as modified by the revaluation of certain financial assets and liabilities and certain classes of property, plant and equipment and investment property. (iv) Significant accounting estimates and
judgements The preparation of financial statements requires the use of certain critical accounting estimates. It also requires management to exercise its judgement in the process of applying the Council's accounting policies. Estimates and judgements are continually evaluated and are based on historical experience and other factors, including expectations of future events that may have a financial impact on the Council and that are believed to be reasonable under the circumstances. Critical accounting estimates and assumptions Council makes estimates and assumptions concerning the future. The resulting accounting estimates will, by definition, seldom equal the related actual results. The estimates and assumptions that have a significant risk of causing a material adjustment to the carrying amounts of assets and liabilities within the next financial period include: (i) Estimated fair values of employee leave entitlements,
Financial Statements 2017_
Snowy Valleys Council
Notes to the Financial Statements for the period 13 May 2016 to 30 June 2017
Note 1. Summary of significant accounting policies (continued)
page 11
(ii) Estimated fair values of infrastructure, property, plant and equipment,
(iii) Estimated tip remediation provisions. Significant judgements in applying the Council's accounting policies (i) Impairment of Receivables Council has made a significant judgement about the impairment of a number of its receivables in Note 7. (b) Revenue recognition Council recognises revenue when the amount of revenue can be reliably measured, it is probable that future economic benefits will flow to the Council and specific criteria have been met for each of the Council’s activities as described below. Council bases its estimates on historical results, taking into consideration the type of customer, the type of transaction and the specifics of each arrangement. Revenue is measured at the fair value of the consideration received or receivable. Revenue is measured on major income categories as follows: (i) Rates, annual charges, grants and
contributions Rates, annual charges, grants and contributions (including developer contributions) are recognised as revenue when the Council obtains control over the assets comprising these receipts. Developer contributions may only be expended for the purposes for which the contributions were required, but the Council may apply contributions according to the priorities established in work schedules. Control over assets acquired from rates and annual charges is obtained at the commencement of the rating year as it is an enforceable debt linked to the rateable property or, where earlier, upon receipt of the rates. Control over granted assets/contributed assets is normally obtained upon their receipt (or acquittal) or upon earlier notification that a grant has been secured, and is valued at their fair value at the date of transfer.
Where grants or contributions recognised as revenues during the financial reporting period were obtained on condition that they be expended in a particular manner or used over a particular period and those conditions were un-discharged at reporting date, the unused grant or contribution is disclosed in Note 3(g). The note also discloses the amount of unused grant or contribution from prior years that was expended on Council’s operations during the current period. A liability is recognised in respect of revenue that is reciprocal in nature to the extent that the requisite service has not been provided at reporting date. (ii) User charges and fees User charges and fees (including parking fees and fines) are recognised as revenue when the service has been provided or when the penalty has been applied, whichever first occurs. (iii) Sale of infrastructure, property, plant and
equipment The profit or loss on sale of an asset is determined when control of the asset has irrevocably passed to the buyer. (iv) Interest Interest income is recognised using the effective interest rate at the date that interest is earned. (v) Rent Rental income is accounted for on a straight-line basis over the lease term. (vi) Dividend income Revenue is recognised when the Council’s right to receive the payment is established, which is generally when shareholders approve the dividend. (vii) Other income Other income is recorded when the payment is due, the value of the payment is notified, or the payment is received, whichever occurs first.

Financial Statements 2017_
Snowy Valleys Council
Notes to the Financial Statements for the period 13 May 2016 to 30 June 2017
Note 1. Summary of significant accounting policies (continued)
page 12
(c) Principles of consolidation (i) The Consolidated Fund In accordance with the provisions of Section 409(1) of the Local Government Act 1993 (NSW), all money and property received by Council is held in the Council’s Consolidated Fund unless it is required to be held in the Council’s Trust Fund. Cash and other assets of the following entities have been included as part of the Consolidated Fund: General purpose operations Water service Sewerage service Domestic Waste Management Snowy Works & Services Due to their immaterial value and nature, the following Committees, Entities and Operations have been excluded from consolidation: Batlow Development League Talbingo Progress Association Festival of the Falling Leaf Glenroy Recreation Reserve Khancoban Community Hall Khancoban Op Shop Tumbarumba Voices Tumbarumba Men’s Shed Tumbarumba Friends of the Library Pioneer Women Hut RSL Youth Council Tooma Recreation Reserve Tumbarumba Historical Society Rosewood Community Shed Khancoban Artisans Gallery The total income and expenditure from continuing operations and net assets held by these excluded committees and operations is as follows: Total income from continuing operations $272,943 Total expenses from continuing operations $240,022 Total net assets held (i.e. equity) $309,600
(ii) The Trust Fund In accordance with the provisions of Section 411 of the Local Government Act 1993 (NSW) (as amended), a separate and distinct Trust Fund is maintained to account for all money and property received by the Council in trust which must be applied only for the purposes of, or in accordance with the trusts relating to those monies. Trust monies and property subject to Council’s control have been included in these reports. Trust monies and property held by Council but not subject to the control of Council have been excluded from these reports. A separate statement of monies held in the Trust Fund is available for inspection at the Council office by any person free of charge. (iii) County Councils Council is not a member of any county councils. (iv) Interests in other entities Subsidiaries Subsidiaries are all entities (including structured entities) over which the Council has control. Control is established when the Council is exposed to, or has rights to variable returns from its involvement with the entity and has the ability to affect those returns through its power to direct the relevant activities of the entity. These consolidated financial statements include the financial position and performance of controlled entities from the date on which control is obtained until the date that control is lost. Intragroup assets, liabilities, equity, income, expenses and cash flows relating to transactions between entities in the consolidated entity have been eliminated in full for the purpose of these financial statements. Appropriate adjustments have been made to a controlled entity’s financial position, performance and cash flows where the accounting policies used by that entity were different from those adopted by the consolidated entity. All controlled entities have a June financial year end. A list of controlled entities is contained in Note 19 to the financial statements.
Financial Statements 2017_
Snowy Valleys Council
Notes to the Financial Statements for the period 13 May 2016 to 30 June 2017
Note 1. Summary of significant accounting policies (continued)
page 13
Joint arrangements Council has no interest in any joint arrangements. Joint operations In relation to its joint operations, where the venturer has the rights to the individual assets and obligations arising from the arrangement, the Council has recognised: its assets, including its share of any assets held
jointly its liabilities, including its share of any liabilities
incurred jointly its share of the revenue from the sale of the
output by the joint operation its expenses, including its share of any expenses
incurred jointly. These figures are incorporated into the relevant line item in the primary statements. Joint ventures/associates Interests in joint ventures/associates are accounted for using the equity method in accordance with AASB128 Associates and Joint Ventures. Under this method, the investment is initially recognised as a cost and the carrying amount is increased or decreased to recognise the Council’s share of the profit or loss and other comprehensive income of the investee after the date of acquisition. If the Council’s share of losses of a joint venture equals or exceeds its interest in the joint venture, the Council discontinues recognising its share of further losses. The Council’s share in the joint venture’s gains or losses arising from transactions between itself and its joint venture are eliminated. Adjustments are made to the joint venture’s accounting policies where they are different from those of the Council for the purpose of the consolidated financial statements. (d) Leases Leases of property, plant and equipment where Council, as lessee, has substantially all the risks and
rewards of ownership are classified as finance leases. Finance leases are capitalised at the lease’s inception at the fair value of the leased property or, if lower, the present value of the minimum lease payments. The corresponding rental obligations, net of finance charges, are included in other short-term and long-term payables. Each lease payment is allocated between the liability and finance cost. The finance cost is charged to the income statement over the lease period so as to produce a constant periodic rate of interest on the remaining balance of the liability for each period. The property, plant and equipment acquired under finance leases is depreciated over the asset's useful life or over the shorter of the asset’s useful life and the lease term if there is no reasonable certainty that Council will obtain ownership at the end of the lease term. Leases in which a significant portion of the risks and rewards of ownership are not transferred to Council as lessee are classified as operating leases. Payments made under operating leases (net of any incentives received from the lessor) are charged to the income statement on a straight-line basis over the period of the lease. Lease income from operating leases where Council is a lessor is recognised as income on a straight-line basis over the lease term. (e) Impairment of assets Intangible assets that have an indefinite useful life or are not yet available for use are not subject to amortisation and are tested annually for impairment, or more frequently if events or changes in circumstances indicate that they might be impaired. Other assets are tested for impairment whenever events or changes in circumstances indicate that the carrying amount may not be recoverable. An impairment loss is recognised for the amount by which the asset’s carrying amount exceeds its recoverable amount. The recoverable amount is the higher of an asset’s fair value less costs to sell and value in use. For the purposes of assessing impairment, assets are grouped at the lowest levels for which there are
Financial Statements 2017_
Snowy Valleys Council
Notes to the Financial Statements for the period 13 May 2016 to 30 June 2017
Note 1. Summary of significant accounting policies (continued)
page 14
separately identifiable cash inflows that are largely independent of the cash inflows from other assets or groups of assets (cash-generating units). Non-financial assets that suffered an impairment are reviewed for possible reversal of the impairment at each reporting date. (f) Cash and cash equivalents For Statement of Cash Flow presentation purposes, cash and cash equivalents includes cash on hand; deposits held at call with financial institutions; other short-term, highly liquid investments with original maturities of three months or less that are readily convertible to known amounts of cash and which are subject to an insignificant risk of changes in value; and bank overdrafts. Bank overdrafts are shown within borrowings in current liabilities on the Statement of Financial Position. (g) Inventories (i) Raw materials and stores, work in progress
and finished goods Raw materials and stores, work in progress and finished goods are stated at the lower of cost and net realisable value. Cost comprises direct materials, direct labour, and an appropriate proportion of variable and fixed overhead expenditure, the latter being allocated on the basis of normal operating capacity. Costs are assigned to individual items of inventory on basis of weighted average costs. Costs of purchased inventory are determined after deducting rebates and discounts. Net realisable value is the estimated selling price in the ordinary course of business less the estimated costs of completion and the estimated costs necessary to make the sale. (ii) Inventory held for distribution Inventory held for distribution is held at cost, adjusted where applicable for any loss of service potential.
(iii) Land held for resale/capitalisation of borrowing costs
Land held for resale is stated at the lower of cost and net realisable value. Cost is assigned by specific identification and includes the cost of acquisition, and development and borrowing costs during development. When development is completed borrowing costs and other holding charges are expensed as incurred. Borrowing costs included in the cost of land held for resale are those costs that would have been avoided if the expenditure on the acquisition and development of the land had not been made. Borrowing costs incurred while active development is interrupted for extended periods are recognised as expenses. (h) Non-current assets (or disposal groups)
held for sale and discontinued operations
Non-current assets (or disposal groups) are classified as held for sale if their carrying amount will be recovered principally through a sale transaction rather than through continuing use. They are measured at the lower of their carrying amount and fair value less costs to sell, except for assets such as deferred tax assets; assets arising from employee benefits; financial assets; and investment properties that are carried at fair value and contractual rights under insurance contracts, which are specifically exempt from this requirement. An impairment loss is recognised for any initial or subsequent write-down of the asset (or disposal group) to fair value less costs to sell. A gain is recognised for any subsequent increases in fair value less costs to sell of an asset (or disposal group), but not in excess of any cumulative impairment loss previously recognised. A gain or loss not previously recognised by the date of the sale of the non-current asset (or disposal group) is recognised at the date of de-recognition. Non-current assets (including those that are part of a disposal group) are not depreciated or amortised while they are classified as held for sale. Interest and other expenses attributable to the liabilities of a

Financial Statements 2017_
Snowy Valleys Council
Notes to the Financial Statements for the period 13 May 2016 to 30 June 2017
Note 1. Summary of significant accounting policies (continued)
page 15
disposal group classified as held for sale continue to be recognised. (i) Investments and other financial assets Classification Council classifies its financial assets in the following categories: financial assets at fair value through profit or loss; loans and receivables; held-to-maturity investments; and available-for-sale financial assets. The classification depends on the purpose for which the investments were acquired. Management determines the classification of its investments at initial recognition and, in the case of assets classified as held-to-maturity, re-evaluates this designation at each reporting date. (i) Financial assets at fair value through profit or
loss Financial assets at fair value through profit or loss are financial assets held for trading. A financial asset is classified in this category if acquired principally for the purpose of selling in the short-term. Assets in this category are classified as current assets. (ii) Loans and receivables Loans and receivables are non-derivative financial assets with fixed or determinable payments that are not quoted in an active market. They are included in current assets, except for those with maturities greater than 12 months after the reporting date which that are classified as non-current assets. Loans and receivables are included in other receivables (note 8) and receivables (note 7) in the Statement of Financial Position. Receivables are recognised initially at fair value and subsequently measured at amortised cost using the effective interest method, less provision for impairment. Receivables are generally due for settlement within 30 days. Cash flows relating to short-term receivables are not discounted if the effect of discounting is immaterial.
(iii) Held-to-maturity investments Held-to-maturity investments are non-derivative financial assets with fixed or determinable payments and fixed maturities that Council’s management has the positive intention and ability to hold to maturity. If Council were to sell other than an insignificant amount of held-to-maturity financial assets, the whole category would be tainted and reclassified as available-for-sale. Held-to-maturity financial assets are included in non-current assets, except for those with maturities less than 12 months from the reporting date, that are classified as current assets. (iv) Available-for-sale financial assets Available-for-sale financial assets are non-derivatives that are either designated in this category or not classified in any of the other categories. They are included in non-current assets unless management intends to dispose of the investment within 12 months of the reporting date. Investments are designated as available-for-sale if they do not have fixed maturities and fixed or determinable payments and management intends to hold them for the medium to long term. Recognition and de-recognition Regular purchases and sales of financial assets are recognised on trade-date: the date on which Council commits to purchase or sell the asset. Investments are initially recognised at fair value plus transaction costs for all financial assets not carried at fair value through profit or loss. Financial assets carried at fair value through profit or loss are initially recognised at fair value and transaction costs are expensed in the income statement. Financial assets are derecognised when the rights to receive cash flows from the financial assets have expired or have been transferred and Council has transferred substantially all the risks and rewards of ownership. When securities classified as available-for-sale are sold, the accumulated fair value adjustments recognised in equity are included in the income statement as gains and losses from investment securities.

Financial Statements 2017_
Snowy Valleys Council
Notes to the Financial Statements for the period 13 May 2016 to 30 June 2017
Note 1. Summary of significant accounting policies (continued)
page 16
Subsequent measurement Loans and receivables and held-to-maturity investments are carried at amortised cost using the effective interest method. Changes in the fair value of other monetary and non-monetary securities classified as available-for-sale are recognised in equity. Impairment Council assesses at the end of each reporting period whether there is objective evidence that a financial asset or group of financial assets is impaired. A financial asset or a group of financial assets is impaired and impairment losses are incurred only if there is objective evidence of impairment as a result of one or more events that occurred after the initial recognition of the asset (a ‘loss event’) and that loss event (or events) has an impact on the estimated future cash flows of the financial asset or group of financial assets that can be reliably estimated. In the case of equity investments classified as available-for-sale, a significant or prolonged decline in the fair value of the security below its cost is considered an indicator that the assets are impaired. (i) Assets carried at amortised cost For loans and receivables the amount of the loss is measured as the difference between the asset’s carrying amount and the present value of estimated future cash flows (excluding future credit losses that have not been incurred) discounted at the financial asset’s original effective interest rate. The carrying amount of the asset is reduced and the amount of the loss is recognised in profit or loss. If a loan or held-to-maturity investment has a variable interest rate, the discount rate for measuring any impairment loss is the current effective interest rate determined under the contract. As a practical expedient, the Council may measure impairment on the basis of an instrument’s fair value using an observable market price. Collectability of receivables is reviewed on an on-going basis. Debts that are known to be uncollectible are written off by reducing the carrying amount directly. An allowance account (provision for impairment of receivables) is used when there is
objective evidence that Council will not be able to collect all amounts due according to the original terms of the receivables. Significant financial difficulties of the debtor, probability that the debtor will enter bankruptcy or financial reorganisation, and default or delinquency in payments (more than 30 days overdue) are considered indicators that the receivable is impaired. The amount of the impairment allowance is the difference between the asset’s carrying amount and the present value of estimated future cash flows, discounted at the original effective interest rate. The amount of the impairment loss is recognised in the income statement within other expenses. When a receivable for which an impairment allowance had been recognised becomes uncollectible in a subsequent period it is written off against the allowance account. Subsequent recoveries of amounts previously written off are credited against other expenses in the income statement. Investment Policy Council has an approved investment policy complying with Section 625 of the Local Government Act 1993 (NSW) and Clause 212 of the Local Government (General) Regulation 2005 (NSW). Investments are placed and managed in accordance with that policy and having particular regard to authorised investments prescribed under the Ministerial Local Government Investment Order. Council maintains an investment policy that complies with the Act and ensures that it, or its representatives, exercise the care, diligence and skill that a prudent person would exercise in investing Council funds. Council amended its policy following revisions to the Ministerial Local Government Investment Order (the Order) arising from the Cole Inquiry recommendations. Certain investments the Council holds are no longer prescribed; however, they have been retained under grandfathering provisions of the Order. These will be disposed of when most financially advantageous to Council.
Financial Statements 2017_
Snowy Valleys Council
Notes to the Financial Statements for the period 13 May 2016 to 30 June 2017
Note 1. Summary of significant accounting policies (continued)
page 17
(j) Fair value estimation – financial instruments
The fair value of financial assets and financial liabilities must be estimated for recognition and measurement or for disclosure purposes. The fair value of financial instruments traded in active markets is based on quoted market prices at the reporting date. The fair value of financial instruments that are not traded in an active market is determined using valuation techniques. Council uses a variety of methods and makes assumptions that are based on market conditions existing at each reporting date. Other techniques, such as estimated discounted cash flows, are used to determine fair value for the remaining financial instruments. The nominal value less estimated credit adjustments of trade receivables and payables are assumed to approximate their fair values. The fair value of financial liabilities for disclosure purposes is estimated by discounting the future contractual cash flows at the current market interest rate that is available to the Council for similar financial instruments. (k) Infrastructure, property, plant and
equipment (IPPE) Council’s assets were transferred from the former councils at fair value (refer to Note 29). Council revalued its Water and Sewer Infrastructure assets in 2017. Assets will be progressively revalued to fair value in accordance with a staged implementation advised by the Office of Local Government. At reporting date, the following classes of IPPE were stated at their fair value: Externally valued: Operational land Community land
Internally valued: Buildings – specialised/non-specialised Other structures
Roads assets including roads, bridges and footpaths
Bulk earthworks
Stormwater drainage Water and sewerage networks
Swimming pools Other open space/recreational assets
Other infrastructure
As approximated by depreciated historical cost: Plant and equipment Land improvements
Other structures
Other assets
Non-specialised assets with short useful lives are measured at depreciated historical cost as an approximation of fair value. Council has assessed that any difference between fair value and depreciated historical cost is unlikely to be material. Water and sewerage network assets are indexed annually between full revaluations in accordance with the latest indices provided by DPI Water. For all other asset classes, Council assesses at each reporting date whether there is any indication that a revalued asset’s carrying amount may differ materially from that which would be determined if the asset were revalued at the reporting date. If any such indication exists, Council determines the asset’s fair value and revalue the asset to that amount. Full revaluations are undertaken for all assets on a five-year cycle. Increases in the carrying amounts arising on revaluation are credited to the asset revaluation reserve. To the extent that the increase reverses a decrease previously recognising profit or loss relating to that asset class, the increase is first recognised as profit or loss. Decreases that reverse previous increases of assets in the same class are first charged against revaluation reserves directly in equity to the extent of the remaining reserve attributable to the class; all other decreases are charged to the Income Statement. Subsequent costs are included in the asset’s carrying amount or recognised as a separate asset, as appropriate, only when it is probable that future economic benefits associated with the item will flow to Council and the cost of the item can be measured reliably. All other repairs and maintenance are

Financial Statements 2017_
Snowy Valleys Council
Notes to the Financial Statements for the period 13 May 2016 to 30 June 2017
Note 1. Summary of significant accounting policies (continued)
page 18
charged to the income statement during the financial period in which they are incurred. Depreciation Land is not depreciated. Depreciation on other assets is calculated using the straight line method to allocate their cost, net of their residual values, over their estimated useful lives as follows: Plant and equipment - Office equipment 5 to 10 years - Office furniture 10 to 20 years - Computer equipment 4 years - Vehicles 5 to 8 years - Heavy plant/road making equipment 5 to 8 years - Other plant and equipment 5 to 15 years Other equipment - Playground equipment 5 to 15 years - Benches, seats etc. 10 to 20 years Buildings - Buildings: masonry 50 to 100 years - Buildings: other 20 to 40 years Water and sewer assets - Dams and reservoirs 40 to 100 years - Bores 20 to 40 years - Reticulation pipes: PVC 70-80 years - Reticulation pipes: other 45 to 75 years - Pumps and telemetry 10 to 25 years Stormwater assets - Drains 50 to 80 years - Culverts 50 to 80 years - Flood control structures 80 to 100 years Transportation assets - Sealed roads: surface 2 to 60 years - Sealed roads: structure 100 years - Unsealed roads 7 to 30 years - Bridge: concrete 100 years - Bridge: other 40 to 80 years - Road pavements 60 years - Kerb, gutter and footpaths 40 years Other infrastructure assets - Bulk earthworks Infinite The assets’ residual values and useful lives are reviewed, and adjusted if appropriate, at each reporting date.
Gains and losses on disposals are determined by comparing proceeds with carrying amount. These are included in the income statement. (l) Payables These amounts represent liabilities for goods and services provided to the Council prior to the end of financial reporting period that are unpaid. The amounts are unsecured and are usually paid within 30 days of recognition. (m) Borrowings Borrowings are initially recognised at fair value, net of transaction costs incurred. Borrowings are subsequently measured at amortised cost. Any difference between the proceeds (net of transaction costs) and the redemption amount is recognised in the income statement over the period of the borrowings using the effective interest method. Fees paid on the establishment of loan facilities are recognised as transaction costs of the loan to the extent that it is probable that some or all of the facility will be drawn down. In this case, the fee is deferred until the draw down occurs. To the extent there is no evidence that it is probable that some or all of the facility will be drawn down, the fee is capitalised as a prepayment for liquidity services and amortised over the period of the facility to which it relates. Borrowings are removed from the Statement of Financial Position when the obligation specified in the contract is discharged, cancelled or expired. The difference between the carrying amount of a financial liability that has been extinguished or transferred to another party and the consideration paid, including any non-cash assets transferred or liabilities assumed, is recognised in other income or finance cost. Borrowings are classified as current liabilities unless Council has an unconditional right to defer settlement of the liability for at least 12 months after the reporting date.

Financial Statements 2017_
Snowy Valleys Council
Notes to the Financial Statements for the period 13 May 2016 to 30 June 2017
Note 1. Summary of significant accounting policies (continued)
page 19
(n) Borrowing costs Borrowing costs incurred for the construction of any qualifying asset are capitalised during the period of time that is required to complete and prepare the asset for its intended use or sale. Other borrowing costs are expensed. (o) Provisions Provisions are recognised when Council has a present legal or constructive obligation as a result of past events, it is probable that an outflow of resources will be required to settle the obligation, and the amount has been reliably estimated. Where there are a number of similar obligations, the likelihood that an outflow will be required in settlement is determined by considering the class of obligations as a whole. A provision is recognised even if the likelihood of an outflow with respect to any one item included in the same class of obligations may be small. Provisions are measured at the present value of management’s best estimate of the expenditure required to settle the present obligation at the reporting date. The discount rate used to determine the present value reflects current market assessments of the time value of money and the risks specific to the liability. The increase in the provision due to the passage of time is recognised as interest expense. (p) Employee benefits (i) Short-term obligations Liabilities for wages and salaries, including non-monetary benefits, annual leave and accumulating sick leave expected to be wholly settled within 12 months after the end of the period in which the employees render the related service are recognised in respect of employees' services up to the end of the reporting period and are measured at the amounts expected to be paid when the liabilities are settled. The liability for annual leave and accumulating sick leave is recognised in the provision for employee
benefits. All other short-term employee benefit obligations are presented as payables. (ii) Other long-term employee benefit obligations The liability for long service leave and annual leave that is not expected to be wholly settled within 12 months after the end of the period in which the employees render the related service is recognised in the provision for employee benefits and measured as the present value of expected future payments to be made in respect of services provided by employees up to the end of the reporting period using the projected unit credit method. Consideration is given to expected future wage and salary levels, experience of employee departures, and periods of service. Expected future payments are discounted using market yields at the end of the reporting period on national government bonds with terms to maturity and currency that match, as closely as possible, the estimated future cash outflows. The obligations are presented as current liabilities in the Statement of Financial Position if the Council does not have an unconditional right to defer settlement for at least 12 months after the reporting date, regardless of when the actual settlement is expected to occur. (iii) Retirement benefit obligations All employees of the Council are entitled to benefits on retirement, disability or death. Council contributes to various defined benefit plans and defined contribution plans on behalf of its employees. Defined Benefit Plans A liability or asset in respect of defined benefit superannuation plans would ordinarily be recognised in the Statement of Financial Position, and measured as the present value of the defined benefit obligation at the reporting date plus unrecognised actuarial gains (less unrecognised actuarial losses) less the fair value of the superannuation fund’s assets at that date and any unrecognised past service cost. The present value of the defined benefit obligation is based on expected future payments that arise from membership of the fund to the reporting date, calculated annually by independent actuaries using the projected unit credit method.
Financial Statements 2017_
Snowy Valleys Council
Notes to the Financial Statements for the period 13 May 2016 to 30 June 2017
Note 1. Summary of significant accounting policies (continued)
page 20
Consideration is given to expected future wage and salary levels, experience of employee departures, and periods of service. However, when this information is not reliably available, Council accounts for its obligations to defined benefit plans on the same basis as its obligations to defined contribution plans, i.e. as an expense when it becomes payable. Council is party to an Industry Defined Benefit Plan under the Local Government Superannuation Scheme, named the ‘Local Government Superannuation Scheme – Pool B’. This scheme has been deemed to be a ‘multi-employer fund’ for the purposes of AASB 119. Sufficient information is not available to account for the Scheme as a defined benefit plan (in accordance with AASB 119) because the assets to the scheme are pooled together for all Councils. Council’s share of that deficiency cannot be accurately calculated as the scheme is a mutual arrangement where assets and liabilities are pooled together for all member councils. For this reason, no liability for the deficiency has been recognised in these financial statements. Council has, however, disclosed a contingent liability in Note 18 to reflect the possible obligation that may arise should the scheme require immediate payment to correct the deficiency. Defined Contribution Plans Contributions to defined contribution plans are recognised as an expense as they become payable. Prepaid contributions are recognised as an asset to the extent that a cash refund or a reduction in the future payments is available. (q) Land under roads Land under roads acquired after 1 July 2008 is recognised in accordance with AASB 116 – Property, Plant and Equipment. Land under roads is land under roadways and road reserves including land under footpaths, nature strips and median strips.
Council has elected not to recognise land under roads acquired before 1 July 2008 in accordance with AASB 1051 Land Under Roads. Land under roads acquired after 1 July 2008 is recognised in accordance with AASB 116 Property, Plant and Equipment. (r) Intangible assets IT development and software Costs incurred in developing products or systems and costs incurred in acquiring software and licenses that will contribute to future period financial benefits through revenue generation and/or cost reduction are capitalised to software and systems. Costs capitalised include external direct costs of materials and service, direct payroll, and payroll related costs of employees’ time spent on the project. Amortisation is calculated on a straight line basis over periods generally ranging from three to five years. IT development costs include only those costs directly attributable to the development phase and are only recognised following completion of technical feasibility, and where Council has an intention and ability to use the asset. (s) Crown reserves Crown Reserves under Council’s care and control are recognised as assets of the Council. While ownership of the reserves remains with the Crown, Council retains operational control of the reserves and is responsible for their maintenance and use in accordance with the specific purposes to which the reserves are dedicated. Improvements on Crown Reserves are also recorded as assets, while maintenance costs incurred by Council and revenues relating to the reserves are recognised within Council’s Income Statement. (t) Rural fire service assets Under section 119 of the Rural Fire Services Act 1997 (NSW), “all fire fighting equipment purchased or constructed wholly or from money to the credit of the Fund is to be vested in the council of the area for or
Financial Statements 2017_
Snowy Valleys Council
Notes to the Financial Statements for the period 13 May 2016 to 30 June 2017
Note 1. Summary of significant accounting policies (continued)
page 21
on behalf of which the fire fighting equipment has been purchased or constructed”. Until such time as discussions on this matter have concluded and the legislation changed, Council will not recognise rural fire service assets including land, buildings, plant and vehicles. (u) Goods and Services Tax (GST) Revenues, expenses and assets are recognised net of the amount of associated GST, unless the GST incurred is not recoverable from the taxation authority. In this case it is recognised as part of the cost of acquisition of the asset or as part of the expense. Receivables and payables are stated inclusive of the amount of GST receivable or payable. The net amount of GST recoverable from, or payable to the taxation authority is included with other receivables or payables in the Statement of Financial Position. Cash flows are presented on a gross basis. The GST components of cash flows arising from investing or financing activities which that are recoverable from, or payable to the taxation authority are presented as operating cash flows. (v) New accounting standards and
interpretations issued not yet effective Certain new accounting standards and interpretations have been published that are not mandatory for the current reporting period and which have not been applied. AASB 9 - Financial Instruments Significant revisions to the classification and measurement of financial assets, reducing the number of categories and simplifying the measurement choices, including the removal of impairment testing of assets measured at fair value. The amortised cost model is available for debt assets meeting both business model and cash flow characteristics tests. All investments in equity instruments using AASB 9 are to be measured at fair value. Apart from Held-to-maturity term deposits, Council already values all other investments at fair
value with the result that there will not be any financial impact for these developments. The revisions also amend measurement rules for financial liabilities that the Council elects to measure at fair value through profit and loss. Changes in fair value attributable to changes in the Council’s own credit risk are presented in other comprehensive income. Council does not have any liabilities that are recorded on this basis and the new requirements will not have any financial impact. Impairment of assets is now based on expected losses in AASB 9 which requires entities to measure: the 12-month expected credit losses (expected
credit losses that result from those default events on the financial instrument that are possible within 12 months after the reporting date) of full lifetime;
expected credit losses (expected credit losses that result from all possible default events over the life of the financial instrument).
A financial impact will only arise if any investments become subject to impairment. Available-for-sale investments will be classified as fair value through other comprehensive income and will no longer be subject to impairment testing. AASB 15 - Revenue from contracts with customers AASB 15 will replace AASB 118 which covers contracts for goods and services and AASB 111 which covers construction contracts. AASB 15 will introduce a 5-step process for revenue recognition with the core principle of the new standard being that entities recognise revenue so as to depict the transfer of goods or services to customers in amounts that reflect the consideration (that is, payment) to which the Council expects to be entitled in exchange for those goods or services. The changes in revenue recognition requirements in AASB 15 may cause changes to accounting policies relating to the timing and amount of revenue recorded in the financial statements, as well as additional disclosures. The effective date of this standard is for annual reporting periods beginning on or after 1 January 2018.
Financial Statements 2017_
Snowy Valleys Council
Notes to the Financial Statements for the period 13 May 2016 to 30 June 2017
Note 1. Summary of significant accounting policies (continued)
page 22
Council is undertaking a detailed assessment of the impact of AASB 15. AASB 16 - Leases AASB 16 Leases replaces AASB 117 Leases and some associated lease-related Interpretations. AASB 16 introduces a single lease accounting model (for lessees) that will require all leases to be accounted for on the balance sheet (i.e. recognition of both a right-of-use asset and a corresponding lease) for all leases with a term of more than 12 months unless the underlying assets are determined to be of ‘low value’. There will also be detailed disclosure requirements for all lessees. The effective date of this standard is for annual reporting periods beginning on or after 1 January 2019. Council is undertaking a detailed assessment of the accounting impacts from AASB 16. However, based on preliminary assessments, impacts from the first time adoption of the standard are likely to not be material. AASB 124 – Related Party Disclosures ASSB 124 will apply to Council for reporting periods beginning on or after 1 July 2016. Council will be required to disclose information about related parties and Council transactions with those related parties. Related parties will more than likely include the Mayor, Councillors and Directors. In addition, the close family members of those people and any organisations that they control or are associated with will be classified as related parties (and fall under the related party reporting requirements).
Financial Statements 2017
page 23
Snowy Valleys Council
Notes to the Financial Statements for the period 13 May 2016 to 30 June 2017
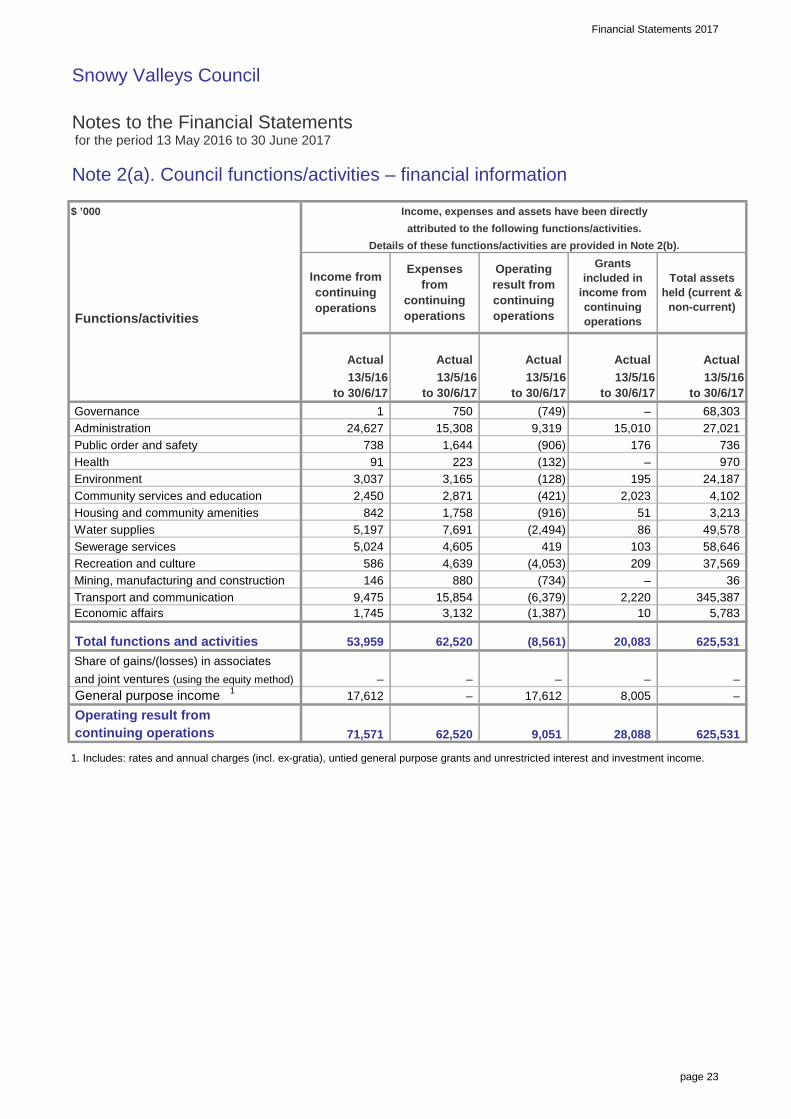
Note 2(a). Council functions/activities – financial information
General purpose income 1
1. Includes: rates and annual charges (incl. ex-gratia), untied general purpose grants and unrestricted interest and investment income.
Functions/activities
Income from continuing operations
Expenses from
continuing operations
Operating result from continuing operations
13/5/16 to 30/6/17
–
62,520
2,220 10
(4,053)
(1,387)
Income, expenses and assets have been directlyattributed to the following functions/activities.
Details of these functions/activities are provided in Note 2(b).Grants
included in income from continuing operations
Total assets held (current &
non-current)
Actual
Share of gains/(losses) in associates
continuing operations
17,612 and joint ventures (using the equity method)
Operating result from
Economic affairs
Total functions and activities
71,571
1,745
53,959
–
625,531
–
5,783
–
625,531
– 8,005
28,088
3,132
–
(8,561)
–
20,083
103 86
–
9,051
17,612
(2,494) (916) (421)
62,520
195 2,023
(128)
36 345,387
37,569 209
27,021
3,213 51 4,102
736 970
68,303
24,187 –
176
419 49,578 58,646
(132) (906)
15,010 –
9,319 (749)
880 (734) (6,379) Transport and communication
Mining, manufacturing and construction 146 9,475
7,691
15,854
1,758
4,639 4,605
842
3,037
Housing and community amenities Water supplies
Recreation and culture Sewerage services
5,197 5,024
586
2,450 Community services and education3,165
223
2,871
Health Environment
1,644 91
Public order and safety
Governance Administration
738
Actual 13/5/16
to 30/6/17
24,627 1
15,308 750
$ ’000
Actual 13/5/16
to 30/6/17 13/5/16
to 30/6/17
Actual Actual 13/5/16
to 30/6/17

Financial Statements 2017
page 24
Snowy Valleys Council
Notes to the Financial Statements for the period 13 May 2016 to 30 June 2017
Note 2(b). Council functions/activities – component descriptions
Details relating to the Council’s functions/activities as reported in Note 2(a) are as follows:
GOVERNANCE
ADMINISTRATION
PUBLIC ORDER AND SAFETY
HEALTH
ENVIRONMENT
COMMUNITY SERVICES AND EDUCATION
HOUSING AND COMMUNITY AMENITIES
WATER SUPPLIESSEWERAGE SERVICES
RECREATION AND CULTURE
MINING, MANUFACTURING AND CONSTRUCTION
TRANSPORT AND COMMUNICATION
ECONOMIC AFFAIRS
Includes noxious plants and insect/vermin control; other environmental protection; solid waste management,including domestic waste; other waste management; other sanitation; and garbage, street cleaning, drainageand stormwater management.
Includes costs relating to Council’s role as a component of democratic government, including elections,members’ fees and expenses, subscriptions to local authority associations, meetings of Council and policy-making committees, public disclosure (e.g. GIPA), and legislative compliance.
Includes corporate support and other support services, engineering works, and any Council policy compliance.
Includes Council’s fire and emergency services levy, fire protection, emergency services, beach control,enforcement of regulations and animal control.
Includes immunisation, food control, health centres etc.
Includes camping areas and caravan parks; tourism and area promotion; industrial development promotion; saleyards and markets; real estate development; commercial nurseries; and other business undertakings.
Includes administration and education; social protection (welfare); migrant, Aboriginal and other communityservices and administration (excluding accommodation – as it is covered under ‘housing and communityamenities’); youth services; aged and disabled persons services; children’s’ services, including family day care;child care; and other family and children services.
Includes public cemeteries; public conveniences; street lighting; town planning; other community amenities,including housing development and accommodation for families and children, aged persons, disabled persons,migrants and Indigenous persons.
Includes public libraries; museums; art galleries; community centres and halls, including public halls andperforming arts venues; sporting grounds and venues; swimming pools; parks; gardens; lakes; and othersporting, recreational and cultural services.
Includes building control, quarries and pits, mineral resources, and abattoirs.
Urban local, urban regional, includes sealed and unsealed roads, bridges, footpaths, parking areas, andaerodromes.
Financial Statements 2017
page 25
Snowy Valleys Council
Notes to the Financial Statements for the period 13 May 2016 to 30 June 2017
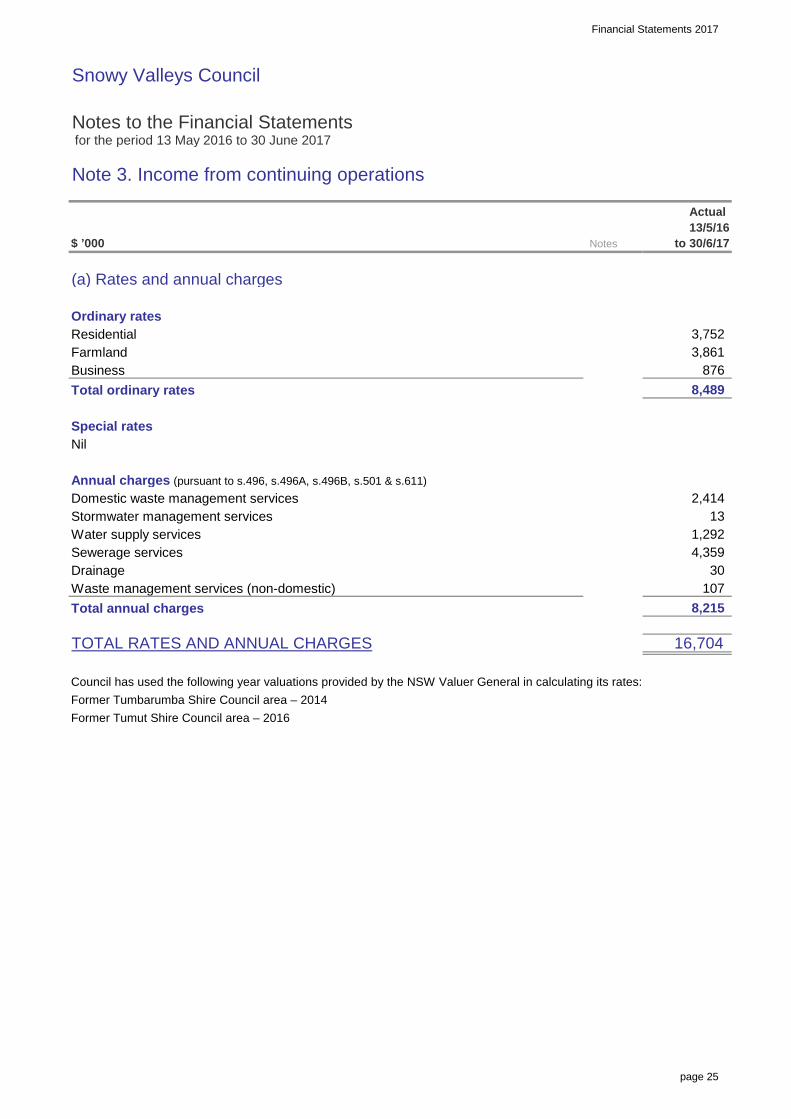
Note 3. Income from continuing operations
$ ’000
(a) Rates and annual charges
Ordinary ratesResidentialFarmlandBusinessTotal ordinary rates
Special ratesNil
Annual charges (pursuant to s.496, s.496A, s.496B, s.501 & s.611)Domestic waste management servicesStormwater management servicesWater supply servicesSewerage servicesDrainageWaste management services (non-domestic)Total annual charges
TOTAL RATES AND ANNUAL CHARGES
Council has used the following year valuations provided by the NSW Valuer General in calculating its rates:Former Tumbarumba Shire Council area – 2014Former Tumut Shire Council area – 2016
13/5/16 to 30/6/17
8,489
Notes
Actual
3,752
876 3,861
30
1,292 4,359
107
2,414 13
8,215
16,704
Financial Statements 2017
page 26
Snowy Valleys Council
Notes to the Financial Statements for the period 13 May 2016 to 30 June 2017
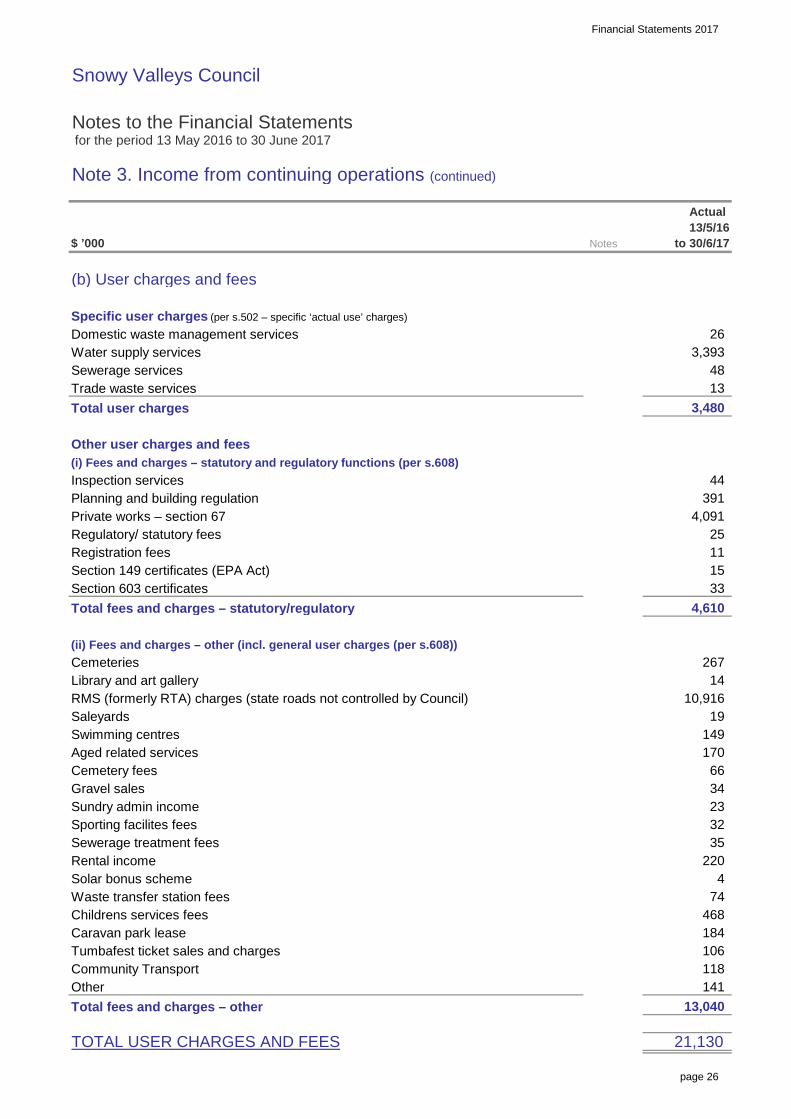
Note 3. Income from continuing operations (continued)
$ ’000
(b) User charges and fees
Specific user charges (per s.502 – specific ‘actual use’ charges)Domestic waste management servicesWater supply servicesSewerage servicesTrade waste servicesTotal user charges
Other user charges and fees(i) Fees and charges – statutory and regulatory functions (per s.608)Inspection servicesPlanning and building regulationPrivate works – section 67Regulatory/ statutory feesRegistration feesSection 149 certificates (EPA Act)Section 603 certificatesTotal fees and charges – statutory/regulatory
(ii) Fees and charges – other (incl. general user charges (per s.608))CemeteriesLibrary and art galleryRMS (formerly RTA) charges (state roads not controlled by Council)SaleyardsSwimming centresAged related servicesCemetery feesGravel salesSundry admin incomeSporting facilites feesSewerage treatment feesRental incomeSolar bonus schemeWaste transfer station feesChildrens services feesCaravan park leaseTumbafest ticket sales and chargesCommunity TransportOtherTotal fees and charges – other
TOTAL USER CHARGES AND FEES
468 184
14 267
15
48
44
3,480
13/5/16 to 30/6/17
26
13
Actual
3,393
4,610
391
25 4,091
11
33
35 220
4 74
10,916 19
23
170 149
21,130
Notes
141 13,040
32
106 118
66 34
Financial Statements 2017
page 27
Snowy Valleys Council
Notes to the Financial Statements for the period 13 May 2016 to 30 June 2017
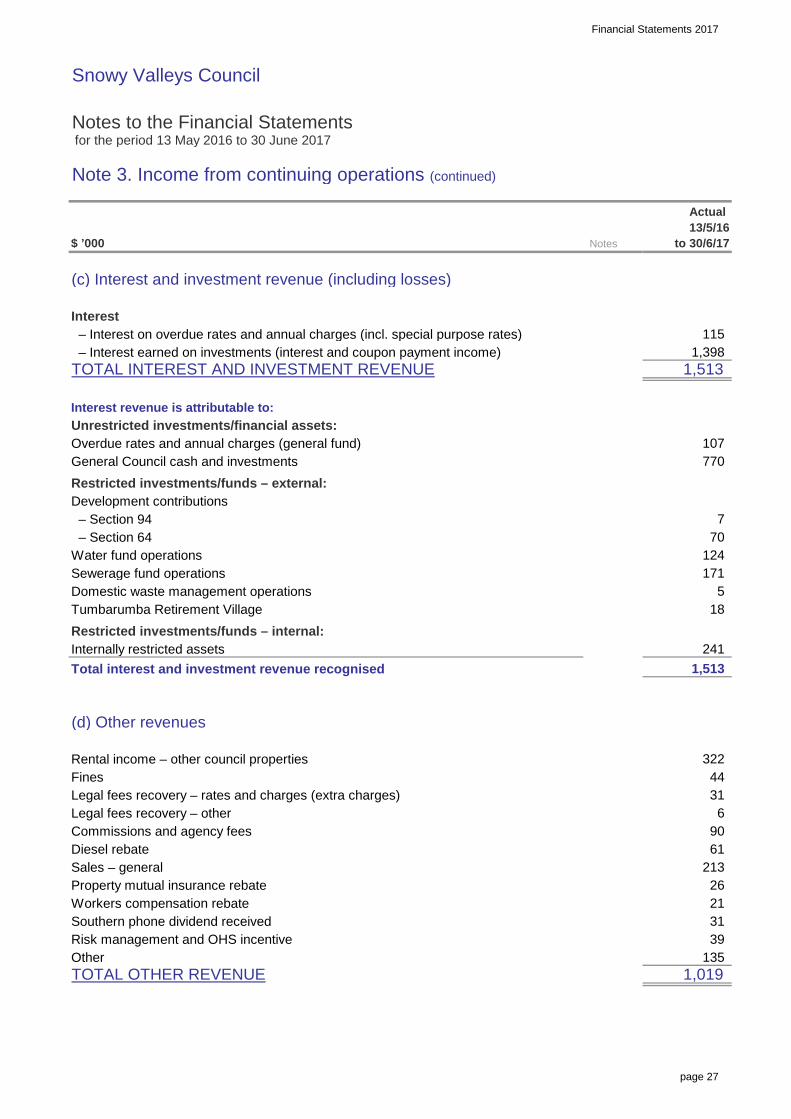
Note 3. Income from continuing operations (continued)
$ ’000
(c) Interest and investment revenue (including losses)
Interest – Interest on overdue rates and annual charges (incl. special purpose rates) – Interest earned on investments (interest and coupon payment income)TOTAL INTEREST AND INVESTMENT REVENUE
Interest revenue is attributable to:Unrestricted investments/financial assets:Overdue rates and annual charges (general fund)General Council cash and investmentsRestricted investments/funds – external:Development contributions – Section 94 – Section 64Water fund operationsSewerage fund operationsDomestic waste management operationsTumbarumba Retirement VillageRestricted investments/funds – internal:Internally restricted assetsTotal interest and investment revenue recognised
(d) Other revenues
Rental income – other council propertiesFinesLegal fees recovery – rates and charges (extra charges)Legal fees recovery – otherCommissions and agency feesDiesel rebateSales – generalProperty mutual insurance rebateWorkers compensation rebateSouthern phone dividend receivedRisk management and OHS incentiveOtherTOTAL OTHER REVENUE
Actual
1,398
44
135
13/5/16 to 30/6/17
31 21 26
39
1,019
1,513
115
107 770
Notes
1,513
7 70
241
124
18
171 5
61 90 6
322
213
31
Financial Statements 2017
page 28
Snowy Valleys Council
Notes to the Financial Statements for the period 13 May 2016 to 30 June 2017
Note 3. Income from continuing operations (continued)
$ ’000
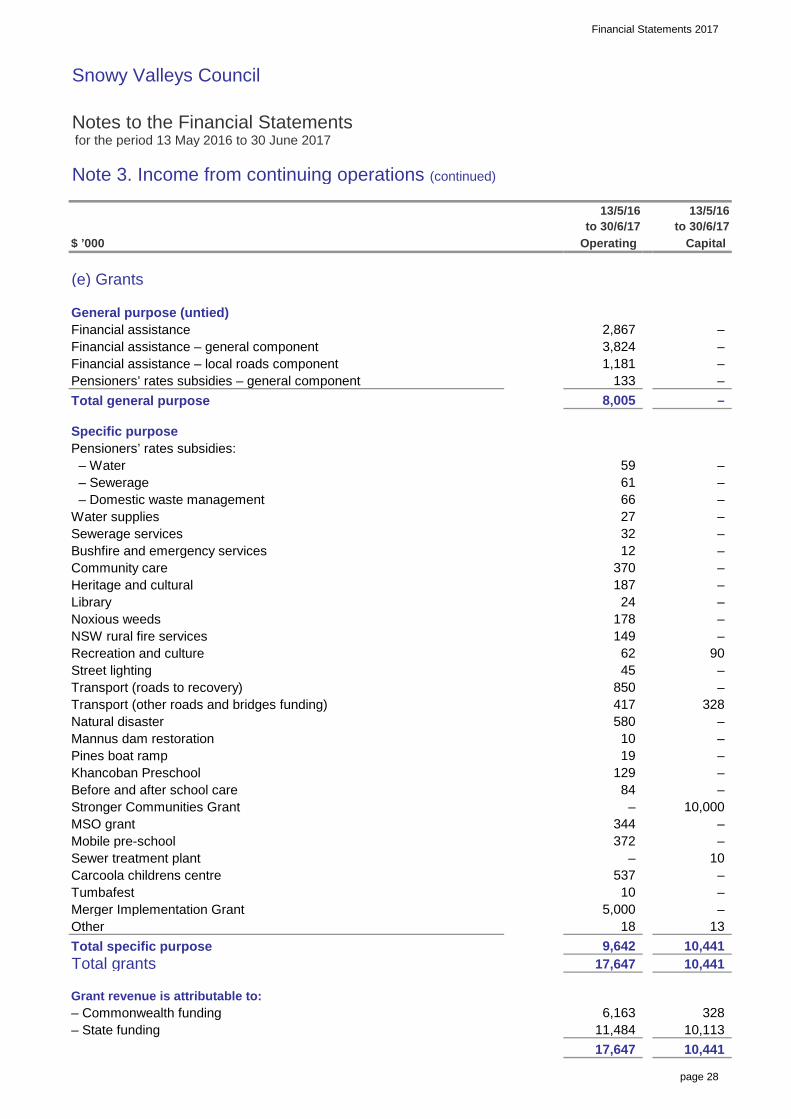
(e) Grants
General purpose (untied)Financial assistanceFinancial assistance – general componentFinancial assistance – local roads componentPensioners’ rates subsidies – general componentTotal general purpose
Specific purposePensioners’ rates subsidies: – Water – Sewerage – Domestic waste managementWater suppliesSewerage servicesBushfire and emergency servicesCommunity careHeritage and culturalLibraryNoxious weedsNSW rural fire servicesRecreation and cultureStreet lightingTransport (roads to recovery)Transport (other roads and bridges funding)Natural disasterMannus dam restorationPines boat rampKhancoban PreschoolBefore and after school careStronger Communities GrantMSO grantMobile pre-schoolSewer treatment plantCarcoola childrens centreTumbafestMerger Implementation GrantOtherTotal specific purposeTotal grants
Grant revenue is attributable to:– Commonwealth funding– State funding
– –
328 –
–
10,441
13
–
417
149
–
10
328 10,113
90
–
10,441
–
–
10,441
–
–
Capital
8,005
–
10 –
–
13/5/16 to 30/6/17 Operating
13/5/16 to 30/6/17
– 133
–
–
–
62
–
5,000 –
–
6,163
– 537
– 66 27
61
3,824
580
178
2,867
1,181
59
370
–
–
11,484
18
129
12
17,647
17,647
9,642
45
187 24
850
–
32
19
–
– 344 372
10
84 – – 10,000
Financial Statements 2017
page 29
Snowy Valleys Council
Notes to the Financial Statements for the period 13 May 2016 to 30 June 2017
Note 3. Income from continuing operations (continued)
$ ’000
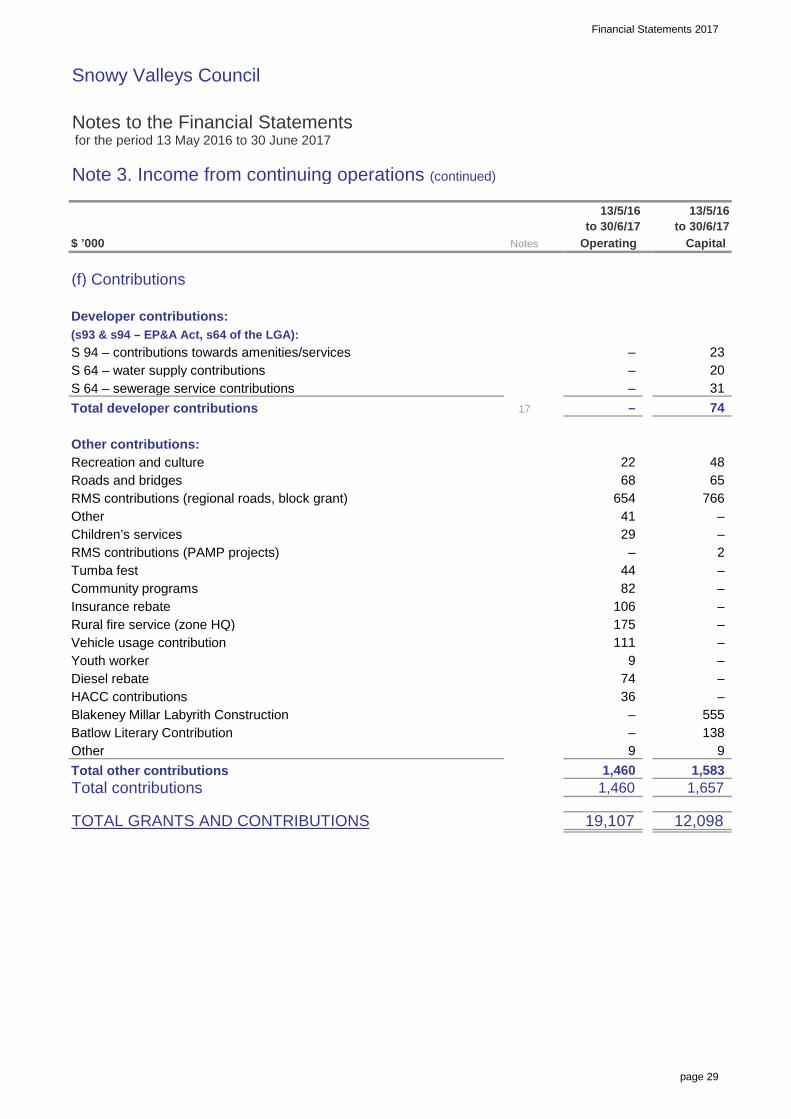
(f) Contributions
Developer contributions:(s93 & s94 – EP&A Act, s64 of the LGA):S 94 – contributions towards amenities/servicesS 64 – water supply contributionsS 64 – sewerage service contributionsTotal developer contributions
Other contributions:Recreation and cultureRoads and bridgesRMS contributions (regional roads, block grant)OtherChildren’s servicesRMS contributions (PAMP projects)Tumba festCommunity programsInsurance rebateRural fire service (zone HQ)Vehicle usage contributionYouth workerDiesel rebateHACC contributionsBlakeney Millar Labyrith ConstructionBatlow Literary Contribution OtherTotal other contributionsTotal contributions
TOTAL GRANTS AND CONTRIBUTIONS
Notes
–
1,583 9
65
138
23
1,460 1,460
19,107
1,657
74
20
13/5/16 to 30/6/17
17
–
13/5/16 to 30/6/17 Operating
12,098
48
–
9
82
555
9 74 – 36 – –
111 –
– 2
–
44 –
175 –
766
31
–
–
106
29 41
22
–
Capital
–
–
68 654
–
Financial Statements 2017
page 30
Snowy Valleys Council
Notes to the Financial Statements for the period 13 May 2016 to 30 June 2017
Note 3. Income from continuing operations (continued)
$ ’000
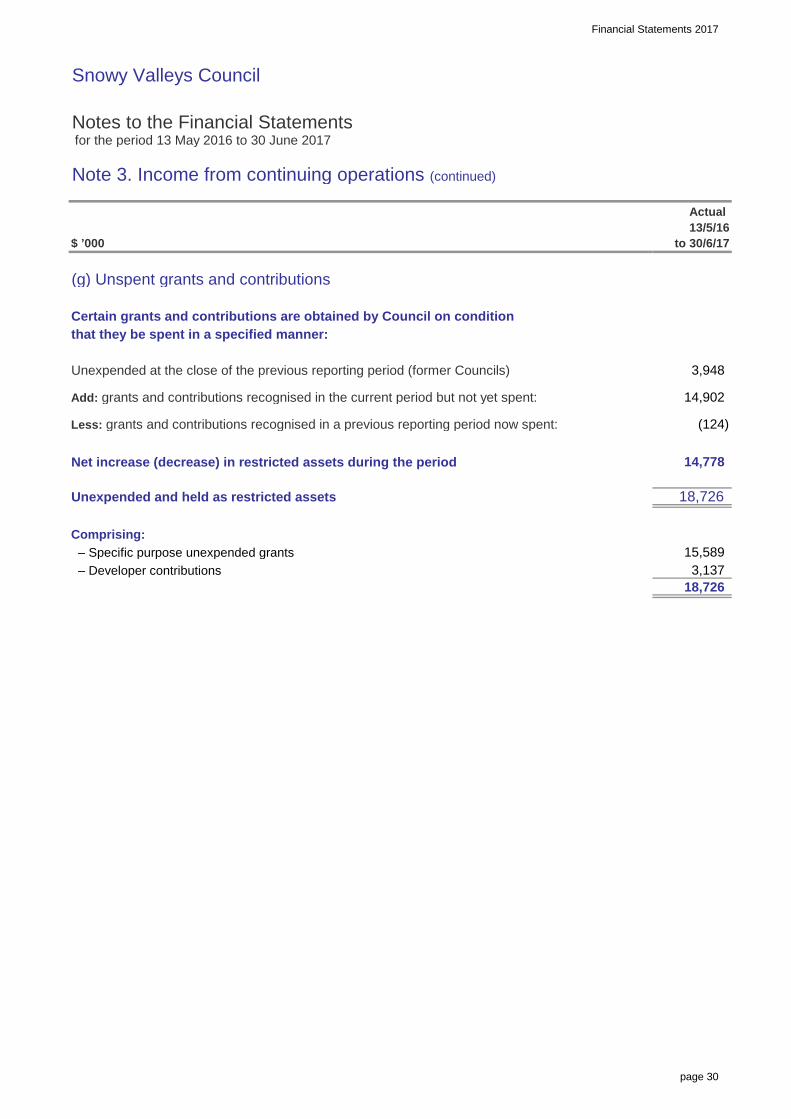
(g) Unspent grants and contributions
Certain grants and contributions are obtained by Council on conditionthat they be spent in a specified manner:
Unexpended at the close of the previous reporting period (former Councils)
Add: grants and contributions recognised in the current period but not yet spent:
Less: grants and contributions recognised in a previous reporting period now spent:
Net increase (decrease) in restricted assets during the period
Unexpended and held as restricted assets
Comprising: – Specific purpose unexpended grants – Developer contributions
18,726
3,137
3,948
14,902
(124)
15,589
13/5/16 to 30/6/17
Actual
18,726
14,778
Financial Statements 2017
page 31
Snowy Valleys Council
Notes to the Financial Statements for the period 13 May 2016 to 30 June 2017
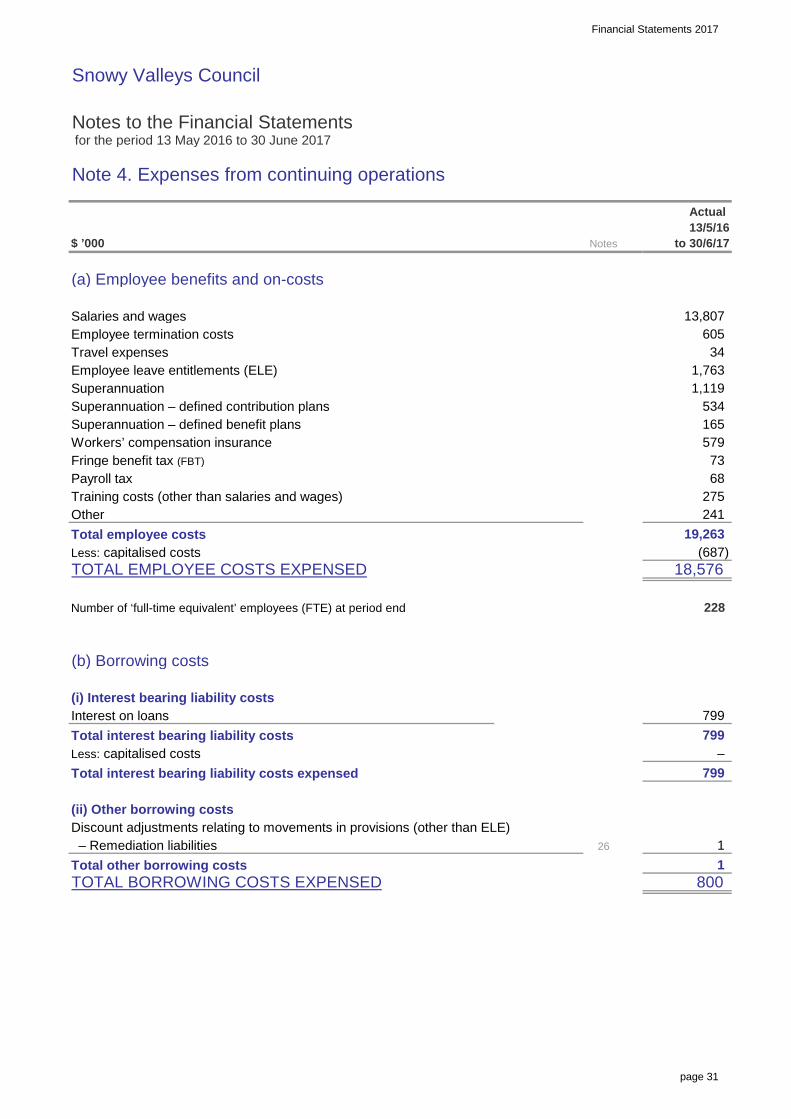
Note 4. Expenses from continuing operations
$ ’000
(a) Employee benefits and on-costs
Salaries and wagesEmployee termination costsTravel expensesEmployee leave entitlements (ELE)SuperannuationSuperannuation – defined contribution plansSuperannuation – defined benefit plansWorkers’ compensation insuranceFringe benefit tax (FBT)Payroll taxTraining costs (other than salaries and wages)OtherTotal employee costsLess: capitalised costsTOTAL EMPLOYEE COSTS EXPENSED
Number of ‘full-time equivalent’ employees (FTE) at period end
(b) Borrowing costs
(i) Interest bearing liability costsInterest on loansTotal interest bearing liability costsLess: capitalised costsTotal interest bearing liability costs expensed
(ii) Other borrowing costsDiscount adjustments relating to movements in provisions (other than ELE) – Remediation liabilitiesTotal other borrowing costsTOTAL BORROWING COSTS EXPENSED
34
1
799
73
228
165 534
Actual
18,576
1,119
13,807
13/5/16 to 30/6/17
(687) 19,263
241
–
26
275
579
605
Notes
800
799
1
–
799
1,763
68

Financial Statements 2017
page 32
Snowy Valleys Council
Notes to the Financial Statements for the period 13 May 2016 to 30 June 2017
Note 4. Expenses from continuing operations (continued)
$ ’000
(c) Materials and contracts
Raw materials and consumablesContractor and consultancy costs – Sealing contract – IT service contract – Garbage and recycle collection – Town planning consultants – Integrated business software – LGFS portfolio – Accounting – Economic development – Implementation Fund Consultancies – Stronger Communities Infrastructure ConsultanciesAuditors remuneration (1)
Legal expenses: – Legal expenses: debt recovery – Legal expenses: otherOperating leases: – Operating lease rentals: minimum lease payments (2)
Total materials and contractsLess: capitalised costsTOTAL MATERIALS AND CONTRACTS
1. Auditor remunerationAudit and other assurance servicesAudit and review of financial statements: Council’s AuditorOther audit and assurance servicesRemuneration for audit and other assurance services
Total Auditor remuneration
2. Operating lease payments are attributable to:Other
848
13/5/16 to 30/6/17
133
105
105
53
459
60
Actual
Notes
20,205
133
– 20,205
133
73
73
18,033 –
38
89
10
33
105
36
151 29
115

Financial Statements 2017
page 33
Snowy Valleys Council
Notes to the Financial Statements for the period 13 May 2016 to 30 June 2017
Note 4. Expenses from continuing operations (continued)
$ ’000
(d) Depreciation, amortisation and impairment
Depreciation and amortisationPlant and equipmentOffice equipmentFurniture and fittingsLand improvements (depreciable)Infrastructure: – Buildings – non-specialised – Buildings – specialised – Other structures – Roads – Bridges – Footpaths – Other road assets – Stormwater drainage – Water supply network – Sewerage network – Other open space/recreational assets – Other infrastructureOther assets – Heritage collections – Library books – OtherAsset reinstatement costsIntangible assetsLess: capitalised costsTotal depreciation and amortisation costs
ImpairmentNil
TOTAL DEPRECIATION ANDIMPAIRMENT COSTS EXPENSED
2,744 83 45
835 250
Actual
12,324
3 5
18 179
12,324 –
20
245
1,041 822
9 & 26
628
116
161
6
25
13/5/16 to 30/6/17
469
Notes
332 290
4,032

Financial Statements 2017
page 34
Snowy Valleys Council
Notes to the Financial Statements for the period 13 May 2016 to 30 June 2017
Note 4. Expenses from continuing operations (continued)
$ ’000
(e) Other expenses
AdvertisingBank chargesContributions/levies to other levels of government – Emergency services levy (includes FRNSW, SES, and RFS levies) – NSW rural fire service levy – Other contributions/leviesCouncillor expenses – councillors’ feesCouncillors’ expenses (incl. mayor) – other (excluding fees above)Donations, contributions and assistance to other organisationsDonations, contributions and assistance to other organisations (Section 356)Electricity and heatingFair value decrements – I,PP&E InsurancePostagePrinting and stationeryStreet lightingSubscriptions and publicationsTelephone and communicationsValuation feesStronger Communities Grants ExpenditureOtherTotal other expensesLess: capitalised costsTOTAL OTHER EXPENSES
8,344
261
44
1,012
237
–
136
214
45
104 159
58
– 49
157
1,136
13/5/16 to 30/6/17 Notes
9(a)
425
2,785 907
173
Actual
292
68
82
8,344
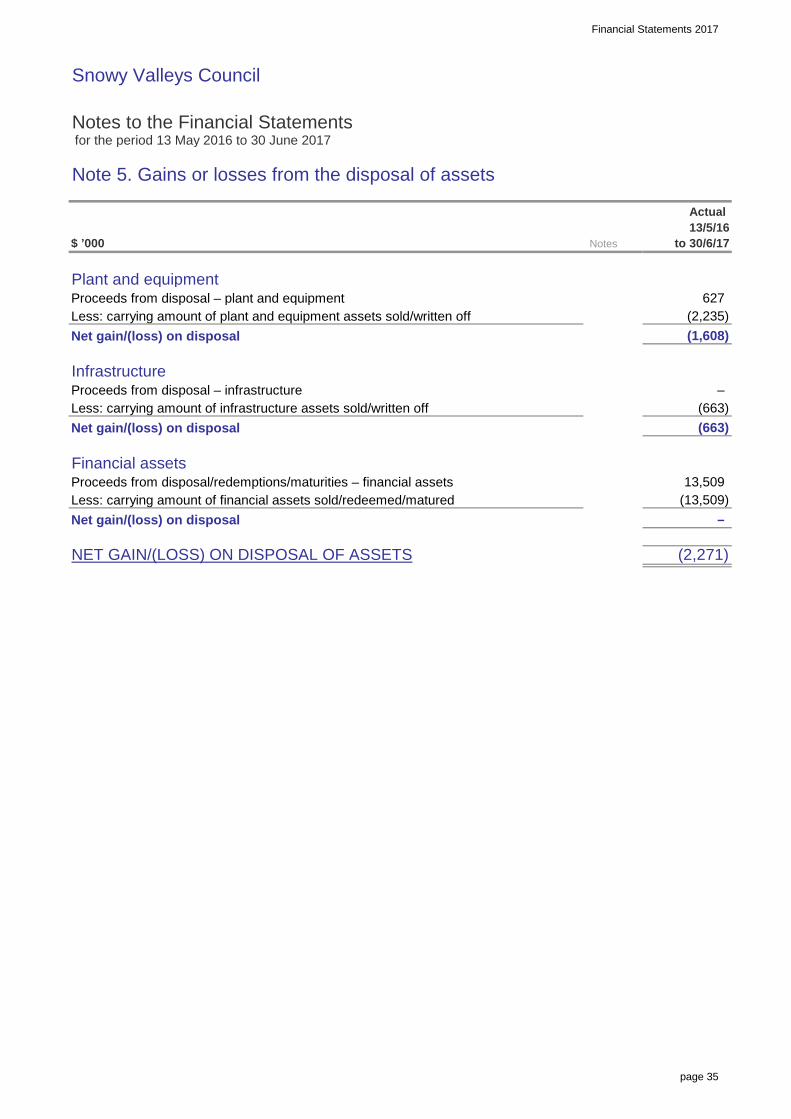
Financial Statements 2017
page 35
Snowy Valleys Council
Notes to the Financial Statements for the period 13 May 2016 to 30 June 2017
Note 5. Gains or losses from the disposal of assets
$ ’000
Plant and equipmentProceeds from disposal – plant and equipmentLess: carrying amount of plant and equipment assets sold/written offNet gain/(loss) on disposal
InfrastructureProceeds from disposal – infrastructureLess: carrying amount of infrastructure assets sold/written offNet gain/(loss) on disposal
Financial assetsProceeds from disposal/redemptions/maturities – financial assetsLess: carrying amount of financial assets sold/redeemed/maturedNet gain/(loss) on disposal
NET GAIN/(LOSS) ON DISPOSAL OF ASSETS
(1,608)
627
13/5/16 to 30/6/17
(663)
Actual
(2,235)
–
(663)
– (13,509) 13,509
Notes
(2,271)
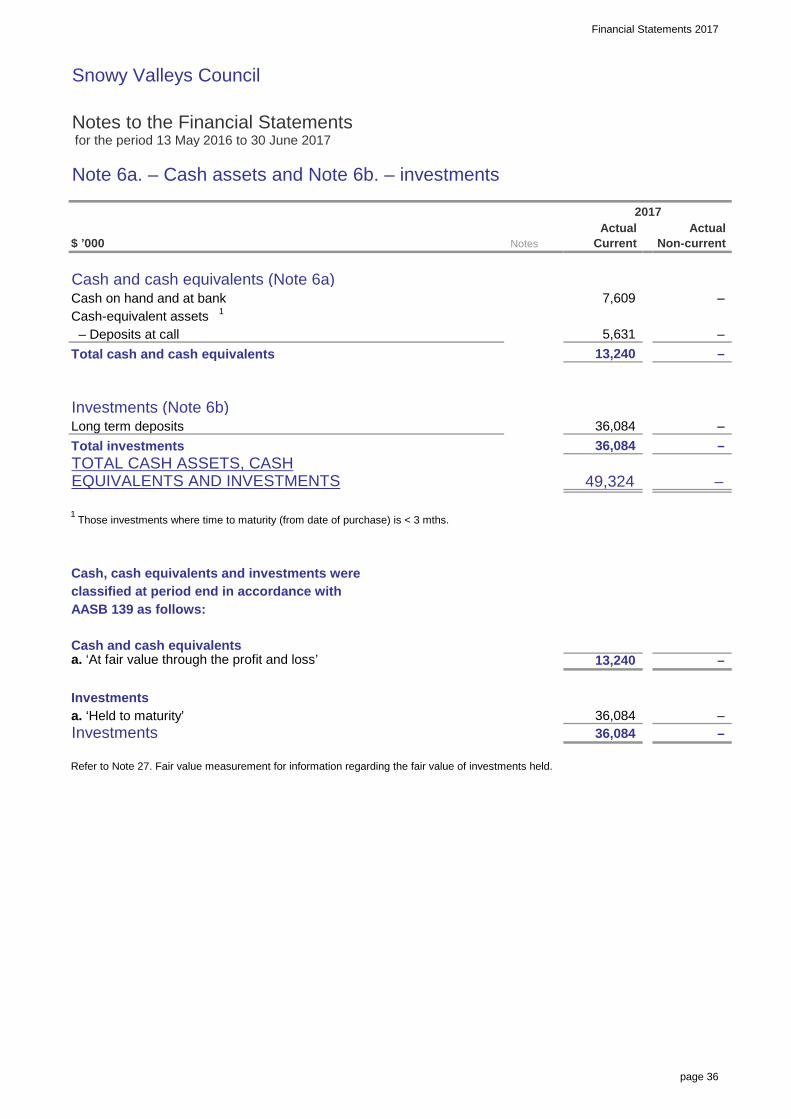
Financial Statements 2017
page 36
Snowy Valleys Council
Notes to the Financial Statements for the period 13 May 2016 to 30 June 2017
Note 6a. – Cash assets and Note 6b. – investments
$ ’000
Cash and cash equivalents (Note 6a)Cash on hand and at bankCash-equivalent assets 1
– Deposits at callTotal cash and cash equivalents
Investments (Note 6b)Long term depositsTotal investmentsTOTAL CASH ASSETS, CASHEQUIVALENTS AND INVESTMENTS
1 Those investments where time to maturity (from date of purchase) is < 3 mths.
Cash, cash equivalents and investments wereclassified at period end in accordance withAASB 139 as follows:
Cash and cash equivalentsa. ‘At fair value through the profit and loss’
Investmentsa. ‘Held to maturity’Investments
Refer to Note 27. Fair value measurement for information regarding the fair value of investments held.
–
–
– 36,084
13,240
13,240
Actual Non-current
–
–
49,324
–
Notes
–
Current
36,084
36,084 36,084
5,631
2017
–
– 7,609
Actual

Financial Statements 2017
page 37
Snowy Valleys Council
Notes to the Financial Statements for the period 13 May 2016 to 30 June 2017
Note 6c. Restricted cash, cash equivalents and investments – details
$ ’000
Total cash, cash equivalentsand investments
attributable to:External restrictions (refer below)Internal restrictions (refer below)Unrestricted
$ ’000
Details of restrictions
External restrictions – included in liabilitiesFunds in trustExternal restrictions – included in liabilities
External restrictions – otherDeveloper contributions – general (A)Developer contributions – water fund (A)Developer contributions – sewer fund (A)Specific purpose unexpended grants (B)Water supplies (C) Sewerage services (C)Domestic waste management (C)Retirement villageSpecific purpose contributionsUrban stormwaterExternal restrictions – otherTotal external restrictions
13/5/16 to 30/6/17
Non-current
57
–
Transfers to restrictions
–
Transferred from former
Councils
Actual
49,324
20,323
Current
251
10,866 10,923
447 83
117
Closing balance
15,570
3,455 2,035
–
(82)
– 14,627
– 57 57
2,590 –
– 826
Actual
49,324
Transfers from
restrictions
1,967 –
–
– 57
2,057 90 58 768
26,354 26,411
3
1,961
15,570
890
254
(82)
(74) 962
–
15,589
807 246 –
– 3,918
693
–
13/5/16 to 30/6/17
–
–
13/5/16 to 30/6/17
463
125 – (8) 49 – – 49
–
26,411

Financial Statements 2017
page 38
Snowy Valleys Council
Notes to the Financial Statements for the period 13 May 2016 to 30 June 2017
Note 6c. Restricted cash, cash equivalents and investments – details (continued)
$ ’000
Internal restrictionsPlant and vehicle replacementEmployees leave entitlementCarry over worksAboriginal brungle reserve PWAdelong showground reserveAirfieldPublic toiletsScholarshipSWS surplus holding accountTree managementOpen spaceFBT liabilityTelevision servicesAerodrom obstacle lightingAirfield resealsPlaygroundPlant TSC vehiclesPlant SWS vehiclePackards pitLife long learnerLegalITKhancoban community reserveOther waste managementBasalt quarry rehabQuarry rehab and capital worksTumbafestTelevision translator/radioReplacement of office equipmentPrivate works contingency reserveMannus quarry rehabCommunity servicesCapital projects reserveUncompleted worksProject developmentFestival of the falling leafElectionsContingenciesCommunity developmentCarpark improvementsCamp hudson
continued…
115
Transferred from former
Councils
1,119
26 – – 26 5 – – 5
4,390
(1) –
71 60
10
–
71 32 65 –
5
456 538
1 –
–
71 –
180
–
148 451
48
–
72 – – 72 (90) 628
27 5 –
–
40
413
–
168
60
6
–
–
(1,408)
718 –
400 – 125 –
3,290 –
95 – – 108 – (60)
–
(5) –
168
–
–
–
– 413
–
2,707
–
60
–
–
– –
77
– 71 –
–
60 –
40
(14) –
125
–
32
–
208
– – –
(120) (107)
–
1,882
1
51
Transfers from
restrictions Closing balance
2,432
456
–
32
(84)
115
10
Transfers to restrictions
4,450
39
323
–
325
95
1
–
240
107
61
(538)
13/5/16 to 30/6/17
–
106 39
105
77
107 –
–
45
2,467 1,426
106
103
391 813 – 1,204 24 27 – 51
(1,366)
103 105
45
667
– 61
(731)
– 409
–
2,044
6
–
400
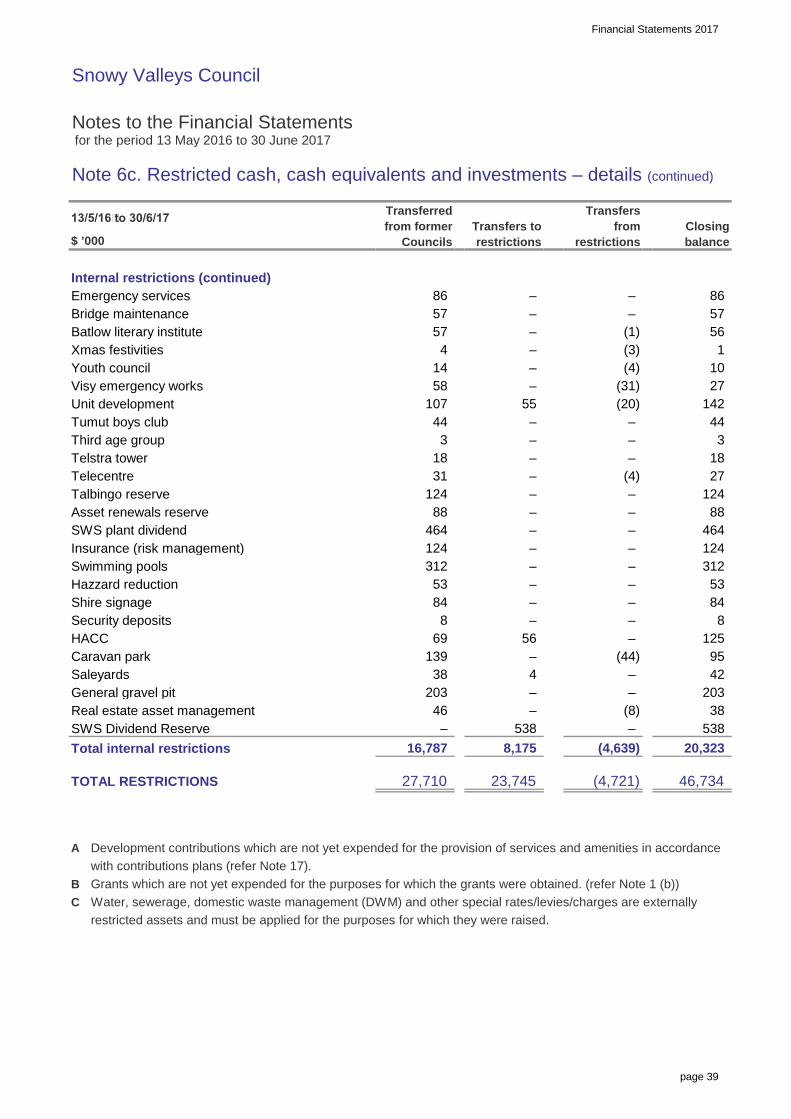
Financial Statements 2017
page 39
Snowy Valleys Council
Notes to the Financial Statements for the period 13 May 2016 to 30 June 2017
Note 6c. Restricted cash, cash equivalents and investments – details (continued)
$ ’000
Internal restrictions (continued)Emergency servicesBridge maintenanceBatlow literary instituteXmas festivitiesYouth councilVisy emergency worksUnit developmentTumut boys clubThird age groupTelstra towerTelecentreTalbingo reserveAsset renewals reserveSWS plant dividendInsurance (risk management)Swimming poolsHazzard reductionShire signageSecurity depositsHACCCaravan parkSaleyardsGeneral gravel pitReal estate asset managementSWS Dividend ReserveTotal internal restrictions
TOTAL RESTRICTIONS
A Development contributions which are not yet expended for the provision of services and amenities in accordancewith contributions plans (refer Note 17).
B Grants which are not yet expended for the purposes for which the grants were obtained. (refer Note 1 (b)) C Water, sewerage, domestic waste management (DWM) and other special rates/levies/charges are externally
restricted assets and must be applied for the purposes for which they were raised.
27,710
16,787
13/5/16 to 30/6/17 Transferred from former
CouncilsTransfers to restrictions
Transfers from
restrictions Closing balance
8,175
23,745
55 44 –
86
(4,721)
20,323
– – 86
(31) 27
– 312
(4) 27
(20) 142
46,734
– 124
(4,639)
42
(8) 38
4
57 – – 57
124
– –
57 – (1) 56 4 – (3) 1
14 – (4) 10
53 53
58 – 107
– 44 3 – – 3
18 – – 18 31 –
– – 124 88 –
– 538 – 538
8 – – 8 69 56 – 125
139
– 88 464 – – 464 124 – 312 –
84
– – 203
(44) 95
– –
203 – 46 –
– 38
84
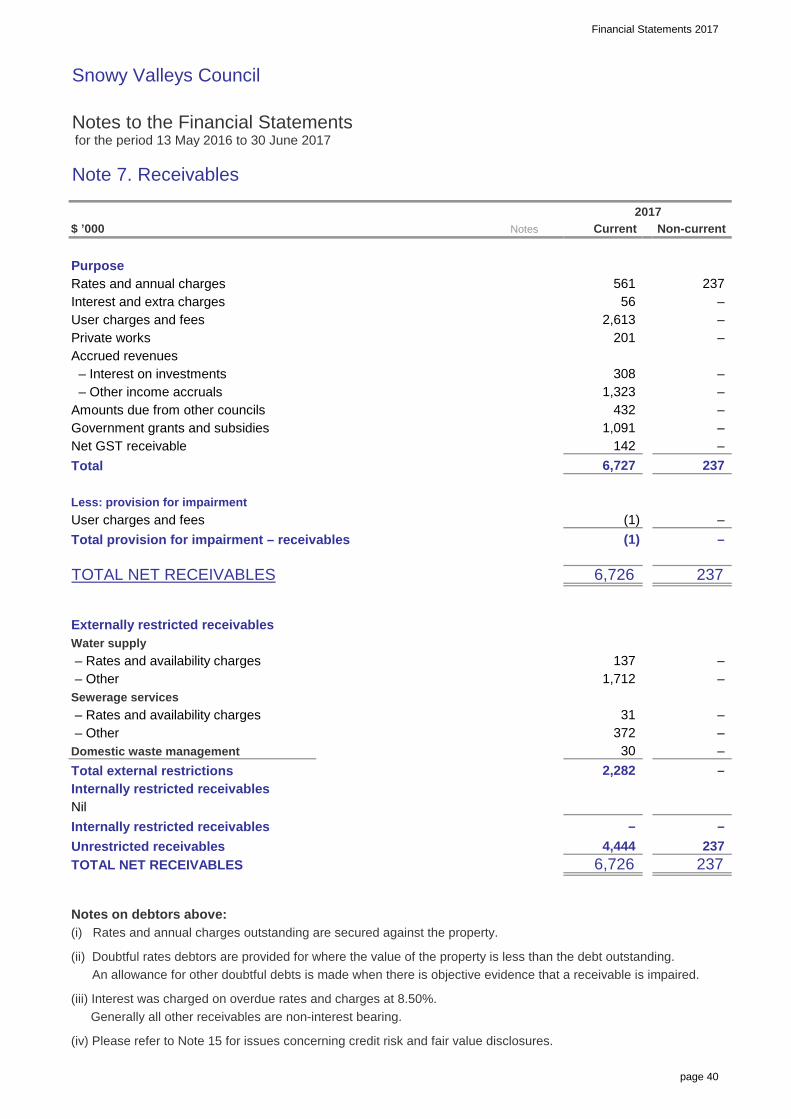
Financial Statements 2017
page 40
Snowy Valleys Council
Notes to the Financial Statements for the period 13 May 2016 to 30 June 2017
Note 7. Receivables
$ ’000
PurposeRates and annual chargesInterest and extra chargesUser charges and feesPrivate worksAccrued revenues – Interest on investments – Other income accrualsAmounts due from other councilsGovernment grants and subsidiesNet GST receivableTotal
Less: provision for impairmentUser charges and feesTotal provision for impairment – receivables
TOTAL NET RECEIVABLES
Externally restricted receivablesWater supply – Rates and availability charges – OtherSewerage services – Rates and availability charges – OtherDomestic waste managementTotal external restrictionsInternally restricted receivablesNilInternally restricted receivablesUnrestricted receivablesTOTAL NET RECEIVABLES
Notes on debtors above:(i) Rates and annual charges outstanding are secured against the property.
(ii) Doubtful rates debtors are provided for where the value of the property is less than the debt outstanding. An allowance for other doubtful debts is made when there is objective evidence that a receivable is impaired.
(iii) Interest was charged on overdue rates and charges at 8.50%.Generally all other receivables are non-interest bearing.
(iv) Please refer to Note 15 for issues concerning credit risk and fair value disclosures.
432
4,444
56
2017
237
2,282 – 30
6,726
–
–
1,712 –
–
6,726
1,323 –
201
– 372 –
–
308
1,091 142
–
–
137
–
237
237
(1)
–
561
237
–
31
6,727
(1)
Current
–
–
– 2,613
237
–
Notes Non-current

Financial Statements 2017
page 41
Snowy Valleys Council
Notes to the Financial Statements for the period 13 May 2016 to 30 June 2017
Note 8. Inventories and other assets
$ ’000
(a) Inventories
(i) Inventories at costReal estate for resale (refer below)Stores and materialsTotal inventories at cost
(ii) Inventories at net realisable value (NRV)Nil
TOTAL INVENTORIES
(b) Other assets
PrepaymentsTOTAL OTHER ASSETS
Externally restricted assetsThere are no restrictions applicable to the above assets.
Current
49
560
560
49
Notes Non-current
– 147
147
147
2017
261 299
– –

Financial Statements 2017
page 42
Snowy Valleys Council
Notes to the Financial Statements for the period 13 May 2016 to 30 June 2017
Note 8. Inventories and other assets (continued)
$ ’000
Other disclosures
(a) Details for real estate developmentResidentialTotal real estate for resale(Valued at the lower of cost and net realisable value)
Represented by:Acquisition costsTotal real estate for resale
Movements:Real estate assets at beginning of the period (former Councils)Total real estate for resale
(b) Current assets not anticipated to be settled within the next 12 monthsThe following inventories and other assets, even though classifiedas current are not expected to be recovered in the next 12 months;
Real estate for resale
(c) Inventory write downsThere were no amounts recognised as an expense relating to the write down of inventory balances held during the period.
Refer to Note 27. Fair value measurement for information regarding the fair value of other assets held.
2017Non-current Current
147 261
147 261
261 147 147
147
2017
261
147
213 213
261
261

Financial Statements 2017
page 43
Snowy Valleys Council
Notes to the Financial Statements for the period 13 May 2016 to 30 June 2017
Note 9a. Infrastructure, property, plant and equipment
Asset class
$ ’000
Capital work in progress 1,058 – 1,058 – 204 – – (1,023) – – – 239 – 239 Plant and equipment 45,920 23,118 22,802 1,570 857 (1,427) (2,744) – (9,313) – – 20,262 8,517 11,745 Office equipment 1,511 908 603 50 – – (83) – 4 – – 1,576 1,002 574 Furniture and fittings 1,191 740 451 – – – (45) – 1 – – 1,195 788 407 Land: – Operational land 7,649 – 7,649 – 15 (47) – – (10) – 38 7,645 – 7,645 – Community land 13,844 – 13,844 – – – – – 10 (242) – 13,612 – 13,612 Land improvements – non-depreciable 1,038 11 1,027 – 25 – – – – – – 1,063 11 1,052 Land improvements – depreciable 6,619 2,156 4,463 33 25 (1) (116) – (1,605) – 103 4,423 1,521 2,902 Infrastructure: – Buildings – non-specialised 53,398 19,092 34,306 1,691 203 (539) (835) 298 4 – – 54,627 19,499 35,128 – Buildings – specialised 17,408 7,000 10,408 – 27 – (250) – 4 – – 17,447 7,258 10,189 – Other structures 34,708 15,914 18,794 35 41 (372) (469) – (13,918) – 50 6,071 1,910 4,161 – Roads 247,732 70,108 177,624 3,256 281 (169) (4,032) 725 (648) – 44 250,973 73,892 177,081 – Bridges 55,451 23,487 31,964 657 – (22) (628) – 1 – 228 55,711 23,511 32,200 – Footpaths 12,005 4,347 7,658 13 221 (28) (161) – 12 – 78 12,300 4,507 7,793 – Kerb and gutter 20,073 8,299 11,774 251 194 (151) (290) – 2 – – 20,261 8,481 11,780 – Bulk earthworks (non-depreciable) 107,068 – 107,068 551 151 – – – 43 – – 107,813 – 107,813 – Stormwater drainage 35,620 14,626 20,994 364 243 (61) (332) – 93 – 97 36,351 14,953 21,398 – Water supply network 46,285 9,058 37,227 378 48 (74) (1,041) – 17,407 (2,543) – 78,527 27,125 51,402 – Sewerage network 82,574 23,768 58,806 193 89 (2) (822) – 5,109 – 1,119 93,970 29,478 64,492 – Other open space/recreational assets 2,346 620 1,726 149 582 (5) (245) – 2,853 – – 9,036 3,976 5,060 – Other infrastructure 286 16 270 – 104 – (6) – (49) – – 338 19 319 Other assets: – Heritage collections 172 15 157 – – – (3) – – – – 172 18 154 – Library books 25 16 9 – – – (5) – – – – 25 21 4 – Other 111 67 44 – – – (20) – – – – 111 87 24 Reinstatement, rehabilitation and restoration assets (refer Note 26): – Tip assets 223 100 123 – 14 – (13) – 2 – – 239 113 126 – Quarry assets 71 36 35 – – – (5) – 6 – – 76 40 36 TOTAL INFRASTRUCTURE,PROPERTY, PLANT AND EQUIP.
Renewals are defined as the replacement of existing assets (as opposed to the acquisition of new assets).
Refer to Note 27. Fair value measurement for information regarding the fair value of other infrastructure, property, plant and equipment.
Gross carrying amount
Net carrying amount
Gross carrying amount
Accumulated depreciation
and impairment
Net carrying amount
WIPtransfers
Adjustmentsand
transfers
Additionsnew assets
Additionsrenewals
Carrying value
of disposals
Depreciation expense
Accumulated depreciation
and impairment
794,386 223,502 570,884 9,191 (2,898) (12,145) 3,324 567,336 (2,785) 1,757 794,063 226,727 – 8
as at 30/6/2017
Revaluation decrements
to P&L
Asset movements during the reporting period
Revaluation increments
to equity (ARR)
IPP&E transferred from former Councils
as at 13/5/2016

Financial Statements 2017
page 44
Snowy Valleys Council
Notes to the Financial Statements for the period 13 May 2016 to 30 June 2017
Note 9b. Externally restricted infrastructure, property, plant and equipment
Note 9c. Infrastructure, property, plant and equipment – current period impairments
Council has recognised no impairment losses during the reporting period nor reversed any prior period losses.
TOTAL RESTRICTED I,PP&E
Buildings Other structures Infrastructure Other assets Total DWM
$ ’000
Class of asset
Water supply Plant and equipment Land – Operational land – Community land – Improvements non-depreciable – Improvements – depreciable Buildings Infrastructure Other assets Total water supply
Sewerage services Plant and equipment Land – Operational land
– Improvements – depreciable Buildings Infrastructure Total sewerage services
Domestic waste management Plant and equipment Land – Operational land – Improvements non-depreciable – Improvements – depreciable
125
454 2,276
95,793 30,131 65,662
57 52
76 – 76 54 19 35
1,447 171 1,276 382
181,813 59,418 122,395
182 200 30
28 220
5
436 – 436
192 185 7
– 125 131 60
1,014 408 606 93,970 29,478 64,492
27,125 –
– –
1,662
16 102
3,454 78,527
12
– 1
1,792
45
71
2 28
Accumulated depreciation and
impairment
Net carryingamount
– Community land – Improvements non-depreciable
Actual2017
226 – 226 135 – 135
248 2,730
Gross carrying amount
53
866 260
16 101
51,402 12
83,290 28,833 54,457
8
866 260

Financial Statements 2017
page 45
Snowy Valleys Council
Notes to the Financial Statements for the period 13 May 2016 to 30 June 2017
Note 10a. Payables, borrowings and provisions
$ ’000
PayablesGoods and services – operating expenditureAccrued expenses: – Borrowings – Salaries and wages – Other expenditure accrualsSecurity bonds, deposits and retentionsEmployee deductionsOtherTotal payables
Income received in advanceNil
BorrowingsLoans – secured 1
Total borrowings
ProvisionsEmployee benefits:Annual leaveLong service leaveOther leave – RDOOther leave – TOILSub-total – aggregate employee benefitsAsset remediation/restoration (future works)Redundancies Total provisions
1. Loans are secured over the income of Council Disclosures on liability interest rate risk exposures, fair value disclosures and security can be found in Note 15.
26
10,425
174 –
1,183
5,152 148
9,088
– 148
420
63 –
–
TOTAL PAYABLES, BORROWINGS AND PROVISIONS
5,746
10,737
35
2017
–
–
–
Non-current
969
2,159
36
Notes Current
153 –
74
–
–
1,646
1,183
– 216 648
–
3,417
10,425
164
312
54
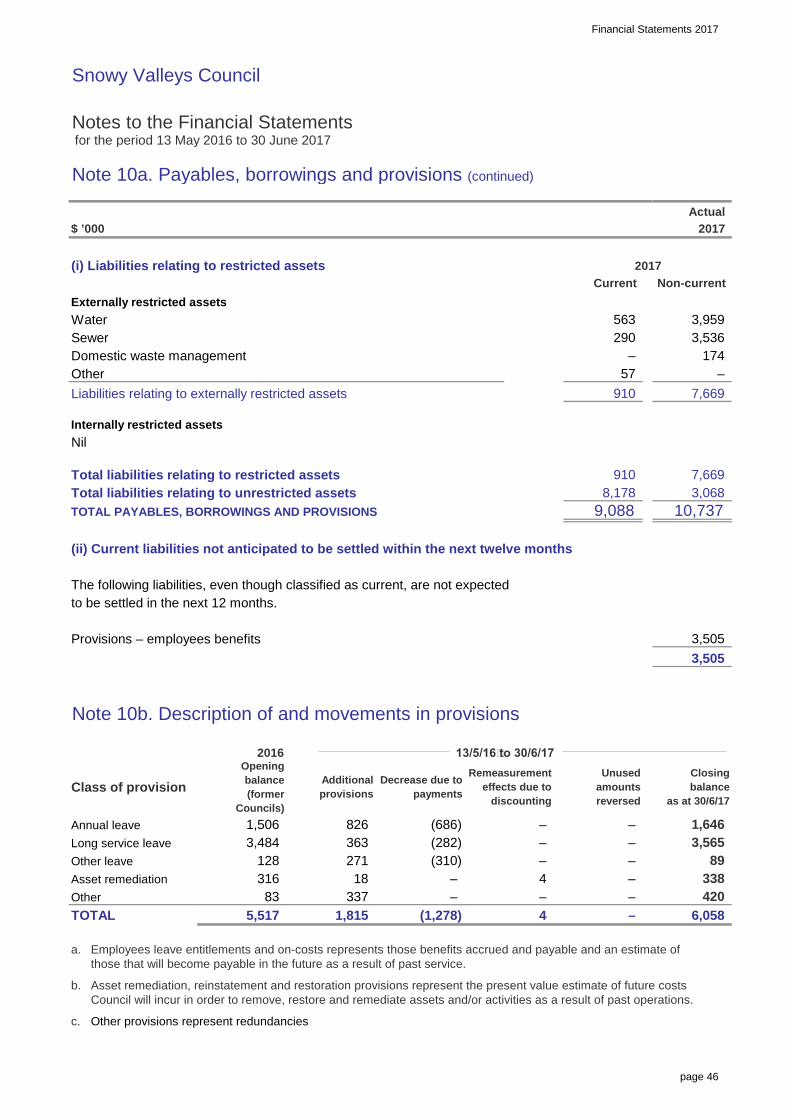
Financial Statements 2017
page 46
Snowy Valleys Council
Notes to the Financial Statements for the period 13 May 2016 to 30 June 2017
Note 10a. Payables, borrowings and provisions (continued)
$ ’000
(i) Liabilities relating to restricted assets
Externally restricted assetsWaterSewerDomestic waste managementOtherLiabilities relating to externally restricted assets
Internally restricted assetsNil
Total liabilities relating to restricted assetsTotal liabilities relating to unrestricted assetsTOTAL PAYABLES, BORROWINGS AND PROVISIONS
(ii) Current liabilities not anticipated to be settled within the next twelve months
The following liabilities, even though classified as current, are not expectedto be settled in the next 12 months.
Provisions – employees benefits
Note 10b. Description of and movements in provisions
a. Employees leave entitlements and on-costs represents those benefits accrued and payable and an estimate of those that will become payable in the future as a result of past service.
b. Asset remediation, reinstatement and restoration provisions represent the present value estimate of future costs Council will incur in order to remove, restore and remediate assets and/or activities as a result of past operations.
c. Other provisions represent redundancies
3,505
–
563
3,505
–
57
3,565
3,959
– 174
Actual2017
910
Non-current 2017
–
Decrease due to paymentsClass of provision
1,646
TOTAL
18 Other 83 337 –
13/5/16 to 30/6/17
3,484
Asset remediation
(282) 363 – Annual leave
316
5,517 1,815 (1,278) 6,058
826
Openingbalance(former
Councils)
4
Long service leave1,506 (686)
(310)
–
Additional provisions
Unused amounts reversed
2016
Current
128
9,088 10,737 8,178
910
290
271 Other leave
Remeasurement effects due to
discounting
–
–
89
7,669
3,068
Closingbalance
as at 30/6/17
3,536
–
420
– –
– 4
338
7,669
–
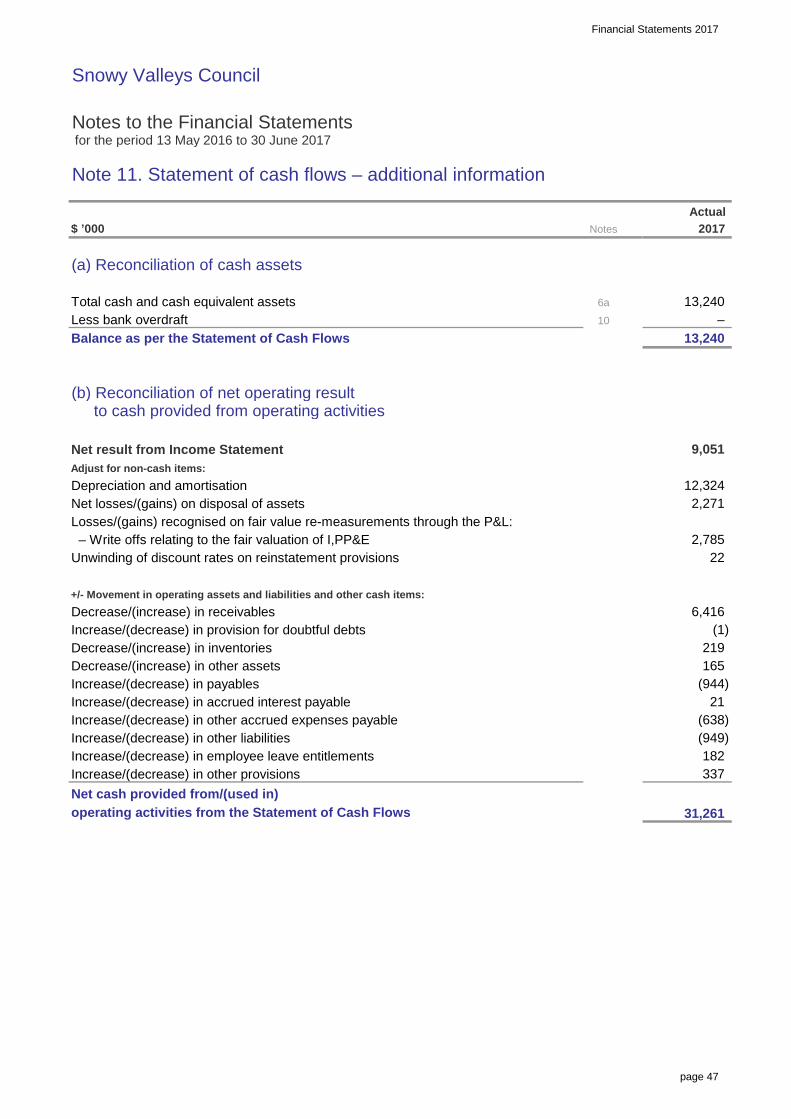
Financial Statements 2017
page 47
Snowy Valleys Council
Notes to the Financial Statements for the period 13 May 2016 to 30 June 2017
Note 11. Statement of cash flows – additional information
$ ’000
(a) Reconciliation of cash assets
Total cash and cash equivalent assetsLess bank overdraftBalance as per the Statement of Cash Flows
(b) Reconciliation of net operating result to cash provided from operating activities
Net result from Income StatementAdjust for non-cash items:Depreciation and amortisationNet losses/(gains) on disposal of assetsLosses/(gains) recognised on fair value re-measurements through the P&L: – Write offs relating to the fair valuation of I,PP&EUnwinding of discount rates on reinstatement provisions
+/- Movement in operating assets and liabilities and other cash items:Decrease/(increase) in receivablesIncrease/(decrease) in provision for doubtful debtsDecrease/(increase) in inventoriesDecrease/(increase) in other assetsIncrease/(decrease) in payablesIncrease/(decrease) in accrued interest payableIncrease/(decrease) in other accrued expenses payableIncrease/(decrease) in other liabilitiesIncrease/(decrease) in employee leave entitlementsIncrease/(decrease) in other provisionsNet cash provided from/(used in)operating activities from the Statement of Cash Flows
13,240 6a
22
(638)
12,324
10
(944)
2,785
2,271
2017
(1)
182
13,240
Notes
9,051
6,416
Actual
31,261
219
337
165
21
(949)
–
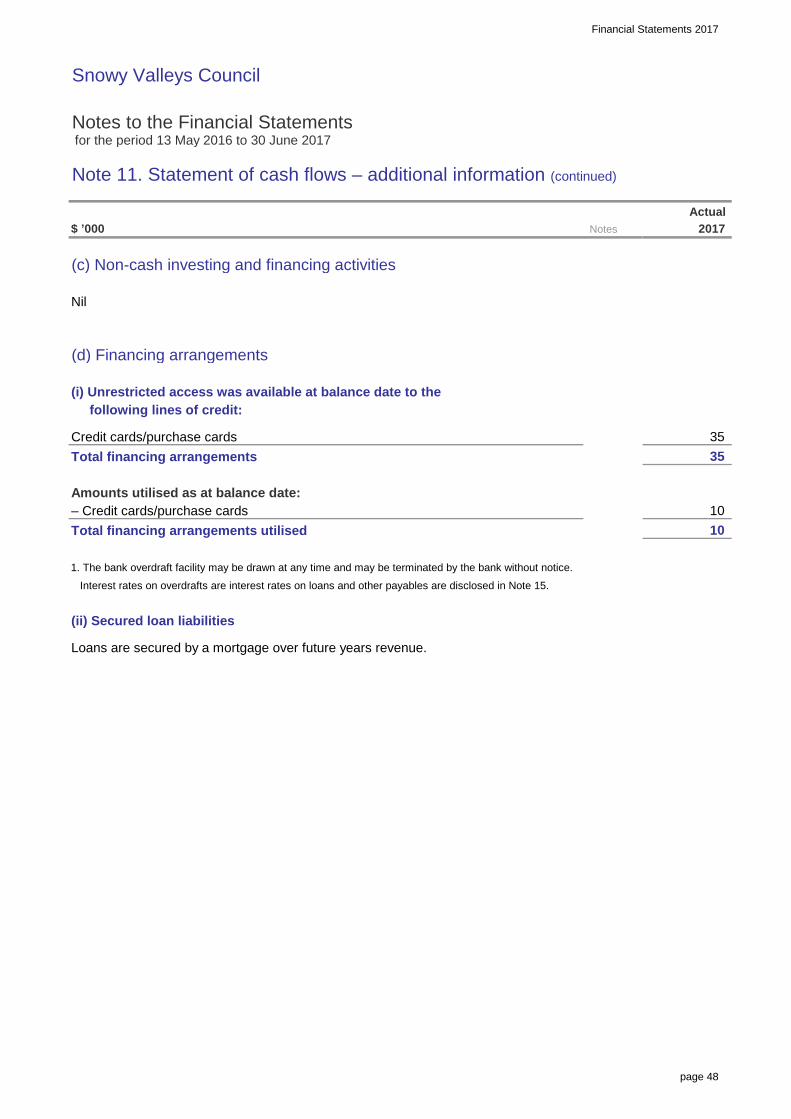
Financial Statements 2017
page 48
Snowy Valleys Council
Notes to the Financial Statements for the period 13 May 2016 to 30 June 2017
Note 11. Statement of cash flows – additional information (continued)
$ ’000
(c) Non-cash investing and financing activities
Nil
(d) Financing arrangements
(i) Unrestricted access was available at balance date to the following lines of credit:
Credit cards/purchase cardsTotal financing arrangements
Amounts utilised as at balance date:– Credit cards/purchase cardsTotal financing arrangements utilised
1. The bank overdraft facility may be drawn at any time and may be terminated by the bank without notice. Interest rates on overdrafts are interest rates on loans and other payables are disclosed in Note 15.
(ii) Secured loan liabilities
Loans are secured by a mortgage over future years revenue.
35
10 10
35
NotesActual
2017

Financial Statements 2017
page 49
Snowy Valleys Council
Notes to the Financial Statements for the period 13 May 2016 to 30 June 2017
Note 12. Commitments for expenditure
$ ’000
(a) Capital commitments (exclusive of GST)
Capital expenditure committed for at the reporting date but notrecognised in the financial statements as liabilities:
Property, plant and equipmentBuildingsPlant and equipmentNetwork for One DomainRoad - Clarkes Hill ResconstructionTotal commitments
These expenditures are payable as follows:Within the next yearLater than one year and not later than 5 yearsLater than 5 yearsTotal payable
Future grants and contributionsUnexpended grantsInternally restricted reservesTotal sources of funding
Details of capital commitmentsICT Strategy network uplift components and labour
(b) Finance lease commitmentsNil
(c) Operating lease commitments (non-cancellable)
a. Commitments under non-cancellable operating leases at the reporting date, but not recognised as liabilities are payable:
Within the next yearLater than one year and not later than 5 yearsLater than 5 yearsTotal non-cancellable operating lease commitments
b. Non-cancellable operating leases include the following assets:IT Equipment including Servers, Laptops & PC's
Conditions relating to operating leases:– All operating lease agreements are secured only against the leased asset.– No lease agreements impose any financial restrictions on Council regarding future debt etc.
–
1,158
101
2017
91
909
– 101
1,158
158
225 684
Notes
1,158
1,158
Actual
91
–
158
–
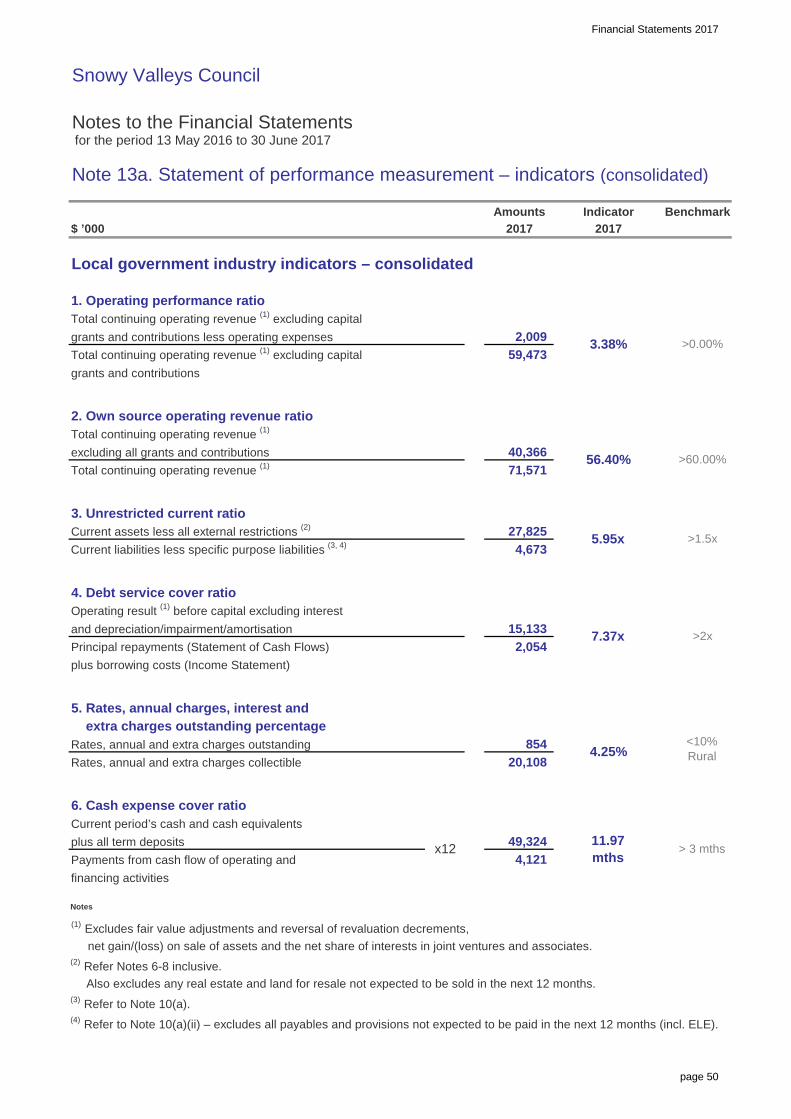
Financial Statements 2017
page 50
Snowy Valleys Council
Notes to the Financial Statements for the period 13 May 2016 to 30 June 2017
Note 13a. Statement of performance measurement – indicators (consolidated)
$ ’000
Local government industry indicators – consolidated
1. Operating performance ratioTotal continuing operating revenue (1) excluding capitalgrants and contributions less operating expensesTotal continuing operating revenue (1) excluding capitalgrants and contributions
2. Own source operating revenue ratioTotal continuing operating revenue (1)
excluding all grants and contributionsTotal continuing operating revenue (1)
3. Unrestricted current ratioCurrent assets less all external restrictions (2)
Current liabilities less specific purpose liabilities (3, 4)
4. Debt service cover ratioOperating result (1) before capital excluding interestand depreciation/impairment/amortisationPrincipal repayments (Statement of Cash Flows)plus borrowing costs (Income Statement)
5. Rates, annual charges, interest and extra charges outstanding percentageRates, annual and extra charges outstandingRates, annual and extra charges collectible
6. Cash expense cover ratioCurrent period’s cash and cash equivalentsplus all term depositsPayments from cash flow of operating andfinancing activities
Notes
(1) Excludes fair value adjustments and reversal of revaluation decrements, net gain/(loss) on sale of assets and the net share of interests in joint ventures and associates.(2) Refer Notes 6-8 inclusive. Also excludes any real estate and land for resale not expected to be sold in the next 12 months.(3) Refer to Note 10(a).(4) Refer to Note 10(a)(ii) – excludes all payables and provisions not expected to be paid in the next 12 months (incl. ELE).
854 4.25%
4,673
56.40%
5.95x
20,108
2,054
4,121 11.97 mths
27,825
> 3 mthsx12
15,133 7.37x >2x
<10% Rural
Benchmark
>0.00%3.38%
49,324
>1.5x
Amounts
59,473 2,009
40,366 >60.00%
2017
71,571
Indicator2017

Financial Statements 2017
page 51
Snowy Valleys Council
Notes to the Financial Statements for the period 13 May 2016 to 30 June 2017
Note 13b. Statement of performance measurement – indicators (by fund)
$ ’000
Local government industry indicators – by fund
1. Operating performance ratioTotal continuing operating revenue (1) excluding capitalgrants and contributions less operating expensesTotal continuing operating revenue (1) excluding capitalgrants and contributions
2. Own source operating revenue ratioTotal continuing operating revenue (1)
excluding all grants and contributionsTotal continuing operating revenue (1)
3. Unrestricted current ratioCurrent assets less all external restrictions (2)
Current liabilities less specific purpose liabilities (3, 4)
4. Debt service cover ratioOperating result (1) before capital excluding interestand depreciation/impairment/amortisationPrincipal repayments (Statement of Cash Flows)plus borrowing costs (Income Statement)
5. Rates, annual charges, interest and extra charges outstanding percentageRates, annual and extra charges outstandingRates, annual and extra charges collectible
6. Cash expense cover ratioCurrent period’s cash and cash equivalentsplus all term depositsPayments from cash flow of operating andfinancing activities
Notes
(1) - (4) Refer to Notes at Note 13a(i) above.(5) General fund refers to all of Council’s activities except for its water and sewer activities which are listed separately.
7.77%
97.24%
>2x2.53x
-47.48%
14.88x
> 3 mths
Water Benchmark
6.77x
8.15%
4.78%
2017General 5 Sewer
1014.00 mths
1639.00 mths
14.90x
0.71%9.93%
5.95x
10.92 mths
4.31x
2017
>0.00%
>1.5x
97.32%
x12
2017
>60.00%
<10% Rural
49.78%
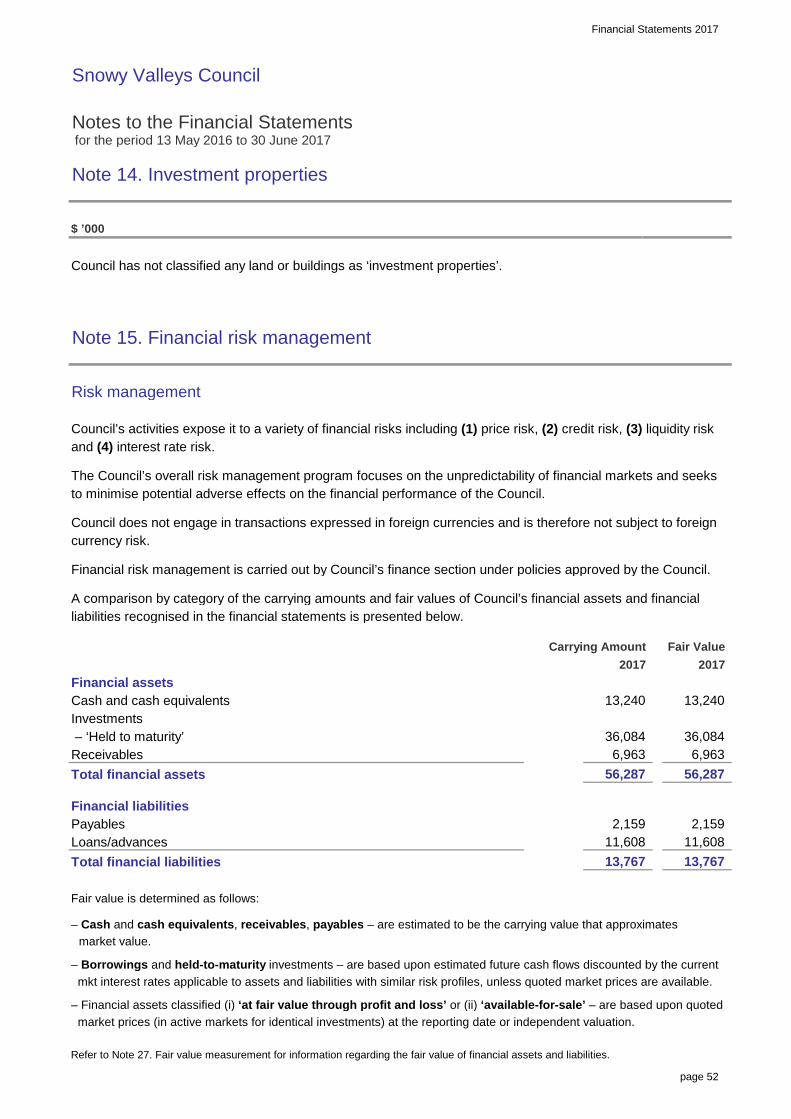
Financial Statements 2017
page 52
Snowy Valleys Council
Notes to the Financial Statements for the period 13 May 2016 to 30 June 2017
Note 14. Investment properties
$ ’000
Council has not classified any land or buildings as ‘investment properties’.
Note 15. Financial risk management
Risk management
Council’s activities expose it to a variety of financial risks including (1) price risk, (2) credit risk, (3) liquidity riskand (4) interest rate risk.
The Council’s overall risk management program focuses on the unpredictability of financial markets and seeksto minimise potential adverse effects on the financial performance of the Council.
Council does not engage in transactions expressed in foreign currencies and is therefore not subject to foreigncurrency risk.
Financial risk management is carried out by Council’s finance section under policies approved by the Council.
A comparison by category of the carrying amounts and fair values of Council’s financial assets and financialliabilities recognised in the financial statements is presented below.
Financial assetsCash and cash equivalentsInvestments – ‘Held to maturity’ReceivablesTotal financial assets
Financial liabilitiesPayablesLoans/advancesTotal financial liabilities
Fair value is determined as follows:
– Cash and cash equivalents, receivables, payables – are estimated to be the carrying value that approximates market value.
– Borrowings and held-to-maturity investments – are based upon estimated future cash flows discounted by the current mkt interest rates applicable to assets and liabilities with similar risk profiles, unless quoted market prices are available.
– Financial assets classified (i) ‘at fair value through profit and loss’ or (ii) ‘available-for-sale’ – are based upon quoted market prices (in active markets for identical investments) at the reporting date or independent valuation.
Refer to Note 27. Fair value measurement for information regarding the fair value of financial assets and liabilities.
2017
13,767 13,767
13,240
56,287
11,608
Fair ValueCarrying Amount
56,287
36,084
2017
13,240
2,159
36,084 6,963 6,963
2,159 11,608
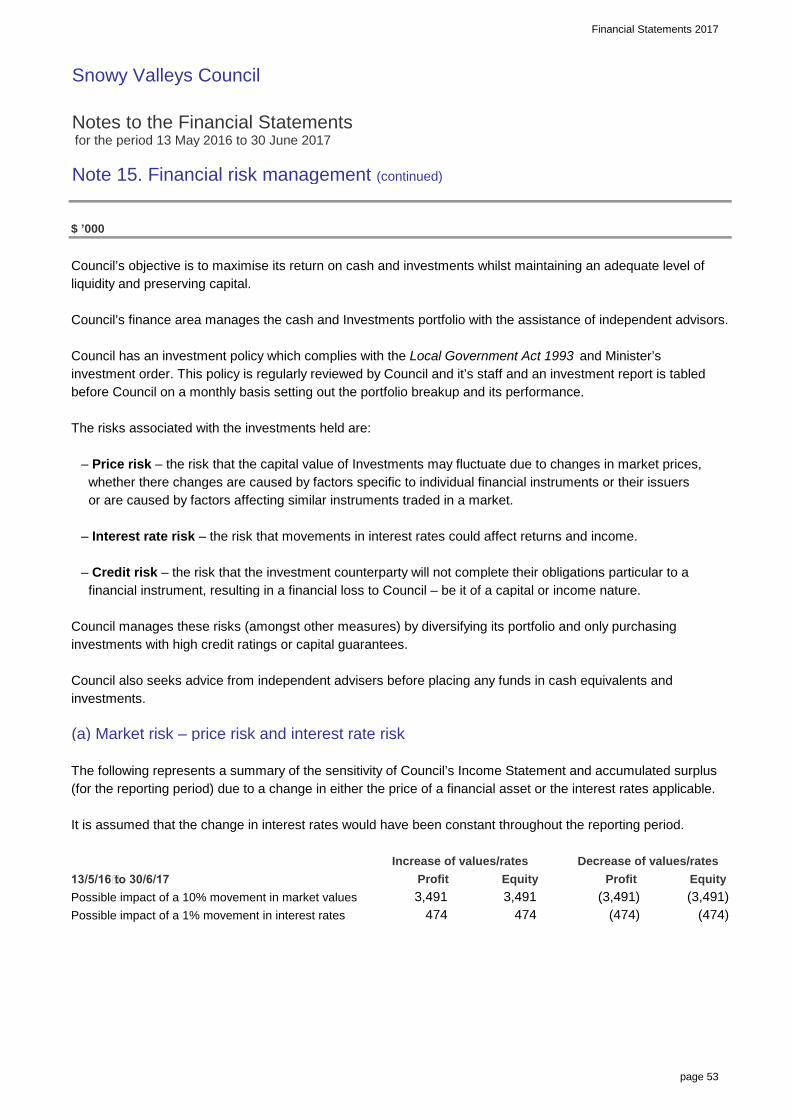
Financial Statements 2017
page 53
Snowy Valleys Council
Notes to the Financial Statements for the period 13 May 2016 to 30 June 2017
Note 15. Financial risk management (continued)
$ ’000
Council’s objective is to maximise its return on cash and investments whilst maintaining an adequate level ofliquidity and preserving capital.
Council’s finance area manages the cash and Investments portfolio with the assistance of independent advisors.
Council has an investment policy which complies with the Local Government Act 1993 and Minister’sinvestment order. This policy is regularly reviewed by Council and it’s staff and an investment report is tabledbefore Council on a monthly basis setting out the portfolio breakup and its performance.
The risks associated with the investments held are:
– Price risk – the risk that the capital value of Investments may fluctuate due to changes in market prices, whether there changes are caused by factors specific to individual financial instruments or their issuers or are caused by factors affecting similar instruments traded in a market.
– Interest rate risk – the risk that movements in interest rates could affect returns and income.
– Credit risk – the risk that the investment counterparty will not complete their obligations particular to a financial instrument, resulting in a financial loss to Council – be it of a capital or income nature.
Council manages these risks (amongst other measures) by diversifying its portfolio and only purchasinginvestments with high credit ratings or capital guarantees.
Council also seeks advice from independent advisers before placing any funds in cash equivalents andinvestments.
(a) Market risk – price risk and interest rate risk
The following represents a summary of the sensitivity of Council’s Income Statement and accumulated surplus(for the reporting period) due to a change in either the price of a financial asset or the interest rates applicable.
It is assumed that the change in interest rates would have been constant throughout the reporting period.
13/5/16 to 30/6/17Possible impact of a 10% movement in market valuesPossible impact of a 1% movement in interest rates
Equity Increase of values/rates
474 (3,491)
474 3,491
(474)
Profit Decrease of values/rates
Equity (3,491) 3,491
Profit
(474)

Financial Statements 2017
page 54
Snowy Valleys Council
Notes to the Financial Statements for the period 13 May 2016 to 30 June 2017
Note 15. Financial risk management (continued)
$ ’000
(b) Credit risk
Council’s major receivables comprise (i) rates and annual charges and (ii) user charges and fees.
The major risk associated with these receivables is credit risk – the risk that debts due and payable to Councilmay not be repaid in full.
Council manages this risk by monitoring outstanding debt and employing stringent debt recovery procedures.It also encourages ratepayers to pay their rates by the due date through incentives.
Credit risk on rates and annual charges is minimised by the ability of Council to secure a charge over the landrelating to the debts – that is, the land can be sold to recover the debt. Council is also able to charge intereston overdue rates and annual charges at higher than market rates which further encourages the payment of debt.
There are no significant concentrations of credit risk, whether through exposure to individual customers,specific industry sectors and/or regions.
The level of outstanding receivables is reported to Council monthly and benchmarks are set and monitored foracceptable collection performance.
Council makes suitable provision for doubtful receivables as required and carries out credit checks on mostnon-rate debtors.
There are no material receivables that have been subjected to a re-negotiation of repayment terms.
A profile of Council’s receivables credit risk at balance date follows:
(i) Ageing of receivables – %Current (not yet overdue)Overdue
(ii) Ageing of receivables – valueRates and annual charges Other receivablesCurrent Current< 1 year overdue 0 – 30 days overdue1 – 2 years overdue 31 – 60 days overdue2 – 5 years overdue 61 – 90 days overdue> 5 years overdue > 91 days overdue
(iii) Movement in provision for impairment of receivablesBalance at the beginning of the period (former Councils)– amounts provided for but recovered during the periodBalance at the end of the period 1
85%
2017
118
Other
184 395
5,790
Rates and
100%6%
receivables
annual
charges
80
receivables charges
2017
62 132
100%
14
annual Other
Rates and
94%
798
2017
2
6,166
102 87
15%
(1)
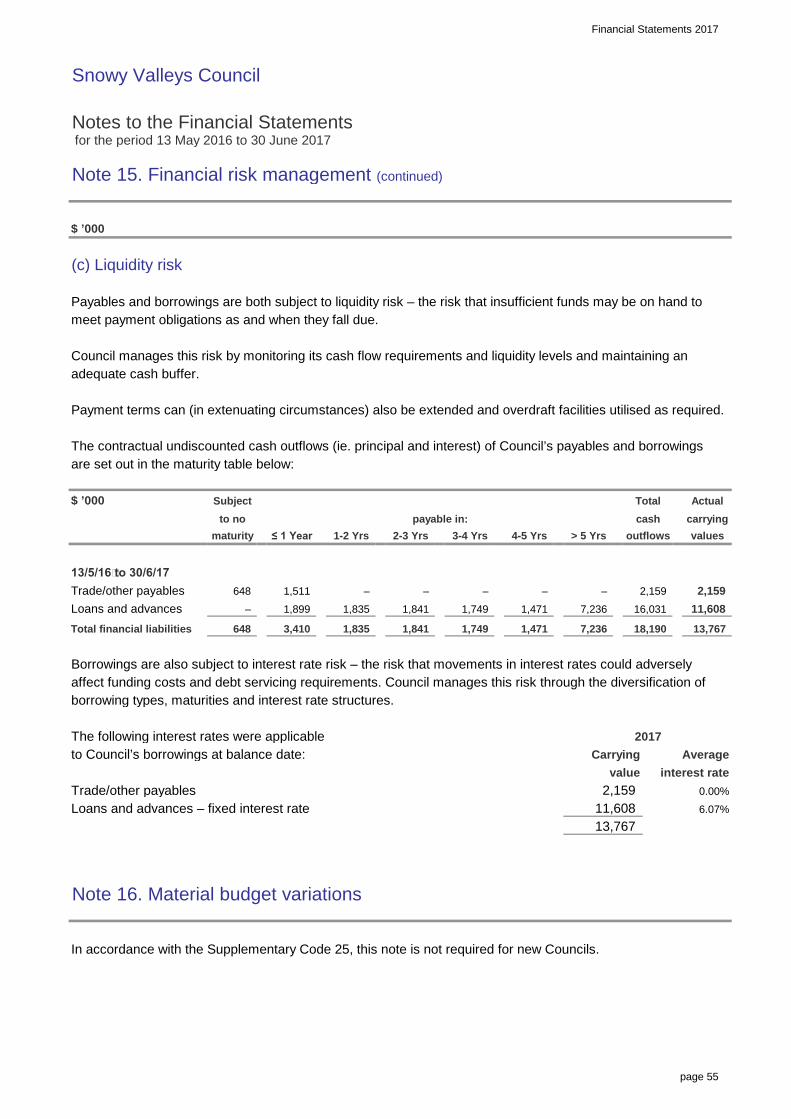
Financial Statements 2017
page 55
Snowy Valleys Council
Notes to the Financial Statements for the period 13 May 2016 to 30 June 2017
Note 15. Financial risk management (continued)
$ ’000
(c) Liquidity risk
Payables and borrowings are both subject to liquidity risk – the risk that insufficient funds may be on hand tomeet payment obligations as and when they fall due.
Council manages this risk by monitoring its cash flow requirements and liquidity levels and maintaining anadequate cash buffer.
Payment terms can (in extenuating circumstances) also be extended and overdraft facilities utilised as required.
The contractual undiscounted cash outflows (ie. principal and interest) of Council’s payables and borrowingsare set out in the maturity table below:
$ ’000
Trade/other payablesLoans and advancesTotal financial liabilities
Borrowings are also subject to interest rate risk – the risk that movements in interest rates could adverselyaffect funding costs and debt servicing requirements. Council manages this risk through the diversification ofborrowing types, maturities and interest rate structures.
The following interest rates were applicableto Council’s borrowings at balance date:
Trade/other payablesLoans and advances – fixed interest rate
Note 16. Material budget variations
In accordance with the Supplementary Code 25, this note is not required for new Councils.
1,749
1,841
7,236 –
cash
16,031 1,835
1,749
1,841 11,608 2,159
13,767
1,471 – 648
outflows
11,608
interest rateAverage
2017
6.07%2,159 0.00%
value
values
ActualTotal
Carrying
carrying
–
payable in:
13,767 18,190 7,236 1,471 648
to no3-4 Yrs
Subject
1,899
1-2 Yrs
3,410
– – – 1,511
4-5 Yrs
2,159
≤ 1 Year > 5 Yrs2-3 Yrsmaturity
1,835
13/5/16 to 30/6/17

Financial Statements 2017
page 56
Snowy Valleys Council
Notes to the Financial Statements for the period 13 May 2016 to 30 June 2017
Note 17. Statement of developer contributions
$ ’000
Council recovers contributions, raises levies and enters into planning agreements on development works that are subject to a development consent issued by Council.All contributions must be spent/utilised for the specific purpose they were levied and any interest applicable to unspent funds must be attributed to remaining funds.
The following tables detail the receipt, interest and use of the above contributions and levies and the value of all remaining funds which are ‘restricted’ in their future use.
SUMMARY OF CONTRIBUTIONS AND LEVIES
RoadsParkingRecreational spaceOther
Cumulative internal
borrowings due/(payable)
– –
– –
–
– 2,986
2,761
3 –
–
– 23
70
Non-cash
– – 7
–
–
– 74
Cash
51
Total S94 revenue under plans 225
–
105
– S94 contributions – under a plan
PURPOSE
– 16
S94 Fundstransferred from former Councils
earned
46
Contributionsreceived during the period
Interest
3
–
23 – 225 –
77
period
–
assetduring period
–
2,882
– 108
–
3
64
255
255
Expenditureborrowing
–
restricted(to)/from
during
–
– 7
–
3,137
–
–
Held asInternal
2
S64 contributions
Total contributions
71 7 – 2 – – 80 –

Financial Statements 2017
page 57
Snowy Valleys Council
Notes to the Financial Statements for the period 13 May 2016 to 30 June 2017
Note 17. Statement of developer contributions (continued)
$ ’000
S94 CONTRIBUTIONS – UNDER A PLAN
CONTRIBUTION PLAN NUMBER (former Tumut)
RoadsParkingRecreational spaceOther
Cumulative internal
borrowings due/(payable)
– –
– –
Contributions
105
PURPOSES94 Funds
transferred from former Councils
earned(to)/from
received during the periodExpenditure
during period
–
–
Cash
– 16
–
Non-cashborrowing
Interest
assetrestricted
–
Internal
3
Held as
–
64
255
periodduring
3 108 –
Total–
46 2 –
23 – 225 3 –
– –
– 7 –
71 7 – 2 – – 80 –
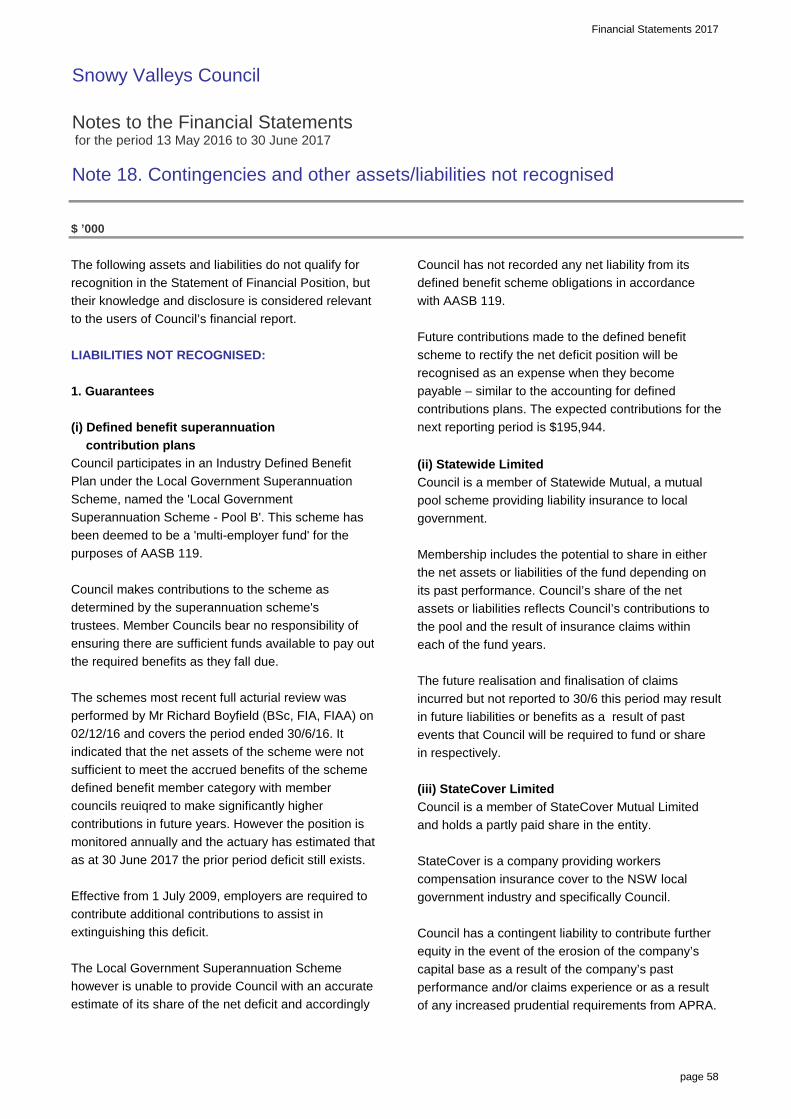
Financial Statements 2017
page 58
Snowy Valleys Council
Notes to the Financial Statements for the period 13 May 2016 to 30 June 2017
Note 18. Contingencies and other assets/liabilities not recognised
$ ’000
The following assets and liabilities do not qualify for Council has not recorded any net liability from itsrecognition in the Statement of Financial Position, but defined benefit scheme obligations in accordancetheir knowledge and disclosure is considered relevant with AASB 119.to the users of Council’s financial report.
Future contributions made to the defined benefitLIABILITIES NOT RECOGNISED: scheme to rectify the net deficit position will be
recognised as an expense when they become1. Guarantees payable – similar to the accounting for defined
contributions plans. The expected contributions for the (i) Defined benefit superannuation next reporting period is $195,944. contribution plansCouncil participates in an Industry Defined Benefit (ii) Statewide LimitedPlan under the Local Government Superannuation Council is a member of Statewide Mutual, a mutualScheme, named the 'Local Government pool scheme providing liability insurance to localSuperannuation Scheme - Pool B'. This scheme has government.been deemed to be a 'multi-employer fund' for thepurposes of AASB 119. Membership includes the potential to share in either
the net assets or liabilities of the fund depending onCouncil makes contributions to the scheme as its past performance. Council’s share of the netdetermined by the superannuation scheme's assets or liabilities reflects Council’s contributions totrustees. Member Councils bear no responsibility of the pool and the result of insurance claims withinensuring there are sufficient funds available to pay out each of the fund years.the required benefits as they fall due.
The future realisation and finalisation of claimsThe schemes most recent full acturial review was incurred but not reported to 30/6 this period may resultperformed by Mr Richard Boyfield (BSc, FIA, FIAA) on in future liabilities or benefits as a result of past02/12/16 and covers the period ended 30/6/16. It events that Council will be required to fund or shareindicated that the net assets of the scheme were not in respectively.sufficient to meet the accrued benefits of the schemedefined benefit member category with member (iii) StateCover Limitedcouncils reuiqred to make significantly higher Council is a member of StateCover Mutual Limitedcontributions in future years. However the position is and holds a partly paid share in the entity.monitored annually and the actuary has estimated thatas at 30 June 2017 the prior period deficit still exists. StateCover is a company providing workers
compensation insurance cover to the NSW localEffective from 1 July 2009, employers are required to government industry and specifically Council.contribute additional contributions to assist in extinguishing this deficit. Council has a contingent liability to contribute further
equity in the event of the erosion of the company’sThe Local Government Superannuation Scheme capital base as a result of the company’s pasthowever is unable to provide Council with an accurate performance and/or claims experience or as a resultestimate of its share of the net deficit and accordingly of any increased prudential requirements from APRA.

Financial Statements 2017
page 59
Snowy Valleys Council
Notes to the Financial Statements for the period 13 May 2016 to 30 June 2017
Note 18. Contingencies and other assets/liabilities not recognised (continued)
$ ’000
LIABILITIES NOT RECOGNISED (continued): (iii) Potential land acquisitions due to planning These future equity contributions would be required restrictions imposed by Councilto maintain the company’s minimum level of netassets in accordance with its licence requirements. Council has classified a number of privately owned
land parcels as local open space or bushland.(iv) Other guarantees
As a result, where notified in writing by the variousCouncil has provided no other guarantees other than owners, Council will be required to purchase thesethose listed above. land parcels.
At reporting date, reliable estimates as to the value2. Other liabilities of any potential liability (and subsequent land asset)
from such potential acquisitions has not been(i) Third party claims possible.
The Council is involved from time to time in variousclaims incidental to the ordinary course of business ASSETS NOT RECOGNISED:including claims for damages relating to its services.
(i) Land under roadsCouncil believes that it is appropriately coveredfor all claims through its insurance coverage and As permitted under AASB 1051, Council has electeddoes not expect any material liabilities to eventuate. not to bring to account land under roads that it
owned or controlled up to and including 30/6/08.(ii) S94 plans
(ii) Infringement notices/finesCouncil levies section 94/94A contributions uponvarious development across the Council area through Fines and penalty income, the result of Council the required contributions plans. issuing infringement notices is followed up and
collected by the Infringement Processing Bureau.As part of these plans, Council has received fundsfor which it will be required to expend the monies in Council’s revenue recognition policy for suchaccordance with those plans. income is to account for it as revenue on receipt.
As well, these plans indicate proposed future Accordingly, at period end, there is a potential assetexpenditure to be undertaken by Council, which will due to Council representing issued but unpaidbe funded by making levies and receipting funds in infringement notices. future years or where a shortfall exists by the use ofCouncil’s general funds. Due to the limited information available on the status,
value and duration of outstanding notices, Council isThese future expenses do not yet qualify as liabilities unable to determine the value of outstanding income.as of the reporting date, but represent Council’sintention to spend funds in the manner and timingset out in those plans.

Financial Statements 2017
page 60
Snowy Valleys Council
Notes to the Financial Statements for the period 13 May 2016 to 30 June 2017
Note 18. Contingencies and other assets/liabilities not recognised (continued)
$ ’000
ASSETS NOT RECOGNISED (continued):
(iii) Investment in Southern Phones
Council owns 2 ordinary (Class A) shares and 1 redeemable preference share (Class B to ZZ) of Southern Phones a Company Limited by shares.The net assets of Southern Phones at 30 June 2016was approximately $24.2 million. This represents anownership interest of approximately $955K.Financial Statements for Southern Phones for the period ended 30 June 2017 are not available.
As there is no active market for these shares and fairvalue cannot be reliably deteremined, Council has elected not to recognise the fair value of shares in their financial statements.
Financial Statements 2017
page 61
Snowy Valleys Council
Notes to the Financial Statements for the period 13 May 2016 to 30 June 2017
Note 19. Interests in other entities
$ ’000
Council’s objectives can and in some cases are best met through the use of separate entities and operations.
These operations and entities range from 100% ownership and control through to lower levels of ownershipand control via co-operative arrangements with other councils, bodies and other outside organisations.
The accounting and reporting for these various entities, operations and arrangements varies in accordancewith accounting standards, depending on the level of council’s (i) interest and (ii) control and the type (form) ofentity/operation, as follows;
Controlled entities (subsidiaries) Note 19(a)Operational arrangements where Council’s control (but not necessarily interest) exceeds 50%.
Joint ventures and associates Note 19(b)Joint ventures are operational arrangements where the parties that have joint control haverights to the net assets of the arrangement.Associates are separate entities where Council has significant influence over the operations(but neither controls nor jointly controls them).
Joint operations Note 19(c)Operational arrangements where the parties that have joint control have rights to specificassets and obligations for specific liabilities relating to the arrangement rather than a rightto the net assets of the arrangement.
Unconsolidated structured entities Note 19(d)Unconsolidated structured entities represent “special vehicles” that Council has an interestin but which are not controlled by Council and therefore not consolidated as a subsidiary,joint arrangement or associate. Attributes of structured entities include restricted activities,a narrow and well-defined objective and insufficient equity to finance its activities withoutfinancial support.
Subsidiaries, joint arrangements and associates not recognised Note 19(e)

Financial Statements 2017
page 62
Snowy Valleys Council
Notes to the Financial Statements for the period 13 May 2016 to 30 June 2017
Note 19. Interests in other entities (continued)
$ ’000
(a) Controlled entities (subsidiaries) – being entities and operations controlled by Council
Council has no interest in any controlled entities (subsidiaries).
(b) Joint ventures and associates
Council has no interest in any joint ventures or associates.
(c) Joint operations
Council has no interest in any joint operations.
(d) Unconsolidated structured entities
Council has no unconsolidated structured entities
(e) Subsidiaries, joint arrangements and associates not recognised
The following subsidiaries, joint arrangements and associates have not been recognised in this financial report.
Name of entity/operation Principal activity/type of entity
Riverina Regional Library 1 Provision of Library Services to member local government areas
Reasons for non-recognition1 Council holds 10.85% equity share in Riverina Library, and has assessed this as not material, hence not recognised.
13/5/16 to 30/6/17
$152k
Net profit Net assets2017
$4.2m

Financial Statements 2017
page 63
Snowy Valleys Council
Notes to the Financial Statements for the period 13 May 2016 to 30 June 2017
Note 20. Retained earnings, revaluation reserves, changes in accounting policies, changes in accounting estimates and errors
$ ’000
(a) Retained earnings
Movements in retained earnings were as follows:Balance at beginning of period (former Councils)a. Net result for the periodBalance at end of the reporting period
(b) Revaluation reserves
(i) Reserves are represented by:
– Infrastructure, property, plant and equipment revaluation reserveTotal
(ii) Reconciliation of movements in reserves:
Infrastructure, property, plant and equipment revaluation reserve– Opening balance (former Councils)– Revaluations for the period– Balance at end of period
TOTAL VALUE OF RESERVES
(iii) Nature and purpose of reserves
Infrastructure, property, plant and equipment revaluation reserve– The infrastructure, property, plant and equipment revaluation reserve is used to record increments/decrements of non-current asset values due to their revaluation.
(c) Correction of error/s relating to a previous reporting period
Council made no correction of errors during the current reporting period.
(d) Voluntary changes in accounting policies
Council made no voluntary changes in any accounting policies during the year.
1,757
9(a)
1,757
Actual 2017 Notes
603,949
1,757
603,949
–
–
1,757
1,757

Financial Statements 2017
page 64
Snowy Valleys Council
Notes to the Financial Statements for the period 13 May 2016 to 30 June 2017
Note 21. Financial result and financial position by fund
Income Statement by fund
$ ’000
Continuing operationsIncome from continuing operationsRates and annual chargesUser charges and feesInterest and investment revenueOther revenuesGrants and contributions provided for operating purposesGrants and contributions provided for capital purposesTotal income from continuing operations
Expenses from continuing operationsEmployee benefits and on-costsBorrowing costsMaterials and contractsDepreciation and amortisationOther expensesNet losses from the disposal of assetsTotal expenses from continuing operationsOperating result from continuing operations
Gain on local government amalgamation
Assets and liabilities transferred from former councilsNet result for the period
Net result attributable to each council fundNet result attributable to non-controlling interests
Net operating result for the period before grantsand contributions provided for capital purposes
1 General fund refers to all Council’s activities other than Water and Sewer. NB. All amounts disclosed above are gross – that is, they include internal charges and recoveries made between the funds.
56,931 66,696 471,271 54,585 67,108 482,256
388 (1,042)
217
Actual
67,108
16,741
4,852
9,163
97
10,985
1,734
–
7,462 412
1,446
Sewer
– –
(2,393)
2,944
243
17,567
13/5/16 to 30/6/17
4,383
13/5/16 to 30/6/17
24 12,027
221
6
1,009 7 18,910
Water
3
482,256
4,440
General1
1,522
5,116
50,618 (2,346)
54,585
47
17,237
61,603
2,168 5,066
934
1,427
340 901
334
107
Actual
1,379 114
1,148 3,449
13/5/16 to 30/6/17
Actual
90
144
10,942

Financial Statements 2017
page 65
Snowy Valleys Council
Notes to the Financial Statements as at 30 June 2017
Note 21. Financial result and financial position by fund (continued)
Statement of Financial Position by fund$ ’000
ASSETSCurrent assetsCash and cash equivalentsInvestmentsReceivablesInventoriesOtherNon-current assets classified as ‘held for sale’Total current assets
Non-current assetsReceivablesInventoriesInfrastructure, property, plant and equipmentIntangible assetsTotal non-current assetsTOTAL ASSETS
LIABILITIESCurrent liabilitiesPayablesBorrowingsProvisionsTotal current liabilities
Non-current liabilitiesBorrowingsProvisionsTotal non-current liabilitiesTOTAL LIABILITIESNet assets
EQUITYRetained earningsRevaluation reservesCouncil equity interestNon-controlling interestsTotal equity1 General Fund refers to all Council’s activities other than Water and Sewer. NB. All amounts disclosed above are gross – that is, they include internal receivables and payables between the funds.
54,457
638
54,571 –
563
68,214 482,921
Water
72
Actual
54,457
–
2017
482,921
–
482,921 54,571 68,214
Actual
448,681
447,217
1,119
412
2,930
1,080 –
494,398
2,077 28
–
262 5,746
3,242 3,536
54,571
65,662
1,013 31,435
–
237 –
4,636
1,952 1,671
6,378
147 – 65,662
–
2017
404
49
45,717
3,826
4,651
2017
–
–
–
3,277
–
2,697
509
560
8,235
–
Actual
Sewer
3,536
72,040
–
– –
11,477
– 290
–
312
482,283
54,571
67,095
4,522
– 3,959
68,214
3,959
59,093
54
General1
8,950

Financial Statements 2017
page 66
Snowy Valleys Council
Notes to the Financial Statements for the period 13 May 2016 to 30 June 2017
Note 22. ‘Held for sale’ non-current assets and disposal groups
$ ’000
(i) Non-current assets and disposal group assets
Non-current assets ‘held for sale’LandTotal non-current assets ‘held for sale’
Disposal group assets ‘held for sale’None
TOTAL NON-CURRENT ASSETSCLASSIFIED AS ‘HELD FOR SALE’
(ii) Details of assets and disposal groupsNil
(iii) Disposal group liabilities
Disposal group related liabilities ‘held for sale’Nil
$ ’000
(iii) Reconciliation of non-current assets ‘held for sale’
Opening balance (former Councils)Less: carrying value of assets/operations soldBalance still unsold after 12 months:Closing balance of ‘held for sale’non-current assets and operations
Refer to Note 27. Fair value measurement for fair value measurement information.
–
Assets ‘held for sale’
Disposal groups
– 72
72
Non-current
2017
–
–
2017
72
72 –
2017 2017
– 72 –
Current
–
72

Financial Statements 2017
page 67
Snowy Valleys Council
Notes to the Financial Statements for the period 13 May 2016 to 30 June 2017
Note 23. Events occurring after the reporting date
$ ’000
Events that occur between the end of the reporting period (30 June 2017) and the date when the financialstatements are ‘authorised for issue’ have been taken into account in preparing these statements.
Council has adopted the date of receipt of the Auditors’ Report as the applicable ‘authorised for issue’ daterelating to these General Purpose Financial Statements.
Accordingly, the ‘authorised for issue’ date is 26/10/17.
Events that occur after the reporting period represent one of two types:
(i) Events that provide evidence of conditions that existed at the reporting period
These financial statements (and the figures therein) incorporate all ‘adjusting events’ that provided evidenceof conditions that existed at 30 June 2017.
(ii) Events that provide evidence of conditions that arose after the reporting period
These financial statements (and figures therein) do not incorporate any ‘non-adjusting events’ that haveoccurred after 30 June 2017 and which are only indicative of conditions that arose after 30 June 2017.
Council is unaware of any material or significant ‘non-adjusting events’ that should be disclosed.

Financial Statements 2017
page 68
Snowy Valleys Council
Notes to the Financial Statements for the period 13 May 2016 to 30 June 2017
Note 24. Discontinued operations
Council has not classified any of its operations as ‘discontinued’.
Note 25. Intangible assets
$ ’000
Intangible assets represent identifiable non-monetary assets without physical substance.
Intangible assets are as follows:
Opening values (former Councils):Gross book valueAccumulated amortisationAccumulated impairmentNet book value – opening balance (former Councils)
Movements for the period– Development costs
– Amortisation charges
Closing values:Gross book value (30/6)Accumulated amortisation (30/6)Accumulated impairment (30/6)
TOTAL INTANGIBLE ASSETS – NET BOOK VALUE 1
1. The net book value of intangible assets represent:
– Software1,080
1,579
1,080
1,080
Actual
(69) 1,257
1,577
(179)
(251)
2
1,080
2017
(430) (69)
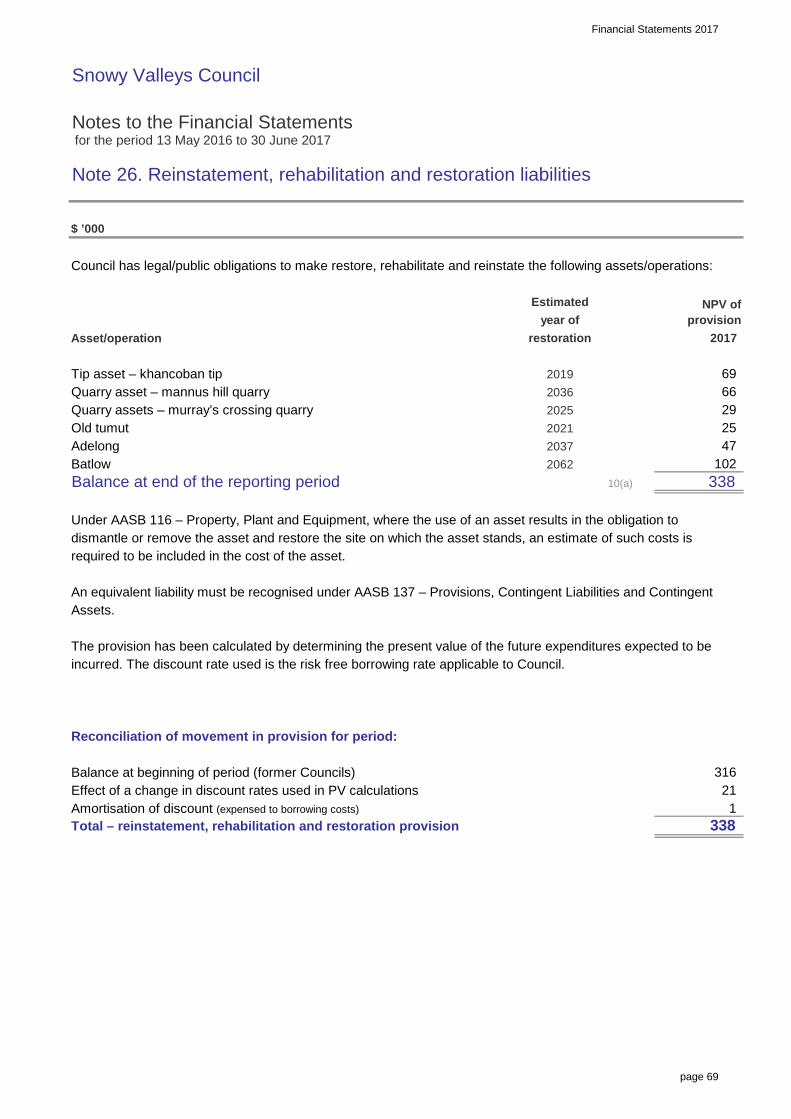
Financial Statements 2017
page 69
Snowy Valleys Council
Notes to the Financial Statements for the period 13 May 2016 to 30 June 2017
Note 26. Reinstatement, rehabilitation and restoration liabilities
$ ’000
Council has legal/public obligations to make restore, rehabilitate and reinstate the following assets/operations:
Asset/operation
Tip asset – khancoban tipQuarry asset – mannus hill quarryQuarry assets – murray’s crossing quarryOld tumutAdelongBatlowBalance at end of the reporting period
Under AASB 116 – Property, Plant and Equipment, where the use of an asset results in the obligation todismantle or remove the asset and restore the site on which the asset stands, an estimate of such costs isrequired to be included in the cost of the asset.
An equivalent liability must be recognised under AASB 137 – Provisions, Contingent Liabilities and ContingentAssets.
The provision has been calculated by determining the present value of the future expenditures expected to beincurred. The discount rate used is the risk free borrowing rate applicable to Council.
Reconciliation of movement in provision for period:
Balance at beginning of period (former Councils)Effect of a change in discount rates used in PV calculationsAmortisation of discount (expensed to borrowing costs)Total – reinstatement, rehabilitation and restoration provision
year of
2019
2025
21
2036
10(a)
316
NPV of provision
2017
Estimated
restoration
66 29
338
338
25 2037 47 2062
69
102
1
2021

Financial Statements 2017
page 70
Snowy Valleys Council
Notes to the Financial Statements for the period 13 May 2016 to 30 June 2017
Note 26. Reinstatement, rehabilitation and restoration liabilities (continued)
$ ’000
Amount of expected reimbursements
Of the above provisions for reinstatement, rehabilitation and restoration works, those applicable to garbageservices and waste management are able to be funded through future charges incorporated within Council’sannual domestic waste management charge.
Provisions for close down and restoration and for environmental clean up costs – tips and quarries
RestorationClose down and restoration costs include the dismantling and demolition of infrastructure and the removal ofresidual materials and remediation of disturbed areas. Estimated close down and restoration costs are providedfor in the accounting period when the obligation arising from the related disturbance occurs, whether this occursduring the development or during the operation phase, based on the net present value of estimated future costs.
Provisions for close down and restoration costs do not include any additional obligations which are expected toarise from future disturbance. The costs are estimated on the basis of a closure plan. The cost estimates are calculated annually during the life of the operation to reflect known developments, eg updated cost estimatesand revisions to the estimated lives of operations, and are subject to formal review at regular intervals
Close down and restoration costs are a normal consequence of tip and quarry operations, and the majority ofclose down and restoration expenditure is incurred at the end of the life of the operations. Although the ultimatecost to be incurred is uncertain, Council estimates the respective costs based on feasibility and engineeringstudies using current restoration standards and techniques.
Other movements in the provisions for close down and restoration costs, including those resulting from newdisturbance, updated cost estimates, changes to the estimated lives of operations and revisions to discountrates are capitalised within property, plant and equipment. These costs are then depreciated over the lives of theassets to which they relate.
RehabilitationWhere rehabilitation is conducted systematically over the life of the operation, rather than at the time of closure,provision is made for the estimated outstanding continuous rehabilitation work at each reporting date and thecost is charged to the Income Statement.
Provision is made for the estimated present value of the costs of environmental clean up obligations outstandingat the reporting date. These costs are charged to the Income Statement. Movements in the environmental cleanup provisions are presented as an operating cost, except for the unwinding of the discount which is shown as a borrowing cost.
Remediation procedures generally commence soon after the time the damage, remediation process and estimated remediation costs become known, but may continue for many years depending on the nature of the disturbance and the remediation techniques.
As noted above, the ultimate cost of environmental remediation is uncertain and cost estimates can vary inresponse to many factors including changes to the relevant legal requirements, the emergence of newrestoration techniques or experience at other locations. The expected timing of expenditure can also change, forexample in response to changes in quarry reserves or production rates. As a result there could be significantadjustments to the provision for close down and restoration and environmental clean up, which would affectfuture financial results.

Financial Statements 2017
page 71
Snowy Valleys Council
Notes to the Financial Statements for the period 13 May 2016 to 30 June 2017
Note 27. Fair value measurement
$ ’000
The Council measures the following asset and liability classes at fair value on a recurring basis:
– Infrastructure, property, plant and equipment
During the reporting period, Council has also fair value measured the following assets on a non-recurring basis:
– Non-current assets classified as ‘held for sale’
The fair value of assets and liabilities must be estimated in accordance with various accounting standards foreither recognition and measurement requirements or for disclosure purposes.
AASB 13 Fair Value Measurement requires all assets and liabilities measured at fair value to be assigned to a‘level’ in the fair value hierarchy as follows:
Level 1: Unadjusted quoted prices in active markets for identical assets or liabilities that the entity can access at the measurement date.
Level 2: Inputs other than quoted prices included within level 1 that are observable for the asset or liability, either directly or indirectly.
Level 3: Inputs for the asset or liability that are not based on observable market data (unobservable inputs).

Financial Statements 2017
page 72
Snowy Valleys Council
Notes to the Financial Statements for the period 13 May 2016 to 30 June 2017
Note 27. Fair value measurement (continued)
$ ’000
(1) The following table presents all assets and liabilities that have been measured and recognised at fair values:
13/5/16 to 30/6/17
Recurring fair value measurements
Infrastructure, property, plant and equipmentPlant and EquipmentOffice Equipment Furntiure and fittingsOperational LandCommunity LandBulk EarthworksLand improvements - depreciableBuildings - non-specialisedBuildings - specialisedOther StructuresRoadsBridges FootpathsKerb and GutterLand Improvements non-depreciableWater InfrastructureSewerage InfrastructureHeritage collectionOther AssetsOther infrastructureOther open space/recreational assetsCapital work in progressTips and quarriesDrainage InfrastructureTotal infrastructure, property, plant and equipment
Non-recurring fair value measurements
Non-current assets classified as ‘held for sale’Surplus Lands AdelongTotal NCA’s classified as ‘held for sale’
(2) Transfers between level 1 and level 2 fair value hierarchies
During the period, there were no transfers between level 1 and level 2 fair value hierarchies for recurring fairvalue measurements.
Significant
– 4,161 4,161
– 51,402 51,402 30/06/17 – – 64,492 64,492
13/05/16 –
13/05/16
valuation active mktsof latest
– – 5,060 5,060
13/05/16
unobservable
Level 3 TotalDate Quoted Significant
Fair value measurement hierarchyLevel 1 Level 2
observableprices ininputs
– 574
35,128
– – 7,645
35,128
72 72
inputs
–
– – 11,745 11,745 – 574 13/05/16
13/05/16 – –
– –
13/05/16 – – 10,189 10,189 13/05/16 –
13/05/16 – – 407 407
– – 1,052 1,052 30/06/17 –
7,645 13/05/16 – – 13,612 13,612 13/05/16 – – 107,813 107,813 13/05/16 – – 2,902 2,902
7,793 13/05/16 – – 32,200 32,200 13/05/16 – –
13/05/16
– – 11,780 11,780
– – 567,336 567,336 13/05/16 – –
13/05/16
30/06/15 – – 72 72
177,081 177,081
21,398 21,398
7,793
–
13/05/16
13/05/16 – – 154 154
13/05/16 – – 162 162 13/05/16 – – 239 239
– 28 28 13/05/16 – – 319 319 13/05/16

Financial Statements 2017
Snowy Valleys Council
Notes to the Financial Statements for the period 13 May 2016 to 30 June 2017
Note 27. Fair value measurement (continued)
page 73
(3) Valuation techniques used to derive level 2 and level 3 fair values Where Council is unable to derive fair valuations using quoted market prices of identical assets (i.e. level 1 inputs), Council instead utilises a spread of both observable inputs (level 2 inputs) and unobservable inputs (level 3 inputs). The fair valuation techniques Council has employed while utilising level 2 and level 3 inputs are as follows: Infrastructure, property, plant and equipment Plant and Equipment, Office Equipment and Furniture and Fittings Plant and Equipment, Office Equipment and Furniture and Fittings are valued at cost but are disclosed at fair value in the notes. The carrying amount of these assets is assumed to approximate fair value due to the nature of the items (being readily sourced and replaceable).
The key unobservable inputs to the valuation are the remaining useful life and remaining value. Council reviews these assets against replacement costs of similar assets. There has been no change to the valuation process during the reporting period.
Typical assets within these classes include, plant/equipment - trucks, cars, mowers, graders, rollers, loaders, office equipment – computers, printers, furniture/fittings – work desks/chairs Stormwater assets Stormwater assets are valued using the cost approach but are disclosed at fair value in the notes. These assets typically include pipes/conduits, pits, headwalls located in urban areas.
The key unobservable inputs to the valuation are the remaining useful life, condition and remaining value. Replacement costs are compiled ‘in house’ by experienced engineers and are calculated by either applying recent actual project costs or by sourcing supplier component costs and then estimating project costs. When estimating project costs, consideration is given to project specifications, location, site conditions and construction techniques. Unit rates for box culverts range from $626 to $4,351/m, for reinforced and uPVC pipes from $45 to $2,208/m, for headwalls from $144 to $6,795/unit and for pits from $225 to $21,568/unit.
There has been no change to the valuation process during the reporting period. Other structure assets Other structure assets are valued using the cost approach but are disclosed at fair value in the notes. These assets typically include retaining walls, shelters, swimming pools. Where possible larger assets such as swimming pools are componentised into significant parts. The key unobservable inputs to the valuation are the remaining useful life, condition and remaining value. Replacement costs are compiled ‘in house’ by experienced engineers and are calculated by either applying recent actual project costs or by sourcing supplier component costs and then estimating project costs.
When estimating project costs, consideration is given to project specifications, location, site conditions and construction techniques. Unit rates for retaining walls range from $224 to $1,740/m2 and for shelters from $280 to $86,700/unit.
There has been no change to the valuation process during the reporting period. Land improvement depreciable and non-depreciable assets These assets are valued using the cost approach but are disclosed at fair value in the notes. These assets typically include playing fields, playground equipment, tables /seats.
The key unobservable inputs to the valuation are the remaining useful life, condition and remaining value. Replacement costs are compiled ‘in house’ by experienced engineers and are calculated by either applying recent actual project costs or by sourcing supplier component costs and then estimating project costs.

Financial Statements 2017_
Snowy Valleys Council
Notes to the Financial Statements for the period 13 May 2016 to 30 June 2017
Note 27. Fair value measurement (continued)
page 74
When estimating project costs, consideration is given to project specifications, location, site conditions and construction techniques. Unit rates include $40/m3 for ground works, for tracks/paths range from $20 to $189/m2 and for play equipment from $1,120 to $47,459/unit.
There has been no change to the valuation process during the reporting period. Operational and Community land assets These assets are valued using the cost approach but are disclosed at fair value in the notes. These assets typically include saleable Operational Land such as land associated with works depot, offices and non-saleable Community Land associated with town commons, parks. The key unobservable inputs to the valuation are the remaining useful life, condition and remaining value. Replacement costs are either sourced from actual recent purchase costs, from qualified valuers or from Valuer-General Unimproved Capital Values. Unit rates range from $0.64 to $4,455/m2.
There has been no change to the valuation process during the reporting period. Buildings – non specialised and specialised assets These assets are valued using the cost approach but are disclosed at fair value in the notes. These assets typically include Council offices (non specialised) and water/sewer treatment plant buildings (specialised).
The key unobservable inputs to the valuation are the remaining useful life, condition and remaining value. Replacement costs are compiled ‘in house’ by experienced engineers and are calculated by either applying recent actual project costs or by sourcing supplier component costs and then estimating project costs. Alternatively, quotations can be sourced from qualified professionals.
Buildings are componentised into significant parts to assist in applying appropriate useful lives and replacement costs.
When estimating project costs, consideration is given to project specifications, location, site conditions and construction techniques. Unit rates for roofs range from $158 to $311/m2, for internal floors from $50 to $181/m2, for external walls from $308 to $805 and for mechanical components from $10,546 to $78,552/unit.
There has been no change to the valuation process during the reporting period. Road assets Road assets are valued using the cost approach but are disclosed at fair value in the notes. These assets typically include sealed/unsealed pavements, surfaces (bituminous seals, asphaltic concrete), kerb and gutter, safety barriers, culverts.
The key unobservable inputs to the valuation are the remaining useful life, condition and remaining value. Replacement costs are compiled ‘in house’ by experienced engineers and are calculated by either applying recent actual project costs or by sourcing supplier component costs and then estimating project costs. Where applicable contract rates are applied (eg, surface assets).
Roads/surfaces/kerb assets are segmented into manageable lengths and uniform specifications.
When estimating project costs, consideration is given to project specifications, location, site conditions and construction techniques. Unit rates for unsealed pavement range from $1.66 to $12.03/m2, for sealed pavements from $2.13 to $88.47/m2, for surface assets from $2.07 to $200/m2, for kerb and gutter assets from $86 to $313/m and for rural road culverts from $168 to $12,500/m.
There has been no change to the valuation process during the reporting period. Bridge assets Bridge assets are valued using the cost approach but are disclosed at fair value in the notes. These assets typically include concrete/steel bridges. Although some timber bridges are still in use, they are being progressively phased out.
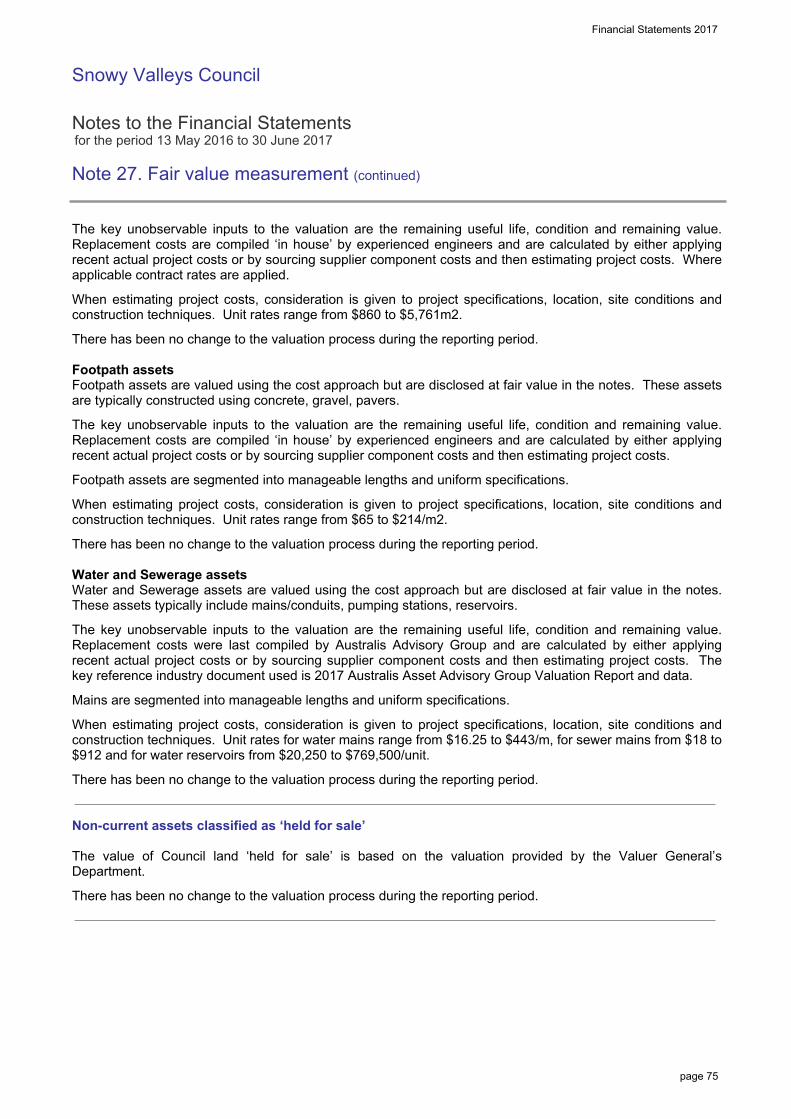
Financial Statements 2017_
Snowy Valleys Council
Notes to the Financial Statements for the period 13 May 2016 to 30 June 2017
Note 27. Fair value measurement (continued)
page 75
The key unobservable inputs to the valuation are the remaining useful life, condition and remaining value. Replacement costs are compiled ‘in house’ by experienced engineers and are calculated by either applying recent actual project costs or by sourcing supplier component costs and then estimating project costs. Where applicable contract rates are applied.
When estimating project costs, consideration is given to project specifications, location, site conditions and construction techniques. Unit rates range from $860 to $5,761m2.
There has been no change to the valuation process during the reporting period. Footpath assets Footpath assets are valued using the cost approach but are disclosed at fair value in the notes. These assets are typically constructed using concrete, gravel, pavers.
The key unobservable inputs to the valuation are the remaining useful life, condition and remaining value. Replacement costs are compiled ‘in house’ by experienced engineers and are calculated by either applying recent actual project costs or by sourcing supplier component costs and then estimating project costs.
Footpath assets are segmented into manageable lengths and uniform specifications.
When estimating project costs, consideration is given to project specifications, location, site conditions and construction techniques. Unit rates range from $65 to $214/m2.
There has been no change to the valuation process during the reporting period. Water and Sewerage assets Water and Sewerage assets are valued using the cost approach but are disclosed at fair value in the notes. These assets typically include mains/conduits, pumping stations, reservoirs.
The key unobservable inputs to the valuation are the remaining useful life, condition and remaining value. Replacement costs were last compiled by Australis Advisory Group and are calculated by either applying recent actual project costs or by sourcing supplier component costs and then estimating project costs. The key reference industry document used is 2017 Australis Asset Advisory Group Valuation Report and data.
Mains are segmented into manageable lengths and uniform specifications.
When estimating project costs, consideration is given to project specifications, location, site conditions and construction techniques. Unit rates for water mains range from $16.25 to $443/m, for sewer mains from $18 to $912 and for water reservoirs from $20,250 to $769,500/unit.
There has been no change to the valuation process during the reporting period. Non-current assets classified as ‘held for sale’ The value of Council land ‘held for sale’ is based on the valuation provided by the Valuer General’s Department.
There has been no change to the valuation process during the reporting period.

Financial Statements 2017
page 76
Snowy Valleys Council
Notes to the Financial Statements for the period 13 May 2016 to 30 June 2017
Note 27. Fair value measurement (continued)
$ ’000
(4). Fair value measurements using significant unobservable inputs (level 3)
a. The following tables present the changes in level 3 fair value asset classes.
Balance on transfer from former CouncilsTransfers from/(to) another asset classPurchases (GBV)Disposals (WDV)Depreciation and impairmentRevaluations to equityClosing balance – 30/6/17
Balance on transfer from former CouncilsTransfers from/(to) another asset classPurchases (GBV)Disposals (WDV)Depreciation and impairmentFV gains – other comprehensive incomeRevaluations to equityClosing balance – 30/6/17
Balance on transfer from former CouncilsTransfers from/(to) another asset classPurchases (GBV)Disposals (WDV)Depreciation and impairmentFV gains – other comprehensive incomeRevaluations to equityClosing balance – 30/6/17
Balance on transfer from former CouncilsTransfers from/(to) another asset classPurchases (GBV)Disposals (WDV)Depreciation and impairmentClosing balance – 30/6/17
31,505
Land
20,371
Office
Land and Other Bridges & Roads,Buildings
Total
6,034
1,781 8 1,039
(297) –
(18) (3)
Community
Structures
14 –
(271)
– – 1,789
– –
3,494 157 9
(5)
(15,840) –
Total
3,954
3,170 158
Footpaths
7,645
10
equipment Equipment fittings land TotalPlant and Furniture & Operational
(1,427)
603 (9,313) 4 1 (10) 2,427 50 –
451 7,649
38 – –
15
network
22,802
– (2,872) –
Drainage supply
–
– (47) (2,744) (83) (45)
(2,543) – – –
(74) (2)
Assets and collection
162 154
702 –
4
1,053
(5)
Quarries
–
13,844 5,490
5,109
(13,612)
(5,111)
83
1,216 –
Total
Stormwater Water Sewerage
– 103 50 350 503 13,612
63,508
network
–
7,678
Earthworks
37,227 43
64,492 245,105
1,997 5,598
20,994
97 –
(370) (1,282) (116) (6,781)
(242)
(137)
93
51,402
Bulk
282 2,017
Tips
(61) (332) (1,041)
1,119
LibraryHeritagebooks
(2,195)
224,095 22,652
607 426 17,407
– (1,554) –
107,068
Other
(5)
58,806
5,714
(242)
(633) 229,020
(822)
107,813 21,398
(2,543)
(1,605)
(1)
provements
11,745 574 407 38
(9,318) 2,492
(1,474)
–
49,478 228,854 295,898
– –
(911)
311,862

Financial Statements 2017_
Snowy Valleys Council
Notes to the Financial Statements for the period 13 May 2016 to 30 June 2017
Note 27. Fair value measurement (continued)
page 77
(4). Fair value measurements using significant unobservable inputs (level 3) b. Significant unobservable valuation inputs used (for level 3 asset classes) and their relationship to fair value. The following table summarises the quantitative information relating to the significant unobservable inputs used in deriving the various level 3 asset class fair values.
I,PP&E
Class
Fair value (30/6/17)
$’000
Valuation technique/s
Unobservable inputs
Operational Land 7,645 Land values Cost per sq meter, Valuer General’s Valuation Community Land 13,612 Land values Cost per sq meter, Valuer General’s Valuation Building and other Structures
49,478 Gross replacement cost Cost per unit, pattern of consumption, useful life, asset condition
Road, bridges and footpaths
228,854 Gross replacement cost Cost per sq metre, dimensions and specification, pattern of consumption, components, useful life, residual value, asset condition
Bulk earthworks 107,813 Gross replacement cost Cost per cubic metre Stormwater Drainage
21,398 Gross replacement cost Cost per unit per metre, pattern of consumption
Water supply network
51,402 Gross replacement cost Unit rates, pattern of consumption, components, useful life, residual value, asset condition
Sewerage network 64,492 Gross replacement cost Unit rates, pattern of consumption, components, useful life, residual value, asset condition
Non-current assets classified as ‘held for sale’
Class
Fair value (30/6/17)
$’000
Valuation technique/s
Unobservable inputs
Surplus Land 72 Land Values Cost per sq meter, Valuer General’s valuation
c. The valuation process for level 3 fair value measurements Council assesses the expertise required for the valuation of all assets classes in determining who will undertake the valuations. A qualified external valuer is used were required. Operational and Community Land is valued using the Valuer Generals valuation. Management reviews valuation reports for consistency and accuracy and to ensure all valuation movements are fully explained. (5). Highest and best use All of Council’s non-financial assets are considered to being utilised for their highest and best use.
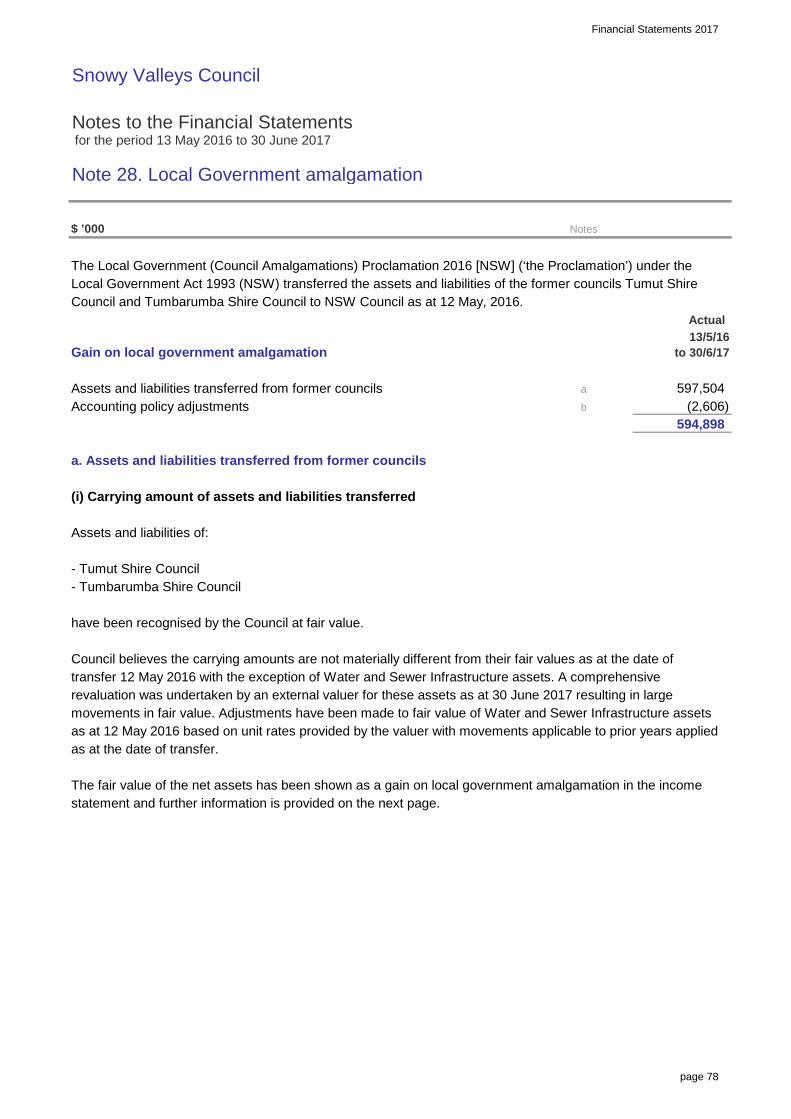
Financial Statements 2017
page 78
Snowy Valleys Council
Notes to the Financial Statements for the period 13 May 2016 to 30 June 2017
Note 28. Local Government amalgamation
$ ’000
The Local Government (Council Amalgamations) Proclamation 2016 [NSW] (‘the Proclamation’) under theLocal Government Act 1993 (NSW) transferred the assets and liabilities of the former councils Tumut ShireCouncil and Tumbarumba Shire Council to NSW Council as at 12 May, 2016.
Gain on local government amalgamation
Assets and liabilities transferred from former councilsAccounting policy adjustments
a. Assets and liabilities transferred from former councils
(i) Carrying amount of assets and liabilities transferred
Assets and liabilities of:
- Tumut Shire Council- Tumbarumba Shire Council
have been recognised by the Council at fair value.
Council believes the carrying amounts are not materially different from their fair values as at the date oftransfer 12 May 2016 with the exception of Water and Sewer Infrastructure assets. A comprehensiverevaluation was undertaken by an external valuer for these assets as at 30 June 2017 resulting in largemovements in fair value. Adjustments have been made to fair value of Water and Sewer Infrastructure assetsas at 12 May 2016 based on unit rates provided by the valuer with movements applicable to prior years appliedas at the date of transfer.
The fair value of the net assets has been shown as a gain on local government amalgamation in the incomestatement and further information is provided on the next page.
b (2,606) 594,898
Actual 13/5/16
to 30/6/17
597,504
Notes
a
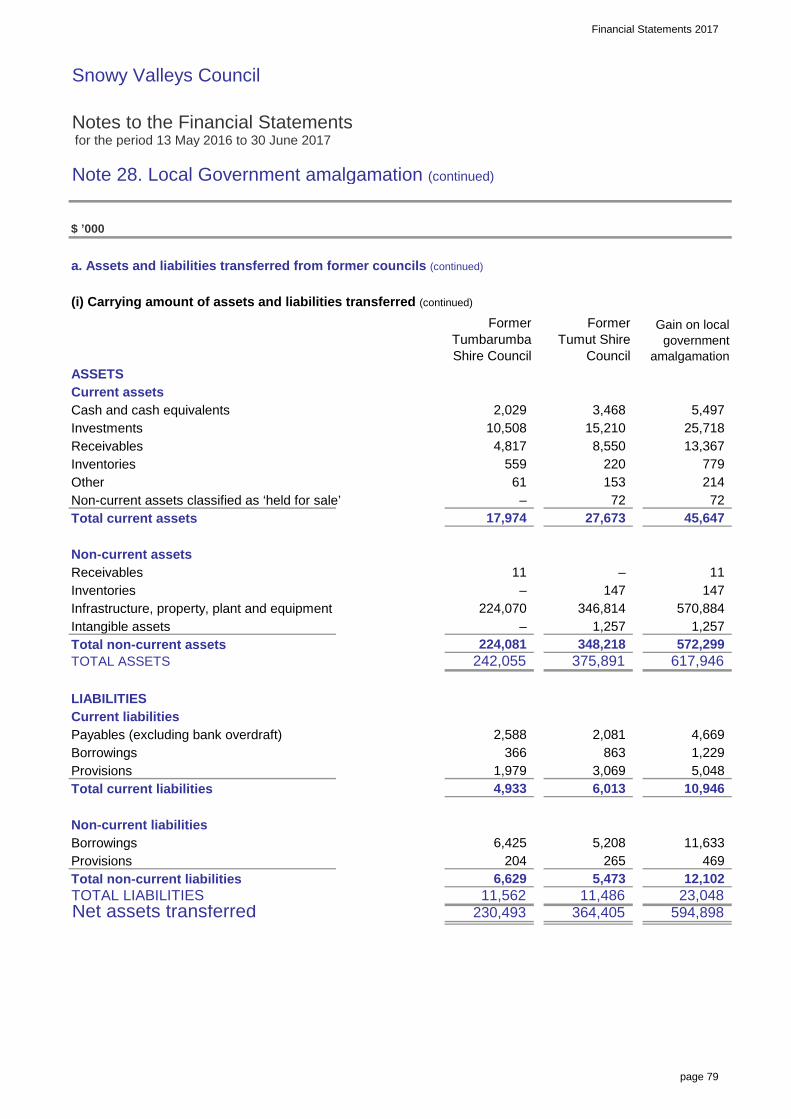
Financial Statements 2017
page 79
Snowy Valleys Council
Notes to the Financial Statements for the period 13 May 2016 to 30 June 2017
Note 28. Local Government amalgamation (continued)
$ ’000
a. Assets and liabilities transferred from former councils (continued)
(i) Carrying amount of assets and liabilities transferred (continued)
ASSETSCurrent assetsCash and cash equivalentsInvestmentsReceivablesInventoriesOtherNon-current assets classified as ‘held for sale’Total current assets
Non-current assetsReceivablesInventoriesInfrastructure, property, plant and equipmentIntangible assetsTotal non-current assetsTOTAL ASSETS
LIABILITIESCurrent liabilitiesPayables (excluding bank overdraft)BorrowingsProvisionsTotal current liabilities
Non-current liabilitiesBorrowingsProvisionsTotal non-current liabilitiesTOTAL LIABILITIESNet assets transferred
Former Tumbarumba Shire Council
Former Tumut Shire
Council
Gain on local government
amalgamation
6,425
11 –
2,588 366
1,979
224,081 242,055 375,891 617,946
863
4,933
– 147
2,081
– 224,070
5,208
11 147
4,669 1,229
3,069 5,048
348,218 572,299
6,013 10,946
11,633
1,257 1,257 346,814 570,884
11,562 11,486 23,048 230,493 364,405 594,898
6,629 5,473 12,102
17,974 27,673 45,647
61 153 214 – 72 72
559 220 779
5,497 25,718 13,367
2,029 10,508 4,817
3,468 15,210 8,550
204 265 469

Financial Statements 2017
page 80
Snowy Valleys Council
Notes to the Financial Statements for the period 13 May 2016 to 30 June 2017
Note 28. Local Government amalgamation (continued)
$ ’000
(ii) Adjustments between former council carrying amount of assets and fair values recognised
The following adjustments were made to the carrying amount of the assets and liabilities received as part of the amalgamation in order to recognise them at fair value at the proclamation date.
Adjustments made to recognise net assets at fair value
Changes in asset values due to comprehensive valuation process - Water InfrastructureChanges in asset values due to comprehensive valuation process - Sewer InfrastructureTotal adjustments
(iii) Rates and Non-Reciprocal Grants income
The rates and non-reciprocal grants revenue for the period from 12 May to 30 June 2016were recorded in the financial statements of the former councils in accordance with AASB 1004 Contributions.
The assets transferred to Council include a portion of rates and non-reciprocal grants that were received butrelated to the period after the former councils ceased to exist.
(2,606)
(8,785) 6,179
Actual12/05/16

Financial Statements 2017
page 81
Snowy Valleys Council
Notes to the Financial Statements for the period 13 May 2016 to 30 June 2017
Note 29. Council information and contact details
Principal place of business:76 Capper St Tumut NSW 2720 andWinton St, Tumbarumba NSW
Contact detailsMailing address: Opening hours:76 Capper St Tumut NSW 2720 8:30 am - 4:30 pm
Telephone: 02 6947 2555 Internet:Facsimile: Email:
Officers Elected membersINTERIM GENERAL MANAGER MAYORDavid Aber James Hayes
RESPONSIBLE ACCOUNTING OFFICER COUNCILLORSSarah Pentland John Larter (Deputy Mayor)
Andrianna BenjaminPUBLIC OFFICER Cate CrossRobyn Harvey Julia Ham
Margaret IsselmanAUDITORS Geoff PritchardNSW Audit Office Cor SmitLevel 15, 1 Margaret St Bruce WrightSydney NSW 2000
Other informationABN: 53 558 891 887

INDEPENDENT AUDITOR’S REPORT
Report on the general purpose financial statements
Snowy Valleys Council
To the Councillors of Snowy Valleys Council
Opinion
I have audited the accompanying financial statements of Snowy Valleys Council (the Council), which
comprise the statement of financial position as at 30 June 2017, the income statement, the statement
of comprehensive income, statement of changes in equity and statement of cash flows for the period
13 May 2016 to 30 June 2017, notes comprising a summary of significant accounting policies and
other explanatory information, and the Statement by Councillors and Management.
In my opinion,
• the Council’s accounting records have been kept in accordance with the requirements of the
Local Government Act 1993, Chapter 13, Part 3, Division 2 (the Division)
• the financial statements:
- have been presented, in all material respects, in accordance with the requirements of this
Division
- are consistent with the Council’s accounting records
present fairly, in all material respects, the financial position of the Council as at
30 June 2017, and of its financial performance and its cash flows for the period
13 May 2016 to 30 June 2017 in accordance with Australian Accounting Standards
• all information relevant to the conduct of the audit has been obtained
• no material deficiencies in the accounting records or financial statements have come to light
during the audit.
My opinion should be read in conjunction with the rest of this report.
Basis for Opinion
I conducted my audit in accordance with Australian Auditing Standards. My responsibilities under the
standards are described in the ‘Auditor’s Responsibilities for the Audit of the Financial Statements’
section of my report.
I am independent of the Council in accordance with the requirements of the:
• Australian Auditing Standards
• Accounting Professional and Ethical Standards Board’s APES 110 ‘Code of Ethics for
Professional Accountants’ (APES 110).
I have fulfilled my other ethical responsibilities in accordance with APES 110.
Parliament promotes independence by ensuring the Auditor-General and the Audit Office of
New South Wales are not compromised in their roles by:
• providing that only Parliament, and not the executive government, can remove an
Auditor-General

2
• mandating the Auditor-General as auditor of councils
• precluding the Auditor-General from providing non-audit services.
I believe the audit evidence I have obtained is sufficient and appropriate to provide a basis for my
audit opinion.
The Councillors’ Responsibility for the Financial Statements
The Councillors are responsible for the preparation and fair presentation of the financial statements in
accordance with Australian Accounting Standards and the Local Government Act 1993, and for such
internal control as the Councillors determine is necessary to enable the preparation and fair
presentation of the financial statements that are free from material misstatement, whether due to fraud
or error.
In preparing the financial statements, the Councillors must assess the Council’s ability to continue as a
going concern except where the Council will be dissolved or amalgamated by an Act of Parliament.
The assessment must disclose, as applicable, matters related to going concern and the
appropriateness of using the going concern basis of accounting.
Auditor’s Responsibility for the Audit of the Financial Statements
My objectives are to:
• obtain reasonable assurance about whether the financial statements as a whole are free from
material misstatement, whether due to fraud or error
• issue an Independent Auditor’s Report including my opinion.
Reasonable assurance is a high level of assurance, but does not guarantee an audit conducted in
accordance with Australian Auditing Standards will always detect material misstatements.
Misstatements can arise from fraud or error. Misstatements are considered material if, individually or in
aggregate, they could reasonably be expected to influence the economic decisions users take based
on the financial statements.
A description of my responsibilities for the audit of the financial statements is located at the Auditing
and Assurance Standards Board website at: www.auasb.gov.au/auditors_responsibilities/ar3.pdf.
The description forms part of my auditor’s report.
My opinion does not provide assurance:
• that the Council carried out its activities effectively, efficiently and economically
• on the Original Budget information included in the Income Statement, Statement of Cash Flows,
Note 2(a) and Note 16 budget variation explanations
• on the attached Special Schedules
• about the security and controls over the electronic publication of the audited financial
statements on any website where they may be presented
• about any other information which may have been hyperlinked to/from the financial statements.
Lawrissa Chan
Director, Financial Audit Services
27 October 2017
SYDNEY

1
Cr James Hayes Mayor Snowy Valleys Council 76 Capper Street TUMUT NSW 2720
27 October 2017
Dear Cr Hayes
Report on the Conduct of the Audit
for the Period 13 May 2016 to 30 June 2017
Snowy Valleys Council
We have audited the general purpose financial statements of Snowy Valleys Council (the Council) for
the period 13 May 2016 to 30 June 2017 as required by section 415 of the Local Government Act
1993 (the Act). We expressed an unmodified opinion on the Council’s general purpose financial
statements.
This Report on the Conduct of the Audit (the Report) for the Council for the period 13 May 2016 to
30 June 2017 is issued in accordance with section 417 of the Act. This Report should be read in
conjunction with our audit opinion on the general purpose financial statements issued under section
417(2) of the Act.
INCOME STATEMENT
The operating results represent council’s activities for the period 13 May 2016 to 30 June 2017
Operating result
2017
$’000
Rates and annual charges revenue 16,704
Grants and contributions revenue 31,205
Operating result for the period 9,051
Net result for the period (after assets and liabilities
transferred from former Councils) 603,949
Net operating result before capital amounts (3,047)

2
The following comments are made in respect of Council’s operating result for the year:
Council’s operating surplus for the period was $9.1 million. The operating result for the period
included:
- revenue from rates and annual charges of $16.7 million
- user charges and fees of $21.1 million
- grants and contributions of $31.2 million
- expenses for employee benefits and on-costs of $18.6 million
- materials and contracts of $20.2 million.
Council recorded a net result for the period after assets and liabilities transferred from former
councils of $604 million.
The net operating result before capital contributions was a deficit of $3.0 million.
Rates and annual charges were $16.7 million, represented by $8.5 million rates and $8.2 million
annual charges.
Grants and contributions provided for operating purposes were $19.1 million. Grant income
included a $5.0 million Merger Implementation Grant, $10 million Stronger Communities Grant
and $7.9 million Financial Assistance Grant, of which $2.7 million for 2017–18 was received in
advance and booked as income in June 2017.
Council’s depreciation and amortisation expense for the period ended 30 June 2017 was
$12.3 million.
STATEMENT OF CASH FLOWS
Council recorded a net increase in cash and cash
equivalents of $7.7 million in 2017 before cash
transferred on amalgamation. Cash transferred on
amalgamation of Councils was $5.5 million.
Net cash provided by operating activities amounted
to $31.3 million. Council recorded $27.2 million
cash receipts from user charges and fees,
$31.1 million cash receipts from grants and
contributions, $22.1 million in cash payments for
materials and contracts and $18.4 million in cash
payments on employee benefits and on-costs.
Net cash used in investing activities totalled
$22.3 million. This is largely due to $12.5 million in
non-financial asset acquisitions and net increase in
the purchases investment securities of
$10.3 million.
0
2,000
4,000
6,000
8,000
10,000
12,000
14,000
2017
$
Period ended 30 June
Statement of Cash Flows
Net cash flow Cash and cash equivalents
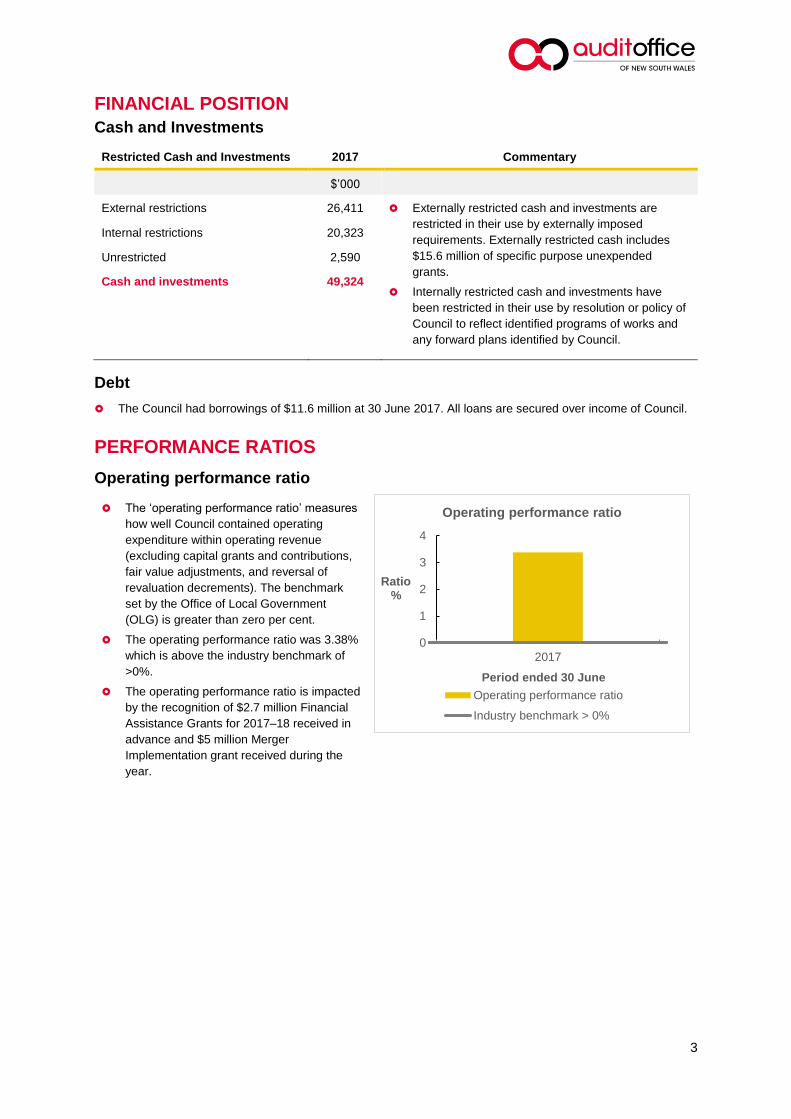
3
FINANCIAL POSITION
Cash and Investments
Restricted Cash and Investments 2017 Commentary
$’000
External restrictions 26,411 Externally restricted cash and investments are
restricted in their use by externally imposed
requirements. Externally restricted cash includes
$15.6 million of specific purpose unexpended
grants.
Internally restricted cash and investments have
been restricted in their use by resolution or policy of
Council to reflect identified programs of works and
any forward plans identified by Council.
Internal restrictions 20,323
Unrestricted 2,590
Cash and investments 49,324
Debt
The Council had borrowings of $11.6 million at 30 June 2017. All loans are secured over income of Council.
PERFORMANCE RATIOS
Operating performance ratio
The ‘operating performance ratio’ measures
how well Council contained operating
expenditure within operating revenue
(excluding capital grants and contributions,
fair value adjustments, and reversal of
revaluation decrements). The benchmark
set by the Office of Local Government
(OLG) is greater than zero per cent.
The operating performance ratio was 3.38%
which is above the industry benchmark of
>0%.
The operating performance ratio is impacted
by the recognition of $2.7 million Financial
Assistance Grants for 2017–18 received in
advance and $5 million Merger
Implementation grant received during the
year.
0
1
2
3
4
2017
Ratio%
Period ended 30 June
Operating performance ratio
Operating performance ratio
Industry benchmark > 0%
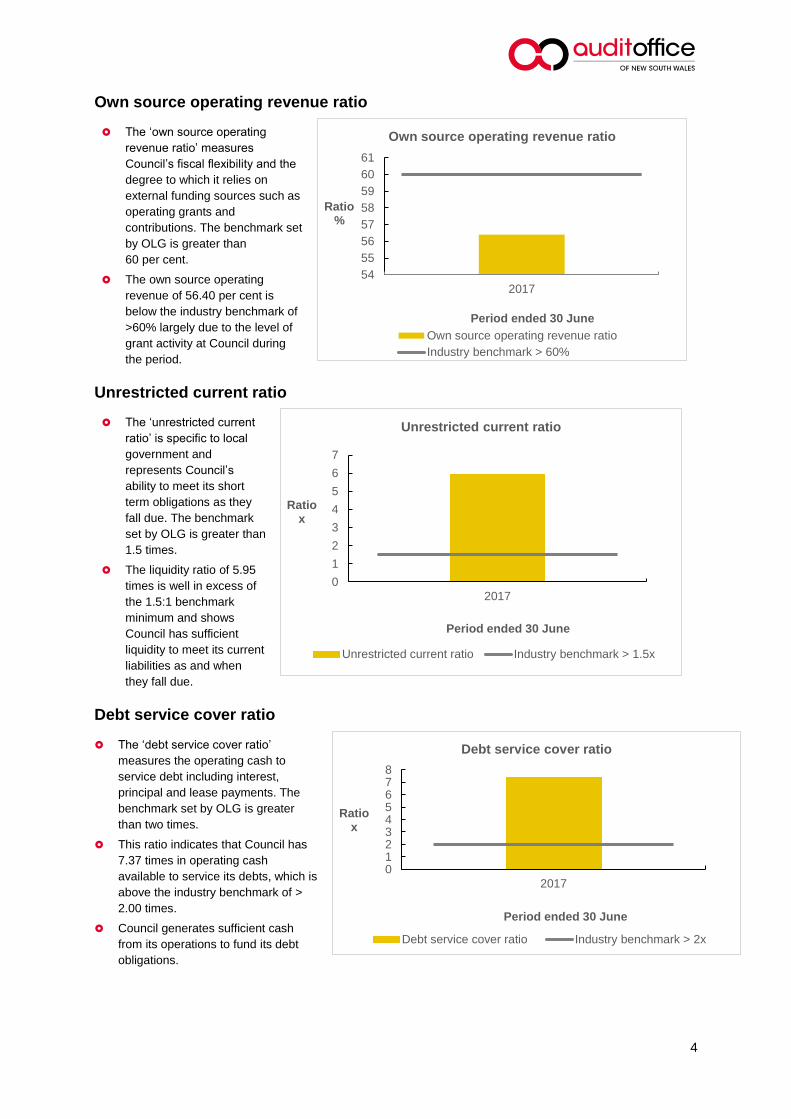
4
Own source operating revenue ratio
The ‘own source operating
revenue ratio’ measures
Council’s fiscal flexibility and the
degree to which it relies on
external funding sources such as
operating grants and
contributions. The benchmark set
by OLG is greater than
60 per cent.
The own source operating
revenue of 56.40 per cent is
below the industry benchmark of
>60% largely due to the level of
grant activity at Council during
the period.
Unrestricted current ratio
The ‘unrestricted current
ratio’ is specific to local
government and
represents Council’s
ability to meet its short
term obligations as they
fall due. The benchmark
set by OLG is greater than
1.5 times.
The liquidity ratio of 5.95
times is well in excess of
the 1.5:1 benchmark
minimum and shows
Council has sufficient
liquidity to meet its current
liabilities as and when
they fall due.
Debt service cover ratio
The ‘debt service cover ratio’
measures the operating cash to
service debt including interest,
principal and lease payments. The
benchmark set by OLG is greater
than two times.
This ratio indicates that Council has
7.37 times in operating cash
available to service its debts, which is
above the industry benchmark of >
2.00 times.
Council generates sufficient cash
from its operations to fund its debt
obligations.
54
55
56
57
58
59
60
61
2017
Ratio%
Period ended 30 June
Own source operating revenue ratio
Own source operating revenue ratio
Industry benchmark > 60%
0
1
2
3
4
5
6
7
2017
Ratiox
Period ended 30 June
Unrestricted current ratio
Unrestricted current ratio Industry benchmark > 1.5x
012345678
2017
Ratiox
Period ended 30 June
Debt service cover ratio
Debt service cover ratio Industry benchmark > 2x

5
Rates and annual charges outstanding ratio
The ‘rates and annual
charges outstanding ratio’
assesses the impact of
uncollected rates and
annual charges on
Council’s liquidity and the
adequacy of debt recovery
efforts. The benchmark set
by OLG is less than
10 per cent for rural
councils.
The outstanding rates ratio
is 4.25% which is within
the benchmark for rural
councils of less than 10%.
This indicates that debt
collection processes at
Council are sound.
Cash expense cover ratio
This liquidity ratio indicates the number
of months the Council can continue
paying for its immediate expenses
without additional cash inflow. The
benchmark set by OLG is greater than
three months.
At 30 June 2017, the Council had the
capacity to cover 11.97 months of cash
expenditure without additional cash
inflows. Council has performed
comfortably above the benchmark in the
current period, indicating a satisfactory
liquidity position.
Building and infrastructure renewals ratio
The ‘building and infrastructure
renewals ratio’ represents the rate
at which assets are being renewed
relative to the rate at which they
are depreciating.
The ratio of 82.74% is below the
industry benchmark of greater than
100%.
Council need to be aware of the
deteriorating impact on
infrastructure assets if this
underperformance is sustained
over an extended period.
0
2
4
6
8
10
12
2017
Ratio%
Period ended 30 June
Rates and annual charges outstanding ratio
Rates and annual charges outstanding ratio
Industry benchmark < 10% (rural Council)
0
5
10
15
2017
Ratiomths
Period ended 30 June
Cash expense cover ratio
Cash expense cover ratio
Industry benchmark > 3 mths
0
20
40
60
80
100
120
2017
Ratio%
Period ended 30 June
Infrastructure renewals ratio
Infrastructure renewals ratio
Industry benchmark > 100%

6
Legislative compliance
Our audit procedures did not identify any instances of non-compliance with legislative requirements or
a material deficiency in the Council’s accounting records or financial reports. The Council’s:
accounting records were maintained in a manner and form to allow the general purpose financial
statements to be prepared and effectively audited
staff provided all accounting records and information relevant to the audit.
Lawrissa Chan
Director, Financial Audit Services
27 October 2017
SYDNEY
cc: Mr David Arber, Acting General Manager Ms Robyn Harvey, Director Internal Services
Ms Sarah Pentland, Division Manager Finance and Information Technology
Mr Tim Hurst, Acting Chief Executive of the Office of Local Government

Snowy Valleys Council SPECIAL PURPOSE FINANCIAL STATEMENTS for the period 13 May 2016 to 30 June 2017
Leading, engaging & supportingstrong & vibrant communities

SPFS 2017
page 1
Snowy Valleys Council
Special Purpose Financial Statements for the period 13 May 2016 to 30 June 2017
Contents
1. Statement by Councillors and Management
2. Special Purpose Financial Statements:
Income Statement – Water Supply Business ActivityIncome Statement – Sewerage Business ActivityIncome Statement – Other Business Activities
Statement of Financial Position – Water Supply Business ActivityStatement of Financial Position – Sewerage Business ActivityStatement of Financial Position – Other Business Activities
3. Notes to the Special Purpose Financial Statements
4. Auditor’s Report
Background
These Special Purpose Financial Statements have been prepared for the use by both Council and the Office ofLocal Government in fulfilling their requirements under National Competition Policy.
The principle of competitive neutrality is based on the concept of a ‘level playing field’ between persons/entitiescompeting in a market place, particularly between private and public sector competitors.
Essentially, the principle is that government businesses, whether Commonwealth, state or local, should operatewithout net competitive advantages over other businesses as a result of their public ownership.
For Council, the principle of competitive neutrality and public reporting applies only to declared business activities.
These include (a) those activities classified by the Australian Bureau of Statistics as business activities beingwater supply, sewerage services, abattoirs, gas production and reticulation, and (b) those activities with a turnoverof more than $2 million that Council has formally declared as a business activity (defined as Category 1 activities).
In preparing these financial statements for Council’s self-classified Category 1 businesses and ABS-definedactivities, councils must (a) adopt a corporatisation model and (b) apply full cost attribution including tax-equivalentregime payments and debt guarantee fees (where the business benefits from Council's borrowing position bycomparison with commercial rates).
(iv)
9
87
(i)
(ii)
18
(iii)
6
Page
345
2


SPFS 2017
page 3
Snowy Valleys Council
Income Statement of Council's Water Supply Business Activity for the period 13 May 2016 to 30 June 2017
$ ’000
Income from continuing operationsAccess chargesUser chargesFeesInterestGrants and contributions provided for non-capital purposesProfit from the sale of assetsShare of profit from equity accounted investmentOther incomeTotal income from continuing operations
Expenses from continuing operationsEmployee benefits and on-costsBorrowing costsMaterials and contractsDepreciation, amortisation and impairmentWater purchase chargesLoss on sale of assetsCalculated taxation equivalentsDebt guarantee fee (if applicable)Other expensesTotal expenses from continuing operationsSurplus (deficit) from continuing operations before capital amounts
Grants and contributions provided for capital purposesSurplus (deficit) from continuing operations after capital amounts
Surplus (deficit) from discontinued operationsSurplus (deficit) from all operations before taxLess: corporate taxation equivalent (30%) [based on result before capital]
SURPLUS (DEFICIT) AFTER TAX
Plus Assets and liabilities transferred from former councilsPlus adjustments for amounts unpaid:– Taxation equivalent payments– Debt guarantee feesLess:– Tax equivalent dividend paidClosing retained profits
Return on capital %Subsidy from Council
Calculation of dividend payable:Surplus (deficit) after taxLess: capital grants and contributions (excluding developer contributions)Surplus for dividend calculation purposesPotential dividend calculated from surplus
1,379 3,449
– 144 90 –
7 5,069
901 340
1,446 1,734
– 97 14 61
2,944 7,537
14 61
(2,468)
47 (2,421)
– (2,421)
–
– –
Actual 13/5/16
to 30/6/17
(14) 54,571
-3.9%3,424
(2,421)
56,931
(2,421) (16)
–
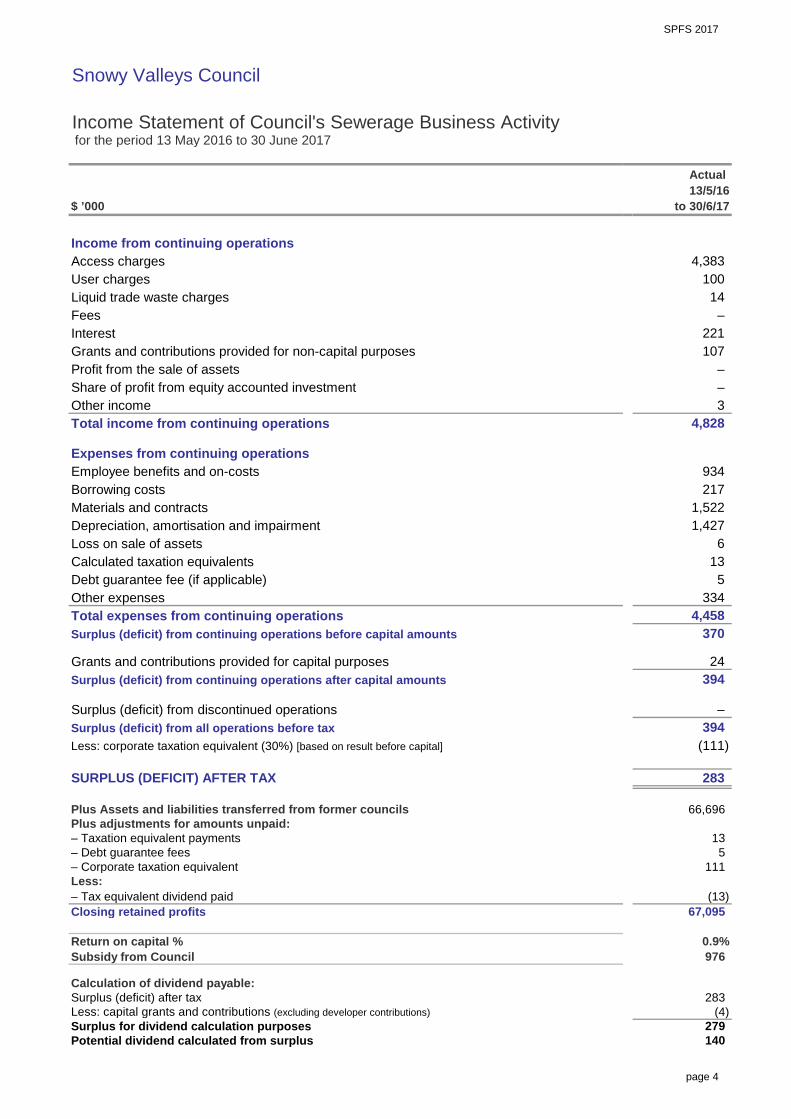
SPFS 2017
page 4
Snowy Valleys Council
Income Statement of Council's Sewerage Business Activity for the period 13 May 2016 to 30 June 2017
$ ’000
Income from continuing operationsAccess chargesUser chargesLiquid trade waste chargesFeesInterestGrants and contributions provided for non-capital purposesProfit from the sale of assetsShare of profit from equity accounted investmentOther incomeTotal income from continuing operations
Expenses from continuing operationsEmployee benefits and on-costsBorrowing costsMaterials and contractsDepreciation, amortisation and impairmentLoss on sale of assetsCalculated taxation equivalentsDebt guarantee fee (if applicable)Other expensesTotal expenses from continuing operationsSurplus (deficit) from continuing operations before capital amounts
Grants and contributions provided for capital purposesSurplus (deficit) from continuing operations after capital amounts
Surplus (deficit) from discontinued operationsSurplus (deficit) from all operations before taxLess: corporate taxation equivalent (30%) [based on result before capital]
SURPLUS (DEFICIT) AFTER TAX
Plus Assets and liabilities transferred from former councilsPlus adjustments for amounts unpaid:– Taxation equivalent payments– Debt guarantee fees– Corporate taxation equivalentLess:– Tax equivalent dividend paidClosing retained profits
Return on capital %Subsidy from Council
Calculation of dividend payable:Surplus (deficit) after taxLess: capital grants and contributions (excluding developer contributions)Surplus for dividend calculation purposesPotential dividend calculated from surplus
–
67,095
0.9%976
283 (4)
279
5 334
4,458 370
4,828
13 5
111
(13)
140
13
– 394
(111)
283
66,696
6
4,383 100 14 –
221
24 394
107 –
3
934 217
1,522 1,427
Actual 13/5/16
to 30/6/17
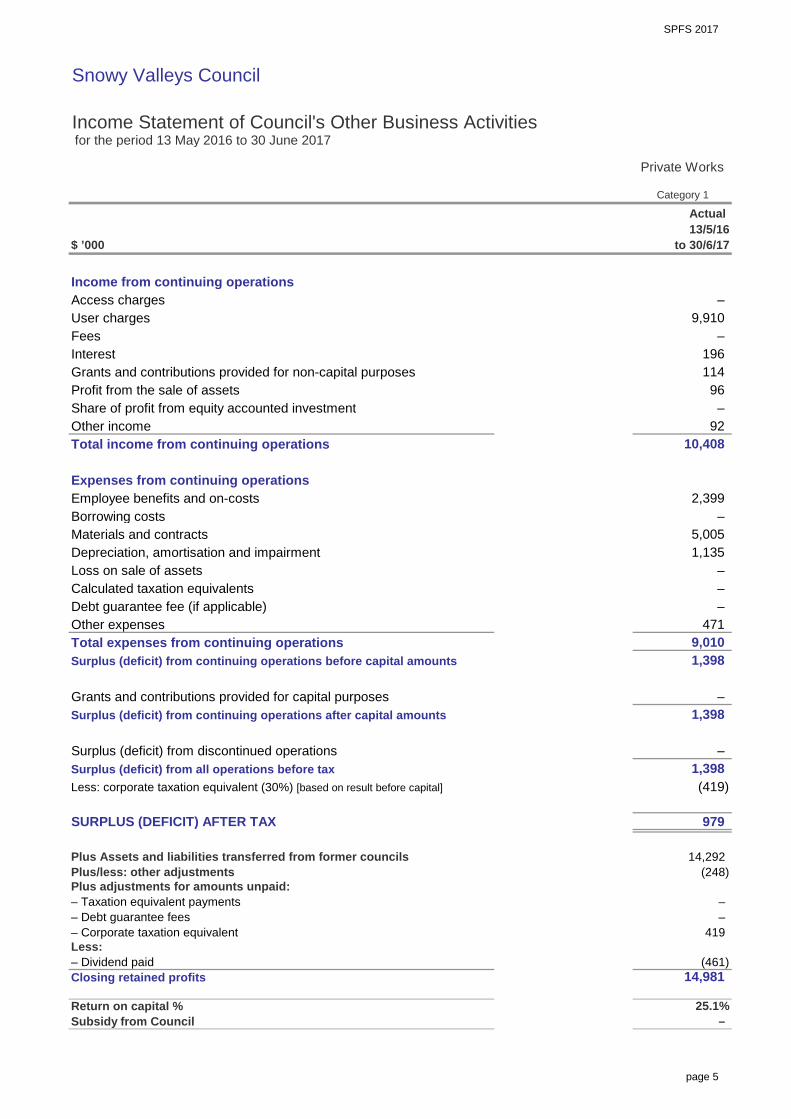
SPFS 2017
page 5
Snowy Valleys Council
Income Statement of Council's Other Business Activities for the period 13 May 2016 to 30 June 2017
$ ’000
Income from continuing operationsAccess chargesUser chargesFeesInterestGrants and contributions provided for non-capital purposesProfit from the sale of assetsShare of profit from equity accounted investmentOther incomeTotal income from continuing operations
Expenses from continuing operationsEmployee benefits and on-costsBorrowing costsMaterials and contractsDepreciation, amortisation and impairmentLoss on sale of assetsCalculated taxation equivalentsDebt guarantee fee (if applicable)Other expensesTotal expenses from continuing operationsSurplus (deficit) from continuing operations before capital amounts
Grants and contributions provided for capital purposesSurplus (deficit) from continuing operations after capital amounts
Surplus (deficit) from discontinued operationsSurplus (deficit) from all operations before taxLess: corporate taxation equivalent (30%) [based on result before capital]
SURPLUS (DEFICIT) AFTER TAX
Plus Assets and liabilities transferred from former councilsPlus/less: other adjustmentsPlus adjustments for amounts unpaid:– Taxation equivalent payments– Debt guarantee fees– Corporate taxation equivalentLess:– Dividend paidClosing retained profits
Return on capital %Subsidy from Council
–
14,981
25.1%–
1,398 (419)
419 – –
(461)
14,292
979
(248)
–
–
5,005 1,135
2,399
13/5/16 to 30/6/17
–
114
92
96
10,408
–
Actual
–
471 9,010
1,398
–
– 196
9,910
1,398
–
Private Works
Category 1

SPFS 2017
page 6
Snowy Valleys Council
Statement of Financial Position – Council's Water Supply Business Activity as at 30 June 2017
$ ’000
ASSETSCurrent assetsCash and cash equivalentsInvestmentsReceivablesInventoriesOtherNon-current assets classified as held for saleTotal current assets
Non-current assetsInvestmentsReceivablesInventoriesInfrastructure, property, plant and equipmentInvestments accounted for using equity methodInvestment propertyIntangible assetsTotal non-current assetsTOTAL ASSETS
LIABILITIESCurrent liabilitiesBank overdraftPayablesIncome received in advanceBorrowingsProvisionsTotal current liabilities
Non-current liabilitiesPayablesIncome received in advanceBorrowingsProvisionsTotal non-current liabilitiesTOTAL LIABILITIESNET ASSETS
EQUITYRetained earningsRevaluation reservesTOTAL EQUITY
–
– –
–
–
–
–
54,571
54
–
3,959
54,571
54,571
Actual 2017
59,093
–
1,013
– –
–
54,457
–
54,457
1,952 1,671
4,636 –
509 –
563
4,522
3,959 –

SPFS 2017
page 7
Snowy Valleys Council
Statement of Financial Position – Council's Sewerage Business Activity as at 30 June 2017
$ ’000
ASSETSCurrent assetsCash and cash equivalentsInvestmentsReceivablesInventoriesOtherNon-current assets classified as held for saleTotal current Assets
Non-current assetsInvestmentsReceivablesInventoriesInfrastructure, property, plant and equipmentInvestments accounted for using equity methodInvestment propertyIntangible assetsTotal non-current assetsTOTAL ASSETS
LIABILITIESCurrent liabilitiesBank overdraftPayablesIncome received in advanceBorrowingsProvisionsTotal current liabilities
Non-current liabilitiesPayablesIncome received in advanceBorrowingsProvisionsTotal non-current liabilitiesTOTAL LIABILITIESNET ASSETS
EQUITYRetained earningsRevaluation reservesTOTAL EQUITY
–
–
65,662
3,536
68,214
68,214
67,095
–
–
1,119
3,536
– –
404 2,697
–
65,662
–
–
3,277
2017
–
Actual
3,826
262
–
290
6,378
72,040
–
–
–
28
–
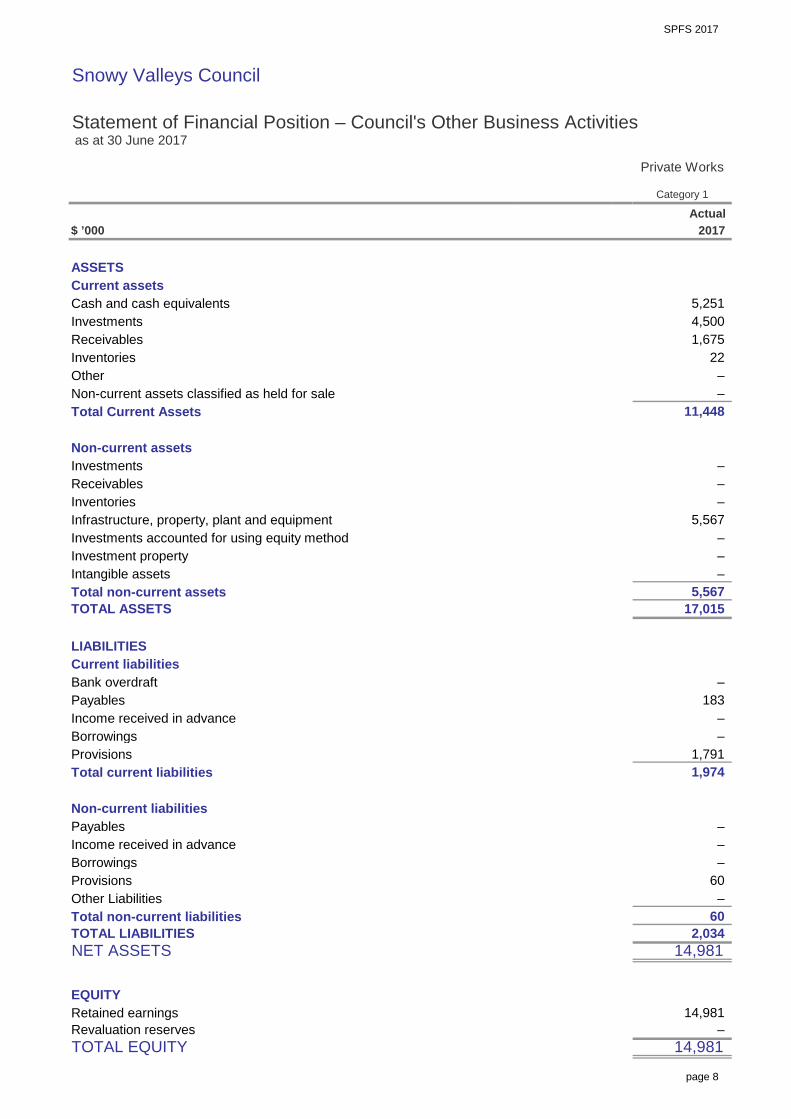
SPFS 2017
page 8
Snowy Valleys Council
Statement of Financial Position – Council's Other Business Activities as at 30 June 2017
$ ’000
ASSETSCurrent assetsCash and cash equivalentsInvestmentsReceivablesInventoriesOtherNon-current assets classified as held for saleTotal Current Assets
Non-current assetsInvestmentsReceivablesInventoriesInfrastructure, property, plant and equipmentInvestments accounted for using equity methodInvestment propertyIntangible assetsTotal non-current assetsTOTAL ASSETS
LIABILITIESCurrent liabilitiesBank overdraftPayablesIncome received in advanceBorrowingsProvisionsTotal current liabilities
Non-current liabilitiesPayablesIncome received in advanceBorrowingsProvisionsOther LiabilitiesTotal non-current liabilitiesTOTAL LIABILITIESNET ASSETS
EQUITYRetained earningsRevaluation reservesTOTAL EQUITY
–
17,015
–
60
14,981
–
183
60
1,974
–
– 14,981
2017
5,251
1,675
– 5,567
–
14,981
–
2,034
1,791 –
22 –
11,448
4,500
–
–
–
Actual
5,567
–
–
–
Private Works
Category 1

SPFS 2017
page 9
Snowy Valleys Council
Special Purpose Financial Statements for the period 13 May 2016 to 30 June 2017
Contents of the notes accompanying the financial statements
Details
Summary of significant accounting policies
Water Supply Business Best-Practice Management disclosure requirements
Sewerage Business Best-Practice Management disclosure requirements 153
Note Page
1
2
10
13
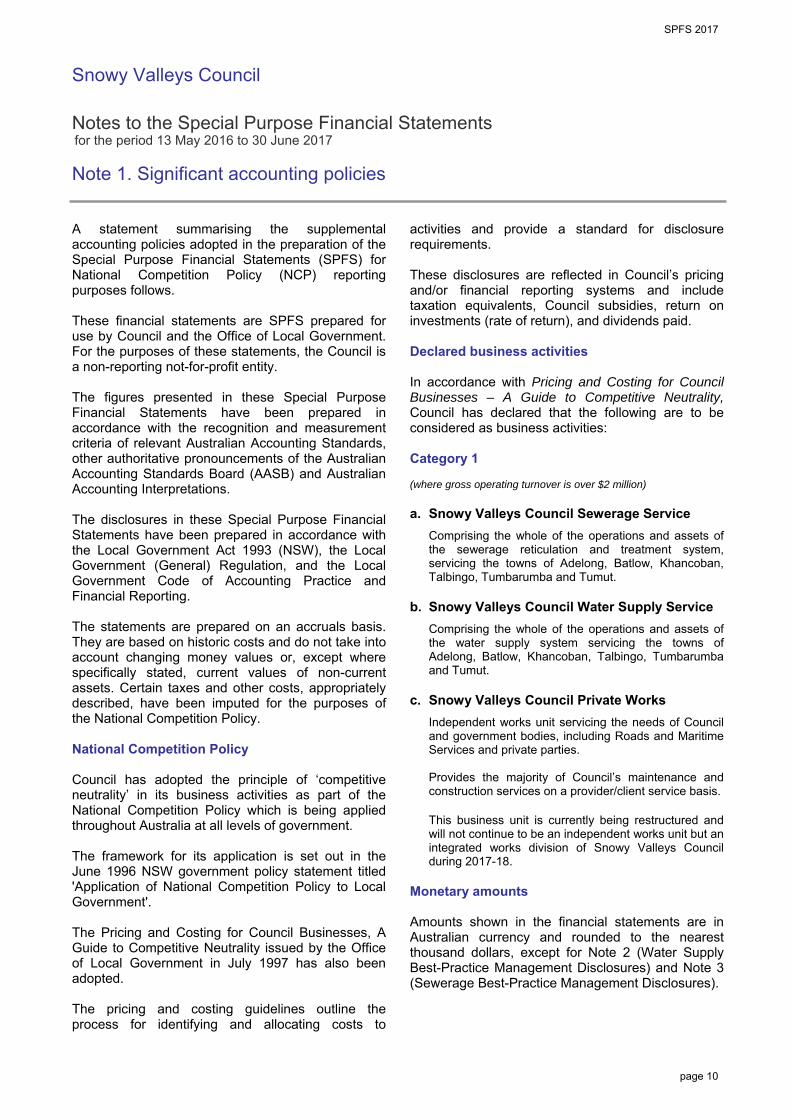
SPFS 2017
Snowy Valleys Council
Notes to the Special Purpose Financial Statements for the period 13 May 2016 to 30 June 2017
Note 1. Significant accounting policies
page 10
A statement summarising the supplemental accounting policies adopted in the preparation of the Special Purpose Financial Statements (SPFS) for National Competition Policy (NCP) reporting purposes follows. These financial statements are SPFS prepared for use by Council and the Office of Local Government. For the purposes of these statements, the Council is a non-reporting not-for-profit entity. The figures presented in these Special Purpose Financial Statements have been prepared in accordance with the recognition and measurement criteria of relevant Australian Accounting Standards, other authoritative pronouncements of the Australian Accounting Standards Board (AASB) and Australian Accounting Interpretations. The disclosures in these Special Purpose Financial Statements have been prepared in accordance with the Local Government Act 1993 (NSW), the Local Government (General) Regulation, and the Local Government Code of Accounting Practice and Financial Reporting. The statements are prepared on an accruals basis. They are based on historic costs and do not take into account changing money values or, except where specifically stated, current values of non-current assets. Certain taxes and other costs, appropriately described, have been imputed for the purposes of the National Competition Policy. National Competition Policy Council has adopted the principle of ‘competitive neutrality’ in its business activities as part of the National Competition Policy which is being applied throughout Australia at all levels of government. The framework for its application is set out in the June 1996 NSW government policy statement titled 'Application of National Competition Policy to Local Government'. The Pricing and Costing for Council Businesses, A Guide to Competitive Neutrality issued by the Office of Local Government in July 1997 has also been adopted. The pricing and costing guidelines outline the process for identifying and allocating costs to
activities and provide a standard for disclosure requirements. These disclosures are reflected in Council’s pricing and/or financial reporting systems and include taxation equivalents, Council subsidies, return on investments (rate of return), and dividends paid. Declared business activities In accordance with Pricing and Costing for Council Businesses – A Guide to Competitive Neutrality, Council has declared that the following are to be considered as business activities: Category 1 (where gross operating turnover is over $2 million) a. Snowy Valleys Council Sewerage Service
Comprising the whole of the operations and assets of the sewerage reticulation and treatment system, servicing the towns of Adelong, Batlow, Khancoban, Talbingo, Tumbarumba and Tumut.
b. Snowy Valleys Council Water Supply Service
Comprising the whole of the operations and assets of the water supply system servicing the towns of Adelong, Batlow, Khancoban, Talbingo, Tumbarumba and Tumut.
c. Snowy Valleys Council Private Works
Independent works unit servicing the needs of Council and government bodies, including Roads and Maritime Services and private parties. Provides the majority of Council’s maintenance and construction services on a provider/client service basis. This business unit is currently being restructured and will not continue to be an independent works unit but an integrated works division of Snowy Valleys Council during 2017-18.
Monetary amounts Amounts shown in the financial statements are in Australian currency and rounded to the nearest thousand dollars, except for Note 2 (Water Supply Best-Practice Management Disclosures) and Note 3 (Sewerage Best-Practice Management Disclosures).
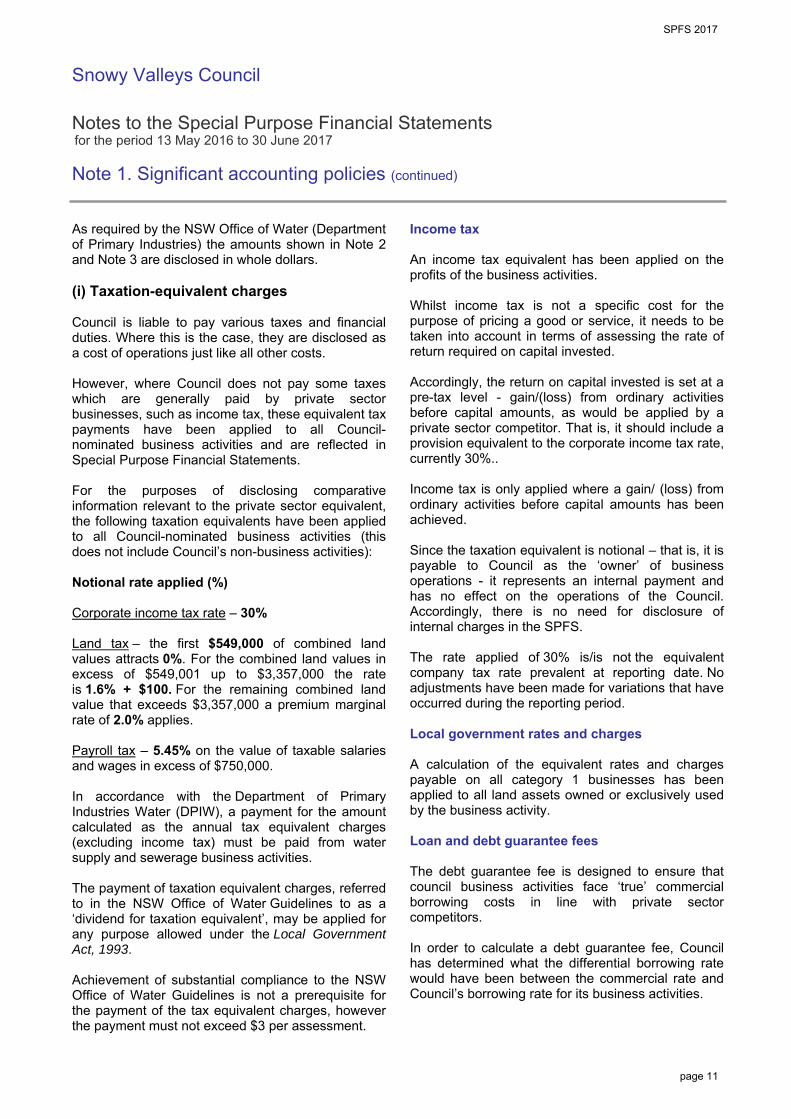
SPFS 20177
Snowy Valleys Council
Notes to the Special Purpose Financial Statements for the period 13 May 2016 to 30 June 2017
Note 1. Significant accounting policies (continued)
page 11
As required by the NSW Office of Water (Department of Primary Industries) the amounts shown in Note 2 and Note 3 are disclosed in whole dollars. (i) Taxation-equivalent charges Council is liable to pay various taxes and financial duties. Where this is the case, they are disclosed as a cost of operations just like all other costs. However, where Council does not pay some taxes which are generally paid by private sector businesses, such as income tax, these equivalent tax payments have been applied to all Council-nominated business activities and are reflected in Special Purpose Financial Statements. For the purposes of disclosing comparative information relevant to the private sector equivalent, the following taxation equivalents have been applied to all Council-nominated business activities (this does not include Council’s non-business activities): Notional rate applied (%) Corporate income tax rate – 30% Land tax – the first $549,000 of combined land values attracts 0%. For the combined land values in excess of $549,001 up to $3,357,000 the rate is 1.6% + $100. For the remaining combined land value that exceeds $3,357,000 a premium marginal rate of 2.0% applies. Payroll tax – 5.45% on the value of taxable salaries and wages in excess of $750,000. In accordance with the Department of Primary Industries Water (DPIW), a payment for the amount calculated as the annual tax equivalent charges (excluding income tax) must be paid from water supply and sewerage business activities. The payment of taxation equivalent charges, referred to in the NSW Office of Water Guidelines to as a ‘dividend for taxation equivalent’, may be applied for any purpose allowed under the Local Government Act, 1993. Achievement of substantial compliance to the NSW Office of Water Guidelines is not a prerequisite for the payment of the tax equivalent charges, however the payment must not exceed $3 per assessment.
Income tax An income tax equivalent has been applied on the profits of the business activities. Whilst income tax is not a specific cost for the purpose of pricing a good or service, it needs to be taken into account in terms of assessing the rate of return required on capital invested. Accordingly, the return on capital invested is set at a pre-tax level - gain/(loss) from ordinary activities before capital amounts, as would be applied by a private sector competitor. That is, it should include a provision equivalent to the corporate income tax rate, currently 30%.. Income tax is only applied where a gain/ (loss) from ordinary activities before capital amounts has been achieved. Since the taxation equivalent is notional – that is, it is payable to Council as the ‘owner’ of business operations - it represents an internal payment and has no effect on the operations of the Council. Accordingly, there is no need for disclosure of internal charges in the SPFS. The rate applied of 30% is/is not the equivalent company tax rate prevalent at reporting date. No adjustments have been made for variations that have occurred during the reporting period. Local government rates and charges A calculation of the equivalent rates and charges payable on all category 1 businesses has been applied to all land assets owned or exclusively used by the business activity. Loan and debt guarantee fees The debt guarantee fee is designed to ensure that council business activities face ‘true’ commercial borrowing costs in line with private sector competitors. In order to calculate a debt guarantee fee, Council has determined what the differential borrowing rate would have been between the commercial rate and Council’s borrowing rate for its business activities.
SPFS 20177
Snowy Valleys Council
Notes to the Special Purpose Financial Statements for the period 13 May 2016 to 30 June 2017
Note 1. Significant accounting policies (continued)
page 12
(ii) Subsidies Government policy requires that subsidies provided to customers, and the funding of those subsidies, must be explicitly disclosed. Subsidies occur when Council provides services on a less-than-cost-recovery basis. This option is exercised on a range of services in order for Council to meet its community service obligations. Accordingly, ‘subsidies disclosed’ (in relation to National Competition Policy) represents the difference between revenue generated from ‘rate of return’ pricing and revenue generated from prices set by Council in any given financial year. The overall effect of subsidies is contained within the Income Statement of each reported business activity. (iii) Return on investments (rate of return) The NCP policy statement requires that councils with Category 1 businesses ‘would be expected to generate a return on capital funds employed that is comparable to rates of return for private businesses operating in a similar field’. Such funds are subsequently available for meeting commitments or financing future investment strategies. The actual rate of return achieved by each business activity is disclosed at the foot of each respective Income Statement. The rate of return is calculated as follows: Operating result before capital income + interest expense
Written down value of I,PP&E as at 30 June As a minimum, business activities should generate a return equal to the Commonwealth 10 year bond rate which is 2.38% at 30/6/17. (iv) Dividends Council is not required to pay dividends to either itself (as owner of a range of businesses) or to any external entities.
Local government water supply and sewerage businesses are permitted to pay an annual dividend from its water supply or sewerage business surplus. Each dividend must be calculated and approved in accordance with the DPIW guidelines and must not exceed:
(i) 50% of this surplus in any one year, or (ii) the number of water supply or sewerage
assessments at 30 June 2017 multiplied by $30 (less the payment for tax equivalent charges, not exceeding $3 per assessment).
In accordance with the DPIW guidelines a Dividend Payment form, Statement of Compliance, Unqualified Independent Financial Audit Report and Compliance Audit Report are required to be submitted to the DPIW.

SPFS 2017
page 13
Snowy Valleys Council
Notes to the Special Purpose Financial Statements for the period 13 May 2016 to 30 June 2017
Note 2. Water Supply Business Best-Practice Management disclosure requirements
Dollars amounts shown below are in whole dollars (unless otherwise indicated)
1. Calculation and payment of tax-equivalents[all local government local water utilities must pay this dividend for tax equivalents]
Calculated tax equivalents
Number of assessments multiplied by $3/assessment
Amounts payable for tax equivalents [lesser of (i) and (ii)]
Amounts actually paid for tax equivalents
2. Dividend from surplus50% of surplus before dividends[calculated in accordance with Best-Practice Management for Water Supply and Sewerage Guidelines]
Number of assessments multiplied by $30/assessment, less tax equivalentcharges/assessment
Cumulative surplus before dividends for the 3 years to 30 June 2017, less thecumulative dividends paid for the 2 years to 13 May 2016 and 30 June 2015
2017 Surplus
Maximum dividend from surplus [least of (i), (ii) and (iii) above]
Dividend actually paid from surplus [refer below for required pre-dividend payment criteria]
Are the overhead reallocation charges to the water business fair and reasonable? a
3. Required outcomes for 6 criteria[to be eligible for the payment of a ‘dividend from surplus’, all the criteria below need a ‘YES’]
Completion of strategic business plan (including financial plan)
Full cost recovery, without significant cross subsidies[refer item 2 (a) in table 1 on page 22 of the Best-Practice Guidelines]
– Complying charges [item 2 (b) in table 1]
– DSP with commercial developer charges [item 2 (e) in table 1]
– If dual water supplies, complying charges [item 2 (g) in table 1]
Sound water conservation and demand management implemented
Sound drought management implemented
Complete performance reporting form (by 15 September each year)
a. Integrated water cycle management evaluation
b. Complete and implement integrated water cycle management strategy
YES
YES(v)
(vi)
YES
75,000
14,000
n/a
2017
–
–
161,298
(3,175,000)
17,922
17,922
(iv) YES
YES
YES
(ii)
YES
YES
(2,437,000)
YES
YES
YES
(iv)
(iii)
(i)
(iv)
(iii)
(iii)
(i)
(ii)
(ii)
(v)
(i)
(vi)
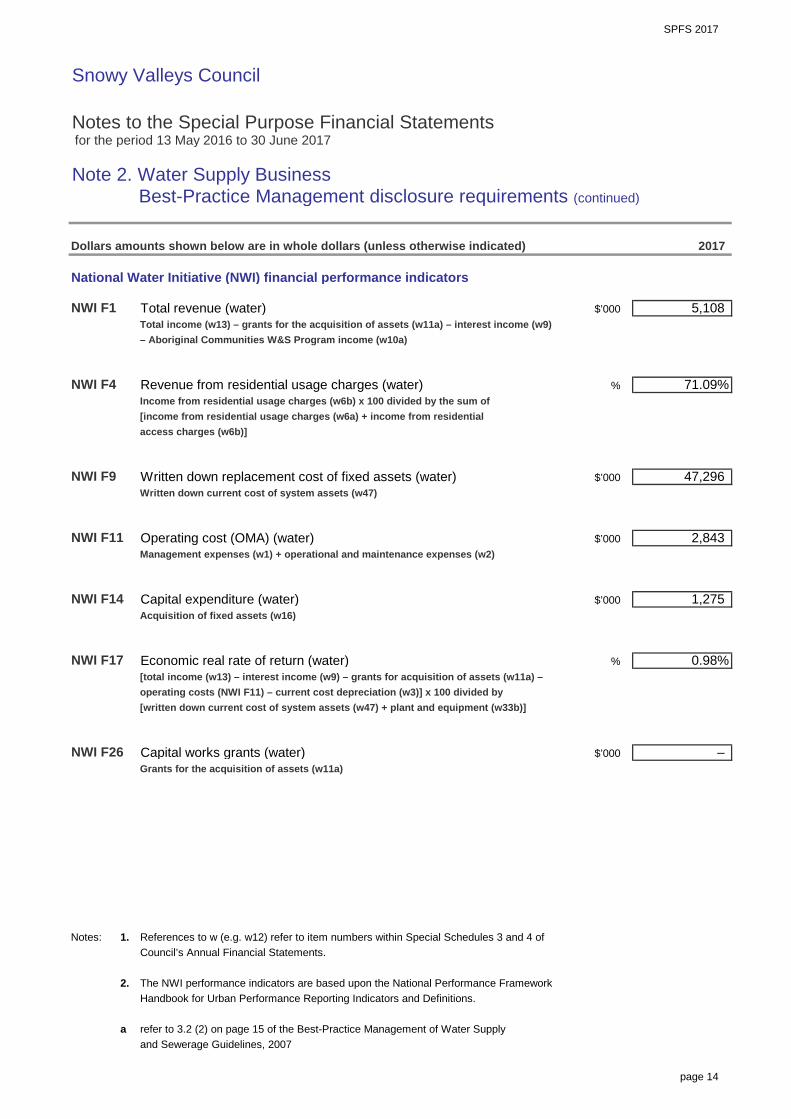
SPFS 2017
page 14
Snowy Valleys Council
Notes to the Special Purpose Financial Statements for the period 13 May 2016 to 30 June 2017
Note 2. Water Supply Business Best-Practice Management disclosure requirements (continued)
Dollars amounts shown below are in whole dollars (unless otherwise indicated)
National Water Initiative (NWI) financial performance indicators
Total revenue (water)Total income (w13) – grants for the acquisition of assets (w11a) – interest income (w9)– Aboriginal Communities W&S Program income (w10a)
Revenue from residential usage charges (water)Income from residential usage charges (w6b) x 100 divided by the sum of[income from residential usage charges (w6a) + income from residentialaccess charges (w6b)]
Written down replacement cost of fixed assets (water)Written down current cost of system assets (w47)
Operating cost (OMA) (water)Management expenses (w1) + operational and maintenance expenses (w2)
Capital expenditure (water)Acquisition of fixed assets (w16)
Economic real rate of return (water)[total income (w13) – interest income (w9) – grants for acquisition of assets (w11a) –operating costs (NWI F11) – current cost depreciation (w3)] x 100 divided by[written down current cost of system assets (w47) + plant and equipment (w33b)]
Capital works grants (water)Grants for the acquisition of assets (w11a)
Notes: 1. References to w (e.g. w12) refer to item numbers within Special Schedules 3 and 4 ofCouncil’s Annual Financial Statements.
2. The NWI performance indicators are based upon the National Performance FrameworkHandbook for Urban Performance Reporting Indicators and Definitions.
a refer to 3.2 (2) on page 15 of the Best-Practice Management of Water Supply and Sewerage Guidelines, 2007
NWI F26 – $’000
NWI F11
NWI F17 %
NWI F14 $’000
0.98%
1,275
2,843 $’000
$’000NWI F9
2017
5,108
NWI F4 %
47,296
$’000
71.09%
NWI F1
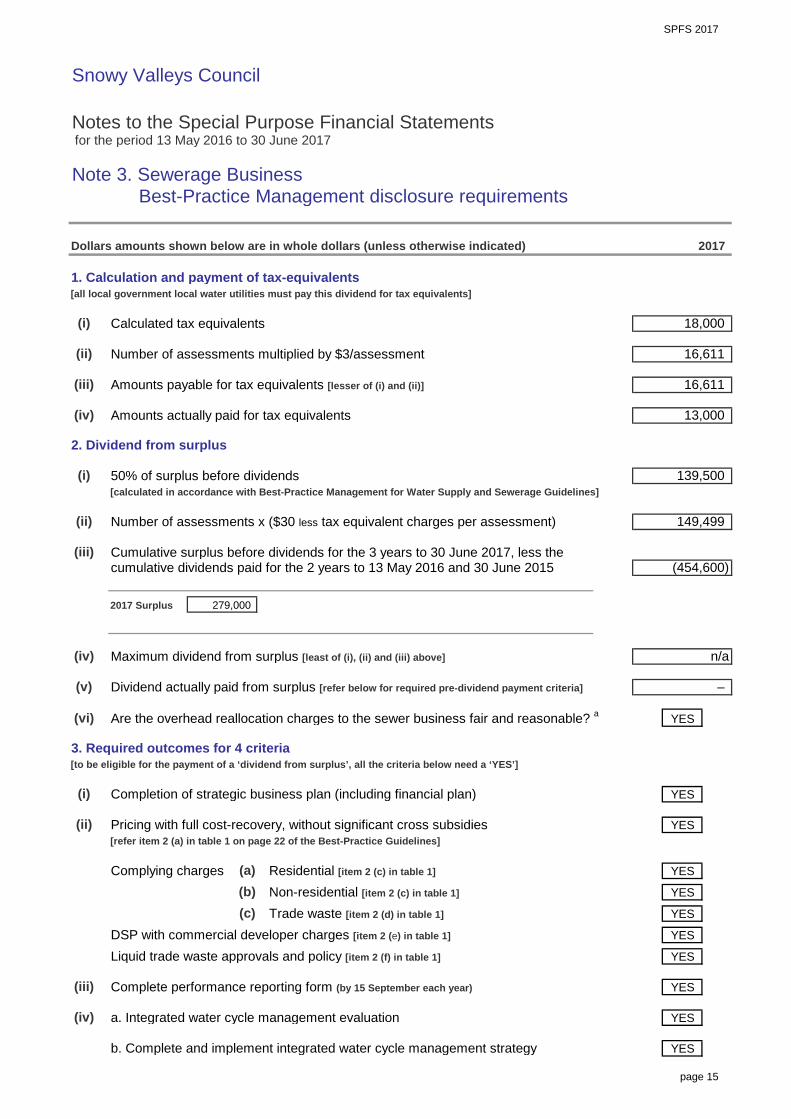
SPFS 2017
page 15
Snowy Valleys Council
Notes to the Special Purpose Financial Statements for the period 13 May 2016 to 30 June 2017
Note 3. Sewerage Business Best-Practice Management disclosure requirements
Dollars amounts shown below are in whole dollars (unless otherwise indicated)
1. Calculation and payment of tax-equivalents[all local government local water utilities must pay this dividend for tax equivalents]
Calculated tax equivalents
Number of assessments multiplied by $3/assessment
Amounts payable for tax equivalents [lesser of (i) and (ii)]
Amounts actually paid for tax equivalents
2. Dividend from surplus
50% of surplus before dividends[calculated in accordance with Best-Practice Management for Water Supply and Sewerage Guidelines]
Number of assessments x ($30 less tax equivalent charges per assessment)
Cumulative surplus before dividends for the 3 years to 30 June 2017, less thecumulative dividends paid for the 2 years to 13 May 2016 and 30 June 2015
2017 Surplus
Maximum dividend from surplus [least of (i), (ii) and (iii) above]
Dividend actually paid from surplus [refer below for required pre-dividend payment criteria]
Are the overhead reallocation charges to the sewer business fair and reasonable? a
3. Required outcomes for 4 criteria [to be eligible for the payment of a ‘dividend from surplus’, all the criteria below need a ‘YES’]
Completion of strategic business plan (including financial plan)
Pricing with full cost-recovery, without significant cross subsidies [refer item 2 (a) in table 1 on page 22 of the Best-Practice Guidelines]
Complying charges Residential [item 2 (c) in table 1] Non-residential [item 2 (c) in table 1] Trade waste [item 2 (d) in table 1]
DSP with commercial developer charges [item 2 (e) in table 1] Liquid trade waste approvals and policy [item 2 (f) in table 1]
Complete performance reporting form (by 15 September each year)
a. Integrated water cycle management evaluation
b. Complete and implement integrated water cycle management strategy
18,000
16,611
YES
YES
YES
139,500
YES
YES
2017
YES
n/a
–
YES
16,611
13,000
YES
YES
(454,600)
YES
YES
(i)
(iv)
(iii)
(ii)
(iii)
279,000
(i)
(ii) 149,499
(iv)
(c)
(iv)
(v)
(iii)
(i)
(ii)
(a)(b)
(vi)
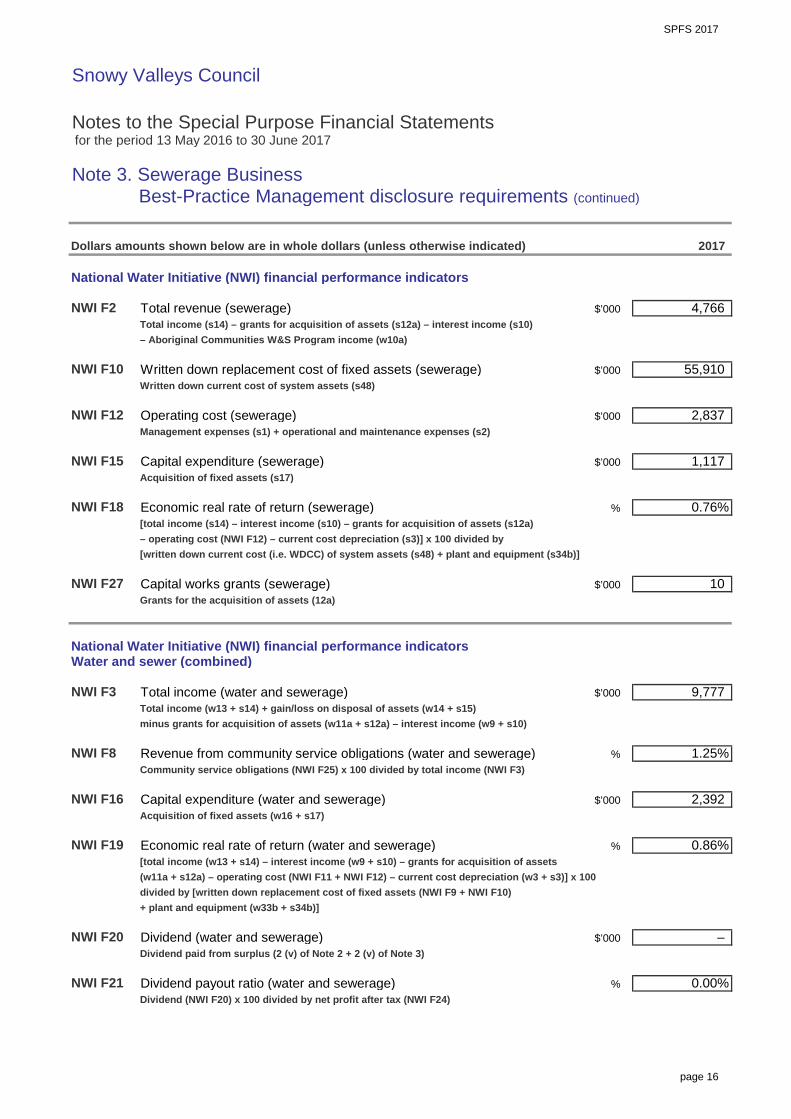
SPFS 2017
page 16
Snowy Valleys Council
Notes to the Special Purpose Financial Statements for the period 13 May 2016 to 30 June 2017
Note 3. Sewerage Business Best-Practice Management disclosure requirements (continued)
Dollars amounts shown below are in whole dollars (unless otherwise indicated)
National Water Initiative (NWI) financial performance indicators
Total revenue (sewerage)Total income (s14) – grants for acquisition of assets (s12a) – interest income (s10)– Aboriginal Communities W&S Program income (w10a)
Written down replacement cost of fixed assets (sewerage)Written down current cost of system assets (s48)
Operating cost (sewerage)Management expenses (s1) + operational and maintenance expenses (s2)
Capital expenditure (sewerage)Acquisition of fixed assets (s17)
Economic real rate of return (sewerage)[total income (s14) – interest income (s10) – grants for acquisition of assets (s12a)– operating cost (NWI F12) – current cost depreciation (s3)] x 100 divided by[written down current cost (i.e. WDCC) of system assets (s48) + plant and equipment (s34b)]
Capital works grants (sewerage)Grants for the acquisition of assets (12a)
National Water Initiative (NWI) financial performance indicatorsWater and sewer (combined)
Total income (water and sewerage)Total income (w13 + s14) + gain/loss on disposal of assets (w14 + s15)minus grants for acquisition of assets (w11a + s12a) – interest income (w9 + s10)
Revenue from community service obligations (water and sewerage)Community service obligations (NWI F25) x 100 divided by total income (NWI F3)
Capital expenditure (water and sewerage)Acquisition of fixed assets (w16 + s17)
Economic real rate of return (water and sewerage)[total income (w13 + s14) – interest income (w9 + s10) – grants for acquisition of assets(w11a + s12a) – operating cost (NWI F11 + NWI F12) – current cost depreciation (w3 + s3)] x 100divided by [written down replacement cost of fixed assets (NWI F9 + NWI F10)+ plant and equipment (w33b + s34b)]
Dividend (water and sewerage)Dividend paid from surplus (2 (v) of Note 2 + 2 (v) of Note 3)
Dividend payout ratio (water and sewerage)Dividend (NWI F20) x 100 divided by net profit after tax (NWI F24)
$’000
10
55,910
4,766
0.76%
2,837
1,117
2017
NWI F3 $’000 9,777
NWI F8 % 1.25%
NWI F19
NWI F21
NWI F20
%
%
– $’000
0.00%
0.86%
2,392 NWI F16 $’000
NWI F27
NWI F18
NWI F15 $’000
%
$’000
NWI F2
NWI F10
NWI F12
$’000
$’000

SPFS 2017
page 17
Snowy Valleys Council
Notes to the Special Purpose Financial Statements for the period 13 May 2016 to 30 June 2017
Note 3. Sewerage Business Best-Practice Management disclosure requirements (continued)
Dollars amounts shown below are in whole dollars (unless otherwise indicated)
National Water Initiative (NWI) financial performance indicatorsWater and sewer (combined)
Net debt to equity (water and sewerage)Overdraft (w36 + s37) + borrowings (w38 + s39) – cash and investments (w30 + s31)x 100 divided by [total assets (w35 + s36) – total liabilities (w40 + s41)]
Interest cover (water and sewerage)Earnings before interest and tax (EBIT) divided by net interest
Earnings before interest and tax (EBIT):Operating result (w15a + s16a) + interest expense (w4a + s4a) – interest income (w9 + s10)– gain/loss on disposal of assets (w14 + s15) + miscellaneous expenses (w4b + w4c + s4b + s4c)
Net interest:Interest expense (w4a + s4a) – interest income (w9 + s10)
Net profit after tax (water and sewerage)Surplus before dividends (w15a + s16a) – tax equivalents paid (Note 2-1 (iv) + Note 3-1 (iv))
Community service obligations (water and sewerage)Grants for pensioner rebates (w11b + s12b)
Notes: 1. References to w (eg. s12) refer to item numbers within Special Schedules 5 and 6 ofCouncil’s Annual Financial Statements.
2. The NWI performance indicators are based upon the National Performance Framework Handbookfor Urban Performance Reporting Indicators and Definitions.
a refer to 3.2 (2) on page 15 of the Best-Practice Management of Water Supply and Sewerage Guidelines, 2007
NWI F25 $’000
NWI F24
NWI F23
NWI F22 %
1,033
122
5
(1,998)
192
$’000
-0.38%
2017

INDEPENDENT AUDITOR’S REPORT
Report on the special purpose financial statements
Snowy Valleys Council
To the Councillors of Snowy Valleys Council
Opinion
I have audited the accompanying special purpose financial statements (the financial statements) of
Snowy Valleys Council’s (the Council) Declared Business Activities, which comprise the statement of
financial position of each Declared Business Activity as at 30 June 2017, the income statement of
each Declared Business Activity for the period 13 May 2016 to 30 June 2017, notes comprising a
summary of significant accounting policies and other explanatory information for the Business
Activities declared by Council, and the Statement by Councillors and Management.
The Declared Business Activities of the Council are:
• Water Supply Business Activity
• Sewerage Business Activity
• Private Works
In my opinion, the financial statements present fairly, in all material respects, the financial position of
the Council’s declared Business Activities as at 30 June 2017, and their financial performance for the
period 13 May 2016 to 30 June 2017, in accordance with the Australian Accounting Standards
described in Note 1 and the Local Government Code of Accounting Practice and Financial Reporting
(LG Code).
My opinion should be read in conjunction with the rest of this report and in particular, the Emphasis of
Matter referring to the basis of accounting.
Basis for Opinion
I conducted my audit in accordance with Australian Auditing Standards. My responsibilities under the
standards are described in the ‘Auditor’s Responsibilities for the Audit of the Financial Statements’
section of my report.
I am independent of the Council in accordance with the requirements of the:
• Australian Auditing Standards
• Accounting Professional and Ethical Standards Board’s APES 110 ‘Code of Ethics for
Professional Accountants’ (APES 110).
I have fulfilled my other ethical responsibilities in accordance with APES 110.
Parliament promotes independence by ensuring the Auditor-General and the Audit Office of New
South Wales are not compromised in their roles by:
• providing that only Parliament, and not the executive government, can remove an
Auditor-General
• mandating the Auditor-General as the auditor of councils
• precluding the Auditor-General from providing non-audit services.

2
I believe the audit evidence I have obtained is sufficient and appropriate to provide a basis for my
audit opinion.
Emphasis of Matter - Basis of Accounting
Without modifying my opinion, I draw attention to Note (1) to the financial statements which describes
the basis of accounting. The financial statements have been prepared for the purpose of fulfilling
Council’s financial reporting responsibilities under the LG Code. As a result, the financial statements
may not be suitable for another purpose.
The Councillors’ Responsibility for the Financial Statements
The Councillors are responsible for the preparation and fair presentation of the financial statements
and for determining that the accounting policies, described in Note 1 to the financial statements, are
appropriate to meet the requirements in the LG Code. The Councillors’ responsibility also includes
such internal control as the Councillors determine is necessary to enable the preparation and fair
presentation of the financial statements that are free from material misstatement, whether due to fraud
or error.
In preparing the financial statements, the Councillors must assess the Council’s ability to continue as a
going concern except where the Council will be dissolved or amalgamated by an Act of Parliament.
The assessment must disclose, as applicable, matters related to going concern and the
appropriateness of using the going concern basis of accounting, as it affects the Council’s Declared
Business Activities.
Auditor’s Responsibility for the Audit of the Financial Statements
My objectives are to:
• obtain reasonable assurance about whether the financial statements as a whole are free from
material misstatement, whether due to fraud or error
• issue an Independent Auditor’s Report including my opinion.
Reasonable assurance is a high level of assurance, but does not guarantee an audit conducted in
accordance with Australian Auditing Standards will always detect material misstatements.
Misstatements can arise from fraud or error. Misstatements are considered material if, individually or
in aggregate, they could reasonably be expected to influence the economic decisions users take
based on the financial statements.
A description of my responsibilities for the audit of the financial statements is located at the Auditing
and Assurance Standards Board website at:
http://www.auasb.gov.au/auditors_responsibilities/ar4.pdf.
The description forms part of my auditor’s report.
My opinion does not provide assurance:
• on the best practice management disclosures in Notes 2 and 3 of the financial statements
• that the Council carried out its activities effectively, efficiently and economically
• about the security and controls over the electronic publication of the audited financial
statements on any website where they may be presented
• about any other information which may have been hyperlinked to/from the financial statements.
Lawrissa Chan
Director, Financial Audit Services
27 October 2017
SYDNEY

Snowy Valleys Council SPECIAL SCHEDULES for the period 13 May 2016 to 30 June 2017
Leading, engaging & supportingstrong & vibrant communities
Special Schedules 2017
page 1
Snowy Valleys Council
Special Schedules for the period 13 May 2016 to 30 June 2017
Contents
Special Schedules1
Net Cost of Services
Statement of Long Term Debt (all purposes)Statement of Internal Loans (Sect. 410(3) LGA 1993)
Water Supply Operations – incl. Income StatementWater Supply – Statement of Financial Position
Sewerage Service Operations – incl. Income StatementSewerage Service – Statement of Financial Position
Notes to Special Schedules 3 and 5
Report on Infrastructure Assets
Permissible Income Calculation
1 Special Schedules are not audited (with the exception of Special Schedule 8).
Background
These Special Schedules have been designed to meet the requirements of special purpose users such as;
the NSW Grants Commissionthe Australian Bureau of Statistics (ABS),the NSW Office of Water (NOW), andthe Office of Local Government (OLG).
The financial data is collected for various uses including;
the allocation of Financial Assistance Grants,the incorporation of Local Government financial figures in national statistics,the monitoring of loan approvals,the allocation of borrowing rights, andthe monitoring of the financial activities of specific services.
15Special Schedule 7
14
13
(ii)
(i)
Special Schedule 8 20
Special Schedule 6Special Schedule 5 10
Page
2
4
6
Special Schedule 1
Special Schedule 2(a)5
Special Schedule 4
Special Schedule 2(b)
Special Schedule 39

Special Schedules 2017
page 2
Snowy Valleys Council
Special Schedule 1 – Net Cost of Services for the period 13 May 2016 to 30 June 2017
$’000
Governance
Administration
Public order and safety
Beach controlEnforcement of local government regulationsAnimal controlOtherTotal public order and safety
Health
EnvironmentNoxious plants and insect/vermin controlOther environmental protectionSolid waste managementStreet cleaningDrainageStormwater managementTotal environment
Community services and educationAdministration and educationSocial protection (welfare)Aged persons and disabledChildren’s servicesTotal community services and education
Housing and community amenitiesPublic cemeteriesPublic conveniencesStreet lightingTown planningOther community amenitiesTotal housing and community amenities
Water supplies
Sewerage services
8
– –
Expenses from. continuing. operations. Non-capital.
117
–
30 –
Capital.
Income fromcontinuing operations
11
91
33 183
2,783
738
3,029
80
–
–
–
18 77
–
444
2,450 8
7,691
45
4,983 4,605 41
–
(59)
– (351)
(367) (139)
– –
–
–
335
842
5,177
15,308
1,309
13,924
– – (906)
– (132)
–
223
218 –
1,644 –
10,703
662
Function or activity
–
Fire service levy, fire protection, emergency services
–
8
184 811
Net cost.of services.
(106) –
(647)
–
(128) (396)
750 1 – (749)
(153) – –
9,319
–
65
192
504
2,871
351
553 –
20
– –
1,758
335
101 –
2,366
3,165 426
–
– –
49
1,889
(2,494)
(916)
(421)
– 2,359
–
419
(470)
(9)
425 –
–
8 (47)
(101)
–
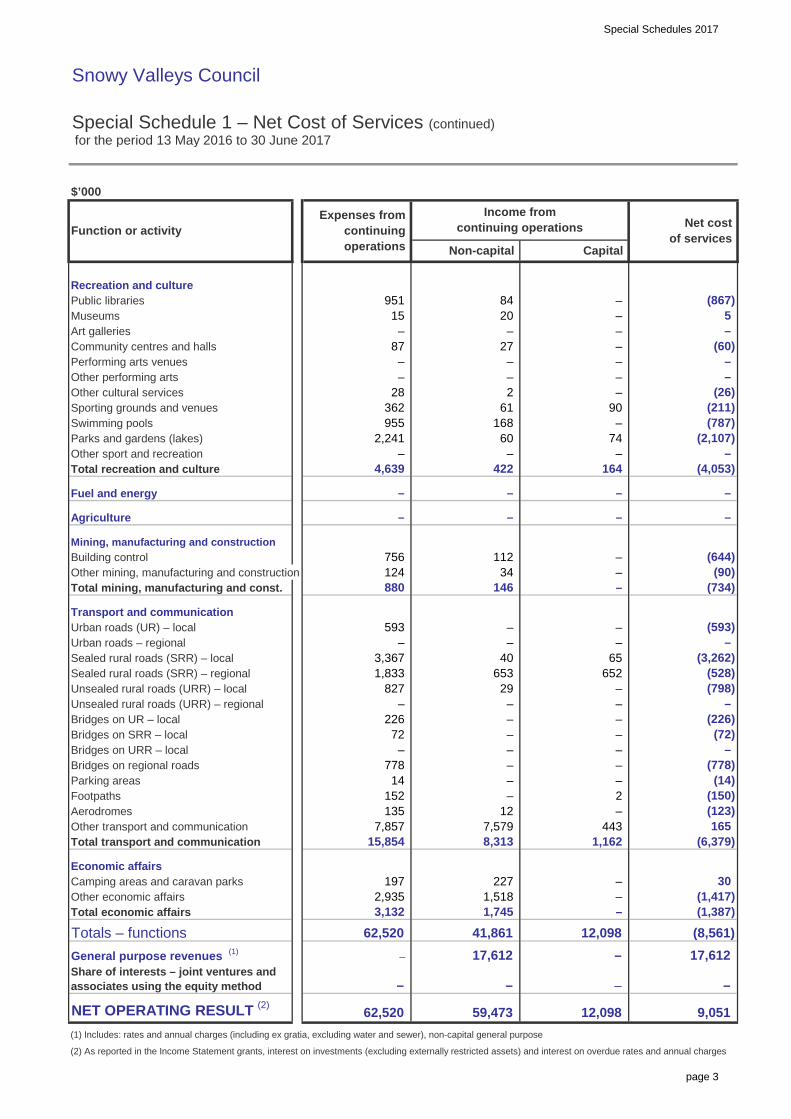
Special Schedules 2017
page 3
Snowy Valleys Council
Special Schedule 1 – Net Cost of Services (continued) for the period 13 May 2016 to 30 June 2017
$’000
Recreation and culturePublic librariesMuseumsArt galleriesCommunity centres and hallsPerforming arts venuesOther performing artsOther cultural servicesSporting grounds and venuesSwimming poolsParks and gardens (lakes)Other sport and recreationTotal recreation and culture
Fuel and energy
Agriculture
Mining, manufacturing and constructionBuilding controlOther mining, manufacturing and constructionTotal mining, manufacturing and const.
Transport and communicationUrban roads (UR) – localUrban roads – regionalSealed rural roads (SRR) – localSealed rural roads (SRR) – regionalUnsealed rural roads (URR) – localUnsealed rural roads (URR) – regionalBridges on UR – localBridges on SRR – localBridges on URR – localBridges on regional roadsParking areasFootpathsAerodromesOther transport and communicationTotal transport and communication
Economic affairsCamping areas and caravan parksOther economic affairsTotal economic affairs
Totals – functionsGeneral purpose revenues (1)
NET OPERATING RESULT (2)
(1) Includes: rates and annual charges (including ex gratia, excluding water and sewer), non-capital general purpose
(2) As reported in the Income Statement grants, interest on investments (excluding externally restricted assets) and interest on overdue rates and annual charges
Income fromcontinuing operations
– – 20
168
84
–
62,520
–
15,854 8,313
3,132 2,935
59,473
1,745
227 197
17,612 62,520
1,518
–
41,861 –
– –
12,098
–
–
443
– 12
–
– 7,579
14
7,857 135 152 2
778
226
– –
1,162
Function or activity
146
–
–
–
–
34 –
–
–
90
–
–
72
–
–
–
–
124
– –
–
164 4,639 – –
422
– –
–
880
756
– – 3,367 40
–
–
Non-capital.
–
Expenses from. continuing. operations.
2,241
362 955
28
27
2 –
653 827
– –
593 –
1,833
112
61
65
(150)
(787)
– (26)
–
(4,053)
74 60
–
Capital.
–
–
–
–
652 – 29
12,098
–
(528) (798)
– (226)
9,051
–
(8,561) (1,387)
30
(6,379) 165
(1,417)
–
(14)
(123)
–
–
17,612 –
951 15
–
(867) 5
87
(778)
–
(734)
(211)
(60)
–
Net cost.of services.
(72)
(644)
–
(90)
(593)
(3,262)
–
– (2,107)
Share of interests – joint ventures and associates using the equity method

Special Schedules 2017
page 4
Snowy Valleys Council
Special Schedule 2(a) – Statement of Long Term Debt (all purpose) for the period 13 May 2016 to 30 June 2017
$’000
Spe
pag
Notes: excludes (i) internal loans and (ii) principal inflows/outflows relating to loan re-financing. This schedule is prepared using the face value of debt obligations, rather than fair value (which are reported in the GPFS).
–
– Deferred payments
– –
1,229
–
11,633
– – – – Total long term debt – –
Total debt
–
12,862
–
– 1,254
–
1,183
– – –
11,608
– – –
10,425
–
799 –
–
– – –
– –
– – – – –
Other long term debtRatepayers advances – – –
– Government advances – Finance leases –
– – – –
– –
Financial institutions 1,034 10,909 11,943 – –
– –
–
–
– 1,254 – 195 –
1,059
1,229 11,633 Total loans919
12,862 Other 195 724
Other State Government – – – – –
– – – – –
NSW Treasury Corporation–
Public subscription – –
– – – – –
– –
10,884
– – –
Debt redemption during the period
From revenue
Sinking funds
– 750
–
–
–
–
1,019 9,865 – –
– – –
Principal outstandingat the end of the period
TotalNon-current
–
– – –
– – –
–
724
–
– – – –
11,608 1,183 164 560
799 49
10,425
– –
New loans raised during
the periodClassification of debt
Loans (by source)Commonwealth Government
Current
– – – – – – –
Transfers to sinking
funds
Interest applicable
for the periodCurrent Non-
current Total
–
Principal outstandingat beginning of the period
(former Councils)

Special Schedules 2017
page 5
Snowy Valleys Council
Special Schedule 2(b) – Statement of Internal Loans [Section 410(3) of the Local Government Act 1993] for the period 13 May 2016 to 30 June 2017
$’000
Note: the summary of internal loans (above) represents the total of Council’s internal loans categorised according to the borrower.
Summary of internal loans
Details of individual internal loans
Principal outstanding (principal and interest) at end of period
Sewer
Total repaid during the period Amount originally raised
Other
Borrower (by purpose)
GeneralWater
Domestic waste management
600,000 75,031 154,319
Amount Principal Term
75,031
111,136 47,705 350,000
154,319
250,000 43,183
600,000
27,326
Totals 600,000 75,031 154,319
Gas
outstanding at end of period
Date ofBorrower Lender Dates of
(princ. and int.)
Total repaid during period
maturity interest raised Rate of originally
(by purpose) (by purpose) approval (years) Date raisedminister’s
11 14
31/12/08Pool Loan General Reserve
Totals
6.50%10/11/04
31/12/1910/11/18 5.00%
Caravan Park Loan ELE Reserve

Special Schedules 2017
page 6
Snowy Valleys Council
Special Schedule 3 – Water Supply Income Statement Includes all internal transactions, i.e. prepared on a gross basis for the period 13 May 2016 to 30 June 2017
$’000
A Expenses and incomeExpenses
1. Management expensesa. Administrationb. Engineering and supervision
2. Operation and maintenance expenses– dams and weirsa. Operation expensesb. Maintenance expenses
– Mainsc. Operation expensesd. Maintenance expenses
– Reservoirse. Operation expensesf. Maintenance expenses
– Pumping stationsg. Operation expenses (excluding energy costs)h. Energy costsi. Maintenance expenses
– Treatmentj. Operation expenses (excluding chemical costs)k. Chemical costsl. Maintenance expenses
– Otherm. Operation expensesn. Maintenance expenseso. Purchase of water
3. Depreciation expensesa. System assetsb. Plant and equipment
4. Miscellaneous expensesa. Interest expensesb. Revaluation decrementsc. Other expensesd. Impairment – system assetse. Impairment – plant and equipmentf. Aboriginal Communities Water and Sewerage Programg. Tax equivalents dividends (actually paid)
5. Total expenses 7,515
Actuals
61
13/5/16 to 30/6/17
–
733
–
1,325
320
–
–
25
63
–
59 275
735
21 140
–
– 411
340 2,525
409
14
– 59
–

Special Schedules 2017
page 7
Snowy Valleys Council
Special Schedule 3 – Water Supply Income Statement (continued) Includes all internal transactions, i.e. prepared on a gross basis for the period 13 May 2016 to 30 June 2017
$’000
Income
6. Residential chargesa. Access (including rates)b. Usage charges
7. Non-residential chargesa. Access (including rates)b. Usage charges
8. Extra charges
9. Interest income
10. Other income10a. Aboriginal Communities Water and Sewerage Program
11. Grantsa. Grants for acquisition of assetsb. Grants for pensioner rebatesc. Other grants
12. Contributionsa. Developer chargesb. Developer provided assetsc. Other contributions
13. Total income
14. Gain (or loss) on disposal of assets
15. Operating result
15a. Operating result (less grants for acquisition of assets)
–
3,527 1,434
Actuals
(2,360)
–
10
(2,360)
(97)
47
5,252
–
–
13/5/16 to 30/6/17
144
63
–
–
–
27

Special Schedules 2017
page 8
Snowy Valleys Council
Special Schedule 3 – Water Supply Income Statement (continued) Includes all internal transactions, i.e. prepared on a gross basis for the period 13 May 2016 to 30 June 2017
$’000
B Capital transactionsNon-operating expenditures
16. Acquisition of fixed assetsa. New assets for improved standardsb. New assets for growthc. Renewalsd. Plant and equipment
17. Repayment of debt
18. Totals
Non-operating funds employed
19. Proceeds from disposal of assets
20. Borrowing utilised
21. Totals
C Rates and charges
22. Number of assessmentsa. Residential (occupied)b. Residential (unoccupied, ie. vacant lot)c. Non-residential (occupied)d. Non-residential (unoccupied, ie. vacant lot)
23. Number of ETs for which developer charges were received
24. Total amount of pensioner rebates (actual dollars)
817 10
– ET
105,663$
–
Actuals
501
–
–
109
758
5,038
517
1,776
–
13/5/16 to 30/6/17
–

Special Schedules 2017
page 9
Snowy Valleys Council
Special Schedule 4 – Water Supply Statement of Financial Position Includes internal transactions, i.e. prepared on a gross basis as at 30 June 2017
$’000
ASSETS25. Cash and investments
a. Developer chargesb. Special purpose grantsc. Accrued leaved. Unexpended loanse. Sinking fundf. Other
26. Receivablesa. Specific purpose grantsb. Rates and availability chargesc. User chargesd. Other
27. Inventories
28. Property, plant and equipmenta. System assetsb. Plant and equipment
29. Other assets
30. Total assets
LIABILITIES31. Bank overdraft32. Creditors
33. Borrowings
34. Provisionsa. Tax equivalentsb. Dividendc. Other
35. Total liabilities
36. NET ASSETS COMMITTED
EQUITY37. Accumulated surplus38. Asset revaluation reserve39. Other reserves
40. TOTAL EQUITY
Note to system assets:41. Current replacement cost of system assets42. Accumulated current cost depreciation of system assets43. Written down current cost of system assets
Actuals Current
826 –
Actuals
– –
–
– –
–
Actuals Total
826
– –
47,296
1,961
1,712 –
Non-current
–
–
27
–
–
137
–
–
1,961 –
1,712
54,457
–
– –
–
4,636
47,296
– – – –
–
– –
54,571
47,296
70,472 (23,176)
–
54,571
54,571
4,522
–
–
137
–
–
59,093
–
50,498 4,073
–
3,959 4,495 536
3,959
–
– –
– –
–
7,161
– 27
7,161
–
– –
563

Special Schedules 2017
page 10
Snowy Valleys Council
Special Schedule 5 – Sewerage Service Income Statement Includes all internal transactions, i.e. prepared on a gross basis for the period 13 May 2016 to 30 June 2017
$’000
A Expenses and incomeExpenses
1. Management expensesa. Administrationb. Engineering and supervision
2. Operation and maintenance expenses– mainsa. Operation expensesb. Maintenance expenses
– Pumping stationsc. Operation expenses (excluding energy costs)
d. Energy costse. Maintenance expenses
– Treatmentf. Operation expenses (excl. chemical, energy, effluent and biosolids management costs)
g. Chemical costsh. Energy costsi. Effluent managementj. Biosolids managementk. Maintenance expenses
– Otherl. Operation expensesm. Maintenance expenses
3. Depreciation expensesa. System assetsb. Plant and equipment
4. Miscellaneous expensesa. Interest expensesb. Revaluation decrementsc. Other expensesd. Impairment – system assetse. Impairment – plant and equipmentf. Aboriginal Communities Water and Sewerage Programg. Tax equivalents dividends (actually paid)
5. Total expenses
291 95
461
–
32 113
–
–
40
13
64
217
–
– –
–
993
4,598
941 54
183 79
–
966
Actuals 13/5/16
to 30/6/17
56
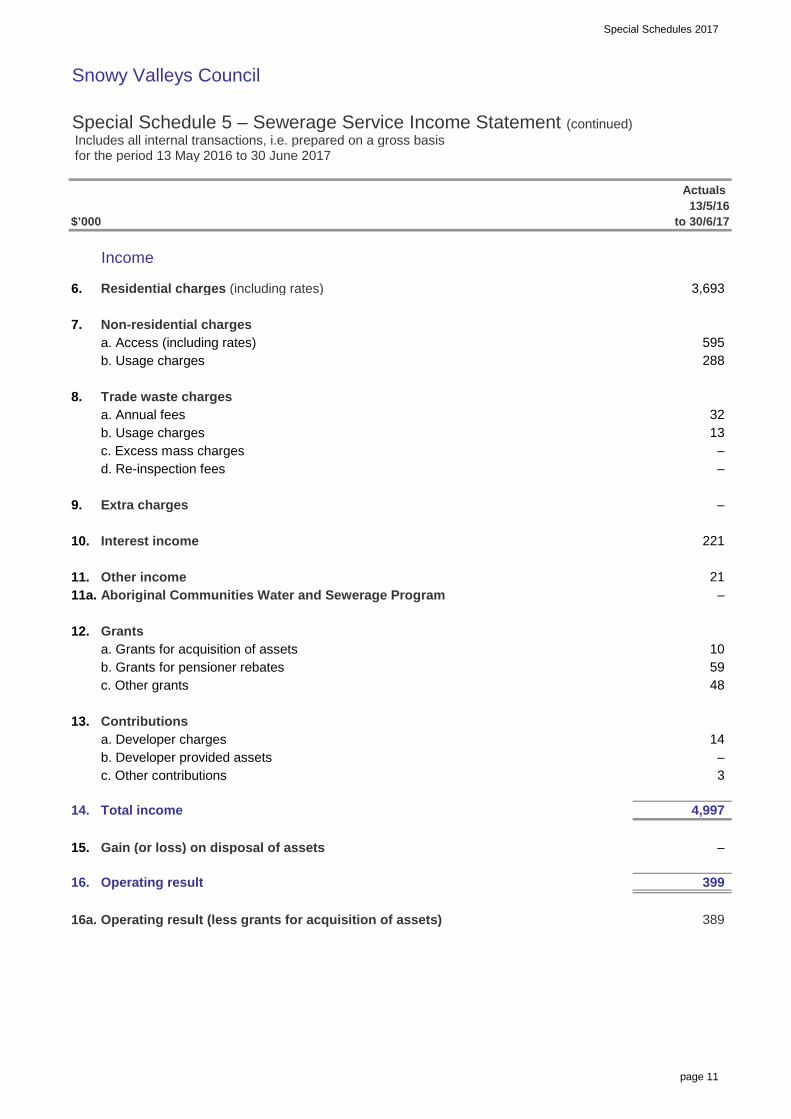
Special Schedules 2017
page 11
Snowy Valleys Council
Special Schedule 5 – Sewerage Service Income Statement (continued) Includes all internal transactions, i.e. prepared on a gross basis for the period 13 May 2016 to 30 June 2017
$’000
Income
6. Residential charges (including rates)
7. Non-residential chargesa. Access (including rates)b. Usage charges
8. Trade waste chargesa. Annual feesb. Usage chargesc. Excess mass chargesd. Re-inspection fees
9. Extra charges
10. Interest income
11. Other income11a. Aboriginal Communities Water and Sewerage Program
12. Grantsa. Grants for acquisition of assetsb. Grants for pensioner rebatesc. Other grants
13. Contributionsa. Developer chargesb. Developer provided assetsc. Other contributions
14. Total income
15. Gain (or loss) on disposal of assets
16. Operating result
16a. Operating result (less grants for acquisition of assets)
3,693
Actuals 13/5/16
to 30/6/17
14
21 –
48
288 595
32
59 10
4,997
–
–
399
389
3
221
13
–
– –
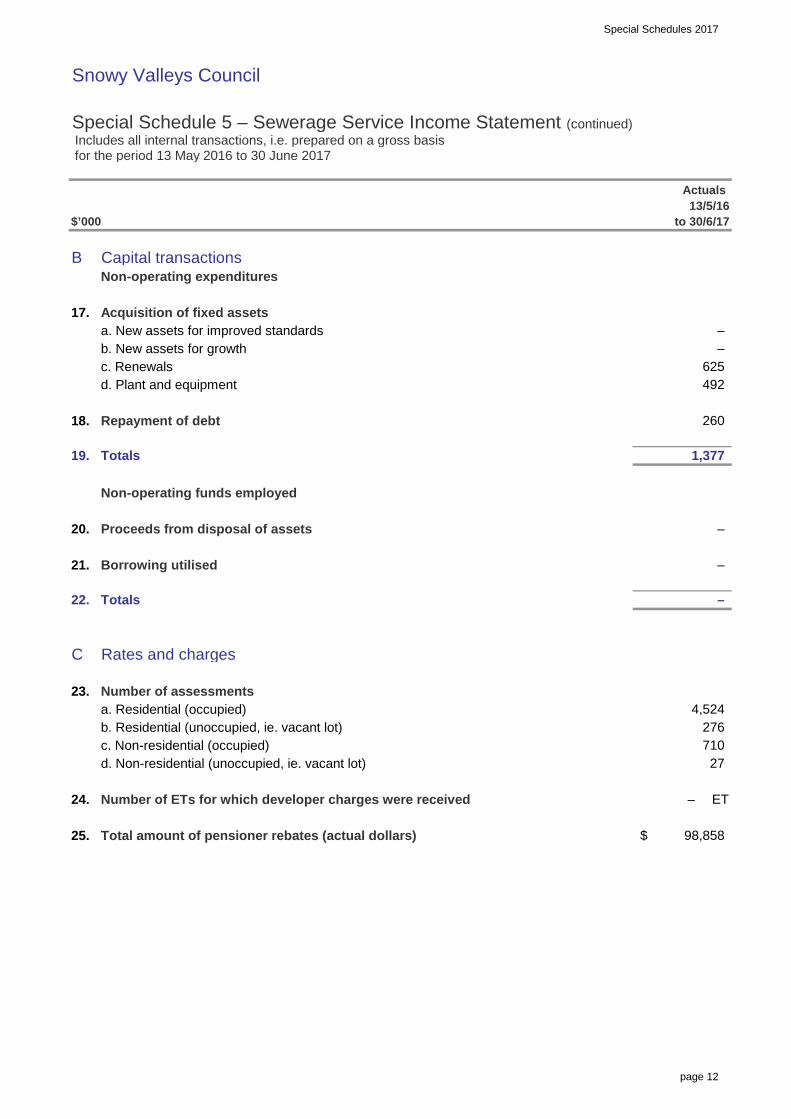
Special Schedules 2017
page 12
Snowy Valleys Council
Special Schedule 5 – Sewerage Service Income Statement (continued) Includes all internal transactions, i.e. prepared on a gross basis for the period 13 May 2016 to 30 June 2017
$’000
B Capital transactionsNon-operating expenditures
17. Acquisition of fixed assetsa. New assets for improved standardsb. New assets for growthc. Renewalsd. Plant and equipment
18. Repayment of debt
19. Totals
Non-operating funds employed
20. Proceeds from disposal of assets
21. Borrowing utilised
22. Totals
C Rates and charges
23. Number of assessmentsa. Residential (occupied)b. Residential (unoccupied, ie. vacant lot)c. Non-residential (occupied)d. Non-residential (unoccupied, ie. vacant lot)
24. Number of ETs for which developer charges were received
25. Total amount of pensioner rebates (actual dollars)
4,524
1,377
–
–
98,858$
–
710 276
27
260
–
Actuals 13/5/16
to 30/6/17
– ET
625 492
–

Special Schedules 2017
page 13
Snowy Valleys Council
Special Schedule 6 – Sewerage Service Statement of Financial Position Includes internal transactions, i.e. prepared on a gross basis as at 30 June 2017
$’000
ASSETS26. Cash and investments
a. Developer chargesb. Special purpose grantsc. Accrued leaved. Unexpended loanse. Sinking fundf. Other
27. Receivablesa. Specific purpose grantsb. Rates and availability chargesc. User chargesd. Other
28. Inventories
29. Property, plant and equipmenta. System assetsb. Plant and equipment
30. Other assets
31. Total assets
LIABILITIES32. Bank overdraft33. Creditors
34. Borrowings
35. Provisionsa. Tax equivalentsb. Dividendc. Other
36. Total liabilities
37. NET ASSETS COMMITTED
EQUITY38. Accumulated surplus39. Asset revaluation reserve40. Other reserves
41. TOTAL EQUITY
Note to system assets:42. Current replacement cost of system assets43. Accumulated current cost depreciation of system assets44. Written down current cost of system assets
6,088
–
27
– –
– –
–
290 3,536
–
– –
68,214
3,826
– – –
263
–
67,095
55,910
81,549 (25,639)
1,119
68,214
62,126
27
–
2,057
–
72,040
55,910
65,662
–
3,799
–
–
3,536
– – 9,752
55,910
6,378
–
9,752
372 – –
–
–
–
–
31
–
– –
–
–
372 –
Actuals
– – –
– –
Non-current Current
3,918 – –
–
–
Total Actuals
– –
2,057
3,918
31
Actuals
Special Schedules 2017
page 14
Snowy Valleys Council
Notes to Special Schedules 3 and 5 for the period 13 May 2016 to 30 June 2017
Administration (1) Engineering and supervision (1)
(item 1a of Special Schedules 3 and 5) comprises the following: (item 1b of Special Schedules 3 and 5) comprises the following:
• Administration staff: • Engineering staff:− Salaries and allowance − Salaries and allowance− Travelling expenses − Travelling expenses− Accrual of leave entitlements − Accrual of leave entitlements− Employment overheads. − Employment overheads.
• Meter reading • Other technical and supervision staff:− Salaries and allowance
• Bad and doubtful debts − Travelling expenses− Accrual of leave entitlements
• Other administrative/corporate support services − Employment overheads.
Operational expenses (item 2 of Special Schedules 3 and 5) comprise the day to day operational expensesexcluding maintenance expenses.
Maintenance expenses (item 2 of Special Schedules 3 and 5) comprise the day to day repair and maintenanceexpenses. (Refer to Section 5 of the Local Government Asset Accounting Manual regarding capitalisationprinciples and the distinction between capital and maintenance expenditure).
Other expenses (item 4c of Special Schedules 3 and 5) includes all expenses not recorded elsewhere.
Revaluation decrements (item 4b of Special Schedules 3 and 5) is to be used when I,PP&E decreases in FV.
Impairment losses (item 4d and 4e of Special Schedules 3 and 5) are to be used when the carrying amount ofan asset exceeds its recoverable amount (refer to page D-31).
Aboriginal Communities Water and Sewerage Program (item 4f of Special Schedules 3 and 5) is to beused when operation and maintenance work has been undertaken on behalf of the Aboriginal CommunitiesWater and Sewerage Program. Similarly, income for item 11a of Special Schedule 3 and item 12a of SpecialSchedule 5 are for services provided to the Aboriginal Communities Water and Sewerage Program and is notpart of Council’s water supply and sewerage revenue.
Residential charges
(2) (items 6a, 6b and item 6 of Special Schedules 3 and 5 respectively) include all incomefrom residential charges. Item 6 of Schedule 3 should be separated into 6a access charges (including rates ifapplicable) and 6b usage charges.
Non-residential charges
(2) (items 7a, 7b of Special Schedules 3 and 5) include all income from non-residentialcharges separated into 7a access charges (including rates if applicable) and 7b usage charges.
Trade waste charges (item 8 of Special Schedule 5) include all income from trade waste charges separatedinto 8a annual fees, 8b usage charges and 8c excess mass charges and 8d re-inspection fees.
Other income (items 10 and 11 of Special Schedules 3 and 5 respectively) include all income not recordedelsewhere.
Other contributions (items 12c and 13c of Special Schedules 3 and 5 respectively) including capital contributionsfor water supply or sewerage services received by Council under Section 565 of the Local Government Act .
Notes:(1) Administration and engineering costs for the development of capital works projects should be reported as part of the capital cost of the project and not as part of the recurrent expenditure (ie. in item 16 for water supply and item 17 for sewerage, and not in items 1a and 1b).
(2) To enable accurate reporting of residential revenue from usage charges, it is essential for councils to accurately separate their residential (item 6) charges and non-residential (item 7) charges.
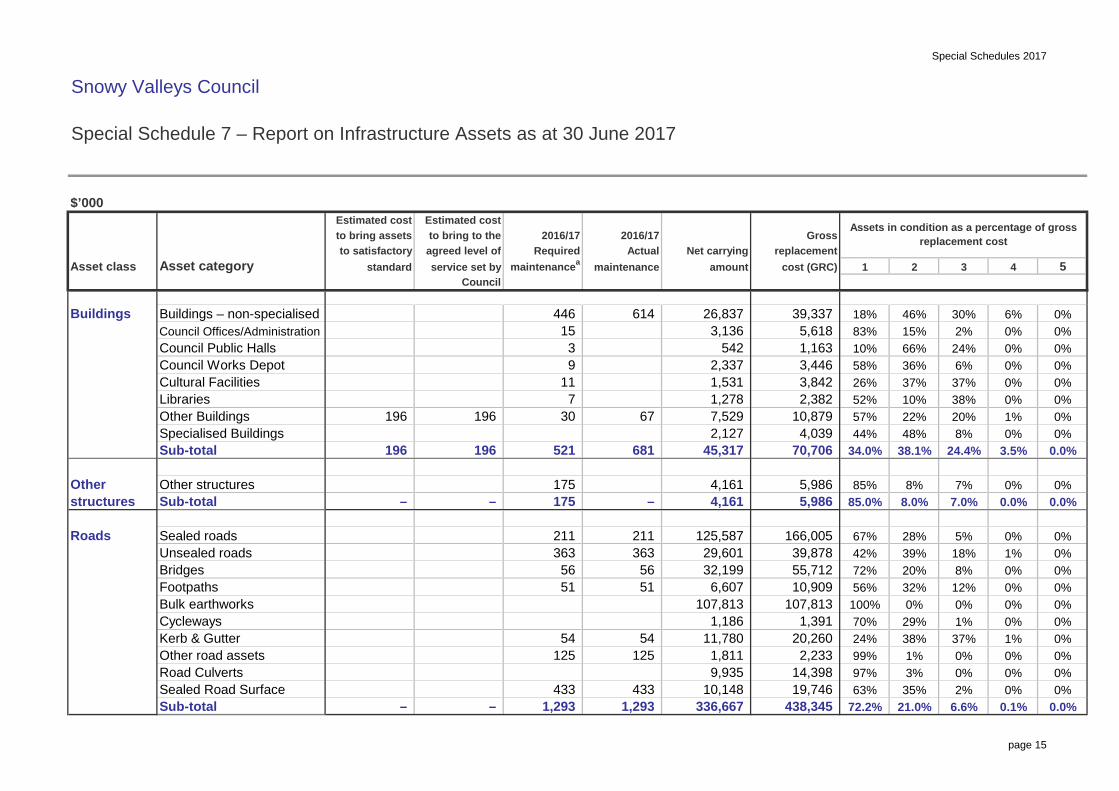
Special Schedules 2017
page 15
Snowy Valleys Council
Special Schedule 7 – Report on Infrastructure Assets as at 30 June 2017 as at 30 June 2017
$’000
–
211 363
0.0%
0%99%0%
19,746 63% 35%
0% 0%1%20,260 24% 37% 0%2,233
438,345
3%
0%
0%
125
–
0%0%
7
1,293
0%85.0%
51
363 0%
72.2%
5,986 0.0%
125
1,293
Other road assets
Sub-totalSealed Road Surface 433
30
70,706 3.5%
0%
5%67%
8.0%–
521
175
56 56
Road Culverts
Bulk earthworks51
Kerb & Gutter
– 433
Footpaths
Cycleways
196
54 54
0%0%3,446 58%
26%
0%166,005 39,878
211 1%
8%
0%
0%0%
37%6%
37%
5
10%
Other Buildings
Council Works DepotCultural Facilities
3
Buildings – non-specialised
0%0%
38.1%
22%48%
614 446 0%15%
18%
24%
4
67 0%
0%
52%
5,618
0%
2%
1%20%
36%
30%
38%
6%39,337
0%
0.0%
46%
44%
28%
0%
Buildings
Roads
Other
Sub-totalSpecialised Buildings
3,842
196
83%66%
2,382 10%
15
Asset category
Council Public Halls 3
Required Actual replacementcost (GRC)maintenancea
to satisfactory
Estimated cost
agreed level ofservice set by
Council21
8%
0.0%
0%
Sealed roads
Other structuresSub-total
Asset class
to bring assetsEstimated cost
2016/17to bring to the 2016/17 Gross
standard maintenance
11
Council Offices/Administration
Libraries
85% 8% 7%5,986
542 2,337 1,531
1,163 9
24.4%
20%32%
72%
100%
1,278 7,529 2,127
45,317
4,161
10,879 4,039
Unsealed roads
57%
–
0%
Bridges
4,161
125,587 29,601 32,199 6,607
107,813 1,186
structures
29%70%
12%
0%0%
6.6% 0.1%
14,398
38%
0%21.0%
97%10,148
336,667
0%
175
1%
196
196 681 34.0%
56%
1%0%0%
0%10,909 0%
55,712
107,813
7.0%
0% 0%
11,780 1,811 9,935
Assets in condition as a percentage of gross replacement cost
Net carryingamount
26,837 3,136
2%
18%42% 39%
1,391
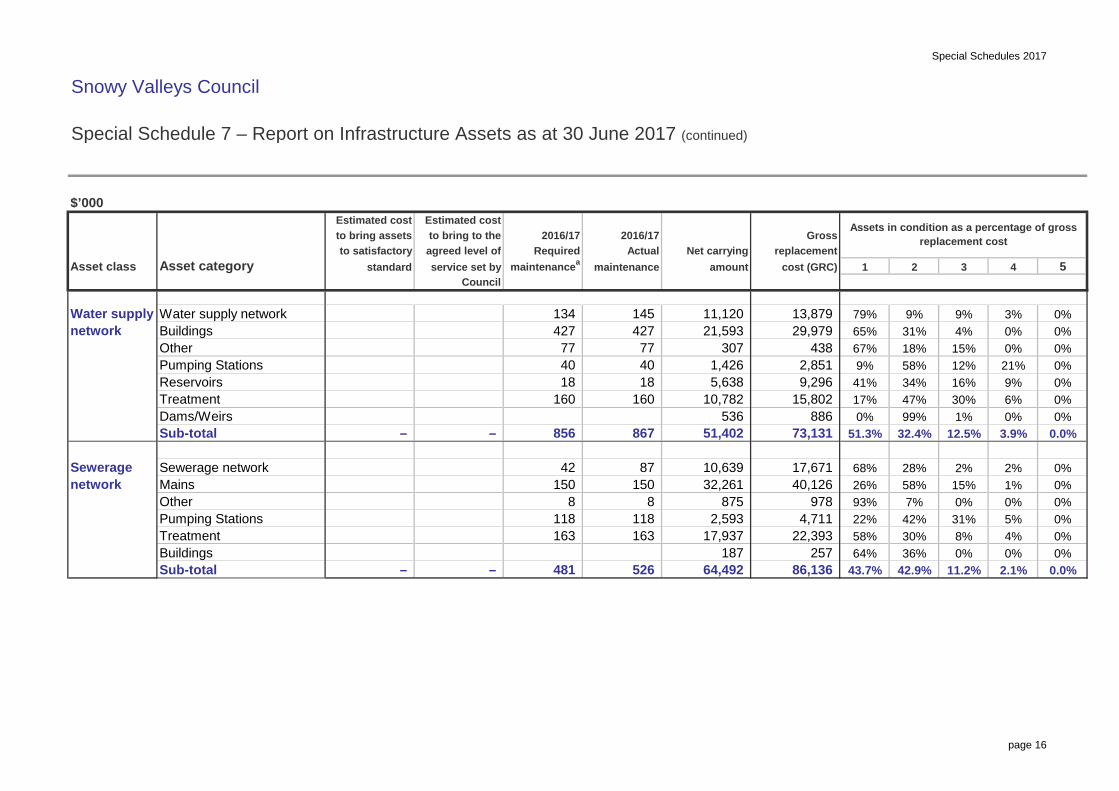
Special Schedules 2017
page 16
Snowy Valleys Council
Special Schedule 7 – Report on Infrastructure Assets as at 30 June 2017 (continued) as at 30 June 2017
$’000
0% 0%978 31% 5%0%
42.9%
Pumping Stations
Water supply
networkSewerage
Reservoirs
Dams/Weirs
Buildings network
Other
0%32,261 1%
maintenance
79%13,879 9%4% 0%
21%
3%
9%
2
9%
438 18% 0%12%
0%
67%
3
GrossEstimated cost
3.9%32.4% 0.0%12.5%51.3%73,131
1
58%
cost (GRC)
0%
ActualRequired2016/17
agreed level of
Other
Water supply network
40
160 18
160
867 –
40
to satisfactorystandard
to bring assets
134
maintenanceareplacement
5Asset class
2016/17Estimated costto bring to the
service set byCouncil
17,671 87
17%
65%
6%1%
4%0%
30%
29,979 15%
68% 28%
99%
41%0%
886
31%
0%47%
9%15,802
0%16%34%
4,711
Treatment
–
Mains
0%
Sewerage network
Sub-total
8
536 51,402
10,639
Asset category
145 427
18 9,296
526 – 11.2%Buildings 36%
42 26% 58%40,126
2%
7%
58%42%
481
8
2%
–
150
64%
30%
0%
150
22%93%
0%
0%0%
2.1%
118 22,393
118
257 43.7%64,492 86,136
163
4
427
15%
Sub-total
Pumping Stations Treatment
187
2,851
Net carryingamount
0%
856
77 77
11,120 21,593
307
17,937
0.0%
0%
8%0%
163 0%
Assets in condition as a percentage of gross replacement cost
1,426 5,638
10,782
875 2,593

Special Schedules 2017
page 17
Snowy Valleys Council
Special Schedule 7 – Report on Infrastructure Assets as at 30 June 2017 (continued) as at 30 June 2017
$’000
Notes:a Required maintenance is the amount identified in Council’s asset management plans.
Infrastructure asset condition assessment ‘key’
Excellent No work required (normal maintenance)Good Only minor maintenance work requiredAverage Maintenance work requiredPoor Renewal requiredVery poor Urgent renewal/upgrading required
5
0%
replacement
0%
14%drainage
5
–
Open space/
Stormwater
maintenancea
69%
Gross
6,178
maintenanceActualRequiredto satisfactory
standard
21,398
3,823 1,237
–
Other Open Space/Recreatio
Net carryingamount
18%6,547 0%19%81%23,369
36,287 Sub-total 70.2%
Asset category
Head Walls
to bring to the
Council
Estimated cost
agreed level ofservice set by 3cost (GRC)
0%
0%
0%
3,552 113
4,098 13,635
0%
26 32 0%
2016/17
0%0%
85% 2%
recreational Swimming pools 3,734 28%–
13%
2016/17
17%
21
0.0% 0.0%
0%72% 0%
36.1% 5.9% 0.0% 0.0%5,060
308 100.0% 0.0%
100% 0% 0% 0% 0%
18.0% 0.0%11.8%
0% 0%
32 0.0%26
4
assets Sub-total
to bring assets
Asset class
0%
– –
Stormwater Conduits Inlet and Junction Pits
Stormwater drainage193
82%
0.0%infrastructure
308
– – – 9,076 58.0%
5,342 79% 11% 10%
Other Other Infrastructure Assets
Estimated cost
319
319 – assets Sub-total –
719,975 62.8% 26.4% 9.8% 1.1% 0.0%196
Assets in condition as a percentage of gross replacement cost
4321
528,816 TOTAL – ALL ASSETS 196 3,352 3,399
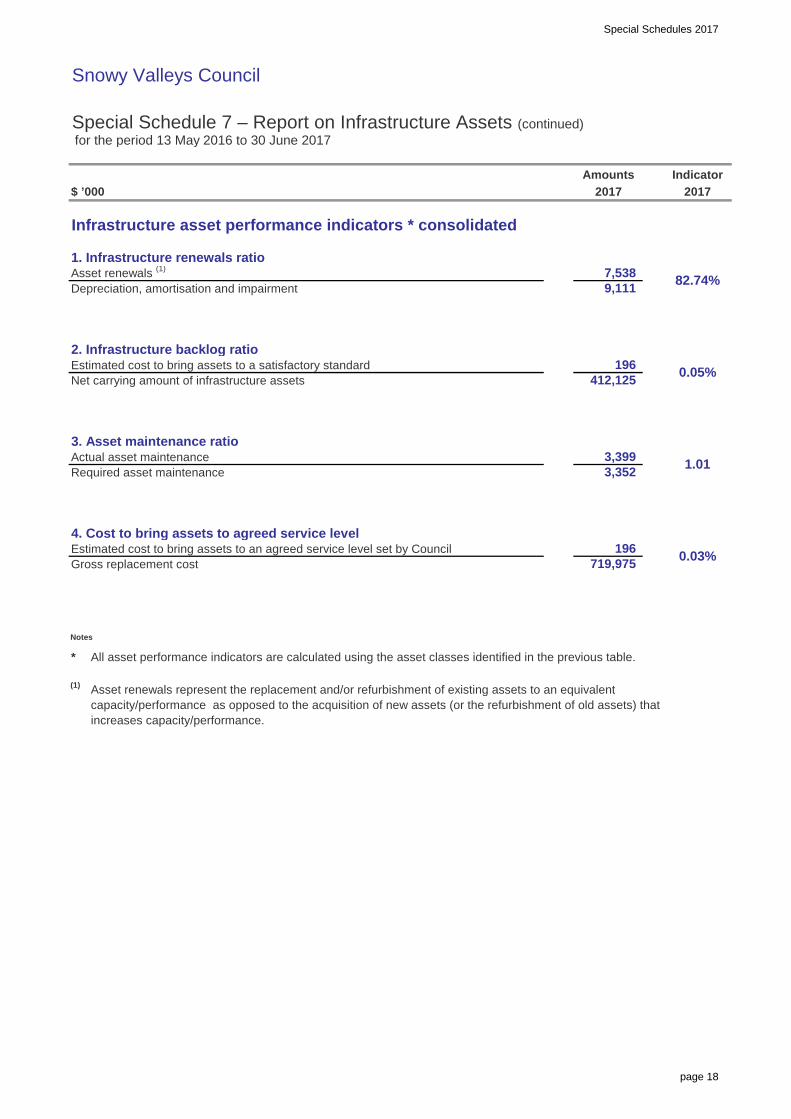
Special Schedules 2017
page 18
Snowy Valleys Council
Special Schedule 7 – Report on Infrastructure Assets (continued) for the period 13 May 2016 to 30 June 2017
$ ’000
Infrastructure asset performance indicators * consolidated
1. Infrastructure renewals ratioAsset renewals (1)
Depreciation, amortisation and impairment
2. Infrastructure backlog ratioEstimated cost to bring assets to a satisfactory standardNet carrying amount of infrastructure assets
3. Asset maintenance ratioActual asset maintenanceRequired asset maintenance
4. Cost to bring assets to agreed service levelEstimated cost to bring assets to an agreed service level set by CouncilGross replacement cost
Notes
* All asset performance indicators are calculated using the asset classes identified in the previous table.
(1) Asset renewals represent the replacement and/or refurbishment of existing assets to an equivalent capacity/performance as opposed to the acquisition of new assets (or the refurbishment of old assets) that increases capacity/performance.
196 719,975
Indicator
196 0.05%412,125
2017 2017
7,538 82.74%9,111
Amounts
3,352
0.03%
3,399 1.01

Special Schedules 2017
page 19
Snowy Valleys Council
Special Schedule 7 – Report on Infrastructure Assets (continued) for the period 13 May 2016 to 30 June 2017
$ ’000
Infrastructure asset performance indicators by fund
1. Infrastructure renewals ratioAsset renewals (2)
Depreciation, amortisation and impairment
2. Infrastructure backlog ratioEstimated cost to bring assets to a satisfactory standardNet carrying amount of infrastructure assets
3. Asset maintenance ratioActual asset maintenanceRequired asset maintenance
4. Cost to bring assets to agreed service levelEstimated cost to bring assets to an agreed service level set by CouncilGross replacement cost
Notes
(1) General fund refers to all of Council’s activities except for its water and sewer activities which are listed separately.
(2) Asset renewals represent the replacement and/or refurbishment of existing assets to an equivalentcapacity/performance as opposed to the acquisition of new assets (or the refurbishment of old assets) thatincreases capacity/performance.
36.31% 23.48% 96.12%
Water Sewer General (1)
2017 2017 2017
1.01 1.09 1.00
0.00% 0.00% 0.07%
0.00% 0.00% 0.03%
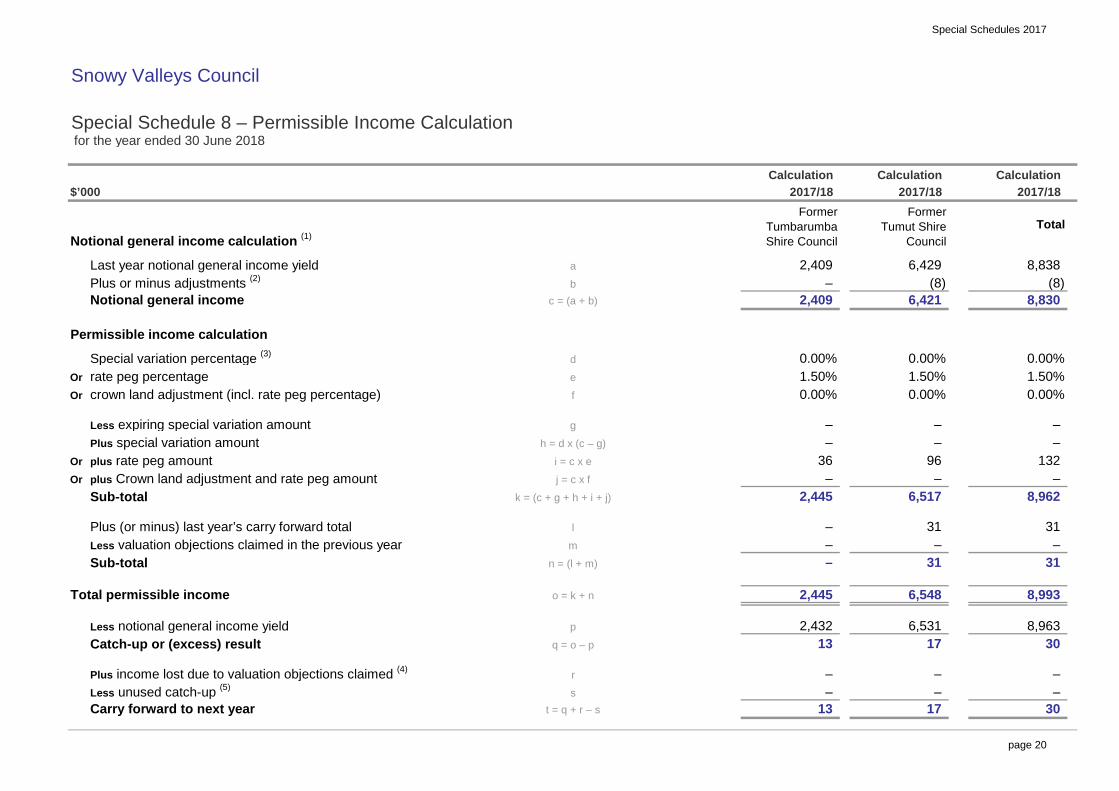
Special Schedules 2017
page 20
Snowy Valleys Council
Special Schedule 8 – Permissible Income Calculation for the year ended 30 June 2018
$’000
Notional general income calculation (1)
Last year notional general income yieldPlus or minus adjustments (2)
Notional general income
Permissible income calculation
Special variation percentage (3)
Or rate peg percentageOr crown land adjustment (incl. rate peg percentage)
Less expiring special variation amountPlus special variation amount
Or plus rate peg amountOr plus Crown land adjustment and rate peg amount
Sub-total
Plus (or minus) last year’s carry forward totalLess valuation objections claimed in the previous yearSub-total
Total permissible income
Less notional general income yieldCatch-up or (excess) result
Plus income lost due to valuation objections claimed (4)
Less unused catch-up (5)
Carry forward to next year
q = o – p
rs
t = q + r – s
b
def
j = c x fi = c x e
h = d x (c – g)
c = (a + b)
p 8,963
a
30
Calculation2017/18
–
30
–
lm
n = (l + m)
o = k + n
g
k = (c + g + h + i + j)
– 31
8,993
– –
31
132 –
8,962
1.50%0.00%
8,838
Total
0.00%
Calculation2017/18
6,429
FormerTumut Shire
Council
(8) 8,830
0.00%1.50%0.00%
–
(8) 6,421
6,531 17
31 –
31
6,548
– 96 –
6,517
–
– –
36 –
2,445
–
– 2,409
Former Tumbarumba Shire Council
0.00%1.50%0.00%
– 17
– – –
13
2,445
2,432 13
–
Calculation2017/18
2,409

Special Schedules 2017
page 21
Snowy Valleys Council
Special Schedule 8 – Permissible Income Calculation (continued) for the year ended 30 June 2018
$’000
Notes
(1) The notional general income will not reconcile with rate income in the financial statements in the corresponding year. The statements are reported on an accrual accounting basis which include amounts that relate to prior years’ rates income.
(2) Adjustments account for changes in the number of assessments and any increase or decrease in land value occurring during the year. The adjustments are called ‘supplementaryvaluations’ as defined in the Valuation of Land Act 1916 .
(3) The ‘special variation percentage’ is inclusive of the rate peg percentage and where applicable Crown land adjustment.
(4) Valuation objections are unexpected changes in land values as a result of land owners successfully objecting to the land value issued by the Valuer-General. Councils can claim thevalue of the income lost due to valuation objections in any single year.
(5) Unused catch-up amounts will be deducted if they are not caught up within 2 years. Usually councils will have a nominal carry forward figure. These amounts can be adjusted for insetting the rates in a future year.
(6) Carry forward amounts which are in excess (an amount that exceeds the permissible income) require ministerial approval by order published in the NSW Government Gazette inaccordance with section 512 of the Local Government Act 1993. The OLG will extract these amounts from Council’s Special Schedule 8 in the financial data return (FDR) to administerthis process.

INDEPENDENT AUDITOR’S REPORT
Special Schedule No. 8
Snowy Valleys Council
To the Councillors of Snowy Valleys Council
Opinion
I have audited the accompanying special purpose financial statement comprising the reconciliation of
total permissible general income (Special Schedule No. 8) of Snowy Valleys Council (the Council) for
the year ending 30 June 2018.
In my opinion, Special Schedule No. 8 of Snowy Valleys Council for 30 June 2018 is prepared, in all
material respects in accordance with the requirements of the Local Government Code of Accounting
Practice and Financial Reporting (LG Code) issued by the Office of Local Government (OLG), and is in
accordance with the books and records of the Council.
My opinion should be read in conjunction with the rest of this report, and in particular the Emphasis of
Matter paragraph, which describes the basis of accounting.
Basis for Opinion
I conducted my audit in accordance with Australian Auditing Standards. My responsibilities under the
standards are described in the ‘Auditor’s Responsibilities for the Audit of Special Schedule No.8’
section of my report.
I am independent of the Council in accordance with the requirements of the:
• Australian Auditing Standards
• ethical requirements of the Accounting Professional and Ethical Standards Board’s APES 110
‘Code of Ethics for Professional Accountants’ (APES 110).
I have fulfilled my other ethical responsibilities in accordance with APES 110.
Parliament promotes independence by ensuring the Auditor-General and the Audit Office of New
South Wales are not compromised in their roles by:
• providing that only Parliament, and not the executive government, can remove an
Auditor-General
• mandating the Auditor-General as auditor of councils
• precluding the Auditor-General from providing non-audit services.
I believe that the audit evidence I have obtained is sufficient and appropriate to provide a basis for my
audit opinion.
Emphasis of Matter - Basis of Accounting
Without modifying my opinion, I draw attention to the notes and explanations in Special Schedule
No. 8 that instruct councils in its preparation so it complies with OLG’s requirements as described in
the LG Code. As a result, Special Schedule No. 8 may not be suitable for another purpose.
Councillors’ Responsibility for Special Schedule No. 8
The Councillors of the Council are responsible for the preparation of Special Schedule No. 8 in
accordance with the LG Code. The Councillors’ responsibility also includes such internal control as the
Councillors determine is necessary to enable the preparation of Special Schedule No. 8 that is free
from material misstatement, whether due to fraud or error.
In preparing Special Schedule No.8, the Councillors must assess the Council’s ability to continue as a
going concern except where the Council will be dissolved or amalgamated by an Act of Parliament.
The assessment must disclose, as applicable, matters related to going concern and the
appropriateness of using the going concern basis of accounting.
Auditor’s Responsibility for the Audit of Special Schedule No. 8
My objectives are to:
• obtain reasonable assurance whether Special Schedule No. 8 as a whole is free from material
misstatement, whether due to fraud or error
• issue an Independent Auditor’s Report including my opinion.
Reasonable assurance is a high level of assurance, but does not guarantee an audit conducted in
accordance with Australian Auditing Standards will always detect material misstatements.
Misstatements can arise from fraud or error. Misstatements are considered material if, individually or
in aggregate, they could reasonably be expected to influence the economic decisions users take
based on Special Schedule No.8.
A description of my responsibilities for the audit of Special Schedule No.8 is located at the Auditing
and Assurance Standards Board website at http://www.auasb.gov.au/auditors_responsibilities/ar8.pdf.
The description forms part of my auditor’s report.
My opinion does not provide assurance:
• that the Council carried out its activities effectively, efficiently and economically
• about the security and controls over the electronic publication of the audited Special Schedule
No.8 on any website where they may be presented
• about any other information which may have been hyperlinked to/from Special Schedule No 8.
Lawrissa Chan
Director, Financial Audit Services
27 October 2017
SYDNEY