Annual Financial Statements In accordance with The ... · PDF fileSteelmaking Plant ... Flat...
45
Annual Financial Statements In accordance with The International Financial Reporting Standards (IFRS) 31 December 2006 Stomana Industry S.A. 1, Vladaisko Vastanie Str. 2304 Pernik, Bulgaria
-
Upload
nguyentruc -
Category
Documents
-
view
217 -
download
4
Transcript of Annual Financial Statements In accordance with The ... · PDF fileSteelmaking Plant ... Flat...

Annual Financial Statements
In accordance with
The International Financial Reporting Standards (IFRS)
31 December 2006
Stomana Industry S.A. 1, Vladaisko Vastanie Str. 2304 Pernik, Bulgaria

Annual Financial Statements 31 December 2006
CONTENTS Page Directors’ Report 1-3 Report of the Auditors 4-5 Balance Sheet 6 Income Statement 7 Statement of Changes in Equity 8 Cash Flow Statement 9 Accounting Policies 10-21 Notes to the Financial Statements 22-42

Annual Financial Statements 31 December 2006
1
BUSINESS DESCRIPTION Stomana Industry AD (the ‘Company’ or ‘Stomana’) is a joint stock company, incorporated in Bulgaria. The Company is a subsidiary of SIDENOR STEEL PRODUCTS MANUFACTURING COMPANY S.A., a company registered in Greece. The Company’s main activity is production and trade sale of steel products. BUSINESS OVERVIEW Stomana Industry AD is located in Pernik at the place of the first biggest steel factory in Bulgaria. The Company’s main activity is production and trade sale of steel products. Basic production capacities are as follows: ▪ Sorting department – its capacity covers the company’s need of scrap sorting and preparing it for manufacturing. ▪ Shreder installation – for cutting and sorting of low quality metal scrap not manufactured. The device is with positive ecological effect. ▪ Steelmaking Plant (Meltshop) – it produces steel as a semi-finished product used by the rolling production and steel blooms for trade. The workshop is equipped with two processing Electric Arc Furnaces (EAF), two Ladle Furnaces, Bloom Caster, Slab Caster and additional equipment. ▪ Flat Products Plant – it produces iron structures. ▪ Long products Plant – it produces big size steel profiles for trade sale and semi-finished products for the Balls Plant. ▪ Balls Plant – it produces steel balls for the mining industry.

Annual Financial Statements 31 December 2006
2
BUSINESS PURPOSES FOR 2007 A highly intensive investment programme is running at the moment, which main purpose is renovating of the equipment, adopting modern and contemporary technologies, increasing Company’s production capacity and opening of new working positions. During 2006 the creation of a new rolling shop for steel products is continuing. It is equipped with new rolling mill together with heating furnace with capacity of 120 tons per hour, with new high-technological electronically automation and up-to-date mechanical equipment. The new Long Products Plant will produce newly for the Company products – armature with diameter from 8 to 40 mm, small profiles, angles and special rounds. The Company Management is planning to diversify its products portfolio and to present it at new foreign markets among its competitors. MANAGEMENT RESPONSIBILITIES The Directors are required by Bulgarian law to prepare financial statements each financial year that give a true and fair view of the financial position of the company as at 31 December 2006 and its financial results, changes in cash flow statement and statement of changes in shareholder’s equity in accordance with International Financial Reporting Standards (IFRS) as adopted for use in the European Union and National Accounting Legislation. During 2006 the Company operates again as a manufacturing one in the sphere of ferrous metals industry. The main income share is based on the sale of products and expenses are made mainly for raw materials. The Company possesses fixed assets from the following categories: land and buildings; vehicle and machinery, furniture, fittings and equipment and assets under construction. Intangible assets include software products. Inventories are consisting of spare parts, raw materials, finished goods and products. During 2006 there are no changes in shareholder’s equity statement in comparison with 2005.

Annual Financial Statements 31 December 2006
3
The financial result of the Company is the amount of BGN 70,469 (profit) after taxes. The taxable procedure is applied in accordance with the requirements of the domestic legislation. There are no important events occurred after the date of preparing of the financial statement, which could reflect over the Company’s result during 2007. The Management does not plan any changes in the main activity of the Company in the near future. The Company is managed by the Board of Directors consisting of five members. …………….................... ………………………… Vladimir Nikolov Sonia Mangeyna Executive Director Chief Accountant 26 March 2007 26 March 2007

PricewaterhouseCoopers Audit OOD 9-11 Maria Louisa Blvd 1000 Sofia Bulgaria Telephone +359 (2) 9355200 Facsimile +359 (2) 9355266
4
ricewaterhouseCoopers Audit OOD has offices in Sofia and Varna Email: [email protected]; Web Site: www.pwc.com/bg Registered with the Sofia City Court under company file number 165381993, Bulstat number 831364383, tax registraton number 12200007681P
Independent auditor’s report
To the Shareholders and Board of Directors of the Stomana Industry S.A. Report on the Financial Statements We have audited the accompanying financial statements of Stomana Industry S.A. which comprise the balance sheet as of 31 December 2006 and the income statement, statement of changes in equity and cash flow statement for the year then ended and a summary of significant accounting policies and other explanatory notes. Management’s Responsibility for the Financial Statements Management is responsible for the preparation and fair presentation of these financial statements in accordance with International Financial Reporting Standards as adopted for use in the European Union. This responsibility includes: designing, implementing and maintaining internal control relevant to the preparation and fair presentation of financial statements that are free from material misstatement, whether due to fraud or error; selecting and applying appropriate accounting policies; and making accounting estimates that are reasonable in the circumstances. Auditor’s Responsibility Our responsibility is to express an opinion on these financial statements based on our audit. We conducted our audit in accordance with International Standards on Auditing. Those Standards require that we comply with ethical requirements and plan and perform the audit to obtain reasonable assurance whether the financial statements are free from material misstatement. An audit involves performing procedures to obtain audit evidence about the amounts and disclosures in the financial statements. The procedures selected depend on the auditor’s judgment, including the assessment of the risks of material misstatement of the financial statements, whether due to fraud or error. In making those risk assessments, the auditor considers internal control relevant to the entity’s preparation and fair presentation of the financial statements in order to design audit procedures that are appropriate in the circumstances, but not for the purpose of expressing an opinion on the effectiveness of the entity’s internal control. An audit also includes evaluating the appropriateness of accounting policies used and the reasonableness of accounting estimates made by management, as well as evaluating the overall presentation of the financial statements. We believe that the audit evidence we have obtained is sufficient and appropriate to provide a basis for our audit opinion.

5
Opinion In our opinion, the accompanying financial statements give a true and fair view of the financial position of the Company as of 31 December 2006, and of its financial performance and its cash flows for the year then ended in accordance with International Financial Reporting Standards as adopted for use in the European Union. Report on Other Legal and Regulatory Requirements Management is also responsible for preparing the Directors’ Report in accordance with the Accounting Act. We are required by the Accounting Act to express an opinion whether the Directors’ Report is consistent with the annual financial statements of the Company. In our opinion, the Directors’ Report set out on pages 1 to 3, is consistent with the accompanying financial statements of the Company as of 31 December 2006. Irena Vakova Jean- Pierre Vigroux Certified auditor PricewaterhouseCoopers Audit OOD 26 March 2007 Sofia

Balance Sheet 31 December 2006
The accounting policies on pages 10 to 21 and the notes on pages 22 to 42 form an integral part of these financial statements.
6
As at 31 December (all amounts in BGN thousands) Note 2006 2005 ASSETS Non-current assets Property, plant and equipment 5 343,546 311,443 Intangible assets 6 3 345 343,549 311,788 Current assets Inventories 7 162,519 125,059 Trade and other receivables 8 102,121 58,389 Tax refundable 12,311 6,951 Available for sale financial assets 7,664 - Cash and cash equivalents 9 2,860 5,773 287,475 196,172 Total assets 631,024 507,960 Equity Share capital 10 63,319 63,319 Other reserves 10 6,332 2,665 Retained earnings 10 266,940 219,696 336,591 285,680 LIABILITIES Non-current liabilities Borrowings 11 85,948 60,869 Deferred tax liabilities 12 21,592 31,953 Government grants 15 2,532 2,677 Retirement benefits obligations 13 1,638 1,648 111,710 97,147 Current liabilities Trade and other payables 14 93,810 62,573 Borrowings 11 83,528 62,100 Current income tax payable 4,117 - Provisions for legal proceedings liabilities 14 700 - Unused leave payable 555 328 Other taxes payable 13 132 182,723 125,133 Total liabilities 294,433 222,280 Total equity and liabilities
631,024 507,960
The Board of Directors has approved these financial statements set on pages 6-42 on 19 March 2007. The financial statements are signed on behalf of the Board of Directors by: Vladimir Nikolov Sonia Mangeyna Executive Director Chief Accountant 26 March 2007 26 March 2007 Initialled in accordance with audit opinion: Irena Vakova Certified auditor 26 March 2007

Income Statement 31 December 2006
The accounting policies on pages 10 to 21 and the notes on pages 22 to 42 form an integral part of these financial statements.
7
Year ended 31 December (all amounts in BGN thousands) Note 2006 2005 Sales 16 681,822 502,598 Cost of sales 17 (561,831) (408,817) Gross profit 119,991 93,781 Distribution costs
18
(32,439) (24,149)
Administrative expenses 19 (13,979) (11,089) Other income 20 8,100 3,882 Other expenses 21 (5,587) (6,211) Operating profit 76,086 56,214 Finance cost- net 23 (6,036) (3,326) Profit before income tax 70,050 52,888 Income tax expense 24 419 (8,102) Profit for the year 70,469 44,786 Vladimir Nikolov Sonia Mangeyna Executive Director Chief Accountant 26 March 2007 26 March 2007 Initialled in accordance with audit opinion: Irena Vakova Certified auditor 26 March 2007

Statement of changes in shareholder’s equity
31 December 2006
The accounting policies on pages 10 to 21 and the notes on pages 22 to 42 form an integral part of these financial statements.
8
(all amounts in BGN thousands) Share
capitalOther
reservesRetained earnings
Total Equity
Balance at 1 January 2005 63,319 5 200,176 263,500 Dividends paid - - (22,606) (22,606) Transfer of reserves - 2,660 (2,660) - Profit for the year - - 44,786 44,786 Balance at 31 December 2005 63,319 2,665 219,696 285,680 Balance at 1 January 2006 63,319 2,665 219,696 285,680 Dividends paid - - (19,558) (19,558) Transfer of reserves - 3,667 (3,667) - Profit for the year - - 70,469 70,469 Balance at 31 December 2006 63,319 6,332 266,940 336,591 Vladimir Nikolov Sonia Mangeyna Executive Director Chief Accountant 26 March 2007 26 March 2007
Initialled in accordance with audit opinion: Irena Vakova Certified auditor 26 March 2007

Cash Flow Statement 31 December 2006
The accounting policies on pages 10 to 21 and the notes on pages 22 to 42 form an integral part of these financial statements.
9
Year ended 31 December (all amounts in BGN thousands) Note 2006 2005 Cash flows from operating activities Cash generated from operations 25 40,888 44,853Income tax paid (4,518) (15,880)Interest paid (6,219) (3,547)Net cash generated from operating activities
30,151 25,426
Cash flows from investing activities Purchase of property, plant and equipment
(52,068) (30,289)
Purchase of assets for resale (7,664) -Proceeds from sale of PPE 199 515Interest received 183 221 Net cash used in the investing activities (59,350) (29,553) Cash flows from financing activities Proceeds from borrowings 306,822 151,795Repayments of borrowings (260,314) (126,916)Dividends paid (20,222) (19,433)Grants received - 2,907Other - (93) Net cash used in financing activities
26,286 8,260
Net increase/ (decrease) in cash and cash equivalents
(2,913) 4,133
Cash and cash equivalents at beginning of the year
9 5,773 1,640
Cash and cash equivalents at the end of the year
9
2,860 5,773
Vladimir Nikolov Sonia Mangeyna Executive Director Chief Accountant 26 March 2007 26 March 2007 Initialled in accordance with audit opinion: Irena Vakova Certified auditor 26 March 2007

Accounting Policy31 December 2006
10
1. General Information Stomana Industry AD (the ‘Company’ or ‘Stomana’) is a joint stock company,
incorporated in Bulgaria. The Company is a subsidiary of SIDENOR STEEL PRODUCTS MANUFACTURING COMPANY S.A., a company registered in Greece and listed on Athens Stock Exchange which holds 85,97% of the share capital of the Company. The ultimate controlling party is VIOHALCO S.A., Greece. EVROMETAL OOD with registration address: 6 Krakra Sernishki Square, Pernik is a shareholder of Stomana, too and holds 14,03% of the share capital of the Company. The Company’s registered office is: 1 Vladaisko Vastanie Str. of the Municipality of Pernik. The company is represented by the General Manager – Mr. Vladimir Nikolov. The Company’s main activity is production and trade sale of steel products. The financial statements of Stomana Industry AD for the year ended 31 December 2006 were authorised for issue in accordance with a resolution of the Board of Directors on 19th of March 2007. These financial statements are subject to the approval of the Company’s Annual Shareholder’s Meeting with respect to the appropriation of profits.
2 Summary of significant accounting policies The principal accounting policies applied in the preparation of these financial statements
are set out below. These policies have been consistently applied to all the years presented, unless otherwise stated.
2.1. Basis of preparation The financial statements have been prepared in accordance with International Financial
Reporting Standards (IFRS) and under the historical cost convention, as modified by the revaluation of land and buildings, available-for-sale financial assets, and financial assets and financial liabilities (including derivative instruments) at fair value through profit or loss.
The preparation of financial statements in conformity with IFRS requires the use of certain critical accounting estimates. It also requires management to exercise its judgment in the process of applying the Group’s accounting policies. The areas involving a higher degree of judgment or complexity, or areas where assumptions and estimates are significant to the consolidated financial statements are disclosed in Note 4.

Accounting Policy31 December 2006
11
2.1. Basis of preparation (continued) Amendments to published standards effective in 2006
IAS 19 (Amendment), Employee Benefits, is mandatory for the Group’s accounting
periods beginning on or after 1 January 2006. It introduces the option of an alternative recognition approach for actuarial gains and losses. It may impose additional recognition requirements for multi-employer plans where insufficient information is available to apply defined benefit accounting. It also adds new disclosure requirements. As the Group does not intend to change the accounting policy adopted for recognition of actuarial gains and losses and does not participate in any multi-employer plans, adoption of this amendment only impacts the format and extent of disclosures presented in the accounts.
Standards, amendments and interpretations effective in 2006 but not relevant
The following standards, amendments and interpretations are mandatory for accounting periods beginning on or after 1 January 2006 but are not relevant to the Group’s operations: • IAS 21 (Amendment), Net Investment in a Foreign Operation; • IAS 39 (Amendment), Cash Flow Hedge Accounting of Forecast Intragroup
Transactions; • IAS 39 (Amendment), The Fair Value Option; • IAS 39 and IFRS 4 (Amendment), Financial Guarantee Contracts; • IFRS 6, Exploration for and Evaluation of Mineral Resources; • IFRS 1 (Amendment), First-time Adoption of International Financial Reporting
Standards and IFRS 6 (Amendment), Exploration for and Evaluation of Mineral Resources;
• IFRIC 6, Liabilities arising from Participating in a Specific Market – Waste Electrical and Electronic Equipment;
• IFRIC 4, Determining whether an Arrangement contains a Lease; and • IFRIC 5, Rights to Interests arising from Decommissioning, Restoration and
Environmental Rehabilitation Funds. Interpretations to existing standards that are not yet effective and have not been early
adopted by the Company
The following interpretations to existing standards have been published that are mandatory for the Company’s accounting periods beginning on or after 1 May 2006 or later periods that the Company has not early adopted:
Accounting Policy31 December 2006
12
2.1. Basis of preparation (continued) • IFRIC 8, Scope of IFRS 2 (effective for annual periods beginning on or after 1 May
2006). IFRIC 8 requires consideration of transactions involving the issuance of equity instruments – where the identifiable consideration received is less than the fair value of the equity instruments issued – to establish whether or not they fall within the scope of IFRS 2. The Company will apply IFRIC 8 from 1 January 2007, but it is not expected to have any impact on the Company’s accounts; and
• IFRIC 10, Interim Financial Reporting and Impairment (effective for annual periods
beginning on or after 1 November 2006). IFRIC 10 prohibits the impairment losses recognised in an interim period on goodwill, investments in equity instruments and investments in financial assets carried at cost to be reversed at a subsequent balance sheet date. The Company will apply IFRIC 10 from 1 January 2007, but it is not expected to have any impact on the Company’s accounts.
Interpretations to existing standards that are not yet effective and not relevant for the Comapny’s operations The following interpretations to existing standards have been published that are mandatory for the Company’s accounting periods beginning on or after 1 May 2006 or later periods but are not relevant for the Company’s operations: • IFRIC 7, Applying the Restatement Approach under IAS 29, Financial Reporting in
Hyperinflationary Economies (effective from 1 March 2006). IFRIC 7 provides guidance on how to apply requirements of IAS 29 in a reporting period in which an entity identifies the existence of hyperinflation in the economy of its functional Currency, when the economy was not hyperinflationary in the prior period. As the Company is not operating in a hyperinflationary economy, IFRIC 7 is not relevant to the Company’s operations; and
• IFRIC 9, Reassessment of embedded derivatives (effective for annual periods beginning
on or after 1 June 2006). IFRIC 9 requires an entity to assess whether an embedded derivative is required to be separated from the host contract and accounted for as a derivative when the entity first becomes a party to the contract. Subsequent reassessment is prohibited unless there is a change in the terms of the contract that significantly modifies the cash flows that otherwise would be required under the contract, in which case reassessment is required. As the Company has not changed the terms of the contracts, IFRIC 9 is not relevant to the Company’s operations.
2.2. Segment reporting

Accounting Policy31 December 2006
13
A business segment is a group of assets and operations engaged in providing products or
services that are subject to risks and returns that are different from those of other business segments. A geographical segment is engaged in providing products or services within a particular economic environment that are subject to risks and return that are different from those of segments operating in other economic environments.
2.3. Foreign currency translation
2.3.1. Functional and presentation currency Items included in the financial statements of the Company are measured using the
currency of the primary economic environment in which the entity operates (‘the functional currency’). The financial statements are presented in Bulgarian leva, which is the Company’s functional and presentation currency.
2.3.2 Transactions and balances
Foreign currency transactions are translated into the functional currency using the exchange rates prevailing at the dates of the transactions. Foreign exchange gains and losses resulting from the settlement of such transactions and from the translation at year- end exchange rates of all assets and liabilities denominated in foreign currencies are recognised in the income statement. Bulgarian National Bank USD fix rate at 01.01.2006 is BGN 1,65790 and at 31.12.2006 is BGN 1,48506.
2.4.
Property, plant and equipment and intangible assets
All property, plant and equipment are stated at historical cost less depreciation. Historical cost includes expenditure that is directly attributable to the acquisition of the items. Subsequent costs are included in the assets carrying amount or recognised as a separate asset, as appropriate, only when it is probable that future economic benefits associated with the item will flow to the Company and the cost of the item can be measured reliably. The Carrying amount of the replaced part is derecognised. All other repairs and maintenance are charged to the income statement during the financial period in which they are incurred.
Land is not depreciated as it is deemed to have an indefinite life. Depreciation on other assets
is calculated on the straight-line method to allocate their cost to their residual values over their estimated useful lives, as follows:
2.4. Property, plant and equipment and intangible assets (continued)

Accounting Policy31 December 2006
14
Buildings 10-33 years Machinery 5-20 years
Vehicles – Cars 6-10 years Other vehicles 6-10 years Office equipment 3-8 years Computers and equipment 3-8 years Other 3-8 years
The assets residual values and useful lives are reviewed, and adjusted if appropriate, at each balance sheet date. An asset’s carrying amount is written down immediately to its recoverable amount if the asset’s carrying amount is greater than its estimated recoverable amount
Gains and losses on disposals are determined by comparing the proceeds with the carrying amount and are recognised within other (losses)/gains – net, in the income statement.
2.5. Intangible assets Trademarks and licences Acquired trademarks and licences are shown at historical cost. Trademarks and licences
have a finite useful life and are carried at cost less accumulated amortisation. Amortisation is calculated using the straight-line method to allocate the cost of trademarks and licences over their estimated useful lives (15-20 years).
Computer software Acquired computer software licences are capitalised on the basis of the costs incurred to
acquire and bring to use the specific software. These costs are amortised over their estimated useful lives (three to five years).
2.6. Impairment of non- financial assets Assets that have an indefinite useful life are not subject to amortisation and are tested
annually for impairment. Assets that are subject to amortisation are reviewed for impairment whenever events or changes in circumstances indicate that the carrying amount may not be recoverable. An impairment loss is recognised for the amount by which the asset’s carrying amount exceeds its recoverable amount. The recoverable amount is the higher of an asset’s fair value less costs to sell and value in use. For the purposes of assessing impairment, assets are grouped at the lowest levels for which there are separately identifiable cash flows (cash-generating units). Non-financial assets other than goodwill that suffered impairment are reviewed for possible reversal of the impairment at each reporting date.
2.7. Financial assets

Accounting Policy31 December 2006
15
Loans and Receivables Loans and receivables are non-derivative financial assets with fixed or determinable
payments that are not quoted in an active market. They are included in current assets, except for maturities greater than 12 months after the balance sheet date. These are classified as non-current assets. Loans and receivables are classified as ‘trade receivables’ and ‘other receivables’ in the balance sheet (Note 2.11).
The Company assesses at each balance sheet date whether there is objective evidence that a financial asset or a group of financial assets is impaired. Impairment testing of trade receivables is described in Note 2.11.
2.8. Inventories Inventories are stated at the lower of cost or net realisable value. Cost is determined by the
weighted average method. The cost of production comprises the cost of raw materials, direct labour, other direct costs and related production overheads, but excludes borrowing costs. Net realisable value is the estimate of the selling price in the ordinary course of business, less applicable variable selling expenses.
2.9. Trade receivables
Trade receivables are recognised initially at fair value and subsequently measured at
amortised cost using effective interest method, less provision for impairment. A provision for impairment of trade receivables is established when there is objective evidence that the Company will not be able to collect all amounts due according to the original terms of receivables. Significant financial difficulties of the debtor, probability that the debtor will enter bankruptcy or financial reorganisation, and default or delinquency in payments are considered indicators that the trade receivable is impaired.. The amount of the provision is the difference between the asset’s carrying amount and the present value of the estimated future cash flows, discounted at the effective interest rate. The carrying amount of the asset is reduced through the use of an allowance account, and the amount of the loss is recognised in the income statement within selling and marketing costs. When a trade receivable is uncollectible, it is written off against the allowance account for trade receivables. Subsequent recoveries of amounts previously written off are credited against selling and marketing costs in the income statement.
2.10. Cash and cash equivalents

Accounting Policy31 December 2006
16
Cash and cash equivalents includes cash in hand, deposits held at call with banks, other
short-term highly liquid investments with original maturities of three months or less, and bank overdrafts. Bank overdrafts are shown within borrowings in current liabilities on the balance sheet.
2.11. Share capital Ordinary shares are classified as equity.
2.12. Borrowings Borrowings are recognised initially at fair value, net of transaction costs incurred.
Borrowings are subsequently stated at amortised cost; any difference between the proceeds (net of transaction costs) and the redemption value is recognised in the income statement over the period of the borrowings using the effective interest method.
Borrowings are classified as current liabilities unless the Company has an unconditional
right to defer settlement of the liability for at least 12 months after the balance sheet date.
2.13. Deferred income tax Deferred income tax is provided, using the liability method, on temporary differences arising
between the tax bases of assets and liabilities and their carrying amounts in the financial statements. Deferred income tax is determined using tax rates that have been enacted or substantially enacted by the balance sheet date and are expected to apply when the related deferred income tax asset is realised or the deferred income tax liability is settled. Deferred income tax assets are recognised to the extent that it is probable that future taxable profits will be available against which the temporary differences can be utilised.
2.14. Government’s grants Grants from government are required at their fair value where there is a reasonable assurance that the grant will be received and the Group will comply with all attached conditions. Government grants relating to property, plant and equipment are included in non-current liabilities as deferred government grants and are credited to the income statement on a straight-line basis over the expected lives of the related assets.

Accounting Policy31 December 2006
17
2.15. Employee benefits The long-term payables to employees comprise of present value of Company’s liability for
pension compensation as at 31 December 2006 if employees retire, determined by periodic actuarial calculations. In accordance with the Labour Code the employer is obliged to pay the employees at retirement age an indemnity, which varies between two and six monthly wages at the time of the termination of the labour contract depending on the length of service in the Company. As at 31 December 2006 the Company has used the services of an independent certified valuer who performed the annual actuarial valuation of these liabilities and on the basis of their present value an expense was recognised in the income statement and a long-term liability to employees in the balance sheet as that date.
2.16. Provisions
Provisions for environmental restoration, restructuring costs and legal claims are recognised when: the Company has a present legal or constructive obligation as a result of past events; it is more likely than not that an outflow of resources will be required to settle the obligation; and the amount has been reliably estimated. Restructuring provisions comprise lease termination penalties and employee termination payments. Provisions are not recognised for future operating losses. Where there are a number of similar obligations, the likelihood that an outflow will be required in settlement is determined by considering the class of obligations as a whole. A provision is recognised even if the likelihood of an outflow with respect to any one item included in the same class of obligations may be small. Provisions are measured at the present value of the expenditures expected to be required to settle the obligation using a pre-tax rate that reflects current market assessments of the time value of money and the risks specific to the obligation. The increase in the provision due to passage of time is recognised as interest expense.
2.17. Revenue recognition

Accounting Policy31 December 2006
18
Revenue comprises the fair value of the consideration received or receivable for the sale of goods and services in the ordinary course of the Group’s activities. Revenue is shown net of value-added tax, returns, rebates and discounts.
The Company recognises revenue when the amount of revenue can be reliably measured, it is probable that future economic benefits will flow to the entity and specific criteria have been met. The amount of revenue is not considered to be reliably measurable until all contingencies relating to the sale have been resolved. The Company bases its estimates on historical results, taking into consideration the type of customer, the type of transaction and the specifics of each arrangement.
Sales of goods
Sales of goods are recognised when the Company sells a product to the customer. Retail sales are usually in cash or by credit.
Sales of services
Services are provided on a time and material basis or as a fixed-price contract, with contract terms generally ranging from less than one year to three years. Revenue from fixed-price contracts for delivering services is recognised under the percentage-of-completion (POC) method. Under the POC method, revenue is generally recognised based on the services performed to date as a percentage of the total services to be performed. Revenue from fixed-price contracts for delivering services is generally recognised in the period the services are provided, using a straight-line basis over the term of the contract. If circumstances arise that may change the original estimates of revenues, costs or extent of progress toward completion, estimates are revised. These revisions may result in increases or decreases in estimated revenues or costs and are reflected in income in the period in which the circumstances that give rise to the revision become known by management.
2.17.
Revenue recognition (continued)

Accounting Policy31 December 2006
19
Interest income
Interest income is recognised on a time-proportion basis using the effective interest method. When a receivable is impaired, the Company reduces the carrying amount to its recoverable amount, being the estimated future cash flow discounted at the original effective interest rate of the instrument, and continues unwinding the discount as interest income. Interest income on impaired loans is recognised using the original effective interest rate.
2.18. Leases Leases in which a significant portion of the risks and rewards of ownership are retained by
the lessor are classified as operating leases. Payments made under operating leases (net of any incentives received from the lessor) are charged to the income statement on a straight-line basis over the period of the lease.
2.19. Dividend distribution Dividend distribution to the Company’s shareholders is recognised as a liability in the
Company’s financial statements in the period in which the dividends are approved by the Company’s shareholders.
3. Financial risk management
3.1. Financial risk factors
The Group’s activities expose it to a variety of financial risks: market risk( including
currency risk, fair value interest rate risk, cash flow interest risk and price risk), credit risk and liquidity risk. The Group’s overall risk management programme focuses on the unpredictability of financial markets and seeks to minimise potential adverse effects on the Group’s financial performance.
Foreign exchange risk The Company operates in Bulgaria and is currently exposed to foreign exchange risk arising from sales, purchases and borrowings in EURO and USD.
3.1. Financial risk factors (continued) Liquidity risk

Accounting Policy31 December 2006
20
Prudent liquidity risk management implies maintaining sufficient cash, availability of
funding through an adequate amount of committed credit facilities. Due to the dynamic nature of the underlying businesses, the Company aims at maintaining flexibility in funding by keeping committed credit lines available.
Interest rate risk
The Company has no significant interest bearing assets. The Company usually borrows at variable rates.
Credit risk The Company has no significant concentrations of credit risk. The Company has policies in
place to ensure that sales of products and services are made to customers with an appropriate credit history.
4. Critical accounting estimates and judgements Estimates and judgments are continually evaluated and are based on historical experience
and other factors, including expectations of future events that are believed to be reasonable under the circumstances.
4.1. Critical accounting estimates and assumptions The Company makes estimates and assumptions concerning the future. The resulting
accounting estimates will, by definition, rarely equal the related actual results. The estimates and assumptions that have a significant risk of causing a material adjustment to the carrying amounts of assets and liabilities within the next financial year are outlined below.
Income taxes 4.1.
Significant judgment is required in determining the provision for income taxes. There are many transactions and calculations for which the ultimate tax determination is uncertain during the ordinary course of business. Critical accounting estimates and assumptions (continued)

Accounting Policy31 December 2006
21
The Company recognises liabilities for anticipated tax audit issues based on estimates of whether additional taxes will be due. Where the final tax outcome of these matters is different from the amounts that were initially recorded, such differences will impact the income tax and deferred tax provisions in the period in which such determination is made.

Annual Financial Statements31 December 2006
22
5
(All amounts in BGN thousands, unless otherwise stated) Property, plant and equipment
Land and buildings
Vehicles & machinery
Furniture, fittings &
equipment
Assets under
construction
Total
At 1 January 2005
Cost or valuation 117,842
191,348
664
10,641 320,495
Accumulated depreciation (3,717)
(15,924)
(112) - (19,753)
Net book amount 114,125
175,424
552
10,641 300,742 Year ended 31 December 2005
Opening net book amount 114,125
175,424
552
10,641
300,742
Additions 824 3,574
185
26,055 30,638
Disposals (125)
(339)
(178) - (642)
Transfers - 3,534
164
(4,047) (349)
Depreciation charge (Note 22) (3,737) (15,115)
(94) -
(18,946)
Closing net book amount 111,087
167,078
629
32,649
311,443 At 31 December 2005
Cost or valuation 118,531
198,013
795
32,649 349,988
Accumulated depreciation (7,444)
(30,935)
(166)
- (38,545)
Net book amount 111,087
167,078
629
32,649
311,443 At 01 January 2006
Opening net book amount 111,087
167,078
629
32,649 311,443
Additions 20
9,701
109
42,237 52,067
Disposals (70)
(199) (269)
Transfer
9,190
(9,190) -
Depreciation charge (Note 22) (3,768)
(15,745)
(182)
-
(19,695)
Closing net book amount 107,269
170,025
556
65,696
343,546 At 31 December 2006
Cost or valuation 118,471
216,703
903
65,696 401,773
Accumulated depreciation (11,202)
(46,678)
(347) - (58,227)
Net book amount 107,269
170,025
556
65,699
343,546

Annual Financial Statements31 December 2006
23
(All amounts in BGN thousands, unless otherwise stated)
5 Property, plant and equipment (continued) Depreciation expense of BGN 18 133 (2005: BGN 19 018) thousand has been charged in cost of goods sold, in selling and marketing costs BGN 162 (2005: BGN 343) and BGN 694 (2005: 389) thousand has been charged to administrative expenses. Lease rentals amounting to BGN 2 914 (2005: BGN 1 451) thousand relating to the lease of machinery and property, are included in the income statement. The balance sheet value of fixed assets pledged as at 31 December 2006 is BGN 91 294 thousand.

Annual Financial Statements31 December 2006
24
6 Intangible assets Software
At 1 January 2005 Cost or valuation 581 Accumulated amortisation and impairment (304)
Net book amount
277 Year ended 31 December 2005 Opening net book amount 277 Additions 348 Amortisation charge (Note 22) (280)
Closing net book amount 345 At 31 December 2005 Cost or valuation 929 Accumulated amortisation and impairment (584)
Net book amount 345 At 01 January 2006 Opening net book amount
345 Amortisation charge (Note 22)
(342)
Closing net book amount 3 At 31 December 2006 Cost or valuation 929 Accumulated amortisation and impairment (926)
Net book amount 3

Annual Financial Statements31 December 2006
25
(All amounts in BGN thousands, unless otherwise stated) Amortisation expense of BGN 342 thousand (2005: BGN 280 thousand) has been charged to administrative expenses. 31 December
7 Inventories 2006 2005 Raw materials and spare parts 62,894 41,511 Finished products 43,558 35,480 Semi-finished products 38,940 31,651 Merchandise 14,114 13,087 Other 3,013 3,330 162,519 125,059
31 December
8 Trade receivables 2006 2005 Trade receivables 59,226 27,657 Receivable from related parties (Note 26) 39,109 27,018 Advances for materials 1,810 1,587 Loans to related parties (Note 26) 998 900 Other receivables 978 1,227
102,121 58,389 The carrying amount of receivables approximates their fair value.
9 Cash and cash equivalents Cash and cash equivalents include the following for the purposes of the cash flow statement:
31 December
2006 2005 Cash in hand 7 5 Cash at bank 2,853 5,768 2,860 5,773
(All amounts in BGN thousands, unless otherwise stated)

Annual Financial Statements31 December 2006
26
10
Share capital
Number of shares In thousands BGN At 31 December 2005 633 189 63,319 At 31 December 2006 633 189 63,319
The total authorised number of ordinary shares is 633 189 with a par value of BGN 100. All issued shares are fully paid. As at 31 December 2006 other reserves – BGN 6 332 thousand represents 10% of the profit for 2001, 2004 and 2005, allocated in accordance with the commercial law and follow up decisions of the Board of Directors in the respective year.
11 Borrowings 31 December 2006 2005 Non- current Bank borrowings 85,948 60,869
85,948 60,869 Current Bank borrowings 83,528 62,100
83,528 62,100 Total borrowings 169,476 122,969 Non-current bank borrowings mature until 2013 and the current until 2007, and bear coupons of,
respectively, 4,11 % and 4,42 % annually (2005: 3,18% and 2,77%). Total borrowings include secured liabilities (bank and collateralised borrowings) of BGN 91 294 thousand. Bank borrowings are secured by the land and buildings of the company. The exposure of the Company’s borrowings to interest rate changes and the contractual reprising dates are the balance sheet dates are as follows:
31 December 2006 2005
1 year 83,528 62,100 2-5 years 48,456 35,517 Over 5 years 37,492 25,352
169,476 122,969
(All amounts in BGN thousands, unless otherwise stated)

Annual Financial Statements31 December 2006
27
11 Borrowings (continued)
The carrying amounts of the Company’s borrowings are denominated in the following currencies: 31 December
Currency
2006 2005
Euro 169,476 122,536 US dollar - 433
169,476 122,96912 Deferred tax liability:
Deferred income tax assets and liabilities are offset when there is a legally enforceable right to offset current tax assets against current tax liabilities and when the deferred income taxes relate to the same fiscal authority.
The gross movement of the deferred income tax account is as follows: 31 December 2006 2005 Beginning of the year (31,953) (28,303) Income statement charge 10,361 (3,650)
End of the year
(21,952) (31,953)
Accelerated tax depreciation
At 1 January 2005 (30,648)
Charged to the income statement
(1,570) At 31 December 2005 (32,218)
Charged to the income statement
10,320
At 31 December 2006
(21,989)

Annual Financial Statements31 December 2006
28
13
Retirement benefit obligations
31 December 2006 2005 Balance sheet obligations for: Pension benefits 1,638 1,648
1,638 1,648
31 December 2006 2005 Income statement charge for: Pension benefits 10 70 10 70
The amounts recognised in the balance sheet are determined as follows:
31 December 2006 2005 Discount rate 5,0% 6,5% Future salary increases 4,5% 4,5%
12
(All amounts in BGN thousands, unless otherwise stated) Deferred tax liability (continued)
Deferred tax asset: Provision
s for unused
leave
Provisions for
retirement benefits
Impairment of
inventory
Provisions for legal proceedin
gs
Other Total
At 1 January 2005
157
237
-
-
1,951
2,345 Charged to the income
statement (70) 54 -
-
(2,064) (2,080)
At 31 December 2005 87 291 -
-
(113) 265 Charged to the income
statement (31) (127) 16
70
113 41
At 31 December 2006 56 164 16
70
- 306

Annual Financial Statements31 December 2006
29
(All amounts in BGN thousands, unless otherwise stated)
13 Retirement benefit obligation (continued) 31 December 2006 2005 Present value of the obligation in the balance sheet 1,648 1,578 Benefits paid (351) (495) Actuarial losses/(gains) - 94 Paid retirement benefit obligations 341 471
Liability in the balance sheet 1,638 1,648
The movement in the liability recognised in the balance sheet is as follows:
31 December 2006 2005 Recognised long-term obligation in the balance
sheet at the beginning of the year 1,648 1,578
Total expense charged to the income statement (10) 70
At the end of the year
1,638 1,648
Trade and other payables 31 December 2006 2005 Amounts due to related parties (Note 26) 59,510 35,245 Trade payables 27,509 20,396 Dividends paid (Note 26) 2,509 3,173 Advances paid to clients 1,224 1,685 Social security payables 296 409 Other payables 2,762 1,665 93,810 62,573
Provisions for court payables at 31 December 2006 The amount of 700,000 BGN represents a provision for certain legal claims brought against the Company by former employees. The provision charge is recognised in profit or loss within administrative expenses. The balance at 31 December 2006 is expected to be utilised in the first half of 2007. In the directors’ opinion, after taking appropriate legal advices, the outcome of these legal claims will not give rise at any significant loss beyond the amounts provided at 31 December 2006.
(All amounts in BGN thousands, unless otherwise stated)

Annual Financial Statements31 December 2006
30
15
Government’s grants
31 December 2006 2005 At the beginning of the year 2,677 - Receiving of government grant - 2.907 Income for the period (145) (230) At year’s end 2,532 2,677
16 Sales 31 December 2006 2005 Sales of merchandises 125,278 78,484 Sales of products and semi-finished products 527,776 418,008 Sales of materials 25,435 2,790 Sales of services 3,333 3,316
681,822 502,598 17
Cost of sales
31 December 2006 2005 Materials (474,973) (325,505) Consumables, water (36,877) (35,229) Depreciation of tangible assets (18,133) (19,018) Wages and salaries (13,064) (11,657) (All amounts in BGN thousands, unless otherwise stated)
Social security expenses (3,729) (3,968)
Hired services (7,788) (6,335) Repairs and maintenance (4,106) (5,636) Coupons (1,189) (866) Taxes and fees (364) (5) Impairment of inventory (158) - Other expenses (1,450) (598)
(561,831) (408,817)
(All amounts in BGN thousands, unless otherwise stated)

Annual Financial Statements31 December 2006
31
18
Distribution costs
31 December 2006 2005 Hired services (29,713) (21,634) Consumables, water (1,360) (783) Wages and salaries (652) (398) Social security expenses (150) (128) Depreciation of tangible assets (162) (343) Materials (11) (11) Taxes and fees (6) (1) Other expenses (385) (851)
(32,439) (24,149) 31 December
19 Administrative expenses 2006 2005 Hired services (5,831) (5,836) Wages and salaries (2,406) (2,451) Taxes and fees (2,131) (587) Depreciation (694) (389) Social security expenses (347) (516) Depreciation of intangible assets (342) (280) Materials (93) (65) Repairs, maintenance (328) (348) Business trips, medical services (420) (583) Other expenses (1,387) (34)
(13,979) (11,089)
20 Other income 31 December 2006 2005 Surpluses 6,812 1,759 Amortisation of subsidies received 145 230 Positive exchange rate differences 961 1,716 Other 182 177
8,100 3,882
(All amounts in BGN thousands, unless otherwise stated)

Annual Financial Statements31 December 2006
32
21
Other expenses
2006 2005 Expenses related to temporarily unused assets (3,576) (2,318) Negative exchange rate differences (868) (2,466) Other financial expenses (997) (742) Other expenses (146) (685)
(5,587) (6,211)
22 Expenses by nature 31 December 2006 2005 Materials (475,281) (325,793) Hired services (24,957) (20,344) Depreciation of tangible assets (19,695) (18,946) Wages and salaries (16,215) (14,915) Social security expenses (4,276) (4,832) Taxes and fees (2,529) (593) Impairment of inventory (158) - Depreciation of intangible assets (342) (280) Other expenses (70,383) (64,563) Total cost of goods, sales, distribution costs, marketing,
administrative and other expenses
(613,836) (450,266)
23 Finance costs – net 31 December 2006 2005
Interest income
183 221 Interest expense (6,219) (3,547)
(6,036) (3,326)
(All amounts in BGN thousands, unless otherwise stated)

Annual Financial Statements31 December 2006
33
24 Taxes 2006 2005 Current tax (9,942) (4,452) Deferred tax (Note 12) 10,361 (3,650) Tax charge/ (credit) 419 (8,102)
The tax on the Company’s profit before tax differs from the theoretical amount that would arise
using the basic tax rate of the Company as follows:
31 December
2006 2005 Profit before tax 70,050 52,888 Tax calculated at a tax rate applicable to profits 15 %
(2005:15%) (10,508) (7,933)
Effect from change in effective tax rate 11,089 - Expenses not deductible for tax purposes (162) (169)
Tax charge/(credit)
419 (8,102)
Bulgarian tax legislation is subject to varying interpretations and constant changes. Furthermore, the interpretations of tax legislation by tax authorities as applied to the transactions and activity of the Company may not coincide with that of the management. As a result tax authorities may challenge the way of calculating tax losses carried forward as well as assess additional taxes, including value added tax (VAT), penalties and interest, which can be significant. The Company has been last audited for compliance with the following tax laws: Corporate Income tax Law – last period audited up to 31.12.2004 VAT Law – last period audited up to 30.11.2005; Social Security Refundable up to 31.12.2004; The tax authorities could check the financial reports and records for the five successive tax years of the current tax period and impose additional penalties. Management of the Company is not aware of any circumstances that could lead to substantial obligations in this area.
(All amounts in BGN thousands, unless otherwise stated)

Annual Financial Statements31 December 2006
34
25 Cash generated from operations Reconciliation of profit before tax to cash generated from operations: 2006 2005 Profit for the period 70,469 44,879 Adjustments for: Tax (Note 24) (419) 8,102 Depreciation and amortisation (Note 22) 20,037 19,226 Net financial expenses (Note 23) 6,036 3,326 Income on disposal of fixed assets, waste etc. (1) (44) Loss on rejected assets 70 171 Donation depreciation (145) (230)
Changes in working capital:
− inventories (37,682) (11,811) − trade and other receivables (48,870) (5,624) − payables 31,393 (13,142) Cash generated from operations 40,888 44,853
26 Related party transactions 31 December
i) Sales of goods and services 2006 2005
SIDENOR Products 58,335 35,608 Services - 32 Materials 24,847 1,251 83,182 36,891
SOVEL
Products 9,751 7,705 Materials 195 9,946 7,705 ETIL Products - 300 Materials 44 - 44 300
(All amounts in BGN thousands, unless otherwise stated)

Annual Financial Statements31 December 2006
35
26 Related party transactions (continued) i) Sales of goods and services (continued) SIGMA IS
Products 356 248 Merchandises 13 32 Services 239 152 Fixed assets - 1 Materials - 55 608 488 ERLIKON Merchandises 8 - 8 -
TEPROSTEEL
Services 315 196 Materials 52 135 Interest 45 111 Fixed assets 4 199 416 641 CPW AMERICA Co Products 3,557 - 3,557 -
DOJRAN
Products 24,377 - 24,377 - AEIFOROS BULGARIA Services 108 49 Fixed assets - 276 Materials 375 674 483 999 AEIFOROS GREECE Materials - 2 - 2 PROSAL TUBES Services 21 - Interest 18 - Loan 1 043 - 1 082 - PRAKSYS Services 11 - 11 -
(All amounts in BGN thousands, unless otherwise stated)
26 Related party transactions (continued)

Annual Financial Statements31 December 2006
36
i) Sales of goods and services (continued) SOFIA MED
Merchandises 325 8 Fixed assets - 5 Services 370 357 695 370 STEELMET BULGARIA Products - 21 Merchandises 179 313 Services 123 156 302 490 TEPROMETAL GERMANY Products 5,463 - 5,463 - TEPROMETAL BULGARIA Merchandises 7 7 Services - 5 7 12 METAL AGENCIES Products 3,167 18,133 3,167 18,133 SIDMA Products 7,071 5,527 7,071 5,527 ENERGY SOLUTIONS Services 230 41 230 41 SID PAC ROMANIA Products 3,046 1,211 3,046 1,211 SID PAC BULGARIA Products 1,479 - Merchandises 1,137 - Fixed assets - 3 Services 33 1 2,649 4 GENECOS Products 17,349 7,417 17,349 7,417
(All amounts in BGN thousands, unless otherwise stated)
26 Related party transactions (continued)

Annual Financial Statements31 December 2006
37
i) Sales of goods and services (continued)
EVROMETAL Products 3,133 3,121 Merchandises 707 412 Services 360 371 4,200 3,904 ANAMET BULGARIA Services - 7 Materials - 1 - 8 Total sales to related parties 167, 893 84, 143
ii) Purchases of goods and services 31 December 2006 2005 SIDENOR Merchandises 120,720 85,788 Services 3,325 3,338 Dividends 16,813 19,433 Materials - 7 Fixed assets 171 13 141,029 108,579 SOVEL Materials 2,866 59 Fixed assets - 606 2,866 665 ETIL Services - 4 Materials 1,445 263 Fixed assets - 887 1,445 1,154 SIGMA IS Services 3,310 2,743 Materials 1,779 266 Fixed assets - 239 5,089 3,248 26
( All amounts in BGN thousands, unless otherwise stated) Related party transaction (continued)

Annual Financial Statements31 December 2006
38
ii) Purchases of goods and services (continued) ERLIKON
Merchandises 1,334 1,515 Fixed assets - 3 1,334 1,518 TEPROSTEEL Services 2,321 4,261 2,321 4 261 DOJRAN Merchandises 305 - 305 - AEIFOROS BULGARIA Services 1,225 1,314 Materials 321 - 1,546 1,314 PROSAL TUBES Materials 27 - Fixed assets 25 - 52 - PRAKSYS Fixed assets 1,350 - 1,350 -
VIEXAL
Services 110 70 110 70 TEKA SYSTEMS GREECE Services 275 Materials 2,319 35 Fixed assets - 1,104 2,319 1,414 TEKA BULGARIA Services 137 654 137 654 SOFIA MED Materials 548 313 Fixed assets - 37 548 350 STEELMET GREECE Services 2,653 1,628 2,653 1,628 26
( All amounts in BGN thousands, unless otherwise stated) Related party transaction (continued)

Annual Financial Statements31 December 2006
39
ii) Purchases of goods and services (continued) STEELMET BULGARIA
Services 3 23 Materials 2,150 1,304 Fixed assets - 10 2,153 1,337 TEPROMETAL GERMANY Services 1,531 867 1,531 867 TEPROMETAL BULGARIA Services 2,568 1,250 Materials 261 241 Fixed assets - 178 2,829 1,669 METAL AGENCIES Services 39 472 39 472 HELLENIC CABLES Fixed assets 91 - 91 - SIDMA Merchandises 19 525 19 525 ANAMET BULGARIA Services 428 1,087 Fixed assets 2 - 430 1,087 ANAMET SERBIA Materials 7,026 3,447 7,026 3,447 ENERGY SOLUTIONS Services - 1 - 1 VITROUVIT Materials 13 4 13 4 SID PAC BULGARIA Services 49 - 49 - GENECOS 161 3 Services 161 3 26
( All amounts in BGN thousands, unless otherwise stated) Related party transactions (continued)

Annual Financial Statements31 December 2006
40
ii) Purchases of goods and services (continued) EVROMETAL
Materials 9,856 3,447 Services - 18 Dividends 2,745 3,173 12,601 6,638 KERAMIA Materials 28 - 28 - ELKEME Services 29 - 29 - ERGOSTEEL Services 34 - 34 - INOS BALKAN Materials 1,809 - 1,809 - PANELCO Fixed assets 1,031 - 1,031 -
Total purchases related parties
192,977 140,905
iii) Key management compensation 31 December 2006 2005 Gross salaries and social benefits 756 572 Social securities payable by the employer 3 3 759 575
26
( All amounts in BGN thousands, unless otherwise stated) Related party transactions (continued)

Annual Financial Statements31 December 2006
41
iv) Receivables from related parties 31 December
2006 2005 DOJRAN 11,875 - SIDENOR 9,738 5,432 GENECOS 8,272 4,646 TEPROMETAL GERMANY 2,514 - METAL AGENCIES 2,139 6,136 EVROMETAL 1,373 7,861 SID PAC BULGARIA 1,274 1 TEPROSTEEL 1,056 1,189 INOS BALKAN 721 - SID PAC ROMANIA 349 634 ENERGY SOLUTIONS 261 14 STEELMET BULGARIA 186 65 SOFIA MED 113 512 PROSAL TUBES 108 - AEIFOROS BULGARIA 48 529 ETIL 44 157 TEPROMETAL BULGARIA 16 15 PRAKSYS 11 - SIGMA IS 7 693 AEIFOROS GREECE 2 2 SIDMA - 27 ANAMET BULGARIA - 5
40,107 27,918
26
( All amounts in BGN thousands, unless otherwise stated) Related party transactions (continued) v) Payables to related parties
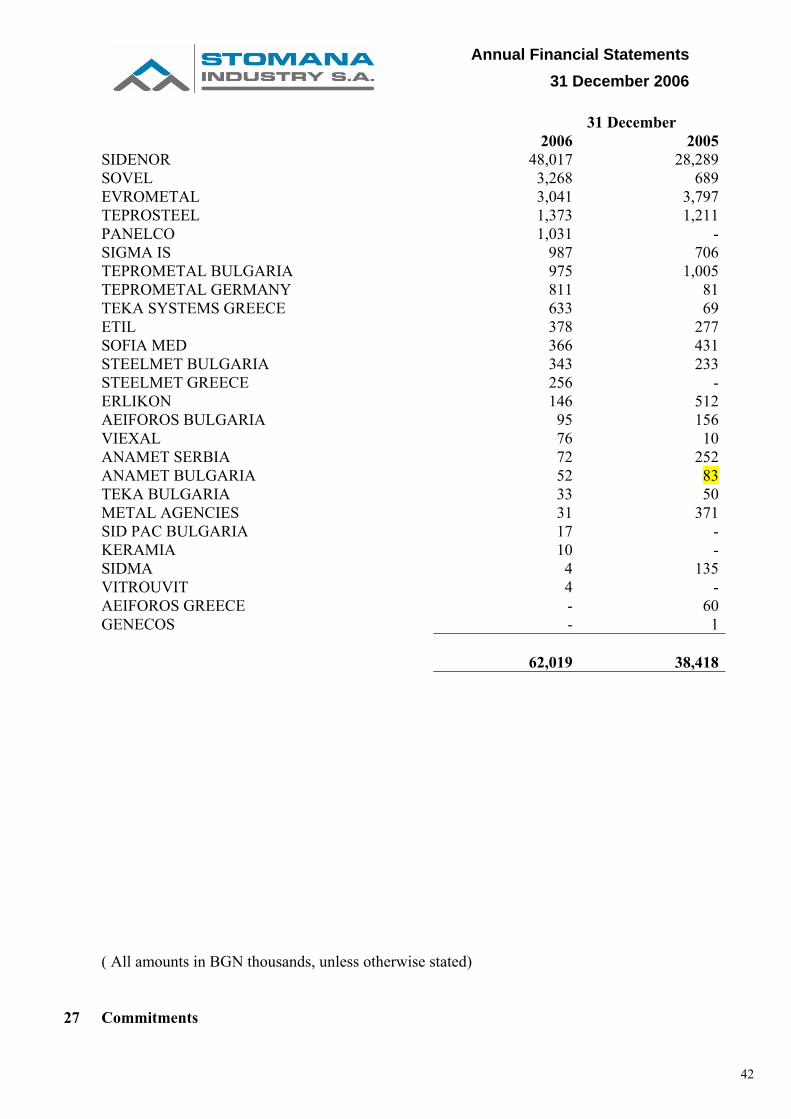
Annual Financial Statements31 December 2006
42
2006
31 December 2005
SIDENOR 48,017 28,289 SOVEL 3,268 689 EVROMETAL 3,041 3,797 TEPROSTEEL 1,373 1,211 PANELCO 1,031 - SIGMA IS 987 706 TEPROMETAL BULGARIA 975 1,005 TEPROMETAL GERMANY 811 81 TEKA SYSTEMS GREECE 633 69 ETIL 378 277 SOFIA MED 366 431 STEELMET BULGARIA 343 233 STEELMET GREECE 256 - ERLIKON 146 512 AEIFOROS BULGARIA 95 156 VIEXAL 76 10 ANAMET SERBIA 72 252 ANAMET BULGARIA 52 83 TEKA BULGARIA 33 50 METAL AGENCIES 31 371 SID PAC BULGARIA 17 - KERAMIA 10 - SIDMA 4 135 VITROUVIT 4 - AEIFOROS GREECE - 60 GENECOS - 1
62,019 38,418
( All amounts in BGN thousands, unless otherwise stated)
27
Commitments

Annual Financial Statements31 December 2006
43
Capital commitments
Capital expenditure contracted for at the balance sheet date but not recognised in the financial statements is as follows:
2006 2005 Danieli 26,948 23,274 Ioannidis 2,457 - OM Impianti 129 1,247 Other 829 780 30,363 25,301 28 Conditional assets and liabilities 2006 2005 Bank guaranties 16,612 27,108 Letter of credits - 126 16,612 27,234 29
Events after the balance sheet date
No significant events have been identified after the balance sheet date, that may influence the
financial statements