ANNUAL FINANCIAL RESULTS - Exxaro
47
ANNUAL FINANCIAL RESULTS PRESENTATION FOR THE YEAR ENDED 31 DECEMBER 2020
Transcript of ANNUAL FINANCIAL RESULTS - Exxaro

ANNUAL FINANCIAL RESULTSPRESENTATION FOR THE YEAR ENDED 31 DECEMBER 2020

Disclaimer
The operational and financial information on which any outlook or forecast statements are based has not
been reviewed nor reported on by the group’s external auditor. These forward-looking statements are based
on management’s current beliefs and expectations and are subject to uncertainty and changes in
circumstances. The forward-looking statements involve risks that may affect the group’s operational and
financial information. Exxaro undertakes no obligation to update or reverse any forward-looking statements,
whether as a result of new information or future developments.
Where relevant, comments exclude transactions which make the results not comparable. These exclusions
are the responsibility of the group's board of directors and have been presented to illustrate the impact of
these transactions on the core operations’ performance and hence may not fairly present the group’s
financial position, changes in equity, results of operations or cash flows. These exclusions have not been
reviewed nor reported on by the group’s external auditor.
2

1
2
3
Presentation outline
Results overview, Outlook & Strategy updateMxolisi Mgojo,Chief Executive Officer
Operational performanceNombasa Tsengwa,Managing Director Minerals Business
Financial resultsRiaan Koppeschaar,Finance Director

RESULTS OVERVIEWMxolisi Mgojo | Chief Executive Officer

5
Macro context | recovery, response and resilience
• Acted to protect employee safety and livelihoods
• Total supportive expenditure of R195.5 million
• Maintained business resilience to provide an essential service
• Ongoing COVID-19 alliances with business and government
Collaborative response to COVID pandemic
Positioning Exxaro for a low carbon future
• Unfolding global impact of outcome of US elections
• Global goal to collaborate to end the pandemic
• Climate-friendly US administration, with potentially wide-ranging implications for the global energy sector
An anticipated shift in geopolitics
• Harvesting value from R17bn capex expansion programme
• Completed TCFD* recommendations assessment
• Early value coal strategy & non-core coal disposal minimises stranded assets
• Digital@Exxaro enabling efficiency improvements
• Decarbonisation - coal operations, position in renewable energy, leveraging mining capability
Mixed commodity price performance
16
(9)
37
(4)
Iron ore fines(62% Fe CFR China US$/t)
Coal(API4, US$/t)
2H20 vs 1H20 FY20 vs FY19
* Task Force on Climate-Related Financial Disclosures

ESG* Maintained leading FTSE Russell
Index position Record safety performance:
• 4 years fatality free
• 0.05 Group LTIFR** (target = 0.11)
6
FY20 highlights | record and balanced performance
* Environment, Social and Governance ** Lost time injury frequency rate per 200 000 man hours worked for FY20 # Measured against FY19
OPERATIONAL Record coal export volumes
12.2Mt 34% Wind energy delivered
727GWh within target
FINANCIAL#
Core EBITDAR7.3bn 25%
Core HEPSR29.73 26%
SHAREHOLDERRETURN Ordinary dividend 1 243 cps Special dividend 543 cps Share buyback R1.5bn

OPERATIONAL PERFORMANCENombasa Tsengwa | Managing Director Minerals Business

Safety and Health
• LTIFR improvement of 58%
• 4 years fatality free on 2 March 2021
• Aim for zero harm
Covid-19 impact on operations
• All operations at full capacity from 2H20, and Matla at 80% till end 3Q20
• Matla 8 264 and Grootegeluk 8 131 tests to date
• Grootegeluk Covid-19 testing laboratory approved for public testing, awaiting approval for the Matla laboratory
• 2 796 positive tests – recovery rate 99% with only 16 active cases as at 10 March 2021
• Strict adherence to screening and testing protocols
8
0.09
0.12 0.12 0.12
0.05
FY16 FY17 FY18 FY19 FY20
Target: 0.11
Safety and health │ excellent safety record
Group COVID-19 vital statistics – 10 March 2021
LTIFR - Operations
Fatality
16 395 2 796 2 768 12 16
TESTS CONDUCTED
CONFIRMED CASES
TOTAL RECOVERIES
TOTAL DEATHS
ACTIVE CASES

MtProduct*
Sales
Domestic ExportWaterberg (WB)• Grootegeluk 1.0 1.2 0.6
Increased offtake from MedupiMpumalanga (MP)• Belfast 1.8 2.1
Ramping up to full production• Matla 0.1 0.2
Higher product from Mine 2 Shortwall
• Leeuwpan (0.7) (1.3) 0.1Covid-19 lockdown and Eskom contract not finalised
• ECC (0.7) (0.9) 0.5Covid-19 lockdown and Eskom contract not finalised
Buy-ins and stock movementFulfil supply commitments 1Q20 Stock increase at RBCT
0.3(0.2)
Total 1.8 (0.8) 3.1
9
FY18 FY19 FY20 FY21** FY22** FY23**
29.7 27.8 28.8 28.8 32.4 32.0
10.8 11.8 12.2 12.616.3 16.96.6 6.0 6.1 6.26.1 6.50.7 0.3
Commercial WB Commercial MP Tied Buy-ins
+ 4% + 0%
Coal volumes │ growth from investments
Total sales
Tonnage movement FY20 vs FY19
* Tumelo previously reported under buy-ins now classified under Commercial MP production ** Based on latest internal forecast (actual figures could vary by ± 5%) Additional information on slides 33 to 35
FY18 FY19 FY20 FY21** FY22** FY23**
26.6 25.4 26.6 27.7 27.8 27.8
4.0 4.0 1.8 3.6 8.9 9.16.6 6.0 6.2 6.26.0 6.58.0 9.1 12.2 11.6
11.5 12.1
Domestic WB Domestic MP Tied Export
+ 5% + 5%
Total product*Mt
Mt
45.2 44.5 46.8 49.154.2 55.5
47.8 45.647.4 47.6
54.8 55.447.8
45.647.4 47.6 54.8 55.4
45.2 44.5 46.8 49.154.2 55.5

• Exported 12.2Mt, 34% higher
• Sales to India down by 12% mainly due to Covid-19 lockdowns
• Increase in sales to other Asian markets driven by Pakistan and opportunistic Vietnamese sales
• Proportion of RB1 is increasing in the sales mix
• Demand in seaborne thermal coal market remains robust
10
Exports │ 12Mt an all-time record
Average realised prices
Exxaro export sales destinations (%)
* Based on latest internal production forecast ** Based on latest internal forecast # Source: Argus/McCloskey Price Index
98
7265
7577
54 4865
0369121518
0
20
40
60
80
100
FY18 FY19 FY20 FY23**
R/US$US$
Average R/US$ rate Average API4 # Exxaro average export price#
Export product mix (%)
FY18 FY19 FY20 FY21* FY22* FY23*
28 21 2047 59 6714 25
4548
43 44 31 2527 17 12 9 10 8
RB1 RB2 RB3 Power station coal
6
63
17
311
FY18
4
5416
14
12
FY19
3
42
27
22
6
FY20
Additional information on slide 36
Europe India Other Asia Pakistan Africa
FY18 FY19 FY20

• Cash cost per tonne up by 4%, below mining inflation
• Main contributor distribution costs associated with 34% higher export volumes
• Stripping ratios remaining high as indicated previously
• Good progress against internal cash preservation targets
11
328359 374
1.92.5
2.8
FY18** FY19** FY20
OE │ driving cost excellence
Cost per tonne – excluding Matla
Cost per tonne – excluding Matla vs strip ratio*
* Tonne of overburden moved for each tonne of ROM ** Re-presented to exclude indirect corporate costs and Coal buy-in cost
359
37415
8 2 1 (7)(4)
FY19
Dis
trib
utio
nco
st
Infla
tion
Prod
uctio
nco
st
Car
bon
tax
and
roya
lties
Supp
ort
cost
Reh
abili
tatio
nad
just
men
t
FY20
Internal cash preservation savings initiatives
+4%
Prod
uctio
n co
st
Sust
aini
ng c
apex
Prod
uctio
n to
nnes
Ran
d / t
onne
Additional information on slide 37
R/tonne
R/tonne
12
FY20 FY21* FY22* FY23* FY24* FY25*
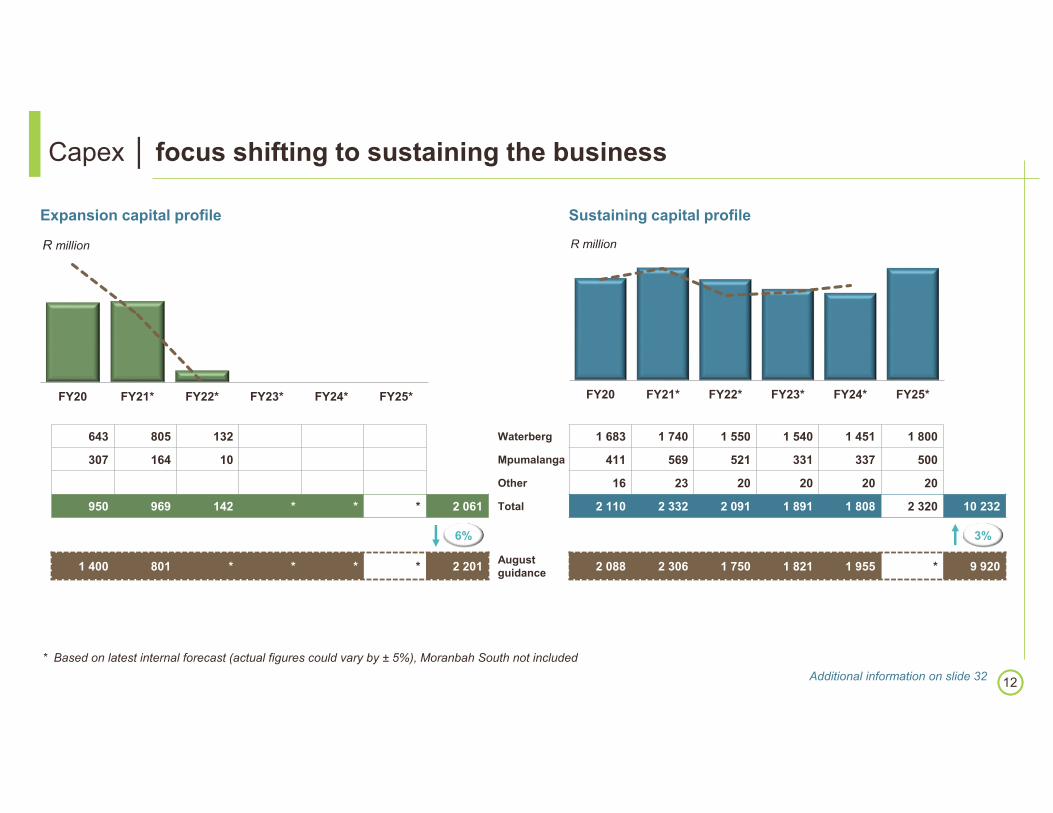
Capex │ focus shifting to sustaining the business
Sustaining capital profile
FY20 FY21* FY22* FY23* FY24* FY25*
Expansion capital profile
643 805 132 Waterberg 1 683 1 740 1 550 1 540 1 451 1 800
307 164 10 Mpumalanga 411 569 521 331 337 500
Other 16 23 20 20 20 20
950 969 142 * * * 2 061 Total 2 110 2 332 2 091 1 891 1 808 2 320 10 232
1 400 801 * * * * 2 201 August guidance 2 088 2 306 1 750 1 821 1 955 * 9 920
* Based on latest internal forecast (actual figures could vary by ± 5%), Moranbah South not included
R million R million
Additional information on slide 32
6% 3%

FINANCIAL RESULTSRiaan Koppeschaar | Finance Director

14
Group core performance | diverse portfolio delivers higher earnings
7 281 5 832
7 291
FY18 FY19 FY20
EBITDA (Rm)
25 491 25 726
28 924
FY18 FY19 FY20
Revenue (Rm)
3 271
4 750
6 455
FY18 FY19 FY20
Equity income (Rm)
2 159 2 354 2 973
FY18 FY19 FY20
HEPS (cents)
+ 12% + 25%
+ 36% + 26%
Detail on calculation of core results on slides 39 to 42

15
Group revenue | continued growth in export market
25 726 473 (1 528)
6 (648)
2 784 10
1 231 (336) 317
889 28 924
Act
ual
FY19
Dom
estic
Exp
ort
Fer
rous
& o
ther
Dom
estic
Exp
ort
Fer
rous
& o
ther
Exc
hang
e
Oth
erre
venu
e
Mat
la
Cen
nerg
i
Act
ual
FY20
Volume & product mix
Coal
R million
Price
Coal

16
Group core EBITDA | cost supporting higher turnover
* Total EBITDA variance for Matla included in General = - R15 million ** Re-presented to exclude indirect corporate costs
5 832
2 881 (353)(150)
431 (162) (674)
(378)(157) (46) (241) 308 7 291
Act
ual
FY19
Com
mer
cial
reve
nue
Infla
tion
Em
ploy
eeco
st
Reh
abili
tatio
n
Ope
ratio
nal
cost
Sel
ling
&D
istr
ibut
ion
Sto
ckm
ovem
ent
& b
uy-in
s
For
ex
Roy
altie
s &
Car
bon
tax
Cen
nerg
ico
st
Gen
eral
*
Act
ual
FY20
R million
Coal** 6 849 1 976 (317) (166) 428 (234) (675) (317) 7 (46) 202 7 707 Energy 889 (241) 648 Ferrous** 11 17 (7) 2 1 56 (70) 2 12 Other** (1 028) (1) (29) 14 2 16 1 9 (164) 104 (1 076)
5 832 2 881 (353) (150) 431 (162) (674) (378) (157) (46) (241) 308 7 291

17
Coal | export volumes offset lower prices
* Re-presented to exclude indirect corporate costs
R million 1H20 2H20 FY19 FY20
Revenue 13 730 14 145 25 582 27 875
Commercial Waterberg 7 615 7 834 14 012 15 449
Commercial Mpumalanga 4 076 3 961 7 240 8 037
Tied Mpumalanga 2 005 2 350 4 038 4 355
Other 34 292 34
EBITDA 4 223 3 484 6 849 7 707
Commercial Waterberg 4 158 3 935 7 146 8 093
Commercial Mpumalanga 35 (468) 71 (433)
Tied Mpumalanga 72 72 159 144
Other* (42) (55) (527) (97)
EBITDA margin (%) 31 25 27 28

18
Cennergi | stable renewable energy generation
* Ratio of actual electricity output over a given period of time to the maximum possible output over that period of time ** Based on latest internal forecast# 100% although only 50% equity-accounted income was included in Exxaro results up to 1Q20 whereafter fully consolidated from 2Q20
FY18 FY19 FY20 FY21**
404 439 404 414
317 322 323 325
Amakhala Tsitsikamma
GWh#
Annual average electricity generation
Amakhala Tsitsikamma
Capacity factor* 36% 40%
Equipment availability 98% 98%
Average electricity generation per annum 414GWh 325GWh
Total
Performance since acquisition
R million 2Q20 2H20 FY20
Revenue 283 606 889
Operational expenses (92) (209) (301)
Group accounting adjustments (51) (158) (209)
Net operating profit 140 239 379
Depreciation 98 194 292
EBITDA 238 433 671
Net debt 4 715 4 632 4 632
Energy generation (9 months) 176GWh 377GWh 553GWh
721 761 727 739
19
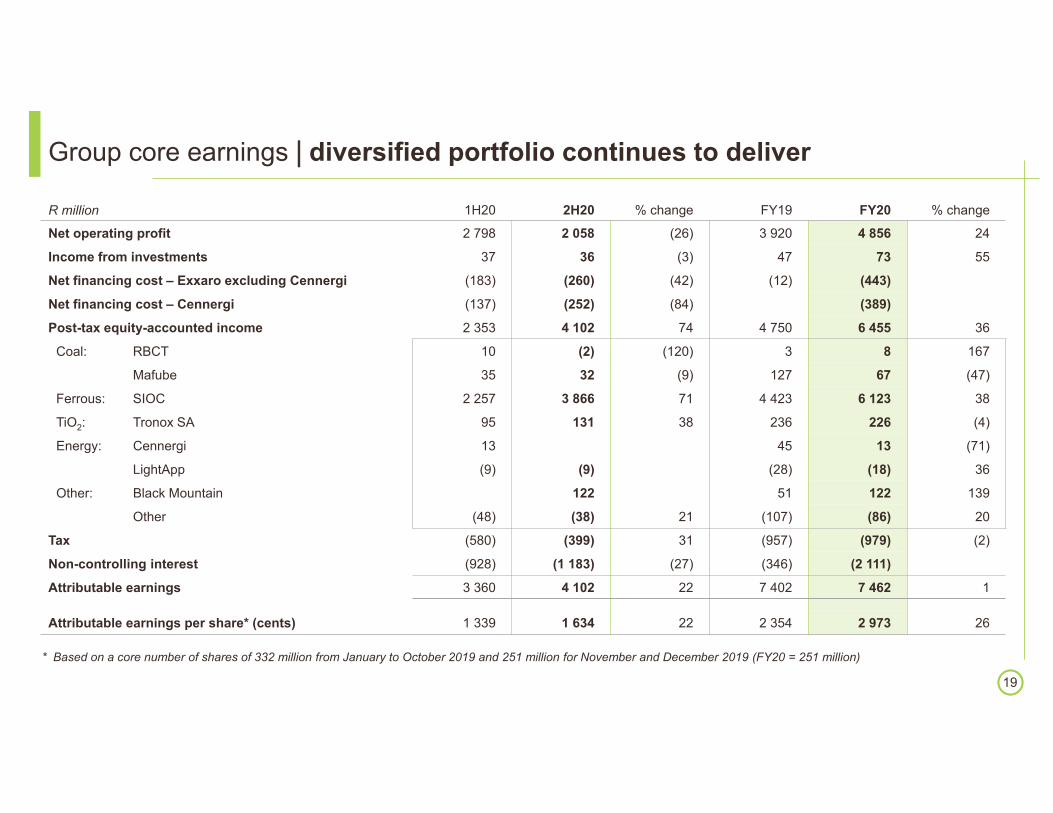
Group core earnings | diversified portfolio continues to deliver
* Based on a core number of shares of 332 million from January to October 2019 and 251 million for November and December 2019 (FY20 = 251 million)
R million 1H20 2H20 % change FY19 FY20 % change
Net operating profit 2 798 2 058 (26) 3 920 4 856 24
Income from investments 37 36 (3) 47 73 55
Net financing cost – Exxaro excluding Cennergi (183) (260) (42) (12) (443)
Net financing cost – Cennergi (137) (252) (84) (389)
Post-tax equity-accounted income 2 353 4 102 74 4 750 6 455 36
Coal: RBCT 10 (2) (120) 3 8 167
Mafube 35 32 (9) 127 67 (47)
Ferrous: SIOC 2 257 3 866 71 4 423 6 123 38
TiO2: Tronox SA 95 131 38 236 226 (4)
Energy: Cennergi 13 45 13 (71)
LightApp (9) (9) (28) (18) 36
Other: Black Mountain 122 51 122 139
Other (48) (38) 21 (107) (86) 20
Tax (580) (399) 31 (957) (979) (2)
Non-controlling interest (928) (1 183) (27) (346) (2 111)
Attributable earnings 3 360 4 102 22 7 402 7 462 1
Attributable earnings per share* (cents) 1 339 1 634 22 2 354 2 973 26
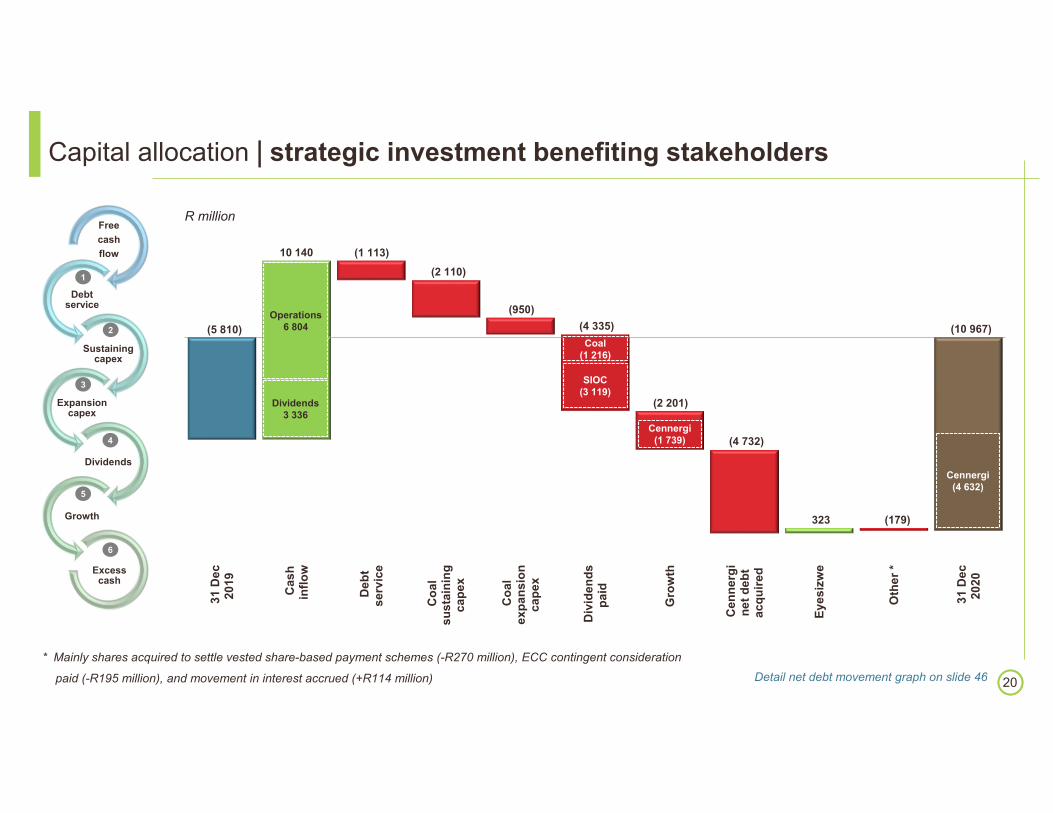
(5 810)
(1 113) (2 110)
(950) (4 335)
(2 201)
(4 732)
323 (179)
(10 967)
31
Dec
2019
Cas
hin
flow
Deb
tse
rvic
e
Coa
lsu
stai
ning
cape
x
Coa
lex
pans
ion
cape
x
Div
iden
dspa
id
Gro
wth
Cen
nerg
ine
t deb
tac
quire
d
Eye
sizw
e
Oth
er *
31
Dec
2020
20
Capital allocation | strategic investment benefiting stakeholders
* Mainly shares acquired to settle vested share-based payment schemes (-R270 million), ECC contingent consideration
paid (-R195 million), and movement in interest accrued (+R114 million)
Freecashflow
Debt service
Sustaining capex
Expansion capex
Dividends
Growth
Excess cash
Detail net debt movement graph on slide 46
Operations6 804
Dividends3 336
SIOC(3 119)
Coal(1 216)
Cennergi(1 739)
1
2
3
4
5
6
10 140
Cennergi(4 632)
R million

21
Shareholder return | strong performance rewarding investment
* Cover calculated on core attributable earnings
Total Final Special Interim Total
FY20 2H20 2H20 1H20 FY19
Dividend cover* - Coal (times) 3.0 3.0
Dividend cover* - Group (times) 2.5
SIOC dividend declared (Rm) 5 369 3 663 1 706 4 092
Dividend declared per share (cents) 2 429 1 243 543 643 1 430
Dividend declared (Rm) 8 713 4 459 1 948 2 306 5 129
Eyesizwe 2 614 1 338 584 692 1 539
Other 6 099 3 121 1 364 1 614 3 590
Share buyback
• Value limited to R1.5 billion
• Subject to market conditions and prevailing share price at the time
• Launch date planned in 2Q21 after closed period ends

OUTLOOKMxolisi Mgojo | Chief Executive Officer
23
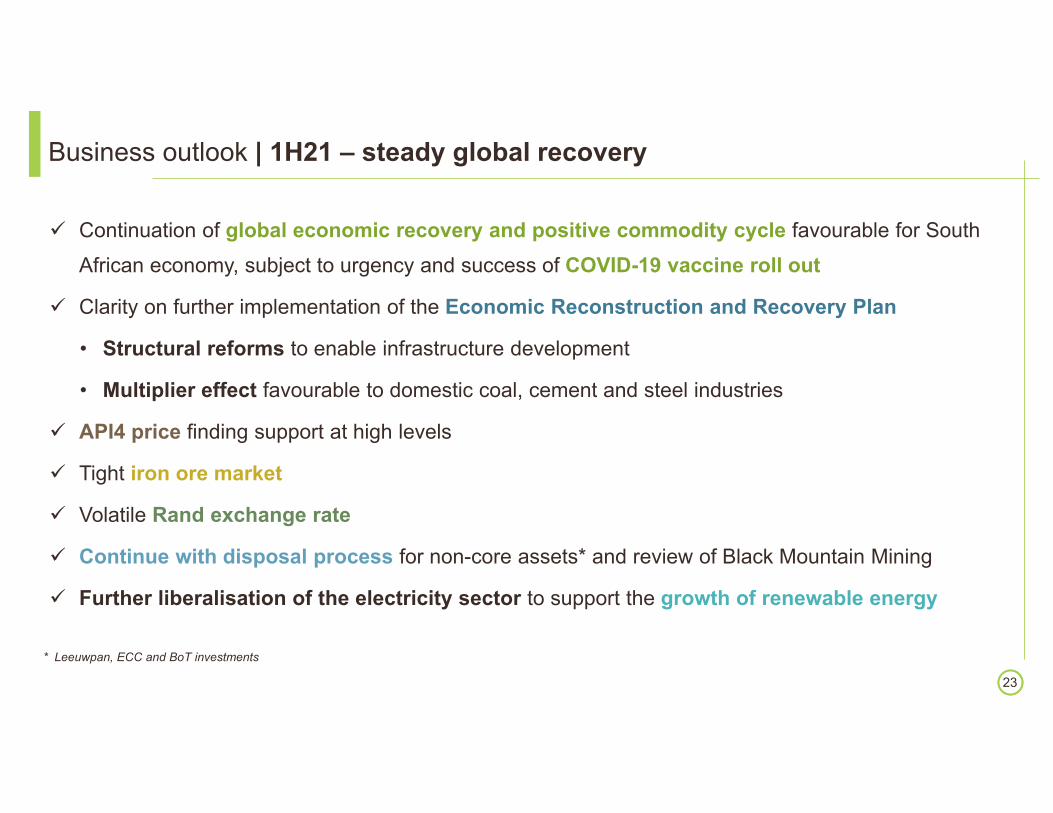
Business outlook | 1H21 – steady global recovery
* Leeuwpan, ECC and BoT investments
Continuation of global economic recovery and positive commodity cycle favourable for South African economy, subject to urgency and success of COVID-19 vaccine roll out
Clarity on further implementation of the Economic Reconstruction and Recovery Plan
• Structural reforms to enable infrastructure development
• Multiplier effect favourable to domestic coal, cement and steel industries
API4 price finding support at high levels
Tight iron ore market
Volatile Rand exchange rate
Continue with disposal process for non-core assets* and review of Black Mountain Mining
Further liberalisation of the electricity sector to support the growth of renewable energy

STRATEGY UPDATEMxolisi Mgojo | Chief Executive Officer

Continue with our portfolio optimisation Good progress on disposal of non-core assets
Responsible value maximisation of our remaining coal asset portfolio
Transition whilst continuing to extract value through operational excellence
Deliberate and responsible management of risks and opportunities in the low carbon transition
Board approval on the strategic direction to facilitate carbon reductions:
Strategy underpinned by TCFD assessment outcomes
Decarbonisation strategy:
• Maximise value of the coal business
• Build on our energy business
• Leverage mining capabilities for minerals opportunities
Build climate resilience for communities
Prioritise acceptable value distribution with long term investments
Disciplined capital allocation and investment framework
25
Strategy | agility and sustainable value creation in a low carbon world
* As communicated at 1H20 results announcement
Strategic priorities*
1
2
3
4
1
2
3
4
Delivery on strategic priorities

26
Energy | accelerate our low carbon future
• South Africa at crossroads of energy liberalisation• 2.5GW of embedded mining demand• Including 84MW demand at Grootegeluk alone
Timing
• Investments in our own generation requirements reduce operating costs,reduce carbon footprint and hedge future electricity tariff increases
• Our DNA is managing large capital-intensive projectsSymbiosis
• The Cennergi strategy has produced one of South Africa’s leading managers ofrenewable assets and one of its largest wind asset basesContinuity
• A disciplined and transparent investment strategy using proven technologyDiscipline
• Investments in Renewable Energy reduce Exxaro’s portfolio risk and provide resilience,diversification and long-term stability to our cash flows
• It is also necessary if we are to accelerate Carbon NeutralityImpact

27
Energy | brief biography of MD – Energy, Roland Tatnall
Appointed as Managing Director, Energy at the ConneXXion, effective 10 March 2021.
A multifaceted professional with over 20 years’ experience in the broader energy industry with a particular focus on Africa and South Africa. He has spent the last 15 years focused on infrastructure and energy investment in private equity, business development and project development roles.
He has had the privilege of working with multicultural teams across the continent and has been exposed to working in markets as diverse as Europe, the US, the Middle East, Asia and Australia. His infrastructure and energy experience exposed him to fund-raising as well as strategy development and implementation.
He says: “Energy is the largest single opportunity on the African continent and one of the most important given the impact it could have on the future of Africa”
THANK YOU

ADDITIONAL INFORMATION

Water intensity
38% Increase
Integrated environmental management
• Total land rehabilitated reduced by 4% due to increased
Belfast activities
• All mine residue facilities at ECC have been upgraded and an
Engineer of Record (EOR) appointed as per SANS 10286
• Water intensity increased by 38% from 99L/tonne ROM in FY19
to 137L/tonne ROM in FY20 due to increased abstraction at
Grootegeluk mine, the ramp up of Belfast and construction
activities at Matla
• Carbon intensity improved by 9% from 5.4ktCO2e/TTM to
4.9ktCO2e/TTM due to energy efficiency projects at our business
units, particularly at Grootegeluk. Electricity intensity decreased
by 7% to 13MWh/kt (14MWh/kt in FY19) and diesel intensity
decreased by 6% to 2 042L/kt (2 183L/kt in FY19)
30
SHEC │ environmental performance
Land disturbed vs land rehabilitated (%)
21%
79%
FY18
21%
79%
FY19
17%
83%
FY20
Total land disturbed Total land rehabilitated
Carbon intensity
9% Reduction
CO2e
Water and Carbon intensity
FY18 FY19 FY20

31
GG6 Expansion • Capex: R5.3bn• Product: 1.7 – 2.7Mtpa of semi soft coking coal • In construction• 1st production: 1H21• Full production: 1H22
Matla Life of Mine Project
• Capex: R3.4bn • Access to reserve at Mine 1• Construction start: 2H20• 1st production: FY23
Belfast • Capex: R3.5bn• Product: 2.7Mtpa of thermal coal• Project Close in progress• 1st production: 1H19• Project Close: 1H21
GG Rapid Load Out Station
• Capex: R1.3bn• Load capacity: 12Mtpa• Project Close: 2H20
Leeuwpan Lifex • Capex: R0.6bn • Product: 2.7Mtpa of thermal coal• 1st production: 2H18• Relocation action plan completion expected
1H21
Coal │ major projects
Pipeline: Timeline:
1H21 • GG6 Expansion: Construction continues with first production expected
• Matla Life of Mine Project: Construction commences • Leeuwpan Lifex: Relocation Action Plan concludes• Belfast: Project Completion
2H21 • GG6 Expansion: Construction Completion• Matla Life of Mine Project: Construction continues
FY22 • GG6 Expansion: Project Complete• Matla Life of Mine Project: Construction continues
FY23 • Matla Life of Mine Project: Construction continues
FY24 • Matla Life of Mine Project: Project Complete

32
R million FY19 FY20 FY21* FY22* FY23* FY24* FY25*Sustaining 2 245 2 110 2 332 2 091 1 891 1 808 2 320
GG rapid load out station 350 113 34GG trucks, shovels and stacker reclaimers 270 643 346 717 334 534 556GG discard and backfill 381 257 251 431 473 214 675GG other 752 670 1 109 402 733 703 569Leeuwpan lifex reserve 48 70 26Leeuwpan other 148 96 196 206 95 102 109ECC 279 216 290 299 160 115 100Belfast 29 57 16 76 120 291Other 17 16 23 20 20 20 20
Expansion 3 572 950 969 142GG6 Expansion 1 195 643 805 132GG other 3Belfast 2 071 204 40ECC 230 103 124 10Other 73
Total coal capital expenditure 5 817 3 060 3 301 2 233 1 891 1 808 2 320Waterberg 2 951 2 326 2 545 1 682 1 540 1 451 1 800Mpumalanga 2 776 718 733 531 331 337 500Other 90 16 23 20 20 20 20
August guidance 3 488 3 107 1 750 1 821 1 955
Coal │ capital expenditure
* Based on latest internal forecast (actual figures could vary by ± 5%)

33
‘000 tonnes FY18 FY19 FY20 FY21* FY22* FY23*
Thermal production 44 815 43 479 44 933 44 592 49 835 50 010
Grootegeluk 27 375 25 683 26 554 25 785 27 457 26 657
Matla 6 609 5 991 6 153 6 214 6 052 6 479
ECC** 4 195 4 511 3 834 3 975 5 359 5 600
Leeuwpan 4 220 4 396 3 720 3 474 5 646 5 626
Belfast 1 029 2 850 3 260 3 442 3 640
Mafube (Buy-ins from Mafube JV) 991 1 869 1 822 1 884 1 879 2 008
NBC 1 425
Buy-ins 651 29 291
Total thermal product (including buy-ins) 45 466 43 508 45 224 44 592 49 835 50 010
Total metallurgical production – Grootegeluk 2 323 2 074 2 222 3 006 5 004 5 355
Total product 47 789 45 582 47 446 47 598 54 839 55 365
Coal │ product volumes
* Based on latest internal forecast (actual figures could vary by ± 5%) ** Reclassified Tumelo buy-ins previously reported under buy-ins to ECC production

34
‘000 tonnes FY18 FY19 FY20 FY21* FY22* FY23*
Sales to Eskom 31 466 31 396 30 861 31 318 37 715 38 378
Grootegeluk 24 059 23 157 24 704 25 122 25 122 25 122
Matla 6 605 5 998 6 157 6 196 6 034 6 460
Leeuwpan 1 343 1 440 1 440
ECC 898 5 119 5 356
NBC 802
Other domestic thermal coal sales 4 536 3 020 2 692 4 826 3 565 3 622
Exports 7 965 9 087 12 170 11 603 11 553 12 087
Total thermal coal sales 43 967 43 503 45 723 47 747 52 833 54 087
Total domestic metallurgical coal sales 1 197 1 030 1 036 1 303 1 399 1 399
Total sales 45 164 44 533 46 759 49 050 54 232 55 486
Coal │ sales volumes
* Based on latest internal forecast (actual figures could vary by ± 5%)

FY18 FY19 FY20 FY21* FY22* FY23*
26.6 25.4 26.6 27.7 27.8 27.8
6.66.0 6.2 6.2 6.0 6.5
2.0 2.7 1.42.1 3.3 3.30.6 1.2 0.31.3
5.4 5.6
0.1 0.10.2
0.2 0.2
1.4
Grootegeluk Matla Leeuwpan ECC Belfast NBC
35
Coal │ domestic market volumes per mine
* Based on latest internal forecast
Million tonnes
37.237.235.435.4 34.634.6
37.537.5
42.742.743.443.4
37.235.4 34.6
37.5
42.743.4

FY18 FY19 FY20 FY21* FY22* FY23*
1.2 1.3 2.0 2.24.1 4.31.9 1.8
1.9 1.8
2.3 2.33.1 3.3
3.1 2.6
1.11.9
1.8 1.9 1.9 2.0
0.7
2.8 3.1 3.23.5
0.7
0.1
0.6
Grootegeluk Leeuwpan ECC Mafube Belfast Other**
36
Coal │ export volumes per mine
* Based on latest internal forecast ** Buy-ins and inventory
Million tonnes
8.08.09.19.1
12.212.211.611.6 11.511.5
12.112.1
8.0
9.1
12.211.6 11.5
12.1

FY19
Selli
ng &
dist
ribut
ion
Infla
tion
Petr
oleu
m
Con
trac
tors
Con
sum
able
s
Car
bon
tax
& ro
yalti
es
Supp
ort
cost
Reh
abili
tatio
n
FY20
6 617 7 010
2 803 2 966
2 324
675
3 000931
(253)
678511491234280317317 163 126 116 46 (151)
Productioncost
Employeecost
Selling & distribution
Supportcost
Generalexpenses
Carbon taxand royalties
Inflation
37
Coal │ cash cost per bucket
R million
13 42014 742
13 42014 742
38
(6)
(11)
(23)
(31)
(32)
(51)
(103)
(200)
(236)
(279)
6
11
23
31
32
51
103
200
234
279
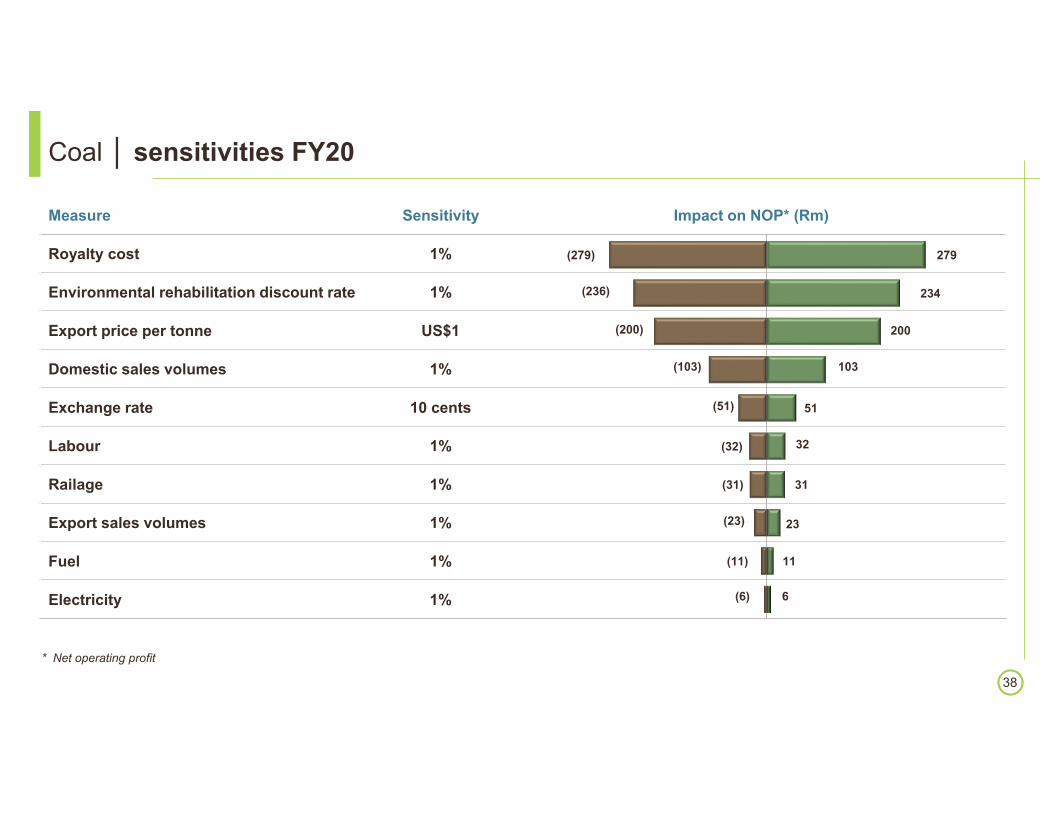
Coal │ sensitivities FY20
* Net operating profit
Measure Sensitivity Impact on NOP* (Rm)
Royalty cost 1%
Environmental rehabilitation discount rate 1%
Export price per tonne US$1
Domestic sales volumes 1%
Exchange rate 10 cents
Labour 1%
Railage 1%
Export sales volumes 1%
Fuel 1%
Electricity 1%

39
Financial overview │ group IFRS
* Non-IFRS number ** Based on weighted average number of shares of 251 million
R million 1H20 2H20 % change FY19 FY20 % change
Revenue 14 078 14 846 5 25 726 28 924 12
Operating expenses (10 009) (14 622) (46) (19 327) (24 631) (27)
Net operating profit 4 069 224 (94) 6 399 4 293 (33)
Net operating profit margin (%) 29 2 (27) 25 15 (10)
Post-tax equity-accounted income 2 355 4 056 72 4 693 6 411 37
Attributable earnings: owners of parent 4 334 2 949 (32) 9 809 7 283 (26)
Headline earnings* 3 315 4 102 24 7 599 7 417 (2)
EBITDA 3 884 3 362 (13) 5 954 7 246 22
Cash generated from operations 4 732 3 038 (36) 5 273 7 770 47
Capital expenditure 1 264 1 911 51 6 076 3 175 (48)
Net debt 10 534 10 967 4 5 810 10 967 89
Attributable earnings per share (cents)** 1 727 1 175 (32) 3 908 2 902 (26)
Headline earnings per share (cents)** 1 321 1 634 24 3 027 2 955 (2)

40
Financial overview │ non-core adjustments
* Property, plant and equipment ** Excluding Matla
R million 1H20 2H20 FY19 FY20Coal (815) (1 478) (44) (2 293)
Disposal/transfer of operations 14 7 76 21
BEE Phase II implementation (870) (870)
Impairment of ECC (1 378) (1 378)
Change in effective equity percentage in RBCT (20) (20)
Loss of control of Tumelo (35)
Impairment reversal on PPE* 23
Insurance claims received 32 148 32
Gain on termination of a lease 1
Targeted voluntary packages** (275)
Gain/(loss) on disposal of non-core assets 9 (87) 18 (78)
Ferrous (11) (2) (11)
BEE Phase II implementation (11) (11)
Targeted voluntary packages (2)
TiO2 2 400
Disposal of Tronox investments 2 335
Indemnity from tax consequence on disposal of Tronox Holdings plc shares 65

41
Financial overview │ non-core adjustments (continued)
R million 1H20 2H20 FY19 FY20Energy 1 262 1 262
Profit on deemed disposal of Cennergi JV 1 321 1 321Recycling of our share of cash flow hedge of Cennergi JV on deemed disposal (59) (59)
Other 835 (356) 125 479ECC contingent consideration adjustment 296
BEE Phase II implementation 881 881Targeted voluntary packages (119)
Loss on dilution of equity-accounted investments (42)
Fair value adjustment of debt 58
Impairment of investment in associate (46) (458) (58) (504)Gain/(loss) on disposal of non-core assets and other 102 (10) 102
Non-core adjustment impact on net operating profit 1 271 (1 834) 2 479 (563)Post-tax equity-accounted income 2 (46) (57) (44)Net financing cost – Replacement BEE Transaction (25)
Tax on items with impact on net operating profit (2) 262 (76) 260Non-controlling interest on items with impact on net operating profit (297) 466 86 168Total non-core adjustment impact on attributable earnings 974 (1 152) 2 407 (179)

42
Financial overview │ group core*
* Non-IFRS number ** Based on a core number of shares of 332 million from January to October 2019 and 251 million for November and December 2019 (FY20 = 251 million)
R million 1H20 2H20 % change FY19 FY20 % change
Revenue 14 078 14 846 5 25 726 28 924 12
Operating expenses (11 280) (12 789) (13) (21 806) (24 069) (10)
Add back: Depreciation 1 131 1 305 15 1 912 2 436 27
EBITDA 3 929 3 362 (14) 5 832 7 291 25
EBITDA margin (%) 28 23 (5) 23 25 2
Post-tax equity-accounted income 2 353 4 102 74 4 750 6 455 36
Headline earnings* 3 360 4 101 22 7 402 7 461 1
Headline earnings per share (cents)** 1 339 1 634 22 2 354 2 973 26
Average R/US$ rate
Realised 16.39 16.51 1 14.73 16.43 12
Spot 16.65 16.25 (2) 14.44 16.45 14
Average API4 export price (US$/tonne) 66.39 64.01 (4) 71.56 65.20 (9)
Average coal export price realised
US$/tonne 51.79 44.54 (14) 53.58 48.00 (10)
R/tonne 862 724 (16) 774 789 2

43
Tronox │ value accretive disposal
R million
Cash invested Proceeds from disposal & dividends
received
Specialcash
dividend
Share buyback
programme
Cash invested in Mineral Sands/Tronox (8 692)
October 2017 6 525 4 502
February & May 2019 4 946 3 215
March 2021 5 763 1 950 1 500
Dividends received (FY12 – FY20) 2 538
Total (8 692) 19 772 9 667 1 500

44
Capital funding structure │ Exxaro excl. Cennergi
* Domestic Medium-Term Note
R million Facilities available
Drawn Undrawn/committed
Undrawn/unissued
Term loan and revolving facility 7 750 2 000
DMTN* programme 1 000 4 000
Interest bearing borrowings 8 750
Interest capitalised 59
Lease liabilities 488
Capitalised transaction costs (8)
Total interest-bearing debt 9 289
Current 6 088
Non-current 3 201
Net cash and cash equivalents (2 954)
Net debt 6 335
Maturity profile of debtRepayment year 9 289
Less than 6 months 736 – 12 months 6 0161 – 2 years 1 2722 – 3 years 9213 – 4 years 6854 – 5 years 53
> 5 years 269

45
Capital funding structure │ Cennergi
* As agreed with providers of loans
R million Facilities available
Drawn Undrawn/committed
Undrawn/unissued
Loan facilities 4 810 395
Interest bearing borrowings 4 810
Lease liabilities 55
Total interest-bearing debt 4 865
Net cash and cash equivalents (233)
Net debt 4 632
Maturity profile of debt*
Repayment year 4 865
Less than 6 months 52
6 – 12 months 59
1 – 2 years 150
2 – 3 years 208
3 – 4 years 273
4 – 5 years 349
> 5 years 3 774

46
Group results │ net debt FY20
5 810 (7 770)
1 113 966
4 335
3 175 (3 336)
1 739
4 732 526 (323) 10 967
31
Dec
2019
Cas
hge
nera
ted
Net fin cost
Tax
Div
iden
dspa
id
Cap
ex
Div
iden
dsre
ceiv
ed
Cen
nerg
ipu
rcha
sepr
ice
Cen
nerg
ine
t deb
tac
quire
d
Oth
er
Eye
sizw
e
31
Dec
2020
Cennergi4 632

47
Performance │ key indicators
* Excluding Cennergi since consolidation of 100% of results since the step-up acquisition from the 1st of April 2020
** Including dividends received from associates and contingent liabilities, except DMRE guarantees and excluding Cennergi consolidated results
Target FY19 FY20
Internal key performance indicators
EBITDA interest cover* (times) >4 160 15
Net debt: equity* (%) <40 17 17
Net debt: EBITDA* (times) <1.5 1.0 1.0
Return on capital employed (%) >20 28 25
Bank covenants**
Net debt: equity (%) <80 17 14
EBITDA interest cover (times) >4 19 11
Net debt: EBITDA (times) <3 0.7 0.7