Annual Financial Report - Schoolwires
125
Annual Financial Report For the Year Ended June 30, 2018 Ector County Independent School District Odessa, Texas
Transcript of Annual Financial Report - Schoolwires

Annual Financial Report
For the Year Ended June 30, 2018
Ector County Independent School District Odessa, Texas

ECTOR COUNTY INDEPENDENT SCHOOL DISTRICT
ANNUAL FINANCIAL REPORT
FOR THE YEAR ENDED JUNE 30, 2018
PREPARED BY THE FINANCE DEPARTMENT
ALBERT ANCHONDO PAM CAYWOOD
REBECCA WIDENER Accounting Department
ALBESSA CHAVEZ Director of Finance
DAVID HARWELL Chief Financial Officer
802 N. Sam Houston Odessa, Texas

ECTOR COUNTY INDEPENDENT SCHOOL DISTRICT
ANNUAL FINANCIAL REPORT FOR THE YEAR ENDED JUNE 30, 2018
TABLE OF CONTENTS
Page INTRODUCTORY SECTION Certificate of Board i Organization Chart ii List of Board of Trustees and Consultants and Advisors vi FINANCIAL SECTION Independent Auditors’ Report 1 Management's Discussion and Analysis 4 Basic Financial Statements Government Wide Statements: A-1 Statement of Net Position 14 B-1 Statement of Activities 15 Governmental Fund Financial Statements: C-1 Balance Sheet 17 C-2 Reconciliation of the Governmental Funds Balance Sheet to the Statement of Net Position 19 C-3 Statement of Revenues, Expenditures, and Changes in Fund Balance 21 C-4 Reconciliation of the Governmental Funds Statement of Revenues, Expenditures, and Changes in Fund Balances to the Statement of Activities 23 Proprietary Fund Financial Statements: D-1 Statement of Net Position 24 D-2 Statement of Revenues, Expenses, and Changes in Fund Net Position 25 D-3 Statement of Cash Flows 26 Fiduciary Fund Financial Statements: E-1 Statement of Fiduciary Net Position 27 Notes to the Financial Statements 28 Budgetary Comparison Reporting: G-1 Statement of Revenues, Expenditures, and Changes in Fund Balance Budget and Actual: General Fund 65 Required Supplementary Information G-2 Schedule of the District’s Proportionate Share of the Net Pension Liability Teacher Retirement System of Texas 66 G-3 Schedule of District Contributions Teacher Retirement System of Texas 67 G-4 Schedule of the District’s Proportionate Share of the Net OPEB Liability Teacher Retirement System of Texas 68 G-5 Schedule of District Contributions for Other Post-Employment Benefits Teacher Retirement System of Texas 69 Note to Required Supplementary Information 70 Combining Schedules Nonmajor Governmental Funds: H-1 Combining Balance Sheet 72 H-2 Combining Statement of Revenues, Expenditures, and Changes in Fund Balances 79 Internal Service Funds: H-3 Combining Statement of Net Position 86 H-4 Combining Statement of Revenues, Expenses, and Changes in Fund Net Position 87

TABLE OF CONTENTS (CONTINUED) Page H-5 Combining Statement of Cash Flows 88 Required TEA Schedules J-1 Schedule of Delinquent Taxes Receivable 89 J-4 Schedule of Revenues, Expenditures, and Changes in Fund Balance Budget and Actual - Child Nutrition Program 91 J-5 Schedule of Revenues, Expenditures, and Changes in Fund Balance Budget and Actual - Debt Service Fund 92 Federal Awards Section Independent Auditors’ Report on Internal Control over Financial Reporting and on 93 Compliance and Other Matters Based on an Audit of Financial Statements Performed in Accordance with Government Auditing Standards Independent Auditors’ Report on Compliance for Each Major Federal Program and Report on 95 Internal Control over Compliance Required by the Uniform Guidance Schedule of Findings and Questioned Costs 97 Schedule of Prior Audit Findings and Questioned Costs 99 K-1 Schedule of Expenditures of Federal Awards 100 Notes to Schedule of Expenditures of Federal Awards 102

INTRODUCTORY SECTION


ii

ECIS
D O
rgan
izat
ion
Char
t C&
I 201
8-20
19
Dr L
lilia
Nan
ez
Ass
ocia
te S
upt
C&I
Ann
McC
lart
yA
sstS
upt f
or S
tude
nt
and
Scho
ol S
uppo
rt
And
rea
Mar
tin
Exec
utiv
e D
irect
or
for E
lem
enta
ry
Elem
enta
ry
Prin
cipa
ls
Vac
ant
Exec
utiv
e D
irect
or fo
r El
emen
tary
Elem
enta
ry
Prin
cipa
ls
Rob
erto
Ced
illo
Exec
utiv
e D
irect
or fo
r Se
cond
ary
Seco
ndar
y Pr
inci
pals
Vac
ant
Exec
utiv
e D
irect
or fo
r Se
cond
ary
Seco
ndar
y Pr
inci
pals
Nan
cy V
anle
y
Exec
utiv
e D
irect
or fo
r Co
unse
ling
Serv
ices
Carla
Byr
ne
Exec
utiv
e D
irect
or fo
r CT
E an
d Ca
reer
Se
rvic
es
Ann
ette
Mac
ias
Exec
utiv
e D
irect
or fo
r A
sses
smen
t and
A
ccou
ntab
ility
Dr.
Tra
cy C
ante
r
Exec
utiv
e D
irect
or fo
r Sp
ecia
l Edu
catio
n
Bet
sabe
Sal
cido
Exec
utiv
e D
irect
or fo
r B
iling
ual/E
SL
Jaso
n O
sbor
ne
Chie
f In
nova
tion
Off
icer
Lisa
Will
s
Exec
utiv
e D
irect
or
for I
nstr
uctio
n an
d Pr
ofes
sion
al
Lear
ning
iii

ECIS
D O
rgan
izat
ion
Char
t Fin
ance
2018
-201
9
Dav
id H
arw
ell
Chie
f Fin
anci
al O
ffic
er
Elai
ne S
mith
ED fo
r Com
plia
nce
and
Gra
nt W
ritin
g
Julia
Will
ett-
Wee
kly
Dire
ctor
of F
eder
al a
nd
Stat
e Pr
ogra
ms
Alb
essa
Cha
vez
Dire
ctor
of F
inan
ce
Arm
ando
Nun
ez
Dire
ctor
of P
ayro
llA
lber
t Val
enci
a
Dire
ctor
of P
urch
asin
g
Jenn
ifer M
oran
Staf
f and
Pay
roll
Budg
et
Coor
dina
tor
iv

ECIS
D O
rgan
izat
ion
Char
t Ope
ratio
ns 2
018-
2019
Patr
ick
Youn
g
Chie
f O
pera
tions
Off
icer
Cort
ney
Smith
Exec
utiv
e D
irect
or D
istr
ict O
pera
tions
Kat
yH
oyng
Dire
ctor
Sch
ool N
utrit
ion
Roge
rCle
ere
Dire
ctor
Tra
nspo
rtat
ion
Gar
y W
eath
erfo
rd
Dire
ctor
of F
acili
ties
Laur
a M
athe
w
Dire
ctor
of N
ursi
ng
v

ECTOR COUNTY INDEPENDENT SCHOOL DISTRICT
Board of Trustees and Consultants and Advisors
Board of Trustees
Doyle Woodall President Donna Smith Vice President Delma Abalos Secretary Steve Brown Member Carol Gregg Member Ray Beaty Member Nelson Minyard Member
Consultants and Advisors
Johnson Miller & Co., CPA’s PC Independent Auditors Atkins, Hollman, Jones, Peacock, Lewis, General Counsel and Lyon McCall, Parkhurst & Horton, LLP Bond Counsel BOK Financial Securities, Inc. Financial Advisor Frost Bank Official Depository
vi

FINANCIAL SECTION

1
Independent Auditors’ Report
Board of Trustees
Ector County Independent School District
802 N. Sam Houston
Odessa, TX 79761
Members of the Board:
Report on the Financial Statements
We have audited the accompanying financial statements of the governmental activities, the
business-type activities, the aggregate discretely presented component units, each major fund, and
the aggregate remaining fund information of the Ector County Independent School District (the
“District”), as of June 30, 2018, and the related notes to the financial statements, which collectively
comprise the District’s basic financial statements as listed in the table of contents.
Management’s Responsibility for the Financial Statements
Management is responsible for the preparation and fair presentation of these financial statements
in accordance with accounting principles generally accepted in the United States of America; this
includes the design, implementation, and maintenance of internal control relevant to the preparation
and fair presentation of financial statements that are free from material misstatement, whether due
to fraud or error.
Auditors’ Responsibility
Our responsibility is to express an opinion on these financial statements based on our audit. We
conducted our audit in accordance with auditing standards generally accepted in the United States
of America and the standards applicable to financial audits contained in Government Auditing
Standards, issued by the Comptroller General of the United States. Those standards require that we
plan and perform the audit to obtain reasonable assurance about whether the financial statements
are free from material misstatement.
An audit involves performing procedures to obtain audit evidence about the amounts and
disclosures in the financial statements. The procedures selected depend on the auditors’ judgment,
including the assessment of the risks of material misstatement of the financial statements, whether
due to fraud or error.
2626 JBS Parkway Two Fasken Center 225 East Bender Boulevard
Suite A-200 550 West Texas Avenue P. O. Drawer 220
Odessa, Texas 79761 Midland, Texas 79701 Hobbs, New Mexico 88241
(432) 362-3800 (432) 683-1835 (575) 393-2171
www.jmcpa.com
JOHNSON, MILLER & CO., CPA’s PC Certified Public Accountants A Professional Corporation
An Independent Member of BDO Alliance USA

2
Auditors’ Responsibility (Continued)
In making those risk assessments, the auditor considers internal control relevant to the entity’s
preparation and fair presentation of the financial statements in order to design audit procedures that
are appropriate in the circumstances, but not for the purpose of expressing an opinion on the
effectiveness of the entity’s internal control. Accordingly, we express no such opinion. An audit
also includes evaluating the appropriateness of accounting policies used and the reasonableness of
significant accounting estimates made by management, as well as evaluating the overall
presentation of the financial statements.
We believe that the audit evidence we have obtained is sufficient and appropriate to provide a basis
for our audit opinion.
Opinion
In our opinion, the financial statements referred to above present fairly, in all material respects, the
financial position of the governmental activities, the business-type activities, the aggregate
discretely presented component units, each major fund, and the aggregate remaining fund
information of the District, as of June 30, 2018, and the respective changes in financial position,
and, where applicable, cash flows thereof for the year then ended in accordance with accounting
principles generally accepted in the United States of America.
Other Matters
Required Supplementary Information
Accounting principles generally accepted in the United States of America require that the
Management’s Discussion and Analysis on pages 4-13, Statement of Revenues, Expenditures, and
Changes in Fund Balance-Budget and Actual-General Fund on page 65, Schedule of the District’s
Proportionate Share of the Net Pension Liability Teacher Retirement System of Texas on page 66,
Schedule of District Contributions Teacher Retirement System of Texas on page 67, Schedule of
the District’s Proportionate Share of the Net OPEB Liability Teacher Retirement System of Texas
(page 68), Schedule of the District’s Contributions for Other Post – Employment Benefits Teacher
Retirement System of Texas (page 69) and the notes to the required Supplementary Information
(pages 70-71) be presented to supplement the basic financial statements. Such information,
although not a part of the basic financial statements, is required by the Governmental Accounting
Standards Board, who considers it to be an essential part of financial reporting for placing the basic
financial statements in an appropriate operational, economic, or historical context. We have applied
certain limited procedures to the required supplementary information in accordance with auditing
standards generally accepted in the United States of America, which consisted of inquiries of
management about the methods of preparing the information and comparing the information for
consistency with management’s responses to our inquiries, the basic financial statements, and other
knowledge we obtained during our audit of the basic financial statements. We do not express an
opinion or provide any assurance on the information because the limited procedures do not provide
us with sufficient evidence to express an opinion or provide any assurance.

3
Other Matters (Continued)
Other Information
Our audit was conducted for the purpose of forming an opinion on the financial statements that
collectively comprise the District’s basic financial statements. The introductory section, combining
and individual nonmajor fund financial statements and statistical section, are presented for purposes
of additional analysis and are not a required part of the basic financial statements. The
accompanying Schedule of Expenditures of Federal Awards, as required by Title 2 U.S. Code of
Federal Regulations (CFR) Part 200, Uniform Administrative Requirements, Cost Principles, and
Audit Requirements for Federal Awards is presented for purposes of additional analysis and is not
a required part of the financial statements. The Texas Education Agency requires Texas school
districts to include certain information in the Annual Financial Report in conformity with laws and
regulations of the state of Texas. The information is in Exhibits J-1 through J-5. These schedules
are not a required part of the financial statements.
The combining and individual nonmajor fund financial statements, the Schedule of Expenditures
of Federal Awards and Exhibits J-1 through J-5 are the responsibility of management and were
derived from and relate directly to the underlying accounting and other records used to prepare the
financial statements. Such information has been subjected to the auditing procedures applied in the
audit of the basic financial statements and certain additional procedures, including comparing and
reconciling such information directly to the underlying accounting and other records used to
prepare the basic financial statements or to the basic financial statements themselves, and other
additional procedures in accordance with auditing standards generally accepted in the United States
of America. In our opinion, the combining and individual nonmajor fund financial statements and
the Schedule of Expenditures of Federal Awards and Exhibits J-1 through J-5 are fairly stated, in
all material respects, in relation to the financial statements as a whole.
The introductory and statistical sections have not been subjected to the auditing procedures applied
in the audit of the basic financial statements and, accordingly, we do not express an opinion or
provide any assurance on them.
Other Reporting Required by Government Auditing Standards
In accordance with Government Auditing Standards, we have also issued our report dated
November 13, 2018 on our consideration of the District’s internal control over financial reporting
and on our tests of its compliance with certain provisions of laws, regulations, contracts, and grant
agreements and other matters. The purpose of that report is solely to describe the scope of our
testing of internal control over financial reporting and compliance and the results of that testing,
and not to provide an opinion on the effectiveness of the District’s internal control over financial
reporting or on compliance. That report is an integral part of an audit performed in accordance with
Government Auditing Standards in considering the District’s internal control over financial
reporting and compliance.
Odessa, Texas
November 13, 2018

MANAGEMENT’S DISCUSSION AND ANALYSIS
In this section of the Annual Financial and Compliance Report, we, the managers of Ector County Independent School District, discuss and analyze the District’s financial performance for the fiscal year ended June 30, 2018. Please read it in conjunction with the independent auditors’ report on page 1, and the District’s Basic Financial Statements which begin on page 14. USING THIS ANNUAL REPORT This annual report consists of a series of financial statements. The government-wide financial statements include the Statement of Net Position and the Statement of Activities (on pages 14 and 15-16). These provide information about the activities of the District as a whole and present a longer-term view of the District’s property and debt obligations and other financial matters. They reflect the flow of total economic resources in a manner similar to the financial reports of a business enterprise. Fund financial statements (starting on page 17) report the District’s operations in more detail than the government-wide statements by providing information about the District’s most significant funds. For governmental activities, these statements tell how services were financed in the short term as well as what resources remain for future spending. They reflect the flow of current financial resources, and supply the basis for tax levies and the appropriations budget. For proprietary activities, fund financial statements tell how goods or services of the District were sold to departments within the District or to external customers and how the sales revenues covered the expenses of the services. The remaining statements and fiduciary statements, provide financial information about activities for which the District acts solely as a trustee or agent for the benefit of those outside of the District. The notes to the financial statements (starting on page 28) provide narrative explanations or additional data needed for full disclosure in the government-wide statements or the fund financial statements. The combining statements for nonmajor funds contain even more information about the District’s individual funds. These are not required by the Texas Education Agency (TEA). The sections labeled TEA Required Schedules and Federal Awards Section contain data used by monitoring or regulatory agencies for assurance that the District is using funds supplied in compliance with the terms of grants. Reporting the District as a Whole The Statement of Net Position and the Statement of Activities The analysis of the District’s overall financial condition and operations begins on page 6. Its primary purpose is to show whether the District is more financially sound as a result of the year’s activities. The Statement of Net Position includes all the District’s assets, deferred outflows, liabilities, and deferred inflows as of the end of the year while the Statement of Activities includes all the revenues and expenses generated by the District’s operations during the year. These apply the accrual basis of accounting which is the basis used by private sector companies. All of the current year’s revenues and expenses are taken into account regardless of when cash is received or paid. The District’s revenues are divided into those provided by outside parties who share the costs of some programs, such as tuition received from students from outside the district and grants provided by the U.S. Department of Education to assist children with disabilities from disadvantaged backgrounds (program revenues), and revenues provided by the taxpayers or by TEA in equalization funding processes (general revenues). All the District’s assets are reported whether they serve the current year or future years. Liabilities are considered regardless of whether they must be paid in the current or future years.
4

These two statements report the District’s net position and changes in them. The District’s net position (the difference between assets and deferred outflows and liabilities and deferred inflows) provide one measure of the District’s financial health, or financial position. Over time, increases or decreases in the District’s net position are one indicator of whether its financial health is improving or deteriorating. To fully assess the overall health of the District, however, you should consider nonfinancial factors as well, such as changes in the District’s average daily attendance or its property tax base and the condition of the District’s facilities. In the Statement of Net Position and the Statement of Activities, the District reports two kinds of activity:
Governmental Activities-All of the District’s basic services are reported here, including instruction, counseling, co-curricular activities, food services, transportation, maintenance, community services, and general administration. Property taxes, tuition, fees, and state and federal grants finance most of these activities.
Component units-The District includes two separate legal entities in its report – ECISD Education
Foundation and Permian High Band and Orchestra. Although legally separate, these “component units” are important because the District is financially accountable for them.
Expense activity is required to be recorded by districts who are participants in cost-sharing pension and OPEB benefit plans with a special funding situation where non-employer contributing entities (NECE) also participate in contributions to the plans. TRS-retirement and TRS-care benefit plans are both cost-sharing plans with special funding situations. Therefore, on-behalf expense activity of the NECE must be recorded at the government-wide level of reporting on the Statement of Activities in accordance with GASB 68 and 75. More detailed information about the negative operating grants and contributions reported in the statement of activities can be found in Note T to the financial statements. Reporting the District’s Most Significant Funds Fund Financial Statements The fund financial statements begin on page 17 and provide detailed information about the most significant funds-not the District as a whole. Laws and contracts require the District to establish some funds, such as grants received under the No Child Left Behind Act from the U.S. Department of Education. The District’s administration establishes many other funds to help it control and manage money for particular purposes (like campus activities). The District’s two kinds of funds-governmental and proprietary-use different accounting approaches.
Governmental funds-Most of the District’s basic services are reported in governmental funds. These use modified accrual accounting (a method that measures the receipt and disbursement of cash and all other financial assets that can be readily converted to cash) and report balances that are available for future spending. The governmental fund statements provide a detailed short-term view of the District’s general operations and the basic services it provides. We describe the differences between governmental activities (reported in the Statement of Net Position and the Statement of Activities) and governmental funds in reconciliation schedules following each of the fund financial statements.
Proprietary funds-The District reports the activities for which it charges users (whether outside
customers or other units of the District) in proprietary funds using the same accounting methods employed in the Statement of Net Position and the Statement of Activities. The internal service funds report activities that provide supplies and services for the District’s other programs and activities-such as the District’s self-insurance programs.
5

The District as Trustee Reporting the District’s Fiduciary Responsibilities The District is the trustee, or fiduciary, for money raised by the student activities. All of the District’s fiduciary activities are reported in a separate Statement of Fiduciary Net Position on page 27. We exclude these resources from the District’s other financial statements because the District cannot use these assets to finance its operations. The District is only responsible for ensuring that the assets reported in these funds are used for their intended purposes. GOVERNMENT-WIDE FINANCIAL ANALYSIS Our analysis focuses on the net position (Table I) and changes in net position (Table II) of the District’s governmental activities.
Table I
Ector County Independent School District
NET POSITION
2018 2017
Current and other assets $ 103,704,630 $ 86,845,728Capital assets 322,885,022 335,155,389 Total assets 426,589,652 422,001,117Deferred charge on refunding 4,338,207 4,620,877 Deferred resource outflow for TRS 23,467,715 31,685,143 Deferred resource outflow for OPEB 901,504 - Total deferred outflows of resources 28,707,426 36,306,020 Long-term liabilities 195,987,428 204,159,141Net Pension liability 52,121,909 67,236,631Net OPEB liability 111,292,438 - Other liabilities 30,791,993 26,437,782 Total liabilities 390,193,768 297,833,554Deferred resource inflow for TRS 12,444,463 3,877,195Deferred resource inflow for TRS OPEB 46,553,837 - Total deferred inflows of resources 58,998,300 3,877,195Net position:Invested in capital assets net of related debt 136,001,166 138,205,124 Restricted 13,256,670 2,610,245Unrestricted (143,152,826) 15,781,019
Total net position $ 6,105,010 $ 156,596,388
Governmental Activities
Net position of the District’s governmental activities decreased 96.0% from $156,596,388 to $6,105,010. Significant changes in net position from the prior year are explained as follows:
Current and other assets increased primarily because of an increase in investments.
6

Net capital assets decreased primarily because of equipment disposals and current year depreciation.
Deferred outflows, net pension liability, net post-employment liability, and deferred inflows changed due to assignment of pension liability and other post-employment benefits liability from the Teacher Retirement System.
Other liabilities increased primarily due to an increase in deferred revenues from insurance recovery funds.
Please see page 19 for a detailed explanation of changes in net position.
Table II
Ector County Independent School District
CHANGES IN NET POSITION
2018 2017
Charges for services $ 7,876,826 $ 7,926,323Operating grants and contributions 2,896,195 42,659,776
Property taxes, levied for general purposes 125,059,972 126,134,457Property taxes, levied for debt service 13,615,128 12,903,623State aid – formula grants 92,438,360 80,857,649Grants and contributions not restricted 35,568 85,045Investment earnings 679,537 338,654Miscellaneous local and intermediate revenue 7,598,417 1,869,098 Total revenue 250,200,003 272,774,625
Instruction, curriculum and media services 107,405,744 176,208,415Instructional and school leadership 14,927,884 23,637,827Student support services 15,629,615 22,573,836Child nutrition 12,362,393 15,161,405Co-curricular activities 6,226,921 7,364,444General administration 4,951,824 6,824,620Facilities maintenance, security and data processing 35,271,309 35,554,159Community services 1,048,069 1,464,377Debt service 6,000,066 4,421,869Other Intergovernmental charges 1,544,684 1,463,402 Total expenses 205,368,509 294,674,354
44,831,494 (21,899,729)156,596,388 178,496,117
Prior period adjust to net position (195,322,872) - $ 6,105,010 $ 156,596,388
Governmental Activities
Revenues:Program revenues:
General revenues:
Expenses:
Increase in net positionNet position - beginning
Net position - ending
7

The District’s total revenues decreased by 8% – approximately $22.6 million from prior year revenues. Significant changes in revenue from the prior year are explained as follows:
Program revenues decreased approximately $39.8 million, due to a decrease in federal and state revenue of $3.7 million and a decrease in operating grants and contributions of approximately $36.1 million as a result of GASB 68 and GASB 75 recognition of the District’s portion of the State’s proportion of pension expense and other post-employment benefits.
Property tax revenue decreased approximately $363,000 due to a decrease in tax collections. State Aid – Formula Grants and Grants and contributions not restricted increased by a net of $11.5
million due to an increase in state funding and to GASB 68 and GASB 75 recognition of the District’s portion of the State’s proportion of pension expense and other post-employment benefits.
Investment Earnings increased by $341,000 during the year primarily due to rising interest rates, from
an average of 0.5400% in 2016-2017 to an average of 1.5324% in 2017-2018. Miscellaneous local revenue increased an approximate of $5.7 million primarily due to insurance
recovery funds received from hail damage claims.
The District’s total expenses decreased by 30% – approximately $89.3 million from prior year expenses. Significant changes in expenses from the prior year are as follows:
• Instruction, curriculum and media services expenses decreased during 2017-2018
approximately $68.8 million. The decrease is attributed mainly from GASB 68 recognition of the District’s portion of the State’s proportion of pension expense and GASB 75 recognition of the District’s portion of the State’s proportion of other post-employment benefits. Payroll expenses decreased approximately by $61.3 million. Services expense increased approximately $200,000, and supplies and miscellaneous expenses decreased approximately $7.7 million.
• Instructional and school leadership expenses decreased approximately $8.7 million mostly due to the GASB 68 recognition of the District’s portion of the State’s proportion of pension expense and GASB 75 recognition of the District’s portion of the State’s proportion of other post-employment. Payroll, miscellaneous and supplies expenses decreased approximately $7.7 million, $600,000, $400,000.
• Student support services expense decreased approximately $6.94 million due mainly to the GASB 68 recognition of the District’s portion of the State’s proportion of pension expense and GASB 75 recognition of the District’s portion of the State’s proportion of other post-employment. Payroll and miscellaneous expenses decreased $6.3 million, and $740,000 respectively. Supplies expense increased by approximately $100,000.
• Child nutrition program expenses decreased approximately $2.8 million due mainly to the GASB 68 recognition of the District’s portion of the State’s proportion of pension expense and GASB 75 recognition of the District’s portion of the State’s proportion of other post-employment. Payroll and miscellaneous expenses decreased $2.1 million and $1.1 million respectively. Supplies and services expenses increased by a total of approximately $400,000.
• Co-curricular activities expenses decreased approximately $1.14 million due mainly to the GASB 68 recognition of the District’s portion of the State’s proportion of pension expense and GASB 75 recognition of the District’s portion of the State’s proportion of other post-employment. Miscellaneous expenses and supplies expenses decreased by approximately $1.94 million and $200,000 respectively. Payroll and services expenses increased by a total of approximately $1 million respectively.
• General administration expenses decreased by approximately $1.9 million from the prior year due mainly to the GASB 68 recognition of the District’s portion of the State’s proportion of
8

pension expense and GASB 75 recognition of the District’s portion of the State’s proportion of other post-employment. Payroll and miscellaneous expenses decreased $2.2 million and $200,000 respectively. Services and supplies expenses net to an increase of approximately $500,000.
• Facilities maintenance, security and data processing expenses decreased approximately $300,000 due mainly to the GASB 68 recognition of the District’s portion of the State’s proportion of pension expense and GASB 75 recognition of the District’s portion of the State’s proportion of other post-employment. Payroll and miscellaneous expenses decreased by $3.9 million and $2.6 million respectively. Supplies and services expenses increased by $3.8 million and $2.5 million respectively.
• Community services expense decreased approximately $400,000 due mainly to the GASB 68 recognition of the District’s portion of the State’s proportion of pension expense and GASB 75 recognition of the District’s portion of the State’s proportion of other post-employment. Payroll, supplies and miscellaneous expenses decreased by a total of approximately $400,000.
• Debt services expenses increased by approximately $1.6 million due to payment of debt obligations.
• Other intergovernmental charges increased approximately $80,000 from an increase in the tax appraisal fees.
In an effort to provide a better understanding of the impact the District has experienced as a result of implementing the reporting requirements of GASB 68 for the District’s portion of the State’s proportion of pension expense and GASB 75 for the District’s portion of the State’s proportion of other post-employment benefits, we have incorporated adjustments in net position (Table III). More detailed information about the District’s benefits plans is presented in Notes J and K to the financial statements.
9

Table III
Ector County Independent School District
ADJUSTMENTS TO NET POSITION
DescriptionRevenues:
Program revenues:Charges for services -$ -$ -$ 7,876,826$ 7,876,826$ Operating grants and contributions - - - 2,896,195 2,896,195
General revenues: - Property taxes, levied for general purposes 127,762,668 - - (2,702,696) 125,059,972 Property taxes, levied for debt service 13,459,073 - - 156,055 13,615,128 State aid – formula grants 141,448,427 (1,829,980) (44,691,397) (2,488,690) 92,438,360 Grants and contributions not restricted - - - 35,568 35,568 Investment earnings 528,767 - - 150,770 679,537 Miscellaneous local and intermediate revenue 15,459,933 - - (7,861,516) 7,598,417
Total Revenue 298,658,868 (1,829,980) (44,691,397) (1,937,488) 250,200,003
Expenses:Instruction, curriculum and media services 159,188,610 (106,810) (56,763,835) 5,087,779 107,405,744 Instructional and school leadership 21,860,579 (15,372) (7,380,914) 463,591 14,927,884 Student support services 21,894,199 (13,976) (6,743,124) 492,516 15,629,615 Child nutrition 14,623,026 (4,141) (3,301,154) 1,044,662 12,362,393 Co-curricular activities 5,165,355 (2,166) (1,035,309) 2,099,041 6,226,921 General administration 6,735,260 (3,566) (1,788,317) 8,447 4,951,824 Facilities maintenance, security and data processing 37,912,867 (13,348) (5,786,395) 3,158,185 35,271,309 Community Services 1,282,531 (627) (270,450) 36,615 1,048,069 Debt service 15,055,060 - - (9,054,994) 6,000,066 Facilities Acquisition and Construction 86,581 - - (86,581) - Other Intergovernmental Charges 1,544,684 - - - 1,544,684
Total Expenditures 285,348,752 (160,006) (83,069,498) 3,249,261 205,368,509
Excess (Deficiency) of Revenues Over (Under) 13,310,116 (1,669,974) 38,378,101 (5,186,749) 44,831,494
Other Sources (Uses):Sale of Real and Personal Property 481,328 - - (481,328) - Transfers In 1,705,845 - - (1,705,845) - Transfers Out (Use) (1,705,845) - - 1,705,845 -
Total Sources (Uses) 481,328 - - (481,328) -
Change in Net Position 13,791,444 (1,669,974) 38,378,101 (5,668,077) 44,831,494 Net Position - Beginning 39,767,739 (39,428,683) - 156,257,332 156,596,388 Prior Period Adjustment - - (195,322,872) - (195,322,872) Net Position - Ending 53,559,183$ (41,098,657)$ (156,944,771)$ 150,589,255$ 6,105,010$
All Other GASB 34
Entity Wide Statement
Fund Statements GASB75 GASB68
10

The District’s Funds As the District completed the year, its governmental funds (as presented in the balance sheet on page 17) reported a combined fund balance of approximately $54 million, which is above last year’s total of approximately $40 million. The primary reasons for the increase include (1) an increase in investments primarily due to increased revenues and rising interest rates, and (2) a reduction of liabilities primarily in due to other funds. Over the course of the year, the District recommended and the Board of Trustees approved revisions of the District’s general fund budget for various reasons. The following is a summary of significant budget amendments made to estimated revenues:
Estimated RevenuesBeginning Estimated Revenues 242,849,264$ Estimated Foundation school funding from property value study for prior years 4,572,775 Estimated tax collections 3,080,000 Estimated investment interest 170,000 Estimated tuition revenues 94,130 Estimated SHARS revenue 90,000 Estimated insurance recovery 48,000 Estimated cocurricular activities revenue 23,500 Estimated gifts and bequests revenue 23,000 Estimated miscellaneous revenues 15,980 Estimated rent revenue 12,500 Estimated federal revenues (38,000) Estimated State Aid Funding (1,411,290) Final Amended Estimated Revenues 249,529,859$
The following is a summary of significant budget amendments made to appropriations and other sources:
AppropriationsBeginning Appropriations 242,452,264$ Increase in property insurance premium 705,000 Increase for discretionary activity for the year 462,000 Increase for fuel and vehicle repairs 75,000 Increase for estimated end of year payroll costs 3,100 Final Amended Appropriations 243,697,364$
Other Sources (Uses)Beginning Other Sources (Uses) (397,000)$ Operating transfer in for close of Fund 686 2015 Capital Projects 1,197,002 Operating transfer in for close of Fund 679 2013 Bond Issue 149,311 Operating transfer in for close of Fund 681 2013 Maintenance Projects 51,337 Final Amended Other Uses 1,000,650$
11

Capital Asset and Debt Administration Capital Assets At the end of 2018, the District had approximately $323 million invested in a broad range of capital assets, (net of accumulated depreciation and amortization) including facilities and equipment for instruction, transportation, athletics, administration, maintenance, and computer technology. This amount represents a net decrease of approximately $12 million or 4%, below last year.
This year's major additions included:2017-2018
Capital AdditionsBond Projects:
Odessa High School-Performing Arts Center 6,255,371
Non-Bond Projects:Odessa High School Parking Lot Project 214,577 School Nutrition Pallet Storage Racks 49,870 School Nutrition Warehouse LED Lights 28,099 Bowie Middle School heating, ventilation, and air conditioning 27,054 Ector Middle School heating, ventilation, and air conditioning 17,893 Nimitz Middle School heating, ventilation, and air conditioning 11,808 Access Controls - Austin Elementary School 9,450 Access Controls - Noel Elementary School 8,378 Access Controls - Murry Fly Elementary School 8,368 Access Controls - Cavazos Elementary School 8,348 Access Controls - Travis Elementary School 7,857 Access Controls - Special Education Annex Building 7,652 Access Controls - School Nutrition 6,315
Construction in Progress (6,245,875)
Furniture, Fixtures and Equipment:Playground Equipment 399,796 Transportation Vehicles & Equipment 352,803 School Nutrition Equipment 193,186 School Nutrition Vehicles 184,645 Technology Equipment 70,413 Welding Machines 32,603 Police Vehicles 32,591 Electronic Signs 17,271 Other Equipment 13,782 Maintenance Vehicles & Equipment 13,756 Network Camera 11,430 Musical Instruments 7,815 Sound Systems 6,522
Total Capital Additions 1,751,778
12

Debt Administration At year-end, the District had approximately $187 million in bonds outstanding versus approximately $196 million last year for a decrease of $9 million. The decrease resulted primarily from bond principal payments. Based on information provided by the Teacher Retirement System of Texas (TRS), the District recognized its proportionate share of TRS’s net other post-employment benefits liability of $111,292,438. Based on information provided by the Teacher Retirement System of Texas (TRS), the District recognized its proportionate share of TRS’s net pension liability of $52,121,909. Other obligations include accrued worker’s compensation and sick leave. More detailed information about the District’s long-term liabilities is presented in Notes G, I, J, K, L and M to the financial statements. Economic Factors and Next Year’s Budgets and Rates The District’s elected and appointed officials considered many factors when preparing the fiscal year 2019 budget: (1) the need to staff and operate campuses; (2) the anticipated change of student population within the campuses and; (3) to provide funding for software, textbooks, and various instructional initiatives. These factors were taken into account when adopting the General Fund budget for 2019. Estimated revenues in the General Fund are $275.3 million, and estimated appropriations and other uses total $275.3 million. Budgeted appropriations have been increased by approximately $30.1 million from the 2018 budget. Of this amount, approximately $18 million is subject to passage of a 13 cent tax rate election to provide additional operating capital. Contacting the District’s Financial Management This financial report is designed to provide our citizens, taxpayers, customers, investors and creditors with a general overview of the District’s finances and to show the District’s accountability for the money it receives. If you have questions about this report or need additional financial information, contact the District’s business office, at Ector County Independent School District, 802 N. Sam Houston, Odessa, Texas.
13

GOVERNMENT WIDE STATEMENTS

EXHIBIT A-1ECTOR COUNTY INDEPENDENT SCHOOL DISTRICTSTATEMENT OF NET POSITION
JUNE 30, 20181 4
Control
Data
CodesGovernmental
Activities Unit
Component
Primary Government Component Unit
ASSETS
168,334 4,666,533 Cash and Cash Equivalents $ $11102,811,705 71,840,187 Current Investments1120
- 15,418,483 Property Taxes Receivable (Delinquent)1220 - (8,508,106)Allowance for Uncollectible Taxes1230 - 19,346,026 Due from Other Governments1240
6,173 24,545 Other Receivables, net12905,335 873,651 Inventories1300
- 43,311 Prepayments1410Capital Assets:
- 10,961,837 Land1510 - 299,451,853 Buildings, Net1520 - 12,188,305 Furniture and Equipment, Net1530 - 283,027 Library Books and Media, Net1560
Total Assets1000 426,589,652 2,991,547
DEFERRED OUTFLOWS OF RESOURCES
- 4,338,207 Deferred Charge for Refunding1701 - 23,467,715 Deferred Outflow Related to TRS Pension1705 - 901,504 Deferred Outflow Related to TRS OPEB1706
Total Deferred Outflows of Resources1700 28,707,426 -
LIABILITIES
35,825 4,363,877 Accounts Payable211043,598 - Short Term Debt Payable2120
- 2,127,983 Interest Payable2140 - 2,066,681 Payroll Deductions & Withholdings2150 - 15,400,071 Accrued Expenses2200 - 6,833,381 Unearned Revenue2300
Noncurrent Liabilities - 4,281,318 Due Within One Year2501 - 191,706,110 Due in More Than One Year2502 - 52,121,909 Net Pension Liability (District's Share)2540 - 111,292,438 Net OPEB Liability (District's Share)2545
Total Liabilities2000 390,193,768 79,423
DEFERRED INFLOWS OF RESOURCES
- 12,444,463 Deferred Inflow Related to TRS Pension2605 - 46,553,837 Deferred Inflow Related to TRS OPEB2606
Total Deferred Inflows of Resources2600 58,998,300 -
NET POSITION
- 136,001,166 Net Investment in Capital Assets3200Restricted for:
- 13,227,510 Restricted for Capital Projects3860 - 3,299 Restricted for Campus Activities3870 - 25,861 Restricted for Scholarships3880
1,376,091 - Restricted for Other Purposes38901,536,033 (143,152,826)Unrestricted3900
Total Net Position3000 6,105,010 2,912,124 $ $
The notes to the financial statements are an integral part of this statement.
14

ECTOR COUNTY INDEPENDENT SCHOOL DISTRICTSTATEMENT OF ACTIVITIES
FOR THE YEAR ENDED JUNE 30, 2018
Control
Data
CodesExpenses Services
Charges for
Contributions
Grants and
Operating
Program Revenues
1 43
Primary Government:
GOVERNMENTAL ACTIVITIES:728,438 99,516,879 (3,517,521)Instruction $ $ $11
- 1,704,354 (239,928)Instructional Resources and Media Services12
- 6,184,511 3,008,557 Curriculum and Staff Development13
- 2,690,512 (390,122)Instructional Leadership21
- 12,237,372 (1,935,472)School Leadership23
- 7,694,633 (689,032)Guidance, Counseling and Evaluation Services31
24,728 469,985 (9,883)Social Work Services32
- 1,508,064 (196,108)Health Services33
37,092 5,956,933 (679,057)Student (Pupil) Transportation34
4,050,342 12,362,393 9,268,903 Food Services35
12,641 6,226,921 (344,683)Extracurricular Activities36
2,884,643 4,951,824 (194,832)General Administration41
126,578 27,545,927 (540,256)Facilities Maintenance and Operations51
- 2,122,947 (271,498)Security and Monitoring Services52
- 5,602,435 (420,890)Data Processing Services53
12,364 1,048,069 48,017 Community Services61
- 5,990,818 - Debt Service - Interest on Long Term Debt72
- 9,248 - Debt Service - Bond Issuance Cost and Fees73
- 1,544,684 - Other Intergovernmental Charges99
[TP] TOTAL PRIMARY GOVERNMENT: 205,368,509 7,876,826 2,896,195 $ $ $
Component Unit:
1,491,557 1,500,666 58,686 Nonmajor Component Unit $ $ $1C
[TC] TOTAL COMPONENT UNIT: 1,500,666 1,491,557 58,686 $ $ $
DataControlCodes
General Revenues:Taxes:
Property Taxes, Levied for General PurposesMT
Property Taxes, Levied for Debt ServiceDT
State Aid - Formula GrantsSF
Grants and Contributions not RestrictedGC
Investment EarningsIE
Miscellaneous Local and Intermediate RevenueMI
Total General RevenuesTR
Net Position - Beginning
Change in Net Position
Net Position - Ending
Prior Period Adjustment Required by GASB 75
CN
NB
PA
NE
The notes to the financial statements are an integral part of this statement.
15

EXHIBIT B-1
Net (Expense) Revenue and
Activities
Governmental
Changes in Net Position
6 9
Component
Unit
Primary Government Component Unit
(102,305,962)$ - $(1,944,282) - (3,175,954) -
(3,080,634) - (14,172,844) - (8,383,665) -
(455,140) - (1,704,172) - (6,598,898) -
956,852 - (6,558,963) -
(2,262,013) - (27,959,605) - (2,394,445) - (6,023,325) -
(987,688) - (5,990,818) -
(9,248) - (1,544,684) -
(194,595,488) -
- 49,577
- 49,577
125,059,972 - 13,615,128 - 92,438,360 -
35,568 -
679,537 - 7,598,417 -
239,426,982 -
44,831,494
156,596,388
6,105,010 $
(195,322,872)
49,577
2,862,547
-
2,912,124 $
16

GOVERNMENTAL FUND FINANCIAL STATEMENTS

ECTOR COUNTY INDEPENDENT SCHOOL DISTRICT
BALANCE SHEET
GOVERNMENTAL FUNDS
JUNE 30, 2018
Control
Data
Codes
General
Fund Recovery Fund
Insurance
40
Fund
Debt Service
5010
ASSETS - 3,485,822 5,340 Cash and Cash Equivalents $ $ $1110
7,147,470 35,563,908 11,809,270 Investments - Current1120
- 14,045,746 1,372,737 Property Taxes - Delinquent1220
- (7,750,613) (757,493)Allowance for Uncollectible Taxes (Credit)1230
- 18,174,219 - Receivables from Other Governments1240
- 3,700,805 463,671 Due from Other Funds1260
- 24,545 - Other Receivables1290
- 58,166 - Inventories1300
- 43,311 - Prepayments1410
Total Assets1000 67,345,909 7,147,470 12,893,525 $ $ $
LIABILITIES598,409 3,032,901 - Accounts Payable $ $ $2110
- 2,066,681 - Payroll Deductions and Withholdings Payable2150
425,955 3,930,971 - Due to Other Funds2170
- 13,011,486 - Accrued Expenditures2200
6,123,106 6,410,534 622,669 Unearned Revenues2300
Total Liabilities2000 28,452,573 7,147,470 622,669
FUND BALANCESNonspendable Fund Balance:
- 58,167 - Inventories3410
Restricted Fund Balance: - - - Federal or State Funds Grant Restriction3450
- - 12,270,856 Retirement of Long-Term Debt3480
- - - Other Restricted Fund Balance3490
Committed Fund Balance: - 13,085,000 - Construction3510
- 1,000,000 - Self Insurance3540
- 728,176 - Other Committed Fund Balance3545
Assigned Fund Balance: - 7,702,535 - Other Assigned Fund Balance3590
- 16,319,458 - Unassigned Fund Balance3600
Total Fund Balances3000 38,893,336 - 12,270,856
$ 67,345,909 $ 7,147,470 $ 12,893,525 Total Liabilities and Fund Balances4000
The notes to the financial statements are an integral part of this statement.
17

EXHIBIT C-1
Other
Funds Funds
Governmental
Total
45,154 3,536,316 $ $975,163 55,495,811
- 15,418,483 - (8,508,106)
1,171,807 19,346,026 1,648,972 5,813,448
- 24,545 815,485 873,651
- 43,311
4,656,581 92,043,485 $ $
610,810 4,242,120 $ $ - 2,066,681
725,184 5,082,110 311,403 13,322,889 614,193 13,770,502
2,261,590 38,484,302
815,485 873,652
1,407,836 1,407,836 - 12,270,856
29,160 29,160
142,510 13,227,510 - 1,000,000 - 728,176
- 7,702,535 - 16,319,458
2,394,991 53,559,183
$ $ 92,043,485 4,656,581
18

EXHIBIT C-2ECTOR COUNTY INDEPENDENT SCHOOL DISTRICT
RECONCILIATION OF THE GOVERNMENTAL FUNDS BALANCE SHEET TO THE
STATEMENT OF NET POSITION
JUNE 30, 2018
53,559,183 $Total Fund Balances - Governmental Funds
14,851,408 The District uses internal service funds to charge the costs of certain activities, such as self-insurance and printing, to appropriate functions in other funds. The assets and liabilities of the internal service funds are included in governmental activities in the statement of net position. The net effect of this consolidation is to increase net position.
135,314,496 Capital assets used in governmental activities are not financial resources and therefore are not reported in governmental funds. At the beginning of the year, the cost of these assets was $520,837,902 and the accumulated depreciation was ($189,312,856). The beginning balance of deferred charge for refunding for $4,673,060 will decrease net position. In addition, long-term liabilities, including bonds payable, are not due and payablein the current period, and, therefore are not reported as liabilities in the funds. The net effect of including the beginning balances for capital assets (net of depreciation) of $331,525,046 and long-term debt in the governmental activities of ($200,883,610) is to increase net position.
5,282,208 Current year capital outlays and long-term debt principal payments are expenditures in the fund financial statements, but they should be shown as increases in capital assets and reductions in long-term debt in the government-wide financial statements. The net effect of including the 2018 capital outlays of $1,751,778 and debt principal payments of $3,530,430 is to increase net position.
(41,098,657) Included in the items related to debt is the recognition of the District's proportionate share of the net pension liability required by GASB 68 in the amount of ($52,121,909), a Deferred Resource Outflow in the amount of $23,467,715, and a Deferred Resource Inflow in the amount of ($12,444,463). The impact of this on Net Position is ($41,098,657).
(156,944,771) The District implemented GASB 75 reporting requirements for the OPEB benefit plan through TRS. Since this is the first year of implementation, a prior period adjustment had to be made in the amount of ($195,322,872). The District's share of the TRS plan resulted in a net OPEB liability of ($111,292,438), a deferred outflow of $901,504 and a deferred inflow of ($46,553,837). This resulted in a difference between the ending fund balance and the ending net position of ($156,944,771).
5,569,593 The issuance of long-term debt is not due and payable within the current period and, therefore, is not reported in the governmental funds balance sheet. Also, governmental funds report the effect of issuance costs, premiums, discounts, and deferred gain/loss on refunding when debt is first issued, whereas these amounts are deferred and amortized in the statement of net assets. The current year effect on the statement of activities resulting from amortizing various bond related items is as follows: net bond premium $2,273,815, deferred loss ($282,670), and accretion on CABs $3,578,448, thus increasing net position.
(10,428,450) Various other reclassifications and eliminations are necessary to convert from the modified accrual basis of accounting to accrual basis of accounting. These include
The notes to the financial statements are an integral part of this statement.
19

EXHIBIT C-2ECTOR COUNTY INDEPENDENT SCHOOL DISTRICT
RECONCILIATION OF THE GOVERNMENTAL FUNDS BALANCE SHEET TO THE
STATEMENT OF NET POSITION
JUNE 30, 2018
recognizing unavailable revenue from property taxes as revenue ($2,546,641), sale of assets ($35,469), recognizing the current year depreciation ($13,899,672), recognizing the current year change in sick leave payable ($1,302,447), recognizing current year interest payable ($2,127,983), and recognizing the effect of the beginning balance for unearned revenue $9,483,762. The net effect of these reclassifications and recognitions is to decrease net position.
6,105,010 $ Net Position of Governmental Activities
The notes to the financial statements are an integral part of this statement.
20

ECTOR COUNTY INDEPENDENT SCHOOL DISTRICT
STATEMENT OF REVENUES, EXPENDITURES, AND CHANGES IN FUND BALANCE
GOVERNMENTAL FUNDS
FOR THE YEAR ENDED JUNE 30, 2018
Control
Data
Codes Fund
General
10
Recovery Fund
Insurance
40
Fund
Debt Service
50
REVENUES:
133,065,174 5,476,391 13,743,700 Total Local and Intermediate Sources $ $ $5700
112,934,952 - 302,377 State Program Revenues5800
2,938,371 - - Federal Program Revenues5900
Total Revenues5020 248,938,497 5,476,391 14,046,077
EXPENDITURES:
Current:136,922,956 - - Instruction0011
2,312,522 - - Instructional Resources and Media Services0012
5,604,700 - - Curriculum and Instructional Staff Development0013
4,022,279 - - Instructional Leadership0021
17,668,666 - - School Leadership0023
11,154,060 - - Guidance, Counseling and Evaluation Services0031
634,315 - - Social Work Services0032
2,169,723 - - Health Services0033
7,282,887 - - Student (Pupil) Transportation0034
93,311 - - Food Services0035
5,165,355 - - Extracurricular Activities0036
6,725,529 - - General Administration0041
22,430,485 5,476,391 - Facilities Maintenance and Operations0051
2,503,797 - - Security and Monitoring Services0052
5,253,103 - - Data Processing Services0053
1,155,022 - - Community Services0061
Debt Service: - - 3,530,430 Principal on Long Term Debt0071
266,118 - 11,249,264 Interest on Long Term Debt0072
- - 9,248 Bond Issuance Cost and Fees0073
Capital Outlay:15,000 - - Facilities Acquisition and Construction0081
Intergovernmental:1,544,684 - - Other Intergovernmental Charges0099
Total Expenditures6030 232,924,512 5,476,391 14,788,942
1100 Excess (Deficiency) of Revenues Over (Under) Expenditures
16,013,985 - (742,865)
OTHER FINANCING SOURCES (USES): 477,211 - - Sale of Real and Personal Property7912
1,397,649 - - Transfers In7915
(308,196) - - Transfers Out (Use)8911
Total Other Financing Sources (Uses) 7080 1,566,664 - -
1200 Net Change in Fund Balances 17,580,649 - (742,865)
0100 Fund Balance - July 1 (Beginning) 21,312,687 - 13,013,721
3000 Fund Balance - June 30 (Ending) $ 38,893,336 $ - $ 12,270,856
The notes to the financial statements are an integral part of this statement.
21

EXHIBIT C-3
Other
Funds Funds
Governmental
Total
157,210,441 4,925,176 $ $
114,351,554 1,114,225
27,096,873 24,158,502
30,197,903 298,658,868
147,395,909 10,472,953
2,317,496 4,974
9,475,205 3,870,505
4,073,640 51,361
17,786,939 118,273
11,677,177 523,117
699,922 65,607
2,234,213 64,490
7,282,887 -
14,623,026 14,529,715
5,165,355 -
6,735,260 9,731
30,034,194 2,127,318
2,503,797 -
5,374,876 121,773
1,282,531 127,509
3,530,430 -
11,515,382 -
9,248 -
86,581 71,581
1,544,684 -
32,158,907 285,348,752
(1,961,004) 13,310,116
481,328 4,117
1,705,845 308,196
(1,705,845)(1,397,649)
(1,085,336) 481,328
(3,046,340) 13,791,444
5,441,331 39,767,739
$ 2,394,991 $ 53,559,183
22

EXHIBIT C-4ECTOR COUNTY INDEPENDENT SCHOOL DISTRICT
RECONCILIATION OF THE GOVERNMENTAL FUNDS STATEMENT OF REVENUES, EXPENDITURES,
AND CHANGES IN FUND BALANCES TO THE STATEMENT OF ACTIVITIES
FOR THE YEAR ENDED JUNE 30, 2018
13,791,444 $Total Net Change in Fund Balances - Governmental Funds
1,309,380 The District uses internal service funds to charge the costs of certain activities, such as self-insurance and printing, to appropriate functions in other funds. The net gain of internal service funds is reported with governmental activities. The net effect of this consolidation is to increase net position.
5,282,208 Current year capital outlays and long-term debt principal payments are expenditures in the fund financial statements, but they should be shown as increases in capital assets and reductions in long-term debt in the government-wide financial statements. The net effect of removing the 2018 capital outlays of $1,751,778 and debt principal payments of $3,530,430 is to increase net position.
(13,899,672)Depreciation is not recognized as an expense in governmental funds since it does not require the use of current financial resources. The net effect of the current year's depreciation is to decrease net position.
5,569,593 The proceeds from the issuance of bonds are reported as financial resources in the year of occurrence on the governmental fund financial statements, whereas there is no effect on the statement of activities. Also, governmental funds report on the effect of bond issuance costs, premiums, discounts, and deferred loss on refunding whereas these amounts are deferred and amortized on the statement of activities. The current year effect on the statement of activities resulting from amortizing various bond related items is as follows: net bond premium $2,273,815, deferred loss ($282,670), and net current year accretion on CAB's $3,578,448, thus increasing net position.
(3,929,586)Various other reclassifications and eliminations are necessary to convert from the modified accrual basis of accounting to accrual basis of accounting. These include adjusting current year revenue to show the revenue earned from the current year's tax levy ($2,546,641), recognizing the current year change in sick leave payable ($1,302,447), recognizing the sale of assets ($35,469), and recognizing the change in interest payable ($45,029). The net effect of these reclassifications and recognitions is to increase net position.
(1,669,974)Current year changes due to GASB 68 increased revenues in the amount of ($1,829,980) but also increased expenditures in the amount of $160,006. The net effect on the change in the ending net position was a decrease in the amount of ($1,669,974).
38,378,101 The implementation of GASB 75 to report the District's share of the TRS OPEB plan resulted in a prior period adjustment in the amount of ($195,322,872). The changes in the ending net position as a result of reporting the OPEB items was an increase in the change in net position in the amount of $38,378,101.
44,831,494 $ Change in Net Position of Governmental Activities
The notes to the financial statements are an integral part of this statement.
23

PROPRIETARY FUND FINANCIAL STATEMENTS

EXHIBIT D-1ECTOR COUNTY INDEPENDENT SCHOOL DISTRICT
STATEMENT OF NET POSITIONPROPRIETARY FUNDS
JUNE 30, 2018
Total
Internal
Service Funds
Governmental
Activities -
ASSETSCurrent Assets:
1,130,217 Cash and Cash Equivalents $
16,344,376 Investments - Current
17,474,593 Total Current Assets
Noncurrent Assets:Capital Assets:
54,012 Land
3,663,335 Buildings and Improvements
(226,191)Depreciation on Buildings
3,491,156 Total Noncurrent Assets
Total Assets 20,965,749
LIABILITIESCurrent Liabilities:
121,757 Accounts Payable
731,338 Due to Other Funds
2,959,412 Accrued Expenses
3,812,507 Total Current Liabilities
Noncurrent Liabilities:
2,301,834 Other Long-Term Debt - Due in More than One Year
2,301,834 Total Noncurrent Liabilities
Total Liabilities 6,114,341
NET POSITION
14,851,408 Unrestricted Net Position
Total Net Position 14,851,408 $
The notes to the financial statements are an integral part of this statement.
24

EXHIBIT D-2ECTOR COUNTY INDEPENDENT SCHOOL DISTRICT
STATEMENT OF REVENUES, EXPENSES, AND CHANGES IN FUND NET POSITION
PROPRIETARY FUNDS
FOR THE YEAR ENDED JUNE 30, 2018
Total
Internal
Service Funds
Governmental
Activities -
OPERATING REVENUES:
26,554,045 Employee and Employer Premiums $251,122 Rent Revenue
338,891 Stop Loss Reimbursement
Total Operating Revenues 27,144,058
OPERATING EXPENSES:
22,956,921 Claims and Prescriptions
268,385 Professional and Contracted Services
5,966 Supplies and Materials2,679,696 Other Operating Costs
87,004 Depreciation Expense
Total Operating Expenses 25,997,972
Operating Income 1,146,086
NONOPERATING REVENUES (EXPENSES):
163,294 Earnings from Temporary Deposits & Investments
Total Nonoperating Revenues (Expenses) 163,294
Change in Net Position
Total Net Position - July 1 (Beginning)
Total Net Position - June 30 (Ending)
1,309,380
13,542,028
$ 14,851,408
The notes to the financial statements are an integral part of this statement.
25

EXHIBIT D-3ECTOR COUNTY INDEPENDENT SCHOOL DISTRICT
STATEMENT OF CASH FLOWS
FOR THE YEAR ENDED JUNE 30, 2018PROPRIETARY FUNDS
Total
Internal
Service Funds
Governmental
Activities -
Cash Flows from Operating Activities:
271,964 Cash Received from Rental Receipts $
30,610,721 Cash Received from Employees and Employer338,891 Cash Received from Stop Loss Carrier
(22,934,185)Cash Payments for Claims(3,533,015)Other Payments
4,754,376 Net Cash Provided by OperatingActivities
Cash Flows from Investing Activities:
163,294 Interest and Dividends on Investments
Net Increase in Cash and Cash Equivalents 4,917,670
Cash and Cash Equivalents at Beginning of Year 12,556,923
Cash and Cash Equivalents at End of Year 17,474,593 $
Operating Income:$
Reconciliation of Operating Income to Net Cash
Provided by Operating Activities:1,146,086
to Net Cash Provided by Operating Activities:Adjustments to Reconcile Operating Income
87,004 Depreciation
Assets and Liabilities:Effect of Increases and Decreases in Current
4,077,518 Increase in Due to Other Funds(578,968)Decrease in Accounts Payable
22,736 Changes in Accrued ExpensesNet Cash Provided by OperatingActivities 4,754,376 $
The notes to the financial statements are an integral part of this statement.
26

FIDUCIARY FUND FINANCIAL STATEMENTS

EXHIBIT E-1ECTOR COUNTY INDEPENDENT SCHOOL DISTRICT
STATEMENT OF FIDUCIARY NET POSITIONFIDUCIARY FUNDS
JUNE 30, 2018
Agency
Fund
ASSETS
1,209,774 Restricted Assets $
Total Assets 1,209,774 $
LIABILITIES
1,209,774 Due to Student Groups $
Total Liabilities 1,209,774 $
The notes to the financial statements are an integral part of this statement.
27

NOTES TO FINANCIAL STATEMENTS

ECTOR COUNTY INDEPENDENT SCHOOL DISTRICT NOTES TO THE FINANCIAL STATEMENTS
YEAR ENDED JUNE 30, 2018
I. SUMMARY OF SIGNIFICANT ACCOUNTING POLICIES Ector County Independent School District (the "District") is a public educational agency operating under the applicable laws and regulations of the State of Texas. It is governed by a seven-member Board of Trustees (the "Board") elected by registered voters of the District. The District prepares its basic financial statements in conformity with generally accepted accounting principles promulgated by the Governmental Accounting Standards Board and other authoritative sources identified in Statement on Auditing Standards No. 69 of the American Institute of Certified Public Accountants; and it complies with the requirements of the appropriate version of Texas Education Agency's Financial Accountability System Resource Guide (the "Resource Guide") and the requirements of contracts and grants of agencies from which it receives funds.
A. REPORTING ENTITY The Board of Trustees (the "Board") is elected by the public and it has the authority to make decisions, appoint administrators and managers, and significantly influence operations. It also has the primary accountability for fiscal matters. Therefore, the District is a financial reporting entity as defined by the Governmental Accounting Standards Board ("GASB") in its Statement No. 14, "The Financial Reporting Entity." The District has component units, which are discretely presented in a separate column in a supporting schedule to the government-wide financial statements. The ECISD Education Foundation and Permian High School Band and Orchestra Booster Club are presented separately in one column to emphasize that they are legally separate from the District. If you have questions about this report or need additional financial information, contact the District’s business office, at Ector County Independent School District, 802 N. Sam Houston, Odessa, Texas.
B. GOVERNMENT-WIDE AND FUND FINANCIAL STATEMENTS The Statement of Net Position and the Statement of Activities are government-wide financial statements. They report information on all of the District and its component units nonfiduciary activities with most of the interfund activities removed. Governmental activities include programs supported primarily by taxes, State foundation funds, grants and other intergovernmental revenues. Business-type activities include operations that rely to a significant extent on fees and charges for support. The Statement of Activities demonstrates how other people or entities that participate in programs the District operates have shared in the payment of the direct costs. The "charges for services" column includes payments made by parties that purchase, use, or directly benefit from goods or services provided by a given function or segment of the District. Examples include tuition paid by students, school lunch charges, etc. The "grants and contributions" column includes amounts paid by organizations outside the District to help meet the operational or capital requirements of a given function. Examples include grants under the Elementary and Secondary Education Act. If a revenue is not a program revenue, it is a general revenue used to support all of the District's functions. Taxes are always general revenues. Interfund activities between governmental funds and proprietary funds appear as due to/due froms on the Governmental Fund Balance Sheet and Proprietary Fund Statement of Net Position and as other resources and other uses on the governmental fund Statement of Revenues, Expenditures and Changes in Fund Balance and on the Proprietary Fund Statement of Revenues, Expenses and Changes in Fund Net Position. All interfund transactions between governmental funds and internal service funds are eliminated on the government-wide statements. Interfund activities between governmental funds and fiduciary funds remain as due to/due froms on the government-wide Statement of Activities.
28

ECTOR COUNTY INDEPENDENT SCHOOL DISTRICT NOTES TO THE FINANCIAL STATEMENTS
YEAR ENDED JUNE 30, 2018
The fund financial statements provide reports on the financial condition and results of operations for three fund categories - governmental, proprietary, and fiduciary. Since the resources in the fiduciary funds cannot be used for District operations, they are not included in the government-wide statements. The District considers some governmental funds major and reports their financial condition and results of operations in a separate column. Proprietary funds distinguish operating revenues and expenses from nonoperating items. Operating revenues result from providing goods and services in connection with a proprietary fund's principal ongoing operations; they usually come from exchange or exchange-like transactions. All other revenues are nonoperating. Operating expenses can be tied specifically to the production of the goods and services, such as materials and labor and direct overhead. Other expenses are nonoperating. C. MEASUREMENT FOCUS, BASIS OF ACCOUNTING, AND FINANCIAL STATEMENT
PRESENTATION The government-wide financial statements use the economic resources measurement focus and the accrual basis of accounting, as do the proprietary fund and fiduciary fund financial statements. Revenues are recorded when earned and expenses are recorded when a liability is incurred, regardless of the timing of the related cash flows. Property taxes are recognized as revenues in the year for which they are levied. Grants and similar items are recognized as revenue as soon as all eligibility requirements imposed by the provider have been met. Governmental fund financial statements use the current financial resources measurement focus and the modified accrual basis of accounting. With this measurement focus, only current assets, current liabilities and fund balances are included on the balance sheet. Operating statements of these funds present net increases and decreases in current assets (i.e., revenues and other financing sources and expenditures and other financing uses). The modified accrual basis of accounting recognizes revenues in the accounting period in which they become both measurable and available, and it recognizes expenditures in the accounting period in which the fund liability is incurred, if measurable, except for unmatured interest and principal on long-term debt, which is recognized when due. The expenditures related to certain compensated absences and claims and judgments are recognized when the obligations are expected to be liquidated with expendable available financial resources. The District considers all revenues available if they are collectible within 60 days after year end. Revenues from local sources consist primarily of property taxes. Property tax revenues and revenues received from the State are recognized under the "susceptible to accrual" concept, that is, when they are both measurable and available. The District considers them "available" if they will be collected within 60 days of the end of the fiscal year. Miscellaneous revenues are recorded as revenue when received in cash because they are generally not measurable until actually received. Investment earnings are recorded as earned, since they are both measurable and available. Grant funds are considered to be earned to the extent of expenditures made under the provisions of the grant. Accordingly, when such funds are received, they are recorded as unearned revenues until related and authorized expenditures have been made. If balances have not been expended by the end of the project period, grantors sometimes require the District to refund all or part of the unused amount.
29

ECTOR COUNTY INDEPENDENT SCHOOL DISTRICT NOTES TO THE FINANCIAL STATEMENTS
YEAR ENDED JUNE 30, 2018
The Proprietary Fund Types and Fiduciary Funds are accounted for on a flow of economic resources measurement focus and utilize the accrual basis of accounting. This basis of accounting recognizes revenues in the accounting period in which they are earned and become measurable and expenses in the accounting period in which they are incurred and become measurable. The District applies all GASB pronouncements as well as the Financial Accounting Standards Board pronouncements issued on or before November 30, 1989, unless these pronouncements conflict or contradict GASB pronouncements. With this measurement focus, all assets and all liabilities associated with the operation of these funds are included on the fund Statement of Net Position. The fund equity is segregated into invested in capital assets net of related debt, restricted net position, and unrestricted net position. The fiduciary net position of the Teacher Retirement System of Texas (TRS) has been determined using the flow of economic resources measurement focus and full accrual basis of accounting. This includes for purposes of measuring the net pension liability, deferred outflows of resources and deferred inflows of resources related to pensions, pension expense, and information about assets, liabilities and additions to/deductions from TRS’s fiduciary net position. Benefit payments (including refunds of employee contributions) are recognized when due and payable in accordance with the benefit terms. Investments are reported at fair value. The fiduciary net position of the Teacher Retirement System of Texas (TRS) TRS Care Plan has been determined using the flow of economic resources measurement focus and full accrual basis of accounting. This includes for purposes of measuring the net OPEB liability, deferred outflows of resources and deferred inflows of resources related to other post-employment benefits, OPEB expense, and information about assets, liabilities and additions to/deductions from TRS Care’s fiduciary net position. Benefit payments are recognized when due and payable in accordance with the benefit terms. There are no investments as this is a pay-as you-go plan and all cash is held in a cash account.
D. FUND ACCOUNTING The District reports the following major governmental funds:
1. The General Fund – The general fund is the District's primary operating fund. It accounts for all financial resources except those required to be accounted for in another fund.
Additionally, the District reports the following fund types: Governmental Funds:
1. Special Revenue Funds – The District accounts for resources restricted to, or designated for,
specific purposes by the District or a grantor in a special revenue fund. Most Federal and some State financial assistance is accounted for in a special revenue fund and sometimes unused balances must be returned to the grantor at the close of specified project periods.
2. Debt Service Funds – The District accounts for resources accumulated and payments made for
principal and interest on long-term general obligation debt of governmental funds in a debt service fund.
3. Capital Projects Funds – The proceeds from long-term debt financing and revenues and
expenditures related to authorized construction and other capital asset acquisitions are accounted for in a capital projects fund. The District has capital projects funds to separately account for various locally funded capital projects occurring throughout the District, and to account for the 2013 bond issue transactions.
30
ECTOR COUNTY INDEPENDENT SCHOOL DISTRICT NOTES TO THE FINANCIAL STATEMENTS
YEAR ENDED JUNE 30, 2018
4. Permanent Funds – The District accounts for donations for which the donor has stipulated that
the principal may not be expended and where the income may only be used for purposes that support the District's programs. The District has no permanent funds.
Proprietary Funds:
5. Enterprise Funds – The District's activities for which outside users are charged a fee roughly
equal to the cost of providing the goods or services of those activities are accounted for in an enterprise fund. The District has no enterprise funds.
6. Internal Service Funds – Revenues and expenses related to services provided to organizations
inside the District on a cost reimbursement basis are accounted for in an internal service fund. The District’s internal service funds are the Medical Trust Fund, the Worker’s Compensation Fund and the Chancellor-Killion Housing Fund.
Fiduciary Funds:
7. Private Purpose Trust Funds – The District accounts for donations for which the donor has
stipulated that both the principal and the income may be used for purposes that benefit parties outside the District. The District has no private purpose trust funds.
8. Pension (and Other Employee Benefit) Trust Funds – These funds are used to account for local
pension and other employee benefit funds that are provided by the District in lieu of or in addition to the Teacher Retirement System of Texas. The District has no pension trust funds.
9. Investment Trust Fund - This fund is one in which the District holds assets in trust for other
entities participating in an investment program managed by the district. The District has no investment trust funds.
10. Agency Funds – The District accounts for resources held for others in a custodial capacity in
agency funds. The District’s agency funds are the Student Activity Funds.
E. OTHER ACCOUNTING POLICIES 1. For purposes of the statement of cash flows for proprietary funds, the District considers highly
liquid investments to be cash equivalents if they have a maturity of three months or less when purchased.
2. The District reports inventories of supplies at weighted average cost. Supplies are recorded as
expenditures when they are consumed. Inventories of food commodities are recorded at market values supplied by the Texas Department of Human Services. Although commodities are received at no cost, their fair value is supplied by the Texas Department of Human Services and recorded as inventory and unearned revenue when received. When requisitioned, inventory and unearned revenue are relieved, expenditures are charged, and revenue is recognized for an equal amount.
31
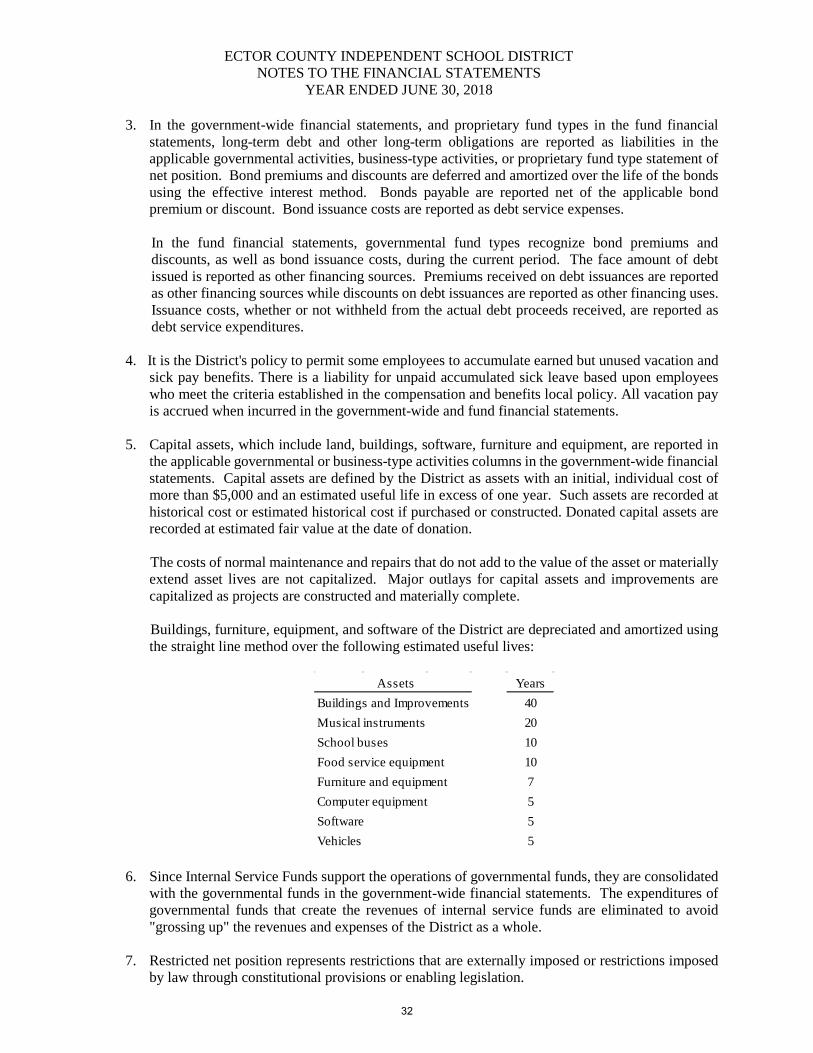
ECTOR COUNTY INDEPENDENT SCHOOL DISTRICT NOTES TO THE FINANCIAL STATEMENTS
YEAR ENDED JUNE 30, 2018
3. In the government-wide financial statements, and proprietary fund types in the fund financial statements, long-term debt and other long-term obligations are reported as liabilities in the applicable governmental activities, business-type activities, or proprietary fund type statement of net position. Bond premiums and discounts are deferred and amortized over the life of the bonds using the effective interest method. Bonds payable are reported net of the applicable bond premium or discount. Bond issuance costs are reported as debt service expenses.
In the fund financial statements, governmental fund types recognize bond premiums and discounts, as well as bond issuance costs, during the current period. The face amount of debt issued is reported as other financing sources. Premiums received on debt issuances are reported as other financing sources while discounts on debt issuances are reported as other financing uses. Issuance costs, whether or not withheld from the actual debt proceeds received, are reported as debt service expenditures.
4. It is the District's policy to permit some employees to accumulate earned but unused vacation and sick pay benefits. There is a liability for unpaid accumulated sick leave based upon employees who meet the criteria established in the compensation and benefits local policy. All vacation pay is accrued when incurred in the government-wide and fund financial statements.
5. Capital assets, which include land, buildings, software, furniture and equipment, are reported in
the applicable governmental or business-type activities columns in the government-wide financial statements. Capital assets are defined by the District as assets with an initial, individual cost of more than $5,000 and an estimated useful life in excess of one year. Such assets are recorded at historical cost or estimated historical cost if purchased or constructed. Donated capital assets are recorded at estimated fair value at the date of donation.
The costs of normal maintenance and repairs that do not add to the value of the asset or materially extend asset lives are not capitalized. Major outlays for capital assets and improvements are capitalized as projects are constructed and materially complete. Buildings, furniture, equipment, and software of the District are depreciated and amortized using the straight line method over the following estimated useful lives:
Assets YearsBuildings and Improvements 40Musical instruments 20School buses 10Food service equipment 10Furniture and equipment 7Computer equipment 5Software 5Vehicles 5
6. Since Internal Service Funds support the operations of governmental funds, they are consolidated
with the governmental funds in the government-wide financial statements. The expenditures of governmental funds that create the revenues of internal service funds are eliminated to avoid "grossing up" the revenues and expenses of the District as a whole.
7. Restricted net position represents restrictions that are externally imposed or restrictions imposed
by law through constitutional provisions or enabling legislation.
32

ECTOR COUNTY INDEPENDENT SCHOOL DISTRICT NOTES TO THE FINANCIAL STATEMENTS
YEAR ENDED JUNE 30, 2018
8. The District has self-insured health and workers’ compensation plans which are accounted for as proprietary funds. Claims incurred but not reported (IBNR) are accrued if it is probable that a claim will be asserted and the loss can be reasonably estimated. The accrued liabilities for IBNR in the workers’ compensation fund are actuarially estimated by Turner Consulting, Inc. Consultants and Actuaries. The accrued liabilities for IBNR in the medical trust fund are based on industry standards applied by underwriters when evaluating a plan.
9. In the fund financial statements, fund balance shall mean the gross difference between
governmental fund assets and liabilities reflected on the balance sheet. Governmental fund assets are those of the General Fund, Special Revenue Funds, Debt Service Funds and Capital Project Funds.
The fund balance of the General Fund, one of the governmental fund types, is of primary significance because the General Fund is the primary fund, which finances most functions in the District.
The order of spending and availability of the fund balance shall be to reduce funds from the listed
areas in the following order: restricted, committed, assigned, and then unassigned funds. Negative amounts shall not be reported for restricted, committed, or assigned funds.
The five classifications of fund balance of the governmental types are as follows: Non-spendable fund balance shall mean that portion of the gross fund balance that is not
expendable (such as inventories) or is legally earmarked for a specific use. Examples of non-spendable fund balance reserves for which fund balance shall not be available for financing general operating expenditures include:
1. Inventories 2. Prepaid items 3. Deferred expenditures 4. Long-term receivables Restricted fund balance shall include amounts constrained to a specific purpose by the provider,
such as a grantor. Examples of restricted fund balances include: 1. Child Nutrition Program 2. Technology Program 3. Construction Programs under a state funded program (i.e. IFA, EDA, PFC, financed bonds) 4. Resources from other granting agencies Committed fund balance shall mean that portion of the fund balance that is constrained to a
specific purpose by the Board of Trustees. Examples of committed fund balance include: 1. Potential litigation, claims, and judgments 2. Campus activity funds Assigned fund balance shall mean that portion of the fund balance that is spendable or available
for appropriation but has been tentatively earmarked for some specific purpose. When it is appropriate for fund balance to be assigned, the Board delegates the responsibility to
assign funds to the Superintendent or his designee.
33

ECTOR COUNTY INDEPENDENT SCHOOL DISTRICT NOTES TO THE FINANCIAL STATEMENTS
YEAR ENDED JUNE 30, 2018
In current practice, such plans or intent may change and may never be budgeted, or may result in expenditures in future periods of time. Examples of assigned fund balances which the District may have tentative plans for expenditures in future periods include:
1. Capital replacement (expenditures for equipment, furniture, software) 2. Building construction, repair and renovation 3. Insurance deductibles 4. Program startup costs 5. Debt service reduction 6. Other legal uses Unassigned fund balance shall include amounts available for any legal purpose. This portion of
the total fund balance in the General Fund is available to finance operating expenditures. Unassigned fund balance shall mean the difference between the total fund balance and the total of
the non-spendable fund balance, restricted fund balance, committed fund balance and assigned fund balance.
10. When the District incurs an expense for which it may use either restricted or unrestricted assets, it
uses the restricted assets first whenever they will have to be returned if they are not used. 11. The District’s investments are reported at cost which approximates fair value. 12. The Data Control Codes refer to the account code structure prescribed by Texas Education Agency
(TEA) in the Financial Accountability System Resource Guide. TEA requires school districts to display these codes in the financial statements filed with TEA in order to ensure accuracy in building a State-wide data base for policy development and funding plans.
13. The District utilizes an encumbrance accounting system which is a method of ascertaining the
availability of funds and then reserving funds to cover outstanding obligations. During the budgetary period, the District can determine the remaining amount of the new commitments that can be signed by comparing the amount of appropriations to the sum of expenditures recognized and encumbrances outstanding.
Encumbrance balances at June 30, 2018, consisted of the following amounts:
Fund Type Amount
General Fund 3,038,823$ Special Revenue Fund 1,258,860 Capital Projects Fund 141,630 Internal Service Fund 153,596 Total 4,592,909$
34

ECTOR COUNTY INDEPENDENT SCHOOL DISTRICT NOTES TO THE FINANCIAL STATEMENTS
YEAR ENDED JUNE 30, 2018
II. STEWARDSHIP, COMPLIANCE, AND ACCOUNTABILITY
A. BUDGETARY DATA The Board of Trustees adopts an "appropriated budget" for the General Fund, Debt Service Fund and the Food Service Fund, which is included in the Special Revenue Funds. The District is required to present the adopted and final amended budgeted revenues and expenditures for each of these funds. The District compares the final amended budget to actual revenues and expenditures. The General Fund Budget report appears in Exhibit G-1 and the other two reports are in Exhibit J-4 and J-5. The following procedures are followed in establishing the budgetary data reflected in the general-purpose financial statements:
1. Prior to June 20th the District prepares a budget for the next succeeding fiscal year beginning July 1st. The operating budget includes proposed expenditures and the means of financing them.
2. A meeting of the Board is then called for the purpose of adopting the proposed budget after ten days’ public notice of the meeting has been given.
3. Prior to July 1st, the budget is legally enacted through passage of a resolution by the Board. 4. The adopted budget must be filed with the Texas Education Agency according to the Public
Education Information Management System (“PEIMS”) data standards, by Thursday of the second full week of December.
Once a budget is approved and adopted, any commitment that exceeds the available balance of the appropriation on the function level requires a budget amendment before the commitment is made. As dictated by law, such amendments are made before the fact, are reflected in the official minutes of the Board, and are not made after fiscal year end. All budget amendments enacted at the function level during fiscal year 2018 were legally approved. Expenditures may not legally exceed budgeted appropriations at the function level within an individual fund for General Funds, Debt Service Funds, and the Capital Project Fund, except when a budget amendment is approved by the Board. For Special Revenue Funds a budget amendment is required by the TEA when cumulative transfers among direct cost categories exceed or are expected to exceed twenty-five percent of the total current approved budget. The District may transfer resources among categories without submitting an amendment as long as the total amount of resources transferred is twenty-five percent or less of the total current approved budget. The total expenditures per funding source per fiscal year cannot exceed the total amount approved. The budget was amended during the year for certain supplementary appropriations as discussed in Management’s Discussion and Analysis.
35
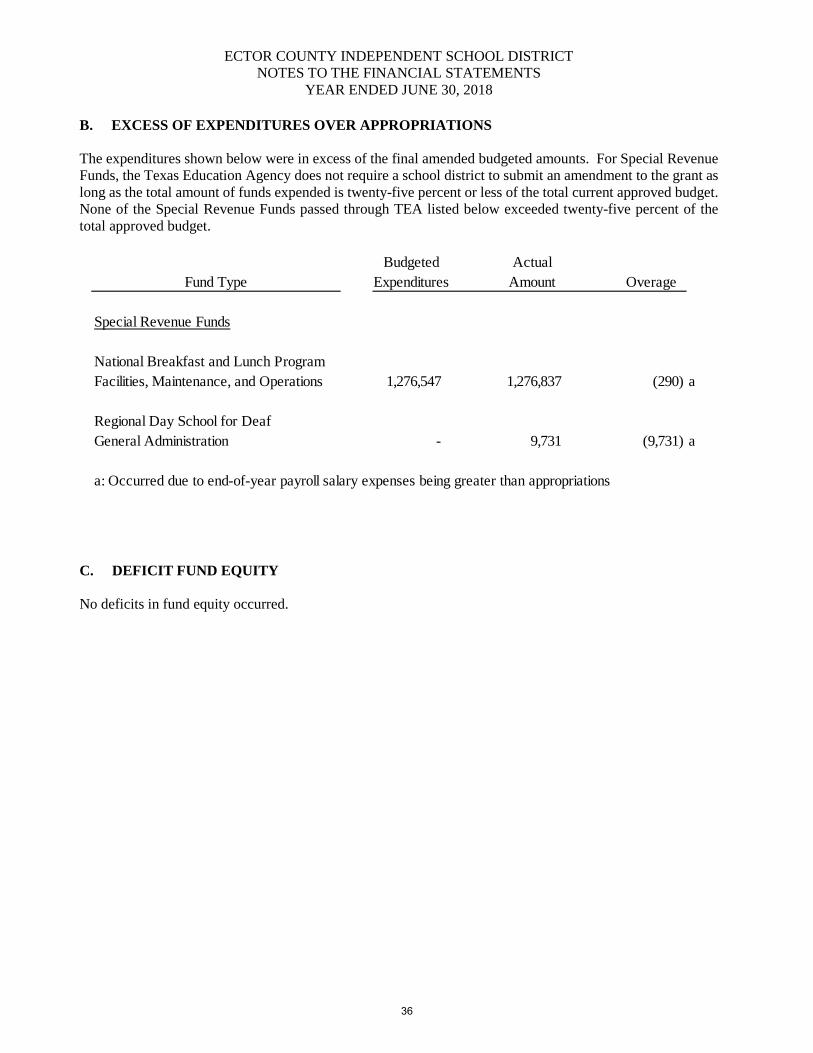
ECTOR COUNTY INDEPENDENT SCHOOL DISTRICT NOTES TO THE FINANCIAL STATEMENTS
YEAR ENDED JUNE 30, 2018
B. EXCESS OF EXPENDITURES OVER APPROPRIATIONS
The expenditures shown below were in excess of the final amended budgeted amounts. For Special Revenue Funds, the Texas Education Agency does not require a school district to submit an amendment to the grant as long as the total amount of funds expended is twenty-five percent or less of the total current approved budget. None of the Special Revenue Funds passed through TEA listed below exceeded twenty-five percent of the total approved budget.
Budgeted Actual
Fund Type Expenditures Amount Overage
Special Revenue Funds
National Breakfast and Lunch ProgramFacilities, Maintenance, and Operations 1,276,547 1,276,837 (290) a
Regional Day School for DeafGeneral Administration - 9,731 (9,731) a
a: Occurred due to end-of-year payroll salary expenses being greater than appropriations
C. DEFICIT FUND EQUITY No deficits in fund equity occurred.
36

ECTOR COUNTY INDEPENDENT SCHOOL DISTRICT NOTES TO THE FINANCIAL STATEMENTS
YEAR ENDED JUNE 30, 2018
III. DETAILED NOTES ON ALL FUNDS AND ACCOUNT GROUPS
A. DEPOSITS AND INVESTMENTS Legal and Contractual Provisions Governing Deposits and Investments The Texas Public Funds Investment Act (Government Code Chapter 2256) contains specific provisions in the areas of investment practices, management reports, and establishment of appropriate policies. Among other things, it requires the District to adopt, implement, and publicize an investment policy. That policy must address the following areas: (1) safety of principal and liquidity, (2) portfolio diversification, (3) allowable investments, (4) acceptable risk levels, (5) expected rates of return, (6) maximum allowable stated maturity of portfolio investments, (7) maximum average dollar-weighted maturity allowed based on the stated maturity date for the portfolio, (8) investment staff quality and capabilities, and (9) bid solicitation preferences for certificates of deposit. Statutes authorize the entity to invest in (1) obligations of the U.S. Treasury, certain U.S. agencies, and the State of Texas and its agencies; (2) guaranteed or secured certificates of deposit issued by state and national banks domiciled in Texas; (3) obligations of states, agencies, counties, cities and other political subdivisions of any state having been rated as to investment quality not less than an "A"; (4) No load money market funds with a weighted average maturity of 90 days or less; (5) fully collateralized repurchase agreements; (6) commercial paper having a stated maturity of 270 days or less from the date of issuance and is not rated less than A-1 or P-1 by two nationally recognized credit rating agencies OR one nationally recognized credit agency and is fully secured by an irrevocable letter of credit; (7) secured corporate bonds rated not lower than "AA-" or the equivalent; (8) public funds investment pools; and (9) guaranteed investment contracts for bond proceeds investment only, with a defined termination date and secured by U.S. Government direct or agency obligations approved by the Texas public Funds Investment Act in an amount equal to the bond proceeds. The Act also requires the entity to have independent auditors perform test procedures related to investment practices as provided by the Act. The District is in substantial compliance with the requirements of the Act and with local policies. Additional Contractual provisions governing deposits and investments for the District are as follows: Policies Governing Deposits and Investments In compliance with the Texas Public Funds Investment Act, the District has adopted a deposit and investment policy. That policy does address the following risks:
a. Custodial Credit Risk – Deposits: In the case of deposits, this is the risk that in the event of a bank
failure, the government’s deposits may not be returned to it. The District’s policy regarding types of deposits allowed and collateral requirements is consistent with the requirements of the Public Funds Collateral Act, it is the policy of the District to require full collateralization of all District investments and funds on deposit with a depository bank, other than investments which are obligations of the U.S. Government and its agencies and instrumentalities. As required by Government Code 2257.022 the collateralization level will be 110% of market value of principal and accrued interest on the deposits or investments less an amount insured by the FDIC or FSLIC. Securities pledged as collateral shall be held by an independent third party with whom the District has a current custodial agreement. The Director of Finance is responsible for entering into collateralization agreements with third party custodians in compliance with this policy. The agreements are to specify the acceptable investment securities for collateral, including provisions relating to possession of the collateral, the substitution or release of investment securities, ownership of securities, and the method of valuation of securities. Collateral shall be reviewed at least weekly to assure that the market value of the pledged securities is adequate.
37

ECTOR COUNTY INDEPENDENT SCHOOL DISTRICT NOTES TO THE FINANCIAL STATEMENTS
YEAR ENDED JUNE 30, 2018
The District is not exposed to custodial credit risk for its deposits as all are covered by depository insurance and collateralization by securities at 110% of the market value.
b. Custodial Credit Risk – Investments: For an investment, this is the risk that, in the event of the failure of
the counterparty, the government will not be able to recover the value of its investments or collateral securities that are in the possession of an outside party. Investments are subject to custodial credit risk only if they are evidenced by securities that exist in physical or book entry form. Thus, the District’s positions in external investment pools are not subject to custodial credit risk.
c. Interest-Rate Risk – Interest-rate risk is the risk that changes in interest rates will adversely affect the fair
value of an investment. To reduce exposure to changes in interest rates that could adversely affect the value of investments, the District shall use final and weighted-average maturity limits and diversification.
d. Other Credit Risk Exposure – The District, in accordance with its investment policy, invests in external
public fund investment pools, meeting the requirements of Government Code 2256.016 and 2256.019. These pools invest in U.S. Government agencies and repurchase agreements.
e. Concentration of Credit Risk – Concentration of credit risk is defined as the risk of loss attributed to the
magnitude of a government’s investment in a single issuer. The District’s policy regarding diversity is as follows:
The investment portfolio shall be diversified in terms of investment instruments, maturity scheduling,
and financial institutions to reduce risk of loss resulting from over concentration of assets in a specific class of investments, specific maturity, or specific issuer.
The District’s investment portfolio consists of external investment pools and balances in savings accounts
collateralized at 110% of their fair value by securities held by a third party custodian of the District’s depository bank in the name of the District.
While all of the District’s investments are available on demand, the underlying weighted average
maturity of investments of the external investment pools that the District invests in are listed below as of June 30, 2018:
Type of Deposit Fair Value PercentNexBank Money Market Savings $ 10,074,885 16.17% $ 10,074,885 N/A
Total Money Markets and FDICInsured Accounts: 10,074,885 10,074,885 - -
Investment Pools: TexPool 35,228,903 56.52% 35,228,903 - - AAAmTexPool Prime 5,021,129 8.06% 5,021,129 AAAmLone Star 662,600 1.06% 662,600 - - AAAmTexStar 11,336,977 18.19% 11,336,977 - - AAAm Total Investment Pools: 52,249,609 52,249,609 - -
Total Cash and Cash Equivalents: $ 62,324,494 100% $ 62,324,494 - -
Maturity in Less than
1 yearMaturity in 1-10 Years
Maturity in Over 10 Years
Credit Rating
38

ECTOR COUNTY INDEPENDENT SCHOOL DISTRICT NOTES TO THE FINANCIAL STATEMENTS
YEAR ENDED JUNE 30, 2018
The District categorizes its fair value measurements with the fair value hierarchy established by generally accepted accounting principles. The hierarchy is based on the valuation inputs used to measure the fair value of the asset. Level 1 inputs are quoted prices in active markets for identical assets; Level 2 inputs are significant other observable inputs; Level 3 inputs are significant unobservable inputs. Investments that are measured at fair value using the net asset value per share (or its equivalent) as a practical expedient are not classified in the fair value hierarchy below. In instances where inputs used to measure fair value fall into different levels in the above fair value hierarchy, fair value measurements in their entirety are categorized based on the lowest level input that is significant to the valuation. The District's assessment of the significance of particular inputs to these fair value measurements requires judgment and considers factors specific to each asset or liability. In this discussion and in the table below, investments are defined according to GASB 72 as a security or other asset that (a) a government holds primarily for the purpose of income or profit and (b) has a present service capacity based solely on its ability to generate cash or to be sold to generate cash. An asset initially reported as a capital asset and later held for sale would not subsequently be reclassified as an investment.
As of June 30, 2018, the District’s had the following investments subject to the fair value measurement:
Level 1 Level 2 Level 3TCG DIRECTED INVESTMENTSFixed Income
Municipal Bonds $ 9,515,693 9,515,693 - - Total Fixed Income: 9,515,693 9,515,693 - -
Total Invesments at Fair Value: $ 9,515,693 9,515,693 - -
Fair Value MeasurementsBalance at June 30, 2018
The TCG Directed Investments at June 30, 2018 classified in Level 1 are valued using prices quoted in active markets for those securities.
39

ECTOR COUNTY INDEPENDENT SCHOOL DISTRICT NOTES TO THE FINANCIAL STATEMENTS
YEAR ENDED JUNE 30, 2018
Information regarding the District’s investment pools may be obtained by contacting the following: TexPool: Internet: www.texpool.com Phone: 1-866-839-7665 Address: TexPool Participant Services c/o Federated Investors, Inc. 1001 Texas Avenue, Suite 1400 Houston, TX 77002 Lone Star: Internet: www.firstpublic.com Phone: 1-800-558-8875 Address: First Public 12007 Research Boulevard Austin, TX 78759 TexSTAR Internet: www.texstar.org Phone: 1-800-839-7827 Address: TexStar Participant Services 1201 Elm Street, Suite 3500 Dallas, TX 75270 TCG Directed Investments: Internet: www.tdameritrade.com Phone: 1-800-454-9272 Address: TCG Investment Advisory Services 900 S Capital of Texas Hwy Suite 350 Austin, TX 78746 NexBank Money Market Savings: Internet: https://www.nexbank.com/ Phone: 1-800-827-4818 Address: NexBank 2515 McKinney Avenue, Suite 1100 Dallas, TX 75201
B. PROPERTY TAXES Property taxes are levied by October 1 on the assessed value listed as of the prior January 1 for all real and business personal property located in the District in conformity with Subtitle E, Texas Property Tax Code. Taxes are due on receipt of the tax bill and are delinquent if not paid before February 1 of the year following the year in which imposed. On January 31 of each year, a tax lien attaches to property to secure the payment of all taxes, penalties, and interest ultimately imposed. Property tax revenues are considered available (1) when they become due or past due and receivable within the current period and (2) when they are expected to be collected during a 60-day period after the close of the District’s fiscal year.
40

ECTOR COUNTY INDEPENDENT SCHOOL DISTRICT NOTES TO THE FINANCIAL STATEMENTS
YEAR ENDED JUNE 30, 2018
C. DELINQUENT TAXES RECEIVABLE Delinquent taxes are prorated between maintenance and debt service based on rates adopted for the year of the levy. Allowances for uncollectible tax receivables within the General and Debt Service Funds are based on historical experience in collecting property taxes. Uncollectible personal property taxes are periodically reviewed and written off, but the District is prohibited from writing off real property taxes without specific statutory authority from the Texas Legislature. D. INTERFUND BALANCES AND TRANSFERS Interfund balances at June 30, 2018, consisted of the following amounts:
Due From Due ToGeneral Fund: Other Funds Other Funds
Debt Service Fund $ - $ 463,671
Special Revenue Fund 1,151,139 1,506,462 Capital Projects Fund - 142,510 Internal Service Fund 731,338 - General Fund 1,818,328 1,818,328
Total General Fund 3,700,805 3,930,971
Debt Service Fund:General Fund 463,671 -
Total Debt Service Fund 463,671 -
Capital Project Fund:General Fund 142,510 -
Total Capital Projects Fund 142,510 -
Special Revenue Fund:General Fund 1,506,462 1,151,139
Total Special Revenue Fund 1,506,462 1,151,139
Internal Service Fund:General Fund - 731,338
Total Internal Service Fund - 731,338
Totals $ 5,813,448 $ 5,813,448
The purpose of the interfund balances as of June 30, 2018, represents amounts owed to and from other funds, payroll and related benefits, and operations that will be cleared the following month when money is received from the granting agency or when subsequent transfers/repayments are made.
41

ECTOR COUNTY INDEPENDENT SCHOOL DISTRICT NOTES TO THE FINANCIAL STATEMENTS
YEAR ENDED JUNE 30, 2018
Interfund transfers for the year ended June 30, 2018 consisted of the following amounts:
Interfund transfers
Transfers Out Transfers InGeneral Fund: $ 308,196 $ 1,397,649 Special Revenue Fund: - 308,196 Capital Project Fund: 1,397,649 -
Totals $ 1,705,845 $ 1,705,845
The transfer from the general fund was to fund the District’s portion of the Regional Day School for the Deaf Programs - $308,196 The transfer into the general fund was from unused local funds from construction projects - $1,397,649. E. DISAGGREGATION OF RECEIVABLES AND PAYABLES
Property Other Due From Total Taxes Governments Other Funds Other Receivables
Governmental Activities:
General Fund $ 14,045,746 $ 18,174,219 $ 3,700,805 $ 24,545 $ 35,945,315 Debt Service Fund 1,372,737 - 463,671 - 1,836,408 Capital Projects Funds - - 142,510 - 142,510 Other Funds - 1,171,807 1,506,462 - 2,678,269 Internal Service Funds - - - - -
Total - Governmental Activities $ 15,418,483 $ 19,346,026 $ 5,813,448 $ 24,545 $ 40,602,502
PayrollDeductions and
Accounts Other Withholdings Due To Total Payable Governments Payable Other Funds Payables
Governmental Activities: General Fund $ 3,032,901 $ - $ 2,066,681 $ 3,930,971 $ 9,030,553 Debt Service Fund - - - - - Capital Projects Funds - - - - - Other Funds 1,209,219 - - 1,151,139 2,360,358 Internal Service Funds 121,757 - - 731,338 853,095
Total - Governmental Activities $ 4,363,877 $ - $ 2,066,681 $ 5,813,448 $ 12,244,006
Receivables at June 30, 2018 were as follows:
Payables at June 30, 2018 were as follows:
42

ECTOR COUNTY INDEPENDENT SCHOOL DISTRICT NOTES TO THE FINANCIAL STATEMENTS
YEAR ENDED JUNE 30, 2018
F. CAPITAL ASSET ACTIVITY Capital asset activity for the District for the year ended June 30, 2018, was as follows:
Beginning Ending Balance Additions Retirements Balance
Governmental activities: Land 10,961,837$ -$ -$ 10,961,837$ Buildings and Improvements 455,331,001 6,661,040 - 461,992,041 Equipment 47,759,099 1,336,613 (1,206,967) 47,888,745 Software 4,257,437 - - 4,257,437 Construction in Progress 6,245,875 (6,245,875) - - Totals at Historical Costs 524,555,249 1,751,778 (1,206,967) 525,100,060
Less accumulated depreciation and amortization for: Buildings and Improvements (152,792,244) (9,747,944) - (162,540,188) All Equipment (33,316,922) (3,555,016) 1,171,498 (35,700,440) Software (3,290,694) (683,716) - (3,974,410) Total accumulated depreciation for: (189,399,860) (13,986,676) 1,171,498 (202,215,038)
Governmental activities capital assets, net 335,155,389$ (12,234,898)$ (35,469)$ 322,885,022$
*Depreciation expense was charged to governmental functionsas follows:
Instruction 4,749,861$ Instruction Resources & Media Services 157,111 Curriculum & Staff Development - Instructional Leadership 29,996 School Leadership 485,781 Guidance, Counseling & Evaluation Service 13,532 Health Services 1,648 Student Transportation 850,794 Food Service 1,496,561 Co-Curricular/Extracurricular Activities 2,109,932 General Administration 33,897 Plant Maintenance & Operations 2,317,429 Securities & Monitoring Services 349,351 Data Processing Services 1,351,346 Community Services 39,437
Total Depreciation Expense 13,986,676$
Primary Government
43

ECTOR COUNTY INDEPENDENT SCHOOL DISTRICT NOTES TO THE FINANCIAL STATEMENTS
YEAR ENDED JUNE 30, 2018
G. BONDS PAYABLE Bonded indebtedness of the District is reflected in the General Long-Term Debt Account Group. Current requirements for principal and interest expenditures are accounted for in the Debt Service Fund. On December 11, 2001, The District issued $55,868,558 of Unlimited Tax School Building and Refunding Bonds, Series 2001 (the “Bonds”) maturing from August 15, 2004 through August 15, 2025. Interest rates vary from 3.55% to 5.75%. The Bonds were issued as part of an October 29, 2001 voter approved referendum of $89,500,000 to renovate schools within the District and to build a new early education center and a new elementary campus. In addition, the bonds defeased $3,755,000 of old bonds by placing the proceeds of new bonds in an irrevocable trust to provide for all future debt service payments on the old bonds. Accordingly, the trust account assets and liabilities for the defeased bonds are not included in the District’s financial statements. The refunding resulted in no economic gain or loss to the District. On February 20, 2007, the District issued $56,380,113 of Unlimited Tax Refunding Bonds, Series 2007 (the “Bonds”) maturing from August 15, 2007 through August 15, 2027. Interest rates vary from 4.00% through 4.64%. The Bonds were issued to advance refund a portion of the District’s outstanding bonds to lower the District’s debt service payments by placing the proceeds of new bonds in an irrevocable trust to provide for all future debt service payments on the old bonds. Accordingly, the trust account assets and liabilities for the defeased bonds are not included in the District’s financial statements. The refunding resulted in an economic gain to the District of $2,027,926. The Series 2007 Bonds outstanding were paid off in August 2017. On June 20, 2012, the District issued $4,690,000 of Unlimited Tax Refunding Bonds, Series 2012 (the “Bonds”) maturing from August 15, 2012 through August 15, 2025. Interest rates vary from 2.00% to 3.00%. The Bonds were issued to advance refund a portion of the District’s outstanding bonds to lower the District’s debt service payments by placing the proceeds of new bonds in an irrevocable trust to provide for all future debt service payments on the old bonds. Accordingly, the trust account assets and liabilities for the defeased bonds are not included in the District’s financial statements. The refunding resulted in an economic gain to the District of $637,628. The net cash flow decrease from the refunding over the life of the bond issue is $687,402. On June 30, 2018, $2,240,000 of bonds considered defeased by the series 2012 bonds are still outstanding. On March 28, 2013, the District issued $121,595,000 of Unlimited Tax School Building Bonds, Series 2013 (the “Bonds”) maturing from August 15, 2013 through August 15, 2038. Interest rates vary from 3.00% through 5.00%. The Bonds were issued for the construction and renovation and equipping of high school facilities, the construction and equipping of elementary school facilities and the acquisition of any necessary school sites and new school buses, and to fund capitalized interest on, and costs of issuance related to, the Bonds. On November 22, 2016, the District issued $49,235,000 of Unlimited Tax Refunding Bonds, Series 2016 (the “Bonds”) maturing from August 15, 2017 through August 15, 2027. Interest rates vary from 2.00% to 5.00%. The Bonds were issued to advance refund a portion of the District’s outstanding bonds to lower the District’s debt service payments by placing the proceeds of new bonds in an irrevocable trust to provide for all future debt service payment on the old bonds. Accordingly, the trust accounts assets and liabilities for the defeased bonds are not included in the District’s financial statements. The refunding resulted in an economic gain to the District of $9,588,712. The net cash flow decrease from the refunding over the life of the bond issue is $8,469,818. On June 30, 2018, $55,677,169 of bonds considered defeased by the series 2016 are still outstanding.
44

ECTOR COUNTY INDEPENDENT SCHOOL DISTRICT NOTES TO THE FINANCIAL STATEMENTS
YEAR ENDED JUNE 30, 2018
A summary of changes in general long-term debt for the year ended June 30, 2018 is as follows:
Interest Amounts Interest Payable PayableRate Original Current Outstanding Outstanding
Description Payable Issue Year 7/1/2017 Issued Retired 6/30/2018
ECISD Unlimited Tax School 3.55,3.90, 55,868,558$ 2,439,570$ 4,487,817$ -$ 1,760,430$ 2,727,387$ Building and Refunding 4.20, 4.50,Bonds, Series 2001 4.68, 4.80,
4.90, 5.01,5.13, 5.26,5.36, 5.46,5.56, 5.64,5.7, 5.75%
ECISD Unlimited Tax School 4.00, 4.16, 56,380,113 1,545,000 155,000 - 155,000 - Refunding Bonds, Series 4.20, 4.23,2007 4.25, 4.29,
4.30, 4.35,4.36, 4.50,4.56, 4.64%
ECISD Unlimited Tax 2.00, 3.00% 4,690,000 59,550 2,110,000 - - 2,110,000 Refunding Bonds, Series2012
ECISD Unlimited Tax 3.00, 3.125 121,595,000 4,814,244 115,580,000 - 935,000 114,645,000 School Building Bonds, 3.25, 4.00Series 2013 5.00%
ECISD Unlimited Tax 2.00, 4.00 49,235,000 2,390,900 49,235,000 680,000 48,555,000 Refunding Bonds, Series 5.00%Series 2016
TOTAL 287,768,671$ 11,249,264$ 171,567,817$ -$ 3,530,430$ 168,037,387$
Debt service requirements are as follows:
General ObligationsTotal
Year Ended June 30, Principal Interest Requirements2019 3,399,088 9,772,480 13,171,5682020 4,143,299 8,990,570 13,133,8692021 6,115,000 6,934,994 13,049,9942022 6,400,000 6,639,769 13,039,7692023 6,710,000 6,331,819 13,041,819
2024-2028 37,925,000 26,457,244 64,382,2442029-2033 42,745,000 16,527,219 59,272,2192034-2038 52,815,000 6,561,222 59,376,222
2039 7,785,000 136,237 7,921,237$ 168,037,387 $ 88,351,554 $ 256,388,941
45

ECTOR COUNTY INDEPENDENT SCHOOL DISTRICT NOTES TO THE FINANCIAL STATEMENTS
YEAR ENDED JUNE 30, 2018
H. COMMITMENTS UNDER OPERATING LEASES
Commitments under operating (noncapitalized) lease agreements for equipment provide for minimum future rental payments as of June 30, 2018, are as follows:
FutureYear Ending June 30, Rental Payments
2019 701,1452020 486,5912021 223,6222022 82,903Total Minimum Rentals $ 1,494,261
Rental Expenditures in Fiscal Year 2018 $ 909,294
I. ACCUMULATED UNPAID VACATION AND SICK LEAVE BENEFITS Upon retirement or death of certain employees, the District pays any accrued sick leave and vacation leave in a lump sum payment to such employee or his/her estate based upon the following criteria:
1. Hourly position employees not working a scheduled 40-hour week are not eligible to be paid for accrued leave.
2. Sick Leave: Any employee not mentioned above who retired after completing five consecutive
years or resigns after completing 20 years of service with the District shall be paid for accrued sick leave. Accrued sick leave shall be computed at one-half the daily rate at the time of retirement or resignation times the number of accrued leave days, which shall not exceed one-half the number of working days in an annual contract. In order to receive payment for unused sick leave, retirement must occur at the end of the employee’s contract period, or when retirement is necessitated by a medical disability as approved by the Teacher Retirement System. Exceptions to this provision were reviewed by the Board upon recommendation of the Superintendent. No benefits shall be calculated on a salary schedule exceeding that of a regular teacher’s salary schedule. Individuals who are retiring and have worked less than 85 days of the contract year shall have accrued sick leave paid based on the previous year’s salary schedule.
3. Vacation Leave: Any accrued vacation leave is paid upon separation at the employee’s current daily
rate of pay. A summary of changes in the accumulated sick leave and vacation leave liability follows:
VacationSick Leave Leave
Balance June 30, 2017 $ 5,248,329 $ 1,633,969Additions/Adjustments - New Entrants and Salary Increments 2,458,824 (180,954)Deductions - Payments to Participants (1,339,149) (102,966)Balance June 30, 2018 $ 6,368,004 $ 1,350,049
46

ECTOR COUNTY INDEPENDENT SCHOOL DISTRICT NOTES TO THE FINANCIAL STATEMENTS
YEAR ENDED JUNE 30, 2018
J. DEFINED BENEFIT PENSION PLAN Plan Description. Ector County Independent School District participates in a cost-sharing multiple-employer defined benefit pension plan that has a special funding situation. The plan is administered by the Teacher Retirement System of Texas (TRS). TRS’s defined benefit pension plan is established and administered in accordance with the Texas Constitution, Article XVI, Section 67 and Texas Government Code, Title 8, Subtitle C. The pension trust fund is a qualified pension trust under Section 401(a) of the Internal Revenue Code. The Texas Legislature establishes benefits and contribution rates within the guidelines of the Texas Constitution. The pension’s Board of Trustees does not have the authority to establish or amend benefit terms.
All employees of public, state-supported educational institutions in Texas who are employed for one-half or more of the standard work load and who are not exempted from membership under Texas Government Code, Title 8, Section 822.002 are covered by the system. Pension Plan Fiduciary Net Position. Detailed information about the Teacher Retirement System’s fiduciary net position is available in a separately-issued Comprehensive Annual Financial Report that includes financial statements and required supplementary information. That report may be obtained on the Internet at https://www.trs.texas.gov/TRS%20Documents/cafr_2017.pdf; by writing to TRS at 1000 Red River Street, Austin, TX, 78701-2698; or by calling (512) 542-6592. Benefits Provided. TRS provides service and disability retirement, as well as death and survivor benefits, to eligible employees (and their beneficiaries) of public and higher education in Texas. The pension formula is calculated using 2.3 percent (multiplier) times the average of the five highest annual creditable salaries times years of credited service to arrive at the annual standard annuity except for members who are grandfathered, the three highest annual salaries are used. The normal service retirement is at age 65 with 5 years of credited service or when the sum of the member’s age and years of credited service equals 80 or more years. Early retirement is at age 55 with 5 years of service credit or earlier than 55 with 30 years of service credit. There are additional provisions for early retirement if the sum of the member’s age and years of service credit total at least 80, but the member is less than age 60 or 62 depending on date of employment, or if the member was grandfathered in under a previous rule. There are no automatic post-employment benefit changes; including automatic COLAs. Ad hoc post-employment benefit changes, including ad hoc COLAs can be granted by the Texas Legislature as noted in the Plan description above. Contributions. Contribution requirements are established or amended pursuant to Article 16, section 67 of the Texas Constitution which requires the Texas legislature to establish a member contribution rate of not less than 6% of the member’s annual compensation and a state contribution rate of not less than 6% and not more than 10% of the aggregate annual compensation paid to members of the system during the fiscal year. Texas Government Code section 821.006 prohibits benefit improvements, if as a result of the particular action, the time required to amortize TRS’ unfunded actuarial liabilities would be increased to a period that exceeds 31 years, or, if the amortization period already exceeds 31 years, the period would be increased by such action.
47

ECTOR COUNTY INDEPENDENT SCHOOL DISTRICT NOTES TO THE FINANCIAL STATEMENTS
YEAR ENDED JUNE 30, 2018
Employee contribution rates are set in state statute, Texas Government Code 825.402. Senate Bill 1458 of the 83rd Texas Legislature amended Texas Government Code 825.402 for member contributions and established employee contribution rates for fiscal years 2014 thru 2017. The 83rd Texas Legislature, General Appropriations Act (GAA) established the employer contribution rates for fiscal years 2014 and 2015. The 84th Texas Legislature, General Appropriations Act (GAA) established the employer contribution rates for fiscal years 2016 and 2017. Contribution Rates can be found in the TRS 2017 CAFR, Note 12, on page 88.
2017 2018Member 7.2% 7.7%Non-Employer Contributing Entity (State) 6.7% 6.8%Employers 6.8% 6.8%
Employer 0576 - 2018 Employer ContributionsEmployer 0576 - 2018 Member ContributionsEmployer 0576 - 2018 NECE On-behalf Contributions
Contribution Rates
$2,951,106$12,513,674$6,249,247
Contributors to the plan include members, employers and the State of Texas as the only non-employer contributing entity. The State contributes to the plan in accordance with state statutes and the General Appropriations Act (GAA). As the non-employer contributing entity for public education, the State of Texas contributes to the retirement system an amount equal to the current employer contribution rate times the aggregate annual compensation of all participating members of the pension trust fund during that fiscal year reduced by the amounts described below which are paid by the employers. Employers including public schools are required to pay the employer contribution rate in the following instances:
• On the portion of the member's salary that exceeds the statutory minimum for members entitled to the statutory minimum under Section 21.402 of the Texas Education Code.
• During a new member’s first 90 days of employment. • When any part or all of an employee’s salary is paid by a federal funding source or a
privately sponsored source
In addition to the employer contributions listed above, there are two additional surcharges an employer is subject to.
• When employing a retiree of the Teacher Retirement System the employer shall pay both the member contribution and the state contribution as an employment after retirement surcharge.
• When a school district does not contribute to the Federal Old-Age, Survivors and Disability Insurance (OASDI) Program for certain employees, they must contribute 1.5% of the state contribution rate for certain instructional or administrative employees; and 100% of the state contribution rate for all other employees.
48

ECTOR COUNTY INDEPENDENT SCHOOL DISTRICT NOTES TO THE FINANCIAL STATEMENTS
YEAR ENDED JUNE 30, 2018
Actuarial Assumptions. The total pension liability in the August 31, 2017 actuarial valuation was determined using the following actuarial assumptions: Actuarial Assumptions can be found in the 2017 TRS CAFR, Note 12, and Page 90.
Valuation Date August 31, 2017 Actuarial Cost Method Individual Entry Age Normal Asset Valuation Method Market Value Single Discount Rate 8.00% Long-term expected Investment Rate of Return 8.00% Inflation 2.50% Salary Increases Including Inflation 3.50% to 9.50% Payroll Growth Rate 2.50% Benefit Changes During the Year None Ad hoc Post Employment Benefit Changes None
The actuarial methods and assumptions are primarily based on a study of actual experience for the four-year period ending August 31, 2014 and adopted on September 24, 2015. Discount Rate. The discount rate used to measure the total pension liability was 8.0%. The Discount Rate can be found in the 2017 TRS CAFR on page 90. There was no change in the discount rate since the previous year. The projection of cash flows used to determine the discount rate assumed that contributions from plan members and those of the contributing employers and the non-employer contributing entity are made at the statutorily required rates. Based on those assumptions, the pension plan’s fiduciary net position was projected to be available to make all future benefit payments of current plan members. Therefore, the long-term expected rate of return on pension plan investments was applied to all periods of projected benefit payments to determine the total pension liability. The long-term rate of return on pension plan investments is 8%. The long-term expected rate of return on pension plan investments was determined using a building-block method in which best-estimates ranges of expected future real rates of return (expected returns, net of pension plan investment expense and inflation) are developed for each major asset class. These ranges are combined to produce the long-term expected rate of return by weighting the expected future real rates of return by the target asset allocation percentage and by adding expected inflation. Best estimates of geometric real rates of return for each major asset class included in the Systems target asset allocation as of August 31, 2017 (see page 62 of the 2017 TRS CAFR) are summarized below:
49

ECTOR COUNTY INDEPENDENT SCHOOL DISTRICT NOTES TO THE FINANCIAL STATEMENTS
YEAR ENDED JUNE 30, 2018
Asset ClassTarget
Allocation**Real Return
Geometric Basis
Long-Term Expected Portfolio Real Rate of
Return*Global Equity
U.S. 18% 4.6% 1.0%Non-U.S. Developed 13% 5.1% 0.8%Emerging Markets 9% 5.9% 0.7%Directional Hedge Funds 4% 3.2% 0.1%Private Equity 13% 7.0% 1.1%
Stable ValueU.S. Treasuries 11% 0.7% 0.1%Absolute Return 0% 1.8% 0.0%Hedge Funds (Stable Value) 4% 3.0% 0.1%Cash 1% -0.2% 0.0%
Real ReturnGlobal Inflation Linked Bonds 3% 0.9% 0.0%Real Assets 16% 5.1% 1.1%Energy and Natural Resources 3% 6.6% 0.2%Commodities 0% 1.2% 0.0%
Risk ParityRisk Parity 5% 6.7% 0.3%Inflation Expectations 2.2%Alpha 1.0%
Total 100% 8.7%*
** Target allocations are based on the FY2014 policy model. Infrastructure was moved from Real Assets to Energyand Natural Resources in FY2017, but the reallocation does not affect the long-term expected geometric realrate of return or expected contribution to long-term portfolio returns
The Expected Contribution to Returns incoporates the volatility drag resulting from the conversion between Arithmetic and Geometric
Discount Rate Sensitivity Analysis. The following schedule shows the impact of the Net Pension Liability if the discount rate used was 1% less than and 1% greater than the discount rate that was used (8%) in measuring the Net Pension Liability. The discount rate can be found in the 2017 TRS CAFR, Note 12, page 91.
1% Decrease in Discount Rate (7.0%) Discount Rate (8.0%)
1% Increase in Discount Rate (9.0%)
ECISD proportionate share of the net pension liability:
$87,867,240 $52,121,909 $22,358,119
50

ECTOR COUNTY INDEPENDENT SCHOOL DISTRICT NOTES TO THE FINANCIAL STATEMENTS
YEAR ENDED JUNE 30, 2018
Pension Liabilities, Pension Expense, and Deferred Outflows of Resources and Deferred Inflows of Resources Related to Pensions. At June 30, 2018, the District reported a liability of $52,121,909 for its proportionate share of the TRS’s net pension liability. This liability reflects a reduction for State pension support provided to the District. The amount recognized by the District as its proportionate share of the net pension liability, the related State support, and the total portion of the net pension liability that was associated with the District were as follows:
ECISD’s Proportionate share of the collective net pension liability 52,121,909$ State’s proportionate share that is associated with ECISD 81,929,372 Total 134,051,281$
The net pension liability was measured as of August 31, 2017 and the total pension liability used to calculate the net pension liability was determined by an actuarial valuation as of that date. The employer’s proportion of the net pension liability was based on the employer’s contributions to the pension plan relative to the contributions of all employers to the plan for the period September 1, 2016 thru August 31, 2017. At August 31, 2017 the employer's proportion of the collective net pension liability was .163010290% which was a decrease of 8.3845167% from its proportion measure as of August 31, 2016. Changes Since the Prior Actuarial Valuation – There were no changes to the actuarial assumptions or other inputs that affected measurement of the total pension liability since the prior measurement period: There were no changes of benefit terms that affected measurement of the total pension liability during the measurement period. For the year ended June 30, 2018, the District recognized pension expense of $6,249,247 and revenue of $6,249,247 for support provided by the State in the Government Wide Statement of Activities. At June 30, 2018, the District reported its proportionate share of the TRS’s deferred outflows of resources and deferred inflows of resources related to pensions from the following sources: (The amounts shown below will be the cumulative layers from the current and prior years combined.)
Differences between expected and actual Actuarial experience $762,567 $2,810,866Changes in Actuarial Assumptions $2,374,236 $1,359,194Difference between projected and actual investment earnings $3,798,531
Total $23,467,715 $12,444,463
Deferred Outflows of Resources
Deferred Inflows of Resources
Changes in proportion and difference between the employer's contributions and the proportionate share of contributionsContributions paid to TRS subsequent to the measurement date (calculated by employer)
$9,857,735 $4,475,872
$10,473,177 $0
51

ECTOR COUNTY INDEPENDENT SCHOOL DISTRICT NOTES TO THE FINANCIAL STATEMENTS
YEAR ENDED JUNE 30, 2018
The net amounts of the employer’s balances of deferred outflows and inflows of resources related to pensions will be recognized in pension expense as follows:
2019 ($92,286)2020 $3,234,791 2021 ($347,909)2022 ($1,310,631)2023 ($302,237)
Thereafter ($631,655)
For the Year Ended June 30
Pension Expense Amount
K. DEFINED OTHER POST-EMPLOYMENT BENEFIT PLANS
Plan Description. The District participates in the Texas Public School Retired Employees Group Insurance Program (TRS-Care). It is a multiple-employer, cost-sharing defined Other Post-Employment Benefit (OPEB) plan that has a special funding situation. The plan is administered through a trust by the Teacher Retirement System of Texas (TRS) Board of Trustees. It is established and administered in accordance with the Texas Insurance Code, Chapter 1575.
OPEB Plan Fiduciary Net Position. Detail information about the TRS-Care's fiduciary net position is available in the separately-issued TRS Comprehensive Annual Financial Report that includes financial statements and required supplementary information. That report may be obtained on the Internet at https://www.trs.texas.gov/TRS%20Documents/cafr_2017.pdf; by writing to TRS at 1000 Red River Street, Austin, TX, 78701-2698; or by calling (512) 542-6592. Components of the net OPEB liability of the TRS-Care plan as of August 31, 2017 are as follows:
NET OPEB Liability AmountTotal OPEB Liability 43,885,784,621$ Less: Plan Fiduciary Net Position 399,535,986 Net OPEB Liability 43,486,248,635$
Net Position as percentage of Total OPEB Liability 0.91%
Benefits Provided. TRS-Care provides a basic health insurance coverage (TRS-Care 1), at no cost to all retirees from public schools, charter schools, regional education service centers and other educational districts who are members of the TRS pension plan. Optional dependent coverage is available for an additional fee. Eligible retirees and their dependents not enrolled in Medicare may pay premiums to participate in one of two optional insurance plans with more comprehensive benefits (TRS-Care 2 and TRS-Care 3). Eligible retirees and dependents enrolled in Medicare may elect to participate in one of the two Medicare health plans for an additional fee. To qualify for TRS-Care coverage, a retiree must have at least 10 years of service credit in the TRS pension system. The Board of Trustees is granted the authority to establish basic and optional group insurance coverage for participants as well as to amend benefit terms as needed under Chapter 1575.052. There are no automatic post-employment benefit changes; including automatic COLAs.
52

ECTOR COUNTY INDEPENDENT SCHOOL DISTRICT NOTES TO THE FINANCIAL STATEMENTS
YEAR ENDED JUNE 30, 2018
The premium rates for the optional health insurance are based on years of service of the member. The schedule below shows the monthly rates for the average retiree with Medicare Parts A&B coverage, with 20 to 29 years of service for the basic plan and the two optional plans.
TRS-Care Plan Premium Rates Effective Sept. 1, 2016 - Dec. 31, 2017
TRS Care-1 Basic Plan
TRS Care-2 Optional Plan
TRS Care-3 Optional Plan
Retiree* $ 0 $ 70 $ 100 Retiree and Spouse 20 175 255 Retiree* and Children 41 132 182 Retiree and Family 61 237 337 Surviving Children Only 28 62 82 *or surviving spouse
Contributions. Contribution rates for the TRS-Care plan are established in state statute by the Texas Legislature, and there is no continuing obligation to provide benefits beyond each fiscal year. The TRS-Care plan is currently funded on a pay-as-you-go basis and is subject to change based on available funding. Funding for TRS-Care is provided by retiree premium contributions and contributions from the state, active employees, and school districts based upon public school district payroll. The TRS Board of trustees does not have the authority to set or amend contribution rates. Texas Insurance Code, section 1575.202 establishes the state's contribution rate which is 1.0% of the employee's salary. Section 1575.203 establishes the active employee's rate which is .65% of pay. Section 1575.204 establishes an employer contribution rate of not less than 0.25 percent or not more than 0.75 percent of the salary of each active employee of the public. The actual employer contribution rate is prescribed by the Legislature in the General Appropriations Act. The following table shows contributions to the TRS-Care plan by type of contributor.
2017 2018Active Employee 0.65% 0.65%Non-Employer Contriuting Entity (State) 1.00% 1.25%Employers 0.55% 0.75%Federal/Private Funding Remitted by Employers 1.00% 1.25%
Employer 0576 - 2018 Employer Contributions $ 1,322,075Employer 0576 - 2018 Member Contributions $ 1,056,336Measurement Year NECE On-behalf Contributions $ (42,334,152)
Contribution Rates
In addition to the employer contributions listed above, there is an additional surcharge all TRS employers are subject to (regardless of whether or not they participate in the TRS Care OPEB program). When employers hire a TRS retiree, they are required to pay to TRS-Care, a monthly surcharge of $535 per retiree. TRS-Care received supplemental appropriations from the State of Texas as the Non-Employer Contributing Entity in the amount of $15.6 million in fiscal year 2017. House Bill 21 was passed in special session and provided a supplemental appropriation in the amount of $212 million in fiscal year 2018.
53

ECTOR COUNTY INDEPENDENT SCHOOL DISTRICT NOTES TO THE FINANCIAL STATEMENTS
YEAR ENDED JUNE 30, 2018
The District's proportionate of share of the $212,000,000 received during the district's 2018 fiscal year is reported in the fund level financial statements as an on-behalf contribution as required by GASB 85 and GASB 24. Actuarial Assumptions. The total OPEB liability in the August 31, 2017 actuarial valuation was determined using the following actuarial assumptions: [Actuarial Assumptions can be found in the 2017 TRS CAFR, Note 10, page 82]. The actuarial valuation of TRS-Care is similar to the actuarial valuations performed for the pension plan, except that the OPEB valuation is more complex. All of the demographic assumptions, including mortality, and most of the economic assumptions are identical to those which were adopted by the Board in 2015 and are based on the 2014 actuarial experience study of TRS. The active mortality rates were based on 90 percent of the RP-2014 Employee Mortality Tables for males and females. The post-retirement mortality rates were based on the 2015 TRS of Texas Healthy Pensioner Mortality Tables. The following assumptions and other inputs used for members of TRS-Care are identical to the assumptions used in the August 31, 2017 TRS pension actuarial valuation:
Rates of Mortality General Inflation Rates of Retirement Wage Inflation Rates of Termination Expected Payroll Growth Rates of Disability Incidence
Additional Actuarial Methods and Assumptions:
Valuation Date August 31, 2017 Actuarial Cost Method Individual Entry Age Normal Inflation 2.50% Discount Rate * 3.42% * Aging Factors Based on Plan Specific Experience Expenses Third-party administrative expenses
related to the delivery of health care benefits are included in the age-adjusted claims costs.
Payroll Growth Rate 2.50% Projected Salary Increases ** 3.50% to 9.50% ** Healthcare Trend Rates *** 4.50% to 12.00% *** Election Rates Normal Retirement: 70% participation
prior to age 65 and 75% after age 65 Ad hoc post-employment benefit changes
None
*Source: Fixed Income municipal bonds with 20 years to maturity that include only federal tax-exempt municipal bonds as reported in Fidelity Index's "20-Year Municipal GO AA Index" as of August 31, 2017. **Includes inflation at 2.50% ***Initial trend rates are 7.00% for non-Medicare retirees; 10.00% for Medicare retirees and 12.00% for prescriptions for all retirees. Initial trend rates decrease to an ultimate trend rate of 4.50% over a period of 10 years.
54

ECTOR COUNTY INDEPENDENT SCHOOL DISTRICT NOTES TO THE FINANCIAL STATEMENTS
YEAR ENDED JUNE 30, 2018
Discount Rate. A single discount rate of 3.42% was used to measure the total OPEB liability. There was a change of .44 percent in the discount rate since the previous year. The Discount Rate can be found in the 2017 TRS CAFR on page 83. Because the plan is essentially a "pay-as-you-go" plan, the single discount rate is equal to the prevailing municipal bond rate. The projection of cash flows used to determine the discount rate assumed that contributions from active members and those of the contributing employers and the non-employer contributing entity are made at the statutorily required rates. Based on those assumptions, the OPEB plan's fiduciary net position was projected to not be able to make all future benefit payments of current plan members. Therefore, the municipal bond rate was applied to all periods of projected benefit payments to determine the total OPEB liability. The source of the municipal bond rate was Fixed-income municipal bonds with 20 years to maturity that include only federally tax-exempt municipal bonds as reported in Fidelity Index's "20-year Municipal GO AA Index" as of August 31, 2017. Sensitivity of the Net OPEB Liability: Discount Rate Sensitivity Analysis. The following schedule shows the impact of the Net OPEB Liability if the discount rate used was 1% less than and 1% greater than the discount rate that was used (3.42%) in measuring the Net OPEB Liability.
1% Decrease in Discount Rate (2.42%) Discount Rate (3.42%)
1% Increase in Discount Rate (4.42%)
ECISD proportionate share of the net pension liability:
$131,352,706 $111,292,438 $95,168,506
Healthcare Cost Trend Rates Sensitivity Analysis - The following presents the net OPEB liability of the plan using the assumed healthcare cost trend rate, as well as what the net OPEB liability would be if it were calculated using a trend rate that is one-percentage point lower or one-percentage point higher than the assumed healthcare cost trend rate.
1% DecreaseCurrent Healthcare
Cost Trend Rate 1% IncreaseECISD proportionate share of the net pension liability:
$92,662,074 $111,292,438 $135,737,825
OPEB Liabilities, OPEB Expense, and Deferred Outflows of Resources and Deferred Inflows of Resources Related to OPEBs. At June 30, 2018, the District reported a liability of $111,292,438 for its proportionate share of the TRS's Net OPEB Liability. This liability reflects a reduction for State OPEB support provided to the District. The amount recognized by the District as its proportionate share of the net OPEB liability, the related State support, and the total portion of the net OPEB liability that was associated with the District were as follows:
ECISD’s Proportionate share of the collective net OPEB liability 111,292,438$ State’s proportionate share that is associated with ECISD 126,511,621 Total 237,804,059$
The Net OPEB Liability was measured as of August 31, 2017 and the Total OPEB Liability used to calculate the Net OPEB Liability was determined by an actuarial valuation as of that date. The employer's proportion of the Net OPEB Liability was based on the employer's contributions to the OPEB plan relative to the contributions of all employers to the plan for the period September 1, 2016 thru August 31, 2017.
55

ECTOR COUNTY INDEPENDENT SCHOOL DISTRICT NOTES TO THE FINANCIAL STATEMENTS
YEAR ENDED JUNE 30, 2018
At August 31, 2017 the employer's proportion of the collective Net OPEB Liability was 0.2559255898% which was the same proportion measured as of August 31, 2016 Changes Since the Prior Actuarial Valuation – The following were changes to the actuarial assumptions or other inputs that affected measurement of the Total OPEB liability since the prior measurement period: [These can be found in the TRS CAFR on page 83].
1. Significant plan changes were adopted during fiscal year ending June 30, 2018. Effective January 1, 2018, only one health plan option will exist (instead of three), and all retirees will be required to contribute monthly premiums for coverage. The health plan changes triggered changes to several of the assumptions, including participation rates, retirement rates, and spousal participation rates.
2. The August 31, 2016 valuation had assumed that the savings related to the Medicare Part D reimbursements would phase out by 2022. This assumption was removed for the August 31, 2017 valuation. Although there is uncertainty regarding these federal subsidies, the new assumption better reflects the current substantive plan. This change was unrelated to the plan amendment, and its impact was included as an assumption change in the reconciliation of the total OPEB liability. This change significantly lowered the OPEB liability.
3. The discount rate changed from 2.98 percent as of August 31, 2016 to 3.42 percent as of August 31, 2017. This change lowered the total OPEB liability.
In this valuation the impact of the Cadillac Tax has been calculated as a portion of the trend assumption. Assumptions and methods used to determine the impact of the Cadillac Tax include:
• 2018 thresholds of $850/$2,292 were indexed annually by 2.50 percent.
• Premium data submitted was not adjusted for permissible exclusions to the Cadillac Tax.
• There were no special adjustments to the dollar limit other than those permissible for non-Medicare retirees over 55.
Results indicate that the value of the excise tax would be reasonably represented by a 25 basis point addition to the long term trend rate assumption. Future actuarial measurements may differ significantly from the current measurements due to such factors as the following: plan experience differing from that anticipated by the economic or demographic assumptions; changes in economic or demographic assumptions; increases or decreases expected as part of the natural operation of the methodology used for these measurements; and changes in plan provisions or applicable law. There were no changes of benefit terms that affected measurement of the Total OPEB liability during the measurement period. For the year ended June 30, 2018, the District recognized OPEB expense of $(42,334,152) and revenue of $(42,334,152) for support provided by the State.
56

ECTOR COUNTY INDEPENDENT SCHOOL DISTRICT NOTES TO THE FINANCIAL STATEMENTS
YEAR ENDED JUNE 30, 2018
At June 30, 2018, the District reported its proportionate share of the TRS's deferred outflows of resources and deferred inflows of resources related to other post-employment benefits from the following sources:
Differences between expected and actual Actuarial experience $2,323,314Changes in Actuarial Assumptions $44,230,523Net Difference between projected and actual investment earnings $16,906
Total $901,504 $46,553,837$884,082
Contributions paid to TRS subsequent to the measurement date (calculated by employer)
Deferred Outflows of Resources
Deferred Inflows of Resources
Changes in proportion and difference between the employer's contributions and the proportionate share of contributions $516
The net amounts of the employer's balances of deferred outflows and inflows (not including the deferred contribution paid subsequent to the measurement date) of resources related to OPEBs will be recognized in OPEB expense as follows:
2019 $ (6,140,533)2020 (6,140,533)2021 (6,140,533)2022 (6,140,533)2023 (6,144,760)
Thereafter (15,829,522)
For the Year Ended June 30
Pension Expense Amount
Medicare Part D. The Medicare Prescription Drug, Improvement, and Modernization Act of 2003, effective January 1, 2006, established prescription drug coverage for Medicare beneficiaries known as Medicare Part D. One of the provisions of Medicare Part D allows for the Texas Public School Retired Employee Group Insurance Program (TRS-Care) to receive retiree drug subsidy payments from the federal government to offset certain prescription drug expenditures for eligible TRS-Care participants. For the fiscal year ended 2018, 2017, and 2016 the subsidy payments received by TRS-Care on-behalf of the District were $660,092, $495,348 and $635,678 respectively. The information for the year ended June 30, 2018 is an estimate provided by the Teacher Retirement System. These payments are recorded as equal revenues and expenditures in the governmental funds financial statements of the District.
57

ECTOR COUNTY INDEPENDENT SCHOOL DISTRICT NOTES TO THE FINANCIAL STATEMENTS
YEAR ENDED JUNE 30, 2018
L. RISK MANAGEMENT Health Insurance The District sponsors a self-funded plan to provide health care benefits to staff members and their dependents. Transactions related to the plan are accounted for in the Medical Trust Fund (the “Fund”), an internal service fund of the District. The District contributed $380 per month per employee for the period of July 2017 through June 2018. Each employee contributed $70 per month in July 2017, $100 per month for the period of August through December 2017, and $115 per month for the period of January through July 2018. Employees, at their option, authorized payroll withholding to pay contributions for dependents. Third party administrators paid all claims from the fund. The plan was authorized by Section 21.922, Texas Education Code, and was documented by contractual agreement. The District was protected against unanticipated catastrophic individual or aggregate loss by stop-loss coverage carried through Sirius America Insurance Company, commercial insurer licensed or eligible to do business in Texas in accordance with the Texas Insurance Code. Stop loss coverage was in effect in 2017 for individual claims exceeding $350,000 annually and aggregate coverage with an attachment point of $27,330,237. These amounts were $350,000 individual and $28,993,731 aggregate in 2018. Estimates of claims payable and of claims incurred, but not reported at June 30, 2018, are reflected as accounts and claims payable of the Fund. The plan is funded to discharge liabilities of the Fund as they become due. For the fiscal year 2017-2018, one claim exceeded the $350,000 limit plus one one-time aggregating specific of $200,000 in 2017. Changes in the balances of claims liabilities during the past year are as follows:
Year Ended Year EndedJune 30, 2017 June 30, 2018
Unpaid claims, beginning of the year $ 2,058,431 $ 2,311,220Incurred claims (including IBNR's) 22,516,423 21,986,139Claim Payments (22,263,634) (22,054,708)Unpaid claims, end of fiscal year $ 2,311,220 $ 2,242,651
Worker’s Compensation
The District sponsors a self-funded Worker’s Compensation Fund. Claims exceeding $450,000 up to the State of Texas statutory limits per occurrence are covered by a stop loss plan through the Texas Association of School Boards, whose carrier is Safety National Casualty Corporation. For the school year 2017-2018, no claims exceeded the $450,000 limit. Changes in the balances of the claims liability during the past year are as follows:
Year Ended Year EndedJune 30, 2017 June 30, 2018
Unpaid claims, beginning of the year $ 2,828,761 $ 2,927,290Incurred claims (including IBNR's) 992,653 970,782Claim Payments (894,124) (879,477)Unpaid claims, end of fiscal year $ 2,927,290 $ 3,018,595
58

ECTOR COUNTY INDEPENDENT SCHOOL DISTRICT NOTES TO THE FINANCIAL STATEMENTS
YEAR ENDED JUNE 30, 2018
M. CHANGES IN LONG-TERM LIABILITIES Long-term activity for the year ended June 30, 2018, was as follows:
Beginning Ending Due WithinBalance Additions Reductions Balance One Year
Governmental Activities: Bonds and Notes Payable:
School Building and Refunding Bonds 171,567,817$ -$ (3,530,430)$ 168,037,387$ 3,399,088$ Accumulated Accretion 7,772,642 406,122 (3,984,570) 4,194,194 - Net Bond Premium 16,643,063 - (2,273,815) 14,369,248 -
Total Bonds and Notes Payable 195,983,522 406,122 (9,788,815) 186,600,829 3,399,088 Other Liabilities:
Net Pension Liability 67,236,631 15,249,170 (30,363,892) 52,121,909 - Net Other Post Employment Benefits (OPEB) Liability 196,481,178 18,836 (85,207,576) 111,292,438 -
Worker's Compensation (IBNR) 2,927,290 970,782 (879,477) 3,018,595 716,761 Sick Leave Benefits 5,248,329 2,458,824 (1,339,149) 6,368,004 165,469
Total Other Liabilities 271,893,428 18,697,612 (117,790,094) 172,800,946 882,230
Total Governmental Activities Long-Term Liabilities 467,876,950$ 19,103,734$ (127,578,909)$ 359,401,775$ 4,281,318$
59

ECTOR COUNTY INDEPENDENT SCHOOL DISTRICT NOTES TO THE FINANCIAL STATEMENTS
YEAR ENDED JUNE 30, 2018
N. UNEARNED REVENUES Unearned revenues at year end consisted of the following:
Special DebtGeneral Fund Revenue Funds Service Fund Total
Net Tax Revenue $ 6,295,133 $ - $ 615,244 6,910,377$ Insurance Recovery - 6,123,106 - 6,123,106State Textbook Fund - 273,811 - 273,811Dental 86,470 - - 86,470Project Lead the Way - 56,998 - 56,998Advanced Placement Incentives - 50,124 - 50,124Brown Agriculture Fund - 46,721 - 46,721Education Foundation Awards - 42,612 - 42,612Odessa Regional School Clinic - 27,881 - 27,881Weldon Scholarship Fund - 27,545 - 27,545Title II, Part A Training and Recruiting - 23,069 - 23,069Restitution 23,005 - - 23,005Advanced Via Individual Determination - 21,526 - 21,526Jason's Project Stem - 19,498 - 19,498Ecolab - Lyndon B. Johnson - 10,792 - 10,792ICA Donation - 8,275 - 8,275Existing Debt Allotment - Texas Education Agency - - 7,425 7,425Permian High School Science Giants Award - 4,933 - 4,933First United Methodist Church Donation 2,501 - - 2,501Texas Comptroller LEOSE 2,425 - - 2,425San Jacinto PTA Donation 1,000 1,000Ecolab - Blackshear Elementary - 376 - 376Great Global Project Challenge - 32 - 32
Total 6,410,534$ 6,737,299$ 622,669$ 13,770,502$
O. DUE FROM STATE AND FEDERAL AGENCIES
The District participates in a variety of federal and state programs from which it receives grants to partially or fully finance certain activities. In addition, the District receives entitlements from the State through the School Foundation and Per Capita Programs. Amounts due from federal and state governments as of June 30, 2018, are summarized below.
Fund Name State Entitlements Federal Grants TotalGeneral Fund $ 18,174,219 $ - $ 18,174,219 ESEA Title I, Part A - Improving Basic Programs - 520,670 520,670 IDEA - Part B, Formula - 367,257 367,257 Regional Day School - Deaf 115,864 - 115,864 National School Breakfast and Lunch Program - 66,104 66,104 IDEA - Part B, Preschool - 39,449 39,449 Title IV, Part A Subpart A - 27,688 27,688 ESEA Title III, Part A - English Language Acquisition - 18,019 18,019 Career and Technical Basic Grant - 11,425 11,425 IDEA - Part B, Discretionary Deaf - 4,232 4,232 Prekindergarten Grant - 1,001 1,001 IDEA - Part C, Early Intervention (Deaf) - 98 98
Total $ 18,290,083 $ 1,055,943 $ 19,346,026
60

ECTOR COUNTY INDEPENDENT SCHOOL DISTRICT NOTES TO THE FINANCIAL STATEMENTS
YEAR ENDED JUNE 30, 2018
P. REVENUE FROM LOCAL AND INTERMEDIATE SOURCES During the year ended June 30, 2018, revenues from local and intermediate sources consisted of the following:
Special Debt CapitalGeneral Revenue Service Projects
Fund Fund Fund Fund Total
Property Taxes 127,762,668$ -$ 13,459,072$ -$ 141,221,740$ Penalties, Interest and Other Tax-Related Income 1,994,863 - 209,751 - 2,204,614 Investment Income 438,454 12,524 74,877 2,912 528,767 Food Sales - 4,108,110 - - 4,108,110 Co-Curricular Student Activities 636,349 - - - 636,349 Other 2,232,840 6,278,021 - - 8,510,861
Total 133,065,174$ 10,398,655$ 13,743,700$ 2,912$ 157,210,441$
Q. CONTINGENT LIABILITIES The District participates in numerous federally-funded programs, on both a direct and state pass-through basis, as well as on a service-provider basis. In connection with these grants, the District is required to comply with specific terms and agreements, as well as applicable federal and state laws, and regulations. Such compliance is subject to review and audit by the grantors and their representatives, including audits under the “Single Audit” concept and compliance examinations which build upon such audits. In the opinion of management, the District has materially complied with all requirements. However, such programs are subject to future audit or review, the possibility of disallowed expenditures exists. In the event of such disallowance of claimed expenditures, the District does not expect the resulting liability to have a material adverse effect on its combined financial statements at June 30, 2018. The District is a defendant in various lawsuits. Although the outcome of these lawsuits is not determinable presently, in the opinion of the District’s counsel the resolution of these matters will not have a material adverse effect on the financial statements of the District.
61

ECTOR COUNTY INDEPENDENT SCHOOL DISTRICT NOTES TO THE FINANCIAL STATEMENTS
YEAR ENDED JUNE 30, 2018
R. SHARED SERVICE ARRANGEMENTS The District is the fiscal agent for a Shared Service Arrangement (“SSA”) that provides deaf education to member districts. In addition to the District, other member districts include Midland, Big Spring, Andrews, Monahans, McCamey, Ft. Stockton, Pecos, Reagan County, Coahoma, and Kermit. All services are provided by the fiscal agent. The member districts provide the funds to the fiscal agent. According to guidance provided in TEA’s Resource Guide, the District has accounted for the fiscal agent’s activities of the SSA in Special Revenue Fund 315, 340 and 435 using Model 3 in the SSA section. Expenditures of the SSA are summarized below:
Ector County Independent School District $ 582,455Midland Independent School District 187,888Big Spring Independent School District 93,944Andrews Independent School District 56,367Monahans Independent School District 56,367McCamey Independent School District 37,578Ft. Stockton Independent School District 37,578Pecos Independent School District 18,789Reagan County Independent School District 18,789Coahoma Independent School District 18,789Kermit Independent School District 18,789Total $ 1,127,333
S. CONSTRUCTION COMMITMENT No construction commitments at year ending June 30, 2018.
62

ECTOR COUNTY INDEPENDENT SCHOOL DISTRICT NOTES TO THE FINANCIAL STATEMENTS
YEAR ENDED JUNE 30, 2018
T. NEGATIVE OPERATING GRANTS AND CONTRIBUTIONS - STATEMENT OF ACTIVITIES Expense activity is required to be recorded by districts who are participants in cost-sharing pension and OPEB benefit plans with a special funding situation where non-employer contributing entities (NECE) also participate in contributions to the plans. TRS-retirement and TRS-care benefit plans are both cost-sharing plans with special funding situations. Therefore, on-behalf expense activity of the NECE must be recorded at the government-wide level of reporting on the Statement of Activities in accordance with GASB 68 and 75. During the year under audit, the NECE expense was negative due to changes in benefits within the TRS-care plan. The accrual for the proportionate share of that expense was a negative on-behalf revenue and negative on-behalf expense. This resulted in negative revenue for operating grants and contributions on the Statement of Activities. According to guidance provided directly from GASB, this is the correct reporting. Following are the effects on the Statement of Activities as a result of the negative on-behalf accruals recorded:
Operating Grants and
Contributions
Negative On-Behalf
Accruals
Operating Grants and Contributions
(excluding on-behalf accruals)
11 - Instruction $ (3,517,521) $ (26,441,788) $ 22,924,267 12 - Instructional Resources and Media Services (239,928) (406,831) 166,903 13 - Curriculum and Instructional Staff Development 3,008,557 (1,410,630) 4,419,187 21 - Instructional Leadership (390,122) (733,393) 343,271 23 - School Leadership (1,935,472) (3,334,357) 1,398,885 31 - Guidance, Counseling and Evaluation Services (689,032) (2,010,973) 1,321,941 32 - Social Work Services (9,883) (125,404) 115,521 33 - Health Services (196,108) (432,906) 236,798 34 - Student (Pupil) Transportation (679,057) (1,128,052) 448,995 35 - Food Services 9,268,903 (1,095,583) 10,364,486 36 - Extracurricular Activities (344,683) (572,589) 227,906 41 - General Administration (194,832) (943,520) 748,688 51 - Facilities Maintenance and Operations (540,256) (2,381,448) 1,841,192 52 - Security and Monitoring Services (271,498) (451,015) 179,517 53 - Data Processing Services (420,890) (699,185) 278,295 61 - Community Services 48,017 (166,478) 214,495
$ 2,896,195 $ (42,334,152) $ 45,230,347
63

ECTOR COUNTY INDEPENDENT SCHOOL DISTRICT NOTES TO THE FINANCIAL STATEMENTS
YEAR ENDED JUNE 30, 2018
U. PRIOR PERIOD ADJUSTMENT During fiscal year 2018, the District adopted GASB Statement No. 75 for Accounting and Financial Reporting for Postemployment Benefits Other Than Pensions. With GASB 75, the District must assume their proportionate share of the net postemployment benefits liability other than pensions of the Teachers Retirement System of Texas. Adoption of GASB 75 required a prior period adjustment to report the effect of GASB 75 retroactively. The amount of the prior period adjustment is $(195,322,872). The restated beginning net position for the Governmental Activities is $(38,726,484) and the Primary Government is $(38,726,484). V. SUBSEQUENT EVENT On June 26th, 2018, the Trustees authorized the issuance of up to $20,000,000 of Tax and Revenue Anticipation Note, Taxable Series 2018, with a maturity date of March 31st, 2019 to enable the District, along with other available funds, to pay its current maintenance expenses on a timely basis. Effective July 2nd, 2018 the partnership between Ector County ISD and Ector Success Academy Network, a 501c3 organization, to operate Ector Middle School as an in district charter met all SB 1882 eligibility requirements and became eligible for the benefits outlined in Texas Education Code §11.174. Due to continuing District accountability for student performance at the campus, Foundation School funds, Instructional Materials Allotment funding, attributable to the campus will be accounted for and reported by Ector County ISD, with Senate Bill 1882 funding earned credited to revenue and passed through to the Ector Success Academy Network as an operating transfer. In addition, to assist in funding operational commitments, subsequent to year end, the District advanced funding to the Network, being approved by the Ector County ISD Board in July 2018, to be reimbursed from Senate Bill 1882 funding when received no later than December 31, 2019. The advanced funding being accounted for on the books of the District as a special revenue fund. On August 14th, 2018, the Trustees approved a proposal of a Tax Ratification Election that will result in an increase of approximately $18 million into the District’s 2018-2019 school year budget. The total proposed tax rate is $1.2759 per $100 valuation. The tax rate change includes an increase from the current $1.04 to $1.17 in Maintenance & Operation (M&O) which provides funding for daily operations of the District. Interest and Sinking tax rate remains at a rate of $0.10957. The Tax Ratification Election will be held on November 6th, 2018. The District has evaluated events subsequent to June 30, 2018 through November 13, 2018, the date the financial statements were available to be issued and concluded there are no other events requiring disclosure in the notes or recognition in the financial statements.
64

BUDGETARY COMPARISON REPORTING

EXHIBIT G-1ECTOR COUNTY INDEPENDENT SCHOOL DISTRICT
SCHEDULE OF REVENUES, EXPENDITURES, AND CHANGES IN FUND BALANCEBUDGET AND ACTUAL - GENERAL FUND
FOR THE YEAR ENDED JUNE 30, 2018
Control
Data
CodesOriginal Final
(GAAP BASIS)
(Negative)
Positive or
Final BudgetVariance WithActual Amounts
Budgeted Amounts
REVENUES:133,454,002 129,986,892 133,065,174 (388,828)Total Local and Intermediate Sources $ $ $ $5700113,033,028 109,871,543 112,934,952 (98,076)State Program Revenues5800
3,042,829 2,990,829 2,938,371 (104,458)Federal Program Revenues5900
Total Revenues5020 242,849,264 249,529,859 248,938,497 (591,362)
EXPENDITURES:Current:
140,123,873 144,971,882 136,922,956 3,200,917 Instruction00112,400,245 2,407,403 2,312,522 87,723 Instructional Resources and Media Services00126,521,616 5,943,508 5,604,700 916,916 Curriculum and Instructional Staff Development00134,166,680 3,982,137 4,022,279 144,401 Instructional Leadership0021
18,726,666 17,193,588 17,668,666 1,058,000 School Leadership002311,337,001 10,690,004 11,154,060 182,941 Guidance, Counseling and Evaluation Services0031
654,791 647,666 634,315 20,476 Social Work Services00322,256,479 2,167,221 2,169,723 86,756 Health Services00339,116,460 8,952,824 7,282,887 1,833,573 Student (Pupil) Transportation0034
106,123 102,900 93,311 12,812 Food Services00355,336,395 5,336,395 5,165,355 171,040 Extracurricular Activities00367,759,779 7,182,421 6,725,529 1,034,250 General Administration0041
23,733,460 21,713,728 22,430,485 1,302,975 Facilit ies Maintenance and Operations00512,599,830 2,586,855 2,503,797 96,033 Security and Monitoring Services00525,744,200 5,585,138 5,253,103 491,097 Data Processing Services00531,214,188 1,181,894 1,155,022 59,166 Community Services0061
Debt Service:284,578 191,700 266,118 18,460 Interest on Long Term Debt0072
Capital Outlay:15,000 15,000 15,000 - Facilit ies Acquisition and Construction0081
Intergovernmental:1,600,000 1,600,000 1,544,684 55,316 Other Intergovernmental Charges0099
Total Expenditures6030 242,452,264 243,697,364 232,924,512 10,772,852
1100 397,000 5,832,495 16,013,985 10,181,490 Excess of Revenues Over Expenditures
OTHER FINANCING SOURCES (USES): 65,418 65,418 477,211 411,793 Sale of Real and Personal Property7912
1,397,650 - 1,397,649 (1)Transfers In7915(462,418)(462,418) (308,196) 154,222 Transfers Out (Use)8911
Total Other Financing Sources (Uses) 7080 (397,000) 1,000,650 1,566,664 566,014
1200 Net Change in Fund Balances - 6,833,145 17,580,649 10,747,504
0100 Fund Balance - July 1 (Beginning) 21,312,687 21,312,687 21,312,687 -
3000 Fund Balance - June 30 (Ending) $ 21,312,687 $ 28,145,832 $ 38,893,336 $ 10,747,504
65

REQUIRED SUPPLEMENTARY INFORMATION

SCHEDULE OF THE DISTRICT'S PROPORTIONATE SHARE OF THE NET PENSION LIABILITY
FOR THE YEAR ENDED JUNE 30, 2018
TEACHER RETIREMENT SYSTEM OF TEXAS
ECTOR COUNTY INDEPENDENT SCHOOL DISTRICT
EXHIBIT G-2
FY 2017 Plan Year 2016
FY 2018 Plan Year 2017
FY 2016 Plan Year 2015
FY 2015 Plan Year 2014
0.163010289%District's Proportion of the Net Pension Liability (Asset) 0.1779288% 0.1717072% 0.1256839%
52,121,909 $District's Proportionate Share of Net Pension Liability (Asset) 67,236,631 $ $ 60,696,210 $ 33,571,908
81,929,372 State's Proportionate Share of the Net Pension Liability (Asset) associated with the District
96,003,500 88,961,129 75,916,290
163,240,131$Total $ 134,051,281 $ 149,657,339 109,488,198$
164,691,543 $District's Covered Payroll 162,443,801 $ $ 150,542,332 $ 147,350,185
31.64%District's Proportionate Share of the Net Pension Liability (Asset) as a Percentage of its Covered Payroll
41.39% 40.32% 22.78%
82.17%Plan Fiduciary Net Position as a Percentage of the Total Pension Liability
78.00% 78.43% 83.25%
Note: In accordance with GASB 68, Paragraph 138, only four years of data are presented this reporting period. "The information for all periods for the 10-year schedules that are required to be presented as required supplementary information may not be available initially. In these cases, during the transition period, that information should be presented for as many years as are available. The schedules should not include information that is not measured in accordance with the requirements of this Statement."
Note: GASB 68, Paragraph 81 requires that the information on this schedule be data from the period corresponding with the periods covered as of the measurement dates of August 31, 2017 for year 2018, August 31, 2016 for Year 2017, August 31, 2015 for Year 2016 and August 31, 2014 for 2015.
66

SCHEDULE OF DISTRICT CONTRIBUTIONS FOR PENSIONS
TEACHER RETIREMENT SYSTEM OF TEXAS
FOR FISCAL YEAR 2018
ECTOR COUNTY INDEPENDENT SCHOOL DISTRICT
EXHIBIT G-3
20172018 2016 2015
Contractually Required Contribution 12,555,494 $$ 12,513,674 11,460,548 $ $ 9,932,172
Contribution in Relation to the Contractually Required Contribution (12,555,494)(12,513,674) (11,460,548) (9,932,172)
Contribution Deficiency (Excess)-0-$$ -0- -0-$ -0-$
District's Covered Payroll 164,788,323 $$ 162,515,095 160,914,812 $ $ 149,308,655
Contributions as a Percentage of Covered Payroll 7.61%7.70% 7.12% 6.65%
Note: In accordance with GASB 68, Paragraph 138, only four years of data are presented this reporting period. "The information for all periods for the 10-year schedules that are required to be presented as required supplementary information may not be available initially. In these cases, during the transition period, that information should be presented for as many years as are available. The schedules should not include information that is not measured in accordance with the requirements of this Statement."
Note: GASB 68, Paragraph 81 requires that the data in this schedule be presented as of the District's respective fiscal years as opposed to the time periods covered by the measurement dates ending August 31 of the preceding year.
67

SCHEDULE OF THE DISTRICT'S PROPORTIONATE SHARE OF THE NET OPEB LIABILITY
FOR THE YEAR ENDED JUNE 30, 2018
TEACHER RETIREMENT SYSTEM OF TEXAS
ECTOR COUNTY INDEPENDENT SCHOOL DISTRICT
EXHIBIT G-4
FY 2018 Plan Year 2017
0.25592559%District's Proportion of the Net Liability (Asset) for Other Post Employment Benefits
111,292,438 $District's Proportionate Share of Net Post Employment Benefit Liability (Asset)
126,511,621 State's Proportionate Share of the Net Post Employment Benefit Liability (Asset) associated with the District
Total $ 237,804,059
164,691,543 $District's Covered Payroll
67.58%District's Proportionate Share of the Net OPEB Liability (Asset) as a Percentage of its Covered Payroll
0.91%Plan Fiduciary Net Position as a Percentage of the Total OPEB Liability
This schedule shows only the year for which this information is available. Additional information will be added until 10 years of data are available and reported.
Note: GASB Codification, Vol. 2, P50.238 states that the information on this schedule should be determined as of the measurement date. Therefore the amounts reported for FY 2018 are based on the August 31, 2017 measurement date.
68

SCHEDULE OF DISTRICT CONTRIBUTIONS FOR OTHER POST EMPLOYMENT BENEFITS
TEACHER RETIREMENT SYSTEM OF TEXAS
FOR THE YEAR ENDED JUNE 30, 2018
ECTOR COUNTY INDEPENDENT SCHOOL DISTRICT
EXHIBIT G-5
2018
Contractually Required Contribution 1,056,336 $
Contribution in Relation to the Contractually Required Contribution (1,056,336)
Contribution Deficiency (Excess)$ -0-
District's Covered Payroll 162,515,095 $
Contributions as a Percentage of Covered Payroll 0.65%
Information in this schedule should be provided only for the years where data is available. Eventually 10 years of data should be presented.
Note: GASB Codification, Vol. 2, P50.238 requires that the data in this schedule be presented as of the District's respective fiscal years as opposed to the time periods covered by the measurement dates ending August 31 of the preceding year..
69

ECTOR COUNTY INDEPENDENT SCHOOL DISTRICT
NOTES TO REQUIRED SUPPLEMENTARY INFORMATION FOR THE YEAR ENDED JUNE 30, 2018
A. Notes to Schedules for the TRS Pension
Changes of Benefit terms.
There were no changes of benefit terms that affected measurement of the total pension
liability during the measurement period.
Changes of Assumptions.
There were no changes to the actuarial assumptions or other inputs that affected
measurement of the total pension liability since the prior measurement period.
B. Notes to Schedules for the TRS OPEB Plan
Changes in Benefit.
There were no changes of benefit terms that affected measurement of the Total OPEB
liability during the measurement period.
Changes in Assumptions.
The following were changes to the actuarial assumptions or other inputs that affected
measurement of Total OPEB liability since the prior measurement period:
1. Significant plan changes were adopted during fiscal year ending August 31, 2017.
Effective January 1, 2018, only one health plan option will exist (instead of three),
and all retirees will be required to contribute monthly premiums for coverage.
The health plan changes triggered changes to several of the assumptions, including
participation rates, retirement rates, and spousal participation rates.
2. The August 31, 2016 valuation had assumed that the savings related to the
Medicare Part D reimbursements would phase out by 2022. This assumption was
removed for the August 31, 2017 valuation. Although there is uncertainty
regarding these federal subsidies, the new assumption better reflects the current
substantive plan. This change was unrelated to the plan amendment, and its
impact was included as an assumption change in the reconciliation of the total
OPEB liability. This change significantly lowered the OPEB liability.
3. The discount rate changed from 2.98 percent as of August 31, 2016 to 3.42 percent
as of August 31, 2017. This change lowered the total OPEB liability.
In this valuation the impact of the Cadillac tax has been calculated as a portion of the trend
assumption. Assumptions and methods used to determine the impact of the Cadillac Tax
include:
2018 thresholds of $850/$2,292 were indexed annually by 2.50 percent.
Premium data submitted was not adjusted for permissible exclusions to the
Cadillac Tax.
There were no special adjustments to the dollar limit other than those permissible
for non-Medicare retirees over 55.
70

ECTOR COUNTY INDEPENDENT SCHOOL DISTRICT
NOTES TO REQUIRED SUPPLEMENTARY INFORMATION FOR THE YEAR ENDED JUNE 30, 2018
Results indicate that the value of the excise tax would be reasonably represented by a 25
basis point addition to the long term trend rate assumption.
Future actuarial measurements may differ significantly from the current measurements due
to such factors as the following: plan experience differing from that anticipated by the
economic or demographic assumptions; changes in economic or demographic assumptions;
increases or decreases expected as part of the natural operation of the methodology used
for these measurements; and changes in plan provisions or applicable law.
71

COMBINING SCHEDULES

ECTOR COUNTY INDEPENDENT SCHOOL DISTRICT
COMBINING BALANCE SHEETNONMAJOR GOVERNMENTAL FUNDS
JUNE 30, 2018
Control
Data
Codes
ESEA I, A
Improving
Basic Program Formula
Part B
IDEA
Preschool
Part B
IDEA
Discretionary
Part B
IDEA
211 224 225 226
ASSETS
- 10,932 - - $ $ $ $1110 Cash and Cash Equivalents
- - - - 1120 Investments - Current
367,257 520,670 39,449 - 1240 Receivables from Other Governments
- - - - 1260 Due from Other Funds
- - - - 1300 Inventories
Total Assets1000 531,602 367,257 39,449 - $ $ $ $
LIABILITIES
44,351 82,048 - - $ $ $ $2110 Accounts Payable
322,906 192,674 39,449 - 2170 Due to Other Funds
- 256,880 - - 2200 Accrued Expenditures
- - - - 2300 Unearned Revenues
Total Liabilities2000 531,602 367,257 39,449 -
FUND BALANCES
Nonspendable Fund Balance:
- - - - 3410 Inventories
Restricted Fund Balance:
- - - - 3450 Federal or State Funds Grant Restriction
- - - - 3490 Other Restricted Fund Balance
Committed Fund Balance:
- - - - 3510 Construction
Total Fund Balances3000 - - - -
4000 Total Liabilities and Fund Balances 531,602 367,257 39,449 - $ $ $ $
72

EXHIBIT H-1 (Cont'd)
National
Breakfast and
Basic Grant
Technical -
Career and
Recruiting
Training and
ESEA II,A
Acquisition
English Lang.
Title III, A Medicaid
Admin. Claim
MAC
Other Federal
Special
Revenue Funds
SSA - IDEA C
Deaf - Early
Intervention
SSA
IDEA, Part B
Discretionary
240 244 255 263 272 289 315 340
Lunch Program
- - - 34,222 - - - - $ $ $ $ $ $ $ $
- - - 870,340 - - - -
- 18,019 27,688 66,104 11,425 - 4,232 98
- - - 934,476 - 24,845 - -
- - - 815,485 - - - -
2,720,627 11,425 24,845 18,019 - 27,688 4,232 98 $ $ $ $ $ $ $ $
- 1,435 - 444,763 2,072 1,776 1,350 40 $ $ $ $ $ $ $ $
- 16,584 27,688 - 9,353 - 2,882 58
- - - 52,543 - - - -
- - - - - 23,069 - -
497,306 11,425 24,845 18,019 - 27,688 4,232 98
- - - 815,485 - - - -
- - - 1,407,836 - - - -
- - - - - - - -
- - - - - - - -
2,223,321 - - - - - - -
2,720,627 11,425 24,845 18,019 - 27,688 4,232 98 $ $ $ $ $ $ $ $
73

ECTOR COUNTY INDEPENDENT SCHOOL DISTRICT
COMBINING BALANCE SHEETNONMAJOR GOVERNMENTAL FUNDS
JUNE 30, 2018
Control
Data
Codes
Advanced
Placement
Incentives Fund
Textbook
State
Revenue Funds
Special
Other State
School - Deaf
Regional Day
SSA
397 410 429 435
ASSETS
- - - - Cash and Cash Equivalents $ $ $ $1110
- - - - Investments - Current1120
- - 1,001 115,864 Receivables from Other Governments1240
279,805 50,124 - - Due from Other Funds1260
- - - - Inventories1300
Total Assets1000 50,124 279,805 1,001 115,864 $ $ $ $
LIABILITIES
5,994 - 679 3,716 Accounts Payable $ $ $ $2110
- - 322 110,168 Due to Other Funds2170
- - - 1,980 Accrued Expenditures2200
273,811 50,124 - - Unearned Revenues2300
Total Liabilities2000 50,124 279,805 1,001 115,864
FUND BALANCES
Nonspendable Fund Balance:
- - - - Inventories3410
Restricted Fund Balance:
- - - - Federal or State Funds Grant Restriction3450
- - - - Other Restricted Fund Balance3490
Committed Fund Balance:
- - - - Construction3510
Total Fund Balances3000 - - - -
4000 Total Liabilities and Fund Balances 50,124 279,805 1,001 115,864 $ $ $ $
74

EXHIBIT H-1 (Cont'd)
PICK
Ecolab
Elementera
Johnson
Challenge
Project
Great Global
Awards
Foundation
Education Citi
Foundation
Award
Blackshear
Ecolab
Barbara
Jordan
Trust
Brown
Agriculture
Fund
478 479 480 482 483 486 489 490
Education
- - - - - - - - $ $ $ $ $ $ $ $
- - - - - - 50,731 686
- - - - - - - -
21,526 46,010 376 30 12,866 32 - 1,703
- - - - - - - -
30 12,866 32 46,010 21,526 376 50,731 2,389 $ $ $ $ $ $ $ $
- 3,398 - 30 2,074 - - - $ $ $ $ $ $ $ $
- - - - - - 3,100 -
- - - - - - - -
21,526 42,612 376 - 10,792 32 46,721 -
30 12,866 32 46,010 21,526 376 49,821 -
- - - - - - - -
- - - - - - - -
- - - - - - 910 2,389
- - - - - - - -
- - - - - - 910 2,389
30 12,866 32 46,010 21,526 376 50,731 2,389 $ $ $ $ $ $ $ $
75

ECTOR COUNTY INDEPENDENT SCHOOL DISTRICT
COMBINING BALANCE SHEETNONMAJOR GOVERNMENTAL FUNDS
JUNE 30, 2018
Control
Data
Codes
OHS
Scholarship
Fund STEM
Project
Jason's
Fund
Donation
ICA
The Way
Project Lead
Chevron
491 492 493 494
ASSETS
- - - - Cash and Cash Equivalents $ $ $ $1110
- 25,342 - - Investments - Current1120
- - - - Receivables from Other Governments1240
19,498 - 20,429 61,928 Due from Other Funds1260
- - - - Inventories1300
Total Assets1000 25,342 19,498 20,429 61,928 $ $ $ $
LIABILITIES
- - 12,154 4,930 Accounts Payable $ $ $ $2110
- - - - Due to Other Funds2170
- - - - Accrued Expenditures2200
19,498 - 8,275 56,998 Unearned Revenues2300
Total Liabilities2000 - 19,498 20,429 61,928
FUND BALANCES
Nonspendable Fund Balance:
- - - - Inventories3410
Restricted Fund Balance:
- - - - Federal or State Funds Grant Restriction3450
- 25,342 - - Other Restricted Fund Balance3490
Committed Fund Balance:
- - - - Construction3510
Total Fund Balances3000 25,342 - - -
4000 Total Liabilities and Fund Balances 25,342 19,498 20,429 61,928 $ $ $ $
76

EXHIBIT H-1 (Cont'd)
Odessa
Regional
Fund
Scholarship
Weldon
Award
Science Giant
PHS
Revenue Funds
Special
Nonmajor Security
Infra-
Structure
2013 Bond
Construction
Fund
2015
Capital
Projects
2013 Main
Projects
Fund
496 497 498 Total 671 679 681 686
School Clinic
- 45,154 - - - - - - $ $ $ $ $ $ $ $
- 975,163 - - 28,064 - - -
- 1,171,807 - - - - - -
- 1,506,462 - 27,881 - 4,933 - -
- 815,485 - - - - - -
27,881 28,064 4,933 4,514,071 - - - - $ $ $ $ $ $ $ $
- 610,810 - - - - - - $ $ $ $ $ $ $ $
- 725,184 - - - - - -
- 311,403 - - - - - -
- 614,193 - 27,881 27,545 4,933 - -
27,881 27,545 4,933 2,261,590 - - - -
- 815,485 - - - - - -
- 1,407,836 - - - - - -
- 29,160 - - 519 - - -
- - - - - - - -
- 519 - 2,252,481 - - - -
27,881 28,064 4,933 4,514,071 - - - - $ $ $ $ $ $ $ $
77

EXHIBIT H-1ECTOR COUNTY INDEPENDENT SCHOOL DISTRICT
COMBINING BALANCE SHEETNONMAJOR GOVERNMENTAL FUNDS
JUNE 30, 2018
Control
Data
Codes
Crockett
Flooring
Fund Project Funds
Capital
Nonmajor
Funds
Governmental
Nonmajor
687 Total Total
ASSETS
- - 45,154 Cash and Cash Equivalents $ $ $1110
- - 975,163 Investments - Current1120
- - 1,171,807 Receivables from Other Governments1240
142,510 142,510 1,648,972 Due from Other Funds1260
- - 815,485 Inventories1300
Total Assets1000 142,510 142,510 4,656,581 $ $ $
LIABILITIES
- - 610,810 Accounts Payable $ $ $2110
- - 725,184 Due to Other Funds2170
- - 311,403 Accrued Expenditures2200
- - 614,193 Unearned Revenues2300
Total Liabilities2000 - - 2,261,590
FUND BALANCES
Nonspendable Fund Balance:
- - 815,485 Inventories3410
Restricted Fund Balance:
- - 1,407,836 Federal or State Funds Grant Restriction3450
- - 29,160 Other Restricted Fund Balance3490
Committed Fund Balance:
142,510 142,510 142,510 Construction3510
Total Fund Balances3000 142,510 142,510 2,394,991
4000 Total Liabilities and Fund Balances 142,510 142,510 4,656,581 $ $ $
78

ECTOR COUNTY INDEPENDENT SCHOOL DISTRICT
COMBINING STATEMENT OF REVENUES, EXPENDITURES AND CHANGES INFUND BALANCES - NONMAJOR GOVERNMENTAL FUNDS
FOR THE YEAR ENDED JUNE 30, 2018
Control
Data
Codes
ESEA I, A
Improving
Basic Program Formula
Part B
IDEA
Preschool
Part B
IDEA
Discretionary
Part B
IDEA
211 224 225 226
REVENUES: - - - - Total Local and Intermediate Sources5700 $ $ $ $ - - - - State Program Revenues5800
5,319,622 6,251,669 136,763 2,889 Federal Program Revenues5900
Total Revenues5020 6,251,669 5,319,622 136,763 2,889
EXPENDITURES:
Current:5,083,700 3,489,753 136,763 2,889 Instruction0011
- - - - Instructional Resources and Media Services001247,810 2,483,197 - - Curriculum and Instructional Staff Development0013
- 4,279 - - Instructional Leadership0021 - 35,995 - - School Leadership0023
188,112 90,067 - - Guidance, Counseling and Evaluation Services0031 - 65,607 - - Social Work Services0032 - - - - Health Services0033 - - - - Food Services0035 - - - - General Administration0041 - 131 - - Facilities Maintenance and Operations0051 - - - - Data Processing Services0053 - 82,640 - - Community Services0061
Capital Outlay: - - - - Facilities Acquisition and Construction0081
Total Expenditures6030 6,251,669 5,319,622 136,763 2,889
1100 Excess (Deficiency) of Revenues Over (Under) Expenditures
- - - -
OTHER FINANCING SOURCES (USES): - - - - Sale of Real and Personal Property7912 - - - - Transfers In7915 - - - - Transfers Out (Use)8911
Total Other Financing Sources (Uses) 7080 - - - -
1200 Net Change in Fund Balance - - - -
0100 Fund Balance - July 1 (Beginning) - - - -
3000 Fund Balance - June 30 (Ending) $ - $ - $ - $ -
79

EXHIBIT H-2 (Cont'd)
National
Breakfast and
Lunch Program Basic Grant
Technical -
Career and
RecruitingTraining and
ESEA II,A
Acquisition
English Lang.
Title III, A
240 244 255 263 340
SSA - IDEA C
Deaf - Early
Intervention
315
SSA
IDEA, Part B
Discretionary
289
Other Federal
Special
Revenue Funds
272
Medicaid
Admin. Claim
MAC
- 4,130,951 - - - - - - $ $ $ $ $ $ $ $ - 343,068 - - - - - -
282,079 10,720,651 760,007 430,261 2,425 77,883 102,436 63,817
15,194,670 282,079 760,007 430,261 2,425 77,883 102,436 63,817
40,041 - - 157,865 2,425 74,291 27,494 - - - - - - - - - - - 755,452 252,163 - 3,592 64,091 - - - 609 7,051 - - 4,922 - - - 3,946 - - - - -
242,038 - - - - - - -
- - - - - - - - - - - - - - - 63,817 - 14,529,715 - - - - - - - - - - - - - - - 1,276,837 - - - - - - - - - - - - - - - - - 13,182 - - 5,929 -
- - - - - - - -
15,806,552 282,079 760,007 430,261 2,425 77,883 102,436 63,817
(611,882) - - - - - - -
- 4,117 - - - - - - - - - - - - - - - - - - - - - -
4,117 - - - - - - -
(607,765) - - - - - - -
2,831,086 - - - - - - -
$ 2,223,321 $ - $ - $ - $ - $ - $ - $ -
80

ECTOR COUNTY INDEPENDENT SCHOOL DISTRICT
COMBINING STATEMENT OF REVENUES, EXPENDITURES AND CHANGES INFUND BALANCES - NONMAJOR GOVERNMENTAL FUNDS
FOR THE YEAR ENDED JUNE 30, 2018
Control
Data
Codes
Advanced
Placement
Incentives Fund
Textbook
State
Revenue Funds
Special
Other State
School - Deaf
Regional Day
SSA
397 410 429 435
REVENUES: - - - 394,980 Total Local and Intermediate Sources5700 $ $ $ $
63,178 15,353 348,777 343,849 State Program Revenues5800 - - - - Federal Program Revenues5900
Total Revenues5020 15,353 63,178 348,777 738,829
EXPENDITURES:
Current:63,178 - 178,353 944,459 Instruction0011
- - - - Instructional Resources and Media Services0012 - 15,353 124,509 19,040 Curriculum and Instructional Staff Development0013 - - - - Instructional Leadership0021 - - 5,316 69,315 School Leadership0023 - - - 2,378 Guidance, Counseling and Evaluation Services0031 - - - - Social Work Services0032 - - - - Health Services0033 - - - - Food Services0035 - - - 9,731 General Administration0041 - - 20,693 - Facilities Maintenance and Operations0051 - - - - Data Processing Services0053 - - 19,906 2,102 Community Services0061
Capital Outlay: - - - - Facilities Acquisition and Construction0081
Total Expenditures6030 15,353 63,178 348,777 1,047,025
1100 Excess (Deficiency) of Revenues Over (Under) Expenditures
- - - (308,196)
OTHER FINANCING SOURCES (USES): - - - - Sale of Real and Personal Property7912 - - - 308,196 Transfers In7915 - - - - Transfers Out (Use)8911
Total Other Financing Sources (Uses) 7080 - - - 308,196
1200 Net Change in Fund Balance - - - -
0100 Fund Balance - July 1 (Beginning) - - - -
3000 Fund Balance - June 30 (Ending) $ - $ - $ - $ -
81

EXHIBIT H-2 (Cont'd)
PICK
Education Ecolab
Elementera
Johnson
Challenge
Project
Great Global
Awards
Foundation
Education
478 479 480 482 490
Barbara
Jordan
Trust
489
Brown
Agriculture
Fund
486
Blackshear
Ecolab
483
Citi
Foundation
Award
32,821 20,000 1,468 106,012 449 499 - 522 $ $ $ $ $ $ $ $ - - - - - - - - - 8,000 - - - - - -
28,000 32,821 1,468 106,012 449 499 - 522
30,686 - 1,468 89,868 - - - - - - - 1,866 - - - - - - - 7,778 - - - - - 28,000 - 6,500 - - - -
2,135 - - - - - - - - - - - - - - 522
- - - - - - - - - - - - - - - - - - - - - - - - - - - - - - - - - - - - - - - - - - - - - - - - - - - - - - - -
- - - - - - - -
28,000 32,821 1,468 106,012 - - - 522
- - - - - - 499 449
- - - - - - - - - - - - - - - - - - - - - - - -
- - - - - - - -
- - - - - - 499 449
- - - - - - 411 1,940
2,389 $910 $ - $ - $ - $ - $ - $ - $
82

ECTOR COUNTY INDEPENDENT SCHOOL DISTRICT
COMBINING STATEMENT OF REVENUES, EXPENDITURES AND CHANGES INFUND BALANCES - NONMAJOR GOVERNMENTAL FUNDS
FOR THE YEAR ENDED JUNE 30, 2018
Control
Data
Codes
OHS
Scholarship
Fund STEM
Project
Jason's
Fund
Donation
ICA
The Way
Project Lead
Chevron
491 492 493 494
REVENUES:93,238 3,978 94,952 41,545 Total Local and Intermediate Sources5700 $ $ $ $
- - - - State Program Revenues5800 - - - - Federal Program Revenues5900
Total Revenues5020 3,978 93,238 94,952 41,545
EXPENDITURES:
Current:12,500 - 91,409 23,632 Instruction0011
- - 3,108 - Instructional Resources and Media Services001280,738 - - 16,782 Curriculum and Instructional Staff Development0013
- - - - Instructional Leadership0021 - - 435 1,131 School Leadership0023 - - - - Guidance, Counseling and Evaluation Services0031 - - - - Social Work Services0032 - - - - Health Services0033 - - - - Food Services0035 - - - - General Administration0041 - - - - Facilities Maintenance and Operations0051 - - - - Data Processing Services0053 - 3,750 - - Community Services0061
Capital Outlay: - - - - Facilities Acquisition and Construction0081
Total Expenditures6030 3,750 93,238 94,952 41,545
1100 Excess (Deficiency) of Revenues Over (Under) Expenditures
228 - - -
OTHER FINANCING SOURCES (USES): - - - - Sale of Real and Personal Property7912 - - - - Transfers In7915 - - - - Transfers Out (Use)8911
Total Other Financing Sources (Uses) 7080 - - - -
1200 Net Change in Fund Balance
0100 Fund Balance - July 1 (Beginning)
3000 Fund Balance - June 30 (Ending)
228 - - -
-
- $
-
$ -
-
$ -
25,114
$ 25,342
83

EXHIBIT H-2 (Cont'd)
Odessa
Regional
School Clinic Fund
Scholarship
Weldon
Award
Science Giant
PHS
Revenue Funds
Special
Nonmajor
496 497 498 Total 686
2015
Capital
Projects
681
2013 Main
Projects
Fund
679
2013 Bond
Construction
Fund
671
Security
Infra-
Structure
176 673 - 4,922,264 - - 2,912 - $ $ $ $ $ $ $ $ - - - 1,114,225 - - - - - - - 24,158,502 - - - -
673 176 - 30,194,991 - - 2,912 -
- - - 10,450,774 - - 22,179 - - - - 4,974 - - - - - - - 3,870,505 - - - - - - - 51,361 - - - - - - - 118,273 - - - - - - - 523,117 - - - -
- - - 65,607 - - - - - 673 - 64,490 - - - - - - - 14,529,715 - - - - - - - 9,731 - - - - - - - 1,297,661 649,408 30,759 - - - - - - 61,196 - - 60,577 - - - 127,509 - - - -
- - - - 39,746 - 31,835 -
673 - - 31,113,717 750,350 30,759 54,014 60,577
- 176 - (918,726) (60,577) (51,102) (30,759) (750,350)
- - - 4,117 - - - - - - - 308,196 - - - - - - - - (1,197,002)(51,336)(149,311) -
- - - 312,313 (1,197,002)(51,336)(149,311) -
- 176 - (606,413) (60,577) (200,413) (82,095) (1,947,352)
- 343 - 2,858,894 60,577 200,413 82,095 1,947,352
$ - $ - $ - $ - $ 2,252,481 $ - $ 519 $ -
84

EXHIBIT H-2ECTOR COUNTY INDEPENDENT SCHOOL DISTRICT
COMBINING STATEMENT OF REVENUES, EXPENDITURES AND CHANGES INFUND BALANCES - NONMAJOR GOVERNMENTAL FUNDS
FOR THE YEAR ENDED JUNE 30, 2018
Control
Data
Codes
Crockett
Flooring
Fund Project Funds
Capital
Nonmajor
Funds
Governmental
Nonmajor
687 Total Total
REVENUES:2,912 - 4,925,176 Total Local and Intermediate Sources5700 $ $ $
- - 1,114,225 State Program Revenues5800 - - 24,158,502 Federal Program Revenues5900
Total Revenues5020 - 2,912 30,197,903
EXPENDITURES:
Current:22,179 - 10,472,953 Instruction0011
- - 4,974 Instructional Resources and Media Services0012 - - 3,870,505 Curriculum and Instructional Staff Development0013 - - 51,361 Instructional Leadership0021 - - 118,273 School Leadership0023 - - 523,117 Guidance, Counseling and Evaluation Services0031 - - 65,607 Social Work Services0032 - - 64,490 Health Services0033 - - 14,529,715 Food Services0035 - - 9,731 General Administration0041
829,657 149,490 2,127,318 Facilities Maintenance and Operations0051121,773 - 121,773 Data Processing Services0053
- - 127,509 Community Services0061
Capital Outlay:71,581 - 71,581 Facilities Acquisition and Construction0081
Total Expenditures6030 149,490 1,045,190 32,158,907
1100 Excess (Deficiency) of Revenues Over (Under) (149,490) (1,042,278) (1,961,004) Expenditures
OTHER FINANCING SOURCES (USES): - - 4,117 Sale of Real and Personal Property7912 - - 308,196 Transfers In7915
(1,397,649) - (1,397,649)Transfers Out (Use)8911
Total Other Financing Sources (Uses) 7080 - (1,397,649) (1,085,336)
1200 Net Change in Fund Balance
0100 Fund Balance - July 1 (Beginning)
3000 Fund Balance - June 30 (Ending)
(149,490) (2,439,927) (3,046,340)
292,000
$ 142,510
2,582,437
$ 142,510
5,441,331
$ 2,394,991
85

COMBINING SCHEDULES – INTERNAL SERVICE FUNDS

EXHIBIT H-3ECTOR COUNTY INDEPENDENT SCHOOL DISTRICT
COMBINING STATEMENT OF NET POSITIONINTERNAL SERVICE FUNDS
JUNE 30, 2018
Chancellor
Killion
Housing Fund
Compensation
Worker's
Fund
Trust
Medical
Service Funds
Internal
Total
772715 771
ASSETSCurrent Assets:
- 119,919 1,010,298 1,130,217 Cash and Cash Equivalents $ $ $ $7,229,109 - 9,115,267 16,344,376 Investments - Current
119,919 7,229,109 10,125,565 17,474,593 Total Current Assets
Noncurrent Assets:
Capital Assets:
- 54,012 - 54,012 Land - 3,663,335 - 3,663,335 Buildings and Improvements - (226,191) - (226,191)Depreciation on Buildings
3,491,156 - - 3,491,156 Total Noncurrent Assets
Total Assets 3,611,075 7,229,109 10,125,565 20,965,749
LIABILITIESCurrent Liabilities:
- 4,139 117,618 121,757 Accounts Payable710,496 20,842 - 731,338 Due to Other Funds
716,761 - 2,242,651 2,959,412 Accrued Expenses
24,981 1,427,257 2,360,269 3,812,507 Total Current Liabilities
NonCurrent Liabilities:
2,301,834 - - 2,301,834 Other Long-Term Debt - Due in More than One Year
- 2,301,834 - 2,301,834 Total Noncurrent Liabilities
Total Liabilities 24,981 3,729,091 2,360,269 6,114,341
NET POSITION3,500,018 3,586,094 7,765,296 14,851,408 Unrestricted Net Position
Total Net Position 3,586,094 3,500,018 7,765,296 14,851,408 $ $ $ $
86

EXHIBIT H-4ECTOR COUNTY INDEPENDENT SCHOOL DISTRICT
COMBINING STATEMENT OF REVENUES, EXPENSES AND CHANGES IN FUND NET POSITIONINTERNAL SERVICE FUNDS
FOR THE YEAR ENDED JUNE 30, 2018
Chancellor
Killion
Housing Fund
Compensation
Worker's
Fund
Trust
Medical
Service Funds
Internal
Total
772715 771
OPERATING REVENUES:
888,336 - 25,665,709 26,554,045 Employee and Employer Premiums $ $ $ $ - 251,122 - 251,122 Rent Revenue
7,167 - 331,724 338,891 Stop Loss Reimbursement
Total Operating Revenues 251,122 895,503 25,997,433 27,144,058
OPERATING EXPENSES:
970,782 - 21,986,139 22,956,921 Claims and Prescriptions56,535 178,850 33,000 268,385 Professional and Contracted Services
- 5,966 - 5,966 Supplies and Materials - 16,149 2,663,547 2,679,696 Other Operating Costs - 87,004 - 87,004 Depreciation Expense
Total Operating Expenses 287,969 1,027,317 24,682,686 25,997,972
Operating Income (Loss) (36,847) (131,814) 1,314,747 1,146,086
NONOPERATING REVENUES (EXPENSES):
92,383 - 70,911 163,294 Earnings from Temporary Deposits & Investments
Total Nonoperating Revenues (Expenses) - 92,383 70,911 163,294
Change in Net Position
Total Net Position - July 1 (Beginning)
Total Net Position June 30 (Ending)
(36,847)
3,622,941
$ 3,586,094
(39,431)
3,539,449
$ 3,500,018
1,385,658
6,379,638
$ 7,765,296
1,309,380
13,542,028
$ 14,851,408
87

EXHIBIT H-5ECTOR COUNTY INDEPENDENT SCHOOL DISTRICT
COMBINING STATEMENT OF CASH FLOWS
FOR THE YEAR ENDED JUNE 30, 2018INTERNAL SERVICE FUNDS
Chancellor Worker's Medical Total
Killion Compensation Trust Internal
Housing Fund Fund Service Funds
715 771 772
Cash Flows from Operating Activities:
- 271,964 - 271,964 Cash Received from Rental Receipts $ $ $ $
1,013,920 - 29,596,801 30,610,721 Cash Received from Employees and Employer7,167 - 331,724 338,891 Cash Received from Stop Loss Carrier
(879,477) - (22,054,708) (22,934,185)Cash Payments for Claims(56,535)(201,919) (3,274,561) (3,533,015)Other Payments
70,045 Net Cash Provided by Operating
85,075 4,599,256 4,754,376 Activities
Cash Flows from Investing Activities:
92,383 - 70,911 163,294 Interest and Dividends on Investments
Net Increase in Cash and Cash Equivalents 70,045 177,458 4,670,167 4,917,670
Cash and Cash Equivalents at Beginning of Year 49,874 7,051,651 5,455,398 12,556,923
Cash and Cash Equivalents at End of Year 119,919 7,229,109 10,125,565 17,474,593 $ $ $ $
Operating Income (Loss): $ $ $ $
Reconciliation of Operating Income (Loss) to Net Cash
Provided by Operating Activities:
(36,847) (131,814) 1,314,747 1,146,086
to Net Cash Provided by Operating Activities:Adjustments to Reconcile Operating Income
- 87,004 - 87,004 Depreciation
Assets and Liabilities:Effect of Increases and Decreases in Current
125,584 20,842 3,931,092 4,077,518 Increase in Due to Other Funds - (954) (578,014) (578,968)Decrease in Accounts Payable
91,305 - (68,569) 22,736 Changes in Accrued ExpensesNet Cash Provided by Operating
85,075 4,599,256 4,754,376 Activities 70,045 $ $ $ $
88
REQUIRED TEA SCHEDULES

ECTOR COUNTY INDEPENDENT SCHOOL DISTRICT
SCHEDULE OF DELINQUENT TAXES RECEIVABLE
FISCAL YEAR ENDED JUNE 30, 2018
Last 10 Years Tax Rates
Debt ServiceMaintenance Tax Purposes
Value for School
Assessed/Appraised
(1) (2) (3)
$Various$Various 9,273,311,000 and prior years2009 $
0.0886001.040000 9,000,890,000 2010
0.0950001.040000 9,565,177,000 2011
0.0950001.040000 10,232,624,000 2012
0.0795001.040000 11,598,844,880 2013
0.1210001.040000 13,401,694,166 2014
0.1210001.040000 14,256,078,650 2015
0.1100001.040000 13,190,683,066 2016
0.1100001.040000 11,855,872,243 2017
0.1095691.040000 12,190,897,339 (School year under audit)2018
1000 TOTALS
89

EXHIBIT J-1
7/1/2017
Balance
Beginning
Total Levy
Year's
Current
(20)(10) (50)
Ending
Balance
6/30/2018
(40)
Entire
Year's
Adjustments
(31)
Maintenance
Collections
(32)
Debt Service
Collections
- 2,700,562 50,041 (384,697)$ $ $ $ $ 2,261,840 $ 3,984
- 395,423 16,027 (319) 377,712 1,365
- 423,761 20,622 (952) 400,303 1,884
- 660,969 35,908 (865) 620,916 3,280
- 551,460 92,625 16,545 468,299 7,081
- 1,019,328 199,213 60,989 857,931 23,173
- 1,842,755 406,490 74,957 1,445,327 65,895
- 3,136,410 1,262,378 91,100 1,831,537 133,595
- 5,654,229 2,610,328 (217,389) 2,550,267 276,245
140,142,774 - 123,049,701 473,184 4,604,351 12,961,906
$ 15,418,483 $ 112,553 $ 127,743,333 $ 140,142,774 $ 16,384,897 $ 13,478,408
90

EXHIBIT J-4ECTOR COUNTY INDEPENDENT SCHOOL DISTRICT
SCHEDULE OF REVENUES, EXPENDITURES, AND CHANGES IN FUND BALANCE
BUDGET AND ACTUAL - CHILD NUTRITION PROGRAM
FOR THE YEAR ENDED JUNE 30, 2018
Control
Data
CodesOriginal Final
(GAAP BASIS)
(Negative)
Positive or
Final BudgetVariance WithActual Amounts
Budgeted Amounts
REVENUES:4,675,000 4,675,000 4,130,951 (544,049)Total Local and Intermediate Sources $ $ $ $5700
370,000 370,000 343,068 (26,932)State Program Revenues5800
11,545,000 11,545,000 10,720,651 (824,349)Federal Program Revenues5900
Total Revenues5020 16,590,000 16,590,000 15,194,670 (1,395,330)
EXPENDITURES:15,313,453 15,313,453 14,529,715 783,738 Food Services0035
1,276,547 1,276,547 1,276,837 (290)Facilities Maintenance and Operations0051
Total Expenditures6030 16,590,000 16,590,000 15,806,552 783,448
1100 Excess (Deficiency) of Revenues Over (Under) Expenditures
- - (611,882) (611,882)
OTHER FINANCING SOURCES (USES): - - 4,117 4,117 Sale of Real and Personal Property7912
1200 Net Change in Fund Balances - - (607,765) (607,765)
0100 Fund Balance - July 1 (Beginning) 2,831,086 2,831,086 2,831,086 -
3000 Fund Balance - June 30 (Ending) $ 2,831,086 $ 2,831,086 $ 2,223,321 $ (607,765)
91

EXHIBIT J-5ECTOR COUNTY INDEPENDENT SCHOOL DISTRICT
SCHEDULE OF REVENUES, EXPENDITURES, AND CHANGES IN FUND BALANCE
BUDGET AND ACTUAL - DEBT SERVICE FUND
FOR THE YEAR ENDED JUNE 30, 2018
Control
Data
CodesOriginal Final
(GAAP BASIS)
(Negative)
Positive or
Final BudgetVariance WithActual Amounts
Budgeted Amounts
REVENUES:13,737,727 13,353,727 13,743,700 5,973 Total Local and Intermediate Sources $ $ $ $5700
270,897 281,897 302,377 31,480 State Program Revenues5800
Total Revenues5020 13,635,624 14,008,624 14,046,077 37,453
EXPENDITURES:
Debt Service:3,530,430 3,530,430 3,530,430 - Principal on Long Term Debt0071
11,249,264 11,249,264 11,249,264 - Interest on Long Term Debt0072
9,800 9,800 9,248 552 Bond Issuance Cost and Fees0073
Total Expenditures6030 14,789,494 14,789,494 14,788,942 552
1200 Net Change in Fund Balances (1,153,870) (780,870) (742,865) 38,005
0100 Fund Balance - July 1 (Beginning) 13,013,721 13,013,721 13,013,721 -
3000 Fund Balance - June 30 (Ending) $ 11,859,851 $ 12,232,851 $ 12,270,856 $ 38,005
92

FEDERAL AWARDS SECTION

93
Independent Auditors’ Report on Internal Control Over Financial
Reporting and on Compliance and Other Matters Based on an Audit of
Financial Statements Performed in Accordance With Government
Auditing Standards
Board of Trustees
Ector County Independent School District
802 N. Sam Houston
Odessa, TX 79761
We have audited, in accordance with the auditing standards generally accepted in the United States of
America and the standards applicable to financial audits contained in Government Auditing Standards
issued by the Comptroller General of the United States, the financial statements of the Ector County
Independent School District (the “District”), as of and for the year ended June 30, 2018, and the related
notes to the financial statements, which collectively comprise the District’s basic financial statements, and
have issued our report thereon dated November 13, 2018.
Internal Control Over Financial Reporting
In planning and performing our audit of the financial statements, we considered the District's internal
control over financial reporting (internal control) to determine the audit procedures that are appropriate in
the circumstances for the purpose of expressing our opinion on the financial statements, but not for the
purpose of expressing an opinion on the effectiveness of the District’s internal control. Accordingly, we do
not express an opinion on the effectiveness of the District’s internal control.
A deficiency in internal control exists when the design or operation of a control does not allow management
or employees, in the normal course of performing their assigned functions, to prevent, or detect and correct,
misstatements on a timely basis. A material weakness is a deficiency, or a combination of deficiencies, in
internal control, such that there is a reasonable possibility that a material misstatement of the District’s
financial statements will not be prevented, or detected and corrected on a timely basis. A significant
deficiency is a deficiency, or a combination of deficiencies, in internal control that is less severe than a
material weakness, yet important enough to merit attention by those charged with governance.
Our consideration of internal control was for the limited purpose described in the first paragraph of this
section and was not designed to identify all deficiencies in internal control that might be material
weaknesses or significant deficiencies. Given these limitations, during our audit we did not identify any
deficiencies in internal control that we consider to be material weaknesses. However, material weaknesses
may exist that have not been identified.
2626 JBS Parkway Two Fasken Center 225 East Bender Boulevard
Suite A-200 550 West Texas Avenue P. O. Drawer 220
Odessa, Texas 79761 Midland, Texas 79701 Hobbs, New Mexico 88241
(432) 362-3800 (432) 683-1835 (575) 393-2171
www.jmcpa.com
JOHNSON, MILLER & CO., CPA’s PC Certified Public Accountants A Professional Corporation
An Independent Member of BDO Alliance USA

94
Compliance and Other Matters
As part of obtaining reasonable assurance about whether the District's financial statements are free from
material misstatement, we performed tests of its compliance with certain provisions of laws, regulations,
contracts, and grant agreements, noncompliance with which could have a direct and material effect on the
determination of financial statement amounts. However, providing an opinion on compliance with those
provisions was not an objective of our audit, and accordingly, we do not express such an opinion. The
results of our tests disclosed no instances of noncompliance or other matters that are required to be reported
under Government Auditing Standards.
We noted certain matters that we have reported to management of the District in a separate letter dated
November 13, 2018.
Other Matter
We performed tests designed to verify the District’s compliance with the requirements of the Texas Public
Funds Investments Act. During the year ended June 30, 2018, no instances of noncompliance were found.
Purpose of this Report
The purpose of this report is solely to describe the scope of our testing of internal control and compliance
and the results of that testing, and not to provide an opinion on the effectiveness of the District’s internal
control or on compliance. This report is an integral part of an audit performed in accordance with
Government Auditing Standards in considering the District’s internal control and compliance. Accordingly,
this communication is not suitable for any other purpose.
Odessa, Texas
November 13, 2018

95 .
Independent Auditors’ Report on Compliance
For Each Major Federal Program and
Report on Internal Control Over Compliance
Required by the Uniform Guidance
Board of Trustees
Ector County Independent School District
802 N. Sam Houston
Odessa, TX 79761
Report on Compliance for Each Major Federal Program
We have audited the Ector County Independent School District’s (the “District”) compliance with the types
of compliance requirements described in the OMB Compliance Supplement that could have a direct and
material effect on each of the District’s major federal programs for the year ended June 30, 2018. The
District’s major federal programs are identified in the summary of auditor’s results section of the
accompanying schedule of findings and questioned costs.
Management’s Responsibility
Management is responsible for compliance with federal statutes, regulations, and the terms and conditions
of its federal awards applicable to its federal programs.
Auditors’ Responsibility
Our responsibility is to express an opinion on compliance for each of the District’s major federal programs
based on our audit of the types of compliance requirements referred to above. We conducted our audit of
compliance in accordance with auditing standards generally accepted in the United States of America; the
standards applicable to financial audits contained in Government Auditing Standards, issued by the
Comptroller General of the United States; and the audit requirements of Title 2 U.S. Code of Federal
Regulations Part 200, Uniform Administrative Requirements, Cost Principles, and Audit Requirements for
Federal Awards (Uniform Guidance). Those standards and the Uniform Guidance require that we plan and
perform the audit to obtain reasonable assurance about whether noncompliance with the types of
compliance requirements referred to above that could have a direct and material effect on a major federal
program occurred. An audit includes examining, on a test basis, evidence about the District’s compliance
with those requirements and performing such other procedures as we considered necessary in the
circumstances. We believe that our audit provides a reasonable basis for our opinion on compliance for
each major federal program. However, our audit does not provide a legal determination of the District’s
compliance.
2626 JBS Parkway Two Fasken Center 225 East Bender Boulevard
Suite A-200 550 West Texas Avenue P. O. Drawer 220
Odessa, Texas 79761 Midland, Texas 79701 Hobbs, New Mexico 88241
(432) 362-3800 (432) 683-1835 (575) 393-2171
www.jmcpa.com
JOHNSON, MILLER & CO., CPA’s PC Certified Public Accountants A Professional Corporation
An Independent Member of BDO Alliance USA

96 .
Opinion on Each Major Federal Program
In our opinion, the District complied, in all material respects, with the types of compliance requirements
referred to above that could have a direct and material effect on each of its major federal programs for the
year ended June 30, 2018.
Report on Internal Control Over Compliance
Management of the District is responsible for establishing and maintaining effective internal control over
compliance with the types of compliance requirements referred to above. In planning and performing our
audit of compliance, we considered the District’s internal control over compliance with the types of
requirements that could have a direct and material effect on each major federal program to determine the
auditing procedures that are appropriate in the circumstances for the purpose of expressing an opinion on
compliance for each major federal program and to test and report on internal control over compliance in
accordance with the Uniform Guidance, but not for the purpose of expressing an opinion on the
effectiveness of internal control over compliance. Accordingly, we do not express an opinion on the
effectiveness of the District’s internal control over compliance.
A deficiency in internal control over compliance exists when the design or operation of a control over
compliance does not allow management or employees, in the normal course of performing their assigned
functions, to prevent, or detect and correct, noncompliance with a type of compliance requirement of a
federal program on a timely basis. A material weakness in internal control over compliance is a deficiency,
or a combination of deficiencies, in internal control over compliance, such that there is a reasonable
possibility that material noncompliance with a type of compliance requirement of a federal program will
not be prevented, or detected and corrected, on a timely basis. A significant deficiency in internal control
over compliance is a deficiency, or a combination of deficiencies, in internal control over compliance with
a type of compliance requirement of a federal program that is less severe than a material weakness in
internal control over compliance, yet important enough to merit attention by those charged with governance.
Our consideration of internal control over compliance was for the limited purpose described in the first
paragraph of this section and was not designed to identify all deficiencies in internal control over
compliance that might be material weaknesses or significant deficiencies. We did not identify any
deficiencies in internal control over compliance that we consider to be material weaknesses. However,
material weaknesses may exist that have not been identified.
The purpose of this report on internal control over compliance is solely to describe the scope of our testing
of internal control over compliance and the results of that testing based on the requirements of the Uniform
Guidance. Accordingly, this report is not suitable for any other purpose.
Odessa, Texas
November 13, 2018

ECTOR COUNTY INDEPENDENT SCHOOL DISTRICT
SCHEDULE OF FINDINGS AND QUESTIONED COSTS
YEAR ENDED JUNE 30, 2018
97
Section I – Summary of Auditors’ Results
Financial Statements
Type of report the auditor issued on whether
the financial statements audited were prepared
in accordance with GAAP
Unmodified
Internal control over financial reporting:
• Material weakness(es) identified? yes X no
• Significant deficiency(ies) identified?
yes
X
none reported
Noncompliance material to financial statements noted?
yes
X
no
Federal Awards
Internal control over major federal programs:
• Material weakness(es) identified? yes X no
• Significant deficiency(ies) identified?
yes
X
none reported
Type of auditor’s report issued on compliance for
major federal programs:
Unmodified
Any audit findings disclosed that are required
to be reported in accordance with 2 CFR
200.516(a)?
yes
X
no
Dollar threshold used to distinguish
between type A and type B programs:
$750,000
Auditee qualified as low-risk auditee? X yes no

ECTOR COUNTY INDEPENDENT SCHOOL DISTRICT
SCHEDULE OF FINDINGS AND QUESTIONED COSTS
YEAR ENDED JUNE 30, 2018
98
Identification of major federal programs:
CFDA Numbers Name of Federal Program or Cluster
84.048A
84.365A
10.553
10.555
10.555
10.559
1
0
Career and Technical – Basic Grant
Title III, Part A
Child Nutrition Cluster
School Breakfast Program
National School Lunch Program –
Cash Assistance
National School Lunch Program –
Non-Cash Assistance
Summer Feeding Program – Cash
Assistance
Section II - Financial Statement Findings
No matters were reported.
Section III - Federal Award Findings and Questioned Costs
No Matters were reported.

ECTOR COUNTY INDEPENDENT SCHOOL DISTRICT
SCHEDULE OF PRIOR FINDINGS AND QUESTIONED COSTS
YEAR ENDED JUNE 30, 2017
99
Section II - Financial Statement Findings
No matters were reported.
Section III - Federal Award Findings and Questioned Costs
No Matters were reported.

EXHIBIT K-1ECTOR COUNTY INDEPENDENT SCHOOL DISTRICT
SCHEDULE OF EXPENDITURES OF FEDERAL AWARDS
FOR THE YEAR ENDED JUNE 30, 2018
(1)
Federal
Entity Identifying
(4)
NumberCFDA
ExpendituresFederal
Number
(3)(2)
FEDERAL GRANTOR/
PASS-THROUGH GRANTOR/PROGRAM or CLUSTER TITLE
Pass-Through
NATIONAL AERONAUTICS SPACE ADMINISTRATION
Passed Through Texas Space Grant Consortium
8,000$Student Space Flight Experiments 43.001 NNX15AJ99H
Total Passed Through Texas Space Grant Consortium 8,000
TOTAL NATIONAL AERONAUTICS SPACE ADMINISTRATION 8,000
U.S. DEPARTMENT OF DEFENSE
Direct Programs
121,607Junior Reserve Officer's Training Corps 12.000
Total Direct Programs 121,607
TOTAL U.S. DEPARTMENT OF DEFENSE 121,607
U.S. DEPARTMENT OF EDUCATION
Passed Through State Department of Education
903,691ESEA, Title I, Part A - Improving Basic Programs 84.010A 176101010689014,497,841ESEA, Title I, Part A - Improving Basic Programs 84.010A 18610101068901
2,959ESEA, Title I, Part D, Subpart 2-Delinquent Progra 84.010A 1761010306890164,542ESEA, Title I, Part D, Subpart 2-Delinquent Progra 84.010A 18610103068901
490,513Title I 1003(A) Priority And Focus School Grant 84.010A 17610112068901000480,943Title I 1003 School Improvement 84.010A 18610123068901
Total CFDA Number 84.010A 6,440,489
661,748IDEA - Part B, Formula 84.027A 1766000106890166004,810,110IDEA - Part B, Formula 84.027A 186600010689016600
2,889IDEA - Part B, Discretionary 84.027A 17660002068901667419,036IDEA - Part B, Discretionary Deaf 84.027A 1766001106890160,929IDEA - Part B, Discretionary Deaf 84.027A 186600110689016673
Total CFDA Number 84.027A 5,554,712
13,980IDEA - Part B, Preschool 84.173A 176610010689016610123,068IDEA - Part B, Preschool 84.173A 186610010689016610
Total CFDA Number 84.173A 137,048
Total Special Education Cluster (IDEA) 5,691,760
282,079Carl D. Perkins Basic Formula Grant 84.048A 18420006068901
364IDEA, Part C - Early Intervention (Deaf) 84.181A 1739110106890139112,061IDEA, Part C - Early Intervention (Deaf) 84.181A 183911010689013911
Total CFDA Number 84.181A 2,425
61,872Title III, Part A - LEP 84.365A 17671001068901368,389Title III, Part A - English Language Acquisition 84.365A 18671001068901
Total CFDA Number 84.365A 430,261
109,260ESEA, Title II, Part A, Teacher/Principal Training 84.367A 17694501068901677,270ESEA, Title II, Part A, Supporting Effective Inst. 84.367A 18694501068901
Total CFDA Number 84.367A 786,530
102,436Title IV, Part A, Subpart 1 84.424A 18680101068901
Total Passed Through State Department of Education 13,735,980
TOTAL U.S. DEPARTMENT OF EDUCATION 13,735,980
See Accompanying Notes to the Schedule of Expenditures of Federal Awards
100

EXHIBIT K-1ECTOR COUNTY INDEPENDENT SCHOOL DISTRICT
SCHEDULE OF EXPENDITURES OF FEDERAL AWARDS
FOR THE YEAR ENDED JUNE 30, 2018
(1)
Federal
Entity Identifying
(4)
NumberCFDA
ExpendituresFederal
Number
(3)(2)
FEDERAL GRANTOR/
PASS-THROUGH GRANTOR/PROGRAM or CLUSTER TITLE
Pass-Through
U.S. DEPARTMENT OF HEALTH AND HUMAN SERVICES
Passed Through State Department of HHS
63,817Medicaid Administrative Claiming Program - MAC 93.778 06890122,135Federal Child Care Tuition 93.556 09030C02FY18
Total Passed Through State Department of HHS 85,952
TOTAL U.S. DEPARTMENT OF HEALTH AND HUMAN SERVICES 85,952
U.S. DEPARTMENT OF AGRICULTURE
Passed Through the State Department of Agriculture
3,399,526School Breakfast Program 10.553 71401801
5,874,324National School Lunch Program - Cash Assistance 10.555 71301801882,293National School Lunch Prog. - Non-Cash Assistance 10.555 068901
Total CFDA Number 10.555 6,756,617
60,318Summer Feeding Program - Cash Assistance 10.559 068901
Total Child Nutrition Cluster 10,216,461
504,189Child & Adult Care Food Program - Cash Assistance 10.558 00327
Total Passed Through the State Department of Agriculture 10,720,650
TOTAL U.S. DEPARTMENT OF AGRICULTURE 10,720,650
TOTAL EXPENDITURES OF FEDERAL AWARDS 24,672,189$
See Accompanying Notes to the Schedule of Expenditures of Federal Awards
101

ECTOR COUNTY INDEPENDENT SCHOOL DISTRICT NOTES TO SCHEDULE OF EXPENDITURES OF FEDERAL AWARDS
FOR THE YEAR ENDED JUNE 30, 2018
1) General
The accompanying Schedule of Expenditures of Federal Awards presents the activity of all Federal financial assistance programs of the Ector County Independent School District, Odessa, Texas (the District). The District reporting entity is defined in note I.A. of the notes to the District’s general purpose financial statements. Federal financial assistance received directly from Federal agencies as well as Federal financial assistance passed through other government agencies is included in the exhibit.
2) Basis of Accounting
The accompanying Schedule of Expenditures of Federal Awards is presented using the modified accrual basis of accounting that is described in note I.C. of the notes to the District’s general purpose financial statements. Indirect costs shown on the Schedule of Expenditures of Federal Awards are properly credited as revenues to the General Fund. These indirect cost revenues were determined by applying approved indirect cost rates to actual applicable expenditures of the projects. The District has elected not to use the 10% de minimis cost rate as covered in 200.414 Indirect (F&A) costs.
3) Relationship to General Purpose Financial Statements
Federal financial assistance revenues are reported in the District’s general purpose financial statements as follows:
100-199 General Fund $ 2,938,371 200-499 Special Revenue Funds 24,158,502 27,096,873 Less: SHARS revenue (2,424,684)
Schedule of Federal Awards $ 24,672,189
4) Relationship to Federal Financial Reports
Amounts reported in the accompanying exhibits agree with the amounts reported in the related Federal Financial Reports.
5) Amounts Passed Through by the District During 2018, the District did not pass through any federal funding to sub-recipients.
102