Annual Financial Report - Board of...
62
Annual Financial Report Retirement System 11/12
Transcript of Annual Financial Report - Board of...

AnnualFinancialReport Retirement System
11/12


U n i v e r s i t y o f C a l i f o r n i a
retirement system 11/12 annual financial report
t a b l e o f C o n t e n t s
University of California Retirement System (UCRS): 3 introduction to the University of California retirement system
University of California Retirement Plan (UCRP): 4 summary statement
5 Plan overview and administration
6 Plan Progression
7 Plan Membership
8 Plan benefits and investment and Proxy Policies
9 Historical investment Performance
University of California Retirement Savings Program (UCRSP): 11 summary statement
12 Plan overview and administration
13 Progression of Plans
14 Contributions and investments
15 UC Core funds investment Performance
16 net Position by Plan and Participant accounts by Plan
17 tax-Deferred 403(b) Plan loan Program
University of California Retirement System (UCRS): 19 Management’s Discussion and analysis
28 financial statements
30 notes to financial statements
52 supplementary information
58 Plan oversight — the board of regents


U n i v e r s i t y o f c a l i f o r n i a r e t i r e m e n t s y s t e m 1 1 / 1 2 a n n U a l f i n a n c i a l r e p o r t 3
the University of California retirement system (“UCrs”) comprises two defined benefit pension
plans and four defined contribution plans. the regents of the University of California (“the regents”)
act as trustee associated with each of UCrs Plans other than the UC tax-Deferred 403(b) Plan
(“403(b) Plan”) and as custodian of the 403(b) Plan. administrative authority with respect to UCrs
Plans is vested in the President of the University as plan administrator and the President
has redelegated that authority within UCrs to the vice President — Human resources.
UCrs consists of two defined benefit pension plans known as the University of California
retirement Plan (“UCrP”) and the University of California voluntary retirement incentive Program
(“Pers Plus 5 Plan”). UCrs also includes the University of California retirement savings Program
(“UCrsP”) which includes the Defined Contribution Plan (“DC Plan”), the supplemental Defined
Contribution Plan (“sDC Plan”), the 403(b) Plan and the 457(b) Deferred Compensation Plan
(“457(b) Plan”). Collectively, UCrs Plans provide for a combination of defined benefits and
retirement savings opportunities to eligible University employees and retirees.
University of California retirement system

4
Summary Statement
This section contains information and audited financial statements on the University of California Retirement Plan (UCRP), which provides lifetime retirement income, disability protection, death benefits and postretirement and preretirement survivor benefits to eligible employees of the University of California (the “University”) and its affiliate, Hastings College of the Law, as of and for the fiscal year ended June 30, 2012. Significant statistics relating to UCRP’s financial information and membership base as of June 30, 2012, is as follows:
net position $41.8 billion net investment income $112.2 million
contributions $2.1 billion Benefit payments (excluding member withdrawals and lump sum cashouts)
$2.0 billion
plan administrative and other expenses $32.8 million
ac t i v e P l a n M e M b e r s h i P
senate faculty and non-faculty academics 23,115 members management/senior professional 9,286 members professional/support staff 84,487 members to ta l 116,888 members
av e r ag e a n n Ua l s a l a r y
senate faculty $121,592 non-faculty academics $77,910 management/senior professional $124,700 professional/support staff $64,321
av e r ag e ag e
senate faculty 50 years non-faculty academics 44 years management/senior professional 50 years professional/support staff 43 years
i n ac t i v e P l a n M e M b e r s h i P / ot h e r
to ta l 67,318 members
r e t i r e e m e m B e r s h i p
faculty 5,445 retirees management/senior professional 7,555 retirees professional/support staff 36,675 retirees to ta l 49,675 retirees
av e r ag e r e t i r e m e n t ag e faculty 64 years management/senior professional 60 years professional/support staff 59 years
av e r ag e s e r v i c e c r e d i t at r e t i r e m e n t faculty 25 years management/senior professional 22 years professional/support staff 20 years
av e r ag e a n n Ua l U c r p i n co m e faculty $75,161 management/senior professional $54,183 professional/support staff $29,618
s u r v i v o r / b e n e f i c i a ry 7,259 recipients D i s a b l e D 2,000 recipients
U n i v e r s i t y o f C a l i f o r n i a r e t i r e M e n t P l a n ( U C r P )

U n i v e r s i t y o f c a l i f o r n i a r e t i r e m e n t s y s t e m 1 1 / 1 2 a n n U a l f i n a n c i a l r e p o r t 5
Plan Overview and adminiStratiOn
UCRP is a key component of the comprehensive benefits package offered to employees of the University of California and its affiliate, Hastings College of the Law. UCRP is a governmental defined benefit pension plan intended to be qualified under §401(a) of the Internal Revenue Code (IRC).
The University’s pension program dates back to 1904, with a plan that provided for the purchase of commercial annuities for retiring professors at UC Berkeley and UC San Francisco. The current retirement pension plan was designed in 1961, before the University’s participation in Social Security and before the introduction of employee life and disability insurance coverage. Over the years, UCRP has evolved to include provisions for:
• basicretirementincome(includespost-retirementsurvivorbenefits)andfouralternativemonthlypayments;• lumpsumcashoutinlieuofbasicretirementincome;• disabilityincome;• deathbenefits;• preretirementsurvivorbenefits;and• annualadjustmentsforincreasesinthecost-of-livingformonthlybenefitsandthecompensationcomponentofthebenefit
formula for inactive members.Further, in lieu of lifetime retirement benefits, members may choose a refund of their accumulated employee contributions and earnings or, if eligible to retire, they may elect a lump sum payment that is the actuarial equivalent present value of their lifetime retirement income.
At June 30, 2012, active UCRP members included 116,888 employees at the University’s ten campuses, five medical centers, Lawrence Berkeley National Laboratory and Hastings College of the Law.
The Vice President — Human Resources of the University carries out administrative duties delegated by the President for theday-to-daymanagementandoperationofthePlan.Theseincludeconductingpolicyresearch,implementingchangestothe Plan document and regulations to preserve the Plan’s qualification under the IRC and overseeing the recordkeeping and accounting functions and the receipt and disbursement of UCRP assets to eligible members, their beneficiaries and survivors.
Summary plan descriptions are updated periodically to reflect legislative, Plan and administrative changes. These booklets are available online on At Your Service (atyourservice.ucop.edu) or through local Benefits Offices. They are mailed directly to active participants once every five years.

6
Plan PrOGreSSiOn
1904Commercialannuitiesequaltotwo-thirdssalarywereprovidedforfacultyaged70orolderwhohad20yearsof service or more. Two decades later, the Pension and Retiring Annuities System (PRAS) pension plan was introduced for faculty and high ranking administrators.
1937 Pensionplancoveragewasalsoestablishedfornon-academicemployeesthroughCalPERS.
1961 PRAS was terminated due to insolvency and UCRP was established to provide retirement, disability and preretirement survivor benefits to all University career employees.
1971Theannual2percent(maximum)cost-of-livingadjustments(COLAs)wereappliedtoretirement,survivor and disability benefits.
1976 Social Security coverage was offered to UCRP members.
1990-1994 Several plan changes were made to address the rising surplus in UCRP funded position: •EmployerandemployeecontributionstoUCRPweregraduallysuspendedforactivemembers
(effectiveformostmembersbeginninginNov-90);
•TheUniversityofferedthreesuccessiveearlyretirementincentiveprogramstoUCRPmembers (aseparatelyfundedprogramwasprovidedtoUCemployeeswhoweremembersofCalPERS);
•FiveCapitalAccumulationPayment(CAP)allocationsweremadetoUCRPrecordkeepingaccountsonbehalf of eligible members.
2001-2002 UCRP membership eligibility was modified to include employees not otherwise eligible who work 1,000 hours ina12-monthperiod.Inaddition,UCRPagefactorswereincreased.
2005-2006 The University transferred management of the Los Alamos National Laboratory (LANL) to the Los Alamos National Security, LLC (LANS) and plan net assets attributable to the prior service of LANL employees to the successor pension plan.
2006-2008UCRPwasamendedtoallowfordistributionandrolloverprovisions(includingRothIRAsin2007-2008) allowedunderthePensionProtectionActof2006.Separately,duringfiscalyear2007-2008,theUniversitytransferred management of the Lawrence Livermore National Laboratory (LLNL) to the Lawrence Livermore National Security, LLC (LLNS) and plan net assets attributable to the prior service of LLNL employees to the successor pension plan.
2008-2009 The University adopted a new UCRP funding policy effective with the July 1, 2008 actuarial valuation.
2009-2010 The University reinstated employer contributions effective April 15, 2010 and employee contributions effective with spring 2010 covered compensation.
2010-2011 The University adopted a new tier of UCRP benefits for employees hired or rehired following a break in service, on or after July 1, 2013, increasing early and normal retirement age by five years while retaining many current UCRP benefits.
2011-2012 The University changed the mortality assumptions for annuity option factors and lump sum factors effective July 1, 2012. The University adopted new employer and employee contribution rates effective July 1, 2013.
U n i v e r s i t y o f C a l i f o r n i a r e t i r e M e n t P l a n ( U C r P )

U n i v e r s i t y o f c a l i f o r n i a r e t i r e m e n t s y s t e m 1 1 / 1 2 a n n U a l f i n a n c i a l r e p o r t 7
Plan memberShiP
EmployeesparticipateinUCRPinoneoffourmembershipclassifications:
• MemberswithSocialSecuritycoverage• MemberswithoutSocialSecuritycoverage• SafetyMembers(policeandfirefighters)• TierTwoMembers
The following table reflects UCRP membership by classification over the past 10 years ended June 30:
PLAN MEMBERSHIP
yearWith
social securityWithout
social securitysafety
MeMberstier tWo total active1 inactive
MeMbers/others1, 2 total3
2012 115,209 1,272 396 11 116,888 67,318 184,206 2011 113,652 1,497 404 15 115,568 60,903 176,471 2010 112,700 1,796 418 14 114,928 55,037 169,965 2009 113,112 2,180 417 26 115,735 54,883 170,618 2008 111,245 2,556 411 21 114,233 64,566 178,799
2007 115,254 3,179 432 20 118,885 59,056 177,941
2006 117,917 3,941 425 34 122,317 52,548 174,865
2005 118,756 5,419 418 49 124,642 47,123 171,765
2004 117,100 6,165 399 53 123,717 39,874 163,591
2003 113,913 6,982 400 56 121,351 31,262 152,613
1 The changes in active and inactive membership during fiscal years 2008 and 2007 include the results of elections made by LLNL and LANL employees, respectively, who either retired, became inactive, or accepted employment with LLNS and LANS, as applicable, and joined its defined benefit pension plan.
2 Includes terminated nonvested employees eligible for a refund of Plan accumulations or Capital Accumulation Payment balance.
3 Excludes UCRP benefit recipients, as accounted for in the table on page 8.

8
Plan benefitS
UCRP paid approximately $2.0 billion in retirement, disability and preretirement survivor benefits to 58,934 members and theirbeneficiariesandsurvivorsduringfiscalyear2011-2012.Retirementpaymentsincludecost-of-livingadjustmentsandexclude lump sum cashouts. Payments to survivors include basic death payments and survivor annuities. The table below reflects total benefits paid in each category over the past 10 years.
UCRP BENEFIT PAYMENTS ($ in thousands)
year enDeD June 30 retireMent Disability Death & survivor total1
2012 $1,908,831 $35,189 $47,262 $1,991,282 2011 1,761,580 35,298 45,059 1,841,937 2010 1,634,114 35,331 41,129 1,710,574 2009 1,517,717 35,984 39,949 1,593,650 2008 1,403,778 36,098 39,624 1,479,500
2007 1,260,092 35,815 36,487 1,332,394
2006 1,106,711 34,771 34,338 1,175,820
2005 984,816 33,434 33,254 1,051,504
2004 877,696 31,900 30,731 940,327
2003 794,861 29,311 28,534 852,706 1 Does not include non-periodic member withdrawals (including CAP distributions) and lump sum cashouts.
The number of UCRP benefit recipients in each category for the year ended June 30 for each of the past 10 years is shown below.
UCRP BENEFIT RECIPIENTS
year enDeD June 30 retireD MeMbers DisableD MeMbers DeceaseD MeMbers survivors total1
2012 49,675 2,000 1,377 7,259 58,934 2011 47,243 2,084 1,790 6,969 56,296 2010 45,111 2,110 1,920 6,681 53,902 2009 42,969 2,157 1,659 6,527 51,653 2008 41,584 2,218 1,964 6,369 50,171
2007 39,261 2,269 1,817 6,152 47,682
2006 37,289 2,269 1,686 5,884 45,442
2005 33,590 2,225 1,774 5,662 41,477
2004 32,072 2,194 1,781 5,472 39,738
2003 30,655 2,129 1,603 5,083 37,867 1 Does not include deceased members.
inveStment and PrOxy POlicieS
In a defined benefit plan such as UCRP, the plan bears the mortality and investment risk because members’ benefits are based on the employer’s promise rather than the contributions or plan assets and their earnings available to pay the benefits.
The Office of the Treasurer has primary responsibility for investing UCRP assets consistent with policies established by The Regents. The Regents has fiduciary responsibility for establishing investment policy for UCRP and for overseeing the implementation of that policy.
The assets of the Plan are held in trust by The Regents separately from the University’s assets and maintained in a custodial account at State Street Bank & Trust Co. The bank carries insurance against loss of property caused by employee dishonesty, theft, misplacement, damage, distribution or mysterious disappearance.
U n i v e r s i t y o f C a l i f o r n i a r e t i r e M e n t P l a n ( U C r P )

U n i v e r s i t y o f c a l i f o r n i a r e t i r e m e n t s y s t e m 1 1 / 1 2 a n n U a l f i n a n c i a l r e p o r t 9
hiStOrical inveStment PerfOrmance
ANNUALIZED RATES OF RETURN AT JUNE 30, 2012
1-year 3-year 5-year 10-year
ucrP 0.37% 11.48% 1.17% 6.04%
policy Benchmark -0.59% 10.50% 0.86% 5.68%
u.s. equity 3.80% 16.59% -0.12% 5.44%
policy Benchmark1 3.41% 16.50% 0.17% 5.64%
non-u.s. equity-Developed Markets -13.71% 6.81% -5.25% 5.81%
policy Benchmark2 -14.58% 5.92% -5.86% 5.32%
non-u.s. equity-emerging Markets -13.76% 11.70% -0.03% 14.39%
policy Benchmark3 -15.95% 9.77% -0.09% 14.11%
Global equity -6.84% 11.54% n/a n/a
policy Benchmark4 -6.91% 11.30% n/a n/a
core fixed income 7.13% 7.43% 6.94% 6.42%
policy Benchmark5 7.47% 6.93% 7.27% 6.39%
high yield bond 7.42% 16.05% 7.81% n/a
policy Benchmark6 6.62% 16.01% 8.07% n/a
emerging Market Debt 6.77% 12.02% 8.79% n/a
policy Benchmark7 6.93% 12.15% 9.05% n/a
tiPs 11.82% 9.86% 8.88% 7.50%
policy Benchmark8 11.66% 9.63% 8.44% 7.23%
Private equity9 8.93% 15.22% 5.38% 9.40%
absolute return-Diversified -2.00% 6.30% 1.40% n/a
policy Benchmark10 -9.32% -0.61% 2.55% n/a
absolute return-cross asset class 11.04% n/a n/a n/a
policy Benchmark11 -0.59% n/a n/a n/a
real assets 1.15% n/a n/a n/a
policy Benchmark12 1.65% n/a n/a n/a
Public real estate 5.13% 17.92% n/a n/a
policy Benchmark13 1.13% 20.80% n/a n/a
Private real estate 14.68% -0.32% -9.11% n/a
policy Benchmark13 13.59% -0.29% -8.23% n/a
asset class benchMark coMPonent PercentaGe
1 U.s. equity russell 3000 tf 25.75% 2 non-U.s. equity developed msci World ex-U.s. (net dividends) tf 19.00% 3 emerging market equity msci emerging market (net dividends) 6.75% 4 global equity msci all country World index net-imi 2.00% 5 U.s. core fixed income Barclays capital U.s. aggregate Bond index 12.00% 6 high yield Bond merrill lynch high yield cash pay index 2.50% 7 emerging market debt dollar-denominated: 67% Jpmorgan emerging markets Bond index global diversified + local currency: 33% Jpmorgan govt Bond index emerging markets global diversified 2.50% 8 tips Barclays capital U.s. tips 8.00% 9 private equity actual pe returns 7.75% 10 absolute return-diversified 50% hfrX absolute return index +50% hfrX market directional index 6.00% 11 absolute return-cross asset class aggregate Ucrp policy Benchmark 2.00% 12 real assets commodities: s&p gsci reduced energy index; all other: actual portfolio return 1.25% 13 real estate (public and private) public: ftse epra nareit global index and private: nfi-odce index– 4.50% ncreif funds index-open end diversified core equity index (lagged 3 months)


U n i v e r s i t y o f c a l i f o r n i a r e t i r e m e n t s y s t e m 1 1 / 1 2 a n n U a l f i n a n c i a l r e p o r t 11
U n i v e r s i t y o f C a l i f o r n i a r e t i r e M e n t s a v i n g s P r o g r a M ( U C r s P )
Summary Statement
This section contains information about the University of California Retirement Savings Program (UCRSP) which consists of fourdefinedcontributionplans,twoplansstructuredunder§401(a)oftheIRC;oneplanstructuredunder§403(b)oftheIRCandadeferredcompensationplanstructuredunderIRC§457(b),collectivelyreferredtoasthe“UCRSPPlans.”UCRSPPlanswere created to provide savings incentives and additional retirement security for eligible University employees. The DC Plan wasestablishedbyresolutionofTheRegentstoacceptafter-taxcontributionseffectiveJuly1,1967,andpretaxcontributionseffective November 1, 1990. The Regents established the Supplemental Defined Contribution Plan (SDC Plan) effective January 1, 2009 to provide retirement benefits to designated employees of the University and their beneficiaries. The403(b)Plan,alsoestablishedbyregentalresolution,becameeffectiveJuly1,1969.TheRegentsestablishedthe457(b)Planeffective September 1, 2004. Significant statistics relating to UCRSP Plans’ financial information and membership base as of June 30, 2012 is as follows:
net position $16.6 billion
total contributions $977.7 million
net investment income $198.4 million
program administrative expenses $8.6 million
SignificantstatisticsrelatingtothePlansandtheirparticipantsasofthe2011–2012fiscalyear-endareasfollows:
DEFINED CONTRIBUTION PL AN | active plan participation
P r e tax acco u n t: management/senior professional 140 participants professional/support staff 2 participants to ta l 142 participants Average Pretax Account monthly contribution $70 Average Pretax Account value 7,401s a f e h a r b o r :
academic faculty 65 participants management/senior professional 127 participants professional/support staff 35,416 participants to ta l s a f e h a r b o r 35,608 participants Average Pretax Account monthly contribution $179 Average Pretax Account value $4,029
a f t e r - tax acco u n t:
academic faculty 504 participants management/senior professional 443 participants professional/support staff 2,593 participants hastings college of the law 3 participants to ta l a f t e r ta x 3,543 participants Average After-Tax Account monthly contribution $282 Average After-Tax Account value $20,776
i n a c t i v e P l a n Pa r t i c i Pat i o n 164,541 participants
TAX-DEFERRED 403(b) PL AN | active plan participation
academic faculty 8,449 participants management/senior professional 10,065 participants professional/support staff 40,571 participants hastings college of the law 110 participants t o ta l 59,195 participants Average percent of salary contributed 9.30%Average monthly contribution $708 Average Plan Account value $77,982 Outstanding Loan Program loans 16,496 Aggregate outstanding loan principal $146.1 million
i n a c t i v e P l a n Pa r t i c i Pat i o n 52,555 participants
457(b) DEFERRED COMPENSATION PLAN | active plan participation
academic faculty 3,819 participants management/senior professional 3,281 participants professional/support staff 7,723 participants hastings college of the law 45 participants to ta l 14,868 participants Average monthly contribution $951 Average plan account balance $49,599
i n a c t i v e P l a n Pa r t i c i Pat i o n 7,002 participants

12
U n i v e r s i t y o f C a l i f o r n i a r e t i r e M e n t s a v i n g s P r o g r a M ( U C r s P )
Plan Overview and adminiStratiOn
Benefits from UCRSP Plans are based on participants’ mandatory and voluntary contributions, and certain University contributions, plus earnings. While their savings accumulate, employees have the benefit of reductions in their personal income taxes.
AdefinedcontributionplanwasfirstmadeavailabletoUniversityemployeesin1967.Employeescouldinvestafter-taxcontributionsintwoUniversity-managedannuityfunds.Twoyearslater,the403(b)Planwasaddedforvoluntarypretaxsavings. Over the years, 403(b) Plan features have been expanded to include mutual fund investment options including a brokeragewindow;aloanprogramthroughwhichparticipantscanborrowfromtheir403(b)Plansavings;diverseinvestmentoptionsthatnowinclude12single,diversifiedinvestmentsforbuildingretirementsavings;7primaryassetclassoptionsselectedbytheOfficeoftheTreasurerforassetallocation;and5specializedassetclassoptionsmanagedbyindependentinvestment advisors.
The457(b)PlanwasestablishedeffectiveSeptember1,2004.Although457(b)planshavebeenavailableformanyyears,theIRCsalarydeferralcontributionlimitspreviouslyappliedtoparticipants’combinedannualcontributionstoboth457(b)and403(b) plans, so there was no advantage in offering both. A change in tax law, however, allows the maximum limit to be applied separatelytoeachkindofplan.Thus,withtheadditionofthe457(b)Plan,Universityfacultyandstaffcandoubletheamountof their voluntary, pretax retirement savings.
The SDC Plan was established effective January 1, 2009. Its primary purpose is to provide retirement benefits to designated employeesoftheUniversityofCaliforniaandtheirbeneficiaries.TheSDCPlanconstitutesaprofit-sharingplanwithinthemeaning of IRC §401(a).
Allemployeesalarydeferralandafter-taxcontributionstoUCRSPPlansaredeductedfromparticipants’wages.Universitycontributions are made on behalf of academic employees who earn summer term or equivalent salary and eligible senior managers.
The fiduciary oversight structure for UCRSP Plans aligns Regental oversight of the Plans through the Committee on Compensation, which oversees the administration of the Plans, and the Committee on Investments, which recommends investment policy for the Plans for Regental approval and oversees the investment management function carried out by the Chief Investment Officer.
The Vice President — Human Resources serves as the Plan Administrator. The Vice President — Human Resources oversees policyresearch,implementsregulationstopreservethePlans’qualificationand/ortax-advantagedstatuswithundertheIRC,and provides administrative services as needed. The Plans’ administration and investment management activities are reviewed semiannually by the Retirement Savings Program Advisory Committee.
Fidelity Workplace Services (FWS) acts as the master recordkeeper for the Plans. The master record keeping and participant services include daily valuation, daily exchanges, expedited processing of distributions and provides plan loans and withdrawals, a consolidated recordkeeping platform for the Plans and all the funds offered under UCRSP, and a core funds menuwithabroadofferingofsingle,diversifiedinvestments,primaryassetclassoptions,specializedassetclassoptionsandexternally managed mutual fund options.
ForservicesrenderedinconnectionwithUCRSPPlans,anadministrativefeeischargedtotheUniversity-managedinvestmentfunds each day, based upon the previous day’s net assets, and is paid to the University. The fee is deducted before calculating the unit values and interest factors. The fee is limited to 0.15 percent (or $1.50 per $1,000 invested) of the fund’s average market value per year, assessed on a daily basis. The administrative fee pays for the Plans’ expenses, such as charges for investment management,investoreducation,accounting,audit,legalandrecordkeepingservices.Therearenofront-endordeferredsalesloads or other marketing expenses associated with the single, diversified investments and primary asset class options managed by the Office of the Treasurer.
In addition, any fees paid by participants, including loan fees and brokerage window account fees, and any credits that may be awarded for FWS’ failure to meet certain performance standards, will be credited to the Plans’ recordkeeping fee account. Additional credits may be received pursuant to a mutual fund revenue sharing agreement and offset against charges for services provided by FWS and its affiliates.
A participant can obtain information on fees charged by a mutual fund investment option by reviewing the fund prospectus available on the FWS web site (netbenefits.fidelity.com).
Summary plan descriptions are updated periodically to reflect legislative, Plan and administrative changes. These booklets are available online on At Your Service (atyourservice.ucop.edu) or through local Benefits Offices. They are mailed directly to active participants once every five years.

U n i v e r s i t y o f c a l i f o r n i a r e t i r e m e n t s y s t e m 1 1 / 1 2 a n n U a l f i n a n c i a l r e p o r t 13
PrOGreSSiOn Of PlanS
1967 SupplementalRetirementProgramestablishedwithFixed(Savings)andVariable(Equity) annuity investment options.
1969 Tax-DeferredAnnuityPlan(403(b)Plan)establishedforinvestmentofpretaxcontributionsinFixed and Variable annuities.
1978 Variable Bond Fund added to annuity investment options.
1985 MoneyMarketandInsuranceCompanyContractfundsaddedasUniversity-managedinvestmentfundoptions.
1986-1987 Mutualfundinvestmentoptionsofferedto403(b)PlanparticipantsthroughFidelityandsociallyresponsibleinvestmentsofferedbyCalvert.The403(b)PlanLoanProgramestablishedunderIRC§72(p).
1990 Multi-AssetFundaddedassixthUniversity-managedinvestmentfundoption.DCPlanexpandedtoacceptredirected man da to ry pretax contributions from UCRP members.
1991 Part-timeUniversityemployeesandCaliforniaStateUniversity(CSU)employeesnototherwisecovered by a retirement system contribute to the DC Plan in lieu of paying Social Security taxes.
1994-1995 DC Plan investment options expanded to include Fidelity mutual funds. Plan participation extended tonon-exemptstudentemployeesinlieuofpayingSocialSecuritytaxes.
2001-2002 RolloveroptionsexpandedundertheEconomicGrowthandTaxReliefReconciliationAct.CalvertGroup mutual fund investment options expanded.
2004 457(b)DeferredCompensationPlanestablished,effectiveSeptember1,2004.
2005 Introduced Core Funds menu and expanded services to participants through a new master recordkeeping platform.
2007 ExpandeddistributionandrolloverprovisionsofthePlans,asprovidedforinthePensionProtectionActof2006.
2008 Allowed rollover of eligible distributions to Roth IRAs, as provided for by the Pension Protection Act of 2006.
2009-2010 DiscontinuedtheredirectionofUCRPemployeecontributionstotheDCPlansubjecttocollectivebargaining for represented employees.
2011-2012 Periodic payments over a specified term added as an allowed form of payment to beneficiary. Allowable hardship reasons expanded to include burial/funeral expenses and qualifying damage to principal residence. Allowable unforeseeable emergency withdrawals expanded to include loss of property of Domestic Partner and extraordinary circumstances beyond control of Domestic Partner that would cause financial hardship clarified.

14
U n i v e r s i t y o f C a l i f o r n i a r e t i r e M e n t s a v i n g s P r o g r a M ( U C r s P )
cOntributiOnS
EffectiveJuly1,2001,TheRegentsapprovedDCPlanretirementcontributionsonthesummerorequivalenttermsalariesof eligible academic employees who teach, conduct research or provide administrative service during the summer session or equivalent term. The eligible employees must hold academic year appointments and be active members of UCRP or another definedbenefitplantowhichtheUniversitycontributes.Thecontributionrateis7.0percentofeligiblesummersalary,ofwhich3.5percentisUniversity-paidand3.5percentisemployee-paid,bothonapretaxbasis.
University contributions may also be made for eligible senior managers on a pretax basis.
VoluntaryDCPlancontributions,whichemployeesmakeonanafter-taxbasis,areheldinthePlan’sAfter-TaxAccount. Themaximumamountemployeesmaycontributeannuallyasafter-taxvoluntarycontributionsisdeterminedbytheIRC§415(c)limit.Generally,thisamountisthelesserof100percentoftheparticipant’sadjustedgrossUniversitysalaryor$49,000in 2011 and $50,000 in 2012. This limit takes into account all annual additions, including any pretax employee and University contributionstotheDCPlanandtheSDCPlanwhereapplicable.After-taxcontributionsaredeductedfromnetincomeandalso may be invested in and transferred among any of the investment options available to the Plans.
The 403(b) Plan includes voluntary employee salary deferral contributions that are made on a pretax basis. Within IRC limits, a 403(b) plan participant may make contributions as a percentage of salary or in flat dollar amounts. Contributions to the 403(b) Plan may be invested in and transferred among any of the investment options available to the Plans. University contributions are made for eligible senior managers on a pretax basis.
The457(b)Planincludesvoluntarysalarydeferralemployeecontributions.Universitycontributionsmayalsobemadeforeligible senior managers on a pretax basis. Within IRC limits a Plan participant may make contributions as a percentage of their salary or in a flat dollar amount. Plan contributions may be invested in and transferred among any of the investment options available to the Plans.
AllfourPlansacceptrolloversofpretaxdistributionsfromotherUniversity-sponsoredplans,includinglumpsumcashouts andCapitalAccumulationPayment(CAP)distributionsfromUCRP,401(a),401(k),403(b),governmental457(b)plans andfromtraditionalIRAs.Inaddition,theDC,SDCand403(b)Plansacceptdirectrolloversofafter-taxamountsfrom 401(a),401(k)and403(b)plans.The457(b)Plandoesnotacceptrolloversofafter-taxdistributions.
inveStmentS
The Chief Investment Officer of the Office of the Treasurer of The Regents has primary responsibility for selecting appropriate asset classes and specific investment options that constitute the Core Funds menu, establishing investment guidelines and benchmarks against which the Core Funds’ performance is measured, and making changes in the Core Funds menu as it deems appropriate based on its periodic evaluations. The Chief Investment Officer selection and monitoring responsibilities do not extend to the Fidelity and Calvert mutual fund options that have been retained as an accommodation to participants nor does it extend to mutual funds available through the Fidelity brokerage account option. The Regents has fiduciary responsibility for establishing broad investment policy and overseeing the performance of the investment functions.
Proxy voting PolicyThe Chief Investment Officer has instructed The Regents’ custodian bank to vote all proxies on behalf of The Regents according to guidelines established by The Regents.
investment OptionsCurrently, all UCRSP participants have the following investment options:
• theUCCoreFunds—investmentoptionsforsinglediversifiedinvestmentsincludingtheBalancedGrowthFundandthePathwayFunds;primaryassetclassinvestmentoptionsforgeneralassetallocation—allmanagedbytheChiefInvestmentOfficer;and,specializedassetclassoptionsforadditionalassetallocationwhicharemutualfundsmanagedbyindependentinvestmentadvisorsoverseenbytheChiefInvestmentOfficer;
• theFidelityInvestmentsmutualfundlineup;• Calvertsociallyresponsiblemutualfunds;and• othermutualfundsthroughtheFidelitybrokeragewindow.Current detailed information regarding the UC Core Funds and other investment options is available at netbenefits.com.

U n i v e r s i t y o f c a l i f o r n i a r e t i r e m e n t s y s t e m 1 1 / 1 2 a n n U a l f i n a n c i a l r e p o r t 15
uc cOre fundS inveStment PerfOrmanceUc fUnd investment performance for periods ending JUne 30, 2012
1-year 3-year 5-year
sinGle, DiversifieD investMents:
balanced Growth fund 0.48% 11.54% 2.43%
policy Benchmark1 0.07% 11.22% 1.71%
Pathway income fund 6.85% 8.67% 5.64%
policy Benchmark2 6.34% 7.74% 4.72%
Pathway fund 2015 6.92% 11.43% n/a
policy Benchmark2 6.94% 10.91% n/a
Pathway fund 2020 5.82% 11.52% 2.91%
policy Benchmark2 6.05% 11.33% 2.47%
Pathway fund 2025 4.71% 11.76% n/a
policy Benchmark2 4.94% 11.50% n/a
Pathway fund 2030 3.58% 11.76% 1.29%
policy Benchmark2 3.87% 11.62% 0.86%
Pathway fund 2035 2.52% 11.87% n/a
policy Benchmark2 2.78% 11.65% n/a
Pathway fund 2040 1.32% 11.59% 0.44%
policy Benchmark2 1.57% 11.44% 0.00%
Pathway fund 2045 0.16% 11.52% n/a
policy Benchmark2 0.33% 11.32% n/a
Pathway fund 2050 -0.91% 11.89% -0.46%
policy Benchmark2 -0.79% 11.75% -0.84%
Pathway fund 2055 -1.85% 12.39% n/a
policy Benchmark2 -1.89% 12.14% n/a
Pathway fund 2060 -2.88% 12.63% n/a
policy Benchmark2 -3.01% 12.35% n/a
1-year 3-year 5-year
PriMary asset class oPtions:
savings fund 1.52% 1.98% 2.86%
2-yr U.s. treasury notes 0.25% 0.62% 1.34%
icc fund 3.39% 4.02% 4.48%
5-yr U.s. treasury notes 1.01% 1.71% 2.27%
tiPs fund 11.74% 9.92% 8.90%
policy Benchmark3 11.66% 9.63% 8.44%
bond fund 7.44% 7.44% 6.81%
policy Benchmark4 7.47% 6.93% 6.79%
Domestic equity fund 3.66% 16.66% 0.36%
policy Benchmark5 3.41% 16.50% 0.17%
equity fund 1.33% 15.24% -0.31%
policy Benchmark6 0.87% 14.91% -0.61%
international equity fund -14.20% 6.34% -5.43%
policy Benchmark7 -14.58% 5.92% -5.86%
sPecializeD asset class oPtions:
vanguard small cap index fund -1.34% 19.92% 1.93%
policy Benchmark: spliced small cap index -1.40% 19.81% 1.76%
vanguard reit index fund 13.07% 33.02% 3.19%
policy Benchmark: msci Us reit index 13.19% 33.06% 3.03%
vanguard ftse social index fund 2.90% 15.54% -2.14%
policy Benchmark: spliced social index 2.97% 15.63% -2.10%
Dreyfus treasury Prime cash Management fund
0.00% 0.00% 0.70%
policy Benchmark: lipper inst Us trs mm iX 0.00% 0.01% 0.65%
Dfa emerging Markets Portfolio -14.96% 11.11% 0.70%
policy Benchmark: msci emerging markets index (net div.) -15.95% 9.77% -0.09%
Policy benchMarks
1 consists of 65% of the equity fund benchmark; 30% of the Bond fund benchmark; and, 5% of the tips fund benchmark.
2 Blend of the benchmarks of the individual underlying core funds based on holdings according to the fund asset allocation mix.
3 Barclays capital U.s. tips index. the fund seeks to provide a total return that matches the index.
4 Barclays capital U.s. aggregate Bond index.
5 russell 3000 tobacco free (tf) index.
6 consists of 85% less the actual private equity weight from the prior month end times the russell 3000 tf index; 15% msci acWi ex Us index (net) and the actual private equity weight of the previous month end times actual pe returns; historical: s&p 500 index.
7 msci eafe + canada index.

16
U n i v e r s i t y o f C a l i f o r n i a r e t i r e M e n t s a v i n g s P r o g r a M ( U C r s P )
net POSitiOn by Plan and ParticiPant accOuntS by Plan
The following tables show the assets, liabilities, net position and the number of participant accounts in each of the Plans as of June 30, 2012. The participant counts reflect the fact that participants may have an account in more than one Plan and may also have more than one account in one or more of the Plans.
(in thousands of dollars)
June 30, 2012 403(b) Plan Dc Plans 457(b) Plan total Plans
assets
Uc core fund investments* $ 7,956,366 $3,436,356 $ 886,471 $12,279,193
investment of securities lending collateral 1,442,585 535,995 149,046 2,127,626
participants’ interests in mutual funds 3,364,747 692,489 369,606 4,426,842
participant 403(b) plan loans 146,055 146,055
other assets 283,649 7,561 1,593 292,803
total assets 13,193,402 4,672,401 1,406,716 19,272,519
liabilities
other liabilities 483,536 54,431 10,876 548,843
collateral held for securities lending 1,038,594 902,535 185,715 2,126,844
total liabilities 1,522,130 956,966 196,591 2,675,687
net Position $11,671,272 $3,715,435 $1,210,125 $16,596,832
* Excludes mutual funds in the UC Core Funds
ParticiPatiOn
At June 30, 2012, the number of active employees contributing to the UC Retirement Savings Program, inactive accounts and participant plan loans was as follows:
June 30, 2012 403(b) Plan Dc Plans 457(b) Plan total Plans
active accounts
pretax 59,195 142 14,868 74,205
safe harbor, pretax 35,608 35,608
after-tax 3,543 3,543
total active accounts 59,195 39,293 14,868 113,356
inactive accounts 52,555 164,541 7,002 224,098
total Participant accounts 111,750 203,834 21,870 337,454
Participant Plan loans 16,496

U n i v e r s i t y o f c a l i f o r n i a r e t i r e m e n t s y s t e m 1 1 / 1 2 a n n U a l f i n a n c i a l r e p o r t 17
tax-deferred 403(b) Plan lOan PrOGram
AspermittedbyIRC§72(p),activeparticipantswitha403(b)Planbalanceofatleast$1,000maygenerallyborrowfromtheirtotal 403(b) Plan account balance without incurring taxes or penalties. Certain limitations apply to the available borrowing amount depending on account balance, previous loan activity and highest outstanding loan balance within the past 12 months.
The403(b)PlanLoanProgramoffersshort-termgeneral-purposeloanswithrepaymenttermsoffiveyearsorless,andlong-termprincipal-residenceloans,withrepaymenttermsofuptofifteenyears.Aparticipantmayhaveonegeneral-purposeloan andoneprincipal-residenceloanoutstandingatonetimebutmaynottakemorethanoneloanwithina12-monthperiod.Monthlyrepaymentsofprincipalandinterestarecreditedproportionatelytotheinvestmentfund(s)accordingtothecurrent403(b) Plan contribution investment mix established by the participant. A nonrefundable loan initiation fee of $35 is deducted from the 403(b) Plan account balance at the end of the calendar quarter in which the loan is taken. An annual maintenance fee of$15isdeducted($3.75percalendarquarter)fromtheparticipant’s403(b)Planaccountbalance.
The interest rate is fixed at the time the loan is granted and equals the prevailing bank Prime Rate as published by The Wall Street Journal plus 1 percent. During fiscal year 2011–2012, the Loan Program interest rate for new loans was unchanged at 4.25 percent. As of June 30, 2012 the loan rate remained at 4.25 percent.
AtJune30,2012,theaggregateoutstandingloanbalanceof16,496activeloanswas$146.1millioncomparedto15,741activeloans with an aggregate outstanding balance of $139.4 million at June 30, 2011.
The following table reflects participant loans funded during ten years ended June 30, 2012.
year enDeD June 30 nuMber of loans funDeD $ in thousanDs
2012 5,261 $62,807 2011 5,150 62,460 2010 5,560 64,253 2009 4,396 48,017 2008 4,162 47,904
2007 3,909 42,267
2006 4,208 46,728
2005 4,224 40,231
2004 4,157 36,479
2003 3,703 31,425


U n i v e r s i t y o f c a l i f o r n i a r e t i r e m e n t s y s t e m 1 1 / 1 2 a n n U a l f i n a n c i a l r e p o r t 19
Management’s Discussion and analysis (Unaudited)
TheobjectiveofManagement’sDiscussionandAnalysisistohelpreadersofUCRS’financialstatementsbetterunderstandthefinancial position and operating activities for the fiscal year ended June 30, 2012, with selected comparative information for the yearsendedJune30,2011andJune30,2010.Thisdiscussionshouldbereadinconjunctionwiththefinancialstatementsandthe notes to the financial statements. Unless otherwise indicated, years (2010, 2011, 2012, etc.) in this discussion refer to the fiscal years ended June 30.
This discussion and analysis is intended to serve as an introduction to UCRS’ financial statements, which are comprised of the following:
• StatementsofNetPosition• StatementsofChangesinNetPosition• NotestoFinancialStatements• RequiredSupplementaryInformation• NotetoRequiredSupplementaryInformation• OtherSupplementaryInformationThe Statements of Net Position present information on UCRS’ assets and liabilities and the resulting net position for pension benefits.ThesestatementsreflectUCRS’investmentsatfairvalue,alongwithcashandshort-terminvestments,receivablesandother assets and liabilities.
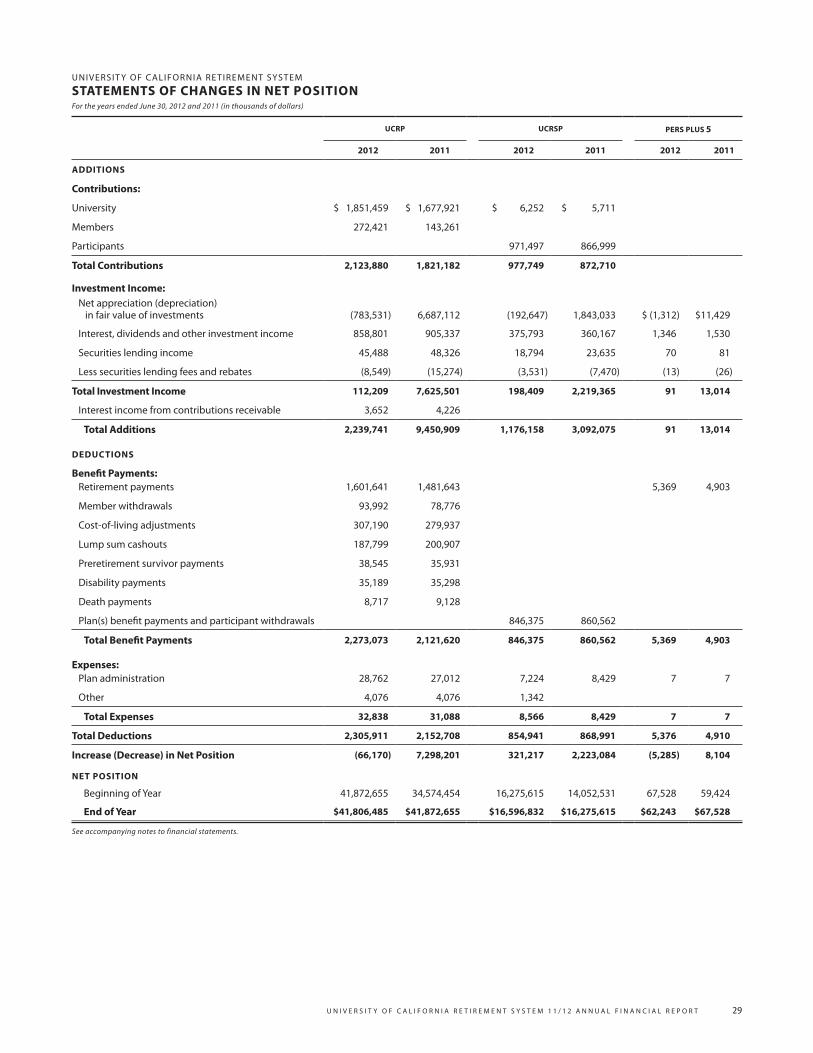
The Statements of Changes in Net Position present information showing how UCRS’ net position for pension benefits changed during the years ended June 30, 2012 and 2011. It reflects contributions along with investment income (or losses) during theperiodfrominvestingandsecuritieslendingactivities.Deductionsforretirementbenefits,withdrawals,cost-of-livingadjustments,survivor,disabilityanddeathbenefits,andadministrativeexpensesarealsopresented.
The Notes to Financial Statements provide additional information that is essential to a full understanding of the data provided in the financial statements.
The Required Supplementary Information consists of two schedules and a related note that apply only to UCRP and the PERSPlus5Planconcerningthefundedstatus.TheNotetoRequiredSupplementaryInformationprovidesadditionaltrendinformationasofthevaluationdate.Thisinformationincludesactuarialcostmethod,amortizationmethod,remainingamortizationperiod,assetvaluationperiodandactuarialassumptions.
The Other Supplementary Information consists of two schedules concerning the actuarial accrued liability and the revenues by source and expenses by type for the past 10 years.

20 m a n a g e m e n t ’ s d i s c U s s i o n & a n a l y s i s
Financial Highlights, Results and AnalysisUCRS Plans provide retirement benefits to University employees. Plan benefits are funded by member, participant and University contributions and by investment income. Below are statements of net position and changes in net position for UCRS Plans:
(in thousands of dollars)
ucrP ucrsP Pers Plus 5
June 30 2012 2011 2010 2012 2011 2010 2012 2011 2010
assetsinvestments (including
short term investment pool) $42,066,296 $42,273,447 $35,140,000 $12,279,193 $11,875,709 $10,654,869 $63,189 $68,862 $60,821
investment of securities lending collateral 5,409,671 5,099,459 6,363,777 2,127,626 2,621,324 3,737,426 8,141 8,290 10,985
participants’ interests in mutual funds 4,426,842 4,488,491 3,461,615
participant 403(b) plan loans 146,055 139,424 126,694
receivables 1,125,409 482,147 292,511 292,803 25,636 30,213 1,141 205 135
total assets 48,601,376 47,855,053 41,796,288 19,272,519 19,150,584 18,010,817 72,471 77,357 71,941
liabilitiespayable for securities purchased,
member withdrawals, refunds and other payables 1,387,208 882,962 855,157 548,843 253,657 219,157 2,090 1,539 1,528
collateral held for securities lending 5,407,683 5,099,436 6,366,677 2,126,844 2,621,312 3,739,129 8,138 8,290 10,989
total liabilities 6,794,891 5,982,398 7,221,834 2,675,687 2,874,969 3,958,286 10,228 9,829 12,517
net Position $41,806,485 $41,872,655 $34,574,454 $16,596,832 $16,275,615 $14,052,531 $62,243 $67,528 $59,424
(in thousands of dollars)
ucrP ucrsP Pers Plus 5
year enDeD June 30 2012 2011 2010 2012 2011 2010 2012 2011 2010
aDDitions University contributions $ 1,851,459 $ 1,677,921 $ 148,446 $ 6,252 $ 5,711 $ 7,303
member and participant contributions 272,421 143,261 23,374 971,497 866,999 927,651
investment income 112,209 7,625,501 4,149,541 198,409 2,219,365 1,274,629 $ 91 $ 13,014 $ 7,363
other 3,652 4,226 4,756
total additions 2,239,741 9,450,909 4,326,117 1,176,158 3,092,075 2,209,583 91 13,014 7,363
DeDuctionsretirement, cost-of-living
adjustments, lump sum cashouts, survivor, disability and death payments 2,179,081 2,042,844 1,901,066 5,369 4,903 4,873
member withdrawals 93,992 78,776 76,485
other benefit payments 846,375 860,562 634,895
administrative and other expenses 32,838 31,088 32,654 8,566 8,429 5,208 7 7 7
total Deductions 2,305,911 2,152,708 2,010,205 854,941 868,991 640,103 5,376 4,910 4,880
increase (decrease) in net position (66,170) 7,298,201 2,315,912 321,217 2,223,084 1,569,480 (5,285) 8,104 2,483
net Position
Beginning of year 41,872,655 34,574,454 32,258,542 16,275,615 14,052,531 12,483,051 67,528 59,424 56,941
end of year $41,806,485 $41,872,655 $34,574,454 $16,596,832 $16,275,615 $14,052,531 $62,243 $67,528 $59,424

U n i v e r s i t y o f c a l i f o r n i a r e t i r e m e n t s y s t e m 1 1 / 1 2 a n n U a l f i n a n c i a l r e p o r t 21
ucrP
UCRP’s net position at June 30, 2012, is $41.8 billion compared to $41.9 billion at June 30, 2011 and $34.6 billion at June 30, 2010. The net position is available to meet UCRP’s ongoing obligations to plan members, retirees and their beneficiaries. The net position of UCRP decreased by $66.2 million or 0.2 percent in 2012 compared to an increase of$7.3billionor21.1percentin2011andaincreaseof$2.3billionor7.2percentin2010.
AsofJuly1,2011,thedateofthemostrecentactuarialvaluation,UCRP’sfundedratiowas82.5percent,comparedto86.7percentat July 1, 2010 and 94.8 percent at July 1, 2009. For July 1, 2011, this indicates that, for every dollar of actuarial accrued liability, assetsof$0.83areavailabletocoversuchobligationsascomparedto$0.87atJuly1,2010and$0.95atJuly1,2009.
UCRP’s actuarial value of assets available for benefits was $42.8 billion at July 1, 2011 compared to $41.2 billion at July 1, 2010 and$42.8billionatJuly1,2009.Theactuarialaccruedliabilitywas$51.8billionatJuly1,2011,comparedto$47.5billionatJuly 1, 2010 and $45.2 billion at July 1, 2009. UCRP’s actuarial deficit was $9.1 billion at July 1, 2011, compared to a deficit of $6.3 billion at July 1, 2010 and a deficit of $2.4 billion at July 1, 2009. An analysis of the funding progress and University contributions and a discussion of actuarial assumptions and methods is set forth in the required supplementary information section of the financial statements.
While all of UCRP’s assets are available to pay any member’s benefits, assets and liabilities for the campus and medical center segmentofUCRPareinternallytrackedseparatelyfromtheDOEnationallaboratorysegmentofUCRP.FortheDOEnationallaboratory segment of UCRP the funded ratio was 84.4 percent at July 1, 2011, compared to 89.0 percent at July 1, 2010 and 94.8percentatJuly1,2009.TheDOEhasacontinuingobligationtotheUniversitytoreimbursetheUniversityforUniversitycontributions made to UCRP to fund UCRP benefits for the laboratory segment retirees.
investmentsThe Office of the Treasurer provides quarterly investment performance reports to The Regents that include investment performance returns related to each specific asset class as approved under UCRP’s investment policy. UCRP’s total investment rateofreturnwas0.37percentin2012comparedto22.5percentin2011and12.7percentin2010,comparedtoUCRPs’totalfund policy benchmark returns of (0.6) percent, 21.6 percent and 11.6 percent, respectively.
The asset allocation for UCRP’s investment portfolio in 2012, 2011 and 2010 is as follows:
2012 2011 2010
At June 30, shown as percentage
12 5 8
25
50
11 4 7
24
54
9 3 7
27
54 Equity
Fixed Income
Private EquityReal Estate
Other

22 m a n a g e m e n t ’ s d i s c U s s i o n & a n a l y s i s
Equity PortfolioThe $20.9 billion equity portfolio (including commingled equity funds) is diversified across multiple strategic global economic and industry sectors within actively managed accounts of equity securities and passively managed index funds. Of the equity portfolio,$16.3billion,or77.9percent,wasinvestedinU.S.andnon-U.S.equitysecuritiesand$4.6billion,or22.1percent, wasinvestedinU.S.andnon-U.S.commingledequityfunds.Combined,U.S.equitysecuritiesandU.S.equityfundstotaled$10.4billion,or49.8percentandforeignequitysecuritiesandnon-U.S.equitycommingledfundstotaled$10.5billion,or 50.2 percent.
Non-U.S. equity funds $3,393,664
Non-U.S. equity securities $7,123,502
U.S. equity securities $9,191,981
U.S. equity funds $1,229,108
2012 in millions of dollars
The U.S. equity portfolio return was 3.8 percent in 2012, 31.8 percent in 2011 and 15.8 percent in 2010, compared to the domesticequitypolicybenchmarkreturnsof3.4percent,32.2percentand15.7percent,respectively.Thenon-U.S.equity(developedcountries)portfolioreturnwas(13.7)percentin2012,30.4percentin2011and8.3percentin2010,comparedtothenon-U.S.equitypolicybenchmarkreturnsof(14.6)percent,30.2percentand6.8percent,respectively.Thenon-U.S.equity (emerging market countries) portfolio return was (13.8) percent in 2012, 28.4 percent in 2011 and 25.9 percent in 2010, comparedtothebenchmarkreturnsof(16.0)percent,27.8percentand23.2percent,respectively.
Private Equity PortfolioThe $3.3 billion private equity segment is invested in venture capital partnerships, buyout funds and international private equity. The private equity segment includes $1.1 billion in venture capital, $2.2 billion in buyout funds and $6.0 million incommonstockdistributions.Theprivateequityportfolioreturnwas8.9percentin2012,17.8percentin2011and 19.2 percent in 2010, respectively.
Distributions $6
Buyouts $2,180 Venture Capital $1,098
2012 in millions of dollars
Fixed Income Portfolio
TheFixedIncomePortfolioof$10.6billionisinvestedprimarilyinhighquality,call-protected,globalbonds.TheFixedIncomePortfolioiscomprisedofU.S.government-guaranteed,fixed-incomesecuritiesof$3.4billion,or32.0percent,otherU.S.dollar-denominatedfixed-incomesecuritiesof$6.9billion,or65.2percent,foreigncurrency-denominatedcorporatefixed-incomesecuritiesof$198.9million,or1.9percentandU.S.andnon-U.S.bondfundsof$1.0billion,or9.4percent.
AtJune30,2012,UCRPheld$6.8billioninU.S.government(excludingtheTIPSportfolio),otherU.S.dollar-denominatedandnon-U.S.fixed-incomesecurities,comparedto$6.5billionatJune30,2011and$6.0billionatJune30,2010.ThecoreFixedIncomePortfolio(excludingTIPS)earnedatotalreturnof7.1percentin2012,4.8percentin2011and10.5percentin2010,comparedtoUCRPs’fixed-incomepolicybenchmarkreturnsof7.5percent,3.9percentand9.5percent,respectively.

U n i v e r s i t y o f c a l i f o r n i a r e t i r e m e n t s y s t e m 1 1 / 1 2 a n n U a l f i n a n c i a l r e p o r t 23
At June 30, 2012, UCRP held $2.8 billion in TIPS, compared to $3.0 billion at June 30, 2011 and $2.8 billion at June 30, 2010. TheTIPSportfolioearnedatotalreturnof11.8percentin2012,8.1percentin2011and9.7percentin2010,comparedtoUCRPs’TIPSpolicybenchmarkreturnsof11.7percent,7.7percentand9.5percent,respectively.
Approximately32.0percentofthe$10.6billionFixedIncomePortfolioconsistsofU.S.government-guaranteedsecurities,and42.5percentoftheportfolioconsistsofhighqualitycorporateissuesratedinvestment-gradeorbetterandgovernmentagencyandasset-backedsecurities.ThebalanceoftheFixedIncomePortfolioiscomprisedofU.S.andnon-U.S.bondfundsandotherlowerqualityfixed-incomesecurities.Thequalityoftheholdingsisillustratedbelow.
Theeffectivedurationofthefixed-incomesecuritiesratedAAAtoAasofJune30,2012,was5.2,andtheweighted averagequalityratingwasAA/A.Thehighyieldfixed-incomesecuritieshadaneffectivedurationof3.9,andweightedaveragequalityofBB/B.Theemergingmarketfixed-incomesecuritieshadaneffectivedurationof6.1,andweightedaveragequality of BBB/BB.
Thequalityanddiversificationoffixed-incomeportfolioinvestmentsarediversifiedamongthesectorsillustratedbelow.
CC or below $183,218
B $1,086,045
BB $429,579
BBB $1,002,180
A $880,571
U.S. government-guaranteed $3,375,649
AAA $2,442,321
AA $165,221
Not rated (U.S. and non-U.S. bond funds) $996,700
Other $11,554
U.S. and non-U.S. bond funds $996,700
Supranational/foreign $1,196,534
Corporate asset-backed securities $549,559
U.S. agencies asset-backed securities $1,538,434
U.S. government-guaranteed $3,375,649
Corporate bonds $ 2,159,428
U.S. agencies $ 733,626
QUALIT Y DIVERSIFIC ATION
2012 in millions of dollars
* Credit Ratings U.S. Treasury Obligations: Guaranteed by the full faith and credit of the United States and rated AAA by Moody’s and AA+ by Standard & Poor’s.Standard & Poor’s (S&P) and Other Bond Ratings:• AAA:Extremelystrongcapacitytomeetfinancialcommitments.HighestRating.• AA:Verystrongcapacitytomeetfinancialcommitments.• A:Strongcapacitytomeetfinancialcommitments,butsomewhatsusceptibletoadverseeconomicconditionsandchangesincircumstances.• BBB:Adequatecapacitytomeetfinancialcommitments,butmoresubjecttoadverseeconomicconditions.• BB:Lessvulnerableinthenear-termbutfacesmajorongoinguncertaintiestoadversebusiness,financialandeconomicconditions.• B:Morevulnerabletoadversebusiness,financialandeconomicconditionsbutcurrentlyhasthecapacitytomeetfinancialcommitments.• CCCorbelow:Currentlyhighlyvulnerable.
Real Estate and Other Portfolios
At June 30, 2012, UCRP held $2.3 billion in institutional private and public real estate investments compared to $2.0 billion in2011and$949.0millionin2010.Theprivaterealestateportfolioearnedatotalreturnof14.7percentin2012compared to21.7percentin2011and(29.0)percentin2010,comparedtopolicybenchmarkreturnsof13.6percent,20.1percentand(27.3)percent,respectively.Thepublicrealestateportfolioearnedatotalreturnof5.1percentin2012,31.3percentin2011 and 18.8 percent in 2010, compared to UCRP’s public real estate policy benchmark returns of 1.1 percent, 32.9 percent and 31.2 percent, respectively.
AtJune30,2012,UCRPalsoheld$3.0billioninabsolutereturndiversifiedandcross-assetclassinvestmentscomparedto $2.8 billion in 2011 and $2.3 billion in 2010. The absolute return diversified segment earned a total return of (2.0) percent in 2012 compared to 12.3 percent in 2011 and 9.6 percent in 2010, compared to policy benchmark returns of (9.3) percent, 2.5percentand5.6percent,respectively.Theabsolutereturncross-assetclasssegmentearnedatotalreturnof11.4percentin2012,12.8percentin2011andzeropercentin2010(nopositionheld)comparedtoUCRP’sabsolutereturncross-assetclasspolicybenchmarkreturnsof(0.6)percent,6.8percentandzeropercent(nopositionheld),respectively.Separately,atJune30,2012,UCRPheld$531.9millioninrealassetinvestmentscomparedto$327.2millionin2011andnopositionheldin2010.The real asset segment earned 1.5 percent in 2012 compared to 9.3 percent in 2011, compared to real asset policy benchmark returnsof1.7percentin2012and9.3percentin2011.Forliquiditypurposes,UCRPheld$1.3billioninmoneymarketfundsin2012comparedto$1.4billionin2011and$732.8millionin2010.

24 m a n a g e m e n t ’ s d i s c U s s i o n & a n a l y s i s
ucrSP PlanS
UCRSP Plans provide savings incentives and the opportunity for additional retirement security for all eligible University of California employees. Participants’ interests in the Plans from contributions and investment income are fully and immediately vested.
UCRSP Plans’ net position as of June 30, 2012 amounted to $16.6 billion compared to $16.3 billion at June 30, 2011 and $14.1 billion at June 30, 2010. Additions to UCRSP Plans’ net position include contributions, rollovers and investment income. ParticipantandUniversitycontributions,androlloversfor2012amountedto$977.7millioncomparedto$872.7million in 2011 and $935.0 million in 2010.
UCRSPPlansrecognizednetinvestmentincomeof$198.4millionin2012comparedtonetinvestmentincomeof$2.2billionin 2011 and net investment income of $1.3 billion in 2010. The investment gains for 2011 and 2010 reflect positive investment performance in the global equity markets.
Deductions from UCRSP Plans’ net position includes benefit payments to participants, participant withdrawals and administrative expenses. For 2012, deductions were $854.9 million compared to $869.0 million in 2011 and $640.1 million in 2010. The deductions fluctuate based upon withdrawals due to retirements and other factors including minimum required distributions and rollovers out of UCRSP Plans.
The investments of UCRSP overseen by the Chief Investment Officer are available to the securities lending program as a means to augment income. Cash collateral fluctuates in response to changes in demand from borrowers and the availability of securities. UCRSP Plans’ investment of cash collateral received for securities lending totaled $2.1 billion at June 30, 2012, comparedto$2.6billionatJune30,2011and$3.7billionatJune30,2010.Securitieslendingactivitycontributed$15.3millionin net investment income, after fees and rebates, in 2012, compared to $16.2 million in 2011 and $16.4 million in 2010.
PerS PluS 5 Plan
ThePERSPlus5PlanprovidesretirementbenefitstoUC-PERSmemberswhoelectedearlyretirementundertheprovisionsofthePlan.ThenetpositionofthePERSPlus5PlanatJune30,2012,is$62.2million,comparedto$67.5millionatJune30,2011and $59.4 million at June 30, 2010. The net position is available to meet the Plan’s ongoing obligations to Plan retirees and their beneficiaries.ThenetassetsofthePERSPlus5Plandecreasedby$5.3million,or7.8percentin2012,comparedtoanincreaseof $8.1 million in 2011, or 13.6 percent, and a increase of $2.5 million in 2010, or 4.4 percent.
Plan benefits are funded by investment income. There were no University contributions during the fiscal years ending 2010 through2012.ThePlanrecognizednetinvestmentincomeof$91thousandin2012,comparedtonetinvestmentincomeof$13.0millionin2011andnetinvestmentincomeof$7.4millionin2010.ThePERSPlus5Plantotalinvestmentrateofreturnwas0.4percentin2012,comparedto22.5percentin2011and12.7percentin2010.
RetirementbenefitpaymentsandotherexpensesweretheonlydeductionsfromthePERSPlus5Plannetposition.For2012,deductions were $5.4 million and in 2011 and 2010, $4.9 million for each year.
AsofJuly1,2011,thedateofthemostrecentactuarialvaluation,thePERSPlus5Planfundedratiowas147.7percentcomparedto167.3percentatJuly1,2010and150.5percentatJuly1,2009.ForJuly1,2011,thisindicatesthatforevery dollarofactuarialaccruedliability,assetsof$1.48areavailabletocoversuchobligationscomparedto$1.67atJuly1,2010 and $1.51 at July 1, 2009.
AtJuly1,2011,thePERSPlus5Planactuarialvalueofassetsavailableforbenefitswas$67.5million,comparedto$59.4millionatJuly1,2010and$56.9millionatJuly1,2009.Theactuarialaccruedliabilitywas$45.7millionatJuly1,2011,compared to$35.5millionatJuly1,2010and$37.8millionatJuly1,2009.ThePERSPlus5Plantotalsurpluswas$21.8millionat July 1, 2011, compared to $23.9 million at July 1, 2010 and $19.1 million at July 1, 2009.
Fiduciary Responsibilities The Vice President — Human Resources has primary fiduciary responsibility for UCRP administrative functions and the Chief Investment Officer has primary fiduciary responsibility for implementing UCRP investment policy. The Regents determines investment policy and retains broad oversight fiduciary responsibility for investment and administrative functions for UCRS Plans.

U n i v e r s i t y o f c a l i f o r n i a r e t i r e m e n t s y s t e m 1 1 / 1 2 a n n U a l f i n a n c i a l r e p o r t 25
lOOkinG fOrward
UCRP costs are funded by a combination of investment earnings, employee member and employer contributions. The unfunded liabilityforthecampusesandmedicalcentersasofJuly1,2011actuarialvaluationwas$7.7billionor82.1percentfunded. AsofJuly1,2012,thefundedratioisexpectedtodecreasetoapproximately78percent.ThetotalfundingpolicycontributionsintheJuly1,2011actuarialvaluationsrepresent26.4percentofcoveredcompensation.Memberandemployercontributionsincreased to 5 percent and 10 percent, respectively, of covered compensation in July 2012. The Regents approved increasing employee member and employer contributions to 6.5 percent and 12 percent, respectively, in July 2013. These contribution rates are below UCRP’s total funding requirements. The Regents also approved a new tier of pension benefits applicable to employees hired on or after July 1, 2013, which would increase the early retirement age from 50 to 55, but retain many of the currentfeaturesofUCRP.Thenewtierwouldnotofferlumpsumcashouts,inactivememberCostofLivingAdjustments(COLAs)orsubsidizedsurvivorannuitiesforspousesanddomesticpartners.Thesechangesaresubjecttocollectivebargainingforunion-representedemployees.
Cautionary Note Regarding Forward-Looking StatementsCertain information provided by the University, including written information as outlined above or oral statements made by itsrepresentatives,maycontainforward-lookingstatementsasdefinedinthePrivateSecuritiesLitigationReformActof1995.All statements, other than statements of historical facts, which address activities, events or developments that the University expectsoranticipateswillormayoccurinthefuturecontainforward-lookinginformation.


U n i v e r s i t y o f c a l i f o r n i a r e t i r e m e n t s y s t e m 1 1 / 1 2 a n n U a l f i n a n c i a l r e p o r t 27
to the regents of the University of California:
in our opinion, the accompanying individual statements of net position and the related individual statements of changes in
net position on pages 28 through 51 present fairly, in all material respects, the individual financial positions of the University of
California retirement Plan (“UCrP”), the University of California voluntary retirement incentive Program (“Pers Plus 5 Plan”)
and the University of California retirement savings Program (“UCrsP”), of which includes four defined contribution plans
known as the Defined Contribution Plan, the supplemental Defined Contribution Plan, the tax Deferred 403(b) Plan and
the 457(b) Deferred Compensation Plan, (collectively, the “Plans”) at June 30, 2012 and 2011, and the individual changes in net
position for the years then ended in conformity with accounting principles generally accepted in the United states of america.
these financial statements are the responsibility of the Plans’ management. our responsibility is to express an opinion on these
financial statements based on our audits. We conducted our audits of these statements in accordance with auditing standards
generally accepted in the United states of america. those standards require that we plan and perform the audits to obtain
reasonable assurance about whether the financial statements are free of material misstatement. an audit includes examining,
on a test basis, evidence supporting the amounts and disclosures in the financial statements, assessing the accounting
principles used and significant estimates made by management, and evaluating the overall financial statement presentation.
We believe that our audits provide a reasonable basis for our opinion.
as discussed in note 1, the financial statements of the Plans are intended to present the net position and the changes in net
position of only that portion of activities that are attributable to the Plans. they do not purport to, and do not, present fairly
the financial position of the University of California as of June 30, 2012 and 2011, and the changes in its financial position and cash
flows for the years then ended in conformity with accounting principles generally accepted in the United states of america.
the accompanying required supplementary information (“rsi”) included on pages 52 through 55, related to actuarial information
and employer and employee Contributions for UCrP and Pers Plus 5 Plan, is required by accounting principles generally
accepted in the United states of america to supplement UCrP and Pers Plus 5 Plan’s financial statements. such information,
although not a part of UCrP or Pers Plus 5 Plan’s financial statements, is required by the governmental accounting
standards board who considers it to be an essential part of financial reporting for placing UCrP and Pers Plus 5 Plan’s financial
statements in the appropriate operational, economic, or historical context. We have applied certain limited procedures to the
required supplementary information in accordance with auditing standards generally accepted in the United states of america,
which consisted of inquiries of management about the methods of preparing the information and comparing the information
for consistency with management’s responses to our inquiries, the financial statements, and other knowledge we obtained
during our audits of UCrP and Pers Plus 5 Plan’s financial statements. We do not express an opinion or provide any assurance
on the information because the limited procedures do not provide us with sufficient evidence to express an opinion or provide
any assurance.
our audit was conducted for the purpose of forming an opinion on the Plans’ individual financial statements. the other
supplementary information on pages 53 through 55, related to the actuarial accrued liability, revenues by source, and
expenses by type for UCrP and the actuarial accrued liability for Pers Plus 5 Plan, is presented for purposes of additional
analysis and is not a required part of UCrP and Pers Plus 5 Plan’s financial statements. such information has not been
subjected to the auditing procedures applied in the audit of UCrP or Pers Plus 5 Plan’s financial statements, and accordingly,
we do not express an opinion or provide any assurance on it.
s a n f r a n C i s C o, C a l i f o r n i a
o C t o b e r 1 1 , 2 0 1 2
report of independent auditors

28 2 0 1 1 / 2 0 1 2 s t a t e m e n t s
Universit y of california re tirement system
stateMents of net PositionAt June 30, 2012 and 2011 (in thousands of dollars)
ucrP ucrsP Pers Plus 5
2012 2011 2012 2011 2012 2011
assets
investments, at fair value:
equity securities:
domestic $ 9,191,981 $10,283,299 $ 3,144,287 $ 3,190,803 $13,835 $16,722
foreign 7,123,502 8,467,617 988,876 1,016,208 10,722 13,766
private equities 3,394,329 2,875,906 183,153 204,715 5,109 4,675
fixed-income securities:
U.s. government 3,375,649 3,860,494 2,711,407 2,490,784 5,081 6,276
other U.s. dollar-denominated 5,990,275 5,597,391 3,734,148 3,486,662 9,016 9,101
foreign 198,860 103,798 299 169
insurance company contracts (at contract value) 514,147 630,091
commingled funds 9,957,296 8,759,512 1,001,690 855,768 14,860 14,372
real estate 2,257,061 1,983,283 3,397 3,224
real assets 531,858 327,189 801 532
investment derivatives 45,485 14,958 1,485 678 69 25
participants’ interests in mutual funds 4,426,842 4,488,491
participant 403(b) plan loans 146,055 139,424
total investments 42,066,296 42,273,447 16,852,090 16,503,624 63,189 68,862
investment of cash collateral 5,409,671 5,099,459 2,127,626 2,621,324 8,141 8,290
receivables:
contributions 354,975 301,000 70
interest and dividends 65,579 69,681 30,069 25,507 99 113
securities sales and other 704,855 111,466 262,664 129 1,042 92
total receivables 1,125,409 482,147 292,803 25,636 1,141 205
total assets 48,601,376 47,855,053 19,272,519 19,150,584 72,471 77,357
liabilities
payable for securities purchased 1,345,658 668,484 545,902 250,677 2,025 1,087
member withdrawals, refunds and other payables 41,550 214,478 2,941 2,980 65 452
collateral held for securities lending 5,407,683 5,099,436 2,126,844 2,621,312 8,138 8,290
total liabilities 6,794,891 5,982,398 2,675,687 2,874,969 10,228 9,829
net Position $41,806,485 $41,872,655 $16,596,832 $16,275,615 $62,243 $67,528
See accompanying notes to financial statements.
U n i v e r s i t y o f c a l i f o r n i a r e t i r e m e n t s y s t e m 1 1 / 1 2 a n n U a l f i n a n c i a l r e p o r t 29
Universit y of california re tirement system
stateMents of chanGes in net PositionFor the years ended June 30, 2012 and 2011 (in thousands of dollars)
ucrP ucrsP Pers Plus 5
2012 2011 2012 2011 2012 2011
aDDitions
contributions:
University $ 1,851,459 $ 1,677,921 $ 6,252 $ 5,711
members 272,421 143,261
participants 971,497 866,999
total contributions 2,123,880 1,821,182 977,749 872,710
investment income:net appreciation (depreciation)
in fair value of investments (783,531) 6,687,112 (192,647) 1,843,033 $ (1,312) $11,429
interest, dividends and other investment income 858,801 905,337 375,793 360,167 1,346 1,530
securities lending income 45,488 48,326 18,794 23,635 70 81
less securities lending fees and rebates (8,549) (15,274) (3,531) (7,470) (13) (26)
total investment income 112,209 7,625,501 198,409 2,219,365 91 13,014
interest income from contributions receivable 3,652 4,226
total additions 2,239,741 9,450,909 1,176,158 3,092,075 91 13,014
DeDuctions
benefit Payments:retirement payments 1,601,641 1,481,643 5,369 4,903
member withdrawals 93,992 78,776
cost-of-living adjustments 307,190 279,937
lump sum cashouts 187,799 200,907
preretirement survivor payments 38,545 35,931
disability payments 35,189 35,298
death payments 8,717 9,128
plan(s) benefit payments and participant withdrawals 846,375 860,562
total benefit Payments 2,273,073 2,121,620 846,375 860,562 5,369 4,903
expenses:plan administration 28,762 27,012 7,224 8,429 7 7
other 4,076 4,076 1,342
total expenses 32,838 31,088 8,566 8,429 7 7
total Deductions 2,305,911 2,152,708 854,941 868,991 5,376 4,910
increase (Decrease) in net Position (66,170) 7,298,201 321,217 2,223,084 (5,285) 8,104
net Position
Beginning of year 41,872,655 34,574,454 16,275,615 14,052,531 67,528 59,424
end of year $41,806,485 $41,872,655 $16,596,832 $16,275,615 $62,243 $67,528
See accompanying notes to financial statements.

30 n o t e s t o f i n a n c i a l s t a t e m e n t s
nOte 1 — deScriPtiOn Of the PlanS and SiGnificant accOuntinG POlicieS
General introductionThe University of California Retirement System (“UCRS”) comprises two defined benefit pension plans and four defined contribution plans. The Regents of the University of California (“The Regents”) acts as trustee associated with each of UCRS PlansotherthantheUCTax-Deferred403(b)Plan(“403(b)Plan”)andascustodianofthe403(b)Plan.Administrativeauthority with respect to UCRS Plans is vested in the President of the University as plan administrator and the President has redelegated that authority within UCRS to the Vice President — Human Resources. UCRS consists of two defined benefit pension plans known as the University of California Retirement Plan (“UCRP”) and the University of California Voluntary RetirementIncentiveProgram(“PERSPlus5Plan”),andalsoincludestheUniversityofCaliforniaRetirementSavingsProgram(“UCRSP” or the “Program”), of which includes four defined contribution plans known as the Defined Contribution Plan (“DC Plan”),theSupplementalDefinedContributionPlan(“SDCPlan”),the403(b)Planandthe457(b)DeferredCompensationPlan(“457(b)Plan”).Collectively,UCRSplansprovideforacombinationofdefinedbenefitsandvoluntaryretirementsavingsopportunities to eligible University employees and retirees.
ucrPUCRP is a defined benefit plan providing lifetime retirement income, disability protection, death benefits and postretirement and preretirement survivor benefits to eligible employees of the University of California (the University) and its affiliate, Hastings College of the Law.
Establishedin1961,membershipinUCRPisrequiredforallemployeesappointedtoworkatleast50percenttimeforoneyearormoreorforanindefiniteperiod.Employeeswithlimitedappointments,employeesincontractpositions,employeesin “non-career”positionsattheDepartmentofEnergy’s(DOE)LawrenceBerkeleyNationalLaboratory(LBNL)andcertainacademicemployeesareeligibleforUCRPmembershipafterworking1,000hours(750hoursfortheNon-SenateInstructionalUnit)inacontinuous12-monthperiod.
Generally,fiveyearsofservicearerequiredforentitlementtoUCRPbenefits.Theamountofthemonthlypensionbenefitisdetermined under the basic formula of covered compensation times age factor times years of service credit. The maximum monthlybenefitcannotexceed100percentoftheemployee’shighestaverageplancompensationovera36-monthperiod,asadjustedfortheannualInternalRevenueCode(IRC)§401(a)(17)limitoncoveredcompensation.TheannualbenefitissubjecttolimitationsestablishedbyIRC§415.Annualcost-of-livingadjustments(COLAs)aremadetomonthlybenefitsaccordingtoaspecifiedformulabasedontheConsumerPriceIndex(CPI).AdhocCOLAsmaybegrantedsubjecttofundingavailability.
U n i v e r s i t y o f c a l i f o r n i a r e t i r e m e n t s y s t e m
notes to financial statements Years ended June 30, 2012 and 2011

U n i v e r s i t y o f c a l i f o r n i a r e t i r e m e n t s y s t e m 1 1 / 1 2 a n n U a l f i n a n c i a l r e p o r t 31
EffectiveJuly1,2013,UCRPwasamendedtoprovideanewtierofpensionbenefitsapplicabletoemployeeshiredorreturnedafter a break in service, on or after July 1, 2013. The new tier would increase the early retirement age from 50 to 55 and normal retirement age to 65, but retain many of UCRP’s current features. The new tier would not offer lump sum cashouts, inactive memberCOLAsorsubsidizedsurvivorannuitiesforspousesanddomesticpartners.Forrepresentedemployees,allchangesaresubjecttocollectivebargaining.
UCRPofferedthreeVoluntaryEarlyRetirementIncentivePrograms(VERIPs)adoptedbyTheRegents,whichgrantedenhancedbenefitstocertaineligiblemembersuponelectingearlyretirement.TheVERIPsareknownasPlus5 (fiscalyear1990-1991),Take5(fiscalyear1992-1993)andVERIPIII(fiscalyear1993-1994).
UCRP includes four membership classifications: members with Social Security, members without Social Security, Safety members (police and firefighters) and Tier Two members. At June 30, 2012, active UCRP membership consisted of 115,209 members withSocialSecurity,1,272memberswithoutSocialSecurity,396Safetymembersand11TierTwomembers.
Members’contributionsarerecordedseparatelyandaccrueinterestataratedeterminedbyTheRegents.Currentlymembercontributions accrue interest at an annual compounded rate of 6.0 percent, credited monthly. Upon termination, members may electarefundoftheircontributionsplusaccumulatedinterest(andtheirCapitalAccumulationPayment(CAP)balanceifany); vested terminated members who are eligible to retire may also elect a lump sum payment equal to the actuarially equivalent present value of their accrued benefits. Both actions forfeit the member’s right to monthly benefits based on the same service credit.
FromJuly1,1966,toJune30,1971,UCRPmaintainedanoncontributoryperiodformostmembers;contributionswererequiredonlyfrommemberswhohadreachedagethirtyandhadatleastoneyearofservice.Memberplanaccountsdesignated“Plan 02” were established to keep track of contributions that would have been made had a member been contributing during this period. Future retirement benefits for members with Plan 02 accounts are reduced to account for the contributions that were not made, unless the member repays the Plan 02 balance.
FortheperiodfromJuly1,1987toJuly1,1990,qualifyingUCRPmemberscouldelecttoparticipateinnoncontributoryUCRPmembership known as Tier Two. Tier Two provides a lower level of retirement income, disability protection and survivor benefits, calculated using specific Tier Two formulas based on the member’s covered compensation times age factor times years of service credit.
UCRP members may also have a balance in UCRP consisting of CAP allocations, which were credited in behalf of eligible members on various dates in 1992, 1993, 1994, 2002 and 2003. Provided to supplement basic UCRP benefits, the allocations were equal to a percentage of the eligible member’s covered compensation paid during the specified period. The CAP balance is generally payable in a lump sum at retirement or separation from service and includes interest credited monthly equal to an annual percentage yield (APY) of 8.5 percent for allocations made in 1992, 1993 and 1994. For allocations made in 2002 and 2003, the interest creditedmonthlyisequaltoUCRP’sinvestmentrateofreturn,whichcurrentlyequatestoanAPYof7.5percent.TheAPYapplied to the 2002 and 2003 allocation will vary according to changes in the assumed earnings rate for UCRP.
At June 30, 2012, UCRP membership included 58,934 retirees, beneficiaries and disabled members currently receiving benefits, 32,873terminatedvestedemployeesentitledtobenefitsbutnotyetreceivingthem,and34,445terminatednon-vestedemployees entitled to a refund of their UCRP accumulations and/or CAP balances, including the CAP balances for Los Alamos National Laboratory (LANL) and Lawrence Livermore National Laboratory (LLNL) members who transferred their benefits and service credit to the defined benefit pension plans established by Los Alamos National Security (LANS) or Lawrence Livermore National Security (LLNS), as applicable, and are eligible for a CAP distribution. Of current active employees, 72,596arefullyvestedand44,292arenon-vestedactiveemployeescoveredbyUCRP.
EmployercontributionsaremadetoUCRPonbehalfofallmembers.TheannualrateofUniversitycontributionsisestablishedpursuant to The Regents’ funding policy (see Note 5 on page 50). For LLNL and LANL retirees and inactive members who remainmembersinUCRP,theDOEhasanongoingfinancialresponsibilitytoreimbursetheUniversityforcontributionstoUCRP, if needed, to satisfy the liabilities attributable to the benefits of members who previously worked at LLNL and LANL.

32 n o t e s t o f i n a n c i a l s t a t e m e n t s
ucrSPThe UC Chief Investment Officer oversees twelve single, diversified investment funds and seven primary asset class options thatformpartoftheUCCoreFundslineup.Inaddition,theUCCoreFundsline-upincludesfivemutualfundsthatarespecializedassetclassoptions.ParticipantsmaydirectinvestmentoftheircontributionsandtransferPlanaccumulations to any of these funds:
Thesingle,diversifiedinvestmentfundsincludetheBalancedGrowthFund,PathwayIncomeFundandPathway“targetdate”Funds for the years 2015, 2020, 2025, 2030, 2035, 2040, 2045, 2050, 2055 and 2060.
The primary asset class options include:
• SavingsFund• ICCFund• BondFund• TIPSFund• DomesticEquityIndexFund• EquityFund• InternationalEquityIndexFund
Thespecializedassetclassoptionsinclude:
• VanguardSmallCapIndexFund• VanguardREITIndexFund• VanguardFTSESocialIndexFund• DreyfusTreasuryPrimeCashManagementFund• DFAEmergingMarketsPortfolio
ParticipantsmayalsoinvestinmutualfundsofferedthroughFidelity(includingnon-Fidelitymutualfunds)andcertainCalvertGroupmutualfunds.Additionally,anetworkofmutualfundsisavailablethroughtheFidelityInvestmentsbrokerageservice.
Transfers and investment changes must be made in accordance with plan provisions, and all contributions made to UCRSP Plans are allocated to the designated plan and invested in one or more of the available investment options, as directed by the participants.
Participants’ interests in UCRSP Plans are fully and immediately vested and are distributable at death, retirement or terminationofemployment.Participantsmayelecttodeferdistributionuntilage70½orseparationfromservice,whichever islater,inaccordancewithIRCminimumdistributionrequirements.In-servicewithdrawalsarepermittedinconformancewith IRC regulations applicable to each plan.
Defined Contribution PlanThe University makes DC Plan retirement contributions on the summer or equivalent term salaries of eligible academic employees who teach, conduct research or provide administrative service during the summer session or an equivalent term. To be eligible, employees must hold academic year appointments and be active members of UCRP or another defined benefit plantowhichtheUniversitycontributes.Thecontributionrateis7.0percentofeligiblesalary,ofwhich3.5percentisUniversitypaidand3.5percentisemployee-paid,bothonapretaxbasis.TheUniversitymayalsomakecontributionsonbehalfofeligiblesenior managers.
TheDCPlanPretaxAccountalsoincludesmandatorycontributionsfrompart-time,seasonalandtemporaryemployeesattheUniversity who are not currently participating in UCRP or another defined benefit plan to which the University contributes (Safe Harbor participants). Safe Harbor participation includes certain University student employees and resident aliens with F-1andJ-1visastatus.SafeHarborparticipantscontribute7.5percentofgrosssalary(uptotheSocialSecuritywagebase) to the Plan in lieu of deductions for Social Security taxes.
All University employees, except students who normally work fewer than 20 hours per week, are eligible to make voluntary contributionstotheDCPlanAfter-TaxAccountanddefertaxationontheearningsuntiltheaccumulationsarewithdrawn. ThemaximumamountparticipantsmaycontributeannuallytotheAfter-TaxAccountisdeterminedbytheIRC§415(c)limit.The University may also make DC Plan contributions on behalf of eligible senior managers.

U n i v e r s i t y o f c a l i f o r n i a r e t i r e m e n t s y s t e m 1 1 / 1 2 a n n U a l f i n a n c i a l r e p o r t 33
Tax-Deferred 403(b) PlanThe 403(b) Plan is available to all University employees except students who normally work fewer than 20 hours per week.Employeeswhowanttoparticipateinthe403(b)PlandesignateaportionoftheirgrosssalarywithintheIRCestablishedlimitsto be contributed on a pretax basis, thus reducing their taxable income. Income taxes on contributions and any earnings are deferred (that is, postponed) until the participant withdraws the money. The University also makes 403(b) Plan contributions on behalf of eligible senior managers.
Annual salary deferral contribution limits for the 403(b) Plan during fiscal year 2011–2012, were as follows: the maximum annualcontributionlimitsforparticipantsunderage50forthecalendaryears2011and2012,were$16,500and$17,000,respectively(or100percentofadjustedgrosssalary,ifless).Forparticipantsage50orolder,theannualcontributionlimitswere$22,000and$22,500,respectively,forcalendaryears2011and2012,(or100percentofadjustedgrosssalary,ifless).Participantswith15ormoreyearsofservicemaybeabletoincreasetheirlimitunderanadditionalcatch-upprovisions.
457(b) Deferred Compensation PlanThe457(b)PlanisavailabletoallUniversityemployeesexceptstudentswhonormallyworklessthan20hoursperweek. Taxes on contributions (deferred compensation) and earnings thereon are deferred until the accumulations are withdrawn. TheUniversitymayalsomake457(b)DeferredCompensationPlancontributionsonbehalfofeligibleseniormanagers. Thedeferredcompensationlimitsforthe457(b)DeferredCompensationPlanwerethesameasthe403(b)Planlimits(describedinthepreviousparagraph)duringfiscalyear2011-2012.
university of california voluntary early retirement incentive ProgramSomeUniversityemployeesbecamemembersoftheCaliforniaPublicEmployees’RetirementPlan(CalPERS)beforeUCRPwasestablishedandcontinuedtoparticipateinCalPERSduringtheirUniversityemploymentafterUCRPwasestablished.TheUniversityofCaliforniacontributedtoCalPERSonbehalfoftheseUC-CalPERSmembers.TheUniversityofCaliforniaVoluntaryEarlyRetirementIncentiveProgram(thePERSPlus5Plan)isadefinedbenefitpensionplanestablishedbytheUniversitythatprovideslifetimesupplementalretirementincomeandsurvivorbenefitstoPERSPlus5PlanmemberswhoelectedearlyretirementunderCalPERS.
Generally,toparticipateinthePERSPlus5Plan,aneligibleemployeewasrequiredtoelectconcurrentretirementunderCalPERSandthePERSPlus5PlaneffectiveOctober1,1991,andmusthavehadacombinedageplusservicecreditequalto80yearsasofSeptember30,1991,ifclassifiedasaQualifiedAcademicSenateFacultyMember,orequalto75yearsifnotclassifiedasaQualifiedAcademicSenateFacultyMember.Of1,579eligibleemployees,879electedtoretireunderthePERSPlus5Plan.AsofJune30,2012,therewere659retireesandbeneficiariesinthePERSPlus5Plan.
ThecostofcontributionsmadetothePERSPlus5PlanisborneentirelybytheUniversity.Noadditionalcontributionsarerequired as long as the Plan remains fully funded under the actuarial assumptions used by the Plan.
EffectiveApril1,2011,thePERSPlus5Planwasamendedtoprovidea15.2percentadhoccost-of-livingadjustment(COLA)toallmonthlybenefits.EffectiveJuly1,2011,thePERSPlus5Planwasamended,subjecttofundingavailability,toprovideannual COLAs to monthly benefits according to a specified formula based on the Consumer Price Index. Ad hoc COLAs may alsobegrantedsubjecttofundingavailability.
basis of accountingThe financial statements have been prepared in accordance with accounting principles generally accepted in the United States ofAmerica,includingallapplicableeffectivestatementsoftheGovernmentalAccountingStandardsBoard(GASB),andtheaccrual basis of accounting.
InNovember2010,theGASBissuedStatementNo.61,The Financial Reporting Entity: Omnibus, effective for the Plans’ fiscal year beginning July 1, 2011. This Statement modifies the existing requirements for the assessment of component units that should be included in the financial statements of the University. Implementation of Statement No. 61 had no effect on the Plans’ net position or changes in net position for the years ended June 30, 2011 and 2012.
InJune2011,theGASBissuedStatementNo.63,Financial Reporting of Deferred Outflows of Resources, Deferred Inflows of Resources, and Net Position,effectivefortheUniversity’sfiscalyearbeginningJuly1,2012;however,thePlansearlyadoptedthisStatement effective for the fiscal year beginning July 1, 2011. This Statement modifies the presentation of deferred inflows and deferred outflows in the financial statements. The effect of the changes from the implementation of Statement No. 63 did not resultinanyadjustmentstothefinancialstatementsforthePlans.
34 n o t e s t o f i n a n c i a l s t a t e m e n t s
InJune2011,theGASBissuedStatementNo.64,Derivative Instruments: Application of Hedge Accounting Termination Provisions,effectivefortheUniversity’sfiscalyearbeginningJuly1,2012;however,thePlansearlyadoptedthisStatementeffective for the fiscal year beginning July 1, 2011. This Statement clarifies the existing requirements for the termination of hedge accounting. Implementation of Statement No. 64 had no effect on the Plans’ net position or changes in net position for the years ended June 30, 2011 and 2012.
valuation of investmentsInvestments are recorded at fair value. Securities, including derivative investments, are valued at the last sale price on the last businessdayofthefiscalyear,asquotedonarecognizedexchangeoranindustrystandardpricingservice,whenavailable.Securities for which no sale was reported as of the close of the last business day of the fiscal year are valued at the quoted bid price of a dealer who regularly trades in the security being valued. Certain securities may be valued on a basis of a price provided by a single source.
Asaresultofinactiveorilliquidmarkets,certaininvestmentsinnon-agencymortgage-backedfixed-incomesecuritiesarevaluedonthebasisoftheirestimatedfutureprincipalandinterestpaymentsusingappropriaterisk-adjusteddiscountrates.
Investments also include private equities, absolute return funds, real estate, real asset and certain corporate asset backed securities. Private equities include venture capital partnerships, buyout and international funds. Interests in private equity and realestatepartnershipsarebaseduponvaluationsprovidedbythegeneralpartnersoftherespectivepartnershipsasofMarch 31,adjustedforcashreceipts,cashdisbursementsandsecuritiesdistributionsthroughJune30.Investmentsinabsolutereturn partnershipsarevaluedasofMay31,adjustedforcashreceiptsandcashdisbursementsthroughJune30.Interestsincertain direct investments in real estate are estimated based upon independent appraisals. The University believes the carrying amount of these financial instruments and real estate is a reasonable estimate of fair value at June 30. Because the private equity, real estate and absolute return partnerships, along with direct investments in real estate, are not readily marketable, their estimated valueissubjecttouncertaintyand,therefore,maydiffersignificantlyfromthevaluethatwouldbeusedhadareadymarketfor such investments existed. Investments in registered investment companies are valued based upon the reported net asset value of those companies.
Insurance contracts are valued at contract value, plus reinvested interest, which approximates market value.
Derivative instruments are recorded at fair value. Futures contracts, foreign currency exchange contracts, stock rights and warrants,optionsandswaptionsarevaluedatthelastsalespriceonthelastdayofthefiscalyear,asquotedonarecognizedexchangeorutilizinganindustrystandardpricingservice,whenavailable.Financialinstitutionsorindependentadvisors have estimated the fair value of the interest rate swaps and total return swaps using quoted market prices when available or discounted expected future net cash flows.
accounting for investments
Investmenttransactionsarerecordedonthedatethesecuritiesarepurchasedorsold(tradedate).Realizedgainsorlossesarerecorded as the difference between the proceeds from the sale and the average cost of the investment sold. Dividend income isrecordedontheex-dividenddateandinterestincomeisaccruedasearned.
ContributionsallocatedtoUCRSPPlans’Pathway,Equity,Bond,TIPS,BalancedGrowth,DomesticEquityIndexandInternationalEquityIndexfundsarecreditedtoparticipantaccountsasunits.Thevalueofaunitchangeseachdaybased onthecurrentfairvalueoftheinvestmentportfolio.Earningsofeachfund,aswellasmarketfluctuations,arereflected in the unit values.
InvestmentsdenominatedinforeigncurrenciesaretranslatedintoU.S.dollarequivalentsusingyear-endspotforeigncurrencyexchange rates. Purchases and sales of investments and their related income are translated at the rate of exchange on the respectivetransactiondates.Realizedandunrealizedgainsandlossesresultingfromforeigncurrencychangesareincluded in the Plans’ statement of changes in net position.

U n i v e r s i t y o f c a l i f o r n i a r e t i r e m e n t s y s t e m 1 1 / 1 2 a n n U a l f i n a n c i a l r e p o r t 35
administrative expensesAdministrative expenses are incurred in connection with the operation of UCRS for costs such as staff salaries and benefits, investment management, information systems, leased space, supplies and equipment, and professional services rendered by the benefits consultants, legal counsel and independent auditor which are paid from UCRS’ assets.
UCRPadministrativeexpensesrepresentapproximately$32.8millionor0.08percentand$31.1millionor0.07percent,respectively, of the net position for fiscal years 2012 and 2011.
Under UCRSP, plan administrative fees are deducted from income on University managed investment funds before calculating unit values and interest factors. Administrative fees are used to pay investment management and investor education, accounting, audit, legal, custodial and recordkeeping services. Revenue sharing from certain mutual funds also is applied againstrecordkeepingcosts.ForthefiscalyearsendedJune30,2012and2011,administrativeexpensestotaled$7.2million and $8.4 million, respectively.
ReasonableadministrativeexpensesareassessedtothePERSPlus5Planthroughanannualaccountservicingcharge.
Status under the ircUCRP is intended to qualify under IRC §401(a) and the regulations thereunder and UCRP trust is intended to be exempt from taxationunderIRC§501(a).InalettertotheUniversitydatedNovember8,2007,theInternalRevenueService(IRS)confirmeditsdeterminationthattheformofUCRP,asamendedthroughDecember11,2002(otherthanamendmentsauthorizedbytheEconomicGrowthandTaxReliefReconciliationActof2001),mettherequirementsforqualificationunderIRC§401(a).Since then, UCRP has been amended to comply with subsequent tax acts and state laws and to make certain design changes recommended by the President and approved by The Regents. A request for a determination on UCRP, as amended, is pending before the IRS.
TheformofthePERSPlus5PlanisintendedtosatisfythequalificationrequirementunderIRC§401(a)andtheregulationsthereunder,andthePERSPlus5PlantrustisintendedtobeexemptfromtaxationunderIRC§501(a).
InJanuary1997,theIRSconfirmeditsdeterminationthattheformoftheDCPlanmettherequirementsforqualificationunder IRC §401(a). Since then, the DC Plan has been amended to comply with subsequent tax acts and state laws and to make certain design changes recommended by the President and approved by The Regents. The University has requested that the IRS issue an updated determination letter on the DC Plan, as amended.
Separately, the University has requested that the IRS issue a favorable determination letter on the SDC Plan. The form of the SDC Plan is intended to satisfy the qualification requirements of IRC §401(a) and its trust intended to be exempt from taxation under IRC §501(a).
Theformofthe403(b)PlanisintendedtosatisfytherequirementsofIRC§403(b).Theformofthe457(b)Planisintended tosatisfytherequirementsofIRC§457(b).
To the best of tax counsel’s knowledge, the Plans have been administered in accordance with their terms and the applicable provisions of the IRC and the regulations thereunder, in all material respects.
use of estimates in the Preparation of financial StatementsThe preparation of financial statements in conformity with accounting principles generally accepted in the United States of America requires management to make estimates and assumptions that affect the reported amounts of assets and liabilities and disclosure of contingent assets and liabilities at the date of the financial statements and the reported amounts of revenues and expenditures during the reporting period. Although management believes the estimates and assumptions are reasonable, theyarebaseduponinformationavailableatthetimetheestimateorjudgmentismadeandactualamountscoulddifferfromthose estimates.
The financial statements of UCRS Plans are intended to present the net position and the changes in net position of only that portion of activities that are attributable to UCRS. They do not purport to, and do not, present fairly the financial position of the University of California as of June 30, 2012 and 2011, and the changes in its financial position and cash flows for the years then ended.

36 n o t e s t o f i n a n c i a l s t a t e m e n t s
nOte 2 — inveStmentS
The Regents, as the governing board and as trustee, is responsible for the oversight of the Plans’ investments and establishes investmentpoliciesforUCRP,UCRSP,andthePERSPlus5Plan,whicharecarriedoutbytheChiefInvestmentOfficer.TheChief Investment Officer has primary fiduciary responsibility for investing UCRS’ assets consistent with the policies established by The Regents.
ParticipationintheUCShortTermInvestmentPool(STIP)maximizesthereturnsonshort-termcashbalancesinUCRSPlansby taking advantage of the economies of scale of investing in a large pool with a broad range of maturities. STIP is managed to maximizecurrentearnedincome.TheavailablecashinUCRSPlansawaitinginvestmentorforadministrativeexpensesisalsoinvestedinSTIP.InvestmentsauthorizedbyTheRegentsforSTIPincludefixed-incomesecuritieswithamaximummaturity offiveandone-halfyears.
InvestmentsauthorizedbyTheRegentsforUCRSPlans’investmentpoolsandseparateinvestmentsincludeequitysecurities,fixed-incomesecuritiesandcertainotherassetclasses.Theequityportionoftheinvestmentportfoliosmayincludebothdomestic and foreign common and preferred stocks, and actively managed and passive (index) strategies, along with a modest exposure to private equities. Private equities include venture capital partnerships, buyouts and international funds. Investment portfoliosmayincludecertainforeigncurrency-denominatedequitysecurities.
Thefixed-incomeportionoftheinvestmentportfoliosmayincludebothdomesticandforeignsecurities,alongwithcertainsecuritizedinvestments,includingmortgage-backedandasset-backedsecurities.Fixed-incomeinvestmentguidelinespermittheuseoffuturesandoptionsonfixed-incomeinstrumentsintheongoingmanagementoftheportfolios.DerivativecontractsareauthorizedforportfoliorebalancinginaccordancewithTheRegents’assetallocationpolicyandassubstitutesforphysicalsecurities.RealestateinvestmentsandabsolutereturnstrategiesareauthorizedforUCRSPlans.Absolutereturnstrategiesmay incorporate short sales, plus derivative positions to implement or hedge an investment position. They are not used for speculative purposes.

U n i v e r s i t y o f c a l i f o r n i a r e t i r e m e n t s y s t e m 1 1 / 1 2 a n n U a l f i n a n c i a l r e p o r t 37
The composition of investments and derivative instruments, by investment type at June 30, 2012 and 2011 is as follows:
(in thousands of dollars) [table composition of investments – nfs:2-a]
ucrP ucrsP Pers Plus 5
2012 2011 2012 2011 2012 2011
Equity securities:
domestic $ 9,191,981 $10,283,299 $ 3,144,287 $ 3,190,803 $13,835 $16,722foreign 7,123,502 8,467,617 988,876 1,016,208 10,722 13,766
equity securities 16,315,483 18,750,916 4,133,163 4,207,011 24,557 30,488
Fixed-income securities:
U.s. government-guaranteed:
U.s. treasury bills, notes and bonds 163,782 547,406 1,745,949 1,807,971 247 889U.s. treasury strips 388,650 271,844 238,239 201,508 585 442U.s. tips 2,809,176 3,026,651 727,219 481,305 4,228 4,921U.s. government-backed securities 14,041 14,593 21 24
fixed-income securities 3,375,649 3,860,494 2,711,407 2,490,784 5,081 6,276
Other U.S. dollar-denominated:
corporate bonds 1,960,568 1,739,829 359,074 284,574 2,951 2,830U.s. agencies 733,626 653,372 2,366,214 2,342,149 1,104 1,062
U.s. agencies asset-backed securities 1,538,434 1,200,554 690,092 476,037 2,316 1,952corporate asset-backed securities 549,559 797,244 163,890 263,372 827 1,296supranational/foreign 1,196,534 1,197,143 151,132 117,945 1,801 1,946
other 11,554 9,249 3,746 2,585 17 15
other u.s. Dollar-Denominated 5,990,275 5,597,391 3,734,148 3,486,662 9,016 9,101
Foreign currency-denominated:
corporate 198,860 103,798 299 169
foreign currency-Denominated 198,860 103,798 299 169
Commingled funds:
absolute return 3,009,129 2,831,652 4,529 4,603 Balanced funds 33,527 50 U.s. equity funds 1,229,108 1,144,974 16,848 101,457 1,850 1,860 non-U.s. equity funds 3,393,664 2,918,345 92,425 5,108 4,744 U.s. bond funds 890,989 476,681 1,341 775 non-U.s. bond funds 105,711 159 real estate investment trusts 6,391 95,846 90,864 10
money market funds* 1,288,777 1,387,860 796,571 663,447 1,813 2,390
commingled funds* 9,957,296 8,759,512 1,001,690 855,768 14,860 14,372
private equities 3,394,329 2,875,906 183,153 204,715 5,109 4,675
real assets 531,858 327,189 801 532real estate 2,257,061 1,983,283 3,397 3,224insurance company contracts 514,147 630,091investment derivatives 45,485 14,958 1,485 678 69 25
total investments** $42,066,296 $42,273,447 $12,279,193 $ 11,875,709 $63,189 $68,862
* Includes investment of $235,689 and $162,208 in UCRP, and $730,893 and $553,362 in UCRSP and $228 and $397 in PERS Plus 5 in the Short Term Investment Pool as of June 30, 2012 and 2011, respectively.
** Does not include participants’ interests in mutual funds and Participant 403(b) Plan loans shown in the statements of net position.

38 n o t e s t o f i n a n c i a l s t a t e m e n t s
investment risk factorsThere are many factors that can affect the value of investments overseen by the Chief Investment Officer. Some, such as custodialcreditrisk,concentrationofcreditriskandforeigncurrencyriskmayaffectbothequityandfixed-incomesecurities.Equitysecuritiesrespondtosuchfactorsaseconomicconditions,individualcompanyearningsperformanceandmarketliquidity,whilefixed-incomesecuritiesareparticularlysensitivetocreditrisksandchangesininterestrates.Alternativeinvestmentstrategiesandtheirunderlyingassetsandrightsarealsosubjecttoanarrayofeconomicandmarketvagariesthatcanlimitorerodevalue.Participants’interestsinmutualfundsaresubjecttoavarietyofinvestmentrisks.Aparticipantcanobtain information on risks by reviewing the fund prospectus available on the Fidelity Investments web site (netbenefits.com).
Credit RiskFixed-incomesecuritiesaresubjecttocreditrisk,whichisthechancethatabondissuerwillfailtopayinterestorprincipalina timely manner, or that negative perceptions of the issuer’s ability to make these payments will cause security prices to decline. These circumstances may arise due to a variety of factors such as financial weakness, bankruptcy, litigation and/or adverse political developments.
A bond’s credit quality is an assessment of the issuer’s ability to pay interest on the bond, and ultimately to pay the principal. Creditqualityisevaluatedbyoneoftheindependentbond-ratingagencies,forexample,Moody’sInvestorsService(Moody’s)or Standard and Poor’s (S&P). The lower the rating, the greater the chance, in the rating agency’s opinion, that the bond issuer willdefault,orfailtomeetitspaymentobligations.Generally,thelowerabond’screditrating,thehigheritsyieldshouldbetocompensate for the additional risk.
Certainfixed-incomesecurities,includingobligationsoftheU.S.governmentorthoseexplicitlyguaranteedbytheU.S.government, are not considered to have credit risk. On August 8, 2011, the S&P downgraded the credit ratings of certain long-termdebtinstrumentsissuedbyFannieMaeandFreddieMacandotherU.S.governmentagencieslinkedtolong-termU.S. debt. These downgrades could adversely affect the market value of such instruments and the credit risk associated with our investments in U.S. Treasury securities held as investments.
Asset-backedsecuritiesaredebtobligationsthatrepresentclaimstothecashflowsfrompoolsofcommercial,mortgage, creditcardorstudentloans.MortgagebackedsecuritiesissuedbyGinnieMaearebackedbythefullfaithandcreditofthe U.S.government.EffectiveSeptember2008,FannieMaeandFreddieMacwereplacedundertheconservatorshipofthe Federal Housing Finance Agency. At the same time, the U.S. Treasury put in place a set of financing agreements to ensure FannieMaeandFreddieMachavetheabilitytofulfilltheirobligationstoholdersofbondsthattheyhaveissuedorguaranteed.
TheinvestmentguidelinesforSTIPrecognizethatalimitedamountofcreditrisk,properlymanagedandmonitored,isprudentandprovidesincrementalrisk-adjustedreturnoveritsbenchmark.(ThebenchmarkforSTIP,thetwo-yearTreasuryNote,doesnot contain credit risk.) No more than 5 percent of the total market value of the STIP portfolio may be invested in securities rated below investment grade (BB, Ba or lower). The average credit quality of STIP must be A or better, and commercial paper mustberatedatleastA-1,P-1orF-1.
Credit risk is appropriate in balanced investment pools such as UCRS Plans by virtue of the benchmark chosen for the fixed-incomeportionofthepool.
Thefixed-incomebenchmarkforUCRSPlans,theBarclaysCapitalU.S.AggregateBondIndex,iscomprisedofapproximately25percentcorporatebondsand35percentmortgage/asset-backedsecurities,allofwhichcarrysomedegreeofcreditrisk. Theremaining40percentiscomprisedofgovernment-issuedbonds.
Credit risk in UCRS Plans is managed primarily by diversifying across issuers. In addition, portfolio guidelines for UCRS Plans mandatethatnomorethan10percentofthemarketvalueoffixed-incomesecuritiesmaybeinvestedinissueswithacreditrating below investment grade. Further, the weighted average credit rating must be A or higher.
Inaddition,theinvestmentpoliciesforUCRSPlansallowsfordedicatedallocationstonon-investmentgradeandemergingmarket bonds, investment in which entails credit, default and/or sovereign risk.

U n i v e r s i t y o f c a l i f o r n i a r e t i r e m e n t s y s t e m 1 1 / 1 2 a n n U a l f i n a n c i a l r e p o r t 39
The credit risk profile for fixed or variable income securities at June 30, 2012 and 2011 is as follows:
Fixed- or variable-income securities ($ in thousands) [table credit risk profile – nfs:2-B]
ucrP ucrsP Pers Plus 5
2012 2011 2012 2011 2012 2011
U.s. government-guaranteed $3,375,649 $ 3,860,494 $2,711,407 $2,490,784 $5,081 $6,276
Other U.S. dollar-denominated:
aaa 2,442,321 2,124,980 2,849,242 2,862,374 3,674 3,457aa 165,221 148,775 327,836 56,360 249 242a 693,589 713,169 218,342 280,827 1,044 1,159BBB 1,002,180 932,059 254,132 182,788 1,509 1,515BB 429,579 431,429 21,425 22,739 647 701B 1,074,167 987,663 1,880 5,203 1,617 1,606cc or below 181,473 256,532 38,260 75,973 273 417a1/p1/f1 773 22,801 133 1not rated 1,745 2,011 230 265 3 3
Foreign currency-denominated:
a 186,982 281 BBB 88,318 144B 11,878 15,480 18 25
Commingled funds:
U.s. bond funds: not rated 890,989 476,681 1,341 775non-U.s. bond funds: not rated 105,711 159 money market funds: not rated 1,288,777 1,387,860 796,571 663,447 1,813 2,390
Investment derivatives:
a 1,715 3
insurance company contracts 514,147 630,091
Custodial Credit RiskCustodial credit risk is the risk that, in the event of the failure of the custodian, the investments may not be returned. UCRS Plans’ securities are registered in the name of The Regents by the custodial bank. Other types of investments represent ownershipintereststhatdonotexistinphysicalorbook-entryform.Asaresult,custodialcreditriskforsuchinvestments is remote.
Concentration of Credit RiskConcentration of credit risk is the risk associated with a lack of diversification, such as having substantial investments in a few individual issuers, thereby exposing UCRS Plans to greater risks resulting from adverse economic, political, regulatory, geographic or credit developments.
TheU.S.andnon-U.S.equityportionsofUCRSmaybemanagedeitherpassivelyoractively.Fortheportionmanagedpassively,the concentration of individual securities is exactly equal to their concentration in the benchmark. While some securities have a larger representation in the benchmark than others, The Regents considers that passive management results in an absence of concentration of credit risk. For the portion managed actively, asset class guidelines do not specifically address concentration risk, but do state that the U.S. equity asset class in the aggregate will be appropriately diversified to control overall risk and will exhibit portfolio characteristics similar to the asset class benchmark (including concentration of credit risk). Concentrationriskforindividualportfoliosismonitoredrelativetotheirindividualbenchmarksandagreed-uponriskparameters in their guidelines.
Investmentguidelinesaddressingconcentrationofcreditriskrelatedtotheinvestment-gradefixed-incomeportionofUCRS’investment portfolio include a limit of no more than 3 percent of the portfolio’s market value to be invested in any single issuer (except for securities issued by the U.S. government or its agencies) at the time of purchase. These same guidelines apply to the STIP.Forhigh-yieldandemergingmarketdebt,thecorrespondinglimitis5percent.

40 n o t e s t o f i n a n c i a l s t a t e m e n t s
Investments in issuers other than U.S. government guaranteed securities that represent 5 percent or more of investments held at June 30, 2012 and 2011 are as follows:
(in thousands of dollars) [table – Ucrs nfs-2d-1-con]
ucrP ucrsP Pers Plus 5
2012 2011 2012 2011 2012 2011
federal national mortgage association $1,611,000 federal farm credit Bank U.s. treasury strips 734,323
Interest Rate RiskInterestrateriskistheriskthatthevalueoffixed-incomesecuritieswilldeclinebecauseofchanginginterestrates.Thepricesoffixed-incomesecuritieswithalongertimetomaturity,measuredbyeffectiveduration,tendtobemoresensitivetochangesininterestratesand,therefore,morevolatilethanthosewithshorterdurations.Effectivedurationistheapproximatechangeinprice of a security resulting from a 100 basis point (1 percentage point) change in the level of interest rates. It is not a measure of time.
Interest rate risk for the STIP is managed by constraining the maturity of all individual securities to be less than five and one-halfyears.Thereisnorestrictiononweightedaveragematurityoftheportfolioasitismanagedrelativetotheliquiditydemands of the investors. The nature and maturity of individual securities in the STIP allow for the use of weighted average maturity as an effective risk management tool, rather than the more complex measure, effective duration.
Portfolioguidelinesforthefixed-incomeportionofUCRSPlanslimitweightedaverageeffectivedurationtotheeffectiveduration of the benchmark Barclays Capital U.S. Aggregate Bond Index, plus or minus 20 percent. These portfolio guidelines constrain the potential price movement due to interest rate changes of the portfolio to be similar to that of the benchmark. Therearesimilarrestrictionsforthehigh-yieldandemergingmarketdebtportfoliosrelativetotheirbenchmarks.
Theeffectivedurationforfixed-incomesecuritiesatJune30,2012and2011areasfollows:Fixed- or variable-income securities (in years) [table – effective duration – nfs:2-c]
ucrP ucrsP Pers Plus 5
2012 2011 2012 2011 2012 2011
Fixed-income securities:U.s. government-guaranteed:
U.s. treasury bills, notes and bonds 2.9 1.5 1.6 1.7 2.9 1.5U.s. treasury strips 9.1 6.9 8.0 7.0 9.1 6.9U.s. tips 4.7 4.5 5.1 4.4 4.7 4.5U.s. government-backed securities 5.2 5.5 5.2 5.5
Other U.S dollar-denominated:
corporate bonds 5.6 5.3 6.9 6.2 5.6 5.3U.s. agencies 4.6 5.7 5.9 1.8 4.6 5.7U.s. agencies asset-backed securities 3.9 5.1 3.6 2.4 3.9 5.1corporate asset-backed securities 3.6 3.5 3.9 3.6 3.6 3.5supranational/foreign 6.4 6.3 6.4 6.2 6.4 6.3other 14.5 13.1 14.5 13.0 14.5 13.1
Foreign currency denominated:
corporate 2.1 4.1 2.1 4.1
Commingled funds:
U.s. bond funds 5.2 5.2 5.2 5.2
money market funds 1.9 1.5 1.5 1.5
Investment derivatives: 0.2
Themoneymarketfundsconsistofunderlyingsecuritiesthatareofashort-term,liquidnature.
Investmentsmayalsoincludevariousmortgage-backedsecurities,collateralizedmortgageobligations,structurednotes,variable-ratesecuritiesandcallablebondsthatmaybeconsideredtobehighlysensitivetochangesininterestratesduetothe existence of prepayment or conversion features. Although the effective durations of the securities may be low, they are considered to be highly sensitive to changes in interest rates.

U n i v e r s i t y o f c a l i f o r n i a r e t i r e m e n t s y s t e m 1 1 / 1 2 a n n U a l f i n a n c i a l r e p o r t 41
At June 30, 2012 and 2011, the fair values of such investments are as follows:
(in thousands of dollars) [table – interest rate risk – nfs:2-d]
ucrP ucrsP Pers Plus 5
2012 2011 2012 2011 2012 2011
mortgage-backed securities $1,852,997 $1,347,986 $ 666,001 $ 478,118 $2,789 $2,191collateralized mortgage obligations 204,054 84,980 171,295 26,960 307 138other asset-backed securities 31,207 209,572 16,686 85,272 47 341structured notes 1,620 2variable-rate securities 110,890 373,758 13,602 149,060 167 608callable bonds 1,055,015 988,417 1,745,471 860,680 1,588 1,607convertible bonds 4,432 7,172 7 12
total $3,260,215 $3,011,885 $2,613,055 $1,600,090 $4,907 $4,897
Mortgage-backed securitiesThesesecuritiesareissuedbyFannieMae,GinnieMaeandFreddieMacandincludeshortembeddedprepaymentoptions.Unanticipated prepayments by the obligees of the underlying asset reduce the total expected rate of return.
Collateralized mortgage obligationsCollateralizedmortgageobligations(CMOs)generateareturnbaseduponthepaymentofeitherinterestorprincipalonmortgages in an underlying pool. The relationship between interest rates and prepayments make the fair value highly sensitive tochangesininterestrates.Infallinginterestrateenvironments,theunderlyingmortgagesaresubjecttoahigherpropensity of prepayments. In a rising interest rate environment, the opposite is true.
Other asset-backed securitiesOtherasset-backedsecuritiesalsogenerateareturnbaseduponthepaymentofeitherinterestorprincipalonobligationsin anunderlyingpool,generallyassociatedwithautoloansorcreditcards.AswithCMOs,therelationshipbetweeninterestratesand prepayments make the fair value highly sensitive to changes in interest rates.
Variable-rate securitiesThesesecuritiesareinvestmentswithtermsthatprovidefortheadjustmentoftheirinterestratesonsetdatesandareexpectedtohavefairvaluesthatwillberelativelyunaffectedbyinterestratechanges.Variable-ratesecuritiesmayhavelimitsonhowhigh or low the interest rate may change. These constraints may affect the market value of the security.
Callable bondsAlthough bonds are issued with clearly defined maturities, an issuer may be able to redeem, or call, a bond earlier than its maturity date. The called bond must then be replaced with a bond that may have a lower yield than the original. The call feature causes the fair value to be highly sensitive to changes in interest rates. At June 30, 2012 and 2011, the effective durations for these securities are as follows:
[(in years) table – Callable Bonds – NFS:2-E]
ucrP ucrsP Pers Plus 5
2012 2011 2012 2011 2012 2011
mortgage-backed securities 4.0 4.9 4.0 5.1 4.0 4.9collateralized mortgage obligations 2.1 2.9 2.5 3.6 2.1 2.9other asset-backed securities 0.6 1.3 1.9 0.5 0.6 1.3structured notes 1.0 1.0variable-rate securities 5.4 4.8 6.6 1.3 5.4 4.8callable bonds 5.0 4.6 2.0 2.3 5.0 4.6convertible bonds 3.7 9.0 3.7 9.0

42 n o t e s t o f i n a n c i a l s t a t e m e n t s
Liquidity RisksAlternativeinvestmentsaresubjecttoliquidityrisk.Alternativeinvestmentsincludehedgefunds,limitedpartnerships,privateequityandventurecapitalfunds.Additionally,certainasset-backedsecuritiesarethinlytradedandsubjecttoliquidityrisk.
Alternative investments include ownership interests in a wide variety of vehicles including partnerships and corporations that maybedomiciledintheUnitedStatesoroffshore.Generally,thereislittleornoregulationoftheseinvestmentvehiclesbytheSecuritiesandExchangeCommissionortheapplicablestateagencies.Managersoftheseinvestmentsemployawidevarietyofstrategies and have areas of concentration including absolute return, venture capital or early stage investing, private equity or laterstageinvestingandtheunderlyinginvestmentsmaybeleveragedtoenhancethetotalinvestmentreturn.Eachassetclasshas guidelines and policies regarding the use of leverage. Such underlying investments may include financial assets such as marketablesecurities,non-marketablesecurities,derivativesandothersyntheticandstructuredinvestmentsaswellastangibleand intangible assets.
These securities do not have a ready market and ownership interests in these investment vehicles may not be traded without theapprovalofthegeneralpartnerorfundmanagement.Theseinvestmentsaresubjecttotherisksgenerallyassociatedwithequitiesandfixed-incomeinstrumentswithadditionalrisksduetoleverageandthelackofareadymarketforacquisitionordisposition of ownership interests.
UCRS Plans’ investment portfolios include the following values for alternative investments as of June 2012 and 2011:
(in thousands of dollars) [table liquidity risks – nfs:2-g]
ucrP ucrsP Pers Plus 5
2012 2011 2012 2011 2012 2011
absolute return funds $3,009,129 $2,831,652 $ 4,529 $ 4,603
private equities 3,394,329 2,875,906 $183,153 $204,715 5,109 4,675
real estate 2,257,061 1,983,283 3,397 3,224
real assets 531,858 327,189 801 532
corporate asset backed securities 207,913 64,759 338
total $9,192,377 $8,225,943 $183,153 $269,474 $13,836 $13,372
UCRS Plans also made commitments to make investments in certain investment partnerships pursuant to provisions in the various partnership agreements. These commitments at June 30, 2012 totaled $3.4 billion.
Foreign Currency RiskTheRegents’strategicassetallocationpoliciesincludeallocationstonon-U.S.equitiesandnon-dollardenominatedbonds.Thebenchmarksfortheseinvestmentsarenothedged;therefore,foreigncurrencyriskisanessentialpartoftheinvestmentstrategies.PortfolioguidelinesforU.S.investment-grade,fixed-incomesecuritiesalsoallowexposuretonon-U.S.dollar-denominatedbondsupto10percentofthetotalportfoliomarketvalue.Exposuretoforeigncurrencyriskfromthesesecuritiesis permitted and it may be fully or partially hedged using forward foreign currency exchange contracts. Under The Regents’ investment policies, such instruments are not permitted for speculative use or to create leverage. Similar limits on foreign exchangeexposureapplytothehigh-yielddebtandemergingmarketdebtportfolios(10percentand20percent,respectively).

U n i v e r s i t y o f c a l i f o r n i a r e t i r e m e n t s y s t e m 1 1 / 1 2 a n n U a l f i n a n c i a l r e p o r t 43
AtJune30,2012and2011,theU.S.dollar-denominatedbalancesorganizedbycurrencydenominationsandinvestmenttypeare as follows:
(in thousands of dollars) [table - foreign currency risk – nfs:2-f]
ucrP ucrsP Pers Plus 5
2012 2011 2012 2011 2012 2011
Equity securities:euro $ 1,732,335 $ 2,448,950 $ 242,672 $ 288,996 $ 2,608 $ 3,981 British pound 1,445,699 1,563,928 196,101 186,403 2,176 2,543 Japanese yen 1,387,983 1,543,259 193,044 183,636 2,089 2,509 canadian dollar 656,389 760,403 107,516 107,691 988 1,236 swiss franc 540,217 643,741 76,341 76,136 813 1,047 australian dollar 529,411 616,454 78,050 78,893 797 1,002 hong Kong dollar 226,074 241,207 26,939 24,897 340 392 swedish Krona 183,949 240,307 26,964 28,595 277 391 singapore dollar 131,215 137,930 16,440 15,318 198 224 danish Krone 77,306 78,654 10,198 9,587 116 128 norwegian Krone 76,063 72,870 8,204 8,413 114 118 israeli shekel 28,809 41,906 5,260 6,578 43 68 other 108,052 78,008 1,147 1,065 163 127
subtotal 7,123,502 8,467,617 988,876 1,016,208 10,722 13,766
Fixed-income securities:mexican peso 25,775 12,765 39 20 south african rand 23,768 12,180 36 20 Brazilian real 23,705 16,150 35 27 malaysian ringgit 22,577 12,489 34 22 turkish lira 22,088 6,737 33 11 polish Zloty 21,032 8,570 32 14 indonesian rupiah 14,881 11,446 22 19 new russian ruble 12,671 19 thailand Baht 11,422 5,785 17 9 euro 11,157 13,759 17 21 other 9,784 3,917 15 6
subtotal 198,860 103,798 299 169
commingled funds non-U.s. equity funds: 3,393,664 2,918,345 92,425 5,108 4,744 non-U.s. bond funds: 105,711 159
subtotal 3,499,375 2,918,345 92,425 5,267 4,744
Investment derivatives:euro 2,911 905 268 74 4 1 swedish Krona 1,180 (1,335) 2 (2)British pound 1,014 431 64 50 2 1 Japanese yen 551 465 64 28 1 1 canadian dollar (24) 58 60 18 australian dollar (1,033) (624) 18 34 (2) (1)other 9 259 7 7
subtotal 4,608 159 481 211 7
Private equity:euro 71,909 57,403 4,173 4,012 108 93 other 11,202 8,940 568 1,029 17 15
Real estate: hong Kong dollar 7,342 30,389 11 49australian dollar 5,316 23,105 8 38Japanese yen 5,155 19,479 8 32euro 4,114 17,760 6 29singapore dollar 3,853 11,756 6 20British pound 3,341 12,425 5 19other 7,543 17,956 11 29
subtotal 119,775 199,213 4,741 5,041 180 324
total exposure to foreign currency risk $10,946,120 $11,689,132 $1,086,523 $1,021,460 $16,475 $ 19,003

44 n o t e s t o f i n a n c i a l s t a t e m e n t s
nOte 3 — SecuritieS lendinG
UCRS Plans participate in a securities lending program as a means to augment income. Securities invested by the Chief Investment Officer are lent to selected brokerage firms for which collateral received equals or exceeds the fair value of such investments during the period of the loan. Securities loans immediately terminate upon notice by either UCRS Plans or the borrower. Collateral may be cash or securities issued by the U.S. government or its agencies, or the sovereign or provincial debt of foreign countries. Collateral securities cannot be pledged or sold by UCRS Plans unless the borrower defaults.
Loansofdomesticequitiesandallfixed-incomesecuritiesareinitiallycollateralizedat102percentofthefairvalue of securities lent.
Loansofforeignequitiesareinitiallycollateralizedat105percent.Allborrowersarerequiredtoprovideadditionalcollateral by the next business day if the value of the collateral falls to less than 100 percent of the fair value of securities lent.
Cash collateral received from the borrower is invested by lending agents, as agents for UCRS Plans, in investment pools in the name of UCRS Plans, with guidelines approved by the Plans. These investments are shown as investment of cash collateral in the statements of net position. At June 30, 2012 and 2011, the securities in these pools had a weighted average maturity of26and17days,respectively.UCRSPlansrecordaliabilityforthereturnofthecashcollateralshownascollateralheldforsecurities lending in the statements of net position. Securities collateral received from the borrower is held in an investment pool by UCRS Plans’ custodial bank.
At June 30, 2012, UCRS Plans had little exposure to borrowers because the amounts UCRS Plans owed the borrowers were substantially the same as the amounts the borrowers owed UCRS Plans. UCRS Plans are fully indemnified by their lending agents against any losses incurred as a result of borrower default.

U n i v e r s i t y o f c a l i f o r n i a r e t i r e m e n t s y s t e m 1 1 / 1 2 a n n U a l f i n a n c i a l r e p o r t 45
Securities lending transactions at June 30, 2012 and 2011 are as follows:(in thousands of dollars) [table: securities lending transactions – nfs:3-a]
ucrP ucrsP Pers Plus 5
2012 2011 2012 2011 2012 2011
securities lent
For cash collateral:equity securities:
domestic $ 2,445,607 $ 1,730,369 $ 751,983 $ 419,651 $ 3,680 $ 2,813foreign 521,250 719,626 67,486 90,147 784 1,170
fixed-income securities:U.s. government 1,733,140 1,907,528 759,090 1,297,676 2,608 3,101other U.s. dollar-denominated 646,930 636,042 519,662 760,059 974 1,034
lent for cash collateral 5,346,927 4,993,565 2,098,221 2,567,533 8,046 8,118for securities collateral:
equity securities:domestic 185,436 155,398 52,300 33,650 279 253foreign 1,097,867 1,298,332 157,087 147,588 1,652 2,111
fixed-income securities: U.s. government 451,152 1,084,932 496,307 895,564 679 1,763
other U.s. dollar-denominated 3,087 222,293 729,654 5 361foreign currency-denominated 3,428 6
lent for securities collateral 1,737,542 2,764,383 705,694 1,806,456 2,615 4,494total securities lent $7,084,469 $ 7,757,948 $2,803,915 $ 4,373,989 $10,661 $ 12,612
collateral receiveD
cash $5,407,683 $ 5,099,436 $2,126,844 $ 2,621,312 $8,138 $ 8,290securities 1,884,002 2,868,956 765,179 1,874,792 2,835 4,664
total collateral received $7,291,685 $ 7,968,392 $2,892,023 $ 4,496,104 $10,973 $ 12,954
investMent of cash receiveD
fixed or variable income securities:other U.s. dollar-denominated:
corporate bonds $ 383,375 $ 462,489 $ 150,781 $ 237,737 $ 577 $ 752commercial paper 57,874 180,744 22,761 92,911 87 294repurchase agreements 2,840,589 2,735,896 1,117,206 1,406,357 4,275 4,447corporate asset-backed securities 902,772 296,508 355,062 152,416 1,359 482certificates of deposit/time deposits 945,784 456,571 371,977 234,696 1,423 742supranational/foreign 346,335 707,934 136,214 363,907 521 1,151U.s. agencies 258,230 132,741 420
assets (liabilities), net* (67,058) 1,087 (26,375) 559 (101) 2total investment of cash collateral $5,409,671 $ 5,099,459 $2,127,626 $ 2,621,324 $ 8,141 $ 8,290
* Other assets (liabilities), net is comprised of pending settlements of cash collateral investments.
UCRS Plans earn interest and dividends on the collateral held during the loan period, as well as a fee from the brokerage firm, and are obligated to pay a fee and rebate to the borrower. UCRS receives the net investment income. The securities lending income and fees and rebates for the years ended June 30, 2012 and 2011 are as follows:
(in thousands of dollars) [table securities lending income – nfs:3-B]
ucrP ucrsP Pers Plus 5
2012 2011 2012 2011 2012 2011
securities lending income $45,488 $ 48,326 $18,794 $ 23,635 $70 $81securities lending fees and rebates (8,549) (15,274) (3,531) (7,470) (13) (26)securities lending income, net $36,939 $ 33,052 $15,263 $ 16,165 $57 $55

46 n o t e s t o f i n a n c i a l s t a t e m e n t s
investment risk factorsThere are a variety of potential risk factors involved in a securities lending program. Risks associated with the investment ofcashcollateralmayincludethecreditriskfromfixed-incomesecurities,concentrationofcreditrisk,interestraterisk and foreign currency risk. In addition, there may be custodial credit risk associated with both cash and securities received as collateral for securities lent.
UCRSPlans’investmentpoliciesandotherinformationrelatedtoeachoftheserisksaresummarizedbelow.
Credit RiskUCRS Plans’ investment policies for the investment of cash collateral maintained in separately managed collateral pools restrictthecreditratingofissuerstonolessthanA-1,P-1orF-1forshort-termsecuritiesandnolessthanA2/Afor long-termsecurities.Asset-backedsecuritiesmusthavearatingofAAA.
Thecreditriskprofileforfixed-orvariable-incomesecuritiesandcommingledfundsassociatedwiththeinvestment of cash collateral at June 30, 2012 and 2011 is as follows:
(in thousands of dollars) [table credit risk – nfs:3-c]
ucrP ucrsP Pers Plus 5
2012 2011 2012 2011 2012 2011
other U.s. dollar-denominated:aaa $ 868,451 $ 678,768 $ 341,562 $ 348,914 $1,307 $1,103aa 686,822 984,469 270,129 506,054 1,034 1,600a 130,710 61,925 51,409 31,831 197 101a1/p1/f1 3,790,745 3,373,210 1,490,901 1,733,964 5,705 5,484
assets (liabilities), net: not rated1 (67,058) 1,087 (26,375) 559 (101) 2
1 Liabilities, net is comprised of pending settlements of cash collateral investments.
Custodial Credit RiskCash collateral received for securities lent is invested in pools by UCRS Plans’ lending agents. UCRS Plans’ securities related to the investment of cash collateral are registered in UCRS Plans’ name by the lending agent. Securities collateral received for securities lent are held in investment pools by UCRS Plans’ lending agent. As a result, custodial credit risk is remote.
Concentration of Credit RiskUCRS Plans’ investment policies with respect to the concentration of credit risk associated with the investment of cash collateral in the separately managed collateral pools restricts investments in any single issuer of corporate debt securities, time deposits, certificates of deposit, bankers acceptances and money market funds to no more than 5 percent of the portfolio value at the time of purchase.
Investments in issuers other than U.S. government guaranteed securities that represent 5 percent or more of the total investment of cash collateral held at June 30, 2012 and 2011 are as follows:
(in thousands of dollars) [table concentration of credit risk – nfs:3-d]
ucrP ucrsP Pers Plus 5
2012 2011 2012 2011 2012 2011
Bank of america $ 836,666Bnp paribas 451,282ing Bank 347,715morgan stanley 372,566
Interest Rate RiskThe nature of individual securities in the collateral pools allows for the use of weighted average maturity as an effective risk management measure. UCRS Plans’ investment policy with respect to the interest rate risk associated with the investment of cash collateral in the separately managed collateral pools requires the weighted average maturity of the entire collateral pool tobelessthan120days.ThematurityofsecuritiesissuedbytheU.S.governmentandasset-backedsecuritiesmustbelessthanfive years, corporate debt obligations must be less than two years and time deposits must be less than 190 days. Floating rate debt may be used, but it is limited to 65 percent of the market value of the portfolio.

U n i v e r s i t y o f c a l i f o r n i a r e t i r e m e n t s y s t e m 1 1 / 1 2 a n n U a l f i n a n c i a l r e p o r t 47
Theweightedaveragematurityexpressedindaysoutstandingforfixed-orvariable-incomesecuritiesassociatedwiththeinvestment of cash collateral at June 30, 2012 and 2011 is as follows:
(in days) [table interest rate risk (Wam) – nfs:3-e]
ucrP ucrsP Pers Plus 5
2012 2011 2012 2011 2012 2011
other U.s. dollar-denominated:corporate bonds 48 23 48 23 48 23commercial paper 28 31 28 31 28 31repurchase agreements 14 8 14 8 14 8U.s. agencies 15 15 15corporate asset-backed securities 23 15 23 15 23 15certificates of deposit/time deposits 45 26 45 26 45 26supranational/foreign 53 38 53 38 53 38
Investmentofcashcollateralmayincludevariousasset-backedsecurities,structurednotesandvariable-ratesecuritiesthatmay be considered to be highly sensitive to changes in interest rates due to the existence of prepayment or conversion features, although the weighted average maturity may be short.
At June 30, 2012 and 2011, the fair value of investments that are considered to be highly sensitive to changes in interest rates is as follows:
(in thousands of dollars) [table interest rate sensitive – nfs:3-f]
ucrP ucrsP Pers Plus 5
2012 2011 2012 2011 2012 2011
other asset-backed securities $902,664 $ 296,508 $355,062 $152,416 $1,467 $ 482variable-rate investments 383,330 1,170,422 150,781 601,644 623 1,903
AtJune30,2012and2011,theweightedaveragematurityexpressedindaysoutstandingforasset-backedsecuritieswas17daysand15days,respectively;48daysand32days,respectively,forvariable-rateinvestments.
Foreign Currency RiskUCRS Plans’ investment policies with respect to the foreign currency risk associated with the investment of cash collateral maintainedinseparatecollateralpoolsrestrictsinvestmentstoU.S.dollar-denominatedsecurities.Therefore,thereisnoforeign currency risk.
nOte 4 — financial derivative inStrumentS
UCRS Plans investments overseen by the Chief Investment Officer may use derivatives including futures, foreign currency exchangecontracts,options,forwardcontracts,stockrightsandwarrantsasasubstituteforinvestmentinequityandfixed-incomesecurities or to reduce the effect of fluctuating foreign currencies on foreign currency denominated investments.
UCRSPlansenterintofuturescontractsforthepurposeofactingasasubstituteforinvestmentinequityandfixed-incomesecurities. A futures contract is an agreement between two parties to buy and sell a security or financial index, interest rate orforeigncurrencyatasetpriceonafuturedate.Theyarestandardizedcontractsthatcanbeeasilyboughtandsoldandareexchange-traded.Uponenteringintosuchacontract,UCRSPlansarerequiredtopledgetothebrokeranamountofcashorsecurities equal to the minimum initial margin requirements of the exchange on which the contract is traded. Pursuant to the contract, UCRS Plans agree to receive from, or pay to, the counterparty an amount of cash equal to the daily fluctuation inthevalueofthecontract.Thesecontractsaresettledonadailybasis,withtheresultingrealizedgainorlossincludedinthestatement of revenues, expenses and changes in net position. The settlement amount at the end of each day for each of the contracts, or variation margin, is included in investments and represents the fair value of the contracts.
Forwardcontractsaresimilartofuturescontracts,althoughtheyarenotexchange-traded.Foreigncurrencyexchangecontractsareforwardcontractsusedtohedgeagainstforeigncurrencyexchangeraterisksonnon-U.S.dollar-denominatedinvestmentsecurities and to increase or decrease exposure to various foreign currencies.

48 n o t e s t o f i n a n c i a l s t a t e m e n t s
An option contract gives UCRS Plans the right, but not the obligation, to buy or sell a specified security or index at a fixed price during a specified period for a nonrefundable fee (the ‘‘premium’’). The maximum loss to UCRS Plans are limited to the premium originally paid for covered options. UCRS Plans record premiums paid for the purchase of these options inthestatementsofnetpositionasaninvestmentwhichissubsequentlyadjustedtoreflectthefairvalueoftheoptions, withunrealizedgainsandlossesincludedinthestatementsofchangesinnetposition.UCRSheldnooptioncontracts at June 30, 2011.
A swap is a contractual agreement entered into between the Plans and a counterparty under which each agrees to exchange periodic fixed or variable payments for an agreed period of time based upon a notional amount of principal or value of the underlying contract. The payments correspond to an equity index, interest rate or currency. The Plans consider its futures, forward contracts, options, rights, warrants and certain interest rate swaps to be investment derivatives.
The Regents considers its futures, foreign currency exchange contracts, options, forward contracts, stock rights and warrants and swaps investment derivatives.
ThefairvaluebalancesandnotionalamountsofderivativeinstrumentsoutstandingatJune30,2012and2011,categorized by type, and the changes in fair value of such derivatives for the years then ended are as follows:
ucrP (in thousands of dollars) [tables for Ucrp, pers, and Ucrsp shown separately ]
notional aMount fair value–Positive (neGative) chanGes in fair value
cateGory 2012 2011 classification 2012 2011 classification 2012 2011
investMent Derivatives
Futures contracts:domestic equity futures:
long positions 1,029,704 825,109 investments $26,215 $ 8,501 net appreciation (depreciation)
$33,908 $ 155,965
short positions (17,426) investments (421) net appreciation (depreciation)
(429) (2,582)
foreign equity futures:long positions 236,271 210,384 investments 4,942 2,548 net appreciation
(depreciation) 28,839 22,602
short positions (44,377) (75,643) investments (435) (1,031) net appreciation (depreciation)
6,419 (7,032)
futures contracts, net 30,301 10,018 68,737 168,953
Foreign currency exchange contracts, net:long positions 169,194 193,691 2,095 (937) net appreciation
(depreciation) (26,137) 34,892
short positions (188,958) (225,686) (2,882) (436) net appreciation (depreciation)
21,603 (35,342)
foreign currency exchange contracts, net (787) (1,373) (4,534) (450)swaps
fixed interest rate swaps 1,715 net appreciation (depreciation)
2,179
total return swaps equity 40 (109) net appreciation (depreciation)
182
swaps, net 1,606 2,361
stock rights/warrants 2,165 12,581 6,313 net appreciation (depreciation)
(4,335) 2,331
options/swaps 211,422 1,784 net appreciation (depreciation)
(13)
total investment derivatives $45,485 $ 14,958 $62,216 $ 170,834

U n i v e r s i t y o f c a l i f o r n i a r e t i r e m e n t s y s t e m 1 1 / 1 2 a n n U a l f i n a n c i a l r e p o r t 49
ucrsP (in thousands of dollars)
notional aMount fair value–Positive (neGative) chanGes in fair value
cateGory 2012 2011 classification 2012 2011 classification 2012 2011
Futures contracts:domestic equity futures:
long positions 39,005 223,298 investments $1,003 $ 430 net appreciation (depreciation)
$1,325 $ 12,930
foreign equity futures:long positions 19,077 15,825 investments 403 212 net appreciation
(depreciation) 425 1,168
futures contracts, net 1,406 642 1,750 14,098
Foreign currency exchange contracts: long positions 22 investments net appreciation
(depreciation)
short positions investments net appreciation (depreciation)
futures currency exchange contracts, net
stock rights/warrants 121 79 36 net appreciation (depreciation)
120 (117)
total investment derivatives $1,485 $678 $1,870 $ 13,981
Pers Plus 5 (in thousands of dollars)
notional aMount fair value–Positive (neGative) chanGes in fair value
cateGory 2012 2011 classification 2012 2011 classification 2012 2011
Futures contracts:domestic equity futures:
long positions 1,550 1,341 investments $40 $ 15 net appreciation (depreciation)
$ 51 $254
short positions (26) investments (1) net appreciation (depreciation)
(1) (4)
foreign equity futures:long positions 356 342 investments 7 4 net appreciation
(depreciation) 43 37
short positions (67) (123) investments (1) (2) net appreciation (depreciation)
10 (11)
futures contracts, net 45 17 103 276
Foreign currency exchange contracts: long positions 255 315 investments 3 (1) net appreciation
(depreciation) (39) 56
short positions (284) (367) investments (4) (1) net appreciation (depreciation)
33 (57)
futures currency exchange contracts, net (1) (2) (6) (1)swaps
fixed interest rate swaps 3 net appreciation (depreciation)
3 3
total return swaps equity net appreciation (depreciation)
swaps, net 3 3 3
stock rights/warrants 3 19 10 net appreciation (depreciation)
(7) 4
options/swaps 318 3 net appreciation (depreciation)
total investment derivatives $69 $ 25 $ 93 $282

50 n o t e s t o f i n a n c i a l s t a t e m e n t s
nOte 5 — cOntributiOnS and reServeS
actuarially determined contribution requirements and contributions made – ucrPThe Regents’ funding policy provides for actuarially determined contributions at rates reasonably expected to maintain UCRP on an actuarially sound basis. The Regents determines the annual contribution rate only and the portion of the total contributiontobemadebytheemployerandbytheemployees.Employeecontributionsforrepresentedemployeesaresubjecttocollectivebargaining.Inaddition,theDOEmayberequiredtoreimbursetheUniversityforcontributionstocoverthebenefits liabilities for LLNL and LANL retirees and inactive members. The contribution rate is determined using the entry agenormalactuarialcostmethod.Underthismethod,theactuarialpresentvalueoftheprojectedbenefitsofeachindividualincluded in an actuarial valuation is allocated on a level basis over the earnings of the individual between entry age and assumed exit age.
The portion of this actuarial present value allocated to a valuation year is called the normal cost. The portion of this actuarial present value not provided for at a valuation date by the actuarial present value of future normal costs is called the actuarial accrued liability. Under this method, the actuarial gains (losses), as they occur, reduce (increase) the unfunded actuarial accrued liability.
As of July 1, 2011, the date of the latest actuarial valuation, and July 1, 2010, the difference between the net assets held in trust for pension benefits presented in the statements of net position and the net assets allocated to fund the actuarial accrued liability is as follows:
(in millions of dollars) [table net assets allocated to fund aal – nfs:5-c&r]
Valuation Date as of July 1 2011 2010
net position $41,873 $34,575
difference* 884 6,620
net position allocated to fund the actuarial accrued liability $42,757 $41,195
* The difference between smoothed market value and fair value is considered available for purposes of calculating the net assets allocated to fund the actuarial accrued liability.
Mandatoryemployeecontributions,madeasaconditionofemployment,arebaseduponcoveredUniversitywageslessaspecified monthly reduction, determined periodically by The Regents, as shown below:
[table mandatory employee contributions]
Effective:MeMbers Without
social securityMeMbers With social security
safety MeMbers Monthly reDuctionBeloW Wage Base aBove Wage Base
7/01/12** 5.0% 5.0% 5.0% 6.0% $19
7/01/11 3.5 3.5 3.5 4.5 19
5/1/10 3.0 2.0 4.0 3.0 19
7/01/93* 3.0 2.0 4.0 3.0 19
11/01/90* 4.5 2.0 4.0 8.0 19
6/30/90 6.0 2.0 4.0 8.0 19
*The entire member assessment was directed to the Defined Contribution Plan. ** Subject to collective bargaining.
At June 30, 2012 and 2011, member accumulations of active employees in UCRP, including allocated investment earnings, amountedtoapproximately$679.7millionand$443.5million,respectively.
The Regents approves the contribution rate for each year and the split between member contributions and University contributions based on the contribution policy and various other factors, including the availability of funds, the impact of employee contributions on the competitiveness of the University’s total remuneration package, and collective bargaining. Contributions, if any, are credited as a percentage of UCRP covered compensation. The contributions under the funding policy are intended to accumulate sufficient assets to fund the actuarial liability under the entry age normal cost method.

U n i v e r s i t y o f c a l i f o r n i a r e t i r e m e n t s y s t e m 1 1 / 1 2 a n n U a l f i n a n c i a l r e p o r t 51
On December 13, 2010, The Regents delegated to the President discretion to fully fund the modified Annual Required Contribution (ARC)forUCRPinthefollowingtwophases:(1)fromfiscalyear2010-11throughfiscalyear2018-19,theUniversitywouldcontribute to UCRP, to the extent practical, the modified ARC, that would include normal cost plus interest only on the unfundedactuarialaccruedliability(UAAL);(2)beyondfiscal2018-19,theUniversitywouldcontributethefullARCpayment,that would include normal cost on the pension, interest on the UAAL and an amount that represents the annual principal contributionofthe30-yearamortizationoftheUAAL.OnMarch16,2011,theRegentsamendedtheDecember13,2010delegation to the President to fully fund the ARC for UCRP and provided the President additional flexibility to perform asset transferstoUCRPbeginninginthefiscalyear2010-11.In2012and2011,employercontributionsincluded$0.9billionand$1.1 billion that was contributed to the Plan at the President’s discretion.
Universityandemployeecontributionswere$1.9billionand$272.4million,respectively,duringtheyearended June30,2012.Universityandemployeecontributionswere$1.7billionand$143.3million,respectively,duringtheyear ended June 30, 2011.
Lawrence Berkeley National Laboratory (“LBNL”) is required to make employer and employee contributions in conformity with The Regents’ funding policy. In addition, under certain circumstances the University makes contributions to UCRP in behalfofLANLandLLNLretireesbaseduponacontractualarrangementwiththeDOEdesignedtomaintainthe100percentfundedstatusoftheLANLandLLNLsegmentswithinUCRP,andisreimbursedbytheDOE.
EmployeecontributionstoUCRPareaccountedforseparatelyandcurrentlyaccrueinterestat6.0percentannually.Upontermination,membersmayelectarefundoftheircontributionsplusaccumulatedinterest;vestedterminatedmemberswhoareeligible to retire may also elect monthly retirement income or a lump sum equal to the present value of their accrued benefits.
PerS Plus 5 PlanTheRegents’fundingpolicyprovidesforactuariallydeterminedcontributionsatratesthatmaintainthePERSPlus5Planonanactuariallysoundbasis.AsofJune30,2012and2011,thePERSPlus5Planwasfullyfundedandnoannualcontributionswere required.
nOte 6 — cOntributiOnS receivable frOm the State Of califOrnia
Contributions receivable includes $36.2 million and $43.8 million at June 30, 2012 and 2011, respectively, related to agreements between the state of California and the University on behalf of UCRP. In 1984, the state agreed to pay the University for contributions due to UCRP of $66.5 million in 30 annual installments of approximately $5.9 million, including interest at 8.00 percent, based on the discount rate used in the 1984 actuarial valuation. Similarly, in fiscal year 1990, the state agreed topaytheUniversityforcontributionsduetoUCRPof$57.2millionin30annualinstallmentsofapproximately$5.3million,including interest at 8.46 percent, based on the discount rate used in the 1990 actuarial valuation.
nOte 7 — Plan terminatiOn
The Regents expects to continue UCRS Plans indefinitely, but reserves the right to amend or discontinue UCRS Plans at any time provided that any such action shall not lessen accrued benefits of any members. In the event that UCRP is terminated, UCRP assets shall be applied solely for the benefit of retired, vested or active participants and beneficiaries, until all liabilities of UCRP have been satisfied. Once all liabilities have been satisfied, any excess assets shall revert to The Regents.
ThebenefitsofUCRSnotedabovearenotinsuredbythePensionBenefitGuarantyCorporation,afederalinsuranceagencyestablishedunderTitleIVoftheEmployeeRetirementIncomeSecurityActof1974.

52 n o t e s t o f i n a n c i a l s t a t e m e n t s
required SuPPlementary infOrmatiOn — ucrP
actuarial informationAnalysis of dollar amounts of the actuarial value of assets, actuarial accrued liability and actuarial value of assets less than or in excessoftheactuarialaccruedliabilityinisolationcanbemisleading.Expressingtheactuarialvalueofassetsasapercentageofthe actuarial accrued liability provides one indication of the funding status on a going concern basis. Analysis of this percentage over time indicates whether a plan is becoming financially stronger or weaker.
Generally,thegreaterthispercentage,thestrongertheplan.Trendsintheunfundedactuarialaccruedliabilityorassetsinexcessoftheactuarialaccruedliabilityandannualcoveredpayrollarebothaffectedbyinflation.Expressingtheunfundedactuarialaccruedliabilityorsurplusasapercentageofannualcoveredpayrollgenerallyadjustsfortheeffectsofinflation and aids in the analysis of progress made in accumulating sufficient assets to pay benefits when due.
REQUIRED SUPPLEMENTARY SCHEDULE OF FUNDING PROGRESS FOR THE PAST SIX YEARS valuation date as of July 1 (in millions of dollars) [table – Ucrp rsi-1]
actuarial
valuation Date
(1) actuarial
value of assets
(2) actuarial
accrueD liability
(3) actuarial
(Deficit) surPlus
(4) total funDeD ratio
(1)÷(2)
(5) annual
covereD Payroll
(6) actuarial (Deficit)
surPlus as a PercentaGe of annual covereD Payroll (3)÷(5)
2011* $42,757 $ 51,831 $ (9,074) 82.5% $8,163 (111.2)% 2010 41,195 47,504 (6,309) 86.7 7,995 (78.9)2009 42,799 45,161 (2,362) 94.8 7,874 (30.0)2008 43,840 42,577 1,263 103.0 7,469 16.9
2007** 43,434 41,437 1,997 104.8 7,613 26.2
2006 41,973 40,302 1,671 104.1 8,259 20.2
* The July 1, 2011 information includes changes in actuarial assumptions that increased the July 1, 2011 actuarial accrued liability by $1.825 billion.
** The July 1, 2007 information includes changes in actuarial assumptions that decreased the July 1, 2007 actuarial accrued liability by $535 million. A change in an actuarial method for projecting covered payroll is also included. Covered payroll is now reduced to anticipate members who leave active status during the year. This decreased the July 1, 2007 annual covered payroll by $814 million.
Actuarialvaluationsrepresentalong-termperspectiveandinvolveestimatesofthevalueofreportedamountsandassumptionsabouttheprobabilityofoccurrenceofeventsfarintothefuture.Theprojectionofbenefitsdoesnotexplicitlyincorporatethepotential effects of the results of collective bargaining discussions on the contribution rate. Actuarially determined amounts aresubjecttoperiodicrevisionsasactualresultsarecomparedwithpastexpectationsandnewestimatesaremadeaboutthefuture.Thescheduleoffundingprogresspresentsmulti-yeartrendinformationaboutwhethertheactuarialvalueofassetsisincreasing or decreasing over time relative to the actuarial accrued liability for benefits.
required Schedule of employer and employee contributionsThe Regents’ funding policy provides for actuarially determined contributions at rates reasonably expected to maintain the Plan on an actuarially sound basis.
Thetotalfundingpolicycontributionisdeterminedbasedonvariousamortizationperiods(uptothirtyyears)fordifferentcomponentsofthedeficitasofJuly1,2012.Employeecontributionsbyrepresentedemployeesaresubjecttocollectivebargaining agreements. During the year ended June 30, 2010, University and employee contributions were reinstated.
EffectiveMarch2011,TheRegentsdelegatedtothePresidentdiscretiontofullyfundthemodifiedARCforthePlan.
LBNL is required to make employer and employee contributions in conformity with The Regents’ funding policy. In addition, under certain circumstances the University makes contributions to UCRP based upon a contractual arrangement with the DOEdesignedtomaintainthe100percentfundedstatusoftheLANLandLLNLsegmentswithinUCRP,andisreimbursed bytheDOE.

U n i v e r s i t y o f c a l i f o r n i a r e t i r e m e n t s y s t e m 1 1 / 1 2 a n n U a l f i n a n c i a l r e p o r t 53
note to required Supplementary informationThe required supplementary information is determined as part of the actuarial valuation as of the date indicated. Additional information as of the July 1, 2011 and 2010 actuarial valuations is as follows:
ADDITIONAL TREND INFORMATION valuation date as of July 1
2011 2010
actuarial cost method entry age normal cost entry age normal cost
amortization method level dollar, closed level dollar, closed
remaining amortization period* 24.2 years 30 years
asset valuation method 5-year smoothed market 5-year smoothed market
actuarial assumptions: investment rate of return** 7.50% 7.50%
projected salary increases 4.30–6.75% 4.35–7.00%
cost-of-living adjustments 2.00% 2.00%
* The July 1, 2010 amortization bases were combined into a single amortization base and amortized over 30 years. Any changes in Unfunded Actuarial Accrued Liability (UAAL) due to actuarial experience gains or losses after July 1, 2010 will be separately amortized over a fixed (closed) 30-year period effective with that valuation. Any changes in UAAL due to a change in actuarial assumptions or Plan provisions will be separately amortized over a fixed (closed) 15-year period.
**Includes inflation assumption at 3.50%.
Other Supplementary informationThe total actuarial accrued liability of the plan, calculated using the entry age normal cost method, was $51.8 billion and $47.5billionatJuly1,2011and2010,respectively.Thisliabilityisthencomparedagainsttheactuarialvalueofplanassets todeterminetheannualrequiredcontributiontofundtheplan.Theprojectionofbenefitsdoesnotexplicitlyincorporate the potential effects of the results of collective bargaining discussions on the contribution rate.
actuarial accrueD liability valuation date as of July 1 (in millions of dollars)
2011 2010
retirees and beneficiaries currently receiving benefits and terminated employees not yet receiving benefits $ (27,548) $ (24,963)active employees: accumulated employee contributions, including allocated investment earnings (443) (337)employer-financed vested (22,391) (20,682)employer-financed nonvested (1,449) (1,522)total actuarial accrued liability — entry age normal cost basis (51,831) (47,504)net assets allocated to fund the actuarial accrued liability, at smoothed market value 42,757 41,195actuarial value of assets in (deficit) excess of actuarial accrued liability — entry age normal cost basis $ (9,074) $ (6,309)
revenues by source (in thousands of dollars)
Year Ended June 30 eMPloyee contributions1 eMPloyer contributions1 total investMent incoMe (loss)2 total
2012 $272,421 $1,851,459 $ 115,861 $2,239,741 2011 143,261 1,677,921 7,629,727 9,450,9092010 23,374 148,446 4,154,297 4,326,1172009 1,300 454 (7,904,904) (7,903,150)
2008 1,391 2,657 (2,593,789) (2,589,741)
2007 1,406 23,934 7,915,940 7,941,2802006 1,746 13 2,977,660 2,979,4192005 1,653 737 3,982,916 3,985,3062004 2,503 5,150 4,998,664 5,006,3172003 7,060 811 1,892,384 1,900,255
1 The increases in Member and University contributions in the years ended June 30, 2012, 2011 and 2010 reflect the restart of Member and University contributions to the Plan during the fourth quarter of the fiscal year ended June 30, 2010.
2 Total investment income (loss) includes net appreciation (depreciation) in fair value of investments, interest, dividends, other investment income and securities lending income net of lending fees and rebate expenses.

54 n o t e s t o f i n a n c i a l s t a t e m e n t s
exPenses by tyPe (in thousands of dollars)
Year Ended benefits1 aDMinistrative & other exPenses
MeMber WithDraWals, transfers & other activity
total
2012 $2,179,081 $32,838 $ 93,992 $2,305,911 2011 2,042,844 31,088 78,776 2,152,7082010 1,901,066 32,654 76,485 2,010,2052009 1,750,223 32,453 78,794 1,861,470
2008 1,791,989 36,557 1,663,8992 3,492,445
2007 1,624,953 38,914 1,534,2893 3,198,1562006 1,369,819 34,011 70,865 1,474,6952005 1,223,648 21,258 70,560 1,315,4662004 1,064,180 24,053 57,236 1,145,4692003 954,887 27,696 32,665 1,015,248
1 Does not include member withdrawals including CAP distributions.2 Includes $1.57 billion of Plan net assets transferred to LLNS successor pension plan.3 Includes $1.44 billion of Plan net assets transferred to LANS successor pension plan.
required SuPPlementary infOrmatiOn — PerS PluS 5 Plan
actuarial informationAnalysis of dollar amounts of the actuarial value of assets, actuarial accrued liability and actuarial value of assets in excess of the actuarialaccruedliabilityinisolationcanbemisleading.Expressingtheactuarialvalueofassetsasapercentageoftheactuarialaccrued liability provides one indication of the funding status on a going concern basis. Analysis of this percentage over time indicateswhetheraplanisbecomingfinanciallystrongerorweaker.Generally,thegreaterthispercentage,thestrongertheplan.
REQUIRED SUPPLEMENTARY SCHEDULE OF FUNDING PROGRESS FOR THE PAST SIX YEARS valuation date as of July 1 (in thousands of dollars)
actuarial valuation Date
(1) actuarial
value of assets*
(2) actuarial
accrueD liability**
(3)actuarial
surPlus
(4) total funDeD
ratio (1)÷(2)
2011 $ 67,528 $ 45,716 $ 21,812 147.7%2010 59,424 35,514 23,910 167.3 2009 56,941 37,833 19,108 150.5 2008 76,336 39,777 36,559 191.9 2007 86,150 42,346 43,804 203.4 2006 77,830 43,877 33,953 177.4
* Reported at fair value.** Includes present value of administrative expenses equal to one percent of actuarial accrued liability.Note: Because 100 percent of the members in the PERS Plus 5 Plan are retired, there is no annual covered payroll.
Actuarialvaluationsrepresentalong-termperspectiveandinvolveestimatesofthevalueofreportedamountsandassumptionsabouttheprobabilityofoccurrenceofeventsfarintothefuture.Actuariallydeterminedamountsaresubjecttoperiodicrevisions as actual results are compared with past expectations and new estimates are made about the future. The schedule offundingprogresspresentsmulti-yeartrendinformationaboutwhethertheactuarialvalueofassetsisincreasingordecreasing over time relative to the actuarial accrued liability for benefits.

U n i v e r s i t y o f c a l i f o r n i a r e t i r e m e n t s y s t e m 1 1 / 1 2 a n n U a l f i n a n c i a l r e p o r t 55
required Schedule of university contributionsSince1996,theUniversityhasnotbeenrequiredtomakecontributionstothePERSPlus5Planduetoitsfullyfundedstatus. The required supplementary information was determined as part of the actuarial valuation as of the date indicated. Additional information as of the July 1, 2011 and 2010 actuarial valuations is as follows:
ADDITIONAL TREND INFORMATION — PERS PLUS 5 PLAN valuation date as of July 1
2011 2010
actuarial cost method Unit credit Unit credit
amortization method n/a n/a
remaining amortization period n/a n/a
asset valuation method fair value fair value
actuarial assumptions: investment rate of return* 7.50% 7.50%
projected salary increases n/a n/a
cost-of-living adjustments 2.00% none
* Includes inflation assumption at 3.50%.
TheactuarialassumptionsarebasedonthepresumptionthatthePERSPlus5Planwillcontinueinoperation.WerethePlantoterminate, different actuarial assumptions and other factors might be applicable in determining the actuarial present value of accumulated plan benefits.
Other Supplementary information
Thetotalnetassetsavailableinexcessofthetotalactuarialaccruedliability(AAL)ofthePERSPlus5PlanbasedonthemeasureoftheAAL,whichusestheunitcreditbasis,asappearsintheactuarialvaluation,wasapproximately$45.7million at July 1, 2011, and $35.5 million at July 1, 2010, as follows:
actuarial accrueD liability valuation date as of July 1 (in millions of dollars)
2011 2010
retirees and beneficiaries receiving benefits and terminated employees not yet receiving benefits $(45.7) $(35.5)total actuarial accrued liability — unit credit basis (45.7) (35.5)
net assets allocated to fund the actuarial accrued liability, at fair value 67.5 59.4 actuarial value of assets in excess of actuarial accrued liability — entry age normal cost basis $21.8 $23.9


58
U n i v e r s i t y o f C a l i f o r n i a
Plan oversight — the board of regents
sherry l. lansing Chairman; ex officio member on all Committees except Committee on Governance
Bruce d. varner Vice Chairman; Chairman, Committee on Finance; Vice Chairman, Committee on Governance; Member of Committee on Compensation; Long Range Planning; Oversight of the DOE Laboratories
monica c. lozano Chairman, Committee on Governance; Vice Chairman of Committee on Finance; Member of Committee on Health Services; Committee on Compensation; Compliance and Audit; Educational Policy
Paul d. Wachter Chair, Committee on Governance; Chair, Committee on Investments; Member of Committees on Compensation and Finance
russell gould Vice Chairman, Committee on Investments; Member of Committees on Educational Policy; Finance; Oversight of the DOE Laboratories
mark g. yudof President of the University and ex officio Regent
i n v e s t M e n t M a n a g e M e n t | Chief investment office
marie n. Berggren Chief Investment Officer and Vice President, Investments and Acting Treasurer
melvin l. stanton Associate Chief Investment Officer, Investments and Chief Operating Officer
P l a n a D M i n i s t r a t i o n | office of the President nathan Brostrom Executive Vice President, Business Operations
dwaine B. duckett Plan Administrator and Vice President Human Resources
michael c. Baptista Executive Director, Benefits Programs and Strategy, Human Resources Department
esther c. hill Director, HR Benefits Information Systems, Benefits Programs and Strategy, Human Resources Department
Joe lewis Director, Retirement Administration Service Center, Human Resources Department
david l. olson Director, Benefit Plan Accounting, CFO Division, Financial Accounting
gary schlimgen Director, Pension & Retirement Programs, Human Resources Department
P l a n f i n a n C i a l r e P o r t i n g , a C t U a r y & i n D e P e n D e n t a U D i t o r
peggy arrivas Associate Vice President and Systemwide Controller, CFO Division, Financial Accounting
the segal company Plan Actuary
pricewaterhousecoopers llp Independent Plan Auditor
Requests for Information: This financial report is designed to provide The Regents, Plans’ retirees and others with a general overview of the Plans’ financial positions and results. Questions concerning this report should be addressed to:
University of California Office of the President Human Resources Department P.O. Box 24570 Oakland, CA 94623-1570