Annual Finan cial Report - Fairmont, Minnesota€¦ · General Fund . Comparative Balance Sheets...
248
City of Fairmont Fairmont, Minnesota For the Year Ended December 31, 2018 Annual Financial Report
Transcript of Annual Finan cial Report - Fairmont, Minnesota€¦ · General Fund . Comparative Balance Sheets...

City of Fairmont Fairmont, Minnesota
For the Year Ended December 31, 2018
Annual Financial Report

THIS PAGE IS LEFT
BLANK INTENTIONALLY

City of Fairmont, Minnesota Comprehensive Annual Financial Report
Table of Contents For the Year Ended December 31, 2018
Page No. Introductory Section Letter from City Administrator 9 Letter of Transmittal 10 Principal City Officials 15 Organization Chart 16 GFOA Certificate of Achievement for Excellence in Financial Reporting 17
Financial Section Independent Auditor's Report 21 Management’s Discussion and Analysis 25
Basic Financial Statements Government-wide Financial Statements
Statement of Net Position 39 Statement of Activities 40 Fund Financial Statements
Governmental Funds Balance Sheet 45 Reconciliation of the Balance Sheet to the Statement of Net Position 46 Statement of Revenues, Expenditures and Changes in Fund Balances 47 Reconciliation of the Statement of Revenues, Expenditures and Changes in Fund Balances to the Statement of Activities 48 General Fund
Statement of Revenues, Expenditures and Changes in Fund Balances - Budget and Actual 49 Proprietary Funds
Statement of Net Position 50 Statement of Revenues, Expenses and Changes in Net Position 54 Statement of Cash Flows 56
Fiduciary Funds Statement of Fiduciary Net Position 60 Notes to the Financial Statements 61
Required Supplementary Information Schedule of Employer’s Share of Public Employees Retirement Association Net Pension Liability - General Employees Retirement Fund 103 Schedule of Employer’s Public Employees Retirement Association Contributions - General Employees Retirement Fund 103 Notes to the Required Supplementary Information - General Employees Retirement Fund 104 Schedule of Employer’s Share of Public Employees Retirement Association Net Pension Liability - Public Employees Police and Fire Fund 105 Schedule of Employer’s Public Employees Retirement Association Contributions - Public Employees Police and Fire Fund 105 Notes to the Required Supplementary Information - Public Employees Police and Fire Fund 106 Schedule of Changes in the Fire Relief Association’s Net Pension Liability (Asset) and Related Ratios 107 Notes to the Required Supplementary Information - Fire Relief Association 107 Schedule of Employer’s Fire Relief Association Contributions 108 Schedule of Changes in the City’s OPEB Liability and Related Ratios 108
3
lmunguia_ABDO16C
Sticky Note
Marked set by lmunguia_ABDO16C
lmunguia_ABDO16C
Sticky Note
Marked set by lmunguia_ABDO16C
lmunguia_ABDO16C
Sticky Note
Marked set by lmunguia_ABDO16C
lmunguia_ABDO16C
Sticky Note
Marked set by lmunguia_ABDO16C

City of Fairmont, Minnesota Comprehensive Annual Financial Report
Table of Contents (Continued) For the Year Ended December 31, 2018
Page No. Combining and Individual Fund Financial Statements and Schedules
Nonmajor Governmental Funds Combining Balance Sheet 111
Combining Statement of Revenues, Expenditures and Changes in Fund Balances 112 Nonmajor Special Revenue Funds
Combining Balance Sheet 116 Combining Statement of Revenues, Expenditures and Changes in Fund Balances 118 Schedule of Revenues, Expenditures and Changes in Fund Balances - Budget and Actual
Aeronautics Fund 120 Lake Restoration Fund 121
Nonmajor Capital Projects Funds Combining Balance Sheet 126
Combining Statement of Revenues, Expenditures and Changes in Fund Balances 128 General Fund
Comparative Balance Sheets 133 Schedule of Revenues, Expenditures and Changes in Fund Balances - Budget and Actual 134
Debt Service Funds Combining Balance Sheet 143
Combining Schedule of Revenues, Expenditures and Changes in Fund Balances 147 Internal Service Funds
153 154
Combining Statement of Net Position Combining Statement of Revenues, Expenses and Changes in Net Position Combining Statement of Cash Flows 155
Agency Funds Combining Balance Sheet 160
Individual Fund Statements of Changes in Assets and Liabilities 162 Discretely Presented Component Unit - Economic Development Authority
Comparative Balance Sheets/Net Position 164 Comparative Statements of Revenues, Expenditures and Changes in Fund Balances/Net Position 165
Summary Financial Report Revenues and Expenditures for General Operations - Governmental Funds 166
Table No. Statistical Section (Unaudited) Financial Trends
Net Position by Component 1 170 Changes in Net Position 2 172 Governmental Activities Tax Revenues by Source 3 179 Fund Balances of Governmental Funds 4 180 Changes in Fund Balances of Governmental Funds 5 182 General Governmental Tax Revenues by Source 6 185
Revenue Capacity Market Value and Estimated Actual Value of Taxable Property 7 186 Property Tax Rates - Direct and Overlapping Governments 8 188 Principal Property Taxpayers 9 190 Property Tax Levies and Collections 10 193
Debt Capacity Ratios of Outstanding Debt by Type 11 194 Direct and Overlapping Governmental Activities Debt 12 197 Legal Debt Margin Information 13 198 Pledged-Revenue Coverage 14 200
Demographic and Economic Information Demographic and Economic Statistics 15 201 Principal Employers 16 203
4
lmunguia_ABDO16C
Sticky Note
Marked set by lmunguia_ABDO16C

City of Fairmont, Minnesota Comprehensive Annual Financial Report
Table of Contents (Continued) For the Year Ended December 31, 2018
Table No. Page No. Statistical Section (Unaudited) (Continued) Operating Information
Full-time Equivalent City Government Employees by Function 17 204 Operating Indicators by Function 18 206 Capital Asset Statistics by Function 19 208
Public Utilities Commission Information Operating Expenses by Function 20 210 Revenue by Utility 21 212 Kilowatt Hours Generated and Purchased 22 214 Cost Per KWH Generated and Purchased 23 215 Kilowatt Sales 24 217 Large Electric Users - Total Kilowatt Hours Used and Revenue Earned Per Year 25 222 Raw Water Finished and Sold 26 224 Cost Per Thousand Gallons of Finished Water 27 227 District Heat Sales 28 228 Cost Per Thousand Pounds of Steam 29 230 Wastewater Inflow and Cost per Thousand Gallons Treated 30 231
Single Audit and Other Required Reports Independent Auditor’s Report on Minnesota Legal Compliance 235 Independent Auditor’s Report on Internal Control
Over Financial Reporting and on Compliance and Other Matters Based on an Audit of Financial Statements Performed in Accordance with Government Auditing Standards 236
Independent Auditor’s Report on Compliance for Each Major Federal Program and Report on Internal Control Over Compliance Required by the Uniform Guidance 238
Schedule of Expenditures of Federal Awards 240 Notes to Schedule of Expenditures of Federal Awards 241 Schedule of Findings and Questioned Costs 243
5

THIS PAGE IS LEFT
BLANK INTENTIONALLY
6

Introductory Section

INTRODUCTORY SECTION
CITY OF FAIRMONT FAIRMONT, MINNESOTA
FOR THE YEAR ENDED DECEMBER 31, 2018
7

THIS PAGE IS LEFT
BLANK INTENTIONALLY
8
May 7, 2019 Honorable Mayor and City Council City of Fairmont Fairmont, Minnesota 56031 Honorable Mayor and City Council: In accordance with the City Charter and State law, I hereby transmit this detailed Comprehensive Annual Financial Report of the City of Fairmont for the year ended December 31, 2018. Management believes that the data as presented is accurate in all material aspects; and that it is presented in a manner designed to fairly set forth the financial position of the City. In developing and evaluating the City’s accounting system, consideration is given to the adequacy of internal accounting controls. The City has placed an emphasis on and has been re-evaluating its system of internal accounting controls to assure its citizens that we adequately safeguard assets and provide reasonable assurance of proper recording of financial transactions. The report has been prepared in accordance with the standards prescribed by the Governmental Accounting Standards Board, the Government Finance Officers Association of the United States and Canada, the American Institute of Certified Public Accountants and the State Auditor’s Office of the State of Minnesota, as required by Minnesota Laws 1978, Chapter 787. Preparation of this report could not be accomplished without the dedicated effort of the Finance Department and support services staff. Their efforts towards upgrading the accounting and financial reporting system of the City have led substantially to the improved quality of information being reported to the City Council, State and Federal agencies, investors and creditors and the citizens of the City of Fairmont. Respectfully submitted, City of Fairmont
Mike Humpal, CEcD City Administrator MH/sko Encls.
9

May 7, 2019 To The Honorable Mayor and City Council City of Fairmont Fairmont, Minnesota 56031 Honorable Mayor and City Council: Submitted herewith is the Comprehensive Annual Financial Report of the City of Fairmont, Minnesota (the City), for the fiscal year ended December 31, 2018. This report was prepared by the City’s Finance Division. Responsibility for both the accuracy of the presented data and the completeness and fairness of the presentation, including all disclosures, supporting schedules and statistical tables rests with the City. I believe the data, as presented, is accurate in all material respects; that it is presented in a manner designed to fairly set forth the financial position and results of operations of the City as measured by the financial activity of its various funds; and that all disclosures necessary to enable the reader to gain the maximum understanding of the City’s financial affairs have been included. Generally accepted accounting principles (GAAP) require management provide a narrative introducing overview, and analysis to accompany the basic financial statements in the form of Management’s Discussion and Analysis (MD&A). This letter of transmittal is designed to complement MD&A and should be read in conjunction with it. The City’s MD&A can be found immediately following the report of the independent auditors.
THE REPORTING ENTITY AND ITS SERVICES
This report includes all of the funds of the City. It includes all activities considered by generally accepted accounting principles to be part of (controlled by or dependent on) the City. This report also includes activities of the Fairmont Economic Development Authority. Independent School District 2752 is an independent district and not part of the City. Financial data for it is not included in the financial statements in this report. Audited financial statements for the district are available upon request at its business office in Fairmont. The Housing and Redevelopment Authority of Fairmont (HRA) is considered to be a separate government. The City does not review or approve the budget. Financial data for it is not included in the financial statements in this report. Audited financial statements are available upon request at its business office in Fairmont. The pension fund for Fairmont’s Volunteer Fire Department is administered through their relief association. This association is self-governing with their own Boards of Trustees, by-laws, and officers. Financial data for the pension fund is not included in the financial statements in this report. A financial statement and actuarial information are available upon request. The City provides the full range of municipal services prescribed by statute or charter. This includes public safety (police and fire), highways and streets, sanitation, culture-recreation, public improvements, planning and zoning and general administrative services. The City also provides enterprise activities including electricity, water and sewer, parking lots, and operates a municipal off sale liquor store.
10

Honorable Mayor and City Council May 7, 2019
BUDGETARY CONTROL
Budgetary control is maintained in compliance with the City’s Charter requirements. The budget process is focused on the balancing of anticipated revenues and appropriations. The flexibility needed to control and protect the various funds comes from a monthly monitoring of the accounting records to show adequate revenue sources for anticipated expenditures. This monthly monitoring process prevents expenditures from being approved until it has been determined that adequate funds were appropriated, the expenditure is necessary and there are adequate funds available for support.
ECONOMIC CONDITION AND OUTLOOK
• The City of Fairmont is located along the southern border of Minnesota at State Highway 15 and Interstate I-90 in a largely agricultural area. Although the population declined slightly over the last ten years, the number of households has increased. The economy of Fairmont consists of large and small industry and commerce. The industries are diversified between food processors, agribusinesses and a variety of other products. The City’s financial base is currently sound with taxable market values increasing 4.0% in 2018. The health care industry in Fairmont is providing significant support for our economy. In addition to the Mayo Health System, the Center for Specialty Care is thriving, Dulcimer Medical Center continues to grow and add staff and most recently, United Hospital District headquartered in Blue Earth, MN has opened a clinic in Fairmont.
• Long term financial planning is a very important function of the City. The City has established a General fund balance of 55-65% of expenditures and has consistently been above this limit. This has allowed the City to continue to fund capital expenditures without issuing debt or raising taxes. It has also given the City a cushion for economic changes that are outside its control. The favorable fund balance has also been a positive factor in the City’s bond rating.
• The City Council has also developed a program of eliminating blighted housing within the City. Starting in 2008 the City began budgeting $42,500 per year and in 2018 the budget was increased to $75,000 per year to help tear down dilapidated housing. Not only has this program helped with the aesthetics of the City, it has maintained and increased valuations within the City.
MAJOR INITIATIVES
For the year –
In 2016, the City of Fairmont was awarded a Small Cities Development Program grant through the Department of Employment and Economic Development to assist income eligible, single family homeowners in completing some structural, health and life safety improvements to their homes. This program spent $485,760 on residential rehabilitation in our community’s target area during the grant period, which ended December 31, 2018. Great Plains Transportation Services, Inc has announced an expansion of 12,000 square feet of class A office space to their current building located at 923 State Street north. The City of Fairmont, ISD 2752 and Martin County all approved tax abatement for the project. The City of Fairmont worked to tear down 7 blighted residential homes in 2018 and plans to tear down another 7 in 2019. The City of Fairmont assisted businesses in our industrial park by working with Martin County to close the gap of $10,000 to get fiber to the industrial park. The City of Fairmont Economic Development Authority obtained a real estate option and infrastructure easements for a 38-acre parcel of bare developable land at the intersection of Bixby
11

Honorable Mayor and City Council May 7, 2019
Road and I-90. This site provides maximum accessibility and visibility to Interstate 90. City staff is working to apply for grant funds to help with the infrastructure costs of the industrial park development. The City of Fairmont in collaboration with Fairmont Area School ISD 2752, installed infrastructure in a residential development that offers much needed residential lots for sale. As of December 31, 2019, eight of the twenty lots have sold, and several potential prospects have evolved.
For the future -
Infrastructure improvement continues to be a community priority. The City will begin constructing a walking trail from Margaret Street North to just South of I90, begin construction on a new T-Hangar at the Airport that will add an additional 8 spots that can be leased and will begin on a $5.9 million street improvement program. The City Council held a budget and goal setting session in 2018 to set improvement goals for the upcoming year. In addition to the infrastructure projects listed above, projects include improvements to the Aquatic Park, constructing a 9 hole mini golf course, a small remodel at the Fire Hall and replacing the HVAC system in the terminal building at the Airport. The Council also allocated funds to continue a program of eliminating blighted housing within the community.
The City of Fairmont is partnering with local lenders and realtors to assist in housing, as well as working with Building blocks Learning Center to add 45 additional child care slots which will be mostly for infants and toddlers. This expansion is expected late 2019 or early 2020. The City of Fairmont has been working with a number of businesses looking at locating or expanding in Fairmont and utilizing the Revolving Loan Fund, Tax Increment Financing and Tax Abatement financing tools. Without full details of the projects, it is difficult to project the job or tax base creation.
INTERNAL ACCOUNTING CONTROLS
In developing and evaluating the City’s accounting system, consideration is given to the adequacy of internal accounting control. Internal accounting controls are designed to provide reasonable, but not absolute, assurance regarding:
1) the safeguarding of assets against loss from unauthorized use or disposition, and;
2) the reliability of financial records for preparing financial statements and maintaining
accountability for assets. The concept of reasonable assurance recognizes that:
1) cost of the control should not exceed the benefits likely to be derived, and;
2) evaluation of costs and benefits requires estimates and judgment by management. The City has placed an emphasis on and continually evaluates its system of internal accounting controls to assure its citizens that we adequately safeguard assets and provide reasonable assurance of proper recording of financial transactions.
12
lmunguia_ABDO16C
Sticky Note
Marked set by lmunguia_ABDO16C

Honorable Mayor and City Council May 7, 2019
FINANCIAL POLICIES
The City has set a general fund balance requirement in the range of 55-65 percent of General fund expenditures. The City has consistently been able to maintain fund balances within or above this range and as of December 31, 2018 the General fund balance was 88.2 percent of General fund expenditures. Council and staff feel that it is important to maintain these balances which will help the City maintain its Aa3 rating with Moody’s reducing future borrowing costs, allow for unforeseen expenditures and act as an insurance policy for future State aid reductions. Financial planning for the City of Fairmont is also based upon the five year Capital Improvement Program. The Capital Improvement Program is reviewed and updated each year during the budget process. The Capital Improvement Program includes projects for which the City must issue debt and/or assess portions of the cost to adjacent or benefited property owners. Because the Council has set limits upon the funds available each year and the City does not wish to issue excessive amounts of debt, these projects need to be reviewed annually, and on occasion reprioritized.
INDEPENDENT AUDIT
State law requires an annual audit of the City’s financial records and transactions supporting the financial statements. This requirement has been complied with and the auditors’ opinion has been included in this report. The accompanying financial statements have been examined by Abdo, Eick & Meyers, LLP independent certified public accountants. The firm is engaged by the City Council to render an opinion on the City’s financial statements in accordance with generally accepted auditing standards. The City Council is responsible for:
1) assuring that the City administration fulfills its responsibilities in the preparation of the financial statements, and;
2) engaging the independent public accountants with whom the City Council reviews the scope
of the audits and the accounting principles to be applied in financial report. To ensure complete independence, Abdo, Eick and Meyers, LLP has full and free access to meet with the City Council to discuss the results of their audit and their assessment of the adequacy of internal accounting controls and the quality of financial reporting.
CERTIFICATE OF ACHIEVEMENT
The Government Finance Officers Association of the United States and Canada (GFOA) awarded a Certificate of Achievement for excellence in financial reporting to the City of Fairmont for its Comprehensive Annual Financial Report for the fiscal year ended December 31, 2017. The Certificate of Achievement is a prestigious national award recognizing conformance with the highest standards for preparation of state and local financial reports. In order to be awarded a Certificate of Achievement, a government unit must publish an easily readable and efficiently organized Comprehensive Annual Financial Report, whose contents conform to program standards. Such Comprehensive Annual Financial Report must satisfy both generally accepted accounting principles and applicable legal requirements. A Certificate of Achievement is valid for a period of one year only. The City of Fairmont has received a Certificate of Achievement for the last twenty-seven (27) consecutive years. We believe our current report continues to conform to the Certificate of Achievement program requirements, and we are submitting it to GFOA.
13

Honorable Mayor and City Council May 7, 2019
ACKNOWLEDGMENTS
The preparation of this report on a timely basis could not be accomplished without efficient and dedicated services of the entire staff of the Finance Department and support services staff. I would like to express my appreciation to all members of the departments who assisted and contributed to its preparation. I would also like to thank the Mayor and City Council for their interest and support in planning and conducting the financial operations of the City in a responsible manner. Respectfully submitted,
City of Fairmont Paul Hoye Finance Director
14

City of Fairmont, Minnesota Principal City Officials
For the Year Ended December 31, 2018
Title Name Term Expires
Deborah Foster 12/31/2018
Tom Hawkins 12/31/2020Bruce Peters 12/31/2018Ruth Cyphers 12/31/2020
Jim Zarling 12/31/2018Wayne Hasek 12/31/2020
Michael Humpal
Paul Hoye
Patty Monsen
Troy Nemmers
Elizabeth W. Bloomquist
Mayor
Council Members
City Administrator
Finance Director
City Clerk
Director of Public Works and Public Utilities
City Attorney
Chief of Police Michael N. Hunter
15
lmunguia_ABDO16C
Sticky Note
Marked set by lmunguia_ABDO16C

Citizens of Fairmont
Mayor And City Council
CityAttorney
CityAdministrator Advises
Public Utilities Commission
PoliceCommission
Fairmont Economic
Development Authority
Housing and Redevelopment
Board Of Zoning Appeals
Board of Building Code Appeals
Planning Commission
Director of Finance and Adminstration
Public Works /Utilities
EconomicDevelopment
Public SafetyChief Of Police
16
(Government Finance Officers Association
Certificate ofAchievementfor Excellence
in FinancialReporting
Presented to
City of Fairmont
Minnesota
For its Comprehensive Annual
Financial Report
for the Fiscal Year Ended
December 31, 2017
QMtM^u. P- T^jv^MExecutive Director/CEO
17

THIS PAGE IS LEFT
BLANK INTENTIONALLY
18

Financial Section

FINANCIAL SECTION
CITY OF FAIRMONT FAIRMONT, MINNESOTA
FOR THE YEAR ENDED DECEMBER 31, 2018
19

THIS PAGE IS LEFT
BLANK INTENTIONALLY
20

INDEPENDENT AUDITOR'S REPORT
Honorable Mayor and City Council City of Fairmont, Minnesota
Report on the Financial Statements
We have audited the accompanying financial statements of the governmental activities, the business-type activities, the discretely presented component unit, each major fund and the aggregate remaining fund information of the City of Fairmont, Minnesota (the City), as of and for the year ended December 31, 2018, and the related notes to the financial statements, which collectively comprise the City’s basic financial statements as listed in the table of contents.
Management’s Responsibility for the Financial Statements
Management is responsible for the preparation and fair presentation of these financial statements in accordance with accounting principles generally accepted in the United States of America; this includes the design, implementation, and maintenance of internal control relevant to the preparation and fair presentation of the financial statements that are free from material misstatement, whether due to fraud or error.
Auditor’s Responsibility
Our responsibility is to express an opinion on these financial statements based on our audit. We conducted our audit in accordance with auditing standards generally accepted in the United States of America and the standards applicable to financial audits contained in Government Auditing Standards, issued by the Comptroller General of the United States. Those standards require that we plan and perform the audit to obtain reasonable assurance about whether the financial statements are free of material misstatement.
An audit involves performing procedures to obtain audit evidence about the amounts and disclosures in the financial statements. The procedures selected depend on the auditor’s judgment, including the assessment of the risks of material misstatement of the financial statements, whether due to fraud or error. In making those risk assessments, the auditor considers internal control relevant to the City’s preparation and fair presentation of the financial statements in order to design audit procedures that are appropriate in the circumstances, but not for the purpose of expressing an opinion on the effectiveness of the City’s internal control. Accordingly, we express no such opinion. An audit also includes evaluating the appropriateness of accounting policies used and the reasonableness of significant accounting estimates made by management, as well as evaluating the overall financial statement presentation.
We believe that the audit evidence we have obtained is sufficient and appropriate to provide a basis for our audit opinions.
Opinions
In our opinion, the financial statements referred to above present fairly, in all material respects, the respective financial position of the governmental activities, the business-type activities, the discretely presented component unit, each major fund and the aggregate remaining fund information of the City as of December 31, 2018, and the respective changes in financial position and cash flows, where applicable, thereof and the budgetary comparison for the General fund for the year then ended in conformity with accounting principles generally accepted in the United States of America.
100 Warren Street, Suite 600 Mankato, MN 56001 Office 507.625.2727 | Fax 507.388.9139
21
lmunguia_ABDO16C
Sticky Note
Marked set by lmunguia_ABDO16C

THIS PAGE IS LEFT
BLANK INTENTIONALLY
22

Change in Accounting Standards As described in Note 8 to the financial statements, the City adopted the provisions of Governmental Accounting Standard Board (GASB) Statement No. 75, Accounting and Financial Reporting for Postemployment Benefits Other Than Pensions, for the year ended December 31, 2018. Adoption of the provisions of these statements results in significant change to the classifications of the components of the financial statements. Other Matters Required Supplementary Information Accounting principles generally accepted in the United States of America require that the Management’s Discussion and Analysis starting on page 25 and the Schedules of Employer’s Share of the Net Pension Liability, the Schedule of Changes in Net Pension Liability (Asset) and Related Ratios, the Schedules of Employer’s Contributions, the related note disclosures and the Schedule of Changes in the City's OPEB Liability and Related Ratios starting on page 103 be presented to supplement the basic financial statements. Such information, although not a part of the basic financial statements, is required by the Governmental Accounting Standards Board who considers it to be an essential part of financial reporting for placing the basic financial statements in an appropriate operational, economic, or historical context. We have applied certain limited procedures to the required supplementary information in accordance with auditing standards generally accepted in the United States of America, which consisted of inquiries of management about the methods of preparing the information and comparing the information for consistency with management’s responses to our inquiries, the basic financial statements, and other knowledge we obtained during our audit of the basic financial statements. We do not express an opinion or provide any assurance on the information because the limited procedures do not provide us with sufficient evidence to express an opinion or provide any assurance. Other Information Our audit was conducted for the purpose of forming opinions on the financial statements that collectively comprise the City’s basic financial statements. The introductory section, combining and individual fund financial statements and schedules and statistical section are presented for purposes of additional analysis and are not a required part of the basic financial statements. Also, the accompanying Schedule of Expenditures of Federal Awards is presented for purposes of additional analysis as required by the Uniform Guidance and is not a required part of the financial statements. The combining and individual fund financial statements and schedules and the Schedule of Expenditures of Federal Awards are the responsibility of management and were derived from and relate directly to the underlying accounting and other records used to prepare the basic financial statements. Such information has been subjected to the auditing procedures applied in the audit of the basic financial statements and certain additional procedures, including comparing and reconciling such information directly to the underlying accounting and other records used to prepare the basic financial statements or to the basic financial statements themselves, and other additional procedures in accordance with auditing standards generally accepted in the United States of America. In our opinion, the combining and individual fund financial statements and schedules and the Schedule of Expenditures of Federal Awards are fairly stated, in all material respects, in relation to the basic financial statements as a whole. The introductory and statistical sections have not been subjected to the auditing procedures applied in the audit of the basic financial statements, and accordingly, we do not express an opinion or provide any assurance on them. Other Reporting Required by Government Auditing Standards In accordance with Government Auditing Standards, we have also issued our report dated May 7, 2019, on our consideration of the City’s internal control over financial reporting and on our tests of its compliance with certain provisions of laws, regulations, contracts, and grant agreements and other matters. The purpose of that report is solely to describe the scope of our testing of internal control over financial reporting and compliance and the results of that testing, and not to provide an opinion on the effectiveness of the City’s internal control over financial reporting or on compliance. That report is an integral part of an audit performed in accordance with Government Auditing Standards in considering the City’s internal control over financial reporting and compliance.
ABDO, EICK & MEYERS, LLP Mankato, Minnesota May 7, 2019
23
THIS PAGE IS LEFT
BLANK INTENTIONALLY
24
Management’s Discussion and Analysis
As management of the City of Fairmont, Minnesota, (the City), we offer readers of the City’s financial statements this narrative overview and analysis of the financial activities of the City for the fiscal year ended December 31, 2018. We encourage readers to consider the information presented here in conjunction with additional information that we have furnished in our letter of transmittal, which can be found starting on page 10 of this report.
Financial Highlights
• The assets and deferred outflows of resources of the City exceeded its liabilities and deferred inflows of resourcesat the close of the most recent fiscal year by $110,897,694 (net position). Of this amount, $19,199,101(unrestricted net position) may be used to meet the City’s ongoing obligations to citizens and creditors.
• The City’s total net position increased by $3,842,656, compared to an increase of $2,941,739, in the previousyear. The increase in net position is attributed to continued strong performance of the City’s enterprise funds,specifically the Wastewater, Electric and Municipal Liquor funds. The City also implemented a local option salestax for additional revenues in the governmental funds.
• As of the close of the current fiscal year, the City’s governmental funds reported combined ending fund balancesof $17,632,130, an increase of $451,102 in comparison with the prior year. This increase is mainly the result ofstrong performance in the General and the nonmajor special revenue funds. Unassigned fund balance at yearend is $3,798,955. The remainder of fund balance is not available for new spending because it is either 1)restricted ($8,264,773), 2) committed ($1,258,708), 3) assigned ($4,309,694) for the purposes described in Note3F in the notes to the financial statements.
Overview of the Financial Statements
This discussion and analysis is intended to serve as an introduction to the City’s basic financial statements. The City’s basic financial statements comprise three components: 1) government-wide financial statements, 2) fund financial statements, and 3) notes to the financial statements. This report also contains other supplemental information in addition to the basic financial statements themselves.
25
lmunguia_ABDO16C
Sticky Note
Marked set by lmunguia_ABDO16C

The financial statements also include notes that explain some of the information in the financial statements and provide more detailed data. The statements are followed by a section of combining and individual fund financial statements and schedules that further explains and supports the information in the financial statements. Figure 1 shows how the required parts of this annual report are arranged and relate to one another. In addition to these required elements, we have included a section with combining and individual fund financial statements and schedules that provide details about nonmajor governmental funds, which are added together and presented in single columns in the basic financial statements.
Figure 1 Required Components of the
City’s Annual Financial Report
Management's Discussion and
Analysis
Basic Financial Statements
Required Supplementary
Information
Government-wide Financial
Statements
FundFinancial
Statements
Notes to theFinancial
Statements
Summary Detail
26
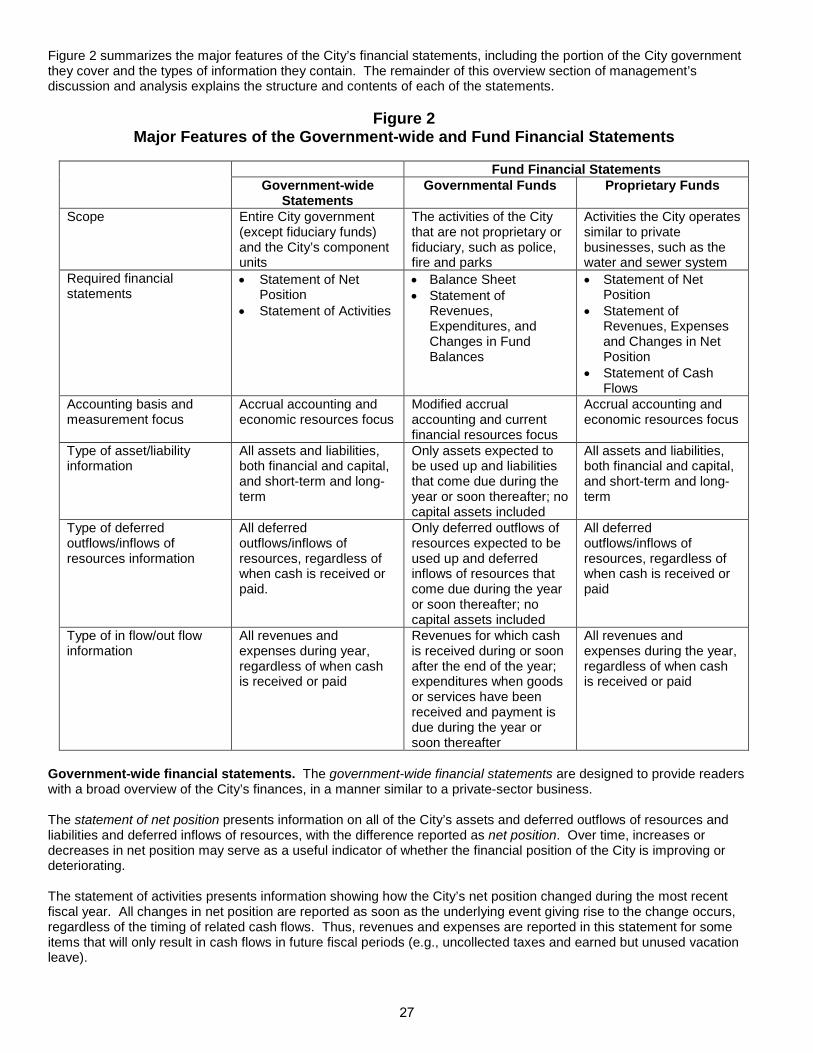
Figure 2 summarizes the major features of the City’s financial statements, including the portion of the City government they cover and the types of information they contain. The remainder of this overview section of management’s discussion and analysis explains the structure and contents of each of the statements.
Figure 2 Major Features of the Government-wide and Fund Financial Statements
Fund Financial Statements
Government-wide Statements
Governmental Funds Proprietary Funds
Scope Entire City government (except fiduciary funds) and the City’s component units
The activities of the City that are not proprietary or fiduciary, such as police, fire and parks
Activities the City operates similar to private businesses, such as the water and sewer system
Required financial statements
• Statement of Net Position
• Statement of Activities
• Balance Sheet • Statement of
Revenues, Expenditures, and Changes in Fund Balances
• Statement of Net Position
• Statement of Revenues, Expenses and Changes in Net Position
• Statement of Cash Flows
Accounting basis and measurement focus
Accrual accounting and economic resources focus
Modified accrual accounting and current financial resources focus
Accrual accounting and economic resources focus
Type of asset/liability information
All assets and liabilities, both financial and capital, and short-term and long-term
Only assets expected to be used up and liabilities that come due during the year or soon thereafter; no capital assets included
All assets and liabilities, both financial and capital, and short-term and long-term
Type of deferred outflows/inflows of resources information
All deferred outflows/inflows of resources, regardless of when cash is received or paid.
Only deferred outflows of resources expected to be used up and deferred inflows of resources that come due during the year or soon thereafter; no capital assets included
All deferred outflows/inflows of resources, regardless of when cash is received or paid
Type of in flow/out flow information
All revenues and expenses during year, regardless of when cash is received or paid
Revenues for which cash is received during or soon after the end of the year; expenditures when goods or services have been received and payment is due during the year or soon thereafter
All revenues and expenses during the year, regardless of when cash is received or paid
Government-wide financial statements. The government-wide financial statements are designed to provide readers with a broad overview of the City’s finances, in a manner similar to a private-sector business. The statement of net position presents information on all of the City’s assets and deferred outflows of resources and liabilities and deferred inflows of resources, with the difference reported as net position. Over time, increases or decreases in net position may serve as a useful indicator of whether the financial position of the City is improving or deteriorating. The statement of activities presents information showing how the City’s net position changed during the most recent fiscal year. All changes in net position are reported as soon as the underlying event giving rise to the change occurs, regardless of the timing of related cash flows. Thus, revenues and expenses are reported in this statement for some items that will only result in cash flows in future fiscal periods (e.g., uncollected taxes and earned but unused vacation leave).
27

Both of the government-wide financial statements distinguish functions of the City that are principally supported by taxes and intergovernmental revenue (governmental activities) from other functions that are intended to recover all or a significant portion of their costs through user fees and charges (business-type activities). The governmental activities of the City include general government, public safety, streets and highways, sanitation and waste removal, culture and recreation, housing development, economic development and airport and lake restoration. The business-type activities of the City include electric, water, wastewater, storm sewer utilities, a municipal liquor store and off street parking. The government-wide financial statements include not only the City itself (known as the primary government), but also a legally separate Fairmont Economic Development Authority for which the City is financially accountable. Financial information for this component unit is reported separately from the financial information presented for the primary government itself. The government-wide financial statements can be found starting on page 39 of this report. Fund financial statements. A fund is a grouping of related accounts that is used to maintain control over resources that have been segregated for specific activities or objectives. The City, like other state and local government, uses fund accounting to ensure and demonstrate compliance with finance-related legal requirements. All of the funds of the City can be divided into three categories: governmental funds, proprietary funds and fiduciary funds. Governmental funds. Governmental funds are used to account for essentially the same functions reported as governmental activities in the government-wide financial statements. However, unlike the government-wide financial statements, governmental fund financial statements focus on near-term inflows and outflows of spendable resources, as well as on balances of spendable resources available at the end of the fiscal year. Such information may be useful in evaluating a government’s near-term financing requirements. Because the focus of governmental funds is narrower than that of the government-wide financial statements, it is useful to compare the information presented for governmental funds with similar information presented for governmental activities in the government-wide financial statements. By doing so, readers may better understand the long-term impact by the government’s near-term financing decisions. Both the governmental fund balance sheet and the governmental fund statement of revenues, expenditures and changes in fund balances provide a reconciliation to facilitate this comparison between governmental funds and governmental activities. The City maintains several individual governmental funds, a number of which are Debt Service funds, which are reported as one fund for reporting purposes. Information is presented separately in the governmental fund balance sheet and in the governmental fund statement of revenues, expenditures and changes in fund balances for the General and Debt Service which are considered to be major funds. Data from the other governmental funds are combined into a single, aggregated presentation. Individual fund data for each of these nonmajor governmental funds is provided in the form of combining statements elsewhere in this report. The City adopts an annual appropriated budget for its General fund. A budgetary comparison statement has been provided for the General fund to demonstrate compliance with this budget. The basic governmental fund financial statements can be found starting on page 45 of this report. Proprietary funds. The City maintains two different types of proprietary funds. Enterprise funds are used to report the same functions presented as business-type activities in the government-wide financial statements. The City uses enterprise funds to account for its electric, water, wastewater, storm sewer, liquor store and parking lots. Internal service funds are an accounting device used to accumulate and allocate costs internally among the City’s various functions. The City uses internal service funds to account for the maintenance of its fleet of vehicles, for its management information systems, and self-insurance funds. Because all of these services benefit both governmental and business-type functions, they have been allocated between the governmental activities and the business-type activities in the government-wide financial statements. Proprietary funds provide the same type of information as the government-wide financial statements, only in more detail. The proprietary fund financial statements provide separate information for each of the enterprise funds which are considered to be major funds of the City. Individual fund data for the internal service funds is provided in the form of combining statements elsewhere in this report. The basic proprietary fund financial statements can be found starting on page 50 of this report. Fiduciary funds. Fiduciary funds are used to account for resources held for the benefit of parties outside the City. Fiduciary funds are not reflected in the government-wide financial statements because the resources of those funds are not available to support the City’s own programs. The accounting used for fiduciary funds is much like that used for proprietary funds. The basic fiduciary fund financial statements can be found starting on page 60 of this report.
28

Notes to the financial statements. The notes provide additional information that is essential to a full understanding of the data provided in the government-wide and fund financial statements. The notes to the financial statements can be found starting on page 61 of this report. Required supplementary information. In addition to the basic financial statements and accompanying notes, this report also presents certain required supplementary information concerning the City of Fairmont’s share of net pension liabilities (assets) for defined benefits plans, schedules of contributions, Schedule of Changes in the City’s Total OPEB Liability and Related Ratios. Required supplementary information can be found starting on page 103 of this report. Other information. The combining statements referred to earlier in connection with nonmajor governmental funds and internal service funds are presented immediately following the required supplementary information on pensions. Combining and individual fund financial statements and schedules can be found starting on page 111 of this report. Government-wide Financial Analysis As noted earlier, net position may serve over time as a useful indicator of a government’s financial position. In the case of the City, assets and deferred outflows of resources exceeded liabilities and deferred inflows of resources by $110,897,694 at the close of the most recent fiscal year. By far, the largest portion of the City’s net position (73.4 percent) reflects its investment in capital assets (e.g., land, buildings, machinery and equipment); less any related debt used to acquire those assets that is still outstanding. The City uses these capital assets to provide services to citizens; consequently, these assets are not available for future spending. Although the City’s investment in its capital assets is reported net of related debt, it should be noted that the resources needed to repay this debt must be provided from other sources, since the capital assets themselves cannot be used to liquidate these liabilities.
City of Fairmont’s Summary of Net Position
(Restated) Increase (Restated) Increase2018 2017 (Decrease) 2018 2017 (Decrease)
AssetsCurrent and other assets 22,317,695$ 22,837,273$ (519,578)$ 18,327,060$ 18,073,496$ 253,564$ Capital assets 56,979,957 57,448,730 (468,773) 65,354,415 66,003,883 (649,468)
Total assets 79,297,652 80,286,003 (988,351) 83,681,475 84,077,379 (395,904)
Deferred Inflows of Resources 2,908,018 3,196,755 (288,737) 404,989 642,692 (237,703)
LiabilitiesLong-term liabilities
outstanding 16,503,288 19,522,644 (3,019,356) 31,512,832 33,561,998 (2,049,166) Other liabilities 1,270,903 1,878,823 (607,920) 1,872,506 1,805,010 67,496
Total liabilities 17,774,191 21,401,467 (3,627,276) 33,385,338 35,367,008 (1,981,670)
Deferred Outflows of Resources 3,637,242 3,715,146 (77,904) 597,669 664,170 (66,501)
Net PositionNet investment in
capital assets 44,638,223 43,687,451 950,772 36,725,415 35,673,883 1,051,532 Restricted 10,334,955 9,971,329 363,626 - - - Unrestricted 5,821,059 4,707,365 1,113,694 13,378,042 13,015,010 363,032
Total Net Position 60,794,237$ 58,366,145$ 2,428,092$ 50,103,457$ 48,688,893$ 1,414,564$
Governmental Activities Business-type Activities
An additional portion of the City’s net position (9.3 percent) represents resources that are subject to external restrictions on how they may be used. The remaining balance of unrestricted net position (17.3 percent) may be used to meet the City’s ongoing obligations to citizens and creditors. At the end of the current fiscal year, the City is able to report positive balances in all three categories of net position, both for the City as a whole, as well as for its separate governmental and business-type activities.
29
lmunguia_ABDO16C
Sticky Note
Marked set by lmunguia_ABDO16C
lmunguia_ABDO16C
Sticky Note
Marked set by lmunguia_ABDO16C

Governmental activities. Governmental activities increased the City’s net position by $2,428,092. The primary reasons for the increase in net position were a result of an increase in taxes of $1,116,225 and capital grants and contributions revenues of $1,216,811. Key elements of this increase are as follows:
• Continued street lighting conversions to LED which has lowered electric costs.• Increased interest earnings as interest rates have continued to improve.• The City received a larger donation from the Fire Relief Association’s gambling fund for future capital purchases.• The City continued to increase its General fund reserves to be used for construction.
City of Fairmont’s Changes in Net Position
Increase Increase2018 2017 (Decrease) 2018 2017 (Decrease)
RevenuesProgram Revenues
Charges for services 1,429,424$ 1,467,059$ (37,635)$ 26,630,706$ 25,970,314$ 660,392$ Operating grants and contributions 613,636 340,258 273,378 - - - Capital grants and contributions 1,216,811 2,200,736 (983,925) 1,460 44,417 (42,957)
General RevenuesProperty taxes/tax increments 4,559,071 4,008,624 550,447 - - - Other taxes 781,951 216,173 565,778 - - - Grants and contributions not
restricted to specific programs 3,614,236 3,469,459 144,777 - - - Unrestricted
investment earnings 158,834 182,987 (24,153) 255,218 162,919 92,299 Other 214,612 203,394 11,218 - - -
Total Revenues 12,588,575 12,088,690 499,885 26,887,384 26,177,650 709,734
ExpensesGeneral government 1,538,761 1,389,155 149,606 - - - Public safety 3,490,270 3,598,787 (108,517) - - - Streets and highways 3,036,945 2,988,471 48,474 - - - Sanitation and waste removal 138,077 148,959 (10,882) - - - Culture and recreation 1,762,810 1,758,014 4,796 - - - Housing development 94,458 143,337 (48,879) - - - Economic development 207,984 243,958 (35,974) - - - Miscellaneous 1,009,453 918,959 90,494 - - - Interest on long-term debt 266,725 313,947 (47,222) - - - Electric - - - 14,995,845 14,731,070 264,775 Water - - - 3,600,037 3,541,198 58,839 Wastewater - - - 1,812,529 1,876,476 (63,947) Storm sewer - - - 461,741 482,469 (20,728) Liquor - - - 3,210,279 3,181,621 28,658 Parking lot - - - 7,389 8,180 (791)
Total Expenses 11,545,483 11,503,587 41,896 24,087,820 23,821,014 266,806
Change in Net Position Before Transfer 1,043,092 585,103 457,989 2,799,564 2,356,636 442,928
Transfers 1,385,000 1,087,132 297,868 (1,385,000) (1,087,132) (297,868)
Change in Net Position 2,428,092 1,672,235 755,857 1,414,564 1,269,504 145,060
Net Position - January 1 as Restated 58,366,145 56,693,910 1,672,235 48,688,893 47,419,389 1,269,504
Net Position - December 31 60,794,237$ 58,366,145$ 2,428,092$ 50,103,457$ 48,688,893$ 1,414,564$
Governmental Activities Business-type Activities
Property tax levies increased by 12.1 percent during the year. The increase was used for operating costs and an additional full-time employee in the street department. The City also increased its funding to the Fire Truck Replacement. Fund and added funding for future street improvements. The following graph depicts various governmental activities and shows the revenue and expenses directly related to those activities.
30
lmunguia_ABDO16C
Sticky Note
Marked set by lmunguia_ABDO16C

Expenses and Program Revenues - Governmental Activities
$- $500,000
$1,000,000 $1,500,000 $2,000,000 $2,500,000 $3,000,000 $3,500,000 $4,000,000
Gen
eral
gov
ernm
ent
Pub
lic s
afet
y
Stre
et a
nd h
ighw
ays
San
itatio
n an
d w
aste
rem
oval
Cul
ture
and
recr
eatio
n
Hou
sing
dev
elop
men
t
Eco
nom
ic d
evel
opm
ent
Mis
cella
neou
s
Inte
rest
on
long
-term
debt
Expenses Program revenues
Revenues by Source
Charges for services11.4%
Operating grants and contributions
4.9%
Capital grants and contributions
9.7%
Grants and contributions unrestricted
28.6%
Property taxes/tax increments
36.2%
Other taxes6.2%
Unrestricted investment earnings
1.3%
Other 1.7%
31
lmunguia_ABDO16C
Sticky Note
Marked set by lmunguia_ABDO16C

Business-type activities. Business-type activities increased the City’s net position by $1,414,564. Key elements of this increase are as follows:
• PUC (electric, wastewater and water) operating income of $2,555,111, with a total change in net position of $1,234,046.
• The PUC approved a 3% water rate increase in 2018 that increased revenues 0.7%.
Expenses and Program Revenues - Business-type Activities
$-
$2,000,000
$4,000,000
$6,000,000
$8,000,000
$10,000,000
$12,000,000
$14,000,000
$16,000,000
$18,000,000
Electric Water Wastewater Storm sewer Liquor
Expenses Program revenues
Revenues by Source
Charges for services99.1%
Unrestricted investment earnings
0.9%
32

Financial Analysis of the City’s Funds As noted earlier, the City uses fund accounting to ensure and demonstrate compliance with finance-related legal requirements. Governmental funds. The focus of the City’s governmental funds is to provide information on near-term inflows, outflows and balances of spendable resources. Such information is useful in assessing the City’s financing requirements. In particular, unassigned fund balance may serve as a useful measure of a government’s net resources available for spending at the end of the fiscal year. The General fund is the chief operating fund of the City. At the end of the current year, the fund balance of the General fund was $7,863,525. As a measure of the General fund’s liquidity, it may be useful to compare unassigned and total fund balance to total fund expenditures. Unassigned fund balance was $3,976,673, or 44.6 percent of total General fund expenditures, while total fund balance represents 88.2 percent of General fund expenditures. The fund balance of the City’s General fund increased by $613,811 during the current fiscal year. Contributing factors to the increase are actual expenditures under budget of $909,852 due to culture and recreation capital outlay expenditures being under budget by $727,693. The Cedar Creek Park Trail and Pioneer Bridge projects were delayed and will be completed in 2019. The Debt Service fund has a total fund balance of $3,411,020, all of which is restricted for the payment of debt service. The net decrease in fund balance during the current year in the Debt Service fund was $1,588,450. The major reason for the decrease was scheduled debt service payments and transfers. Proprietary funds. The City’s proprietary funds provide the same type of information found in the government-wide financial statements, but in more detail. Unrestricted net position of the enterprise funds at the end of the year amounted to $13,301,760, of which $2,137,693 was for the Water Utility fund, $3,805,140 was for the Wastewater Utility fund, $5,450,571 was for the Electric Utility fund, $288,429 was for the Storm Sewer fund and those for the Municipal Liquor fund amounted to $1,620,370. The total increase in net position for the enterprise funds was $1,442,954. Other factors concerning the finances of these funds have already been addressed in the discussion of the City’s business-type activities. General Fund Budgetary Highlights The City’s General fund budget was not amended during the year. Budgeted revenues exceeded actual by $248,453 and actual expenditures were under budget by $909,852 in 2018. The primary reasons for the variances are as follows:
• The City received $165,005 from FEMA for disaster relief that put intergovernmental revenues over budget.
• The City received $131,899 from the Fire Relief Association’s gambling fund for capital equipment which was not included in the budget.
• Capital outlay was under budget by $937,920 as a result of a couple of trail projects being delayed until 2019. Also, The estimate on the construction of the new Street and Park building came in considerably over budget which delayed this project as well.
33

Capital Asset and Debt Administration Capital assets. The City’s investment in capital assets for its governmental and business type activities as of December 31, 2018 amounts to $122,334,372 (net of accumulated depreciation). This investment in capital assets includes land, structures, improvements, machinery and equipment, park facilities, roads, highways and bridges. Major capital asset events during the current fiscal year included the following:
• Completed $1,225,791 in street improvement projects.
• Replaced a squad car in the Police Department.
• Various equipment purchases by the PUC including meters, transformers and cable.
• Repaired the roof of the Senior Center.
• Purchased a Plow/Dump Truck in the Street Department.
• Began design work on the new Street and Park Building.
• Refurbished 3 pool slides at the Aquatic Park.
• Began construction on the Cedar Creek Park Trail.
• Continued work on the Pioneer Bridge replacement.
• Began design on the Margaret Street Trail extension.
• Began design on a new T-Hangar for the Airport.
• Continued work on the Canyon Drive storm water improvement project.
Additional information on the City’s capital assets can be found in Note 3C starting on page 74 of this report.
City of Fairmont’s Capital Assets (net of depreciation)
Increase Increase2018 2017 (Decrease) 2018 2017 (Decrease)
Land 3,949,478$ 3,949,478$ -$ 1,718,715$ 1,718,715$ -$ Buildings and Structures 5,099,814 5,298,527 (198,713) 34,818,621 35,633,456 (814,835) Improvement Other
Than Buildings 10,134,658 10,728,063 (593,405) 22,944,210 23,593,426 (649,216) Machinery and Equipment 1,646,908 1,762,982 (116,074) 4,678,397 4,824,712 (146,315) Vehicles 737,277 585,919 151,358 - - - Infrastructure 32,678,628 31,348,299 1,330,329 - - - Construction in Progress 2,733,194 3,775,462 (1,042,268) 1,194,472 233,574 960,898
Total 56,979,957$ 57,448,730$ (468,773)$ 65,354,415$ 66,003,883$ (649,468)$
Governmental Activities Business-type Activities
34
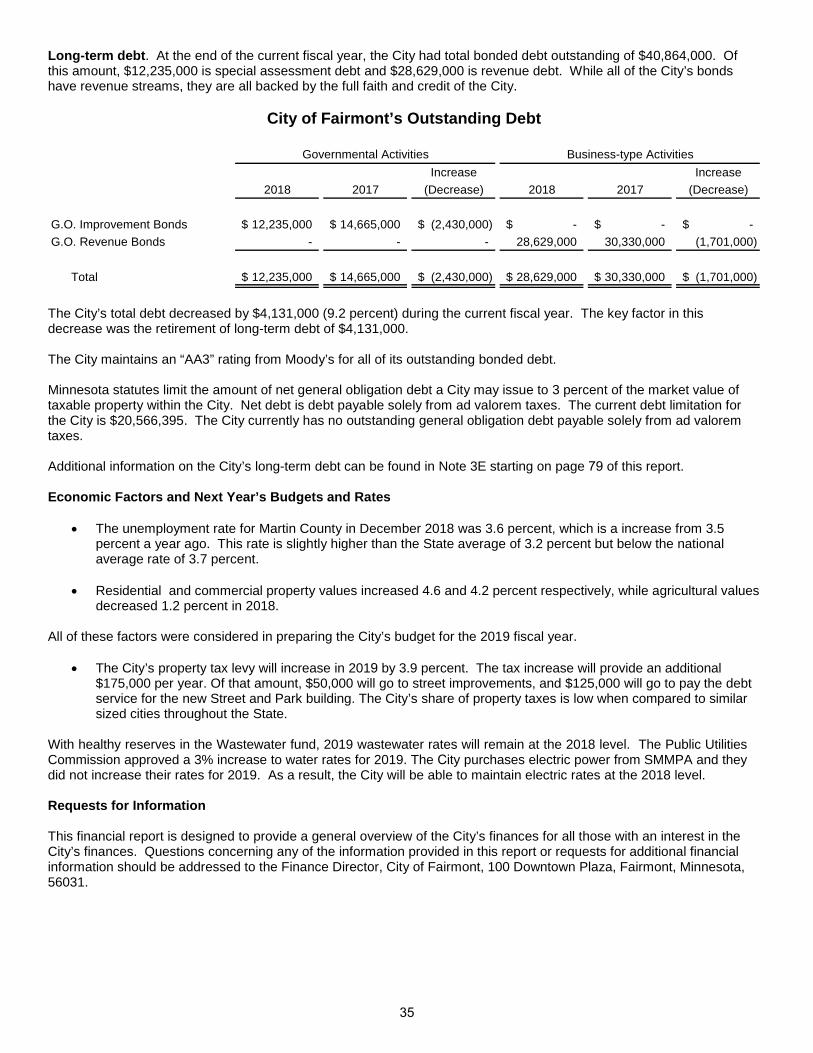
Long-term debt. At the end of the current fiscal year, the City had total bonded debt outstanding of $40,864,000. Of this amount, $12,235,000 is special assessment debt and $28,629,000 is revenue debt. While all of the City’s bonds have revenue streams, they are all backed by the full faith and credit of the City.
City of Fairmont’s Outstanding Debt
Increase Increase2018 2017 (Decrease) 2018 2017 (Decrease)
G.O. Improvement Bonds 12,235,000$ 14,665,000$ (2,430,000)$ -$ -$ -$ G.O. Revenue Bonds - - - 28,629,000 30,330,000 (1,701,000)
Total 12,235,000$ 14,665,000$ (2,430,000)$ 28,629,000$ 30,330,000$ (1,701,000)$
Governmental Activities Business-type Activities
The City’s total debt decreased by $4,131,000 (9.2 percent) during the current fiscal year. The key factor in this decrease was the retirement of long-term debt of $4,131,000.
The City maintains an “AA3” rating from Moody’s for all of its outstanding bonded debt.
Minnesota statutes limit the amount of net general obligation debt a City may issue to 3 percent of the market value of taxable property within the City. Net debt is debt payable solely from ad valorem taxes. The current debt limitation for the City is $20,566,395. The City currently has no outstanding general obligation debt payable solely from ad valorem taxes.
Additional information on the City’s long-term debt can be found in Note 3E starting on page 79 of this report.
Economic Factors and Next Year’s Budgets and Rates
• The unemployment rate for Martin County in December 2018 was 3.6 percent, which is a increase from 3.5percent a year ago. This rate is slightly higher than the State average of 3.2 percent but below the nationalaverage rate of 3.7 percent.
• Residential and commercial property values increased 4.6 and 4.2 percent respectively, while agricultural valuesdecreased 1.2 percent in 2018.
All of these factors were considered in preparing the City’s budget for the 2019 fiscal year.
• The City’s property tax levy will increase in 2019 by 3.9 percent. The tax increase will provide an additional$175,000 per year. Of that amount, $50,000 will go to street improvements, and $125,000 will go to pay the debtservice for the new Street and Park building. The City’s share of property taxes is low when compared to similarsized cities throughout the State.
With healthy reserves in the Wastewater fund, 2019 wastewater rates will remain at the 2018 level. The Public Utilities Commission approved a 3% increase to water rates for 2019. The City purchases electric power from SMMPA and they did not increase their rates for 2019. As a result, the City will be able to maintain electric rates at the 2018 level.
Requests for Information
This financial report is designed to provide a general overview of the City’s finances for all those with an interest in the City’s finances. Questions concerning any of the information provided in this report or requests for additional financial information should be addressed to the Finance Director, City of Fairmont, 100 Downtown Plaza, Fairmont, Minnesota, 56031.
35
lmunguia_ABDO16C
Sticky Note
Marked set by lmunguia_ABDO16C
lmunguia_ABDO16C
Sticky Note
Marked set by lmunguia_ABDO16C
lmunguia_ABDO16C
Sticky Note
Marked set by lmunguia_ABDO16C

THIS PAGE IS LEFT
BLANK INTENTIONALLY
36

B
asic Financial Statements

GOVERNMENT-WIDE FINANCIAL STATEMENTS
CITY OF FAIRMONT FAIRMONT, MINNESOTA
FOR THE YEAR ENDED DECEMBER 31, 2018
37

THIS PAGE IS LEFT
BLANK INTENTIONALLY
38

City of Fairmont, MinnesotaStatement of Net Position
December 31, 2018
Component Unit
EconomicGovernmental Business-type Development
Activities Activities Total AuthorityAssets
Cash and temporary investments 17,871,070$ 14,309,570$ 32,180,640$ 405,280$ Receivables
Interest 76,759 - 76,759 - Delinquent taxes 92,341 - 92,341 2,301 Accounts 112,025 3,016,232 3,128,257 499 Notes 1,242,383 - 1,242,383 6,371 Special assessments 2,140,861 8,124 2,148,985 - Intergovernmental 707,525 - 707,525 1,099
Due from component unit 5,120 - 5,120 - Internal balances (51,514) 51,514 - - Inventories - 837,699 837,699 - Prepaid items 1,125 35,542 36,667 - Unamortized maintenance charges - 68,379 68,379 - Land held for resale 120,000 - 120,000 - Capital assets
Nondepreciable 6,682,672 2,913,187 9,595,859 - Depreciable, net of accumulated depreciation 50,297,285 62,441,228 112,738,513 -
Total Assets 79,297,652 83,681,475 162,979,127 415,550
Deferred Outflows of ResourcesDeferred pension resources 2,889,155 392,547 3,281,702 - Deferred other postemployment resources 18,863 12,442 31,305 472
Total Deferred Outflows of Resources 2,908,018 404,989 3,313,007 472
LiabilitiesAccounts and contracts payable 617,094 1,314,491 1,931,585 2,075 Due to primary government - - - 5,120 Due to other governments 344,983 92,918 437,901 - Accrued interest payable 83,042 224,965 308,007 - Accrued salaries and vacation payable 134,129 103,183 237,312 3,217 Deposits payable - 130,832 130,832 1,713 Unearned revenue 91,655 6,117 97,772 - Noncurrent liabilities
Due within one year 1,635,423 1,870,646 3,506,069 2,460 Due in more than one year 14,867,865 29,642,186 44,510,051 7,883
Total Liabilities 17,774,191 33,385,338 51,159,529 22,468
Deferred Inflows of ResourcesDeferred pension resources 3,637,242 597,669 4,234,911 -
Net PositionNet investment in capital assets 44,638,223 36,725,415 81,363,638 - Restricted for
Debt service 5,481,202 - 5,481,202 - Capital projects 2,381,787 - 2,381,787 - Housing and economic development 2,471,966 - 2,471,966 -
Unrestricted 5,821,059 13,378,042 19,199,101 393,554
Total Net Position 60,794,237$ 50,103,457$ 110,897,694$ 393,554$
Primary Government
The notes to the financial statements are an integral part of this statement.39
lmunguia_ABDO16C
Sticky Note
Marked set by lmunguia_ABDO16C

City of Fairmont, MinnesotaStatement of Activities
For the Year Ended December 31, 2018
Operating CapitalCharges for Grants and Grants and
Functions/Programs Expenses Services Contributions ContributionsPrimary Government
Governmental ActivitiesGeneral government 1,538,761$ 239,759$ -$ -$ Public safety 3,490,270 309,577 459,695 - Streets and highways 3,036,945 13,302 30,015 789,188 Sanitation and waste removal 138,077 137,360 - - Culture and recreation 1,762,810 171,529 - - Housing development 94,458 22,226 26,651 273,997 Economic development 207,984 65,454 - - Airport and lake restoration 1,009,453 470,217 97,275 153,626 Interest on long-term debt 266,725 - - -
Total Governmental Activities 11,545,483 1,429,424 613,636 1,216,811
Business-type ActivitiesElectric 14,995,845 16,405,873 - - Water 3,600,037 3,521,529 - 1,387 Wastewater 1,812,529 2,305,792 - 73 Storm sewer 461,741 581,475 - - Liquor 3,210,279 3,809,557 - - Parking lot 7,389 6,480 - -
Total Business-type Activities 24,087,820 26,630,706 - 1,460
Total Primary Government 35,633,303$ 28,060,130$ 613,636$ 1,218,271$
Component UnitHousing and economic development 224,540$ 38,953$ 104,962$ -$
General RevenuesProperty taxes, levied for general purposesProperty taxes, levied for debt serviceTax incrementsSales taxFranchise taxesGrants and contributions not restricted to specific programsUnrestricted investment earningsOther revenuesGain on sale of capital assets
TransfersTotal General Revenues and Transfers
Change in Net Position
Net Position - January 1 as Restated (Note 9)
Net Position - December 31
Program Revenues
The notes to the financial statements are an integral part of this statement.40

Component UnitEconomic
Governmental Business-type DevelopmentActivities Activities Total Authority
(1,299,002)$ (1,299,002)$ (2,720,998) (2,720,998) (2,204,440) (2,204,440)
(717) (717) (1,591,281) (1,591,281)
228,416 228,416 (142,530) (142,530) (288,335) (288,335) (266,725) (266,725)
(8,285,612) (8,285,612)
- 1,410,028$ 1,410,028 - (77,121) (77,121) - 493,336 493,336 - 119,734 119,734 - 599,278 599,278 - (909) (909) - 2,544,346 2,544,346
(8,285,612) 2,544,346 (5,741,266)
(80,625)$
3,295,022 - 3,295,022 99,312 1,124,959 - 1,124,959 -
139,090 - 139,090 - 740,471 - 740,471 -
41,480 - 41,480 - 3,614,236 - 3,614,236 -
158,834 255,218 414,052 6,181 15,278 - 15,278 -
199,334 - 199,334 - 1,385,000 (1,385,000) - -
10,713,704 (1,129,782) 9,583,922 105,493
2,428,092 1,414,564 3,842,656 24,868
58,366,145 48,688,893 107,055,038 368,686
60,794,237$ 50,103,457$ 110,897,694$ 393,554$
Primary Government
Net (Expense) Revenue andChanges in Net Position
The notes to the financial statements are an integral part of this statement.41

THIS PAGE IS LEFT
BLANK INTENTIONALLY
42

FUND FINANCIAL STATEMENTS
CITY OF FAIRMONT FAIRMONT, MINNESOTA
FOR THE YEAR ENDED DECEMBER 31, 2018
43

THIS PAGE IS LEFT
BLANK INTENTIONALLY
44

Other TotalDebt Governmental Governmental
General Service Funds FundsAssets
Cash and temporary investments 7,916,959$ 3,396,219$ 5,246,534$ 16,559,712$ Receivables
Interest 76,759 - - 76,759 Delinquent taxes 65,508 25,211 1,622 92,341 Accounts 98,792 - 12,179 110,971 Loans - - 1,242,383 1,242,383 Special assessments 12,848 2,128,013 - 2,140,861 Intergovernmental 203,529 17,301 486,695 707,525
Due from other funds - - 29,000 29,000 Land held for resale - - 120,000 120,000
Total Assets 8,374,395$ 5,566,744$ 7,138,413$ 21,079,552$
LiabilitiesAccounts and contracts payable 251,655$ 2,500$ 331,358$ 585,513$ Due to other funds 31,959 - 29,971 61,930 Due to other governments 286 - 344,697 344,983 Accrued salaries payable 127,538 - 2,601 130,139 Unearned revenue 21,076 - 70,579 91,655
Total Liabilities 432,514 2,500 779,206 1,214,220
Deferred Inflows of ResourcesUnavailable revenue - taxes 65,508 25,211 1,622 92,341 Unavailable revenue - special assessments 12,848 2,128,013 - 2,140,861
Total Deferred Inflows of Resources 78,356 2,153,224 1,622 2,233,202
Fund BalancesRestricted - 3,411,020 4,853,753 8,264,773 Committed 79,222 - 1,179,486 1,258,708 Assigned 3,807,630 - 502,064 4,309,694 Unassigned 3,976,673 - (177,718) 3,798,955
Total Fund Balances 7,863,525 3,411,020 6,357,585 17,632,130
Total Liabilities, Deferred Inflows of Resources and Fund Balances 8,374,395$ 5,566,744$ 7,138,413$ 21,079,552$
City of Fairmont, MinnesotaBalance Sheet
Governmental FundsDecember 31, 2018
The notes to the financial statements are an integral part of this statement.45

City of Fairmont, MinnesotaReconciliation of the Balance Sheet
to the Statement of Net PositionGovernmental FundsDecember 31, 2018
Amounts reported for governmental activities in the statementof net position are different because
Total Fund Balances - Governmental Funds 17,632,130$
Capital assets used in governmental activities are not financialresources and therefore are not reported as assets in the funds. 56,927,573
Long-term liabilities, including bonds payable, are not due and payable in thecurrent period and therefore are not reported as liabilities in the funds.Long-term liabilities at year-end consist of
Severance payable (522,856) Postemployment benefits other than pension obligation (315,058) Pension liability (3,316,420) Bonds payable (12,235,000) Bond premiums, net of accumulated amortization (106,734)
Long-term assets are not available to pay current-period expenditures and, therefore,are unavailable in the funds.
Delinquent property taxes receivable 92,341 Special assessments receivable 2,140,861
Governmental funds do not report long-term amounts related to pensions andother postemployment benefits.
Deferred outflows of pension resources 2,889,155 Deferred inflows of pension resources (3,637,242) Deferred outflows of other postemployment benefit resources 18,863
Governmental funds do not report a liability for accrued interest untildue and payable. (83,042)
Internal service funds are used by management to charge the costs of various services toindividual funds. The assets and liabilities of certain internal service funds are included ingovernmental activities in the statement of net position. 1,309,666
Total Net Position - Governmental Activities 60,794,237$
The notes to the financial statements are an integral part of this statement.46

Other Total Debt Governmental Governmental
General Service Funds FundsRevenues
Taxes 3,255,724$ 1,261,933$ 814,957$ 5,332,614$ Special assessments 1,001 400,222 - 401,223 Licenses and permits 161,590 - - 161,590 Intergovernmental 3,970,647 - 1,279,089 5,249,736 Charges for services 524,603 - 468,671 993,274 Fines and forfeits 56,420 - - 56,420 Investment earnings 2,467 55,879 82,014 140,360 Payments from Component Unit for debt service - 800 - 800 Miscellaneous 251,025 - 259,226 510,251
Total Revenues 8,223,477 1,718,834 2,903,957 12,846,268
ExpendituresCurrent
General government 1,438,470 - - 1,438,470 Public safety 3,460,352 - - 3,460,352 Streets and highways 1,663,997 - - 1,663,997 Sanitation and waste removal 138,077 - - 138,077 Culture and recreation 1,398,228 - 15,543 1,413,771 Housing and economic development - 115,247 126,451 241,698 Miscellaneous - - 543,120 543,120
Capital outlay General government 34,203 - - 34,203 Public safety 153,385 - - 153,385 Streets and highways 209,785 - 1,225,791 1,435,576 Culture and recreation 416,307 - - 416,307 Miscellaneous - - 137,781 137,781
Debt servicePrincipal - 2,430,000 - 2,430,000 Interest and other - 302,763 - 302,763 Total Expenditures 8,912,804 2,848,010 2,048,686 13,809,500
Excess (Deficiency) of RevenuesOver (Under) Expenditures (689,327) (1,129,176) 855,271 (963,232)
Other Financing Sources (Uses)Proceeds from sale of capital assets 29,334 - - 29,334 Transfers in 1,348,804 485,337 998,140 2,832,281 Transfers out (75,000) (944,611) (427,670) (1,447,281)
Total Other Financing Sources (Uses) 1,303,138 (459,274) 570,470 1,414,334
Net Change in Fund Balances 613,811 (1,588,450) 1,425,741 451,102
Fund Balances, January 1 7,249,714 4,999,470 4,931,844 17,181,028
Fund Balances, December 31 7,863,525$ 3,411,020$ 6,357,585$ 17,632,130$
City of Fairmont, MinnesotaStatement of Revenues, Expenditures
and Changes in Fund BalancesGovernmental Funds
For the Year Ended December 31, 2018
The notes to the financial statements are an integral part of this statement.47

City of Fairmont, MinnesotaReconciliation of the Statement of
Revenues, Expenditures and Changes in Fund Balancesto the Statement of Activities
Governmental FundsFor the Year Ended December 31, 2018
Amounts reported for governmental activities in the statementof activities are different because
Net change in Fund balances - governmental funds 451,102$
Governmental funds report capital outlay as expenditures. However, in the statement ofactivities the cost of those assets is allocated over the estimated useful lives and reportedas depreciation expense.
Capital outlay 2,005,701 Depreciation expense (2,515,078)
The issuance of long-term debt provides current financial resources to governmental funds, whilethe repayment of principal of long-term debt consumes the current financial resources of governmentalfunds. Neither transaction, however, has any effect on net position. Also, governmental funds report the effect of premiums, discounts and similar items when debt is first issued, whereas these amountsare deferred and amortized in the statement of activities.
Principal repayments 2,430,000 Amortization of premiums, net of premium on bonds issued 19,545
Interest on long-term debt in the statement of activities differs from the amount reported in thegovernmental fund because interest is recognized as an expenditure in the funds when it is due,and thus requires the use of current financial resources. In the statement of activities, however,interest expense is recognized as the interest accrues, regardless of when it is due. 16,493
Long-term pension activity is not reported in governmental funds.Pension expense 357,933 Direct aid contributions 26,466
Certain revenues are recognized as soon as they are earned. Under the modified accrualbasis of accounting certain revenues cannot be recognized until they are availableto liquidate liabilities of the current period.
Property taxes 7,608 Special assessments (339,575)
Some expenses reported in the statement of activities do not require the use of currentfinancial resources and, therefore, are not reported as expenditures in governmental funds.
Compensated absences (33,132) Post employment benefits other than pension costs 10,569
Internal service funds are used by management to charge the costs of various services toindividual funds. The net revenues of certain activities of internal service funds are reportedwith governmental activities. (9,540)
Change in Net Position - Governmental Activities 2,428,092$
The notes to the financial statements are an integral part of this statement.48

City of Fairmont, MinnesotaStatement of Revenues, Expenditures and Changes in Fund Balances
Budget and ActualGeneral Fund
For the Year Ended December 31, 2018
Actual Variance withOriginal Final Amounts Final Budget
RevenuesTaxes 3,270,372$ 3,270,372$ 3,255,724$ (14,648)$ Special assessments - - 1,001 1,001 Licenses and permits 172,600 172,600 161,590 (11,010) Intergovernmental 3,882,346 3,882,346 3,970,647 88,301 Charges for services 454,152 454,152 524,603 70,451 Fines and forfeits 54,000 54,000 56,420 2,420 Investment earnings 40,000 40,000 2,467 (37,533) Miscellaneous 101,554 101,554 251,025 149,471
Total Revenues 7,975,024 7,975,024 8,223,477 248,453
ExpendituresCurrent
General government 1,429,952 1,429,952 1,438,470 (8,518) Public safety 3,346,141 3,346,141 3,460,352 (114,211) Streets and highways 1,669,270 1,669,270 1,663,997 5,273 Sanitation and waste removal 122,293 122,293 138,077 (15,784) Culture and recreation 1,503,400 1,503,400 1,398,228 105,172
Capital outlayGeneral government 71,000 71,000 34,203 36,797 Public safety 140,600 140,600 153,385 (12,785) Streets and highways 396,000 396,000 209,785 186,215 Culture and recreation 1,144,000 1,144,000 416,307 727,693
Total Expenditures 9,822,656 9,822,656 8,912,804 909,852
Excess (Deficiency) of RevenuesOver (Under) Expenditures (1,847,632) (1,847,632) (689,327) 1,158,305
Other Financing Sources (Uses)Proceeds from sale of capital assets - - 29,334 29,334 Transfers in 1,363,000 1,363,000 1,348,804 (14,196) Transfers out (80,000) (80,000) (75,000) 5,000
Total Other Financing Sources (Uses) 1,283,000 1,283,000 1,303,138 20,138
Net Change in Fund Balances (564,632) (564,632) 613,811 1,178,443
Fund Balances, January 1 7,249,714 7,249,714 7,249,714 -
Fund Balances, December 31 6,685,082$ 6,685,082$ 7,863,525$ 1,178,443$
Budgeted Amounts
The notes to the financial statements are an integral part of this statement.49

City of Fairmont, MinnesotaStatement of Net Position (Continued on the Following Pages)
Proprietary FundsFor the Year Ended December 31, 2018
Water Wastewater Electric Public Utilities
AssetsCurrent Assets
Cash and temporary investments 2,673,886$ 4,084,068$ 5,421,550$ 12,179,504$ Receivables
Accounts 446,232 307,711 2,167,800 2,921,743 Special assessments - current 7,245 879 - 8,124
Due from other funds - - - - Inventories 45,022 - 413,042 458,064 Prepaid items 34,192 - - 34,192
Total Current Assets 3,206,577 4,392,658 8,002,392 15,601,627
Noncurrent AssetsUnamortized maintenance charges 68,379 - - 68,379 Capital assets
Land 468,687 58,186 90,991 617,864 Buildings 28,556,341 11,075,237 1,302,793 40,934,371 Improvements other than buildings - - - - Utility plant in service 12,892,051 8,268,558 13,826,334 34,986,943 Machinery and equipment 435,314 6,790,738 3,909,209 11,135,261 Construction in progress 86,795 79,189 - 165,984
Total capital assets 42,439,188 26,271,908 19,129,327 87,840,423 Less accumulated depreciation (6,958,911) (11,602,250) (13,499,023) (32,060,184)
Total Capital Assets (Net of Accumulated Depreciation) 35,480,277 14,669,658 5,630,304 55,780,239
Total Noncurrent Assets 35,548,656 14,669,658 5,630,304 55,848,618
Total Assets 38,755,233 19,062,316 13,632,696 71,450,245
Deferred Outflows of ResourcesDeferred pension resources 118,232 56,531 161,085 335,848 Deferred other postemployment benefit resources 3,928 2,738 4,110 10,776
Total Deferred Outflows of Resources 122,160 59,269 165,195 346,624
Business-type Activities - Enterprise Funds
Utility Utility Utility Commission
601 602 604 Total
The notes to the financial statements are an integral part of this statement.53

GovernmentalActivities -
Storm Sewer Municipal Internal ServiceFunds
475,325$ 1,654,207$ 14,309,570$ 1,311,358$
53,767 40,722 3,016,232 1,054 - - 8,124 - - - - 58,856 - 379,635 837,699 - - 1,350 35,542 1,125
529,092 2,075,914 18,207,167 1,372,393
- - 68,379 -
495,863 229,138 1,718,715 - - 1,725,625 42,659,996 -
9,113,035 19,169 9,132,204 - - - 34,986,943 - - 33,344 11,168,605 261,204
1,028,488 - 1,194,472 - 10,637,386 2,007,276 100,860,935 261,204 (3,021,300) (425,036) (35,506,520) (208,820)
7,616,086 1,582,240 65,354,415 52,384
7,616,086 1,582,240 65,422,794 52,384
8,145,178 3,658,154 83,629,961 1,424,777
19,833 36,866 392,547 - 680 986 12,442
20,513 37,852 404,989 -
Business-type Activities - Enterprise Funds
Utility Liquor Totals
603 609
The notes to the financial statements are an integral part of this statement.54

City of Fairmont, MinnesotaStatement of Net Position (Continued)
Proprietary FundsFor the Year Ended December 31, 2018
Water Wastewater Electric Public Utilities
LiabilitiesCurrent Liabilities
Accounts and contracts payable 44,721$ 66,124$ 1,016,055$ 1,126,900$ Due to other funds 7,028 5,323 10,222 22,573 Due to other governments - - 53,087 53,087 Accrued interest payable 189,700 29,223 - 218,923 Accrued salaries payable 32,800 14,853 38,065 85,718 Sick leave/severance payable - current portion 19,489 15,509 76,887 111,885 Deposits payable 18,270 - 112,562 130,832 Unearned revenue - - - - Bonds payable - current portion 800,000 742,000 - 1,542,000
Total Current Liabilities 1,112,008 873,032 1,306,878 3,291,918
Noncurrent LiabilitiesSick leave/severance payable,
net of current portion 19,053 57,515 166,038 242,606 Postemployment benefits other than
pension obligation 65,613 45,732 68,646 179,991 Pension liability 682,736 326,438 930,195 1,939,369 Bonds payable, net of current portion 22,570,000 3,907,000 - 26,477,000
Total Noncurrent Liabilities 23,337,402 4,336,685 1,164,879 28,838,966
Total Liabilities 24,449,410 5,209,717 2,471,757 32,130,884
Deferred Inflows of ResourcesDeferred pension resources 180,013 86,070 245,259 511,342
Net Position Net investment in capital assets 12,110,277 10,020,658 5,630,304 27,761,239 Unrestricted 2,137,693 3,805,140 5,450,571 11,393,404
Total Net Position 14,247,970$ 13,825,798$ 11,080,875$ 39,154,643$
Business-type Activities - Enterprise Funds601 602 604 Total
Utility Utility Utility Commission
The notes to the financial statements are an integral part of this statement.55

GovernmentalActivities -
Storm Sewer Municipal Internal ServiceFunds
54,603$ 132,589$ 1,314,491$ 31,581$ - 2,195 24,768 1,158 - 39,831 92,918 -
6,042 - 224,965 - 30,960 16,827 133,505 11,210
- 5,209 117,094 - - - 130,832 - - 5,539 6,117 -
200,000 - 1,742,000 - 291,605 202,190 3,786,690 43,949
613 5,722 248,941 -
11,355 16,470 207,816 - 114,528 212,884 2,266,781 - 422,878 - 26,899,878 - 549,374 235,076 29,623,416 -
840,979 437,266 33,410,106 43,949
30,197 56,130 597,669 -
7,006,086 1,582,240 36,725,415 2,536 288,429 1,620,370 13,301,760 1,378,292
7,294,515$ 3,202,610$ 50,027,175 1,380,828$
Adjustment to reflect the consolidation of internal service fund activities related to enterprise funds 76,282
Net Position of Business-type Activities 50,103,457$
Liquor
Business-type Activities - Enterprise Funds
Totals
603 609
Utility
The notes to the financial statements are an integral part of this statement.56
lmunguia_ABDO16C
Sticky Note
Marked set by lmunguia_ABDO16C
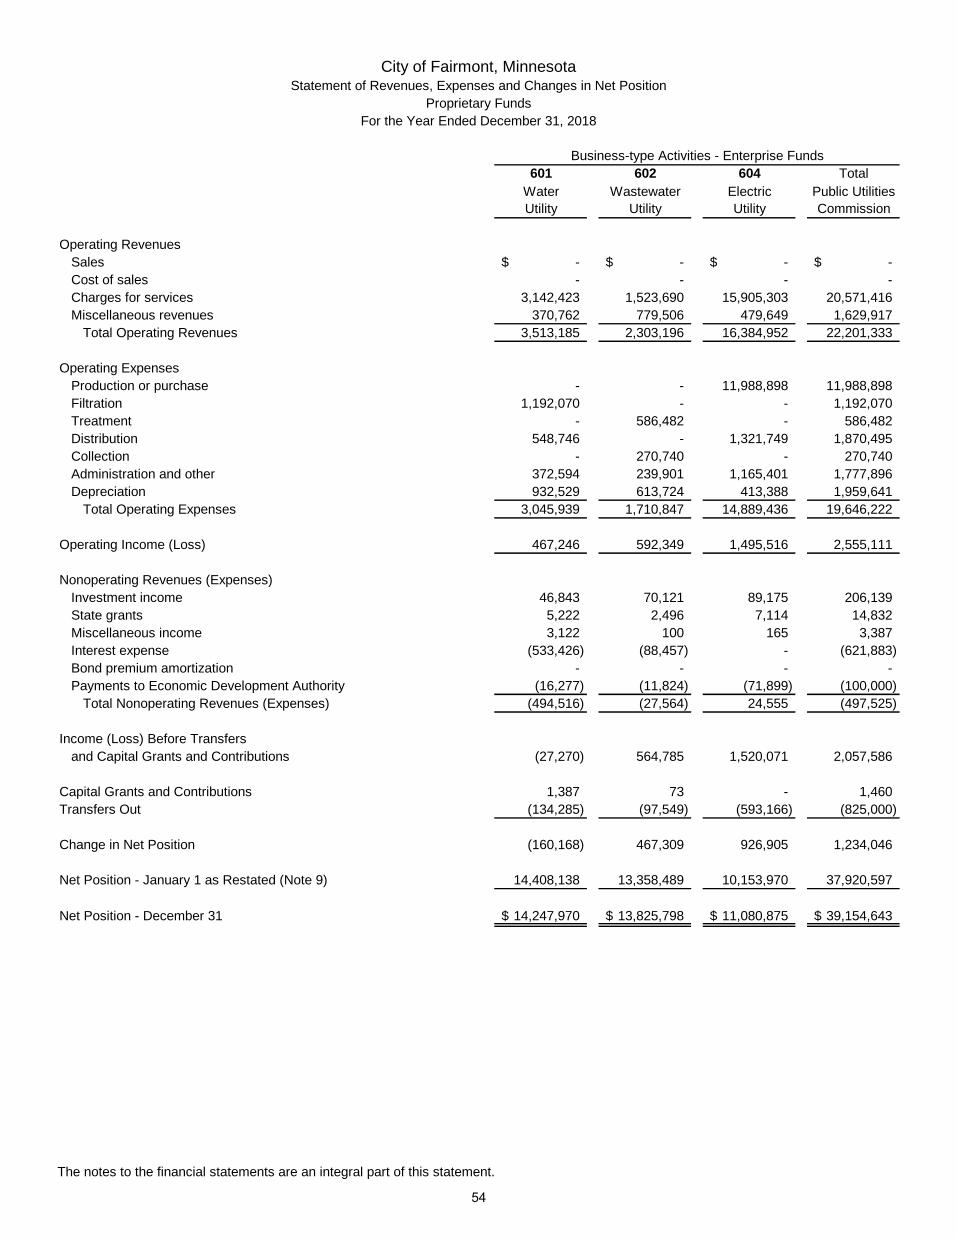
City of Fairmont, MinnesotaStatement of Revenues, Expenses and Changes in Net Position
Proprietary FundsFor the Year Ended December 31, 2018
Water Wastewater Electric Public Utilities
Operating RevenuesSales -$ -$ -$ -$ Cost of sales - - - - Charges for services 3,142,423 1,523,690 15,905,303 20,571,416 Miscellaneous revenues 370,762 779,506 479,649 1,629,917
Total Operating Revenues 3,513,185 2,303,196 16,384,952 22,201,333
Operating ExpensesProduction or purchase - - 11,988,898 11,988,898 Filtration 1,192,070 - - 1,192,070 Treatment - 586,482 - 586,482 Distribution 548,746 - 1,321,749 1,870,495 Collection - 270,740 - 270,740 Administration and other 372,594 239,901 1,165,401 1,777,896 Depreciation 932,529 613,724 413,388 1,959,641
Total Operating Expenses 3,045,939 1,710,847 14,889,436 19,646,222
Operating Income (Loss) 467,246 592,349 1,495,516 2,555,111
Nonoperating Revenues (Expenses)Investment income 46,843 70,121 89,175 206,139 State grants 5,222 2,496 7,114 14,832 Miscellaneous income 3,122 100 165 3,387 Interest expense (533,426) (88,457) - (621,883) Bond premium amortization - - - - Payments to Economic Development Authority (16,277) (11,824) (71,899) (100,000)
Total Nonoperating Revenues (Expenses) (494,516) (27,564) 24,555 (497,525)
Income (Loss) Before Transfers and Capital Grants and Contributions (27,270) 564,785 1,520,071 2,057,586
Capital Grants and Contributions 1,387 73 - 1,460 Transfers Out (134,285) (97,549) (593,166) (825,000)
Change in Net Position (160,168) 467,309 926,905 1,234,046
Net Position - January 1 as Restated (Note 9) 14,408,138 13,358,489 10,153,970 37,920,597
Net Position - December 31 14,247,970$ 13,825,798$ 11,080,875$ 39,154,643$
Business-type Activities - Enterprise Funds601 602 604 Total
Utility Utility CommissionUtility
The notes to the financial statements are an integral part of this statement.
54
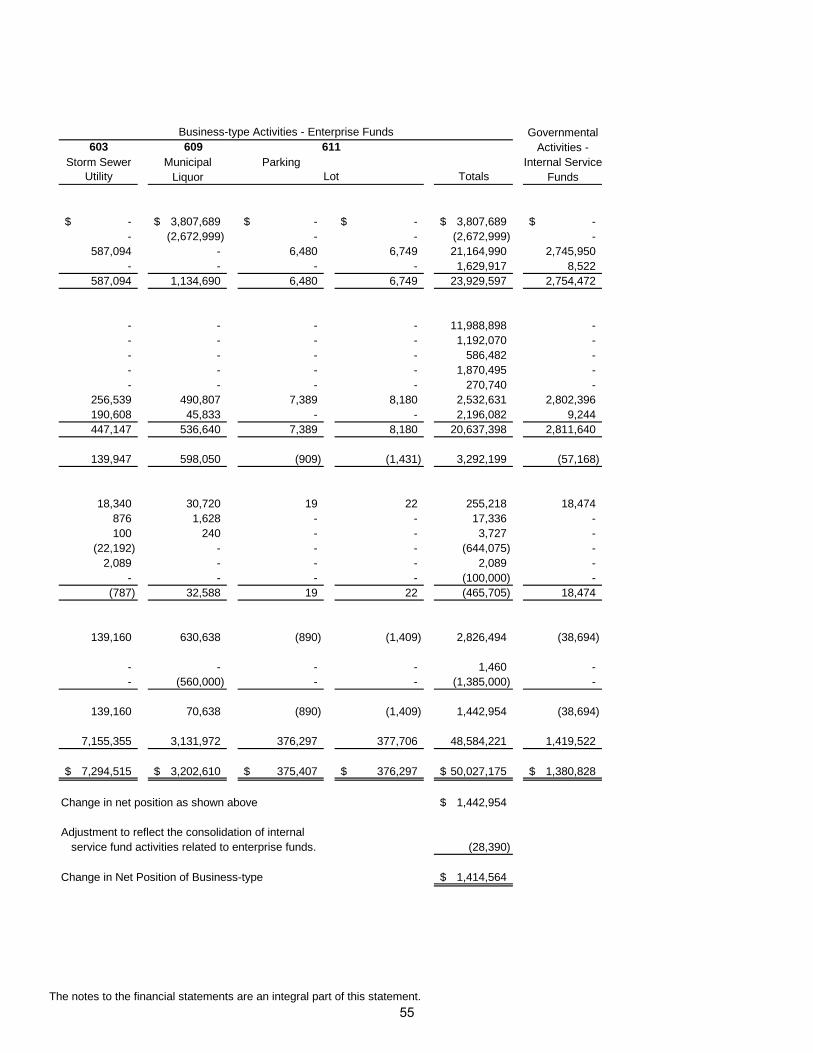
GovernmentalActivities -
Storm Sewer Municipal Parking Internal ServiceLiquor Funds
-$ 3,807,689$ -$ -$ 3,807,689$ -$ - (2,672,999) - - (2,672,999) -
587,094 - 6,480 6,749 21,164,990 2,745,950 - - - - 1,629,917 8,522
587,094 1,134,690 6,480 6,749 23,929,597 2,754,472
- - - - 11,988,898 - - - - - 1,192,070 - - - - - 586,482 - - - - - 1,870,495 - - - - - 270,740 -
256,539 490,807 7,389 8,180 2,532,631 2,802,396 190,608 45,833 - - 2,196,082 9,244 447,147 536,640 7,389 8,180 20,637,398 2,811,640
139,947 598,050 (909) (1,431) 3,292,199 (57,168)
18,340 30,720 19 22 255,218 18,474 876 1,628 - - 17,336 - 100 240 - - 3,727 -
(22,192) - - - (644,075) - 2,089 - - - 2,089 -
- - - - (100,000) - (787) 32,588 19 22 (465,705) 18,474
139,160 630,638 (890) (1,409) 2,826,494 (38,694)
- - - - 1,460 - - (560,000) - - (1,385,000) -
139,160 70,638 (890) (1,409) 1,442,954 (38,694)
7,155,355 3,131,972 376,297 377,706 48,584,221 1,419,522
7,294,515$ 3,202,610$ 375,407$ 376,297$ 50,027,175$ 1,380,828$
Change in net position as shown above 1,442,954$
Adjustment to reflect the consolidation of internal service fund activities related to enterprise funds. (28,390)
Change in Net Position of Business-type 1,414,564$
Lot TotalsUtility
609603 611Business-type Activities - Enterprise Funds
The notes to the financial statements are an integral part of this statement.55
lmunguia_ABDO16C
Sticky Note
Marked set by lmunguia_ABDO16C

City of Fairmont, MinnesotaStatement of Cash Flows (Continued on the Following Pages)
Proprietary FundsFor the Year Ended December 31, 2018
Water Wastewater Electric Public Utilities
Cash Flows from Operating ActivitiesReceipts from customers and users 3,543,385$ 2,324,560$ 16,211,926$ 22,079,871$ Payments to suppliers (903,098) (431,176) (12,802,055) (14,136,329) Payments to and on behalf of employees (984,377) (517,736) (1,364,308) (2,866,421) Payments for interfund services used (257,630) (174,766) (356,500) (788,896) Other receipts - - - -
Net Cash Provided (Used) by Operating Activities 1,398,280 1,200,882 1,689,063 4,288,225
Cash Flows from Noncapital and Related Financing ActivitiesTransfers to other funds (134,285) (97,549) (593,166) (825,000) Payments to Economic Development Authority (16,277) (11,824) (71,899) (100,000) State aids received 5,222 2,496 7,114 14,832 Increase in due from other funds - - - - Increase (decrease) in due to other funds 709 802 835 2,346
Net Cash Provided (Used) by Noncapital and Related Financing Activities (144,631) (106,075) (657,116) (907,822)
Cash Flows from Capital and RelatedFinancing ActivitiesAcquisition of capital assets (133,197) (242,319) (313,826) (689,342) Capital grants received 831 513 - 1,344 Principal paid on revenue bond obligations (782,000) (729,000) - (1,511,000) Interest paid on revenue bond obligations (539,774) (93,040) - (632,814)
Net Cash Provided (Used) by Capital and Related Financing Activities (1,454,140) (1,063,846) (313,826) (2,831,812)
Cash Flows from Investing ActivitiesInterest received 46,843 70,121 89,175 206,139
Net Increase (Decrease) in Cash and Cash Equivalents (153,648) 101,082 807,296 754,730
Cash and Cash Equivalents, January 1 2,827,534 3,982,986 4,614,254 11,424,774
Cash and Cash Equivalents, December 31 2,673,886$ 4,084,068$ 5,421,550$ 12,179,504$
601 602 604 Total
Utility Utility Utility Commission
Business-type Activities - Enterprise Funds
The notes to the financial statements are an integral part of this statement.
56

GovernmentalActivities -
Storm Sewer Municipal Parking Internal ServiceFunds
588,200$ 3,812,527$ 6,543$ 26,487,141$ 2,773,302$ (42,634) (2,841,928) (7,364) (17,028,255) (567,790)
(160,687) (305,352) - (3,332,460) (2,179,304) (45,081) (81,791) (18) (915,786) (37,556)
100 240 - 340 8,522
339,898 583,696 (839) 5,210,980 (2,826)
- (560,000) - (1,385,000) - - - - (100,000) -
876 1,628 - 17,336 - - - - - (3,963) - (126) - 2,220 38
876 (558,498) - (1,465,444) (3,925)
(818,582) - - (1,507,924) (49,848) - - - 1,344 -
(190,000) - - (1,701,000) - (24,225) - - (657,039) -
(1,032,807) - - (3,864,619) (49,848)
18,340 30,720 19 255,218 18,474
(673,693) 55,918 (820) 136,135 (38,125)
1,149,018 1,598,289 1,354 14,173,435 1,349,483
475,325$ 1,654,207$ 534$ 14,309,570$ 1,311,358$
Utility LotLiquor
603 609Business-type Activities - Enterprise Funds
Totals
611
The notes to the financial statements are an integral part of this statement.
57

City of Fairmont, MinnesotaStatement of Cash Flows (Continued)
Proprietary Funds For the Year Ended December 31, 2018
Water Wastewater Electric Public Utilities
Reconciliation of Operating Income (Loss) to Net Cash Provided (Used) by Operating ActivitiesOperating income (loss) 467,246$ 592,349$ 1,495,516$ 2,555,111$ Adjustments to reconcile operating income (loss) to net
cash provided (used) by operating activitiesOther income related to operations 3,122 100 165 3,387 Depreciation 932,529 613,724 413,388 1,959,641 (Increase) decrease in assets
Net accounts receivable 24,078 21,264 (186,888) (141,546) Inventories 12,497 - (58,264) (45,767) Prepaid items - - - - Unamortized maintenance charges 34,192 - - 34,192
(Increase) decrease in deferred outflows of resourcesDeferred pension resources 66,439 44,963 101,664 213,066 Deferred other postemployment benefit resources (3,928) (2,738) (4,110) (10,776)
Increase (decrease) in liabilitiesAccounts and contracts payable (27,536) 24,558 41,924 38,946 Due to other governments - - 506 506 Accrued wages and sick leave/severance payable (43,900) 8,051 39,810 3,961 Postemployment benefits other than pension obligation 9,365 3,586 (4,131) 8,820 Pension liability (67,995) (86,159) (137,943) (292,097) Deposits payable 3,000 - 13,697 16,697 Unearned revenue - - - -
Increase (decrease) in deferred inflows of resourcesDeferred pension resources (10,829) (18,816) (26,271) (55,916)
Net Cash Provided (Used) by Operating Activities 1,398,280$ 1,200,882$ 1,689,063$ 4,288,225$
Noncash Investing, Capital and Financing ActivitiesCapital assets acquired on account -$ -$ -$ -$ Special assessments levied 1,387$ 73$ -$ 1,460$ Amortization of bond (premium) discount -$ -$ -$ -$
Business-type Activities - Enterprise Funds
Utility Utility Utility Commission
601 602 604 Total
The notes to the financial statements are an integral part of this statement.
58
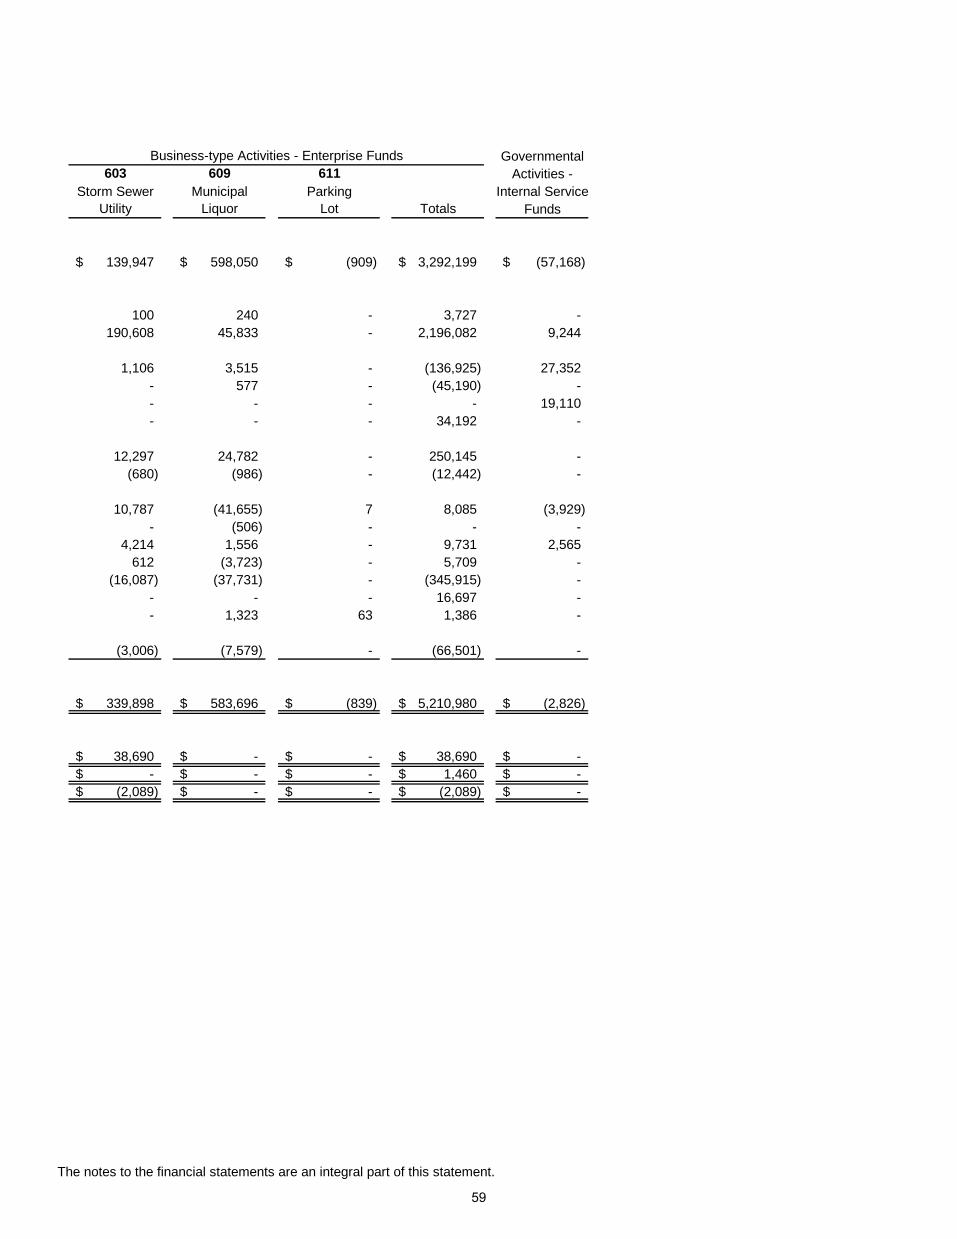
GovernmentalActivities -
Storm Sewer Municipal Parking Internal ServiceFunds
139,947$ 598,050$ (909)$ 3,292,199$ (57,168)$
100 240 - 3,727 - 190,608 45,833 - 2,196,082 9,244
1,106 3,515 - (136,925) 27,352 - 577 - (45,190) - - - - - 19,110 - - - 34,192 -
12,297 24,782 - 250,145 - (680) (986) - (12,442) -
10,787 (41,655) 7 8,085 (3,929) - (506) - - -
4,214 1,556 - 9,731 2,565 612 (3,723) - 5,709 -
(16,087) (37,731) - (345,915) - - - - 16,697 - - 1,323 63 1,386 -
(3,006) (7,579) - (66,501) -
339,898$ 583,696$ (839)$ 5,210,980$ (2,826)$
38,690$ -$ -$ 38,690$ -$ -$ -$ -$ 1,460$ -$
(2,089)$ -$ -$ (2,089)$ -$
Business-type Activities - Enterprise Funds611
Lot Totals
609
LiquorUtility
603
The notes to the financial statements are an integral part of this statement.
59

City of Fairmont, MinnesotaStatement of Fiduciary Net Position
Fiduciary FundsDecember 31, 2018
AgencyAssets
Cash and temporary investments 548,638$ Receivables
Due from other governments 1,109
Total Assets 549,747$
LiabilitiesAccounts payable 531,831$ Deposits payable 17,916
Total Liabilities 549,747$
The notes to the financial statements are an integral part of this statement.60

City of Fairmont, Minnesota Notes to the Financial Statements
December 31, 2018 Note 1: Summary of Significant Accounting Policies A. Reporting Entity The City of Fairmont (the City) operates under its own Home Rule Charter. The City is governed by an elected Mayor and a five-member Council. The Council exercises legislative authority and determines all matters of policy. The Council appoints personnel responsible for the proper administration of all affairs relating to the City. The City has considered all potential units for which it is financially accountable, and other organizations for which the nature and significance of their relationship with the City are such that exclusion would cause the City’s financial statements to be misleading or incomplete. The Governmental Accounting Standards Board (GASB) has set forth criteria to be considered in determining financial accountability. These criteria include appointing a voting majority of an organization’s governing body, and (1) the ability of the primary government to impose its will on that organization or (2) the potential for the organization to provide specific benefits to, or impose specific financial burdens on the primary government. Each discretely presented component unit is reported in a separate column in the government-wide (see note below for description) financial statements to emphasize it is legally separate from the City. The discretely presented component unit has a December 31 year end. Discretely presented component unit. The Fairmont Economic Development Authority (EDA) was created pursuant to Minnesota statutes 469.090 through 469.108 to carry out economic and industrial development and redevelopment within the City in accordance with policies established by the Council. The seven-member board consists of two Council members and five other Council approved members. The City can impose its will on the EDA by significantly influencing the program, projects, activities, and other levels of service performed by the EDA. In accordance with GASB Statement No. 61, this entity is properly presented as a discretely presented component unit as a governmental fund type. Separate financial statements are not issued for this component unit. Condensed statement information for the EDA is presented starting on page 184 of these financial statements. Other agencies. The Fairmont Public Utilities Commission (the Commission) was established and statutory authority is provided in accordance with chapter 412.321 of the Minnesota statutes. The Commission has five Council approved members who serve overlapping three-year terms. The Minnesota statutes provide the Council all the discretionary authority necessary to operate the utilities except as its powers has been delegated to the Commission. The Public Utilities Commission fund considered to be part of the primary government and is included with the enterprise funds of this report.
B. Government-wide and Fund Financial Statements The government-wide financial statements (i.e., the statement of net position and the statement of activities) report information on all of the nonfiduciary activities of the primary government and its component units. Governmental activities, which normally are supported by taxes and intergovernmental revenues, are reported separately from business-type activities, which rely to a significant extent on fees and charges for support. Likewise, the primary government is reported separately from certain legally separate component units for which the primary government is financially accountable. The statement of activities demonstrates the degree to which the direct expenses of a given function or segment is offset by program revenues. Direct expenses are those that are clearly identifiable with a specific function or segment. Amounts reported as program revenues include 1) charges to customers or applicants who purchase, use, or directly benefit from goods, services, or privileges provided by a given function or segment and 2) grants and contributions that are restricted to meeting the operational or capital requirements of a particular function or segment. Taxes and other items not properly included among program revenues are reported instead as general revenues.
Separate financial statements are provided for governmental funds, proprietary funds, and fiduciary funds, even though the latter are excluded from the government-wide financial statements. Major individual governmental funds and major individual enterprise funds are reported as separate columns in the fund financial statements.
61

City of Fairmont, Minnesota Notes to the Financial Statements
December 31, 2018 Note 1: Summary of Significant Accounting Policies (Continued) C. Measurement Focus, Basis of Accounting and Financial Statement Presentation
The government-wide financial statements are reported using the economic resources measurement focus and the accrual basis of accounting, as are the proprietary fund financial statements. Revenues are recorded when earned and expenses are recorded when a liability is incurred, regardless of the timing of related cash flows. Property taxes are recognized as revenues in the year for which they are levied. Grants and similar items are recognized as revenue as soon as all eligibility requirements imposed by the provider have been met.
Governmental fund financial statements are reported using the current financial resources measurement focus and the modified accrual basis of accounting. Revenues are recognized as soon as they are both measurable and available. Revenues are considered to be available when they are collectible within the current period or soon enough thereafter to pay liabilities of the current period. For this purpose, the City considers revenues to be available if they are collected within 60 days of the end of the current fiscal period. Expenditures generally are recorded when a liability is incurred, as under accrual accounting. However, debt service expenditures, as well as expenditures related to compensated absences and claims and judgments, are recorded only when payment is due.
Property taxes, franchise taxes, licenses, and interest associated with the current fiscal period are all considered to be susceptible to accrual and have been recognized as revenues of the current fiscal period. Only the portion of special assessments receivable due within the current fiscal period is considered to be susceptible to accrual as revenue of the current period. All other revenue items are considered to be measurable and available only when cash is received by the City.
Revenue resulting from exchange transactions, in which each party gives and receives essentially equal value, is recorded on the accrual basis when the exchange takes place. On a modified accrual basis, revenue is recorded in the year in which the resources are measurable and become available.
Non-exchange transactions, in which the City receives value without directly giving equal value in return, include property taxes, grants, entitlement and donations. On an accrual basis, revenue from property taxes is recognized in the year for which the tax is levied. Revenue from grants, entitlements and donations is recognized in the year in which all eligibility requirements have been satisfied. Eligibility requirements include timing requirements, which specify the year when the resources are required to be used or the year when use is first permitted, matching requirements, in which the City must provide local resources to be used for a specified purpose, and expenditure requirements, in which the resources are provided to the City on a reimbursement basis. On a modified accrual basis, revenue from non-exchange transactions must also be available before it can be recognized.
Unearned revenue arises when assets are recognized before revenue recognition criteria have been satisfied. Grants and entitlements received before eligibility requirements are met are also recorded as unearned revenue.
The preparation of financial statements in conformity with accounting principles generally accepted in the United States of America requires management to make estimates and assumptions that affect certain reported amounts and disclosures. Accordingly, actual results could differ from those estimates. The City reports the following major governmental funds:
The General fund is the City’s primary operating fund. It accounts for all financial resources of the general government, except those required to be accounted for in another fund.
The Debt Service fund accounts for the resources accumulated and payments made for principal and interest on long-term general obligation debt of governmental funds.
62

City of Fairmont, Minnesota Notes to the Financial Statements
December 31, 2018 Note 1: Summary of Significant Accounting Policies (Continued)
The City reports the following major proprietary funds:
The Water Utility fund - Water is obtained from surface water taken from Budd Lake, treated and distributed.
The Wastewater Utility fund - Sewage is collected by lift stations and treated, and then effluent is discharged into Center Creek.
The Electric Utility fund - Electricity is purchased from Southern MN Municipal Power Agency and Western Area Power Authority; the power is then distributed.
The Storm Sewer Utility fund is used to account for the operating maintenance and capital improvements of the City’s Storm Sewer Utility.
The Municipal Liquor fund is used to account for the operation of the municipal off-sale liquor store.
The Parking Lot fund is used to account for costs associated with minor maintenance and parking control of the City’s off-street parking lots in the downtown area.
Additionally, the government reports the following fund types:
Internal Service funds account for data processing, fleet management and insurance services provided to other departments or agencies of the City, or to other governments, on a cost reimbursement basis.
Fiduciary funds account for assets held by the government in a trustee capacity or as an agent on behalf of others.
The Agency fund is custodial in nature and does not present results of operations or have a measurement focus. Agency funds are accounted for using the accrual basis of accounting. This fund is used to account for assets that the government holds for others in an agency capacity. Agency activities include the following: Convention and Visitors’ Bureau (C.V.B.), Flex Plan, Multi-family Housing, HRA Potter’s Addition, Focus on Fairmont, Project 1590, Inclusive Playground, Mall Playground, iPaddlePort and Fairmont Visitor Profile.
Enterprise funds are used to account for those operations that are financed and operated in a manner similar to private business or where the Council has decided that the determination of revenues earned, costs incurred and/or net income is necessary for management accountability.
As a general rule the effect of interfund activity has been eliminated from government-wide financial statements. Exceptions to this general rule are charges between the City’s Public Utilities Commission and storm sewer utility functions and various other functions of the City. Elimination of these charges would distort the direct costs and program revenues reported for the various functions concerned. Proprietary funds distinguish operating revenues and expenses from nonoperating items. Operating revenues and expenses generally result from providing services and producing and delivering goods in connection with a proprietary fund’s principal ongoing operations. The principal operating revenues of the City’s enterprise and internal service funds are charges to customers for sales and services. The City also recognizes as operating revenue the portion of tap fees intended to recover the cost of connecting new customers to the system. Operating expenses for enterprise and internal service funds include the cost of sales and services, administrative expenses, and depreciation on capital assets. All revenues and expenses not meeting this definition are reported as nonoperating revenues and expenses. When both restricted and unrestricted resources are available for use, it is the City’s policy to use restricted resources first, then unrestricted resources as they are needed.
63

City of Fairmont, Minnesota Notes to the Financial Statements
December 31, 2018 Note 1: Summary of Significant Accounting Policies (Continued) D. Assets, Deferred Outflows of Resources, Liabilities, Deferred Inflows of Resources and Net Position/Fund Balance Deposits and Investments The City’s cash and cash equivalents are considered to be cash on hand, demand deposits and short-term investments with original maturities of three months or less from the date of acquisition. The proprietary funds’ portion in the government-wide cash and temporary investments pool is considered to be cash and cash equivalents for purposes of the statements of cash flows. Cash balances from all funds are pooled and invested, to the extent available, in certificates of deposit and other authorized investments. Earnings from such investments are allocated on the basis of applicable participation by each of the funds. The City may invest idle funds as authorized by Minnesota statutes, as follows: 1. Direct obligations or obligations guaranteed by the United States or its agencies. 2. Shares of investment companies registered under the Federal Investment Company Act of 1940 and received the
highest credit rating, rated in one of the two highest rating categories by a statistical rating agency, and have a final maturity of thirteen months or less.
3. General obligations of a state or local government with taxing powers rated “A” or better; revenue obligations rated
“AA” or better. 4. General obligations of the Minnesota Housing Finance Agency rated “A” or better.
5. Obligation of a school district with an original maturity not exceeding 13 months and (i) rated in the highest category
by a national bond rating service or (ii) enrolled in the credit enhancement program pursuant to statute section 126C.55.
6. Bankers’ acceptances of United States banks eligible for purchase by the Federal Reserve System.
7. Commercial paper issued by United States banks corporations or their Canadian subsidiaries, of highest quality category by at least two nationally recognized rating agencies, and maturing in 270 days or less.
8. Repurchase or reverse repurchase agreements and securities lending agreements with financial institutions qualified as a “depository” by the government entity, with banks that are members of the Federal Reserve System with capitalization exceeding $10,000,000, a primary reporting dealer in U.S. government securities to the Federal Reserve Bank of New York, or certain Minnesota securities broker-dealers.
9. Guaranteed investment contracts (GIC's) issued or guaranteed by a United States commercial bank, a domestic branch of a foreign bank, a United States insurance company, or its Canadian subsidiary, whose similar debt obligations were rated in one of the top two rating categories by a nationally recognized rating agency.
Broker money market funds operate in accordance with appropriate state laws and regulations. The reported value of the pool is the same as the fair value of the shares.
64

City of Fairmont, Minnesota Notes to the Financial Statements
December 31, 2018 Note 1: Summary of Significant Accounting Policies (Continued) The City categorizes its fair value measurements within the fair value hierarchy established by generally accepted accounting principles. The hierarchy is based on the valuation inputs used to measure the fair value of the asset. Level 1 inputs are quoted prices in active markets for identical assets; Level 2 inputs are significant other observable inputs; Level 3 inputs are significant unobservable inputs. The City has the following recurring fair value measurements as of December 31, 2018:
• Governmental agency securities of $8,605,809 are valued using quoted market prices (Level 1 inputs) • Negotiable certificates of deposits of $15,384,847 are values using a matrix pricing model (Level 2 inputs)
The Minnesota Municipal Money Market Fund is regulated by Minnesota statutes and the Board of Directors of the League of Minnesota Cities and is an external investment pool not registered with the Securities Exchange Commission (SEC) that follows the regulatory rules of the SEC. In accordance with GASB Statement No. 79, the City’s investment in this pool is valued at amortized cost, which approximates fair value. There are no restrictions or limitations on withdrwawals from the 4M Liquid Asset Fund. Investments in the 4M Plus must be deposited for a minimum of 14 calendar days. Withdrawals prior to the 14-day restriction period will be subject to a penalty equal to seven days interest on the amount withdrawn. Seven days' notice of redemption is required for withdrawals of investments in the 4M Term Series withdrawn prior to the maturity date of that series. A penalty could be assessed as necessary to recoup the Series for any charges, losses, and other costs attributable to the early redemption. Financial statements of the 4M Fund can be obtained by contracting RBC Global Management at 100 South Fifth Street, Suite 2300, Minneapolis, MN 55402-1240. Investment Policy The City’s investment policy follows Minnesota statutes, which reduces the City’s exposure to credit, custodial credit and interest rate risks. Specific risk information for the City is as follows:
• Custodial Credit Risk - For investments, custodial credit risk is the risk that in the event of a failure of the counterparty, the government would not be able to recover the value of its investment or collateral securities that are in the possession of an outside party. As of December 31, 2018 all investments were insured or registered, or securities were held by the City or its agent in the City’s name.
• Credit Risk - Credit risk is the risk that an issuer or other counterparty to an investment will not fulfill its obligations. State law limits investments in commercial paper that is rated in the highest quality category by at least two nationally recognized rating agencies. The City’s investment policy does not further limit the ratings of their investments.
• Concentration of Credit Risk - At year end, the City’s investments were made with two brokers. The City’s investment policy does not address concentration with a particular broker. Investment instruments are varied to prevent concentration in any one investment type.
• Interest Rate Risk - In accordance with its investment policy, the City diversifies its investment portfolio to eliminate the risk of loss resulting from the over-concentration of assets in a specific maturity. The maturities selected shall provide for stability of income and reasonable liquidity.
Investments for the City, as well as for its component unit, are reported at fair value. Broker money market funds operate in accordance with appropriate state laws and regulations. The reported value of the pool in these funds is the same as the fair value of the pool shares. It is the goal of the City to maximize interest earnings through the use of an ongoing, effective investment program. Therefore, it is the objective of the City to increase the volume of money in attractive high-yielding investments for the maximum period of time. More than any other consideration, the safeguarding of public funds will be primary. Speculation is never justified. All investments will be properly protected with the required collateral and/or federal insurance. The City will invest only in those investment instruments authorized by statute. Minnesota statutes, chapters 118A.04, 118A.05 and 118A.06 set forth the authorized investments for a municipality.
65

City of Fairmont, Minnesota Notes to the Financial Statements
December 31, 2018 Note 1: Summary of Significant Accounting Policies (Continued) Investments will be scheduled through the use of revenue and expenditure charting. The maturity dates of investments shall not exceed five (5) years from the purchase date without prior approval of the Council. In cases where it is prudent to match an obligation with a maturity in excess of five (5) years, the Finance Director will receive approval from the Council prior to the purchase of such an investment. It is a policy of the City to schedule investment maturities to coincide with paying dates. Interfund Receivables and Payables Activity between funds that are representative of lending/borrowing arrangements outstanding at the end of the fiscal year are referred to as either “due to/from other funds” (i.e., the current portion of interfund loans) or “advances to/from other funds” (i.e., the non-current portion of interfund loans). All other outstanding balances between funds are reported as “due to/from other funds.” Any residual balances outstanding between the governmental activities and business-type activities are reported in the government-wide financial statements as “internal balances.” Advances between funds, as reported in the fund financial statements, are offset by a fund balance nonspendable account in applicable governmental funds to indicate that they are not available for appropriation and are not expendable available financial resources. Accounts Receivable
Accounts receivable include amounts billed for services provided before year end. Unbilled enterprise fund receivables are also included for services provided in 2018. All trade receivables are shown net of an allowance for uncollectible accounts. The allowance for uncollectible accounts in the Public Utilities Commission enterprise funds at December 31, 2018 was $0. Property Taxes The Council annually adopts a tax levy in December and certifies it to the County for collection in the following year. The County is responsible for collecting all property taxes for the City. These taxes attach an enforceable lien on taxable property within the City on January 1 and are payable by the property owners in two installments in May and October. The taxes are collected by the County Treasurer and tax settlements are made to the City during January, June and November each year.
Delinquent taxes receivable include the past six years' uncollected taxes. Delinquent taxes have been offset by a deferred inflow of resources for delinquent taxes not received within 60 days after year end in the governmental fund financial statements. Special Assessments Special assessments represent the financing for public improvements paid for by benefiting property owners. These assessments are recorded as receivables upon certification to the County. Special assessments are recognized as revenue when they are received in cash or within 60 days after year end. All governmental special assessments receivable are offset by a deferred inflow of resources in the fund financial statements. Inventories and Prepaid Items/Unamortized Maintenance Charges All inventories are stated at the lower of cost or market on the first-in, first-out (FIFO) method, except for diesel fuel and coal inventories used in production of steam and electricity, which are on a last-in, first-out (LIFO) method.
Inventories of governmental funds are recorded as expenditures when consumed rather than when purchased.
Certain payments to vendors reflect costs applicable to future accounting periods and are recorded as prepaid items or unamortized maintenance charges in both government-wide and fund financial statements.
66
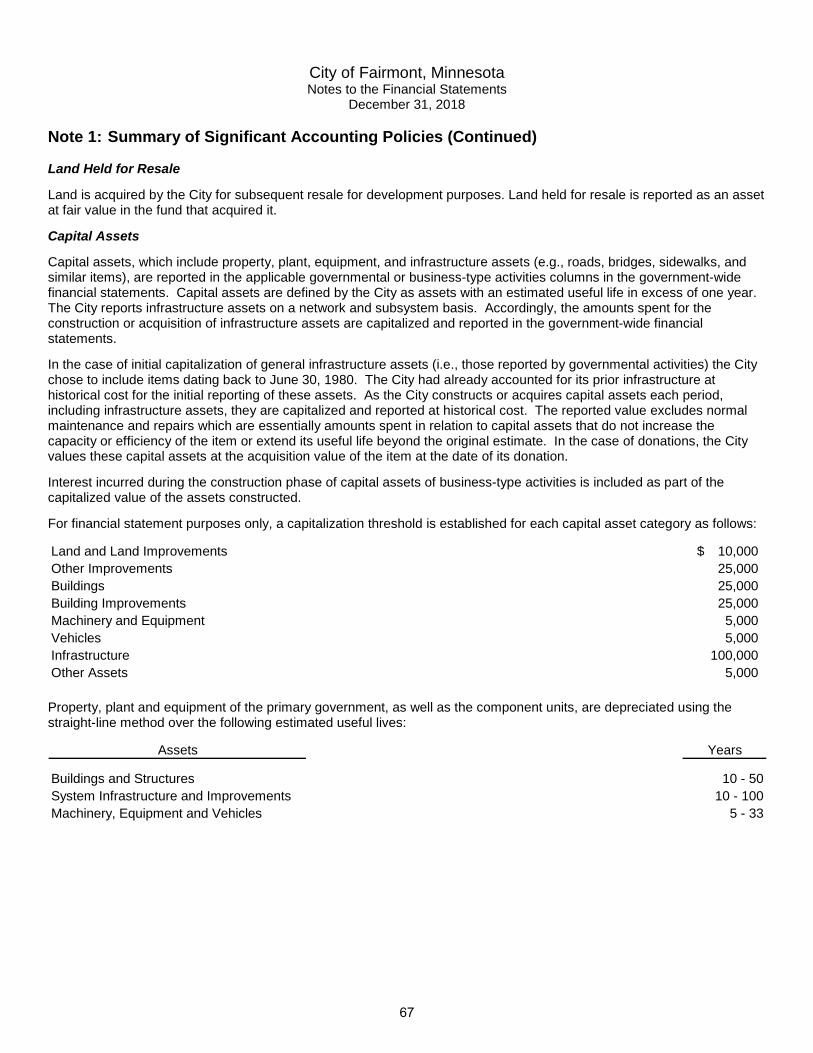
City of Fairmont, Minnesota Notes to the Financial Statements
December 31, 2018 Note 1: Summary of Significant Accounting Policies (Continued) Land Held for Resale Land is acquired by the City for subsequent resale for development purposes. Land held for resale is reported as an asset at fair value in the fund that acquired it. Capital Assets
Capital assets, which include property, plant, equipment, and infrastructure assets (e.g., roads, bridges, sidewalks, and similar items), are reported in the applicable governmental or business-type activities columns in the government-wide financial statements. Capital assets are defined by the City as assets with an estimated useful life in excess of one year. The City reports infrastructure assets on a network and subsystem basis. Accordingly, the amounts spent for the construction or acquisition of infrastructure assets are capitalized and reported in the government-wide financial statements. In the case of initial capitalization of general infrastructure assets (i.e., those reported by governmental activities) the City chose to include items dating back to June 30, 1980. The City had already accounted for its prior infrastructure at historical cost for the initial reporting of these assets. As the City constructs or acquires capital assets each period, including infrastructure assets, they are capitalized and reported at historical cost. The reported value excludes normal maintenance and repairs which are essentially amounts spent in relation to capital assets that do not increase the capacity or efficiency of the item or extend its useful life beyond the original estimate. In the case of donations, the City values these capital assets at the acquisition value of the item at the date of its donation. Interest incurred during the construction phase of capital assets of business-type activities is included as part of the capitalized value of the assets constructed. For financial statement purposes only, a capitalization threshold is established for each capital asset category as follows:
Land and Land Improvements 10,000$ Other Improvements 25,000 Buildings 25,000 Building Improvements 25,000 Machinery and Equipment 5,000 Vehicles 5,000 Infrastructure 100,000 Other Assets 5,000
Property, plant and equipment of the primary government, as well as the component units, are depreciated using the straight-line method over the following estimated useful lives:
Assets Years
Buildings and Structures 10 - 50System Infrastructure and Improvements 10 - 100Machinery, Equipment and Vehicles 5 - 33
67
City of Fairmont, Minnesota Notes to the Financial Statements
December 31, 2018
Note 1: Summary of Significant Accounting Policies (Continued)
Deferred Outflows of Resources In addition to assets, the statements of net position will sometimes report a separate section for deferred outflows of resources. This separate financial statement element, deferred outflows of resources, represents a consumption of net position that applies to a future period(s) and so will not be recognized as an outflow of resources (expense/expenditure) until then. The City has two items which qualify for reporting in this category. Accordingly, the items, deferred pension resources and deferred other postemployment benefit resources, are reported only in the statement of net position. These items result from actuarial calculations and current year pension contributions and OPEB contributions made subsequent to the measurement dates. Compensated Absences It is the City's policy to permit employees to accumulate earned but unused vacation and sick pay benefits. No liability is recorded for unpaid accumulated sick leave. However, a liability is recognized for that portion of accumulated sick leave that is estimated will be taken as “terminal leave” prior to retirement. All vacation and sick pay is accrued when incurred in the government-wide proprietary fund financial statements. A liability for these amounts is reported in governmental funds only if they have matured, for example, as a result of employee resignations and retirements. For the most part, the General fund is typically used to liquidate governmental compensated absences payable. Postemployment Benefits Other Than Pensions Under Minnesota statue 471.61, subdivision 2b., public employers must allow retirees and their dependents to continue coverage indefinitely in an employer-sponsored health care plan, under the following conditions: 1) Retirees must be receiving (or eligible to receive) an annuity from a Minnesota public pension plan, 2) Coverage must continue in a group plan until age 65, and retirees must pay no more than the group premium, and 3) Retirees may obtain dependent coverage immediately before retirement. All premiums are funded on a pay-as-you-go basis. The liability was actuarially determined, in accordance with GASB 75, at January 1, 2018. The General fund is typically used to liquidate governmental other postemployment benefits payable. Long-term Obligations
In the government-wide financial statements, and proprietary fund types in the fund financial statements, long-term debt and other long-term obligations are reported as liabilities in the applicable governmental activities, business-type activities, or proprietary fund type statement of net position. Bond premiums and discounts are deferred and amortized over the life of the bonds using the straight-line method. Bonds payable are reported net of the applicable bond premium or discount. Bond issuance costs are reported as an expense in the period incurred.
In the fund financial statements, governmental fund types recognized bond premiums and discounts, as well as bond issuance costs, during the current period. The face amount of debt issued is reported as other financing sources. Premiums received on debt issuances are reported as other financing sources while discounts on debt issuances are reported as other financing uses. Issuance costs, whether or not withheld from the actual debt proceeds received, are reported as debt service expenditures.
Pensions For purposes of measuring the net pension liability, deferred outflows/inflows of resources, and pension expense, information about the fiduciary net position of the Public Employees Retirement Association (PERA) and additions to/deductions from PERA’s fiduciary net position have been determined on the same basis as they are reported by PERA except that PERA’s fiscal year end is June 30. For this purpose, plan contributions are recognized as of employer payroll paid dates and benefit payments and refunds are recognized when due and payable in accordance with the benefit terms. Investments are reported at fair value. For purposes of measuring the net pension liability (asset), deferred outflows of resources and deferred inflows of resources related to pensions, and pension expense, information about the fiduciary net position of the defined benefit plan administered by Fairmont Fire Department Relief Association and additions to and deductions from the plan’s fiduciary net position have been determined on the same basis as they are reported by the plan. Investments are reported at fair value. The General fund is typically used to liquidate the governmental net pension liability.
68
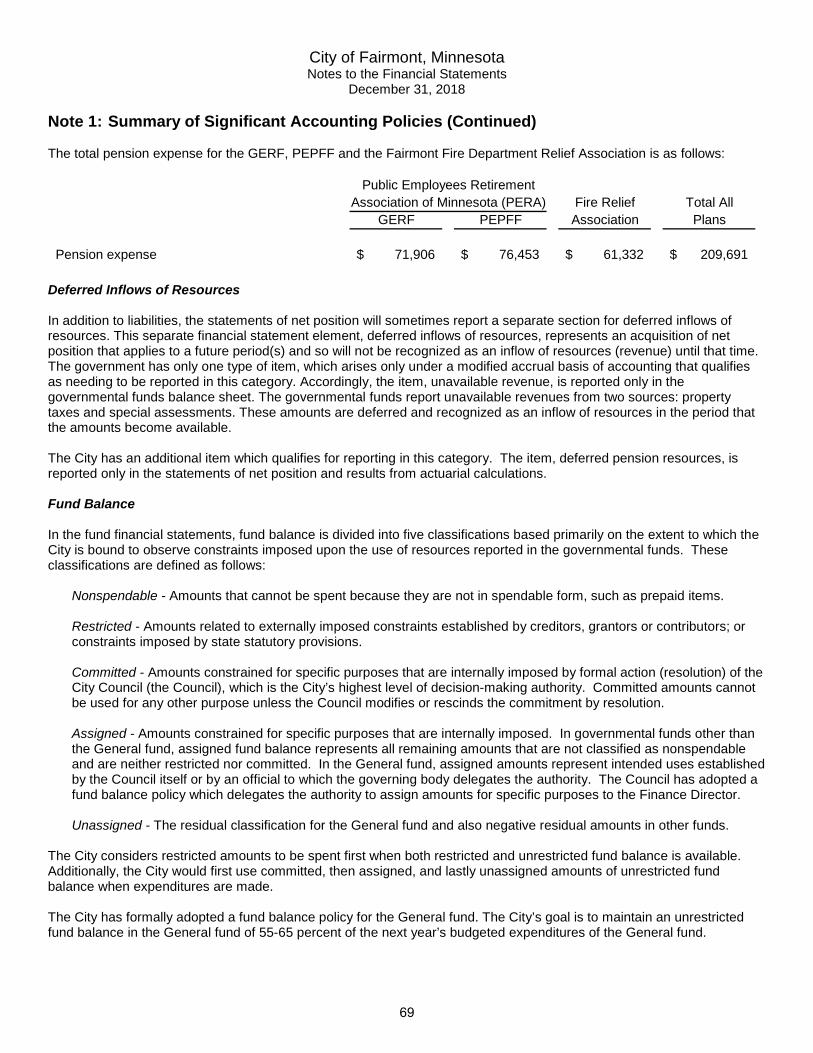
City of Fairmont, Minnesota Notes to the Financial Statements
December 31, 2018
Note 1: Summary of Significant Accounting Policies (Continued)
The total pension expense for the GERF, PEPFF and the Fairmont Fire Department Relief Association is as follows:
Fire Relief Total AllGERF PEPFF Association Plans
Pension expense 71,906$ 76,453$ 61,332$ 209,691$
Public Employees RetirementAssociation of Minnesota (PERA)
Deferred Inflows of Resources
In addition to liabilities, the statements of net position will sometimes report a separate section for deferred inflows of resources. This separate financial statement element, deferred inflows of resources, represents an acquisition of net position that applies to a future period(s) and so will not be recognized as an inflow of resources (revenue) until that time. The government has only one type of item, which arises only under a modified accrual basis of accounting that qualifies as needing to be reported in this category. Accordingly, the item, unavailable revenue, is reported only in the governmental funds balance sheet. The governmental funds report unavailable revenues from two sources: property taxes and special assessments. These amounts are deferred and recognized as an inflow of resources in the period that the amounts become available.
The City has an additional item which qualifies for reporting in this category. The item, deferred pension resources, is reported only in the statements of net position and results from actuarial calculations.
Fund Balance
In the fund financial statements, fund balance is divided into five classifications based primarily on the extent to which the City is bound to observe constraints imposed upon the use of resources reported in the governmental funds. These classifications are defined as follows:
Nonspendable - Amounts that cannot be spent because they are not in spendable form, such as prepaid items.
Restricted - Amounts related to externally imposed constraints established by creditors, grantors or contributors; or constraints imposed by state statutory provisions.
Committed - Amounts constrained for specific purposes that are internally imposed by formal action (resolution) of the City Council (the Council), which is the City’s highest level of decision-making authority. Committed amounts cannot be used for any other purpose unless the Council modifies or rescinds the commitment by resolution.
Assigned - Amounts constrained for specific purposes that are internally imposed. In governmental funds other than the General fund, assigned fund balance represents all remaining amounts that are not classified as nonspendable and are neither restricted nor committed. In the General fund, assigned amounts represent intended uses established by the Council itself or by an official to which the governing body delegates the authority. The Council has adopted a fund balance policy which delegates the authority to assign amounts for specific purposes to the Finance Director.
Unassigned - The residual classification for the General fund and also negative residual amounts in other funds.
The City considers restricted amounts to be spent first when both restricted and unrestricted fund balance is available. Additionally, the City would first use committed, then assigned, and lastly unassigned amounts of unrestricted fund balance when expenditures are made.
The City has formally adopted a fund balance policy for the General fund. The City’s goal is to maintain an unrestricted fund balance in the General fund of 55-65 percent of the next year’s budgeted expenditures of the General fund.
69
lmunguia_ABDO16C
Sticky Note
Marked set by lmunguia_ABDO16C
lmunguia_ABDO16C
Sticky Note
Marked set by lmunguia_ABDO16C
lmunguia_ABDO16C
Sticky Note
Marked set by lmunguia_ABDO16C

City of Fairmont, Minnesota Notes to the Financial Statements
December 31, 2018
Note 1: Summary of Significant Accounting Policies (Continued)
Net Position
Net position represents the difference between assets and deferred outflows of resources and liabilities and deferred inflows of resources. Net position is displayed in three components:
a. Net investment in capital assets - Consists of capital assets, net of accumulated depreciation reduced by anyoutstanding debt attributable to acquire capital assets.
b. Restricted net position - Consists of net position restricted when there are limitations imposed on their usethrough external restrictions imposed by creditors, grantors, laws or regulations of other governments.
c. Unrestricted net position - All other net position that do not meet the definition of “restricted” or “net investment incapital assets”.
Note 2: Stewardship, Compliance and Accountability
A. Budgetary Information
Annual budgets are adopted on a basis consistent with accounting principles generally accepted in the United States of America for the General and Aeronautics and Lake Restoration special revenue funds. All annual appropriations lapse at fiscal year-end. The City does not use encumbrance accounting.
In August of each year, all departments of the City submit requests for appropriations to the City Administrator so that a budget may be prepared. Before September 30, the proposed budget is presented to the Council for review. The Council holds public hearings and a final budget is prepared and adopted in early December.
The appropriated budget is prepared by fund, function and department. The City’s department heads, with the approval of the City Administrator, may make transfers of appropriations within a department. Transfers of appropriations between departments require the approval of the Council. The legal level of budgetary control is the department level. Budgeted amounts are as originally adopted, or as amended by the Council. No budget amendments were made during the year.
B. Deficit Fund Equity
The following funds had fund equity deficits at December 31, 2018:
AmountNonmajor
Capital Projects2017 Capital Improvement Program 165,586$ 2019 Capital Improvement Program 12,132
Fund
These fund deficits will be funded by future State Aid reimbursements or from capital fund reserves.
70
lmunguia_ABDO16C
Sticky Note
Marked set by lmunguia_ABDO16C

City of Fairmont, Minnesota Notes to the Financial Statements
December 31, 2018
Note 3: Detailed Notes on All Funds A. Deposits and Investments Deposits Custodial credit risk for deposits and investments is the risk that in the event of a bank failure, the City’s deposits and investments may not be returned or the City will not be able to recover collateral securities in the possession of an outside party. In accordance with Minnesota statutes and as authorized by the Council, the City maintains deposits at those depository banks, all of which are members of the Federal Reserve System. Minnesota statutes require that all City deposits be protected by insurance, surety bond or collateral. The market value of collateral pledged must equal 110 percent of the deposits not covered by insurance or bonds, with the exception of irrevocable standby letters of credit issued by Federal Home Loan Banks as this type of collateral only requires collateral pledged equal to 100 percent of the deposits not covered by insurance or bonds. Authorized collateral in lieu of a corporate surety bond includes:
• United States government Treasury bills, Treasury notes, Treasury bonds;
• Issues of United States government agencies and instrumentalities as quoted by a recognized industry quotation
service available to the government entity; • General obligation securities of any state or local government with taxing powers which is rated “A” or better by a
national bond rating service, or revenue obligation securities of any state or local government with taxing powers which is rated “AA” or better by a national bond rating service;
• General obligation securities of a local government with taxing powers may be pledged as collateral against funds
deposited by that same local government entity; • Irrevocable standby letters of credit issued by Federal Home Loan Banks to a municipality accompanied by
written evidence that the bank’s public debt is rated “AA” or better by Moody’s Investors Service, Inc., or Standard & Poor’s Corporation; and
• Time deposits that are fully insured by any federal agency.
Minnesota statutes require that all collateral shall be placed in safekeeping in a restricted account at a Federal Reserve Bank, or in an account at a trust department of a commercial bank or other financial institution that is not owned or controlled by the financial institution furnishing the collateral. The selection should be approved by the City. At year end, the City’s carrying amount of deposits was $6,390,384, including $548,638 reported in fiduciary funds. The bank balance was $6,751,552. The bank balance was covered by federal depository insurance of $1,000,000. Of the remaining balance, $5,751,552, was collateralized with securities held by the pledging financial institution’s trust department in the City’s name. The primary government and component unit’s deposits and investments are pooled.
71

City of Fairmont, Minnesota Notes to the Financial Statements
December 31, 2018 Note 3: Detailed Notes on All Funds (Continued) At year end, the City had the following investments that are insured or registered, or securities held by the City or its agent in the City’s name:
Credit SegmentedQuality/ Time
Type of Investments Ratings (1) Distribution (2) Amount Level 1 Level 2Pooled investments at amortized costs
4M Fund N/A less than 6 months 2,556,767$ Non-pooled investments at amortized costs
Money Market Funds N/A less than 6 months 193,228 Non-pooled investments at fair value
Governmental Agency Securities AAA more than 3 years 740,444 740,444$ -$ Governmental Agency Securities AAA 1 to 3 years 7,865,365 7,865,365 - Negotiable certificates of deposit N/A less than 6 months 2,446,857 - 2,446,857 Negotiable certificates of deposit N/A 6 months to 1 year 3,864,244 - 3,864,244 Negotiable certificates of deposit N/A 1 to 3 years 8,356,943 - 8,356,943 Negotiable certificates of deposit N/A more than 3 years 716,803 - 716,803
Total investments 26,740,651$ 8,605,809$ 15,384,847$
(1) Ratings are provided by various credit rating agencies where applicable to indicate associatedcredit risk. N/A indicates not applicable or available.
(2) Interest rate risk is disclosed using the segmented time distribution method.N/A Indicates not applicable or available.Note: The City does not have any level 3 investments.
Measurement UsingFair Value
72
lmunguia_ABDO16C
Sticky Note
Marked set by lmunguia_ABDO16C

City of Fairmont, Minnesota Notes to the Financial Statements
December 31, 2018 Note 3: Detailed Notes on All Funds (Continued) Cash on Hand Cash in the possession of the City, consisting of undeposited receipts, petty cash, and change funds totals $3,523. Cash and Investments Summary A reconciliation of cash and investments as shown on the statement of net position for the City, including the component unit, follows:
Primary Component AgencyGovernment Unit - EDA Funds Total
Deposits 5,436,466$ 405,280$ 548,638$ 6,390,384$ Investments 26,740,651 - - 26,740,651 Cash on Hand 3,523 - - 3,523
Total 32,180,640$ 405,280$ 548,638$ 33,134,558$
B. Notes Receivable The City has received Federal grants to be used for economic development. The proceeds of these grants were loaned to businesses and are to be paid back to the City with interest at 3 percent to 6 percent within twenty years. The balance of these notes at December 31, 2018 is $865,335. The City has received Federal grants to be used for housing loans to qualified residents for home improvements. The total notes receivable as of December 31, 2018 are $377,048 of which $15,944 represents the pay back portion which is to be paid back to the City with interest at 1 to 3 percent over 10 years. The remaining balance of $361,104 is forgivable after seven to ten years from the note date. Also, the Economic Development Authority (EDA) has made loans to businesses that are to be paid back to the City with interest at 1.5 to 5 percent over 2 to 10 years. The balance of these notes at December 31, 2018 is $6,371.
73
lmunguia_ABDO16C
Sticky Note
Marked set by lmunguia_ABDO16C

City of Fairmont, Minnesota Notes to the Financial Statements
December 31, 2018 Note 3: Detailed Notes on All Funds (Continued) C. Capital Assets Primary Government Capital asset activity for the year ended December 31, 2018 was as follows:
Beginning EndingBalance Increases Decreases Balance
Governmental Activities Capital Assets not Being Depreciated
Land 3,949,478$ -$ -$ 3,949,478$ Construction in progress 3,775,462 1,590,045 (2,632,313) 2,733,194
Total Capital Assets not Being Depreciated 7,724,940 1,590,045 (2,632,313) 6,682,672
Capital Assets Being DepreciatedBuildings and structures 9,148,687 - - 9,148,687 Improvements other than buildings 16,130,114 65,311 - 16,195,425 Machinery and equipment 5,145,874 125,952 (5,643) 5,266,183 Vehicles 2,968,737 274,241 (132,745) 3,110,233 Infrastructure 46,845,006 2,632,313 - 49,477,319 Bridges 4,890,518 - - 4,890,518
Total Capital Assets Being Depreciated 85,128,936 3,097,817 (138,388) 88,088,365
Less Accumulated Depreciation forBuildings and structures (3,850,160) (198,713) - (4,048,873) Improvements other than buildings (5,402,051) (658,716) - (6,060,767) Machinery and equipment (3,382,892) (242,026) 5,643 (3,619,275) Vehicles (2,382,818) (122,883) 132,745 (2,372,956) Infrastructure (19,083,708) (1,179,724) - (20,263,432) Bridges (1,303,517) (122,260) - (1,425,777)
Total Accumulated Depreciation (35,405,146) (2,524,322) 138,388 (37,791,080)
Total Capital Assets Being Depreciated, Net 49,723,790 573,495 - 50,297,285
Governmental ActivitiesCapital Assets, Net 57,448,730$ 2,163,540$ (2,632,313)$ 56,979,957$
74

City of Fairmont, Minnesota Notes to the Financial Statements
December 31, 2018 Note 3: Detailed Notes on All Funds (Continued)
Beginning EndingBalance Increases Decreases Balance
Business-type ActivitiesCapital Assets not Being Depreciated
Land 1,718,715$ -$ -$ 1,718,715$ Construction in progress 233,574 960,898 - 1,194,472
Total Capital Assets not Being Depreciated 1,952,289 960,898 - 2,913,187
Capital Assets Being DepreciatedBuildings and structures 42,659,996 - - 42,659,996 Improvements other than buildings 43,790,211 328,936 - 44,119,147 Machinery and equipment 10,934,716 256,780 (22,891) 11,168,605
Total Capital Assets Being Depreciated 97,384,923 585,716 (22,891) 97,947,748
Less Accumulated Depreciation forBuildings and structures (7,026,540) (814,835) - (7,841,375) Improvements other than buildings (20,196,785) (978,152) - (21,174,937) Machinery and equipment (6,110,004) (403,095) 22,891 (6,490,208)
Total Accumulated Depreciation (33,333,329) (2,196,082) 22,891 (35,506,520)
Total Capital Assets Being Depreciated, Net 64,051,594 (1,610,366) - 62,441,228
Business-type Activities Capital Assets, Net 66,003,883$ (649,468)$ -$ 65,354,415$
75

City of Fairmont, Minnesota Notes to the Financial Statements
December 31, 2018 Note 3: Detailed Notes on All Funds (Continued) Depreciation expense was charged to functions/programs of the primary government as follows: Governmental Activities
General government 72,591$ Public safety 188,663 Streets and highways 1,396,172 Culture and recreation 311,281 Housing and economic development 65,876 Airport 480,495 Capital assets held by the City's internal service funds are charged
to the various functions based on their usage of assets 9,244
Total Depreciation Expense - Governmental Activities 2,524,322$
Business-type ActivitiesElectric utility 413,388$ Water utility 932,529 Wastewater utility 613,724 Storm sewer 190,608 Liquor 45,833
Total Depreciation Expense - Business-type Activities 2,196,082$
Construction Commitments The City has active construction projects as of December 31, 2018. The projects include street and road improvements and public parks projects. At year end the City’s commitments with contractors are as follows:
RemainingSpent-to-Date Commitment
Margaret Street 2,298,987$ 46,449$ Cedar Creek Park Trail 91,381 249,168 Canyon Drive 773,808 114,436
Total 3,164,176$ 410,053$
Project
76
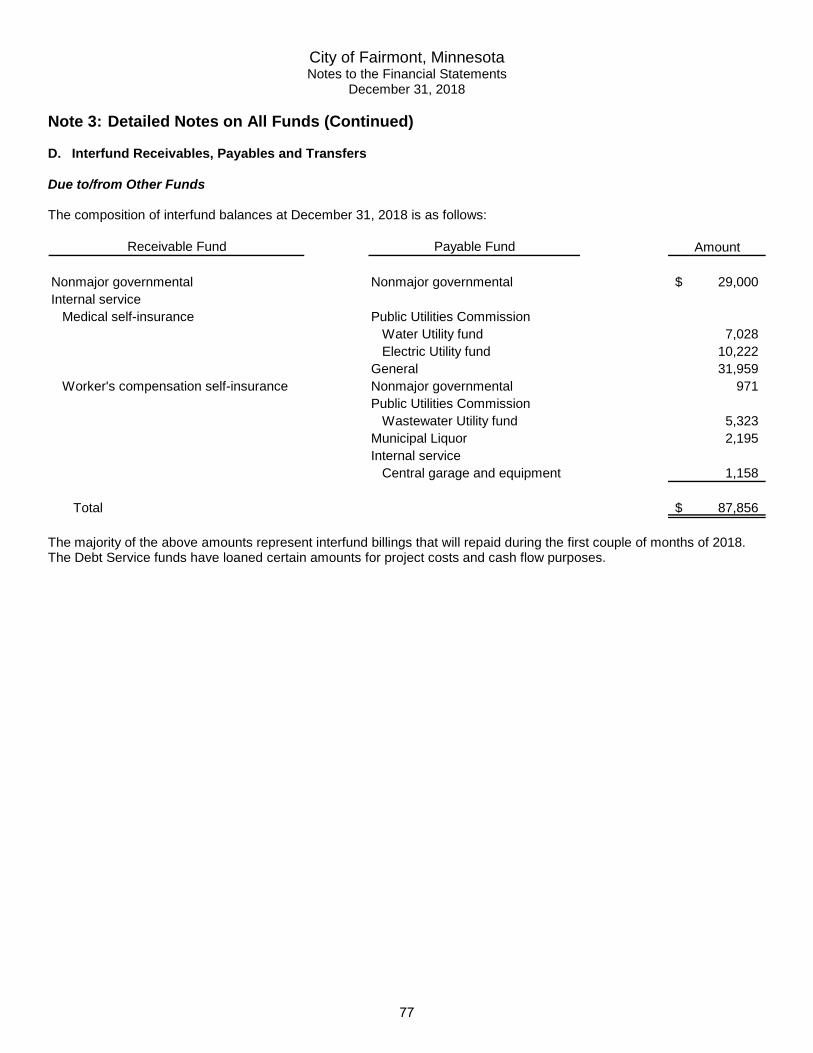
City of Fairmont, Minnesota Notes to the Financial Statements
December 31, 2018 Note 3: Detailed Notes on All Funds (Continued) D. Interfund Receivables, Payables and Transfers
Due to/from Other Funds The composition of interfund balances at December 31, 2018 is as follows:
Amount
Nonmajor governmental Nonmajor governmental 29,000$ Internal service
Medical self-insurance Public Utilities CommissionWater Utility fund 7,028 Electric Utility fund 10,222
General 31,959 Worker's compensation self-insurance Nonmajor governmental 971
Public Utilities CommissionWastewater Utility fund 5,323
Municipal Liquor 2,195 Internal service
Central garage and equipment 1,158
Total 87,856$
Payable FundReceivable Fund
The majority of the above amounts represent interfund billings that will repaid during the first couple of months of 2018. The Debt Service funds have loaned certain amounts for project costs and cash flow purposes.
77
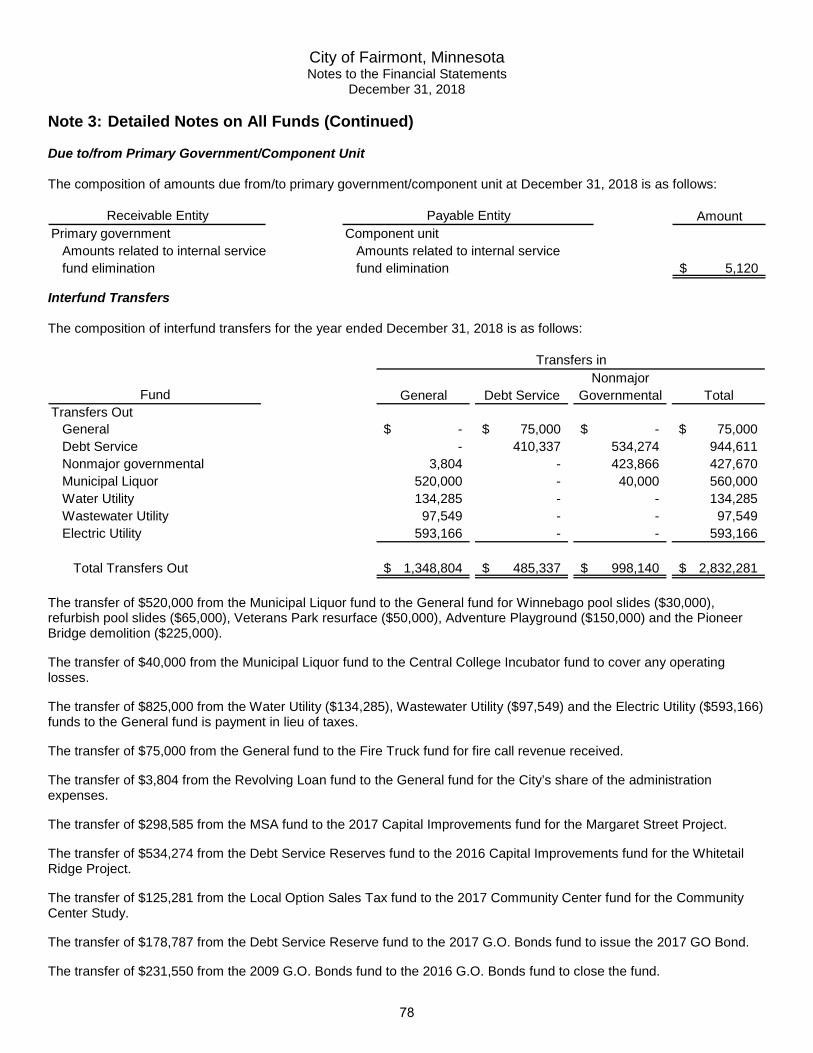
City of Fairmont, Minnesota Notes to the Financial Statements
December 31, 2018 Note 3: Detailed Notes on All Funds (Continued) Due to/from Primary Government/Component Unit The composition of amounts due from/to primary government/component unit at December 31, 2018 is as follows:
AmountPrimary government Component unit
Amounts related to internal service Amounts related to internal service fund elimination fund elimination 5,120$
Payable EntityReceivable Entity
Interfund Transfers The composition of interfund transfers for the year ended December 31, 2018 is as follows:
NonmajorGeneral Debt Service Governmental Total
Transfers Out General -$ 75,000$ -$ 75,000$ Debt Service - 410,337 534,274 944,611 Nonmajor governmental 3,804 - 423,866 427,670 Municipal Liquor 520,000 - 40,000 560,000 Water Utility 134,285 - - 134,285 Wastewater Utility 97,549 - - 97,549 Electric Utility 593,166 - - 593,166
Total Transfers Out 1,348,804$ 485,337$ 998,140$ 2,832,281$
Fund
Transfers in
The transfer of $520,000 from the Municipal Liquor fund to the General fund for Winnebago pool slides ($30,000), refurbish pool slides ($65,000), Veterans Park resurface ($50,000), Adventure Playground ($150,000) and the Pioneer Bridge demolition ($225,000). The transfer of $40,000 from the Municipal Liquor fund to the Central College Incubator fund to cover any operating losses. The transfer of $825,000 from the Water Utility ($134,285), Wastewater Utility ($97,549) and the Electric Utility ($593,166) funds to the General fund is payment in lieu of taxes. The transfer of $75,000 from the General fund to the Fire Truck fund for fire call revenue received. The transfer of $3,804 from the Revolving Loan fund to the General fund for the City’s share of the administration expenses. The transfer of $298,585 from the MSA fund to the 2017 Capital Improvements fund for the Margaret Street Project. The transfer of $534,274 from the Debt Service Reserves fund to the 2016 Capital Improvements fund for the Whitetail Ridge Project. The transfer of $125,281 from the Local Option Sales Tax fund to the 2017 Community Center fund for the Community Center Study. The transfer of $178,787 from the Debt Service Reserve fund to the 2017 G.O. Bonds fund to issue the 2017 GO Bond. The transfer of $231,550 from the 2009 G.O. Bonds fund to the 2016 G.O. Bonds fund to close the fund.
78

City of Fairmont, Minnesota Notes to the Financial Statements
December 31, 2018 Note 3: Detailed Notes on All Funds (Continued) E. Long-term Debt General Obligation Bonds The City issues general obligation bonds to provide funds for the acquisition and construction of major capital facilities. General obligation bonds have been issued for both general government and proprietary activities. These bonds are reported in the proprietary funds if they are expected to be repaid from proprietary fund revenues. In addition, general obligation bonds have been issued to refund both general obligation and revenue bonds. General obligation bonds are direct obligations and pledge the full faith and credit of the government. General obligation bonds currently outstanding are as follows: Primary Government Debt General Obligation Improvement Bonds The following bonds were issued to finance various improvements and will be repaid primarily from special assessments levied on the properties benefiting from the improvements. Some issues, however, are partly financed by ad valorem tax levies. Ad valorem tax levies of $9,433,956 are scheduled to be collected in future years for retirement of these bonds. All special assessment debt is backed by the full faith and credit of the City. Each year the combined assessment and tax levy equals 105 percent of the amount required for debt service. The excess of 5 percent is to cover any delinquencies in tax or assessment payments.
BalanceAuthorized Issue Maturity atand Issued Date Date Year End
G.O. Improvement Crossover RefundingBonds of 2012A 5,755,000$ 0.50 - 1.95 % 03/15/12 03/01/24 3,470,000$
G.O. Improvement Bonds of 2013A 1,715,000 2.00 - 3.75 08/22/13 03/01/29 1,305,000 G.O. Improvement Bonds of 2015A 2,330,000 2.00 - 3.00 08/20/15 03/01/31 2,015,000 G.O. Improvement Crossover Refunding
Bonds of 2016A 2,715,000 1.50 - 2.00 05/01/16 03/01/27 2,495,000 G.O. Improvement Bonds of 2017A 2,950,000 2.00 - 3.00 07/18/17 03/01/33 2,950,000
Total G.O. Special Assessment Bonds 12,235,000$
RateInterest
Description
79

City of Fairmont, Minnesota Notes to the Financial Statements
December 31, 2018 Note 3: Detailed Notes on All Funds (Continued) The annual debt service requirements to maturity for general obligation special assessment bonds are as follows:
Year EndingDecember 31, Principal Interest Total
2019 1,465,000$ 249,125$ 1,714,125$ 2020 1,470,000 225,296 1,695,296 2021 1,495,000 199,066 1,694,066 2022 1,300,000 172,941 1,472,941 2023 1,080,000 149,740 1,229,740
2024 - 2028 3,700,000 461,670 4,161,670 2029 - 2033 1,725,000 108,981 1,833,981
Total 12,235,000$ 1,566,819$ 13,801,819$
Governmental Activities
General Obligation Revenue Bonds The following bonds were issued to finance capital improvements to the Public Utilities Commission and Storm Sewer Utility funds. They will be retired from net revenue of these funds.
BalanceAuthorized Issue Maturity atand Issued Date Date Year End
2004 G.O. RevenueNotes (PFA) 13,248,347$ 1.73 % 05/25/04 08/20/24 4,649,000$
G.O. Storm Sewer Crossover Refunding Bonds of 2009A 1,835,000 2.00 - 4.00 09/01/09 04/01/25 610,000
2011 G.O. RevenueNotes (PFA) 28,902,811 2.23 10/11/11 08/20/41 23,370,000
Total G.O. Revenue Bonds 28,629,000$
RateInterest
Description
The annual debt service requirements to maturity for general obligation revenue bonds are as follows:
Year EndingDecember 31, Principal Interest Total
2019 1,742,000$ 620,639$ 2,362,639$ 2020 1,773,000 583,180 2,356,180 2021 1,814,000 544,407 2,358,407 2022 1,636,000 508,507 2,144,507 2023 1,669,000 475,895 2,144,895
2024 - 2028 5,479,000 1,953,067 7,432,067 2029 - 2033 5,217,000 1,393,480 6,610,480 2034 - 2038 5,827,000 784,089 6,611,089 2039 - 2041 3,472,000 148,695 3,620,695
Total 28,629,000$ 7,011,959$ 35,640,959$
Business-type ActivitiesG.O. Revenue Bonds
80

City of Fairmont, Minnesota Notes to the Financial Statements
December 31, 2018
Note 3: Detailed Notes on All Funds (Continued)
Annual revenues from charges for services, principal and interest payments, and percentage of revenue required to cover principal and interest payments for the year ended December 31, 2018 are as follows:
Water Wastewater Storm WaterUtility Utility Utility
Revenues 3,513,185$ 2,303,196$ 587,094$ Principal and Interest 1,321,774 822,040 214,225 Percentage of Revenues 37.6% 35.7% 36.5%
Changes in Long-term Liabilities
Long-term liability activity for the year ended December 31, 2018 was as follows:
Beginning Ending Due WithinBalance Increases Decreases Balance One Year
Governmental ActivitiesBonds Payable
General obligation specialassessment bonds 14,665,000$ -$ (2,430,000)$ 12,235,000$ 1,465,000$
Bond premiums 126,279 - (19,545) 106,734 - Total Bonds Payable 14,791,279 - (2,449,545) 12,341,734 1,465,000
Sick Leave/Severance Payable 494,086 505,992 (470,002) 530,076 170,423 Pension Liability
GERF 2,092,263 - (281,565) 1,810,698 - PEPFF 1,647,145 99,296 (252,053) 1,494,388 - FRA 191,107 - (179,773) 11,334 -
Postemployment Benefits Other306,763 22,606 (14,311) 315,058 - Than Pension Obligations
Governmental Activity Long-term Liabilities 19,522,643$ 627,894$ (3,647,249)$ 16,503,288$ 1,635,423$
Business-type ActivitiesBonds Payable
General obligationrevenue bonds 30,330,000$ -$ (1,701,000)$ 28,629,000$ 1,742,000$
Bond premiums 14,967 - (2,089) 12,878 - Total Bonds Payable 30,344,967 - (1,703,089) 28,641,878 1,742,000
Sick Leave/Severance Payable 402,228 268,599 (274,470) 396,357 128,646 Pension Liability
GERF 2,612,696 37,969 (383,884) 2,266,781 - Postemployment Benefits Other
202,108 15,148 (9,440) 207,816 - Than Pension Obligations
Business-type Activity Long-term Liabilities 33,561,999$ 321,716$ (2,370,883)$ 31,512,832$ 1,870,646$
81
lmunguia_ABDO16C
Sticky Note
Marked set by lmunguia_ABDO16C
lmunguia_ABDO16C
Sticky Note
Marked set by lmunguia_ABDO16C
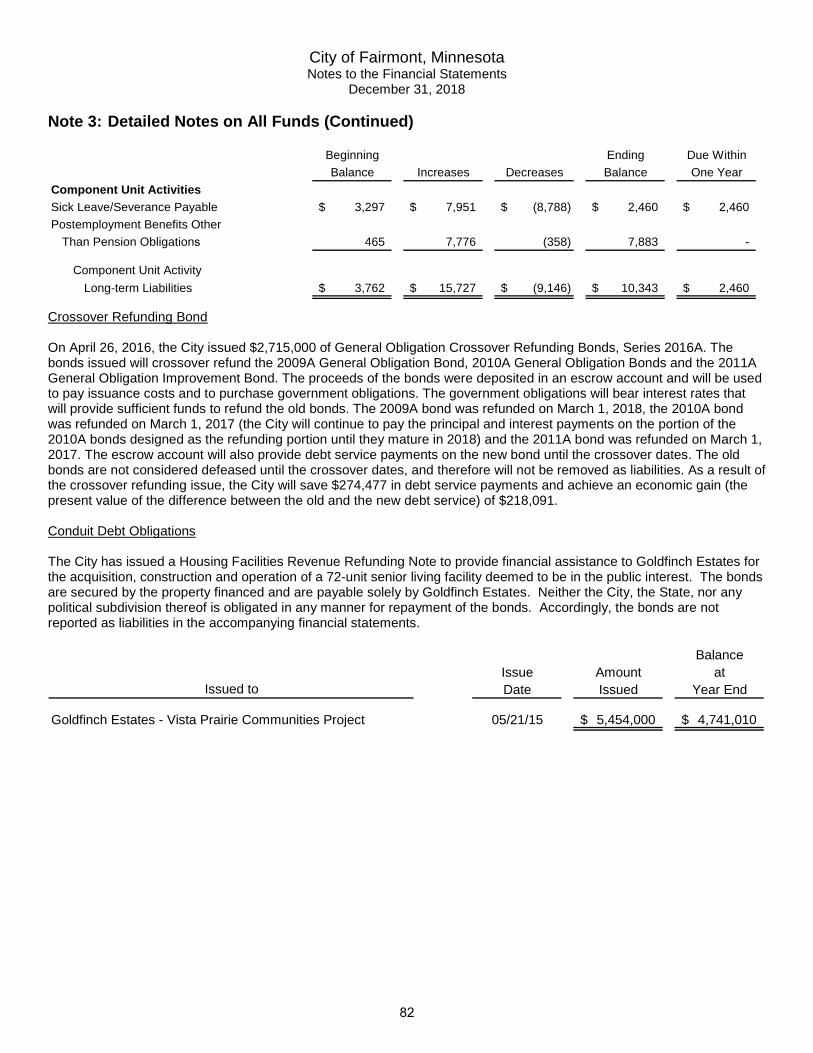
City of Fairmont, Minnesota Notes to the Financial Statements
December 31, 2018
Note 3: Detailed Notes on All Funds (Continued)
Beginning Ending Due WithinBalance Increases Decreases Balance One Year
Component Unit ActivitiesSick Leave/Severance Payable 3,297$ 7,951$ (8,788)$ 2,460$ 2,460$ Postemployment Benefits Other
Than Pension Obligations 465 7,776 (358) 7,883 -
Component Unit Activity Long-term Liabilities 3,762$ 15,727$ (9,146)$ 10,343$ 2,460$
Crossover Refunding Bond
On April 26, 2016, the City issued $2,715,000 of General Obligation Crossover Refunding Bonds, Series 2016A. The bonds issued will crossover refund the 2009A General Obligation Bond, 2010A General Obligation Bonds and the 2011A General Obligation Improvement Bond. The proceeds of the bonds were deposited in an escrow account and will be used to pay issuance costs and to purchase government obligations. The government obligations will bear interest rates that will provide sufficient funds to refund the old bonds. The 2009A bond was refunded on March 1, 2018, the 2010A bond was refunded on March 1, 2017 (the City will continue to pay the principal and interest payments on the portion of the 2010A bonds designed as the refunding portion until they mature in 2018) and the 2011A bond was refunded on March 1, 2017. The escrow account will also provide debt service payments on the new bond until the crossover dates. The old bonds are not considered defeased until the crossover dates, and therefore will not be removed as liabilities. As a result of the crossover refunding issue, the City will save $274,477 in debt service payments and achieve an economic gain (the present value of the difference between the old and the new debt service) of $218,091.
Conduit Debt Obligations
The City has issued a Housing Facilities Revenue Refunding Note to provide financial assistance to Goldfinch Estates for the acquisition, construction and operation of a 72-unit senior living facility deemed to be in the public interest. The bonds are secured by the property financed and are payable solely by Goldfinch Estates. Neither the City, the State, nor any political subdivision thereof is obligated in any manner for repayment of the bonds. Accordingly, the bonds are not reported as liabilities in the accompanying financial statements.
BalanceIssue Amount atDate Issued Year End
Goldfinch Estates - Vista Prairie Communities Project 05/21/15 5,454,000$ 4,741,010$
Issued to
82
lmunguia_ABDO16C
Sticky Note
Marked set by lmunguia_ABDO16C
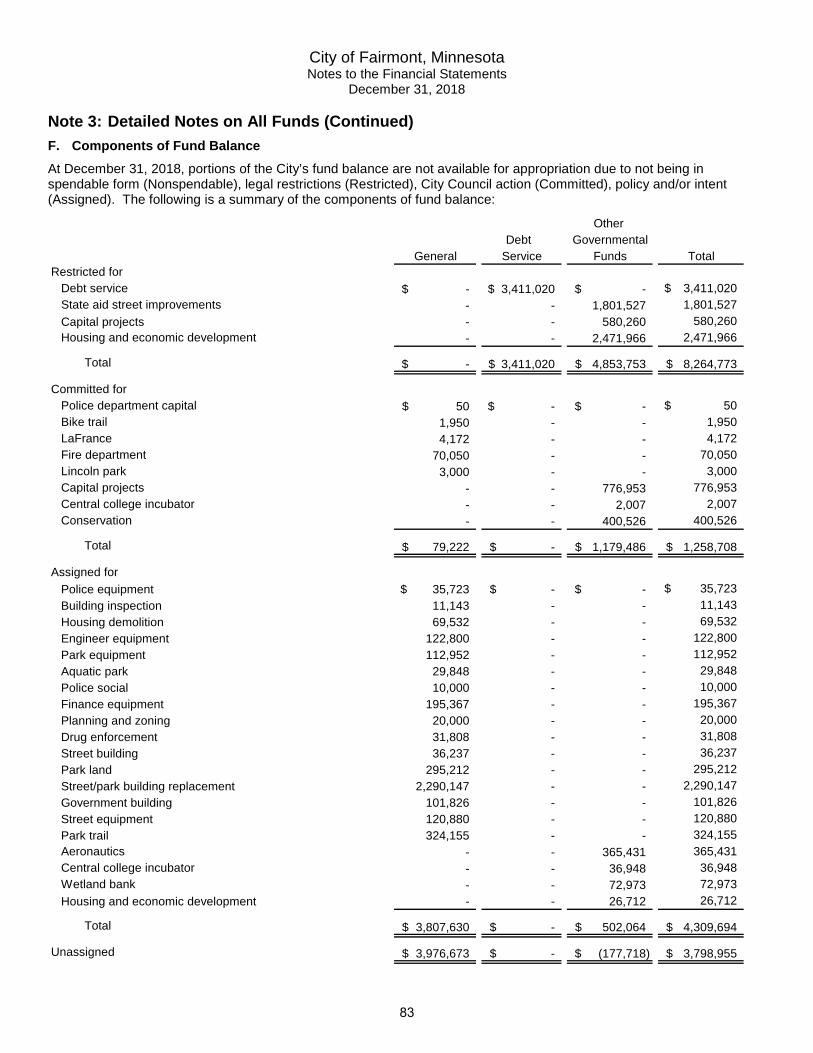
City of Fairmont, Minnesota Notes to the Financial Statements
December 31, 2018 Note 3: Detailed Notes on All Funds (Continued)
F. Components of Fund Balance
At December 31, 2018, portions of the City’s fund balance are not available for appropriation due to not being in spendable form (Nonspendable), legal restrictions (Restricted), City Council action (Committed), policy and/or intent (Assigned). The following is a summary of the components of fund balance:
Other Debt Governmental
General Service Funds TotalRestricted for
Debt service -$ 3,411,020$ -$ 3,411,020$ State aid street improvements - - 1,801,527 1,801,527 Capital projects - - 580,260 580,260 Housing and economic development - - 2,471,966 2,471,966
Total -$ 3,411,020$ 4,853,753$ 8,264,773$
Committed forPolice department capital 50$ -$ -$ 50$ Bike trail 1,950 - - 1,950 LaFrance 4,172 - - 4,172 Fire department 70,050 - - 70,050 Lincoln park 3,000 - - 3,000 Capital projects - - 776,953 776,953 Central college incubator - - 2,007 2,007 Conservation - - 400,526 400,526
Total 79,222$ -$ 1,179,486$ 1,258,708$
Assigned forPolice equipment 35,723$ -$ -$ 35,723$ Building inspection 11,143 - - 11,143 Housing demolition 69,532 - - 69,532 Engineer equipment 122,800 - - 122,800 Park equipment 112,952 - - 112,952 Aquatic park 29,848 - - 29,848 Police social 10,000 - - 10,000 Finance equipment 195,367 - - 195,367 Planning and zoning 20,000 - - 20,000 Drug enforcement 31,808 - - 31,808 Street building 36,237 - - 36,237 Park land 295,212 - - 295,212 Street/park building replacement 2,290,147 - - 2,290,147 Government building 101,826 - - 101,826 Street equipment 120,880 - - 120,880 Park trail 324,155 - - 324,155 Aeronautics - - 365,431 365,431 Central college incubator - - 36,948 36,948 Wetland bank - - 72,973 72,973 Housing and economic development - - 26,712 26,712
Total 3,807,630$ -$ 502,064$ 4,309,694$
Unassigned 3,976,673$ -$ (177,718)$ 3,798,955$
83

City of Fairmont, Minnesota Notes to the Financial Statements
December 31, 2018
Note 4: Defined Benefit Pension Plans - Statewide
A. Plan Description
The City participates in the following cost-sharing multiple-employer defined benefit pension plans administered by the Public Employees Retirement Association of Minnesota (PERA). PERA’s defined benefit pension plans are established and administered in accordance with Minnesota statutes, chapters 353 and 356. PERA’s defined benefit pension plans are tax qualified plans under Section 401(a) of the Internal Revenue Code.
General Employees Retirement Fund (GERF)
All full-time and certain part-time employees of the City, are covered by the General Employees Retirement Fund (GERF). GERF members belong to the Coordinated Plan. Coordinated Plan members are covered by Social Security.
Public Employees Police and Fire Fund (PEPFF)
The PEPFF, originally established for police officers and firefighters not covered by a local relief association, now covers all police officers and firefighters hired since 1980. Effective July 1, 1999, the PEPFF also covers police officers and firefighters belonging to a local relief association that elected to merge with and transfer assets and administration to PERA.
B. Benefits Provided
PERA provides retirement, disability and death benefits. Benefit provisions are established by Minnesota statute and can only be modified by the state legislature. Vested, terminated employees who are entitled to benefits but are not receiving them yet are bound by the provisions in effect at the time they last terminated their public service.
GERF Benefits
Benefits are based on a member’s highest average salary for any five successive years of allowable service, age, and years of credit at termination of service. Two methods are used to compute benefits for PERA's Coordinated Plan members. Members hired prior to July 1, 1989 receive the higher of Method 1 or Method 2 formulas. Only Method 2 is used for members hired after June 30, 1989. Under Method 1, the accrual rate for Coordinated members is 1.2 percent of average salary for each of the first 10 years of service and 1.7 percent of average salary for each additional year. Under Method 2, the accrual rate for Coordinated members is 1.7 percent for average salary for all years of service. For members hired prior to July 1, 1989 a full annuity is available when age plus years of service equal 90 and normal retirement age is 65. For members hired on or after July 1, 1989 normal retirement age is the age for unreduced Social Security benefits capped at 66.
Benefit increases are provided to benefit recipients each January. Increases are related to the funding ratio of the plan. If the General Employees Plan is at least 90 percent funded for two consecutive years, benefit recipients are given a 2.5 percent increase. If the plan has not exceeded 90 percent funded, or have fallen below 80 percent, benefit recipients are given a one percent increase. A benefit recipient who has been receiving a benefit for at least 12 full months as of June 30 will receive a full increase. Members receiving benefits for at least one month but less than 12 full months as of June 30 will receive a pro rata increase.
84
lmunguia_ABDO16C
Sticky Note
Marked set by lmunguia_ABDO16C

City of Fairmont, Minnesota Notes to the Financial Statements
December 31, 2018
Note 4: Defined Benefit Pension Plans - Statewide (Continued) PEPFF Benefits Benefits for the PEPFF members first hired after June 30, 2010, but before July 1, 2014, vest on a prorated basis from 50 percent after five years up to 100 percent after ten years of credited service. Benefits for PEPFF members first hired after June 30, 2014 vest on a prorated basis from 50 percent after ten years up to 100 percent after twenty years of credited service. The annuity accrual rate is 3 percent of average salary for each year of service. A full, unreduced pension is earned when members are age 55 and vested, or for members who were first hired prior to July 1, 1989, when age plus years of service equal at least 90. Benefit increases are provided to benefit recipients each January. Police and Fire Plan benefit recipients receive a future annual 1.0 percent increase. An annual adjustment will equal 2.5 percent any time the plan exceeds a 90 percent funded ratio for two consecutive years. If the adjustment is increased to 2.5 percent and the funded ratio falls below 80 percent for one year or 85 percent for two consecutive years, the post-retirement benefit increase will be lowered to one percent. A benefit recipient who has been receiving a benefit for at least 12 full months as of June 30 will receive a full increase. Members receiving benefits for at least one month but less than 12 full months as of June 30 will receive a pro rata increase. For retirements after May 31, 2014, the first increase will be delayed two years. C. Contributions Minnesota statutes chapter 353 sets the rates for employer and employee contributions. Contribution rates can only be modified by the state legislature. GERF Contributions Plan members were required to contribute 6.50 percent of their annual covered salary and the City was required to contribute 7.50 percent of pay for Coordinated Plan members in fiscal year 2018. The City’s contributions to the GERF for the years ending December 31, 2018, 2017 and 2016 were $379,487, $362,456 and $346,231, respectively. The City’s contributions were equal to the required contributions for each year as set by Minnesota statute. PEPFF Contributions Plan members were required to contribute 10.80 percent of their annual covered salary and the City was required to contribute 16.20 percent of pay for members in fiscal year 2018. The City’s contributions to the PEPFF for the years ending December 31, 2018, 2017 and 2016 were $240,033, $219,305 and $203,906, respectively. The City’s contributions were equal to the required contributions for each year as set by Minnesota statute.
D. Pension Costs
GERF Pension Costs At December 31, 2018, the City reported a liability of $4,077,479 for its proportionate share of the GERF’s net pension liability. The City’s net pension liability reflected a reduction due to the State of Minnesota’s contribution of $16 million to the fund in 2018. The State of Minnesota is considered a non-employer contributing entity and the State’s contribution meets the definition of a special funding situation. The State of Minnesota’s proportionate share of the net pension liability associated with the City totaled $133,729. The net pension liability was measured as of June 30, 2018, and the total pension liability used to calculate the net pension liability was determined by an actuarial valuation as of that date. The City’s proportionate share of the net pension liability was based on the City’s contributions received by PERA during the measurement period for employer payroll paid dates from July 1, 2017 through June 30, 2018 relative to the total employer contributions received from all of PERA’s participating employers. At June 30, 2018, the City’s proportionate share was 0.0735 percent which was a 0.0002 percent decrease from its proportion measured as of June 30, 2017.
85

City of Fairmont, Minnesota Notes to the Financial Statements
December 31, 2018
Note 4: Defined Benefit Pension Plans - Statewide (Continued) City's proportianate share of the net pension liability 4,077,479$ State of Minnesota's proportionate share of the net pension
liability associated with the City 133,729
Total 4,211,208$
For the year ended December 31, 2018, the City recognized pension expense of $71,906 for its proportionate share of GERF’s pension expense. In addition, the City recognized an additional $31,185 as pension expense (and grant revenue) for its proportionate share of the State of Minnesota’s contribution of $16 million to the GERF. At December 31, 2018, the City reported its proportionate share of GERF’s deferred outflows of resources and deferred inflows of resources, and its contributions subsequent to the measurement date, from the following sources:
Deferred DeferredOutflows Inflows
of Resources of Resources
Differences Between Expected and Actual Experience 107,716$ 116,082$ Changes in Actuarial Assumptions 387,749 458,149 Net Difference Between Projected and Actual Earnings on Plan Investments - 411,929 Changes in Proportion 20,753 88,926 Contributions to GERF Subsequent to the Measurement Date 189,894 -
Total 706,112$ 1,075,086$
Deferred outflows of resources totaling $189,894 related to pensions resulting from the City’s contributions to GERF subsequent to the measurement date will be recognized as a reduction of the net pension liability in the year ended December 31, 2019. Other amounts reported as deferred outflows and inflows of resources related to GERF pensions will be recognized in pension expense as follows:
122,782$ (261,578) (334,973) (85,099)
2019202020212022
PEPFF Pension Costs At December 31, 2018, the City reported a liability of $1,494,388 for its proportionate share of the PEPFF’s net pension liability. The net pension liability was measured as of June 30, 2018, and the total pension liability used to calculate the net pension liability was determined by an actuarial valuation as of that date. The City’s proportion of the net pension liability was based on the City’s contributions received by PERA during the measurement period for employer payroll paid dates from July 1, 2017, through June 30, 2018, relative to the total employer contributions received from all of PERA’s participating employers. At June 30, 2018, the City’s proportionate share was 0.1402 percent which was an increase of 0.0182 percent from its proportion measured as of June 30, 2017. For the year ended December 31, 2018, the City recognized pension expense of $76,453 for its proportionate share of PEPFF’s pension expense. The City also recognized $12,618 for the year ended December 31, 2018, as pension expense (and an offsetting reduction of net pension liability) for its proportionate share of the State of Minnesota’s on-behalf contributions to the plan. Legislation passed in 2013 required the State of Minnesota to begin contributing $9 million to the PEPFF each year, starting in fiscal year 2014.
86

City of Fairmont, Minnesota Notes to the Financial Statements
December 31, 2018
Note 4: Defined Benefit Pension Plans - Statewide (Continued)
At December 31, 2018, the City reported its proportionate share of PEPFF’s deferred outflows of resources and deferred inflows of resources, and its contributions subsequent to the measurement date, from the following sources:
Deferred DeferredOutflows Inflows
of Resources of Resources
Differences Between Expected and Actual Experience 60,657$ 416,591$ Changes in Actuarial Assumptions 1,950,926 2,199,933 Net Difference Between Projected and Actual Earnings on Plan Investments - 268,688 Changes in Proportion 306,984 152,194 Contributions to PEPFF Subsequent to the Measurement Date 117,620 -
Total 2,436,187$ 3,037,406$
Deferred outflows of resources totaling $117,620 related to pensions resulting from the City’s contributions to PEPFF subsequent to the measurement date will be recognized as a reduction of the net pension liability in the year ended December 31, 2019. Other amounts reported as deferred outflows and inflows of resources related to PEPFF pensions will be recognized in pension expense as follows:
47,832$ (89,268)
(195,646) (532,512)
50,755
20192020202120222023
Total Pension Expense
The total pension expense for all plans recognized by the City for the year ended December 31, 2018, was $209,691.
E. Actuarial Assumptions
The total pension liability in the June 30, 2018 actuarial valuation was determined using the following actuarial assumptions:
Inflation 2.50% per yearActive Member Payroll Growth 3.25% per yearInvestment Rate of Return 7.50%
Salary increases were based on a service-related table. Mortality rates for active members, retirees, survivors and disabilitants were based on RP-2014 tables for all plans for males or females, as appropriate, with slight adjustments to fit PERA’s experience. Cost of living benefit increases after retirement for retirees are assumed to be 1.25 percent per year for GERF and 1.0 percent per year for PEPFF.
Actuarial assumptions used in the June 30, 2018 valuation were based on the results of actuarial experience studies. The most recent six-year experience study in the GERF plan was completed in 2015. The most recent four-year experience study for PEPFF was completed in 2016. Economic assumptions were updated in 2017 based on a review of inflation and investment return assumptions.
87
lmunguia_ABDO16C
Sticky Note
Marked set by lmunguia_ABDO16C

City of Fairmont, Minnesota Notes to the Financial Statements
December 31, 2018
Note 4: Defined Benefit Pension Plans - Statewide (Continued)
The following changes in actuarial assumptions occurred in 2018: GERF
• The mortality projection scale was changed from MP-2015 to MP-2017. • The assumed benefit increase was changed from 1.0 percent per year through 2044 and 2.50 percent per year
thereafter to 1.25 percent per year. PEPFF
• The mortality projection scale was changed from MP-2016 to MP-2017. • As set by statute, the assumed post-retirement benefit increase was changed from 1.0 percent per year through
2064 and 2.5 percent per year, thereafter, to 1.0 percent for all years, with no trigger. The State Board of Investment, which manages the investments of PERA, prepares an analysis of the reasonableness on a regular basis of the long-term expected rate of return using a building-block method in which best-estimate ranges of expected future rates of return are developed for each major asset class. These ranges are combined to produce an expected long-term rate of return by weighting the expected future rates of return by the target asset allocation percentages. The target allocation and best estimates of geometric real rates of return for each major asset class are summarized in the following table:
Asset Class
Domestic Stocks 36.00 % 5.10 %International Stocks 17.00 5.30 Bonds (Fixed Income) 20.00 0.75 Alternative Assets (Private Markets) 25.00 5.90 Cash 2.00 -
Total 100.00 %
Long-termTarget Expected Real
Allocation Rate of Return
F. Discount Rate
The discount rate used to measure the total pension liability in 2018 was 7.50 percent. The projection of cash flows used to determine the discount rate assumed that contributions from plan members and employers will be made at rates set in Minnesota statutes. Based on these assumptions, the fiduciary net position of the GERF and PEPFF were projected to be available to make all projected future benefit payments of current plan members. Therefore, the long-term expected rate of return on pension plan investments was applied to all periods of projected benefit payments to determine the total pension liability.
88
lmunguia_ABDO16C
Sticky Note
Marked set by lmunguia_ABDO16C

City of Fairmont, Minnesota Notes to the Financial Statements
December 31, 2018
Note 4: Defined Benefit Pension Plans - Statewide (Continued) G. Pension Liability Sensitivity
The following presents the City’s proportionate share of the net pension liability for all plans it participates in, calculated using the discount rate disclosed in the preceding paragraph, as well as what the City’s proportionate share of the net pension liability would be if it were calculated using a discount rate 1 percentage point lower or 1 percentage point higher than the current discount rate:
1 Percent 1 PercentDecrease (6.50%) Current (7.50%) Increase (8.50%)
GERF 6,626,425$ 4,077,479$ 1,973,396$ PEPFF 3,204,061 1,494,388 80,559
City Proportionate Share of NPL
H. Pension Plan Fiduciary Net Position
Detailed information about each pension plan’s fiduciary net position is available in a separately-issued PERA financial report that includes financial statements and required supplementary information. That report may be obtained on the Internet at www.mnpera.org. Note 5: Defined Benefit Pension Plans - Fire Relief Association A. Plan Description All members of the Fairmont Fire Department (the Department) are covered by a defined benefit plan administered by the Fairmont Fire Department Relief Association (the Association). As of December 31, 2017, the plan covered 32 active firefighters and 2 vested terminated fire fighters whose pension benefits are deferred. The plan is a single employer retirement plan and is established and administered in accordance with Minnesota statute, chapter 69. The Association maintains a separate Special fund to accumulate assets to fund the retirement benefits earned by the Department’s membership. Funding for the Association is derived from an insurance premium tax in accordance with the Volunteer Firefighter’s Relief Association Financing Guidelines Act of 1971 (chapter 261 as amended by chapter 509 of Minnesota statutes 1980). Funds are also derived from investment income. B. Benefits Provided
A fire fighter who completes at least 20 years as an active member of the Department is entitled, after age 50, to a full service pension upon retirement. The bylaws of the Association also provide for an early vested service pension for a retiring member who has completed fewer than 20 years of service. The reduced pension, available to members with 10 years of service, shall be equal to 60 percent of the pension as prescribed by the bylaws. This percentage increases 4 percent per year so that at 20 years of service, the full amount prescribed is paid. Members who retire with less than 20 years of service and have reached the age of 50 years and have completed at least 10 years of active membership are entitled to a reduced service pension not to exceed the amount calculated by multiplying the member's service pension for the completed years of service times the applicable non-forfeitable percentage of pension.
89

City of Fairmont, Minnesota Notes to the Financial Statements
December 31, 2018
Note 5: Defined Benefit Pension Plans - Fire Relief Association (Continued)
C. Contributions
Minnesota statutes, chapters 424 and 424A authorize pension benefits for volunteer fire relief associations. The plan is funded by fire state aid, investment earnings and, if necessary, employer contributions as specified in Minnesota statutes and voluntary City contributions (if applicable). The State of Minnesota contributed $91,181 in fire state aid to the plan on behalf of the City Fire Department for the year ended December 31, 2017, which was recorded as a revenue. Required employer contributions are calculated annually based on statutory provisions. The City’s statutorily-required contributions to the plan for the year ended December 31, 2018 were $134,620. The City’s contributions were equal to the required contributions as set by state statute.
D. Pension Costs
At December 31, 2018, the City reported a net pension liability of $11,334 for the plan. The net pension liability was measured as of December 31, 2017. The total pension liability used to calculate the net pension liability in accordance with GASB 68 was determined by VanIwaarden applying an actuarial formula to specific census data certified by the Department. The following table presents the changes in net pension liability (asset) during the year:
Total Plan NetPension Fiduciary PensionLiability Net Position Liability (Asset)
(a) (b) (a-b)
Beginning Balance January 1, 2017 1,711,855$ 1,520,748$ 191,107$
Changes for the YearService cost 56,261 - 56,261 Interest 100,750 - 100,750 Differences between expected and actual experience (77,198) - (77,198) Changes in assumptions 26,484 - 26,484 Contributions - State and local - 131,968 (131,968) Contributions - member - 17,420 (17,420) Net investment income - 149,581 (149,581) Benefit payments (312,223) (312,223) - Administrative expenses - (12,899) 12,899
Total Net Changes (205,926) (26,153) (179,773)
Ending Balance December 31, 2017 1,505,929$ 1,494,595$ 11,334$
For the year ended December 31, 2018, the City recognized negative pension expense of $73,288.
90
lmunguia_ABDO16C
Sticky Note
Marked set by lmunguia_ABDO16C
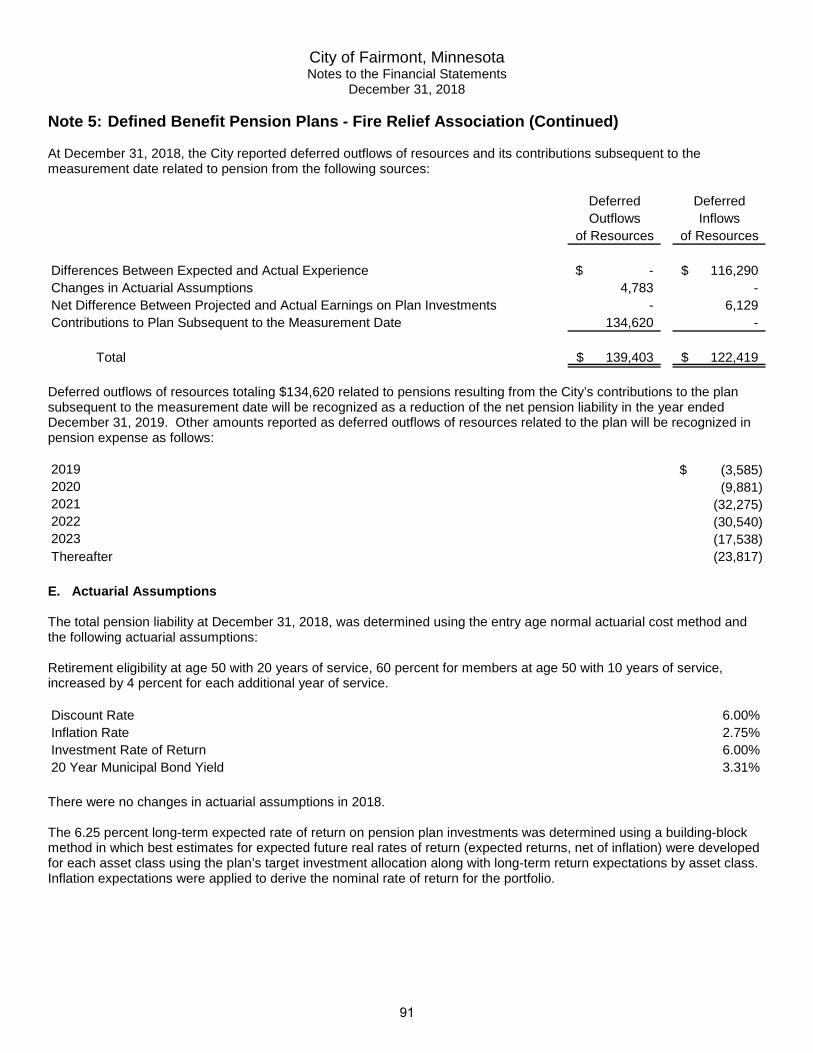
City of Fairmont, Minnesota Notes to the Financial Statements
December 31, 2018 Note 5: Defined Benefit Pension Plans - Fire Relief Association (Continued) At December 31, 2018, the City reported deferred outflows of resources and its contributions subsequent to the measurement date related to pension from the following sources:
Deferred DeferredOutflows Inflows
of Resources of Resources
Differences Between Expected and Actual Experience -$ 116,290$ Changes in Actuarial Assumptions 4,783 - Net Difference Between Projected and Actual Earnings on Plan Investments - 6,129 Contributions to Plan Subsequent to the Measurement Date 134,620 -
Total 139,403$ 122,419$
Deferred outflows of resources totaling $134,620 related to pensions resulting from the City’s contributions to the plan subsequent to the measurement date will be recognized as a reduction of the net pension liability in the year ended December 31, 2019. Other amounts reported as deferred outflows of resources related to the plan will be recognized in pension expense as follows:
(3,585)$ (9,881)
(32,275) (30,540) (17,538)
Thereafter (23,817)
20192020202120222023
E. Actuarial Assumptions
The total pension liability at December 31, 2018, was determined using the entry age normal actuarial cost method and the following actuarial assumptions: Retirement eligibility at age 50 with 20 years of service, 60 percent for members at age 50 with 10 years of service, increased by 4 percent for each additional year of service. Discount Rate 6.00%Inflation Rate 2.75%Investment Rate of Return 6.00%20 Year Municipal Bond Yield 3.31%
There were no changes in actuarial assumptions in 2018. The 6.25 percent long-term expected rate of return on pension plan investments was determined using a building-block method in which best estimates for expected future real rates of return (expected returns, net of inflation) were developed for each asset class using the plan’s target investment allocation along with long-term return expectations by asset class. Inflation expectations were applied to derive the nominal rate of return for the portfolio.
91

City of Fairmont, Minnesota Notes to the Financial Statements
December 31, 2018
Note 5: Defined Benefit Pension Plans - Fire Relief Association (Continued)
The target allocation and best estimates of arithmetic real rates of return for each major asset class are summarized in the following table:
Asset Class
Domestic Equity 44.00 % 8.14 %International Equity 0.93 7.95 Fixed Income 29.50 4.73 Real Estate and Alternatives 0.61 7.00 Cash and Equivalents 24.96 3.54
Total 100.00 %
Long-termTarget Expected Nominal
Allocation Rate of Return
F. Discount Rate
The discount rate used to measure the total pension liability was 6.25 percent. The projection of cash flows used to determine the discount rate assumed that contributions to the plan will be made as specified in statute. Based on that assumption and considering the funding ratio of the plan, the fiduciary net position was projected to be available to make all projected future benefit payments of current active and inactive members. Therefore, the long-term expected rate of return on pension plan investments was applied to all periods of projected benefit payments to determine the total pension liability.
G. Pension Liability Sensitivity
The following presents the City’s net pension liability for the plan, calculated using the discount rate disclosed in the preceding paragraph, as well as what the City’s net pension liability would be if it were calculated using a discount rate 1 percent lower or 1 percent higher than the current discount rate:
1 Percent 1 PercentDecrease (5.25%) Current (6.25%) Increase (7.25%)
Defined Benefit Plan 65,109$ 11,334$ (38,807)$
H. Pension Plan Fiduciary Net Position The Association issues a publicly available financial report. The report may be obtained by writing to the Fairmont Fire Department Relief Association, 100 Downtown Plaza, Fairmont, MN 56031.
92

City of Fairmont, Minnesota Notes to the Financial Statements
December 31, 2018
Note 6: Postemployment Benefits Other Than Pensions A. Plan Description
The City administers a single-employer defined benefit healthcare plan (“the Retiree Health Plan”). The plan provides healthcare insurance for eligible retirees and their spouses through the City’s group health insurance plan, which covers both active and retired members. Benefit provisions are established through negotiations between the City and the union representing employees and are renegotiated each three-year bargaining period. The component unit is included in the City’s plan. The Retiree Health Plan does not issue a publicly available financial report. At December 31, 2018, the following employees were covered by the benefit terms: Active Plan Members 86
B. Funding Policy.
Contribution requirements also are negotiated between the City and union representatives. The City does not contribute to the cost of current-year premiums for eligible retired plan members and their spouses. For fiscal year 2018, the City contributed $24,109 to the plan. C. Actuarial Methods and Assumptions
The City’s total OPEB liability of $530,757 was measured as of December 31, 2018, and the total OPEB liability used to calculate the total OPEB liability was determined by an actuarial valuation as of January 1, 2018. Roll forward procedures were used to roll forward the total OPEB liability to the measurement date. The total OPEB liability in the January 1, 2018 actuarial valuation was determined using the following actuarial assumptions, applied to all periods included in the measurement, unless otherwise specified: Discount Rate 3.30%Expected Long-Term Investment Return 3.30%, net of investment expense20-Year Municpal Bond Yeild 3.30%Inflation Rate 2.50%Salary Increases 3.00%Medical Trend Rate 6.25% in 2018 grading to 5% over 5 years
The discount rate used to measure the total OPEB liability was 3.30 percent. Since the plan is not funded (has no Assets), the discount rate was developed by estimating the long term investment yield on the employer funds that will be used to pay benefits as they come due. The long-term inflation assumption has been chosen based on a review of historical changes in the Consumer Price Index (CPI.) Published projections of future inflation rates were also considered. The salary scale increases percentage has been determined based on the long-term inflation assumption plus any additional wage increase assumption in excess of inflation. The additional wage assumption is based on a review of increases in the taxable wage base comparted to inflation. Any additional information on expected salary increases provided by the City is also reflected in this assumption. The medical trend rates have been chosen based on a review of historical health care increase rates, projected health care increase rates, and projected health care expenditures as a percentage of GDP. The components of health care costs were considered when developing the aggregate set of trend rates.
93

City of Fairmont, Minnesota Notes to the Financial Statements
December 31, 2018 Note 6: Postemployment Benefits Other Than Pensions (Continued) D. Changes in the Total OPEB Liability
Total OPEBLiability
(a)
Balances at January 1, 2017 509,337$ Changes for the Year:
Service cost 28,185 Interest 17,344 Benefit payments (24,109)
Net Changes 21,420
Balances at December 31, 2018 530,757$
Since the prior measurement date, the following assumptions changed:
• The discount rate changed from 3.50 percent to 3.30 percent. E. Sensitivity of the Total OPEB Liability The following presents the total OPEB liability of the City, as well as what the City’s total OPEB liability would be if it were calculated using a discount rate that is 1-percentage point lower (2.30 percent) or 1-percentage-point higher (4.30 percent) than the current discount rate:
1 Percent 1 PercentDecrease (2.3%) Current (3.3%) Decrease (4.3%)
569,906$ 530,757$ 494,000$
The following presents the total OPEB liability of the City, as well as what the City’s total OPEB liability would be if it were calculated using a Healthcare Cost Trent Rates that is 1-percentage point lower (5.25 percent decreasing to 4.00 percent) or 1-percentage-point higher (7.25 percent increasing to 6.00 percent) than the current discount rate:
Healthcare Cost1 Percent Decrease Trend Rates 1 Percent Increase(5.25% decreasing (6.25% decreasing (7.25% decreasing
to 4%) to 5%) to 6%)
475,185$ 530,757$ 595,785$
94

City of Fairmont, Minnesota Notes to the Financial Statements
December 31, 2018
Note 6: Postemployment Benefits Other Than Pensions (Continued)
F. OPEB Expense and Deferred Outflows of Resources and Deferred Inflows of Resources Related to OPEB
For the year ended December 31, 2018, the City recognized negative OPEB expense of $10,357. At December 31, 2018, the City reported deferred outflows of resources and deferred inflows of resources related to OPEB from the following sources:
Deferred Outflows Deferred Inflowsof Resources of Resources
Contributions to OPEB Subsequentto the Measurement Date 31,777$ -$
Deferred outflows of resources totaling $31,777 related to pensions resulting from the City’s contributions to OPEB subsequent to the measurement date will be recognized as a reduction of the OPEB liability in the year ended December 31, 2019.
Note 7: Other Information
A. Risk Management
The City is exposed to various risks of loss related to torts; theft of, damage to and destruction of assets; errors and omissions; injuries to employees; and natural disasters for which the City carries insurance. The City obtains insurance through participation in the League of Minnesota Cities Insurance Trust (LMCIT) which is a risk sharing pool with approximately 800 other governmental units. The City pays an annual premium to LMCIT for its workers compensation and property and casualty insurance. The LMCIT is self-sustaining through member premiums and will reinsure for claims above a prescribed dollar amount for each insurance event. Settled claims have not exceeded this City's coverage in any of the past three fiscal years.
Liabilities are reported when it is probable that a loss has occurred and the amount of the loss can be reasonably estimated. Liabilities, if any, include an amount for claims that have been incurred but not reported (IBNRs). The City’s management is not aware of any incurred but not reported claims.
During fiscal year 1984, the City established a self-insurance fund for health and dental benefits to account for and finance its uninsured risks of loss. In 2009, the City changed its funding of this plan from a self-funded to a premium based plan through Blue Cross Blue Shield of Minnesota.
All funds of the City participate in the program and make payments to the Medical Self-insurance fund based on actuarial estimates of the amounts needed to pay prior and current-year claims and to establish a reserve for catastrophe losses. This fund has a net position of $213,229 at December 31, 2018. The claims liability of $5,307 reported in the fund at December 31, 2018 is based on the requirements of GASB Statement No. 10, which requires that a liability for claims be reported if information prior to the issuance of the financial statements indicates that it is probable that a liability has been incurred at the date of the financial statements and the amount of the loss can be reasonably estimated. Changes in the Medical Self-insurance fund’s claims liability amount in calendar 2018, 2017 and 2016 were:
Current YearJanuary 1 Claims and Current Year December 31
Claims Changes in Claim ClaimsYear Liability Estimates Payments Liability
2018 12,742$ 197,838$ (205,273)$ 5,307$ 2017 8,514 202,587 (198,359) 12,7422016 22,593 190,032 (204,111) 8,514
95
lmunguia_ABDO16C
Sticky Note
Marked set by lmunguia_ABDO16C
lmunguia_ABDO16C
Sticky Note
Marked set by lmunguia_ABDO16C

City of Fairmont, Minnesota Notes to the Financial Statements
December 31, 2018 Note 7: Other Information (Continued) During 1987, the City was unable to obtain worker’s compensation and general liability insurance at a cost it considered to be economically justifiable. In 1987, the City joined the League of Minnesota Cities Insurance Trust (LMCIT), a public entity risk pool currently operating as a common risk management and insurance program for member cities. The City pays an annual premium to LMCIT for its workers’ compensation and general liability and property insurance coverage. The Agreement for Formation of the LMCIT provides that LMCIT will be self-sustaining through member premiums. Annual claims in excess of $10,000 per event and $100,000 in the aggregate are covered through reinsurance. All funds of the City participate in the program and make payments to the Property, Equipment and Liability and Workers’ Compensation Self-insurance funds based on actuarial estimates of the amounts needed to pay prior and current year claims and to establish a reserve for future claims. Net position at December 31, 2018, was $710,856 and $397,919 for the Property, Equipment and Liability and Workers’ Compensation Self-insurance funds, respectively. The claims liabilities of $0 reported in the Property, Equipment and Liability and Worker’s Compensation funds at December 31, 2018, is based on the requirements of Governmental Accounting Standards Board Statement No. 10, which requires that a liability for claims be reported if information prior to the issuance of the financial statements indicates that it is probable that a liability has been incurred at the date of the financial statements and the amount of the loss can be reasonably estimated. Changes in the Property, Equipment and Liability fund’s claims liability amount in calendar 2018, 2017 and 2016 were:
Current YearJanuary 1 Claims and Current Year December 31
Claims Changes in Claim ClaimsYear Liability Estimates Payments Liability
2018 6,451$ 15,205$ (21,656)$ -$ 2017 - 23,456 (17,005) 6,451 2016 - 3,618 (3,618) -
B. Contingent Liabilities Amounts received or receivable from grant agencies are subject to audit and adjustment by grantor agencies, principally the federal government. Any disallowed claims, including amounts already collected, may constitute a liability of the applicable funds. The amount, if any, of expenditures which may be disallowed by the grantor cannot be determined at this time although the City expects such amounts, if any, to be immaterial. The City’s tax increment districts are subject to review by the State of Minnesota Office of the State Auditor (OSA). Any disallowed claims or misuse of tax increments could become a liability of the applicable fund. Management has indicated that they are not aware of any instances of noncompliance which would have a material effect on the financial statements. The City is a defendant in various lawsuits. Although the outcome of these lawsuits is not presently determinable, it is the opinion of the City’s counsel that resolution of these matters will not have a material adverse effect on the financial condition of the City. The EDA has a limited debt service guarantee with the Housing and Redevelopment Authority (HRA). The guarantee limit is $50,000 and is solely for the purpose of paying the debt service on the HRA’s $575,000 Essential Function Housing Development Revenue Bond of 2001. If there are ever insufficient funds available in the HRA’s debt service account to pay the principal and interest on the bond, the EDA is obligated to make such debt service payments up to an aggregate limit of $50,000.
96
lmunguia_ABDO16C
Sticky Note
Marked set by lmunguia_ABDO16C

City of Fairmont, Minnesota Notes to the Financial Statements
December 31, 2018 Note 7: Other Information (Continued) C. Commitments Power Purchase Commitment - Southern Minnesota Municipal Power Agency (SMMPA) is a municipal corporation of which the City of Fairmont is one of eighteen member municipalities, each of which owns and operates an electric distribution system. In 1981, the City entered into an agreement with SMMPA to purchase power from SMMPA until April 1, 2030, and in 2009 the City voted to extend the purchase power contract an additional 20 years, until April 1, 2050. The price of energy purchased is based upon the amount required to produce revenue necessary for SMMPA to meet all operating costs and debt commitments, and to maintain reasonable reserves. D. Concentrations The City receives a significant amount of its annual General fund revenues from the State of Minnesota from the Local Government Aid (LGA) program. The amount received in 2018 was $3,459,265. This accounted for 42 percent of General fund revenues. Note 8: Tax Abatements
As of December 31, 2018, the City has seven agreements entered into by the City listed below that abate City property taxes. Below is information specific to each agreement: The City entered into a tax abatement agreement on September 1, 2016 with a business in which the business incurred costs for the renovation of an existing building to accommodate the manufacturing of industrial custom fabricated products. In return, the City will reimburse the business for some costs as the City collects future increment for the increased property value and tax capacity related to the economic development. The agreement has a maximum return to the developer of $231,000 over the life of the agreement. The agreement was negotiated under state law (Minnesota Statute 469.1812-469.1816) and has a maximum duration of February 1, 2027. The calculation of taxes abated during the fiscal year is noted in the chart below. The City entered into a tax increment financing agreement (TIF #22) on August 22, 2011 with a developer in which the developer demolished an existing substandard building and the acquisition, construction and equipping of an approximately 10,000 square foot banking facility. In return, the City will reimburse the developer for some costs as the City collects future tax increment for the increased property value and tax capacity related to the redevelopment. The pay-as-you-go agreement has a maximum return to the developer of $591,884 over the life of the agreement. The agreement was negotiated under state law (Minnesota Statute 469.174-469.1799) and has a maximum duration of December 31, 2038. The calculation of taxes abated during the fiscal year is noted in the chart below. The City entered into a tax increment financing agreement (TIF #23) on September 24, 2012 with a developer in which the developer incurs costs for the construction of an approximate 15,000 square foot facility for the expansion of an existing business currently within the City. In return, the City will reimburse the developer for some costs as the City collects future tax increment for the increased property value and tax capacity related to the economic development. The pay-as-you-go agreement has a maximum return to the developer of $225,134 over the life of the agreement. The agreement was negotiated under state law (Minnesota Statute 469.174-469.1799) and has a maximum duration of December 31, 2022. The calculation of taxes abated during the fiscal year is noted in the chart below. The City entered into a tax increment financing agreement (TIF #24) on February 23, 2015 with a developer in which the developer incurs costs for the construction of retail and office complex consisting of two buildings, one approximately 2,364 square feet and the other approximately 5,468 square feet. In return, the City will reimburse the developer for some costs as the City collects future tax increment for the increased property value and tax capacity related to the economic development. The pay-as-you-go agreement has a maximum return to the developer of $154,560 over the life of the agreement. The agreement was negotiated under state law (Minnesota Statute 469.174-469.1794) and has a maximum duration of December 31, 2028. The calculation of taxes abated during the fiscal year is noted in the chart below.
97

City of Fairmont, Minnesota Notes to the Financial Statements
December 31, 2018
Note 8: Tax Abatements (Continued) The City entered into a tax increment financing agreement (TIF #25) on April 27, 2015 with a developer in which the developer demolished an existing substandard building and the acquisition, construction and equipping of an approximately 12,000 square foot office building. In return, the City will reimburse the developer for some costs as the City collects future tax increment for the increased property value and tax capacity related to the economic development. The pay-as-you-go agreement has a maximum return to the developer of $290,798 over the life of the agreement. The agreement was negotiated under state law (Minnesota Statute 469.174-469.1794) and has a maximum duration of December 31, 2025. The calculation of taxes abated during the fiscal year is noted in the chart below. The City entered into a tax increment financing agreement (TIF #26) on July 27, 2015 with a developer in which the developer incurred costs to construct a 14,000-15,000 square foot expansion to an existing assisted living facility to add approximately 20 new housing units. In return, the City will reimburse the developer for some costs as the City collects future tax increment for the increased property value and tax capacity related to the housing development. The pay-as-you-go agreement has a maximum return to the developer of $198,641 over the life of the agreement. The agreement was negotiated under state law (Minnesota Statute 469.174-469.1794) and has a maximum duration of December 31, 2025. The calculation of taxes abated during the fiscal year is noted in the chart below.
The City entered into a tax increment financing agreement (TIF #27) on August 22, 2016 with a developer in which the developer incurred costs to demolish an existing substandard building and the acquisition, construction and equipping a multifamily rental housing project consisting of one four plex with three bedrooms per unit and one three plex unit with three bedrooms per unit. In return, the City will reimburse the developer for some costs as the City collects future tax increment for the increased property value and tax capacity related to the housing development. The pay-as-you-go agreement has a maximum return to the developer of $121,330 over the life of the agreement. The agreement was negotiated under state law (Minnesota Statute 469.174-469.1794) and has a maximum duration of December 31, 2044. The calculation of taxes abated during the fiscal year is noted in the chart below. Lost revenue as it relates to tax abatements for the year ended December 31, 2018 was as follows:
City Tax Amount of
Rate (Year of District Tax taxes abated Establishment) Capacity the fiscal year
Tax Abatement AgreementsZierke Built Manufacturing, Inc. 10,476$
Tax Increment Districts (PAYGO)TIF District #22 42.272% 48,074$ 20,322 TIF District #23 49.454% 21,034 10,402 TIF District #24 46.113% 11,112 5,124 TIF District #25 46.113% 31,640 14,590 TIF District #26 46.165% 10,981 5,069
Total 65,983$
98
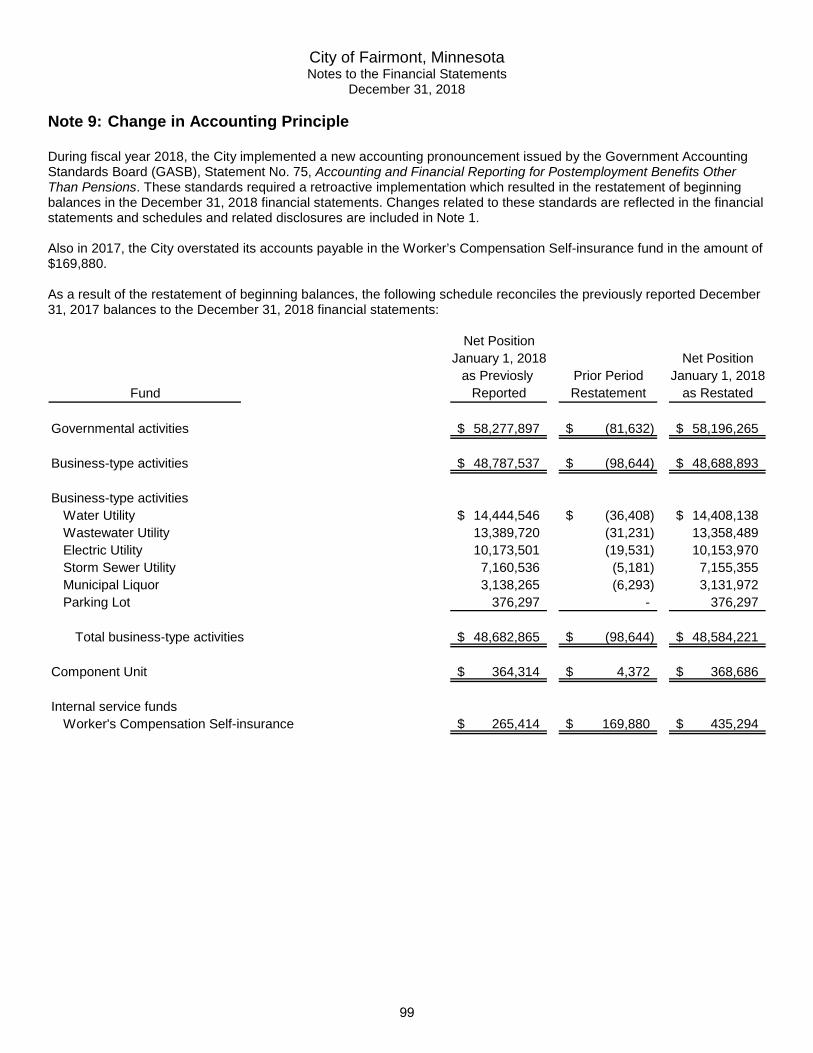
City of Fairmont, Minnesota Notes to the Financial Statements
December 31, 2018 Note 9: Change in Accounting Principle During fiscal year 2018, the City implemented a new accounting pronouncement issued by the Government Accounting Standards Board (GASB), Statement No. 75, Accounting and Financial Reporting for Postemployment Benefits Other Than Pensions. These standards required a retroactive implementation which resulted in the restatement of beginning balances in the December 31, 2018 financial statements. Changes related to these standards are reflected in the financial statements and schedules and related disclosures are included in Note 1. Also in 2017, the City overstated its accounts payable in the Worker’s Compensation Self-insurance fund in the amount of $169,880. As a result of the restatement of beginning balances, the following schedule reconciles the previously reported December 31, 2017 balances to the December 31, 2018 financial statements:
Net PositionJanuary 1, 2018 Net Position
as Previosly Prior Period January 1, 2018Reported Restatement as Restated
Governmental activities 58,277,897$ (81,632)$ 58,196,265$
Business-type activities 48,787,537$ (98,644)$ 48,688,893$
Business-type activitiesWater Utility 14,444,546$ (36,408)$ 14,408,138$ Wastewater Utility 13,389,720 (31,231) 13,358,489 Electric Utility 10,173,501 (19,531) 10,153,970 Storm Sewer Utility 7,160,536 (5,181) 7,155,355 Municipal Liquor 3,138,265 (6,293) 3,131,972 Parking Lot 376,297 - 376,297
Total business-type activities 48,682,865$ (98,644)$ 48,584,221$
Component Unit 364,314$ 4,372$ 368,686$
Internal service fundsWorker's Compensation Self-insurance 265,414$ 169,880$ 435,294$
Fund
99

THIS PAGE IS LEFT
BLANK INTENTIONALLY
100

REQUIRED SUPPLEMENTARY INFORMATION
CITY OF FAIRMONT
FAIRMONT, MINNESOTA
FOR THE YEAR ENDED DECEMBER 31, 2018
101

THIS PAGE IS LEFT
BLANK INTENTIONALLY
102

City of Fairmont, Minnesota Required Supplementary Information
For the Year Ended December 31, 2018 Schedule of Employer’s Share of PERA Net Pension Liability - General Employees Retirement Fund
State'sProportionate
City's Share ofProportionate the Net Pension
Share of Liability City'sFiscal the Net Pension Associated with CoveredYear Liability the City Total Payroll
Ending (a) (b) (a+b) (c)
06/30/18 0.0735 % 4,077,479$ 133,729$ 4,211,208$ 4,941,671$ 85.2 % 79.5 %06/30/17 0.0737 4,704,959 59,134 4,764,093 4,745,755 99.1 75.9 06/30/16 0.0763 6,195,182 80,915 6,276,097 4,732,291 130.9 68.9 06/30/15 0.0748 3,876,524 - 3,876,524 4,401,419 88.1 78.2
Liability as a Plan Fiduciary
City'sProportionateShare of theNet Pension
City's Percentage of Net PositionProportion of Covered as a Percentage
the Net Pension Payroll of the TotalLiability ((a+b)/c) Pension Liability
Note: Schedule is intended to show 10-year trend. Additional years will be reported as they become available. Schedule of Employer’s PERA Contributions - General Employees Retirement Fund
Contributions inRelation to the
Statutorily Statutorily Contribution City'sRequired Required Deficiency Covered
Year Contribution Contribution (Excess) PayrollEnding (a) (b) (a-b) (c)
12/31/18 379,487$ 379,487$ -$ 5,059,831$ 7.5 %12/31/17 362,456 362,456 - 4,832,746 7.5 12/31/16 346,231 346,231 - 4,616,416 7.5 12/31/15 341,038 341,038 - 4,547,173 7.5
(b/c)
Contributions asa Percentage of
PayrollCovered
Note: Schedule is intended to show 10-year trend. Additional years will be reported as they become available.
103
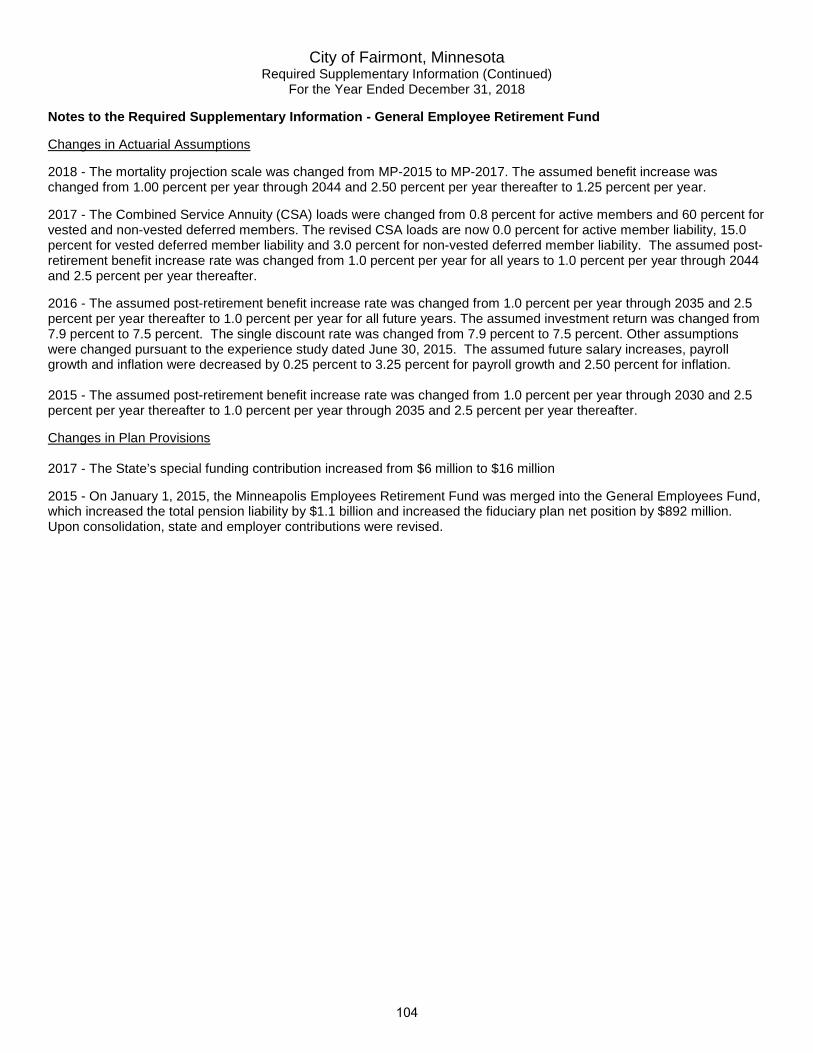
City of Fairmont, Minnesota Required Supplementary Information (Continued)
For the Year Ended December 31, 2018 Notes to the Required Supplementary Information - General Employee Retirement Fund Changes in Actuarial Assumptions 2018 - The mortality projection scale was changed from MP-2015 to MP-2017. The assumed benefit increase was changed from 1.00 percent per year through 2044 and 2.50 percent per year thereafter to 1.25 percent per year. 2017 - The Combined Service Annuity (CSA) loads were changed from 0.8 percent for active members and 60 percent for vested and non-vested deferred members. The revised CSA loads are now 0.0 percent for active member liability, 15.0 percent for vested deferred member liability and 3.0 percent for non-vested deferred member liability. The assumed post-retirement benefit increase rate was changed from 1.0 percent per year for all years to 1.0 percent per year through 2044 and 2.5 percent per year thereafter. 2016 - The assumed post-retirement benefit increase rate was changed from 1.0 percent per year through 2035 and 2.5 percent per year thereafter to 1.0 percent per year for all future years. The assumed investment return was changed from 7.9 percent to 7.5 percent. The single discount rate was changed from 7.9 percent to 7.5 percent. Other assumptions were changed pursuant to the experience study dated June 30, 2015. The assumed future salary increases, payroll growth and inflation were decreased by 0.25 percent to 3.25 percent for payroll growth and 2.50 percent for inflation. 2015 - The assumed post-retirement benefit increase rate was changed from 1.0 percent per year through 2030 and 2.5 percent per year thereafter to 1.0 percent per year through 2035 and 2.5 percent per year thereafter. Changes in Plan Provisions 2017 - The State’s special funding contribution increased from $6 million to $16 million 2015 - On January 1, 2015, the Minneapolis Employees Retirement Fund was merged into the General Employees Fund, which increased the total pension liability by $1.1 billion and increased the fiduciary plan net position by $892 million. Upon consolidation, state and employer contributions were revised.
104
lmunguia_ABDO16C
Sticky Note
Marked set by lmunguia_ABDO16C

City of Fairmont, Minnesota Required Supplementary Information (Continued)
For the Year Ended December 31, 2018 Schedule of Employer’s Share of PERA Net Pension Liability - Public Employees Police and Fire Fund
State'sProportionate
City's Share ofProportionate the Net Pension
Share of Liability City'sFiscal the Net Pension Associated with CoveredYear Liability the City Total Payroll
Ending (a) (b) (a+b) (c)
06/30/18 0.1402 % 1,494,388$ -$ 1,494,388$ 1,477,441$ 101.1 % 88.8 %06/30/17 0.1220 1,647,145 - 1,647,145 1,256,120 131.1 85.4 06/30/16 0.1350 5,417,785 - 5,417,785 1,297,817 417.5 63.9 06/30/15 0.1320 1,499,829 - 1,499,829 1,210,129 123.9 86.6
the Net Pension Payroll of the TotalLiability ((a+b)/c) Pension Liability
City's Percentage of Net PositionProportion of Covered as a Percentage
Liability as a Plan Fiduciary
City'sProportionateShare of theNet Pension
Note: Schedule is intended to show 10-year trend. Additional years will be reported as they become available. Schedule of Employer’s PERA Contributions - Public Employees Police and Fire Fund
Contributions inRelation to the
Statutorily Statutorily Contribution City'sRequired Required Deficiency Covered
Year Contribution Contribution (Excess) PayrollEnding (a) (b) (a-b) (c)
12/31/18 240,033$ 240,033$ -$ 1,481,682$ 16.2 %12/31/17 219,305 219,305 - 1,353,736 16.2 12/31/16 203,906 203,906 - 1,258,681 16.2 12/31/15 199,315 199,315 - 1,230,340 16.2
(b/c)
Contributions asa Percentage of
PayrollCovered
Note: Schedule is intended to show 10-year trend. Additional years will be reported as they become available.
105

City of Fairmont, Minnesota Required Supplementary Information (Continued)
For the Year Ended December 31, 2018
Notes to the Required Supplementary Information - Public Employees Police and Fire Fund Changes in Actuarial Assumptions 2018 - The mortality projection scale was changed from MP-2016 to MP-2017. As set by statute, the assumed post-retirement benefit increase was changed from 1.0 percent per year through 2064 and 2.5 percent per year, thereafter, to 1.0 percent for all years, with no trigger. 2017 - Assumed salary increases were changed as recommended in the June 30, 2016 experience study. The net effect is proposed rates that average 0.34 percent lower than the previous rates. Assumed rates of retirement were changed, resulting in fewer retirements. The Combined Service Annuity (CSA) load was 30 percent for vested and non-vested deferred members. The CSA has been changed to 33 percent for vested members and 2 percent for non-vested members. The base mortality table for healthy annuitants was changed from the RP-2000 fully generational table to the RP-2014 fully generational table (with a base year of 2006), with male rates adjusted by a factor of 0.96. The mortality improvement scale was changed from Scale AA to Scale MP-2016. The base mortality table for disabled annuitants was changed from the RP-2000 disabled mortality table to the mortality tables assumed for healthy retirees. Assumed termination rates were decreased to 3.0 percent for the first three years of service. Rates beyond the select period of three years were adjusted, resulting in more expected terminations overall. Assumed percentage of married female members was decreased from 65 percent to 60 percent. Assumed age difference was changed from separate assumptions for male members (wives assumed to be three years younger) and female members (husbands assumed to be four years older) to the assumption that males are two years older than females. The assumed percentage of female members electing joint and survivor annuities was increased. The assumed post-retirement benefit increase rate was changed from 1.00 percent for all years to 1.00 percent per year through 2064 and 2.50 percent thereafter. The single discount rate was changed from 5.6 percent to 7.5 percent. 2016 - The assumed post-retirement benefit increase rate was changed from 1.0 percent per year through 2037 and 2.5 percent per year thereafter to 1.0 percent per year for all future years. The assumed investment return was changed from 7.9 percent to 7.5 percent. The single discount rate was changed from 7.9 percent to 5.6 percent. The assumed future salary increases, payroll growth and inflation were decreased by 0.25 percent to 3.25 percent for payroll growth and 2.50 percent for inflation. 2015 - The assumed post-retirement benefit increase rate was changed from 1.0 percent per year through 2030 and 2.5 percent per year thereafter to 1.0 percent per year through 2037 and 2.5 percent per year thereafter. Changes in Plan Provisions 2015 - The post-retirement benefit increase to be paid after attainment of the 90 percent funding threshold was changed, from inflation up to 2.5 percent, to a fixed rate of 2.5 percent.
106
lmunguia_ABDO16C
Sticky Note
Marked set by lmunguia_ABDO16C

City of Fairmont, Minnesota Required Supplementary Information (Continued)
For the Year Ended December 31, 2018 Schedule of Changes in the Fire Relief Association’s Net Pension Liability and Related Ratios
2018 2017 2016 2015(Fire Relief Report (Fire Relief Report (Fire Relief Report (Fire Relief Report
Date 2017) Date 2016) Date 2015) Date 2014)Total Pension Liability
Service cost 56,261$ 53,182$ 47,679$ 46,403$ Interest 100,750 112,051 106,331 104,175 Differences between expected and actual experience (77,198) - (73,104) - Changes of assumptions 26,484 12,042 (42,248) - Benefit payments, including refunds of employee contributions (312,223) (272,190) (66,890) (161,823)
Net Change in Total Pension Liability (205,926) (94,915) (28,232) (11,245)
Total Pension Liability - January 1 1,711,855 1,806,770 1,835,002 1,846,247
Total Pension Liability (A) 1,505,929$ 1,711,855$ 1,806,770$ 1,835,002$
Plan Fiduciary Net PositionContributions - employer 131,968$ 127,341$ 143,804$ 171,691$ Contributions - employee 17,420 16,800 15,320 13,760 Net investment income 149,581 99,916 (24,723) 52,082 Benefit payments, including refunds of employee contributions (312,223) (272,190) (66,890) (161,823) Administrative expense (12,899) (13,915) (13,568) (17,227)
Net Change in Plan Fiduciary Net Position (26,153) (42,048) 53,943 58,483
Plan Fiduciary Net Position - January 1 1,520,748 1,562,796 1,508,853 1,450,370
Plan Fiduciary Net Position (B) 1,494,595$ 1,520,748$ 1,562,796$ 1,508,853$
Fire Relief's Net Pension Liability (Asset) - December 31 (A-B) 11,334$ 191,107$ 243,974$ 326,149$
Plan Fiduciary Net Position as a Percentage of the Total Pension Liability (B/A) 99.25% 88.84% 86.50% 82.23%
Covered Payroll N/A N/A N/A N/A
Fire Relief's Net Pension Liability (Asset) as a Percentageof Covered Payroll N/A N/A N/A N/A
Notes to Schedule: Benefit Changes. No Changes in 2018.Changes of Assumptions. The expected investment return and discount rate decreased from 6.25% to 6.00% to reflect updated capital market assumptions. The mortality and withdrawal assumptions were updated from the rates used in the July 1, 2016 Minnesota PERA Police & Fire Plan actuarial valuation to the rates used in the July 1, 2017 Minnestoa PERA Police & Fire Plan actuarial valuation.This schedule is presented to illustrate the requirement to show information for 10 years. However, until a full 10-year trend is compiled, governments should present information for those years for which information is available.
107
lmunguia_ABDO16C
Sticky Note
Marked set by lmunguia_ABDO16C

City of Fairmont, Minnesota Required Supplementary Information (Continued)
For the Year Ended December 31, 2018
Schedule of Employer’s Fire Relief Association Contributions
Actuarial Actual ContributionDetermined Contributions Deficiency
Year Contribution Paid (Excess)Ending (a) (b) (a-b)
12/31/18 -$ * -$ * -$ 12/31/17 151,431 149,388 * 2,043 12/31/16 151,431 144,141 7,290 12/31/15 134,935 152,186 (17,251) 12/31/14 153,574 192,239 (38,665)
* Information not available at the time of the audit.
Schedule of Changes in the City’s Total OPEB Liability and Related Ratios
2018Total OPEB liability
Service cost 28,185$ Interest 17,344 Benefit payments (24,109)
Net change in total OPEB liability 21,420
Total OPEB liability - beginning 509,337
Total OPEB liability - ending $ 530,757
Covered payroll 5,741,610$
City's total OPEB liability as a percentage of covered payroll 9.24 %
Benefit changes:No benefit changes in 2018.
Changes in assumptions:In 2018, the following assumptions changes:
The discount rate was changed from 3.50% to 3.30%.
Note: Schedule is intended to show 10-year trend. Additional years will be reported as they become available.
108
lmunguia_ABDO16C
Sticky Note
Marked set by lmunguia_ABDO16C

C
ombining and Individual Fund
Statements and Schedules

COMBINING AND INDIVIDUAL FUND FINANCIAL STATEMENTS AND SCHEDULES
CITY OF FAIRMONT
FAIRMONT, MINNESOTA
FOR THE YEAR ENDED DECEMBER 31, 2018
109

THIS PAGE IS LEFT
BLANK INTENTIONALLY
110

City of Fairmont, MinnesotaCombining Balance Sheet
Nonmajor Governmental FundsDecember 31, 2018
TotalNonmajor Nonmajor NonmajorSpecial Capital Governmental
Revenue Projects FundsAssets
Cash and temporary investments 2,253,167$ 2,993,367$ 5,246,534$ Receivables
Delinquent taxes 1,622 - 1,622 Accounts 12,179 - 12,179 Loans 1,242,383 - 1,242,383 Intergovernmental 285,351 201,344 486,695
Due from other funds 29,000 - 29,000 Land held for resale - 120,000 120,000
Total Assets 3,823,702$ 3,314,711$ 7,138,413$
LiabilitiesAccounts and contracts payable 117,669$ 213,689$ 331,358$ Due to other funds 29,971 - 29,971 Due to other governments 224,697 120,000 344,697 Accrued wages payable 2,601 - 2,601 Unearned revenue 70,579 - 70,579
Total Liabilities 445,517 333,689 779,206
Deferred Inflows of ResourcesUnavailable revenue - taxes 1,622 - 1,622
Fund BalancesRestricted 2,471,966 2,381,787 4,853,753 Committed 402,533 776,953 1,179,486 Assigned 502,064 - 502,064 Unassigned - (177,718) (177,718)
Total Fund Balances 3,376,563 2,981,022 6,357,585
Total Liabilities, Deferred Inflows of Resources and Fund Balances 3,823,702$ 3,314,711$ 7,138,413$
111

City of Fairmont, MinnesotaCombining Statement of Revenues, Expenditures
and Changes in Fund Balances Nonmajor Governmental Funds
For the Year Ended December 31, 2018
TotalNonmajor Nonmajor NonmajorSpecial Capital Governmental
Revenue Projects FundsRevenues
Taxes 814,957$ -$ 814,957$ Intergovernmental 397,923 881,166 1,279,089 Charges for services 468,671 - 468,671 Investment earnings 31,970 50,044 82,014 Miscellaneous 89,226 170,000 259,226
Total Revenues 1,802,747 1,101,210 2,903,957
ExpendituresCurrent
Culture and recreation 15,543 - 15,543 Housing and economic development 118,293 8,158 126,451 Miscellaneous 543,120 - 543,120
Capital outlay Streets and highways - 1,225,791 1,225,791 Miscellaneous 45,649 92,132 137,781
Total Expenditures 722,605 1,326,081 2,048,686
Excess (Deficiency) of Revenues Over (Under) Expenditures 1,080,142 (224,871) 855,271
Other Financing Sources (Uses)Transfers in 40,000 958,140 998,140 Transfers out (129,085) (298,585) (427,670)
Total Other Financing Sources (Uses) (89,085) 659,555 570,470
Net Change in Fund Balances 991,057 434,684 1,425,741
Fund Balances, January 1 2,385,506 2,546,338 4,931,844
Fund Balances, December 31 3,376,563$ 2,981,022$ 6,357,585$
112

Nonmajor Special Revenue Funds
Special revenue funds are used to account for revenues derived from specific taxes or
other earmarked revenue sources. They are usually required by statute, charter
provision, or local ordinance to finance particular functions or activities of government.
Central College Incubator: This fund accounts for the activities relating to the
operations of the Southern Minnesota Education Campus building.
Wetland Bank: This fund accounts for the management of wetland credits owned
by the City.
Revolving Loan: This fund accounts for Federal and State grants received by the
City which are loaned for economic development purposes under the guidelines
established by the Fairmont Economic Development Authority.
Revolving Loan 2: This fund accounts for Federal and State grants received by the
City which are loaned for economic development purposes under the guidelines
established by the Fairmont Economic Development Authority.
Micro Loan: This fund is used to make small business micro loans up to $10,000
for building signage, facade improvements and equipment purchases.
State Housing Grant II, III, 2011 and 2016: These funds account for Small Cities
Development Program Federal Grants used to improve housing for low income
citizens within the City.
Aeronautics: This fund accounts for the administrative and maintenance costs of
operating the Fairmont municipal airport.
Lake Restoration: This fund accounts for the City's ongoing lake dredging
program.
Local Option Sales Tax: This fund accounts for the City's local sales tax revenue.
113

THIS PAGE IS LEFT
BLANK INTENTIONALLY
114

THIS PAGE IS LEFT
BLANK INTENTIONALLY
115

City of Fairmont, MinnesotaNonmajor Special Revenue Funds
Combining Balance SheetDecember 31, 2018
212 214 215 216 217Central College Wetland Revolving Revolving Micro
Incubator Bank Loan Loan 2 LoanAssets
Cash and temporary investments 40,005$ 72,973$ 263,405$ 481,441$ 21,937$ Receivables
Delinquent taxes - - - - - Accounts 4,084 - - - - Loans - - 343,244 557,091 4,775 Intergovernmental - - - - -
Due from other funds - - - 29,000 -
Total Assets 44,089$ 72,973$ 606,649$ 1,067,532$ 26,712$
LiabilitiesAccounts and contracts payable 5,134$ -$ 268$ -$ -$ Due to other funds - - - - - Due to other governments - - - 224,697 - Accrued wages payable - - - - - Unearned revenue - - - 70,579 -
Total Liabilities 5,134 - 268 295,276 -
Deferred Inflows of ResourcesUnavailable revenue - property taxes - - - - -
Fund Balances Restricted - - 606,381 772,256 - Committed 2,007 - - - - Assigned 36,948 72,973 - - 26,712
Total Fund Balances 38,955 72,973 606,381 772,256 26,712
Total Liabilities, Deferred Inflows ofResources and Fund Balances 44,089$ 72,973$ 606,649$ 1,067,532$ 26,712$
116

222 224 226 228 230 240 250 TotalState State State State Local Nonmajor
Housing Housing Housing Housing Lake Option SpecialGrant II Grant III Grant 2011 Grant 2016 Aeronautics Restoration Sales Tax Revenue
835$ 1,661$ 2,497$ 686$ 346,440$ 394,899$ 626,388$ 2,253,167$
- - - - 1,622 - - 1,622 - - - - 965 7,130 - 12,179 - 11,169 10,162 315,942 - - - 1,242,383 - - - 125,410 26,247 - 133,694 285,351 - - - - - - - 29,000
835$ 12,830$ 12,659$ 442,038$ 375,274$ 402,029$ 760,082$ 3,823,702$
-$ -$ -$ 106,115$ 4,649$ 1,503$ -$ 117,669$ - - - 29,000 971 - - 29,971 - - - - - - - 224,697 - - - - 2,601 - - 2,601 - - - - - - - 70,579 - - - 135,115 8,221 1,503 - 445,517
- - - - 1,622 - - 1,622
835 12,830 12,659 306,923 - - 760,082 2,471,966 - - - - - 400,526 - 402,533 - - - - 365,431 - - 502,064
835 12,830 12,659 306,923 365,431 400,526 760,082 3,376,563
835$ 12,830$ 12,659$ 442,038$ 375,274$ 402,029$ 760,082$ 3,823,702$
117
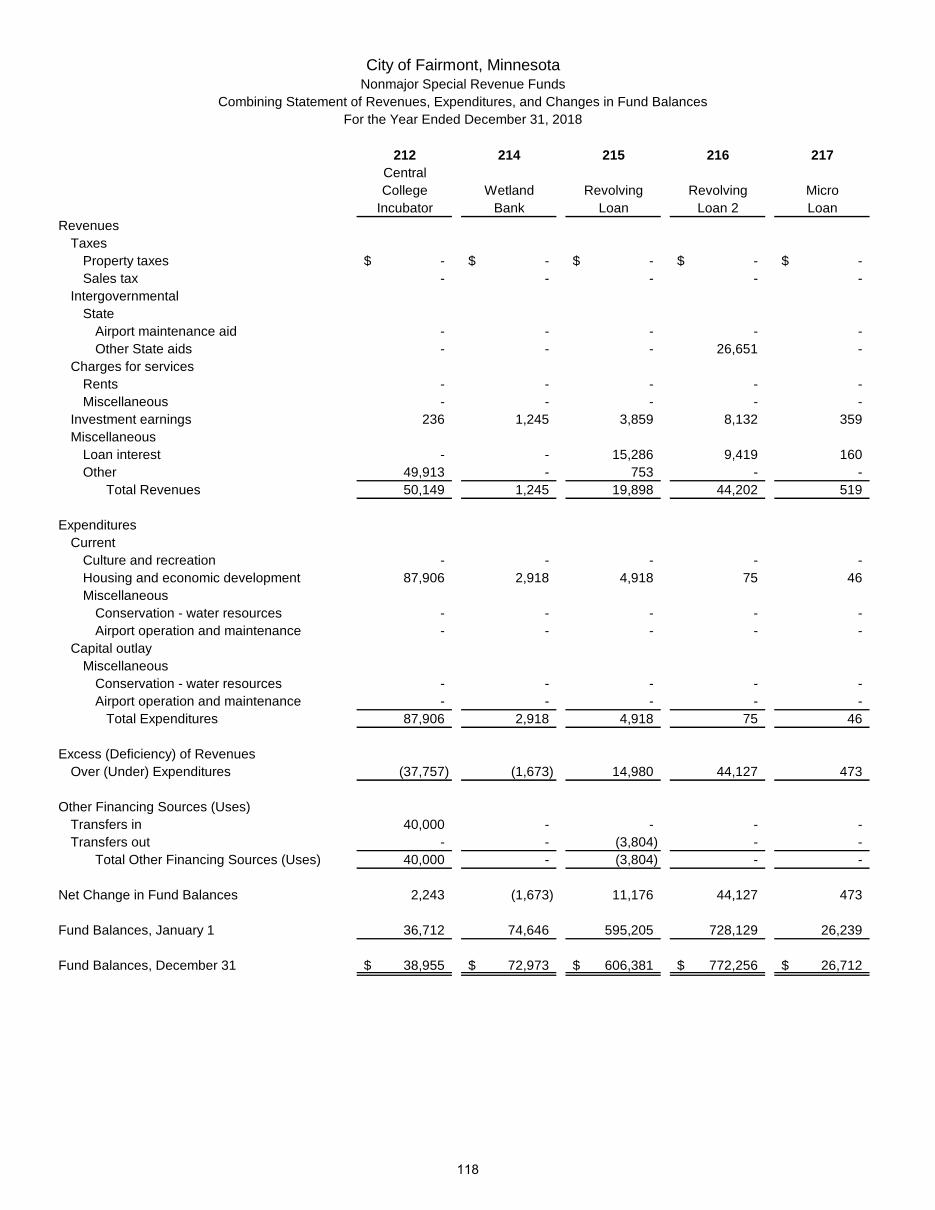
212 214 215 216 217Central College Wetland Revolving Revolving Micro
Incubator Bank Loan Loan 2 LoanRevenues
TaxesProperty taxes -$ -$ -$ -$ -$ Sales tax - - - - -
IntergovernmentalState
Airport maintenance aid - - - - - Other State aids - - - 26,651 -
Charges for servicesRents - - - - - Miscellaneous - - - - -
Investment earnings 236 1,245 3,859 8,132 359 Miscellaneous
Loan interest - - 15,286 9,419 160 Other 49,913 - 753 - -
Total Revenues 50,149 1,245 19,898 44,202 519
ExpendituresCurrent
Culture and recreation - - - - - Housing and economic development 87,906 2,918 4,918 75 46 Miscellaneous
Conservation - water resources - - - - - Airport operation and maintenance - - - - -
Capital outlayMiscellaneous
Conservation - water resources - - - - - Airport operation and maintenance - - - - - Total Expenditures 87,906 2,918 4,918 75 46
Excess (Deficiency) of Revenues Over (Under) Expenditures (37,757) (1,673) 14,980 44,127 473
Other Financing Sources (Uses)Transfers in 40,000 - - - - Transfers out - - (3,804) - -
Total Other Financing Sources (Uses) 40,000 - (3,804) - -
Net Change in Fund Balances 2,243 (1,673) 11,176 44,127 473
Fund Balances, January 1 36,712 74,646 595,205 728,129 26,239
Fund Balances, December 31 38,955$ 72,973$ 606,381$ 772,256$ 26,712$
City of Fairmont, MinnesotaNonmajor Special Revenue Funds
Combining Statement of Revenues, Expenditures, and Changes in Fund BalancesFor the Year Ended December 31, 2018
118

222 224 226 228 230 240 250 TotalState State State State Local Nonmajor
Housing Housing Housing Housing Lake Option SpecialGrant II Grant III Grant 2011 Grant 2016 Aeronautics Restoration Sales Tax Revenue
-$ -$ -$ -$ 74,486$ -$ -$ 74,486$ - - - - - - 740,471 740,471
- - - - 97,275 - - 97,275 - - - 273,997 - - - 300,648
- - - - 128,334 - - 128,334 - - - - 275,487 64,850 - 340,337 7 16 36 547 5,579 6,196 5,758 31,970
- 48 - 12,101 - - - 37,014 - - - - 1,546 - - 52,212 7 64 36 286,645 582,707 71,046 746,229 1,802,747
- - - - - - 15,543 15,543 646 4,349 17,418 17 - - - 118,293
- - - - - 10,507 - 10,507 - - - - 532,613 - - 532,613
- - - - - 1,400 - 1,400 - - - - 44,249 - - 44,249
646 4,349 17,418 17 576,862 11,907 15,543 722,605
(639) (4,285) (17,382) 286,628 5,845 59,139 730,686 1,080,142
- - - - - - - 40,000 - - - - - - (125,281) (129,085) - - - - - - (125,281) (89,085)
(639) (4,285) (17,382) 286,628 5,845 59,139 605,405 991,057
1,474 17,115 30,041 20,295 359,586 341,387 154,677 2,385,506
835$ 12,830$ 12,659$ 306,923$ 365,431$ 400,526$ 760,082$ 3,376,563$
119
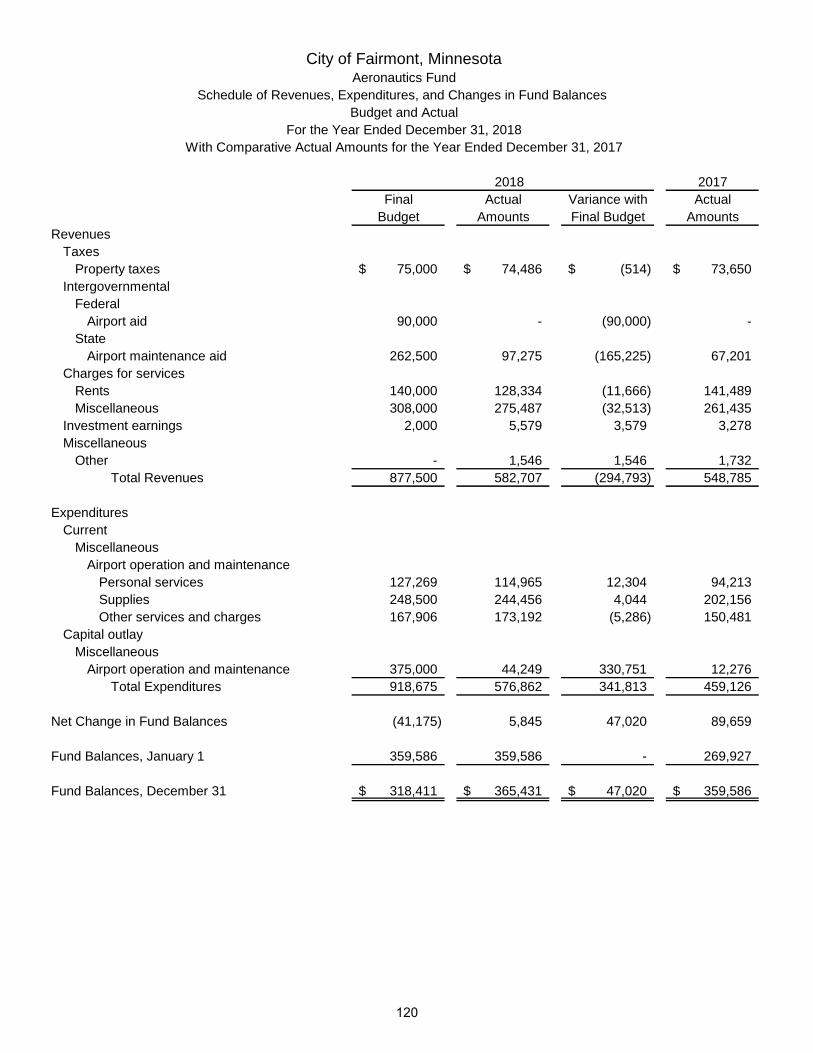
City of Fairmont, MinnesotaAeronautics Fund
Schedule of Revenues, Expenditures, and Changes in Fund Balances Budget and Actual
For the Year Ended December 31, 2018With Comparative Actual Amounts for the Year Ended December 31, 2017
2018 2017Final Actual Variance with Actual
Budget Amounts Final Budget AmountsRevenues
TaxesProperty taxes 75,000$ 74,486$ (514)$ 73,650$
Intergovernmental Federal
Airport aid 90,000 - (90,000) - State
Airport maintenance aid 262,500 97,275 (165,225) 67,201 Charges for services
Rents 140,000 128,334 (11,666) 141,489 Miscellaneous 308,000 275,487 (32,513) 261,435
Investment earnings 2,000 5,579 3,579 3,278 Miscellaneous
Other - 1,546 1,546 1,732 Total Revenues 877,500 582,707 (294,793) 548,785
ExpendituresCurrent
Miscellaneous Airport operation and maintenance
Personal services 127,269 114,965 12,304 94,213 Supplies 248,500 244,456 4,044 202,156 Other services and charges 167,906 173,192 (5,286) 150,481
Capital outlayMiscellaneous
Airport operation and maintenance 375,000 44,249 330,751 12,276 Total Expenditures 918,675 576,862 341,813 459,126
Net Change in Fund Balances (41,175) 5,845 47,020 89,659
Fund Balances, January 1 359,586 359,586 - 269,927
Fund Balances, December 31 318,411$ 365,431$ 47,020$ 359,586$
120
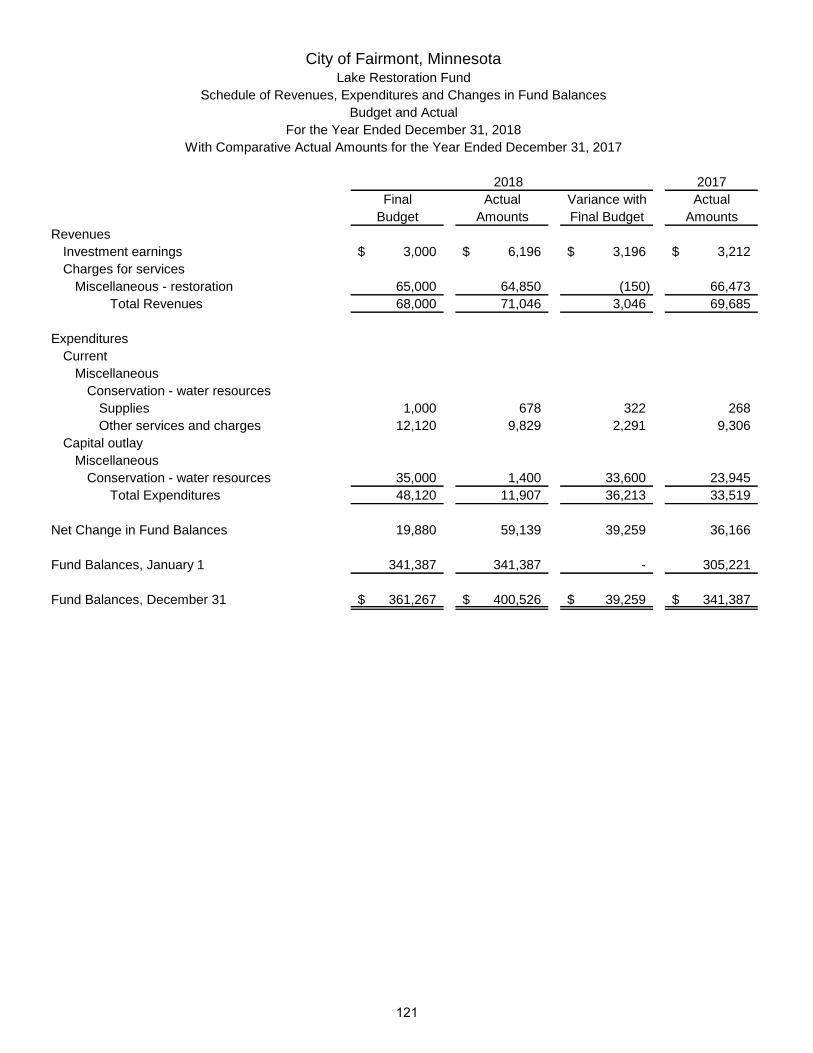
City of Fairmont, MinnesotaLake Restoration Fund
Schedule of Revenues, Expenditures and Changes in Fund BalancesBudget and Actual
For the Year Ended December 31, 2018With Comparative Actual Amounts for the Year Ended December 31, 2017
2018 2017Final Actual Variance with Actual
Budget Amounts Final Budget AmountsRevenues
Investment earnings 3,000$ 6,196$ 3,196$ 3,212$ Charges for services
Miscellaneous - restoration 65,000 64,850 (150) 66,473 Total Revenues 68,000 71,046 3,046 69,685
ExpendituresCurrent
Miscellaneous Conservation - water resources
Supplies 1,000 678 322 268 Other services and charges 12,120 9,829 2,291 9,306
Capital outlayMiscellaneous
Conservation - water resources 35,000 1,400 33,600 23,945 Total Expenditures 48,120 11,907 36,213 33,519
Net Change in Fund Balances 19,880 59,139 39,259 36,166
Fund Balances, January 1 341,387 341,387 - 305,221
Fund Balances, December 31 361,267$ 400,526$ 39,259$ 341,387$
121

THIS PAGE IS LEFT
BLANK INTENTIONALLY
122
Nonmajor Capital Projects Funds
Capital projects funds are created to account for all resources used for the acquisition of
capital facilities by a governmental unit except those financed by Enterprise funds.
Municipal State Aid - Streets: This fund is used to account for revenues received
from the State of Minnesota to help pay costs of improvements on Minnesota State
Aid Streets within the City.
Housing: This fund is used to account for land held for resale for housing
development.
Community Center: This fund is used to account for the future construction of a
community center.
Airport Reconstruction Project: This fund is used to account for costs associated
with ongoing major repair, replacement and expansion projects at the municipal
airport.
2016 Capital Improvement Program: This fund is used to account for costs
associated with major street replacement projects which began in 2015.
2017 Capital Improvement Program: This fund is used to account for costs
associated with major street replacement projects which began in 2016.
2019 Capital Improvement Program: This fund is used to account for costs
associated with major street replacement projects which began in 2018.
123
THIS PAGE IS LEFT
BLANK INTENTIONALLY
124

THIS PAGE IS LEFT
BLANK INTENTIONALLY
125

402 420 430Municipal
State Aid - CommunityStreets Housing Center
AssetsCash and temporary investments 1,695,269$ 334,747$ -$ Receivables
Intergovernmental 106,258 - - Land held for resale - 120,000 -
Total Assets 1,801,527$ 454,747$ -$
LiabilitiesAccounts and contracts payable -$ -$ -$ Due to other governments - 120,000 -
Total Liabilities - 120,000 -
Fund Balances Restricted 1,801,527 - - Committed - 334,747 - Unassigned - - -
Total Fund Balances 1,801,527 334,747 -
Total Liabilities and Fund Balances 1,801,527$ 454,747$ -$
City of Fairmont, MinnesotaNonmajor Capital Projects Funds
Combining Balance SheetDecember 31, 2018
126

450 476 477 479 TotalAirport 2016 Capital 2017 Capital 2019 Capital Nonmajor
Reconstruction Improvement Improvement Improvement CapitalProject Program Program Program Projects
438,123$ 521,937$ 3,291$ -$ 2,993,367$
95,086 - - - 201,344 - - - 120,000
533,209$ 521,937$ 3,291$ -$ 3,314,711$
29,509$ 3,171$ 168,877$ 12,132$ 213,689$ - - - 120,000
29,509 3,171 168,877 12,132 333,689
61,494 518,766 - - 2,381,787 442,206 - - - 776,953
- - (165,586) (12,132) (177,718) 503,700 518,766 (165,586) (12,132) 2,981,022
533,209$ 521,937$ 3,291$ -$ 3,314,711$
127

402 420 430MunicipalState Aid - Community
Streets Housing CenterRevenues
IntergovernmentalFederal
Airport reconstruction grant -$ -$ -$ Other federal grants 280,555 - -
StateAirport reconstruction grant - - - Street construction aid 8,000 - -
Investment earnings 29,678 5,143 - Miscellaneous
Proceeds of land sales - 170,000 - Total Revenues 318,233 175,143 -
ExpendituresCurrent
Housing and economic development - 8,158 - Capital outlay
Streets and highways - - - Miscellaneous - - -
Total Expenditures - 8,158 - Excess (Deficiency) of Revenues
Over (Under) Expenditures 318,233 166,985 -
Other Financing Sources (Uses)Transfers in - - 125,281 Transfers out (298,585) - -
Total Other Financing Sources (Uses) (298,585) - 125,281
Net Change in Fund Balances 19,648 166,985 125,281
Fund Balances, January 1 1,781,879 167,762 (125,281)
Fund Balances, December 31 1,801,527$ 334,747$ -$
City of Fairmont, MinnesotaNonmajor Capital Projects Funds
Combining Statement of Revenues, Expenditures and Changes in Fund BalancesFor the Year Ended December 31, 2018
128
lmunguia_ABDO16C
Sticky Note
Marked set by lmunguia_ABDO16C

450 476 477 479 TotalAirport 2016 Capital 2017 Capital 2019 Capital Nonmajor
Reconstruction Improvement Improvement Improvement CapitalProject Program Program Program Projects
93,316$ -$ -$ -$ 93,316$ - - 438,985 - 719,540
60,310 - - - 60,310 - - - - 8,000
10,545 56 4,622 - 50,044
- - - 170,000 164,171 56 443,607 - 1,101,210
- - - - 8,158
- 15,564 1,198,095 12,132 1,225,791 92,132 - - - 92,132 92,132 15,564 1,198,095 12,132 1,326,081
72,039 (15,508) (754,488) (12,132) (224,871)
- 534,274 298,585 - 958,140 - - - - (298,585) - 534,274 298,585 - 659,555
72,039 518,766 (455,903) (12,132) 434,684
431,661 - 290,317 - 2,546,338
503,700$ 518,766$ (165,586)$ (12,132)$ 2,981,022$
129

THIS PAGE IS LEFT
BLANK INTENTIONALLY
130

The General Fund
The General fund accounts for all revenues and expenditures of a governmental unit
which are not accounted for in other funds, and it is usually the largest and most
important accounting activity for state and local governments. It normally receives a
greater variety and number of taxes and other general revenues than any other fund.
This fund has flowing into it such revenues as general property taxes, licenses and
permits, fines and penalties, rents and charges for current services, state-shared taxes,
and interest earnings. The fund's resources also finance a wider range of activities than
any other fund. Most of the current operations of governmental units will be financed
from this fund.
131

THIS PAGE IS LEFT
BLANK INTENTIONALLY
132

City of Fairmont, MinnesotaGeneral Fund
Comparative Balance SheetsDecember 31, 2018 and 2017
2018 2017Assets Cash and cash equivalentsCash and temporary investments 7,916,959$ 7,373,419$
ReceivablesInterest 76,759 75,759 Delinquent taxes 65,508 59,260 Special assessments 12,848 22,069 Accounts 98,792 107,770 Intergovernmental 203,529 24,525
Total Assets 8,374,395$ 7,662,802$
LiabilitiesAccounts and contracts payable 251,655$ 157,819$ Due to other funds 31,959 30,341 Due to other governments 286 280 Accrued salaries payable 127,538 119,981 Unearned revenue 21,076 23,338
Total Liabilities 432,514 331,759
Deferred Inflows of ResourcesUnavailable revenue - taxes 65,508 59,260 Unavailable revenue - special assessments 12,848 22,069
Total Deferred Inflows of Resources 78,356 81,329
Fund BalancesCommitted 79,222 29,122 Assigned 3,807,630 3,279,918 Unassigned 3,976,673 3,940,674
Total Fund Balances 7,863,525 7,249,714
Total Liabilities, Deferred Inflows of Resources and Fund Balances 8,374,395$ 7,662,802$
133

City of Fairmont, MinnesotaGeneral Fund
Schedule of Revenues, Expenditures and Changes in Fund BalancesBudget and Actual (Continued on the Following Pages)
For the Year Ended December 31, 2018With Comparative Actual Amounts for the Year Ended December 31, 2017
2017Actual Variance with Actual
Original Final Amounts Final Budget AmountsRevenues
TaxesProperty taxes 3,230,372$ 3,230,372$ 3,214,244$ (16,128)$ 2,824,041$ Franchise taxes 40,000 40,000 41,480 1,480 40,696
Total taxes 3,270,372 3,270,372 3,255,724 (14,648) 2,864,737
Special assessments - - 1,001 1,001 3,649
Licenses and permitsBusiness 40,300 40,300 44,000 3,700 44,264 Nonbusiness 132,300 132,300 117,590 (14,710) 127,456
Total licenses and permits 172,600 172,600 161,590 (11,010) 171,720
IntergovernmentalFederal
Other Federal aids - - 165,005 165,005 - State
Local government aid 3,457,546 3,457,546 3,457,546 - 3,426,119 Property tax credits - - 1,719 1,719 1,672 Street maintenance aid 29,085 29,085 30,015 930 30,015 Police aid 224,043 224,043 251,285 27,242 232,062 Other State aids 171,672 171,672 65,077 (106,595) 21,672
CountyOther County aids - - - - 9,000
Total intergovernmental 3,882,346 3,882,346 3,970,647 88,301 3,720,540
Charges for servicesGeneral government 11,200 11,200 12,692 1,492 11,935 Public safety 123,500 123,500 186,787 63,287 218,440 Streets and highways 5,500 5,500 15,917 10,417 8,355 Sanitation 146,452 146,452 137,360 (9,092) 161,680 Culture and recreation 167,500 167,500 171,847 4,347 184,873
Total charges for services 454,152 454,152 524,603 70,451 585,283
Fines and forfeitsCourt fines 54,000 54,000 56,420 2,420 55,221
Investment earnings 40,000 40,000 2,467 (37,533) 66,986
MiscellaneousRents 48,000 48,000 62,061 14,061 48,461 Contributions and donations - - 133,299 133,299 19,996 Other 53,554 53,554 55,665 2,111 49,901
Total miscellaneous 101,554 101,554 251,025 149,471 118,358
Total Revenues 7,975,024 7,975,024 8,223,477 248,453 7,586,494
Budgeted Amounts2018
134

City of Fairmont, MinnesotaGeneral Fund
Schedule of Revenues, Expenditures and Changes in Fund BalancesBudget and Actual (Continued)
For the Year Ended December 31, 2018With Comparative Actual Amounts for the Year Ended December 31, 2017
2017Actual Variance with Actual
Original Final Amounts Final Budget AmountsExpenditures
CurrentGeneral government
Mayor and councilPersonal services 62,434$ 62,434$ 72,528$ (10,094)$ 56,463$ Supplies 2,200 2,200 3,514 (1,314) 825 Other services and charges 5,800 5,800 7,362 (1,562) 5,612
Total mayor and council 70,434 70,434 83,404 (12,970) 62,900
City administratorPersonal services 114,964 114,964 115,044 (80) 94,587 Supplies 2,600 2,600 2,737 (137) 1,839 Other services and charges 25,335 25,335 25,142 193 21,214
Total city administrator 142,899 142,899 142,923 (24) 117,640
ElectionsPersonal services 27,927 27,927 26,243 1,684 11,329 Supplies 2,500 2,500 5,904 (3,404) 40 Other services and charges 625 625 268 357 53
Total elections 31,052 31,052 32,415 (1,363) 11,422
Recording and reportingPersonal services 59,632 59,632 58,371 1,261 56,645 Supplies 3,300 3,300 4,778 (1,478) 3,011 Other services and charges 4,325 4,325 2,992 1,333 3,917
Total recording and reporting 67,257 67,257 66,141 1,116 63,573
Local access channelPersonal services 1,913 1,913 1,778 135 1,683 Supplies 1,000 1,000 25 975 - Other services and charges 7,515 7,515 8,548 (1,033) 7,588
Total local access channel 10,428 10,428 10,351 77 9,271
AccountingPersonal services 241,403 241,403 237,329 4,074 229,652 Supplies 4,000 4,000 4,486 (486) 1,912 Other services and charges 85,618 85,618 57,021 28,597 64,563
Total accounting 331,021 331,021 298,836 32,185 296,127
City attorneyPersonal services 160,252 160,252 157,797 2,455 153,925 Supplies 2,500 2,500 2,971 (471) 1,219 Other services and charges 14,065 14,065 10,713 3,352 11,848
Total city attorney 176,817 176,817 171,481 5,336 166,992
Budgeted Amounts2018
135

City of Fairmont, MinnesotaGeneral Fund
Schedule of Revenues, Expenditures and Changes in Fund BalancesBudget and Actual (Continued)
For the Year Ended December 31, 2018With Comparative Actual Amounts for the Year Ended December 31, 2017
2017Actual Variance with Actual
Original Final Amounts Final Budget AmountsExpenditures (Continued)
Current (continued)General government (continued)
Planning and zoningPersonal services 146,948$ 146,948$ 134,643$ 12,305$ 155,023$ Supplies 1,500 1,500 2,913 (1,413) 3,962 Other services and charges 4,500 4,500 5,989 (1,489) 5,072
Total planning and zoning 152,948 152,948 143,545 9,403 164,057
General government buildingPersonal services 73,816 73,816 68,568 5,248 65,454 Supplies 5,500 5,500 2,703 2,797 2,077 Other services and charges 59,970 59,970 87,350 (27,380) 50,145
Total general government building 139,286 139,286 158,621 (19,335) 117,676
Library buildingSupplies 4,000 4,000 2,360 1,640 1,999 Other services and changes 73,560 73,560 97,590 (24,030) 78,668
Total library building 77,560 77,560 99,950 (22,390) 80,667
Other general governmentSupplies 250 250 229 21 99 Other services and changes 230,000 230,000 230,574 (574) 150,463
Total other general government 230,250 230,250 230,803 (553) 150,562
Total general government 1,429,952 1,429,952 1,438,470 (8,518) 1,240,887
Public safetyPolice
AdministrationPersonal services 442,266 442,266 400,641 41,625 432,620 Supplies 4,750 4,750 3,932 818 3,342 Other services and charges 19,990 19,990 10,981 9,009 18,750
Total administration 467,006 467,006 415,554 51,452 454,712
Crime controlPersonal services 1,695,896 1,695,896 1,875,959 (180,063) 1,688,859 Supplies 79,250 79,250 52,126 27,124 45,904 Other services and charges 254,025 254,025 290,283 (36,258) 261,432
Total crime control 2,029,171 2,029,171 2,218,368 (189,197) 1,996,195
2018Budgeted Amounts
136

City of Fairmont, MinnesotaGeneral Fund
Schedule of Revenues, Expenditures and Changes in Fund BalancesBudget and Actual (Continued)
For the Year Ended December 31, 2018With Comparative Actual Amounts for the Year Ended December 31, 2017
2017Actual Variance with Actual
Original Final Amounts Final Budget AmountsExpenditures (Continued)
Current (continued)Public safety (continued)
PoliceD.A.R.E. program
Supplies 2,500$ 2,500$ -$ 2,500$ 253$
Crossing guardsPersonal services - - 3,083 (3,083) 1,078 Other services and charges 3,000 3,000 - 3,000 -
Total crossing guards 3,000 3,000 3,083 (83) 1,078
Drug task forceOther services and charges 16,700 16,700 31,565 (14,865) 25,870
Total police 2,518,377 2,518,377 2,668,570 (150,193) 2,478,108
FireFire fighting
Personal services 258,984 258,984 233,445 25,539 242,948 Supplies 42,000 42,000 10,989 31,011 5,057
Other services and charges 85,525 85,525 169,102 (83,577) 169,343 Total fire fighting 386,509 386,509 413,536 (27,027) 417,348
TrainingPersonal services 51,405 51,405 37,616 13,789 38,288 Supplies 5,000 5,000 - 5,000 - Other services and charges 10,250 10,250 214 10,036 228
Total training 66,655 66,655 37,830 28,825 38,516
Total fire 453,164 453,164 451,366 1,798 455,864
InspectionBuilding inspection
Personal services 216,491 216,491 204,520 11,971 191,750 Supplies 7,300 7,300 4,717 2,583 2,727
Other services and charges 13,050 13,050 9,960 3,090 10,303 Total building inspection 236,841 236,841 219,197 17,644 204,780
Fire inspectionPersonal services - - - - 2,744 Other services and charges - - 408 (408) 106
Total fire inspection - - 408 (408) 2,850
Total inspection 236,841 236,841 219,605 17,236 207,630
Civil defenseSupplies 600 600 464 136 1,845
Other services and charges 225 225 1,562 (1,337) 2,245 Total civil defense 825 825 2,026 (1,201) 4,090
2018Budgeted Amounts
137

City of Fairmont, MinnesotaGeneral Fund
Schedule of Revenues, Expenditures and Changes in Fund BalancesBudget and Actual (Continued)
For the Year Ended December 31, 2018With Comparative Actual Amounts for the Year Ended December 31, 2017
2017Actual Variance with Actual
Original Final Amounts Final Budget AmountsExpenditures (Continued)
Current (continued)Public safety (continued)
Animal controlPersonal services 93,050$ 93,050$ 77,440$ 15,610$ 64,104$ Supplies 11,225 11,225 8,801 2,424 9,015
Other services and charges 32,659 32,659 32,544 115 28,965 Total animal control 136,934 136,934 118,785 18,149 102,084
Total public safety 3,346,141 3,346,141 3,460,352 (114,211) 3,247,776
Streets and highwaysPaved streets
Personal services 467,942 467,942 435,552 32,390 388,476 Supplies 159,950 159,950 147,944 12,006 126,325 Other services and charges 58,770 58,770 71,071 (12,301) 47,656
Total paved streets 686,662 686,662 654,567 32,095 562,457
Ice and snow removalPersonal services 212,019 212,019 197,591 14,428 176,431 Supplies 47,000 47,000 78,914 (31,914) 40,966 Other services and charges 18,200 18,200 55,330 (37,130) 15,142
Total ice and snow removal 277,219 277,219 331,835 (54,616) 232,539
Road and bridge equipmentPersonal services 42,404 42,404 39,518 2,886 35,285 Supplies 25,000 25,000 9,224 15,776 13,786 Other services and charges 121,000 121,000 142,845 (21,845) 120,926
Total road and bridge equipment 188,404 188,404 191,587 (3,183) 169,997
Street lightingOther services and charges 167,900 167,900 158,959 8,941 157,650
EngineeringPersonal services 292,775 292,775 285,907 6,868 279,059 Supplies 10,500 10,500 5,336 5,164 4,692 Other services and charges 45,810 45,810 35,806 10,004 39,541
Total engineering 349,085 349,085 327,049 22,036 323,292
Total streets and highways 1,669,270 1,669,270 1,663,997 5,273 1,445,935
Sanitation and waste removalWeed control
Other services and charges 20,400 20,400 5,552 14,848 42,842
Garbage collectionPersonal services 34,743 34,743 30,623 4,120 30,924 Supplies 3,900 3,900 2,073 1,827 1,780 Other services and charges 63,250 63,250 99,829 (36,579) 73,413
Total garbage collection 101,893 101,893 132,525 (30,632) 106,117
Total sanitation and waste removal 122,293 122,293 138,077 (15,784) 148,959
Culture and recreationParks
Personal services 753,799 753,799 701,180 52,619 655,418 Supplies 82,600 82,600 70,938 11,662 73,160 Other services and charges 250,050 250,050 229,455 20,595 324,386
Total parks 1,086,449 1,086,449 1,001,573 84,876 1,052,964
2018Budgeted Amounts
138

City of Fairmont, MinnesotaGeneral Fund
Schedule of Revenues, Expenditures and Changes in Fund BalancesBudget and Actual (Continued)
For the Year Ended December 31, 2018With Comparative Actual Amounts for the Year Ended December 31, 2017
2017Actual Variance with Actual
Original Final Amounts Final Budget AmountsExpenditures (Continued)
Current (continued)Culture and recreation (continued)
Recreation - aquatic parkPersonal services 267,097$ 267,097$ 253,845$ 13,252$ 254,257$ Supplies 57,000 57,000 62,366 (5,366) 49,295 Other services and charges 92,854 92,854 80,444 12,410 94,125
Total recreation - aquatic park 416,951 416,951 396,655 20,296 397,677
Total culture and recreation 1,503,400 1,503,400 1,398,228 105,172 1,450,641
Total current 8,071,056 8,071,056 8,099,124 (28,068) 7,534,198
Capital outlayGeneral government 71,000 71,000 34,203 36,797 92,042 Public safety 140,600 140,600 153,385 (12,785) 451,377 Streets and highways 396,000 396,000 209,785 186,215 203,599 Culture and recreation 1,144,000 1,144,000 416,307 727,693 103,071
Total capital outlay 1,751,600 1,751,600 813,680 937,920 850,089
Total Expenditures 9,822,656 9,822,656 8,912,804 909,852 8,384,287
Deficiency of Revenues Under Expenditures (1,847,632) (1,847,632) (689,327) 1,158,305 (797,793)
Other Financing Sources (Uses)Proceeds from sale of capital assets - - 29,334 29,334 43,435 Transfers in 1,363,000 1,363,000 1,348,804 (14,196) 1,047,132 Transfers out (80,000) (80,000) (75,000) 5,000 (35,000)
Total Other Financing Sources (Uses) 1,283,000 1,283,000 1,303,138 20,138 1,055,567
Net Change in Fund Balances (564,632) (564,632) 613,811 1,178,443 257,774
Fund Balances, January 1 7,249,714 7,249,714 7,249,714 - 6,991,940
Fund Balances, December 31 6,685,082$ 6,685,082$ 7,863,525$ 1,178,443$ 7,249,714$
Budgeted Amounts2018
139

THIS PAGE IS LEFT
BLANK INTENTIONALLY
140

Debt Service Funds
Debt Service funds are created to account for the payment of interest and principal on
long-term, general obligation debt other than that payable from debt issued for and
serviced primarily by a governmental enterprise.
141

THIS PAGE IS LEFT
BLANK INTENTIONALLY
142

323 369 305 320 322Tax Tax
2009 Fire Increment IncrementSpecial Special Truck District District
Assessment Assessments Debt No. 23 No. 22Assets
Cash and temporary investments 922,427$ -$ 260,342$ 12,680$ -$ Receivables
Delinquent taxes 244 - 896 - - Special assessments
Delinquent 6,773 - - - - Noncurrent 182,449 - - - -
Intergovernmental 1,186 - 703 - - Due from other funds 10,000 - - - -
Total Assets 1,123,079$ -$ 261,941$ 12,680$ -$
LiabilitiesAccounts payable 2,500$ -$ -$ -$ -$ Due to other funds - - - - -
Total Liabilites 2,500 - - - -
Deferred Inflows of ResourcesUnavailable revenue - taxes 244 - 896 - - Unavailable revenue - special assessments 189,222 - - - -
Total Deferred Inflows of Resources 189,466 - 896 - -
Fund Balances Restricted 931,113 - 261,045 12,680 -
Total Liabilities, Deferred Inflows of Resources and Fund Balances 1,123,079$ -$ 261,941$ 12,680$ -$
City of Fairmont, MinnesotaDebt Service Funds
Combining Balance Sheet (Continued on the Following Pages)December 31, 2018
143

324 325 326 327 372Tax Tax Tax Tax
Increment Increment Increment Increment 2012District District District District Refunding ImprovementNo. 24 No. 25 No. 26 No. 27 Bonds
AssetsCash and temporary investments 5,583$ -$ 2,007$ -$ 457,555$ Receivables
Delinquent taxes - - - - 12,587 Special assessments
Delinquent - - - - 175,832 Noncurrent - - - - 578,784
Intergovernmental - - - - 8,416 Due from other funds - - - - -
Total Assets 5,583$ -$ 2,007$ -$ 1,233,174$
LiabilitiesAccounts payable -$ -$ -$ -$ -$ Due to other funds - - - 10,000 -
Total Liabilites - - - 10,000 -
Deferred Inflows of ResourcesUnavailable revenue - taxes - - - - 12,587 Unavailable revenue - special assessments - - - - 754,616
Total Deferred Inflows of Resources - - - - 767,203
Fund Balances Restricted 5,583 - 2,007 (10,000) 465,971
Total Liabilities, Deferred Inflows of Resources and Fund Balances 5,583$ -$ 2,007$ -$ 1,233,174$
City of Fairmont, MinnesotaDebt Service Funds
Combining Balance Sheet (Continued)December 31, 2018
144

373 375 376 377
2013 2015 2016 2017Improvement Improvement G.O. G.O.
Bonds Bonds Bonds Bonds Totals
226,867$ 359,770$ 665,169$ 483,819$ 3,396,219$
1,959 2,322 7,002 201 25,211
3,963 6,138 1,527 6,076 200,309 137,985 235,904 366,585 425,997 1,927,704
977 1,704 3,647 668 17,301 - - - - 10,000
371,751$ 605,838$ 1,043,930$ 916,761$ 5,576,744$
-$ -$ -$ -$ 2,500$ - - - - 10,000 - - - - 12,500
1,959 2,322 7,002 201 25,211 141,948 242,042 368,112 432,073 2,128,013 143,907 244,364 375,114 432,274 2,153,224
227,844 361,474 668,816 484,487 3,411,020
371,751$ 605,838$ 1,043,930$ 916,761$ 5,576,744$
145

THIS PAGE IS LEFT
BLANK INTENTIONALLY
146

323 369 305 320 322Tax Tax
2009 Fire Increment IncrementSpecial Special Truck District District
Assessment Assessments Debt No. 23 No. 22Revenues
Taxes Property taxes (59)$ -$ 63,985$ -$ -$ Tax increment district taxes - - - 25,360 57,962
Special assessments 42,687 - - - - Investment earnings 25,184 - 2,525 - - Payments from Component Unit for debt service - - - - -
Total Revenues 67,812 - 66,510 25,360 57,962 Expenditures
CurrentHousing and economic development - - - 25,172 57,962
Debt servicePrincipal - 427,363 - - - Interest and other 2,500 - - - -
Total Expenditures 2,500 427,363 - 25,172 57,962
Excess (Deficiency) of Revenues Over(Under) Expenditures 65,312 (427,363) 66,510 188 -
Other Financing Sources (Uses)Transfers in - - 75,000 - - Transfers out (713,061) (231,550) - - -
Total Other Financing Sources (Uses) (713,061) (231,550) 75,000 - -
Net Change in Fund Balances (647,749) (658,913) 141,510 188 -
Fund Balances, January 1 1,578,862 658,913 119,535 12,492 -
Fund Balances, December 31 931,113$ -$ 261,045$ 12,680$ -$
For the Year Ended December 31, 2018
City of Fairmont, MinnesotaDebt Service Funds
Combining Schedule of Revenues, Expenditures and Changes in Fund Balances (Continued on Following Pages)
147

324 325 326 327 372Tax Tax Tax Tax
Increment Increment Increment Increment 2012District District District District RefundingNo. 24 No. 25 No. 26 No. 27 Bonds
RevenuesTaxes
Property taxes -$ -$ -$ -$ 542,329$ Tax increment district taxes 11,166 31,795 12,007 - -
Special assessments - - - - 165,859 Investment earnings - - - - 3,041 Payments from Component Unit for debt service - 400 400 - -
Total Revenues 11,166 32,195 12,407 - 711,229 Expenditures
CurrentHousing and economic development 8,962 21,194 - 1,957 -
Debt servicePrincipal - - - - 735,000 Interest and other - - - - 58,460
Total Expenditures 8,962 21,194 - 1,957 793,460
Excess (Deficiency) of Revenues Over(Under) Expenditures 2,204 11,001 12,407 (1,957) (82,231)
Other Financing Sources (Uses)Transfers in - - - - - Transfers out - - - - -
Total Other Financing Sources (Uses) - - - - -
Net Change in Fund Balances 2,204 11,001 12,407 (1,957) (82,231)
Fund Balances, January 1 3,379 (11,001) (10,400) (8,043) 548,202
Fund Balances, December 31 5,583$ -$ 2,007$ (10,000)$ 465,971$
City of Fairmont, MinnesotaDebt Service Funds
Combining Schedule of Revenues, Expenditures and Changes in Fund Balances (Continued)For the Year Ended December 31, 2018
148

373 375 376 377
2013 2015 2016 2017Improvement Improvement G.O. G.O.
Bonds Bonds Bonds Bonds Totals
94,332$ 143,832$ 262,195$ 17,029$ 1,123,643$
- - - - 138,290 24,454 37,424 80,585 49,213 400,222
2,998 4,359 12,673 5,099 55,879 - - - - 800
121,784 185,615 355,453 71,341 1,718,834
- - - - 115,247
105,000 170,000 992,637 - 2,430,000 40,763 49,431 70,351 81,258 302,763
145,763 219,431 1,062,988 81,258 2,848,010
(23,979) (33,816) (707,535) (9,917) (1,129,176)
- - 231,550 178,787 485,337 - - - - (944,611) - - 231,550 178,787 (459,274)
(23,979) (33,816) (475,985) 168,870 (1,588,450)
251,823 395,290 1,144,801 315,617 4,999,470
227,844$ 361,474$ 668,816$ 484,487$ 3,411,020$
149

THIS PAGE IS LEFT
BLANK INTENTIONALLY
150

Internal Service Funds
Internal service funds are created to account for the financing of goods and services
provided by one department of government to other departments on a cost -
reimbursement basis.
Central Garage and Equipment: This fund accounts for the cost of maintaining the
City's vehicle fleet. All City vehicles are maintained by the central garage and billed
for the maintenance on a departmental basis.
Medical Self-Insurance: This fund is used to account for the costs of the City
employee health insurance plan. Premiums are paid by the benefiting funds and
health insurance claims are paid out of the fund.
Property, Equipment, and Liability Self-Insurance: This fund is used to account
for the costs of the City's insurance for liability and multi-peril risks. Premiums are
received from benefiting funds and payments for insurance premiums and claims
that fall within the deductible amounts are paid out of this fund.
Worker's Compensation Self-Insurance: This fund is used to account for costs
associated with the City's workers' compensation insurance. Premiums are received
from benefiting funds. Payments for insurance and other costs not covered under
this plan are paid out of this fund.
Data Processing: This fund is used to account for the costs associated with the
City's data processing system. Benefited funds are charged on a percentage basis
for the costs of operating this department.
151

THIS PAGE IS LEFT
BLANK INTENTIONALLY
152

City of Fairmont, MinnesotaInternal Service Funds
Combining Statement of Net Position December 31, 2018
Property, Equipment Worker's
Central Garage Medical and Liability Compensation Data and Equipment Self-insurance Self-insurance Self-insurance Processing Totals
AssetsCurrent Assets
Cash and temporary investments 16,770$ 172,291$ 710,856$ 397,919$ 13,522$ 1,311,358$ Receivables
Accounts - 557 - 497 - 1,054 Due from other funds - 49,209 - 9,647 - 58,856 Prepaid items - - - - 1,125 1,125
Total Current Assets 16,770 222,057 710,856 408,063 14,647 1,372,393
Capital AssetsMachinery and equipment 49,848 - - - 211,356 261,204 Less accumulated depreciation - - - - (208,820) (208,820)
Net Capital Assets 49,848 - - - 2,536 52,384
Total Assets 66,618 222,057 710,856 408,063 17,183 1,424,777
LiabilitiesCurrent Liabilities
Accounts and contracts payable 6,791 8,828 - 10,144 5,818 31,581 Due to other funds 1,158 - - - - 1,158 Accrued salaries payable 11,210 - - - - 11,210
Total Liabilities 19,159 8,828 - 10,144 5,818 43,949
Net Position Investment in capital assets - - - - 2,536 2,536 Unrestricted 47,459 213,229 710,856 397,919 8,829 1,378,292
Total Net Position 47,459$ 213,229$ 710,856$ 397,919$ 11,365$ 1,380,828$
701 703 710704 705
153

City of Fairmont, MinnesotaInternal Service Funds
Combining Statement of Revenues, Expenses and Changes in Net PositionFor the Year Ended December 31, 2018
Property, Equipment Worker's
Central Garage Medical and Liability Compensation Data and Equipment Self-insurance Self-insurance Self-insurance Processing Totals
Operating RevenuesCharges for services 260,517$ 1,737,587$ 317,706$ 339,164$ 90,976$ 2,745,950$ Miscellaneous revenues 108 3,583 - 4,831 - 8,522
Total Operating Revenues 260,625 1,741,170 317,706 343,995 90,976 2,754,472
Operating ExpensesAdministration and other
Personal services 180,676 348 - - - 181,024 Supplies 33,536 - - - 7,020 40,556 Other services and charges 6,032 97,701 15,000 49,061 104,351 272,145 Insurance premiums paid - 1,496,377 260,839 338,412 - 2,095,628 Insurance claims paid - 197,838 15,205 - - 213,043
Depreciation - - - - 9,244 9,244 Total Operating Expenses 220,244 1,792,264 291,044 387,473 120,615 2,811,640
Operating Income (Loss) 40,381 (51,094) 26,662 (43,478) (29,639) (57,168)
Nonoperating RevenuesInvestment income 283 478 11,382 6,103 228 18,474
Change in Net Position 40,664 (50,616) 38,044 (37,375) (29,411) (38,694)
Net Position - January 1 as Restated 6,795 263,845 672,812 435,294 40,776 1,419,522
Net Position - December 31 47,459$ 213,229$ 710,856$ 397,919$ 11,365$ 1,380,828$
701 703 705 710704
154

City of Fairmont, MinnesotaInternal Service Funds
Combining Statement of Cash FlowsFor the Year Ended December 31, 2018
Property, Equipment Worker's
Central Garage Medical and Liability Compensation Data and Equipment Self-insurance Self-insurance Self-insurance Processing Totals
Cash Flows from Operating ActivitiesReceipts from interfund services provided 260,517$ 1,746,810$ 317,706$ 357,293$ 90,976$ 2,773,302$ Payments to suppliers (32,330) (98,049) (297,495) (49,061) (90,855) (567,790) Payments to and on behalf of employees (143,083) (1,698,857) - (337,364) - (2,179,304) Payments for interfund services used (36,641) (17) - - (898) (37,556) Other receipts 108 3,583 - 4,831 - 8,522
Net Cash Provided (Used) by Operating Activities 48,571 (46,530) 20,211 (24,301) (777) (2,826)
Cash Flows from Noncapital and Related Financing ActivitiesIncrease in due from other funds - (3,162) - (801) - (3,963) Increase in due to other funds 38 - - - - 38
Net Cash Provided (Used) by Noncapital and Related Financing Activities 38 (3,162) - (801) - (3,925)
Cash Flows from Capital AndRelated Financing ActivitiesAcquisition of capital assets (49,848) - - - - (49,848)
Cash Flows from Investing ActivitiesInterest received 283 478 11,382 6,103 228 18,474
Net Increase (Decrease) in Cash and Cash Equivalents (956) (49,214) 31,593 (18,999) (549) (38,125)
Cash and Cash Equivalents, January 1 17,726 221,505 679,263 416,918 14,071 1,349,483
Cash and Cash Equivalents, December 31 16,770$ 172,291$ 710,856$ 397,919$ 13,522$ 1,311,358$
Reconciliation of Operating Income (Loss) to Net CashProvided (Used) by Operating ActivitiesOperating income (loss) 40,381$ (51,094)$ 26,662$ (43,478)$ (29,639)$ (57,168)$ Adjustments to reconcile operating income (loss) to
net cash provided (used) by operating activitiesDepreciation - - - - 9,244 9,244 (Increase) decrease in assets
Net accounts receivable - 9,223 - 18,129 - 27,352 Prepaid expenses - - - - 19,110 19,110
Increase (decrease) in liabilitiesAccounts and contracts payable 5,625 (4,659) (6,451) 1,048 508 (3,929) Accrued wages payable 2,565 - - - - 2,565
Net Cash Provided (Used) by Operating Activities 48,571$ (46,530)$ 20,211$ (24,301)$ (777)$ (2,826)$
710701 703 704 705
155

THIS PAGE IS LEFT
BLANK INTENTIONALLY
156

Agency Funds
Agency funds account for assets held by the City as an agent for individuals, private
organizations, and other governmental units.
C.V.B. Tax Agency: This fund is used to account for taxes collected by the City on
lodging facilities. Ninety-five percent of the taxes collected are transferred to the
local Convention and Visitors Bureau.
Flex Plan: This fund is used to account for deposits to and withdrawals from the
City employee cafeteria plan.
Multi-Family Housing: This fund is used to account for rents received and
expenditures made related to the Burton Lane rental property.
HRA Potter’s Addition: This fund is used to account for the rents and expenses of
the 16 unit rental recently constructed by the HRA.
Focus on Fairmont: This fund is used to account for the donations received and
expenditures made for the Focus on Fairmont Committee.
Project 1590: This fund is used to account for the donations received and the
expenditures made for the Project 1590 Committee.
Inclusive Playground: This fund is used to account for the donations received and
the expenditures made for the inclusive playground.
Mall Playground: This fund is used to account for the donations received and the
expenditures made for the mall playground.
iPaddlePort: This fund is used to account for the donations received and the
expenditures made for purchase and operations of an iPaddleport..
Fairmont Visitor Profile: This fund is used to account for the donations received
and the expenditures made to fund a profile of visitors to the Fairmont area.
157

THIS PAGE IS LEFT
BLANK INTENTIONALLY
158

THIS PAGE IS LEFT
BLANK INTENTIONALLY
159

City of Fairmont, MinnesotaAgency Funds
Combining Balance SheetDecember 31, 2018
873 706 871 872C.V.B. Multi- HRA
Tax Flex Family Potter'sAgency Plan Housing Addition
AssetsCash and temporary investments 1,954$ 12,418$ 125,194$ 303,305$ Receivables
Due from other governments - 1,109 - -
Total Assets 1,954$ 13,527$ 125,194$ 303,305$ Liabilities
Accounts payable 1,954$ 13,527$ 119,839$ 290,744$ Deposits payable - - 5,355 12,561
Total Liabilities 1,954$ 13,527$ 125,194$ 303,305$
160

874 876 877 878 879 880
Focus on Project Inclusive Mall Fairmont Fairmont 1590 Playground Playground iPaddlePort Visitor Profile Total
-$ -$ 100,767$ -$ 5,000$ -$ 548,638$
- - - - - - 1,109
-$ -$ 100,767$ -$ 5,000$ -$ 549,747$
-$ -$ 100,767$ -$ 5,000$ -$ 531,831$ - - - - - - 17,916
-$ -$ 100,767$ -$ 5,000$ -$ 549,747$
161

City of Fairmont, MinnesotaAgency Funds
Individual Fund Statements of Changes in Assets and LiabilitiesFor the Year Ended December 31, 2018
Balance BalanceJanuary 1, December 31,
2018 Additions Deletions 2018C. V. B. Tax Agency Fund (873)Assets
Cash and temporary investments 15,136$ 170,644$ 183,826$ 1,954$ Liabilities
Accounts payable 15,136$ 170,644$ 183,826$ 1,954$
Flex Plan Fund (706)Assets
Cash and temporary investments 11,940$ 43,627$ 43,149$ 12,418$ Due from other governments 1,003 43,716 43,610 1,109
Total Assets 12,943$ 87,343$ 86,759$ 13,527$ Liabilities
Accounts payable 12,943$ 87,343$ 86,759$ 13,527$
Multi-Family Housing Fund (871)Assets
Cash and temporary investments 131,871$ 74,389$ 81,066$ 125,194$ Accounts receivable - 69,160 69,160 -
Total Assets 131,871$ 143,549$ 150,226$ 125,194$
Liabilities Accounts payable 126,756$ 142,029$ 148,946$ 119,839$ Deposits payable 5,115 1,520 1,280 5,355
Total Liabilities 131,871$ 143,549$ 150,226$ 125,194$
HRA Potter's Addition Fund (872)Assets
Cash and temporary investments 252,608$ 217,333$ 166,636$ 303,305$ Accounts receivable 62 151,841 151,903 -
Total Assets 252,670$ 369,174$ 318,539$ 303,305$ .Liabilities
Accounts payable 241,806$ 366,801$ 317,863$ 290,744$ Deposits payable 10,864 2,373 676 12,561
Total Liabilities 252,670$ 369,174$ 318,539$ 303,305$
Focus on Fairmont (874)Assets
Cash and temporary investments 412$ 4,500$ 4,912$ -$ Liabilities
Accounts payable 412$ 4,500$ 4,912$ -$
162

City of Fairmont, MinnesotaAgency Funds
Individual Fund Statements of Changes in Assets and Liabilities (Continued)For the Year Ended December 31, 2018
Balance BalanceJanuary 1, December 31,
2018 Additions Deletions 2018Project 1590 (876)Assets
Cash and temporary investments 14,918$ -$ 14,918$ -$ .Liabilities
Accounts payable 14,918$ -$ 14,918$ -$
Inclusive Playground (877)Assets
Cash and temporary investments 44,747$ 64,581$ 8,561$ 100,767$ .Liabilities
Accounts payable 44,747$ 64,581$ 8,561$ 100,767$
Mall Playground (878)Assets
Cash and temporary investments 28,852$ 8,610$ 37,462$ -$ .Liabilities
Accounts payable 28,852$ 8,610$ 37,462$ -$
iPaddlePort (879)Assets
Cash and temporary investments 5,000$ -$ -$ 5,000$ .Liabilities
Accounts payable 5,000$ -$ -$ 5,000$
Fairmont Visitor Profile (880)Assets
Cash and temporary investments -$ 2,500$ 2,500$ -$ .Liabilities
Accounts payable -$ 2,500$ 2,500$ -$
Totals - All Funds
AssetsCash and temporary investments 505,484$ 586,184$ 543,030$ 548,638$ Accounts receivable 62 221,001 221,063 - Due from other governments 1,003 43,716 43,610 1,109
Total Assets 506,549$ 850,901$ 807,703$ 549,747$
Liabilities Accounts payable 490,570$ 847,008$ 805,747$ 531,831$ Deposits payable 15,979 3,893 1,956 17,916
Total Liabilities 506,549$ 850,901$ 807,703$ 549,747$
163
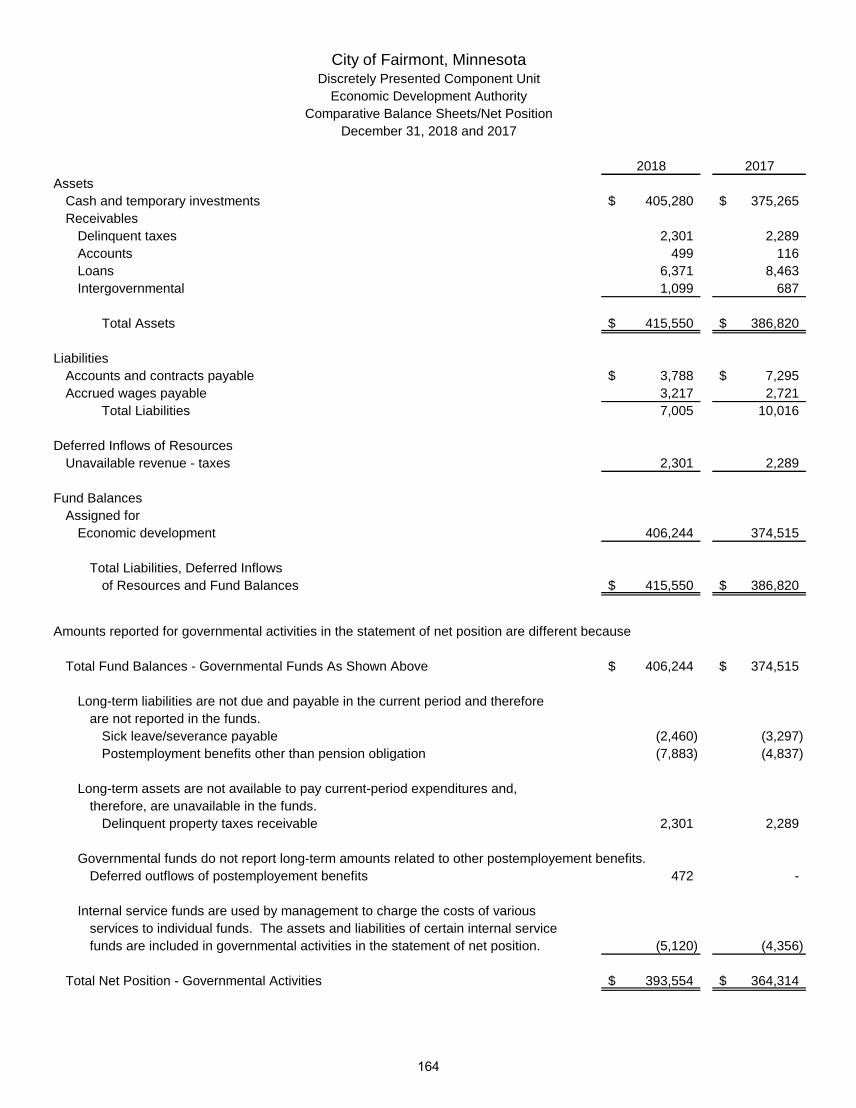
City of Fairmont, MinnesotaDiscretely Presented Component Unit
Economic Development AuthorityComparative Balance Sheets/Net Position
December 31, 2018 and 2017
2018 2017Assets
Cash and temporary investments 405,280$ 375,265$ Receivables
Delinquent taxes 2,301 2,289 Accounts 499 116 Loans 6,371 8,463 Intergovernmental 1,099 687
Total Assets 415,550$ 386,820$
LiabilitiesAccounts and contracts payable 3,788$ 7,295$ Accrued wages payable 3,217 2,721
Total Liabilities 7,005 10,016
Deferred Inflows of ResourcesUnavailable revenue - taxes 2,301 2,289
Fund BalancesAssigned for
Economic development 406,244 374,515
Total Liabilities, Deferred Inflows of Resources and Fund Balances 415,550$ 386,820$
Amounts reported for governmental activities in the statement of net position are different because
Total Fund Balances - Governmental Funds As Shown Above 406,244$ 374,515$
Long-term liabilities are not due and payable in the current period and therefore are not reported in the funds.
Sick leave/severance payable (2,460) (3,297) Postemployment benefits other than pension obligation (7,883) (4,837)
Long-term assets are not available to pay current-period expenditures and, therefore, are unavailable in the funds.
Delinquent property taxes receivable 2,301 2,289
Governmental funds do not report long-term amounts related to other postemployement benefits.Deferred outflows of postemployement benefits 472 -
Internal service funds are used by management to charge the costs of variousservices to individual funds. The assets and liabilities of certain internal service funds are included in governmental activities in the statement of net position. (5,120) (4,356)
Total Net Position - Governmental Activities 393,554$ 364,314$
164

City of Fairmont, MinnesotaDiscretely Presented Component Unit
Economic Development AuthorityComparative Statements of Revenues, Expenditures and Changes in Fund Balances/Net Position
For the Years Ended December 31, 2018 and 2017
2018 2017Revenues
Taxes 99,300$ 98,249$ Intergovernmental - 10,000 Payments from City 105,762 100,000 Investment earnings 6,181 4,140 Miscellaneous 38,953 29,688
Total Revenues 250,196 242,077
ExpendituresCurrent
Housing and economic development 217,667 296,395 Debt service
Payments to City for debt service 800 - Total Expenditures 218,467 296,395
Net Change in Fund Balances 31,729 (54,318)
Fund Balances, January 1 374,515 428,833
Fund Balances, December 31 406,244$ 374,515$
Amounts reported for governmental activities in the statementof activities are different because
Net change in fund balances - governmental funds as shown above 31,729$ (54,318)$
Certain revenues are recognized as soon as they are earned. Under the modified accrual basis of accounting certain revenues cannot be recognized until they are available to liquidate liabilities of the current period.
Property taxes 12 317
Certain expenses reported in the statement of activities do not require the use of current financial resources and, therefore, are not reported as expenditures in the governmental funds.
Compensated absences 837 (858) Post employment benefits other than pension costs (6,946) (33)
Internal service funds are used by management to charge the costs of various services to individual funds. The net revenues of certain activitiesof internal service funds is reported with governmental activities. (764) (530)
Change in Net Position - Governmental Activities 24,868$ (55,422)$
165

City of Fairmont, MinnesotaSummary Financial Report
Revenues and Expenditures For General Operations - Governmental Funds
For the Years Ended December 31, 2018 and 2017
2018 2017Revenues
Taxes 5,332,614$ 4,207,083$ 26.75 %Special assessments 401,223 721,283 (44.37) Licenses and permits 161,590 171,720 (5.90) Intergovernmental 5,249,736 5,115,057 2.63 Charges for services 993,274 913,191 8.77 Fines and forfeits 56,420 55,221 2.17 Investment earnings 140,360 170,377 (17.62) Miscellaneous 510,251 504,388 1.16 Payments from Component Unit for debt service 800 - N/A
Total Revenues 12,846,268$ 11,858,320$ 8.33 %Per Capita 1,243$ 1,145$ 8.55 %
ExpendituresCurrent
General government 1,438,470$ 1,240,887$ 15.92 %Public safety 3,460,352 3,247,776 6.55 Streets and highways 1,663,997 1,445,935 15.08 Sanitation and waste removal 138,077 148,959 (7.31) Culture and recreation 1,413,771 1,377,943 2.60 Housing and economic development 241,698 319,018 (24.24) Miscellaneous 543,120 456,424 18.99
Capital outlayGeneral government 34,203 92,042 (62.84) Public safety 153,385 451,377 (66.02) Streets and highways 1,435,576 4,081,660 (64.83) Culture and recreation 416,307 321,579 29.46 Miscellaneous 137,781 65,790 109.43
Debt servicePrincipal 2,430,000 3,730,000 (34.85) Interest and other charges 302,763 333,112 (9.11) Bond issuance costs - 41,379 (100.00)
Total Expenditures 13,809,500$ 17,353,881$ (20.42) %Per Capita 1,337$ 1,676$ (20.26) %
Total Long-term Indebtedness 12,235,000$ 14,665,000$ (16.57) %Per Capita 1,184 1,417 (16.40)
General Fund Balance - December 31 7,863,525$ 7,249,714$ 8.47 %Per Capita 761 700 8.69
The purpose of this report is to provide a summary of financial information concerning the City of Fairmont to interestedcitizens. The complete financial statements may be examined at City Hall, 100 Downtown Plaza, PO Box 751, Fairmont, MN 56031. Questions about this report should be directed to Paul Hoye at (507) 238-9461.
(Decrease)IncreasePercent
Total
166

Statistical Section
STATISTICAL SECTION (UNAUDITED)
This part of the City of Fairmont’s comprehensive annual financial report presents detailed information as a context for understanding what the information in the financial statements, note disclosures, and required supplementary information says about the government’s overall financial health. Financial Trends These schedules contain trend information to help the reader understand how the government’s financial performance and well-being have changed over time.
Revenue Capacity These schedules contain information to help the reader assess the government’s most significant local revenue source, the property tax. Debt Capacity These schedules present information to help the reader assess the affordability of the government’s current levels of outstanding debt and the government’s ability to issue additional debt in the future. Demographic and Economic Information These schedules offer demographic and economic indicators to help the reader understand the environment within which the government’s financial activities take place. Operating Information These schedules contain service and infrastructure data to help the reader understand how the information in the government’s financial report relates to the services the government provides and the activities it performs.
167

THIS PAGE IS LEFT
BLANK INTENTIONALLY
168

THIS PAGE IS LEFT
BLANK INTENTIONALLY
169

2018 2017 2016 2015 2014Governmental Activities
Net investment in capital assets 44,638,223$ 43,687,451$ 42,677,369 41,232,320$ 40,916,624$ Restricted 10,334,955 9,971,329 9,958,778 12,367,042 12,265,446 Unrestricted 5,821,059 4,619,117 3,969,515 2,908,794 1,550,558
Total Governmental Activities Net Position 60,794,237 58,277,897 56,605,662 56,508,156 54,732,628
Business-type ActivitiesNet investment in capital assets 36,725,415 35,673,883 34,422,093 33,949,598 33,735,220 Restricted - - - - - Unrestricted 13,378,042 13,113,654 13,095,940 12,197,684 11,263,786
Total Business-type Activities Net Position 50,103,457 48,787,537 47,518,033 46,147,282 44,999,006
Primary governmentNet investment in capital assets 81,363,638 79,361,334 77,099,462 75,181,918 74,651,844 Restricted 10,334,955 9,971,329 9,958,778 12,367,042 12,265,446 Unrestricted 19,199,101 17,732,771 17,065,455 15,106,478 12,814,344
Total Primary Government Net Position 110,897,694$ 107,065,434$ 104,123,695$ 102,655,438$ 99,731,634$
Fiscal Year
City of Fairmont, MinnesotaNet Position By Component
Last Ten Fiscal Years(accrual basis of accounting)
170
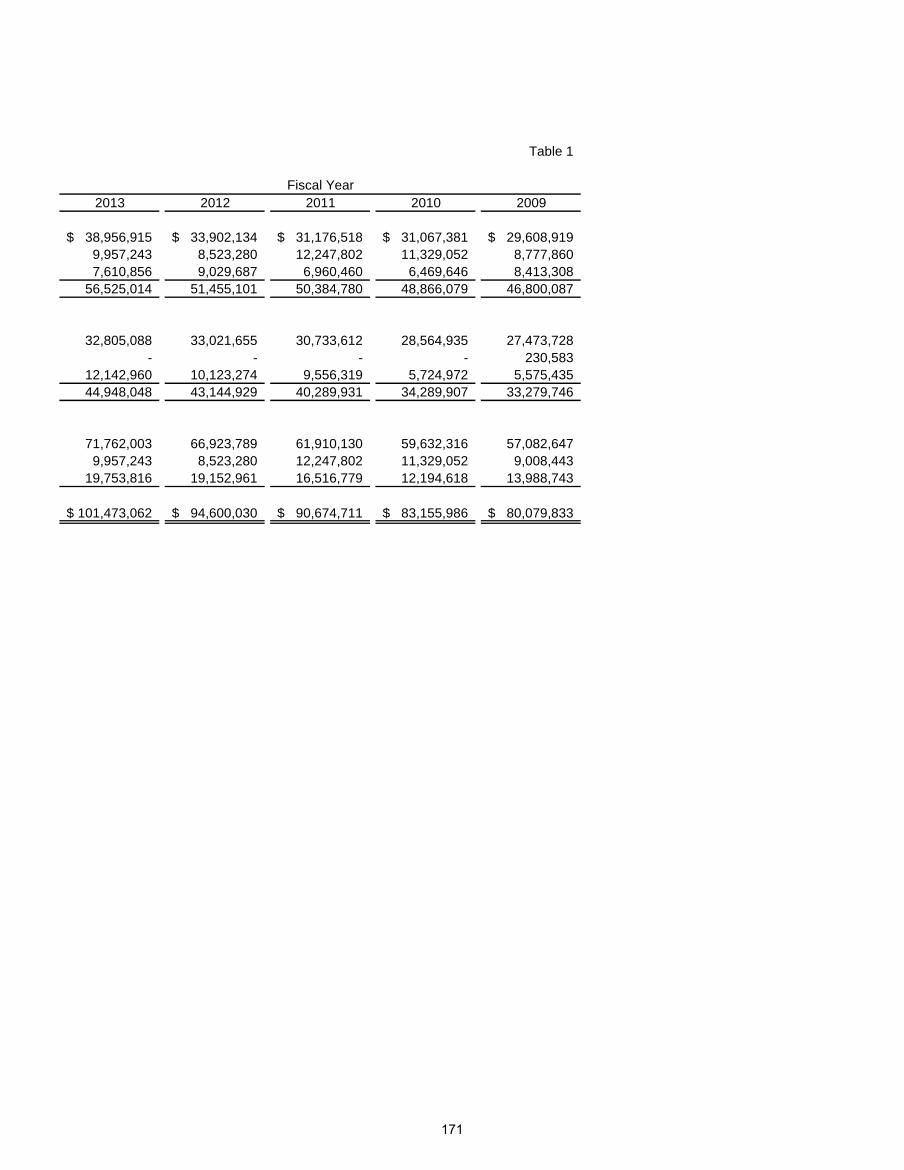
Table 1
2013 2012 2011 2010 2009
38,956,915$ 33,902,134$ 31,176,518$ 31,067,381$ 29,608,919$ 9,957,243 8,523,280 12,247,802 11,329,052 8,777,860 7,610,856 9,029,687 6,960,460 6,469,646 8,413,308
56,525,014 51,455,101 50,384,780 48,866,079 46,800,087
32,805,088 33,021,655 30,733,612 28,564,935 27,473,728 - - - - 230,583
12,142,960 10,123,274 9,556,319 5,724,972 5,575,435 44,948,048 43,144,929 40,289,931 34,289,907 33,279,746
71,762,003 66,923,789 61,910,130 59,632,316 57,082,647 9,957,243 8,523,280 12,247,802 11,329,052 9,008,443
19,753,816 19,152,961 16,516,779 12,194,618 13,988,743
101,473,062$ 94,600,030$ 90,674,711$ 83,155,986$ 80,079,833$
Fiscal Year
171

City of Fairmont, MinnesotaChanges in Net Position (Continued on the Following Pages)
Last Ten Fiscal Years(accrual basis of accounting)
2018 2017 2016 2015 2014ExpensesGovernmental Activities
General government 1,538,761$ 1,389,155$ 1,315,890$ 1,216,566$ 1,143,844$ Public safety 3,490,270 3,598,787 3,806,893 2,717,662 3,035,606 Public works/streets 3,036,945 2,988,471 2,787,405 3,128,949 2,566,565 Sanitation and waste removal 138,077 148,959 138,831 100,740 132,693 Culture and recreation 1,762,810 1,758,014 1,643,560 1,584,291 1,520,715 Housing development 94,458 143,337 127,407 120,042 173,290 Economic development 207,984 243,958 234,923 148,400 55,579 Miscellaneous 1,009,453 918,959 910,637 728,443 760,332 Interest on long-term debt 266,725 313,947 323,637 477,400 446,355
Total Governmental Activities Expenses 11,545,483 11,503,587 11,289,183 10,222,493 9,834,979
Business-type ActivitiesElectric 14,995,845 14,731,070 14,297,048 13,285,756 13,617,700 District heat - - - - - Water 3,600,037 3,541,198 3,547,150 3,279,741 2,489,640 Wastewater 1,812,529 1,876,476 1,745,686 1,818,529 1,811,386 Storm sewer 461,741 482,469 437,661 453,463 421,155 Liquor 3,210,279 3,181,621 3,134,956 3,035,247 2,950,980 Parking lot 7,389 8,180 6,432 5,252 4,663
Total Business-type Activities Expenses 24,087,820 23,821,014 23,168,933 21,877,988 21,295,524
Total Primary Government Expenses 35,633,303$ 35,324,601$ 34,458,116$ 32,100,481$ 31,130,503$
Fiscal Year
172
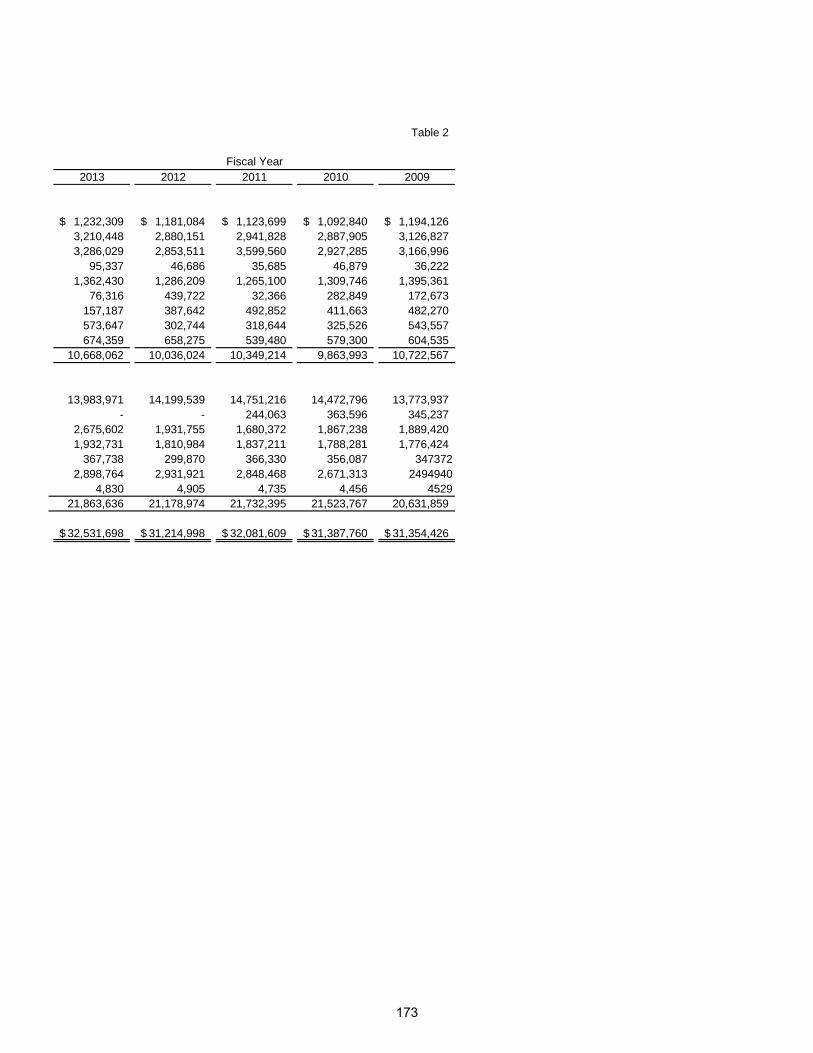
Table 2
2013 2012 2011 2010 2009
1,232,309$ 1,181,084$ 1,123,699$ 1,092,840$ 1,194,126$ 3,210,448 2,880,151 2,941,828 2,887,905 3,126,827 3,286,029 2,853,511 3,599,560 2,927,285 3,166,996
95,337 46,686 35,685 46,879 36,222 1,362,430 1,286,209 1,265,100 1,309,746 1,395,361
76,316 439,722 32,366 282,849 172,673 157,187 387,642 492,852 411,663 482,270 573,647 302,744 318,644 325,526 543,557 674,359 658,275 539,480 579,300 604,535
10,668,062 10,036,024 10,349,214 9,863,993 10,722,567
13,983,971 14,199,539 14,751,216 14,472,796 13,773,937 - - 244,063 363,596 345,237
2,675,602 1,931,755 1,680,372 1,867,238 1,889,420 1,932,731 1,810,984 1,837,211 1,788,281 1,776,424
367,738 299,870 366,330 356,087 3473722,898,764 2,931,921 2,848,468 2,671,313 2494940
4,830 4,905 4,735 4,456 452921,863,636 21,178,974 21,732,395 21,523,767 20,631,859
32,531,698$ 31,214,998$ 32,081,609$ 31,387,760$ 31,354,426$
Fiscal Year
173

City of Fairmont, MinnesotaChanges in Net Position (Continued)
Last Ten Fiscal Years(accrual basis of accounting)
2018 2017 2016 2015 2014Program RevenuesGovernmental Activities
Charges for servicesGeneral government 239,759$ 200,395$ 206,187$ 218,618$ 223,894$ Public safety 309,577 351,871 229,177 267,438 173,616 Public works/streets 13,302 13,080 7,995 3,327 1,177 Sanitation and waste removal 137,360 161,680 162,841 142,225 98,879 Culture and recreation 171,529 184,505 188,734 185,412 167,287 Housing development 22,226 17,786 9,044 7,669 7,585 Economic development 65,454 66,613 65,973 76,006 68,833 Miscellaneous 470,217 471,129 491,669 517,193 511,424
Operating grants and contributions 613,636 340,258 413,384 369,600 285,926 Capital grants and contributions 1,216,811 2,200,736 890,243 824,310 2,031,172
Total Governmental Activities Program Revenues 3,259,871 4,008,053 2,665,247 2,611,798 3,569,793
Business-type ActivitiesCharges for services
Electric 16,405,873 15,866,026 15,375,663 14,599,368 14,742,850 District heat - - - - - Water 3,521,529 3,494,693 3,502,969 3,359,568 3,299,993 Wastewater 2,305,792 2,334,393 2,389,450 2,349,903 2,602,355 Storm sewer 581,475 582,584 581,011 582,566 583,369 Liquor 3,809,557 3,685,869 3,684,982 3,597,659 3,446,532 Parking 6,480 6,749 5,708 5,773 4,837
Operating grants and contributions - - - - - Capital grants and contributions 1,460 44,417 10,227 (97) 7,429
Total Business-type Activities Program Revenues 26,632,166 26,014,731 25,550,010 24,494,740 24,687,365
Total Primary Government Program Revenues 29,892,037$ 30,022,784$ 28,215,257$ 27,106,538$ 28,257,158$
Net (Expense)/RevenueGovernmental Activities (8,285,612)$ (7,495,534)$ (8,623,936)$ (7,610,695)$ (6,265,186)$ Business-type Activities 2,544,346 2,193,717 2,381,077 2,616,752 3,391,841
Total Primary Government Net (Expense) Revenue (5,741,266)$ (5,301,817)$ (6,242,859)$ (4,993,943)$ (2,873,345)$
Fiscal Year
174
lmunguia_ABDO16C
Sticky Note
Marked set by lmunguia_ABDO16C
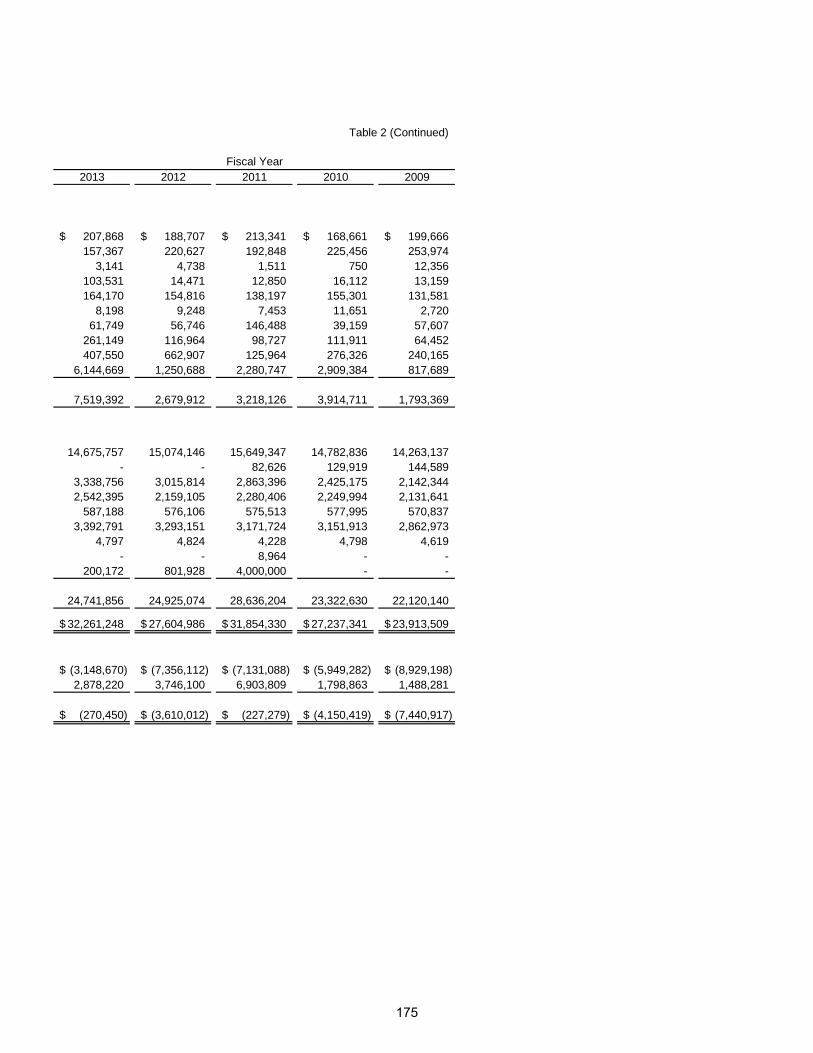
Table 2 (Continued)
2013 2012 2011 2010 2009
207,868$ 188,707$ 213,341$ 168,661$ 199,666$ 157,367 220,627 192,848 225,456 253,974
3,141 4,738 1,511 750 12,356 103,531 14,471 12,850 16,112 13,159 164,170 154,816 138,197 155,301 131,581
8,198 9,248 7,453 11,651 2,720 61,749 56,746 146,488 39,159 57,607
261,149 116,964 98,727 111,911 64,452 407,550 662,907 125,964 276,326 240,165
6,144,669 1,250,688 2,280,747 2,909,384 817,689
7,519,392 2,679,912 3,218,126 3,914,711 1,793,369
14,675,757 15,074,146 15,649,347 14,782,836 14,263,137 - - 82,626 129,919 144,589
3,338,756 3,015,814 2,863,396 2,425,175 2,142,344 2,542,395 2,159,105 2,280,406 2,249,994 2,131,641
587,188 576,106 575,513 577,995 570,837 3,392,791 3,293,151 3,171,724 3,151,913 2,862,973
4,797 4,824 4,228 4,798 4,619 - - 8,964 - -
200,172 801,928 4,000,000 - -
24,741,856 24,925,074 28,636,204 23,322,630 22,120,140
32,261,248$ 27,604,986$ 31,854,330$ 27,237,341$ 23,913,509$
(3,148,670)$ (7,356,112)$ (7,131,088)$ (5,949,282)$ (8,929,198)$ 2,878,220 3,746,100 6,903,809 1,798,863 1,488,281
(270,450)$ (3,610,012)$ (227,279)$ (4,150,419)$ (7,440,917)$
Fiscal Year
175

City of Fairmont, MinnesotaChanges in Net Position (Continued)
(accrual basis of accounting)
2018 2017 2016 2015 2014General Revenues and Other
Changes in Net PositionGovernmental Activities
TaxesProperty taxes, levied for general purposes 3,295,022$ 2,912,776$ 2,556,358$ 2,297,072$ 2,153,651$ Property taxes, levied for debt service 1,124,959 1,003,754 1,074,582 1,025,796 1,094,331 Tax increments 139,090 92,094 74,173 67,165 27,020 Sales tax 740,471 175,477 - - - Franchise taxes 41,480 40,696 39,526 38,294 36,927
Grants and contributions not restricted to specific programs 3,614,236 3,469,459 3,646,550 3,691,778 3,789,473
Unrestricted investment earnings (loss) 158,834 182,987 138,795 94,493 170,917 Other revenues 15,278 9,459 13,141 567,451 33,139 Gain on sale of capital assets 199,334 193,935 28,684 38,485 69,662 Transfers 1,385,000 1,087,132 1,149,633 1,565,689 964,632
Total Governmental Activities 10,713,704 9,167,769 8,721,442 9,386,223 8,339,752
Business-type ActivitiesUnrestricted investment earnings 255,218 162,919 139,307 97,213 89,997 Transfers (1,385,000) (1,087,132) (1,149,633) (1,565,689) (964,632)
Total Business-type Activities (1,129,782) (924,213) (1,010,326) (1,468,476) (874,635)
Total Primary Government 9,583,922$ 8,243,556$ 7,711,116$ 7,917,747$ 7,465,117$
Changes in Net PositionGovernmental Activities 2,428,092$ 1,672,235$ 97,506$ 1,775,528$ 2,074,566$ Business-type Activities 1,414,564 1,269,504 1,370,751 1,148,276 2,517,206
Total Primary Government 3,842,656$ 2,941,739$ 1,468,257$ 2,923,804$ 4,591,772$
Last Ten Fiscal Years
Fiscal Year
176
lmunguia_ABDO16C
Sticky Note
Marked set by lmunguia_ABDO16C

Table 2 (Continued)
2013 2012 2011 2010 2009
1,975,108$ 1,885,398$ 1,596,716$ 1,473,465$ 1,384,997$ 1,153,660 1,152,523 1,025,257 1,013,775 1,019,496
- 334,725 341,402 563,453 618,379 - - - - -
36,205 34,343 35,392 35,749 35,119
3,918,992 3,822,810 3,795,820 3,863,130 4,228,418 (14,237) 144,501 148,810 155,334 182,804 17,052 32,397 7,615 10,497 68,704 3,241 42,104 957,136 6,423 767
1,128,562 977,632 941,148 890,561 885,601 8,218,583 8,426,433 8,849,296 8,012,387 8,424,285
53,461 86,530 53,591 101,859 73,871 (1,128,562) (977,632) (941,148) (890,561) (885,601) (1,075,101) (891,102) (887,557) (788,702) (811,730)
7,143,482$ 7,535,331$ 7,961,739$ 7,223,685$ 7,612,555$
5,069,913$ 1,070,321$ 1,718,208$ 2,063,105$ (504,913)$ 1,803,119 2,854,998 6,016,252 1,010,161 676,551
6,873,032$ 3,925,319$ 7,734,460$ 3,073,266$ 171,638$
Fiscal Year
177

THIS PAGE IS LEFT
BLANK INTENTIONALLY
178

City of Fairmont, MinnesotaGovernmental Activities Tax Revenues By Source
(accrual basis of accounting)
Table 3
Levied for Levied forFiscal General Debt Tax Sales Franchise Year Purposes Service Increments Tax Tax Total
2018 3,295,022$ 1,124,959$ 139,090$ 740,471$ 41,480$ 5,341,022$ 2017 2,912,776 1,003,754 92,094 175,477 40,696 4,224,797 2016 2,556,358 1,074,582 74,173 - 39,526 3,744,639 2015 2,297,072 1,025,796 67,165 - 38,294 3,428,327 2014 2,153,651 1,094,331 27,020 - 36,927 3,311,929 2013 1,975,108 1,153,660 - - 36,205 3,164,973 2012 1,885,398 1,152,523 334,725 - 34,343 3,406,989 2011 1,596,716 1,025,257 341,402 - 35,392 2,998,767 2010 1,473,465 1,013,775 563,453 - 35,749 3,086,442 2009 1,384,997 1,019,496 618,379 - 35,119 3,057,991
Property Taxes
Last Ten Fiscal Years
179
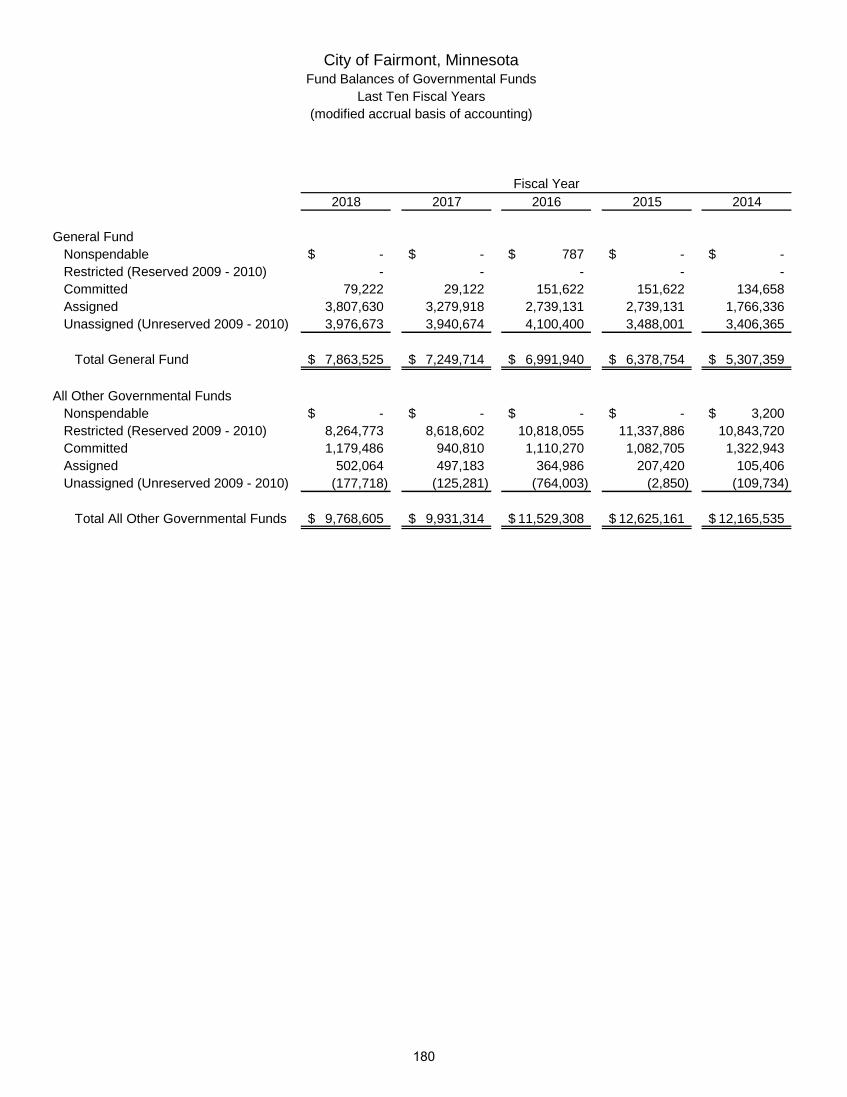
2018 2017 2016 2015 2014
General FundNonspendable -$ -$ 787$ -$ -$ Restricted (Reserved 2009 - 2010) - - - - - Committed 79,222 29,122 151,622 151,622 134,658 Assigned 3,807,630 3,279,918 2,739,131 2,739,131 1,766,336 Unassigned (Unreserved 2009 - 2010) 3,976,673 3,940,674 4,100,400 3,488,001 3,406,365
Total General Fund 7,863,525$ 7,249,714$ 6,991,940$ 6,378,754$ 5,307,359$
All Other Governmental FundsNonspendable -$ -$ -$ -$ 3,200$ Restricted (Reserved 2009 - 2010) 8,264,773 8,618,602 10,818,055 11,337,886 10,843,720 Committed 1,179,486 940,810 1,110,270 1,082,705 1,322,943 Assigned 502,064 497,183 364,986 207,420 105,406 Unassigned (Unreserved 2009 - 2010) (177,718) (125,281) (764,003) (2,850) (109,734)
Total All Other Governmental Funds 9,768,605$ 9,931,314$ 11,529,308$ 12,625,161$ 12,165,535$
Fiscal Year
Fund Balances of Governmental FundsCity of Fairmont, Minnesota
Last Ten Fiscal Years(modified accrual basis of accounting)
180

Table 4
2013 2012 2011 2010 2009
205,000$ 205,000$ -$ -$ -$ - - - - 2,300
135,575 104,777 40,387 - - 989,402 909,063 1,757,373 - -
3,225,036 3,178,069 3,456,713 4,889,101 4,744,998
4,555,013$ 4,396,909$ 5,254,473$ 4,889,101$ 4,747,298$
3,200$ 4,080$ 4,000$ -$ -$ 12,731,158 12,491,677 8,178,777 7,530,799 6,368,794
604,172 137,347 89,950 - - 2,045,307 2,412,379 2,525,140 - -
(10,218) (207,534) (276,237) 3,242,524 2,248,030
15,373,619$ 14,837,949$ 10,521,630$ 10,773,323$ 8,616,824$
Fiscal Year
181

City of Fairmont, Minnesota
(modified accrual basis of accounting)
2018 2017 2016 2015 2014Revenues
Taxes 5,332,614$ 4,207,083$ 3,768,410$ 3,448,929$ 3,307,262$ Special assessments 401,223 721,283 459,825 589,366 674,620 Intergovernmental revenue 5,249,736 5,115,057 4,831,630 4,313,685 5,786,044 Licenses and permits 161,590 171,720 155,757 213,922 149,066 Charges for services 993,274 913,191 830,732 799,346 668,623 Fines and forfeits 56,420 55,221 55,554 56,129 66,829 Interest 140,360 170,377 127,993 86,920 165,770 Other revenues 511,051 504,388 411,293 974,449 429,845
Total Revenues 12,846,268 11,858,320 10,641,194 10,482,746 11,248,059
ExpendituresGeneral government 1,438,470 1,240,887 1,133,899 1,218,580 1,041,291 Public safety 3,460,352 3,247,776 3,079,878 3,016,290 2,902,658 Public works 1,802,074 1,636,273 1,577,725 1,561,660 1,402,299 Culture and recreation 1,413,771 1,377,943 1,319,819 1,330,948 1,419,270 Housing and economic development 241,698 319,018 283,659 199,147 262,042 Public transportation 543,120 456,424 460,580 492,002 566,190 Capital outlay 2,177,252 5,012,448 3,058,970 3,452,739 2,286,066 Debt service
Principal 2,430,000 3,730,000 3,780,000 1,230,000 4,650,000 Interest and fees 302,763 333,112 390,173 408,708 504,376 Total Expenditures 13,809,500 17,353,881 15,084,703 12,910,074 15,034,192
Deficiency of RevenuesUnder Expenditures (963,232) (5,495,561) (4,443,509) (2,427,328) (3,786,133)
Other Financing Sources (Uses)Proceeds from sale of capital assets 29,334 43,435 28,684 38,485 69,662 Transfers in 2,832,281 4,520,394 1,734,065 2,366,802 989,632 Transfers out (1,447,281) (3,433,262) (584,432) (801,113) (25,000) Bonds issued - 2,950,000 2,715,000 2,330,000 - Premium (discount) on bonds issued - 74,774 67,525 24,175 -
Total Other Financing Sources (Uses) 1,414,334 4,155,341 3,960,842 3,958,349 1,034,294
Net Change in Fund Balances 451,102$ (1,340,220)$ (482,667)$ 1,531,021$ (2,751,839)$
Debt service as a percentage of noncapital expenditures 23% 32% 34% 16% 40%
Fiscal Year
Changes in Fund Balances of Governmental FundsLast Ten Fiscal Years
182
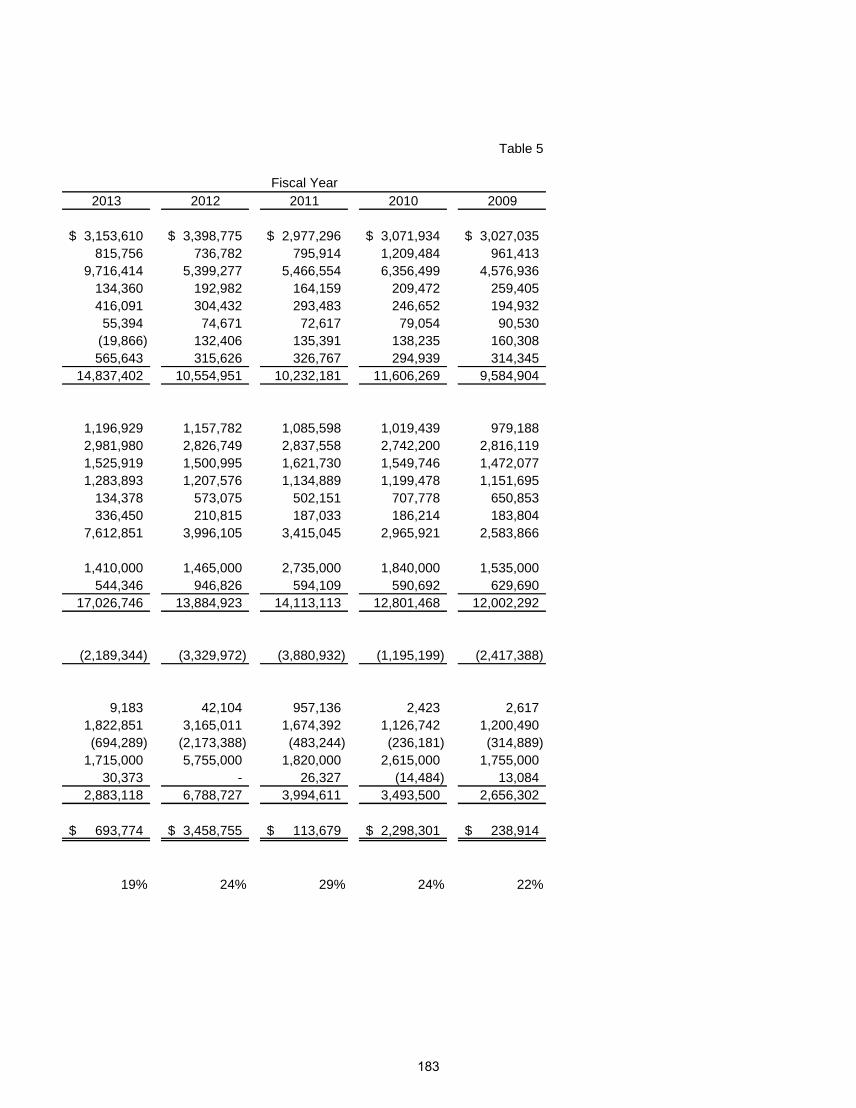
Table 5
2013 2012 2011 2010 2009
3,153,610$ 3,398,775$ 2,977,296$ 3,071,934$ 3,027,035$ 815,756 736,782 795,914 1,209,484 961,413
9,716,414 5,399,277 5,466,554 6,356,499 4,576,936 134,360 192,982 164,159 209,472 259,405 416,091 304,432 293,483 246,652 194,932
55,394 74,671 72,617 79,054 90,530 (19,866) 132,406 135,391 138,235 160,308 565,643 315,626 326,767 294,939 314,345
14,837,402 10,554,951 10,232,181 11,606,269 9,584,904
1,196,929 1,157,782 1,085,598 1,019,439 979,188 2,981,980 2,826,749 2,837,558 2,742,200 2,816,119 1,525,919 1,500,995 1,621,730 1,549,746 1,472,077 1,283,893 1,207,576 1,134,889 1,199,478 1,151,695
134,378 573,075 502,151 707,778 650,853 336,450 210,815 187,033 186,214 183,804
7,612,851 3,996,105 3,415,045 2,965,921 2,583,866
1,410,000 1,465,000 2,735,000 1,840,000 1,535,000 544,346 946,826 594,109 590,692 629,690
17,026,746 13,884,923 14,113,113 12,801,468 12,002,292
(2,189,344) (3,329,972) (3,880,932) (1,195,199) (2,417,388)
9,183 42,104 957,136 2,423 2,617 1,822,851 3,165,011 1,674,392 1,126,742 1,200,490 (694,289) (2,173,388) (483,244) (236,181) (314,889)
1,715,000 5,755,000 1,820,000 2,615,000 1,755,000 30,373 - 26,327 (14,484) 13,084
2,883,118 6,788,727 3,994,611 3,493,500 2,656,302
693,774$ 3,458,755$ 113,679$ 2,298,301$ 238,914$
19% 24% 29% 24% 22%
Fiscal Year
183

THIS PAGE IS LEFT
BLANK INTENTIONALLY
184

City of Fairmont, MinnesotaGeneral Governmental Tax Revenues by Source
Last Ten Fiscal Years(modified accrual basis of accounting)
Table 6
Fiscal Property Tax Increment Sales FranchiseYear Tax Tax Tax Tax Total
2018 4,412,373$ 138,290$ 740,471$ 41,480$ 5,332,614$ 2017 3,898,816 92,094 175,477 40,696 4,207,083 2016 3,654,711 74,173 - 39,526 3,768,410 2015 3,343,470 67,165 - 38,294 3,448,929 2014 3,243,315 27,020 - 36,927 3,307,262 2013 3,117,405 - - 36,205 3,153,610 2012 3,029,707 334,725 - 34,343 3,398,775 2011 2,600,502 341,402 - 35,392 2,977,296 2010 2,472,023 564,162 - 35,749 3,071,934 2009 2,396,672 595,244 - 35,119 3,027,035
185
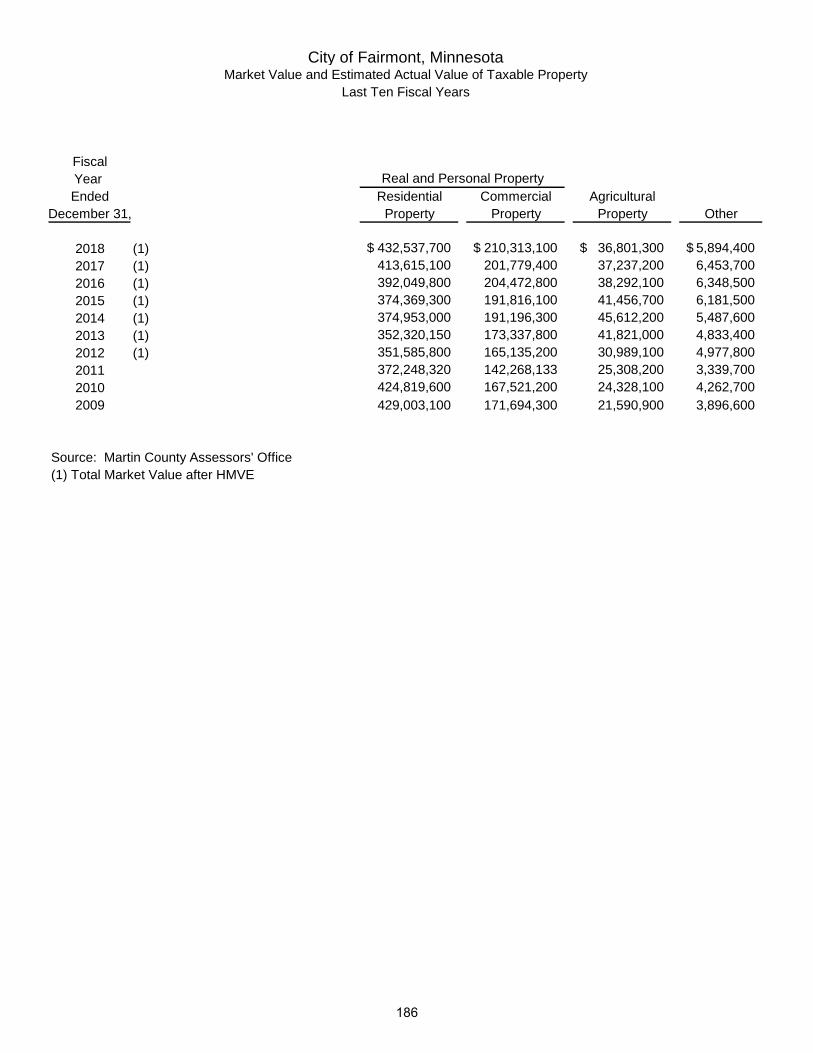
City of Fairmont, MinnesotaMarket Value and Estimated Actual Value of Taxable Property
Last Ten Fiscal Years
FiscalYear Ended Residential Commercial Agricultural
December 31, Property Property Property Other
2018 (1) 432,537,700$ 210,313,100$ 36,801,300$ 5,894,400$ 2017 (1) 413,615,100 201,779,400 37,237,200 6,453,700 2016 (1) 392,049,800 204,472,800 38,292,100 6,348,500 2015 (1) 374,369,300 191,816,100 41,456,700 6,181,500 2014 (1) 374,953,000 191,196,300 45,612,200 5,487,600 2013 (1) 352,320,150 173,337,800 41,821,000 4,833,400 2012 (1) 351,585,800 165,135,200 30,989,100 4,977,800 2011 372,248,320 142,268,133 25,308,200 3,339,700 2010 424,819,600 167,521,200 24,328,100 4,262,700 2009 429,003,100 171,694,300 21,590,900 3,896,600
Source: Martin County Assessors' Office(1) Total Market Value after HMVE
Real and Personal Property
186

Table 7
TotalTotal Taxable Direct Indicated
Market Tax MarketValue Rate Value
685,546,500$ 55.687 759,629,000$ 90.25 %659,085,400 55.747 732,710,900 89.95 641,163,200 50.505 716,148,600 89.53 613,823,600 48.739 689,312,500 89.05 617,249,100 46.165 692,285,200 89.16 572,312,350 48.381 647,810,000 88.35 552,687,900 48.349 629,089,800 87.86 543,164,353 49.454 670,211,836 81.04 620,931,600 42.272 675,914,203 91.87 626,184,900 39.481 592,616,000 105.66
Actual ValuePercentage ofValue (1) as a
Assessed
187
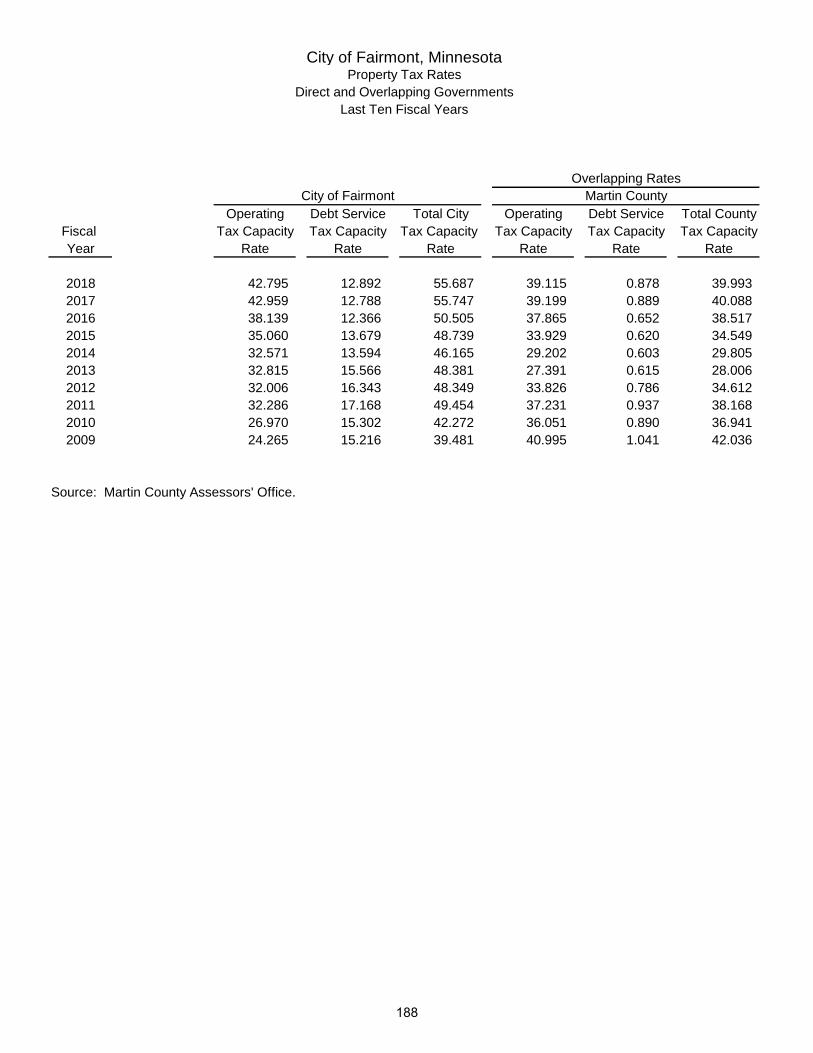
City of Fairmont, MinnesotaProperty Tax Rates
Direct and Overlapping GovernmentsLast Ten Fiscal Years
Operating Debt Service Total City Operating Debt Service Total CountyFiscal Tax Capacity Tax Capacity Tax Capacity Tax Capacity Tax Capacity Tax CapacityYear Rate Rate Rate Rate Rate Rate
2018 42.795 12.892 55.687 39.115 0.878 39.993 2017 42.959 12.788 55.747 39.199 0.889 40.088 2016 38.139 12.366 50.505 37.865 0.652 38.517 2015 35.060 13.679 48.739 33.929 0.620 34.549 2014 32.571 13.594 46.165 29.202 0.603 29.805 2013 32.815 15.566 48.381 27.391 0.615 28.006 2012 32.006 16.343 48.349 33.826 0.786 34.612 2011 32.286 17.168 49.454 37.231 0.937 38.168 2010 26.970 15.302 42.272 36.051 0.890 36.941 2009 24.265 15.216 39.481 40.995 1.041 42.036
Source: Martin County Assessors' Office.
City of Fairmont Martin CountyOverlapping Rates
188
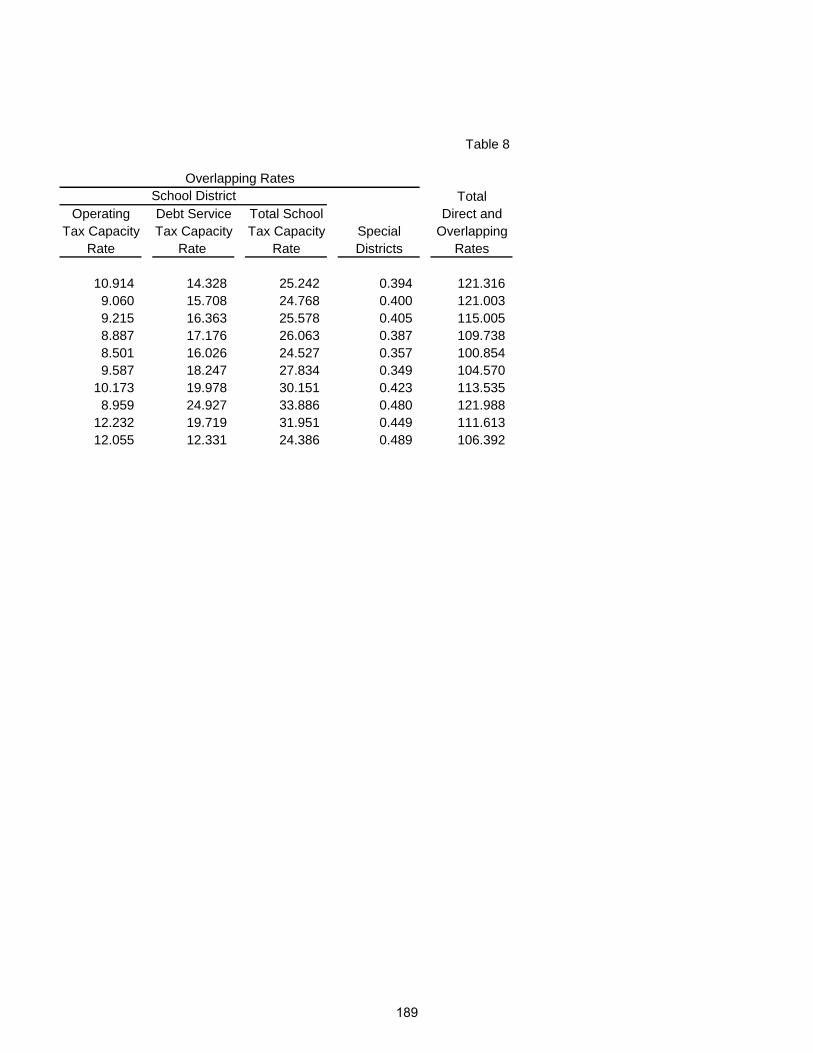
Table 8
TotalOperating Debt Service Total School Direct and
Tax Capacity Tax Capacity Tax Capacity Special OverlappingRate Rate Rate Districts Rates
10.914 14.328 25.242 0.394 121.316 9.060 15.708 24.768 0.400 121.003 9.215 16.363 25.578 0.405 115.005 8.887 17.176 26.063 0.387 109.738 8.501 16.026 24.527 0.357 100.854 9.587 18.247 27.834 0.349 104.570
10.173 19.978 30.151 0.423 113.535 8.959 24.927 33.886 0.480 121.988
12.232 19.719 31.951 0.449 111.613 12.055 12.331 24.386 0.489 106.392
School DistrictOverlapping Rates
189
lmunguia_ABDO16C
Sticky Note
Marked set by lmunguia_ABDO16C

City of Fairmont, MinnesotaPrincipal Property Taxpayers
Current Year and Nine Years Ago
TaxableMarket
Taxpayer Type of Business Value Rank
Cenex Harvest States Soybean Crushing 22,748,900$ 1 3.3 %Green Plains Fairmont LLC Ethanol Manufacturing 20,368,700 2 3.0 Wal-Mart Retail 10,991,800 3 1.6 SMMPA Utilities 9,379,300 4 1.4 Mayo Health Systems-Fairmont Medical Facility 7,217,700 5 1.1 Goldfinch Estates Assisted Living 9,569,400 6 1.4 Capview Income & Value Fund Retail 5,426,000 7 0.8 Bank Midwest Banking 5,342,400 8 0.8 Weigh-Tronix, Inc. Scale Manufacturing 4,435,000 9 0.7 Minnesota Energy Resources Utilities 4,163,000 10 0.6 Five Lakes Center Shopping Center - - Holiday Inn Hotel - - Hawkeye Foodservice Distribution - - Fairmont Foods Food Processing - -
Total 99,642,200$ 14.7 %
Source: Martin County Assessors' Office.
Percentage of2018
ValueMarket
Total Taxable
190
lmunguia_ABDO16C
Sticky Note
Marked set by lmunguia_ABDO16C

TaxableMarketValue Rank
16,215,100$ 2 2.6 %25,130,900 1 4.0 12,838,800 3 2.1
- - 6,172,500 5 1.0
- - 8,383,400 4 1.3
- - 3,957,700 7 0.6
- - 4,200,000 6 0.7 3,632,600 8 0.6 3,458,000 9 0.6 3,187,500 10 0.5
87,176,500$ 14.0 %
Total TaxablePercentage of
2009
Table 9
ValueMarket
191
lmunguia_ABDO16C
Sticky Note
Marked set by lmunguia_ABDO16C

THIS PAGE IS LEFT
BLANK INTENTIONALLY
192

City of Fairmont, MinnesotaProperty Tax Levies and Collections
Last Ten Fiscal Years
Fiscal Year Total Tax Collections inEnded Levy for Subsequent
December 31, Fiscal Year Amount Years Amount
2018 4,537,870$ 4,485,200$ 98.8 % -$ 4,485,200$ 98.8 %2017 4,049,030 4,000,995 98.8 30,514 4,031,509 99.6 2016 3,714,706 3,680,130 99.1 23,741 3,703,871 99.7 2015 3,410,035 3,372,606 98.9 31,819 3,404,425 99.8 2014 3,310,714 3,264,224 98.6 45,022 3,309,246 100.0 2013 3,214,285 3,156,697 98.2 55,811 3,212,508 99.9 2012 3,120,665 3,064,821 98.2 53,935 3,118,756 99.9 2011 2,992,245 2,936,191 98.1 54,693 2,990,884 100.0 2010 2,857,242 2,816,532 98.6 39,652 2,856,184 100.0 2009 2,760,620 2,727,817 98.8 32,595 2,760,412 100.0
Collected within theTotal Collections to Date
Table 10
Fiscal Year of the Levy
of Levy of LevyPercentage Percentage
193
lmunguia_ABDO16C
Sticky Note
Marked set by lmunguia_ABDO16C

City of Fairmont, MinnesotaRatios of Outstanding Debt by Type
Last Ten Fiscal Years
General Special Storm General TotalFiscal Obligation Assessment Tax Increment Sewer Obligation PrimaryYear Bonds Bonds Bonds Bonds Revenue Bonds Government
2018 -$ 12,341,734$ -$ 622,878$ 28,019,000$ 40,983,612$ 2017 - 14,791,279 - 814,967 29,530,000 45,136,246 2016 - 15,553,250 - 1,002,055 31,012,000 47,567,305 2015 - 16,628,375 - 1,179,144 32,466,495 50,274,014 2014 - 15,513,284 - 1,356,232 33,815,421 50,684,937 2013 - 20,171,849 - 1,528,321 34,200,762 55,900,932 2012 65,000 19,778,940 - 1,693,321 27,313,160 48,850,421 2011 125,000 15,435,616 - 1,860,409 11,037,587 28,458,612 2010 175,000 15,240,616 245,000 3,777,498 10,148,000 29,586,114 2009 215,000 15,178,624 245,000 4,009,586 10,784,000 30,432,210
Note: Details regarding the City's outstanding debt can be found in the notes to the financial statements.
Governmental Activities Business-type Activities
194

Table 11
Perto Property Value Capita
1.62 % 12.78 % 3,967$ 2.02 15.14 4,360 2.17 15.78 4,565 2.41 17.51 4,804 2.24 18.19 4,830 3.11 20.06 5,327 3.15 17.81 4,643 2.32 10.72 2,677 2.28 11.11 2,774 2.60 15.26 2,848
Incomeof Personal Percentage
Percentageof (Net) General
Bonded Debt
195

THIS PAGE IS LEFT
BLANK INTENTIONALLY
196

December 31, 2018
Table 12
EstimatedShare of
Debt OverlappingOutstanding Debt
City of Fairmont 12,341,734$ 100.00 % 12,341,734$ Total direct debt 12,341,734 12,341,734
Martin County 15,828,000 15.65 2,477,082
Independent School District No. 2752 45,585,000 46.36 21,133,206 Total overlapping debt 61,413,000 23,610,288
Total direct and overlapping debt 73,754,734$ 35,952,022$
Source: Martin County Assessors' Office and Independent School District No. 2752.
Note: Overlapping governments are those that coincide, at least in part, with the geographic boundaries of the City. Thisschedule estimates the portion of the outstanding debt of those overlapping governments that is borne by the residentsand businesses of the City of Fairmont. This process recognized that, when considering the government's ability toissue and repay long-term debt, the entire debt burden borne by the residents and businesses should be taken into account.However, this does not imply that every taxpayer is a resident, and therefore responsible for repaying the debt, of eachoverlapping government.
City of Fairmont, MinnesotaDirect and Overlapping Governmental Activities Debt
ApplicablePercentageEstimated
Governmental Unit
197
lmunguia_ABDO16C
Sticky Note
Marked set by lmunguia_ABDO16C

City of Fairmont, MinnesotaLegal Debt Margin Information
Last Ten Fiscal Years
2018 2017 2016 2015 2014
Debt limit 20,566,395$ 19,772,562$ 19,234,896$ 18,414,708$ 18,517,473$
Total net debt applicable to limit - - - - -
Legal debt margin 20,566,395$ 19,772,562$ 19,234,896$ 18,414,708$ 18,517,473$
Total net debt applicable to the limitas a percentage of debt limit - - - - -
Legal Debt Margin Calculation for Fiscal Year 2018
Market value 685,546,500$
Debt limit (3% of total assessed value) 20,566,395 Debt applicable to limit General obligation bonds - Less Amount set aside for repayment of general obligation debt -
Total net debt applicable to limit -
Legal debt margin 20,566,395$
Note: Under state finance law, the City of Fairmont's outstanding general obligation debt should not exceed 3 percent of totalassessed property value. By law, the general obligation debt subject to the limitation may be offset by amounts set aside for repaying general obligations bonds.
198

Table 13
2013 2012 2011 2010 2009
17,169,371$ 16,580,637$ 16,294,931$ 18,627,948$ 18,785,547$
- 65,000 125,000 175,000 215,000
17,169,371$ 16,515,637$ 16,169,931$ 18,452,948$ 18,570,547$
- 0.4 0.8 0.9 1.1
199
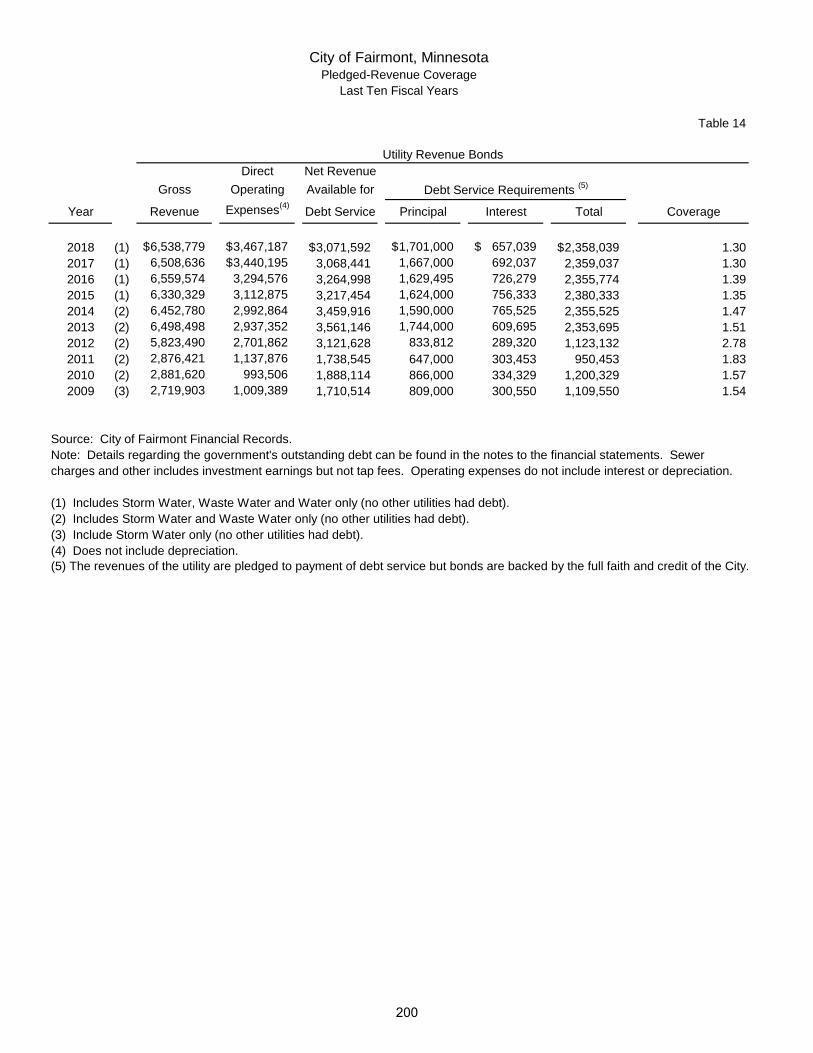
Table 14
Direct Net RevenueGross Operating Available for
Year Revenue Expenses(4) Debt Service Principal Interest Total Coverage
2018 (1) 6,538,779$ 3,467,187$ 3,071,592$ 1,701,000$ 657,039$ 2,358,039$ 1.302017 (1) 6,508,636 3,440,195$ 3,068,441 1,667,000 692,037 2,359,037 1.302016 (1) 6,559,574 3,294,576 3,264,998 1,629,495 726,279 2,355,774 1.392015 (1) 6,330,329 3,112,875 3,217,454 1,624,000 756,333 2,380,333 1.352014 (2) 6,452,780 2,992,864 3,459,916 1,590,000 765,525 2,355,525 1.472013 (2) 6,498,498 2,937,352 3,561,146 1,744,000 609,695 2,353,695 1.512012 (2) 5,823,490 2,701,862 3,121,628 833,812 289,320 1,123,132 2.782011 (2) 2,876,421 1,137,876 1,738,545 647,000 303,453 950,453 1.832010 (2) 2,881,620 993,506 1,888,114 866,000 334,329 1,200,329 1.572009 (3) 2,719,903 1,009,389 1,710,514 809,000 300,550 1,109,550 1.54
Source: City of Fairmont Financial Records.Note: Details regarding the government's outstanding debt can be found in the notes to the financial statements. Sewercharges and other includes investment earnings but not tap fees. Operating expenses do not include interest or depreciation.
(1) Includes Storm Water, Waste Water and Water only (no other utilities had debt).(2) Includes Storm Water and Waste Water only (no other utilities had debt).(3) Include Storm Water only (no other utilities had debt).(4) Does not include depreciation.(5) The revenues of the utility are pledged to payment of debt service but bonds are backed by the full faith and credit of the City.
Debt Service Requirements (5)
City of Fairmont, MinnesotaPledged-Revenue Coverage
Last Ten Fiscal Years
Utility Revenue Bonds
200
lmunguia_ABDO16C
Sticky Note
Marked set by lmunguia_ABDO16C
lmunguia_ABDO16C
Sticky Note
Marked set by lmunguia_ABDO16C
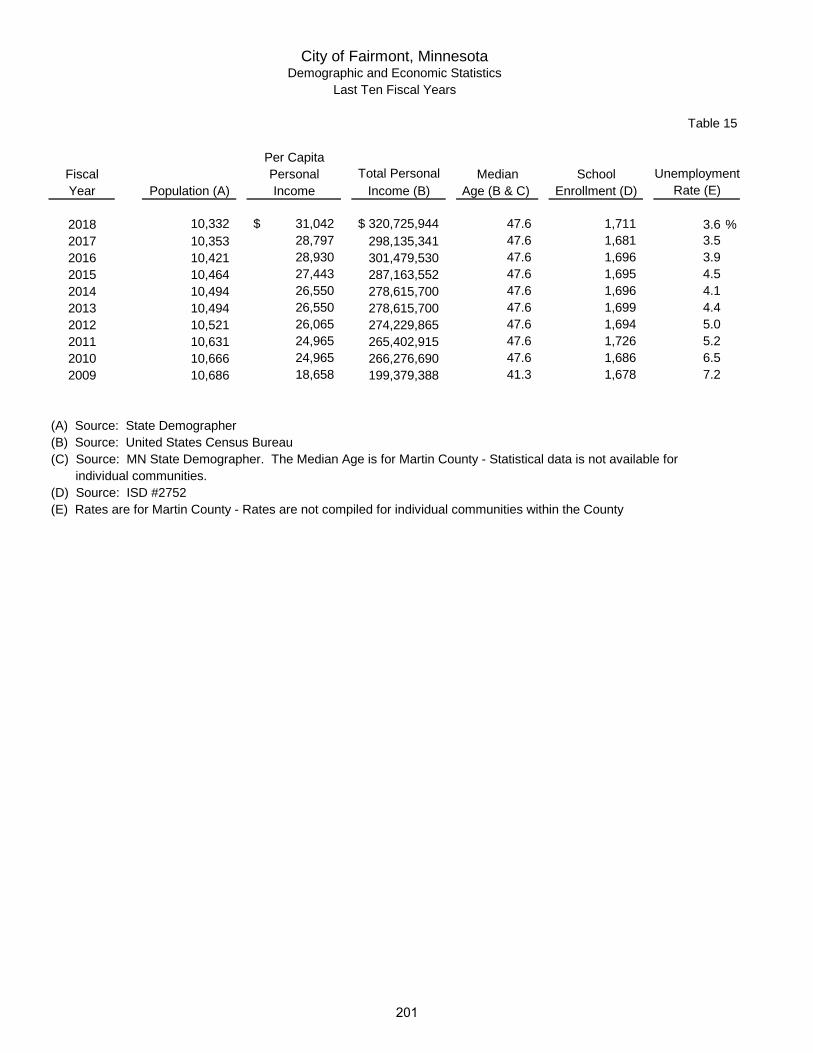
Per CapitaFiscal Personal Total Personal Median SchoolYear Population (A) Income Income (B) Age (B & C) Enrollment (D)
2018 10,332 31,042$ 320,725,944$ 47.6 1,711 3.6 %2017 10,353 28,797 298,135,341 47.6 1,681 3.52016 10,421 28,930 301,479,530 47.6 1,696 3.92015 10,464 27,443 287,163,552 47.6 1,695 4.52014 10,494 26,550 278,615,700 47.6 1,696 4.12013 10,494 26,550 278,615,700 47.6 1,699 4.42012 10,521 26,065 274,229,865 47.6 1,694 5.02011 10,631 24,965 265,402,915 47.6 1,726 5.22010 10,666 24,965 266,276,690 47.6 1,686 6.52009 10,686 18,658 199,379,388 41.3 1,678 7.2
(A) Source: State Demographer(B) Source: United States Census Bureau(C) Source: MN State Demographer. The Median Age is for Martin County - Statistical data is not available for individual communities.(D) Source: ISD #2752(E) Rates are for Martin County - Rates are not compiled for individual communities within the County
City of Fairmont, MinnesotaDemographic and Economic Statistics
Rate (E)Unemployment
Last Ten Fiscal Years
Table 15
201
lmunguia_ABDO16C
Sticky Note
Marked set by lmunguia_ABDO16C

THIS PAGE IS LEFT
BLANK INTENTIONALLY
202

Table 16
Percentageof Total City
Employer Employees Rank Employees Rank
Fairmont Mayo Health Systems 488 1 4.91 % 740 1 6.51 %Weigh-Tronix Scale Manufacturing 350 2 3.52 340 2 2.99 Fairmont Foods of Minnesota 330 3 3.32 300 4 2.64 ISD 2752 260 4 2.62 325 3 2.86 Hy-Vee 240 5 2.41 - - Torgerson Properties 219 6 2.20 - - Wal-Mart 191 7 1.92 - - REM Heartland 185 8 1.86 200 6 1.76 Lakeview Health Care Facility 155 9 1.56 250 5 2.20 Martin County 131 10 1.32 120 10 1.06 3M - - 130 7 1.14 MRCI - - 125 8 1.10 Harsco Track Technologies - - 120 9 1.06
Total 2,549 25.64 % 2,650 23.32 %
Source: State Department of Commerce.
Employmentof Total CityPercentage
2009
City of Fairmont, MinnesotaPrincipal Employers
Current Year and Nine Years Ago
2018
Employment
203
lmunguia_ABDO16C
Sticky Note
Marked set by lmunguia_ABDO16C
lmunguia_ABDO16C
Sticky Note
Marked set by lmunguia_ABDO16C

City of Fairmont, MinnesotaFull-Time Equivalent City Government Employees by Function
Last Ten Fiscal Years
2018 2017 2016 2015 2014
General government 11 11 10 11 11 Public safety
PoliceOfficers 18 18 15 16 16 Civilians 2 2 2 2 2
Streets and highwaysEngineering 4 4 4 3 3 Maintenance 11 10 10 10 10
Culture and recreationParks 10 10 10 9 9
Housing and economic development 4 4 4 3 3 Water 11 12 12 12 11 Sewer 5 5 5 5 5 Electric 11 11 11 11 11 Liquor Store 3 3 3 3 3 Airport 1 1 1 1 1
Total 91 91 87 86 85
Source: City of Fairmont Records
FunctionFull-time Equivalent Employees as of December 31
204

Table 17
2013 2012 2011 2010 2009
11 11 14 14 14
16 17 17 18 18 2 2 2 1 1
4 4 3 4 4 10 10 12 12 12
8 8 8 8 8 2 2 2 2 2
10 10 10 11 11 6 6 6 6 6
12 12 12 17 17 3 3 3 3 3 - - - - -
84 85 89 96 96
Full-time Equivalent Employees as of December 31
205

City of Fairmont, MinnesotaOperating Indicators by Function
Last Ten Fiscal Years
2018 2017 2016 2015 2014Police
Adult arrests 1,320 1,086 916 979 1,310 Juvenile arrests 86 89 69 87 74
FireNumber of fire calls answered 95 104 103 119 114 Number of rescue calls answered 36 40 34 19 17
Highways and streets Street resurfacing (miles) 1 4 1 5 3 Culture and recreation
Attendance at water park 21,691 21,852 25,585 25,336 22,771 Water
Annual water consumption 359,856 371,690 375,715 367,127 354,293 (thousands of gallons)
WastewaterAnnual treatment flows 778,920 586,820 673,240 490,670 475,036 (thousands of gallons)
ElectricAnnual KWH electricity sold 150,728 146,088 147,048 142,562 147,322
(thousands of kwh)
Sources: Various government departments.Note: Indicators are not available for the general government function.
FunctionFiscal Year
206

Table 18
2013 2012 2011 2010 2009
1,178 1,306 1,175 1,483 1,426 54 125 162 125 132
126 122 140 128 97 22 28 20 34 35
4 5 5 4 5
22,400 24,500 21,000 26,346 25,000
414,121 430,334 455,140 465,407 481,836
468,170 404,830 656,800 741,060 536,740
148,187 151,973 156,001 153,605 147,794
Fiscal Year
207
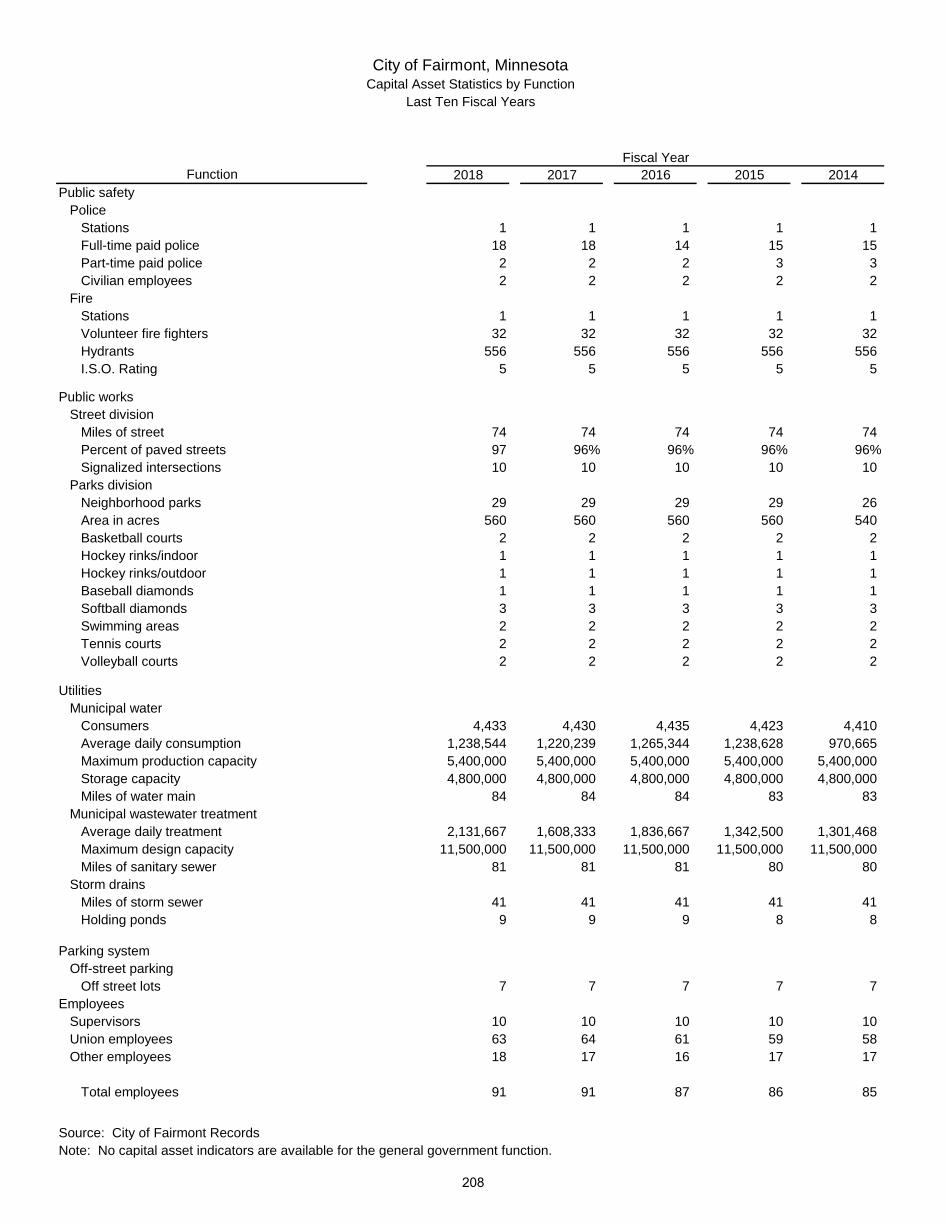
City of Fairmont, MinnesotaCapital Asset Statistics by Function
Last Ten Fiscal Years
2018 2017 2016 2015 2014Public safety
PoliceStations 1 1 1 1 1 Full-time paid police 18 18 14 15 15 Part-time paid police 2 2 2 3 3 Civilian employees 2 2 2 2 2
FireStations 1 1 1 1 1 Volunteer fire fighters 32 32 32 32 32 Hydrants 556 556 556 556 556 I.S.O. Rating 5 5 5 5 5
Public worksStreet division
Miles of street 74 74 74 74 74 Percent of paved streets 97 96% 96% 96% 96%Signalized intersections 10 10 10 10 10
Parks divisionNeighborhood parks 29 29 29 29 26 Area in acres 560 560 560 560 540 Basketball courts 2 2 2 2 2 Hockey rinks/indoor 1 1 1 1 1 Hockey rinks/outdoor 1 1 1 1 1 Baseball diamonds 1 1 1 1 1 Softball diamonds 3 3 3 3 3 Swimming areas 2 2 2 2 2 Tennis courts 2 2 2 2 2 Volleyball courts 2 2 2 2 2
UtilitiesMunicipal water
Consumers 4,433 4,430 4,435 4,423 4,410 Average daily consumption 1,238,544 1,220,239 1,265,344 1,238,628 970,665 Maximum production capacity 5,400,000 5,400,000 5,400,000 5,400,000 5,400,000 Storage capacity 4,800,000 4,800,000 4,800,000 4,800,000 4,800,000 Miles of water main 84 84 84 83 83
Municipal wastewater treatmentAverage daily treatment 2,131,667 1,608,333 1,836,667 1,342,500 1,301,468 Maximum design capacity 11,500,000 11,500,000 11,500,000 11,500,000 11,500,000 Miles of sanitary sewer 81 81 81 80 80
Storm drainsMiles of storm sewer 41 41 41 41 41 Holding ponds 9 9 9 8 8
Parking systemOff-street parking
Off street lots 7 7 7 7 7 Employees
Supervisors 10 10 10 10 10 Union employees 63 64 61 59 58 Other employees 18 17 16 17 17
Total employees 91 91 87 86 85
Source: City of Fairmont RecordsNote: No capital asset indicators are available for the general government function.
FunctionFiscal Year
208

Table 19
2013 2012 2011 2010 2009
1 1 1 1 1 16 17 17 18 18 3 3 3 3 3 2 2 2 1 1
1 1 1 1 1 32 32 32 32 32
556 556 556 556 556 5 5 5 5 5
74 74 74 74 74 96% 96% 96% 96% 96%10 10 10 10 10
26 26 26 26 26 540 540 540 540 540
2 2 2 2 2 1 1 1 1 1 1 1 1 1 1 1 1 - - - 3 3 5 5 5 2 2 2 2 2 2 2 2 2 2 2 2 2 2 2
4,426 4,429 4,442 4,443 4,599 1,134,577 1,272,199 1,413,036 1,539,775 1,546,175 5,400,000 5,400,000 5,400,000 5,400,000 5,400,000 4,800,000 4,800,000 4,800,000 4,800,000 4,800,000
83 83 83 83 83
1,282,658 1,109,123 1,799,452 2,030,301 1,470,521 11,500,000 11,500,000 11,500,000 11,500,000 11,500,000
80 80 80 80 80
41 41 41 41 41 8 8 8 8 8
7 7 7 7 7
10 10 11 13 13 57 58 59 65 65 17 17 19 18 18
84 85 89 96 96
Fiscal Year
209
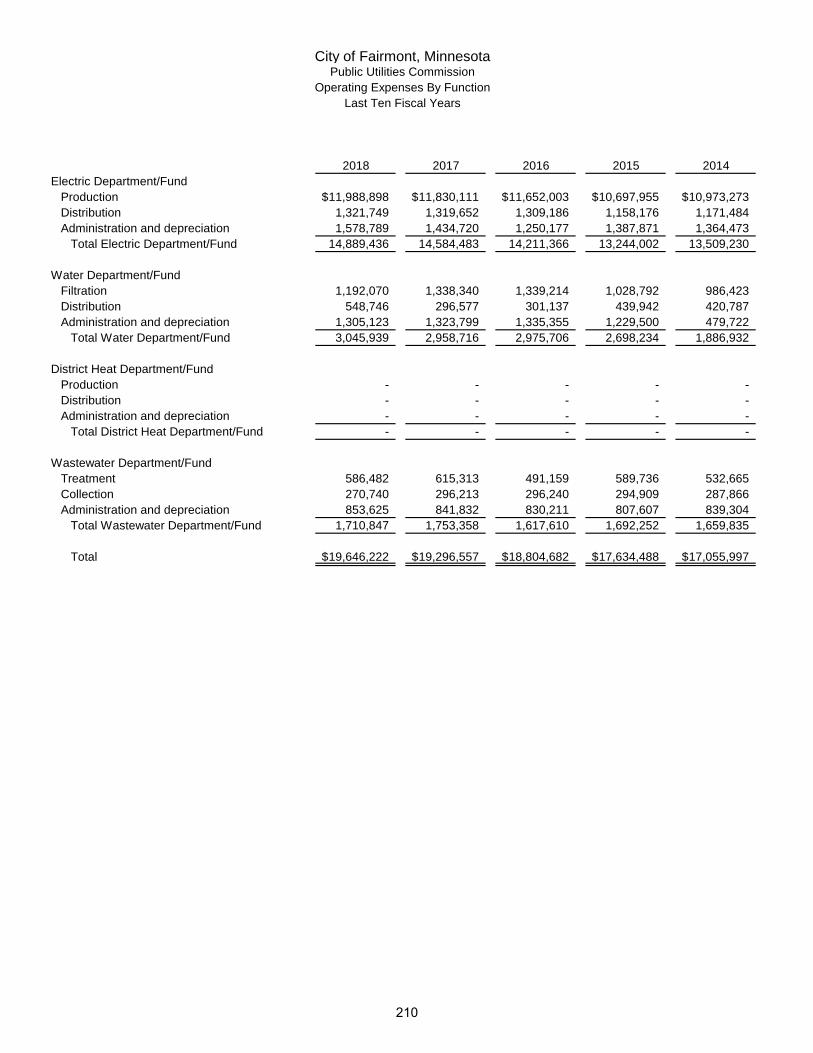
City of Fairmont, MinnesotaPublic Utilities Commission
Operating Expenses By FunctionLast Ten Fiscal Years
2018 2017 2016 2015 2014Electric Department/Fund
Production 11,988,898$ 11,830,111$ 11,652,003$ 10,697,955$ 10,973,273$ Distribution 1,321,749 1,319,652 1,309,186 1,158,176 1,171,484 Administration and depreciation 1,578,789 1,434,720 1,250,177 1,387,871 1,364,473
Total Electric Department/Fund 14,889,436 14,584,483 14,211,366 13,244,002 13,509,230
Water Department/FundFiltration 1,192,070 1,338,340 1,339,214 1,028,792 986,423 Distribution 548,746 296,577 301,137 439,942 420,787 Administration and depreciation 1,305,123 1,323,799 1,335,355 1,229,500 479,722
Total Water Department/Fund 3,045,939 2,958,716 2,975,706 2,698,234 1,886,932
District Heat Department/FundProduction - - - - - Distribution - - - - - Administration and depreciation - - - - -
Total District Heat Department/Fund - - - - -
Wastewater Department/FundTreatment 586,482 615,313 491,159 589,736 532,665 Collection 270,740 296,213 296,240 294,909 287,866 Administration and depreciation 853,625 841,832 830,211 807,607 839,304
Total Wastewater Department/Fund 1,710,847 1,753,358 1,617,610 1,692,252 1,659,835
Total 19,646,222$ 19,296,557$ 18,804,682$ 17,634,488$ 17,055,997$
210
lmunguia_ABDO16C
Sticky Note
Marked set by lmunguia_ABDO16C
lmunguia_ABDO16C
Sticky Note
Marked set by lmunguia_ABDO16C

Table 20
2013 2012 2011 2010 2009
11,370,136$ 11,488,996$ 11,793,263$ 11,907,333$ 11,457,408$ 1,173,817 1,251,599 1,234,196 1,212,690 1,071,154 1,357,745 1,253,489 1,210,384 1,219,437 1,066,353
13,901,698 13,994,084 14,237,843 14,339,460 13,594,915
950,375 957,550 1,007,315 1,128,507 1,164,881 466,580 449,489 282,000 432,482 437,103 436,620 356,590 327,437 286,837 264,022
1,853,575 1,763,629 1,616,752 1,847,826 1,866,006
- - 62,657 116,599 122,270 - - 602 794 654 - - - 246,203 222,305 - - 63,259 363,596 345,229
633,326 623,509 588,910 587,921 584,674 303,052 279,944 284,448 271,987 293,973 843,856 781,998 780,124 709,412 690,480
1,780,234 1,685,451 1,653,482 1,569,320 1,569,127
17,535,507$ 17,443,164$ 17,571,336$ 18,120,202$ 17,375,277$
211

City of Fairmont, MinnesotaPublic Utilities Commission
Revenue By Utility
2018 2017 2016 2015 2014
Electric Department/Fund 16,384,952$ 15,845,241$ 15,338,091$ 14,561,648$ 14,713,001$
Water Department/Fund 3,513,185 3,488,744 3,497,629 3,329,141 3,273,006
District Heat Department/Fund - - - - -
Wastewater Department/Fund 2,303,196 2,334,068 2,387,483 2,349,903 2,599,354
Total 22,201,333$ 21,668,053$ 21,223,203$ 20,240,692$ 20,585,361$
Last Ten Fiscal Years
212

Table 21
2013 2012 2011 2010 2009
14,639,236$ 14,856,538$ 15,601,619$ 14,724,031$ 14,270,358$
3,332,167 3,023,394 2,838,809 2,413,865 2,037,674
- - 82,626 129,919 144,589
2,542,395 2,159,105 2,246,597 2,250,191 2,143,140
20,513,798$ 20,039,037$ 20,769,651$ 19,518,006$ 18,595,761$
213

City of Fairmont, MinnesotaPublic Utilities Commission
Kilowatt Hours Generated and PurchasedLast Ten Fiscal Years
Table 22
Gross Purchased Purchased PeakYear Generation KWH From Total KWH * Sales KWH Own Use Demand
2018 - 154,178,601 SMMPA/WAPA 154,178,601 150,728,230 - 31,846 2017 - 151,628,686 SMMPA/WAPA 151,628,686 146,087,575 - 28,726 2016 - 153,558,569 SMMPA/WAPA 153,558,569 147,048,570 - 32,243 2015 - 149,679,834 SMMPA/WAPA 149,679,834 142,562,065 - 29,449 2014 - 153,388,172 SMMPA/WAPA 153,388,172 147,321,850 - 27,894 2013 - 157,632,145 SMMPA/WAPA 157,632,145 148,187,120 - 31,049 2012 133,000 158,852,096 SMMPA/WAPA 158,985,096 151,973,053 - 31,652 2011 2,943,000 161,848,504 SMMPA/WAPA 164,791,504 155,661,326 1,500 32,059 2010 761,000 160,021,257 SMMPA/WAPA 160,782,257 153,605,131 37,500 31,450 2009 717,000 154,409,696 SMMPA/WAPA 155,126,696 147,794,464 10,500 28,091
* Includes own use (but not station service).
214

City of Fairmont, MinnesotaPublic Utilities Commission
Cost Per Kwh Generated and PurchasedLast Ten Fiscal Years
Table 23
Total Production Distribution Administrative Depreciation KWH Purchased
Cost Cost Cost Cost Total Cost and Generated Cost Per KWHYear Per KWH Per KWH Per KWH Per KWH Per KWH Billed and Used Billed and Used
2018 11,988,898$ 1,321,749$ 1,165,401$ 413,388$ 14,889,436$ 154,178,601$ 0.07776 0.00857 0.00756 0.00268 0.09657 150,728,230 0.09878$
2017 11,830,111 1,319,652 1,046,648 388,072 14,584,483 151,628,686 0.07802 0.00870 0.00690 0.00256 0.09618 146,087,575 0.09983
2016 11,652,003 1,309,186 861,771 388,406 14,211,366 153,558,569 0.07588 0.00853 0.00648 0.00256 0.09345 147,048,570 0.09664
2015 10,697,955 1,158,176 994,948 392,923 13,244,002 149,679,834 0.07147 0.00774 0.00656 0.00256 0.08833 142,562,065 0.09290
2014 10,973,273 1,171,484 982,024 382,449 13,509,230 153,388,172 0.07154 0.00764 0.00608 0.00278 0.08804 147,321,850 0.09170
2013 11,370,136 1,173,817 932,076 425,669 13,901,698 157,632,145 0.07213 0.00745 0.00524 0.00271 0.08753 148,187,120 0.09381
2012 11,488,996 1,251,599 825,695 427,794 13,994,084 158,985,096 0.07226 0.00787 0.00492 0.00270 0.08775 151,973,053 0.09208
2011 11,793,263 1,234,196 781,856 428,528 14,237,843 164,791,504 0.07156 0.00749 0.00454 0.00286 0.08645 155,661,326 0.09147
2010 11,907,333 1,212,690 748,128 471,309 14,339,460 160,782,257 0.07406 0.00754 0.00373 0.00290 0.08823 153,605,131 0.09335
2009 11,457,408 1,071,154 599,429 466,924 13,594,915 155,126,696 0.07386 0.00691 0.00386 0.00301 0.08764 147,794,464 0.09199
215

THIS PAGE IS LEFT
BLANK INTENTIONALLY
216

City of Fairmont, MinnesotaPublic Utilities Commission
Kilowatt Sales (Continued on the Following Pages)Last Ten Fiscal Years
Table 24
Percent of Percent of Number ofRevenue KWH to Revenue to Meters in
KWH Amount Billed Per KWH Total KWH Total Revenue Service2018
Residential Light 29,310,618 3,316,840$ 0.113162$ 19.4 % 20.9 % 3,786 Commercial Service 22,791,640 2,438,585 0.106995 15.1 15.3 755 General Service 16,497,971 1,626,728 0.098602 10.9 10.2 42 Industrial Sales 53,960,562 4,883,075 0.090493 35.9 30.8 12 All Electric 8,782,597 770,695 0.087753 5.8 4.8 8 Rural Electric 4,021,451 446,534 0.111038 2.7 2.8 227 Filter Plant 1,398,400 92,994 0.066500 0.9 0.6 1 Street Lighting 1,568,877 117,666 0.075000 1.0 0.7 6 Flat Rate Security Lights 75,982 10,739 0.141336 0.1 0.1 146 Residential Heat 9,613,644 1,003,001 0.104331 6.4 6.3 910 Wastewater Plant 1,422,302 94,576 0.066495 0.9 0.6 1 Seasonal Heat Rate 1,284,186 99,419 0.077418 0.9 0.6 22 Energy Cost Adjustment - 1,004,451 - - 6.3 -
Total Sales 150,728,230 15,905,303$ 0.105523$ 100.0 % 100.0 % 5,916
Percent of Percent of Number ofRevenue KWH to Revenue to Meters in
KWH Amount Billed Per KWH Total KWH Total Revenue Service2017
Residential Light 27,178,487 3,089,916$ 0.113690$ 18.6 % 20.1 % 3,790 Commercial Service 21,667,094 2,313,203 0.106761 14.8 15.0 758 General Service 16,148,841 1,615,370 0.100030 11.1 10.5 42 Industrial Sales 54,949,723 4,944,410 0.089981 37.7 32.1 12 All Electric 8,082,443 718,901 0.088946 5.5 4.7 8 Rural Electric 3,681,432 408,733 0.111026 2.5 2.7 227 Filter Plant 1,370,000 91,105 0.066500 0.9 0.6 1 Street Lighting 1,556,513 116,739 0.075000 1.1 0.8 6 Flat Rate Security Lights 126,972 10,058 0.079214 0.1 0.1 146 Residential Heat 8,980,862 929,531 0.103501 6.1 6.0 907 Wastewater Plant 1,350,010 85,786 0.063545 0.9 0.6 1 Seasonal Heat Rate 995,198 74,407 0.074766 0.7 0.5 26 Energy Cost Adjustment - 972,114 - - 6.3 -
Total Sales 146,087,575 15,370,273$ 0.105213$ 100.0 % 100.0 % 5,924
Type of Service
Type of Service
217
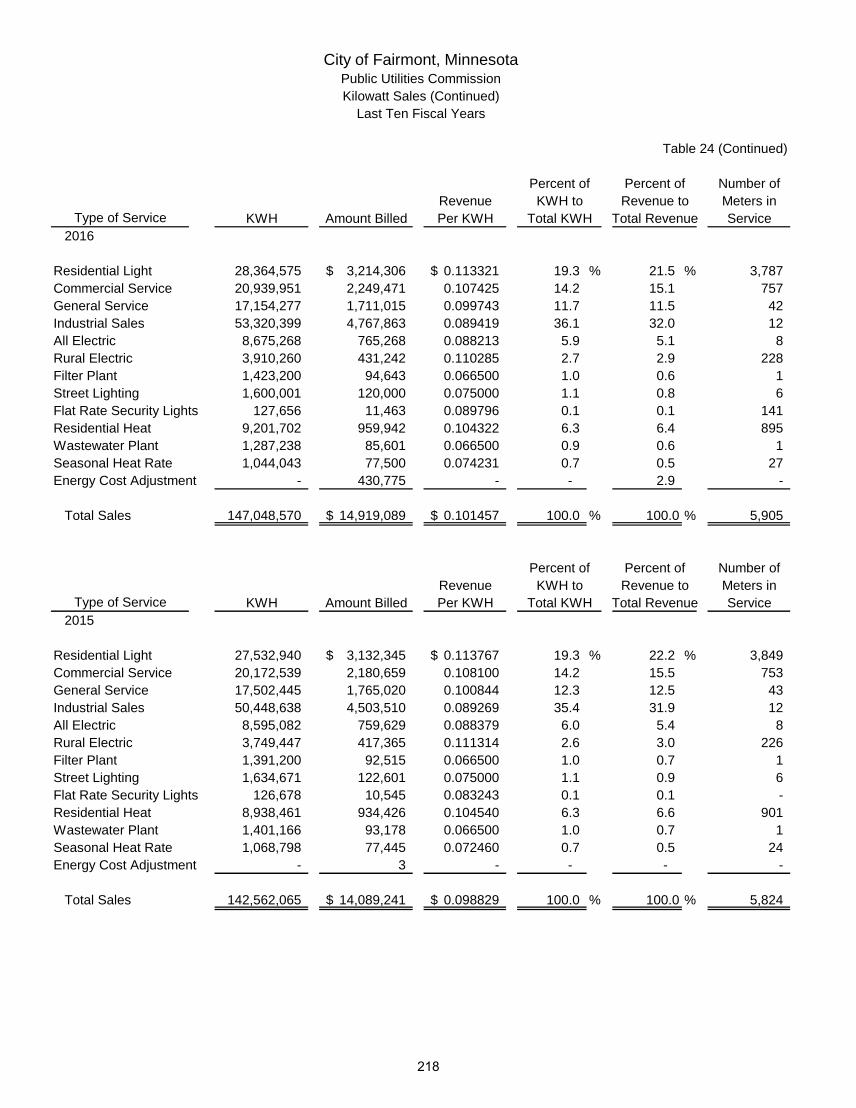
City of Fairmont, MinnesotaPublic Utilities CommissionKilowatt Sales (Continued)
Last Ten Fiscal Years
Table 24 (Continued)
Percent of Percent of Number ofRevenue KWH to Revenue to Meters in
KWH Amount Billed Per KWH Total KWH Total Revenue Service2016
Residential Light 28,364,575 3,214,306$ 0.113321$ 19.3 % 21.5 % 3,787 Commercial Service 20,939,951 2,249,471 0.107425 14.2 15.1 757 General Service 17,154,277 1,711,015 0.099743 11.7 11.5 42 Industrial Sales 53,320,399 4,767,863 0.089419 36.1 32.0 12 All Electric 8,675,268 765,268 0.088213 5.9 5.1 8 Rural Electric 3,910,260 431,242 0.110285 2.7 2.9 228 Filter Plant 1,423,200 94,643 0.066500 1.0 0.6 1 Street Lighting 1,600,001 120,000 0.075000 1.1 0.8 6 Flat Rate Security Lights 127,656 11,463 0.089796 0.1 0.1 141 Residential Heat 9,201,702 959,942 0.104322 6.3 6.4 895 Wastewater Plant 1,287,238 85,601 0.066500 0.9 0.6 1 Seasonal Heat Rate 1,044,043 77,500 0.074231 0.7 0.5 27 Energy Cost Adjustment - 430,775 - - 2.9 -
Total Sales 147,048,570 14,919,089$ 0.101457$ 100.0 % 100.0 % 5,905
Percent of Percent of Number ofRevenue KWH to Revenue to Meters in
KWH Amount Billed Per KWH Total KWH Total Revenue Service2015
Residential Light 27,532,940 3,132,345$ 0.113767$ 19.3 % 22.2 % 3,849 Commercial Service 20,172,539 2,180,659 0.108100 14.2 15.5 753 General Service 17,502,445 1,765,020 0.100844 12.3 12.5 43 Industrial Sales 50,448,638 4,503,510 0.089269 35.4 31.9 12 All Electric 8,595,082 759,629 0.088379 6.0 5.4 8 Rural Electric 3,749,447 417,365 0.111314 2.6 3.0 226 Filter Plant 1,391,200 92,515 0.066500 1.0 0.7 1 Street Lighting 1,634,671 122,601 0.075000 1.1 0.9 6 Flat Rate Security Lights 126,678 10,545 0.083243 0.1 0.1 - Residential Heat 8,938,461 934,426 0.104540 6.3 6.6 901 Wastewater Plant 1,401,166 93,178 0.066500 1.0 0.7 1 Seasonal Heat Rate 1,068,798 77,445 0.072460 0.7 0.5 24 Energy Cost Adjustment - 3 - - - -
Total Sales 142,562,065 14,089,241$ 0.098829$ 100.0 % 100.0 % 5,824
Type of Service
Type of Service
218

City of Fairmont, MinnesotaPublic Utilities CommissionKilowatt Sales (Continued)
Last Ten Fiscal Years
Table 24 (Continued)
Percent of Percent of Number ofRevenue KWH to Revenue to Meters in
KWH Amount Billed Per KWH Total KWH Total Revenue Service2014
Residential Light 28,653,260 2,418,394$ 0.084402$ 19.4 % 17.0 % 3,879 Commercial Service 21,184,995 1,656,657 0.078200 14.4 11.6 747 General Service 18,549,910 1,286,853 0.069372 12.6 9.0 43 Industrial Sales 50,409,061 3,068,222 0.060866 34.3 21.5 12 All Electric 9,039,097 556,328 0.061547 6.1 3.9 8 Rural Electric 3,914,295 323,984 0.082769 2.7 2.3 225 Filter Plant 1,437,200 54,614 0.038000 1.0 0.4 1 Street Lighting 1,791,188 134,339 0.075000 1.2 0.9 6 Flat Rate Security Lights 128,637 10,320 0.080226 0.1 0.1 - Residential Heat 9,293,874 698,258 0.075131 6.3 4.9 888 Wastewater Plant 1,535,800 58,360 0.038000 1.0 0.4 1 SMMPA Expansion Rate 1,384,533 62,782 0.045345 0.9 0.4 22 Energy Cost Adjustment - 3,933,326 - - 27.6 -
Total Sales 147,321,850 14,262,437$ 0.096811$ 100.0 % 100.0 % 5,832
Percent of Percent of Number ofRevenue KWH to Revenue to Meters in
KWH Amount Billed Per KWH Total KWH Total Revenue Service2013
Residential Light 29,755,931 2,500,922$ 0.084048$ 20.1 % 17.5 % 3,909 Commercial Service 22,067,984 1,728,734 0.078337 14.9 12.1 761 General Service 19,989,428 1,354,742 0.067773 13.5 9.5 43 Industrial Sales 49,455,710 3,141,624 0.063524 33.3 22.0 12 All Electric 9,054,123 549,234 0.060661 6.1 3.9 8 Rural Electric 3,946,018 319,756 0.081033 2.7 2.2 224 Filter Plant 1,212,440 46,073 0.038000 0.8 0.3 1 Street Lighting 1,751,086 131,332 0.075000 1.2 0.9 6 Flat Rate Security Lights 125,846 10,519 0.083586 0.1 0.1 - Residential Heat 8,600,482 687,168 0.079899 5.8 4.8 867 Wastewater Plant 1,325,800 50,380 0.038000 0.9 0.4 1 SMMPA Expansion Rate 902,272 41,182 0.045643 0.6 0.3 24 Energy Cost Adjustment - 3,703,983 - - 26.0 -
Total Sales 148,187,120 14,265,649$ 0.096268$ 100.0 % 100.0 % 5,856
Type of Service
Type of Service
219

City of Fairmont, MinnesotaPublic Utilities CommissionKilowatt Sales (Continued)
Last Ten Fiscal Years
Table 24 (Continued)
Percent of Percent of Number ofRevenue KWH to Revenue to Meters in
KWH Amount Billed Per KWH Total KWH Total Revenue Service2012
Residential Light 30,135,119 2,585,797$ 0.085807$ 19.8 % 17.9 % 4,002 Commercial Service 21,416,365 1,681,089 0.078496 14.1 11.6 741 General Service 19,763,554 1,366,118 0.069123 13.0 9.5 47 Industrial Sales 54,749,354 3,291,661 0.060122 36.1 23.0 12 All Electric 8,402,183 524,619 0.062438 5.5 3.6 8 Rural Electric 3,541,412 294,972 0.083292 2.3 2.0 225 Filter Plant 1,475,640 56,074 0.038000 1.0 0.4 1 Street Lighting 1,767,241 132,543 0.075000 1.2 0.9 6 Flat Rate Security Lights 131,924 10,427 0.079038 0.1 0.1 - Residential Heat 8,688,023 652,925 0.075152 5.7 4.5 798 Wastewater Plant 1,248,800 47,454 0.038000 0.8 0.3 1 SMMPA Expansion Rate 653,438 30,192 0.046205 0.4 0.2 26 Energy Cost Adjustment - 3,758,736 - - 26.0 -
Total Sales 151,973,053 14,432,607$ 0.094968$ 100.0 % 100.0 % 5,867
Percent of Percent of Number ofRevenue KWH to Revenue to Meters in
KWH Amount Billed Per KWH Total KWH Total Revenue Service2011
Residential Light 31,317,844 2,588,036$ 0.081144$ 20.1 % 17.7 % 4,002 Commercial Service 21,389,157 1,669,914 0.075909 13.7 11.4 741 General Service 19,416,287 1,334,831 0.070981 12.5 9.1 47 Industrial Sales 56,005,474 3,371,816 0.062990 36.0 23.1 12 All Electric 9,281,304 562,505 0.061132 6.0 3.8 8 Rural Electric 3,625,936 300,942 0.075854 2.3 2.1 225 Filter Plant 1,647,720 62,613 0.038234 1.1 0.4 1 Street Lighting 1,902,419 141,340 0.077557 1.2 1.0 6 Flat Rate Security Lights 136,259 10,456 0.079668 0.1 0.1 - Residential Heat 8,694,687 652,295 0.078421 5.6 4.5 798 Wastewater Plant 1,270,200 48,268 0.038957 0.8 0.3 1 SMMPA Expansion Rate 974,039 45,552 0.042984 0.6 0.3 26 Energy Cost Adjustment - 3,823,925 - - 26.2 -
Total Sales 155,661,326 14,612,493$ 0.093874$ 100.0 % 100.0 % 5,867
Type of Service
Type of Service
220
lmunguia_ABDO16C
Sticky Note
Marked set by lmunguia_ABDO16C
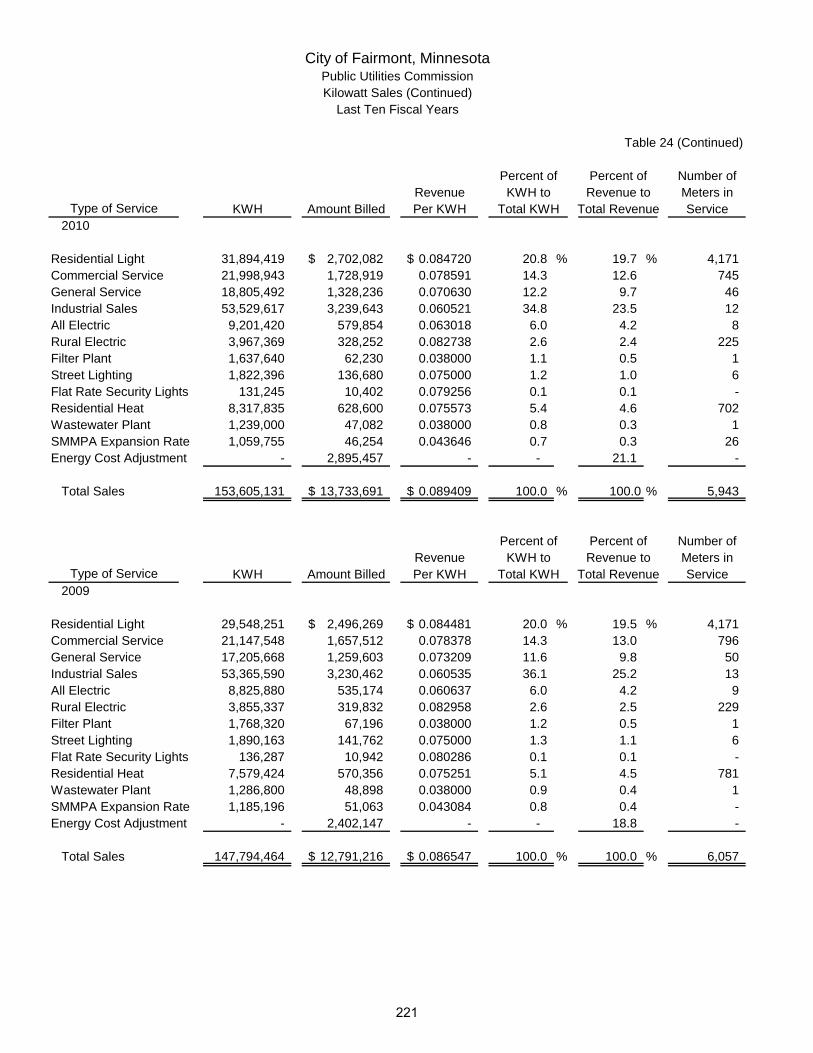
City of Fairmont, MinnesotaPublic Utilities CommissionKilowatt Sales (Continued)
Last Ten Fiscal Years
Table 24 (Continued)
Percent of Percent of Number ofRevenue KWH to Revenue to Meters in
KWH Amount Billed Per KWH Total KWH Total Revenue Service2010
Residential Light 31,894,419 2,702,082$ 0.084720$ 20.8 % 19.7 % 4,171 Commercial Service 21,998,943 1,728,919 0.078591 14.3 12.6 745 General Service 18,805,492 1,328,236 0.070630 12.2 9.7 46 Industrial Sales 53,529,617 3,239,643 0.060521 34.8 23.5 12 All Electric 9,201,420 579,854 0.063018 6.0 4.2 8 Rural Electric 3,967,369 328,252 0.082738 2.6 2.4 225 Filter Plant 1,637,640 62,230 0.038000 1.1 0.5 1 Street Lighting 1,822,396 136,680 0.075000 1.2 1.0 6 Flat Rate Security Lights 131,245 10,402 0.079256 0.1 0.1 - Residential Heat 8,317,835 628,600 0.075573 5.4 4.6 702 Wastewater Plant 1,239,000 47,082 0.038000 0.8 0.3 1 SMMPA Expansion Rate 1,059,755 46,254 0.043646 0.7 0.3 26 Energy Cost Adjustment - 2,895,457 - - 21.1 -
Total Sales 153,605,131 13,733,691$ 0.089409$ 100.0 % 100.0 % 5,943
Percent of Percent of Number ofRevenue KWH to Revenue to Meters in
KWH Amount Billed Per KWH Total KWH Total Revenue Service2009
Residential Light 29,548,251 2,496,269$ 0.084481$ 20.0 % 19.5 % 4,171 Commercial Service 21,147,548 1,657,512 0.078378 14.3 13.0 796 General Service 17,205,668 1,259,603 0.073209 11.6 9.8 50 Industrial Sales 53,365,590 3,230,462 0.060535 36.1 25.2 13 All Electric 8,825,880 535,174 0.060637 6.0 4.2 9 Rural Electric 3,855,337 319,832 0.082958 2.6 2.5 229 Filter Plant 1,768,320 67,196 0.038000 1.2 0.5 1 Street Lighting 1,890,163 141,762 0.075000 1.3 1.1 6 Flat Rate Security Lights 136,287 10,942 0.080286 0.1 0.1 - Residential Heat 7,579,424 570,356 0.075251 5.1 4.5 781 Wastewater Plant 1,286,800 48,898 0.038000 0.9 0.4 1 SMMPA Expansion Rate 1,185,196 51,063 0.043084 0.8 0.4 - Energy Cost Adjustment - 2,402,147 - - 18.8 -
Total Sales 147,794,464 12,791,216$ 0.086547$ 100.0 % 100.0 % 6,057
Type of Service
Type of Service
221
lmunguia_ABDO16C
Sticky Note
Marked set by lmunguia_ABDO16C
lmunguia_ABDO16C
Sticky Note
Marked set by lmunguia_ABDO16C
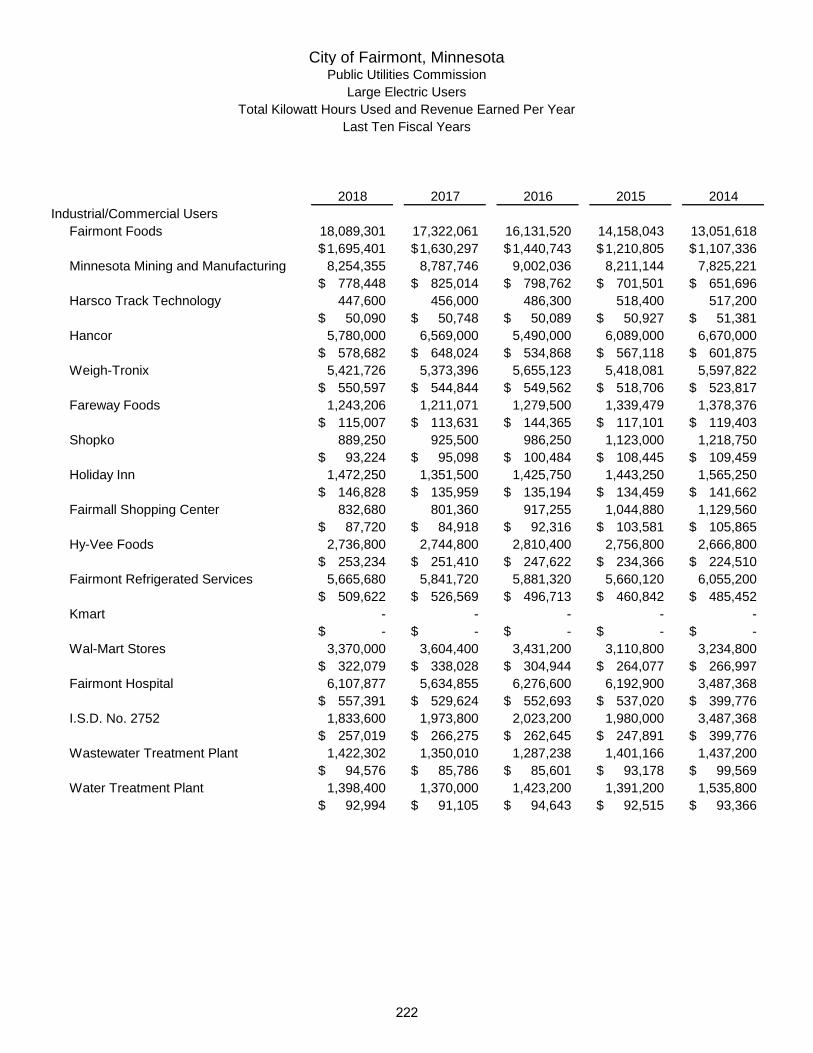
City of Fairmont, MinnesotaPublic Utilities Commission
Large Electric UsersTotal Kilowatt Hours Used and Revenue Earned Per Year
Last Ten Fiscal Years
2018 2017 2016 2015 2014Industrial/Commercial Users
Fairmont Foods 18,089,301 17,322,061 16,131,520 14,158,043 13,051,618 1,695,401$ 1,630,297$ 1,440,743$ 1,210,805$ 1,107,336$
Minnesota Mining and Manufacturing 8,254,355 8,787,746 9,002,036 8,211,144 7,825,221 778,448$ 825,014$ 798,762$ 701,501$ 651,696$
Harsco Track Technology 447,600 456,000 486,300 518,400 517,200 50,090$ 50,748$ 50,089$ 50,927$ 51,381$
Hancor 5,780,000 6,569,000 5,490,000 6,089,000 6,670,000 578,682$ 648,024$ 534,868$ 567,118$ 601,875$
Weigh-Tronix 5,421,726 5,373,396 5,655,123 5,418,081 5,597,822 550,597$ 544,844$ 549,562$ 518,706$ 523,817$
Fareway Foods 1,243,206 1,211,071 1,279,500 1,339,479 1,378,376 115,007$ 113,631$ 144,365$ 117,101$ 119,403$
Shopko 889,250 925,500 986,250 1,123,000 1,218,750 93,224$ 95,098$ 100,484$ 108,445$ 109,459$
Holiday Inn 1,472,250 1,351,500 1,425,750 1,443,250 1,565,250 146,828$ 135,959$ 135,194$ 134,459$ 141,662$
Fairmall Shopping Center 832,680 801,360 917,255 1,044,880 1,129,560 87,720$ 84,918$ 92,316$ 103,581$ 105,865$
Hy-Vee Foods 2,736,800 2,744,800 2,810,400 2,756,800 2,666,800 253,234$ 251,410$ 247,622$ 234,366$ 224,510$
Fairmont Refrigerated Services 5,665,680 5,841,720 5,881,320 5,660,120 6,055,200 509,622$ 526,569$ 496,713$ 460,842$ 485,452$
Kmart - - - - - -$ -$ -$ -$ -$
Wal-Mart Stores 3,370,000 3,604,400 3,431,200 3,110,800 3,234,800 322,079$ 338,028$ 304,944$ 264,077$ 266,997$
Fairmont Hospital 6,107,877 5,634,855 6,276,600 6,192,900 3,487,368 557,391$ 529,624$ 552,693$ 537,020$ 399,776$
I.S.D. No. 2752 1,833,600 1,973,800 2,023,200 1,980,000 3,487,368 257,019$ 266,275$ 262,645$ 247,891$ 399,776$
Wastewater Treatment Plant 1,422,302 1,350,010 1,287,238 1,401,166 1,437,200 94,576$ 85,786$ 85,601$ 93,178$ 99,569$
Water Treatment Plant 1,398,400 1,370,000 1,423,200 1,391,200 1,535,800 92,994$ 91,105$ 94,643$ 92,515$ 93,366$
222

Table 25
2013 2012 2011 2010 2009
2,464,831 14,315,307 15,975,378 14,405,962 15,229,904 1,042,803$ 1,180,918$ 1,317,813$ 1,114,623$ 1,130,627$ 7,591,649 7,712,425 7,361,865 7,172,204 6,743,792
619,290$ 631,048$ 604,175$ 547,629$ 498,185$ 552,000 571,200 1,136,400 1,742,400 1,935,600 54,207$ 56,457$ 122,519$ 177,622$ 184,883$
7,509,000 8,627,000 7,840,000 7,092,000 6,536,000 666,009$ 723,634$ 661,645$ 566,223$ 519,326$
5,734,080 6,392,412 6,501,321 6,501,551 6,111,050 530,950$ 575,467$ 589,774$ 551,984$ 511,612$
1,484,452 1,398,829 1,309,292 1,142,880 - 124,463$ 119,854$ 115,007$ 89,704$ -$
1,414,500 1,451,000 1,287,750 1,280,250 1,246,000 122,882$ 123,958$ 113,221$ 105,200$ 98,515$
1,633,500 1,552,500 1,759,000 1,674,250 1,610,500 143,720$ 139,323$ 154,431$ 138,570$ 127,840$
1,092,200 945,860 776,400 789,640 760,940 103,406$ 88,258$ 90,337$ 71,990$ 69,330$
2,698,800 2,605,120 2,657,440 2,525,920 2,670,880 222,689$ 221,566$ 211,168$ 189,363$ 192,183$
6,139,800 6,127,560 6,030,720 5,872,680 6,031,080 480,003$ 474,287$ 465,861$ 424,233$ 414,539$
- - - - 129,984 -$ -$ -$ -$ 11,927$
3,296,000 3,449,200 3,506,800 3,476,800 3,461,200 270,157$ 283,831$ 285,919$ 268,115$ 255,977$
6,375,600 6,314,400 6,735,600 6,806,700 6,521,400 527,157$ 516,892$ 557,202$ 540,320$ 485,053$
3,585,720 3,427,680 3,211,200 2,558,880 2,312,000 400,658$ 384,529$ 346,486$ 240,995$ 209,171$
1,325,800 1,248,800 1,270,200 1,239,000 1,286,800 89,004$ 83,835$ 79,786$ 70,727$ 69,939$
1,212,440 1,475,640 1,647,730 1,637,640 1,768,320 76,158$ 92,691$ 103,500$ 93,483$ 96,110$
223

City of Fairmont, MinnesotaPublic Utilities Commission
Raw Water Finished and SoldLast Ten Fiscal Years
Table 26
Volume Percent of Total Revenue per Number ofin Gallons Total Pumped Revenue 1,000 Gallons Water Meters
Net Raw Water 449,645,802 100.0 %Used in Production 21,425,416 4.8Net Finished Water 428,220,386 95.2Loss in Distribution System (including hydrant) 68,364,481 15.2
Total Sales 359,855,905 80.0 3,142,423$ 8.732448$ 4,433
Net Raw Water 437,145,408 100.0Used in Production 19,805,380 4.5Net Finished Water 417,340,028 95.5Loss in Distribution System (including hydrant) 45,650,046 10.4
Total Sales 371,689,982 85.1 3,090,598 8.314989 4,426
Net Raw Water 454,363,595 100.0Used in Production 18,179,916 4.0Net Finished Water 436,183,679 96.0Loss in Distribution System (including hydrant) 60,468,422 13.3
Total Sales 375,715,257 82.7 3,121,434 8.307978 4,382
Net Raw Water 442,895,764 100.0Used in Production 8,100,838 1.8Net Finished Water 434,794,926 98.2Loss in Distribution System (including hydrant) 67,667,767 15.3
Total Sales 367,127,159 82.9 2,942,896 8.016013 4,423
Net Raw Water 430,038,323 100.0Used in Production 9,156,992 2.1Net Finished Water 420,881,331 97.9Loss in Distribution System (including hydrant) 66,588,469 15.5
Total Sales 354,292,862 82.4 2,893,977 8.168319 4,410
2018
2017
2016
2015
2014
224

City of Fairmont, MinnesotaPublic Utilities Commission
Raw Water Finished and Sold (Continued)Last Ten Fiscal Years
Table 26 (Continued)
Volume Percent of Total Revenue per Number ofin Gallons Total Pumped Revenue 1,000 Gallons Water Meters
Net Raw Water 526,958,224 100.0 %Used in Production 58,852,312 11.2Net Finished Water 468,105,912 88.8Loss in Distribution System (including hydrant) 53,985,299 10.2
Total Sales 414,120,613 78.6 2,995,348$ 7.233033$ 4,426
Net Raw Water 485,011,000 100.0Used in Production 20,658,344 4.3Net Finished Water 464,352,656 95.7Loss in Distribution System (including hydrant) 34,019,079 7.0
Total Sales 430,333,577 88.7 2,699,242 6.272441 4,429
Net Raw Water 589,167,636 100.0Used in Production 73,409,316 12.5Net Finished Water 515,758,320 87.5Loss in Distribution System (including hydrant) 60,617,941 10.3
Total Sales 455,140,379 77.2 2,536,752 5.573560 4,442
Net Raw Water 591,918,009 100.0Used in Production 61,373,009 10.4Net Finished Water 530,545,000 89.6Loss in Distribution System (including hydrant) 65,137,047 11.0
Total Sales 465,407,953 78.6 2,114,745 4.543852 4,443
Net Raw Water 590,695,431 100.0Used in Production 26,341,431 4.5Net Finished Water 564,354,000 95.5Loss in Distribution System (including hydrant) 82,518,126 14.0
Total Sales 481,835,874 81.5 1,732,391 3.595396 4,599
2009
2010
2011
2012
2013
225

THIS PAGE IS LEFT
BLANK INTENTIONALLY
226
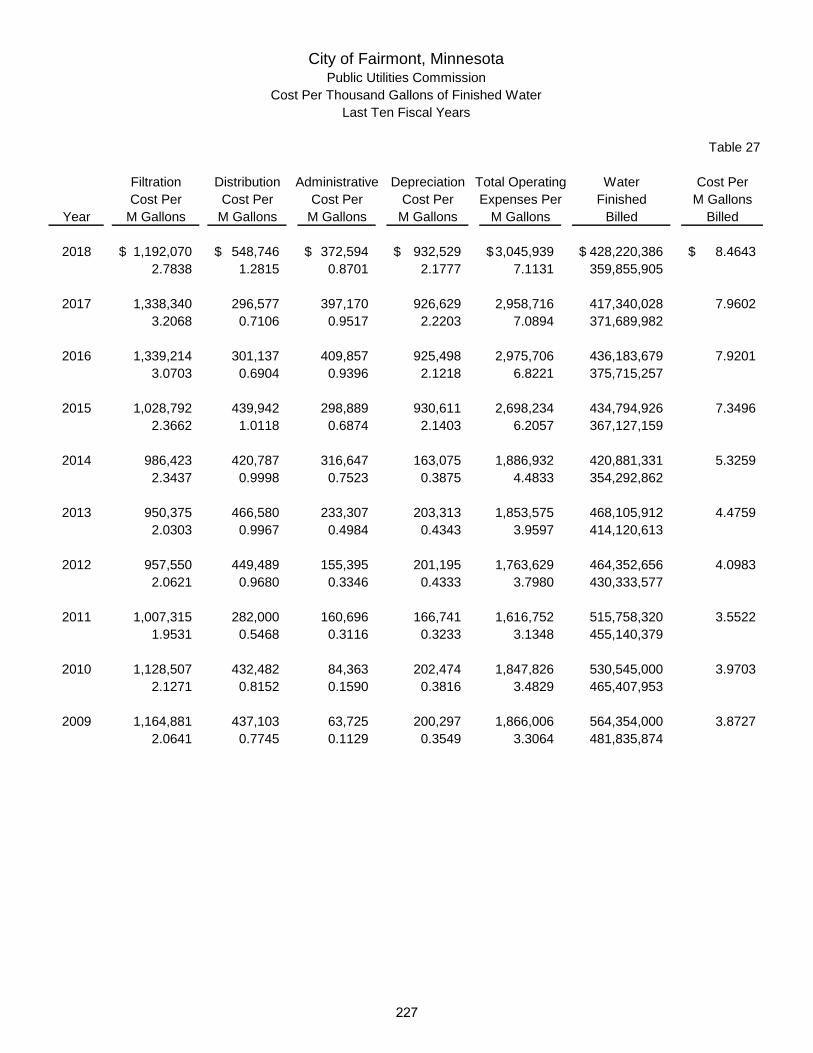
City of Fairmont, MinnesotaPublic Utilities Commission
Cost Per Thousand Gallons of Finished WaterLast Ten Fiscal Years
Table 27
Filtration Distribution Administrative Depreciation Total Operating Water Cost PerCost Per Cost Per Cost Per Cost Per Expenses Per Finished M Gallons
Year M Gallons M Gallons M Gallons M Gallons M Gallons Billed Billed
2018 1,192,070$ 548,746$ 372,594$ 932,529$ 3,045,939$ 428,220,386$ 8.4643$ 2.7838 1.2815 0.8701 2.1777 7.1131 359,855,905
2017 1,338,340 296,577 397,170 926,629 2,958,716 417,340,028 7.9602 3.2068 0.7106 0.9517 2.2203 7.0894 371,689,982
2016 1,339,214 301,137 409,857 925,498 2,975,706 436,183,679 7.9201 3.0703 0.6904 0.9396 2.1218 6.8221 375,715,257
2015 1,028,792 439,942 298,889 930,611 2,698,234 434,794,926 7.3496 2.3662 1.0118 0.6874 2.1403 6.2057 367,127,159
2014 986,423 420,787 316,647 163,075 1,886,932 420,881,331 5.3259 2.3437 0.9998 0.7523 0.3875 4.4833 354,292,862
2013 950,375 466,580 233,307 203,313 1,853,575 468,105,912 4.4759 2.0303 0.9967 0.4984 0.4343 3.9597 414,120,613
2012 957,550 449,489 155,395 201,195 1,763,629 464,352,656 4.0983 2.0621 0.9680 0.3346 0.4333 3.7980 430,333,577
2011 1,007,315 282,000 160,696 166,741 1,616,752 515,758,320 3.5522 1.9531 0.5468 0.3116 0.3233 3.1348 455,140,379
2010 1,128,507 432,482 84,363 202,474 1,847,826 530,545,000 3.9703 2.1271 0.8152 0.1590 0.3816 3.4829 465,407,953
2009 1,164,881 437,103 63,725 200,297 1,866,006 564,354,000 3.8727 2.0641 0.7745 0.1129 0.3549 3.3064 481,835,874
227

Table 28
Percent Revenueof Total Per M Steam
Total Pounds Total Revenue Pounds Meters
Steam billed to customers - - % -$ -$ - Metered warehouse use - - - - Metered Power Plant use - - - - Loss - - - - Fuel cost adder - - - -
Total steam metered to District Heat Department - - - -
Steam billed to customers - - - - - Metered warehouse use - - - - Metered Power Plant use - - - - Loss - - - - Fuel cost adder - - - -
Total steam metered to District Heat Department - - - -
Steam billed to customers - - - - - Metered warehouse use - - - - Metered Power Plant use - - - - Loss - - - - Fuel cost adder - - - -
Total steam metered to District Heat Department - - - -
Steam billed to customers - - - - - Metered warehouse use - - - - Metered Power Plant use - - - - Loss - - - - Fuel cost adder - - - -
Total steam metered to District Heat Department - - - -
Steam billed to customers - - - - - Metered warehouse use - - - - Metered Power Plant use - - - - Loss - - - - Fuel cost adder - - - -
Total steam metered to District Heat Department - - - -
City of Fairmont, MinnesotaPublic Utilities Commission
District Heat SalesLast Ten Fiscal Years
2018
2016
2017
2014
2015
228
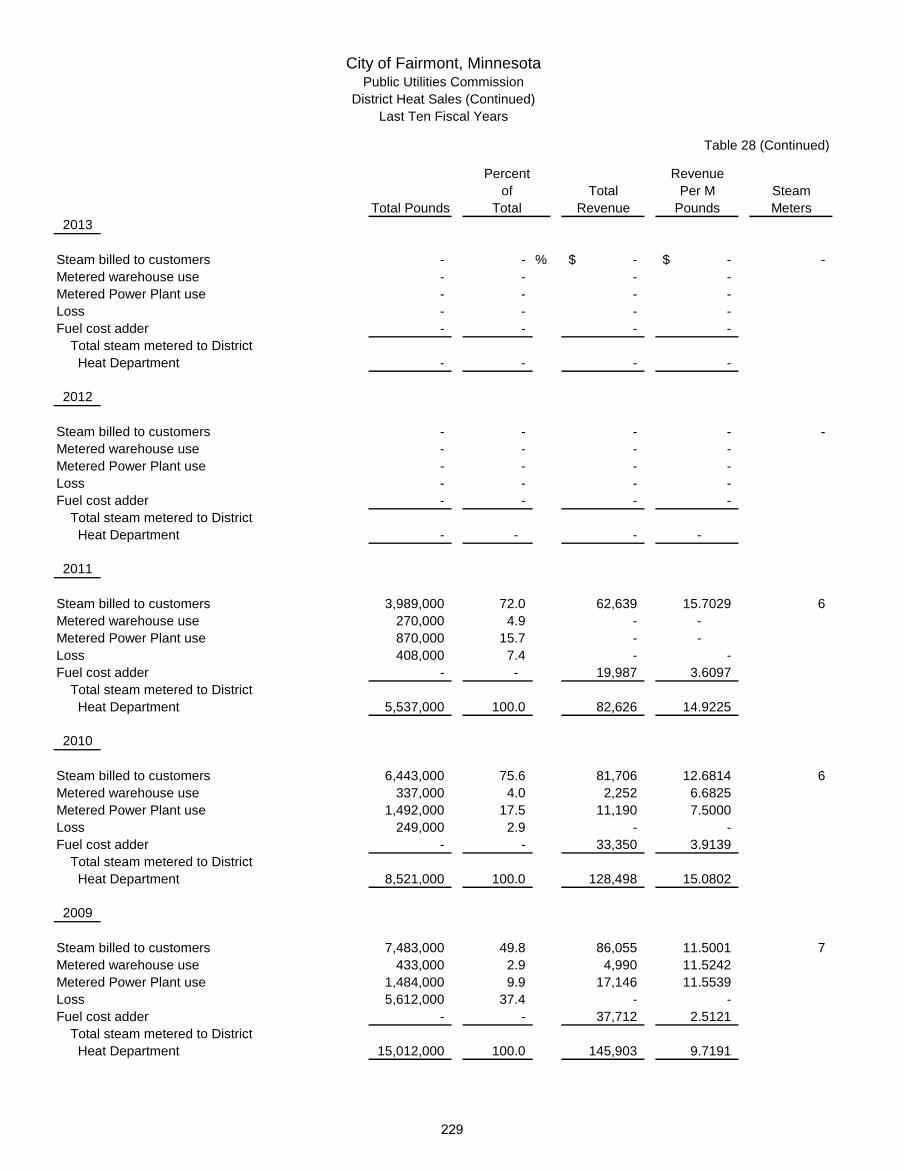
Table 28 (Continued)
Percent Revenueof Total Per M Steam
Total Pounds Total Revenue Pounds Meters
Steam billed to customers - - % -$ -$ - Metered warehouse use - - - - Metered Power Plant use - - - - Loss - - - - Fuel cost adder - - - -
Total steam metered to District Heat Department - - - -
Steam billed to customers - - - - - Metered warehouse use - - - - Metered Power Plant use - - - - Loss - - - - Fuel cost adder - - - -
Total steam metered to District Heat Department - - - -
Steam billed to customers 3,989,000 72.0 62,639 15.7029 6 Metered warehouse use 270,000 4.9 - - Metered Power Plant use 870,000 15.7 - - Loss 408,000 7.4 - - Fuel cost adder - - 19,987 3.6097
Total steam metered to District Heat Department 5,537,000 100.0 82,626 14.9225
Steam billed to customers 6,443,000 75.6 81,706 12.6814 6 Metered warehouse use 337,000 4.0 2,252 6.6825 Metered Power Plant use 1,492,000 17.5 11,190 7.5000 Loss 249,000 2.9 - - Fuel cost adder - - 33,350 3.9139
Total steam metered to District Heat Department 8,521,000 100.0 128,498 15.0802
Steam billed to customers 7,483,000 49.8 86,055 11.5001 7 Metered warehouse use 433,000 2.9 4,990 11.5242 Metered Power Plant use 1,484,000 9.9 17,146 11.5539 Loss 5,612,000 37.4 - - Fuel cost adder - - 37,712 2.5121
Total steam metered to District Heat Department 15,012,000 100.0 145,903 9.7191
City of Fairmont, MinnesotaPublic Utilities Commission
District Heat Sales (Continued)Last Ten Fiscal Years
2013
2009
2010
2011
2012
229
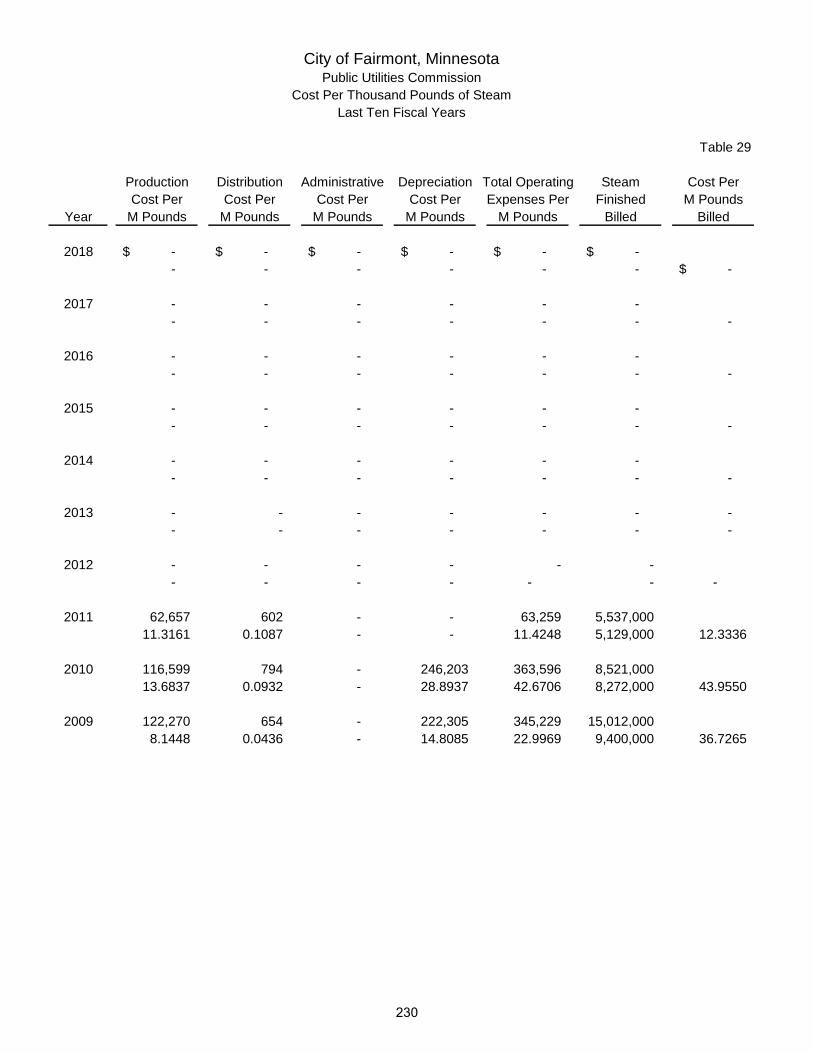
City of Fairmont, MinnesotaPublic Utilities Commission
Cost Per Thousand Pounds of SteamLast Ten Fiscal Years
Table 29
Production Distribution Administrative Depreciation Total Operating Steam Cost PerCost Per Cost Per Cost Per Cost Per Expenses Per Finished M Pounds
Year M Pounds M Pounds M Pounds M Pounds M Pounds Billed Billed
2018 -$ -$ -$ -$ -$ -$ - - - - - - -$
2017 - - - - - - - - - - - - -
2016 - - - - - - - - - - - - -
2015 - - - - - - - - - - - - -
2014 - - - - - - - - - - - - -
2013 - - - - - - - - - - - - - -
2012 - - - - - - - - - - - - -
2011 62,657 602 - - 63,259 5,537,000 11.3161 0.1087 - - 11.4248 5,129,000 12.3336
2010 116,599 794 - 246,203 363,596 8,521,000 13.6837 0.0932 - 28.8937 42.6706 8,272,000 43.9550
2009 122,270 654 - 222,305 345,229 15,012,000 8.1448 0.0436 - 14.8085 22.9969 9,400,000 36.7265
230

City of Fairmont, MinnesotaPublic Utilities Commission
Wastewater Inflow and Cost Per Thousand Gallons TreatedLast Ten Fiscal Years
Table 30
Daily FlowTotal M Gallons Treatment Collection Administrative Depreciation Total Gallons
to Treatment Cost Per Cost Per Cost Per Cost Per Cost Per Minimum/Year Facility M Gallons M Gallons M Gallons M Gallons M Gallons Maximum
2018 778,920 586,482$ 270,740$ 239,901$ 613,724$ 1,710,847$ 871,000 0.7529 0.3476 0.3080 0.7879 2.1964 3,840,000
2017 586,820 615,313 296,213 226,687 615,145 1,753,358 871,000 1.0486 0.5048 0.3863 1.0483 2.9880 3,840,000
2016 673,240 491,159 296,240 219,344 610,867 1,617,610 1,230,000 0.7295 0.4400 0.3258 0.9074 2.4027 6,150,000
2015 490,670 589,736 294,909 204,631 602,976 1,692,252 945,000 1.2019 0.6010 0.4170 1.2289 3.4488 4,600,000
2014 475,036 532,665 287,866 235,712 603,592 1,659,835 904,000 1.1213 0.6060 0.4962 1.2706 3.4941 6,580,000
2013 468,170 633,326 303,052 205,663 638,193 1,780,234 890,000 1.3528 0.6473 0.4393 1.3632 3.8026 3,200,000
2012 404,830 623,509 279,944 151,457 630,541 1,685,451 840,000 1.5402 0.6915 0.3741 1.5575 4.1633 3,010,000
2011 656,800 588,910 284,448 170,820 609,304 1,653,482 990,000 0.8966 0.4331 0.2601 0.9277 2.5175 6,380,000
2010 741,060 587,921 271,987 88,233 621,179 1,569,320 1,280,000 0.7934 0.3670 0.1191 0.8382 2.1177 7,310,000
2009 536,740 584,674 293,973 71,296 619,184 1,569,127 1,040,000 1.0893 0.5477 0.1328 1.1536 2.9234 2,300,000
231

THIS PAGE IS LEFT
BLANK INTENTIONALLY
232

SINGLE AUDIT AND OTHER REQUIRED REPORTS
CITY OF FAIRMONT
FAIRMONT, MINNESOTA
FOR THE YEAR ENDED DECEMBER 31, 2018
233

THIS PAGE IS LEFT
BLANK INTENTIONALLY
234
INDEPENDENT AUDITOR’S REPORT ON MINNESOTA LEGAL COMPLIANCE
Honorable Mayor and City Council City of Fairmont, Minnesota We have audited, in accordance with auditing standards generally accepted in the United States of America, and the standards applicable to financial audits contained in Government Auditing Standards, issued by the Comptroller General of the United States, the financial statements of the governmental activities, the business-type activities, the discretely presented component unit, each major fund and the aggregate remaining fund information of the City of Fairmont, Minnesota (the City) as of and for the year ended December 31, 2018, and the related notes to the financial statements, and have issued our report thereon dated May 7, 2019. The Minnesota Legal Compliance Audit Guide for Cities, promulgated by the State Auditor pursuant to Minnesota Statute §6.65, contains seven categories of compliance to be tested: contracting and bidding, deposits and investments, conflicts of interest, public indebtedness, claims and disbursements, miscellaneous provisions, and tax increment financing. Our audit considered all of the listed categories. In connection with our audit, nothing came to our attention that caused us to believe that the City failed to comply with the provisions of the Minnesota Legal Compliance Audit Guide for Cities. However, our audit was not directed primarily toward obtaining knowledge of such noncompliance. Accordingly, had we performed additional procedures, other matters may have come to our attention regarding the City’s noncompliance with the above referenced provisions. The purpose of this report is solely to describe the scope of our testing of compliance and the results of that testing, and not to provide an opinion on compliance. Accordingly, this communication is not suitable for any other purpose.
ABDO, EICK & MEYERS, LLP Mankato, Minnesota May 7, 2019 100 Warren Street, Suite 600 Mankato, MN 56001 Office 507.625.2727 | Fax 507.388.9139
235

INDEPENDENT AUDITOR’S REPORT ON INTERNAL CONTROL OVER FINANCIAL REPORTING AND ON COMPLIANCE AND
OTHER MATTERS BASED ON AN AUDIT OF FINANCIAL STATEMENTS PERFORMED IN ACCORDANCE WITH GOVERNMENT AUDITING STANDARDS
Honorable Mayor and City Council City of Fairmont, Minnesota We have audited, in accordance with the auditing standards generally accepted in the United States of America and the standards applicable to financial audits contained in Government Auditing Standards issued by the Comptroller General of the United States, the financial statements of the governmental activities, the business-type activities, the discretely presented component unit, each major fund and the aggregate remaining fund information of the City of Fairmont, Minnesota (the City), as of and for the year ended December 31, 2018, and the related notes to the financial statements, which collectively comprise the City’s basic financial statements, and have issued our report thereon dated May 7, 2019. Internal Control Over Financial Reporting In planning and performing our audit of the financial statements, we considered the City's internal control over financial reporting (internal control) to determine the audit procedures that are appropriate in the circumstances for the purpose of expressing our opinions on the financial statements, but not for the purpose of expressing an opinion on the effectiveness of the City’s internal control. Accordingly, we do not express an opinion on the effectiveness of the City’s internal control. A deficiency in internal control exists when the design or operation of a control does not allow management or employees, in the normal course of performing their assigned functions, to prevent, or detect and correct, misstatements on a timely basis. A material weakness is a deficiency, or a combination of deficiencies, in internal control, such that there is a reasonable possibility that a material misstatement of the entity’s financial statements will not be prevented, or detected and corrected on a timely basis. A significant deficiency is a deficiency, or a combination of deficiencies, in internal control that is less severe than a material weakness, yet important enough to merit attention by those charged with governance. Our consideration of internal control was for the limited purpose described in the first paragraph of this section and was not designed to identify all deficiencies in internal control that might be material weaknesses or significant deficiencies. Given these limitations, during our audit we did not identify any deficiencies in internal control that we consider to be material weaknesses. However, material weaknesses may exist that have not been identified. Compliance and Other Matters As part of obtaining reasonable assurance about whether the City’s financial statements are free of material misstatement, we performed tests of its compliance with certain provisions of laws, regulations, contracts and grants, noncompliance with which could have a direct and material effect on the determination of financial statement amounts. However, providing an opinion on compliance with those provisions was not an objective of our audit and, accordingly, we do not express such an opinion. The results of our tests disclosed no instances of noncompliance or other matters that are required to be reported under Government Auditing Standards. 100 Warren Street, Suite 600 Mankato, MN 56001 Office 507.625.2727 | Fax 507.388.9139
236

Purpose of this Report
The purpose of this report is solely to describe the scope of our testing of internal control and compliance and the results of that testing, and not to provide an opinion on the effectiveness of the City’s internal control or on compliance. This report is an integral part of an audit performed in accordance with Government Auditing Standards in considering the City’s internal control and compliance. Accordingly, this communication is not suitable for any other purpose.
ABDO, EICK & MEYERS, LLP Mankato, Minnesota May 7, 2019
237

INDEPENDENT AUDITOR’S REPORT ON COMPLIANCE FOR EACH MAJOR FEDERAL PROGRAM AND REPORT
ON INTERNAL CONTROL OVER COMPLIANCE REQUIRED BY THE UNIFORM GUIDANCE
Honorable Mayor and City Council City of Fairmont, Minnesota Report on Compliance for Each Major Federal Program We have audited the City of Fairmont’s, Fairmont, Minnesota (the City) compliance with the types of compliance requirements described in the OMB Compliance Supplement that could have a direct and material effect on each of the City’s major federal programs for the year ended December 31, 2018. The City’s major federal programs are identified in the summary of auditor’s results section of the accompanying Schedule of Findings and Questioned Costs. Management’s Responsibility Management is responsible for compliance with federal statutes, regulations, and the terms and conditions of its federal awards applicable to its federal programs. Auditor’s Responsibility Our responsibility is to express an opinion on compliance for each of the City’s major federal programs based on our audit of the types of compliance requirements referred to above. We conducted our audit of compliance in accordance with auditing standards generally accepted in the United States of America; the standards applicable to financial audits contained in Government Auditing Standards, issued by the Comptroller General of the United States; and the audit requirements of Title 2 U.S. Code of Federal Regulations Part 200, Uniform Administrative Requirements, Cost Principles, and Audit Requirements for Federal Awards (Uniform Guidance). Those standards and the Uniform Guidance require that we plan and perform the audit to obtain reasonable assurance about whether noncompliance with the types of compliance requirements referred to above that could have a direct and material effect on a major federal program occurred. An audit includes examining, on a test basis, evidence about the City’s compliance with those requirements and performing such other procedures as we considered necessary in the circumstances. We believe that our audit provides a reasonable basis for our opinion on compliance for each major federal program. However, our audit does not provide a legal determination of the City’s compliance. Opinion on Each Major Federal Program In our opinion, the City complied, in all material respects, with the types of compliance requirements referred to above that could have a direct and material effect on each of its major federal programs for the year ended December 31, 2018. 100 Warren Street, Suite 600 Mankato, MN 56001 Office 507.625.2727 | Fax 507.388.9139
238

Report on Internal Control Over Compliance Management of the City is responsible for establishing and maintaining effective internal control over compliance with the types of compliance requirements referred to above. In planning and performing our audit of compliance, we considered the City’s internal control over compliance with the types of requirements that could have a direct and material effect on each major federal program to determine the auditing procedures that are appropriate in the circumstances for the purpose of expressing an opinion on compliance for each major federal program and to test and report on internal control over compliance in accordance with the Uniform Guidance, but not for the purpose of expressing an opinion on the effectiveness of internal control over compliance. Accordingly, we do not express an opinion on the effectiveness of the City’s internal control over compliance. A deficiency in internal control over compliance exists when the design or operation of a control over compliance does not allow management or employees, in the normal course of performing their assigned functions, to prevent, or detect and correct, noncompliance with a type of compliance requirement of a federal program on a timely basis. A material weakness in internal control over compliance is a deficiency, or combination of deficiencies, in internal control over compliance, such that there is a reasonable possibility that material noncompliance with a type of compliance requirement of a federal program will not be prevented, or detected and corrected, on a timely basis. A significant deficiency in internal control over compliance is a deficiency, or a combination of deficiencies, in internal control over compliance with a type of compliance requirement of a federal program that is less severe than a material weakness in internal control over compliance, yet important enough to merit attention by those charged with governance. Our consideration of internal control over compliance was for the limited purpose described in the first paragraph of this section and was not designed to identify all deficiencies in internal control over compliance that might be material weaknesses or significant deficiencies. We did not identify any deficiencies in internal control over compliance that we consider to be material weaknesses. However, material weaknesses may exist that have not been identified. The purpose of this report on internal control over compliance is solely to describe the scope of our testing of internal control over compliance and the results of that testing based on the requirements of the Uniform Guidance. Accordingly, this report is not suitable for any other purpose.
ABDO, EICK & MEYERS, LLP Mankato, Minnesota May 7, 2019
239

City of Fairmont, MinnesotaSchedule of Expenditures of Federal Awards
For the Year Ended December 31, 2018
FederalDomestic Pass-Through
Assistance Entity Identifying Total FederalNumber Number Expenditures
U.S. Department of Economic Adjustment 11.307 607,762$Commerce Assistance
U.S. Department of Minnesota Department National Guard Military 12.401 P0116X01SRM 8,750Defense of Military Affairs Operations and Maintenance
U.S. Department of Minnesota Department Community Development 14.228 CDAP-15-0060-O-FY16 273,997Housing and of Employment and Block GrantsUrban Development Economic Development
U.S. Department Minnesota Department Airport Improvement 20.106 TMNFAA00291415 93,316of Transportation of Transportation Program
U.S. Department Minnesota Department Highway Planning 20.205 1029945 719,540of Transportation of Transportation and Construction
U.S. Department of Minnesota Department Disaster Grants - 97.036 165,005Homeland Security of Public Safety Public Assistance
Total Expended 1,868,370$
Balance of RLF loans outstanding at year end 343,244$ Cash and investment balances in the RLF at year end 263,405
Administrative expenses paid out of RLF income during the year 1,113Subtotal 607,762
Federal share of the RLF 100%
Total Expenditures 607,762$
FederalFunding Source Name
ProgramAdministeringDepartment
240
lmunguia_ABDO16C
Sticky Note
Marked set by lmunguia_ABDO16C
City of Fairmont, Minnesota Notes to Schedule of Expenditures of Federal Awards
For the Year Ended December 31, 2018 Note 1: Basis of Presentation The accompanying Schedule of Expenditures of Federal Awards includes the federal grant activity of the City of Fairmont, Minnesota, (the City) for the year ended December 31, 2018. The City's reporting entity is defined in Note 1A to the City's financial statements. The information in this schedule is presented in accordance with the requirement of the Uniform Guidance, Audits of States, Local Governments, and Non-Profit Organizations. All Federal awards received directly from Federal agencies as well as Federal awards passed through other government agencies are included on the schedule. Note 2: Summary of Significant Accounting Policies for Expenditures Expenditures reported on this schedule are reported on the modified accrual basis of accounting. Such expenditures are recognized following, as applicable, either the cost principles in OMB Circular A-122, Cost Principles for Non-Profit- Organizations, or the cost principles contained in Title 2 U.S. Code of Federal Regulations Part 200, Uniform Administrative Requirements, Cost Principles, and Audit Requirements for Federal Awards, wherein certain types of expenditures are not allowable or are limited as to reimbursement. Note 3: Pass-Through Entity Identifying Numbers Pass-through entity identifying numbers, if any, are presented where available. Note 4: Subrecipients No federal expenditures presented in this schedule were provided to subrecipients. Note 5: Indirect Cost Rate During the year ended December 31, 2018, the City did not elect to use the 10% de minimis indirect cost rate.
241

THIS PAGE IS LEFT
BLANK INTENTIONALLY
242

Section I - Summary of Auditor's Results
Financial Statements
Type of auditor's report issued UnmodifiedInternal control over financial reporting
Material weaknesses identified? NoSignificant deficiencies identified not considered to be material weaknesses? None reported
Noncompliance material to financial statements noted? No
Federal Awards
Internal control over major programsMaterial weaknesses identified? NoSignificant deficiencies identified not considered to be material weaknesses? None reported
Type of auditor's report issued on compliance for major programs UnmodifiedAny audit findings disclosed that are required to be reported in accordance with
2CFR section 200.516(a)? Yes
Identification of Major Programs/Projects CFDA No.
Highway Planning and Construction 20.205
Dollar threshold used to distinguish between Type A and Type B Programs 750,000$
Auditee qualified as low-risk auditee? Yes
Section II - Financial Statement Findings
Section III - Major Federal Award Findings and Questioned Costs
City of Fairmont, MinnesotaSchedule of Findings and Questioned Costs
For the Year Ended December 31, 2018
None
There are no significant deficiencies, material weaknesses, or instances of noncompliance including questioned costs that are required to be reported in accordance with Uniform Guidance.
243
lmunguia_ABDO16C
Sticky Note
Marked set by lmunguia_ABDO16C