ANNUAL FEDERAL BUDGET 2021-22
21
BMA Research [email protected] UAN: 111-262-111 ext. 2067 REP-005 For the full list of authors, see inside. Prices are as of 11 June 2021. ANNUAL FEDERAL BUDGET 2021-22 Moving from stabilizaon to growth Sunday, June 13, 2021
Transcript of ANNUAL FEDERAL BUDGET 2021-22

BMA Research
UAN: 111-262-111 ext. 2067
REP-005
For the full list of authors, see inside.
Prices are as of 11 June 2021.
ANNUAL FEDERAL BUDGET 2021-22 Moving from stabilization to growth
Sunday, June 13, 2021

Annual Budget FY 2021-22
Pakistan Investment Research
Sunday, June 13, 2021 2
BMA RESEARCH TEAM
Faizan Ahmed Abdul Rehman Siddiqui Syed Ali Ahmed Zaidi
Head of Research Senior Analyst Senior Analyst
021-111-262-111 ext. 2067 021-111-262-111 ext. 2006 021-111-262-111 ext. 2062
[email protected] [email protected] [email protected]
Noor Huda Shaikh Taha Madani Kamal Ahmed
Research Analyst Research Analyst Technical Analyst
021-111-262-111 ext. 2053 021-111-262-111 ext. 2056 021-111-262-111 ext. 2148
[email protected] [email protected] [email protected]
Naseem Akhtar Khattak
Manager Database
021-111-262-111 ext. 2060

3
BMA Capital Management Ltd. 801 Unitower, I.I.Chundrigar Road, Karachi, 74000, Pakistan For
further queries. Last page of this report contains important disclosures and disclaimers. For que-
ries, please contact: [email protected] or call UAN: 111-262-111
EXECUTIVE SUMMARY
More than meets the eye
REP—005
Sunday, June 13, 2021
PAKISTAN INVESTMENT RESEARCH
Federal Budget FY 2021-22
Pakistan Tehreek-e-Insaaf (PTI) govt. presented its third Federal Budget for the year
2021-22 yesterday amidst the usual uproar by the opposition parties in the National
Assembly (NA). The proposals put forth by PTI this time around were widely
acknowledged as reformist in true sense of the word as a number of long-standing
fiscal issues were addressed. Govt. opted to give the industries the stick to catch the
fish rather than the fish itself. A growth-focused, export-oriented budget which sets
the stage for a long-term sustainable growth in Pakistan. Barring a few measures
which could feed inflation in the medium-term, overall budget is largely positive for
economy and capital market in the country. The initiatives taken offer more than
what meets the eye. We maintain our bullish stance on Pak Equities and see our
Bull Case KSE-100 index target of 59,000pts materializing by the end of 2021. We
are overweight on Banks, IT, Cements, Textiles, Pharmaceuticals, Steel and refiner-
ies.
Revenue targets seem consistent with GDP growth projections: The Federal budget
FY22 marks the end of a tough 2 years long economic stabilization period which saw
increases in public indebtedness, high interest rates and tough curbs on imports. Aid-
ed by a mix of tax reforms and incentives to the private sector, govt seeks to collect
PKR 7,909Bn in taxes next, which reflects a growth of 20.3% YoY. Out of the total, PKR
5,829Bn is estimated to be generated via taxable revenue through FBR while the re-
mainder is bridged by Non-tax revenue of PKR 2,080Bn. The surge in FBR revenue is
expected to be fulfilled by increased income tax (up 22% YoY) whereas Non-tax reve-
nue is estimated to be met by greater SBP profits and increased collection on energy
products. However, in order for these collection targets to materialize, it is important
that GDP grows in-line with govt’s growth projections.
Focus now shifts to export-led growth & taxation reforms: Following a strong come-
back in 2HFY21, GDP growth is expected to continue its robust momentum and climb
to 3.9% in the current year, a huge improvement from an abysmal FY20. Moving for-
ward, the government expects the up-turn to continue going into the next fiscal year
with the GDP growth target set at 4.8% while in the medium term, it is expected to
rise to 5-7%.
A sweet budget for capital market and listed sectors: All in all, the budget came as a
welcome sign for the local bourse and listed sectors as an array of tax concessions,
duty drawbacks and pro-growth/supportive policies were announced. Taking cue
from the announcement, PSX related measures with notable ones being rationaliza-
tion in CGT (down to 12.5% from 15.0% for filers), abolishment of CVT on buy/sell
transactions and NCCPL advance tax would improve investor sentiments and enhance
market participation, in our view. Key stocks benefitting from budgetary develop-
ments include; 1) ATRL; 2) PRL; 3) NRL; 4) BYCO; 5) LUCK; 6) DGKC; 7) MLCF; 8) KOHC;
9) NML; 10) GATM; 11) ASC; 12) TOMCL; 13) PSMC; 14) SYS; 15) HINOON; 16) GSKCH;
17) AGP; and 18) SEARLE; 19) ISL; 20) ASL; 21) MUGHAL; 22) ASTL; and 23) AGHA. Our
top picks from BMA Universe include: 1) LUCK (TP: PKR 1,200); 2) MLCF (TP: PKR 85);
3) FLYNG (TP: PKR 46); 4) HBL (TP: PKR 160); 5) BAHL (TP: PKR 112); 6) MUGHAL (TP:
PKR 125); 7) SYS (TP: PKR 619); 8) IMAGE (TP: PKR 40); 9) ENGRO (TP: PKR 400); and
10) KAPCO (TP: PKR 45).
Table 2: Pakistan Govt. Macro Forecast
Description FY21R FY22B FY23B
GDP (PKR Bn) 47,709 53,867 60,811
GDP Growth (% YoY) 3.9% 5.0% 5.7%
Inflation (% YoY) 9.0% 8.2% 7.2%
Federal Rev. (% GDP) 13.4% 14.7% 14.9%
Federal Exp. (% GDP) 15.4% 15.8% 14.6%
Fiscal Bal. (% of GDP) -7.1% -6.3% -5.3%
Primary Bal.(% GDP) -1.2% -0.7% 0.2%
Public Debt (% GDP) 83.1% 81.8% 79.1%
Source: Annual Budget Statement 2021
Table 1: Budget Summary
PKR Bn FY21B FY22B % Chg.
Gross Revenue 6,573 7,909 20.3%
Tax Revenue 4,963 5,829 17.4%
Non-Tax Revenue 1,610 2,080 29.2%
Transfer to Provinces -2,874 -3,412 18.7%
Net Revenue 3,700 4,497 21.5%
Total Expenditure 7,137 8,487 18.9%
Current Expenditure 6,346 7,523 18.6%
Dev. Exp. & Net Lending 792 964 21.7%
Fiscal Balance -3,437 -3,990 16.1%
Provincial Surplus 242 570 135.5%
Cons. Fiscal Balance -3,195 -3,420 7.0%
% of GDP -7.0% -6.3% 0.7%
Primary Balance -249 -360 44.6%
% of GDP -0.5% -0.7% -0.1%
GDP (PKR Bn) 45,567 53,867 18.2%
Source: Budget in Brief 2022

Annual Budget FY 2021-22
Pakistan Investment Research
Sunday, June 13, 2021 4
TABLE OF CONTENTS
Executive Summary…………………….……….………………………………….………………...3
Budget impact on listed Sectors and Economy……………………...………………...5
Key custom duty changes in FY22 Budget……………………..….…………………...11
Budget FY22 focus charts………………………..…………………….…………………….....12
Revenue targets for FY22 heavily depend on GDP forecast…………….……..13
Markup payments to eat up most of the budget………………….…….………….14
FY22 budget breakdown………………………………….………………….………………....15
KSE-100 likely to extend its rally as Pakistan enters a new era…….….……..16
Summary of FY22 budget ……………………………………...……………….….…………..17
BMA Universe………………………………………………….……………………….…….……….18
Abbreviations…………………………………………………...…………………….…….………...20

Annual Budget FY 2021-22
Pakistan Investment Research
Sunday, June 13, 2021 5
Sector Key Changes Impact Importance Our View
Economy
Setting up of Special Technology Zones
(STZ), offering incentives such as In-
come Tax exemptions for 10 years for IT
services, IT enabled exports, IT enabled
contracts and technical services firms.
In addition, sales tax on raw material
and machinery has also been abolished
for these companies existing in these
STZs.
Positive High
An excellent initiative to spur IT exports in the
country. Pakistan is taking a leap forward in the
technological revolution age by incentivizing IT
sector in the country. IT exports are expected to
cross USD 2Bn in FY21 (↑48% YoY) and have the
potential to cross USD 10Bn in the next 5 years.
Formulation of an export facilitation
scheme which shall supersede existing
scheme (existing scheme to be phased
out over the next two years). Benefits
on export receipts will be automated
and tax matters will be streamlined for
exporters.
Positive High
Enhanced focus on exports is a welcome sign as it
will help ensure external account sustainability.
Exports have shown some improvement during
FY21 but more needs to be done to shift the tilt
towards high-value added exports.
Local supplies of raw materials/plant
and machinery to registered exporters
falling under Export Facilitation
Scheme, 2021 will be zero-rated.
Positive High
Will incentivize setting up of export-oriented in-
dustries in Pakistan. Encourage new investments
by domestic and foreign players in high-value
added export segments.
Subsidized turnover tax of 1% (1.5%
previously) on export of services, con-
tracts and technical services carried
outside Pakistan.
Positive High The concession is likely to boost services exports
in the country.
PSDP allocation increased to PKR 900Bn
from PKR 650Bn last year. Positive High
Increased allocation will spur construction sector
activity and employment of a large, young work-
force in the country.
PKR 30Bn allocated for Naya Pakistan
Housing and PKR 3bn markup subsidy
for Naya Pakistan Scheme. In addition,
for people under the age of 30, PKR
0.3Mn subsidy will be given for small
houses and PKR 2Mn worth of interest
free loans will be provided under the
Naya Pakistan Housing Scheme.
Positive High
Given PM Imran Khan’s emphasis on construction
sector, we believe that this is a step in the right
direction and will significantly boost construction
sector credit and activity in the country going
forward.
Abolishment of 12 types of Withholding
Taxes (WHT) on various types of trans-
actions. Most notable of these is reduc-
tion in WHT on banking transactions.
Positive High
This adjustment is likely to reduce dependence
on indirect withholding taxes and will encourage
fresh deposits into formal banking channels.
Petroleum Levy (PL) budgetary alloca-
tion increased from PKR 450Bn to PKR
610Bn.
Negative High
The measure will likely be inflationary in nature
as increased PL will be directly passed into petro-
leum product prices.
BUDGET IMPACT ON LISTED SECTORS & ECONOMY

Annual Budget FY 2021-22
Pakistan Investment Research
Sunday, June 13, 2021 6
Sector Key Changes Impact Importance Our View
Capital Market
Abolishment of Capital Value Tax (CVT).
Previously, it was charged at 0.02% on
purchase/sale value at the time of
buying/selling.
Positive High
Will likely boost trading activity at Pakistan Stock
Exchange (PSX) and also enhance investor base in
the country. Active investor accounts in the coun-
try have remained stagnant at 250k for over 5
years.
Abolishment of NCCPL advance tax
collection equating to 10% of profit/
markup/interest earned by margin fi-
nancier, member or securities lender.
Positive High
Abolishment of advance tax will likely increase the
use of leveraged products at PSX. An upward shift
in the level of margin financing can be expected
which currently stands at PKR 11.45Bn, down
from its 1yr high of PKR 14.03Bn recorded in
Feb’21.
Tax credit on new listings at PSX has
been abolished. Previously new compa-
nies listed on PSX could avail 20% tax
credit for first two years and 10% for
subsequent two years.
Negative High
This change could discourage new entities from
getting listed on PSX. New listings have remained
chronically low at PSX historically due to multiple
reasons. This adjustment could further slowdown
IPO activity in the country.
Capital Gains Tax (CGT) on shares trad-
ing reduced from 15% to 12.5% for tax
return filers. CGT for non-filers re-
mained unchanged at 30%.
Positive High
A very positive development which will fuel trad-
ing activity at PSX. Reduction in CGT has been a
key demand of PSX for a number of years.
Autos
Exemption from FED (previously 2.5%)
on cars with engine capacity of up to
850cc. Sales tax on these cars is also
reduced from 17% to 12.5%.
Positive High
Will likely reduce prices of smaller cars in the
country by up to PKR 113k and boost unit sales.
PSMC is likely to be a key beneficiary of this devel-
opment.
AVT (AD-valorem tax) exemption of 3%
for electric vehicles CKD kits/small cars
up till Jun’26 while AVT exemption for
2-3 wheelers in CBU condition is availa-
ble till Jun-25.
Neutral Medium
Influx of electric vehicles in Pakistan will likely
dent sales of existing auto manufacturers in the
country in the medium-long term.
New clause added in transfer of vehicle
cost to penalize business of ‘On’ mon-
ey. PKR 50,000, 100,000 and 200,000
imposed on transfer of vehicles below
1000cc, 2000cc and over 2000cc re-
spectively.
Positive Medium
This will likely discourage the prevailing ‘on’ mon-
ey practices and reduce delivery time for consum-
ers. The measure can likely boost new car sales of
existing players such as HCAR, INDU, PSMC, KIA,
HYUNDAI etc.
BUDGET IMPACT ON LISTED SECTORS & ECONOMY

Annual Budget FY 2021-22
Pakistan Investment Research
Sunday, June 13, 2021 7
Sector Key Changes Impact Importance Our View
Cements
Federal PSDP increased by 43%
YoY from PKR 630Bn to PKR 900Bn
while allocation for provinces has
been budgeted at PKR 1.2Trn.
Positive High
Highest ever PSDP announcement as the government’s
focus on growth bodes well for the cement sector as
demand from the local end will continue to remain
upwelling. We have a bullish stance on Pak Cements.
PKR 30Bn subsidy for alleviation of
Naya Pakistan Housing Scheme
and another PKR 3Bn mark-up sub-
sidy for low cost housing loans.
Positive High
Continuing with the focus of providing low cost hous-
ing solutions to low-income groups, this development
from the government will spur demand growth for the
sector.
Refineries
Imposition of 10% custom duty on
Motor Spirit (MS) and High Speed
Diesel (HSD).
Positive High
Additional revenue from this end will likely be utilized
for expansion projects of refineries. Positive for all
listed Refineries
10 year tax holiday for new refin-
eries and BMR projects for existing
refineries.
Positive High
The incentives being offered by the government will
aid in attracting new investment into the refinery sec-
tor and likely spur domestic output. Positive for PRL,
BYCO, ATRL.
Abolishment of zero-rating on
crude oil import. Neutral Low
As a result of this withdrawal, sales tax of 17% will now
be charged on crude oil imports. Greater revenue from
this end will aid the government in achieving its ambi-
tious revenue targets.
Textile
Abolishment of custom and regula-
tory duties of 5% on the import of
polyester yarn.
Positive High
This is a positive development for all textile players as
yarn is the basic raw material for textiles and will likely
boost their gross margins.
Increase in general sales tax on
raw cotton and ginned cotton from
10% to 17%.
Negative High
This will likely increase cotton prices which is another
basic raw material used in the manufacturing process
and shrink gross margins.
Increase in GST on potassium chlo-
rate which will now be imposed at
PKR 90/kg from PKR 80/kg at a
standard 17% rate.
Negative Medium This is a negative development for the sector as potas-
sium chlorate is used in the fabrics dyeing process.
Steel
Imposition of 17% sales tax on the
import of steel billets, ingots, ship
plates and other long re-rolled
items.
Positive High
Imposition of GST on imported products will make it
costlier for commercial importers thereby improving
pricing power of local players. We see MUGHAL,
AGHA, ITTEFAQ & ASTL to be major beneficiaries of
this development.
Abolishment of CD/ACD and re-
duction in RD on import of stain-
less steel and HRC
Positive High
This will reduce production costs and improve gross
margins for flat steel producers including ISL & ASL
which currently only pay custom duty at 5% on import-
ed HRC.
Banks Removal of WHT tax (0.6% for non
-filers) on banking transactions. Positive High
We expect this development to reduce Currency in
Circulation (CIC) and improve flow into the formal
channel. This will also reduce in cash based transac-
tions in the economy and spur deposits growth.
Technology
Zero rated taxation regime for
companies who bring back 80% of
their export revenues into Pakistan
through formal banking channels.
Positive Medium
This is a non-event for listed tech sector. Current listed
companies such as NETSOL and SYS are already avail-
ing this tax benefit. This only changes the nature of tax
benefit whereby all companies now fall under zero-
BUDGET IMPACT ON LISTED SECTORS & ECONOMY

Annual Budget FY 2021-22
Pakistan Investment Research
Sunday, June 13, 2021 8
Sector Key Changes Impact Importance Our View
Pharma
Exemption of CD/ACD on more
than 350 Active Pharmaceutical
Ingredients (API’s).
Positive High This development will drive down import prices for phar-
ma companies thereby enhancing their gross margins.
Concessionary borrowing on plant,
machinery and equipment @ 5%. Positive High
This will incentivize the pharma sector and encourage
them in enhancing their footprint.
Abolishment of customs duty on 6
life saving drugs. Positive High
This will reduce cost burden on end consumer of life saving
drugs.
Others Tax on profit from debt set at uni-
form 15% across all income levels. Neutral Low
Reduced taxation will increase disposable income of indi-
viduals and increased spending.
Tax credit offered for investment
in Point of Sales (POS) machines. Neutral Low
The drive towards documentation of retailer continues.
This will help in speeding documentation drive.
Tax on rental income of PKR 200k,
other than salary, has been im-
posed.
Negative Low
Removal of Advance (5%) tax on
extraction of minerals. Neutral Low
Sales tax of 2/2.5% of the gross
amount payable by distributors of
FMCG companies has now been
abolished.
Positive Medium
Reduction in sales tax will likely translate into lower prices
of FMCG sector products and somewhat help ease core
inflation in the country.
Rate of tax collection will be 7.5%
for domestic consumers if monthly
electricity bill exceeds PKR 25k,
otherwise.
Neutral Low
Advance tax of 0.5% on certain
petroleum products has been
abolished.
Neutral Low Will result into lower petroleum prices and somewhat ease
inflationary pressures
1% Advance tax on amount re-
mitted abroad through credit, deb-
it or prepaid cards has been abol-
ished.
Neutral Low
Will increase the use of formal banking channels and help
in documentation. In addition, increased transaction vol-
umes will improve fee income of banks.
Extension in tax exemptions for a
person who books gains and
profits on sale of immovable prop-
erty to REITs till June, 2023.
Neutral Low
Gains derived by venture capital
firms up to Jun-24 will no more be
tax exempted.
Negative Medium Will likely deter VC investments in Pakistan which have
recently started to pick up.
BUDGET IMPACT ON LISTED SECTORS & ECONOMY

Annual Budget FY 2021-22
Pakistan Investment Research
Sunday, June 13, 2021 9
Sector Key Changes Impact Importance Our View
Advance tax exemption on profits
derived by LNG terminal operators
and terminal owners for a period
of 5 years has been abolished.
Negative Low
ACD exemption on the import of
raw materials for the production
of cables and optical fiber.
Positive Medium
Positive for WTL. The company is in the process of acquir-
ing new fiber optic lines to upgrade its existing infrastruc-
ture.
Reduction/exemption in CD/ACD
on raw materials for paint manu-
facturing.
Positive Medium Positive for BERG, BUXLY and other importers of paint raw
materials.
Removal of CD & ACD on 6 life-
saving drugs. Positive Low
Reduction in RD on the import of
cell phones. Positive Low
SEZs exempted from minimum
turnover tax. Positive Medium
Warehouses for food preservation
now exempt from taxes. Positive Medium
The measure will increase warehousing activity in the
country and help towards ensuring food security and food
price stability in the future.
Removal of 5% advance tax and
absolute advance tax on air tickets. Positive Low
Turnover tax on bike dealers in-
creased from 0.3% to 0.5%. Negative Low
The measure could increase bike prices. However, the
effect of price increase is unlikely to be material on 2
wheeler sales.
Abolishment of customs duty on
the import of plant and machinery
for bagasse/biomass based Cogen
projects.
Positive Low Likely a minor positive for sugar millers.
Reduced duties on the import of
raw materials and inputs for use in
footwear industry.
Positive Medium Positive for BATA and SRVI, the two major listed footwear
manufacturers in Pakistan.
Imposition of sales tax on sales via
online markets and channels. Neutral Low
Tax credit amendments previously
offered to new industrial under-
takings have now been removed.
Negative Low
CGT on disposal of immovable
property increased to 5.0% from
2.5% for gains up to PKR 5Mn.
Negative Low
Sales tax on imported LNG for ser-
vicing CNG sector and local sup-
plies have been reduced to 0%
from previous 5%.
Positive Low
BUDGET IMPACT ON LISTED SECTORS & ECONOMY

Annual Budget FY 2021-22
Pakistan Investment Research
Sunday, June 13, 2021
Sector Key Changes Impact Importance Our View
Sales tax on plant and machinery not manu-
factured locally and having no compatible
local substitutes have been reduced to 0%
from 10%.
Positive Low The measure could facilitate fixed capital invest-
ments in the country.
Sales tax on Plant, machinery, and equip-
ment used in production of biodiesel have
been reduced to 0% from 5%.
Positive Low
Sales tax on agriculture machinery used for
harvesting, threshing and storage have been
reduced to 0% from 5%.
Positive Low
First year allowance has been removed for
plant, machinery and equipment installed by
any industrial undertaking set up in specified
rural and under developed areas or engaged
in the manufacturing of cellular mobile
phones and qualifying for exemption.
Negative Low
From now on, a person would be unable to
take depreciation benefit on amount exceed-
ing asset purchasing value.
Positive Medium Will result into lowering of speculative activity in the
real estate sector.
CNIC shall be the common identifier number
for sales tax. For Companies, NTN shall be
the common identifier number in addition to
sales tax registration number.
Positive Medium
This is a step in the right direction towards simplifi-
cation of tax. Also, this will improve documentation
of the economy going forward.
Now a person can extend the sales tax file
return by giving an application to the com-
missioner courtesy that the following rea-
sons apply; (a) absence from Pakistan; (b)
sickness or other misadventure; or (c) any
other reasonable cause.
Neutral Low
Local supplies of raw materials, components,
parts and plant and machinery to registered
exporters have been omitted from sales tax
under Gwadar free zone.
Neutral Low
Retailing of smuggled goods has been includ-
ed in the definition of smuggling. Positive High
The measure will help in curbing smuggling and im-
prove tax collection in the country. A positive for
GTYR which continues to battle smuggled tyres in
the replacement market.
BUDGET IMPACT ON LISTED SECTORS & ECONOMY

Annual Budget FY 2021-22
Pakistan Investment Research
Sunday, June 13, 2021
KEY CUSTOMS DUTY CHANGES IN FY22 BUDGET
Table 3: Custom Duty changes
Commodities Customs 2020 Customs 2021 Change Impact Impact on Companies
Energy
Crude Oil 3.00% 2.50% 0.50% Positive Positive for BYCO, ATRL, NRL, PRL
MS 3.00% 10.00% -7.00% Positive Positive for BYCO, ATRL, NRL, PRL
HSD 11.00% 10.00% 1.00% Neutral Positive for BYCO, ATRL, NRL, PRL
Textile
Synthetic filament yarn polyester 11.00% 9.00% 2.00% Positive Negative for ICI, positive for textiles
Synthetic staple fiber of polyester 6.50% 7.00% -0.50% Neutral Positive for textile companies
Basic dyes and preparations based thereon 3.00% 0.00% 3.00% Positive Textile companies
Steel
HRC 5.00% 0.00% 5.00% Positive Flat steel (ISL, ASL, INIL)
Pharmaceutical API
Cefixime 16.00% 0.00% 16.00% Positive Highnoon, Searl, Abbot, AGP
Source: Finance Bill, BMA Research
BUDGET AT A GLANCE
Table 4: FY22 Budget at a Glance
PKR Bn FY19 FY20 FY21B FY21R % Chg. FY22B % YoY
Fiscal Revenue 4,436 5,782 6,573 6,395 -2.7% 7,909 23.7%
Tax Revenue 3,829 3,998 4,963 4,691 -5.5% 5,829 24.3%
Non-Tax Revenue 607 1,784 1,610 1,704 5.9% 2,080 22.0%
Fiscal Expenditure 5,982 7,248 7,137 7,341 2.9% 8,487 15.6%
Current Expenditure 4,804 6,093 6,343 6,561 3.4% 7,523 14.7%
Debt Servicing 2,091 2,620 2,946 2,851 -3.2% 3,060 7.3%
Defense Expenditures 1,147 1,213 1,286 1,295 0.7% 1,370 5.8%
Other Current Expenditures 1,566 2,260 2,110 2,415 14.5% 3,094 28.1%
Development Expenditure & Net Lending 1,178 1,155 794 780 -1.8% 964 23.6%
Provincial Transfers 2,398 2,504 2,874 2,704 -5.9% 3,412 26.2%
Net Revenue Receipts 2,038 3,278 3,700 3,691 -0.2% 4,497 21.8%
Overall Fiscal Balance (3,944) (3,970) (3,437) (3,650) 6.2% (3,990) 9.3%
Provincial Surplus 499 594 242 242 0.0% 570 135.5%
Cons. Fiscal Balance (3,445) (3,376) (3,195) (3,408) 6.7% (3,420) 0.4%
Total Fiscal Financing -3,944 -3,970 -3,437 -3,650 6.2% -3,990 9.3%
External Fiscal Financing 417 896 810 1,323 63.3% 1,246 -5.8%
Domestic Fiscal Financing 3,527 3,074 2,627 2,327 -11.4% 2,492 7.1%
Privatization Proceeds 0 0 0 0 N/A 252 N/A
Primary Fiscal Balance -1,354 -756 -249 -557 123.8% -360 -35.3%
GDP 38,086 41,556 45,567 47,709 4.7% 53,867 12.9%
Source: Budget in Brief 2021-22, MoF, BMA Research

Annual Budget FY 2021-22
Pakistan Investment Research
Sunday, June 13, 2021
Chart 3: Growth in FY21 remained better than expected Chart 4: Fiscal deficit (% of GDP)
Source: SBP, BMA Research Source: MoF, BMA Research
Chart 1: GDP growth to recover strong Chart 2: Growth target for FY22
Source: MoF, BMA Research Source: SBP, BMA Research
Chart 5: Govt. inflation projections seem reasonable Chart 6: Aiming for higher tax collection next year
Source: MoF, BMA Research Source: PBS, BMA Research
-1.0%
0.0%
1.0%
2.0%
3.0%
4.0%
5.0%
6.0%
0.0
10.0
20.0
30.0
40.0
50.0
60.0
FY11
A
FY12
A
FY13
A
FY14
A
FY15
A
FY16
A
FY17
A
FY18
A
FY19
A
FY20
A
FY21
R
FY22
B
PKR
Trn
Norminal GDP GDP (% YoY) - RHS
Agricultural sector, 3.50%
Industrial Sector, 6.20%
Services Sector, 4.70%
2.1%
2.8%
0.1%
2.6%
3.9%
2.8%
3.6%
4.4%
0.0%
0.5%
1.0%
1.5%
2.0%
2.5%
3.0%
3.5%
4.0%
4.5%
5.0%
GDPg rate Agriculture Industries Services
FY21 Target Revised Forecast
6.56.8
8.2
5.5 5.3
4.6
5.8
6.6
8.9
8.1
7.1
6.3
0.0
1.0
2.0
3.0
4.0
5.0
6.0
7.0
8.0
9.0
10.0
FY1
1A
FY1
2A
FY1
3A
FY1
4A
FY1
5A
FY1
6A
FY1
7A
FY1
8A
FY1
9A
FY2
0A
FY2
1R
FY2
2B
13.7%
11.1%
7.4%
8.6%
4.6%
2.9%
4.2%
4.7%
6.8%
10.8%
9.0%
8.2%
FY11A
FY12A
FY13A
FY14A
FY15A
FY16A
FY17A
FY18A
FY19A
FY20A
FY21R
FY22B
% Y
oY
0.0%
2.0%
4.0%
6.0%
8.0%
10.0%
12.0%
14.0%
FY1
1A
FY1
2A
FY1
3A
FY1
4A
FY1
5A
FY1
6A
FY1
7A
FY1
8A
FY1
9A
FY2
0A
FY2
1R
FY2
2B
Tax Revenue (as % of GDP)
BUDGET FY22 FOCUS CHARTS

Annual Budget FY 2021-22
Pakistan Investment Research
Sunday, June 13, 2021
Revenue targets for FY22 heavily depend on GDP forecasts
FBR tax collection budget to increase by 27% YoY: The government has envisaged total gross rev-
enue outlay of PKR 7,909Bn for the upcoming fiscal year, up 26.7% from previous year revised
estimates of PKR 6,395Bn. The government expects PKR 5,829Bn (up 17.4% YoY) of this target to
be met via FBR revenue while the remainder is forecasted to be collected in the shape of non-tax
revenue (PKR 2,080Bn, up 22.0% YoY).
How does the government expects FBR to contribute to its revenue target? The sizable jump in
FBR revenue is expected to be met through an increase in both direct and indirect taxation to the
tune of 22.0% YoY and 25.7% YoY respectively. In terms of direct taxes, primary impetus is ex-
pected to come from taxes on income that are expected to surge to PKR 2.17Trn (up 22.0% YoY).
On the flip side, indirect taxes, the sum is forecasted to climb to PKR 3.6Trn with principal growth
coming from Sales tax (up 30.0% YoY) to PKR 2.5Trn.
What contributions will be made from non-tax revenue? In terms of non-tax revenue, the 22.0%
YoY growth is expected to be collected through higher petroleum levy (up PKR110Bn YoY) and
increased GIDC (up PKR 105Bn YoY) being the primary changes from previous year revenue tar-
gets. Apart from these, profits from SBP, albeit lower by PKR 50Bn, are expected to continue a
bulky chunk towards Non-Tax revenues.
Table 5: Revenue Receipts Target
PKR Bn FY21B FY21R % Chg. FY22B % YoY
FBR Tax Revenues 4,963 4,691 -5.48% 5,829 24.26%
Direct Taxes 2,043 1,789 -12.43% 2,182 21.97%
Income Tax 2,033 1,780 -12.43% 2,172 22.02%
Others 10 9 -13.10% 10 11.97%
Indirect Taxes 2,920 2,902 -0.62% 3,647 25.67%
Custom Duties 640 700 9.38% 785 12.14%
Sales Tax 1,919 1,927 0.42% 2,506 30.05%
Federal Excise 361 275 -23.82% 356 29.45%
Non-Tax Revenues 1,610 1,704 5.85% 2,080 22.03%
Levies & Fees 26 18 -29.92% 30 60.07%
Fee Collected by ICT Admin 20 13 -34.55% 20 52.62%
Others 6 5 -13.65% 9 79.92%
Income from Property & Enterprise 211 177 -15.91% 266 50.03%
PTA (3G / 4G) Licences 2 2 20.95% 4 65.36%
Mark-up (Provinces) 27 25 -7.00% 36 42.34%
Mark-up (PSEs & others) 93 75 -19.65% 90 20.00%
PSE Dividends 61 40 -33.86% 90 124.07%
Others 28 34 25.18% 46 33.26%
Receipts from Civil Administration 646 728 12.69% 684 -5.97%
SBP Profit 620 700 12.90% 650 -7.14%
Others 26 28 7.45% 34 23.91%
Misc. Receipts 728 781 7.38% 1,101 40.86%
Petroleum Levy 450 500 11.11% 610 22.00%
GIDC 15 25 66.67% 130 420.00%
Royalty on Natural Gas 54 57 5.92% 65 14.04%
Royalty on Crude Oil 23 26 13.04% 35 34.62%
Others 186 173 -6.72% 261 50.33%
Total Fiscal Revenues 6,573 6,395 -2.7% 7,909 23.7%
Source: Budget in Brief FY22, MoF

Annual Budget FY 2021-22
Pakistan Investment Research
Sunday, June 13, 2021
Markup payments to eat up most of the budget
Focus on providing relief to the masses: The government expects total current expenditure for
the next fiscal year to climb to PKR 7,523Bn (up 18.6% YoY). Breaking it up, the major changes are
expected in terms of subsidy pay-outs that have been scaled up from PKR 209Bn in FY21 to PKR
682Bn in the next fiscal year and PKR 100Bn for COVID relief fund. The sizable increase in subsi-
dies primarily relate to grants allocated to the power sector. Of these, PKR 266Bn are to be allo-
cated to Power Holdings Private Limited (PHPL) and IPPs. PKR 245Bn subsidy for WAPDA/PEPCO
and PKR 85Bn have been set aside for KEL. Continuing with its focus on low cost housing for the
lesser privileged, the government has allotted PKR 30Bn with regards to the Naya Pakistan Hous-
ing Scheme and PKR 3Bn for concessionary housing loans. Furthermore, PSDP allocation has been
pushed up to a record PKR 2.1Trn, up by a sizable 61% YoY. Federal PSDP has been increased to
PKR 900Bn from PKR 630Bn while provincial PSDP has been increased to PKR 1,235Bn (up 83%
YoY).
General public service to take the lion’s share: On the other hand, mark-up payments are ex-
pected to increase by a marginal 3.9% YoY to PKR 3,060Bn. Similarly, defense spending has been
increased by ~6% YoY to PKR 1.37Trn. In terms of functions, general public service will take the
lion’s share with PKR 5.4Trn, up 22.7% YoY from last year’s allotment.
Table 6: Current Expenditures
PKR Bn FY21B FY21R % Chg. FY22B % YoY.
Mark-up Payment 2,946 2,851 -3.24% 3,060 7.33%
Mark-up on Domestic Debt 2,631 2,611 -0.76% 2,757 5.59%
Mark-up on Foreign Debt 315 240 -23.98% 303 26.27%
Pension 470 470 0.00% 480 2.13%
Military 359 359 0.00% 360 0.28%
Civil 111 111 0.00% 120 8.11%
Defence Affairs & Services 1,286 1,295 0.68% 1,370 5.79%
Grants & Transfers 905 932 3.07% 1,168 25.22%
Grants to Provinces 85 85 0.00% 106 25.00%
Grants to Others 820 847 3.39% 1,061 25.24%
Subsidies 209 430 105.74% 682 58.60%
Pay & Pension 0 0 N/A 160 N/A
Provision for Contingencies 50 0 N/A 25 N/A
Running of Civil Government 477 488 2.37% 479 -1.81%
Provision for Disaster / Covid 0 95 N/A 100 5.26%
Total Current Expenditures 6,343 6,561 3.44% 7,523 14.67% Source: Budget in Brief FY22, MoF
Table 8: Subsidies
PKR Bn FY21B FY21R % Chg. FY22B % YoY.
WAPDA/PEPCO 124 350 182.54% 511 45.85%
KESC 16 16 3.23% 85 431.25%
Petroleum 10 12 20.00% 20 66.67%
PASSCO 7 7 0.00% 7 0.00%
Utility Stores Corporation 3 8 166.67% 6 -25.00%
Others 50 37 -25.96% 53 44.61%
Total Subsidies 209 430 105.74% 682 58.60%
Source: Budget in Brief FY22, MoF
Table 7: Development Expenditure & Net Lending
PKR Bn FY21B FY21R % Change FY22B % Change
Dev. Expend. & Net Lending 794 780 -1.8% 964 23.6%
Total PSDP 1,324 1,304 -1.5% 2,135 63.7%
Federal 650 630 -3.1% 900 42.9%
Provincial 674 674 0.0% 1,235 83.2%
Net Lending 72 72 0.0% 64 -11.1% Source: Budget in Brief FY22, MoF

Annual Budget FY 2021-22
Pakistan Investment Research
Sunday, June 13, 2021
Chart 9: Budgeted Expenditures at a Glance Chart 10: Federal PSDP is the Highest Ever this Year
Source: MoF, BMA Research Source: MoF, BMA Research
Chart 7: Tax Target Breakdown Chart 8: Expenditures Breakdown
Source: MoF, BMA Research Source: MoF, BMA Research
BUDGET FY22 BUDGET BREAKDOWN
1.73 2.08 2.26 2.63 3.02 3.66 3.97 4.47 4.47 4.21 4.69
5.83 0.52 0.49
0.72 1.00 0.91
0.79 0.97 0.76 0.43
1.30
1.70
2.08
FY11
A
FY12
A
FY13
A
FY14
A
FY15
A
FY16
A
FY17
A
FY18
A
FY19
A
FY20
A
FY21
R
FY22
B
PKR
Trn
Tax Revenue Non-Tax Revenue
3.45 3.94
4.82 5.03 5.39
5.80
6.80 7.49
8.35
9.65
7.14
8.49
-
2.00
4.00
6.00
8.00
10.00
12.00
FY
11
A
FY
12
A
FY
13
A
FY
14
A
FY
15
A
FY
16
A
FY
17
A
FY
18
A
FY
19
A
FY
20
A
FY
21
R
FY
22
B
PK
R T
rn
Total Current Expenditure Total Development Expenditure Total Expenditure
-5,000
-4,000
-3,000
-2,000
-1,000
-
1,000
2,000
3,000
4,000
5,000
FY11
A
FY12
A
FY13
A
FY14
A
FY15
A
FY16
A
FY17
A
FY18
A
FY19
A
FY20
A
FY21
R
FY22
B
PKR
Bn
Debt Servicing Defence Others
FY11A
FY12A
FY13A
FY14A
FY15A
FY16A
FY17A
FY18A
FY19A
FY20A
FY21R
FY22B
PK
R B
n
Provincial PSDP Federal PSDP
Chart 11: Public Debt (% of GDP) Chart 12: Primary Balance (% of GDP)
Source: MoF, BMA Research Source: MoF, BMA Research
58.963.3 63.8 63.5 63.3
67.7 67.072.1
85.9 87.683.1 81.8
0.0
10.0
20.0
30.0
40.0
50.0
60.0
70.0
80.0
90.0
100.0
FY11
A
FY12
A
FY13
A
FY14
A
FY15
A
FY16
A
FY17
A
FY18
A
FY19
A
FY20
A
FY21
R
FY22
B
-2.7
-2.4
-3.8
-1.0
-0.6-0.3
-1.6
-2.2
-3.6
-1.8
-1.2
-0.7
-4.0
-3.5
-3.0
-2.5
-2.0
-1.5
-1.0
-0.5
0.0
FY1
1A
FY1
2A
FY1
3A
FY1
4A
FY1
5A
FY1
6A
FY1
7A
FY1
8A
FY1
9A
FY2
0A
FY2
1R
FY2
2B

Annual Budget FY 2021-22
Pakistan Investment Research
Sunday, June 13, 2021
KSE-100 likely to extend its rally as Pakistan enters a new era
Discounted valuations & improving macroeconomic backdrop: At our 2022E Universe P/E of 6.2x,
valuations look incredibly cheap at current levels. Pak Equities continue to trade at a steep dis-
count to MSCI EM trading multiples. We believe that emerging improvements in macroeconomic
fundamentals are grossly underestimated and this seems like an opportune time to invest in the
country. We retain our bullish stance and expect our bull case Dec’21 KSE-100 index target of
59,000 points to materialize.
Recommendations: We like Banks, IT, Cements, Textiles, Pharmaceuticals, Steel and refineries
sector at current levels. Key stocks benefitting from budgetary developments include; 1) ATRL; 2)
PRL; 3) NRL; 4) BYCO; 5) LUCK; 6) DGKC; 7) MLCF; 8) KOHC; 9) NML; 10) GATM; 11) ASC; 12)
TOMCL; 13) PSMC; 14) SYS; 15) HINOON; 16) GSKCH; 17) AGP; and 18) SEARLE; 19) ISL; 20) ASL;
21) MUGHAL; 22) ASTL; and 23) AGHA. Our top picks from BMA Universe include: 1) LUCK (TP: PKR
1,200); 2) MLCF (TP: PKR 85); 3) FLYNG (TP: PKR 46); 4) HBL (TP: PKR 160); 5) BAHL (TP: PKR 112);
6) MUGHAL (TP: PKR 125); 7) SYS (TP: PKR 619); 8) IMAGE (TP: PKR 40); 9) ENGRO (TP: PKR 400);
and 10) KAPCO (TP: PKR 45).
Table 9: Sector-wise valuation snapshot
P/E (x) D/Y (%) P/B (x) ROE (%)
Sectors 2021E 2022F 2021E 2022F 2021E 2022F 2021E 2022F
Commercial Banks 5.8 5.0 8.0% 8.8% 0.8 0.7 13.5% 14.5%
E&Ps 5.3 5.3 5.9% 5.9% 0.7 0.7 14.8% 13.3%
Fertilizer 6.1 6.9 10.5% 9.2% 1.1 1.0 19.0% 15.0%
Cement 17.4 9.8 1.8% 3.0% 1.9 1.7 11.4% 18.3%
Food 29.1 21.9 0.8% 1.0% 6.1 5.0 22.9% 25.1%
Chemical 4.9 6.1 5.9% 4.9% 1.3 1.1 28.5% 19.2%
Auto Assemblers 11.0 8.2 4.3% 6.8% 2.5 2.2 24.2% 28.9%
Pharmaceuticals 15.1 13.7 3.4% 3.4% 4.5 3.8 32.3% 30.3%
Textile Composite 8.0 5.7 3.7% 5.3% 0.5 0.5 6.1% 8.2%
Power Gen. & Dist. 3.1 3.2 9.3% 11.2% 0.7 0.6 24.4% 20.5%
Oil & Gas Marketing 7.6 7.3 3.8% 4.6% 1.0 0.9 13.5% 12.9%
Tech. & Comm. 24.8 16.7 0.8% 1.2% 6.8 5.1 30.7% 35.0%
Engineering 9.6 9.7 3.7% 3.5% 2.1 1.8 24.8% 20.0%
Transport 13.0 12.2 0.0% 0.0% 1.3 1.2 10.3% 9.9%
BMA Universe 6.7 6.2 6.1% 6.5% 1.0 0.9 15.3% 15.2%

Annual Budget FY 2021-22
Pakistan Investment Research
Sunday, June 13, 2021
Summary of FY22 budget
The Finance Minister Shaukat Tareen announced a pro-growth budget with a total outlay of PKR 8.5Trn, up ~19% from FY21 re-
vised estimates. The aim from the government was clear as it aims to build on the strong economic revival seen in 2HFY21 with-
out compromising on revenue targets.
The government expects GDP growth of 4.8% in FY22 from 3.9% in FY21, while in the medium term they expect it to rise to 5-7%.
Total tax revenue target for FY22 has been set at an ambitious PKR7.9Trn of which PKR5.8Trn pertains to FBR revenue while the
remainder is related to non-tax revenue. The government expects surge in FBR revenue target to be met by increased income tax
(up 22.0% YoY) and greater sales tax collection (up 30.0% budgeted).
Fiscal deficit for the upcoming fiscal year has been targeted at 6.3% of GDP against 7.1% for the current year while primary deficit
is expected to shrink to 0.7% compared to 1.2% this year.
Budget deficit for the upcoming fiscal year is projected at PKR 3,990Bn compared to PKR 3,437Bn for FY21.
Subsidy allocations for the next fiscal year have been increased to PKR 682Bn, up from PKR 430Bn last year. The increase primarily
stems from grants allocated to the power sector. Breaking it up, PKR 266Bn are to be allocated to Power Holdings Private Limited
(PHPL) and IPPs. PKR 245Bn subsidy for WAPDA/PEPCO and PKR 85Bn have been set aside for KEL. Continuing with its focus on
low cost housing for the lesser privileged, the government has allotted PKR 30Bn with regards to the Naya Pakistan Housing
Scheme and PKR 3Bn for concessionary housing loans.
PSDP allocation has been scaled up to a record PKR 2.1Trn, up by a sizable 61% YoY. Breaking it up, federal PSDP has been in-
creased to PKR 900Bn from PKR 630Bn while provincial PSDP has shot up to PKR 1,235Bn (up 83% YoY).
The government seeks to continue with the rigorous COVID-19 vaccination drive and has allocated PKR 100Bn for the purpose
with an aim of vaccinating 100Mn people by the end of the next fiscal year.
Debt repayment for the upcoming year has been projected at PKR 3,060Bn.
Defence budget is targeted at PKR 1.4Trn, an increase estimate of 6% YoY.
Currently, exports stand at 8% of GDP which is considerably low compared to regional peers, the government has a vision to scale
them up to 20% of GDP over the next 5 years.
The government has taken initiatives to facilitate IT sector through the introduction of special technology economic zones (STEZs).
Under the STEZs, the companies can avail 10 year tax break on exports of IT services. Moreover, the STEZs will be facilitated
through reduced custom duty on the import of raw material on plant and machinery.
The government has also taken initiatives to support textile sector by lowering duties on the import of basic raw material such as
polyester yarn. This will help the textile companies to improve their profitability.
The govt. has also supported the auto industry by reducing/abolishing duties applicable on the auto sector to facilitate the low
income segment while also formulating the “Meri Gari Scheme”.
The Telecom sector is now been granted the status of an industry.
To curb the smuggling of goods into the country, the govt. has now put retailing of smuggled goods into the same category as
smuggling.
The govt. has abolished CD/ACD on more than 350 Active Pharmaceutical Ingredients (API’s) as well as exemptions of duties on
life saving drugs. In addition, the govt. has also encouraged the pharma companies to expand via import plant and machinery at
reduced rate of 5%.
Annual Budget FY 2021-22
Pakistan Investment Research
Sunday, June 13, 2021
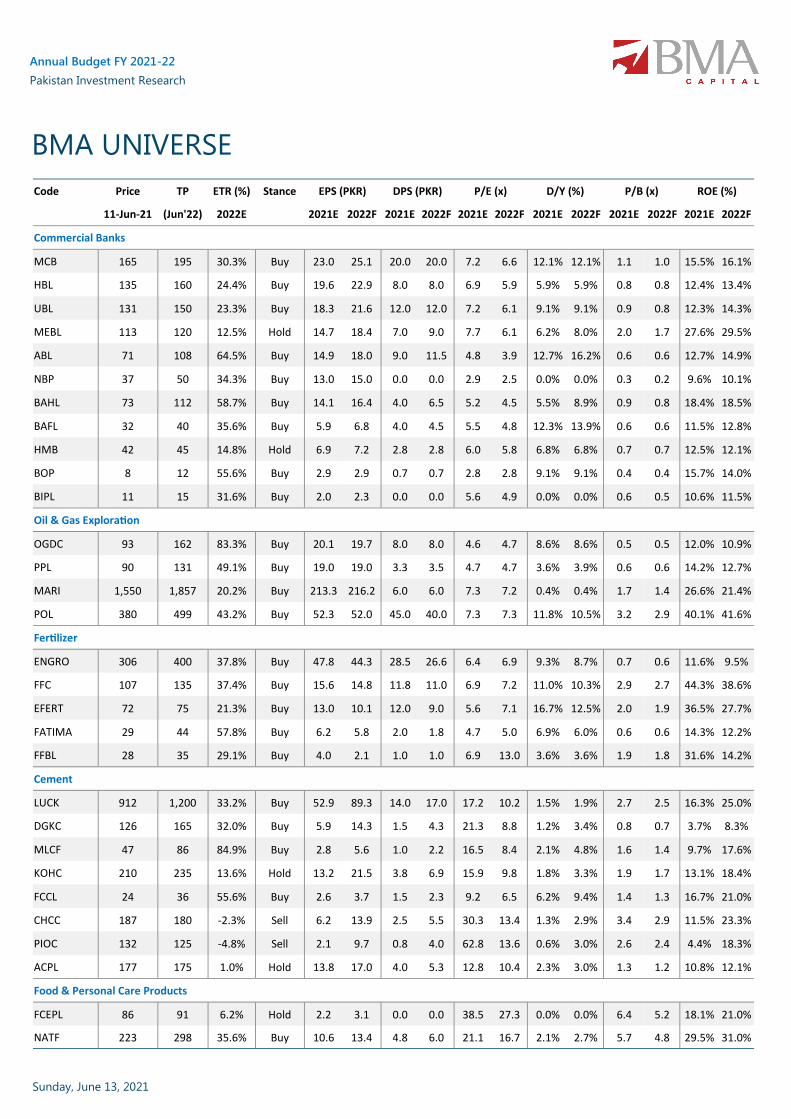
Code Price TP ETR (%) Stance EPS (PKR) DPS (PKR) P/E (x) D/Y (%) P/B (x) ROE (%)
11-Jun-21 (Jun'22) 2022E 2021E 2022F 2021E 2022F 2021E 2022F 2021E 2022F 2021E 2022F 2021E 2022F
Commercial Banks
MCB 165 195 30.3% Buy 23.0 25.1 20.0 20.0 7.2 6.6 12.1% 12.1% 1.1 1.0 15.5% 16.1%
HBL 135 160 24.4% Buy 19.6 22.9 8.0 8.0 6.9 5.9 5.9% 5.9% 0.8 0.8 12.4% 13.4%
UBL 131 150 23.3% Buy 18.3 21.6 12.0 12.0 7.2 6.1 9.1% 9.1% 0.9 0.8 12.3% 14.3%
MEBL 113 120 12.5% Hold 14.7 18.4 7.0 9.0 7.7 6.1 6.2% 8.0% 2.0 1.7 27.6% 29.5%
ABL 71 108 64.5% Buy 14.9 18.0 9.0 11.5 4.8 3.9 12.7% 16.2% 0.6 0.6 12.7% 14.9%
NBP 37 50 34.3% Buy 13.0 15.0 0.0 0.0 2.9 2.5 0.0% 0.0% 0.3 0.2 9.6% 10.1%
BAHL 73 112 58.7% Buy 14.1 16.4 4.0 6.5 5.2 4.5 5.5% 8.9% 0.9 0.8 18.4% 18.5%
BAFL 32 40 35.6% Buy 5.9 6.8 4.0 4.5 5.5 4.8 12.3% 13.9% 0.6 0.6 11.5% 12.8%
HMB 42 45 14.8% Hold 6.9 7.2 2.8 2.8 6.0 5.8 6.8% 6.8% 0.7 0.7 12.5% 12.1%
BOP 8 12 55.6% Buy 2.9 2.9 0.7 0.7 2.8 2.8 9.1% 9.1% 0.4 0.4 15.7% 14.0%
BIPL 11 15 31.6% Buy 2.0 2.3 0.0 0.0 5.6 4.9 0.0% 0.0% 0.6 0.5 10.6% 11.5%
Oil & Gas Exploration
OGDC 93 162 83.3% Buy 20.1 19.7 8.0 8.0 4.6 4.7 8.6% 8.6% 0.5 0.5 12.0% 10.9%
PPL 90 131 49.1% Buy 19.0 19.0 3.3 3.5 4.7 4.7 3.6% 3.9% 0.6 0.6 14.2% 12.7%
MARI 1,550 1,857 20.2% Buy 213.3 216.2 6.0 6.0 7.3 7.2 0.4% 0.4% 1.7 1.4 26.6% 21.4%
POL 380 499 43.2% Buy 52.3 52.0 45.0 40.0 7.3 7.3 11.8% 10.5% 3.2 2.9 40.1% 41.6%
Fertilizer
ENGRO 306 400 37.8% Buy 47.8 44.3 28.5 26.6 6.4 6.9 9.3% 8.7% 0.7 0.6 11.6% 9.5%
FFC 107 135 37.4% Buy 15.6 14.8 11.8 11.0 6.9 7.2 11.0% 10.3% 2.9 2.7 44.3% 38.6%
EFERT 72 75 21.3% Buy 13.0 10.1 12.0 9.0 5.6 7.1 16.7% 12.5% 2.0 1.9 36.5% 27.7%
FATIMA 29 44 57.8% Buy 6.2 5.8 2.0 1.8 4.7 5.0 6.9% 6.0% 0.6 0.6 14.3% 12.2%
FFBL 28 35 29.1% Buy 4.0 2.1 1.0 1.0 6.9 13.0 3.6% 3.6% 1.9 1.8 31.6% 14.2%
Cement
LUCK 912 1,200 33.2% Buy 52.9 89.3 14.0 17.0 17.2 10.2 1.5% 1.9% 2.7 2.5 16.3% 25.0%
DGKC 126 165 32.0% Buy 5.9 14.3 1.5 4.3 21.3 8.8 1.2% 3.4% 0.8 0.7 3.7% 8.3%
MLCF 47 86 84.9% Buy 2.8 5.6 1.0 2.2 16.5 8.4 2.1% 4.8% 1.6 1.4 9.7% 17.6%
KOHC 210 235 13.6% Hold 13.2 21.5 3.8 6.9 15.9 9.8 1.8% 3.3% 1.9 1.7 13.1% 18.4%
FCCL 24 36 55.6% Buy 2.6 3.7 1.5 2.3 9.2 6.5 6.2% 9.4% 1.4 1.3 16.7% 21.0%
CHCC 187 180 -2.3% Sell 6.2 13.9 2.5 5.5 30.3 13.4 1.3% 2.9% 3.4 2.9 11.5% 23.3%
PIOC 132 125 -4.8% Sell 2.1 9.7 0.8 4.0 62.8 13.6 0.6% 3.0% 2.6 2.4 4.4% 18.3%
ACPL 177 175 1.0% Hold 13.8 17.0 4.0 5.3 12.8 10.4 2.3% 3.0% 1.3 1.2 10.8% 12.1%
Food & Personal Care Products
FCEPL 86 91 6.2% Hold 2.2 3.1 0.0 0.0 38.5 27.3 0.0% 0.0% 6.4 5.2 18.1% 21.0%
NATF 223 298 35.6% Buy 10.6 13.4 4.8 6.0 21.1 16.7 2.1% 2.7% 5.7 4.8 29.5% 31.0%
BMA UNIVERSE

Annual Budget FY 2021-22
Pakistan Investment Research
Sunday, June 13, 2021
Code Price TP ETR (%) Stance EPS (PKR) DPS (PKR) P/E (x) D/Y (%) P/B (x) ROE (%)
11-Jun-21 (Jun'22) 2022E 2021E 2022F 2021E 2022F 2021E 2022F 2021E 2022F 2021E 2022F 2021E 2022F
Chemicals
EPCL 48 67 45.1% Buy 11.5 9.1 2.2 1.7 4.1 5.2 4.7% 3.7% 1.2 1.0 34.0% 21.3%
LOTCHEM 16 21 38.0% Buy 2.9 2.2 1.5 1.3 5.7 7.5 9.1% 7.6% 1.3 1.2 23.1% 16.3%
DOL 29 36 28.9% Buy 1.8 2.5 0.8 1.0 15.9 11.4 2.6% 3.5% 2.6 2.3 16.4% 21.4%
SPL 28 31 11.0% Hold 2.6 3.2 0.0 0.0 10.8 8.7 0.0% 0.0% 0.7 0.7 6.8% 7.9%
Automobile Assemblers
INDU 1,318 1,587 27.4% Buy 145.1 171.2 91.7 102.7 9.1 7.7 7.0% 7.8% 2.2 2.1 25.9% 27.7%
MTL 1,123 1,183 11.2% Hold 91.9 102.9 66.1 90.0 12.2 10.9 5.9% 8.0% 10.3 8.8 101.3% 87.0%
HCAR 377 388 4.0% Hold 12.6 28.4 4.5 4.5 30.0 13.3 1.2% 1.2% 3.0 2.6 10.3% 20.7%
PSMC 333 350 9.5% Hold 46.2 58.5 14.0 17.5 7.2 5.7 4.2% 5.3% 1.0 0.9 14.5% 16.1%
Pharmaceuticals
HINOON 614 850 41.8% Buy 40.7 44.8 20.7 20.7 15.1 13.7 3.4% 3.4% 4.5 3.8 32.3% 30.3%
Textiles
NML 101 130 32.3% Buy 13.5 17.8 4.0 5.3 7.5 5.7 3.7% 5.3% 0.5 0.5 6.1% 8.2%
Power Generation & Distribution
HUBC 78 110 48.2% Buy 23.3 22.9 6.3 7.5 3.4 3.4 8.0% 9.6% 1.0 0.8 31.8% 25.6%
NPL 20 42 132.4% Buy 7.9 6.9 5.0 6.0 2.6 2.9 24.7% 29.7% 0.3 0.3 11.6% 9.8%
PKGP 29 35 23.9% Buy 11.5 11.8 1.5 1.5 2.6 2.5 5.1% 5.1% 0.5 0.4 20.7% 17.8%
NCPL 16 28 99.7% Buy 5.9 4.7 4.2 5.5 2.7 3.4 26.3% 34.1% 0.3 0.3 11.3% 8.9%
LPL 19 31 71.1% Buy 8.9 9.4 1.0 1.2 2.1 2.0 5.3% 6.7% 0.4 0.3 21.0% 18.5%
Oil & Gas Marketing
PSO 233 282 24.9% Buy 30.7 32.1 9.2 10.0 7.6 7.2 4.0% 4.3% 0.9 0.8 12.2% 11.7%
APL 329 374 17.1% Buy 42.2 44.7 10.8 18.0 7.8 7.4 3.3% 5.5% 1.5 1.3 21.0% 19.4%
Technology & Communication
SYS 506 619 23.1% Buy 20.4 30.3 4.1 6.1 24.8 16.7 0.8% 1.2% 6.8 5.1 30.7% 35.0%
Engineering
ISL 91 116 35.0% Buy 17.3 11.8 7.5 4.8 5.3 7.8 8.2% 5.2% 2.1 1.9 47.6% 25.5%
MUGHAL 115 135 21.0% Buy 12.6 18.8 4.5 6.5 9.2 6.1 3.9% 5.6% 2.1 1.7 30.7% 30.8%
ASTL 46 55 21.1% Buy 3.6 4.0 0.8 0.8 12.7 11.5 1.6% 1.6% 1.1 1.1 9.3% 9.5%
ASL 26 30 17.0% Buy 8.9 5.9 0.8 1.3 3.0 4.5 2.9% 4.8% 1.4 1.1 59.1% 26.8%
Transport
PIBTL 11 15 31.2% Buy 0.8 0.9 0.0 0.0 13.0 12.2 0.0% 0.0% 1.3 1.2 10.3% 9.9%
BMA UNIVERSE

Annual Budget FY 2021-22
Pakistan Investment Research
Sunday, June 13, 2021
Abbreviations
ADR Advances Deposit Ratio FYTD Fiscal year to date OMCs Oil Marketing Companies
APCMA All Pakistan Cement Manufacturers Association FY Fiscal Year OPEC Oil Producing and Exporting Countries
Avg. Average GBP Great Britain Pound p.a. Per annum
BN Billion GDPg GDP growth PAT Profit After Tax
BBL Barrel GDP Gross Domestic Product PBS Pakistan Bureau of Statistic
BCF Billion Cubic Feet GENCOs Power Generation Companies P/B Price to Book Value
BoE Barrels of Oil Equivalent GIDC Gas Infrastructure Development Cess P/E Price Earning
BoP Balance of Payment GHPL Government Holdings (Pvt) Ltd. PER Price Earning Ratio
BPD barrels per day Gov't Government PIB Pakistan Investment Bonds
Bps Basis Points GST General Sales Tax PKR Pakistan Rupee
B/Y Bond Yield HSD High Speed Diesel POL Petroleum Products Prices
CAD Current Account Deficit IDR Investment Deposit Ratio PP Petroleum Policy
CAGR Compounded Annual Growth Rate IMF International Monetary Fund PPA Power Purchase Agreement
CAR Capital Adequacy Ratio IPPs Independent Power Producers PPIS Pakistan Petroleum Information Service
CASA Current Account Saving Account JPY Japanese Yen PR Policy Rate
1Q First Quarter KO Kerosene Oil PSDP Public Sector Development Program
CKD Complete Knock Down 9M 9 Months PSM Pakistan Steel Mills
CNG Compressed Natural Gas LHS Left hand side PSX Pakistan Stock Exchange
CNIC Computerized National Identity Card LNG Liquified Natural Gas PTI Pakistan Tehreek-e-Insaf
COD Commercial Operations Date LPS Loss Per Share QR Quick Response
CPEC China Pakistan Economic Corridor LSM Large Scale Manufacturing RDs Regulatory Duties
CPI Consumer Price Index LTFF Long Term Financing Facility REER Real Effective Exchange Rate
CPP Capacity Purchase Price mn Million RFO Residue Fuel Oil
CPPA Central Power Purchase Agency mb/d Million barrels per day RHS Right hand side
CYTD Calendar year to date ME March End RLNG Regassified Liquified Natural Gas
CY Calendar Year MEPCO Multan Electric Power Company ROA Return on Assets
DAP Di-ammonium Phosphate mmbtu Metric Million British Thermal Unit ROE Return on Equity
DISCOS Distribution Companies mmcfd Million Cubic Feet Per Day RRR Reserve Replacement Ratio
DCF Discounted Cash Flow MoU Memorandum of understanding SBP State Bank of Pakistan
DPS Dividend Per Share MPS Monetary Policy Statement SECMC Sindh Engro Coal Mining Company
DR Discount rate MS Motor Spirit SME Small Medium Enterprises
D/Y Dividend Yield MSCI Morgan Stanley Composite Index SOE State-Owned Enterprises
E&P Exploration & Production MVA Moving Average SoTP Sum of the parts
EBITDA Earning Before Interest, Taxes & Amortization MW Mega Watts SPLY Same period last year
EFF Extended Fund Facility NCCPL National Clearing Company of Pakistan Limited TD
TD To Date
EM Emerging Markets NEPRA National Electric Power Regulatory Authority T&D Transmission & Distribution
ER Expected Return NFA Net Domestic Assets TPA Tonnes Per Annum
EPS Earrings Per Share NFC National Finance Commission Tn Trillion
EV Enterprise Value NHA National Highway Authority UFG Unaccounted for Gas
Ex. Excluding NII Net Interest Income US United States
FATF Financial Action Task Force NIM Net Interest Margins UK United Kingdom
FBR Federal Board of Revenue NIR Net International Reserve USD US Dollar
FIPI Foreign Investor Portfolio Investment NPL Non Performing Loans WAP-DA
Water & Power Development Authority
FM Frontier Markets NSS National Saving Scheme YTD Year-to-date
FO Furnace Oil NTDC National Transmission & Despatch Company YoY Year-on-Year
OEM Original Equipment Manufacturer O&M Operations & Maintenance 1H First Half

Disclaimer
This research report is for information purposes only and does not constitute nor is it intended as an offer or solicitation for the purchase or sale of securities or other financial instruments. Neither the information contained in this research report nor any future information made available with the subject matter contained herein will form the basis of any contract. Information and opinions contained herein have been compiled or arrived at by BMA Capital Management Limited from publicly availa-ble information and sources that BMA Capital Management Limited believed to be reliable. Whilst every care has been taken in preparing this research report, no re-search analyst, director, officer, employee, agent or adviser of any member of BMA Capital Management Limited gives or makes any representation, warranty or under-taking, whether express or implied, and accepts no responsibility or liability as to the reliability, accuracy or completeness of the information set out in this research report. Any responsibility or liability for any information contained herein is expressly disclaimed. All information contained herein is subject to change at any time without notice. No member of BMA Capital Management Limited has an obligation to update, modify or amend this research report or to otherwise notify a reader thereof in the event that any matter stated herein, or any opinion, projection, forecast or estimate set forth herein, changes or subsequently becomes inaccurate, or if research on the subject company is withdrawn. Furthermore, past performance is not indicative of future results.
The investments and strategies discussed herein may not be suitable for all investors or any particular class of investor. Investors should make their own investment decisions using their own independent advisors as they believe necessary and based upon their specific financial situations and investment objectives when investing. Investors should consult their independent advisors if they have any doubts as to the applicability to their business or investment objectives of the information and the strategies discussed herein. This research report is being furnished to certain persons as permitted by applicable law, and accordingly may not be reproduced or circu-lated to any other person without the prior written consent of a member of BMA Capital Management Limited. This research report may not be relied upon by any retail customers or person to whom this research report may not be provided by law. Unauthorized use or disclosure of this research report is strictly prohibited. Mem-bers of BMA Capital Management and/or their respective principals, directors, officers and employees may own, have positions or effect transactions in the securities or financial instruments referred herein or in the investments of any issuers discussed herein, may engage in securities transactions in a manner inconsistent with the research contained in this research report and with respect to securities or financial instruments covered by this research report, may sell to or buy from customers on a principal basis and may serve or act as director, placement agent, advisor or lender, or make a market in, or may have been a manager or a co-manager of the most recent public offering in respect of any investments or issuers of such securities or financial instruments referenced in this research report or may perform any other investment banking or other services for, or solicit investment banking or other business from any company mentioned in this research report. Investing in Pakistan involves a high degree of risk and many persons, physical and legal, may be restricted from dealing in the securities market of Pakistan. Investors should perform their own due diligence before investing. No part of the compensation of the authors of this research report was, is or will be directly or indirectly related to the specific recommendations or views contained in the research report. By accepting this research report, you agree to be bound by the foregoing limitations.
BMA Capital Management Limited and / or any of its affiliates, which operate outside Pakistan, do and seek to do business with the company(s) covered in this research document. Investors should consider this research report as only a single factor in making their investment decision. BMA Research Policy prohibits research personnel from disclosing a recommendation, investment rating, or investment thesis for review by an issuer/company prior to the publication of a research report containing such rating, recommendation or investment thesis.
Stock Rating
Investors should carefully read the definitions of all rating used within every research reports. In addition, research reports carry an analyst’s independent view and investors should ensure careful reading of the entire research reports and not infer its contents from the rating ascribed by the analyst. Ratings should not be used or relied upon as investment advice. An investor’s decision to buy, hold or sell a stock should depend on said individual’s circumstances and other considerations. BMA Capital Limited uses a three tier rating system: i) Buy, ii) Neutral and iii) Underperform (new rating system effective Jan 1’18) with our rating being based on total stock returns versus BMA’s index target return for the year. A table presenting BMA’s rating definitions is given below:
Old rating system
Valuation Methodology
To arrive at our period end target prices, BMA Capital uses different valuation methodologies including
Discounted cash flow (DCF, DDM)
Relative Valuation (P/E, P/B, P/S etc.)
Equity & Asset return based methodologies (EVA, Residual Income etc.)
Buy >15% expected total return
Hold 10%-15% expected total return
Underperform <10% expected total return
*Total stock return = capital gain + dividend yield
Overweight Total sector return > expected market return
Marketweight Expected market return
Underweight Total stock return < expected market return
Annual Budget FY 2021-22
Pakistan Investment Research
Sunday, June 13, 2021