
ANNUAL ER0Sl0N POTENTIAL FUR DESERT HARBOR...
20
Library f'kk i !; -;. ANNUAL ER0Sl0N POTENTIAL FUR DESERT HARBOR ALONG NEW RIVER MATHEWS KESSLER & ASSOCIATES. INC.
-
Upload
truonghanh -
Category
Documents
-
view
213 -
download
0
Transcript of ANNUAL ER0Sl0N POTENTIAL FUR DESERT HARBOR...

PP~~~t'i
F~~~n+'~ r:hj~I~:'iit:b.pMC. Libraryf'kk i !; il~~~!;tltil1:d>C -;.
2:aU~ \j~i't''LQ\.tJi:a~~p ;:'::~
~~~I)(~;/Jt!U.8S&09.~ .-//~
ANNUAL ER0Sl0N POTENTIAL FUR DESERT HARBOR ALONG NEW RIVER
MATHEWS KESSLER & ASSOCIATES. INC.
~371.949

March 15, 1989
MATHEWS KESSLER & ASSOCIATES, INC.4045 E. McDOWELL ROAD, PHOENIX, ARIZONA 85008-4405
602/244-2664
As you requested, we have reviewed the Ellis-Murphy report entitled "DESERTHARBOR EROSION STUDY", September 1988, in an effort to develop an estimate of theannual costs that the City of Peoria might incur in maintaining approximately 8,000 L.P. ofunprotected bankline along New River.
Dan L. Nissen, P.E.
Annual Erosion Potential for Desert Harbor Along New River
ATIN:
RE:
Dear Dan,
We did not review the Ellis-Murphy report with the intent of providing a technicalcritique of methodology, however, we did leave a few red-lined comments in the marginsof the report. They conclude (page 8) that erosion will probably occur, but that they preferto delay construction of any permanent bank protection until after major damage isdocumented.
Mr. Elden Johansen, P.E.City EngineerCity of PeoriaP.O. Box 38Peoria, Arizona 85345
We are submitting with this letter an estimate of the annual volume of bank materialthat might be lost. Although we have no knowledge of your force account capability forreplacing eroded material, we have assumed that the City would probably contract for suchrepair. Based on recent figures that we have used in construction estimates with similarhaul distances and working area, we would estimate that the in-place cost of fill materialwouLd be somewhere in the $2.00 to $5.00 range depending upon source and conveyancemethod of the fill material. Whatever unit cost the City feels is reasonable can be applieddirectly to the annual erosion volume listed in Tables 1, 2, 3, or 4 to get an annualmaintenance cost.
IIIIIIIIIIIIIIII
I
j
G • PLANNING. ARCHITECTURE. ENGINEERING. PLANNING. ARCHITECTURE. ENGINEERING. PLANNING' ARCHITECTURE. ENGINEERING. PLANNING. ARCHITEC,TURE • ENGINEERING. PLANNING. ARCHITECTURE. ENGINEERING. PLANNING. ARCHITECTURE. ENGINEERING. PLANNING. ARCHITECTURE. ENGINEERING. PLA

IlIIIII
III
II
Mr. Dan L. Nissen, P.E.March 15, 1989
Page 2
The Ellis-Murphy report appears to have one major error. Page 18 of the HEC-2output data indicates a Q100 = 19,000 cfs was used for Skunk Creek, above the confluencewith New River, while Q100 = 35,000 cfs was used for New River above the confluence.The data in the 1985 SLA report (Final Sediment Transport Study for New River & SkunkCreek) indicates these numbers should be reversed, Le., 35,000 cfs up Skunk Creek and19000 cfs up New River. In fact, page 3 of the Ellis-Murphy report also acknowledges the19,000 cfs-value-for New River.-Perhaps their cross-section-numbering on the vicinity maphas been mixed up. They should be asked to check this.
Enclosed is the complete documentation for the technical procedure that has beendeveloped to estimate the annual erosion potential. The approach is based on theprobability that specific amounts of erosion will occur for floods of different frequencies.This is similar to an average annual benefit calculation, i.e., the volume of erosion fordifferent flood events is plotted as a function of the annual probability of occurrence. Thearea under the resulting curve is the volume (c.y.) of erosion per year.
To assist in review of this documentation, the major steps in the procedure areoutlined as follows:
1. Determine Qp for 100-, 50·, 25-, 10-, 5-, and 2-year events. The Ql00, Qso, Q25,and QlO were taken from the 1985 SLA report. This data was plotted on lognormal probability paper to extrapolate values for QlO, Qs, and Q2.
2. A typical trapezoidal cross-section was developed for this reach of New Riverusing data in the Ellis-Murphy report, the 1985 SLA report, and site photos.
Using the range of Qp values developed in Step 1, normal-depth calculations(Mannings Equation) were performed for this "typical" cross-section.
3. The hydraulic data from Step 2 was used to compute a maximum crosssectional shear stress corresponding to each of the peak discharge values fromStep 1.
4. Using sieve analysis data from the Ellis-Murphy report, a Dso = 2mm wasdetermined to be representative of the west river bank adjacent to DesertHarbor. The critical shear stress (at incipient motion) was computed for thisparticle size and compared to the predicted cross-sectional shear stresses

I
III
I
IIIIIIIII
II
I
J
I
Mr. Dan L. Nissen, P.E.March 15, 1989
Page 3
computed for each flood event (Step 3). If the actual shear stress was greaterthan the critical particle shear stress, erosion was assumed to occur. As youwill note from the technical documentation, erosion is predicted for all eventsbecause of the extremely low allowable (critical) shear stress for a 2mmdiameter particle.
5. Using the data from Steps 3 and 4, an estimate was made of the anticipatederosion geometry. This geometry was developed as a function of the flowdepth and the angle of repose of the bank material. As will be seen fromreviewing Tables 1, 2, 3, and 4, several ratios of the maximum flow depthwere examined during this analysis. Obviously, considerable judgement isinvolved in selecting this geometry.
6. Again, using engineering judgement, an estimate was made of the percentageof bank line (L.F.) that would be eroded during a specific flood event. Thislength was then multiplied by the erosion volume (c.y.) that would occurduring each flood event. The erosion lengths that were used in this step werea function of flood return interval.
A total west bank length of 8,000 L.F. was measured from the Ellis-Murphyvicinity map. This length extends from Greenway Road to about 1,300 feetsouth of Thunderbird Road. A total length of 6,600 feet was used below theSkunk Creek confluence, and 1,400 feet was used above the confluence. EllisMurphy HEC-2 XSEC 35.0 was used as the break point for the NewRiver/Skunk Creek confluence.
7. The erosion volumes from Step 6 were plotted as a function of the annualprobability of occurrence and the computed area under the resulting curvewas taken as the annual volume of bank erosion.
Due to the substantial amount of judgement that was involved in this procedure, werecommend using the figures in Table 4. This table is the most conservative of the fourscenarios, since it assumes an erosion depth equal to the full depth of flow, and also usesgreater percentages of eroded bank length for each event.

I
I
I
I
I
-+I
IIII
IIIIIIII
Mr. Dan L. Nissen, P.E.March 15, 1989
Page 4
If you would like to discuss this in any more detail, give me a call. Thanks forasking MKA to prepare this analysis.
-Sin-cerel ------ - --y, ~
~J)/1~
William D. Mathews, P.E., R.L.S.PresidentMathews Kessler & Associates, Inc.
WDM:ssEnclosures: Technical Documentation

'-
C~ent City of PeoriaProject No. 11£4-0:z...Project Name DPscol'f ;/a,.lot-'
'2) €oS £12 T /-I/J1f' ,130 If>AN»u4,L ERooS/ON 4N/lL.YS/S
Page _~_..,..- _
Date g/Jzle &}
Computed By fiUV
/
-3,-
4
IoS
II
.~
I 7
I ~
9.
I /0
I 1/
I 7Q.£ItoS J- 4
I
\//'(,I'/)/!-1 J.1C/,/J r/ s:/Ie ?/an
P~Qk t.J/scAol'.J e VQ/v .... s C/~t:Od For- £'1'0 ~1'<3 nAr;af ~ /.
LOJ -No,../Y1Q / ?/'d ,6<;£///1,/ lJlo I- o..f.. Q~
?:J E'vi!'/cy:Jm/J/J1- 0 -/ Alyd'l"CU'h'(l ~ q l.:t -/or- Cl"a:SJ'o/7.4/1 Q /y -s J·S
~4mma"t. 0 -J. )/ycll'oCl~'c ~ SAtoQr Sfr(O~s
Ca/cu/Q -h'arJs C£r -ry/JJ'~aI Clro.s ~ - oS f!I C' .j;·on
lJe.fal/tcd ;../yclro~hc Oa/(1u/ol/a/7.s -:::k,r-. Ty.;O J'C'a ! {!ro .s ~ -..s ("(2 -h'o /)
R:,1'~'q/ P/o Is "f :S/~ve A/14IyS~S. -+OrtAJ~.s ~ ~a/7J:HQ.I;'I'/q / Q I'cu:/q .J/on
()@ -hor,m/'rl Q ;1';'0/1 0-1 130,-,1: £ /'r::J .s /'0 /1 ~ COOm ~ ';"'y
Cra l$ s- :sE' C' ~'o 11 0+ ,<3,Qnl: c/'a QJol1 G (Oo/1'1~ j.,..y
Grq,P), ~ Aow/171 /l~/e <:).J- l?f'fJ~ -sc.o VeNqsI1(OQ/J '?or--4'c ~ /Q m t9 ~to I"-
"bettol'h7/l1al'o/) ()+ Avt"/e AI1/1~Q/ E;-os/'a/1
Volt/me
:S',oYlfYlar/es 0-1 Ilvet-aJt2 /!1l/lUQ! Eros/onCo /('0 /<:t I/o /) s
J

_ • .. ... 1e.__ !
,'I:: SOC'
II
0::'W
>0::
OESERT HARBORNEW RIVER ANALYSIS
VICINITY MAP AND SITE PLAN
8000 L.P; of. I3QI)K
(wt'tSl- sld~ 01 r/v~",)
18, I a 2
205.
19
29
I
I,~
~
t~
j
~
i.I ~
j.

Client City af Pear; aProject No. _J-1_k_A_-0_2__...,.,..._.- _
Project Name OeoSto/'1- )/01-10,..
P(5'4k D/-SC)Q7~ Vet.k.",s ~~oS f!JcI Fo,.. £/"0 ~/o/J /1110 Y.s/.s
a I- "Z:> /!'>.S (0~I- /10 I"- '0 I-
Page .;tDate .:3);I!g "1Computed By _;8=---& _
J rA e /00 - / ,So - ./vo ht!"S ~r N94.Jl.islt!"d ~ n 7Q lIe
zs-./ </./0 - Y 'eor ~~QIc dNS. c4or-J~,A?,'v I" I'- <1'". s;i:~",A: C'/'f!Of!O' cu· Q
3.3 0:1 .,the /92S SL4 rejJo"'~
;J. ri~ i:C/-i~'oSj,~d qz-s /n 1.4(0 SLA ,.el'0"'/ .,k,..~./eL-V /dvpr-/ ~/..s <:>~ -.?he eo"J/ut!"nce AJ//.4 Sk~",k
. {},.e~k/ _ 'Y'/,,,,ors ~ .6E' ./n ~"/'or. Ti/s alo~ /.o/nl~/o-ls _ AJ~// 01'+ 0+ ~ bn~r re/o-i.'oI7~h~ 'fIJrou1Af),e 1'~",o/nJ'1 clo/a. /,o/nls. ne C;>z~/Qso do'- .:,t,4/ssi/~ 4Jo.$ ol1/Y <I:z./70 c0ny'0r-ec/ -h 060&l,l.6~ 7..
.k". -//,e o-/htPr ~/Il!'s. AC'C'ord/n.J~ / .,t--J;e SLA do/.~
;:o/n-J ..L.<lO_; c!J:.sC'on/e>d ~ ~ 1J0 /ue 0 -J 9900 c+s.4Jo~ ~.s/!>d.j;,r CfJz.~ • ThiS. r-~V"s("aI va/~~ (99ao c/s).,I//S. -lie ///1(5'Q,- ,..e/Q~',:,/1 Jf!J/](:o/'-O~c/ 1y -fie/'"lunot'/1J'nj dQIt1- ?c;,nls.
Kelu~/7
1nlt!"/'"Va I(yr.)
100
56:2.S
)0
~
;z..
Ne0 BVN/ q/.soj C'ol?f/~en{'e 4.1/'/.1
.:s.k~n k Cr'tP ek
I~ 000
/<.J, 000
?,900 (S90o).J/
s,/oo
.l.l0Sc>~o30
N"fUU River D/S<:J.j ~I?.f/e, el?:t:. ~.JI·14
sA::U I] k. CI" e e f::.
Y'~ 000
;<'9, 000
J't 000
/0; $'00
~;ooo
~?9S
..!J S900 t:'/s «)0 s 1'(.;!JI/si~cI ,'n:s L IJ I'efJ0/,- t .
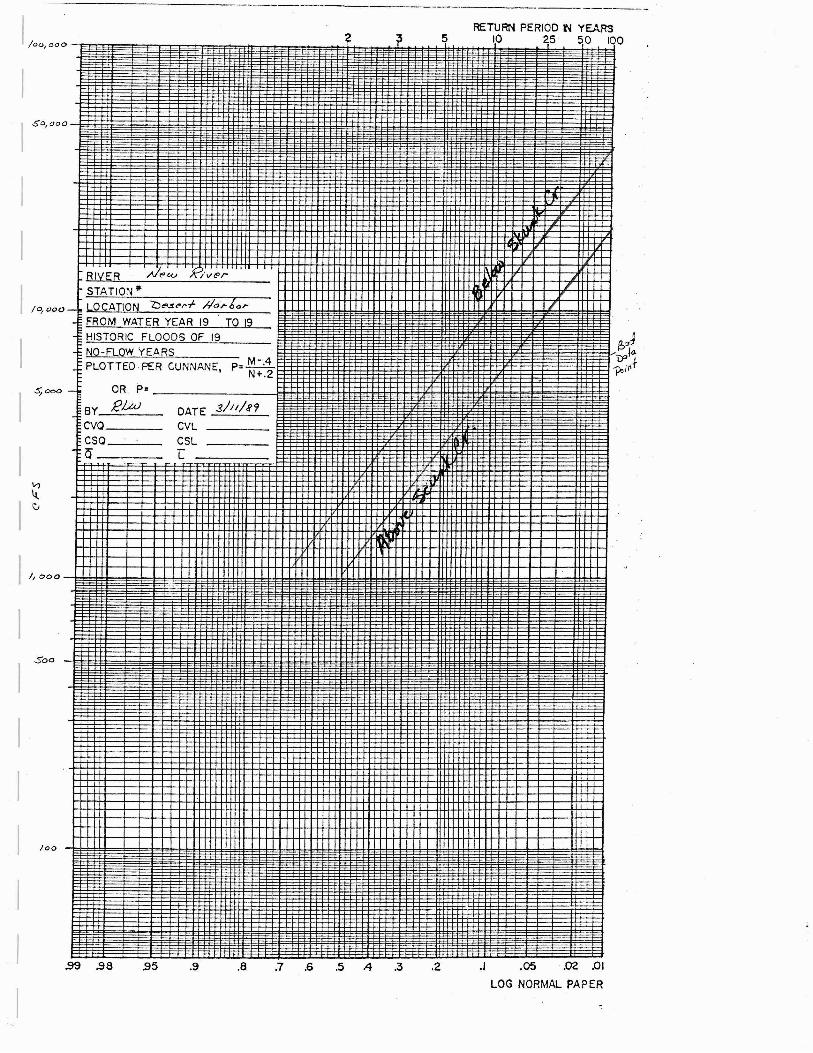
RETURN PERIOD IN YEARso~ ~ I 5 10 ~5 50 Iq
- -
0 .. II.i ..
Ne<oRIVER iv~r
STATION lI<,
.- LOCATION 7:J"'~t"I'f- #Orio,. /
FROM WATER YEAR 19 TO 19HISTORIC FLOODS OF 19
NO-FLOW YEARSPLOTTED PER CUNNANE, P= M-.4
N+.2
- OR. p=
BY RJAJ DATE 3)II/n
cva CVLesa eSLQ L
... --=
-
..
, '• I
I
i
I
-
-100
Sao
/CJ.tooo
1,000
.99 .98 .95 .9 .8 .7 .6 .5 .4 .3 .2 .1 .05 .02 .01
LOG NORMAL PAP ER

-0 ~V@~~I'?1c:<'/1-J 0 -I J../ydro u ;';'C ~ Qo-lQ.For- E/'CJ,s/o/7 4I1o/y..:f/s a..t a~-s~/'--I f/o"..io/,-
,IJI'o (l dvl' e .
I, :5//1 (' e no cho"''1f!)! J 190 m@*,-y .~os jJ/'CJlhdt!"d -?U/,t..;{-rA~ .-'IECi-;z /,V/} //IC'lu c/tod //) -IA~ £///s- I1v~;;'f (£/-1)rr0/'-f/ Q. .JJI"O .6Q.6/e c:Ao/JI1t9/ {lro.ss-st!"C'l/o/} ~QS
df'I/""lo~(Oc/ 0" -lIe 6Qs/s 0-+ s//-e "PAo/os 1 .sileoIe.sC'/"IjJ-h'ons /" ..,tJe. En -I /93S ;s~4 rp;06"'.,ts~ orlcl
ft..;"o/ .f error- Ayql,...oa~'(' (lo/Cq/o-kt::U1S "'fAa.,L /'"too$(,/H/J;" ct. f-r.a~~ zo/c/q / ~ t!"~j/o /'I -r-1J q -I ;:u-ool'ut't!'o! ~ //71I»'or
Ayclr09/"c.. /J Q /'-Qn7@It!'/'"s Q-s ,tAe &-/-1 #e;-C-::?, r~n.
Page <jDate 3///1~'1Computed By ---:...R--:..-/.AJ _
.ew ::= / $"'oJf.
Z = .5#: / \In ::. o,o:z.</..s = CJ.oo/S J-.//J"f
~. USiny -Ijlt~i~,/J/>zo/c/Q/ J't.O<:>/Y1L<>;,.y It:s/~c/ oiove/!10/Jn/n5~ £;1'Uq ~'O/7 ~t:1S ~.st!>d ;i.o cltovt!"lo/, elf/'';,f q./)c;IVto~('/~y /@,s~>nq';"tP~.,J;,,-- IAe /00-/ $"0- 7-S"- /0-
/ ./ ./ ./
6" - ./ q"cI 2. -y;-. ~ I,II!"/} 15". 71J1'S },ycl/'Ou~·~ do/q -G<JQS .
u.s ec:l 10 dpvtP/.y:' Q/] t's/lmole 0 -f 'I)e .rnax./rnun7 ;s },(>o.,-
"S1t-~s ~ f-j,q";" Could Ie us~d ~ de;!""r-/?7/'I1e -rAe-li/'-eos,.,s-j~/c/ 01" //}C'~/~",~ moh'o/7 Q";' I/,e icC! oJ -lie.6Q/7,k. ~Jo)'e. TAl'S Q/'IQlys/-s ,,&-Uo~ ~e"~/'h1ecl -.6/'~;;:t..Il/7 -fAt!' 6e>unc/ol-( ;s ;,~o/" -s Ire.$s /'2 u /l't<>d 10In/h"ole jJ,or~·(!/e. /'YJo;/.;o/) ~r- a.. OSo = .;z nun, z+
-J-/Je aaka/ -.sIJeo/'- ~Ir .....~s is JI'~q/~/" I-hQ'1 ~i~ 1"')C'~J·t<>/)..j./l1o~'o/} cr)eoo/" .s,t;...4I'>>SS / el'os/O/1 /s Qsse.-/1?@c/ ~ ocrc-u,,:
Client City af Pear; aProject No. Hk.4 -0 :z
" / 1'/-,lLJor-Project Name __v..:::....e.~:s=-(O:.....:/'"~r__-.:-ra _
I
IIIIIIIII~--
IIIIII
Ol. ..... m = 0, 00"" .ff,
Of''' I,. (10/ ::S,,1 (00.-. Sil"t"s.s ::; 7<!
fo,.. ::l".,,,., jJ0"//{, Ie ~
1;
= 0.0<'/7 DSo (<!'~-<r)
:: (o.a<n)(d,oO~<;,)(/t..S.q- ~.2'.v')
= 0.03 11/-f/7.

Client City af Pear; aProject No. H.kA -o;z.
Project Name O@st:O,../ hlc/'-lor
Page _S_'---;-_r-- _Date 3/n/e9Computed By ~~
Sc.uYlmcu-y 0:1 ;../yc//'O~~.C! I'" uAt.<'o~ S.,Lrt!'ss(k /c~/<). kon ~ oCr -r;y;; J'C'Q / 7/'cyoe ZO.lc/Q / L'.I'oSS- St.<'co"?on
./00
/a
Q(c:l's)
Z~OCJO
/'t OCJO
G"OOO
/S./L.
/2.S7
9. 9~
~-.21
;z.7s1
V!'locr/lyCl)s)
/2.0;2..
Jo,8~
..!/o.976"'DS
0./,/:111.)
/,31
0.9/
0,<:/7
£ro::;,,'O/7
New R/vt"/" ,4..6ove dn//t.<'L"/7"'~ jJ.I'~/ 'S-I::~/JK C' /,,(!>I!"~
I a 0 /'1~ 000· '1. 'Ie 't,-$'3 0.9/ 0.03 7"1' .s
So /~ 000 '? tfJ. ~.6~ 0.7~
:25 7-900 ~.93 7.7<1 o.~ 3
/0 s:. /0 C q,7~ 1a.ICJ o.Y3
~ 3" DS'cJ .3. oS"::t S-/,51 o.3.z
2.- /,,0 -3 0 /. 8t. 3, <If? o. J7
.!/ .4veraJe l'.I1e'JY s/ojJe :: 0, oo/S" Jllii.TA/~ vQ/~e ('(J,.n!Q.,IlU """,,// ~/.,IA IJO/~ ';~e 6ed s,{;oe-I t'l1e77 J,.q~·~n,t .Jrum E/It's-hu';IJhy Jlcc-:z. /""17.

. -.. - - -
Q= 3959.99 .:..'8W= 159. ee.. .Zl;_ 5.0B .Z2= 5.99 . '"0= 3.52 .H=B.824S=0.9B1SeeR= 589.31 .,P= 185.86 ' .'R= 3•.17 .. "TW= 185.17 : "Y= 5.18FR= 9.51YH= 9.42-. ::E6= 3.93'" ,HYD DEPTH= 3.18UflK YAR WAS 0
Q= 1938.00BW= 150.80ZI= 5.ge .Z2= 5.89D= 1. 86H=3.9245=9.B91580 '.•.R= 295.72P= 168.93R= 1. 7STW= 168.57Y= 3.48FR= 9.46YH= 0.19E6= 2.04HYD DEPTH= 1.75;'.UHK YAR WAS D. )';'c:>
Page -.:::6:.-...._....--- _Date 3);1/29Computed By _.:-IJ._% _
Q= 9939.90au= 150.00Z1= 5.99Z2= 5.0B0= 6.93H=8.924S=e.9alSBBA= 1279.25p= 220.65R= 5.89TW= 219.28Y= 7.14FR= B.56YH= e.93E6= 7.86HYD DEPTH= 5.83UHKYflR WAS. D.
Q=.14809.998W= 150.99Zl= 5.98 .'Z2;·5.98 "
·D= 8.42H=9.9245=8.991599fl.=.1617.45P=235.B7R= 6.86TW= 234.20
.V=8.66FR= 0.58YH= 1.16E6= 9.58HYD DEPTH= 6.91UflK YAR WAS D
.-:-."
I 1r.T~·~~:2G~:81of~~159. 99·:. " :-"~f
Zf= ·5; 39:.. .Z2~ 5.a8~=:·9. 98K=e.B24 '.5#8; 891500·· .Ro:01993.96 , '..,p= 251. 73R=7.92TI(~. 249.76V=9'; 53FR~ e.59
, YH= 1.41E6.= 11.39HYD. DEPTH= 7.98UHK YAR WAS D
.'- _.. '-
Q= 6ea3.99 .BW=. 159. e9 '
.ZI,=_ 5.99:.< ... 'Z2' '5 S9' ...~. ;.~" I _:< -, ::' ." 0= 5.21 .... :.
H=B. 924" .~·L~ ...S=9. ge15ea_~ .R=~916.33
P=293.99·'.R=4.51
~ TW=. 292.96 .Y= 6;55 .FR;-e.54· .
:YH="9.67 ..E6= 5.87 .HYO DEPTH= 4. 54UHK. 'mR WAS D
Q= 1995.99BW=15B.88Zl= 5.99Z2= 5.ae .
·D= 2.14.'H=9.924 .. '
.. S=9.891539.R= _448. 94 ..P= 177.97 ..R= 2.52TW;,.l77.42 .Y= A.44 ..FR= 9.49 .VH= 9.31 .E6=. 3. 85 ,~.,.
HYD DEPTH= 2.S3.UHK YflR WAS OJ,
. ..... /f. "'. .:-
;
· .. :"..: .....
/-Iyd/'ou~'<! Llako/Q ;to/7 s hr TY;JJ'C'Q ITi--~e ZCJda / S toe' .,I/on
Q= 190ae.geBW= 150.99ZI= 5.90Z2=. 5. geD=9.98H=a.024S=9.eeISee
! R= 1993.96p= 251. 73R=.7.92TW= 249.76
· Y=9.53,. FR; 9.59:YH= 1.41'EG= 11. 39·'HYD DEPTH= 7.98 ;.
'UHK VAR WAS D·-
L 'Q=_29geB.eah\,BW~: 150. aeP'. c Zl,.. 5.ge~; ~Z2= 5.8e[.D=12. 57...i' :H=9.924'·' '.: 5=9.891599 0 _ ..... , ,·o.·~.,.~:,
: : R=~ 2674. 48.· "~'-'.I p=: 278.15:R= 9.62: :JW= 275.66. :V= 18.84, 'FR=.. e.61
=VH= 1.83 "'_ '..' E6~· 14,39 .-. ~.::-
,HYD DEPTH= 9.73'" !UHK VAR WAS D I
II
III
I
:
Client City af Pear; aProject No. HJ:'4-o:<'Pro ject Name ---=:b~l?~s::..:f!'J/'~I:--..:...)J.!..:.o~/':.....:2:::..o:..:.;- _
I
IIIII
III1--·
IIIIIII
',~ ot'~' ••

2087FORM
I hot AY 6)ENG
..U. S. STANDARD SI~+ OPENING IN I+HES U. S. STANDARD SIEVE NUMBERS HYDROMETER643111- t 3 4 6 I 10 14 16 20 30 40 50 70 100 140 200 ,100 I I I I II I I II II I I I I II I II I r
01\ I... -r-.,\ '- ~
90\\
""~ '" tlse !JV@I'-0'le [0~o
t'- ~\ ~ ~<:. CJSO = ;l mm.80
'If\. "--
"~ 20- - - ~ - ..ii J
Fo~ C /'tJ 0$/0/7-I\~ ~
,,- J
AnO/y~~'!lI\. l'-..70
"'- ~ 1\ 30~
"'"-f- -
\. -
........ 1"- '" "" :r:r
"" 60 ww~
--....... i'r--.. J"', \ 4Q~~ I'-., ~ )-)- --
~- t'-,I" ........... \ I '".. CDm
i"... a:a:ww 50
~. IIIZ
~.~I--~_.I\1\a:;:: -.
:::=-- «_•. -j_.. 0...uz I
"'".....
wu 4Q za:
60 ..,w
I\. u"-t\ .. a:. . _. -- . --- - --_ .. -r- ..,
1\ - "-
30 1\I t\ 70
'e- .- -- ._ ...~ -_. -
"20eo
I --t10 i . 90
. - .... --~.__. .- -0
100500 100 50 10 5 1 0.5 0.1 0.05 0.01 0.005 O.CX)!GRAIN SIZE IN MILLIMETERS
I GRAVEL I SAND 1 ICOBBLESI CXlAllS[ I nNE I co.o.RS£ 14£OIUIo4 nNE 1 SILT OR CLAY
Sample No. Elev or Depth Classific.-.tion Nal 'Ii " LL PL PI /lew P,'ver- GJ t::> i5>$ (0,./Project../!srlor / Sic... /0 +S-o 3St-o° t'"~OTOO/ 'f!O+OO - ,a)~sl- ~Q/JKArea
Oa4 Q,n.sho ~/ol1aorina No. h-on?GRADATION CURVES Date .Il'1sj>t!'c4'o/7 ,- nS/"'1~ (t.
J

(\
"'O"'O()
a a ~....... _. :::l(l) (l) ....() ()........
Td~
eroS/or1h e/J;";
_1 ~
~._L.I__
EXIS'/;'/1J
Eon/:: lin.::!
o1
4.:s-s~ml?-h·ol7 s :,
1. 2 =L. / =
J. A:z. = A I -I- A :3
.:2.
() 0"'0
3. /71 (O.s) (et) (L;) (o. s) (c1./ICi,.,.3o .)0 III III= = 3 -0"0
CD (l)
c
(o.s) (eI) (L z) = (o.s) (d1.-! f.c,/1 /1.3 0)
--4 ,4~ = <tla.
t--0
OJ
43 //2-///'<.s. =
,43 = (o.s) (c/1../1a1'1 If. 3 0) - (o.s)(d/,1o/1 30 Q)
A3 = a.set,., ( 7<1';/1.3· - fc,~::l.oo),4.3 = I. ~3" et.'Z.
I. £x/s ~'nJ 60nk slo/, e = 6'/-1: 11/.
;J. cx/sl/aJ jQ"'.I: M.//// (O/,-"de ;.,Qn any/e o.j N'/,tJS@ ~-f. 30:
..3. eroS/a/) h(>lyh~ c:l" ~//I it!'~~/pc/d on .,tA e iJas/s <s-:!fO"jl/?toe"/j Jqdy~rnt='n1-.

111-13
Mean Diameter; mm··'
.:..:.::'.- ....
1:2');,
Cl)
0..o....en
... Cl)
I "00
I:,'T" ,V;
I 'll.. 4
An~ular
0,3 2 4 10£0 40 60 100 200 400 600;;:~i ,4 ~ r-r------r--~"""T"~'r.""---"r"--..__r_-r___r--r_~-.,.__r___.--_n I: ,
b:-l! ':~J"-' . " ~:~,:- .. "~." f~~.'.l6:~!
~ 40 I---------+.,.. t.}·~.J:·,r~;"· :;"i;;', '~:~~~"" ~::~'I .~:, ··;:~.":d '{·X ~
'-'("fJJ- '-.:
1Il ,35 1--..,..--..,..-..,.....,.......""7"'.e:...,.-,.. S; g/.::
Cl)
0::_. ", ~
'~
.:.' ~ ,30 bj~-:'":'.':':'':.;:':"'=====~rr=-------'----T ..,-;:~~':-;R:o=-u::-n::-:;d=ed:;-----1-.:---
\;.'~:c ':::;;'i~';": '''::r~j af!:;n:,: .ll. Rounded end
f.t,~~:; "-'u~ ,'._.\)('1' V"~":'H,;ffd to"'·'. '. Angular"
t:'.:;:: 3~.L..0-1-.~._.-.,,~.,;,-:.,,~.-:-:':.-,:-:.!>~r;-:.~()-.L..i-:,-:'-------.l.-- ...J1.0 10
1·~, ..-:(';Di·,Fig. 3.2~4 Angle of Repose
.':.;Q,"
I·
,. dId hways. In The 12"v(lt"-~:,.:.:FJ-IA,I T'Q/?Uq,.y 19~7

J. "
IIPageDate
Computed By
(.o~) ('lzs- +- '00) +
(./0) (V:o f- V-s-) +
(,.5 0) (Vs- + v~) +
(. so) (VA)J
O.OI(~".. ) f- O.S [[o/)(~,,<>r ~o) +
C- oz.) (\{.o I- ~s) +
4rea. = c.y. ()..f PrO$/on / yeo,..
uncl!!'r I--'Is C"rv~ C'a,., 6~ ('0 ~"Ier:/ ..r;..om~;-l'f'1q/~
!1n;wa I £"l'o~/QI1 Vo/"me =( c. y. /yeor)
o
774"5 'pro C' ..c/u re a:ssum~~ -//ooc/s /or.Jer- -140/1 <Ploo -G<,),'I/ produce
f-he SQffle voJ"rne o~~ros/on as j:rorn 4>/00' I.,L O/SO o,sS"I71t?S
C\. //n ...."''' alt/'('recsl!' ..,Lo \\%<"ro (0/'0$/0/7" .L(}/// 0 coeur j,(!!I4J~PI'7
fhe :z-yeqr t'vt'qf .; /he /-,/~Q;' ~vPr7f.
j. 'j)/ol- ~ hI e/"~~/d/J vo/~me PfJl" ,.ji~,,01 evt"n-l- versusr~ (? Q/]nt./Q / ~ro.£ct /J/'h'I/ o~' 0 C'cU/"l't"/}('€ <1~ ~qcA
~vprrl: -rAe. Qr-eq ~nc:/t"/" rA/s C'~/"Vt8 ~,"/I y/~/c/
C:u!>JC yo/'ds 0-1' (!>"'CSS/"/I /ylOcn".
:<.
Client City af Pear; a .Project No. MJ::A - o:zProject Name Ot5J~co/'-.,L )feu-lor
IIIIIIIIII~
IIIIIIII

T8ble 1
Summary of Estimated Erosion VolumeDesert Harbor, !Jest Bank'-ofNew River
Percent of Flow Depth to Use For Erosion Height: 67
Annual Assumed Length Assuilled Erosion Volume Total ErosionReturn Probability Percent of of Eroded Flow Erosion (cu.ft.) Volume for
Interval -of Occurrence Bankline Bank line Depth Height per L. F. of This Event(years) (l/years) Eroded (L. F. ) (L.F. ) (ft) (ft) Bank line (cu. yd.)
(New River Below Confluence !Jith Skunk Creek)
100 0.01 60 3960 15.12 10.13 167.9 2462550 0.02 40 2640 12.57 8.42 116.0 1134625 0.04 30 1980 9.98 6.69 73.1 536410 0.10 20 1320 7.16 4.80 37.6 18415 0.20 10 660 5.21 3.49 19.9 4872 0.50 5 330 2.74 1.84 5.5 67
(New River Above Confluence !Jith Skunk Creek)
100 0.01 60 840 9.98 6.69 73.1 227650 0.02 40 560 8.42 5.64 52.1 108025 0.04 30 420 6.93 4.64 35.3 54910 0.10 20 280 4.74 3.18 16.5 171 '.5 0.20 10 140 3.52 2.36 9.1 472 0.50 5 70 1. 86 1. 25 2.5 7
Average Annual Erosion Volule : 1122 cu. yd.
SUI.ery Df Estileted Erosion VolulDeDesert Harbort-West Bank ot-New River
Percent ot Flow Depth to Use For Erosion Height: 75
Annual Assumed Length Assumed Erosion Volulle Totel ErosionReturn Probability Percent of of Eroded Flow Erosion (cu. ft.) Volulle for
Interval of Occurrence Bankline Benkline Depth Height per L. F. of This Event(years) (l!Years) Eroded (L. F. ) (L.F. ) (ft) (ft) Bankline (cu. yd.)
(New River Below Confluence With Skunk Creek)
100 0.01 60 3960 15.12 11.34 210.4 3085650 0.02 40 2640 12.57 9.43 145.4 1421725 0.04 30 1980 9.98 7.49 91. 7 672210 0.10 20 1320 7.16 5.37 47.2 23065 0.20 10 660 5.21 3.91 25.0 6112 0.50 5 330 2.74 2.06 6.9 84
(New River Above Confluence With Skunk Creek)
100 0.01 60 840 9.98 7.49 91. 7 285250 0.02 40 560 8.42 6.32 65.2 135325 0.04 30 420 6.93 5.20 44.2 68710 0.10 20 280 4.74 3.56 20.7 2145 0.20 10 140 3.52 2.64 11.4 592 0.50 5 70 1.86 1. 40 3.2 8
IIIIIIIIIIIIIIIIIII
Average Annual Erosion Volume =
Teble 2
1406 cu. yd.

Table 3
Su~mary of Estimated Erosion Volume·Desert Harbor, West Bank of Hew River
Percent of Flow Depth to Use For Erosion Height: 75
Annual Assuled Length Assulled Erosion Volume Total ErosionReturn Probability Percent of of Eroded Flow Erosion (cu. ft.) Volulle for
Interval of Occurrence Bankline Bankline Depth Height per L.F. of This Event(years) t1!years) Eroded (L. F. ) (L.F.) (tt) (ft) Bankline (cu.yd.)
(Hew River Below Confluence With Skunk Creek)
100 0.01 75 4950 15.12 11.34 210.4 3857050 0.02 50 3300 12.57 9.43 145.4 1777225 0.04 40 2640 9.98 7.49 91. 7 896210 0.10 30 1980 7.16 5.37 47.2 34605 0.20 20 1320 5.21 3.91 25.0 12212 0.50 10 660 2.74 2.06 6.9 169
(New River Above Confluence With Skunk Creek)
100 0.01 75 1050 9.98 7.49 91. 7 356450 0.02 50 700 8.42 6.32 65.2 169125 0.04 40 560 6.93 5.20 .44.2 91710 0.10 30 420 4.74 3.56 20.7 3225 0.20 20 280 3.52 2.64 11.4 1182 0.50 10 140 1. 86 1. 40 3.2 17
I I
Average Annual Erosion Volume = 1960 cu. yd.

Summary of Estimated Erosion VolumeDesert Harbor, ~est Bank ·of New River
Percent of Flow Depth to Use For Erosion Height: 100
Annual Assumed Length AssUiled Erosion Voluille Total ErosionReturn Probab i I ity Percent of of Eroded Flow Erosion (cu.tt.) Volume for
Interval of-Occurrence Bankline Bankline Depth Height per L. F. of This Event(years) O/yeers) Eroded (L. F.) (L.F. ) (tt) (tt) Benkline (cu.yd.)
(New River Below Confluence ~ith Skunk Creek)
100 0.01 75 4950 15.12 15.12 374.0 6856950 0.02 50 3300 12.57 12.57 258.5 3159425 0.04 40 2640 9.98 9.98 162.9 1593310 0.10 30 1980 7.16 7.16 83.9 61515 0.20 20 1320 5.21 5.21 44.4 21712 0.50 10 660 2.74 2.74 12.3 300
(New River Above Confluence With Skunk Creek)
100 0.01 75 1050 9.98 9.98 162.9 633750 0.02 50 700 8.42 8.42 116.0 300725 0.04 40 560 6.93 6.93 78.6 163010 0.10 30 420 4.74 4.74 36.8 5725 0.20 20 280 3.52 3.52 20.3 2102 0.50 10 140 1. 86 1. 86 5.7 29
I
I
IIIIIIJ
J
J
J
1
l
J
I
Average Annuel Erosion Volume =
Table 4
3484 cu. yd.


![Was bedeutet das Safe Harbor-Urteil fur Ihre Informationen und Ihr Unternehmen? [Deutsche]](https://static.fdocuments.us/doc/165x107/5a6543f87f8b9a4a388b4853/was-bedeutet-das-safe-harbor-urteil-fur-ihre-informationen-und-ihr-unternehmen.jpg)