Annual Education Report Cody Academy of Public Leadership...
30
03/13/2017 Annual Education Report Cody Academy of Public Leadership (00026) M-STEP Grades 3-11 Subject Grade Testing Group School Year State Percent Students Proficient District Percent Students Proficient School Percent Students Proficient Percent Advanced Percent Proficient Percent Partially Proficient Percent Not Proficient ELA 11th Grade Content All Students 2014-15 49.3% 26.0% 1.6% 0.0% 1.6% 14.8% 83.6% ELA 11th Grade Content Asian 2014-15 64.8% 56.5% <10 <10 <10 <10 <10 ELA 11th Grade Content Black or African American 2014-15 25.8% 25.9% 1.7% 0.0% 1.7% 13.8% 84.5% ELA 11th Grade Content White 2014-15 54.3% 25.0% <10 <10 <10 <10 <10 ELA 11th Grade Content Female 2014-15 55.4% 30.0% 0.0% 0.0% 0.0% 20.7% 79.3% ELA 11th Grade Content Male 2014-15 43.3% 20.9% 3.1% 0.0% 3.1% 9.4% 87.5% ELA 11th Grade Content Economically Disadvantaged 2014-15 34.6% 20.1% 2.0% 0.0% 2.0% 16.0% 82.0% ELA 11th Grade Content English Language Learners 2014-15 15.2% 14.7% <10 <10 <10 <10 <10 ELA 11th Grade Content Students With Disabilities 2014-15 12.6% 3.8% 0.0% 0.0% 0.0% 0.0% 100.0% Mathematics 11th Grade Content All Students 2014-15 28.5% 12.5% 0.0% 0.0% 0.0% 1.6% 98.4% Mathematics 11th Grade Content Asian 2014-15 60.7% 39.1% <10 <10 <10 <10 <10 Page 1 of A service of the Center for Educational Performance and Information (CEPI) 30
Transcript of Annual Education Report Cody Academy of Public Leadership...
03/13/2017
Annual Education ReportCody Academy of Public Leadership (00026)
M-STEP Grades 3-11
Subject Grade TestingGroup
School Year State PercentStudentsProficient
DistrictPercentStudentsProficient
SchoolPercentStudentsProficient
PercentAdvanced
PercentProficient
PercentPartiallyProficient
Percent NotProficient
ELA 11th GradeContent
All Students 2014-15 49.3% 26.0% 1.6% 0.0% 1.6% 14.8% 83.6%
ELA 11th GradeContent
Asian 2014-15 64.8% 56.5% <10 <10 <10 <10 <10
ELA 11th GradeContent
Black orAfricanAmerican
2014-15 25.8% 25.9% 1.7% 0.0% 1.7% 13.8% 84.5%
ELA 11th GradeContent
White 2014-15 54.3% 25.0% <10 <10 <10 <10 <10
ELA 11th GradeContent
Female 2014-15 55.4% 30.0% 0.0% 0.0% 0.0% 20.7% 79.3%
ELA 11th GradeContent
Male 2014-15 43.3% 20.9% 3.1% 0.0% 3.1% 9.4% 87.5%
ELA 11th GradeContent
EconomicallyDisadvantaged
2014-15 34.6% 20.1% 2.0% 0.0% 2.0% 16.0% 82.0%
ELA 11th GradeContent
EnglishLanguageLearners
2014-15 15.2% 14.7% <10 <10 <10 <10 <10
ELA 11th GradeContent
Students WithDisabilities
2014-15 12.6% 3.8% 0.0% 0.0% 0.0% 0.0% 100.0%
Mathematics 11th GradeContent
All Students 2014-15 28.5% 12.5% 0.0% 0.0% 0.0% 1.6% 98.4%
Mathematics 11th GradeContent
Asian 2014-15 60.7% 39.1% <10 <10 <10 <10 <10
Page 1 of A service of the Center for Educational Performance and Information (CEPI) 30
03/13/2017
Annual Education ReportCody Academy of Public Leadership (00026)
M-STEP Grades 3-11
Subject Grade TestingGroup
School Year State PercentStudentsProficient
DistrictPercentStudentsProficient
SchoolPercentStudentsProficient
PercentAdvanced
PercentProficient
PercentPartiallyProficient
Percent NotProficient
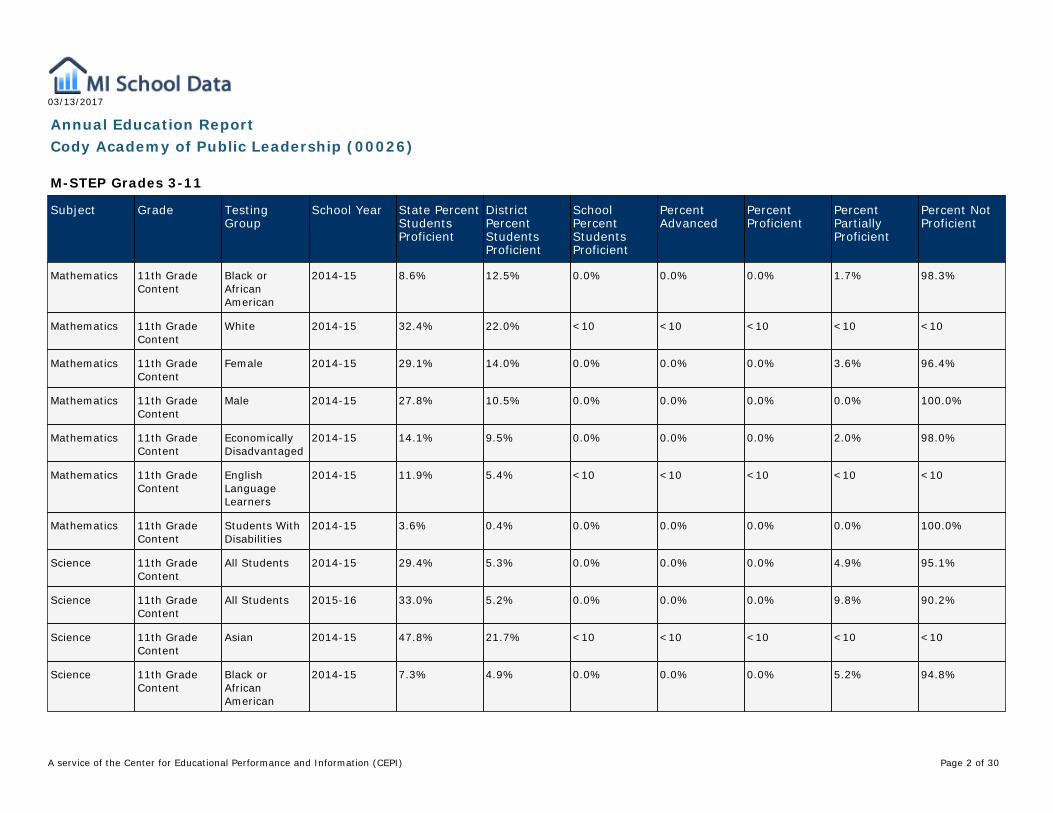
Mathematics 11th GradeContent
Black orAfricanAmerican
2014-15 8.6% 12.5% 0.0% 0.0% 0.0% 1.7% 98.3%
Mathematics 11th GradeContent
White 2014-15 32.4% 22.0% <10 <10 <10 <10 <10
Mathematics 11th GradeContent
Female 2014-15 29.1% 14.0% 0.0% 0.0% 0.0% 3.6% 96.4%
Mathematics 11th GradeContent
Male 2014-15 27.8% 10.5% 0.0% 0.0% 0.0% 0.0% 100.0%
Mathematics 11th GradeContent
EconomicallyDisadvantaged
2014-15 14.1% 9.5% 0.0% 0.0% 0.0% 2.0% 98.0%
Mathematics 11th GradeContent
EnglishLanguageLearners
2014-15 11.9% 5.4% <10 <10 <10 <10 <10
Mathematics 11th GradeContent
Students WithDisabilities
2014-15 3.6% 0.4% 0.0% 0.0% 0.0% 0.0% 100.0%
Science 11th GradeContent
All Students 2014-15 29.4% 5.3% 0.0% 0.0% 0.0% 4.9% 95.1%
Science 11th GradeContent
All Students 2015-16 33.0% 5.2% 0.0% 0.0% 0.0% 9.8% 90.2%
Science 11th GradeContent
Asian 2014-15 47.8% 21.7% <10 <10 <10 <10 <10
Science 11th GradeContent
Black orAfricanAmerican
2014-15 7.3% 4.9% 0.0% 0.0% 0.0% 5.2% 94.8%
Page 2 of A service of the Center for Educational Performance and Information (CEPI) 30
03/13/2017
Annual Education ReportCody Academy of Public Leadership (00026)
M-STEP Grades 3-11
Subject Grade TestingGroup
School Year State PercentStudentsProficient
DistrictPercentStudentsProficient
SchoolPercentStudentsProficient
PercentAdvanced
PercentProficient
PercentPartiallyProficient
Percent NotProficient
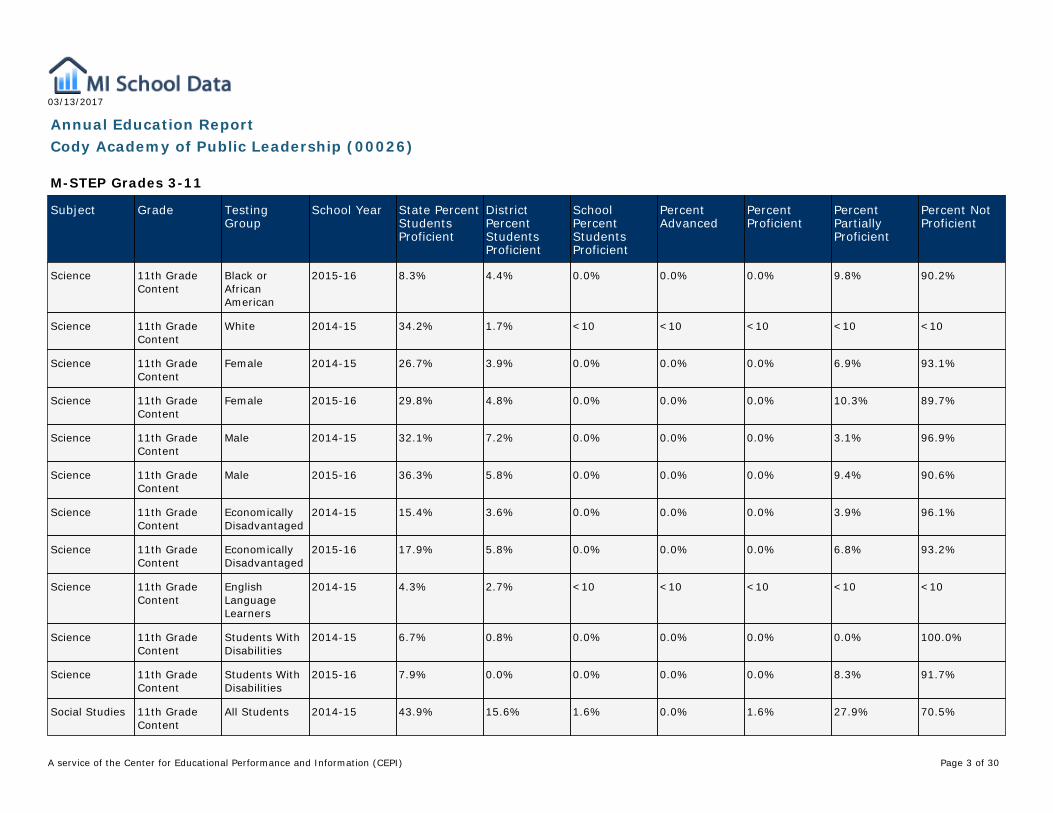
Science 11th GradeContent
Black orAfricanAmerican
2015-16 8.3% 4.4% 0.0% 0.0% 0.0% 9.8% 90.2%
Science 11th GradeContent
White 2014-15 34.2% 1.7% <10 <10 <10 <10 <10
Science 11th GradeContent
Female 2014-15 26.7% 3.9% 0.0% 0.0% 0.0% 6.9% 93.1%
Science 11th GradeContent
Female 2015-16 29.8% 4.8% 0.0% 0.0% 0.0% 10.3% 89.7%
Science 11th GradeContent
Male 2014-15 32.1% 7.2% 0.0% 0.0% 0.0% 3.1% 96.9%
Science 11th GradeContent
Male 2015-16 36.3% 5.8% 0.0% 0.0% 0.0% 9.4% 90.6%
Science 11th GradeContent
EconomicallyDisadvantaged
2014-15 15.4% 3.6% 0.0% 0.0% 0.0% 3.9% 96.1%
Science 11th GradeContent
EconomicallyDisadvantaged
2015-16 17.9% 5.8% 0.0% 0.0% 0.0% 6.8% 93.2%
Science 11th GradeContent
EnglishLanguageLearners
2014-15 4.3% 2.7% <10 <10 <10 <10 <10
Science 11th GradeContent
Students WithDisabilities
2014-15 6.7% 0.8% 0.0% 0.0% 0.0% 0.0% 100.0%
Science 11th GradeContent
Students WithDisabilities
2015-16 7.9% 0.0% 0.0% 0.0% 0.0% 8.3% 91.7%
Social Studies 11th GradeContent
All Students 2014-15 43.9% 15.6% 1.6% 0.0% 1.6% 27.9% 70.5%
Page 3 of A service of the Center for Educational Performance and Information (CEPI) 30
03/13/2017
Annual Education ReportCody Academy of Public Leadership (00026)
M-STEP Grades 3-11
Subject Grade TestingGroup
School Year State PercentStudentsProficient
DistrictPercentStudentsProficient
SchoolPercentStudentsProficient
PercentAdvanced
PercentProficient
PercentPartiallyProficient
Percent NotProficient
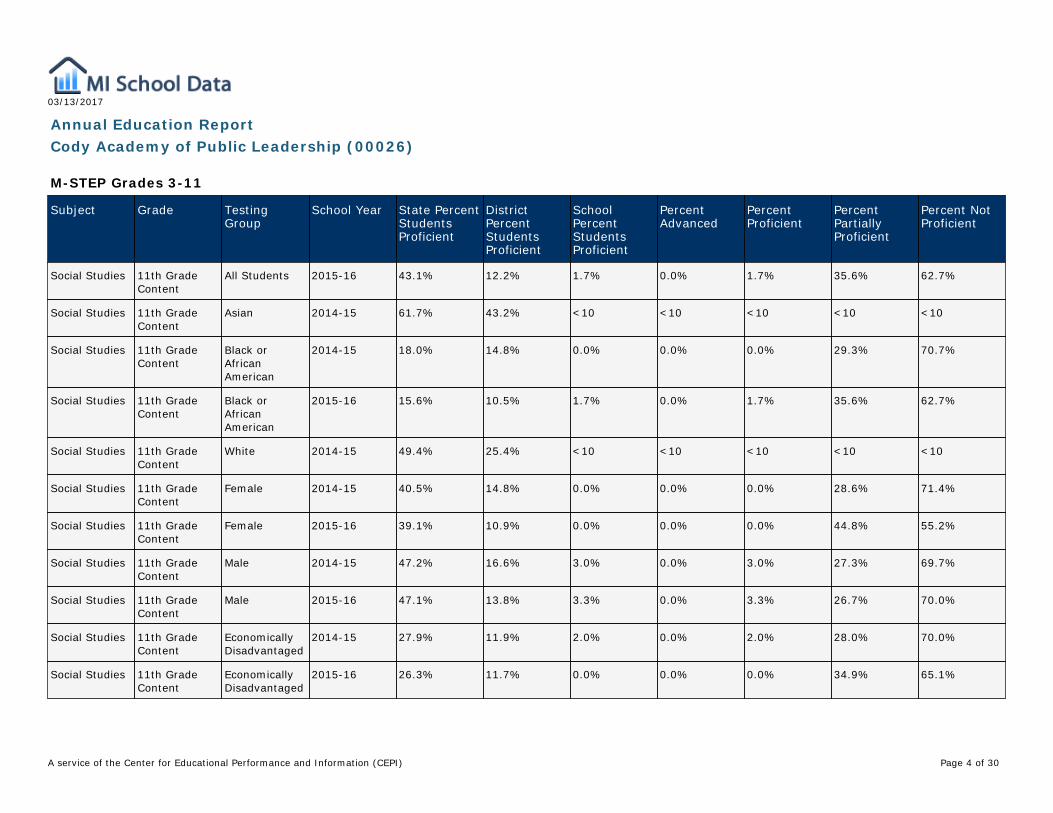
Social Studies 11th GradeContent
All Students 2015-16 43.1% 12.2% 1.7% 0.0% 1.7% 35.6% 62.7%
Social Studies 11th GradeContent
Asian 2014-15 61.7% 43.2% <10 <10 <10 <10 <10
Social Studies 11th GradeContent
Black orAfricanAmerican
2014-15 18.0% 14.8% 0.0% 0.0% 0.0% 29.3% 70.7%
Social Studies 11th GradeContent
Black orAfricanAmerican
2015-16 15.6% 10.5% 1.7% 0.0% 1.7% 35.6% 62.7%
Social Studies 11th GradeContent
White 2014-15 49.4% 25.4% <10 <10 <10 <10 <10
Social Studies 11th GradeContent
Female 2014-15 40.5% 14.8% 0.0% 0.0% 0.0% 28.6% 71.4%
Social Studies 11th GradeContent
Female 2015-16 39.1% 10.9% 0.0% 0.0% 0.0% 44.8% 55.2%
Social Studies 11th GradeContent
Male 2014-15 47.2% 16.6% 3.0% 0.0% 3.0% 27.3% 69.7%
Social Studies 11th GradeContent
Male 2015-16 47.1% 13.8% 3.3% 0.0% 3.3% 26.7% 70.0%
Social Studies 11th GradeContent
EconomicallyDisadvantaged
2014-15 27.9% 11.9% 2.0% 0.0% 2.0% 28.0% 70.0%
Social Studies 11th GradeContent
EconomicallyDisadvantaged
2015-16 26.3% 11.7% 0.0% 0.0% 0.0% 34.9% 65.1%
Page 4 of A service of the Center for Educational Performance and Information (CEPI) 30
03/13/2017
Annual Education ReportCody Academy of Public Leadership (00026)
M-STEP Grades 3-11
Subject Grade TestingGroup
School Year State PercentStudentsProficient
DistrictPercentStudentsProficient
SchoolPercentStudentsProficient
PercentAdvanced
PercentProficient
PercentPartiallyProficient
Percent NotProficient
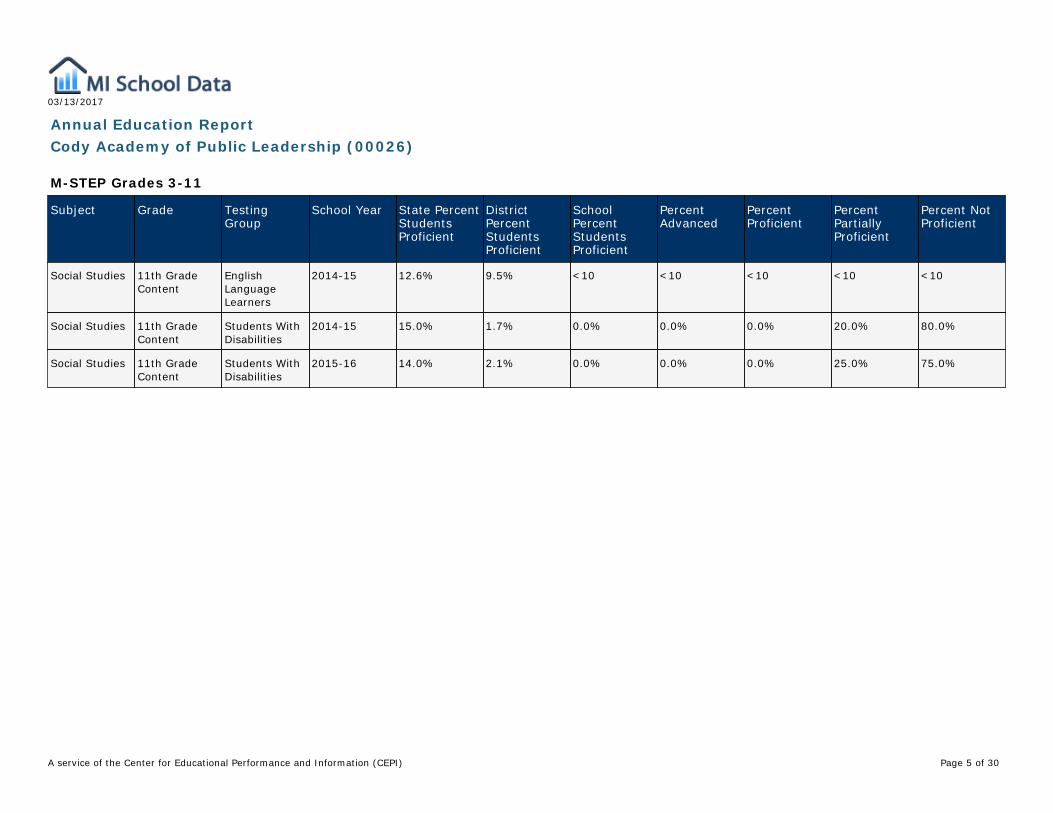
Social Studies 11th GradeContent
EnglishLanguageLearners
2014-15 12.6% 9.5% <10 <10 <10 <10 <10
Social Studies 11th GradeContent
Students WithDisabilities
2014-15 15.0% 1.7% 0.0% 0.0% 0.0% 20.0% 80.0%
Social Studies 11th GradeContent
Students WithDisabilities
2015-16 14.0% 2.1% 0.0% 0.0% 0.0% 25.0% 75.0%
Page 5 of A service of the Center for Educational Performance and Information (CEPI) 30
03/13/2017
Annual Education ReportCody Academy of Public Leadership (00026)
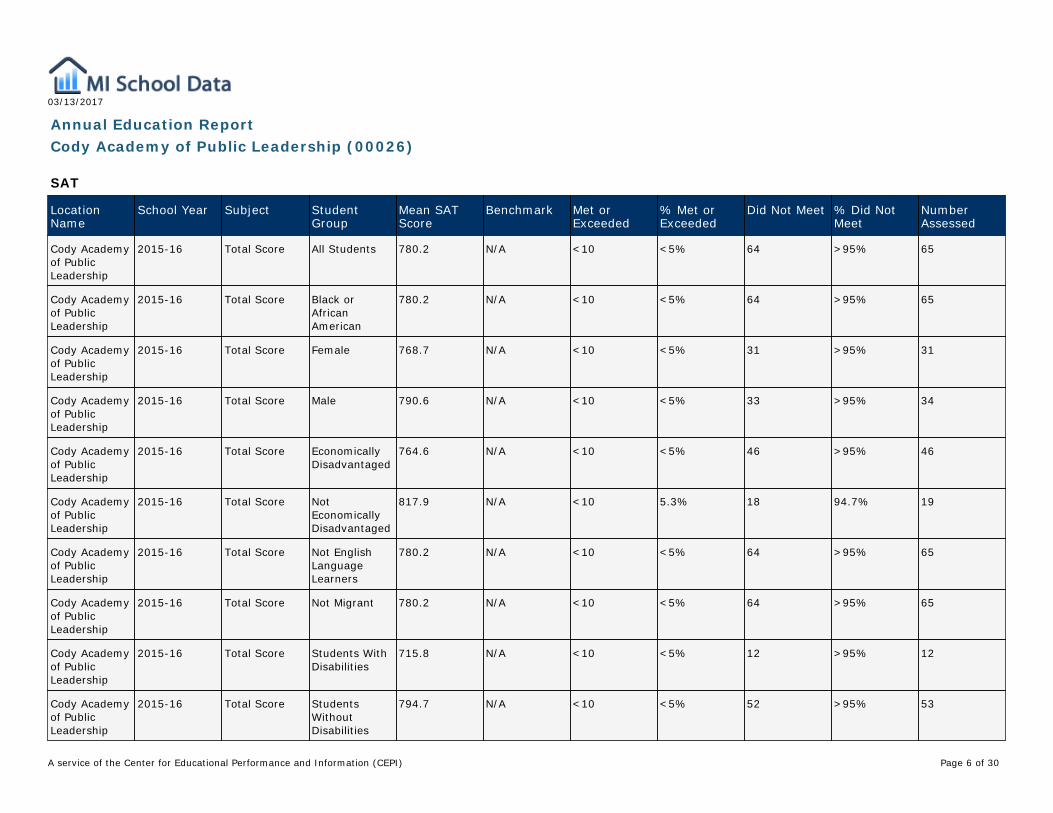
SAT
LocationName
School Year Subject StudentGroup
Mean SATScore
Benchmark Met orExceeded
% Met orExceeded
Did Not Meet % Did NotMeet
NumberAssessed
Cody Academyof PublicLeadership
2015-16 Total Score All Students 780.2 N/A <10 <5% 64 >95% 65
Cody Academyof PublicLeadership
2015-16 Total Score Black orAfricanAmerican
780.2 N/A <10 <5% 64 >95% 65
Cody Academyof PublicLeadership
2015-16 Total Score Female 768.7 N/A <10 <5% 31 >95% 31
Cody Academyof PublicLeadership
2015-16 Total Score Male 790.6 N/A <10 <5% 33 >95% 34
Cody Academyof PublicLeadership
2015-16 Total Score EconomicallyDisadvantaged
764.6 N/A <10 <5% 46 >95% 46
Cody Academyof PublicLeadership
2015-16 Total Score NotEconomicallyDisadvantaged
817.9 N/A <10 5.3% 18 94.7% 19
Cody Academyof PublicLeadership
2015-16 Total Score Not EnglishLanguageLearners
780.2 N/A <10 <5% 64 >95% 65
Cody Academyof PublicLeadership
2015-16 Total Score Not Migrant 780.2 N/A <10 <5% 64 >95% 65
Cody Academyof PublicLeadership
2015-16 Total Score Students WithDisabilities
715.8 N/A <10 <5% 12 >95% 12
Cody Academyof PublicLeadership
2015-16 Total Score StudentsWithoutDisabilities
794.7 N/A <10 <5% 52 >95% 53
Page 6 of A service of the Center for Educational Performance and Information (CEPI) 30
03/13/2017
Annual Education ReportCody Academy of Public Leadership (00026)
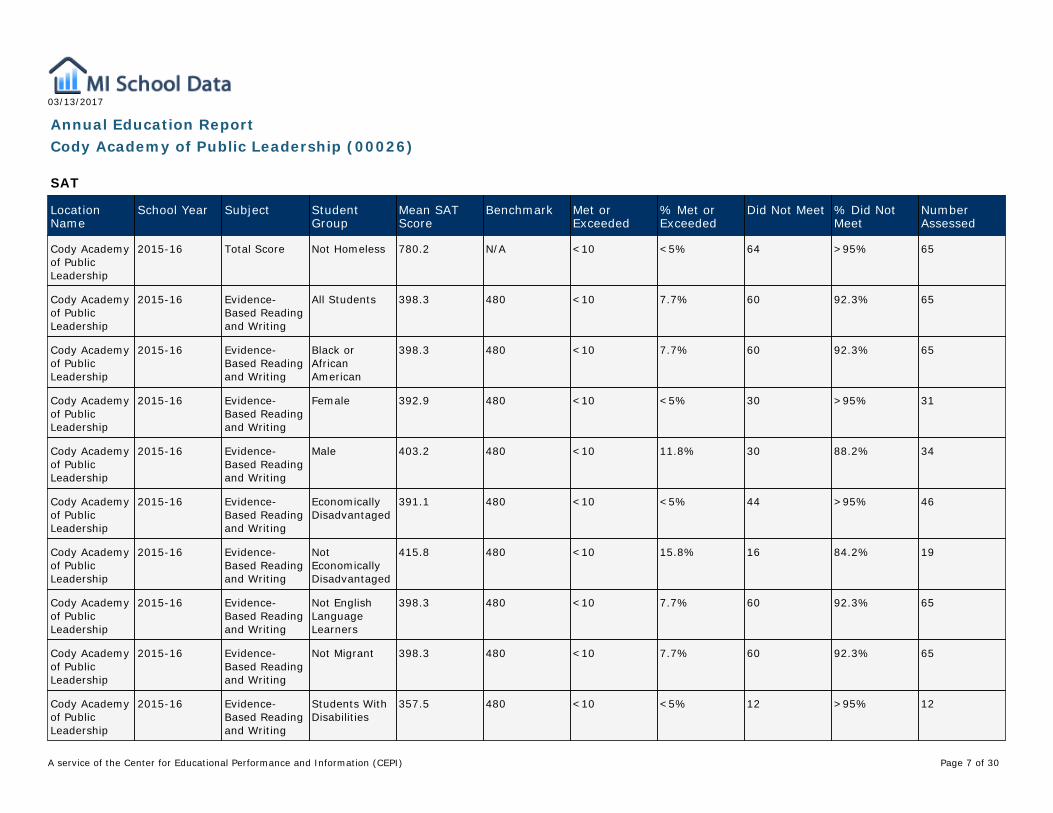
SAT
LocationName
School Year Subject StudentGroup
Mean SATScore
Benchmark Met orExceeded
% Met orExceeded
Did Not Meet % Did NotMeet
NumberAssessed
Cody Academyof PublicLeadership
2015-16 Total Score Not Homeless 780.2 N/A <10 <5% 64 >95% 65
Cody Academyof PublicLeadership
2015-16 Evidence-Based Readingand Writing
All Students 398.3 480 <10 7.7% 60 92.3% 65
Cody Academyof PublicLeadership
2015-16 Evidence-Based Readingand Writing
Black orAfricanAmerican
398.3 480 <10 7.7% 60 92.3% 65
Cody Academyof PublicLeadership
2015-16 Evidence-Based Readingand Writing
Female 392.9 480 <10 <5% 30 >95% 31
Cody Academyof PublicLeadership
2015-16 Evidence-Based Readingand Writing
Male 403.2 480 <10 11.8% 30 88.2% 34
Cody Academyof PublicLeadership
2015-16 Evidence-Based Readingand Writing
EconomicallyDisadvantaged
391.1 480 <10 <5% 44 >95% 46
Cody Academyof PublicLeadership
2015-16 Evidence-Based Readingand Writing
NotEconomicallyDisadvantaged
415.8 480 <10 15.8% 16 84.2% 19
Cody Academyof PublicLeadership
2015-16 Evidence-Based Readingand Writing
Not EnglishLanguageLearners
398.3 480 <10 7.7% 60 92.3% 65
Cody Academyof PublicLeadership
2015-16 Evidence-Based Readingand Writing
Not Migrant 398.3 480 <10 7.7% 60 92.3% 65
Cody Academyof PublicLeadership
2015-16 Evidence-Based Readingand Writing
Students WithDisabilities
357.5 480 <10 <5% 12 >95% 12
Page 7 of A service of the Center for Educational Performance and Information (CEPI) 30
03/13/2017
Annual Education ReportCody Academy of Public Leadership (00026)
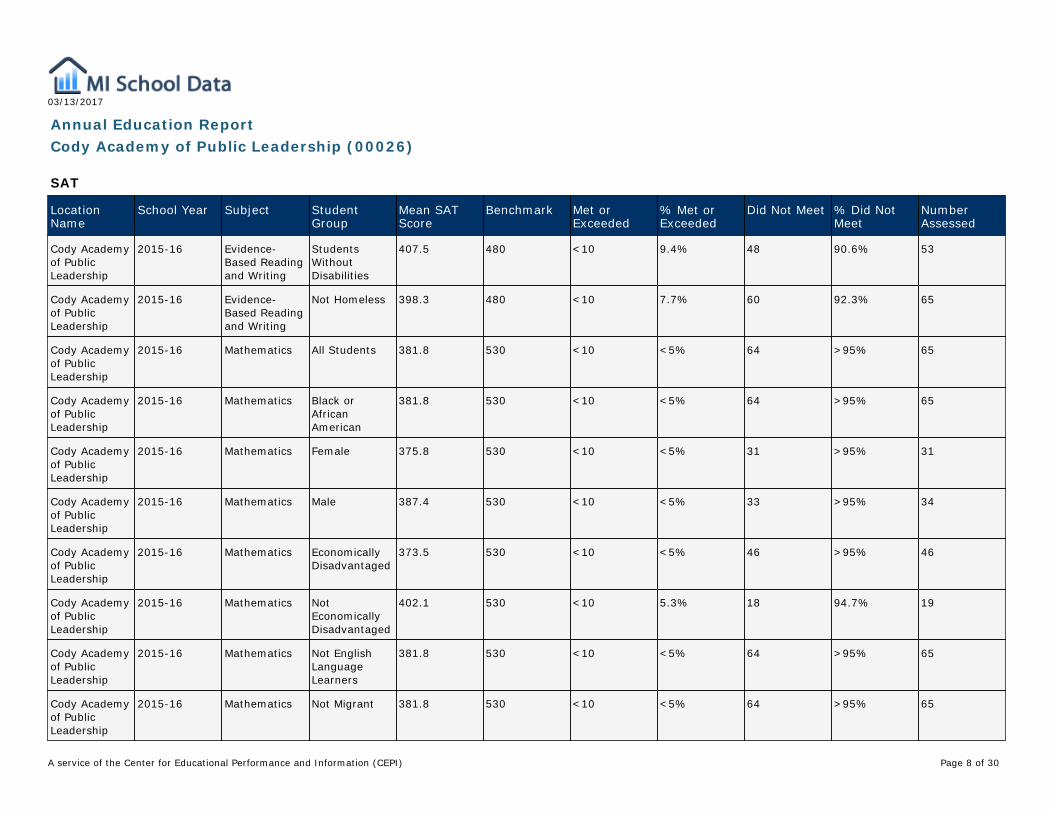
SAT
LocationName
School Year Subject StudentGroup
Mean SATScore
Benchmark Met orExceeded
% Met orExceeded
Did Not Meet % Did NotMeet
NumberAssessed
Cody Academyof PublicLeadership
2015-16 Evidence-Based Readingand Writing
StudentsWithoutDisabilities
407.5 480 <10 9.4% 48 90.6% 53
Cody Academyof PublicLeadership
2015-16 Evidence-Based Readingand Writing
Not Homeless 398.3 480 <10 7.7% 60 92.3% 65
Cody Academyof PublicLeadership
2015-16 Mathematics All Students 381.8 530 <10 <5% 64 >95% 65
Cody Academyof PublicLeadership
2015-16 Mathematics Black orAfricanAmerican
381.8 530 <10 <5% 64 >95% 65
Cody Academyof PublicLeadership
2015-16 Mathematics Female 375.8 530 <10 <5% 31 >95% 31
Cody Academyof PublicLeadership
2015-16 Mathematics Male 387.4 530 <10 <5% 33 >95% 34
Cody Academyof PublicLeadership
2015-16 Mathematics EconomicallyDisadvantaged
373.5 530 <10 <5% 46 >95% 46
Cody Academyof PublicLeadership
2015-16 Mathematics NotEconomicallyDisadvantaged
402.1 530 <10 5.3% 18 94.7% 19
Cody Academyof PublicLeadership
2015-16 Mathematics Not EnglishLanguageLearners
381.8 530 <10 <5% 64 >95% 65
Cody Academyof PublicLeadership
2015-16 Mathematics Not Migrant 381.8 530 <10 <5% 64 >95% 65
Page 8 of A service of the Center for Educational Performance and Information (CEPI) 30
03/13/2017
Annual Education ReportCody Academy of Public Leadership (00026)
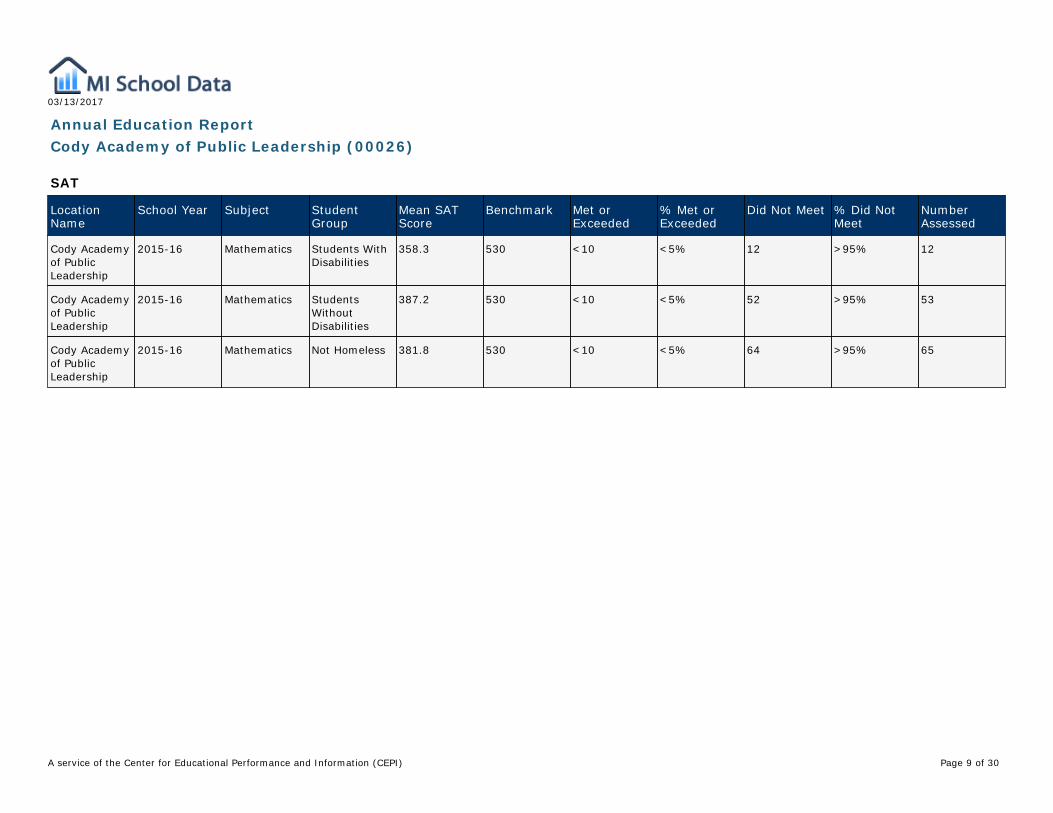
SAT
LocationName
School Year Subject StudentGroup
Mean SATScore
Benchmark Met orExceeded
% Met orExceeded
Did Not Meet % Did NotMeet
NumberAssessed
Cody Academyof PublicLeadership
2015-16 Mathematics Students WithDisabilities
358.3 530 <10 <5% 12 >95% 12
Cody Academyof PublicLeadership
2015-16 Mathematics StudentsWithoutDisabilities
387.2 530 <10 <5% 52 >95% 53
Cody Academyof PublicLeadership
2015-16 Mathematics Not Homeless 381.8 530 <10 <5% 64 >95% 65
Page 9 of A service of the Center for Educational Performance and Information (CEPI) 30
03/13/2017
Annual Education ReportCody Academy of Public Leadership (00026)
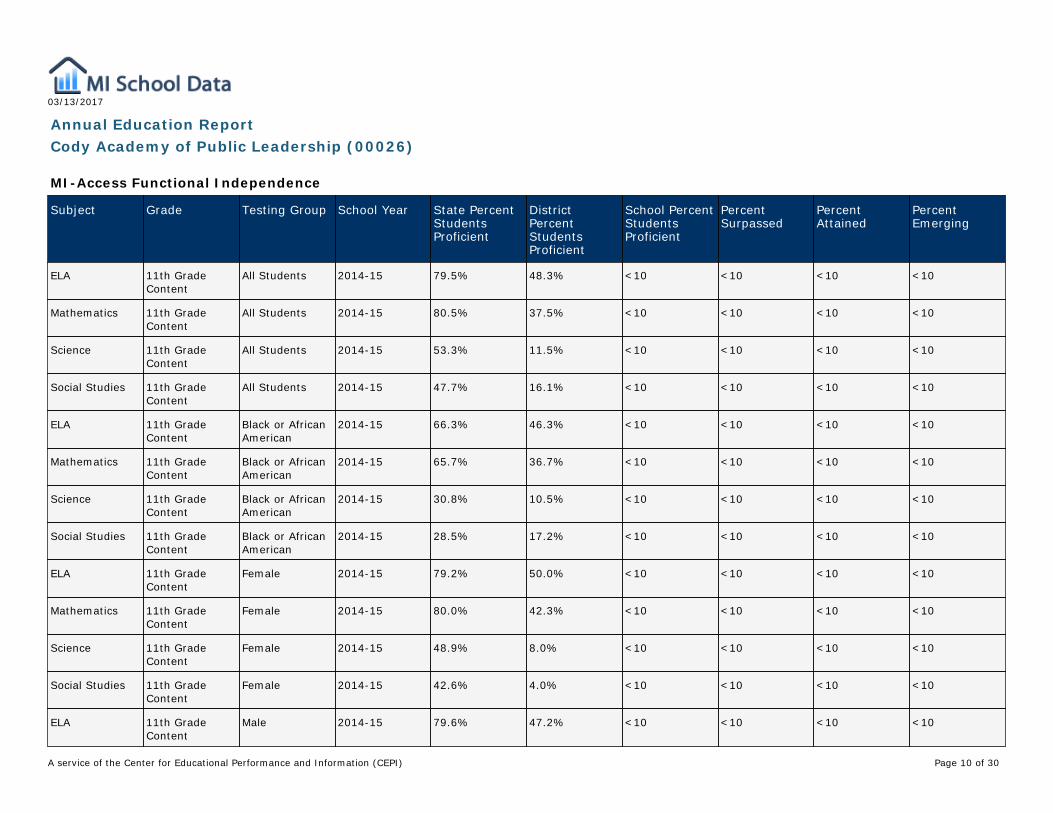
MI-Access Functional Independence
Subject Grade Testing Group School Year State PercentStudentsProficient
DistrictPercentStudentsProficient
School PercentStudentsProficient
PercentSurpassed
PercentAttained
PercentEmerging
ELA 11th GradeContent
All Students 2014-15 79.5% 48.3% <10 <10 <10 <10
Mathematics 11th GradeContent
All Students 2014-15 80.5% 37.5% <10 <10 <10 <10
Science 11th GradeContent
All Students 2014-15 53.3% 11.5% <10 <10 <10 <10
Social Studies 11th GradeContent
All Students 2014-15 47.7% 16.1% <10 <10 <10 <10
ELA 11th GradeContent
Black or AfricanAmerican
2014-15 66.3% 46.3% <10 <10 <10 <10
Mathematics 11th GradeContent
Black or AfricanAmerican
2014-15 65.7% 36.7% <10 <10 <10 <10
Science 11th GradeContent
Black or AfricanAmerican
2014-15 30.8% 10.5% <10 <10 <10 <10
Social Studies 11th GradeContent
Black or AfricanAmerican
2014-15 28.5% 17.2% <10 <10 <10 <10
ELA 11th GradeContent
Female 2014-15 79.2% 50.0% <10 <10 <10 <10
Mathematics 11th GradeContent
Female 2014-15 80.0% 42.3% <10 <10 <10 <10
Science 11th GradeContent
Female 2014-15 48.9% 8.0% <10 <10 <10 <10
Social Studies 11th GradeContent
Female 2014-15 42.6% 4.0% <10 <10 <10 <10
ELA 11th GradeContent
Male 2014-15 79.6% 47.2% <10 <10 <10 <10
Page 10 of A service of the Center for Educational Performance and Information (CEPI) 30
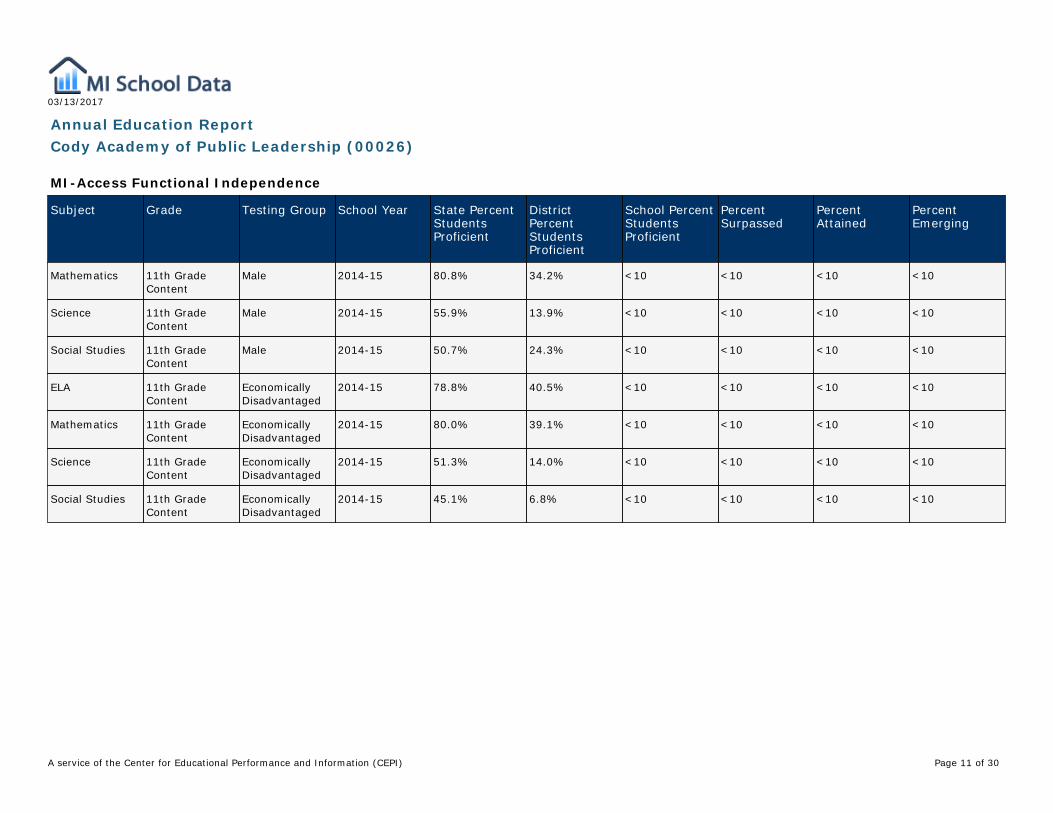
03/13/2017
Annual Education ReportCody Academy of Public Leadership (00026)
MI-Access Functional Independence
Subject Grade Testing Group School Year State PercentStudentsProficient
DistrictPercentStudentsProficient
School PercentStudentsProficient
PercentSurpassed
PercentAttained
PercentEmerging
Mathematics 11th GradeContent
Male 2014-15 80.8% 34.2% <10 <10 <10 <10
Science 11th GradeContent
Male 2014-15 55.9% 13.9% <10 <10 <10 <10
Social Studies 11th GradeContent
Male 2014-15 50.7% 24.3% <10 <10 <10 <10
ELA 11th GradeContent
EconomicallyDisadvantaged
2014-15 78.8% 40.5% <10 <10 <10 <10
Mathematics 11th GradeContent
EconomicallyDisadvantaged
2014-15 80.0% 39.1% <10 <10 <10 <10
Science 11th GradeContent
EconomicallyDisadvantaged
2014-15 51.3% 14.0% <10 <10 <10 <10
Social Studies 11th GradeContent
EconomicallyDisadvantaged
2014-15 45.1% 6.8% <10 <10 <10 <10
Page 11 of A service of the Center for Educational Performance and Information (CEPI) 30
03/13/2017
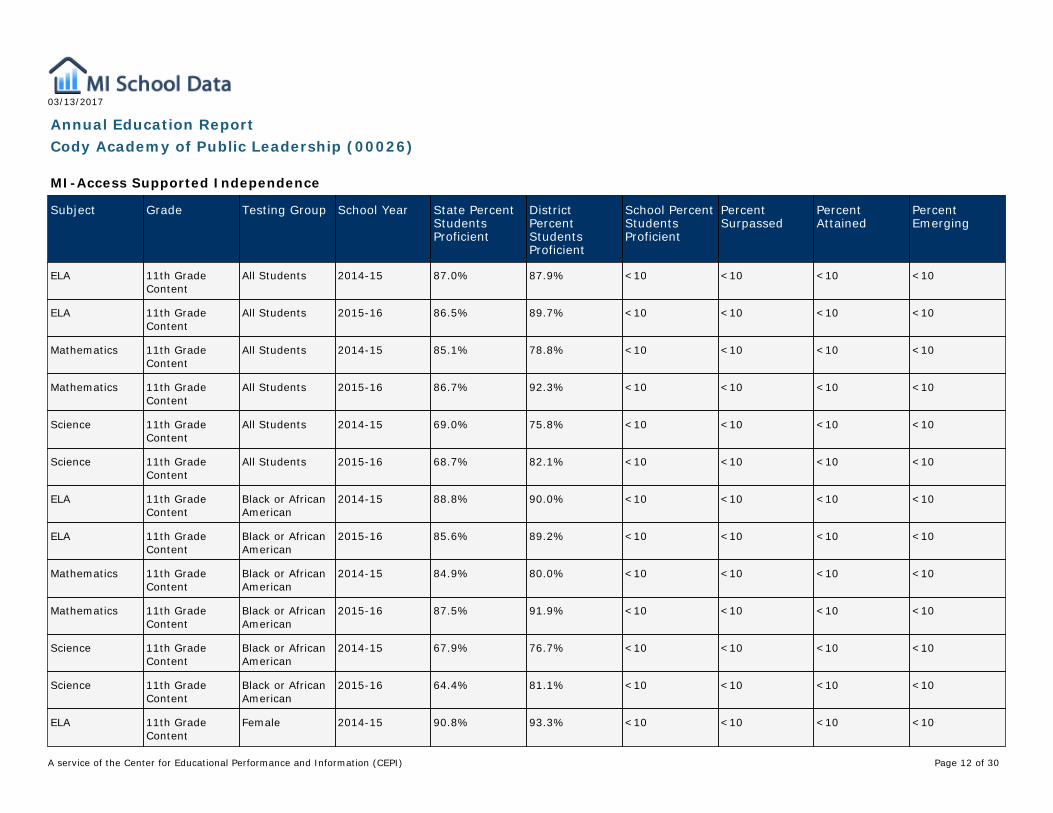
Annual Education ReportCody Academy of Public Leadership (00026)
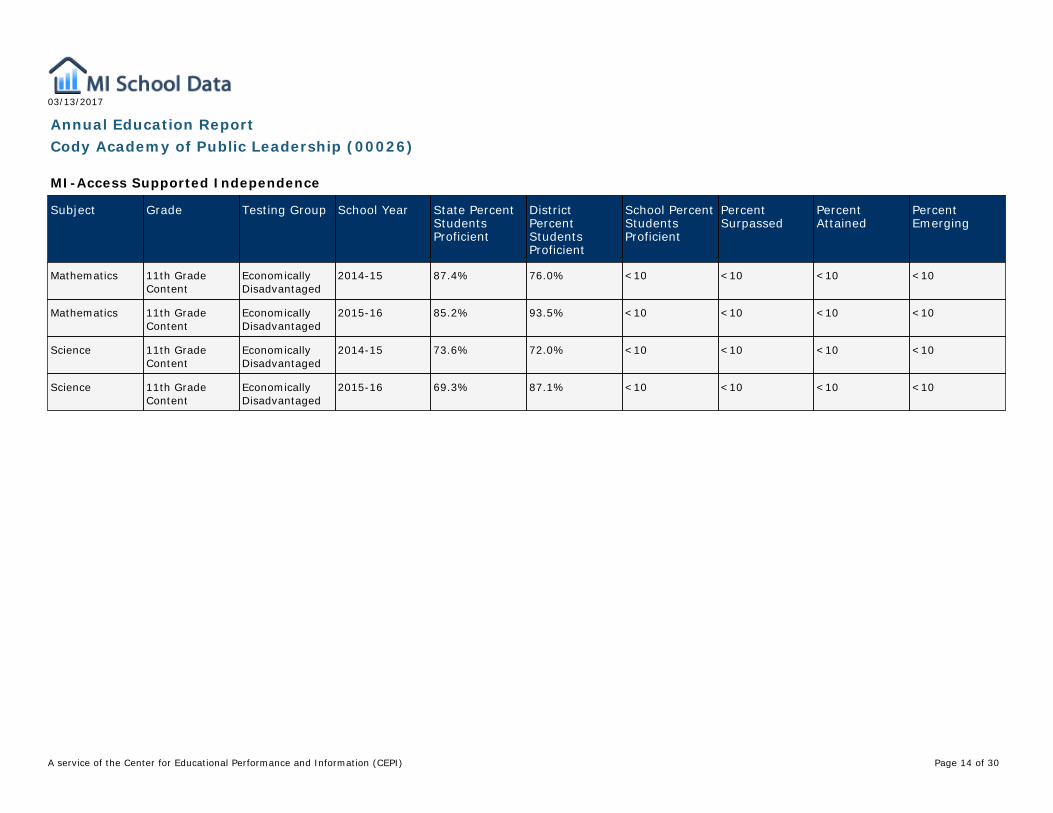
MI-Access Supported Independence
Subject Grade Testing Group School Year State PercentStudentsProficient
DistrictPercentStudentsProficient
School PercentStudentsProficient
PercentSurpassed
PercentAttained
PercentEmerging
ELA 11th GradeContent
All Students 2014-15 87.0% 87.9% <10 <10 <10 <10
ELA 11th GradeContent
All Students 2015-16 86.5% 89.7% <10 <10 <10 <10
Mathematics 11th GradeContent
All Students 2014-15 85.1% 78.8% <10 <10 <10 <10
Mathematics 11th GradeContent
All Students 2015-16 86.7% 92.3% <10 <10 <10 <10
Science 11th GradeContent
All Students 2014-15 69.0% 75.8% <10 <10 <10 <10
Science 11th GradeContent
All Students 2015-16 68.7% 82.1% <10 <10 <10 <10
ELA 11th GradeContent
Black or AfricanAmerican
2014-15 88.8% 90.0% <10 <10 <10 <10
ELA 11th GradeContent
Black or AfricanAmerican
2015-16 85.6% 89.2% <10 <10 <10 <10
Mathematics 11th GradeContent
Black or AfricanAmerican
2014-15 84.9% 80.0% <10 <10 <10 <10
Mathematics 11th GradeContent
Black or AfricanAmerican
2015-16 87.5% 91.9% <10 <10 <10 <10
Science 11th GradeContent
Black or AfricanAmerican
2014-15 67.9% 76.7% <10 <10 <10 <10
Science 11th GradeContent
Black or AfricanAmerican
2015-16 64.4% 81.1% <10 <10 <10 <10
ELA 11th GradeContent
Female 2014-15 90.8% 93.3% <10 <10 <10 <10
Page 12 of A service of the Center for Educational Performance and Information (CEPI) 30
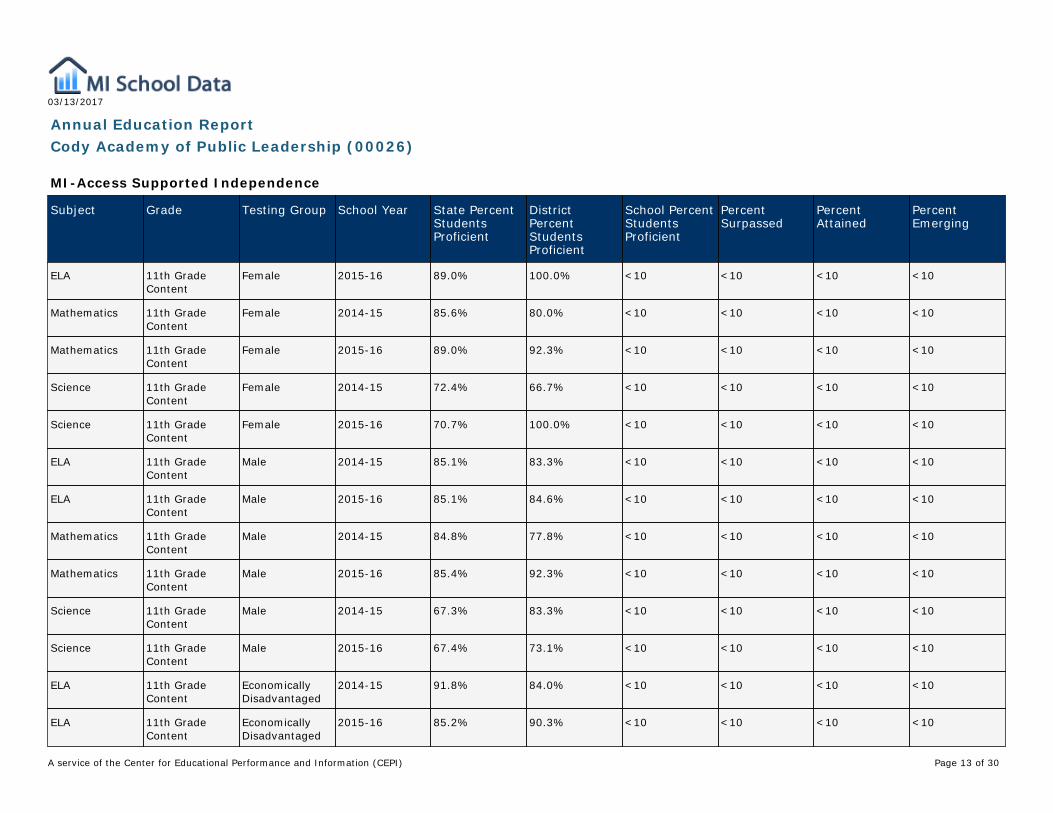
03/13/2017
Annual Education ReportCody Academy of Public Leadership (00026)
MI-Access Supported Independence
Subject Grade Testing Group School Year State PercentStudentsProficient
DistrictPercentStudentsProficient
School PercentStudentsProficient
PercentSurpassed
PercentAttained
PercentEmerging
ELA 11th GradeContent
Female 2015-16 89.0% 100.0% <10 <10 <10 <10
Mathematics 11th GradeContent
Female 2014-15 85.6% 80.0% <10 <10 <10 <10
Mathematics 11th GradeContent
Female 2015-16 89.0% 92.3% <10 <10 <10 <10
Science 11th GradeContent
Female 2014-15 72.4% 66.7% <10 <10 <10 <10
Science 11th GradeContent
Female 2015-16 70.7% 100.0% <10 <10 <10 <10
ELA 11th GradeContent
Male 2014-15 85.1% 83.3% <10 <10 <10 <10
ELA 11th GradeContent
Male 2015-16 85.1% 84.6% <10 <10 <10 <10
Mathematics 11th GradeContent
Male 2014-15 84.8% 77.8% <10 <10 <10 <10
Mathematics 11th GradeContent
Male 2015-16 85.4% 92.3% <10 <10 <10 <10
Science 11th GradeContent
Male 2014-15 67.3% 83.3% <10 <10 <10 <10
Science 11th GradeContent
Male 2015-16 67.4% 73.1% <10 <10 <10 <10
ELA 11th GradeContent
EconomicallyDisadvantaged
2014-15 91.8% 84.0% <10 <10 <10 <10
ELA 11th GradeContent
EconomicallyDisadvantaged
2015-16 85.2% 90.3% <10 <10 <10 <10
Page 13 of A service of the Center for Educational Performance and Information (CEPI) 30
03/13/2017
Annual Education ReportCody Academy of Public Leadership (00026)
MI-Access Supported Independence
Subject Grade Testing Group School Year State PercentStudentsProficient
DistrictPercentStudentsProficient
School PercentStudentsProficient
PercentSurpassed
PercentAttained
PercentEmerging
Mathematics 11th GradeContent
EconomicallyDisadvantaged
2014-15 87.4% 76.0% <10 <10 <10 <10
Mathematics 11th GradeContent
EconomicallyDisadvantaged
2015-16 85.2% 93.5% <10 <10 <10 <10
Science 11th GradeContent
EconomicallyDisadvantaged
2014-15 73.6% 72.0% <10 <10 <10 <10
Science 11th GradeContent
EconomicallyDisadvantaged
2015-16 69.3% 87.1% <10 <10 <10 <10
Page 14 of A service of the Center for Educational Performance and Information (CEPI) 30
03/13/2017
Annual Education ReportCody Academy of Public Leadership (00026)
MI-Access Participation
Subject Grade Testing Group School Year State PercentStudentsProficient
DistrictPercentStudentsProficient
School PercentStudentsProficient
PercentSurpassed
PercentAttained
PercentEmerging
No Data to Display
Page 15 of A service of the Center for Educational Performance and Information (CEPI) 30

03/13/2017
Annual Education ReportCody Academy of Public Leadership (00026)
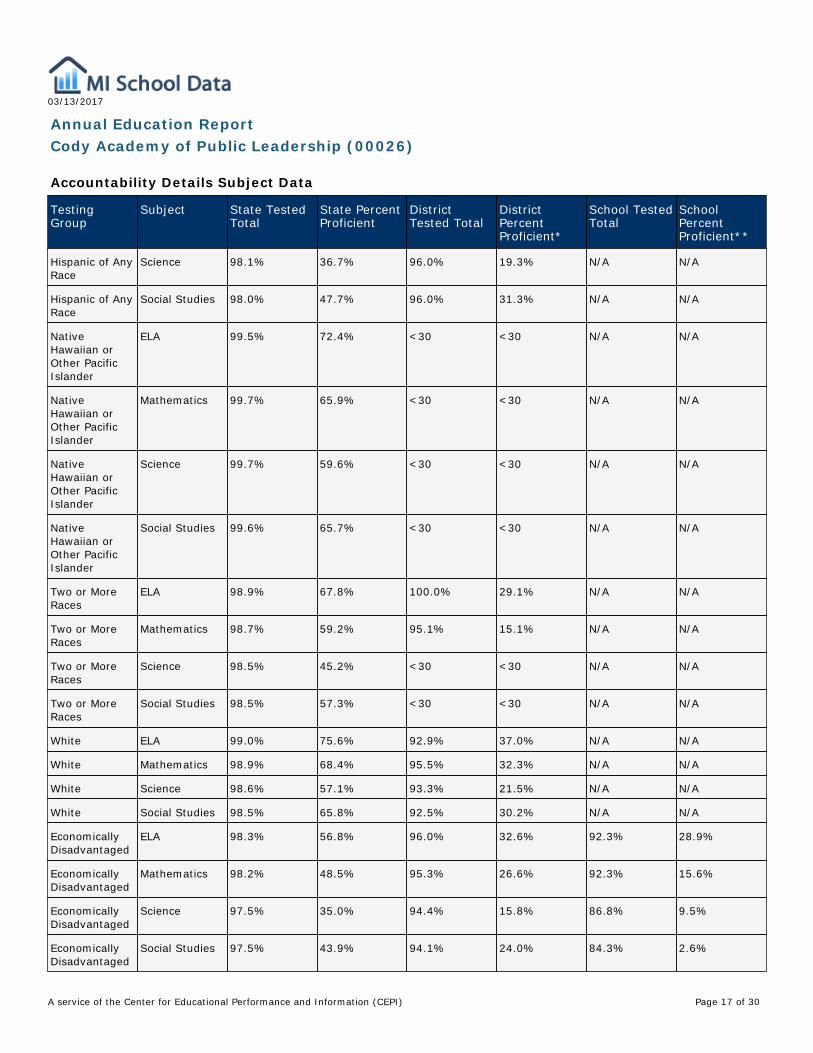
Accountability Details Subject Data
TestingGroup
Subject State TestedTotal
State PercentProficient
DistrictTested Total
DistrictPercentProficient*
School TestedTotal
SchoolPercentProficient**
All Students ELA 98.7% 69.6% 96.0% 34.9% 90.8% 29.7%
All Students Mathematics 98.6% 62.1% 95.4% 28.2% 90.8% 18.8%
All Students Science 98.1% 50.0% 94.5% 16.7% 84.4% 13.6%
All Students Social Studies 98.1% 59.3% 94.0% 26.2% 80.8% 7.6%
Bottom 30% ELA N/A 25.1% N/A 0.8% N/A <30
Bottom 30% Mathematics N/A 19.0% N/A 1.2% N/A <30
Bottom 30% Science N/A 9.8% N/A 0.0% N/A <30
Bottom 30% Social Studies N/A 13.3% N/A 0.0% N/A <30
AmericanIndian orAlaska Native
ELA 98.4% 63.4% 91.7% 43.9% N/A N/A
AmericanIndian orAlaska Native
Mathematics 98.4% 55.9% 95.8% 32.6% N/A N/A
AmericanIndian orAlaska Native
Science 98.0% 46.3% <30 <30 N/A N/A
AmericanIndian orAlaska Native
Social Studies 97.3% 54.5% <30 <30 N/A N/A
Asian ELA 99.3% 84.3% 96.8% 62.6% N/A N/A
Asian Mathematics 99.4% 83.7% 98.3% 59.5% N/A N/A
Asian Science 99.3% 65.5% 98.9% 48.0% N/A N/A
Asian Social Studies 99.3% 76.0% 98.4% 66.7% N/A N/A
Black or AfricanAmerican
ELA 97.7% 46.9% 95.7% 33.4% 90.8% 29.7%
Black or AfricanAmerican
Mathematics 97.4% 37.3% 95.0% 26.2% 90.8% 18.8%
Black or AfricanAmerican
Science 96.5% 23.9% 94.1% 15.3% 84.4% 13.6%
Black or AfricanAmerican
Social Studies 96.6% 33.6% 93.6% 24.1% 80.8% 7.6%
Hispanic of AnyRace
ELA 98.8% 60.8% 97.8% 39.1% N/A N/A
Hispanic of AnyRace
Mathematics 98.8% 51.1% 97.2% 34.0% N/A N/A
Page 16 of A service of the Center for Educational Performance and Information (CEPI) 30
03/13/2017
Annual Education ReportCody Academy of Public Leadership (00026)
Accountability Details Subject Data
TestingGroup
Subject State TestedTotal
State PercentProficient
DistrictTested Total
DistrictPercentProficient*
School TestedTotal
SchoolPercentProficient**
Hispanic of AnyRace
Science 98.1% 36.7% 96.0% 19.3% N/A N/A
Hispanic of AnyRace
Social Studies 98.0% 47.7% 96.0% 31.3% N/A N/A
NativeHawaiian orOther PacificIslander
ELA 99.5% 72.4% <30 <30 N/A N/A
NativeHawaiian orOther PacificIslander
Mathematics 99.7% 65.9% <30 <30 N/A N/A
NativeHawaiian orOther PacificIslander
Science 99.7% 59.6% <30 <30 N/A N/A
NativeHawaiian orOther PacificIslander
Social Studies 99.6% 65.7% <30 <30 N/A N/A
Two or MoreRaces
ELA 98.9% 67.8% 100.0% 29.1% N/A N/A
Two or MoreRaces
Mathematics 98.7% 59.2% 95.1% 15.1% N/A N/A
Two or MoreRaces
Science 98.5% 45.2% <30 <30 N/A N/A
Two or MoreRaces
Social Studies 98.5% 57.3% <30 <30 N/A N/A
White ELA 99.0% 75.6% 92.9% 37.0% N/A N/A
White Mathematics 98.9% 68.4% 95.5% 32.3% N/A N/A
White Science 98.6% 57.1% 93.3% 21.5% N/A N/A
White Social Studies 98.5% 65.8% 92.5% 30.2% N/A N/A
EconomicallyDisadvantaged
ELA 98.3% 56.8% 96.0% 32.6% 92.3% 28.9%
EconomicallyDisadvantaged
Mathematics 98.2% 48.5% 95.3% 26.6% 92.3% 15.6%
EconomicallyDisadvantaged
Science 97.5% 35.0% 94.4% 15.8% 86.8% 9.5%
EconomicallyDisadvantaged
Social Studies 97.5% 43.9% 94.1% 24.0% 84.3% 2.6%
Page 17 of A service of the Center for Educational Performance and Information (CEPI) 30
03/13/2017
Annual Education ReportCody Academy of Public Leadership (00026)
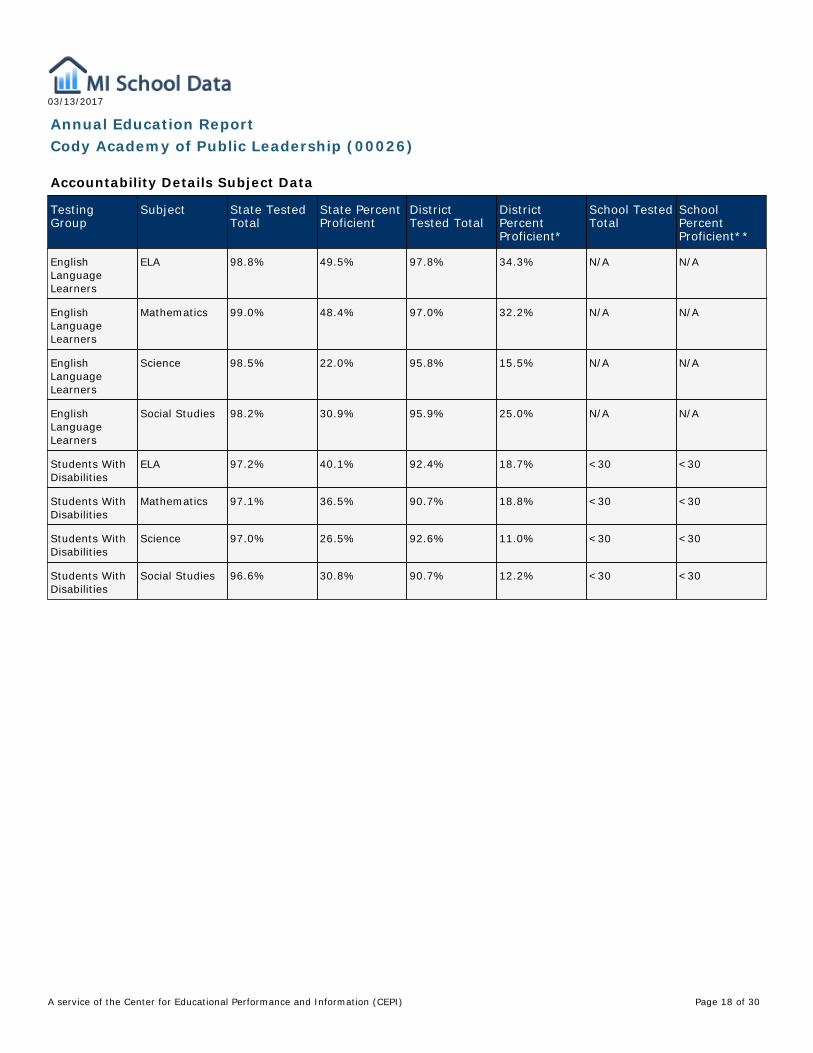
Accountability Details Subject Data
TestingGroup
Subject State TestedTotal
State PercentProficient
DistrictTested Total
DistrictPercentProficient*
School TestedTotal
SchoolPercentProficient**
EnglishLanguageLearners
ELA 98.8% 49.5% 97.8% 34.3% N/A N/A
EnglishLanguageLearners
Mathematics 99.0% 48.4% 97.0% 32.2% N/A N/A
EnglishLanguageLearners
Science 98.5% 22.0% 95.8% 15.5% N/A N/A
EnglishLanguageLearners
Social Studies 98.2% 30.9% 95.9% 25.0% N/A N/A
Students WithDisabilities
ELA 97.2% 40.1% 92.4% 18.7% <30 <30
Students WithDisabilities
Mathematics 97.1% 36.5% 90.7% 18.8% <30 <30
Students WithDisabilities
Science 97.0% 26.5% 92.6% 11.0% <30 <30
Students WithDisabilities
Social Studies 96.6% 30.8% 90.7% 12.2% <30 <30
Page 18 of A service of the Center for Educational Performance and Information (CEPI) 30
03/13/2017
Annual Education ReportCody Academy of Public Leadership (00026)
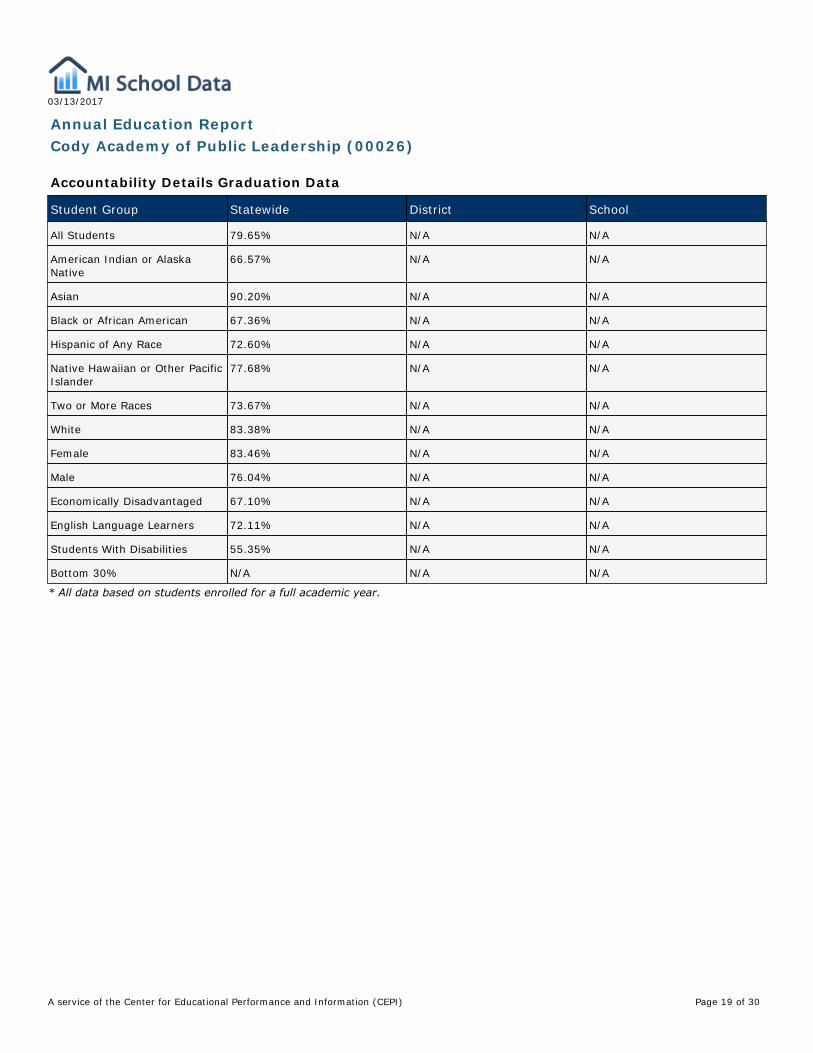
Accountability Details Graduation Data
Student Group Statewide District School
All Students 79.65% N/A N/A
American Indian or AlaskaNative
66.57% N/A N/A
Asian 90.20% N/A N/A
Black or African American 67.36% N/A N/A
Hispanic of Any Race 72.60% N/A N/A
Native Hawaiian or Other PacificIslander
77.68% N/A N/A
Two or More Races 73.67% N/A N/A
White 83.38% N/A N/A
Female 83.46% N/A N/A
Male 76.04% N/A N/A
Economically Disadvantaged 67.10% N/A N/A
English Language Learners 72.11% N/A N/A
Students With Disabilities 55.35% N/A N/A
Bottom 30% N/A N/A N/A
* All data based on students enrolled for a full academic year.
Page 19 of A service of the Center for Educational Performance and Information (CEPI) 30
03/13/2017
Annual Education ReportCody Academy of Public Leadership (00026)
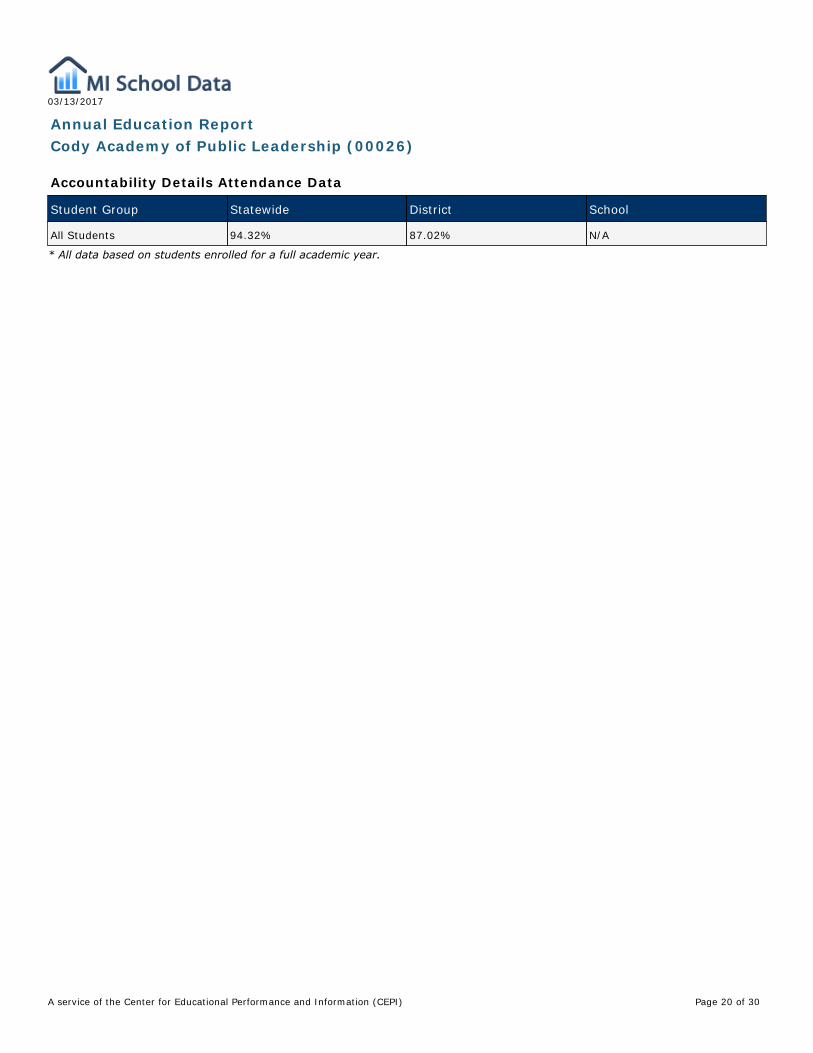
Accountability Details Attendance Data
Student Group Statewide District School
All Students 94.32% 87.02% N/A
* All data based on students enrolled for a full academic year.
Page 20 of A service of the Center for Educational Performance and Information (CEPI) 30
03/13/2017
Annual Education ReportCody Academy of Public Leadership (00026)
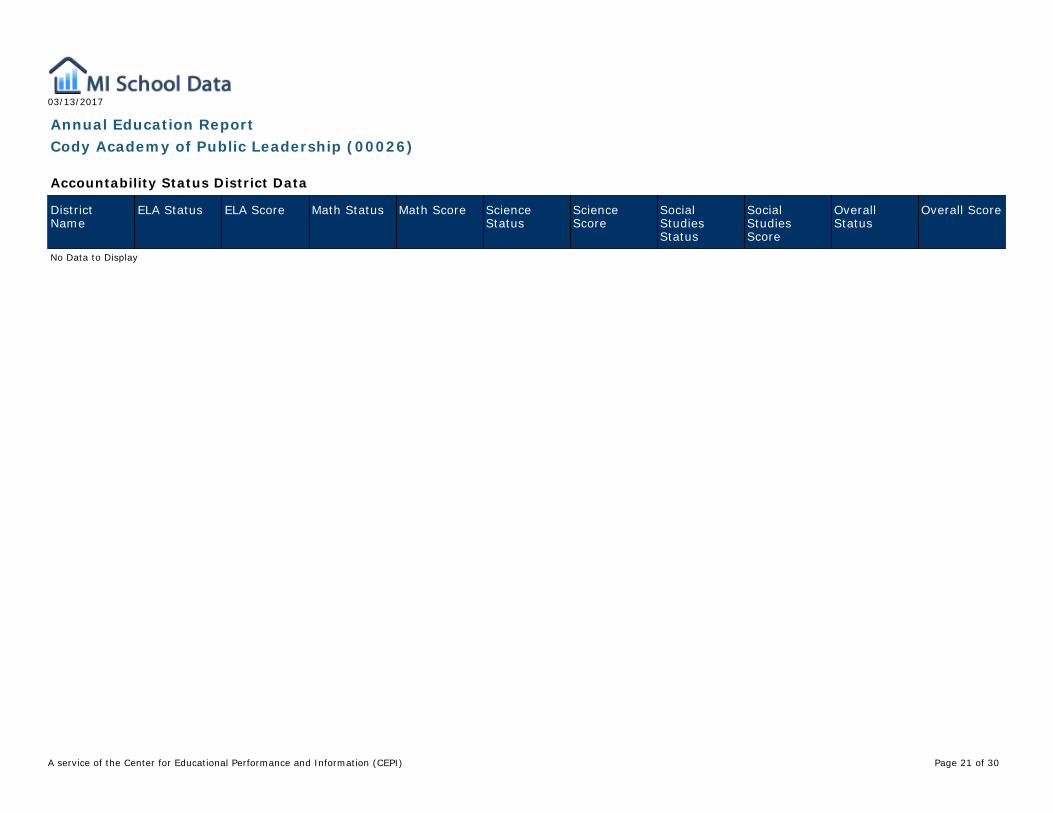
Accountability Status District Data
DistrictName
ELA Status ELA Score Math Status Math Score ScienceStatus
ScienceScore
SocialStudiesStatus
SocialStudiesScore
OverallStatus
Overall Score
No Data to Display
Page 21 of A service of the Center for Educational Performance and Information (CEPI) 30
03/13/2017
Annual Education ReportCody Academy of Public Leadership (00026)
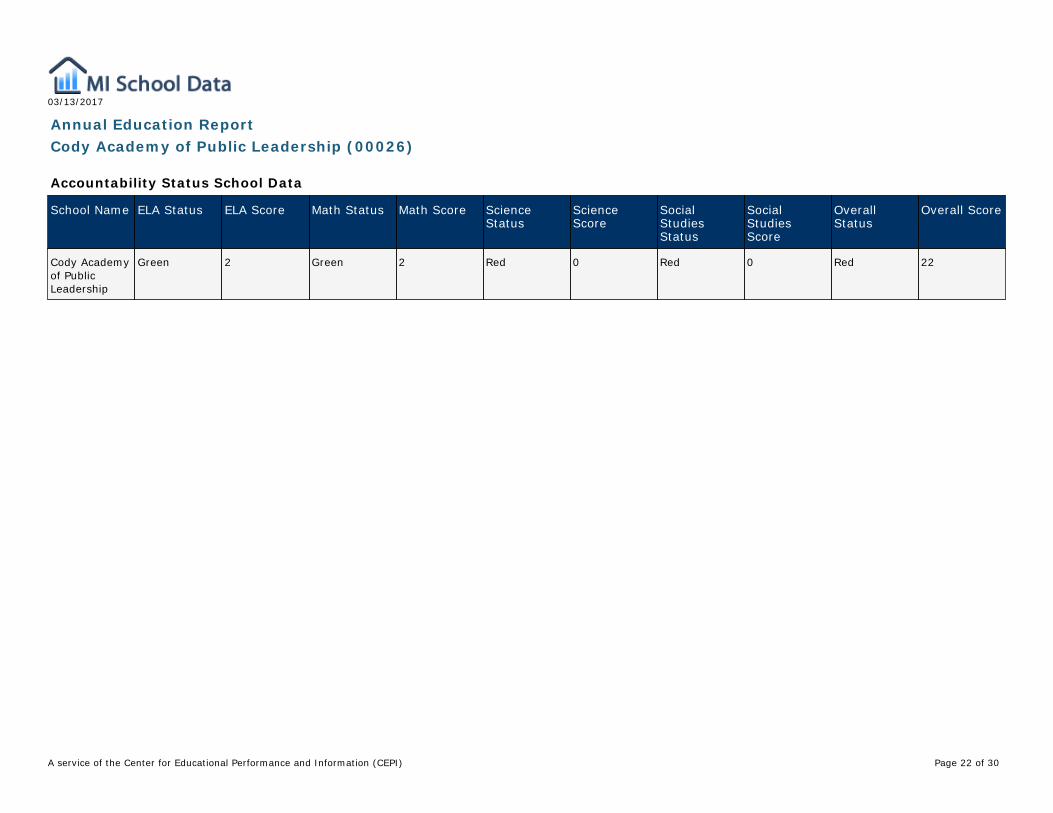
Accountability Status School Data
School Name ELA Status ELA Score Math Status Math Score ScienceStatus
ScienceScore
SocialStudiesStatus
SocialStudiesScore
OverallStatus
Overall Score
Cody Academyof PublicLeadership
Green 2 Green 2 Red 0 Red 0 Red 22
Page 22 of A service of the Center for Educational Performance and Information (CEPI) 30
03/13/2017
Annual Education ReportCody Academy of Public Leadership (00026)
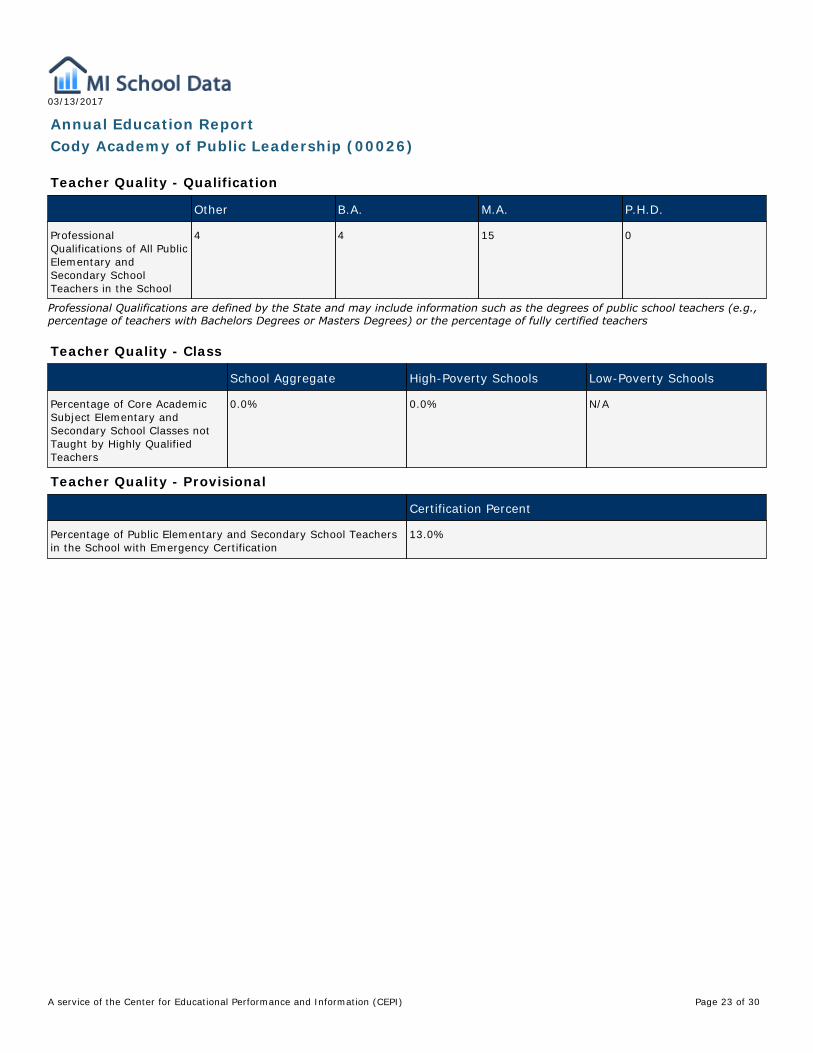
Teacher Quality - Qualification
Other B.A. M.A. P.H.D.
ProfessionalQualifications of All PublicElementary andSecondary SchoolTeachers in the School
4 4 15 0
Professional Qualifications are defined by the State and may include information such as the degrees of public school teachers (e.g.,percentage of teachers with Bachelors Degrees or Masters Degrees) or the percentage of fully certified teachers
Teacher Quality - Class
School Aggregate High-Poverty Schools Low-Poverty Schools
Percentage of Core AcademicSubject Elementary andSecondary School Classes notTaught by Highly QualifiedTeachers
0.0% 0.0% N/A
Teacher Quality - Provisional
Certification Percent
Percentage of Public Elementary and Secondary School Teachersin the School with Emergency Certification
13.0%
Page 23 of A service of the Center for Educational Performance and Information (CEPI) 30

03/13/2017
Annual Education ReportCody Academy of Public Leadership (00026)
NAEP Grade 4 Math
Percent ofStudents
Percent belowBasic
Percent Basic Percent Proficient Percent Advanced
All Students 100 23 77 34 5
MaleFemale
5149
2223
7877
3632
64
National LunchProgram EligibilityEligibleNot EligibleInfo not available
4753#
3610‡
6490‡
1749‡
19‡
Race/EthnicityWhiteBlack or AfricanAmericanHispanicAsianAmerican Indian orAlaska NativeNative Hawaiian orOther PacificIslanderTwo or More Races
7215641#3
15533811‡‡‡
85476289‡‡‡
39102158‡‡‡
5觷‡‡‡
Student classified ashaving a disabilitySDNot SD
1288
4719
5381
1437
15
Student is an EnglishLanguage LearnerELLNot ELL
595
4222
5878
1635
15
‡ Reporting Standards not met. Note: Observed differences are not necessarily statistically significant. Detail may not sum to totalbecause of rounding. SOURCE: U.S. Department of Education. Institute for Education Sciences. National Center for EducationStatistics. National Assessment of Educational Progress (NAEP) 2015 Mathematics Achievement.
Page 24 of A service of the Center for Educational Performance and Information (CEPI) 30
03/13/2017
Annual Education ReportCody Academy of Public Leadership (00026)
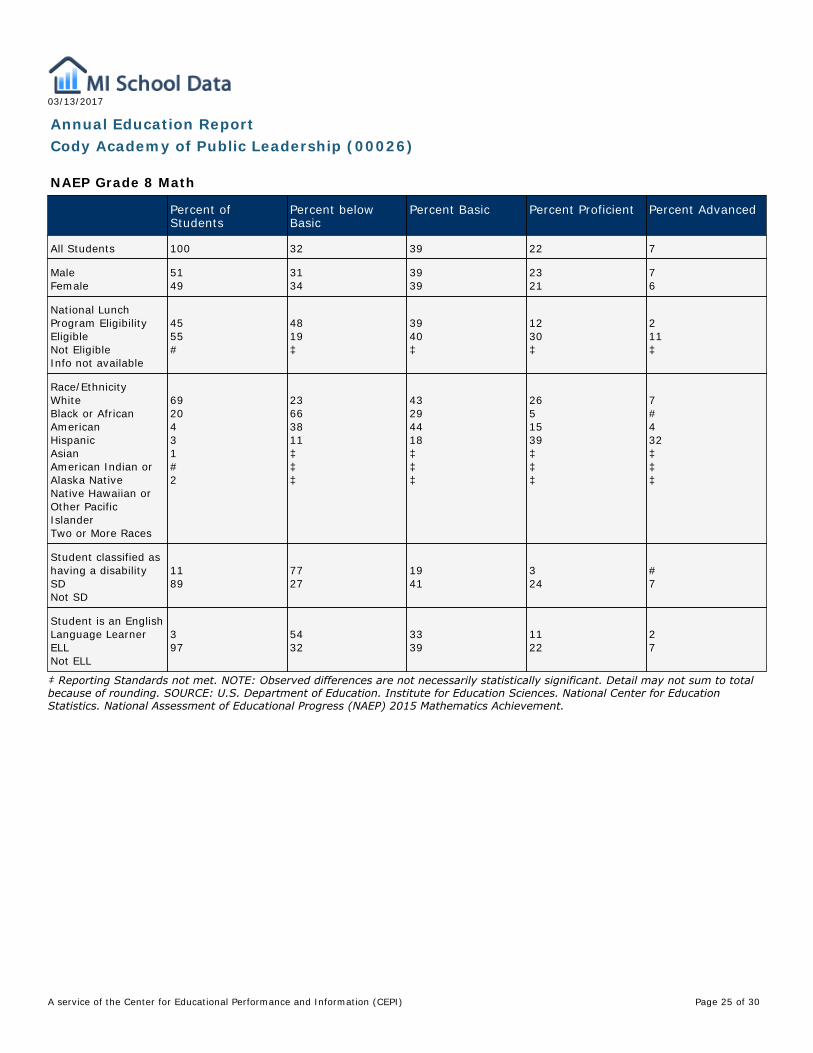
NAEP Grade 8 Math
Percent ofStudents
Percent belowBasic
Percent Basic Percent Proficient Percent Advanced
All Students 100 32 39 22 7
MaleFemale
5149
3134
3939
2321
76
National LunchProgram EligibilityEligibleNot EligibleInfo not available
4555#
4819‡
3940‡
1230‡
211‡
Race/EthnicityWhiteBlack or AfricanAmericanHispanicAsianAmerican Indian orAlaska NativeNative Hawaiian orOther PacificIslanderTwo or More Races
6920431#2
23663811‡‡‡
43294418‡‡‡
2651539‡‡‡
7#432‡‡‡
Student classified ashaving a disabilitySDNot SD
1189
7727
1941
324
#7
Student is an EnglishLanguage LearnerELLNot ELL
397
5432
3339
1122
27
‡ Reporting Standards not met. NOTE: Observed differences are not necessarily statistically significant. Detail may not sum to totalbecause of rounding. SOURCE: U.S. Department of Education. Institute for Education Sciences. National Center for EducationStatistics. National Assessment of Educational Progress (NAEP) 2015 Mathematics Achievement.
Page 25 of A service of the Center for Educational Performance and Information (CEPI) 30
03/13/2017
Annual Education ReportCody Academy of Public Leadership (00026)
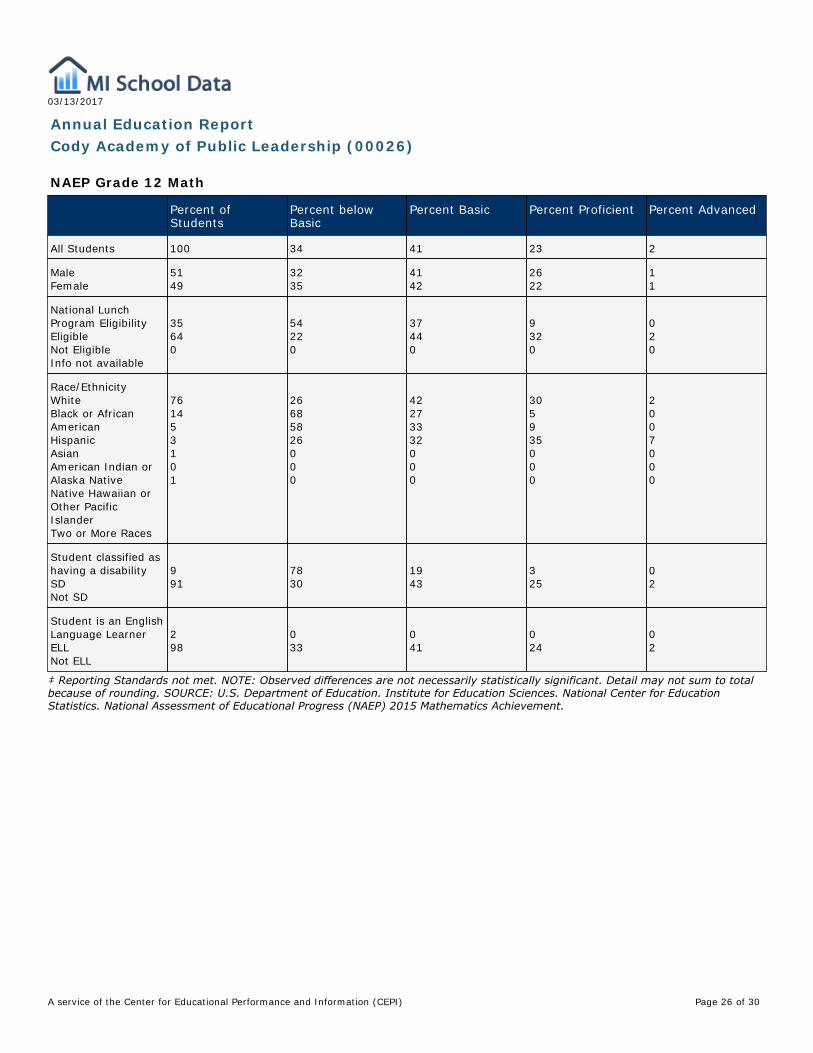
NAEP Grade 12 Math
Percent ofStudents
Percent belowBasic
Percent Basic Percent Proficient Percent Advanced
All Students 100 34 41 23 2
MaleFemale
5149
3235
4142
2622
11
National LunchProgram EligibilityEligibleNot EligibleInfo not available
35640
54220
37440
9320
020
Race/EthnicityWhiteBlack or AfricanAmericanHispanicAsianAmerican Indian orAlaska NativeNative Hawaiian orOther PacificIslanderTwo or More Races
761453101
26685826000
42273332000
305935000
2007000
Student classified ashaving a disabilitySDNot SD
991
7830
1943
325
02
Student is an EnglishLanguage LearnerELLNot ELL
298
033
041
024
02
‡ Reporting Standards not met. NOTE: Observed differences are not necessarily statistically significant. Detail may not sum to totalbecause of rounding. SOURCE: U.S. Department of Education. Institute for Education Sciences. National Center for EducationStatistics. National Assessment of Educational Progress (NAEP) 2015 Mathematics Achievement.
Page 26 of A service of the Center for Educational Performance and Information (CEPI) 30

03/13/2017
Annual Education ReportCody Academy of Public Leadership (00026)
NAEP Grade 4 Reading
Percent ofStudents
Percent belowBasic
Percent Basic Percent Proficient Percent Advanced
All Students 100 37 63 29 5
MaleFemale
5050
3934
6166
2631
56
National LunchProgram EligibilityEligibleNot EligibleInfo not available
4852#
5024‡
5076‡
1640‡
18‡
Race/EthnicityWhiteBlack or AfricanAmericanHispanicAsianAmerican Indian orAlaska NativeNative Hawaiian orOther PacificIslanderTwo or More Races
7214641#3
32664916‡‡30
68345184‡‡70
3291749‡‡37
61115‡‡8
Student classified ashaving a disabilitySDNot SD
1288
7632
2468
731
#6
Student is an EnglishLanguage LearnerELLNot ELL
496
5236
4864
1629
25
# Rounds to zero‡ Reporting Standards not met. NOTE: Observed differences are not necessarily statistically significant. Detail may not sum to totalbecause of rounding. SOURCE: U.S. Department of Education, Institute of Education Sciences, National Center for EducationStatistics, National Assessment of Educational Progress (NAEP), 2015 Reading Assessment.
Page 27 of A service of the Center for Educational Performance and Information (CEPI) 30

03/13/2017
Annual Education ReportCody Academy of Public Leadership (00026)
NAEP Grade 8 Reading
Percent ofStudents
Percent belowBasic
Percent Basic Percent Proficient Percent Advanced
All Students 100 24 44 29 3
MaleFemale
5149
2920
4542
2534
24
National LunchProgram EligibilityEligibleNot EligibleInfo not available
4555#
3714‡
4543‡
1739‡
14‡
Race/EthnicityWhiteBlack or AficanAmericanHispanicAsian/NativeHawaiian or PacificIslanderAmerican Indian orAlaska NativeTwo or More Races
69204312
18472713‡‡
44444135‡‡
3492941‡‡
3觮‡‡
Student classified ashaving a disabilitySDNot SD
1090
6420
3045
532
#3
Student is an EnglishLanguage LearnerELLNot ELL
397
5723
3744
630
#3
# Rounds to zero‡ Reporting Standards not met. NOTE: Observed differences are not necessarily statistically significant. Detail may not sum to totalbecause of rounding. SOURCE: U.S. Department of Education, Institute of Education Sciences, National Center for EducationStatistics, National Assessment of Educational Progress (NAEP), 2015 Reading Assessment.
Page 28 of A service of the Center for Educational Performance and Information (CEPI) 30
03/13/2017
Annual Education ReportCody Academy of Public Leadership (00026)
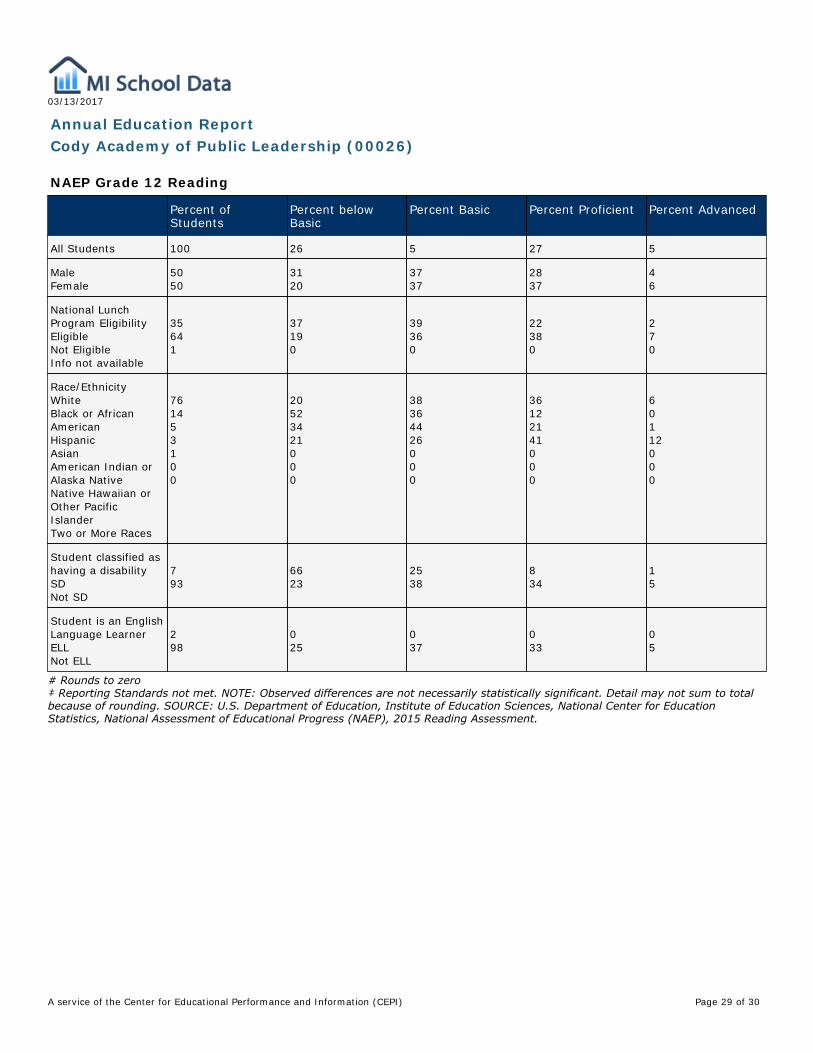
NAEP Grade 12 Reading
Percent ofStudents
Percent belowBasic
Percent Basic Percent Proficient Percent Advanced
All Students 100 26 5 27 5
MaleFemale
5050
3120
3737
2837
46
National LunchProgram EligibilityEligibleNot EligibleInfo not available
35641
37190
39360
22380
270
Race/EthnicityWhiteBlack or AfricanAmericanHispanicAsianAmerican Indian orAlaska NativeNative Hawaiian orOther PacificIslanderTwo or More Races
761453100
20523421000
38364426000
36122141000
60112000
Student classified ashaving a disabilitySDNot SD
793
6623
2538
834
15
Student is an EnglishLanguage LearnerELLNot ELL
298
025
037
033
05
# Rounds to zero‡ Reporting Standards not met. NOTE: Observed differences are not necessarily statistically significant. Detail may not sum to totalbecause of rounding. SOURCE: U.S. Department of Education, Institute of Education Sciences, National Center for EducationStatistics, National Assessment of Educational Progress (NAEP), 2015 Reading Assessment.
Page 29 of A service of the Center for Educational Performance and Information (CEPI) 30
03/13/2017
Annual Education ReportCody Academy of Public Leadership (00026)
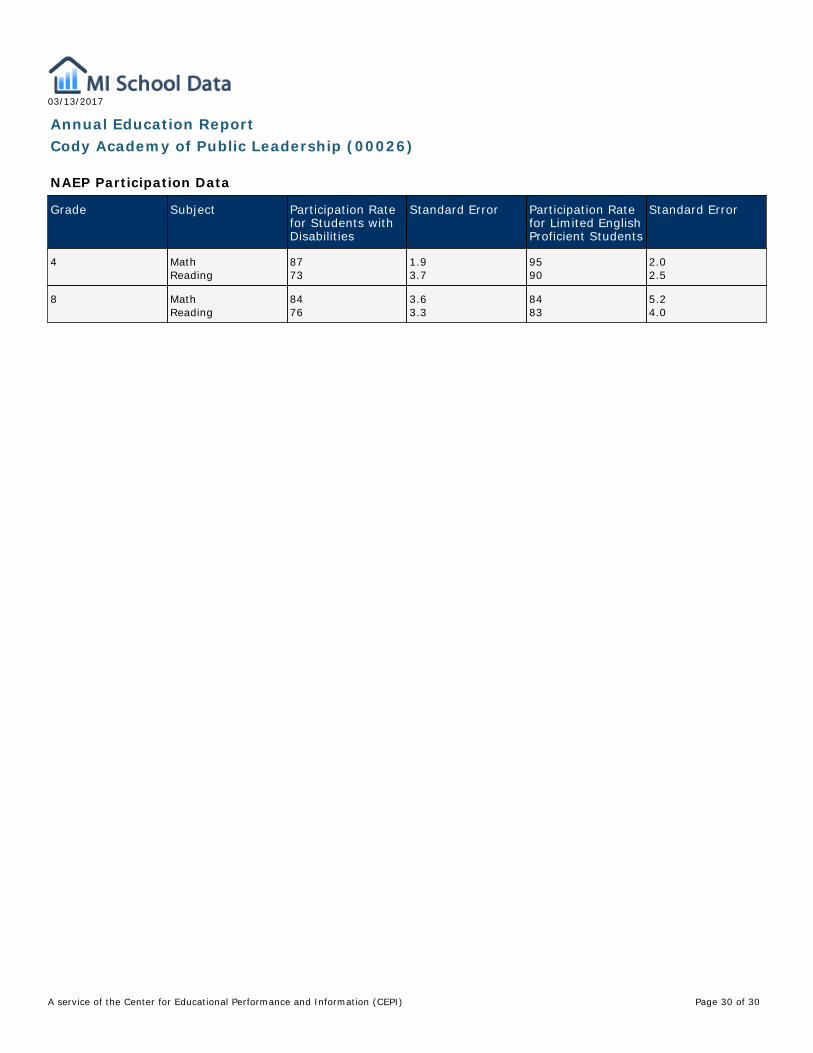
NAEP Participation Data
Grade Subject Participation Ratefor Students withDisabilities
Standard Error Participation Ratefor Limited EnglishProficient Students
Standard Error
4 MathReading
8773
1.93.7
9590
2.02.5
8 MathReading
8476
3.63.3
8483
5.24.0
Page 30 of A service of the Center for Educational Performance and Information (CEPI) 30