
Annual Competitiveness Report 2002 - NCC · Annual Competitiveness Report and Competitiveness...
123
2002 Annual Competitiveness Report 2002
Transcript of Annual Competitiveness Report 2002 - NCC · Annual Competitiveness Report and Competitiveness...

2002Annual
Competitiveness
Report 2002
National
Competitiveness
Council
Annual
Competitiveness
Report
2002
Annual
Competitiveness
Report 2002
This report was prepared with the assistance of
Indecon International Economic Consultants.
November 2002
2002

Mr William Burgess Chairman
Mr Rory Ardagh Leap Broadband Limited
Mr Kevin Bonner Chairman, Transition Management
Mr Donal Byrne Chairman, Cadbury Ireland Limited
Ms Joan Carmichael Deputy General Secretary, Irish Congress of Trade Unions
Mr Bernard Collins Chief Executive Officer, Lifemed Consulting Limited
Mr Martin Cronin Chief Executive Officer, Forfás
Mr Des Geraghty President, SIPTU
Ms Jackie Harrison Director – Social Policy, IBEC
Ms Annette Hughes Economist, DKM Economic Consultants
Mr Billy McCann Chairman, Galco Steel Limited
Ms Áine Mizzoni Chief Executive Officer, emergeSmart Limited
Mr Neil Ormonde Director, Plato Ireland Limited
Mr John Travers Chairman, National Tourism Development Authority
Prof. Ferdinand von Prondzinski President, Dublin City University
Ms Jane Williams Managing Director, The Sia Group Limited
Secretariat:
Forfás
Wilton Park House
Wilton Place
Dublin 2.
Tel: 01 607 3000
Fax: 01 607 3030
Web: www.forfas.ie
Council Members
An
nu
al
Co
mp
eti
tiv
en
es
s R
epo
rt 2
00
2N
ati
on
al
Co
mp
eti
tiv
en
es
s C
ou
nc
il
ii
Ireland’s international competitiveness, allied to a well
educated workforce and a favourable regulatory environment
for enterprise, has been the hallmark of our extraordinary
economic success. Now, as the economy faces into a difficult
and uncertain time, competitiveness will assume even greater
importance in the coming years. New challenges have to be
faced and while recent economic success is no guarantee of
future success, many lessons can be gleaned from our own
experiences since the 1980’s. In the absence of monetary and exchange rate policy, and in
light of weakened global demand, we must maintain competitiveness if we are to safeguard
the economic gains made over the past decade. With this in mind, competitiveness is a key
priority for Government policy.
The Government is determined that the conditions for enterprises operating in Ireland should
be as favourable as possible. This encompasses the costs that businesses face, the skills level
of the population, the physical infrastructure, the regulatory environment, the efficiency and
effectiveness of public administration and other factors.
The National Competitiveness Council was established in 1997 as part of the Programme for
Prosperity and Fairness to report to the Taoiseach on key competitiveness issues for the Irish
economy. The Council makes recommendations to Government and provides a significant
contribution to the development of policy in all of the areas mentioned above. The Council
takes a broad view of competitiveness, defining it as the ability to achieve success in markets
leading to better standards of living for all. The Annual Competitiveness Report, together
with the Competitiveness Challenge provides a valuable insight into the current state of Irish
competitiveness, together with a comprehensive list of policy actions, designed to protect and
indeed enhance Ireland’s competitive position relevant to other countries.
I am very pleased therefore to introduce both the Annual Competitiveness Report 2002 and
Competitiveness Challenge 2002. The Government will give careful consideration to the
Council’s recommendations in the formulation of policy.
Mr. Bertie Ahern, T.D. ,
Taoiseach
November 2002
Foreword by An Taoiseach
An
nu
al C
om
pe
titive
ne
ss R
epo
rt 20
02
Na
tion
al C
om
pe
titive
ne
ss
Co
un
cil
iii
This year the National Competitiveness Council is publishing its fifth
Annual Competitiveness Report and Competitiveness Challenge. The
Council would like to acknowledge the dedication and hard work of
former Chairman Brian Patterson over the past five years.
Using a wide range of key indicators, sourced from bodies such as the
OECD and Eurostat, the Annual Competitiveness Report 2002(ACR) analyses Ireland’s competitiveness and compares it to that of
our trading partners and main competitors. This year’s report differs
from last years in several ways. First it contains a more refined and
focussed set of indicators. Using an input-output approach, these
indicators are sub-divided into a number of separate headings, each representing a key driver of
competitiveness. Second, this year’s report is more accessible and user friendly, with improvements
in the layout of the statistics, graphs and tables.
This year’s ACR confirms many of our strengths. However it also points out many areas of
deterioration and leaves no room for complacency. Future policy must focus on improving the
underlying structures of our economy. Escalating wage costs, prices and infrastructural deficits
must be urgently tackled. As these key issues are addressed policies must be put in place to develop
our human capital to facilitate the development of a knowledge economy. Using the analysis
contained in the ACR as a starting point the Council’s main policy document, the CompetitivenessChallenge 2002, identifies a wide range of competitiveness issues and makes a number of
recommendations for the direction of future public policy. In addition to addressing the primary
concerns of prices and costs, wage growth moderation and the continued provision of
infrastructure, the Council has focussed attention on issues such as Regulation and Competition
Policy, Science, Technology and Innovation, and Education and Skills.
Both the domestic and global economies face difficult times ahead. The extent or exact timing of
any upturn in economic growth cannot be predicted with a strong degree of confidence. As a result
policy makers must contend with a number of potential domestic and international threats to the
economy: rising costs, increasing wages, higher than acceptable inflation, lower investment than is
desirable and weaker than expected global demand. Any decrease in international competitiveness
would have adverse effects on employment, income levels and would inevitably impact on the
Government’s ambitious public spending plans, all of which would put at risk the benefits of the
last ten years of unparalleled growth. Remaining at the forefront of world competitiveness is the
key to overcoming these current difficulties and will put Ireland in a favourable position to take
advantage of any world economic recovery, as well as making the most of the current environment.
In order to do this, the over-arching short to medium-term emphasis must be on the restoration of
the ‘virtuous circle’ which Ireland enjoyed in the late 1990’s. This virtuous circle of sustainable
moderate wage growth, low inflation, productivity gains, social partnership and a competitive
business environment was the bedrock on which our remarkable recent economic performance has
been built. Although the economy has progressed in recent years, we cannot afford to ignore the
fundamentals of our success and urgent policy action is required to restore our much lauded
international competitiveness.
Looking to the future, strategies to enhance productivity must become the guiding light for policy
makers. By addressing the drivers of productivity: skill levels, investment and innovation- and
moving towards the creation of a knowledge economy, policy makers can put in place a framework
which will maximise the growth potential of the economy ensuring continued prosperity and
increasing living standards for all. Now more than ever, in the face of international economic
unpredictability, competitiveness is our only security and the only way to ensure long term
prosperity and social equality.
William Burgess
Chairman
National Competitiveness Council
November 2002
Preface
An
nu
al
Co
mp
eti
tiv
en
es
s R
epo
rt 2
00
2N
ati
on
al
Co
mp
eti
tiv
en
es
s C
ou
nc
il
iv
Previous strong economic performance was driven by gains in competitiveness alongside
other economic factors, and as a result employment and incomes grew rapidly. However,
more recent economic evidence outlined in this Report shows deterioration in some areas of
competitiveness.
• Firstly the rise in wage costs evident in this Report has seen Irish wage levels now rise
above major competitors, with the risk of further divergence over the coming years. EU
data now estimates average Irish nominal wages per full-time employee was 3.6% above
the EMU-12 average in 2001, with average wage levels forecast to rise to 13% above the
EMU average by 2003. In the past, gains in labour productivity justified significant
growth in incomes and wages. However, recent falling productivity trends suggest that
wage inflation will have to ease if low unemployment and competitiveness are to be
sustained. Account must be taken of different sectoral performances.
• Secondly, an easing of wage growth must be accompanied equally, and in parallel, by
reductions in consumer price inflation, thus allowing real wage gains to match
productivity gains. This will limit the risks of embedded cost inflation and the
development of a competitiveness damaging price-wage spiral. Recent price and cost
developments highlighted in this report, confirm a number of worrying trends with
consumer price inflation running at more than twice the EU average. There is a key role
for policy in enhancing competition where possible, particularly in restoring
competitiveness across the non-traded sector of the economy.
• Finally infrastructure bottlenecks are still severe and adding to business costs. Problems
are particularly acute in the transport sector and the progressive implementation of the
National Development Plan (NDP) should remain a priority notwithstanding the tighter
budgetary position. Growing congestion that is driving up costs and curtailing economic
prospects must also be addressed by regional policy. The forthcoming National Spatial
Strategy has a central role to play in achieving balanced regional development.
Conclusions
Overall findings show that there appears to be a wide spectrum of competitive performance
across the economy. The report though also highlights other areas where competitiveness is
deteriorating.
The benchmark findings from this report should be used to develop future policy which can
stabilise and improve the Irish competitive position. If we are successful in delivering this
policy action then the economic outlook is solid. However, failure to address these challenges
within the new economic environment will result in a sharp increase in risks across
the economy, in turn threatening a reversal of many of the economic gains made over the
last decade.
Key Findings
An
nu
al C
om
pe
titive
ne
ss R
epo
rt 20
02
Na
tion
al C
om
pe
titive
ne
ss
Co
un
cil
v
Overview
Maintaining and strengthening our overall competitive position is the key to ensuring that
economic potential is maximised. It is therefore vital that Government policy responds
rapidly and effectively to unfolding macroeconomic events and competitiveness threats. A
stable macro-economic environment is the necessary foundation on which enterprise can
build competitiveness, assisted where feasible by other competitiveness-enhancing public
interventions. Ensuring a strong economic foundation and business environment will allow
the benefits from other competitiveness policies to be fully reaped.
Recent Developments
Over the last decade the Irish economy has enjoyed significant advances, allowing
convergence across key areas with many of our competitors. A virtuous circle of low
inflation, moderate wage increases, lower taxes and higher productivity was maintained. As
a result the Irish economy has been extremely competitive in recent years. This can be
observed when assessing the level of GDP or GNP per capita in Ireland compared with other
countries. OECD data shows that Ireland now has the second highest level of GDP per capita
at US$31,400. While GDP measures overstate Irish income, the data indicate that Ireland is
now amongst the richest countries in the world.
However, this economic transformation has presented policymakers with a new set of
challenges. Firstly, the economy has come up against supply-side constraints including labour
market tightness, and also inadequate infrastructure in the areas of transport, housing,
education, telecommunications, health and energy. Secondly, the risk of a price-wage spiral
has escalated as consumer prices, wage growth and other costs accelerate rapidly in response
to surging demand and restricted capacity.
Adding to this new set of economic circumstances was the bursting of the ICT bubble in mid-
2000, and later the global economic shock triggered by the events of September 11th 2001.
As a result global growth conditions, which were already on a tentative footing, deteriorated
rapidly from the second half of 2001 led by a rapid deceleration in US growth. The Asian
and European economies also remained weak in this period and into early 2002, dampening
global economic conditions further. The Irish economy was not immune to these
deteriorating global trends. With domestic economic conditions remaining shaky as a result
of continued high wage and price inflation and the foot and mouth crisis, downside risks to
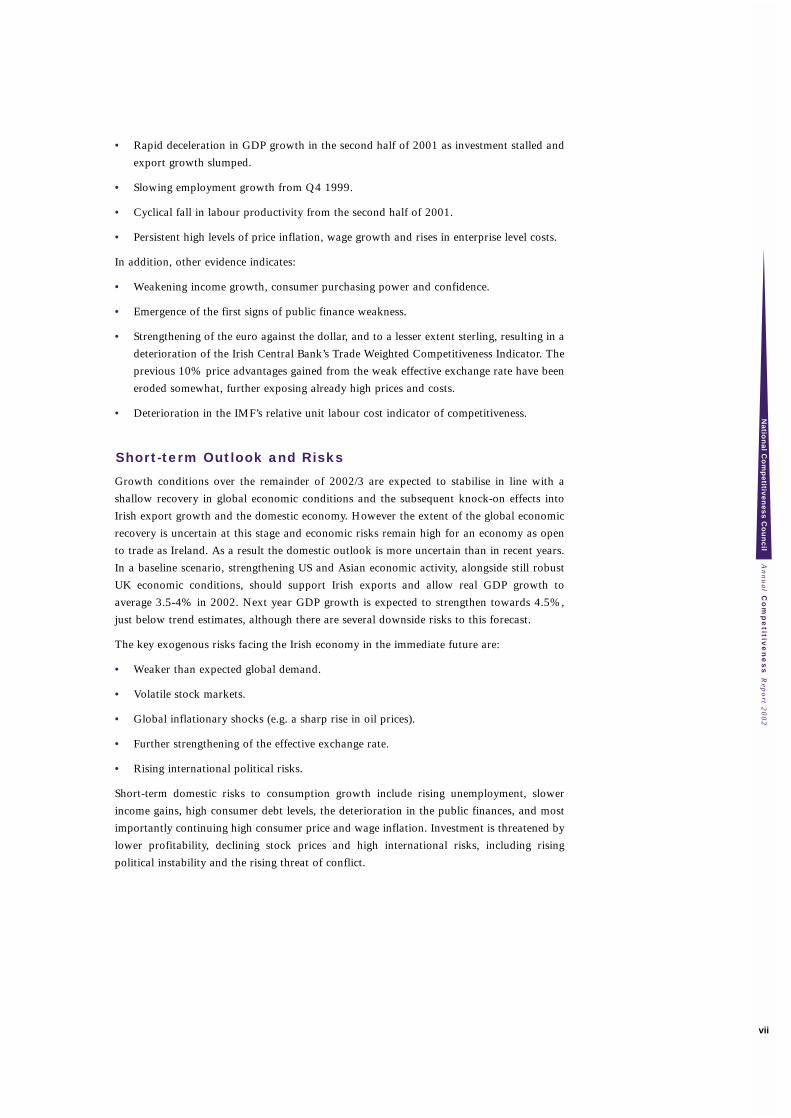
the overall economy reached their highest levels for over a decade. The changing economic
environment is summarised in the following table:
1999 2000 2000 2000 2000 2001 2001 2001 2001 2002 2002Q4 Q1 Q2 Q3 Q4 Q1 Q2 Q3 Q4 Q1 Q2
Real GDP (%ch) 14.3 10.2 13.4 10.1 12.1 12.3 9.0 2.8 0.1 2.9
Employment (%ch) 6.6 6.1 5.0 4.1 3.8 3.6 2.7 2.8 2.5 2.1 1.9
Productivity* (%ch) 7.2 3.8 8.0 5.7 7.9 8.4 6.1 0.0 -2.4 0.8
Consumer Prices (%ch) 3.8 4.3 5.2 6.2 6.6 5.3 5.5 4.7 4.1 4.8 4.6
Unemployment (%) 5.1 4.7 4.3 4.3 3.9 3.7 3.7 4.3 4.0 4.4 4.2
%ch = annual change* Forfás labour productivity estimateSource: Central Statistics Office
Economic Summary
An
nu
al
Co
mp
eti
tiv
en
es
s R
epo
rt 2
00
2N
ati
on
al
Co
mp
eti
tiv
en
es
s C
ou
nc
il
vi
• Rapid deceleration in GDP growth in the second half of 2001 as investment stalled and
export growth slumped.
• Slowing employment growth from Q4 1999.
• Cyclical fall in labour productivity from the second half of 2001.
• Persistent high levels of price inflation, wage growth and rises in enterprise level costs.
In addition, other evidence indicates:
• Weakening income growth, consumer purchasing power and confidence.
• Emergence of the first signs of public finance weakness.
• Strengthening of the euro against the dollar, and to a lesser extent sterling, resulting in a
deterioration of the Irish Central Bank’s Trade Weighted Competitiveness Indicator. The
previous 10% price advantages gained from the weak effective exchange rate have been
eroded somewhat, further exposing already high prices and costs.
• Deterioration in the IMF’s relative unit labour cost indicator of competitiveness.
Short-term Outlook and Risks
Growth conditions over the remainder of 2002/3 are expected to stabilise in line with a
shallow recovery in global economic conditions and the subsequent knock-on effects into
Irish export growth and the domestic economy. However the extent of the global economic
recovery is uncertain at this stage and economic risks remain high for an economy as open
to trade as Ireland. As a result the domestic outlook is more uncertain than in recent years.
In a baseline scenario, strengthening US and Asian economic activity, alongside still robust
UK economic conditions, should support Irish exports and allow real GDP growth to
average 3.5-4% in 2002. Next year GDP growth is expected to strengthen towards 4.5%,
just below trend estimates, although there are several downside risks to this forecast.
The key exogenous risks facing the Irish economy in the immediate future are:
• Weaker than expected global demand.
• Volatile stock markets.
• Global inflationary shocks (e.g. a sharp rise in oil prices).
• Further strengthening of the effective exchange rate.
• Rising international political risks.
Short-term domestic risks to consumption growth include rising unemployment, slower
income gains, high consumer debt levels, the deterioration in the public finances, and most
importantly continuing high consumer price and wage inflation. Investment is threatened by
lower profitability, declining stock prices and high international risks, including rising
political instability and the rising threat of conflict.
An
nu
al C
om
pe
titive
ne
ss R
epo
rt 20
02
Na
tion
al C
om
pe
titive
ne
ss
Co
un
cil
vii
Longer Term Macroeconomic Outlook and Risks
The key to the long-term performance of the economy continues to depend on solid policy
action directed towards maximising the growth potential of the economy by maintaining
Irish competitiveness. Although the longer term outlook for the economy appears healthy,
this scenario is underpinned by the key assumption that Ireland is able to successfully
respond to the recent deterioration in competitiveness. Failure to deal with key
competitiveness issues would severely threaten the economic outlook over the coming years.
The longer-term growth potential of the economy is estimated to be around 5%, and
although this is well below the double-digit gains recorded over recent years, it is still
expected to strongly outpace EU average growth. In another economic scenario though,
growth could be much lower, particularly if there was a continued weakening of
competitiveness, or if productivity failed to become a stronger driver of growth. Specific
longer term risks to the economy are therefore:
• An unsettled macroeconomic environment with embedded high price inflation,
unsustainable wage growth and growing costs in other areas. Any return to sustained
budget deficits alongside a rising government burden would also present problems for the
longer term performance of the economy.
• The failure to address the infrastructural short-fall which continues to threaten the
longer-term growth potential of the economy.
• Failure to build on and adapt our successful competitiveness formula to new challenges,
particularly targeting policy towards niche industries, improving skills and fostering
innovation.
• A euro strengthening against sterling (most likely if the UK makes efforts to join EMU).
This will raise the effective exchange rate further.
• Increased global competition.
Irish Competitive Summary
The National Competitiveness Council defines competitiveness as “The ability to achieve
success in markets leading to better standards of living for all”. This report presents and
assesses a range of input indicators which underpin competitiveness under a variety of
headings:
• Labour Costs;
• Prices and Costs;
• Economic Policy, Government, and Regulation;
• Education and Skills;
• Information Society;
• Transport Infrastructure;
• Environment and Energy;
• Investment and Capital;
• R&D and Innovation; and,
• Productivity.
In this summary we review Ireland’s recent competitiveness performance on the international
stage, and highlight some of the key issues arising from this Report.
An
nu
al
Co
mp
eti
tiv
en
es
s R
epo
rt 2
00
2N
ati
on
al
Co
mp
eti
tiv
en
es
s C
ou
nc
il
viii
Labour Costs
Given Ireland’s previous productivity performance it was possible to sustain high wage
growth and rapidly rising wage levels while sustaining the economy’s competitiveness.
However, recent trends including those highlighted in this Report suggest that wage inflation
needs to be quickly moderated in line with weakening growth and productivity if
competitiveness, high growth and low unemployment are to be maintained. Projections from
the OECD show that Ireland has higher wage levels and inflation than most of its
competitors. Unit labour cost measures paint a similar weak picture, with Ireland having the
third highest growth of the countries considered. Wage costs, even when adjusted for
productivity, are therefore rising by more than Irelands competitors. Managing wage growth
in a way that it relates to the ability of enterprise to absorb the costs without damaging the
competitiveness position of the economy is a key challenge for policy-makers. This is only
likely to happen if accompanied in parallel by slower rises in consumer price inflation and
also by reductions in other cost pressures across the economy.
Prices and Costs
Other enterprise costs (excluding wages) are also important when assessing competitiveness.
Recent trends point to a sharp rise in a wide range of costs facing firms across the economy.
These cost pressures include rapid rises in insurance, property, telecommunications and
energy costs. The competitive position of exporting firms is also being undermined by the
recent strengthening of the effective exchange rate which had previously given an artificial
and temporary boost to competitiveness. Unfavourable exchange rate movements,
accompanied in parallel by rising wages and other cost increases, are therefore threatening
to place sharp upward pressure on export prices. Telecommunications costs are a key cost
for certain types of business and were assessed as part of this study. On the basis of the cost
of a basket of calls, both national and international, Ireland is ranked the 9th most expensive
out of 16 countries considered. Electricity is also crucial for competitiveness and one measure
reported reveals Irish firms face the second highest level of electricity costs of eight countries
surveyed. Unfortunately data for international insurance costs is not yet available although
data would be expected to confirm the high and rising insurance cost burden facing Irish
firms.
Economic Policy, Government and Regulation
The tax burden faced by employees and businesses is considered to be a key determinant of
competitiveness and was analysed in this study. Total tax revenue as a percentage of GDP is
equal to 29.2% which ranks Ireland as 3rd lowest out of 16 countries. This compares to an
average of 41.6% across the EU as a whole, and to 37.4% for all OECD countries.
Corporate and personal taxation burdens are also low in Ireland. Ireland has the lowest rate
of tax on corporate income. Japan currently has the highest rate at 42%, out of the sixteen
countries considered. From a competitiveness perspective Ireland is ranked highly on
this measure.
An
nu
al C
om
pe
titive
ne
ss R
epo
rt 20
02
Na
tion
al C
om
pe
titive
ne
ss
Co
un
cil
ix
Education and Skills
Investment in education is an important determinant of competitiveness and various
measures of human capital development were examined. One measure of the impact of
investment on education is the percentage of the population aged 25–34 that has attained at
least third level education. On the basis of this indicator Ireland is ranked in 8th place out
of 13 countries, with 29% of the 25-34 year old cohort having attained this level of
education. Japan is ranked first at 45%. This data dates to 1999 and given on-going
increases in third-level participation this percentage is set to increase over the coming years.
Further investment though is still needed if this driver of competitiveness is to be maximised
over the longer term.
Information Society
Investment in Information Society is also seen as important for future economic growth. A
range of competitiveness indicators have been accessed and analysed in relation to the
Information Society. These include indicators on broadband access, Internet usage, mobile
telephone and the extent of DSL. Ireland is ranked around mid-table based on a number of
measures. While progress has been rapid with significant investment in new technology,
further work is required if Ireland is to be amongst the leaders in these developments.
Transport Infrastructure
Higher than expected economic and population growth in recent years has placed
considerable strain on Ireland’s transport infrastructure. This infrastructure deficit is leading
to increased congestion and to concerns that future economic and social development will be
impaired unless the deficit is met. In assessing this and other issues in relation to transport,
a range of competitiveness indicators have been accessed and analysed which suggest that the
quality of Ireland’s infrastructure is weak and requires significant upgrading. That said,
significant progress has been made, and is continuing to be made, particularly in the Roads
and Public Transport projects around the Greater Dublin Area.
One indicator of the quality of our transport infrastructure measures the average speed of
business deliveries for a specified journey in capital cities expressed in minutes. While
information on this is weak, available data would suggest that Ireland is ranked last of eight
countries, with the longest speed of business delivery on average. Further detailed research
on this may be warranted.
Investment and Capital
Gross fixed capital formation measures total investment undertaken by the private and
public sector. Using this measure Ireland is ranked the 4th highest of the 16 countries
considered. Foreign Direct Investment (FDI) is an important element of this investment. In
terms of FDI flows as a percentage of GDP however, Ireland is ranked first out of the chosen
set of 16 countries. These indicators show the favourable competitiveness position of the
economy, however the recent decline in FDI indicates how quickly competitiveness can
change for a small open economy.
An
nu
al
Co
mp
eti
tiv
en
es
s R
epo
rt 2
00
2N
ati
on
al
Co
mp
eti
tiv
en
es
s C
ou
nc
il
x
R&D and Innovation
Ireland has benefited greatly over the past decade or so from the performance of high-tech
sectors. Spill-over effects from high-tech foreign enterprises have stimulated a range of new
technology-based firms in areas like software to add to traditional indigenous strengths in
the food-processing sector. The challenge now is to consolidate these advances at a time of
increasing uncertainty in world markets and to lay the groundwork for moving to a new
stage of industrial development. Ireland must intensify its commitment to Science,
Technology and Innovation by increasing its investment in Research & Development (R&D),
and by addressing the bottlenecks which limit our innovation capabilities.
While Ireland performs reasonably well in certain areas, for instance, in terms of the number
of science graduates at third level etc. it is evident that many concerns remain. Overall
research intensities are below international norms. Ireland is ranked just 11th out of 16
countries in terms of Gross Expenditure on R&D (percentage of GDP). An additional worry
is that almost two thirds of business sector R&D in Ireland is performed in foreign owned
industry.
Productivity
Available data shows that Ireland has experienced rapid labour productivity growth in recent
years which has far outpaced other major OECD countries. This rapid productivity growth
has allowed the level of output per employee to rise rapidly and be amongst the highest in
the OECD area. Measures of labour productivity levels place Ireland 4th out of 16 countries
reviewed. Data on productivity as measured in terms of US$ per hour worked rank Ireland
5th of the 16 countries considered. More recent trends though show a rapid deceleration in
productivity growth as economic activity slowed following recent global economic shocks.
Over the longer term, economic stability and equilibrium must be supported by real wage
growth staying in line with productivity gains. Another key area which policy must address
is the narrowing of the current wide productivity gap between the indigenous traditional
sectors and largely high tech foreign owned sectors.
Balanced Regional Development
Balanced regional development is a crucial element of economic and industrial policy.
Though there has been significant economic and social progress, the distribution of this
progress is now a key issue with the emergence of significant regional disparities. In
particular there are concerns about increased urbanisation and the excessive growth and
development of the mid-east region. Urban sprawl, traffic congestion, and infrastructure
problems are affecting the economic competitiveness of the mid-east region in particular.
A key competitiveness challenge is to achieve more balanced regional development, and this
is one of the issues to be addressed in the forthcoming National Spatial Strategy document.
The difficulties in altering established economic concentrations will require determined and
innovative policies.
An
nu
al C
om
pe
titive
ne
ss R
epo
rt 20
02
Na
tion
al C
om
pe
titive
ne
ss
Co
un
cil
xi
Sectoral Performance
The impressive performance of the macro economy masks significant differences in sectoral
performance. Ireland’s traded manufacturing sector comprises a low productivity traditional
sector, which is generally Irish owned and which serves the domestic and UK markets. It also
includes a modern or high technology sector, which is predominately foreign-owned and
which serves the wider European market. These leading sectors tend to have high
productivity as measured by output per person.
Trends in employment provide a useful indicator of the relative performance of these sectors
and the different competitiveness challenges that they face. Traditional manufacturing
employment remained unchanged over the period 1995-2000, while the food-processing
sector showed modest growth. In contrast, employment in high technology sectors expanded
rapidly. These significant differences in performance present a challenge particularly for
pay policy.
An
nu
al
Co
mp
eti
tiv
en
es
s R
epo
rt 2
00
2N
ati
on
al
Co
mp
eti
tiv
en
es
s C
ou
nc
il
xii
Address by An Taoiseach iii
Preface iv
Key Findings v
Economic Summary vi
1 Competitiveness Framework 1
1.1 Definition of Competitiveness 2
1.2 Approach Taken to Measuring Competitiveness: Input-Output Approach 2
1.3 Headline Indicators 4
1.4 Comparator Countries 6
1.5 Limitations of Competitiveness Benchmarking 6
2 Business Environment 7
2.1 Labour Costs 9
2.2 Costs and Prices 13
2.3 Economic Policy, Government and Regulation 17
3 Socio-Economic Environment 21
3.1 Education and Skills 23
3.2 Information Society 27
3.3 Transport Infrastructure 32
3.4 Environment and Energy 36
3.5 Social Capital 40
4 Enterprise, R&D and Innovation 41
4.1 Investment and Capital 43
4.2 R&D and Innovation 47
4.3 Productivity 51
5 Outputs 55
5.1 Macroeconomic Performance 57
5.2 Internationalisation 62
6 Spatial Aspects of Competitiveness 63
7 Sectoral Aspects of Competitiveness 73
Annex 1 Detailed Tables 79
Contents
An
nu
al C
om
pe
titive
ne
ss R
epo
rt 20
02
Na
tion
al C
om
pe
titive
ne
ss
Co
un
cil
xiii
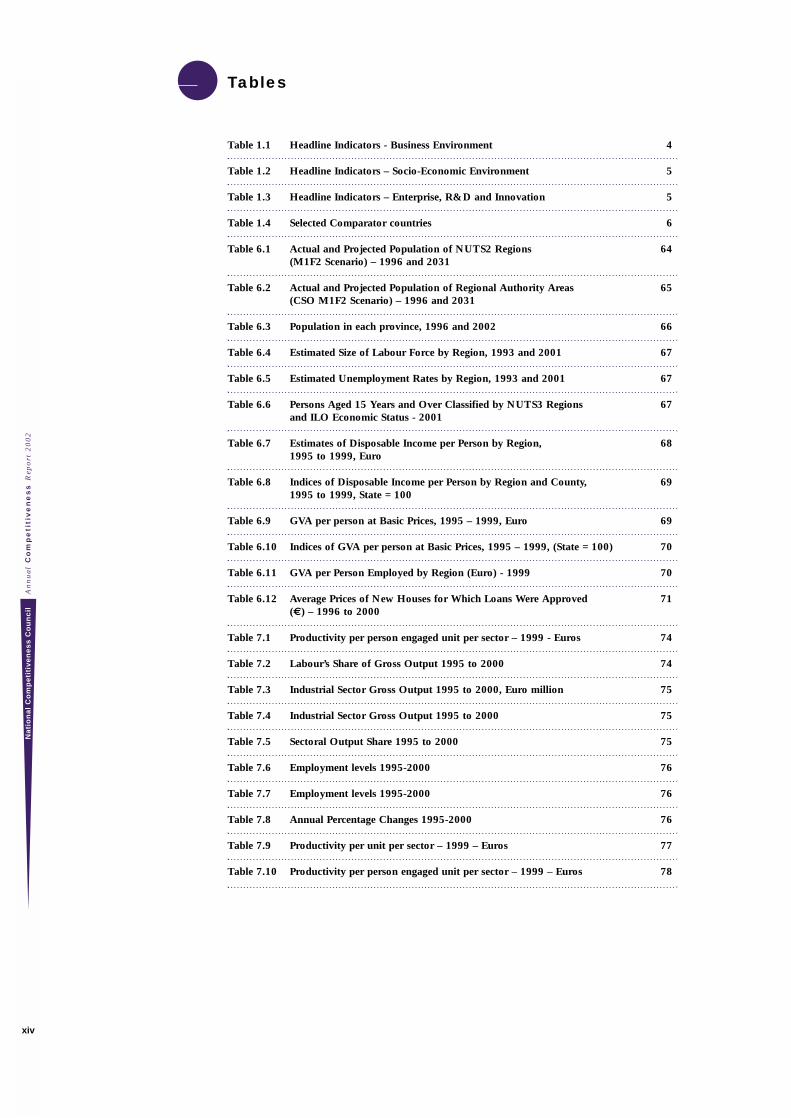
Table 1.1 Headline Indicators - Business Environment 4
Table 1.2 Headline Indicators – Socio-Economic Environment 5
Table 1.3 Headline Indicators – Enterprise, R&D and Innovation 5
Table 1.4 Selected Comparator countries 6
Table 6.1 Actual and Projected Population of NUTS2 Regions 64
(M1F2 Scenario) – 1996 and 2031
Table 6.2 Actual and Projected Population of Regional Authority Areas 65
(CSO M1F2 Scenario) – 1996 and 2031
Table 6.3 Population in each province, 1996 and 2002 66
Table 6.4 Estimated Size of Labour Force by Region, 1993 and 2001 67
Table 6.5 Estimated Unemployment Rates by Region, 1993 and 2001 67
Table 6.6 Persons Aged 15 Years and Over Classified by NUTS3 Regions 67
and ILO Economic Status - 2001
Table 6.7 Estimates of Disposable Income per Person by Region, 68
1995 to 1999, Euro
Table 6.8 Indices of Disposable Income per Person by Region and County, 69
1995 to 1999, State = 100
Table 6.9 GVA per person at Basic Prices, 1995 – 1999, Euro 69
Table 6.10 Indices of GVA per person at Basic Prices, 1995 – 1999, (State = 100) 70
Table 6.11 GVA per Person Employed by Region (Euro) - 1999 70
Table 6.12 Average Prices of New Houses for Which Loans Were Approved 71
(€) – 1996 to 2000
Table 7.1 Productivity per person engaged unit per sector – 1999 - Euros 74
Table 7.2 Labour’s Share of Gross Output 1995 to 2000 74
Table 7.3 Industrial Sector Gross Output 1995 to 2000, Euro million 75
Table 7.4 Industrial Sector Gross Output 1995 to 2000 75
Table 7.5 Sectoral Output Share 1995 to 2000 75
Table 7.6 Employment levels 1995-2000 76
Table 7.7 Employment levels 1995-2000 76
Table 7.8 Annual Percentage Changes 1995-2000 76
Table 7.9 Productivity per unit per sector – 1999 – Euros 77
Table 7.10 Productivity per person engaged unit per sector – 1999 – Euros 78
Tables
An
nu
al
Co
mp
eti
tiv
en
es
s R
epo
rt 2
00
2N
ati
on
al
Co
mp
eti
tiv
en
es
s C
ou
nc
il
xiv
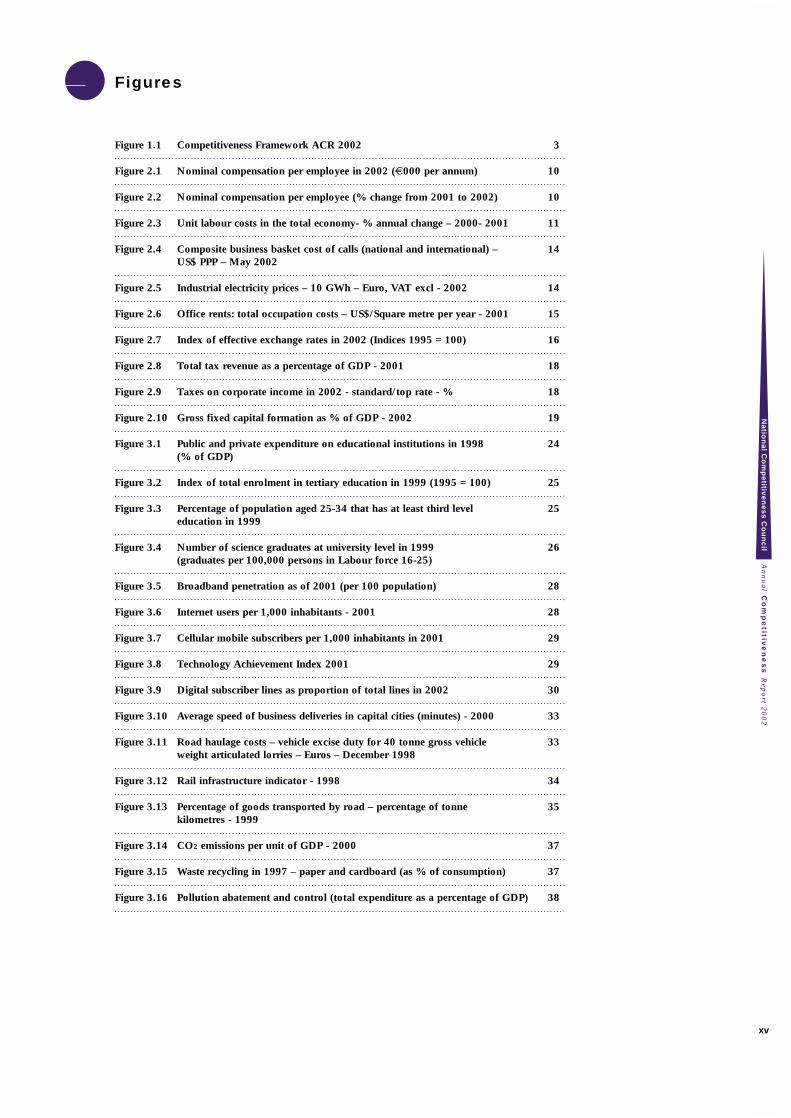
Figure 1.1 Competitiveness Framework ACR 2002 3
Figure 2.1 Nominal compensation per employee in 2002 (€000 per annum) 10
Figure 2.2 Nominal compensation per employee (% change from 2001 to 2002) 10
Figure 2.3 Unit labour costs in the total economy- % annual change – 2000- 2001 11
Figure 2.4 Composite business basket cost of calls (national and international) – 14
US$ PPP – May 2002
Figure 2.5 Industrial electricity prices – 10 GWh – Euro, VAT excl - 2002 14
Figure 2.6 Office rents: total occupation costs – US$/Square metre per year - 2001 15
Figure 2.7 Index of effective exchange rates in 2002 (Indices 1995 = 100) 16
Figure 2.8 Total tax revenue as a percentage of GDP - 2001 18
Figure 2.9 Taxes on corporate income in 2002 - standard/top rate - % 18
Figure 2.10 Gross fixed capital formation as % of GDP - 2002 19
Figure 3.1 Public and private expenditure on educational institutions in 1998 24
(% of GDP)
Figure 3.2 Index of total enrolment in tertiary education in 1999 (1995 = 100) 25
Figure 3.3 Percentage of population aged 25-34 that has at least third level 25
education in 1999
Figure 3.4 Number of science graduates at university level in 1999 26
(graduates per 100,000 persons in Labour force 16-25)
Figure 3.5 Broadband penetration as of 2001 (per 100 population) 28
Figure 3.6 Internet users per 1,000 inhabitants - 2001 28
Figure 3.7 Cellular mobile subscribers per 1,000 inhabitants in 2001 29
Figure 3.8 Technology Achievement Index 2001 29
Figure 3.9 Digital subscriber lines as proportion of total lines in 2002 30
Figure 3.10 Average speed of business deliveries in capital cities (minutes) - 2000 33
Figure 3.11 Road haulage costs – vehicle excise duty for 40 tonne gross vehicle 33
weight articulated lorries – Euros – December 1998
Figure 3.12 Rail infrastructure indicator - 1998 34
Figure 3.13 Percentage of goods transported by road – percentage of tonne 35
kilometres - 1999
Figure 3.14 CO2 emissions per unit of GDP - 2000 37
Figure 3.15 Waste recycling in 1997 – paper and cardboard (as % of consumption) 37
Figure 3.16 Pollution abatement and control (total expenditure as a percentage of GDP) 38
Figures
An
nu
al C
om
pe
titive
ne
ss R
epo
rt 20
02
Na
tion
al C
om
pe
titive
ne
ss
Co
un
cil
xv
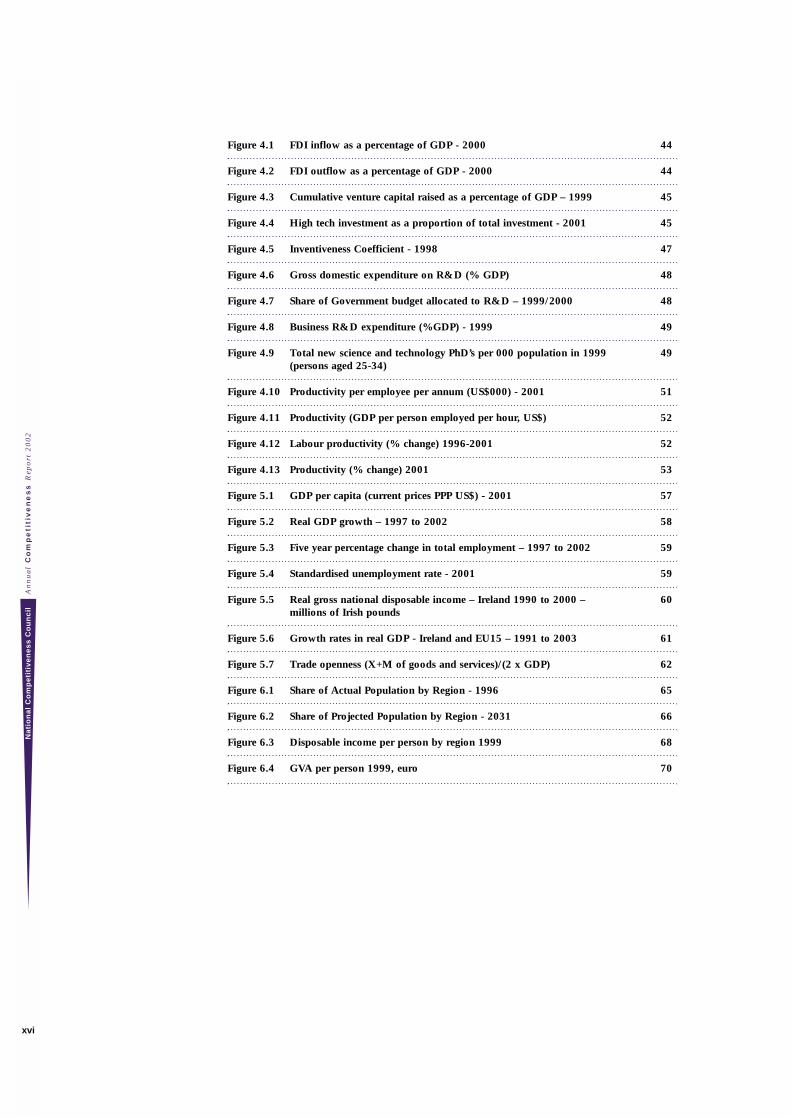
Figure 4.1 FDI inflow as a percentage of GDP - 2000 44
Figure 4.2 FDI outflow as a percentage of GDP - 2000 44
Figure 4.3 Cumulative venture capital raised as a percentage of GDP – 1999 45
Figure 4.4 High tech investment as a proportion of total investment - 2001 45
Figure 4.5 Inventiveness Coefficient - 1998 47
Figure 4.6 Gross domestic expenditure on R&D (% GDP) 48
Figure 4.7 Share of Government budget allocated to R&D – 1999/2000 48
Figure 4.8 Business R&D expenditure (%GDP) - 1999 49
Figure 4.9 Total new science and technology PhD’s per 000 population in 1999 49
(persons aged 25-34)
Figure 4.10 Productivity per employee per annum (US$000) - 2001 51
Figure 4.11 Productivity (GDP per person employed per hour, US$) 52
Figure 4.12 Labour productivity (% change) 1996-2001 52
Figure 4.13 Productivity (% change) 2001 53
Figure 5.1 GDP per capita (current prices PPP US$) - 2001 57
Figure 5.2 Real GDP growth – 1997 to 2002 58
Figure 5.3 Five year percentage change in total employment – 1997 to 2002 59
Figure 5.4 Standardised unemployment rate - 2001 59
Figure 5.5 Real gross national disposable income – Ireland 1990 to 2000 – 60
millions of Irish pounds
Figure 5.6 Growth rates in real GDP - Ireland and EU15 – 1991 to 2003 61
Figure 5.7 Trade openness (X+M of goods and services)/(2 x GDP) 62
Figure 6.1 Share of Actual Population by Region - 1996 65
Figure 6.2 Share of Projected Population by Region - 2031 66
Figure 6.3 Disposable income per person by region 1999 68
Figure 6.4 GVA per person 1999, euro 70
An
nu
al
Co
mp
eti
tiv
en
es
s R
epo
rt 2
00
2N
ati
on
al
Co
mp
eti
tiv
en
es
s C
ou
nc
il
xvi

1Competitiveness Framework
1. Competitiveness Framework
1.1 Definition of Competitiveness
The literature on competitiveness supplies a wide variety of definitions of the term. One of
the most straightforward definitions, supplied by the World Economic Forum, is that
competitiveness is the ability of a country to achieve sustained high rates of growth in GDP
per capita. A similar but more detailed definition, supplied by the OECD, is that
competitiveness is the degree to which a nation can, under free trade and fair market
conditions, produce goods and services which meet the test of international markets, while
simultaneously maintaining and expanding the real incomes of its people over the long-term.
The definition favoured by the National Competitiveness Council is that competitiveness
is the ability to achieve success in markets leading to better standards of living for all.
The approach taken in this report to measuring competitiveness is based on this definition.
Competitiveness is something that is important at a range of levels, from the level of the
individual firm to the level of an industry and from the level of a small local region to the
level of an association of nation states. The National Competitiveness Council is concerned
with the country as a whole, with promoting the success in national and international
markets of the enterprise sector overall and with the ultimate objective of promoting
improved standards of living for all people in the country. However, for the first time this
Report also includes a number of regional aspects of competitiveness.
1.2 Approach Taken to Measuring Competitiveness:
Input-Output Approach
The approach taken in this year’s Annual Competitiveness Report consists of an input-output
framework to assessing competitiveness. This report presents and assesses a range of input
indicators, under a variety of headings, namely:
• Labour Costs;
• Costs and Prices;
• Economic Policy, Government, and Regulation;
• Education and Skills;
• Information Society;
• Transport Infrastructure;
• Environment and Energy;
• Social Capital;
• Investment and Capital;
• R&D and Innovation; and,
• Productivity.
These sets of input indicators provide an indication of the level of competitiveness in the
economy. A range of national performance indicators are then considered as resultant output
indicators of competitiveness, under the broad headings:
• Macroeconomic Performance; and,
• Internationalisation.
This overall approach is represented in Figure 1.1.
An
nu
al
Co
mp
eti
tiv
en
es
s R
epo
rt 2
00
2N
ati
on
al
Co
mp
eti
tiv
en
es
s C
ou
nc
il
2
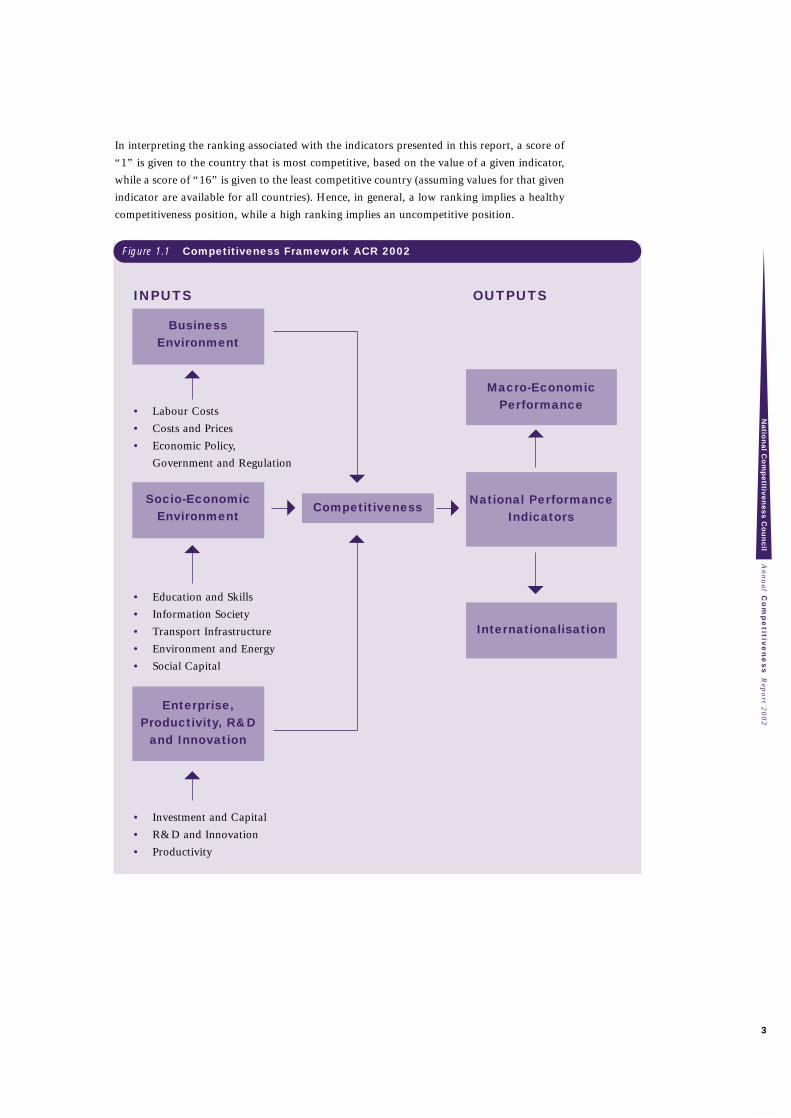
In interpreting the ranking associated with the indicators presented in this report, a score of
“1” is given to the country that is most competitive, based on the value of a given indicator,
while a score of “16” is given to the least competitive country (assuming values for that given
indicator are available for all countries). Hence, in general, a low ranking implies a healthy
competitiveness position, while a high ranking implies an uncompetitive position.
Figure 1.1 Competitiveness Framework ACR 2002
INPUTS OUTPUTS
• Labour Costs
• Costs and Prices
• Economic Policy,
Government and Regulation
• Education and Skills
• Information Society
• Transport Infrastructure
• Environment and Energy
• Social Capital
• Investment and Capital
• R&D and Innovation
• Productivity
An
nu
al C
om
pe
titive
ne
ss R
epo
rt 20
02
Na
tion
al C
om
pe
titive
ne
ss
Co
un
cil
3
BusinessEnvironment
Socio-EconomicEnvironment
Competitiveness
Enterprise,Productivity, R&D
and Innovation
National PerformanceIndicators
Macro-EconomicPerformance
Internationalisation
1.3 Headline Indicators
A total of 144 indicators relating to competitiveness are considered in this report. In order
to present a concise and accurate reflection of Ireland’s relative competitiveness, a number of
key or headline indicators have been selected for more detailed analysis in the main body of
the report. The remaining indicators are discussed briefly at section ends and presented in the
annexes.
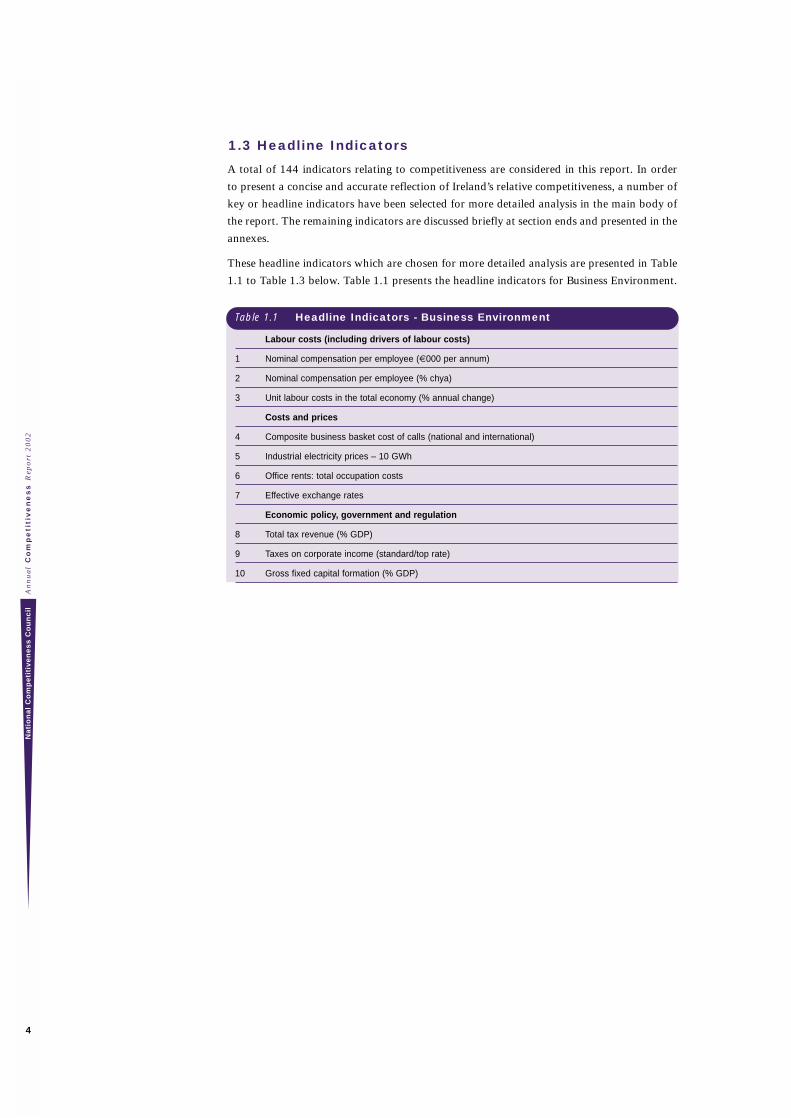
These headline indicators which are chosen for more detailed analysis are presented in Table
1.1 to Table 1.3 below. Table 1.1 presents the headline indicators for Business Environment.
Table 1.1 Headline Indicators - Business Environment
Labour costs (including drivers of labour costs)
1 Nominal compensation per employee (€000 per annum)
2 Nominal compensation per employee (% chya)
3 Unit labour costs in the total economy (% annual change)
Costs and prices
4 Composite business basket cost of calls (national and international)
5 Industrial electricity prices – 10 GWh
6 Office rents: total occupation costs
7 Effective exchange rates
Economic policy, government and regulation
8 Total tax revenue (% GDP)
9 Taxes on corporate income (standard/top rate)
10 Gross fixed capital formation (% GDP)
An
nu
al
Co
mp
eti
tiv
en
es
s R
epo
rt 2
00
2N
ati
on
al
Co
mp
eti
tiv
en
es
s C
ou
nc
il
4
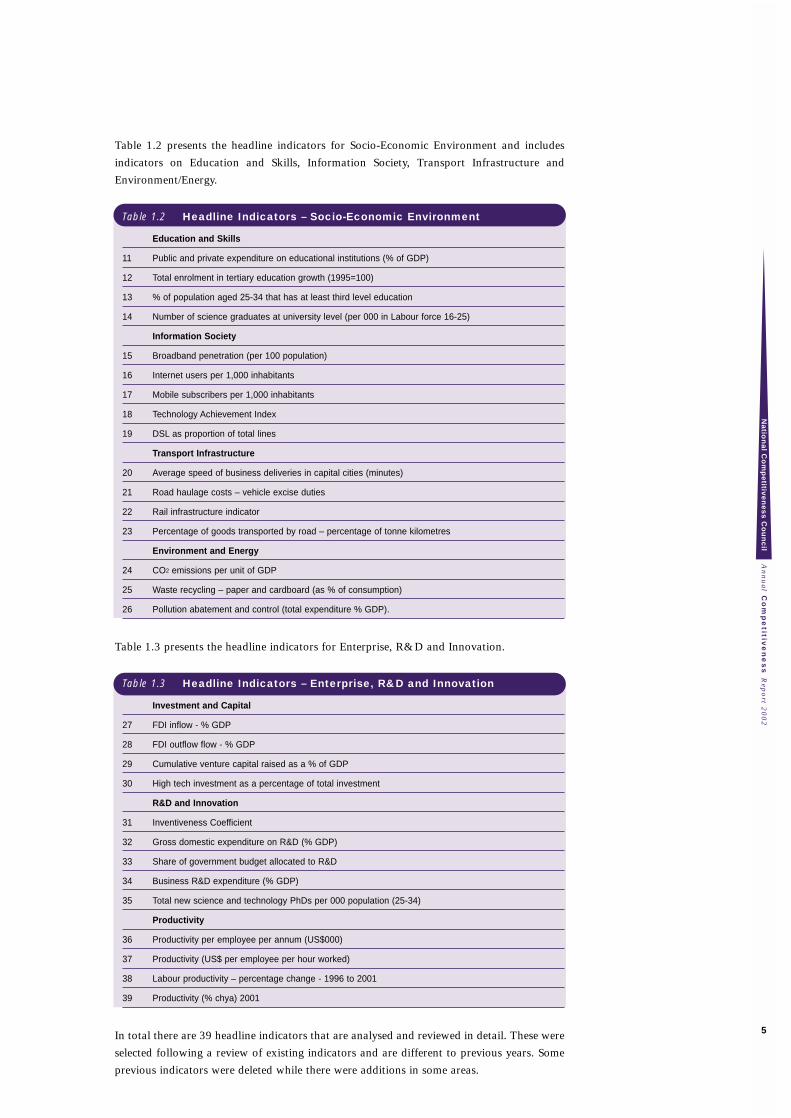
Table 1.2 presents the headline indicators for Socio-Economic Environment and includes
indicators on Education and Skills, Information Society, Transport Infrastructure and
Environment/Energy.
Table 1.2 Headline Indicators – Socio-Economic Environment
Education and Skills
11 Public and private expenditure on educational institutions (% of GDP)
12 Total enrolment in tertiary education growth (1995=100)
13 % of population aged 25-34 that has at least third level education
14 Number of science graduates at university level (per 000 in Labour force 16-25)
Information Society
15 Broadband penetration (per 100 population)
16 Internet users per 1,000 inhabitants
17 Mobile subscribers per 1,000 inhabitants
18 Technology Achievement Index
19 DSL as proportion of total lines
Transport Infrastructure
20 Average speed of business deliveries in capital cities (minutes)
21 Road haulage costs – vehicle excise duties
22 Rail infrastructure indicator
23 Percentage of goods transported by road – percentage of tonne kilometres
Environment and Energy
24 CO2 emissions per unit of GDP
25 Waste recycling – paper and cardboard (as % of consumption)
26 Pollution abatement and control (total expenditure % GDP).
Table 1.3 presents the headline indicators for Enterprise, R&D and Innovation.
Table 1.3 Headline Indicators – Enterprise, R&D and Innovation
Investment and Capital
27 FDI inflow - % GDP
28 FDI outflow flow - % GDP
29 Cumulative venture capital raised as a % of GDP
30 High tech investment as a percentage of total investment
R&D and Innovation
31 Inventiveness Coefficient
32 Gross domestic expenditure on R&D (% GDP)
33 Share of government budget allocated to R&D
34 Business R&D expenditure (% GDP)
35 Total new science and technology PhDs per 000 population (25-34)
Productivity
36 Productivity per employee per annum (US$000)
37 Productivity (US$ per employee per hour worked)
38 Labour productivity – percentage change - 1996 to 2001
39 Productivity (% chya) 2001
In total there are 39 headline indicators that are analysed and reviewed in detail. These were
selected following a review of existing indicators and are different to previous years. Some
previous indicators were deleted while there were additions in some areas.
An
nu
al C
om
pe
titive
ne
ss R
epo
rt 20
02
Na
tion
al C
om
pe
titive
ne
ss
Co
un
cil
5
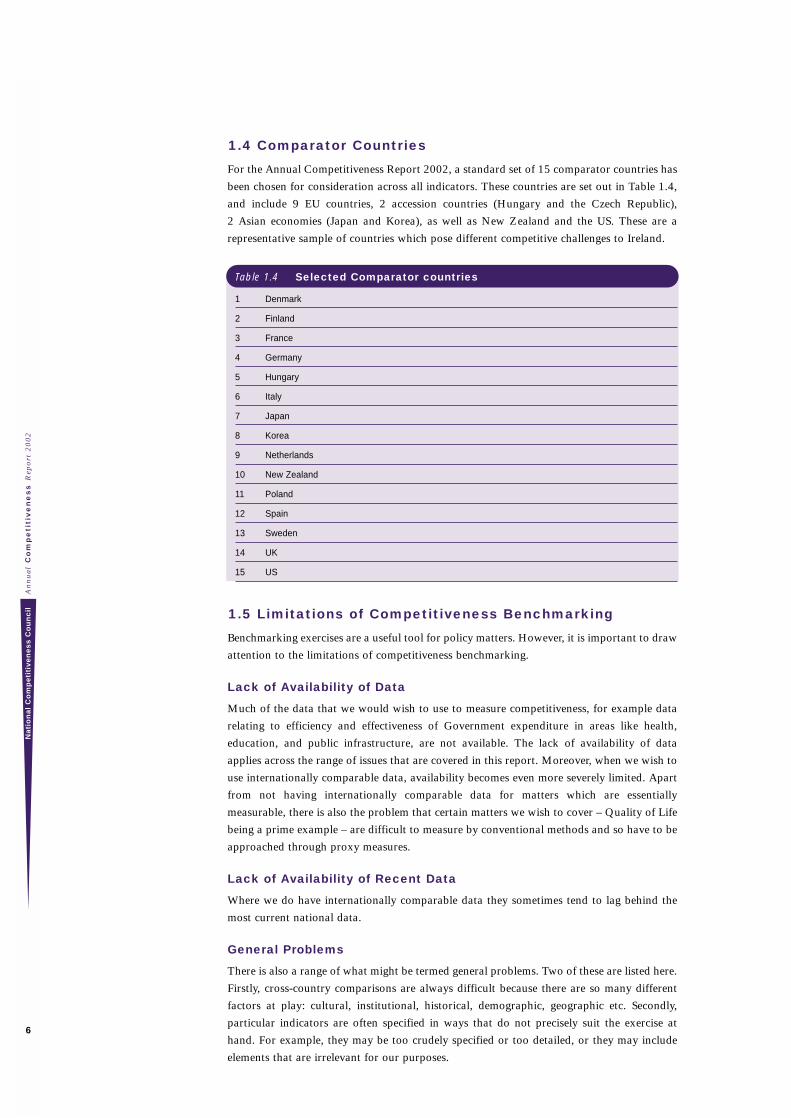
1.4 Comparator Countries
For the Annual Competitiveness Report 2002, a standard set of 15 comparator countries has
been chosen for consideration across all indicators. These countries are set out in Table 1.4,
and include 9 EU countries, 2 accession countries (Hungary and the Czech Republic),
2 Asian economies (Japan and Korea), as well as New Zealand and the US. These are a
representative sample of countries which pose different competitive challenges to Ireland.
Table 1.4 Selected Comparator countries
1 Denmark
2 Finland
3 France
4 Germany
5 Hungary
6 Italy
7 Japan
8 Korea
9 Netherlands
10 New Zealand
11 Poland
12 Spain
13 Sweden
14 UK
15 US
1.5 Limitations of Competitiveness Benchmarking
Benchmarking exercises are a useful tool for policy matters. However, it is important to draw
attention to the limitations of competitiveness benchmarking.
Lack of Availability of Data
Much of the data that we would wish to use to measure competitiveness, for example data
relating to efficiency and effectiveness of Government expenditure in areas like health,
education, and public infrastructure, are not available. The lack of availability of data
applies across the range of issues that are covered in this report. Moreover, when we wish to
use internationally comparable data, availability becomes even more severely limited. Apart
from not having internationally comparable data for matters which are essentially
measurable, there is also the problem that certain matters we wish to cover – Quality of Life
being a prime example – are difficult to measure by conventional methods and so have to be
approached through proxy measures.
Lack of Availability of Recent Data
Where we do have internationally comparable data they sometimes tend to lag behind the
most current national data.
General Problems
There is also a range of what might be termed general problems. Two of these are listed here.
Firstly, cross-country comparisons are always difficult because there are so many different
factors at play: cultural, institutional, historical, demographic, geographic etc. Secondly,
particular indicators are often specified in ways that do not precisely suit the exercise at
hand. For example, they may be too crudely specified or too detailed, or they may include
elements that are irrelevant for our purposes.
An
nu
al
Co
mp
eti
tiv
en
es
s R
epo
rt 2
00
2N
ati
on
al
Co
mp
eti
tiv
en
es
s C
ou
nc
il
6

Business Environment2
2 Business Environment
This section considers indicators relating to the competitiveness of the business environment.
This is a natural starting point in our input-output approach to assessing competitiveness,
since the competitiveness of a firm is affected by both labour and non-labour costs.
Economic policy, government and regulation will also directly impact on the competitiveness
of the business environment and these are also considered in this section.
Despite a slowing economy the business environment in Ireland remains positive. There are
however, concerns about rising costs which if not addressed have the capacity to undermine
future economic performance. These concerns particularly relate to labour costs where
increases have been exceeding those of our main trading partners. There have also been
significant increases in the costs of certain services. This reflects increases in the costs of
labour but also a lack of competition in some sectors that needs to be addressed. Finally,
overall government tax and regulation policy supports competitiveness. The tax burden is
currently low and very supportive for competitiveness. However, there are regulatory and
competition issues in some sectors.
Hence, the indicators under this heading cover three main areas, namely:
• Labour Costs (including drivers of labour costs);
• Costs and Prices; and,
• Economic Policy, Government and Regulation.
An
nu
al
Co
mp
eti
tiv
en
es
s R
epo
rt 2
00
2N
ati
on
al
Co
mp
eti
tiv
en
es
s C
ou
nc
il
8
2.1 Labour Costs
Labour costs as an indicator can be viewed in two ways. Firstly, and from the point of view
of competitiveness, lower labour costs are seen as having a positive impact. On the other
hand, labour costs reflect what employees earn, in turn reflecting the overall standard of
living. The overall objective of policy is to improve living standards. Accordingly, higher
sustainable wage levels and improved quality of life are the objective of policies to improve
competitiveness.
In assessing Ireland’s relative competitiveness position, we present three headline indicators:
• Nominal compensation per employee (€000 per annum);
• Nominal compensation per employee (% change 2001 to 2002); and,
• Unit labour costs in the total economy (% annual change).
Furthermore, a number of additional indicators are assessed:
• Unit labour costs in the total economy – projected % annual change 2001 to 2002;
• Unit labour costs in the total economy – projected % annual change 2002 to 2003;
• Hourly compensation costs for production workers (manufacturing);
• Nominal compensation per employee (% change 2002 to 2003)
• Working days lost per 1,000 inhabitants per year due to industrial disputes;
• Cost of living index;
• Cost of housing index;
• Average annual percentage change in nationwide house prices from 1980 to 2002;
• Urban house prices as a multiple of personal disposable income per head.
Thus, the focus is on a range of labour and non-labour cost indicators.
Nominal compensation per employee (€000 per annum)
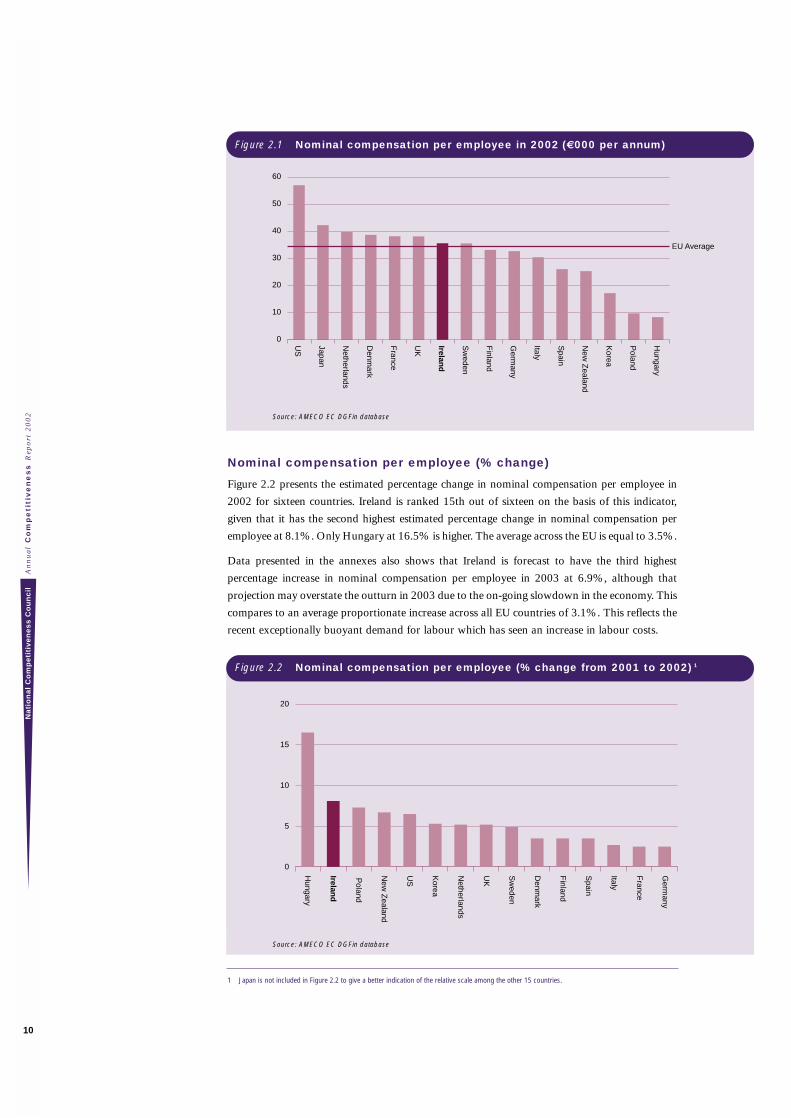
Figure 2.1 presents the latest available data on nominal compensation per employee. The
data is presented in thousands of euro per annum and is taken from the AMECO EC DGFin
database, and relates to estimated 2002 figures. This relates to the level of wages in contrast
to the next indicator which examins annual changes.
Nominal compensation costs per employee are estimated by the European commission at
€35,590 in 2002, ranking Ireland as 7th highest out of the sixteen countries considered.
Average nominal compensation per employee in the EU is equal to €33,810. Thus, Irish
employees are now amongst the better paid in the EU and earn more than the EU average.
By 2003, nominal compensation levels per employee in Ireland are forecast by the
Commission to be 13% higher than the EMU12 average. This could have adverse pressures
on competitiveness unless supported by higher productivity per person employed.
An
nu
al C
om
pe
titive
ne
ss R
epo
rt 20
02
Na
tion
al C
om
pe
titive
ne
ss
Co
un
cil
9
An
nu
al
Co
mp
eti
tiv
en
es
s R
epo
rt 2
00
2N
ati
on
al
Co
mp
eti
tiv
en
es
s C
ou
nc
il
10
1 Japan is not included in Figure 2.2 to give a better indication of the relative scale among the other 15 countries.
Figure 2.1 Nominal compensation per employee in 2002 (€000 per annum)
Source: AMECO EC DGFin database
Nominal compensation per employee (% change)
Figure 2.2 presents the estimated percentage change in nominal compensation per employee in
2002 for sixteen countries. Ireland is ranked 15th out of sixteen on the basis of this indicator,
given that it has the second highest estimated percentage change in nominal compensation per
employee at 8.1%. Only Hungary at 16.5% is higher. The average across the EU is equal to 3.5%.
Data presented in the annexes also shows that Ireland is forecast to have the third highest
percentage increase in nominal compensation per employee in 2003 at 6.9%, although that
projection may overstate the outturn in 2003 due to the on-going slowdown in the economy. This
compares to an average proportionate increase across all EU countries of 3.1%. This reflects the
recent exceptionally buoyant demand for labour which has seen an increase in labour costs.
Source: AMECO EC DGFin database
0
10
20
30
40
50
60
Hungary
Poland
Korea
New
Zealand
Spain
Italy
Germ
any
Finland
Sw
eden
Ireland
UK
France
Denm
ark
Netherlands
Japan
US
EU Average
Figure 2.2 Nominal compensation per employee (% change from 2001 to 2002) 1
Germ
any
France
Italy
Spain
Finland
Denm
ark
Sw
eden
UK
Netherlands
Korea
US
New
Zealand
Poland
Ireland
Hungary
0
5
10
15
20
Unit labour costs in the total economy (% annual change)
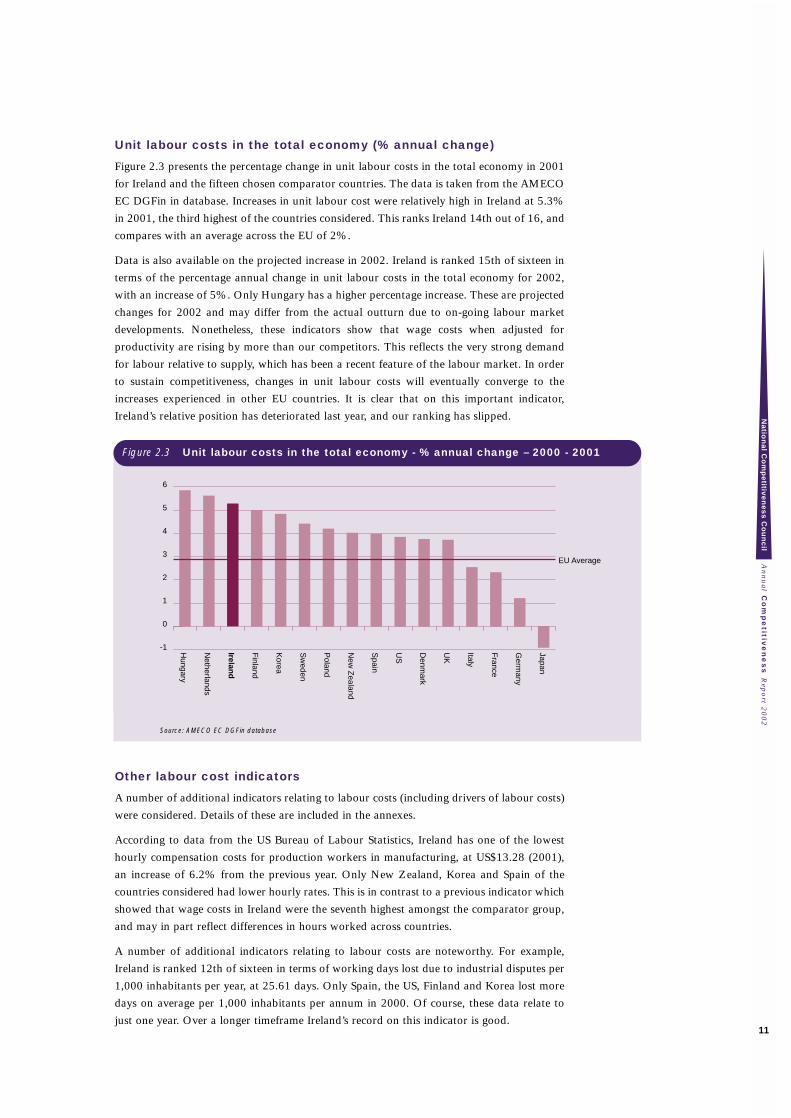
Figure 2.3 presents the percentage change in unit labour costs in the total economy in 2001
for Ireland and the fifteen chosen comparator countries. The data is taken from the AMECO
EC DGFin in database. Increases in unit labour cost were relatively high in Ireland at 5.3%
in 2001, the third highest of the countries considered. This ranks Ireland 14th out of 16, and
compares with an average across the EU of 2%.
Data is also available on the projected increase in 2002. Ireland is ranked 15th of sixteen in
terms of the percentage annual change in unit labour costs in the total economy for 2002,
with an increase of 5%. Only Hungary has a higher percentage increase. These are projected
changes for 2002 and may differ from the actual outturn due to on-going labour market
developments. Nonetheless, these indicators show that wage costs when adjusted for
productivity are rising by more than our competitors. This reflects the very strong demand
for labour relative to supply, which has been a recent feature of the labour market. In order
to sustain competitiveness, changes in unit labour costs will eventually converge to the
increases experienced in other EU countries. It is clear that on this important indicator,
Ireland’s relative position has deteriorated last year, and our ranking has slipped.
Source: AMECO EC DGFin database
Other labour cost indicators
A number of additional indicators relating to labour costs (including drivers of labour costs)
were considered. Details of these are included in the annexes.
According to data from the US Bureau of Labour Statistics, Ireland has one of the lowest
hourly compensation costs for production workers in manufacturing, at US$13.28 (2001),
an increase of 6.2% from the previous year. Only New Zealand, Korea and Spain of the
countries considered had lower hourly rates. This is in contrast to a previous indicator which
showed that wage costs in Ireland were the seventh highest amongst the comparator group,
and may in part reflect differences in hours worked across countries.
A number of additional indicators relating to labour costs are noteworthy. For example,
Ireland is ranked 12th of sixteen in terms of working days lost due to industrial disputes per
1,000 inhabitants per year, at 25.61 days. Only Spain, the US, Finland and Korea lost more
days on average per 1,000 inhabitants per annum in 2000. Of course, these data relate to
just one year. Over a longer timeframe Ireland’s record on this indicator is good.
An
nu
al C
om
pe
titive
ne
ss R
epo
rt 20
02
Na
tion
al C
om
pe
titive
ne
ss
Co
un
cil
11
Figure 2.3 Unit labour costs in the total economy - % annual change – 2000 - 2001
-1
0
1
2
3
4
5
6
EU Average
Japan
Germ
any
France
Italy
UK
Denm
ark
US
Spain
New
Zealand
Poland
Sw
eden
Korea
Finland
Ireland
Netherlands
Hungary
A cost of living index ranks Ireland as the 12th most expensive out of our set of sixteen
countries in 2001, while a cost of housing index ranks Ireland as 12th most expensive in
2000 (this index considers the cost of a three-room apartment). The Economist House-Price
Index implies that house prices in Ireland grew by 9.5% per annum on average over the
period from 1980 to 2002, the second highest of ten countries considered. Only Spain was
ranked worse on the basis of this indicator. In fact, as of 1999, urban house prices as a
multiple of personal disposable income per capita had reached a multiple of 18.2 in Ireland.
This ranks Ireland as 3rd worst of 11 countries for which comparable data is available on
the affordability of urban housing.
It would also be interesting to include data on the actual level of house prices. Unfortunately,
comparative data on housing costs across countries are not available, but it is apparent that
housing costs in Ireland, most notably in Dublin, are amongst the highest in the OECD area.
This mainly reflects improvements in living standards, but issues about affordability for some
groups and high debt-to-income levels are of increasing concern.
Overall, the indicators of labour costs show cause for concern.
An
nu
al
Co
mp
eti
tiv
en
es
s R
epo
rt 2
00
2N
ati
on
al
Co
mp
eti
tiv
en
es
s C
ou
nc
il
12
2.2 Costs and Prices
As well as labour costs, the competitiveness of individual firms is also a function of non-
labour enterprise costs and prices. For example, a number of costs and prices are important
for competitiveness including:
• Telecommunications costs;
• Energy costs; and,
• Property costs.
This section considers a number of non-labour enterprise costs and prices, including the
following headline indicators:
• Composite business basket cost of calls (national and international);
• Industrial electricity prices – 10 GWh;
• Office rents: total occupation costs;
• Effective exchange rates.
An additional set of cost and price indicators are also analysed:
• National leased line prices – 2mb/s, 2 km circuits;
• Fixed-to-fixed interconnection cost (national) cents per minute;
• Fixed-to-fixed interconnection charges for call termination on fixed network –
local level;
• Cost of internet use (30 mins peak rate);
• OECD business basket cost of calls;
• International fixed telephone costs;
• Automotive diesel oil prices for commercial use (US$/toe);
• Gas prices – Industrial Rate (exc VAT 4186 GJ/200 days);
• Absolute interest rate spread - % points.
Regrettably data for insurance costs is not yet available on an international basis, although
they would be expected to confirm the high and rising insurance cost burden facing Irish
firms compared to major competitors.
An
nu
al C
om
pe
titive
ne
ss R
epo
rt 20
02
Na
tion
al C
om
pe
titive
ne
ss
Co
un
cil
13
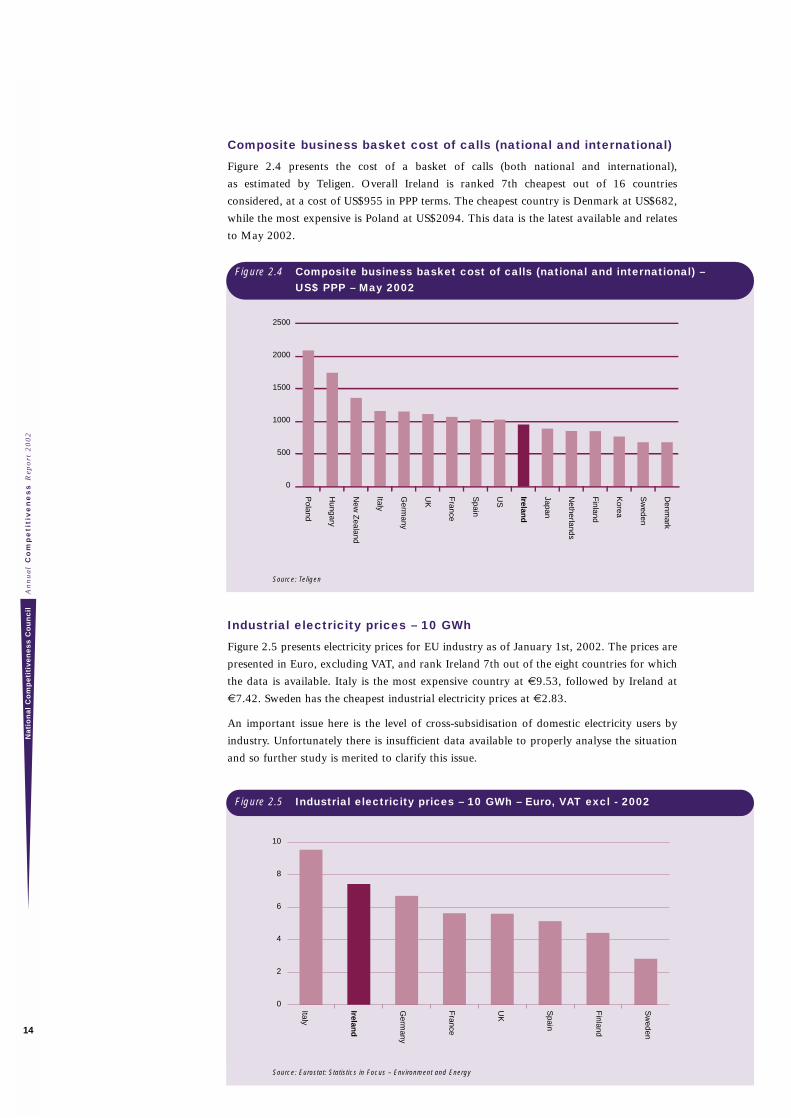
Composite business basket cost of calls (national and international)
Figure 2.4 presents the cost of a basket of calls (both national and international),
as estimated by Teligen. Overall Ireland is ranked 7th cheapest out of 16 countries
considered, at a cost of US$955 in PPP terms. The cheapest country is Denmark at US$682,
while the most expensive is Poland at US$2094. This data is the latest available and relates
to May 2002.
Source: Teligen
Industrial electricity prices – 10 GWh
Figure 2.5 presents electricity prices for EU industry as of January 1st, 2002. The prices are
presented in Euro, excluding VAT, and rank Ireland 7th out of the eight countries for which
the data is available. Italy is the most expensive country at €9.53, followed by Ireland at
€7.42. Sweden has the cheapest industrial electricity prices at €2.83.
An important issue here is the level of cross-subsidisation of domestic electricity users by
industry. Unfortunately there is insufficient data available to properly analyse the situation
and so further study is merited to clarify this issue.
Source: Eurostat: Statistics in Focus – Environment and Energy
An
nu
al
Co
mp
eti
tiv
en
es
s R
epo
rt 2
00
2N
ati
on
al
Co
mp
eti
tiv
en
es
s C
ou
nc
il
14
Figure 2.4 Composite business basket cost of calls (national and international) – US$ PPP – May 2002
0
500
1000
1500
2000
2500
Denm
ark
Sw
eden
Korea
Finland
Netherlands
Japan
Ireland
US
Spain
France
UK
Germ
any
Italy
New
Zealand
Hungary
Poland
Figure 2.5 Industrial electricity prices – 10 GWh – Euro, VAT excl - 2002
0
2
4
6
8
10
Sw
eden
Finland
Spain
UK
France
Germ
any
Ireland
Italy
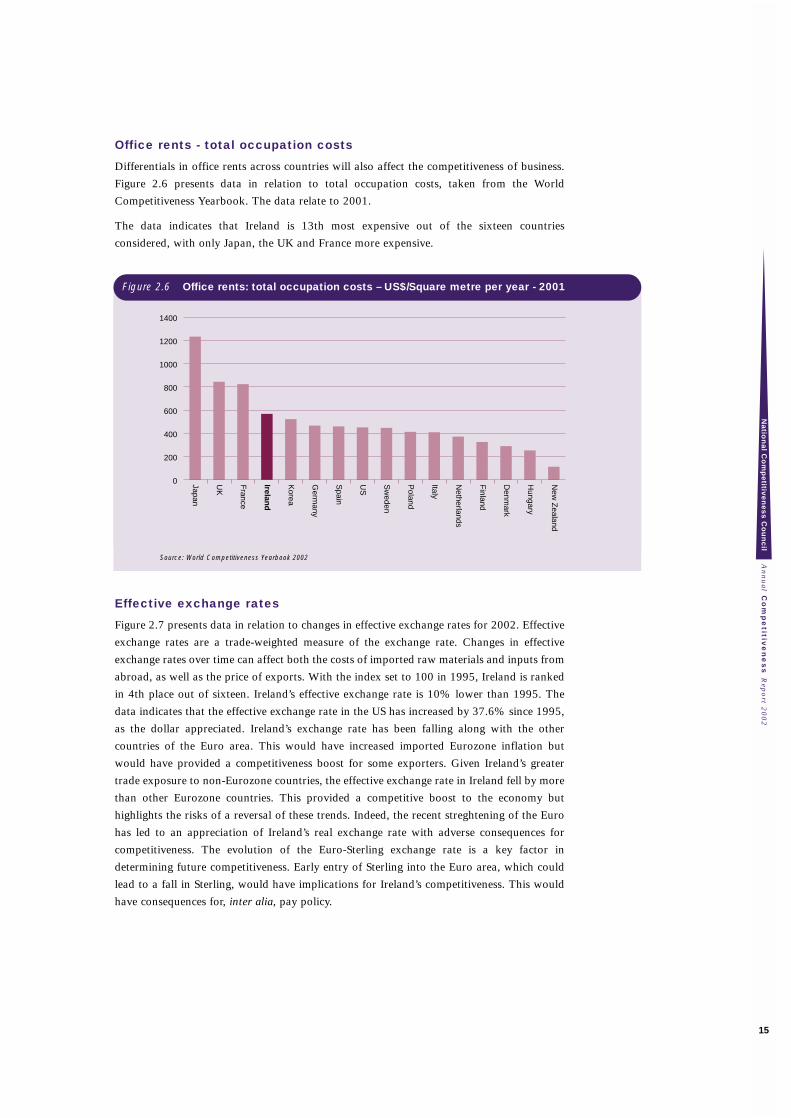
Office rents - total occupation costs
Differentials in office rents across countries will also affect the competitiveness of business.
Figure 2.6 presents data in relation to total occupation costs, taken from the World
Competitiveness Yearbook. The data relate to 2001.
The data indicates that Ireland is 13th most expensive out of the sixteen countries
considered, with only Japan, the UK and France more expensive.
Source: World Competitiveness Yearbook 2002
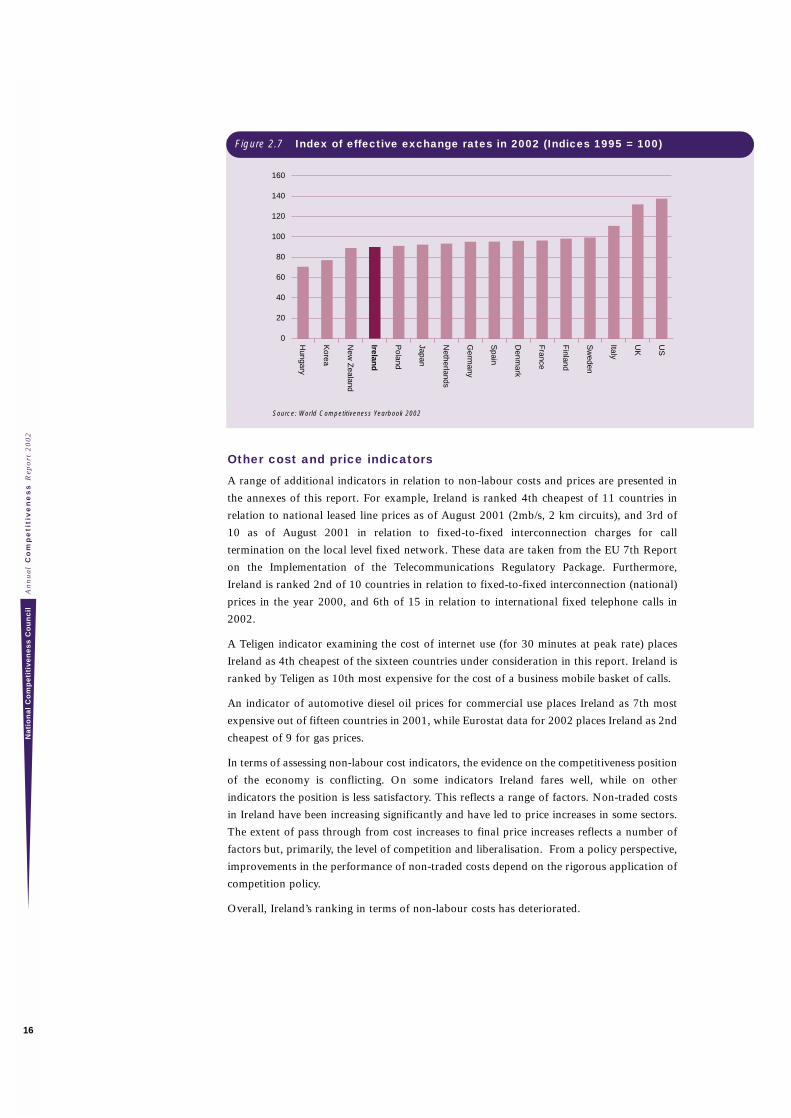
Effective exchange rates
Figure 2.7 presents data in relation to changes in effective exchange rates for 2002. Effective
exchange rates are a trade-weighted measure of the exchange rate. Changes in effective
exchange rates over time can affect both the costs of imported raw materials and inputs from
abroad, as well as the price of exports. With the index set to 100 in 1995, Ireland is ranked
in 4th place out of sixteen. Ireland’s effective exchange rate is 10% lower than 1995. The
data indicates that the effective exchange rate in the US has increased by 37.6% since 1995,
as the dollar appreciated. Ireland’s exchange rate has been falling along with the other
countries of the Euro area. This would have increased imported Eurozone inflation but
would have provided a competitiveness boost for some exporters. Given Ireland’s greater
trade exposure to non-Eurozone countries, the effective exchange rate in Ireland fell by more
than other Eurozone countries. This provided a competitive boost to the economy but
highlights the risks of a reversal of these trends. Indeed, the recent streghtening of the Euro
has led to an appreciation of Ireland’s real exchange rate with adverse consequences for
competitiveness. The evolution of the Euro-Sterling exchange rate is a key factor in
determining future competitiveness. Early entry of Sterling into the Euro area, which could
lead to a fall in Sterling, would have implications for Ireland’s competitiveness. This would
have consequences for, inter alia, pay policy.
An
nu
al C
om
pe
titive
ne
ss R
epo
rt 20
02
Na
tion
al C
om
pe
titive
ne
ss
Co
un
cil
15
Figure 2.6 Office rents: total occupation costs – US$/Square metre per year - 2001
New
Zealand
Hungary
Denm
ark
Finland
Netherlands
Italy
Poland
Sw
eden
US
Spain
Germ
any
Korea
Ireland
France
UK
Japan
0
200
400
600
800
1000
1200
1400
Source: World Competitiveness Yearbook 2002
Other cost and price indicators
A range of additional indicators in relation to non-labour costs and prices are presented in
the annexes of this report. For example, Ireland is ranked 4th cheapest of 11 countries in
relation to national leased line prices as of August 2001 (2mb/s, 2 km circuits), and 3rd of
10 as of August 2001 in relation to fixed-to-fixed interconnection charges for call
termination on the local level fixed network. These data are taken from the EU 7th Report
on the Implementation of the Telecommunications Regulatory Package. Furthermore,
Ireland is ranked 2nd of 10 countries in relation to fixed-to-fixed interconnection (national)
prices in the year 2000, and 6th of 15 in relation to international fixed telephone calls in
2002.
A Teligen indicator examining the cost of internet use (for 30 minutes at peak rate) places
Ireland as 4th cheapest of the sixteen countries under consideration in this report. Ireland is
ranked by Teligen as 10th most expensive for the cost of a business mobile basket of calls.
An indicator of automotive diesel oil prices for commercial use places Ireland as 7th most
expensive out of fifteen countries in 2001, while Eurostat data for 2002 places Ireland as 2nd
cheapest of 9 for gas prices.
In terms of assessing non-labour cost indicators, the evidence on the competitiveness position
of the economy is conflicting. On some indicators Ireland fares well, while on other
indicators the position is less satisfactory. This reflects a range of factors. Non-traded costs
in Ireland have been increasing significantly and have led to price increases in some sectors.
The extent of pass through from cost increases to final price increases reflects a number of
factors but, primarily, the level of competition and liberalisation. From a policy perspective,
improvements in the performance of non-traded costs depend on the rigorous application of
competition policy.
Overall, Ireland’s ranking in terms of non-labour costs has deteriorated.
An
nu
al
Co
mp
eti
tiv
en
es
s R
epo
rt 2
00
2N
ati
on
al
Co
mp
eti
tiv
en
es
s C
ou
nc
il
16
Figure 2.7 Index of effective exchange rates in 2002 (Indices 1995 = 100)
0
20
40
60
80
100
120
140
160
US
UK
Italy
Sw
eden
Finland
France
Denm
ark
Spain
Germ
any
Netherlands
Japan
Poland
Ireland
New
Zealand
Korea
Hungary
2.3 Economic Policy, Government and Regulation
This section considers indicators in relation to economic policy, government and regulation.
This represents an important set of indicators as government policy and regulation can have
important implications for business competitiveness and economic development.
Furthermore, government investment policy can impact on future competitiveness.
In undertaking this analysis, we focus on the following headline indicators:
• Total tax revenue (%GDP);
• Taxes on corporate income (standard/top rate);
• Gross fixed capital formation as a percentage of GDP.
We also consider a number of additional indicators, namely:
• Employees and employers social security contributions and personal income tax less
transfer payments – married (% gross labour costs);
• Employees and employers social security contributions and personal income tax less
transfer payments – single (% gross labour costs);
• Employers social security contributions (% gross labour costs);
• Government spending (%GDP);
• Government financial balance (% GDP);
• Overall employment protection against dismissal;
• Cost of forming a private limited company (euro);
• Rating of Competition Authorities across countries.
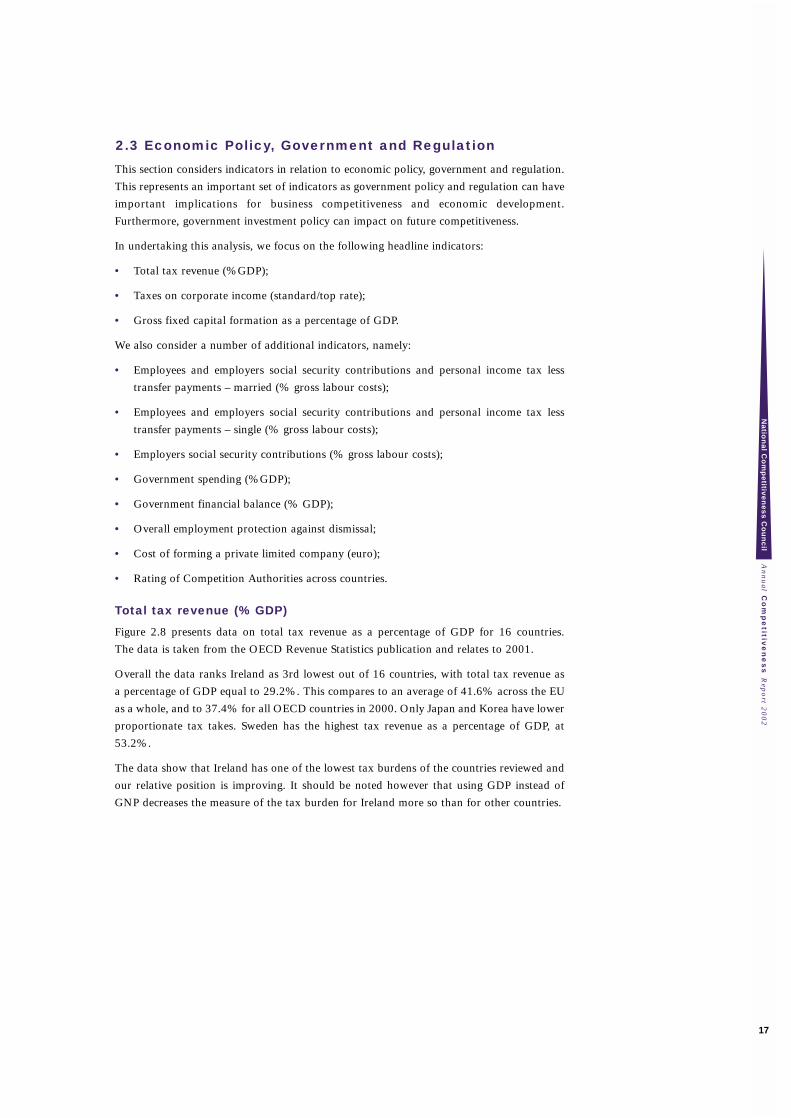
Total tax revenue (% GDP)
Figure 2.8 presents data on total tax revenue as a percentage of GDP for 16 countries.
The data is taken from the OECD Revenue Statistics publication and relates to 2001.
Overall the data ranks Ireland as 3rd lowest out of 16 countries, with total tax revenue as
a percentage of GDP equal to 29.2%. This compares to an average of 41.6% across the EU
as a whole, and to 37.4% for all OECD countries in 2000. Only Japan and Korea have lower
proportionate tax takes. Sweden has the highest tax revenue as a percentage of GDP, at
53.2%.
The data show that Ireland has one of the lowest tax burdens of the countries reviewed and
our relative position is improving. It should be noted however that using GDP instead of
GNP decreases the measure of the tax burden for Ireland more so than for other countries.
An
nu
al C
om
pe
titive
ne
ss R
epo
rt 20
02
Na
tion
al C
om
pe
titive
ne
ss
Co
un
cil
17
Source: OECD Revenue Statistics 2002
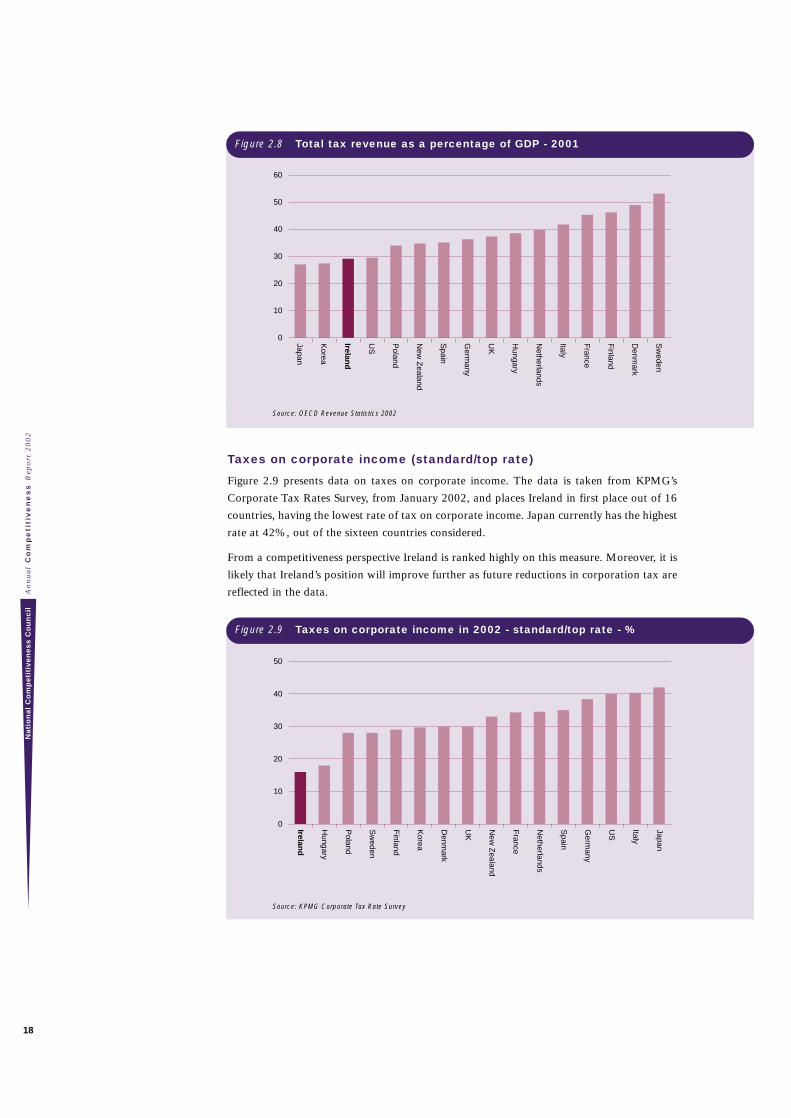
Taxes on corporate income (standard/top rate)
Figure 2.9 presents data on taxes on corporate income. The data is taken from KPMG’s
Corporate Tax Rates Survey, from January 2002, and places Ireland in first place out of 16
countries, having the lowest rate of tax on corporate income. Japan currently has the highest
rate at 42%, out of the sixteen countries considered.
From a competitiveness perspective Ireland is ranked highly on this measure. Moreover, it is
likely that Ireland’s position will improve further as future reductions in corporation tax are
reflected in the data.
Source: KPMG Corporate Tax Rate Survey
An
nu
al
Co
mp
eti
tiv
en
es
s R
epo
rt 2
00
2N
ati
on
al
Co
mp
eti
tiv
en
es
s C
ou
nc
il
18
0
10
20
30
40
50
60
Sw
eden
Denm
ark
Finland
France
Italy
Netherlands
Hungary
UK
Germ
any
Spain
New
Zealand
Poland
US
Ireland
Korea
Japan
Figure 2.8 Total tax revenue as a percentage of GDP - 2001
Figure 2.9 Taxes on corporate income in 2002 - standard/top rate - %
0
10
20
30
40
50
Japan
Italy
US
Germ
any
Spain
Netherlands
France
New
Zealand
UK
Denm
ark
Korea
Finland
Sw
eden
Poland
Hungary
Ireland
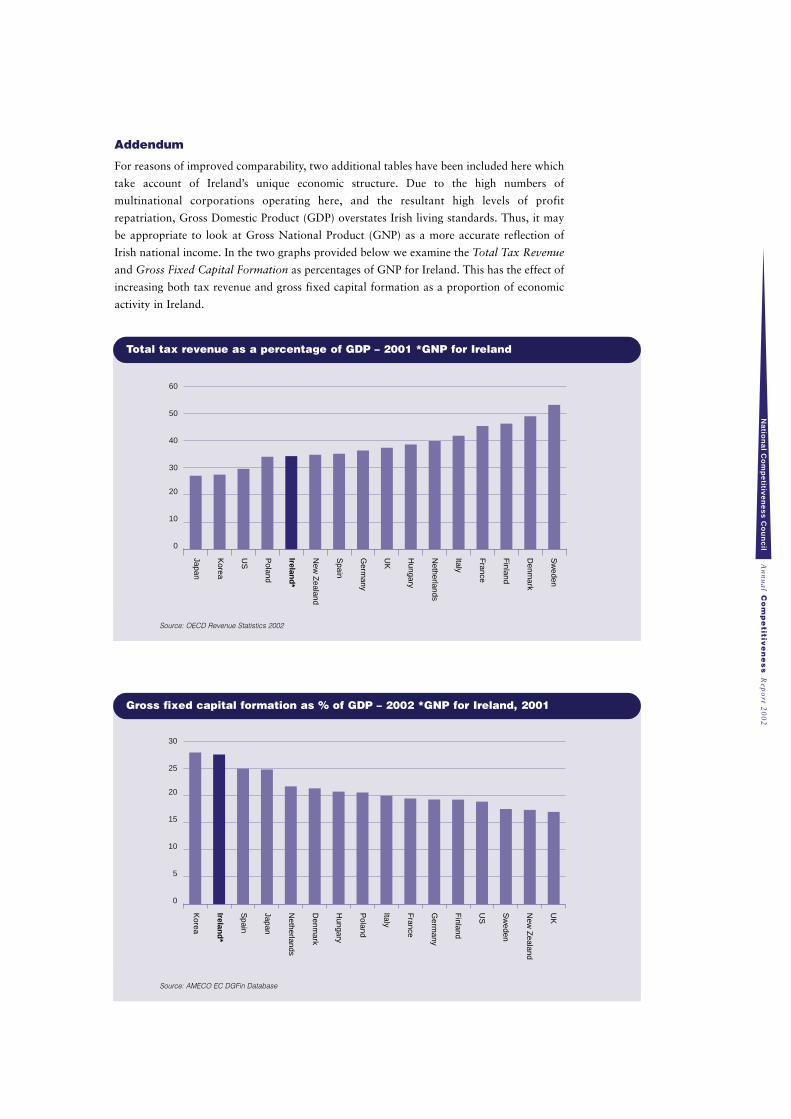
Gross fixed capital formation as % of GDP – 2002 *GNP for Ireland, 2001
UK
New
Zealand
Sw
eden
US
Finland
Germ
any
France
Italy
Poland
Hungary
Denm
ark
Netherlands
Japan
Spain
Ireland
*
Korea
0
5
10
15
20
25
30
Total tax revenue as a percentage of GDP – 2001 *GNP for Ireland
Sw
eden
Denm
ark
Finland
France
Italy
Netherlands
Hungary
UK
Germ
any
Spain
New
Zealand
Ireland
*
Poland
US
Korea
Japan
0
10
20
30
40
50
60
Addendum
For reasons of improved comparability, two additional tables have been included here which
take account of Ireland’s unique economic structure. Due to the high numbers of
multinational corporations operating here, and the resultant high levels of profit
repatriation, Gross Domestic Product (GDP) overstates Irish living standards. Thus, it may
be appropriate to look at Gross National Product (GNP) as a more accurate reflection of
Irish national income. In the two graphs provided below we examine the Total Tax Revenue
and Gross Fixed Capital Formation as percentages of GNP for Ireland. This has the effect of
increasing both tax revenue and gross fixed capital formation as a proportion of economic
activity in Ireland.
Source: OECD Revenue Statistics 2002
An
nu
al C
om
pe
titive
ne
ss R
epo
rt 20
02
Na
tion
al C
om
pe
titive
ne
ss
Co
un
cil
Source: AMECO EC DGFin Database
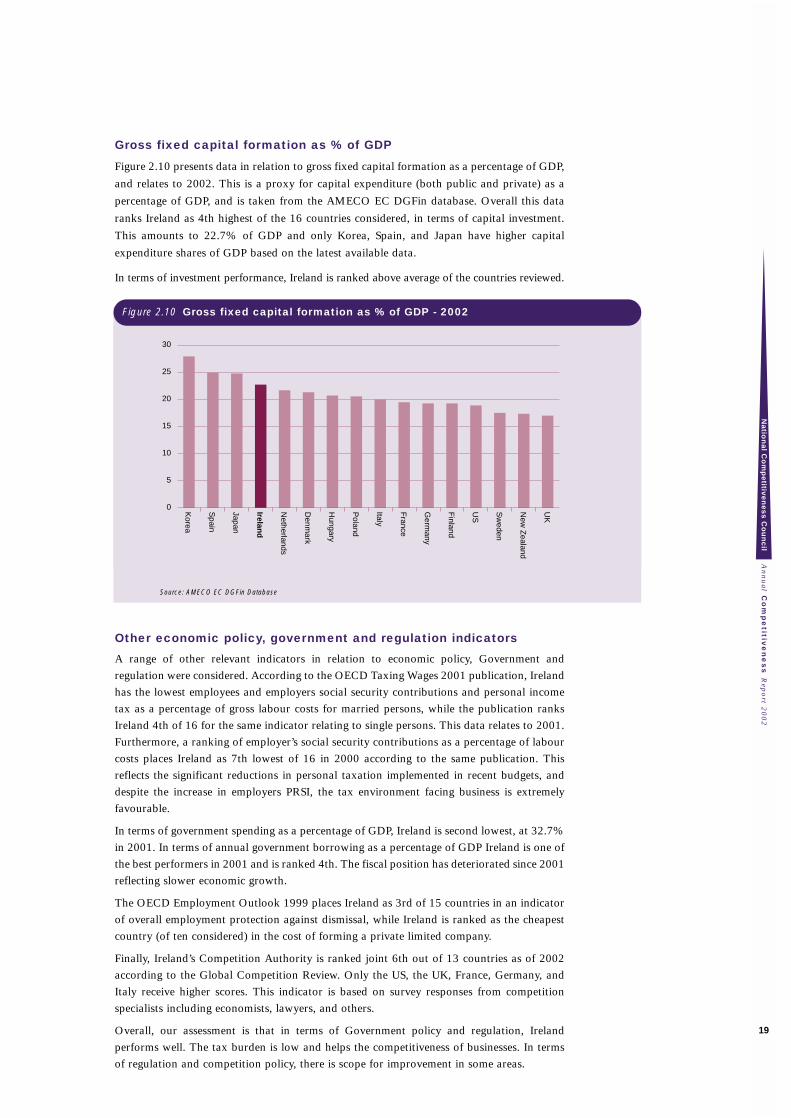
Gross fixed capital formation as % of GDP
Figure 2.10 presents data in relation to gross fixed capital formation as a percentage of GDP,
and relates to 2002. This is a proxy for capital expenditure (both public and private) as a
percentage of GDP, and is taken from the AMECO EC DGFin database. Overall this data
ranks Ireland as 4th highest of the 16 countries considered, in terms of capital investment.
This amounts to 22.7% of GDP and only Korea, Spain, and Japan have higher capital
expenditure shares of GDP based on the latest available data.
In terms of investment performance, Ireland is ranked above average of the countries reviewed.
Source: AMECO EC DGFin Database
Other economic policy, government and regulation indicators
A range of other relevant indicators in relation to economic policy, Government and
regulation were considered. According to the OECD Taxing Wages 2001 publication, Ireland
has the lowest employees and employers social security contributions and personal income
tax as a percentage of gross labour costs for married persons, while the publication ranks
Ireland 4th of 16 for the same indicator relating to single persons. This data relates to 2001.
Furthermore, a ranking of employer’s social security contributions as a percentage of labour
costs places Ireland as 7th lowest of 16 in 2000 according to the same publication. This
reflects the significant reductions in personal taxation implemented in recent budgets, and
despite the increase in employers PRSI, the tax environment facing business is extremely
favourable.
In terms of government spending as a percentage of GDP, Ireland is second lowest, at 32.7%
in 2001. In terms of annual government borrowing as a percentage of GDP Ireland is one of
the best performers in 2001 and is ranked 4th. The fiscal position has deteriorated since 2001
reflecting slower economic growth.
The OECD Employment Outlook 1999 places Ireland as 3rd of 15 countries in an indicator
of overall employment protection against dismissal, while Ireland is ranked as the cheapest
country (of ten considered) in the cost of forming a private limited company.
Finally, Ireland’s Competition Authority is ranked joint 6th out of 13 countries as of 2002
according to the Global Competition Review. Only the US, the UK, France, Germany, and
Italy receive higher scores. This indicator is based on survey responses from competition
specialists including economists, lawyers, and others.
Overall, our assessment is that in terms of Government policy and regulation, Ireland
performs well. The tax burden is low and helps the competitiveness of businesses. In terms
of regulation and competition policy, there is scope for improvement in some areas.
An
nu
al C
om
pe
titive
ne
ss R
epo
rt 20
02
Na
tion
al C
om
pe
titive
ne
ss
Co
un
cil
19
0
5
10
15
20
25
30
UK
New
Zealand
Sw
eden
US
Finland
Germ
any
France
Italy
Poland
Hungary
Denm
ark
Netherlands
Ireland
Japan
Spain
Korea
Figure 2.10 Gross fixed capital formation as % of GDP - 2002


Socio-Economic Environment3
3 Socio-Economic Environment
In terms of the socio-economic environment there are major challenges for policy-makers.
Despite significant investment, Ireland’s infrastructure is severely congested as a result of the
growing demand for travel. Ireland’s relative performance is declining. In relation to the
information society Ireland has made progress but lags behind our competitors on some of
the key indicators. Overall performance looks unchanged. Investment in education and skills
has been one of the key reasons for the rapid expansion in living standards. Improvements
in most key areas are observed but further work is required. There are major challenges in
each of the main environmental areas where Ireland’s record is relatively poor.
The indicators under this heading cover five main areas, namely:
• Education and Skills;
• Information Society;
• Transport Infrastructure;
• Environment and Energy; and,
• Social Capital.
Each of these areas is considered important from a competitiveness perspective and
indicators on each one are presented in subsequent sections.
An
nu
al
Co
mp
eti
tiv
en
es
s R
epo
rt 2
00
2N
ati
on
al
Co
mp
eti
tiv
en
es
s C
ou
nc
il
22
3.1 Education and Skills
The stock of human capital is one of the most important determinants of competitiveness.
Research from the ESRI on Ireland as well as international reviews by the OECD indicate the
critical importance of investment in human capital as a factor influencing economic growth.
Ireland’s convergence in living standards towards the EU average reflects significant
investment in education. With a high proportion of the population having attained a third-
level qualification, Ireland has the skills to compete in the global market. Of course, while
much progress has been made on foot of previous policy, continued progress is required.
In relation to education and skills, the following represent the headline indicators:
• Public and private expenditure on educational institutions (% of GDP);
• Total enrolment in tertiary education growth (1995=100);
• % of population aged 25-34 that has at least third level education;
• Number of science graduates at university level (per 000 in Labour force 25-34).
A number of additional indicators in relation to education and skills are also examined:
• Annual expenditure per student (US$ PPP) – all;
• Ratio of students to teaching staff – all;
• Educational participation – age 16 (%);
• % of 25-64 year olds participating in continuing education and training;
• % of population aged 25-64 that has at least upper secondary level education;
• Percentage of students scoring at literacy level 3 or higher;
• Student performance on the mathematical literacy scale;
• Student performance on the scientific literacy scale;
• Average number of foreign languages per pupil; and,
• Measure of ageing population.
Public and private expenditure on educational institutions (% of GDP)
Figure 3.1 presents data in relation to public and private expenditure on educational
institutions as a percentage of GDP. The data is from the OECD Education at a Glance 2001
publication and relates to 1998. This data ranks Ireland in 8th place of 14 countries for
which the data is available, with expenditure on educational institutions amounting to 5.4%
of GDP.
There is some evidence of a decline in this proportion for Ireland in recent years. Preliminary
data for 1999 puts the percentage at 4.6% and at 4% in 2000.
An
nu
al C
om
pe
titive
ne
ss R
epo
rt 20
02
Na
tion
al C
om
pe
titive
ne
ss
Co
un
cil
23
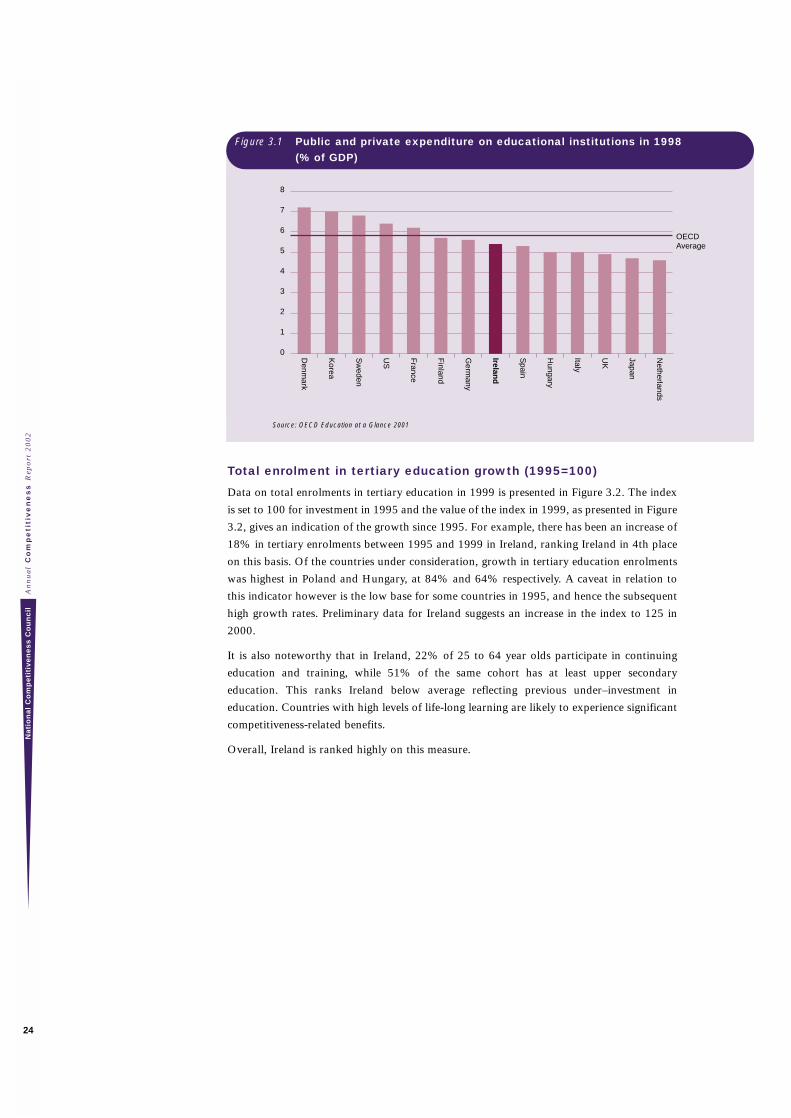
Source: OECD Education at a Glance 2001
Total enrolment in tertiary education growth (1995=100)
Data on total enrolments in tertiary education in 1999 is presented in Figure 3.2. The index
is set to 100 for investment in 1995 and the value of the index in 1999, as presented in Figure
3.2, gives an indication of the growth since 1995. For example, there has been an increase of
18% in tertiary enrolments between 1995 and 1999 in Ireland, ranking Ireland in 4th place
on this basis. Of the countries under consideration, growth in tertiary education enrolments
was highest in Poland and Hungary, at 84% and 64% respectively. A caveat in relation to
this indicator however is the low base for some countries in 1995, and hence the subsequent
high growth rates. Preliminary data for Ireland suggests an increase in the index to 125 in
2000.
It is also noteworthy that in Ireland, 22% of 25 to 64 year olds participate in continuing
education and training, while 51% of the same cohort has at least upper secondary
education. This ranks Ireland below average reflecting previous under–investment in
education. Countries with high levels of life-long learning are likely to experience significant
competitiveness-related benefits.
Overall, Ireland is ranked highly on this measure.
An
nu
al
Co
mp
eti
tiv
en
es
s R
epo
rt 2
00
2N
ati
on
al
Co
mp
eti
tiv
en
es
s C
ou
nc
il
24
0
1
2
3
4
5
6
7
8
Netherlands
Japan
UK
Italy
Hungary
Spain
Ireland
Germ
any
Finland
France
US
Sw
eden
Korea
Denm
ark
OECD Average
Figure 3.1 Public and private expenditure on educational institutions in 1998(% of GDP)
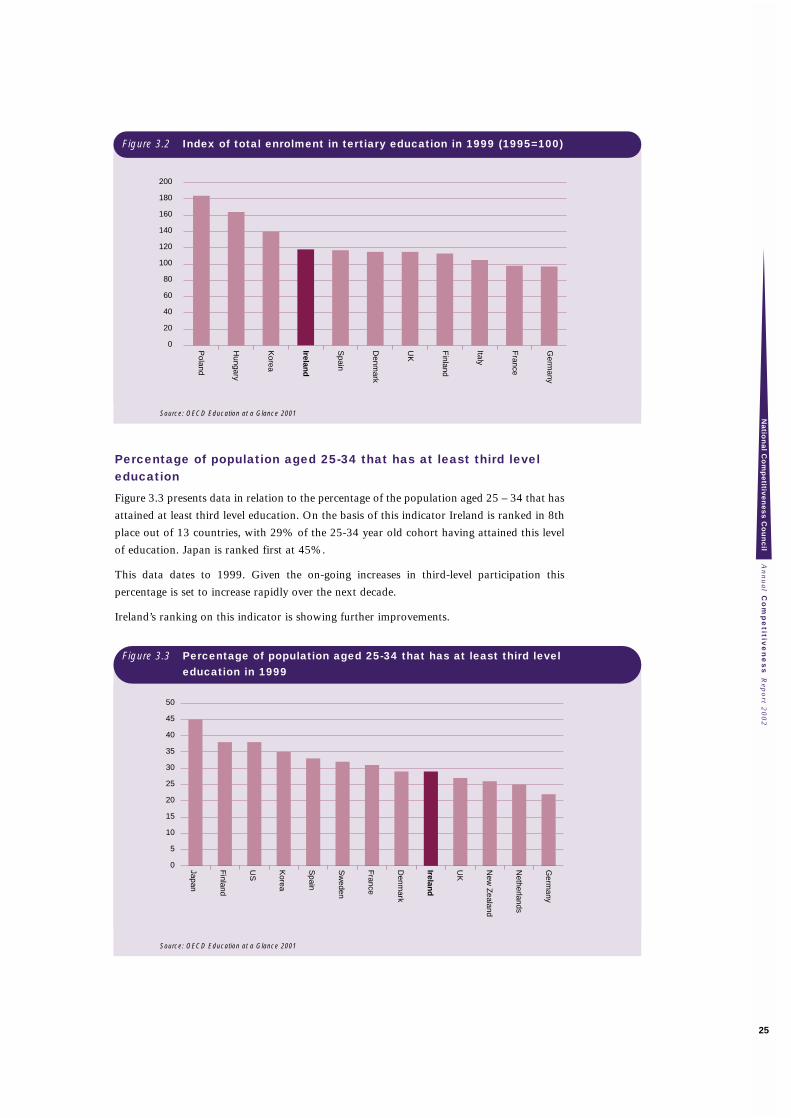
Source: OECD Education at a Glance 2001
Percentage of population aged 25-34 that has at least third leveleducation
Figure 3.3 presents data in relation to the percentage of the population aged 25 – 34 that has
attained at least third level education. On the basis of this indicator Ireland is ranked in 8th
place out of 13 countries, with 29% of the 25-34 year old cohort having attained this level
of education. Japan is ranked first at 45%.
This data dates to 1999. Given the on-going increases in third-level participation this
percentage is set to increase rapidly over the next decade.
Ireland’s ranking on this indicator is showing further improvements.
Source: OECD Education at a Glance 2001
An
nu
al C
om
pe
titive
ne
ss R
epo
rt 20
02
Na
tion
al C
om
pe
titive
ne
ss
Co
un
cil
25
0
20
40
60
80
100
120
140
160
180
200
Germ
any
France
Italy
Finland
UK
Denm
ark
Spain
Ireland
Korea
Hungary
Poland
0
5
10
15
20
25
30
35
40
45
50
Germ
any
Netherlands
New
Zealand
UK
Ireland
Denm
ark
France
Sw
eden
Spain
Korea
US
Finland
Japan
Figure 3.2 Index of total enrolment in tertiary education in 1999 (1995=100)
Figure 3.3 Percentage of population aged 25-34 that has at least third level education in 1999
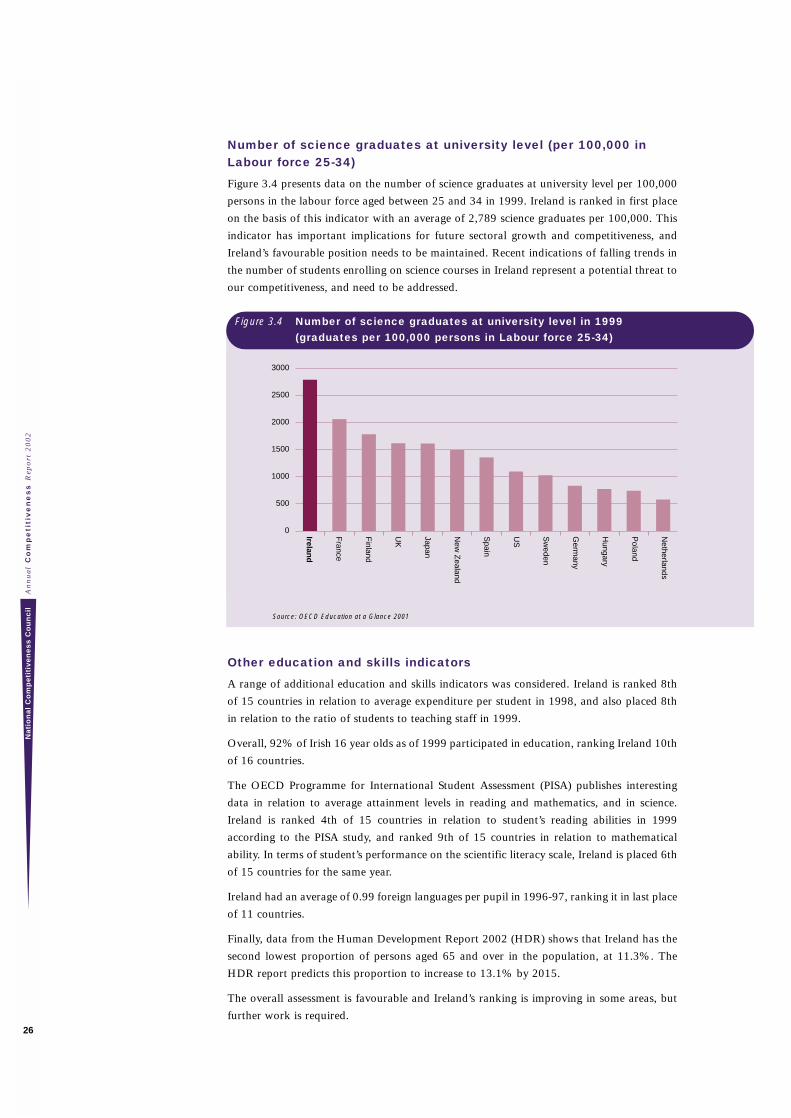
Number of science graduates at university level (per 100,000 inLabour force 25-34)
Figure 3.4 presents data on the number of science graduates at university level per 100,000
persons in the labour force aged between 25 and 34 in 1999. Ireland is ranked in first place
on the basis of this indicator with an average of 2,789 science graduates per 100,000. This
indicator has important implications for future sectoral growth and competitiveness, and
Ireland’s favourable position needs to be maintained. Recent indications of falling trends in
the number of students enrolling on science courses in Ireland represent a potential threat to
our competitiveness, and need to be addressed.
Source: OECD Education at a Glance 2001
Other education and skills indicators
A range of additional education and skills indicators was considered. Ireland is ranked 8th
of 15 countries in relation to average expenditure per student in 1998, and also placed 8th
in relation to the ratio of students to teaching staff in 1999.
Overall, 92% of Irish 16 year olds as of 1999 participated in education, ranking Ireland 10th
of 16 countries.
The OECD Programme for International Student Assessment (PISA) publishes interesting
data in relation to average attainment levels in reading and mathematics, and in science.
Ireland is ranked 4th of 15 countries in relation to student’s reading abilities in 1999
according to the PISA study, and ranked 9th of 15 countries in relation to mathematical
ability. In terms of student’s performance on the scientific literacy scale, Ireland is placed 6th
of 15 countries for the same year.
Ireland had an average of 0.99 foreign languages per pupil in 1996-97, ranking it in last place
of 11 countries.
Finally, data from the Human Development Report 2002 (HDR) shows that Ireland has the
second lowest proportion of persons aged 65 and over in the population, at 11.3%. The
HDR report predicts this proportion to increase to 13.1% by 2015.
The overall assessment is favourable and Ireland’s ranking is improving in some areas, but
further work is required.
An
nu
al
Co
mp
eti
tiv
en
es
s R
epo
rt 2
00
2N
ati
on
al
Co
mp
eti
tiv
en
es
s C
ou
nc
il
26
0
500
1000
1500
2000
2500
3000
Netherlands
Poland
Hungary
Germ
any
Sw
eden
US
Spain
New
Zealand
Japan
UK
Finland
France
Ireland
Figure 3.4 Number of science graduates at university level in 1999 (graduates per 100,000 persons in Labour force 25-34)
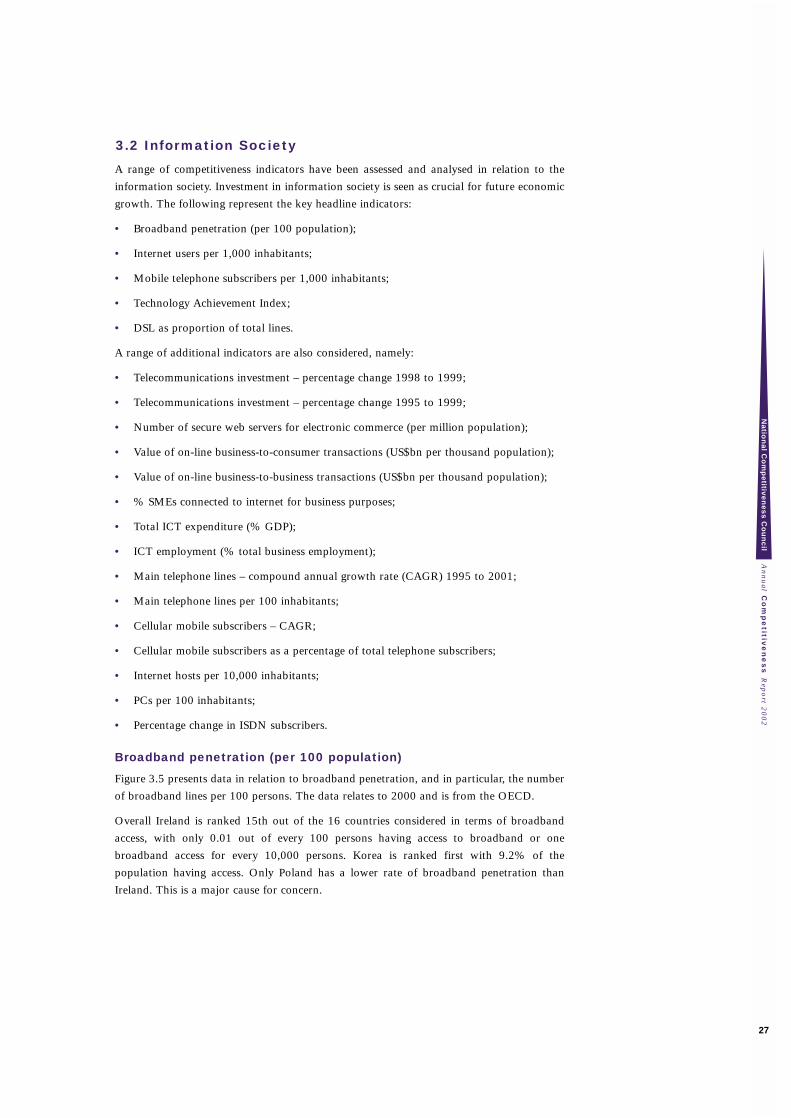
3.2 Information Society
A range of competitiveness indicators have been assessed and analysed in relation to the
information society. Investment in information society is seen as crucial for future economic
growth. The following represent the key headline indicators:
• Broadband penetration (per 100 population);
• Internet users per 1,000 inhabitants;
• Mobile telephone subscribers per 1,000 inhabitants;
• Technology Achievement Index;
• DSL as proportion of total lines.
A range of additional indicators are also considered, namely:
• Telecommunications investment – percentage change 1998 to 1999;
• Telecommunications investment – percentage change 1995 to 1999;
• Number of secure web servers for electronic commerce (per million population);
• Value of on-line business-to-consumer transactions (US$bn per thousand population);
• Value of on-line business-to-business transactions (US$bn per thousand population);
• % SMEs connected to internet for business purposes;
• Total ICT expenditure (% GDP);
• ICT employment (% total business employment);
• Main telephone lines – compound annual growth rate (CAGR) 1995 to 2001;
• Main telephone lines per 100 inhabitants;
• Cellular mobile subscribers – CAGR;
• Cellular mobile subscribers as a percentage of total telephone subscribers;
• Internet hosts per 10,000 inhabitants;
• PCs per 100 inhabitants;
• Percentage change in ISDN subscribers.
Broadband penetration (per 100 population)
Figure 3.5 presents data in relation to broadband penetration, and in particular, the number
of broadband lines per 100 persons. The data relates to 2000 and is from the OECD.
Overall Ireland is ranked 15th out of the 16 countries considered in terms of broadband
access, with only 0.01 out of every 100 persons having access to broadband or one
broadband access for every 10,000 persons. Korea is ranked first with 9.2% of the
population having access. Only Poland has a lower rate of broadband penetration than
Ireland. This is a major cause for concern.
An
nu
al C
om
pe
titive
ne
ss R
epo
rt 20
02
Na
tion
al C
om
pe
titive
ne
ss
Co
un
cil
27
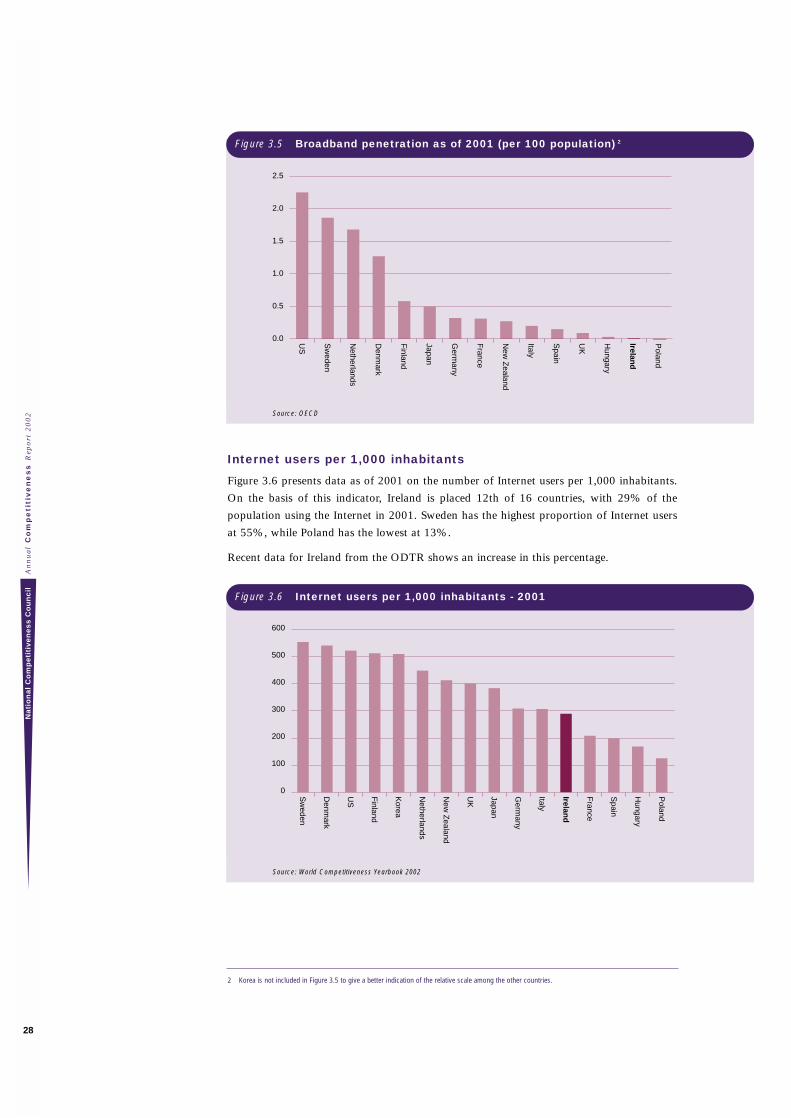
An
nu
al
Co
mp
eti
tiv
en
es
s R
epo
rt 2
00
2N
ati
on
al
Co
mp
eti
tiv
en
es
s C
ou
nc
il
28
2 Korea is not included in Figure 3.5 to give a better indication of the relative scale among the other countries.
Source: OECD
Internet users per 1,000 inhabitants
Figure 3.6 presents data as of 2001 on the number of Internet users per 1,000 inhabitants.
On the basis of this indicator, Ireland is placed 12th of 16 countries, with 29% of the
population using the Internet in 2001. Sweden has the highest proportion of Internet users
at 55%, while Poland has the lowest at 13%.
Recent data for Ireland from the ODTR shows an increase in this percentage.
Source: World Competitiveness Yearbook 2002
0.0
0.5
1.0
1.5
2.0
2.5
Poland
Ireland
Hungary
UK
Spain
Italy
New
Zealand
France
Germ
any
Japan
Finland
Denm
ark
Netherlands
Sw
eden
US
0
100
200
300
400
500
600
Poland
Hungary
Spain
France
Ireland
Italy
Germ
any
Japan
UK
New
Zealand
Netherlands
Korea
Finland
US
Denm
ark
Sw
eden
Figure 3.5 Broadband penetration as of 2001 (per 100 population) 2
Figure 3.6 Internet users per 1,000 inhabitants - 2001
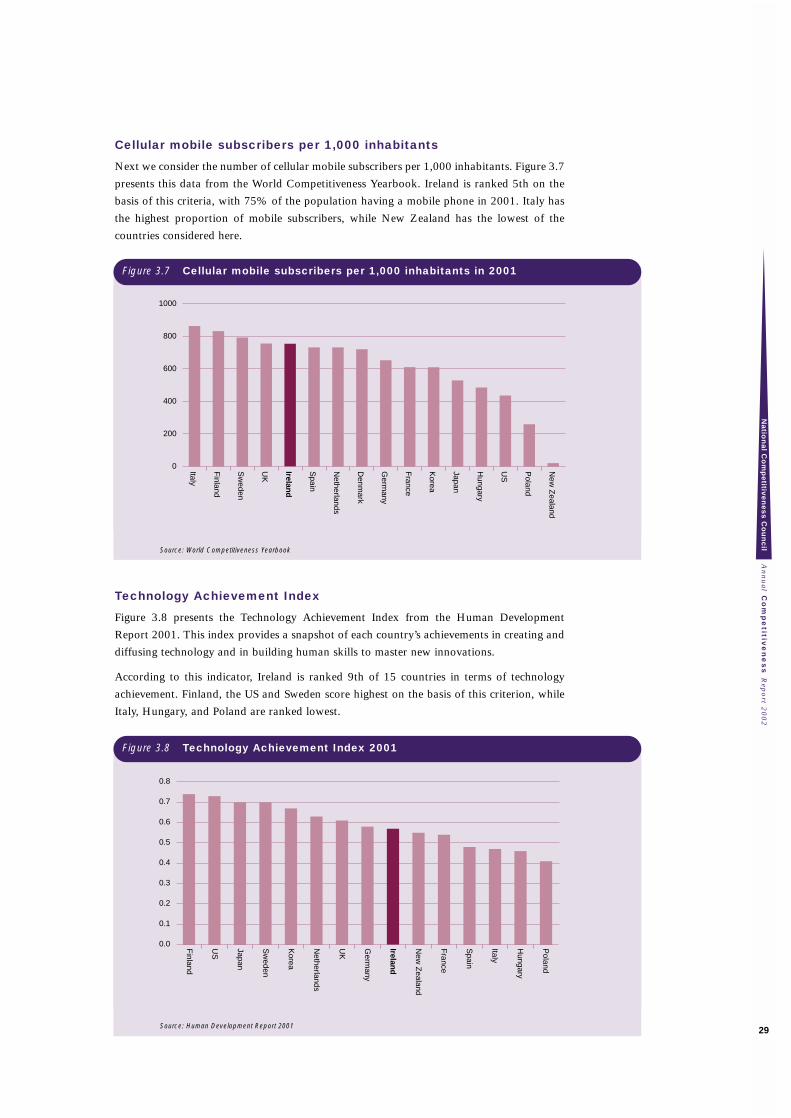
Cellular mobile subscribers per 1,000 inhabitants
Next we consider the number of cellular mobile subscribers per 1,000 inhabitants. Figure 3.7
presents this data from the World Competitiveness Yearbook. Ireland is ranked 5th on the
basis of this criteria, with 75% of the population having a mobile phone in 2001. Italy has
the highest proportion of mobile subscribers, while New Zealand has the lowest of the
countries considered here.
Source: World Competitiveness Yearbook
Technology Achievement Index
Figure 3.8 presents the Technology Achievement Index from the Human Development
Report 2001. This index provides a snapshot of each country’s achievements in creating and
diffusing technology and in building human skills to master new innovations.
According to this indicator, Ireland is ranked 9th of 15 countries in terms of technology
achievement. Finland, the US and Sweden score highest on the basis of this criterion, while
Italy, Hungary, and Poland are ranked lowest.
Source: Human Development Report 2001
An
nu
al C
om
pe
titive
ne
ss R
epo
rt 20
02
Na
tion
al C
om
pe
titive
ne
ss
Co
un
cil
29
0
200
400
600
800
1000
New
Zealand
Poland
US
Hungary
Japan
Korea
France
Germ
any
Denm
ark
Netherlands
Spain
Ireland
UK
Sw
eden
Finland
Italy
Figure 3.7 Cellular mobile subscribers per 1,000 inhabitants in 2001
Figure 3.8 Technology Achievement Index 2001
0.0
0.1
0.2
0.3
0.4
0.5
0.6
0.7
0.8
Poland
Hungary
Italy
Spain
France
New
Zealand
Ireland
Germ
any
UK
Netherlands
Korea
Sw
eden
Japan
US
Finland
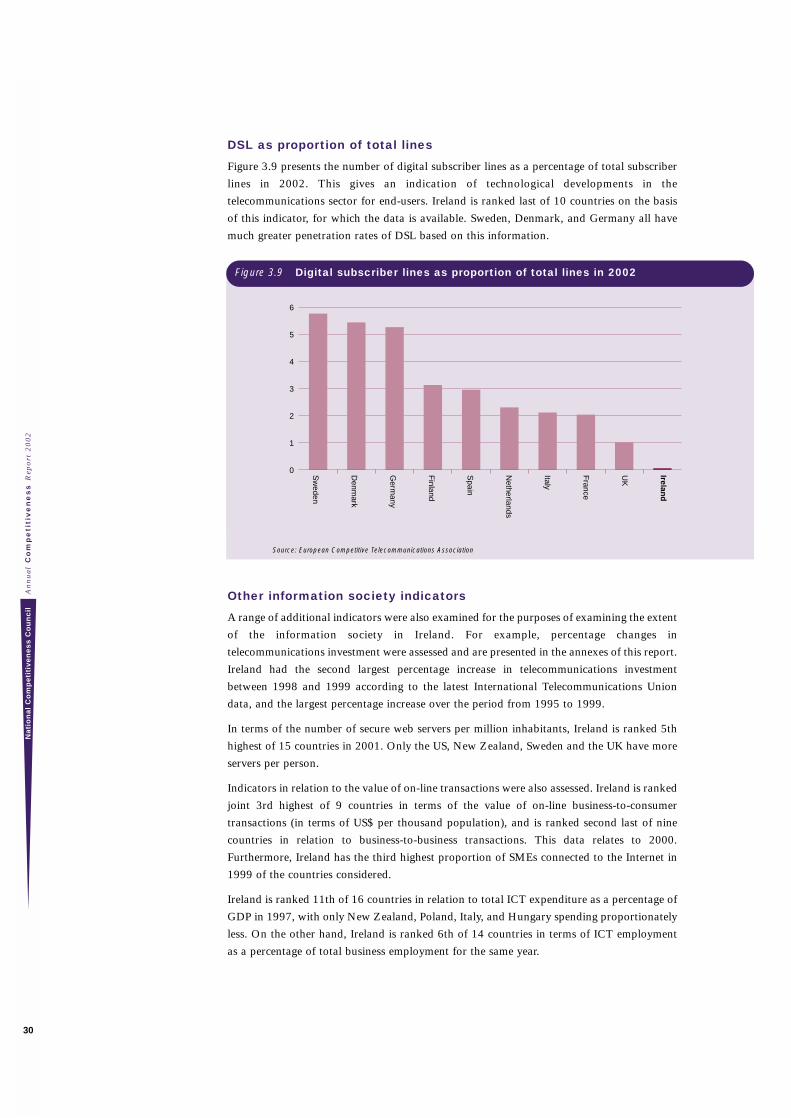
DSL as proportion of total lines
Figure 3.9 presents the number of digital subscriber lines as a percentage of total subscriber
lines in 2002. This gives an indication of technological developments in the
telecommunications sector for end-users. Ireland is ranked last of 10 countries on the basis
of this indicator, for which the data is available. Sweden, Denmark, and Germany all have
much greater penetration rates of DSL based on this information.
Source: European Competitive Telecommunications Association
Other information society indicators
A range of additional indicators were also examined for the purposes of examining the extent
of the information society in Ireland. For example, percentage changes in
telecommunications investment were assessed and are presented in the annexes of this report.
Ireland had the second largest percentage increase in telecommunications investment
between 1998 and 1999 according to the latest International Telecommunications Union
data, and the largest percentage increase over the period from 1995 to 1999.
In terms of the number of secure web servers per million inhabitants, Ireland is ranked 5th
highest of 15 countries in 2001. Only the US, New Zealand, Sweden and the UK have more
servers per person.
Indicators in relation to the value of on-line transactions were also assessed. Ireland is ranked
joint 3rd highest of 9 countries in terms of the value of on-line business-to-consumer
transactions (in terms of US$ per thousand population), and is ranked second last of nine
countries in relation to business-to-business transactions. This data relates to 2000.
Furthermore, Ireland has the third highest proportion of SMEs connected to the Internet in
1999 of the countries considered.
Ireland is ranked 11th of 16 countries in relation to total ICT expenditure as a percentage of
GDP in 1997, with only New Zealand, Poland, Italy, and Hungary spending proportionately
less. On the other hand, Ireland is ranked 6th of 14 countries in terms of ICT employment
as a percentage of total business employment for the same year.
An
nu
al
Co
mp
eti
tiv
en
es
s R
epo
rt 2
00
2N
ati
on
al
Co
mp
eti
tiv
en
es
s C
ou
nc
il
30
0
1
2
3
4
5
6
Ireland
UK
France
Italy
Netherlands
Spain
Finland
Germ
any
Denm
ark
Sw
eden
Figure 3.9 Digital subscriber lines as proportion of total lines in 2002
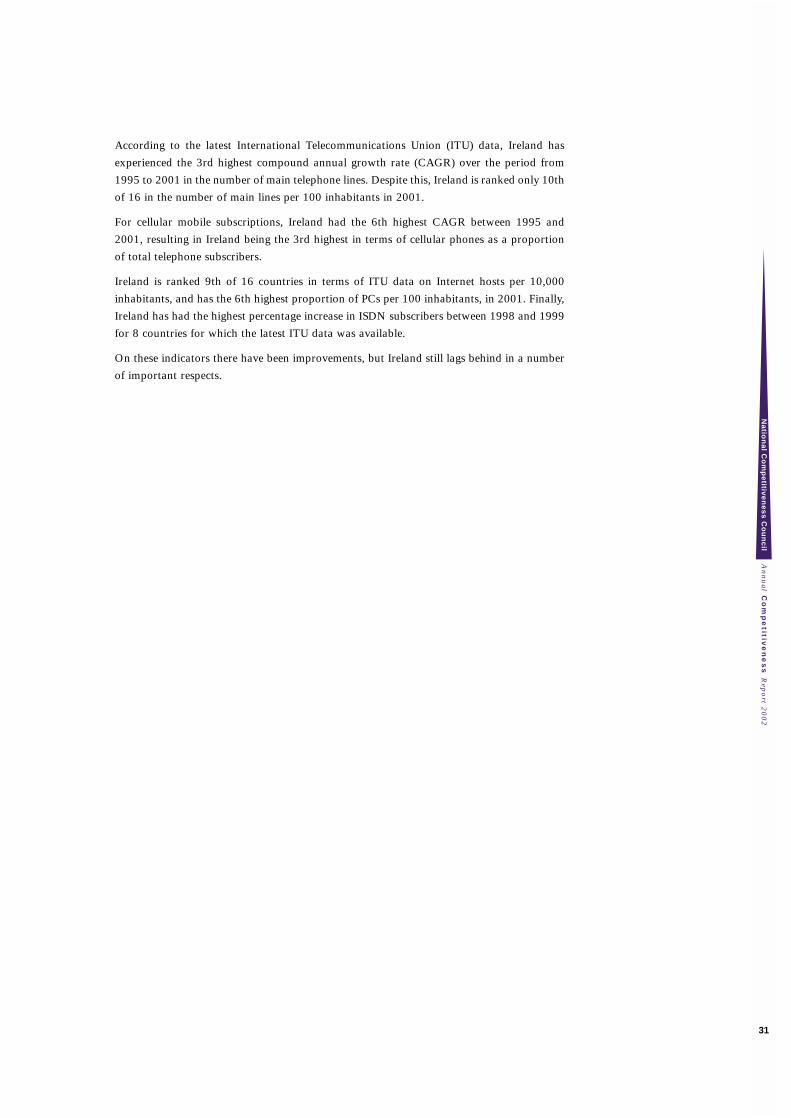
According to the latest International Telecommunications Union (ITU) data, Ireland has
experienced the 3rd highest compound annual growth rate (CAGR) over the period from
1995 to 2001 in the number of main telephone lines. Despite this, Ireland is ranked only 10th
of 16 in the number of main lines per 100 inhabitants in 2001.
For cellular mobile subscriptions, Ireland had the 6th highest CAGR between 1995 and
2001, resulting in Ireland being the 3rd highest in terms of cellular phones as a proportion
of total telephone subscribers.
Ireland is ranked 9th of 16 countries in terms of ITU data on Internet hosts per 10,000
inhabitants, and has the 6th highest proportion of PCs per 100 inhabitants, in 2001. Finally,
Ireland has had the highest percentage increase in ISDN subscribers between 1998 and 1999
for 8 countries for which the latest ITU data was available.
On these indicators there have been improvements, but Ireland still lags behind in a number
of important respects.
An
nu
al C
om
pe
titive
ne
ss R
epo
rt 20
02
Na
tion
al C
om
pe
titive
ne
ss
Co
un
cil
31
3.3 Transport Infrastructure
Higher than expected economic and population growth in recent years has placed
considerable strain on Ireland’s transport infrastructure. This infrastructure deficit is leading
to increased congestion and to concerns that future economic and social development will be
impaired unless the infrastructure deficit is met. In assessing this and other issues in relation
to transport, a range of competitiveness indicators have been assessed and analysed.
The following represent the key headline indicators with respect to transport infrastructure
that are presented in this report:
• Average speed of business deliveries in capital cities (minutes);
• Road haulage costs – vehicle excise duties – 40te gvw (2+3) articulated vehicles
• Rail infrastructure indicator;
• Percentage of goods transported by road – percentage of tonne kilometres.
A range of additional indicators are also considered, namely:
• Length of road network per 1,000 km;
• Length of motorway per 1,000 km;
• Investment in transport infrastructure per head;
• Average commute time to and from work (EU time use survey);
• Passenger kilometres on buses and coaches per person per year;
• Percentage of railway line electrified;
• Number of passenger cars per 100 inhabitants;
• Percentage of tax added to the price of a small passenger car;
• Percentage of goods transported by rail – percentage of tonne kilometres;
• Passenger cars – passenger km per person per year;
• Road accidents per 1,000 population.
An
nu
al
Co
mp
eti
tiv
en
es
s R
epo
rt 2
00
2N
ati
on
al
Co
mp
eti
tiv
en
es
s C
ou
nc
il
32
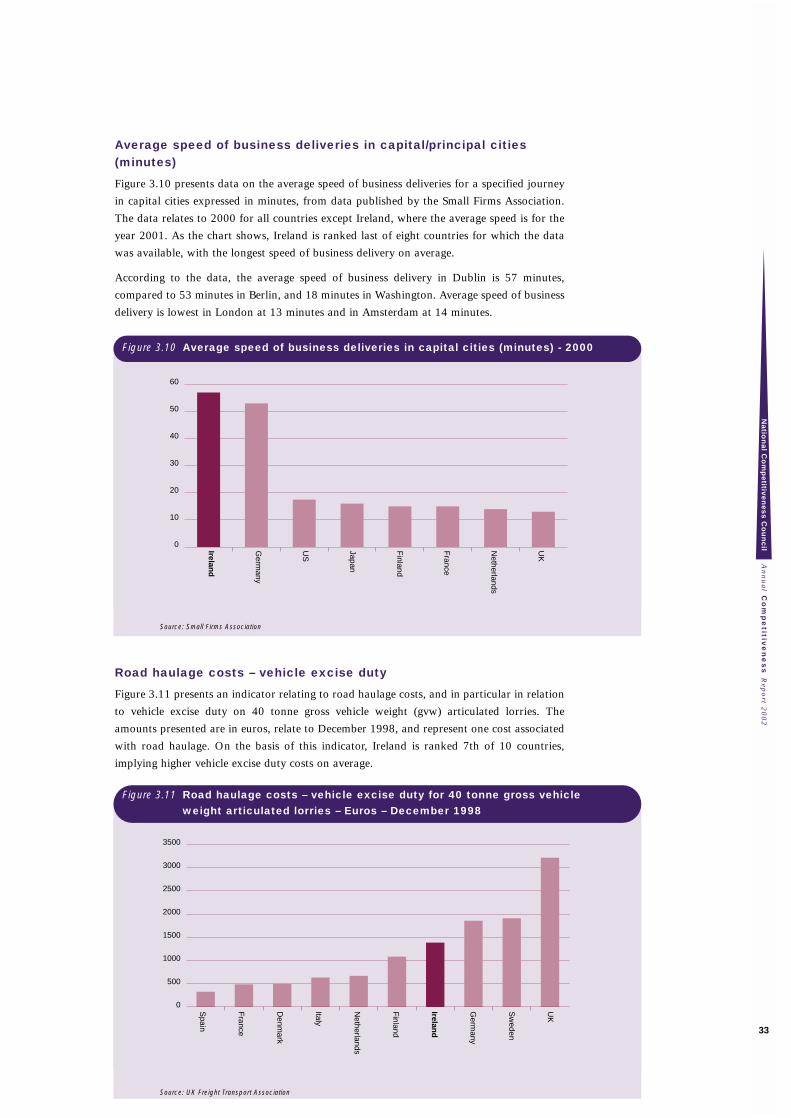
Average speed of business deliveries in capital/principal cities(minutes)
Figure 3.10 presents data on the average speed of business deliveries for a specified journey
in capital cities expressed in minutes, from data published by the Small Firms Association.
The data relates to 2000 for all countries except Ireland, where the average speed is for the
year 2001. As the chart shows, Ireland is ranked last of eight countries for which the data
was available, with the longest speed of business delivery on average.
According to the data, the average speed of business delivery in Dublin is 57 minutes,
compared to 53 minutes in Berlin, and 18 minutes in Washington. Average speed of business
delivery is lowest in London at 13 minutes and in Amsterdam at 14 minutes.
Source: Small Firms Association
Road haulage costs – vehicle excise duty
Figure 3.11 presents an indicator relating to road haulage costs, and in particular in relation
to vehicle excise duty on 40 tonne gross vehicle weight (gvw) articulated lorries. The
amounts presented are in euros, relate to December 1998, and represent one cost associated
with road haulage. On the basis of this indicator, Ireland is ranked 7th of 10 countries,
implying higher vehicle excise duty costs on average.
Source: UK Freight Transport Association
An
nu
al C
om
pe
titive
ne
ss R
epo
rt 20
02
Na
tion
al C
om
pe
titive
ne
ss
Co
un
cil
33
Figure 3.10 Average speed of business deliveries in capital cities (minutes) - 2000
0
10
20
30
40
50
60
UK
Netherlands
France
Finland
Japan
US
Germ
any
Ireland
Figure 3.11 Road haulage costs – vehicle excise duty for 40 tonne gross vehicle weight articulated lorries – Euros – December 1998
0
500
1000
1500
2000
2500
3000
3500
UK
Sw
eden
Germ
any
Ireland
Finland
Netherlands
Italy
Denm
ark
France
Spain
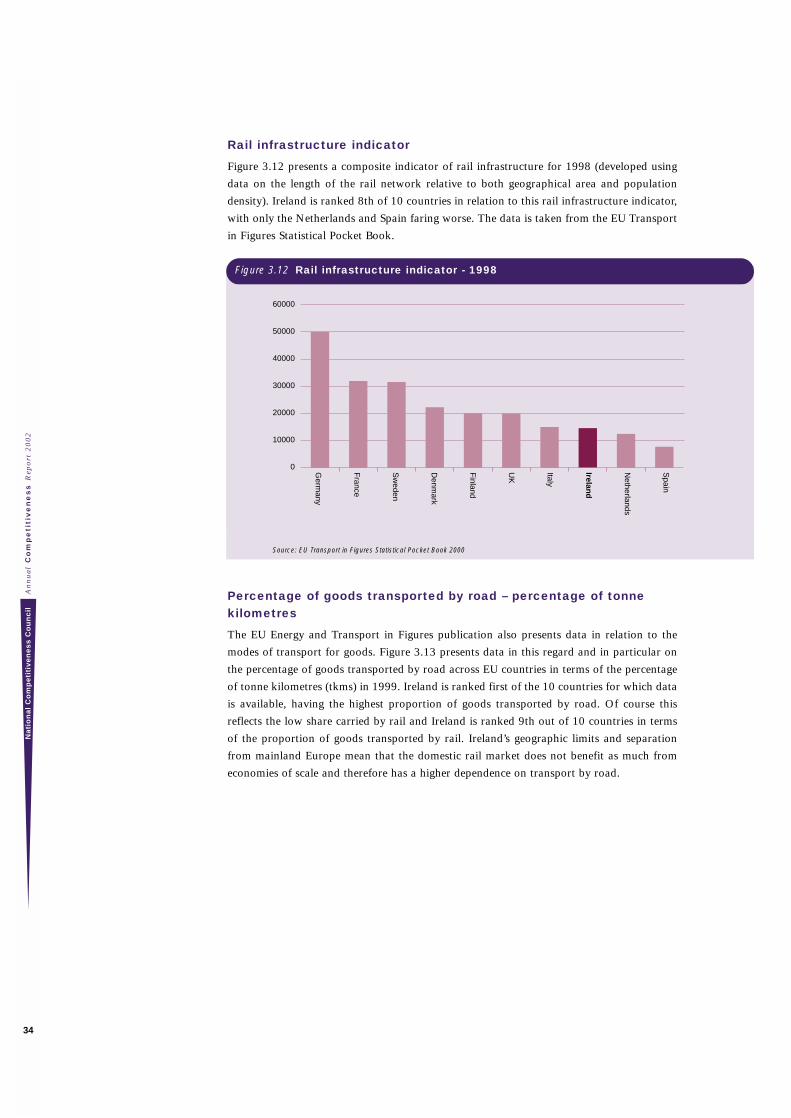
Rail infrastructure indicator
Figure 3.12 presents a composite indicator of rail infrastructure for 1998 (developed using
data on the length of the rail network relative to both geographical area and population
density). Ireland is ranked 8th of 10 countries in relation to this rail infrastructure indicator,
with only the Netherlands and Spain faring worse. The data is taken from the EU Transport
in Figures Statistical Pocket Book.
Source: EU Transport in Figures Statistical Pocket Book 2000
Percentage of goods transported by road – percentage of tonnekilometres
The EU Energy and Transport in Figures publication also presents data in relation to the
modes of transport for goods. Figure 3.13 presents data in this regard and in particular on
the percentage of goods transported by road across EU countries in terms of the percentage
of tonne kilometres (tkms) in 1999. Ireland is ranked first of the 10 countries for which data
is available, having the highest proportion of goods transported by road. Of course this
reflects the low share carried by rail and Ireland is ranked 9th out of 10 countries in terms
of the proportion of goods transported by rail. Ireland’s geographic limits and separation
from mainland Europe mean that the domestic rail market does not benefit as much from
economies of scale and therefore has a higher dependence on transport by road.
An
nu
al
Co
mp
eti
tiv
en
es
s R
epo
rt 2
00
2N
ati
on
al
Co
mp
eti
tiv
en
es
s C
ou
nc
il
34
Figure 3.12 Rail infrastructure indicator - 1998
0
10000
20000
30000
40000
50000
60000
Spain
Netherlands
Ireland
Italy
UK
Finland
Denm
ark
Sw
eden
France
Germ
any
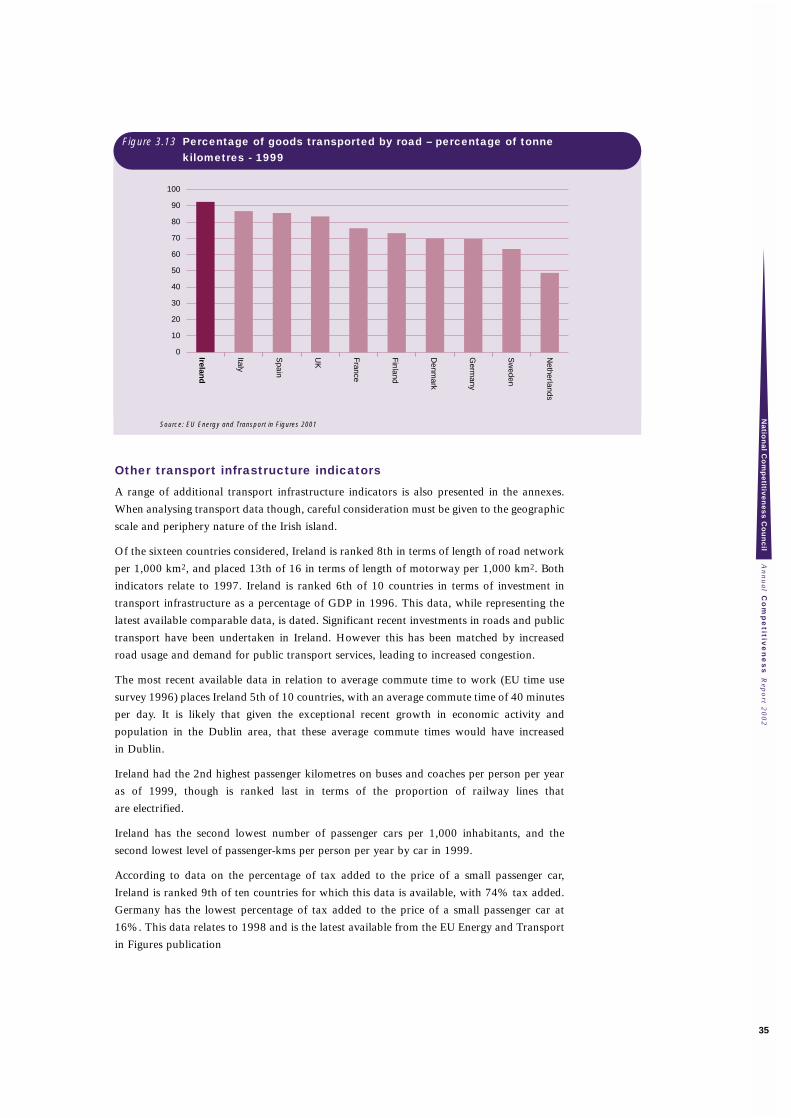
Source: EU Energy and Transport in Figures 2001
Other transport infrastructure indicators
A range of additional transport infrastructure indicators is also presented in the annexes.
When analysing transport data though, careful consideration must be given to the geographic
scale and periphery nature of the Irish island.
Of the sixteen countries considered, Ireland is ranked 8th in terms of length of road network
per 1,000 km2, and placed 13th of 16 in terms of length of motorway per 1,000 km2. Both
indicators relate to 1997. Ireland is ranked 6th of 10 countries in terms of investment in
transport infrastructure as a percentage of GDP in 1996. This data, while representing the
latest available comparable data, is dated. Significant recent investments in roads and public
transport have been undertaken in Ireland. However this has been matched by increased
road usage and demand for public transport services, leading to increased congestion.
The most recent available data in relation to average commute time to work (EU time use
survey 1996) places Ireland 5th of 10 countries, with an average commute time of 40 minutes
per day. It is likely that given the exceptional recent growth in economic activity and
population in the Dublin area, that these average commute times would have increased
in Dublin.
Ireland had the 2nd highest passenger kilometres on buses and coaches per person per year
as of 1999, though is ranked last in terms of the proportion of railway lines that
are electrified.
Ireland has the second lowest number of passenger cars per 1,000 inhabitants, and the
second lowest level of passenger-kms per person per year by car in 1999.
According to data on the percentage of tax added to the price of a small passenger car,
Ireland is ranked 9th of ten countries for which this data is available, with 74% tax added.
Germany has the lowest percentage of tax added to the price of a small passenger car at
16%. This data relates to 1998 and is the latest available from the EU Energy and Transport
in Figures publication
An
nu
al C
om
pe
titive
ne
ss R
epo
rt 20
02
Na
tion
al C
om
pe
titive
ne
ss
Co
un
cil
35
Figure 3.13 Percentage of goods transported by road – percentage of tonne kilometres - 1999
0
10
20
30
40
50
60
70
80
90
100
Netherlands
Sw
eden
Germ
any
Denm
ark
Finland
France
UK
Spain
Italy
Ireland
3.4 Environment and Energy
It is also important to consider competitiveness indicators pertaining to environment and
energy given the importance of sustainable development. Environmental and energy
resources are in general scarce, and pollution and environmental degradation can have long-
lasting and far-reaching costs.
A high quality environment is important both as an indicator of the quality of life as well as
a key requirement for economic performance. For example, the tourism industry and the
food industry in Ireland depend in many ways on a high quality environment. Efficient
energy use is also important in this regard.
In assessing Ireland’s relative competitiveness position in relation to the environment and
energy, we present three headline indicators:
• CO2 emissions per unit of GDP;
• Waste recycling – paper and cardboard (as % of consumption);
• Pollution abatement and control (total expenditure % GDP).
Furthermore, a number of additional indicators are assessed, namely:
• Major protected areas (% total area);
• Nitrogenous fertilisers used (tonnes per square km of arable land);
• Public waste water plants (% population connected);
• Water quality of selected rivers;
• Total final consumption of energy (per unit of GDP) %chya;
• Total final consumption of energy (per unit of GDP);
• Commercial energy use per capita (KG of oil);
• Municipal waste generated (kg per capita);
• Industrial waste.
CO2 emissions per unit of GDP
Figure 3.14 presents data on CO2 emissions per unit of GDP in 2000. Ireland is ranked 9th
of the sixteen countries under review in terms of CO2 emissions. Sweden has the lowest rate
of CO2 emissions based on the criterion, while Poland has the highest.
Given Ireland’s commitments under the Kyoto Protocol, decoupling CO2 emissions (and
emissions of the other five Greenhouse gases), and economic growth is a major challenge.
An
nu
al
Co
mp
eti
tiv
en
es
s R
epo
rt 2
00
2N
ati
on
al
Co
mp
eti
tiv
en
es
s C
ou
nc
il
36
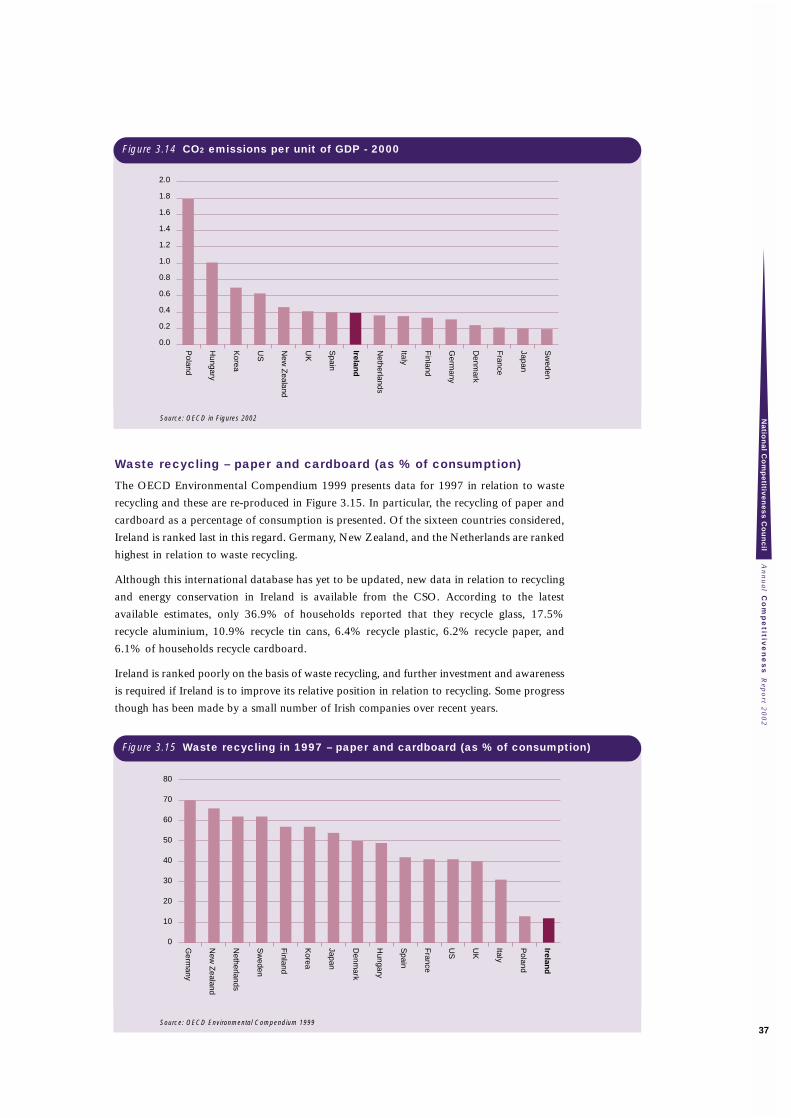
Source: OECD in Figures 2002
Waste recycling – paper and cardboard (as % of consumption)
The OECD Environmental Compendium 1999 presents data for 1997 in relation to waste
recycling and these are re-produced in Figure 3.15. In particular, the recycling of paper and
cardboard as a percentage of consumption is presented. Of the sixteen countries considered,
Ireland is ranked last in this regard. Germany, New Zealand, and the Netherlands are ranked
highest in relation to waste recycling.
Although this international database has yet to be updated, new data in relation to recycling
and energy conservation in Ireland is available from the CSO. According to the latest
available estimates, only 36.9% of households reported that they recycle glass, 17.5%
recycle aluminium, 10.9% recycle tin cans, 6.4% recycle plastic, 6.2% recycle paper, and
6.1% of households recycle cardboard.
Ireland is ranked poorly on the basis of waste recycling, and further investment and awareness
is required if Ireland is to improve its relative position in relation to recycling. Some progress
though has been made by a small number of Irish companies over recent years.
Source: OECD Environmental Compendium 1999
An
nu
al C
om
pe
titive
ne
ss R
epo
rt 20
02
Na
tion
al C
om
pe
titive
ne
ss
Co
un
cil
37
0.0
0.2
0.4
0.6
0.8
1.0
1.2
1.4
1.6
1.8
2.0
Sw
eden
Japan
France
Denm
ark
Germ
any
Finland
Italy
Netherlands
Ireland
Spain
UK
New
Zealand
US
Korea
Hungary
Poland
Figure 3.14 CO2 emissions per unit of GDP - 2000
Figure 3.15 Waste recycling in 1997 – paper and cardboard (as % of consumption)
0
10
20
30
40
50
60
70
80
Ireland
Poland
Italy
UK
US
France
Spain
Hungary
Denm
ark
Japan
Korea
Finland
Sw
eden
Netherlands
New
Zealand
Germ
any
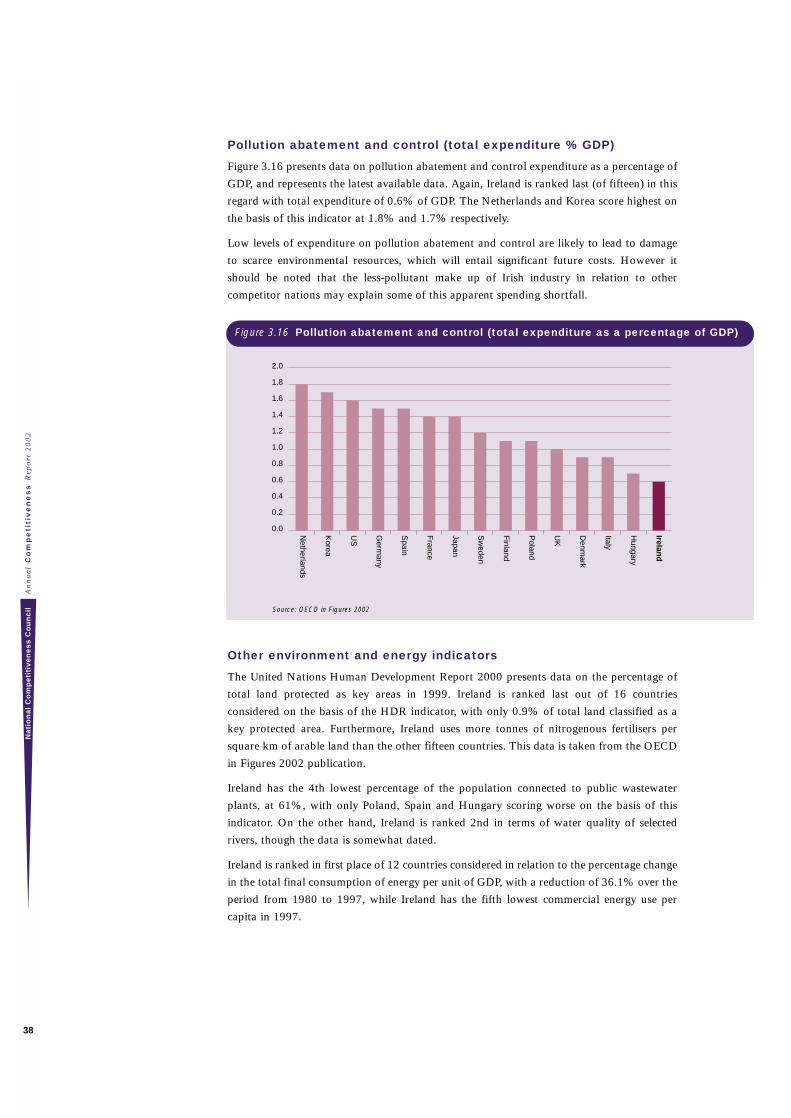
Pollution abatement and control (total expenditure % GDP)
Figure 3.16 presents data on pollution abatement and control expenditure as a percentage of
GDP, and represents the latest available data. Again, Ireland is ranked last (of fifteen) in this
regard with total expenditure of 0.6% of GDP. The Netherlands and Korea score highest on
the basis of this indicator at 1.8% and 1.7% respectively.
Low levels of expenditure on pollution abatement and control are likely to lead to damage
to scarce environmental resources, which will entail significant future costs. However it
should be noted that the less-pollutant make up of Irish industry in relation to other
competitor nations may explain some of this apparent spending shortfall.
Source: OECD in Figures 2002
Other environment and energy indicators
The United Nations Human Development Report 2000 presents data on the percentage of
total land protected as key areas in 1999. Ireland is ranked last out of 16 countries
considered on the basis of the HDR indicator, with only 0.9% of total land classified as a
key protected area. Furthermore, Ireland uses more tonnes of nitrogenous fertilisers per
square km of arable land than the other fifteen countries. This data is taken from the OECD
in Figures 2002 publication.
Ireland has the 4th lowest percentage of the population connected to public wastewater
plants, at 61%, with only Poland, Spain and Hungary scoring worse on the basis of this
indicator. On the other hand, Ireland is ranked 2nd in terms of water quality of selected
rivers, though the data is somewhat dated.
Ireland is ranked in first place of 12 countries considered in relation to the percentage change
in the total final consumption of energy per unit of GDP, with a reduction of 36.1% over the
period from 1980 to 1997, while Ireland has the fifth lowest commercial energy use per
capita in 1997.
An
nu
al
Co
mp
eti
tiv
en
es
s R
epo
rt 2
00
2N
ati
on
al
Co
mp
eti
tiv
en
es
s C
ou
nc
il
38
Figure 3.16 Pollution abatement and control (total expenditure as a percentage of GDP)
0.0
0.2
0.4
0.6
0.8
1.0
1.2
1.4
1.6
1.8
2.0
Ireland
Hungary
Italy
Denm
ark
UK
Poland
Finland
Sw
eden
Japan
France
Spain
Germ
any
US
Korea
Netherlands
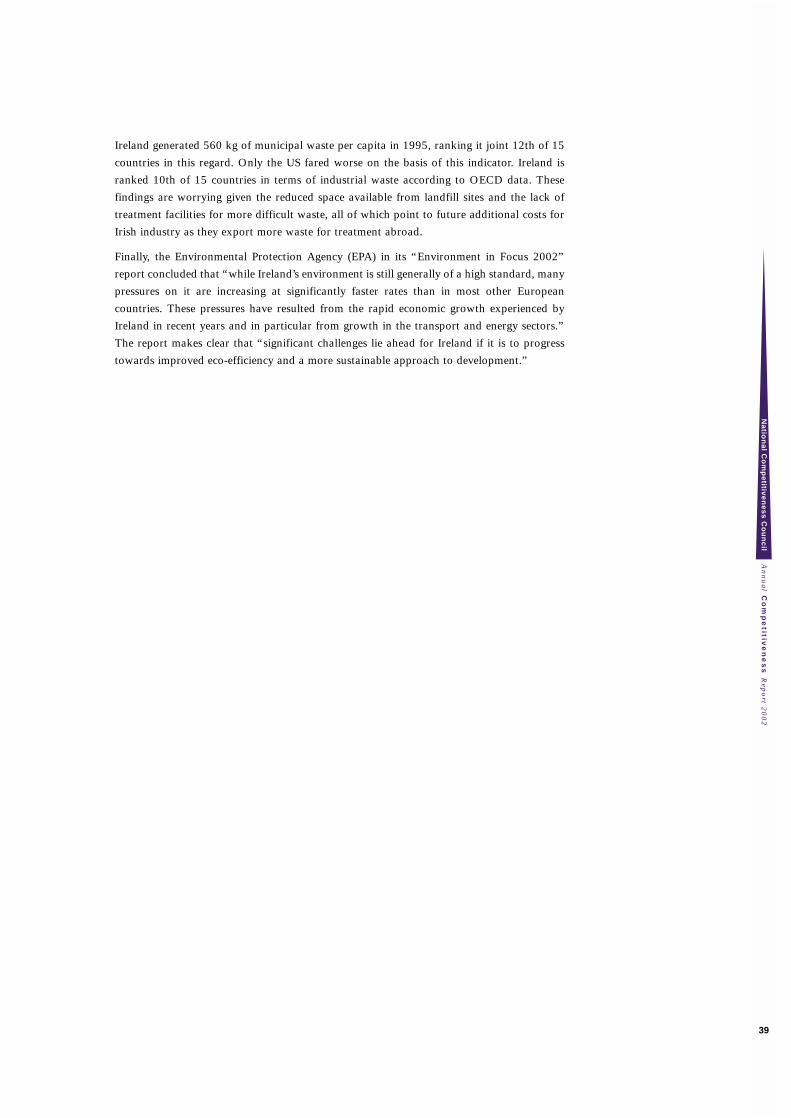
Ireland generated 560 kg of municipal waste per capita in 1995, ranking it joint 12th of 15
countries in this regard. Only the US fared worse on the basis of this indicator. Ireland is
ranked 10th of 15 countries in terms of industrial waste according to OECD data. These
findings are worrying given the reduced space available from landfill sites and the lack of
treatment facilities for more difficult waste, all of which point to future additional costs for
Irish industry as they export more waste for treatment abroad.
Finally, the Environmental Protection Agency (EPA) in its “Environment in Focus 2002”
report concluded that “while Ireland’s environment is still generally of a high standard, many
pressures on it are increasing at significantly faster rates than in most other European
countries. These pressures have resulted from the rapid economic growth experienced by
Ireland in recent years and in particular from growth in the transport and energy sectors.”
The report makes clear that “significant challenges lie ahead for Ireland if it is to progress
towards improved eco-efficiency and a more sustainable approach to development.”
An
nu
al C
om
pe
titive
ne
ss R
epo
rt 20
02
Na
tion
al C
om
pe
titive
ne
ss
Co
un
cil
39
3.5 Social Capital
Indicators in relation to social capital are also presented in the annexes to this report, and in
particular indicators in relation to:
• Income inequality (share of highest 20% to poorest 20% after transfers);
• Responsiveness of health systems; and,
• Interpersonal trust.
Income inequality, measured as the ratio of the share of the richest 20% to the share of the
poorest 20% ranks Ireland as 13th of 15 countries. According to this measure, only the UK
and the US have more unequal income/consumption distributions. This measure of income
inequality is taken from the Human Development Report 2002, and is consistent with other
data sources.
The World Health Organisation in their annual Report of 2000 presented an indicator in
relation to the responsiveness of health systems across countries. This indicator ranked
Ireland as 11th out of 16 in this regard in 1999.
Finally, an indicator relating to interpersonal trust is also presented for 2000. This indicator
presents survey evidence by country in relation to the proportion of the population who
indicate that people can generally be trusted in their country. For Ireland this proportion is
equal to 35.2%, the sixth highest of 12 countries for which the data is available. Denmark,
Sweden, and the Netherlands score highest on the basis of this indicator.
Overall on the basis of these social capital indicators, Ireland’s performance is mixed, with
poor scores in relation to income inequality and health systems, and an average score in
relation to interpersonal trust.
An
nu
al
Co
mp
eti
tiv
en
es
s R
epo
rt 2
00
2N
ati
on
al
Co
mp
eti
tiv
en
es
s C
ou
nc
il
40

Enterprise, R&D and Innovation4
4 Enterprise, R&D and Innovation
This chapter considers competitiveness indicators in relation to enterprise, R&D and
innovation. Investment in the capital stock is crucial for future economic development.
Furthermore, scientific and technological advance based on research and development
(R&D) and innovation, is an important determinant of economic growth.
Ireland’s investment record has been impressive during the boom years and ranks amongst
the highest of the OECD countries. There are however pressures in sustaining FDI flows - a
key source of investment - given the global slowdown and Ireland’s declining relative
competitiveness. This is a major challenge for policy. Improving R&D investment and
venture capital performance are also desirable.
The indicators considered here cover three main areas, namely:
• Investment and Capital;
• R&D and Innovation; and,
• Productivity.
An
nu
al
Co
mp
eti
tiv
en
es
s R
epo
rt 2
00
2N
ati
on
al
Co
mp
eti
tiv
en
es
s C
ou
nc
il
42
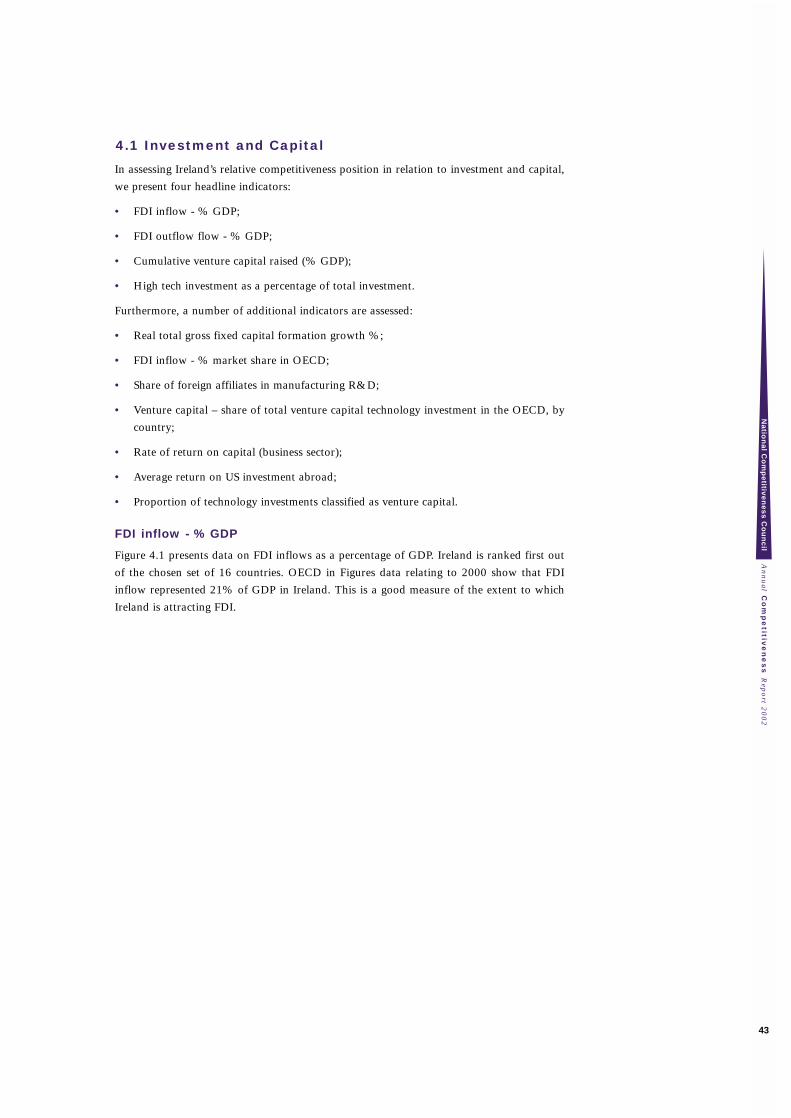
4.1 Investment and Capital
In assessing Ireland’s relative competitiveness position in relation to investment and capital,
we present four headline indicators:
• FDI inflow - % GDP;
• FDI outflow flow - % GDP;
• Cumulative venture capital raised (% GDP);
• High tech investment as a percentage of total investment.
Furthermore, a number of additional indicators are assessed:
• Real total gross fixed capital formation growth %;
• FDI inflow - % market share in OECD;
• Share of foreign affiliates in manufacturing R&D;
• Venture capital – share of total venture capital technology investment in the OECD, by
country;
• Rate of return on capital (business sector);
• Average return on US investment abroad;
• Proportion of technology investments classified as venture capital.
FDI inflow - % GDP
Figure 4.1 presents data on FDI inflows as a percentage of GDP. Ireland is ranked first out
of the chosen set of 16 countries. OECD in Figures data relating to 2000 show that FDI
inflow represented 21% of GDP in Ireland. This is a good measure of the extent to which
Ireland is attracting FDI.
An
nu
al C
om
pe
titive
ne
ss R
epo
rt 20
02
Na
tion
al C
om
pe
titive
ne
ss
Co
un
cil
43
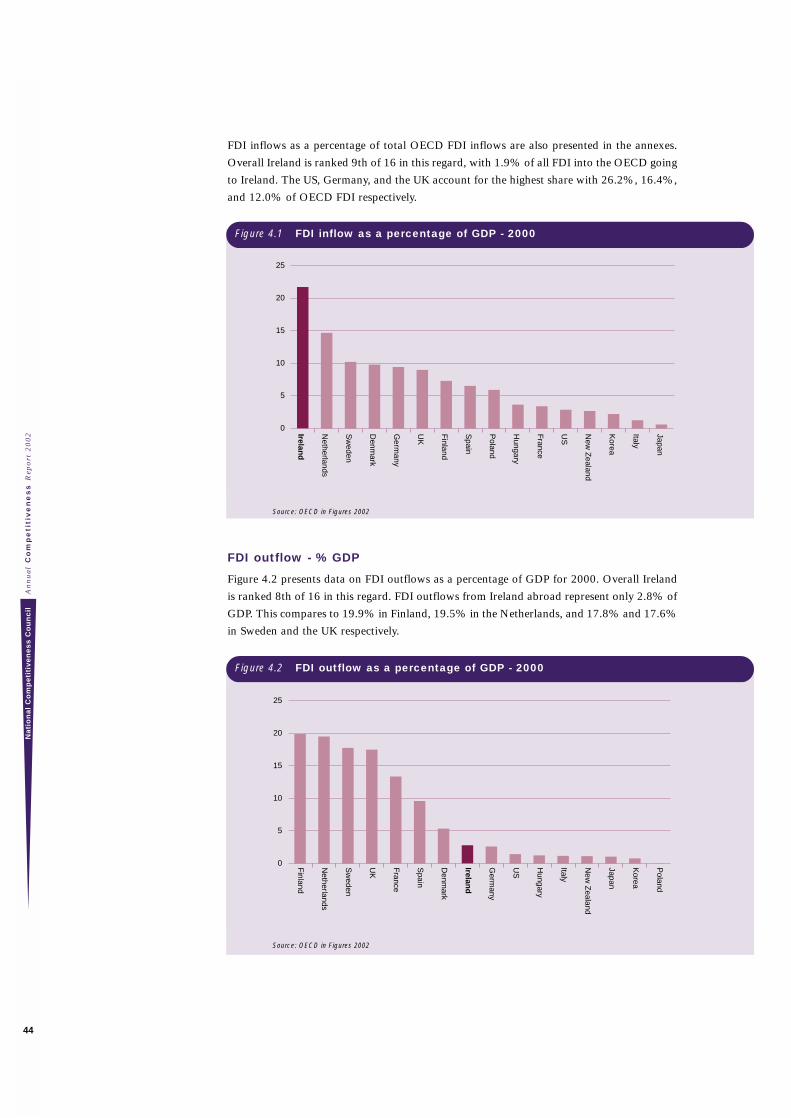
FDI inflows as a percentage of total OECD FDI inflows are also presented in the annexes.
Overall Ireland is ranked 9th of 16 in this regard, with 1.9% of all FDI into the OECD going
to Ireland. The US, Germany, and the UK account for the highest share with 26.2%, 16.4%,
and 12.0% of OECD FDI respectively.
Source: OECD in Figures 2002
FDI outflow - % GDP
Figure 4.2 presents data on FDI outflows as a percentage of GDP for 2000. Overall Ireland
is ranked 8th of 16 in this regard. FDI outflows from Ireland abroad represent only 2.8% of
GDP. This compares to 19.9% in Finland, 19.5% in the Netherlands, and 17.8% and 17.6%
in Sweden and the UK respectively.
Source: OECD in Figures 2002
An
nu
al
Co
mp
eti
tiv
en
es
s R
epo
rt 2
00
2N
ati
on
al
Co
mp
eti
tiv
en
es
s C
ou
nc
il
44
Figure 4.1 FDI inflow as a percentage of GDP - 2000
0
5
10
15
20
25
Japan
Italy
Korea
New
Zealand
US
France
Hungary
Poland
Spain
Finland
UK
Germ
any
Denm
ark
Sw
eden
Netherlands
Ireland
Figure 4.2 FDI outflow as a percentage of GDP - 2000
0
5
10
15
20
25
Poland
Korea
Japan
New
Zealand
Italy
Hungary
US
Germ
any
Ireland
Denm
ark
Spain
France
UK
Sw
eden
Netherlands
Finland
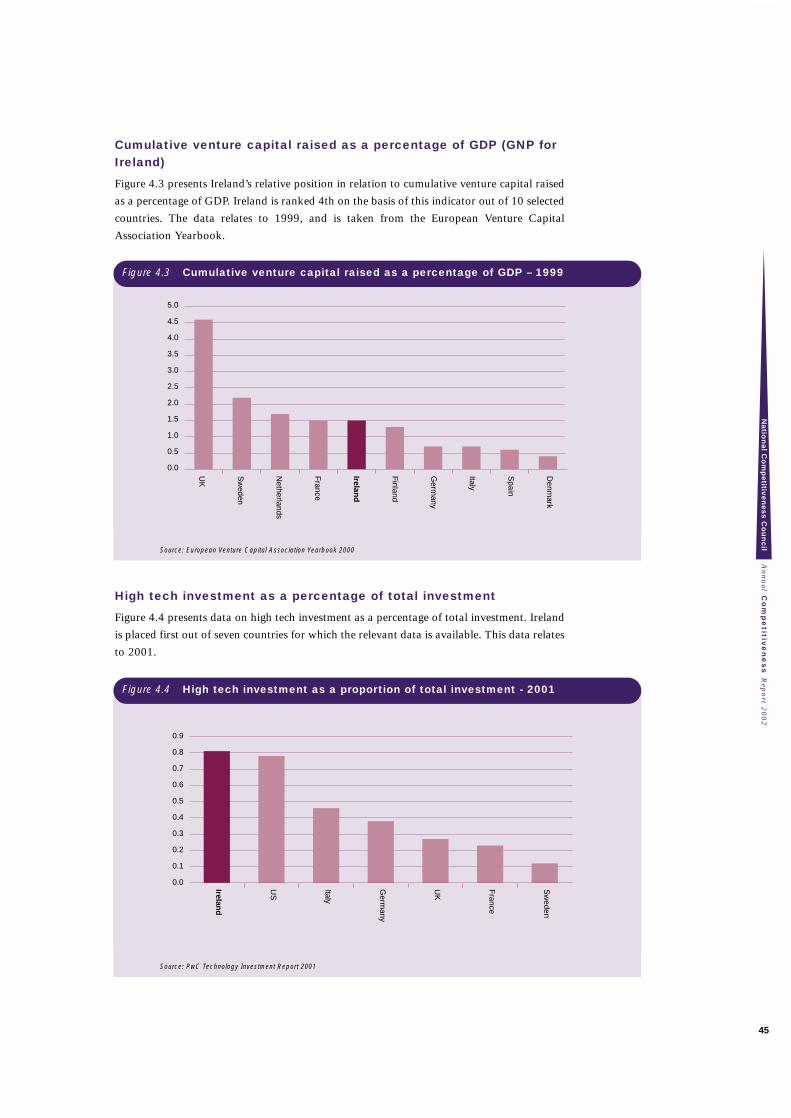
Cumulative venture capital raised as a percentage of GDP (GNP forIreland)
Figure 4.3 presents Ireland’s relative position in relation to cumulative venture capital raised
as a percentage of GDP. Ireland is ranked 4th on the basis of this indicator out of 10 selected
countries. The data relates to 1999, and is taken from the European Venture Capital
Association Yearbook.
Source: European Venture Capital Association Yearbook 2000
High tech investment as a percentage of total investment
Figure 4.4 presents data on high tech investment as a percentage of total investment. Ireland
is placed first out of seven countries for which the relevant data is available. This data relates
to 2001.
Source: PwC Technology Investment Report 2001
An
nu
al C
om
pe
titive
ne
ss R
epo
rt 20
02
Na
tion
al C
om
pe
titive
ne
ss
Co
un
cil
45
Figure 4.3 Cumulative venture capital raised as a percentage of GDP – 1999
0.0
0.5
1.0
1.5
2.0
2.5
3.0
3.5
4.0
4.5
5.0
Denm
ark
Spain
Italy
Germ
any
Finland
Ireland
France
Netherlands
Sw
eden
UK
Figure 4.4 High tech investment as a proportion of total investment - 2001
0.0
0.1
0.2
0.3
0.4
0.5
0.6
0.7
0.8
0.9
Sw
eden
France
UK
Germ
any
Italy
US
Ireland
Other investment and capital indicators
A number of additional indicators are worthy of consideration in relation to investment and
capital and these are included in the Annex. Ireland is ranked 7th of 16 countries in relation
to growth in real total gross fixed capital formation in 2001.
Ireland is ranked 11th of 12 countries with respect to the share of foreign affiliates in
manufacturing R&D in 1997.
Data on the share of total venture capital technology investment in Europe, by country
suggests Ireland is placed 10th out of twelve countries on the basis of this criterion. Ireland
received 1.2% of OECD venture capital investment in 2001, compared to 26.3% in the UK,
the highest ranked country on the basis of this indicator
The rate of return on capital in the business sector was 4th highest in Ireland out of 12
countries in 1998, while the average return on US investment abroad was second highest in
Ireland between 1995 and 1998.
Finally, Ireland is ranked last in terms of the proportion of technology investments classified
as venture capital technology investments, at 56% in 2001.
These trends indicate a mixed picture. Clearly the economy benefited from a significant
expansion in investment. However, in some indicators such as investment from venture capital,
Ireland ranks less well. It is difficult to fully explain these trends but they may well reflect the
dominance of FDI as a source of investment and a still maturing venture capital market.
An
nu
al
Co
mp
eti
tiv
en
es
s R
epo
rt 2
00
2N
ati
on
al
Co
mp
eti
tiv
en
es
s C
ou
nc
il
46
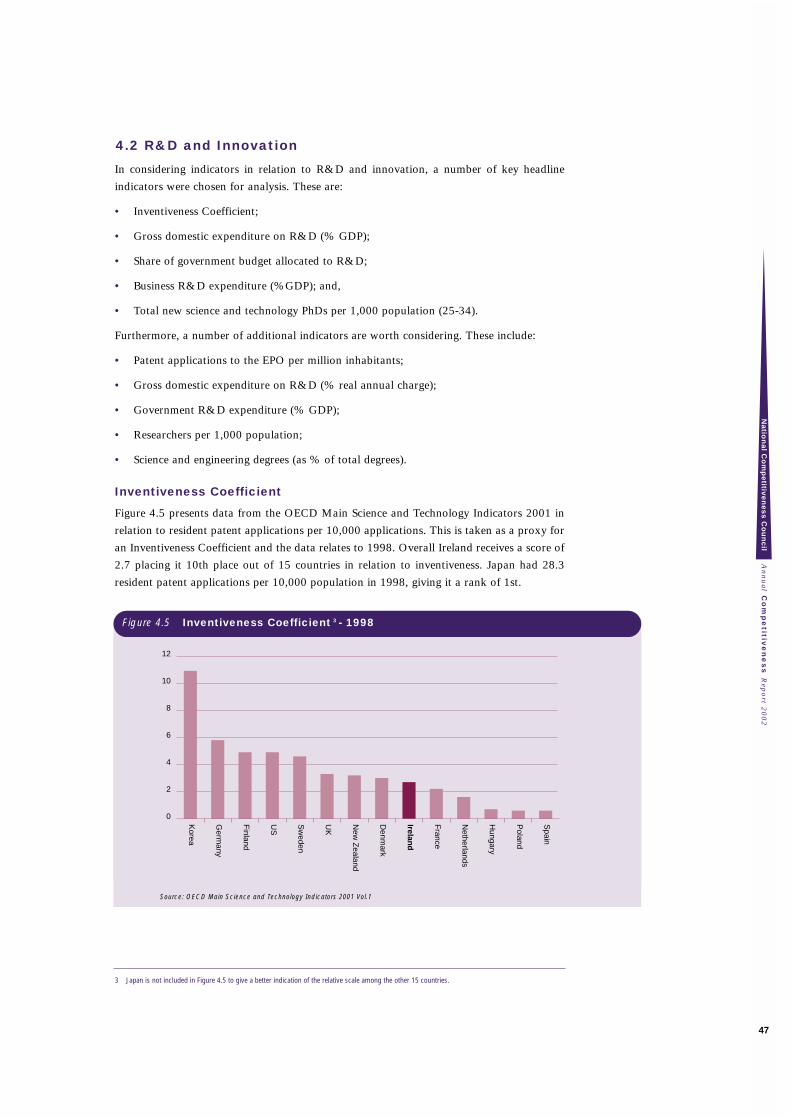
4.2 R&D and Innovation
In considering indicators in relation to R&D and innovation, a number of key headline
indicators were chosen for analysis. These are:
• Inventiveness Coefficient;
• Gross domestic expenditure on R&D (% GDP);
• Share of government budget allocated to R&D;
• Business R&D expenditure (%GDP); and,
• Total new science and technology PhDs per 1,000 population (25-34).
Furthermore, a number of additional indicators are worth considering. These include:
• Patent applications to the EPO per million inhabitants;
• Gross domestic expenditure on R&D (% real annual charge);
• Government R&D expenditure (% GDP);
• Researchers per 1,000 population;
• Science and engineering degrees (as % of total degrees).
Inventiveness Coefficient
Figure 4.5 presents data from the OECD Main Science and Technology Indicators 2001 in
relation to resident patent applications per 10,000 applications. This is taken as a proxy for
an Inventiveness Coefficient and the data relates to 1998. Overall Ireland receives a score of
2.7 placing it 10th place out of 15 countries in relation to inventiveness. Japan had 28.3
resident patent applications per 10,000 population in 1998, giving it a rank of 1st.
Source: OECD Main Science and Technology Indicators 2001 Vol.1
3 Japan is not included in Figure 4.5 to give a better indication of the relative scale among the other 15 countries.
An
nu
al C
om
pe
titive
ne
ss R
epo
rt 20
02
Na
tion
al C
om
pe
titive
ne
ss
Co
un
cil
47
0
2
4
6
8
10
12
Spain
Poland
Hungary
Netherlands
France
Ireland
Denm
ark
New
Zealand
UK
Sw
eden
US
Finland
Germ
any
Korea
Figure 4.5 Inventiveness Coefficient 3 - 1998
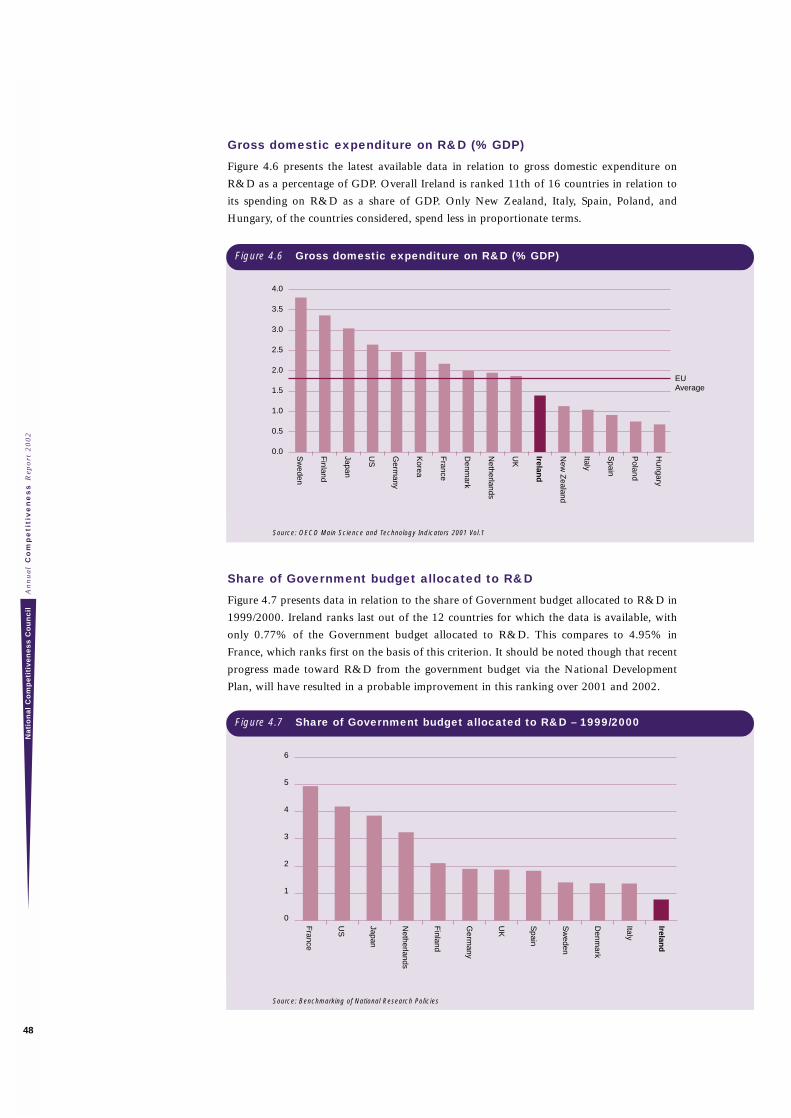
Gross domestic expenditure on R&D (% GDP)
Figure 4.6 presents the latest available data in relation to gross domestic expenditure on
R&D as a percentage of GDP. Overall Ireland is ranked 11th of 16 countries in relation to
its spending on R&D as a share of GDP. Only New Zealand, Italy, Spain, Poland, and
Hungary, of the countries considered, spend less in proportionate terms.
Source: OECD Main Science and Technology Indicators 2001 Vol.1
Share of Government budget allocated to R&D
Figure 4.7 presents data in relation to the share of Government budget allocated to R&D in
1999/2000. Ireland ranks last out of the 12 countries for which the data is available, with
only 0.77% of the Government budget allocated to R&D. This compares to 4.95% in
France, which ranks first on the basis of this criterion. It should be noted though that recent
progress made toward R&D from the government budget via the National Development
Plan, will have resulted in a probable improvement in this ranking over 2001 and 2002.
Source: Benchmarking of National Research Policies
An
nu
al
Co
mp
eti
tiv
en
es
s R
epo
rt 2
00
2N
ati
on
al
Co
mp
eti
tiv
en
es
s C
ou
nc
il
48
Figure 4.7 Share of Government budget allocated to R&D – 1999/2000
0
1
2
3
4
5
6
Ireland
Italy
Denm
ark
Sw
eden
Spain
UK
Germ
any
Finland
Netherlands
Japan
US
France
Figure 4.6 Gross domestic expenditure on R&D (% GDP)
0.0
0.5
1.0
1.5
2.0
2.5
3.0
3.5
4.0
Hungary
Poland
Spain
Italy
New
Zealand
Ireland
UK
Netherlands
Denm
ark
France
Korea
Germ
any
US
Japan
Finland
Sw
eden
EU Average
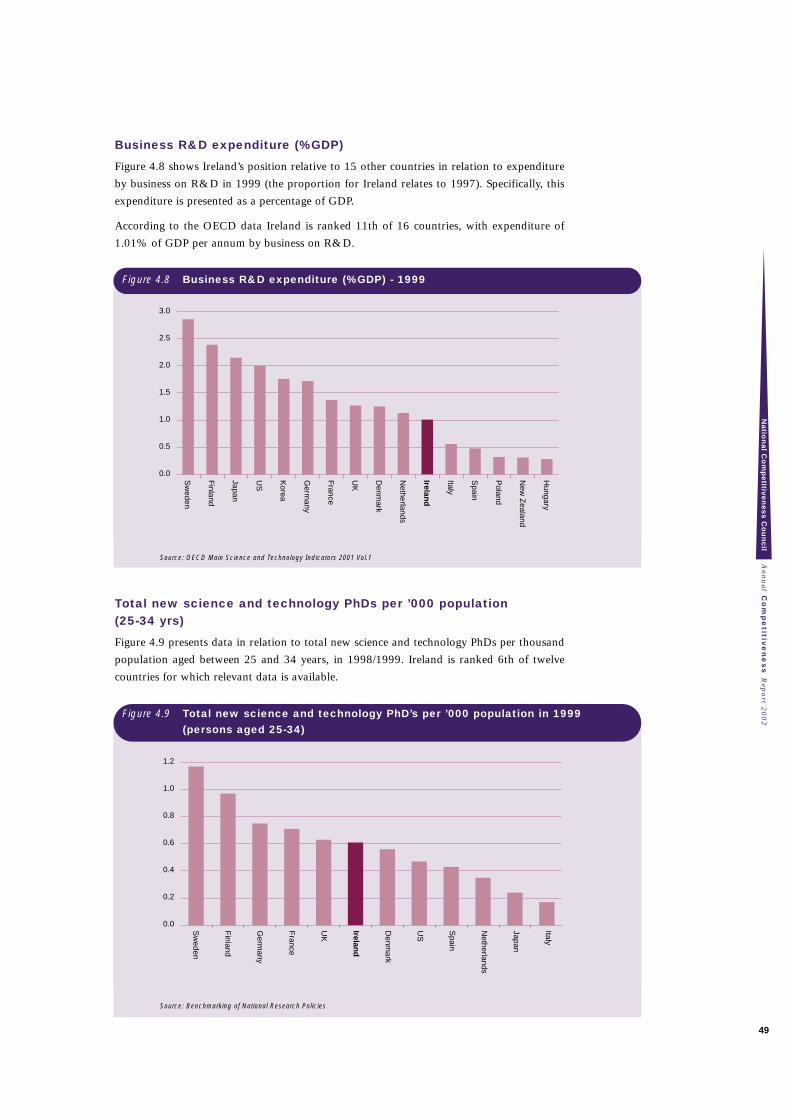
Business R&D expenditure (%GDP)
Figure 4.8 shows Ireland’s position relative to 15 other countries in relation to expenditure
by business on R&D in 1999 (the proportion for Ireland relates to 1997). Specifically, this
expenditure is presented as a percentage of GDP.
According to the OECD data Ireland is ranked 11th of 16 countries, with expenditure of
1.01% of GDP per annum by business on R&D.
Source: OECD Main Science and Technology Indicators 2001 Vol.1
Total new science and technology PhDs per ’000 population (25-34 yrs)
Figure 4.9 presents data in relation to total new science and technology PhDs per thousand
population aged between 25 and 34 years, in 1998/1999. Ireland is ranked 6th of twelve
countries for which relevant data is available.
Source: Benchmarking of National Research Policies
An
nu
al C
om
pe
titive
ne
ss R
epo
rt 20
02
Na
tion
al C
om
pe
titive
ne
ss
Co
un
cil
49
0.0
0.2
0.4
0.6
0.8
1.0
1.2
Italy
Japan
Netherlands
Spain
US
Denm
ark
Ireland
UK
France
Germ
any
Finland
Sw
eden
Figure 4.9 Total new science and technology PhD’s per ’000 population in 1999 (persons aged 25-34)
Figure 4.8 Business R&D expenditure (%GDP) - 1999
0.0
0.5
1.0
1.5
2.0
2.5
3.0
Hungary
New
Zealand
Poland
Spain
Italy
Ireland
Netherlands
Denm
ark
UK
France
Germ
any
Korea
US
Japan
Finland
Sw
eden
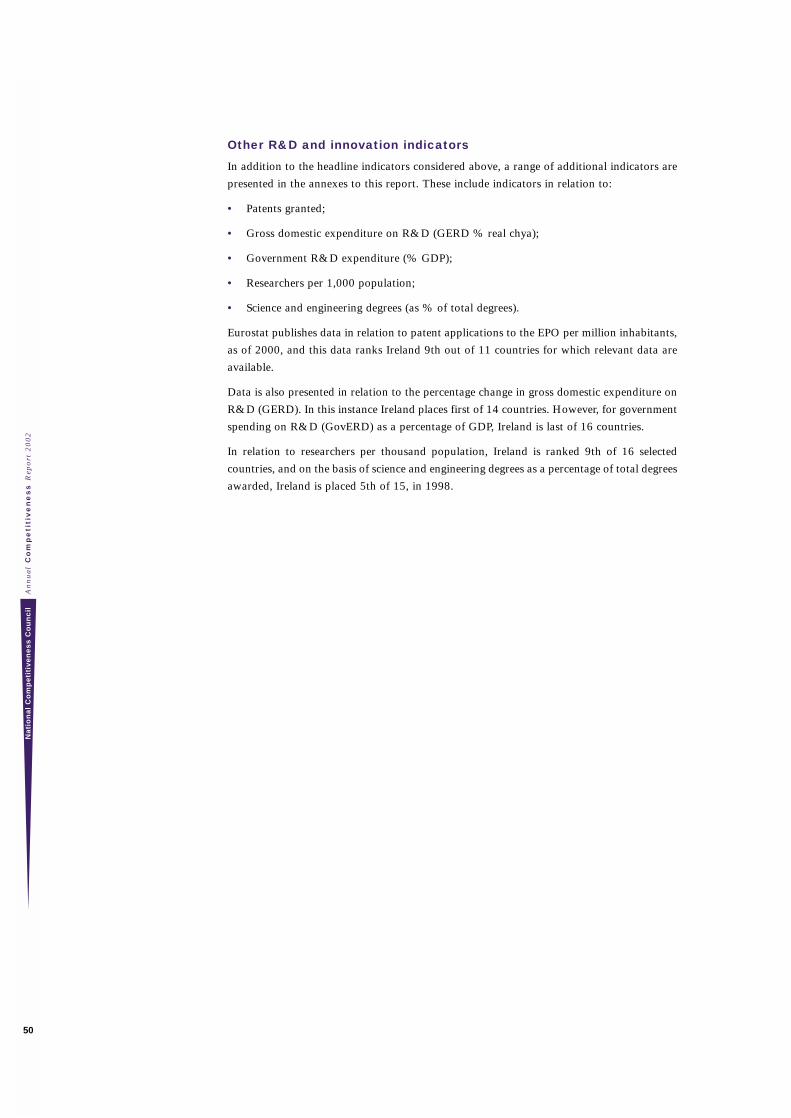
Other R&D and innovation indicators
In addition to the headline indicators considered above, a range of additional indicators are
presented in the annexes to this report. These include indicators in relation to:
• Patents granted;
• Gross domestic expenditure on R&D (GERD % real chya);
• Government R&D expenditure (% GDP);
• Researchers per 1,000 population;
• Science and engineering degrees (as % of total degrees).
Eurostat publishes data in relation to patent applications to the EPO per million inhabitants,
as of 2000, and this data ranks Ireland 9th out of 11 countries for which relevant data are
available.
Data is also presented in relation to the percentage change in gross domestic expenditure on
R&D (GERD). In this instance Ireland places first of 14 countries. However, for government
spending on R&D (GovERD) as a percentage of GDP, Ireland is last of 16 countries.
In relation to researchers per thousand population, Ireland is ranked 9th of 16 selected
countries, and on the basis of science and engineering degrees as a percentage of total degrees
awarded, Ireland is placed 5th of 15, in 1998.
An
nu
al
Co
mp
eti
tiv
en
es
s R
epo
rt 2
00
2N
ati
on
al
Co
mp
eti
tiv
en
es
s C
ou
nc
il
50
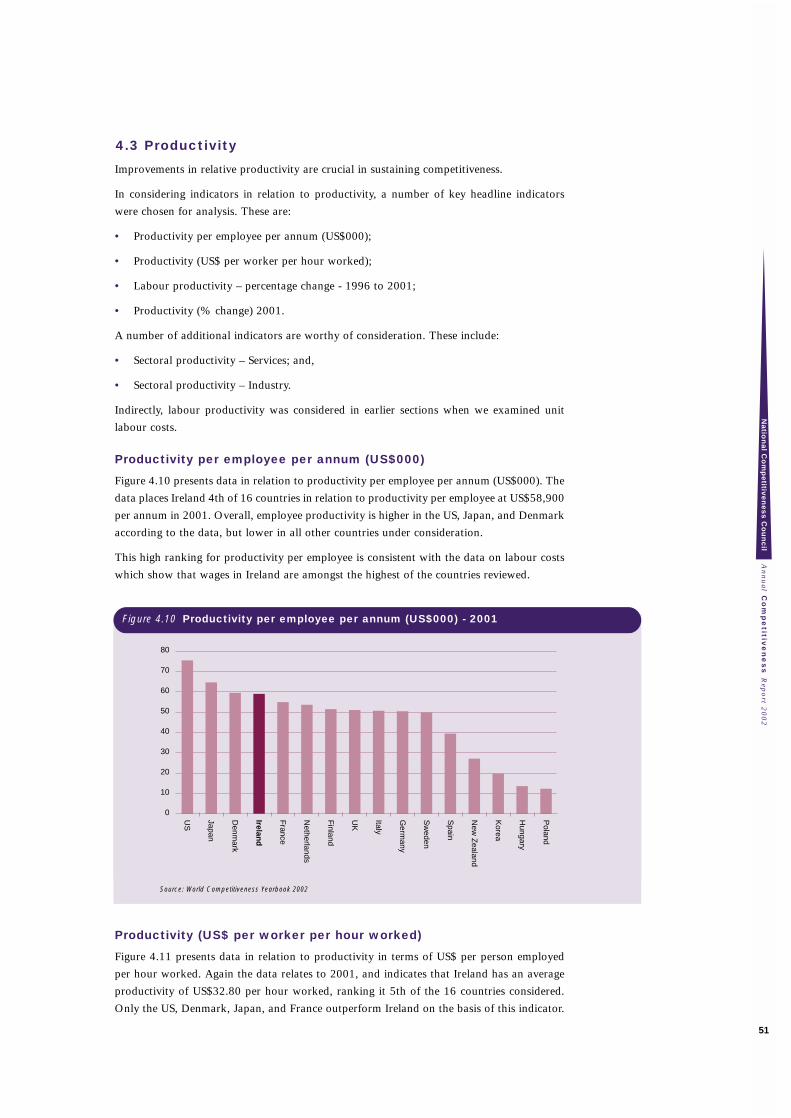
4.3 Productivity
Improvements in relative productivity are crucial in sustaining competitiveness.
In considering indicators in relation to productivity, a number of key headline indicators
were chosen for analysis. These are:
• Productivity per employee per annum (US$000);
• Productivity (US$ per worker per hour worked);
• Labour productivity – percentage change - 1996 to 2001;
• Productivity (% change) 2001.
A number of additional indicators are worthy of consideration. These include:
• Sectoral productivity – Services; and,
• Sectoral productivity – Industry.
Indirectly, labour productivity was considered in earlier sections when we examined unit
labour costs.
Productivity per employee per annum (US$000)
Figure 4.10 presents data in relation to productivity per employee per annum (US$000). The
data places Ireland 4th of 16 countries in relation to productivity per employee at US$58,900
per annum in 2001. Overall, employee productivity is higher in the US, Japan, and Denmark
according to the data, but lower in all other countries under consideration.
This high ranking for productivity per employee is consistent with the data on labour costs
which show that wages in Ireland are amongst the highest of the countries reviewed.
Source: World Competitiveness Yearbook 2002
Productivity (US$ per worker per hour worked)
Figure 4.11 presents data in relation to productivity in terms of US$ per person employed
per hour worked. Again the data relates to 2001, and indicates that Ireland has an average
productivity of US$32.80 per hour worked, ranking it 5th of the 16 countries considered.
Only the US, Denmark, Japan, and France outperform Ireland on the basis of this indicator.
An
nu
al C
om
pe
titive
ne
ss R
epo
rt 20
02
Na
tion
al C
om
pe
titive
ne
ss
Co
un
cil
51
Figure 4.10 Productivity per employee per annum (US$000) - 2001
0
10
20
30
40
50
60
70
80
Poland
Hungary
Korea
New
Zealand
Spain
Sw
eden
Germ
any
Italy
UK
Finland
Netherlands
France
Ireland
Denm
ark
Japan
US
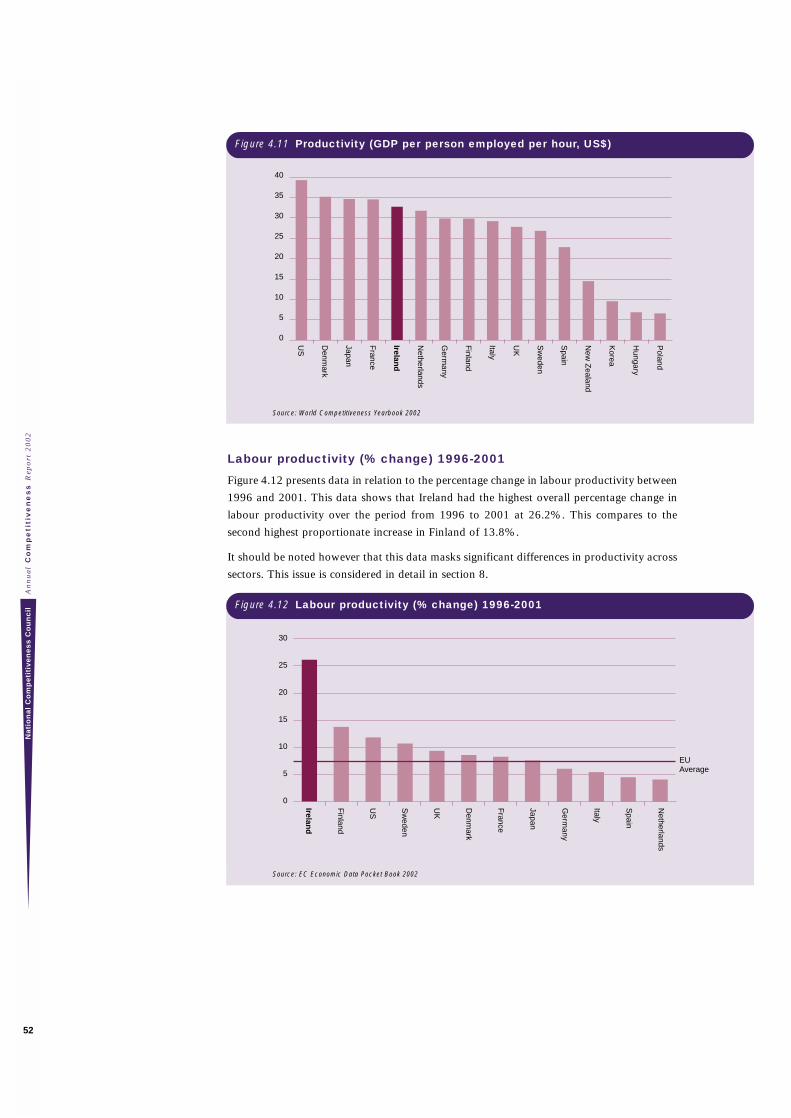
Source: World Competitiveness Yearbook 2002
Labour productivity (% change) 1996-2001
Figure 4.12 presents data in relation to the percentage change in labour productivity between
1996 and 2001. This data shows that Ireland had the highest overall percentage change in
labour productivity over the period from 1996 to 2001 at 26.2%. This compares to the
second highest proportionate increase in Finland of 13.8%.
It should be noted however that this data masks significant differences in productivity across
sectors. This issue is considered in detail in section 8.
Source: EC Economic Data Pocket Book 2002
An
nu
al
Co
mp
eti
tiv
en
es
s R
epo
rt 2
00
2N
ati
on
al
Co
mp
eti
tiv
en
es
s C
ou
nc
il
52
Figure 4.12 Labour productivity (% change) 1996-2001
0
5
10
15
20
25
30
Netherlands
Spain
Italy
Germ
any
Japan
France
Denm
ark
UK
Sw
eden
US
Finland
Ireland
EU Average
Figure 4.11 Productivity (GDP per person employed per hour, US$)
0
5
10
15
20
25
30
35
40
Poland
Hungary
Korea
New
Zealand
Spain
Sw
eden
UK
Italy
Finland
Germ
any
Netherlands
Ireland
France
Japan
Denm
ark
US
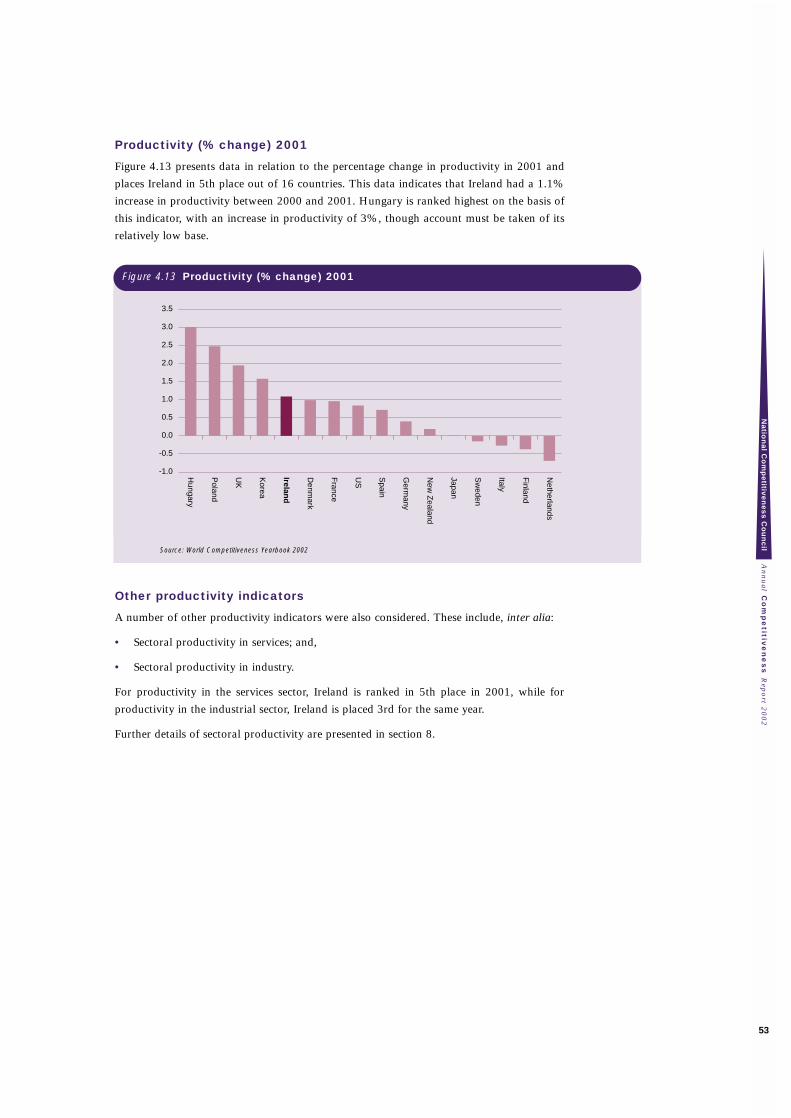
Productivity (% change) 2001
Figure 4.13 presents data in relation to the percentage change in productivity in 2001 and
places Ireland in 5th place out of 16 countries. This data indicates that Ireland had a 1.1%
increase in productivity between 2000 and 2001. Hungary is ranked highest on the basis of
this indicator, with an increase in productivity of 3%, though account must be taken of its
relatively low base.
Source: World Competitiveness Yearbook 2002
Other productivity indicators
A number of other productivity indicators were also considered. These include, inter alia:
• Sectoral productivity in services; and,
• Sectoral productivity in industry.
For productivity in the services sector, Ireland is ranked in 5th place in 2001, while for
productivity in the industrial sector, Ireland is placed 3rd for the same year.
Further details of sectoral productivity are presented in section 8.
An
nu
al C
om
pe
titive
ne
ss R
epo
rt 20
02
Na
tion
al C
om
pe
titive
ne
ss
Co
un
cil
53
Figure 4.13 Productivity (% change) 2001
-1.0
-0.5
0.0
0.5
1.0
1.5
2.0
2.5
3.0
3.5
Netherlands
Finland
Italy
Sw
eden
Japan
New
Zealand
Germ
any
Spain
US
France
Denm
ark
Ireland
Korea
UK
Poland
Hungary

An
nu
al
Co
mp
eti
tiv
en
es
s R
epo
rt 2
00
2N
ati
on
al
Co
mp
eti
tiv
en
es
s C
ou
nc
il
54

Outputs5

5 Outputs
Next we consider the output indicators from the Competitiveness Framework as described
in section 1. These indicators represent the results and outputs from Ireland’s relative
competitiveness and include indicators in relation to:
• Macroeconomic Performance;
• Internationalisation.
On the key macro indicators Ireland’s performance is very impressive and has ranked highly
for the last number of years. Although the economy is slowing, this is reflected in most
countries as the global slowdown continues leaving our relative position unchanged.
An
nu
al
Co
mp
eti
tiv
en
es
s R
epo
rt 2
00
2N
ati
on
al
Co
mp
eti
tiv
en
es
s C
ou
nc
il
56
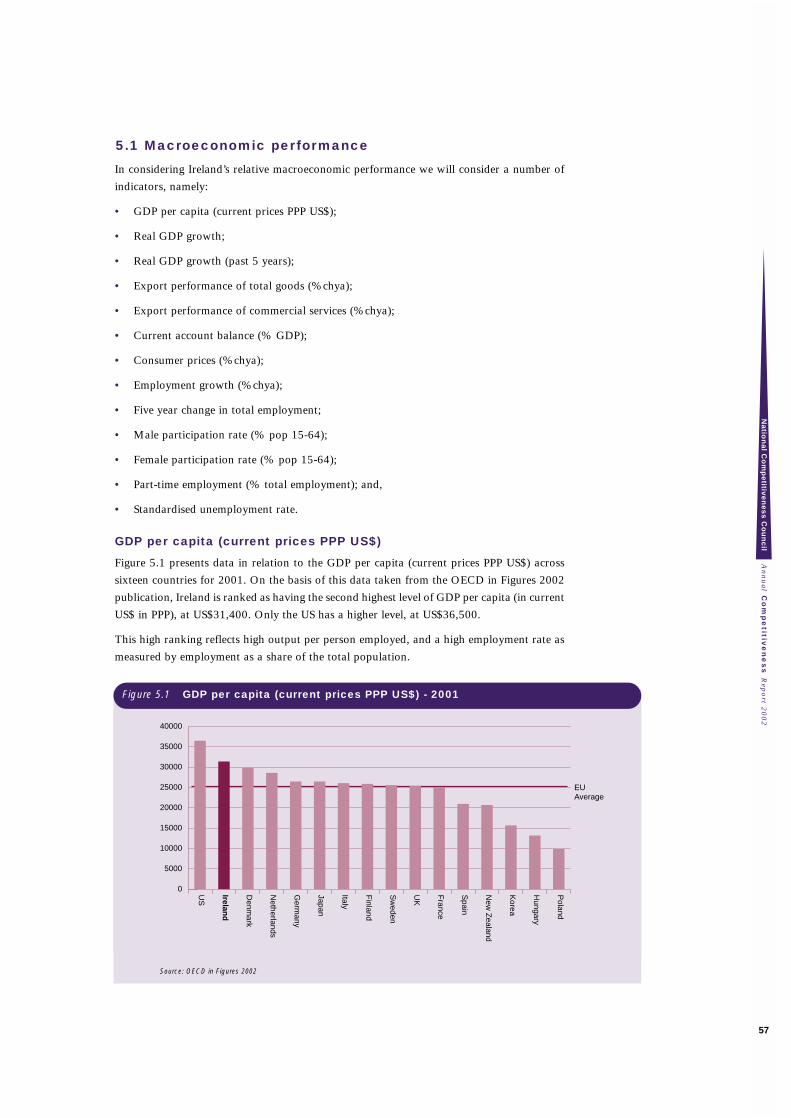
5.1 Macroeconomic performance
In considering Ireland’s relative macroeconomic performance we will consider a number of
indicators, namely:
• GDP per capita (current prices PPP US$);
• Real GDP growth;
• Real GDP growth (past 5 years);
• Export performance of total goods (%chya);
• Export performance of commercial services (%chya);
• Current account balance (% GDP);
• Consumer prices (%chya);
• Employment growth (%chya);
• Five year change in total employment;
• Male participation rate (% pop 15-64);
• Female participation rate (% pop 15-64);
• Part-time employment (% total employment); and,
• Standardised unemployment rate.
GDP per capita (current prices PPP US$)
Figure 5.1 presents data in relation to the GDP per capita (current prices PPP US$) across
sixteen countries for 2001. On the basis of this data taken from the OECD in Figures 2002
publication, Ireland is ranked as having the second highest level of GDP per capita (in current
US$ in PPP), at US$31,400. Only the US has a higher level, at US$36,500.
This high ranking reflects high output per person employed, and a high employment rate as
measured by employment as a share of the total population.
Source: OECD in Figures 2002
An
nu
al C
om
pe
titive
ne
ss R
epo
rt 20
02
Na
tion
al C
om
pe
titive
ne
ss
Co
un
cil
57
Figure 5.1 GDP per capita (current prices PPP US$) - 2001
0
5000
10000
15000
20000
25000
30000
35000
40000
EU Average
Poland
Hungary
Korea
New
Zealand
Spain
France
UK
Sw
eden
Finland
Italy
Japan
Germ
any
Netherlands
Denm
ark
Ireland
US
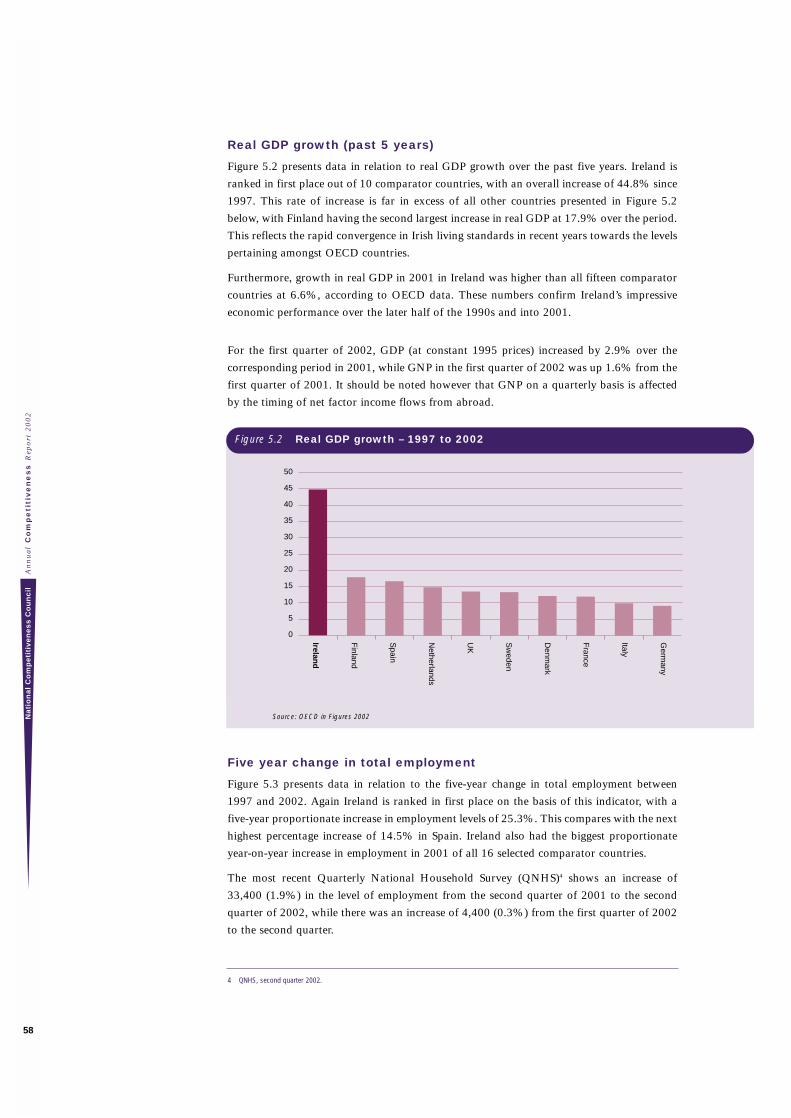
Real GDP growth (past 5 years)
Figure 5.2 presents data in relation to real GDP growth over the past five years. Ireland is
ranked in first place out of 10 comparator countries, with an overall increase of 44.8% since
1997. This rate of increase is far in excess of all other countries presented in Figure 5.2
below, with Finland having the second largest increase in real GDP at 17.9% over the period.
This reflects the rapid convergence in Irish living standards in recent years towards the levels
pertaining amongst OECD countries.
Furthermore, growth in real GDP in 2001 in Ireland was higher than all fifteen comparator
countries at 6.6%, according to OECD data. These numbers confirm Ireland’s impressive
economic performance over the later half of the 1990s and into 2001.
For the first quarter of 2002, GDP (at constant 1995 prices) increased by 2.9% over the
corresponding period in 2001, while GNP in the first quarter of 2002 was up 1.6% from the
first quarter of 2001. It should be noted however that GNP on a quarterly basis is affected
by the timing of net factor income flows from abroad.
Source: OECD in Figures 2002
Five year change in total employment
Figure 5.3 presents data in relation to the five-year change in total employment between
1997 and 2002. Again Ireland is ranked in first place on the basis of this indicator, with a
five-year proportionate increase in employment levels of 25.3%. This compares with the next
highest percentage increase of 14.5% in Spain. Ireland also had the biggest proportionate
year-on-year increase in employment in 2001 of all 16 selected comparator countries.
The most recent Quarterly National Household Survey (QNHS)4 shows an increase of
33,400 (1.9%) in the level of employment from the second quarter of 2001 to the second
quarter of 2002, while there was an increase of 4,400 (0.3%) from the first quarter of 2002
to the second quarter.
An
nu
al
Co
mp
eti
tiv
en
es
s R
epo
rt 2
00
2N
ati
on
al
Co
mp
eti
tiv
en
es
s C
ou
nc
il
58
4 QNHS, second quarter 2002.
Figure 5.2 Real GDP growth – 1997 to 2002
0
5
10
15
20
25
30
35
40
45
50
Germ
any
Italy
France
Denm
ark
Sw
eden
UK
Netherlands
Spain
Finland
Ireland
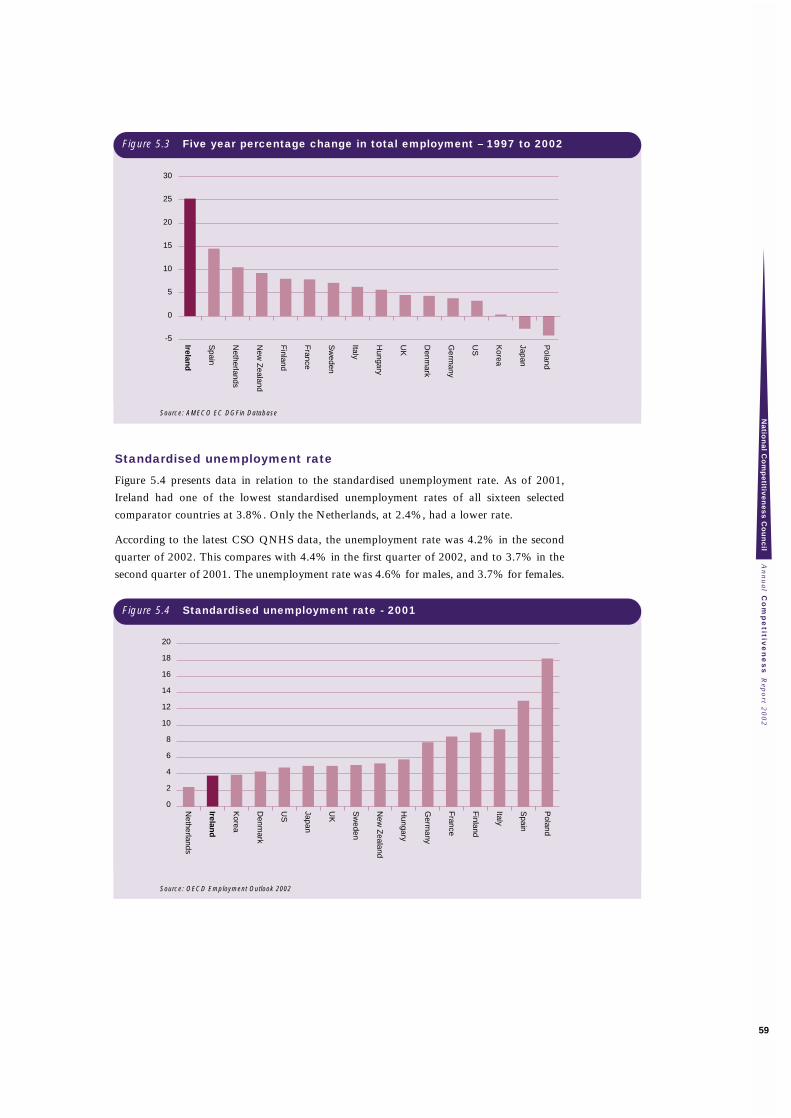
Source: AMECO EC DGFin Database
Standardised unemployment rate
Figure 5.4 presents data in relation to the standardised unemployment rate. As of 2001,
Ireland had one of the lowest standardised unemployment rates of all sixteen selected
comparator countries at 3.8%. Only the Netherlands, at 2.4%, had a lower rate.
According to the latest CSO QNHS data, the unemployment rate was 4.2% in the second
quarter of 2002. This compares with 4.4% in the first quarter of 2002, and to 3.7% in the
second quarter of 2001. The unemployment rate was 4.6% for males, and 3.7% for females.
Source: OECD Employment Outlook 2002
An
nu
al C
om
pe
titive
ne
ss R
epo
rt 20
02
Na
tion
al C
om
pe
titive
ne
ss
Co
un
cil
59
Figure 5.3 Five year percentage change in total employment – 1997 to 2002
-5
0
5
10
15
20
25
30
Poland
Japan
Korea
US
Germ
any
Denm
ark
UK
Hungary
Italy
Sw
eden
France
Finland
New
Zealand
Netherlands
Spain
Ireland
Figure 5.4 Standardised unemployment rate - 2001
0
2
4
6
8
10
12
14
16
18
20
Poland
Spain
Italy
Finland
France
Germ
any
Hungary
New
Zealand
Sw
eden
UK
Japan
US
Denm
ark
Korea
Ireland
Netherlands
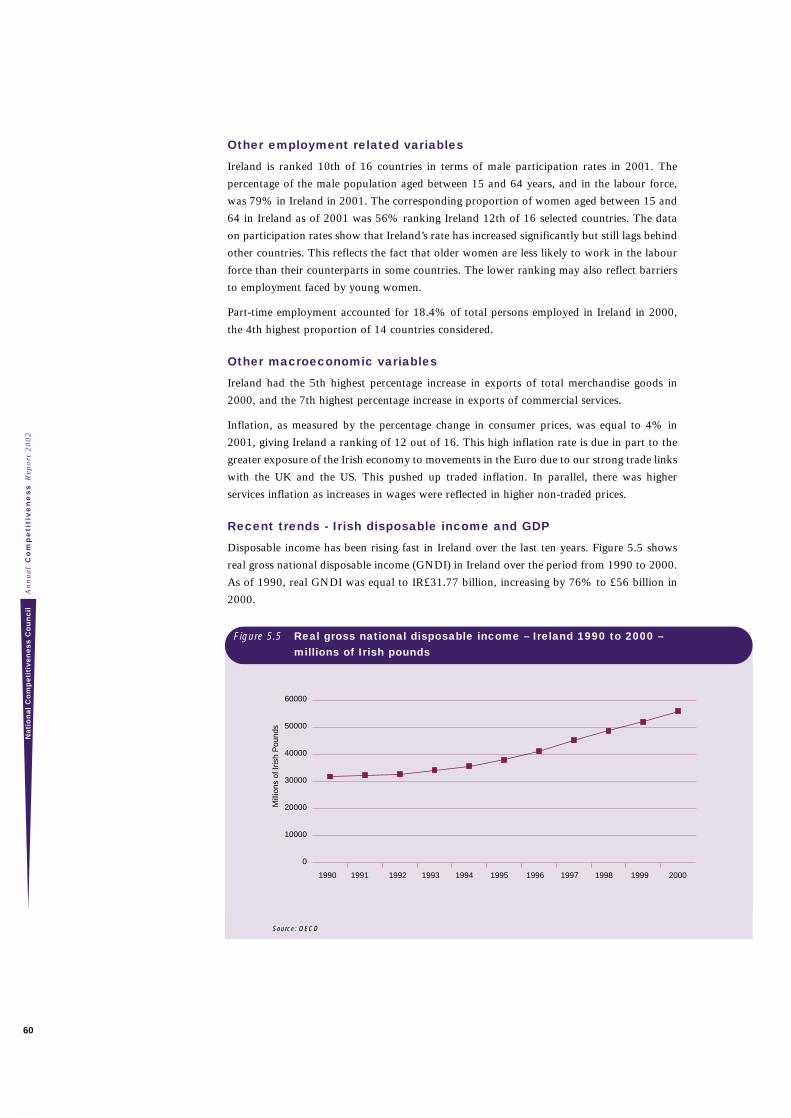
Other employment related variables
Ireland is ranked 10th of 16 countries in terms of male participation rates in 2001. The
percentage of the male population aged between 15 and 64 years, and in the labour force,
was 79% in Ireland in 2001. The corresponding proportion of women aged between 15 and
64 in Ireland as of 2001 was 56% ranking Ireland 12th of 16 selected countries. The data
on participation rates show that Ireland’s rate has increased significantly but still lags behind
other countries. This reflects the fact that older women are less likely to work in the labour
force than their counterparts in some countries. The lower ranking may also reflect barriers
to employment faced by young women.
Part-time employment accounted for 18.4% of total persons employed in Ireland in 2000,
the 4th highest proportion of 14 countries considered.
Other macroeconomic variables
Ireland had the 5th highest percentage increase in exports of total merchandise goods in
2000, and the 7th highest percentage increase in exports of commercial services.
Inflation, as measured by the percentage change in consumer prices, was equal to 4% in
2001, giving Ireland a ranking of 12 out of 16. This high inflation rate is due in part to the
greater exposure of the Irish economy to movements in the Euro due to our strong trade links
with the UK and the US. This pushed up traded inflation. In parallel, there was higher
services inflation as increases in wages were reflected in higher non-traded prices.
Recent trends - Irish disposable income and GDP
Disposable income has been rising fast in Ireland over the last ten years. Figure 5.5 shows
real gross national disposable income (GNDI) in Ireland over the period from 1990 to 2000.
As of 1990, real GNDI was equal to IR£31.77 billion, increasing by 76% to £56 billion in
2000.
Source: OECD
An
nu
al
Co
mp
eti
tiv
en
es
s R
epo
rt 2
00
2N
ati
on
al
Co
mp
eti
tiv
en
es
s C
ou
nc
il
60
Figure 5.5 Real gross national disposable income – Ireland 1990 to 2000 – millions of Irish pounds
0
10000
20000
30000
40000
50000
60000
1990 1991 1992 1993 1994 1995 1996 1997 1998 1999 2000
Mill
ions
of I
rish
Pou
nds
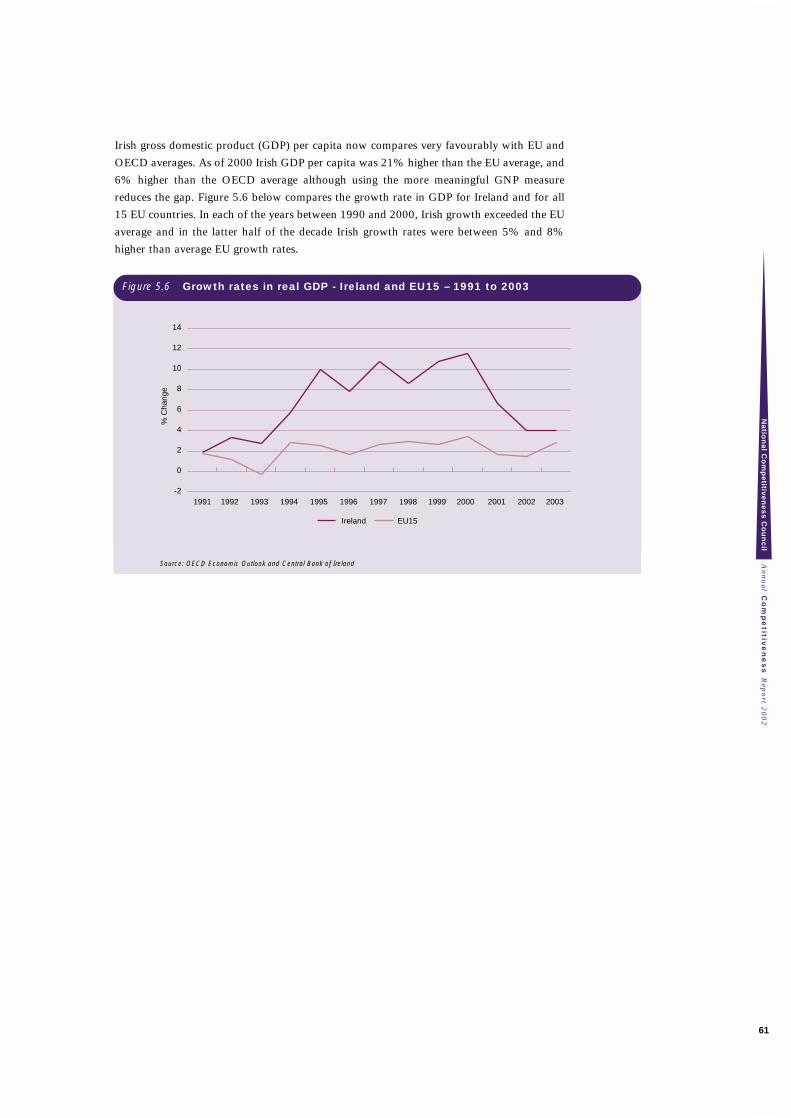
Irish gross domestic product (GDP) per capita now compares very favourably with EU and
OECD averages. As of 2000 Irish GDP per capita was 21% higher than the EU average, and
6% higher than the OECD average although using the more meaningful GNP measure
reduces the gap. Figure 5.6 below compares the growth rate in GDP for Ireland and for all
15 EU countries. In each of the years between 1990 and 2000, Irish growth exceeded the EU
average and in the latter half of the decade Irish growth rates were between 5% and 8%
higher than average EU growth rates.
Source: OECD Economic Outlook and Central Bank of Ireland An
nu
al C
om
pe
titive
ne
ss R
epo
rt 20
02
Na
tion
al C
om
pe
titive
ne
ss
Co
un
cil
61
Figure 5.6 Growth rates in real GDP - Ireland and EU15 – 1991 to 2003
-2
0
2
4
6
8
10
12
14
1991 1992 1993 1994 1995 1996 1997 1998 1999 2000 2001 2002 2003
Ireland EU15
% C
hang
e
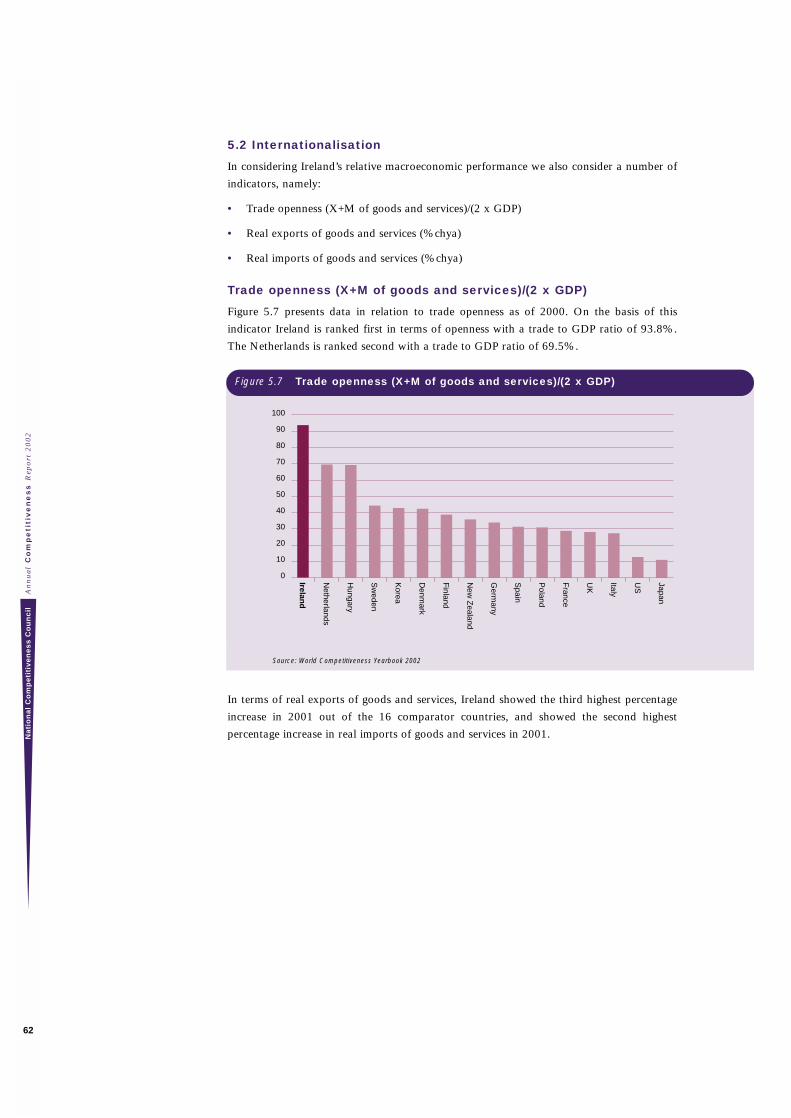
5.2 Internationalisation
In considering Ireland’s relative macroeconomic performance we also consider a number of
indicators, namely:
• Trade openness (X+M of goods and services)/(2 x GDP)
• Real exports of goods and services (%chya)
• Real imports of goods and services (%chya)
Trade openness (X+M of goods and services)/(2 x GDP)
Figure 5.7 presents data in relation to trade openness as of 2000. On the basis of this
indicator Ireland is ranked first in terms of openness with a trade to GDP ratio of 93.8%.
The Netherlands is ranked second with a trade to GDP ratio of 69.5%.
Source: World Competitiveness Yearbook 2002
In terms of real exports of goods and services, Ireland showed the third highest percentage
increase in 2001 out of the 16 comparator countries, and showed the second highest
percentage increase in real imports of goods and services in 2001.
An
nu
al
Co
mp
eti
tiv
en
es
s R
epo
rt 2
00
2N
ati
on
al
Co
mp
eti
tiv
en
es
s C
ou
nc
il
62
Figure 5.7 Trade openness (X+M of goods and services)/(2 x GDP)
0
10
20
30
40
50
60
70
80
90
100
Japan
US
Italy
UK
France
Poland
Spain
Germ
any
New
Zealand
Finland
Denm
ark
Korea
Sw
eden
Hungary
Netherlands
Ireland

Spatial Aspects of Competitiveness6
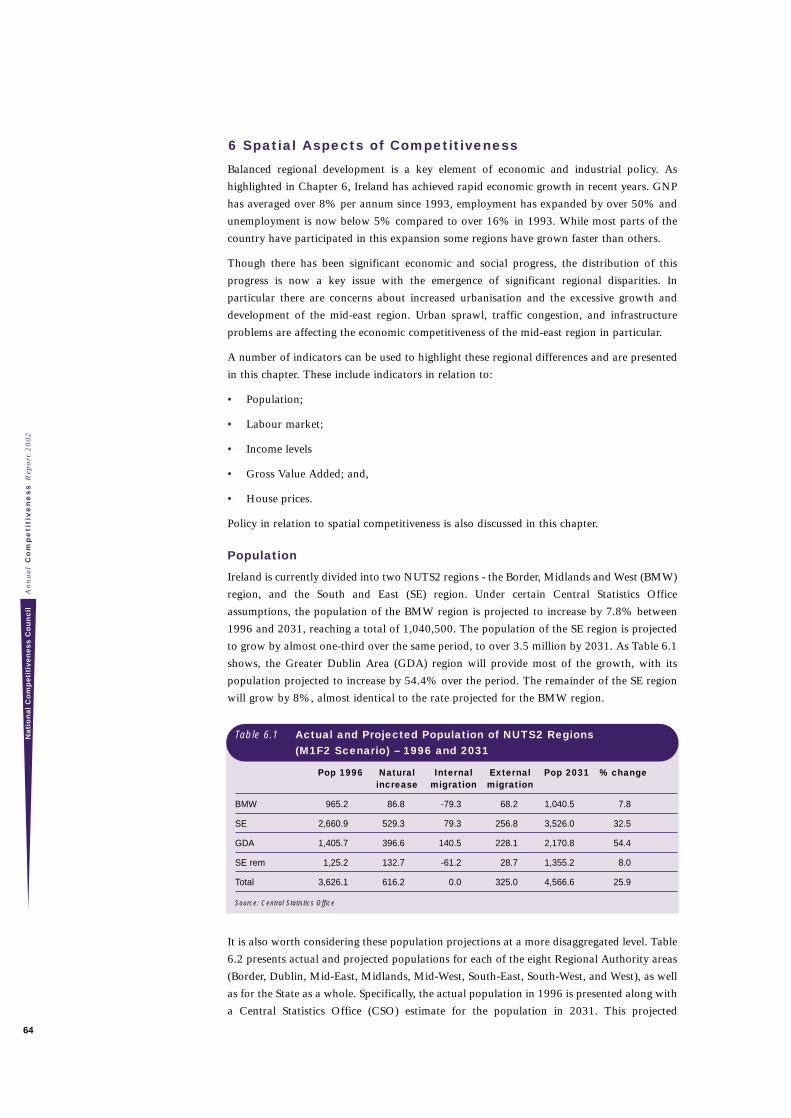
6 Spatial Aspects of Competitiveness
Balanced regional development is a key element of economic and industrial policy. As
highlighted in Chapter 6, Ireland has achieved rapid economic growth in recent years. GNP
has averaged over 8% per annum since 1993, employment has expanded by over 50% and
unemployment is now below 5% compared to over 16% in 1993. While most parts of the
country have participated in this expansion some regions have grown faster than others.
Though there has been significant economic and social progress, the distribution of this
progress is now a key issue with the emergence of significant regional disparities. In
particular there are concerns about increased urbanisation and the excessive growth and
development of the mid-east region. Urban sprawl, traffic congestion, and infrastructure
problems are affecting the economic competitiveness of the mid-east region in particular.
A number of indicators can be used to highlight these regional differences and are presented
in this chapter. These include indicators in relation to:
• Population;
• Labour market;
• Income levels
• Gross Value Added; and,
• House prices.
Policy in relation to spatial competitiveness is also discussed in this chapter.
Population
Ireland is currently divided into two NUTS2 regions - the Border, Midlands and West (BMW)
region, and the South and East (SE) region. Under certain Central Statistics Office
assumptions, the population of the BMW region is projected to increase by 7.8% between
1996 and 2031, reaching a total of 1,040,500. The population of the SE region is projected
to grow by almost one-third over the same period, to over 3.5 million by 2031. As Table 6.1
shows, the Greater Dublin Area (GDA) region will provide most of the growth, with its
population projected to increase by 54.4% over the period. The remainder of the SE region
will grow by 8%, almost identical to the rate projected for the BMW region.
Table 6.1 Actual and Projected Population of NUTS2 Regions (M1F2 Scenario) – 1996 and 2031
Pop 1996 Natural Internal External Pop 2031 % changeincrease migration migration
BMW 965.2 86.8 -79.3 68.2 1,040.5 7.8
SE 2,660.9 529.3 79.3 256.8 3,526.0 32.5
GDA 1,405.7 396.6 140.5 228.1 2,170.8 54.4
SE rem 1,25.2 132.7 -61.2 28.7 1,355.2 8.0
Total 3,626.1 616.2 0.0 325.0 4,566.6 25.9
Source: Central Statistics Office
It is also worth considering these population projections at a more disaggregated level. Table
6.2 presents actual and projected populations for each of the eight Regional Authority areas
(Border, Dublin, Mid-East, Midlands, Mid-West, South-East, South-West, and West), as well
as for the State as a whole. Specifically, the actual population in 1996 is presented along with
a Central Statistics Office (CSO) estimate for the population in 2031. This projected
An
nu
al
Co
mp
eti
tiv
en
es
s R
epo
rt 2
00
2N
ati
on
al
Co
mp
eti
tiv
en
es
s C
ou
nc
il
64
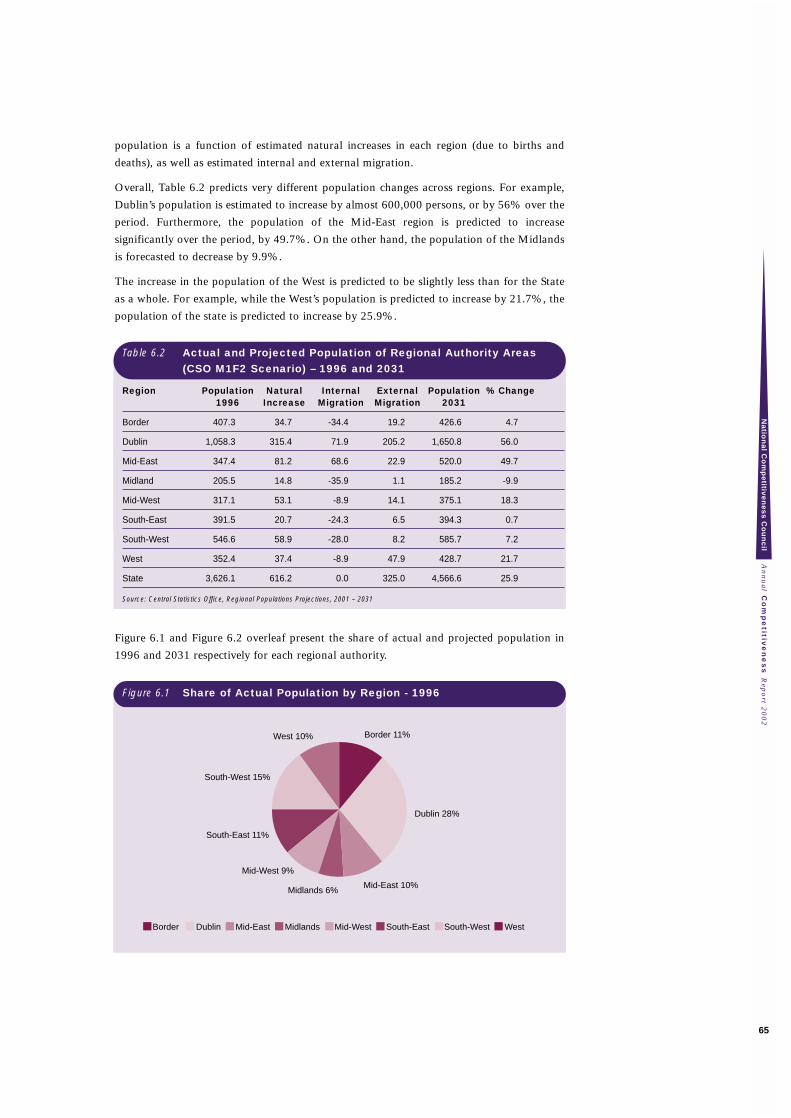
population is a function of estimated natural increases in each region (due to births and
deaths), as well as estimated internal and external migration.
Overall, Table 6.2 predicts very different population changes across regions. For example,
Dublin’s population is estimated to increase by almost 600,000 persons, or by 56% over the
period. Furthermore, the population of the Mid-East region is predicted to increase
significantly over the period, by 49.7%. On the other hand, the population of the Midlands
is forecasted to decrease by 9.9%.
The increase in the population of the West is predicted to be slightly less than for the State
as a whole. For example, while the West’s population is predicted to increase by 21.7%, the
population of the state is predicted to increase by 25.9%.
Table 6.2 Actual and Projected Population of Regional Authority Areas (CSO M1F2 Scenario) – 1996 and 2031
Region Population Natural Internal External Population % Change1996 Increase Migration Migration 2031
Border 407.3 34.7 -34.4 19.2 426.6 4.7
Dublin 1,058.3 315.4 71.9 205.2 1,650.8 56.0
Mid-East 347.4 81.2 68.6 22.9 520.0 49.7
Midland 205.5 14.8 -35.9 1.1 185.2 -9.9
Mid-West 317.1 53.1 -8.9 14.1 375.1 18.3
South-East 391.5 20.7 -24.3 6.5 394.3 0.7
South-West 546.6 58.9 -28.0 8.2 585.7 7.2
West 352.4 37.4 -8.9 47.9 428.7 21.7
State 3,626.1 616.2 0.0 325.0 4,566.6 25.9
Source: Central Statistics Office, Regional Populations Projections, 2001 – 2031
Figure 6.1 and Figure 6.2 overleaf present the share of actual and projected population in
1996 and 2031 respectively for each regional authority.
An
nu
al C
om
pe
titive
ne
ss R
epo
rt 20
02
Na
tion
al C
om
pe
titive
ne
ss
Co
un
cil
65
Figure 6.1 Share of Actual Population by Region - 1996
Border 11%
Dublin 28%
Mid-East 10%Midlands 6%
Mid-West 9%
South-East 11%
South-West 15%
West 10%
Border Dublin Mid-East Midlands Mid-West South-East South-West West
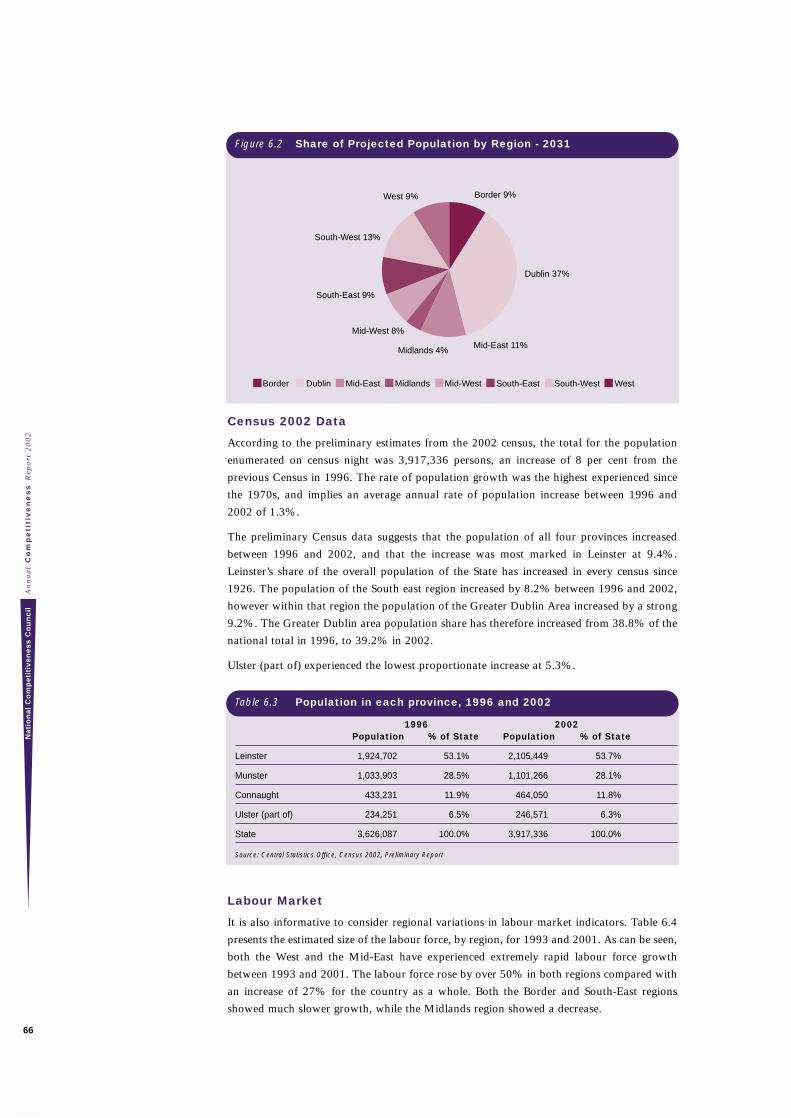
Census 2002 Data
According to the preliminary estimates from the 2002 census, the total for the population
enumerated on census night was 3,917,336 persons, an increase of 8 per cent from the
previous Census in 1996. The rate of population growth was the highest experienced since
the 1970s, and implies an average annual rate of population increase between 1996 and
2002 of 1.3%.
The preliminary Census data suggests that the population of all four provinces increased
between 1996 and 2002, and that the increase was most marked in Leinster at 9.4%.
Leinster’s share of the overall population of the State has increased in every census since
1926. The population of the South east region increased by 8.2% between 1996 and 2002,
however within that region the population of the Greater Dublin Area increased by a strong
9.2%. The Greater Dublin area population share has therefore increased from 38.8% of the
national total in 1996, to 39.2% in 2002.
Ulster (part of) experienced the lowest proportionate increase at 5.3%.
1996 2002Population % of State Population % of State
Leinster 1,924,702 53.1% 2,105,449 53.7%
Munster 1,033,903 28.5% 1,101,266 28.1%
Connaught 433,231 11.9% 464,050 11.8%
Ulster (part of) 234,251 6.5% 246,571 6.3%
State 3,626,087 100.0% 3,917,336 100.0%
Source: Central Statistics Office, Census 2002, Preliminary Report
Labour Market
It is also informative to consider regional variations in labour market indicators. Table 6.4
presents the estimated size of the labour force, by region, for 1993 and 2001. As can be seen,
both the West and the Mid-East have experienced extremely rapid labour force growth
between 1993 and 2001. The labour force rose by over 50% in both regions compared with
an increase of 27% for the country as a whole. Both the Border and South-East regions
showed much slower growth, while the Midlands region showed a decrease.
An
nu
al
Co
mp
eti
tiv
en
es
s R
epo
rt 2
00
2N
ati
on
al
Co
mp
eti
tiv
en
es
s C
ou
nc
il
66
Figure 6.2 Share of Projected Population by Region - 2031
Border 9%
Dublin 37%
Mid-East 11%Midlands 4%
Mid-West 8%
South-East 9%
South-West 13%
West 9%
Border Dublin Mid-East Midlands Mid-West South-East South-West West
Table 6.3 Population in each province, 1996 and 2002
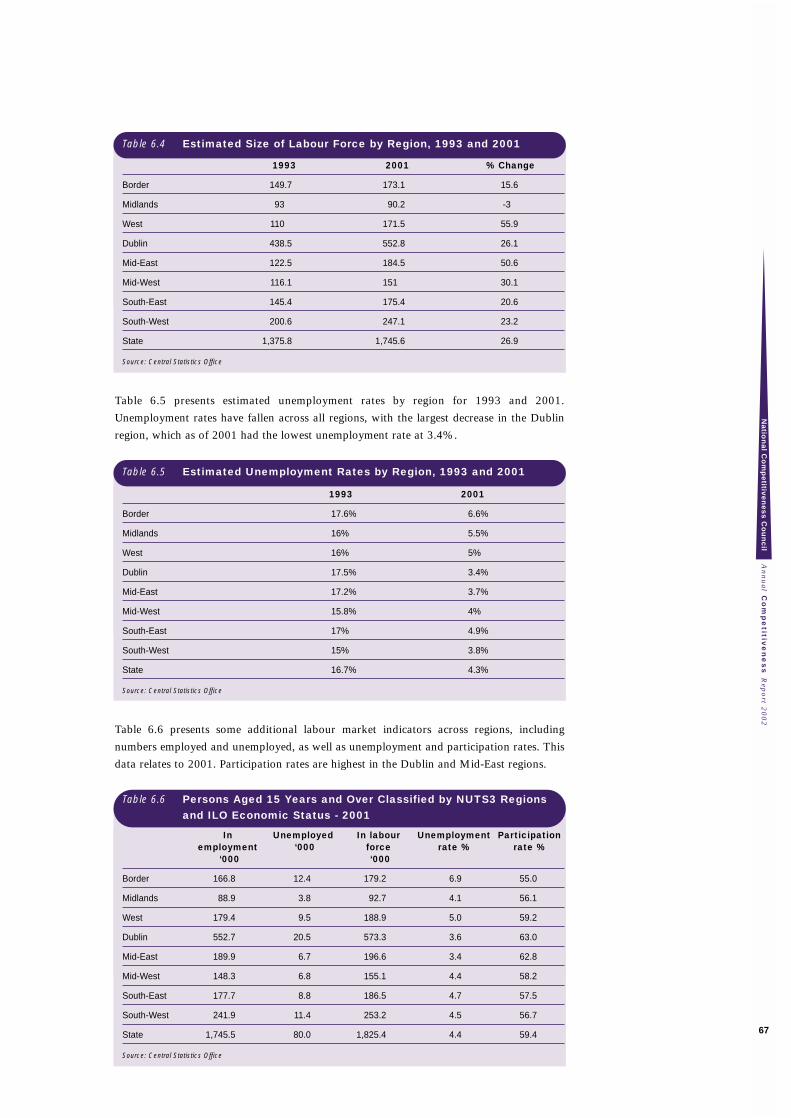
1993 2001 % Change
Border 149.7 173.1 15.6
Midlands 93 90.2 -3
West 110 171.5 55.9
Dublin 438.5 552.8 26.1
Mid-East 122.5 184.5 50.6
Mid-West 116.1 151 30.1
South-East 145.4 175.4 20.6
South-West 200.6 247.1 23.2
State 1,375.8 1,745.6 26.9
Source: Central Statistics Office
Table 6.5 presents estimated unemployment rates by region for 1993 and 2001.
Unemployment rates have fallen across all regions, with the largest decrease in the Dublin
region, which as of 2001 had the lowest unemployment rate at 3.4%.
1993 2001
Border 17.6% 6.6%
Midlands 16% 5.5%
West 16% 5%
Dublin 17.5% 3.4%
Mid-East 17.2% 3.7%
Mid-West 15.8% 4%
South-East 17% 4.9%
South-West 15% 3.8%
State 16.7% 4.3%
Source: Central Statistics Office
Table 6.6 presents some additional labour market indicators across regions, including
numbers employed and unemployed, as well as unemployment and participation rates. This
data relates to 2001. Participation rates are highest in the Dublin and Mid-East regions.
In Unemployed In labour Unemployment Participation employment ‘000 force rate % rate %
‘000 ‘000
Border 166.8 12.4 179.2 6.9 55.0
Midlands 88.9 3.8 92.7 4.1 56.1
West 179.4 9.5 188.9 5.0 59.2
Dublin 552.7 20.5 573.3 3.6 63.0
Mid-East 189.9 6.7 196.6 3.4 62.8
Mid-West 148.3 6.8 155.1 4.4 58.2
South-East 177.7 8.8 186.5 4.7 57.5
South-West 241.9 11.4 253.2 4.5 56.7
State 1,745.5 80.0 1,825.4 4.4 59.4
Source: Central Statistics Office
An
nu
al C
om
pe
titive
ne
ss R
epo
rt 20
02
Na
tion
al C
om
pe
titive
ne
ss
Co
un
cil
67
Table 6.4 Estimated Size of Labour Force by Region, 1993 and 2001
Table 6.5 Estimated Unemployment Rates by Region, 1993 and 2001
Table 6.6 Persons Aged 15 Years and Over Classified by NUTS3 Regions and ILO Economic Status - 2001
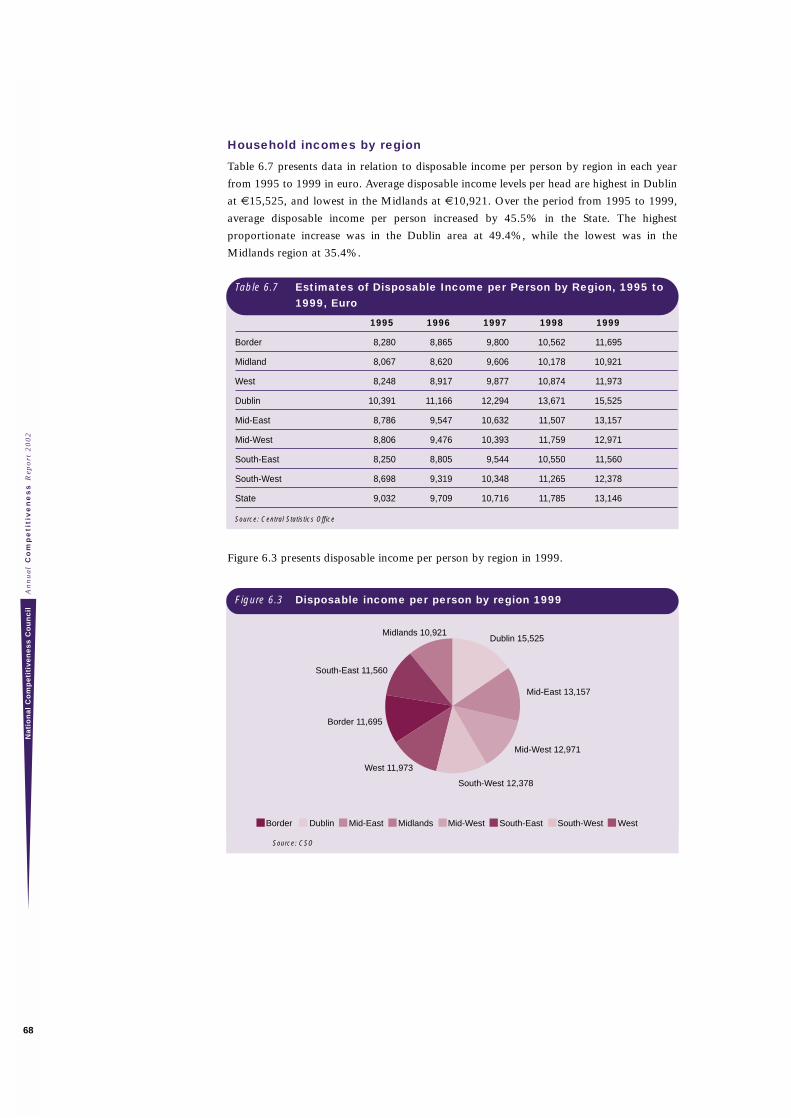
Household incomes by region
Table 6.7 presents data in relation to disposable income per person by region in each year
from 1995 to 1999 in euro. Average disposable income levels per head are highest in Dublin
at €15,525, and lowest in the Midlands at €10,921. Over the period from 1995 to 1999,
average disposable income per person increased by 45.5% in the State. The highest
proportionate increase was in the Dublin area at 49.4%, while the lowest was in the
Midlands region at 35.4%.
1995 1996 1997 1998 1999
Border 8,280 8,865 9,800 10,562 11,695
Midland 8,067 8,620 9,606 10,178 10,921
West 8,248 8,917 9,877 10,874 11,973
Dublin 10,391 11,166 12,294 13,671 15,525
Mid-East 8,786 9,547 10,632 11,507 13,157
Mid-West 8,806 9,476 10,393 11,759 12,971
South-East 8,250 8,805 9,544 10,550 11,560
South-West 8,698 9,319 10,348 11,265 12,378
State 9,032 9,709 10,716 11,785 13,146
Source: Central Statistics Office
Figure 6.3 presents disposable income per person by region in 1999.
Source: CSO
An
nu
al
Co
mp
eti
tiv
en
es
s R
epo
rt 2
00
2N
ati
on
al
Co
mp
eti
tiv
en
es
s C
ou
nc
il
68
Figure 6.3 Disposable income per person by region 1999
Border 11,695
Dublin 15,525
Mid-East 13,157
Midlands 10,921
Mid-West 12,971
South-East 11,560
South-West 12,378
West 11,973
Border Dublin Mid-East Midlands Mid-West South-East South-West West
Table 6.7 Estimates of Disposable Income per Person by Region, 1995 to 1999, Euro
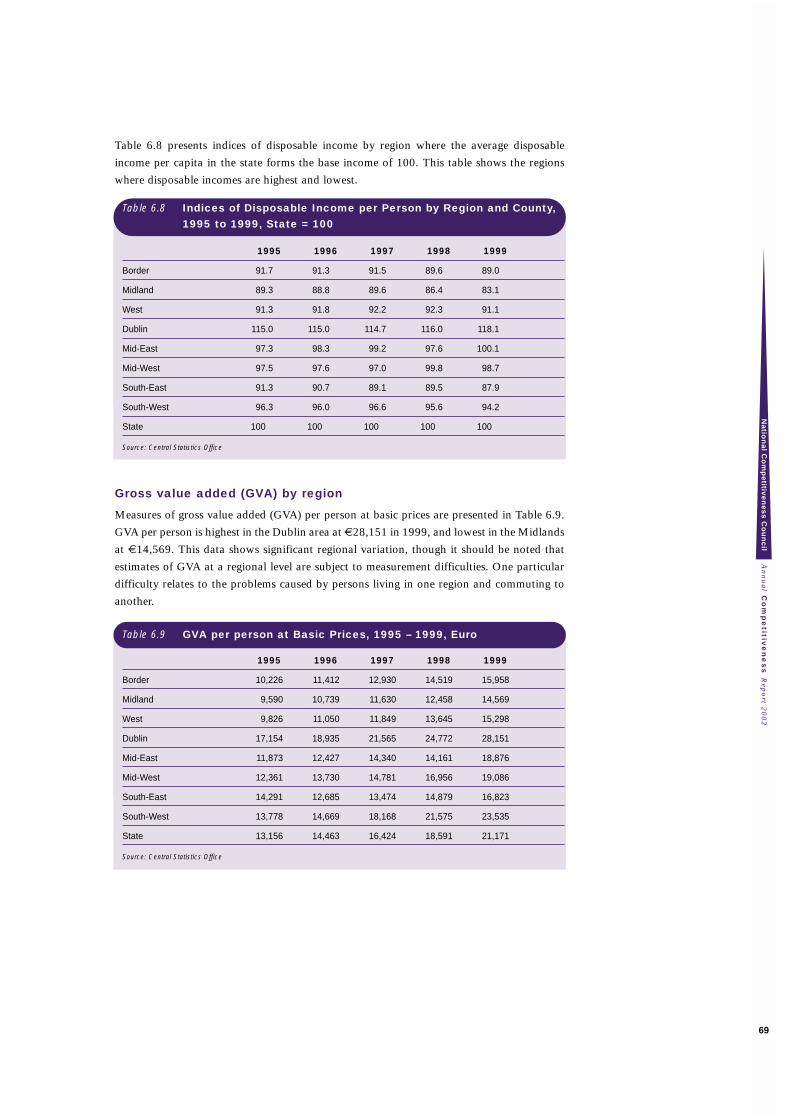
Table 6.8 presents indices of disposable income by region where the average disposable
income per capita in the state forms the base income of 100. This table shows the regions
where disposable incomes are highest and lowest.
1995 1996 1997 1998 1999
Border 91.7 91.3 91.5 89.6 89.0
Midland 89.3 88.8 89.6 86.4 83.1
West 91.3 91.8 92.2 92.3 91.1
Dublin 115.0 115.0 114.7 116.0 118.1
Mid-East 97.3 98.3 99.2 97.6 100.1
Mid-West 97.5 97.6 97.0 99.8 98.7
South-East 91.3 90.7 89.1 89.5 87.9
South-West 96.3 96.0 96.6 95.6 94.2
State 100 100 100 100 100
Source: Central Statistics Office
Gross value added (GVA) by region
Measures of gross value added (GVA) per person at basic prices are presented in Table 6.9.
GVA per person is highest in the Dublin area at €28,151 in 1999, and lowest in the Midlands
at €14,569. This data shows significant regional variation, though it should be noted that
estimates of GVA at a regional level are subject to measurement difficulties. One particular
difficulty relates to the problems caused by persons living in one region and commuting to
another.
1995 1996 1997 1998 1999
Border 10,226 11,412 12,930 14,519 15,958
Midland 9,590 10,739 11,630 12,458 14,569
West 9,826 11,050 11,849 13,645 15,298
Dublin 17,154 18,935 21,565 24,772 28,151
Mid-East 11,873 12,427 14,340 14,161 18,876
Mid-West 12,361 13,730 14,781 16,956 19,086
South-East 14,291 12,685 13,474 14,879 16,823
South-West 13,778 14,669 18,168 21,575 23,535
State 13,156 14,463 16,424 18,591 21,171
Source: Central Statistics Office
An
nu
al C
om
pe
titive
ne
ss R
epo
rt 20
02
Na
tion
al C
om
pe
titive
ne
ss
Co
un
cil
69
Table 6.9 GVA per person at Basic Prices, 1995 – 1999, Euro
Table 6.8 Indices of Disposable Income per Person by Region and County, 1995 to 1999, State = 100
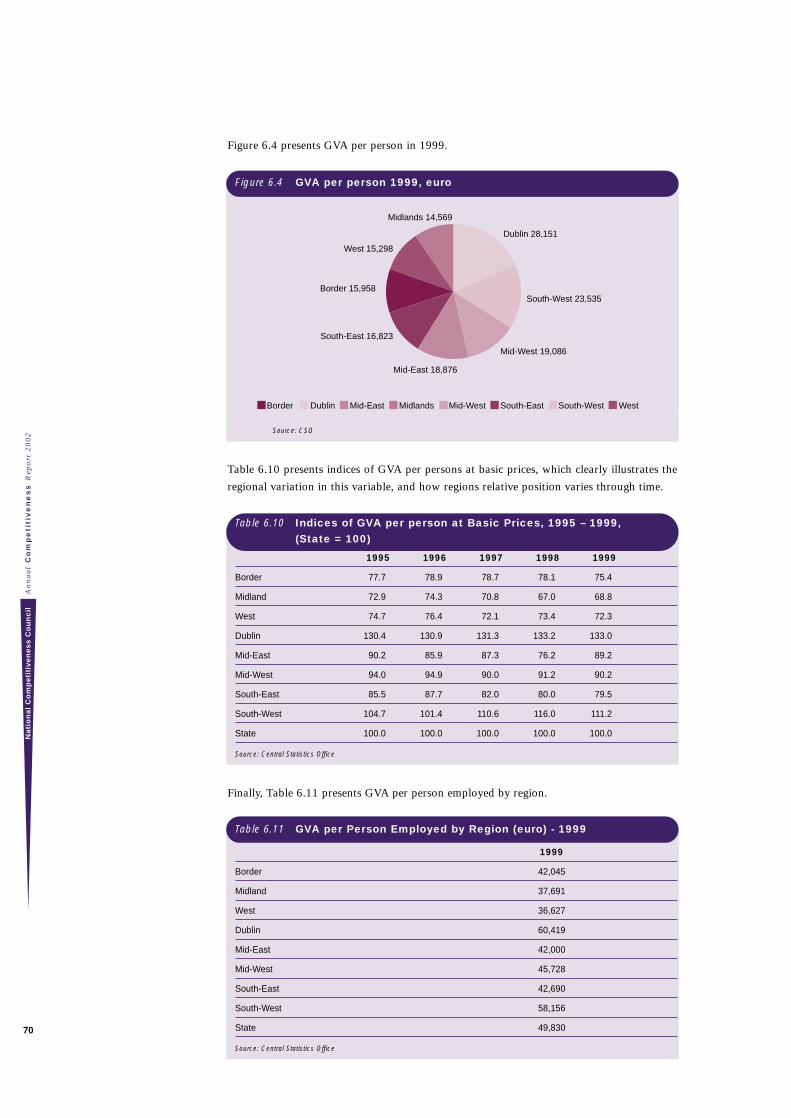
Figure 6.4 presents GVA per person in 1999.
Source: CSO
Table 6.10 presents indices of GVA per persons at basic prices, which clearly illustrates the
regional variation in this variable, and how regions relative position varies through time.
1995 1996 1997 1998 1999
Border 77.7 78.9 78.7 78.1 75.4
Midland 72.9 74.3 70.8 67.0 68.8
West 74.7 76.4 72.1 73.4 72.3
Dublin 130.4 130.9 131.3 133.2 133.0
Mid-East 90.2 85.9 87.3 76.2 89.2
Mid-West 94.0 94.9 90.0 91.2 90.2
South-East 85.5 87.7 82.0 80.0 79.5
South-West 104.7 101.4 110.6 116.0 111.2
State 100.0 100.0 100.0 100.0 100.0
Source: Central Statistics Office
Finally, Table 6.11 presents GVA per person employed by region.
1999
Border 42,045
Midland 37,691
West 36,627
Dublin 60,419
Mid-East 42,000
Mid-West 45,728
South-East 42,690
South-West 58,156
State 49,830
Source: Central Statistics Office
An
nu
al
Co
mp
eti
tiv
en
es
s R
epo
rt 2
00
2N
ati
on
al
Co
mp
eti
tiv
en
es
s C
ou
nc
il
70
Figure 6.4 GVA per person 1999, euro
Border 15,958
Dublin 28,151
Mid-East 18,876
Midlands 14,569
Mid-West 19,086
South-East 16,823
South-West 23,535
West 15,298
Border Dublin Mid-East Midlands Mid-West South-East South-West West
Table 6.10 Indices of GVA per person at Basic Prices, 1995 – 1999, (State = 100)
Table 6.11 GVA per Person Employed by Region (euro) - 1999
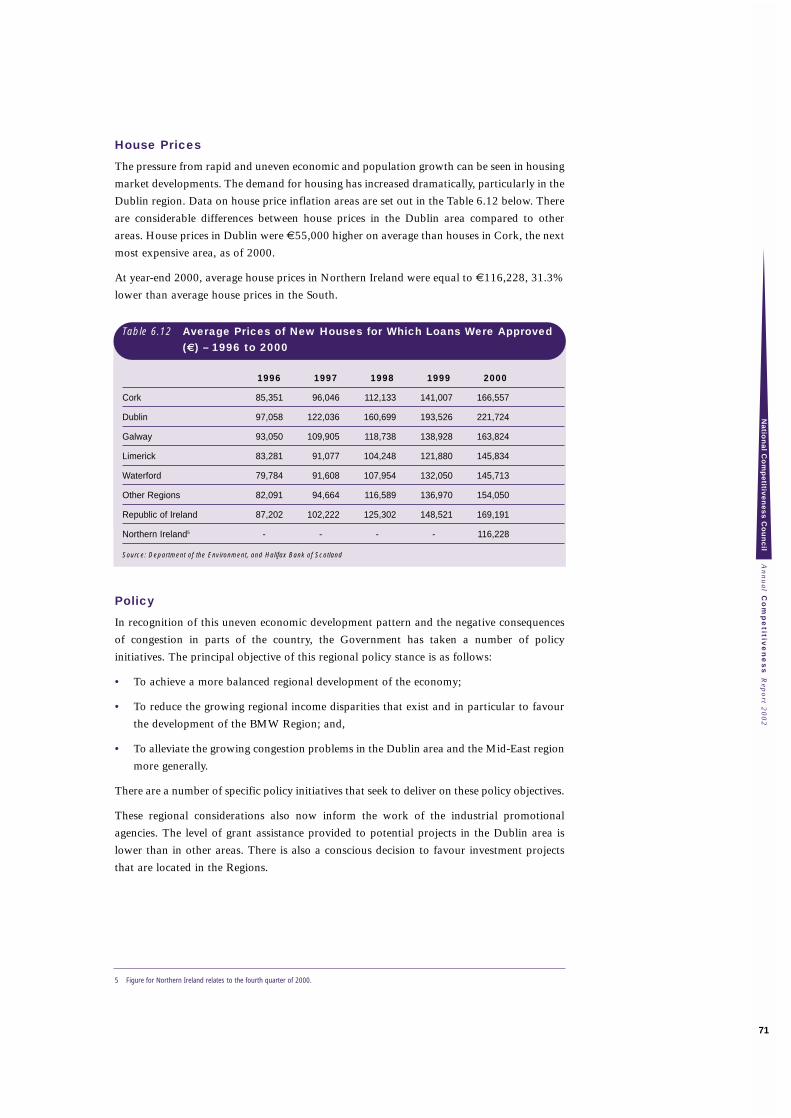
House Prices
The pressure from rapid and uneven economic and population growth can be seen in housing
market developments. The demand for housing has increased dramatically, particularly in the
Dublin region. Data on house price inflation areas are set out in the Table 6.12 below. There
are considerable differences between house prices in the Dublin area compared to other
areas. House prices in Dublin were €55,000 higher on average than houses in Cork, the next
most expensive area, as of 2000.
At year-end 2000, average house prices in Northern Ireland were equal to €116,228, 31.3%
lower than average house prices in the South.
1996 1997 1998 1999 2000
Cork 85,351 96,046 112,133 141,007 166,557
Dublin 97,058 122,036 160,699 193,526 221,724
Galway 93,050 109,905 118,738 138,928 163,824
Limerick 83,281 91,077 104,248 121,880 145,834
Waterford 79,784 91,608 107,954 132,050 145,713
Other Regions 82,091 94,664 116,589 136,970 154,050
Republic of Ireland 87,202 102,222 125,302 148,521 169,191
Northern Ireland5 - - - - 116,228
Source: Department of the Environment, and Halifax Bank of Scotland
Policy
In recognition of this uneven economic development pattern and the negative consequences
of congestion in parts of the country, the Government has taken a number of policy
initiatives. The principal objective of this regional policy stance is as follows:
• To achieve a more balanced regional development of the economy;
• To reduce the growing regional income disparities that exist and in particular to favour
the development of the BMW Region; and,
• To alleviate the growing congestion problems in the Dublin area and the Mid-East region
more generally.
There are a number of specific policy initiatives that seek to deliver on these policy objectives.
These regional considerations also now inform the work of the industrial promotional
agencies. The level of grant assistance provided to potential projects in the Dublin area is
lower than in other areas. There is also a conscious decision to favour investment projects
that are located in the Regions.
5 Figure for Northern Ireland relates to the fourth quarter of 2000.
An
nu
al C
om
pe
titive
ne
ss R
epo
rt 20
02
Na
tion
al C
om
pe
titive
ne
ss
Co
un
cil
71
Table 6.12 Average Prices of New Houses for Which Loans Were Approved (€) – 1996 to 2000
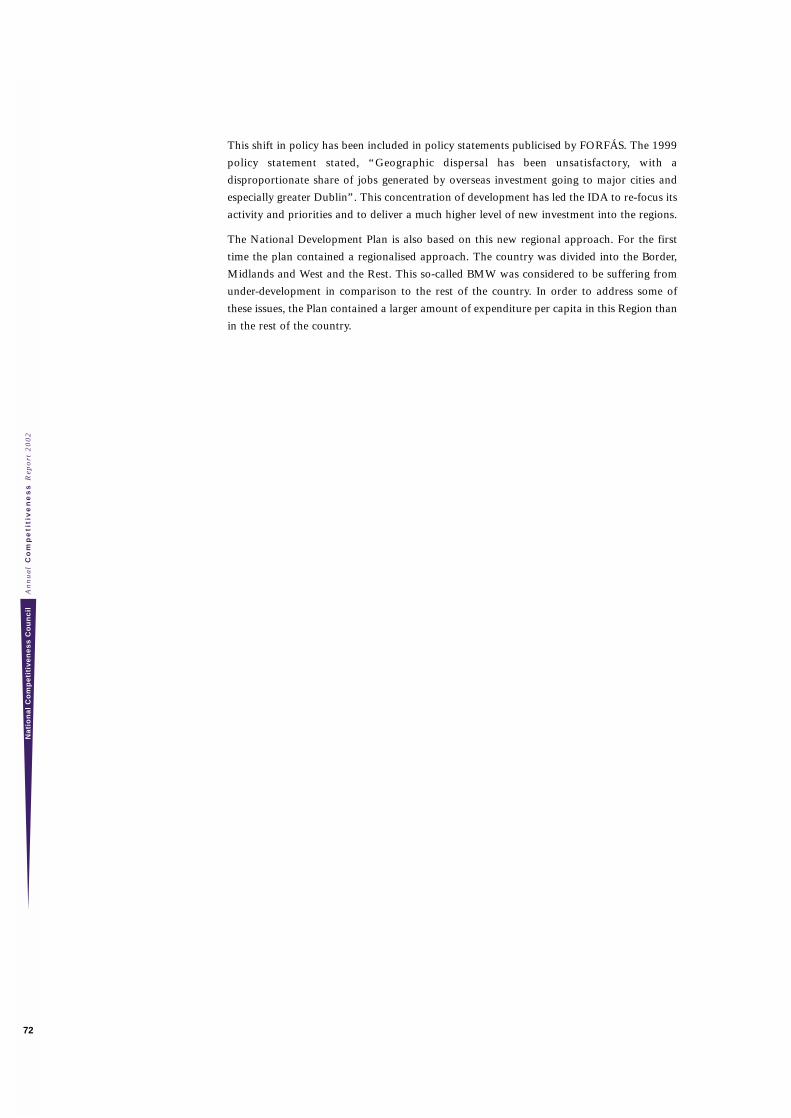
This shift in policy has been included in policy statements publicised by FORFÁS. The 1999
policy statement stated, “Geographic dispersal has been unsatisfactory, with a
disproportionate share of jobs generated by overseas investment going to major cities and
especially greater Dublin”. This concentration of development has led the IDA to re-focus its
activity and priorities and to deliver a much higher level of new investment into the regions.
The National Development Plan is also based on this new regional approach. For the first
time the plan contained a regionalised approach. The country was divided into the Border,
Midlands and West and the Rest. This so-called BMW was considered to be suffering from
under-development in comparison to the rest of the country. In order to address some of
these issues, the Plan contained a larger amount of expenditure per capita in this Region than
in the rest of the country.
An
nu
al
Co
mp
eti
tiv
en
es
s R
epo
rt 2
00
2N
ati
on
al
Co
mp
eti
tiv
en
es
s C
ou
nc
il
72

Sectoral Aspects of Competitiveness7
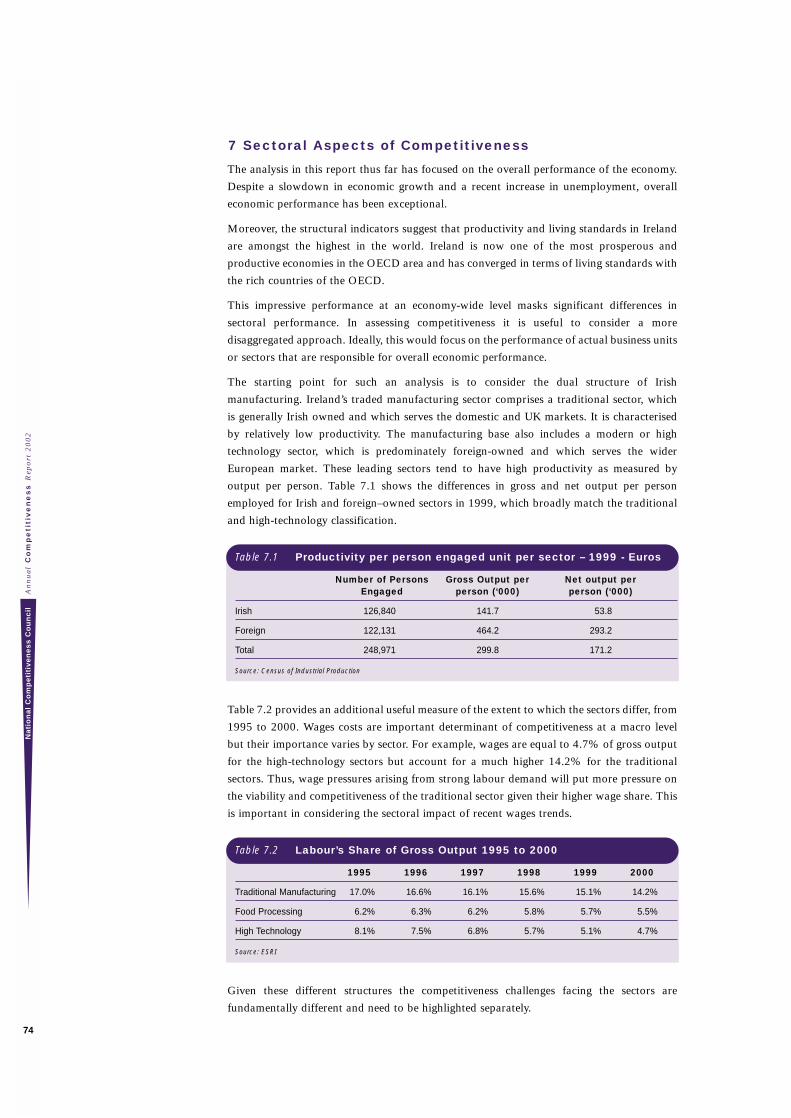
7 Sectoral Aspects of Competitiveness
The analysis in this report thus far has focused on the overall performance of the economy.
Despite a slowdown in economic growth and a recent increase in unemployment, overall
economic performance has been exceptional.
Moreover, the structural indicators suggest that productivity and living standards in Ireland
are amongst the highest in the world. Ireland is now one of the most prosperous and
productive economies in the OECD area and has converged in terms of living standards with
the rich countries of the OECD.
This impressive performance at an economy-wide level masks significant differences in
sectoral performance. In assessing competitiveness it is useful to consider a more
disaggregated approach. Ideally, this would focus on the performance of actual business units
or sectors that are responsible for overall economic performance.
The starting point for such an analysis is to consider the dual structure of Irish
manufacturing. Ireland’s traded manufacturing sector comprises a traditional sector, which
is generally Irish owned and which serves the domestic and UK markets. It is characterised
by relatively low productivity. The manufacturing base also includes a modern or high
technology sector, which is predominately foreign-owned and which serves the wider
European market. These leading sectors tend to have high productivity as measured by
output per person. Table 7.1 shows the differences in gross and net output per person
employed for Irish and foreign–owned sectors in 1999, which broadly match the traditional
and high-technology classification.
Number of Persons Gross Output per Net output per Engaged person (‘000) person (‘000)
Irish 126,840 141.7 53.8
Foreign 122,131 464.2 293.2
Total 248,971 299.8 171.2
Source: Census of Industrial Production
Table 7.2 provides an additional useful measure of the extent to which the sectors differ, from
1995 to 2000. Wages costs are important determinant of competitiveness at a macro level
but their importance varies by sector. For example, wages are equal to 4.7% of gross output
for the high-technology sectors but account for a much higher 14.2% for the traditional
sectors. Thus, wage pressures arising from strong labour demand will put more pressure on
the viability and competitiveness of the traditional sector given their higher wage share. This
is important in considering the sectoral impact of recent wages trends.
1995 1996 1997 1998 1999 2000
Traditional Manufacturing 17.0% 16.6% 16.1% 15.6% 15.1% 14.2%
Food Processing 6.2% 6.3% 6.2% 5.8% 5.7% 5.5%
High Technology 8.1% 7.5% 6.8% 5.7% 5.1% 4.7%
Source: ESRI
Given these different structures the competitiveness challenges facing the sectors are
fundamentally different and need to be highlighted separately.
An
nu
al
Co
mp
eti
tiv
en
es
s R
epo
rt 2
00
2N
ati
on
al
Co
mp
eti
tiv
en
es
s C
ou
nc
il
74
Table 7.1 Productivity per person engaged unit per sector – 1999 - Euros
Table 7.2 Labour’s Share of Gross Output 1995 to 2000
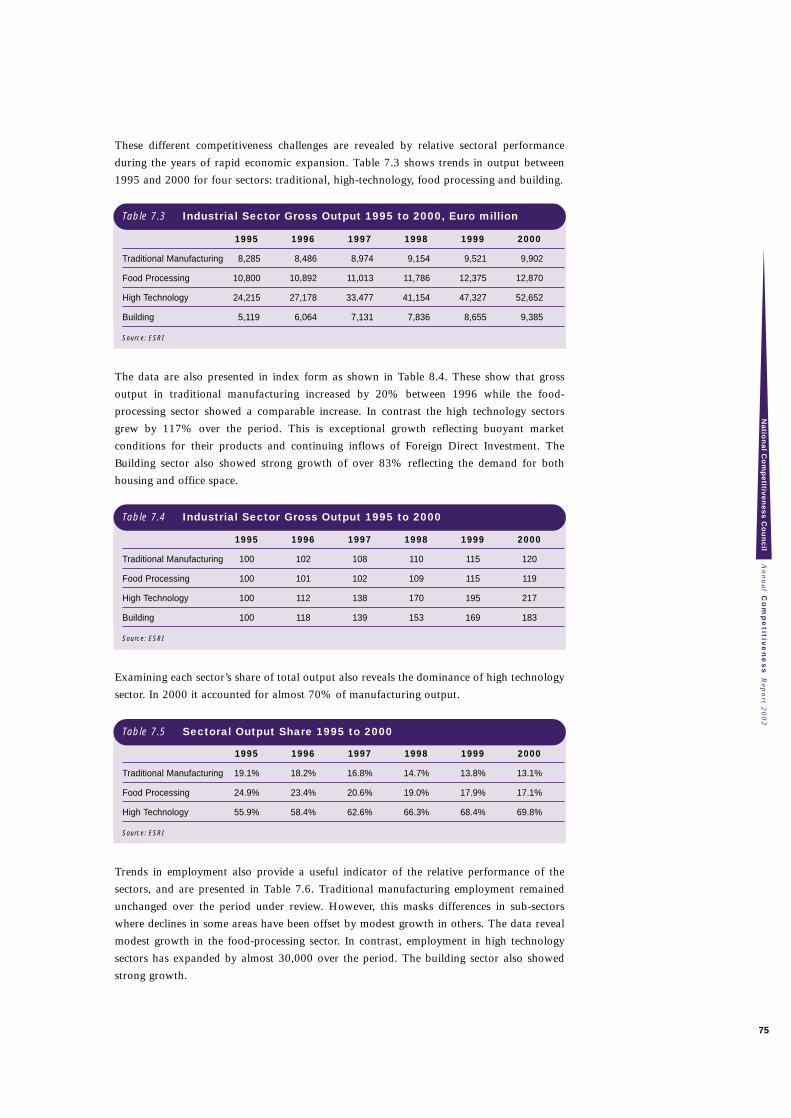
These different competitiveness challenges are revealed by relative sectoral performance
during the years of rapid economic expansion. Table 7.3 shows trends in output between
1995 and 2000 for four sectors: traditional, high-technology, food processing and building.
1995 1996 1997 1998 1999 2000
Traditional Manufacturing 8,285 8,486 8,974 9,154 9,521 9,902
Food Processing 10,800 10,892 11,013 11,786 12,375 12,870
High Technology 24,215 27,178 33,477 41,154 47,327 52,652
Building 5,119 6,064 7,131 7,836 8,655 9,385
Source: ESRI
The data are also presented in index form as shown in Table 8.4. These show that gross
output in traditional manufacturing increased by 20% between 1996 while the food-
processing sector showed a comparable increase. In contrast the high technology sectors
grew by 117% over the period. This is exceptional growth reflecting buoyant market
conditions for their products and continuing inflows of Foreign Direct Investment. The
Building sector also showed strong growth of over 83% reflecting the demand for both
housing and office space.
1995 1996 1997 1998 1999 2000
Traditional Manufacturing 100 102 108 110 115 120
Food Processing 100 101 102 109 115 119
High Technology 100 112 138 170 195 217
Building 100 118 139 153 169 183
Source: ESRI
Examining each sector’s share of total output also reveals the dominance of high technology
sector. In 2000 it accounted for almost 70% of manufacturing output.
1995 1996 1997 1998 1999 2000
Traditional Manufacturing 19.1% 18.2% 16.8% 14.7% 13.8% 13.1%
Food Processing 24.9% 23.4% 20.6% 19.0% 17.9% 17.1%
High Technology 55.9% 58.4% 62.6% 66.3% 68.4% 69.8%
Source: ESRI
Trends in employment also provide a useful indicator of the relative performance of the
sectors, and are presented in Table 7.6. Traditional manufacturing employment remained
unchanged over the period under review. However, this masks differences in sub-sectors
where declines in some areas have been offset by modest growth in others. The data reveal
modest growth in the food-processing sector. In contrast, employment in high technology
sectors has expanded by almost 30,000 over the period. The building sector also showed
strong growth.
An
nu
al C
om
pe
titive
ne
ss R
epo
rt 20
02
Na
tion
al C
om
pe
titive
ne
ss
Co
un
cil
75
Table 7.3 Industrial Sector Gross Output 1995 to 2000, Euro million
Table 7.4 Industrial Sector Gross Output 1995 to 2000
Table 7.5 Sectoral Output Share 1995 to 2000
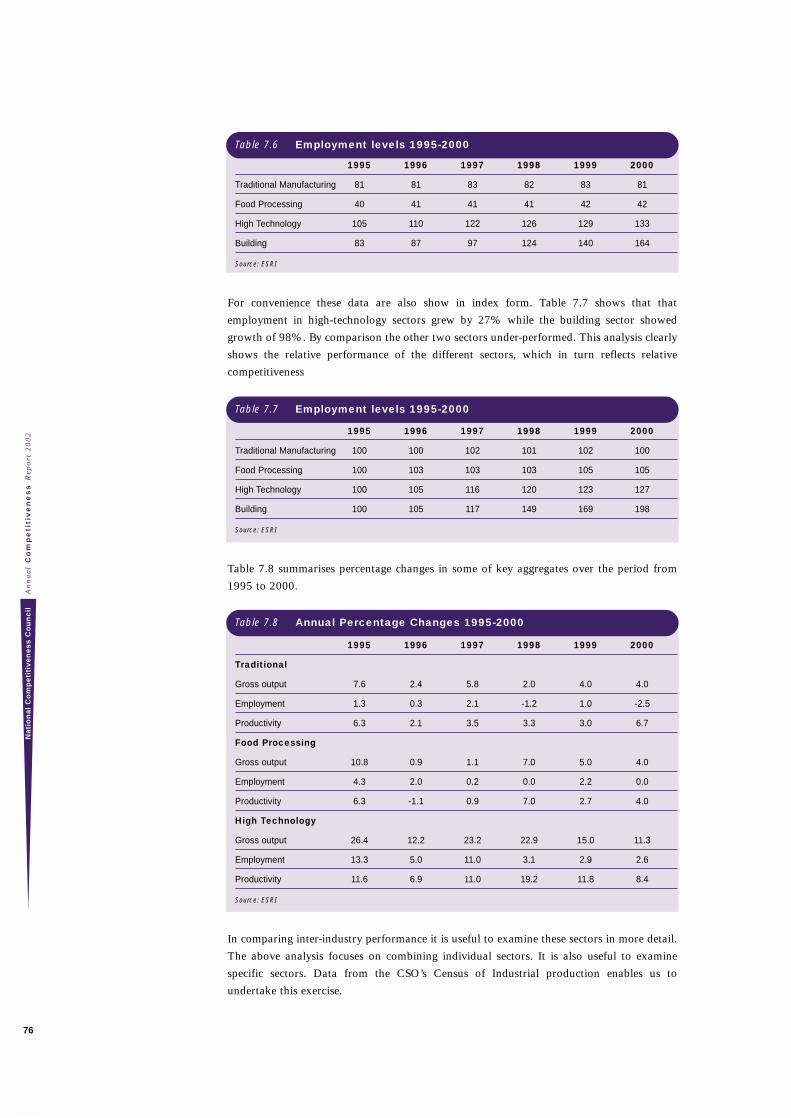
1995 1996 1997 1998 1999 2000
Traditional Manufacturing 81 81 83 82 83 81
Food Processing 40 41 41 41 42 42
High Technology 105 110 122 126 129 133
Building 83 87 97 124 140 164
Source: ESRI
For convenience these data are also show in index form. Table 7.7 shows that that
employment in high-technology sectors grew by 27% while the building sector showed
growth of 98%. By comparison the other two sectors under-performed. This analysis clearly
shows the relative performance of the different sectors, which in turn reflects relative
competitiveness
1995 1996 1997 1998 1999 2000
Traditional Manufacturing 100 100 102 101 102 100
Food Processing 100 103 103 103 105 105
High Technology 100 105 116 120 123 127
Building 100 105 117 149 169 198
Source: ESRI
Table 7.8 summarises percentage changes in some of key aggregates over the period from
1995 to 2000.
1995 1996 1997 1998 1999 2000
Traditional
Gross output 7.6 2.4 5.8 2.0 4.0 4.0
Employment 1.3 0.3 2.1 -1.2 1.0 -2.5
Productivity 6.3 2.1 3.5 3.3 3.0 6.7
Food Processing
Gross output 10.8 0.9 1.1 7.0 5.0 4.0
Employment 4.3 2.0 0.2 0.0 2.2 0.0
Productivity 6.3 -1.1 0.9 7.0 2.7 4.0
High Technology
Gross output 26.4 12.2 23.2 22.9 15.0 11.3
Employment 13.3 5.0 11.0 3.1 2.9 2.6
Productivity 11.6 6.9 11.0 19.2 11.8 8.4
Source: ESRI
In comparing inter-industry performance it is useful to examine these sectors in more detail.
The above analysis focuses on combining individual sectors. It is also useful to examine
specific sectors. Data from the CSO’s Census of Industrial production enables us to
undertake this exercise.
An
nu
al
Co
mp
eti
tiv
en
es
s R
epo
rt 2
00
2N
ati
on
al
Co
mp
eti
tiv
en
es
s C
ou
nc
il
76
Table 7.6 Employment levels 1995-2000
Table 7.7 Employment levels 1995-2000
Table 7.8 Annual Percentage Changes 1995-2000
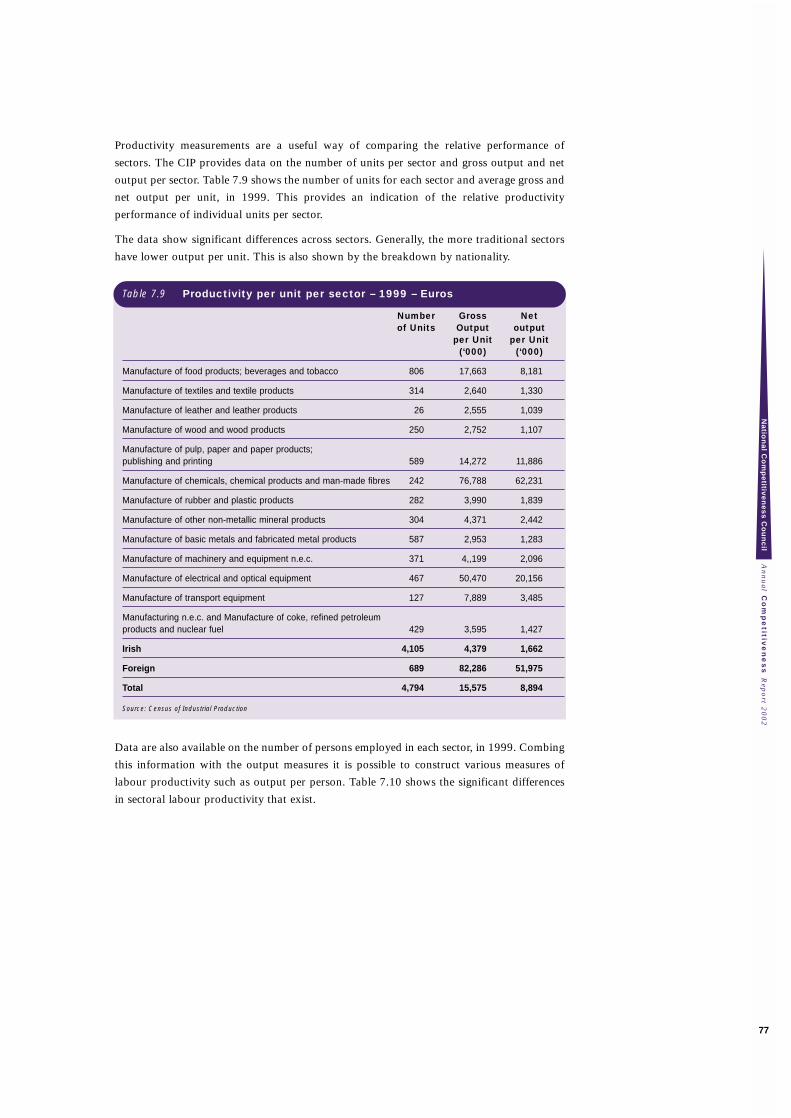
Productivity measurements are a useful way of comparing the relative performance of
sectors. The CIP provides data on the number of units per sector and gross output and net
output per sector. Table 7.9 shows the number of units for each sector and average gross and
net output per unit, in 1999. This provides an indication of the relative productivity
performance of individual units per sector.
The data show significant differences across sectors. Generally, the more traditional sectors
have lower output per unit. This is also shown by the breakdown by nationality.
Number Gross Net of Units Output output
per Unit per Unit(‘000) (‘000)
Manufacture of food products; beverages and tobacco 806 17,663 8,181
Manufacture of textiles and textile products 314 2,640 1,330
Manufacture of leather and leather products 26 2,555 1,039
Manufacture of wood and wood products 250 2,752 1,107
Manufacture of pulp, paper and paper products; publishing and printing 589 14,272 11,886
Manufacture of chemicals, chemical products and man-made fibres 242 76,788 62,231
Manufacture of rubber and plastic products 282 3,990 1,839
Manufacture of other non-metallic mineral products 304 4,371 2,442
Manufacture of basic metals and fabricated metal products 587 2,953 1,283
Manufacture of machinery and equipment n.e.c. 371 4,,199 2,096
Manufacture of electrical and optical equipment 467 50,470 20,156
Manufacture of transport equipment 127 7,889 3,485
Manufacturing n.e.c. and Manufacture of coke, refined petroleum products and nuclear fuel 429 3,595 1,427
Irish 4,105 4,379 1,662
Foreign 689 82,286 51,975
Total 4,794 15,575 8,894
Source: Census of Industrial Production
Data are also available on the number of persons employed in each sector, in 1999. Combing
this information with the output measures it is possible to construct various measures of
labour productivity such as output per person. Table 7.10 shows the significant differences
in sectoral labour productivity that exist.
An
nu
al C
om
pe
titive
ne
ss R
epo
rt 20
02
Na
tion
al C
om
pe
titive
ne
ss
Co
un
cil
77
Table 7.9 Productivity per unit per sector – 1999 – Euros
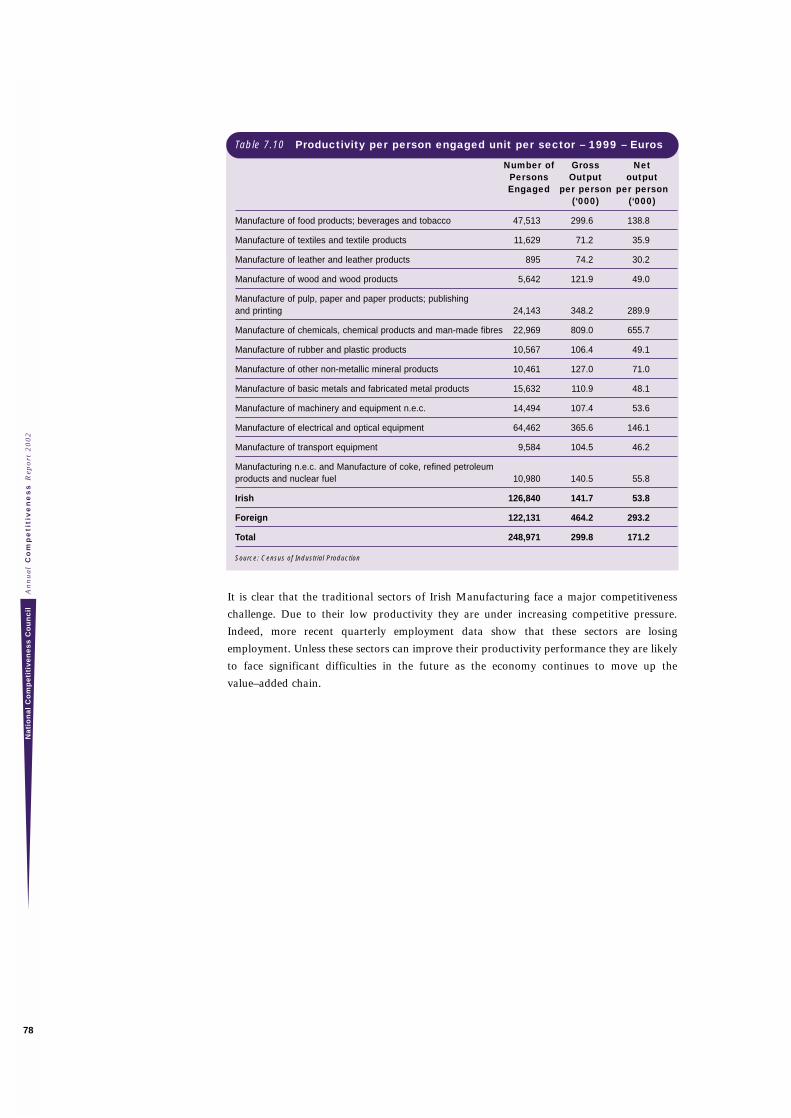
Number of Gross Net Persons Output output Engaged per person per person
(‘000) (‘000)
Manufacture of food products; beverages and tobacco 47,513 299.6 138.8
Manufacture of textiles and textile products 11,629 71.2 35.9
Manufacture of leather and leather products 895 74.2 30.2
Manufacture of wood and wood products 5,642 121.9 49.0
Manufacture of pulp, paper and paper products; publishing and printing 24,143 348.2 289.9
Manufacture of chemicals, chemical products and man-made fibres 22,969 809.0 655.7
Manufacture of rubber and plastic products 10,567 106.4 49.1
Manufacture of other non-metallic mineral products 10,461 127.0 71.0
Manufacture of basic metals and fabricated metal products 15,632 110.9 48.1
Manufacture of machinery and equipment n.e.c. 14,494 107.4 53.6
Manufacture of electrical and optical equipment 64,462 365.6 146.1
Manufacture of transport equipment 9,584 104.5 46.2
Manufacturing n.e.c. and Manufacture of coke, refined petroleum products and nuclear fuel 10,980 140.5 55.8
Irish 126,840 141.7 53.8
Foreign 122,131 464.2 293.2
Total 248,971 299.8 171.2
Source: Census of Industrial Production
It is clear that the traditional sectors of Irish Manufacturing face a major competitiveness
challenge. Due to their low productivity they are under increasing competitive pressure.
Indeed, more recent quarterly employment data show that these sectors are losing
employment. Unless these sectors can improve their productivity performance they are likely
to face significant difficulties in the future as the economy continues to move up the
value–added chain.
An
nu
al
Co
mp
eti
tiv
en
es
s R
epo
rt 2
00
2N
ati
on
al
Co
mp
eti
tiv
en
es
s C
ou
nc
il
78
Table 7.10 Productivity per person engaged unit per sector – 1999 – Euros

Annex 1 Detailed Tables8
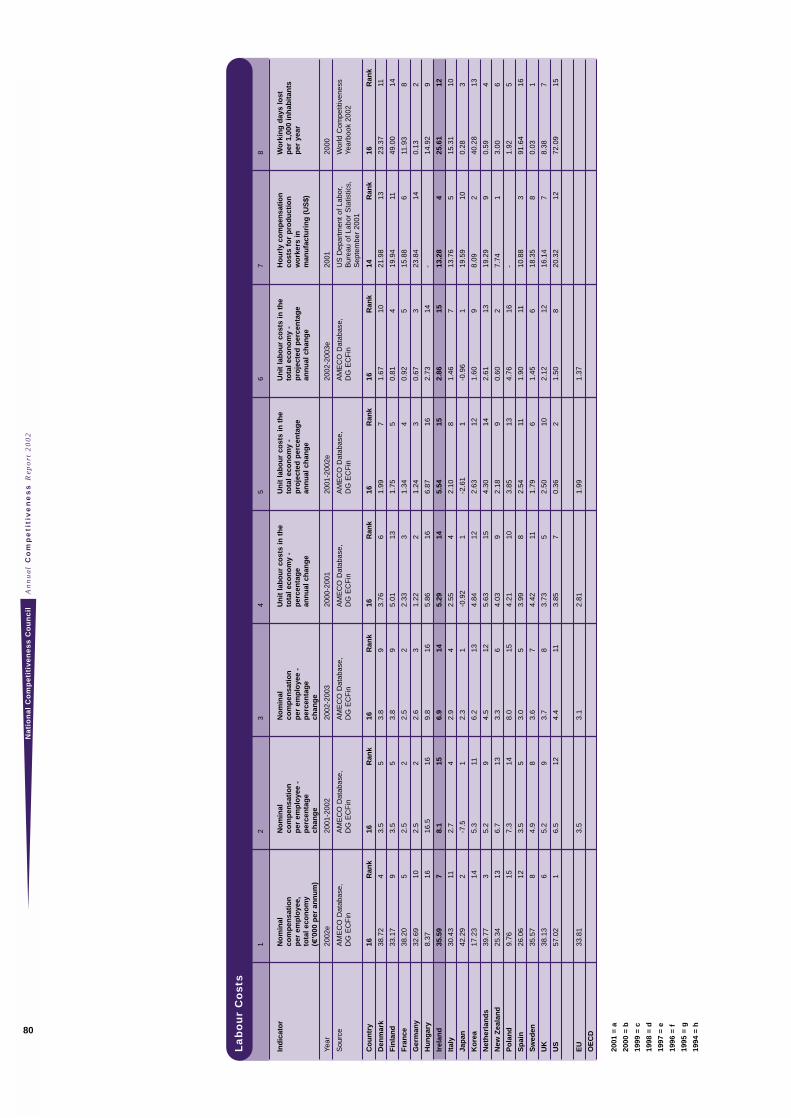
An
nu
al
Co
mp
eti
tiv
en
es
s R
epo
rt 2
00
2N
ati
on
al
Co
mp
eti
tiv
en
es
s C
ou
nc
il
80
La
bo
ur
Co
sts
12
34
56
78
Ind
icat
or
No
min
al
No
min
al
No
min
al
Un
it la
bo
ur
cost
s in
th
e U
nit
lab
ou
r co
sts
in t
he
Un
it la
bo
ur
cost
s in
th
e
Ho
url
y co
mp
ensa
tio
n
Wo
rkin
g d
ays
lost
co
mp
ensa
tio
nco
mp
ensa
tio
nco
mp
ensa
tio
nto
tal e
con
om
y -
tota
l eco
no
my
- to
tal e
con
om
y -
cost
s fo
r p
rod
uct
ion
p
er 1
,000
inh
abit
ants
per
em
plo
yee,
per
em
plo
yee
- p
er e
mp
loye
e -
per
cen
tag
e p
roje
cted
per
cen
tag
e p
roje
cted
per
cen
tag
e w
ork
ers
in
per
yea
rto
tal e
con
om
yp
erce
nta
ge
per
cen
tag
e an
nu
al c
han
ge
ann
ual
ch
ang
ean
nu
al c
han
ge
man
ufa
ctu
rin
g (
US
$)(€
'000
per
an
nu
m)
chan
ge
chan
ge
Year
2002
e20
01-2
002
2002
-200
320
00-2
001
2001
-200
2e20
02-2
003e
2001
2000
Sou
rce
AM
EC
O D
atab
ase,
AM
EC
O D
atab
ase,
A
ME
CO
Dat
abas
e,
AM
EC
O D
atab
ase,
A
ME
CO
Dat
abas
e,
AM
EC
O D
atab
ase,
U
S D
epar
tmen
t of
Lab
or,
Wor
ld C
ompe
titiv
enes
s D
G E
CF
inD
G E
CF
inD
G E
CF
inD
G E
CF
inD
G E
CF
inD
G E
CF
inB
urea
u of
Lab
or S
tatis
tics,
Ye
arbo
ok 2
002
Sep
tem
ber
2001
Co
un
try
16R
ank
16R
ank
16R
ank
16R
ank
16R
ank
16R
ank
14R
ank
16R
ank
Den
mar
k38
.72
43.
55
3.8
93.
766
1.99
71.
6710
21.9
813
23.3
711
Fin
lan
d33
.17
93.
55
3.8
95.
0113
1.75
50.
814
19.9
411
49.0
014
Fra
nce
38.2
05
2.5
22.
52
2.33
31.
344
0.92
515
.88
611
.93
8
Ger
man
y32
.69
102.
52
2.6
31.
222
1.24
30.
673
23.8
414
0.13
2
Hu
ng
ary
8.37
1616
.516
9.8
165.
8616
6.87
162.
7314
-14
.92
9
Irel
and
35.5
97
8.1
156.
914
5.29
145.
5415
2.86
1513
.28
425
.61
12
Ital
y30
.43
112.
74
2.9
42.
554
2.10
81.
467
13.7
65
15.3
110
Jap
an42
.29
2-7
.51
2.3
1-0
.92
1-2
.61
1-0
.96
119
.59
100.
283
Ko
rea
17.2
314
5.3
116.
213
4.84
122.
6312
1.60
98.
092
40.2
813
Net
her
lan
ds
39.7
73
5.2
94.
512
5.63
154.
3014
2.61
1319
.29
90.
594
New
Zea
lan
d25
.34
136.
713
3.3
64.
039
2.18
90.
602
7.74
13.
006
Po
lan
d9.
7615
7.3
148.
015
4.21
103.
8513
4.76
16-
1.92
5
Sp
ain
26.0
612
3.5
53.
05
3.99
82.
5411
1.90
1110
.88
391
.64
16
Sw
eden
35.5
78
4.9
83.
67
4.42
111.
796
1.45
618
.35
80.
031
UK
38.1
36
5.2
93.
78
3.73
52.
5010
2.12
1216
.14
78.
387
US
57.0
21
6.5
124.
411
3.85
70.
362
1.50
820
.32
1272
.09
15
EU
33.8
13.
53.
12.
811.
991.
37
OE
CD
2001
= a
2000
= b
1999
= c
1998
= d
1997
= e
1996
= f
1995
= g
1994
= h
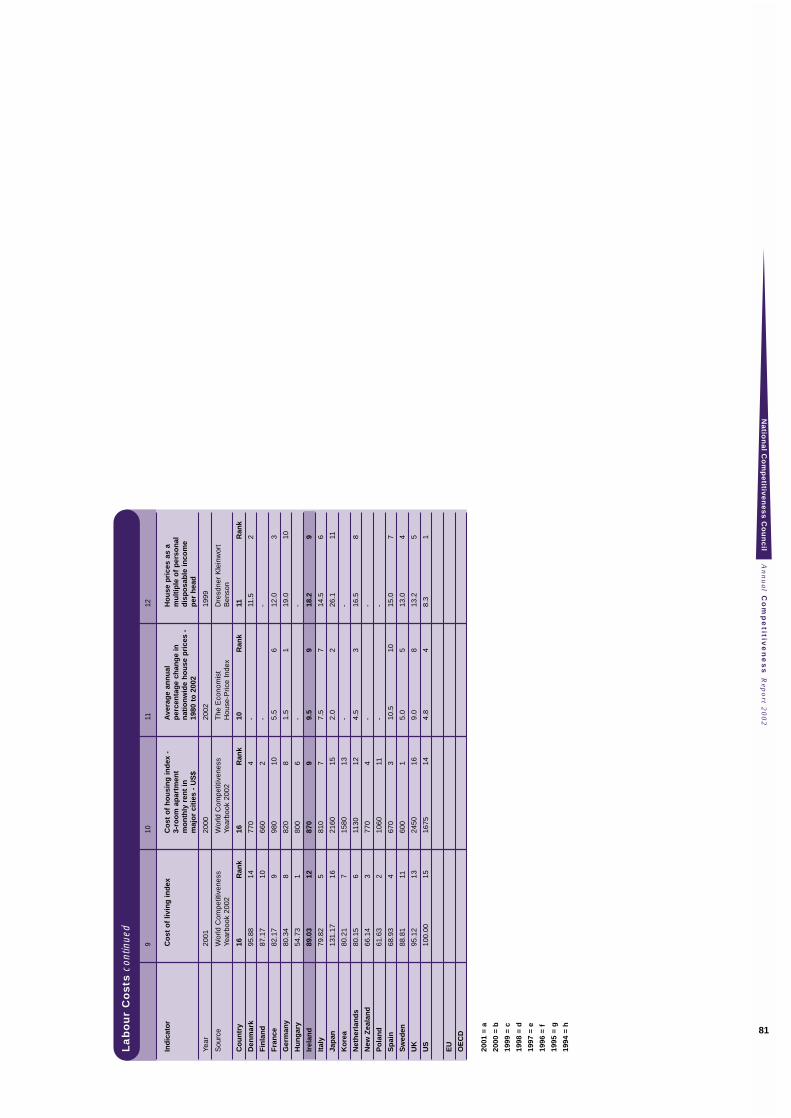
An
nu
al C
om
pe
titive
ne
ss R
epo
rt 20
02
Na
tion
al C
om
pe
titive
ne
ss
Co
un
cil
81
La
bo
ur
Co
sts
cont
inue
d
910
1112
Ind
icat
or
Co
st o
f liv
ing
ind
exC
ost
of
ho
usi
ng
ind
ex -
A
vera
ge
ann
ual
H
ou
se p
rice
s as
a
3-ro
om
ap
artm
ent
per
cen
tag
e ch
ang
e in
m
ult
iple
of
per
son
al
mo
nth
ly r
ent
in
nat
ion
wid
e h
ou
se p
rice
s -
dis
po
sab
le in
com
e m
ajo
r ci
ties
- U
S$
1980
to
200
2p
er h
ead
Year
2001
2000
2002
1999
Sou
rce
Wor
ld C
ompe
titiv
enes
s W
orld
Com
petit
iven
ess
The
Eco
nom
ist
Dre
sdne
r K
lein
wor
t Ye
arbo
ok 2
002
Year
book
200
2H
ouse
-Pric
e In
dex
Ben
son
Co
un
try
16R
ank
16R
ank
10R
ank
11R
ank
Den
mar
k95
.88
1477
04
-11
.52
Fin
lan
d87
.17
1066
02
--
Fra
nce
82.1
79
980
105.
56
12.0
3
Ger
man
y80
.34
882
08
1.5
119
.010
Hu
ng
ary
54.7
31
800
6-
-
Irel
and
89.0
312
870
99.
59
18.2
9
Ital
y79
.82
581
07
7.5
714
.56
Jap
an13
1.17
1621
6015
2.0
226
.111
Ko
rea
80.2
17
1580
13-
-
Net
her
lan
ds
80.1
56
1130
124.
53
16.5
8
New
Zea
lan
d66
.14
377
04
--
Po
lan
d61
.63
210
6011
--
Sp
ain
68.9
34
670
310
.510
15.0
7
Sw
eden
88.8
111
600
15.
05
13.0
4
UK
95.1
213
2450
169.
08
13.2
5
US
100.
0015
1675
144.
84
8.3
1
EU
OE
CD
2001
= a
2000
= b
1999
= c
1998
= d
1997
= e
1996
= f
1995
= g
1994
= h
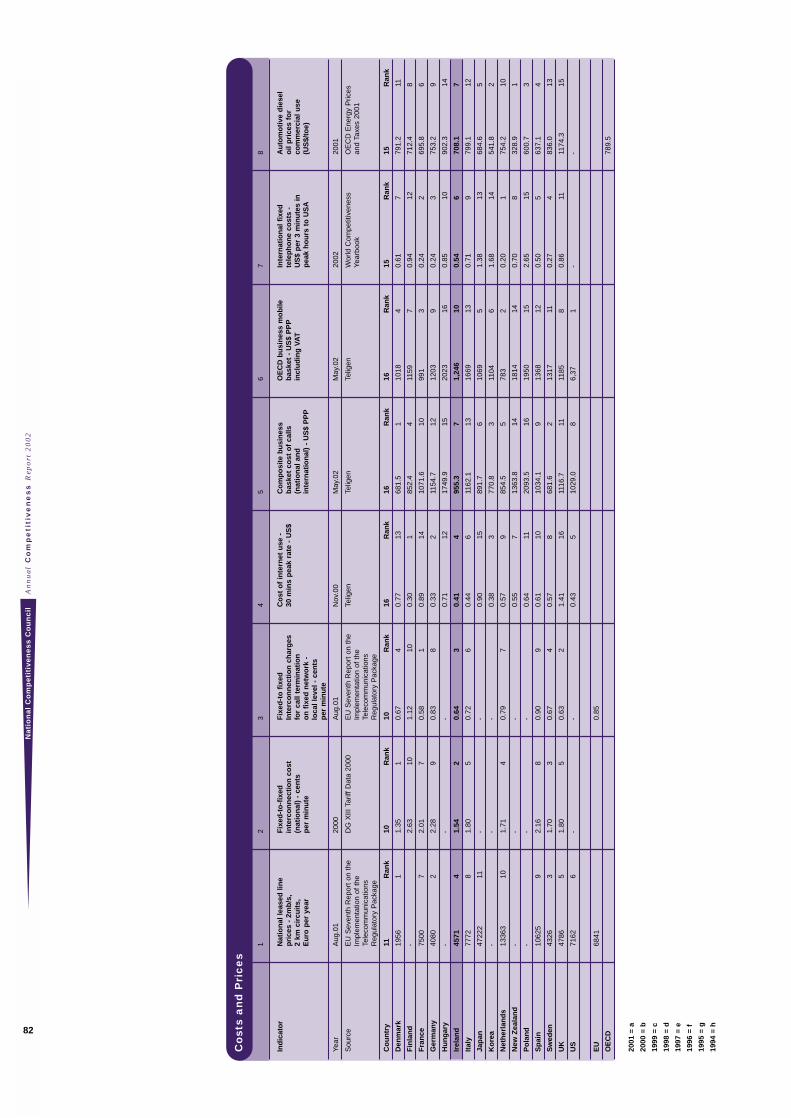
An
nu
al
Co
mp
eti
tiv
en
es
s R
epo
rt 2
00
2N
ati
on
al
Co
mp
eti
tiv
en
es
s C
ou
nc
il
82
Co
sts
an
d P
ric
es
12
34
56
78
Ind
icat
or
Nat
ion
al le
ased
lin
e
Fix
ed-t
o-f
ixed
F
ixed
-to
fix
ed
Co
st o
f in
tern
et u
se -
C
om
po
site
bu
sin
ess
OE
CD
bu
sin
ess
mo
bile
In
tern
atio
nal
fix
ed
Au
tom
oti
ve d
iese
l p
rice
s -
2mb
/s,
inte
rco
nn
ecti
on
co
st
Inte
rco
nn
ecti
on
ch
arg
es
30 m
ins
pea
k ra
te -
US
$b
aske
t co
st o
f ca
lls
bas
ket
- U
S$
PP
Pte
lep
ho
ne
cost
s -
oil
pri
ces
for
2 km
cir
cuit
s,(n
atio
nal
) -
cen
ts
for
call
term
inat
ion
(n
atio
nal
an
d
incl
ud
ing
VA
TU
S$
per
3 m
inu
tes
in
com
mer
cial
use
E
uro
per
yea
rp
er m
inu
teo
n f
ixed
net
wo
rk -
in
tern
atio
nal
) -
US
$ P
PP
pea
k h
ou
rs t
o U
SA
(US
$/to
e)lo
cal l
evel
- c
ents
p
er m
inu
te
Year
Aug
.01
2000
Aug
.01
Nov
.00
May
.02
May
.02
2002
2001
Sou
rce
EU
Sev
enth
Rep
ort
on t
he
DG
XIII
Tar
iff D
ata
2000
EU
Sev
enth
Rep
ort
on t
he
Telig
enTe
ligen
Telig
enW
orld
Com
petit
iven
ess
OE
CD
Ene
rgy
Pric
es
Impl
emen
tatio
n of
the
Im
plem
enta
tion
of t
he
Year
book
and
Taxe
s 20
01Te
leco
mm
unic
atio
ns
Tele
com
mun
icat
ions
R
egul
ator
y P
acka
geR
egul
ator
y P
acka
ge
Co
un
try
11R
ank
10R
ank
10R
ank
16R
ank
16R
ank
16R
ank
15R
ank
15R
ank
Den
mar
k19
561
1.35
10.
674
0.77
1368
1.5
110
184
0.61
779
1.2
11
Fin
lan
d-
2.63
101.
1210
0.30
185
2.4
411
597
0.94
1271
2.4
8
Fra
nce
7500
72.
017
0.58
10.
8914
1071
.610
991
30.
242
695.
86
Ger
man
y40
802
2.28
90.
838
0.33
211
54.7
1212
039
0.24
375
3.2
9
Hu
ng
ary
--
-0.
7112
1749
.915
2023
160.
8510
902.
314
Irel
and
4571
41.
542
0.64
30.
414
955.
37
1,24
610
0.54
670
8.1
7
Ital
y77
728
1.80
50.
726
0.44
611
62.1
1316
6913
0.71
979
9.1
12
Jap
an47
222
11-
-0.
9015
891.
76
1069
51.
3813
684.
65
Ko
rea
--
-0.
383
770.
83
1104
61.
6814
541.
82
Net
her
lan
ds
1336
310
1.71
40.
797
0.57
985
4.5
578
32
0.20
175
4.2
10
New
Zea
lan
d-
--
0.55
713
63.8
1418
1414
0.70
832
8.9
1
Po
lan
d-
--
0.64
1120
93.5
1619
5015
2.65
1560
0.7
3
Sp
ain
1062
59
2.16
80.
909
0.61
1010
34.1
913
6812
0.50
563
7.1
4
Sw
eden
4326
31.
703
0.67
40.
578
681.
62
1317
110.
274
836.
013
UK
4786
51.
805
0.63
21.
4116
1116
.711
1185
80.
8611
1174
.315
US
7162
6-
-0.
435
1029
.08
6,37
1-
-
EU
6841
0.85
OE
CD
789.
5
2001
= a
2000
= b
1999
= c
1998
= d
1997
= e
1996
= f
1995
= g
1994
= h
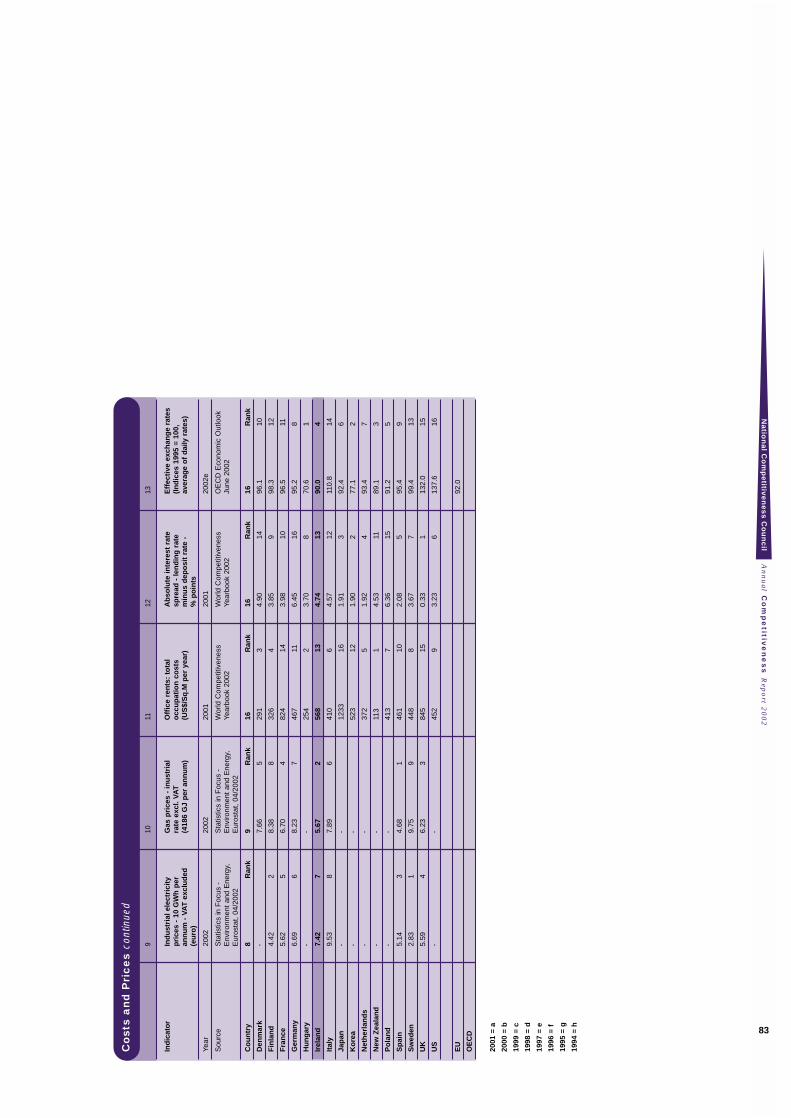
An
nu
al C
om
pe
titive
ne
ss R
epo
rt 20
02
Na
tion
al C
om
pe
titive
ne
ss
Co
un
cil
83
Co
sts
an
d P
ric
es
cont
inue
d
910
1112
13
Ind
icat
or
Ind
ust
rial
ele
ctri
city
G
as p
rice
s -
inu
stri
al
Off
ice
ren
ts:
tota
l A
bso
lute
inte
rest
rat
e E
ffec
tive
exc
han
ge
rate
s
pri
ces
- 10
GW
h p
er
rate
exc
l. VA
T
occ
up
atio
n c
ost
s sp
read
- le
nd
ing
rat
e
(In
dic
es 1
995
= 10
0,an
nu
m -
VA
T e
xclu
ded
(4
186
GJ
per
an
nu
m)
(US
$/S
q.M
per
yea
r)m
inu
s d
epo
sit
rate
-
aver
age
of
dai
ly r
ates
)(e
uro
)%
po
ints
Year
2002
2002
2001
2001
2002
e
Sou
rce
Sta
tistic
s in
Foc
us -
S
tatis
tics
in F
ocus
-
Wor
ld C
ompe
titiv
enes
s W
orld
Com
petit
iven
ess
OE
CD
Eco
nom
ic O
utlo
ok
Env
ironm
ent
and
Ene
rgy,
Env
ironm
ent
and
Ene
rgy,
Year
book
200
2Ye
arbo
ok 2
002
June
200
2E
uros
tat,
04/2
002
Eur
osta
t, 04
/200
2
Co
un
try
8R
ank
9R
ank
16R
ank
16R
ank
16R
ank
Den
mar
k-
7.66
529
13
4.90
1496
.110
Fin
lan
d4.
422
8.38
832
64
3.85
998
.312
Fra
nce
5.62
56.
704
824
143.
9810
96.5
11
Ger
man
y6.
696
8.23
746
711
6.45
1695
.28
Hu
ng
ary
--
254
23.
708
70.6
1
Irel
and
7.42
75.
672
568
134.
7413
90.0
4
Ital
y9.
538
7.89
641
06
4.57
1211
0.8
14
Jap
an-
-12
3316
1.91
392
.46
Ko
rea
--
523
121.
902
77.1
2
Net
her
lan
ds
--
372
51.
924
93.4
7
New
Zea
lan
d-
-11
31
4.53
1189
.13
Po
lan
d-
-41
37
6.36
1591
.25
Sp
ain
5.14
34.
681
461
102.
085
95.4
9
Sw
eden
2.83
19.
759
448
83.
677
99.4
13
UK
5.59
46.
233
845
150.
331
132.
015
US
--
452
93.
236
137.
616
EU
92.0
OE
CD
2001
= a
2000
= b
1999
= c
1998
= d
1997
= e
1996
= f
1995
= g
1994
= h
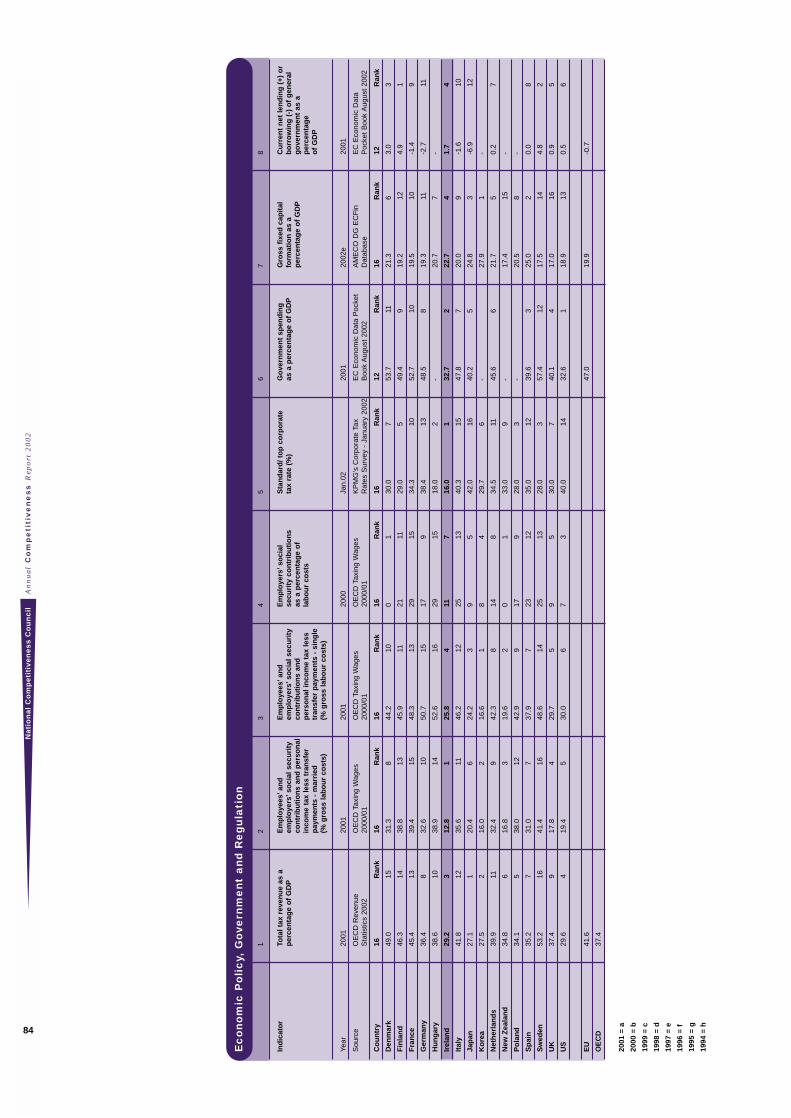
An
nu
al
Co
mp
eti
tiv
en
es
s R
epo
rt 2
00
2N
ati
on
al
Co
mp
eti
tiv
en
es
s C
ou
nc
il
84
Ec
on
om
ic P
olic
y, G
ove
rnm
en
t a
nd
Re
gu
lati
on
12
34
56
78
Ind
icat
or
Tota
l tax
rev
enu
e as
a
Em
plo
yees
’an
d
Em
plo
yees
’an
d
Em
plo
yers
’so
cial
S
tan
dar
d/ t
op
co
rpo
rate
G
ove
rnm
ent
spen
din
g
Gro
ss f
ixed
cap
ital
C
urr
ent
net
len
din
g (
+) o
r p
erce
nta
ge
of
GD
Pem
plo
yers
’so
cial
sec
uri
tyem
plo
yers
’so
cial
sec
uri
ty
secu
rity
co
ntr
ibu
tio
ns
ta
x ra
te (
%)
as a
per
cen
tag
e o
f G
DP
form
atio
n a
s a
bo
rro
win
g (
-) o
f g
ener
al
con
trib
uti
on
s an
d p
erso
nal
co
ntr
ibu
tio
ns
and
as
a p
erce
nta
ge
of
per
cen
tag
e o
f G
DP
go
vern
men
t as
a
inco
me
tax
less
tra
nsf
er
per
son
al in
com
e ta
x le
ss
lab
ou
r co
sts
per
cen
tag
e p
aym
ents
- m
arri
edtr
ansf
er p
aym
ents
- s
ing
le
of
GD
P(%
gro
ss la
bo
ur
cost
s)(%
gro
ss la
bo
ur
cost
s)
Year
2001
2001
2001
2000
Jan.
0220
0120
02e
2001
Sou
rce
OE
CD
Rev
enue
O
EC
D T
axin
g W
ages
O
EC
D T
axin
g W
ages
O
EC
D T
axin
g W
ages
K
PM
G’s
Cor
pora
te T
ax
EC
Eco
nom
ic D
ata
Poc
ket
AM
EC
O D
G E
CF
in
EC
Eco
nom
ic D
ata
Sta
tistic
s 20
0220
00/0
120
00/0
120
00/0
1R
ates
Sur
vey
- Ja
nuar
y 20
02B
ook
Aug
ust
2002
Dat
abas
eP
ocke
t B
ook
Aug
ust
2002
Co
un
try
16R
ank
16R
ank
16R
ank
16R
ank
16R
ank
12R
ank
16R
ank
12R
ank
Den
mar
k49
.015
31.3
844
.210
01
30.0
753
.711
21.3
63.
03
Fin
lan
d46
.314
38.8
1345
.911
2111
29.0
549
.49
19.2
124.
91
Fra
nce
45.4
1339
.415
48.3
1329
1534
.310
52.7
1019
.510
-1.4
9
Ger
man
y36
.48
32.6
1050
.715
179
38.4
1348
.58
19.3
11-2
.711
Hu
ng
ary
38.6
1038
.914
52.6
1629
1518
.02
-20
.77
-
Irel
and
29.2
312
.81
25.8
411
716
.01
32.7
222
.74
1.7
4
Ital
y41
.812
35.6
1146
.212
2513
40.3
1547
.87
20.0
9-1
.610
Jap
an27
.11
20.4
624
.23
95
42.0
1640
.25
24.8
3-6
.912
Ko
rea
27.5
216
.02
16.6
18
429
.76
-27
.91
-
Net
her
lan
ds
39.9
1132
.49
42.3
814
834
.511
45.6
621
.75
0.2
7
New
Zea
lan
d34
.86
16.8
319
.62
01
33.0
9-
17.4
15-
Po
lan
d34
.15
38.0
1242
.99
179
28.0
3-
20.5
8-
Sp
ain
35.2
731
.07
37.9
723
1235
.012
39.6
325
.02
0.0
8
Sw
eden
53.2
1641
.416
48.6
1425
1328
.03
57.4
1217
.514
4.8
2
UK
37.4
917
.84
29.7
59
530
.07
40.1
417
.016
0.9
5
US
29.6
419
.45
30.0
67
340
.014
32.6
118
.913
0.5
6
EU
41.6
47.0
19.9
-0.7
OE
CD
37.4
2001
= a
2000
= b
1999
= c
1998
= d
1997
= e
1996
= f
1995
= g
1994
= h

An
nu
al C
om
pe
titive
ne
ss R
epo
rt 20
02
Na
tion
al C
om
pe
titive
ne
ss
Co
un
cil
85
Ec
on
om
ic P
olic
y, G
ove
rnm
en
t a
nd
Re
gu
lati
on
con
tinue
d
910
11
Ind
icat
or
Ove
rall
emp
loym
ent
Co
st o
f fo
rmin
g a
pri
vate
R
atin
g o
f C
om
pet
itio
n
pro
tect
ion
ag
ain
st
limit
ed c
om
pan
y (e
uro
)A
uth
ori
ties
acr
oss
d
ism
issa
lco
un
trie
s
Year
Late
90s
1996
2002
Sou
rce
OE
CD
Em
ploy
men
t O
utlo
ok
OE
CD
’Fos
terin
g G
loba
l Com
petit
ion
Rev
iew
-
June
199
9E
ntre
pren
eurs
hip
- Ju
ly 2
002
AT
hem
atic
Rev
iew
’, 19
98
Co
un
try
15R
ank
10R
ank
13R
ank
Den
mar
k1.
63
-3.
56
Fin
lan
d2.
16
-3.
56
Fra
nce
2.3
934
009
4.5
2
Ger
man
y2.
812
1400
74.
52
Hu
ng
ary
2.1
6-
-
Irel
and
1.6
320
01
3.5
6
Ital
y2.
812
2100
84.
05
Jap
an2.
711
4000
103.
56
Ko
rea
--
-
Net
her
lan
ds
3.1
1510
005
3.5
6
New
Zea
lan
d1.
75
-3.
56
Po
lan
d2.
28
--
Sp
ain
2.6
1030
02
3.0
13
Sw
eden
2.8
1211
006
3.5
6
UK
0.8
240
03
4.5
2
US
0.2
150
04
5.0
1
EU
3.5
4
OE
CD
2001
= a
2000
= b
1999
= c
1998
= d
1997
= e
1996
= f
1995
= g
1994
= h
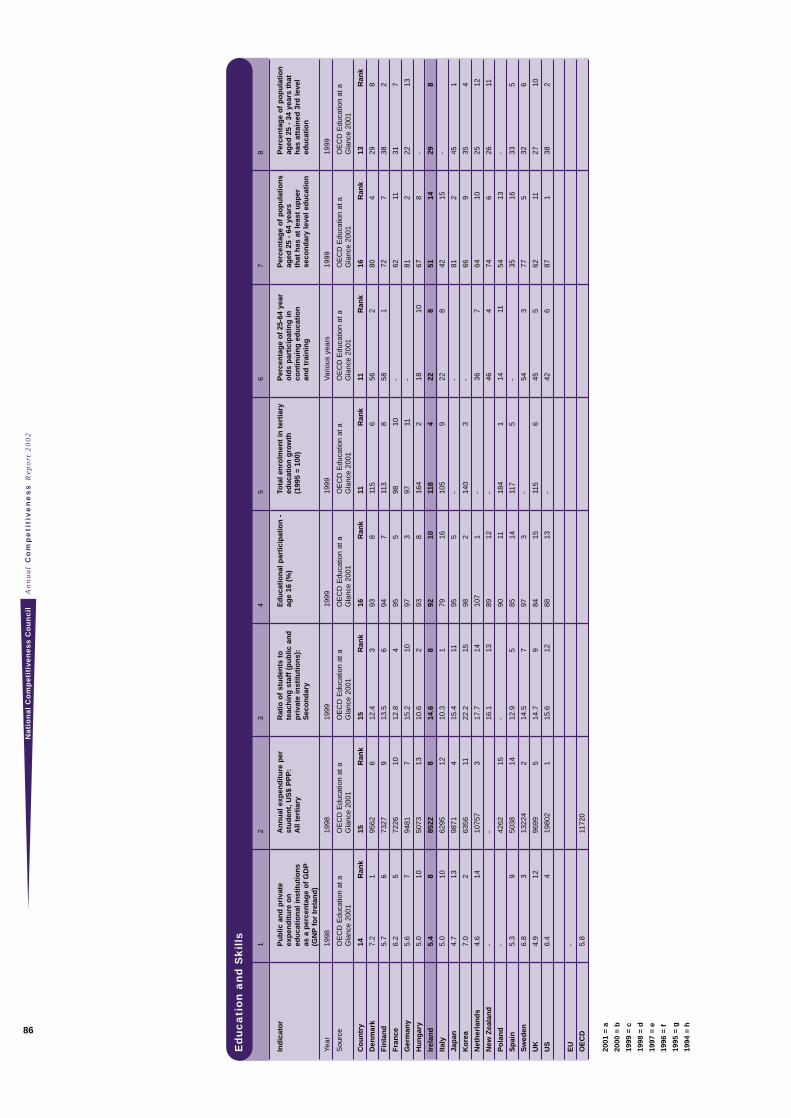
An
nu
al
Co
mp
eti
tiv
en
es
s R
epo
rt 2
00
2N
ati
on
al
Co
mp
eti
tiv
en
es
s C
ou
nc
il
86
Ed
uc
ati
on
an
d S
kills 1
23
45
67
8
Ind
icat
or
Pu
blic
an
d p
riva
te
An
nu
al e
xpen
dit
ure
per
R
atio
of
stu
den
ts t
o
Ed
uca
tio
nal
par
tici
pat
ion
-
Tota
l en
rolm
ent
in t
erti
ary
Per
cen
tag
e o
f 25
-64
year
P
erce
nta
ge
of
po
pu
lati
on
sP
erce
nta
ge
of
po
pu
lati
on
ex
pen
dit
ure
on
st
ud
ent,
US
$ P
PP
: te
ach
ing
sta
ff (
pu
blic
an
d
age
16 (
%)
edu
cati
on
gro
wth
o
lds
par
tici
pat
ing
in
aged
25
- 64
yea
rs
aged
25
- 34
yea
rs t
hat
ed
uca
tio
nal
inst
itu
tio
ns
A
ll te
rtia
ryp
riva
te in
stit
uti
on
s):
(199
5 =
100)
con
tin
uin
g e
du
cati
on
th
at h
as a
t le
ast
up
per
h
as a
ttai
ned
3rd
leve
l as
a p
erce
nta
ge
of
GD
PS
eco
nd
ary
and
tra
inin
gse
con
dar
y le
vel e
du
cati
on
edu
cati
on
(GN
Pfo
r Ir
elan
d)
Year
1998
1998
1999
1999
1999
Var
ious
yea
rs19
9919
99
Sou
rce
OE
CD
Edu
catio
n at
a
OE
CD
Edu
catio
n at
a
OE
CD
Edu
catio
n at
a
OE
CD
Edu
catio
n at
a
OE
CD
Edu
catio
n at
a
OE
CD
Edu
catio
n at
a
OE
CD
Edu
catio
n at
a
OE
CD
Edu
catio
n at
a
Gla
nce
2001
Gla
nce
2001
Gla
nce
2001
Gla
nce
2001
Gla
nce
2001
Gla
nce
2001
Gla
nce
2001
Gla
nce
2001
Co
un
try
14R
ank
15R
ank
15R
ank
16R
ank
11R
ank
11R
ank
16R
ank
13R
ank
Den
mar
k7.
21
9562
612
.43
938
115
656
280
429
8
Fin
lan
d5.
76
7327
913
.56
947
113
858
172
738
2
Fra
nce
6.2
572
2610
12.8
495
598
10-
6211
317
Ger
man
y5.
67
9481
715
.210
973
9711
-81
222
13
Hu
ng
ary
5.0
1050
7313
10.6
293
816
42
1810
678
-
Irel
and
5.4
885
228
14.6
892
1011
84
228
5114
298
Ital
y5.
010
6295
1210
.31
7916
105
922
842
15-
Jap
an4.
713
9871
415
.411
955
--
812
451
Ko
rea
7.0
263
5611
22.2
1598
214
03
-66
935
4
Net
her
lan
ds
4.6
1410
757
317
.714
107
1-
367
6410
2512
New
Zea
lan
d-
-16
.113
8912
-46
474
626
11
Po
lan
d-
4262
15-
9011
184
114
1154
13-
Sp
ain
5.3
950
3814
12.9
585
1411
75
-35
1633
5
Sw
eden
6.8
313
224
214
.57
973
-54
377
532
6
UK
4.9
1296
995
14.7
984
1511
56
455
6211
2710
US
6.4
419
802
115
.612
8813
-42
687
138
2
EU
-
OE
CD
5.8
1172
0
2001
= a
2000
= b
1999
= c
1998
= d
1997
= e
1996
= f
1995
= g
1994
= h
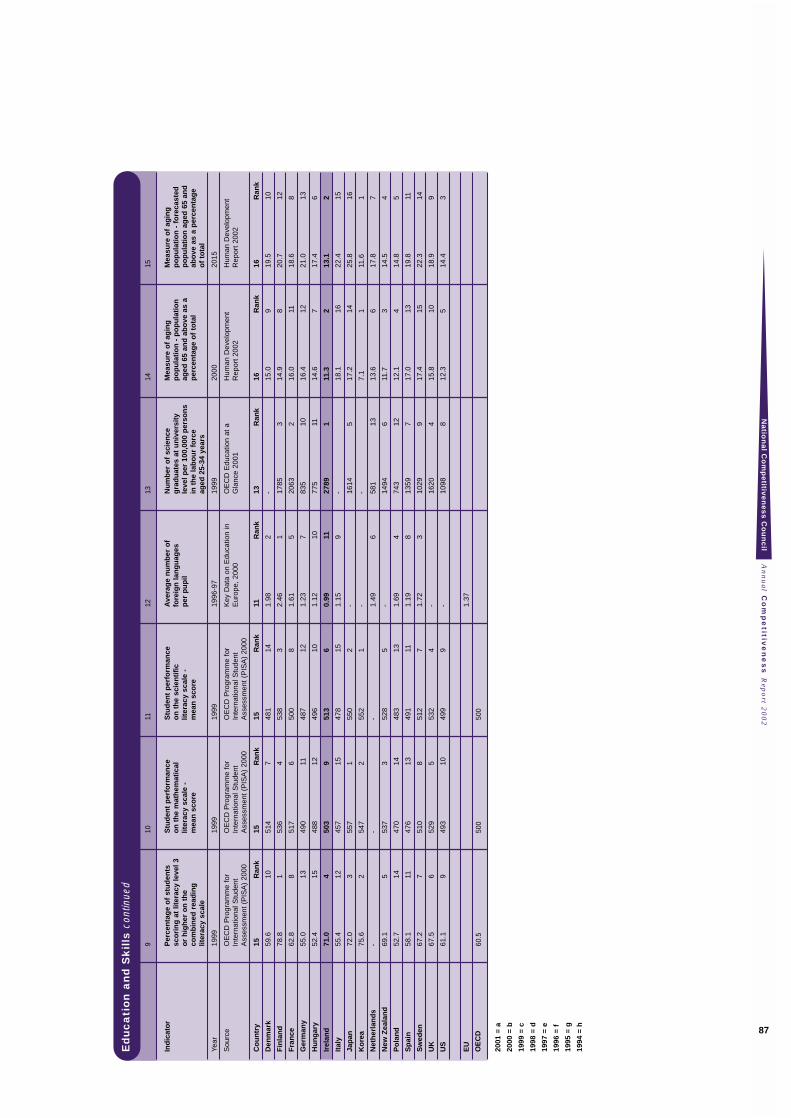
An
nu
al C
om
pe
titive
ne
ss R
epo
rt 20
02
Na
tion
al C
om
pe
titive
ne
ss
Co
un
cil
87
Ed
uc
ati
on
an
d S
kills
con
tinue
d
910
1112
1314
15
Ind
icat
or
Per
cen
tag
e o
f st
ud
ents
S
tud
ent
per
form
ance
S
tud
ent
per
form
ance
A
vera
ge
nu
mb
er o
f
Nu
mb
er o
f sc
ien
ce
Mea
sure
of
agin
g
Mea
sure
of
agin
g
sco
rin
g a
t lit
erac
y le
vel 3
o
n t
he
mat
hem
atic
al
on
th
e sc
ien
tifi
c fo
reig
n la
ng
uag
es
gra
du
ates
at
un
iver
sity
p
op
ula
tio
n -
po
pu
lati
on
p
op
ula
tio
n -
fo
reca
sted
o
r h
igh
er o
n t
he
lit
erac
y sc
ale
- lit
erac
y sc
ale
- p
er p
up
ille
vel p
er 1
00,0
00 p
erso
ns
aged
65
and
ab
ove
as
a p
op
ula
tio
n a
ged
65
and
co
mb
ined
rea
din
g
mea
n s
core
mea
n s
core
in t
he
lab
ou
r fo
rce
per
cen
tag
e o
f to
tal
abo
ve a
s a
per
cen
tag
e lit
erac
y sc
ale
aged
25-
34 y
ears
of
tota
l
Year
1999
1999
1999
1996
-97
1999
2000
2015
Sou
rce
OE
CD
Pro
gram
me
for
OE
CD
Pro
gram
me
for
OE
CD
Pro
gram
me
for
Key
Dat
a on
Edu
catio
n in
O
EC
D E
duca
tion
at a
H
uman
Dev
elop
men
t H
uman
Dev
elop
men
t In
tern
atio
nal S
tude
nt
Inte
rnat
iona
l Stu
dent
In
tern
atio
nal S
tude
nt
Eur
ope,
200
0G
lanc
e 20
01R
epor
t 20
02R
epor
t 20
02A
sses
smen
t (P
ISA
) 20
00A
sses
smen
t (P
ISA
) 20
00A
sses
smen
t (P
ISA
) 20
00
Co
un
try
15R
ank
15R
ank
15R
ank
11R
ank
13R
ank
16R
ank
16R
ank
Den
mar
k59
.610
514
748
114
1.98
2-
15.0
919
.510
Fin
lan
d78
.81
536
453
83
2.46
117
853
14.9
820
.712
Fra
nce
62.8
851
76
500
81.
615
2063
216
.011
18.6
8
Ger
man
y55
.013
490
1148
712
1.23
783
510
16.4
1221
.013
Hu
ng
ary
52.4
1548
812
496
101.
1210
775
1114
.67
17.4
6
Irel
and
71.0
450
39
513
60.
9911
2789
111
.32
13.1
2
Ital
y55
.412
457
1547
815
1.15
9-
18.1
1622
.415
Jap
an72
.03
557
155
02
-16
145
17.2
1425
.816
Ko
rea
75.6
254
72
552
1-
-7.
11
11.6
1
Net
her
lan
ds
--
-1.
496
581
1313
.66
17.8
7
New
Zea
lan
d69
.15
537
352
85
-14
946
11.7
314
.54
Po
lan
d52
.714
470
1448
313
1.69
474
312
12.1
414
.85
Sp
ain
58.1
1147
613
491
111.
198
1359
717
.013
19.8
11
Sw
eden
67.2
751
08
512
71.
723
1029
917
.415
22.3
14
UK
67.5
652
95
532
4-
1620
415
.810
18.9
9
US
61.1
949
310
499
9-
1098
812
.35
14.4
3
EU
1.37
OE
CD
60.5
500
500
2001
= a
2000
= b
1999
= c
1998
= d
1997
= e
1996
= f
1995
= g
1994
= h
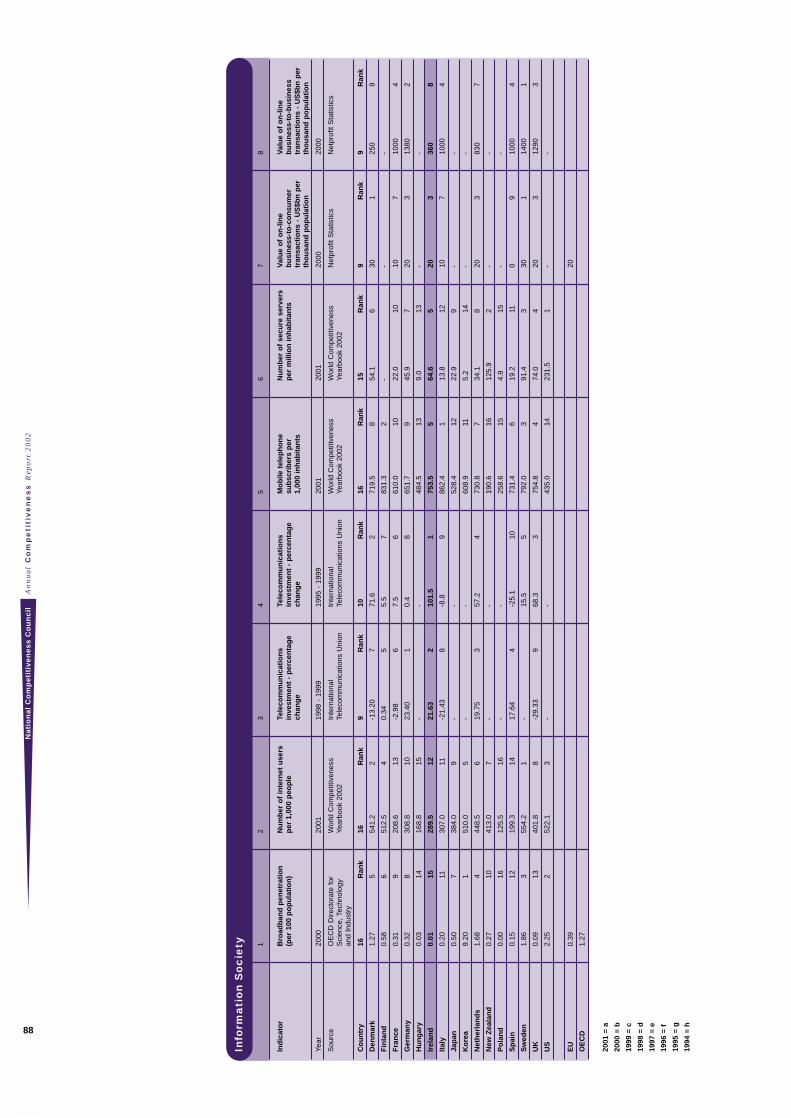
An
nu
al
Co
mp
eti
tiv
en
es
s R
epo
rt 2
00
2N
ati
on
al
Co
mp
eti
tiv
en
es
s C
ou
nc
il
88
Info
rma
tio
n S
oc
iety 1
23
45
67
8
Ind
icat
or
Bro
adb
and
pen
etra
tio
n
Nu
mb
er o
f in
tern
et u
sers
Te
leco
mm
un
icat
ion
s Te
leco
mm
un
icat
ion
s M
ob
ile t
elep
ho
ne
Nu
mb
er o
f se
cure
ser
vers
V
alu
e o
f o
n-l
ine
Val
ue
of
on
-lin
e (p
er 1
00 p
op
ula
tio
n)
per
1,0
00 p
eop
lein
vest
men
t -
per
cen
tag
e in
vest
men
t -
per
cen
tag
e su
bsc
rib
ers
per
p
er m
illio
n in
hab
itan
tsb
usi
nes
s-to
-co
nsu
mer
b
usi
nes
s-to
-bu
sin
ess
chan
ge
chan
ge
1,00
0 in
hab
itan
tstr
ansa
ctio
ns
- U
S$b
n p
er
tran
sact
ion
s -
US
$bn
per
th
ou
san
d p
op
ula
tio
nth
ou
san
d p
op
ula
tio
n
Year
2000
2001
1998
- 1
999
1995
- 1
999
2001
2001
2000
2000
Sou
rce
OE
CD
Dire
ctor
ate
for
Wor
ld C
ompe
titiv
enes
s In
tern
atio
nal
Inte
rnat
iona
l W
orld
Com
petit
iven
ess
Wor
ld C
ompe
titiv
enes
s N
etpr
ofit
Sta
tistic
sN
etpr
ofit
Sta
tistic
sS
cien
ce, T
echn
olog
y Ye
arbo
ok 2
002
Tele
com
mun
icat
ions
Uni
onTe
leco
mm
unic
atio
ns U
nion
Year
book
200
2Ye
arbo
ok 2
002
and
Indu
stry
Co
un
try
16R
ank
16R
ank
9R
ank
10R
ank
16R
ank
15R
ank
9R
ank
9R
ank
Den
mar
k1.
275
541.
22
-13.
207
71.6
271
9.5
854
.16
301
250
9
Fin
lan
d0.
586
512.
54
0.34
55.
57
831.
32
--
-
Fra
nce
0.31
920
8.6
13-2
.98
67.
56
610.
010
22.0
1010
710
004
Ger
man
y0.
328
308.
810
23.4
01
0.4
865
1.7
945
.97
203
1380
2
Hu
ng
ary
0.03
1416
8.8
15-
-48
4.5
139.
013
--
Irel
and
0.01
1528
9.5
1221
.63
210
1.5
175
3.5
564
.65
203
360
8
Ital
y0.
2011
307.
011
-21.
438
-8.8
986
2.4
113
.812
107
1000
4
Jap
an0.
507
384.
09
--
528.
412
22.9
9-
-
Ko
rea
9.20
151
0.0
5-
-60
8.9
115.
214
--
Net
her
lan
ds
1.68
444
8.5
619
.75
357
.24
730.
87
34.1
820
383
07
New
Zea
lan
d0.
2710
413.
07
--
190.
616
125.
92
--
Po
lan
d0.
0016
125.
516
--
258.
615
4.9
15-
-
Sp
ain
0.15
1219
9.3
1417
.64
4-2
5.1
1073
1.4
619
.211
09
1000
4
Sw
eden
1.86
355
4.2
1-
15.5
579
2.0
391
.43
301
1400
1
UK
0.09
1340
1.8
8-2
9.33
968
.33
754.
84
74.0
420
312
903
US
2.25
252
2.1
3-
-43
5.0
1423
1.5
1-
-
EU
0.39
20
OE
CD
1.27
2001
= a
2000
= b
1999
= c
1998
= d
1997
= e
1996
= f
1995
= g
1994
= h
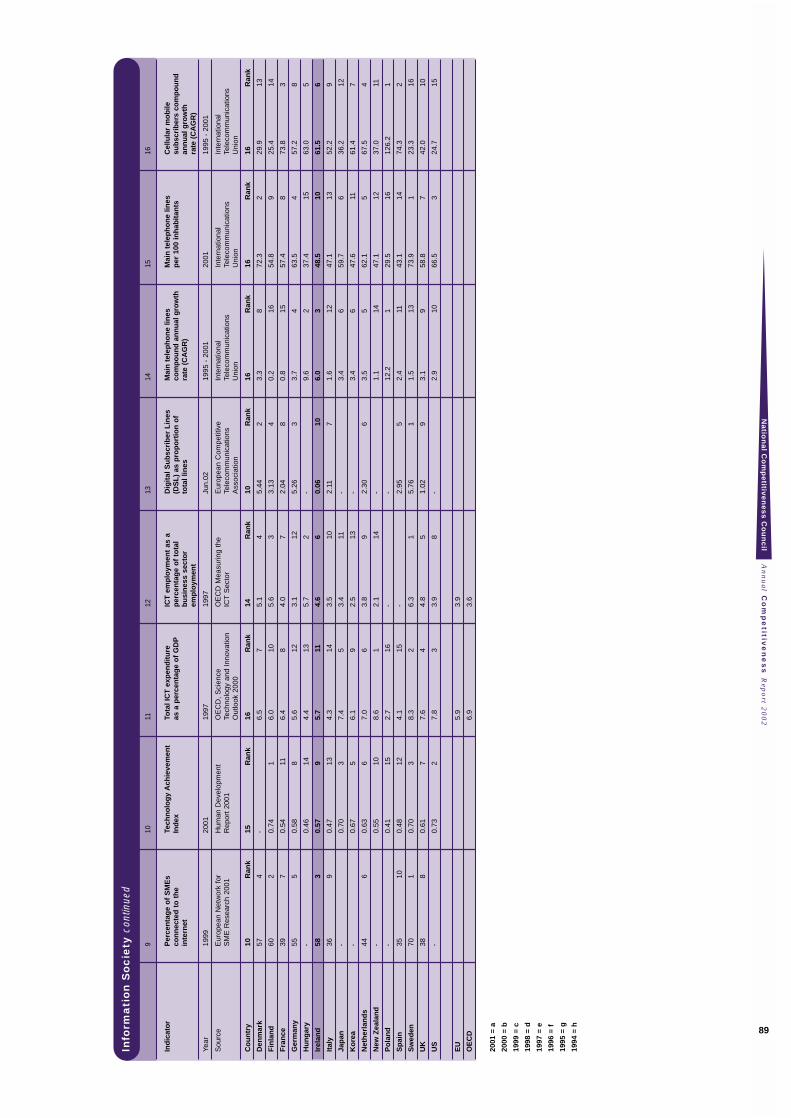
An
nu
al C
om
pe
titive
ne
ss R
epo
rt 20
02
Na
tion
al C
om
pe
titive
ne
ss
Co
un
cil
89
Info
rma
tio
n S
oc
iety
con
tinue
d
910
1112
1314
1516
Ind
icat
or
Per
cen
tag
e o
f S
ME
s Te
chn
olo
gy
Ach
ieve
men
t To
tal I
CT
exp
end
itu
re
ICT
em
plo
ymen
t as
a
Dig
ital
Su
bsc
rib
er L
ines
M
ain
tel
eph
on
e lin
es
Mai
n t
elep
ho
ne
lines
C
ellu
lar
mo
bile
co
nn
ecte
d t
o t
he
Ind
exas
a p
erce
nta
ge
of
GD
Pp
erce
nta
ge
of
tota
l (D
SL
) as
pro
po
rtio
n o
f co
mp
ou
nd
an
nu
al g
row
th
per
100
inh
abit
ants
sub
scri
ber
s co
mp
ou
nd
in
tern
etb
usi
nes
s se
cto
r to
tal l
ines
rate
(C
AG
R)
ann
ual
gro
wth
em
plo
ymen
tra
te (
CA
GR
)
Year
1999
2001
1997
1997
Jun.
0219
95 -
200
120
0119
95 -
200
1
Sou
rce
Eur
opea
n N
etw
ork
for
Hum
an D
evel
opm
ent
OE
CD
, S
cien
ce
OE
CD
Mea
surin
g th
e E
urop
ean
Com
petit
ive
Inte
rnat
iona
l In
tern
atio
nal
Inte
rnat
iona
l S
ME
Res
earc
h 20
01R
epor
t 20
01Te
chno
logy
and
Inn
ovat
ion
ICT
Sec
tor
Tele
com
mun
icat
ions
Te
leco
mm
unic
atio
ns
Tele
com
mun
icat
ions
Tele
com
mun
icat
ions
O
utlo
ok 2
000
Ass
ocia
tion
Uni
onU
nion
Uni
on
Co
un
try
10R
ank
15R
ank
16R
ank
14R
ank
10R
ank
16R
ank
16R
ank
16R
ank
Den
mar
k57
4-
6.5
75.
14
5.44
23.
38
72.3
229
.913
Fin
lan
d60
20.
741
6.0
105.
63
3.13
40.
216
54.8
925
.414
Fra
nce
397
0.54
116.
48
4.0
72.
048
0.8
1557
.48
73.8
3
Ger
man
y55
50.
588
5.6
123.
112
5.26
33.
74
63.5
457
.28
Hu
ng
ary
-0.
4614
4.4
135.
72
-9.
62
37.4
1563
.05
Irel
and
583
0.57
95.
711
4.6
60.
0610
6.0
348
.510
61.5
6
Ital
y36
90.
4713
4.3
143.
510
2.11
71.
612
47.1
1352
.29
Jap
an-
0.70
37.
45
3.4
11-
3.4
659
.76
36.2
12
Ko
rea
-0.
675
6.1
92.
513
-3.
46
47.6
1161
.47
Net
her
lan
ds
446
0.63
67.
06
3.8
92.
306
3.5
562
.15
67.5
4
New
Zea
lan
d-
0.55
108.
61
2.1
14-
1.1
1447
.112
37.0
11
Po
lan
d-
0.41
152.
716
--
12.2
129
.516
126.
21
Sp
ain
3510
0.48
124.
115
-2.
955
2.4
1143
.114
74.3
2
Sw
eden
701
0.70
38.
32
6.3
15.
761
1.5
1373
.91
23.3
16
UK
388
0.61
77.
64
4.8
51.
029
3.1
958
.87
42.0
10
US
-0.
732
7.8
33.
98
-2.
910
66.5
324
.715
EU
5.9
3.9
OE
CD
6.9
3.6
2001
= a
2000
= b
1999
= c
1998
= d
1997
= e
1996
= f
1995
= g
1994
= h
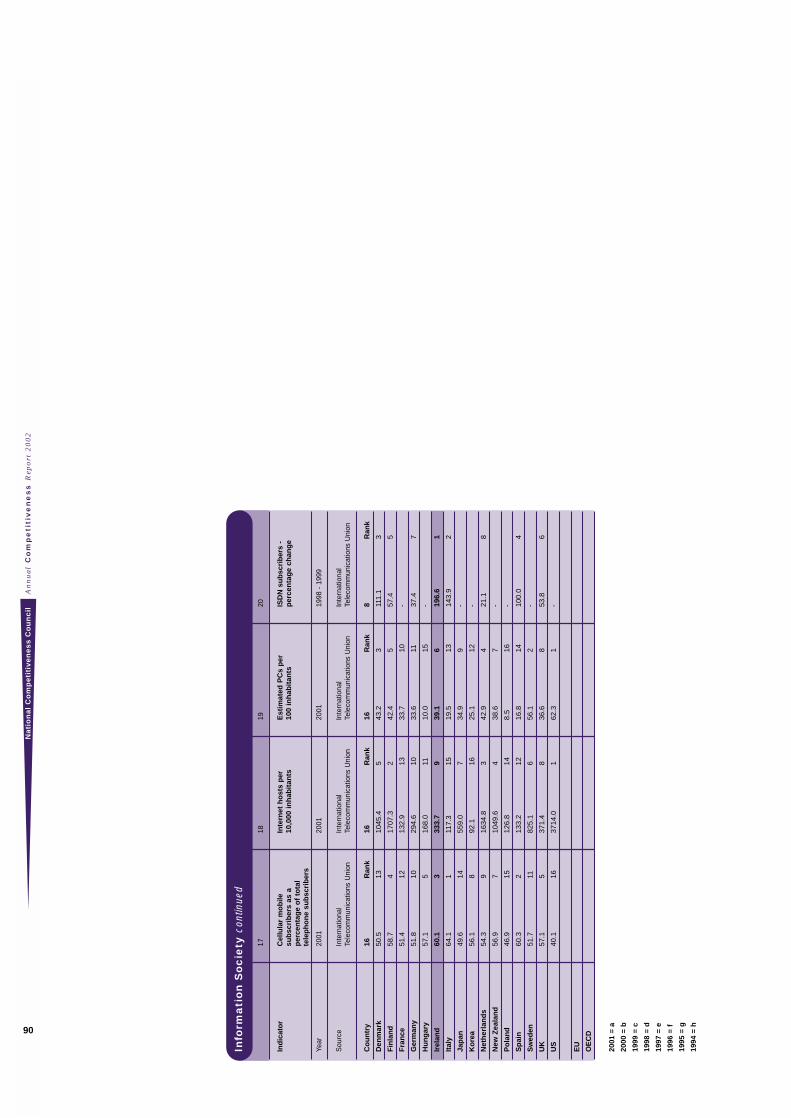
An
nu
al
Co
mp
eti
tiv
en
es
s R
epo
rt 2
00
2N
ati
on
al
Co
mp
eti
tiv
en
es
s C
ou
nc
il
90
Info
rma
tio
n S
oc
iety
con
tinue
d
1718
1920
Ind
icat
or
Cel
lula
r m
ob
ile
Inte
rnet
ho
sts
per
E
stim
ated
PC
s p
er
ISD
N s
ub
scri
ber
s -
sub
scri
ber
s as
a
10,0
00 in
hab
itan
ts
100
inh
abit
ants
per
cen
tag
e ch
ang
ep
erce
nta
ge
of
tota
l te
lep
ho
ne
sub
scri
ber
s
Year
2001
2001
2001
1998
- 1
999
Sou
rce
Inte
rnat
iona
l In
tern
atio
nal
Inte
rnat
iona
l In
tern
atio
nal
Tele
com
mun
icat
ions
Uni
onTe
leco
mm
unic
atio
ns U
nion
Tele
com
mun
icat
ions
Uni
onTe
leco
mm
unic
atio
ns U
nion
Co
un
try
16R
ank
16R
ank
16R
ank
8R
ank
Den
mar
k50
.513
1045
.45
43.2
311
1.1
3
Fin
lan
d58
.74
1707
.32
42.4
557
.45
Fra
nce
51.4
1213
2.9
1333
.710
-
Ger
man
y51
.810
294.
610
33.6
1137
.47
Hu
ng
ary
57.1
516
8.0
1110
.015
-
Irel
and
60.1
333
3.7
939
.16
196.
61
Ital
y64
.11
117.
315
19.5
1314
3.9
2
Jap
an49
.614
559.
07
34.9
9-
Ko
rea
56.1
892
.116
25.1
12-
Net
her
lan
ds
54.3
916
34.8
342
.94
21.1
8
New
Zea
lan
d56
.97
1049
.64
38.6
7-
Po
lan
d46
.915
126.
814
8.5
16-
Sp
ain
60.3
213
3.2
1216
.814
100.
04
Sw
eden
51.7
1182
5.1
656
.12
-
UK
57.1
537
1.4
836
.68
53.8
6
US
40.1
1637
14.0
162
.31
-
EU
OE
CD
2001
= a
2000
= b
1999
= c
1998
= d
1997
= e
1996
= f
1995
= g
1994
= h
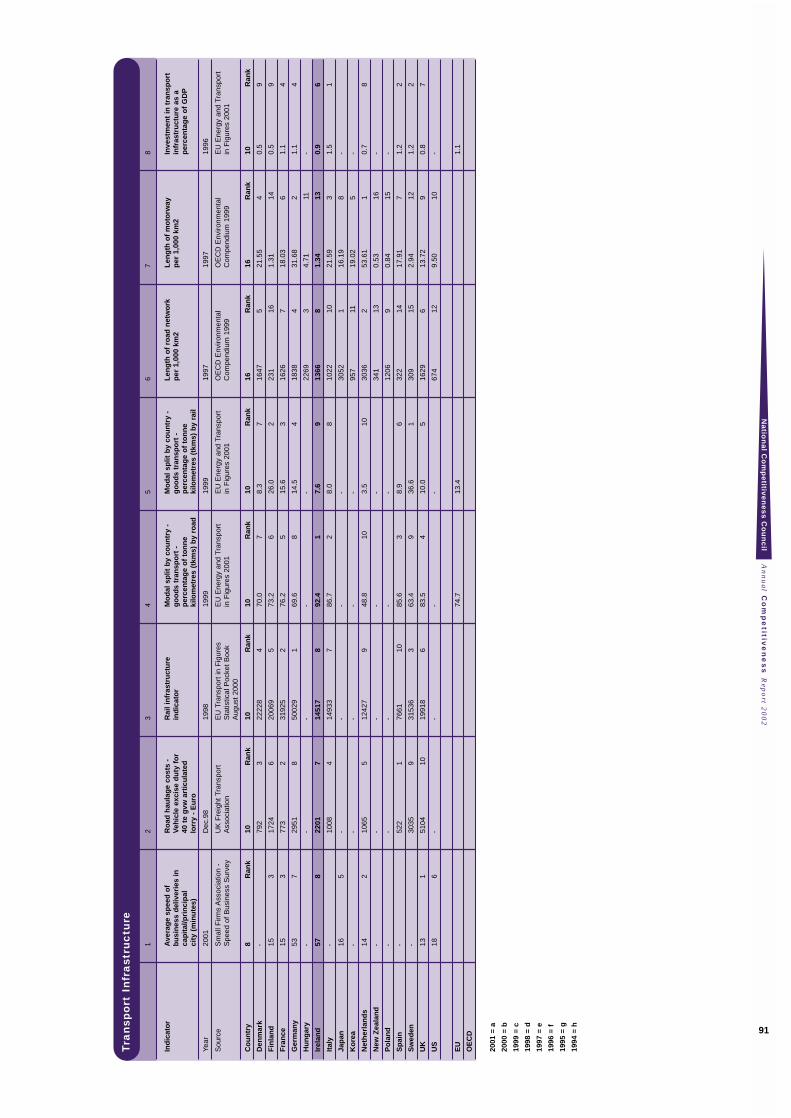
An
nu
al C
om
pe
titive
ne
ss R
epo
rt 20
02
Na
tion
al C
om
pe
titive
ne
ss
Co
un
cil
91
Tra
nsp
ort
In
fra
stru
ctu
re
12
34
56
78
Ind
icat
or
Ave
rag
e sp
eed
of
Ro
ad h
aula
ge
cost
s -
Rai
l in
fras
tru
ctu
reM
od
al s
plit
by
cou
ntr
y -
Mo
dal
sp
lit b
y co
un
try
- L
eng
th o
f ro
ad n
etw
ork
L
eng
th o
f m
oto
rway
In
vest
men
t in
tra
nsp
ort
b
usi
nes
s d
eliv
erie
s in
V
ehic
le e
xcis
e d
uty
fo
r in
dic
ato
rg
oo
ds
tran
spo
rt -
g
oo
ds
tran
spo
rt -
p
er 1
,000
km
2p
er 1
,000
km
2in
fras
tru
ctu
re a
s a
cap
ital
/pri
nci
pal
40
te
gvw
art
icu
late
d
per
cen
tag
e o
f to
nn
e p
erce
nta
ge
of
ton
ne
per
cen
tag
e o
f G
DP
city
(m
inu
tes)
lorr
y -
Eu
roki
lom
etre
s (t
kms)
by
road
kilo
met
res
(tkm
s) b
y ra
il
Year
2001
Dec
.98
1998
1999
1999
1997
1997
1996
Sou
rce
Sm
all F
irms
Ass
ocia
tion
- U
K F
reig
ht T
rans
port
E
U T
rans
port
in F
igur
es
EU
Ene
rgy
and
Tran
spor
t E
U E
nerg
y an
d Tr
ansp
ort
OE
CD
Env
ironm
enta
l O
EC
D E
nviro
nmen
tal
EU
Ene
rgy
and
Tran
spor
t S
peed
of
Bus
ines
s S
urve
yA
ssoc
iatio
nS
tatis
tical
Poc
ket
Boo
k in
Fig
ures
200
1in
Fig
ures
200
1C
ompe
ndiu
m 1
999
Com
pend
ium
199
9in
Fig
ures
200
1A
ugus
t 20
00
Co
un
try
8R
ank
10R
ank
10R
ank
10R
ank
10R
ank
16R
ank
16R
ank
10R
ank
Den
mar
k-
792
322
228
470
.07
8.3
716
475
21.5
54
0.5
9
Fin
lan
d15
317
246
2006
95
73.2
626
.02
231
161.
3114
0.5
9
Fra
nce
153
773
231
925
276
.25
15.6
316
267
18.0
36
1.1
4
Ger
man
y53
729
518
5002
91
69.6
814
.54
1838
431
.68
21.
14
Hu
ng
ary
--
--
-22
693
4.71
11-
Irel
and
578
2201
714
517
892
.41
7.6
913
668
1.34
130.
96
Ital
y-
1008
414
933
786
.72
8.0
810
2210
21.5
93
1.5
1
Jap
an16
5-
--
-30
521
16.1
98
-
Ko
rea
--
--
-95
711
19.0
25
-
Net
her
lan
ds
142
1065
512
427
948
.810
3.5
1030
362
53.6
11
0.7
8
New
Zea
lan
d-
--
--
341
130.
5316
-
Po
lan
d-
--
--
1206
90.
8415
-
Sp
ain
-52
21
7661
1085
.63
8.9
632
214
17.9
17
1.2
2
Sw
eden
-30
359
3153
63
63.4
936
.61
309
152.
9412
1.2
2
UK
131
5104
1019
918
683
.54
10.0
516
296
13.7
29
0.8
7
US
186
--
--
674
129.
5010
-
EU
74.7
13.4
1.1
OE
CD
2001
= a
2000
= b
1999
= c
1998
= d
1997
= e
1996
= f
1995
= g
1994
= h
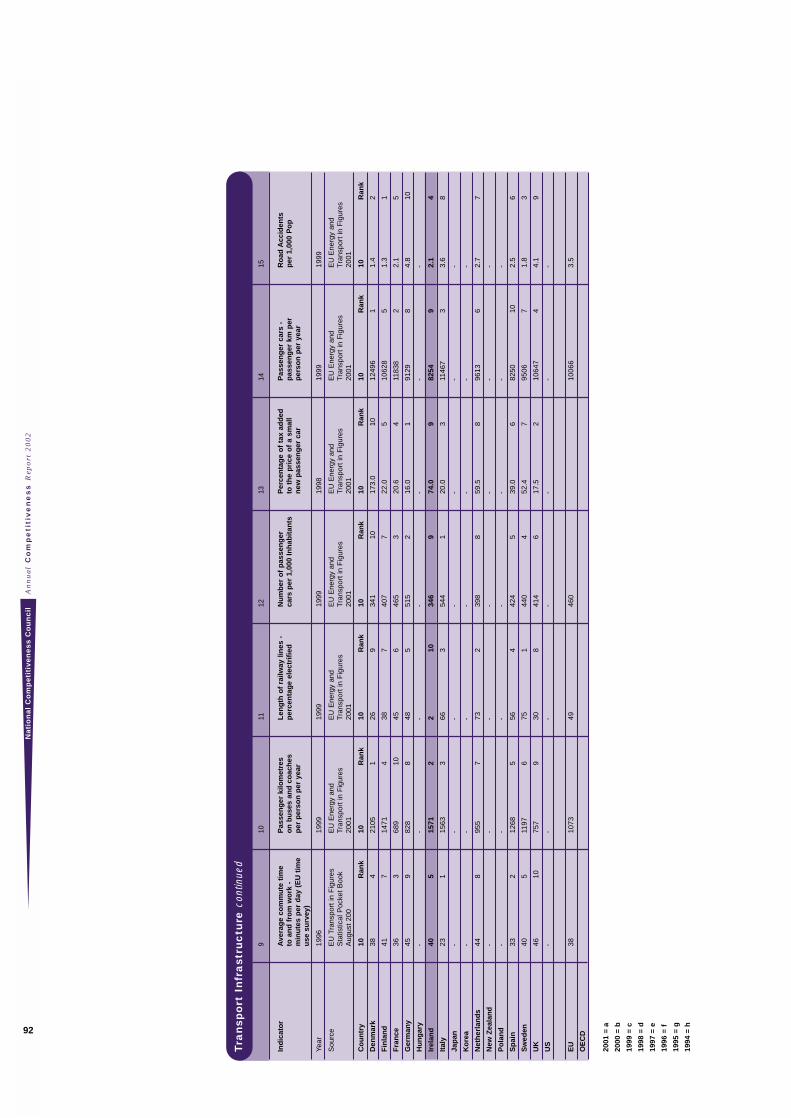
An
nu
al
Co
mp
eti
tiv
en
es
s R
epo
rt 2
00
2N
ati
on
al
Co
mp
eti
tiv
en
es
s C
ou
nc
il
92
Tra
nsp
ort
In
fra
stru
ctu
re c
ontin
ued
910
1112
1314
15
Ind
icat
or
Ave
rag
e co
mm
ute
tim
e P
asse
ng
er k
ilom
etre
s L
eng
th o
f ra
ilway
lin
es -
N
um
ber
of
pas
sen
ger
P
erce
nta
ge
of
tax
add
ed
Pas
sen
ger
car
s -
Ro
ad A
ccid
ents
to
an
d f
rom
wo
rk -
o
n b
use
s an
d c
oac
hes
p
erce
nta
ge
elec
trif
ied
ca
rs p
er 1
,000
Inh
abit
ants
to t
he
pri
ce o
f a
smal
l p
asse
ng
er k
m p
er
per
1,0
00 P
op
min
ute
s p
er d
ay (
EU
tim
e p
er p
erso
n p
er y
ear
new
pas
sen
ger
car
per
son
per
yea
ru
se s
urv
ey)
Year
1996
1999
1999
1999
1998
1999
1999
Sou
rce
EU
Tra
nspo
rt in
Fig
ures
E
U E
nerg
y an
d E
U E
nerg
y an
d E
U E
nerg
y an
d E
U E
nerg
y an
d E
U E
nerg
y an
d E
U E
nerg
y an
d S
tatis
tical
Poc
ket
Boo
k Tr
ansp
ort
in F
igur
es
Tran
spor
t in
Fig
ures
Tr
ansp
ort
in F
igur
es
Tran
spor
t in
Fig
ures
Tr
ansp
ort
in F
igur
es
Tran
spor
t in
Fig
ures
A
ugus
t 20
020
0120
0120
0120
0120
0120
01
Co
un
try
10R
ank
10R
ank
10R
ank
10R
ank
10R
ank
10R
ank
10R
ank
Den
mar
k38
421
051
269
341
1017
3.0
1012
496
11.
42
Fin
lan
d41
714
714
387
407
722
.05
1062
85
1.3
1
Fra
nce
363
689
1045
646
53
20.6
411
838
22.
15
Ger
man
y45
982
88
485
515
216
.01
9129
84.
810
Hu
ng
ary
--
--
--
-
Irel
and
405
1571
22
1034
69
74.0
982
549
2.1
4
Ital
y23
115
633
663
544
120
.03
1146
73
3.6
8
Jap
an-
--
--
--
Ko
rea
--
--
--
-
Net
her
lan
ds
448
955
773
239
88
59.5
896
136
2.7
7
New
Zea
lan
d-
--
--
--
Po
lan
d-
--
--
--
Sp
ain
332
1268
556
442
45
39.0
682
5010
2.5
6
Sw
eden
405
1197
675
144
04
52.4
795
067
1.8
3
UK
4610
757
930
841
46
17.5
210
647
44.
19
US
--
--
--
-
EU
3810
7349
460
1006
63.
5
OE
CD
2001
= a
2000
= b
1999
= c
1998
= d
1997
= e
1996
= f
1995
= g
1994
= h
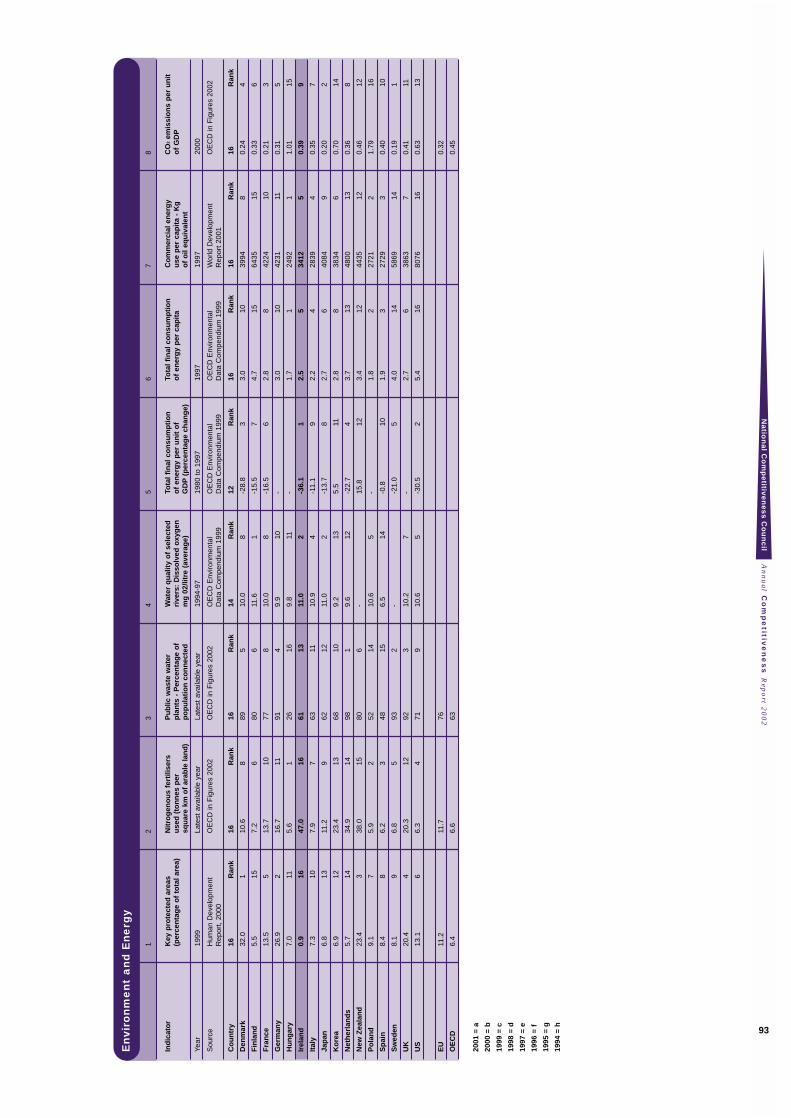
An
nu
al C
om
pe
titive
ne
ss R
epo
rt 20
02
Na
tion
al C
om
pe
titive
ne
ss
Co
un
cil
93
En
viro
nm
en
t a
nd
En
erg
y
12
34
56
78
Ind
icat
or
Key
pro
tect
ed a
reas
N
itro
gen
ou
s fe
rtili
sers
P
ub
lic w
aste
wat
er
Wat
er q
ual
ity
of
sele
cted
To
tal f
inal
co
nsu
mp
tio
n
Tota
l fin
al c
on
sum
pti
on
C
om
mer
cial
en
erg
y C
O2
emis
sio
ns
per
un
it
(per
cen
tag
e o
f to
tal a
rea)
use
d (
ton
nes
per
p
lan
ts -
Per
cen
tag
e o
f ri
vers
: D
isso
lved
oxy
gen
o
f en
erg
y p
er u
nit
of
of
ener
gy
per
cap
ita
use
per
cap
ita
- K
g
of
GD
Psq
uar
e km
of
arab
le la
nd
)p
op
ula
tio
n c
on
nec
ted
mg
02/
litre
(av
erag
e)G
DP
(per
cen
tag
e ch
ang
e)o
f o
il eq
uiv
alen
t
Year
1999
Late
st a
vaila
ble
year
Late
st a
vaila
ble
year
1994
-97
1980
to
1997
1997
1997
2000
Sou
rce
Hum
an D
evel
opm
ent
OE
CD
in F
igur
es 2
002
OE
CD
in F
igur
es 2
002
OE
CD
Env
ironm
enta
l O
EC
D E
nviro
nmen
tal
OE
CD
Env
ironm
enta
l W
orld
Dev
elop
men
t O
EC
D in
Fig
ures
200
2R
epor
t, 20
00D
ata
Com
pend
ium
199
9D
ata
Com
pend
ium
199
9D
ata
Com
pend
ium
199
9R
epor
t 20
01
Co
un
try
16R
ank
16R
ank
16R
ank
14R
ank
12R
ank
16R
ank
16R
ank
16R
ank
Den
mar
k32
.01
10.6
889
510
.08
-28.
83
3.0
1039
948
0.24
4
Fin
lan
d5.
515
7.2
680
611
.61
-15.
57
4.7
1564
3515
0.33
6
Fra
nce
13.5
513
.710
778
10.0
8-1
6.5
62.
88
4224
100.
213
Ger
man
y26
.92
16.7
1191
49.
910
-3.
010
4231
110.
315
Hu
ng
ary
7.0
115.
61
2616
9.8
11-
1.7
124
921
1.01
15
Irel
and
0.9
1647
.016
6113
11.0
2-3
6.1
12.
55
3412
50.
399
Ital
y7.
310
7.9
763
1110
.94
-11.
19
2.2
428
394
0.35
7
Jap
an6.
813
11.2
962
1211
.02
-13.
78
2.7
640
849
0.20
2
Ko
rea
6.9
1223
.413
6810
9.2
135.
511
2.8
838
346
0.70
14
Net
her
lan
ds
5.7
1434
.914
981
9.6
12-2
2.7
43.
713
4800
130.
368
New
Zea
lan
d23
.43
38.0
1580
6-
15.8
123.
412
4435
120.
4612
Po
lan
d9.
17
5.9
252
1410
.65
-1.
82
2721
21.
7916
Sp
ain
8.4
86.
23
4815
6.5
14-0
.810
1.9
327
293
0.40
10
Sw
eden
8.1
96.
85
932
--2
1.0
54.
014
5869
140.
191
UK
20.4
420
.312
923
10.2
7-
2.7
638
637
0.41
11
US
13.1
66.
34
719
10.6
5-3
0.5
25.
416
8076
160.
6313
EU
11.2
11.7
760.
32
OE
CD
6.4
6.6
630.
45
2001
= a
2000
= b
1999
= c
1998
= d
1997
= e
1996
= f
1995
= g
1994
= h
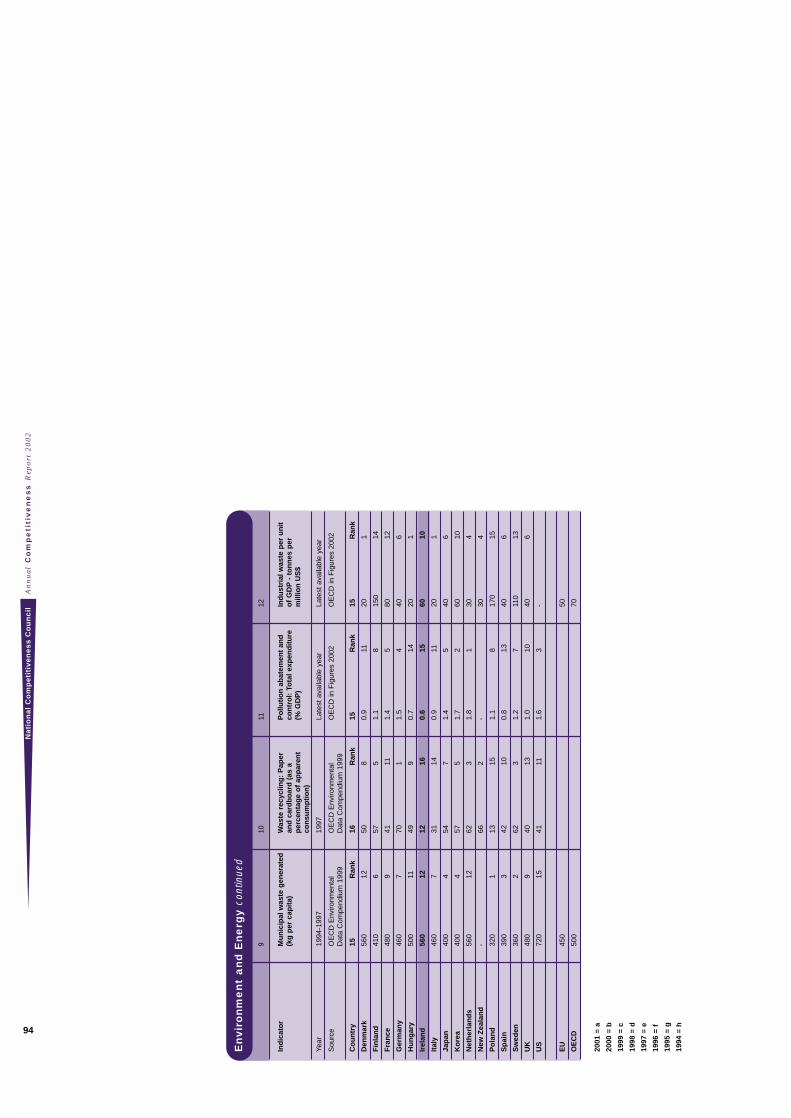
An
nu
al
Co
mp
eti
tiv
en
es
s R
epo
rt 2
00
2N
ati
on
al
Co
mp
eti
tiv
en
es
s C
ou
nc
il
94
En
viro
nm
en
t a
nd
En
erg
y co
ntin
ued
910
1112
Ind
icat
or
Mu
nic
ipal
was
te g
ener
ated
W
aste
rec
yclin
g:
Pap
er
Po
lluti
on
ab
atem
ent
and
In
du
stri
al w
aste
per
un
it
(kg
per
cap
ita)
and
car
db
oar
d (
as a
co
ntr
ol:
To
tal e
xpen
dit
ure
o
f G
DP
- to
nn
es p
er
per
cen
tag
e o
f ap
par
ent
(% G
DP
)m
illio
n U
S$
con
sum
pti
on
)
Year
1994
-199
719
97La
test
ava
ilabl
e ye
arLa
test
ava
ilabl
e ye
ar
Sou
rce
OE
CD
Env
ironm
enta
l O
EC
D E
nviro
nmen
tal
OE
CD
in F
igur
es 2
002
OE
CD
in F
igur
es 2
002
Dat
a C
ompe
ndiu
m 1
999
Dat
a C
ompe
ndiu
m 1
999
Co
un
try
15R
ank
16R
ank
15R
ank
15R
ank
Den
mar
k56
012
508
0.9
1120
1
Fin
lan
d41
06
575
1.1
815
014
Fra
nce
480
941
111.
45
8012
Ger
man
y46
07
701
1.5
440
6
Hu
ng
ary
500
1149
90.
714
201
Irel
and
560
1212
160.
615
6010
Ital
y46
07
3114
0.9
1120
1
Jap
an40
04
547
1.4
540
6
Ko
rea
400
457
51.
72
6010
Net
her
lan
ds
560
1262
31.
81
304
New
Zea
lan
d-
662
-30
4
Po
lan
d32
01
1315
1.1
817
015
Sp
ain
390
342
100.
813
406
Sw
eden
360
262
31.
27
110
13
UK
480
940
131.
010
406
US
720
1541
111.
63
-
EU
450
50
OE
CD
500
70
2001
= a
2000
= b
1999
= c
1998
= d
1997
= e
1996
= f
1995
= g
1994
= h

An
nu
al C
om
pe
titive
ne
ss R
epo
rt 20
02
Na
tion
al C
om
pe
titive
ne
ss
Co
un
cil
95
So
cia
l C
ap
ita
l
12
3
Ind
icat
or
Inco
me
ineq
ual
ity
(rat
io
Res
po
nsi
ven
ess
of
hea
lth
In
terp
erso
nal
tru
st -
o
f sh
are
of
rich
est
20%
to
sy
stem
s -
Lev
el W
HO
p
rop
ort
ion
of
po
pu
lati
on
sh
are
of
po
ore
st 2
0%)
Ind
exin
dic
atin
g t
hat
peo
ple
can
g
ener
ally
be
tru
sted
Year
Late
st a
vaila
ble
year
1999
2000
Sou
rce
Hum
an D
evel
opm
ent
Wor
ld H
ealth
Org
anis
atio
n H
alm
an, T
ilbur
g U
nive
rsity
Rep
ort
2002
Ann
ual R
epor
t 20
00
Co
un
try
15R
ank
16R
ank
12R
ank
Den
mar
k3.
63
7.1
266
.51
Fin
lan
d3.
63
6.8
858
.04
Fra
nce
5.6
126.
87
22.2
10
Ger
man
y4.
77
7.1
334
.87
Hu
ng
ary
3.5
25.
516
21.8
11
Irel
and
6.4
136.
511
35.2
6
Ital
y4.
26
6.7
932
.68
Jap
an3.
41
7.0
4-
Ko
rea
5.3
96.
114
-
Net
her
lan
ds
5.5
116.
95
59.7
3
New
Zea
lan
d-
6.7
9-
Po
lan
d5.
18
5.7
1518
.912
Sp
ain
5.4
106.
213
38.5
5
Sw
eden
3.6
36.
96
66.3
2
UK
7.1
146.
512
29.8
9
US
9.0
158.
11
-
EU
OE
CD
2001
= a
2000
= b
1999
= c
1998
= d
1997
= e
1996
= f
1995
= g
1994
= h
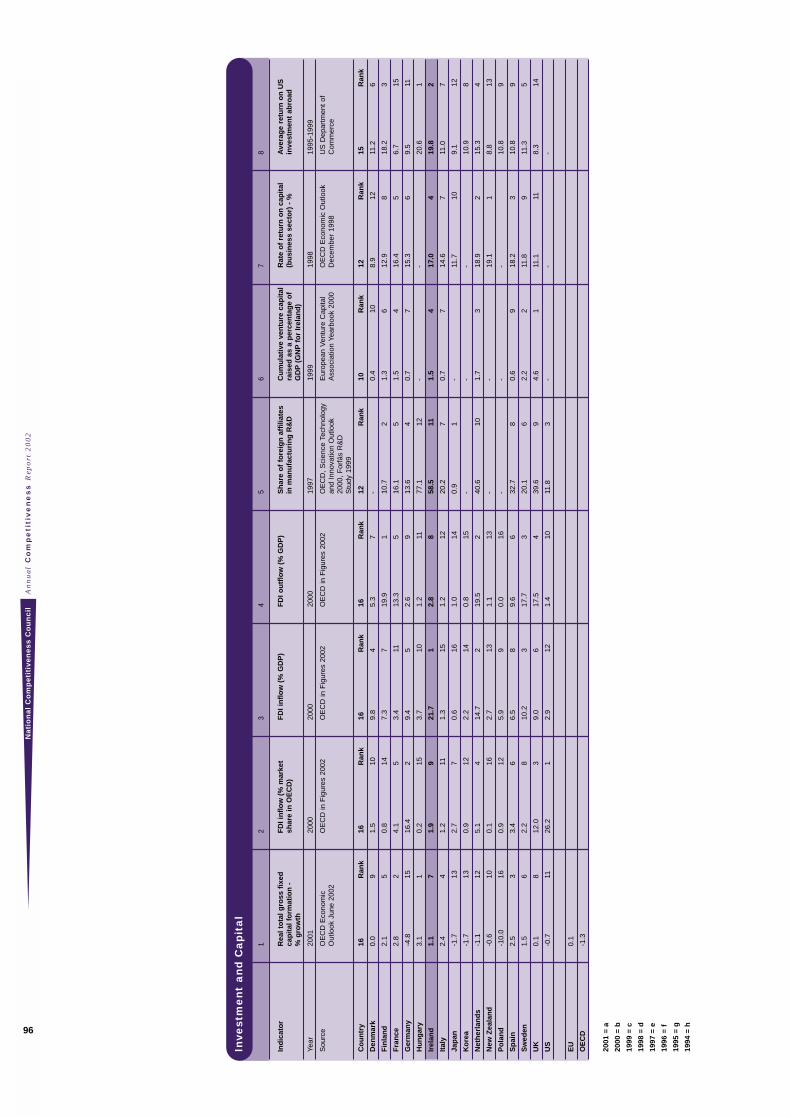
An
nu
al
Co
mp
eti
tiv
en
es
s R
epo
rt 2
00
2N
ati
on
al
Co
mp
eti
tiv
en
es
s C
ou
nc
il
96
Inve
stm
en
t a
nd
Ca
pit
al
12
34
56
78
Ind
icat
or
Rea
l to
tal g
ross
fix
ed
FD
I in
flo
w (
% m
arke
t F
DI i
nfl
ow
(%
GD
P)
FD
I ou
tflo
w (
% G
DP
)S
har
e o
f fo
reig
n a
ffili
ates
C
um
ula
tive
ven
ture
cap
ital
R
ate
of
retu
rn o
n c
apit
al
Ave
rag
e re
turn
on
US
ca
pit
al f
orm
atio
n -
sh
are
in O
EC
D)
in m
anu
fact
uri
ng
R&
Dra
ised
as
a p
erce
nta
ge
of
(bu
sin
ess
sect
or)
- %
inve
stm
ent
abro
ad%
gro
wth
GD
P(G
NP
for
Irel
and
)
Year
2001
2000
2000
2000
1997
1999
1998
1995
-199
9
Sou
rce
OE
CD
Eco
nom
ic
OE
CD
in F
igur
es 2
002
OE
CD
in F
igur
es 2
002
OE
CD
in F
igur
es 2
002
OE
CD
, S
cien
ce T
echn
olog
y E
urop
ean
Ven
ture
Cap
ital
OE
CD
Eco
nom
ic O
utlo
ok
US
Dep
artm
ent
of
Out
look
Jun
e 20
02an
d In
nova
tion
Out
look
A
ssoc
iatio
n Ye
arbo
ok 2
000
Dec
embe
r 19
98C
omm
erce
2000
, F
orfá
s R
&D
S
tudy
199
9
Co
un
try
16R
ank
16R
ank
16R
ank
16R
ank
12R
ank
10R
ank
12R
ank
15R
ank
Den
mar
k0.
09
1.5
109.
84
5.3
7-
0.4
108.
912
11.2
6
Fin
lan
d2.
15
0.8
147.
37
19.9
110
.72
1.3
612
.98
18.2
3
Fra
nce
2.8
24.
15
3.4
1113
.35
16.1
51.
54
16.4
56.
715
Ger
man
y-4
.815
16.4
29.
45
2.6
913
.64
0.7
715
.36
9.5
11
Hu
ng
ary
3.1
10.
215
3.7
101.
211
77.1
12-
-20
.61
Irel
and
1.1
71.
99
21.7
12.
88
58.5
111.
54
17.0
419
.82
Ital
y2.
44
1.2
111.
315
1.2
1220
.27
0.7
714
.67
11.0
7
Jap
an-1
.713
2.7
70.
616
1.0
140.
91
-11
.710
9.1
12
Ko
rea
-1.7
130.
912
2.2
140.
815
--
-10
.98
Net
her
lan
ds
-1.1
125.
14
14.7
219
.52
40.6
101.
73
18.9
215
.34
New
Zea
lan
d-0
.610
0.1
162.
713
1.1
13-
-19
.11
8.8
13
Po
lan
d-1
0.0
160.
912
5.9
90.
016
--
-10
.89
Sp
ain
2.5
33.
46
6.5
89.
66
32.7
80.
69
18.2
310
.89
Sw
eden
1.5
62.
28
10.2
317
.73
20.1
62.
22
11.8
911
.35
UK
0.1
812
.03
9.0
617
.54
39.6
94.
61
11.1
118.
314
US
-0.7
1126
.21
2.9
121.
410
11.8
3-
--
EU
0.1
OE
CD
-1.3
2001
= a
2000
= b
1999
= c
1998
= d
1997
= e
1996
= f
1995
= g
1994
= h
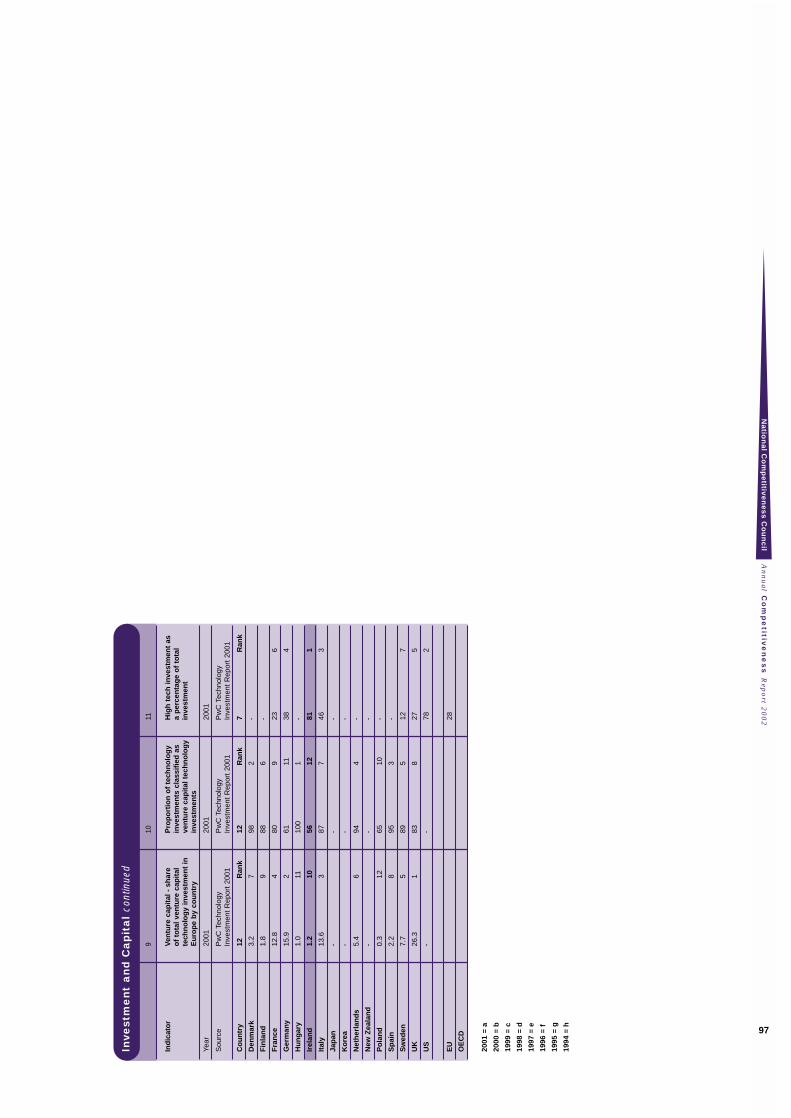
An
nu
al C
om
pe
titive
ne
ss R
epo
rt 20
02
Na
tion
al C
om
pe
titive
ne
ss
Co
un
cil
97
910
11
Ind
icat
or
Ven
ture
cap
ital
- s
har
e P
rop
ort
ion
of
tech
no
log
y H
igh
tec
h in
vest
men
t as
o
f to
tal v
entu
re c
apit
al
inve
stm
ents
cla
ssif
ied
as
a p
erce
nta
ge
of
tota
l te
chn
olo
gy
inve
stm
ent
in
ven
ture
cap
ital
tec
hn
olo
gy
inve
stm
ent
Eu
rop
e b
y co
un
try
inve
stm
ents
Year
2001
2001
2001
Sou
rce
Pw
C T
echn
olog
y P
wC
Tec
hnol
ogy
Pw
C T
echn
olog
y In
vest
men
t R
epor
t 20
01In
vest
men
t R
epor
t 20
01In
vest
men
t R
epor
t 20
01
Co
un
try
12R
ank
12R
ank
7R
ank
Den
mar
k3.
27
982
-
Fin
lan
d1.
89
886
-
Fra
nce
12.8
480
923
6
Ger
man
y15
.92
6111
384
Hu
ng
ary
1.0
1110
01
-
Irel
and
1.2
1056
1281
1
Ital
y13
.63
877
463
Jap
an-
--
Ko
rea
--
-
Net
her
lan
ds
5.4
694
4-
New
Zea
lan
d-
--
Po
lan
d0.
312
6510
-
Sp
ain
2.2
895
3-
Sw
eden
7.7
589
512
7
UK
26.3
183
827
5
US
--
782
EU
28
OE
CD
2001
= a
2000
= b
1999
= c
1998
= d
1997
= e
1996
= f
1995
= g
1994
= h
Inve
stm
en
t a
nd
Ca
pit
al
cont
inue
d
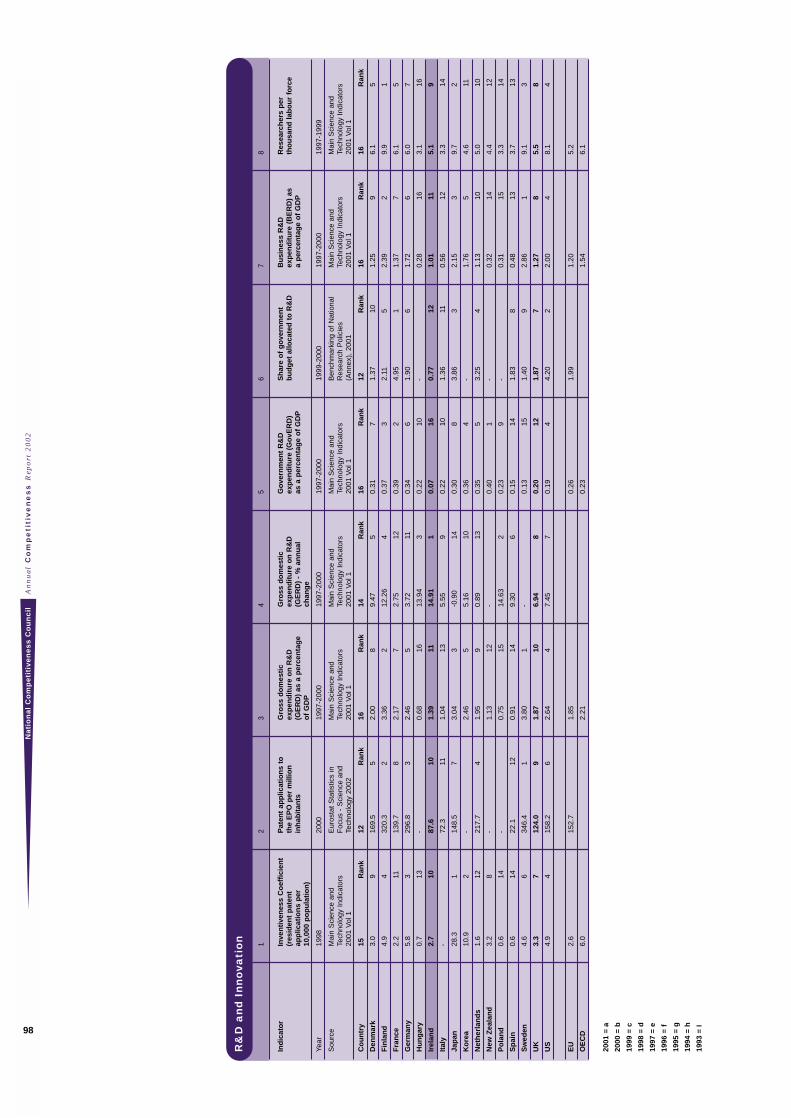
An
nu
al
Co
mp
eti
tiv
en
es
s R
epo
rt 2
00
2N
ati
on
al
Co
mp
eti
tiv
en
es
s C
ou
nc
il
98
R&
D a
nd
In
no
vati
on 1
23
45
67
8
Ind
icat
or
Inve
nti
ven
ess
Co
effi
cien
t P
aten
t ap
plic
atio
ns
to
Gro
ss d
om
esti
c G
ross
do
mes
tic
Go
vern
men
t R
&D
S
har
e o
f g
ove
rnm
ent
Bu
sin
ess
R&
D
Res
earc
her
s p
er
(res
iden
t p
aten
t th
e E
PO
per
mill
ion
exp
end
itu
re o
n R
&D
ex
pen
dit
ure
on
R&
D
exp
end
itu
re (
Go
vER
D)
bu
dg
et a
lloca
ted
to
R&
Dex
pen
dit
ure
(B
ER
D)
as
tho
usa
nd
lab
ou
r fo
rce
app
licat
ion
s p
erin
hab
itan
ts
(GE
RD
) as
a p
erce
nta
ge
(GE
RD
) -
% a
nn
ual
as
a p
erce
nta
ge
of
GD
Pa
per
cen
tag
e o
f G
DP
10,0
00 p
op
ula
tio
n)
of
GD
Pch
ang
e
Year
1998
2000
1997
-200
019
97-2
000
1997
-200
019
99-2
000
1997
-200
019
97-1
999
Sou
rce
Mai
n S
cien
ce a
nd
Eur
osta
t S
tatis
tics
in
Mai
n S
cien
ce a
nd
Mai
n S
cien
ce a
nd
Mai
n S
cien
ce a
nd
Ben
chm
arki
ng o
f N
atio
nal
Mai
n S
cien
ce a
nd
Mai
n S
cien
ce a
nd
Tech
nolo
gy I
ndic
ator
s F
ocus
- S
cien
ce a
nd
Tech
nolo
gy I
ndic
ator
s Te
chno
logy
Ind
icat
ors
Tech
nolo
gy I
ndic
ator
s R
esea
rch
Pol
icie
s Te
chno
logy
Ind
icat
ors
Tech
nolo
gy I
ndic
ator
s 20
01 V
ol 1
Tech
nolo
gy 2
002
2001
Vol
120
01 V
ol 1
2001
Vol
1(A
nnex
), 2
001
2001
Vol
120
01 V
ol 1
Co
un
try
15R
ank
12R
ank
16R
ank
14R
ank
16R
ank
12R
ank
16R
ank
16R
ank
Den
mar
k3.
09
169.
55
2.00
89.
475
0.31
71.
3710
1.25
96.
15
Fin
lan
d4.
94
320.
32
3.36
212
.26
40.
373
2.11
52.
392
9.9
1
Fra
nce
2.2
1113
9.7
82.
177
2.75
120.
392
4.95
11.
377
6.1
5
Ger
man
y5.
83
296.
83
2.46
53.
7211
0.34
61.
906
1.72
66.
07
Hu
ng
ary
0.7
13-
0.68
1613
.94
30.
2210
-0.
2816
3.1
16
Irel
and
2.7
1087
.610
1.39
1114
.91
10.
0716
0.77
121.
0111
5.1
9
Ital
y-
72.3
111.
0413
5.55
90.
2210
1.36
110.
5612
3.3
14
Jap
an28
.31
148.
57
3.04
3-0
.90
140.
308
3.86
32.
153
9.7
2
Ko
rea
10.9
2-
2.46
55.
1610
0.36
4-
1.76
54.
611
Net
her
lan
ds
1.6
1221
7.7
41.
959
0.89
130.
355
3.25
41.
1310
5.0
10
New
Zea
lan
d3.
28
-1.
1312
-0.
401
-0.
3214
4.4
12
Po
lan
d0.
614
-0.
7515
14.6
32
0.23
9-
0.31
153.
314
Sp
ain
0.6
1422
.112
0.91
149.
306
0.15
141.
838
0.48
133.
713
Sw
eden
4.6
634
6.4
13.
801
-0.
1315
1.40
92.
861
9.1
3
UK
3.3
712
4.0
91.
8710
6.94
80.
2012
1.87
71.
278
5.5
8
US
4.9
415
8.2
62.
644
7.45
70.
194
4.20
22.
004
8.1
4
EU
2.6
152.
71.
850.
261.
991.
205.
2
OE
CD
6.0
2.21
0.23
1.54
6.1
2001
= a
2000
= b
1999
= c
1998
= d
1997
= e
1996
= f
1995
= g
1994
= h
1993
= I
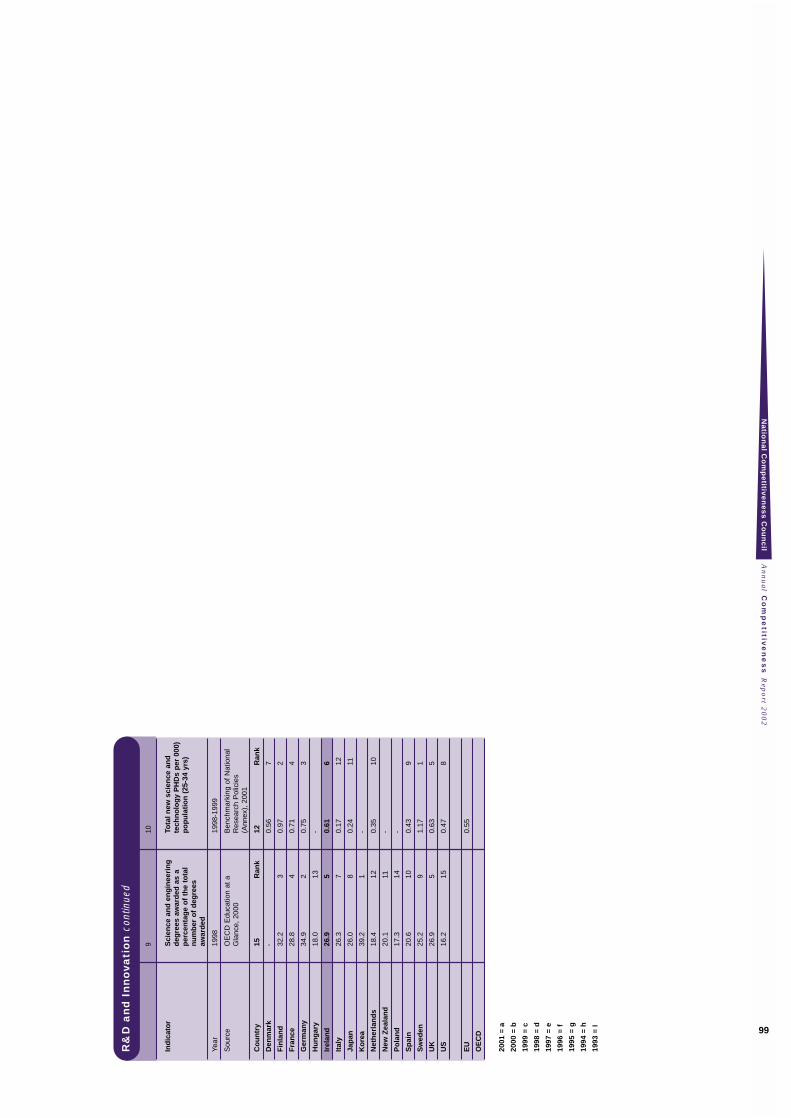
An
nu
al C
om
pe
titive
ne
ss R
epo
rt 20
02
Na
tion
al C
om
pe
titive
ne
ss
Co
un
cil
99
910
Ind
icat
or
Sci
ence
an
d e
ng
inee
rin
g
Tota
l new
sci
ence
an
d
deg
rees
aw
ard
ed a
s a
tech
no
log
y P
HD
s p
er 0
00)
per
cen
tag
e o
f th
e to
tal
po
pu
lati
on
(25
-34
yrs)
nu
mb
er o
f d
egre
es
awar
ded
Year
1998
1998
-199
9
Sou
rce
OE
CD
Edu
catio
n at
a
Ben
chm
arki
ng o
f N
atio
nal
Gla
nce,
200
0R
esea
rch
Pol
icie
s (A
nnex
), 2
001
Co
un
try
15R
ank
12R
ank
Den
mar
k-
0.56
7
Fin
lan
d32
.23
0.97
2
Fra
nce
28.8
40.
714
Ger
man
y34
.92
0.75
3
Hu
ng
ary
18.0
13-
Irel
and
26.9
50.
616
Ital
y26
.37
0.17
12
Jap
an26
.08
0.24
11
Ko
rea
39.2
1-
Net
her
lan
ds
18.4
120.
3510
New
Zea
lan
d20
.111
-
Po
lan
d17
.314
-
Sp
ain
20.6
100.
439
Sw
eden
25.2
91.
171
UK
26.9
50.
635
US
16.2
150.
478
EU
0.55
OE
CD
2001
= a
2000
= b
1999
= c
1998
= d
1997
= e
1996
= f
1995
= g
1994
= h
1993
= I
R&
D a
nd
In
no
vati
on
con
tinue
d
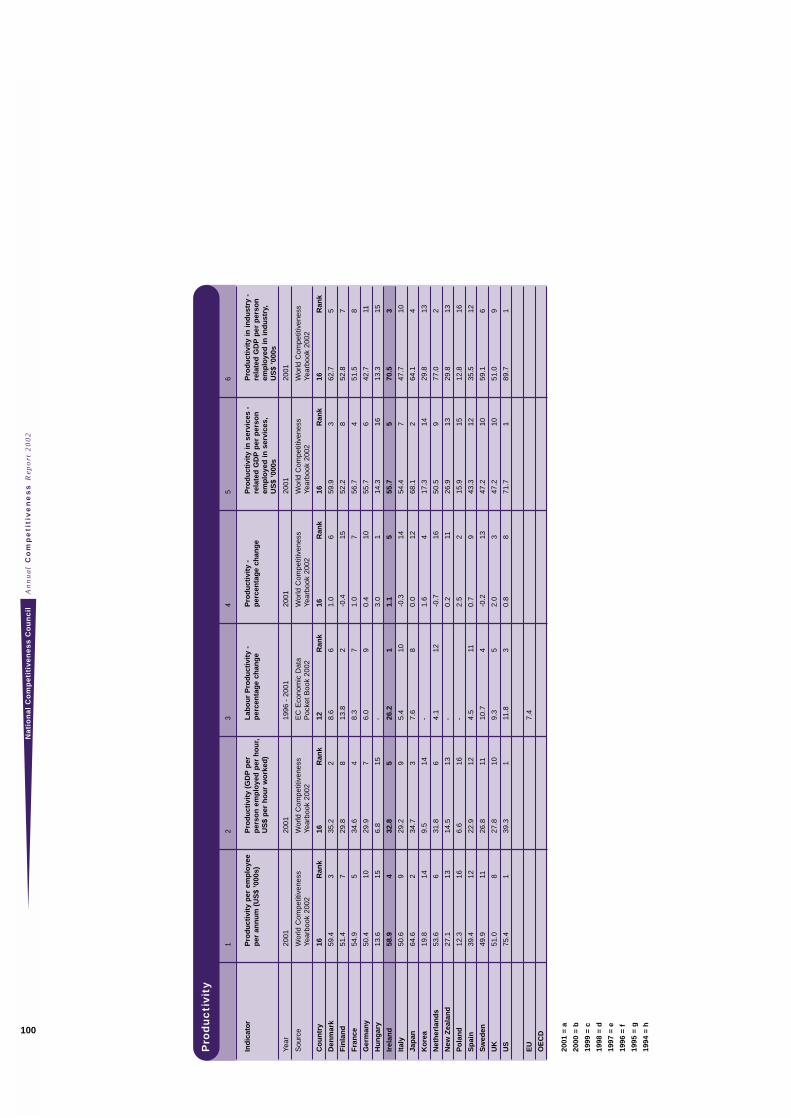
An
nu
al
Co
mp
eti
tiv
en
es
s R
epo
rt 2
00
2N
ati
on
al
Co
mp
eti
tiv
en
es
s C
ou
nc
il
100
Pro
du
cti
vity
12
34
56
Ind
icat
or
Pro
du
ctiv
ity
per
em
plo
yee
Pro
du
ctiv
ity
(GD
Pp
er
Lab
ou
r P
rod
uct
ivit
y -
Pro
du
ctiv
ity
- P
rod
uct
ivit
y in
ser
vice
s -
Pro
du
ctiv
ity
in in
du
stry
-
per
an
nu
m (
US
$ ’0
00s)
per
son
em
plo
yed
per
ho
ur,
per
cen
tag
e ch
ang
e p
erce
nta
ge
chan
ge
rela
ted
GD
Pp
er p
erso
n
rela
ted
GD
Pp
er p
erso
n
US
$ p
er h
ou
r w
ork
ed)
emp
loye
d in
ser
vice
s,
emp
loye
d in
ind
ust
ry,
US
$ ’0
00s
US
$ ’0
00s
Year
2001
2001
1996
- 2
001
2001
2001
2001
Sou
rce
Wor
ld C
ompe
titiv
enes
s W
orld
Com
petit
iven
ess
EC
Eco
nom
ic D
ata
Wor
ld C
ompe
titiv
enes
s W
orld
Com
petit
iven
ess
Wor
ld C
ompe
titiv
enes
s Ye
arbo
ok 2
002
Year
book
200
2P
ocke
t B
ook
2002
Year
book
200
2Ye
arbo
ok 2
002
Year
book
200
2
Co
un
try
16R
ank
16R
ank
12R
ank
16R
ank
16R
ank
16R
ank
Den
mar
k59
.43
35.2
28.
66
1.0
659
.93
62.7
5
Fin
lan
d51
.47
29.8
813
.82
-0.4
1552
.28
52.8
7
Fra
nce
54.9
534
.64
8.3
71.
07
56.7
451
.58
Ger
man
y50
.410
29.9
76.
09
0.4
1055
.76
42.7
11
Hu
ng
ary
13.6
156.
815
-3.
01
14.3
1613
.315
Irel
and
58.9
432
.85
26.2
11.
15
55.7
570
.53
Ital
y50
.69
29.2
95.
410
-0.3
1454
.47
47.7
10
Jap
an64
.62
34.7
37.
68
0.0
1268
.12
64.1
4
Ko
rea
19.8
149.
514
-1.
64
17.3
1429
.813
Net
her
lan
ds
53.6
631
.86
4.1
12-0
.716
50.5
977
.02
New
Zea
lan
d27
.113
14.5
13-
0.2
1126
.913
29.8
13
Po
lan
d12
.316
6.6
16-
2.5
215
.915
12.8
16
Sp
ain
39.4
1222
.912
4.5
110.
79
43.3
1235
.512
Sw
eden
49.9
1126
.811
10.7
4-0
.213
47.2
1059
.16
UK
51.0
827
.810
9.3
52.
03
47.2
1051
.09
US
75.4
139
.31
11.8
30.
88
71.7
189
.71
EU
7.4
OE
CD
2001
= a
2000
= b
1999
= c
1998
= d
1997
= e
1996
= f
1995
= g
1994
= h
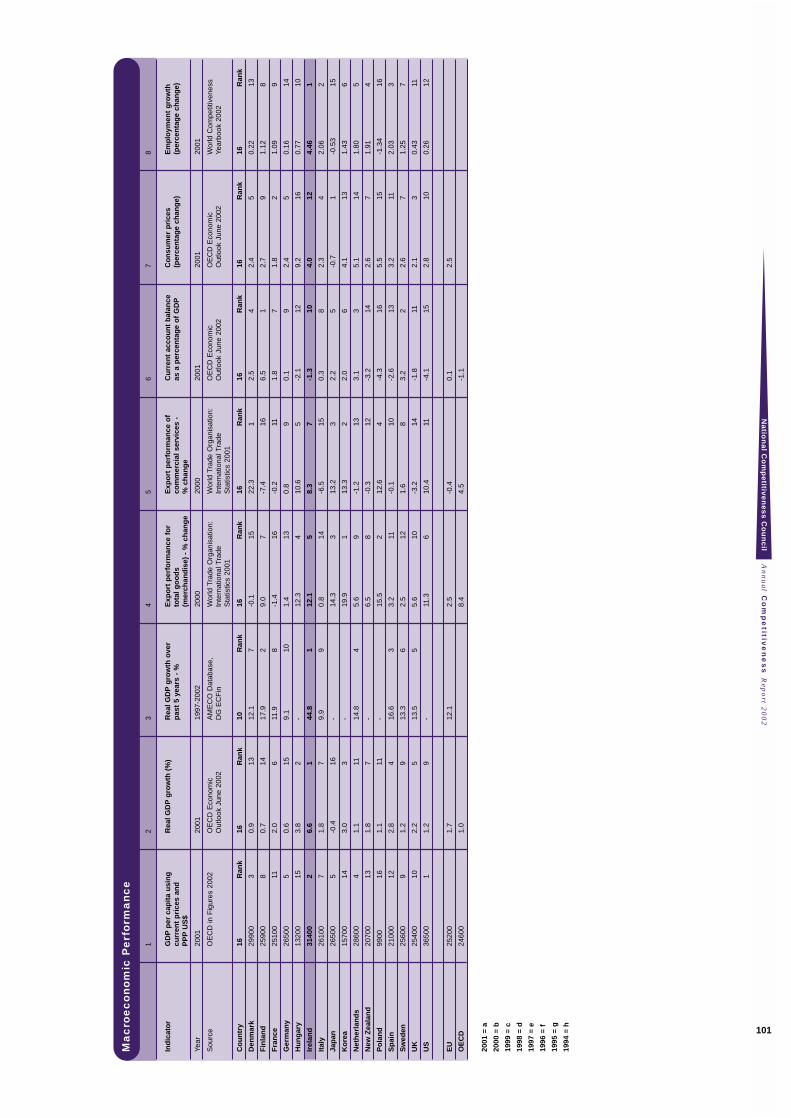
An
nu
al C
om
pe
titive
ne
ss R
epo
rt 20
02
Na
tion
al C
om
pe
titive
ne
ss
Co
un
cil
101
Ma
cro
ec
on
om
ic P
erf
orm
an
ce
12
34
56
78
Ind
icat
or
GD
Pp
er c
apit
a u
sin
g
Rea
l GD
Pg
row
th (
%)
Rea
l GD
Pg
row
th o
ver
E
xpo
rt p
erfo
rman
ce f
or
Exp
ort
per
form
ance
of
Cu
rren
t ac
cou
nt
bal
ance
C
on
sum
er p
rice
s E
mp
loym
ent
gro
wth
cu
rren
t p
rice
s an
d
pas
t 5
year
s -
%to
tal g
oo
ds
com
mer
cial
ser
vice
s -
as a
per
cen
tag
e o
f G
DP
(per
cen
tag
e ch
ang
e)(p
erce
nta
ge
chan
ge)
PP
PU
S$
(mer
chan
dis
e) -
% c
han
ge
% c
han
ge
Year
2001
2001
1997
-200
220
0020
0020
0120
0120
01
Sou
rce
OE
CD
in F
igur
es 2
002
OE
CD
Eco
nom
ic
AM
EC
O D
atab
ase,
Wor
ld T
rade
Org
anis
atio
n:
Wor
ld T
rade
Org
anis
atio
n:
OE
CD
Eco
nom
ic
OE
CD
Eco
nom
ic
Wor
ld C
ompe
titiv
enes
s O
utlo
ok J
une
2002
D
G E
CF
inIn
tern
atio
nal T
rade
In
tern
atio
nal T
rade
O
utlo
ok J
une
2002
O
utlo
ok J
une
2002
Ye
arbo
ok 2
002
Sta
tistic
s 20
01S
tatis
tics
2001
Co
un
try
16R
ank
16R
ank
10R
ank
16R
ank
16R
ank
16R
ank
16R
ank
16R
ank
Den
mar
k29
900
30.
913
12.1
7-0
.115
22.3
12.
54
2.4
50.
2213
Fin
lan
d25
900
80.
714
17.9
29.
07
-7.4
166.
51
2.7
91.
128
Fra
nce
2510
011
2.0
611
.98
-1.4
16-0
.211
1.8
71.
82
1.09
9
Ger
man
y26
500
50.
615
9.1
101.
413
0.8
90.
19
2.4
50.
1614
Hu
ng
ary
1320
015
3.8
2-
12.3
410
.65
-2.1
129.
216
0.77
10
Irel
and
3140
02
6.6
144
.81
12.1
58.
37
-1.3
104.
012
4.46
1
Ital
y26
100
71.
87
9.9
90.
814
-6.5
150.
38
2.3
42.
062
Jap
an26
500
5-0
.416
-14
.33
13.2
32.
25
-0.7
1-0
.53
15
Ko
rea
1570
014
3.0
3-
19.9
113
.32
2.0
64.
113
1.43
6
Net
her
lan
ds
2860
04
1.1
1114
.84
5.6
9-1
.213
3.1
35.
114
1.80
5
New
Zea
lan
d20
700
131.
87
-6.
58
-0.3
12-3
.214
2.6
71.
914
Po
lan
d99
0016
1.1
11-
15.5
212
.64
-4.3
165.
515
-1.3
416
Sp
ain
2100
012
2.8
416
.63
3.2
11-0
.110
-2.6
133.
211
2.03
3
Sw
eden
2560
09
1.2
913
.36
2.5
121.
68
3.2
22.
67
1.25
7
UK
2540
010
2.2
513
.55
5.6
10-3
.214
-1.8
112.
13
0.43
11
US
3650
01
1.2
9-
11.3
610
.411
-4.1
152.
810
0.26
12
EU
2520
01.
712
.12.
5-0
.40.
12.
5
OE
CD
2460
01.
08.
44.
5-1
.1
2001
= a
2000
= b
1999
= c
1998
= d
1997
= e
1996
= f
1995
= g
1994
= h
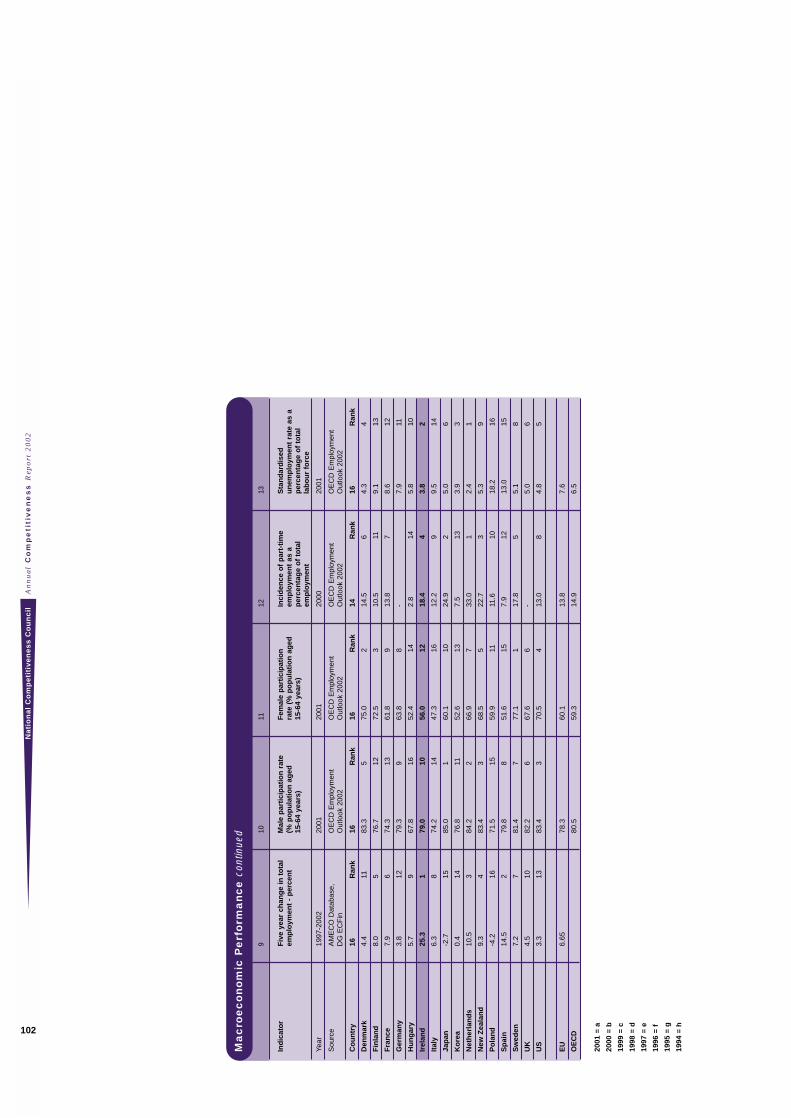
An
nu
al
Co
mp
eti
tiv
en
es
s R
epo
rt 2
00
2N
ati
on
al
Co
mp
eti
tiv
en
es
s C
ou
nc
il
102
Ma
cro
ec
on
om
ic P
erf
orm
an
ce
con
tinue
d
910
1112
13
Ind
icat
or
Fiv
e ye
ar c
han
ge
in t
ota
l M
ale
par
tici
pat
ion
rat
e F
emal
e p
arti
cip
atio
n
Inci
den
ce o
f p
art-
tim
e S
tan
dar
dis
ed
emp
loym
ent
- p
erce
nt
(% p
op
ula
tio
n a
ged
ra
te (
% p
op
ula
tio
n a
ged
em
plo
ymen
t as
a
un
emp
loym
ent
rate
as
a 15
-64
year
s)15
-64
year
s)p
erce
nta
ge
of
tota
l p
erce
nta
ge
of
tota
l em
plo
ymen
tla
bo
ur
forc
e
Year
1997
-200
220
0120
0120
0020
01
Sou
rce
AM
EC
O D
atab
ase,
O
EC
D E
mpl
oym
ent
OE
CD
Em
ploy
men
t O
EC
D E
mpl
oym
ent
OE
CD
Em
ploy
men
t D
G E
CF
inO
utlo
ok 2
002
Out
look
200
2O
utlo
ok 2
002
Out
look
200
2
Co
un
try
16R
ank
16R
ank
16R
ank
14R
ank
16R
ank
Den
mar
k4.
411
83.3
575
.02
14.5
64.
34
Fin
lan
d8.
05
76.7
1272
.53
10.5
119.
113
Fra
nce
7.9
674
.313
61.8
913
.87
8.6
12
Ger
man
y3.
812
79.3
963
.88
-7.
911
Hu
ng
ary
5.7
967
.816
52.4
142.
814
5.8
10
Irel
and
25.3
179
.010
56.0
1218
.44
3.8
2
Ital
y6.
38
74.2
1447
.316
12.2
99.
514
Jap
an-2
.715
85.0
160
.110
24.9
25.
06
Ko
rea
0.4
1476
.811
52.6
137.
513
3.9
3
Net
her
lan
ds
10.5
384
.22
66.9
733
.01
2.4
1
New
Zea
lan
d9.
34
83.4
368
.55
22.7
35.
39
Po
lan
d-4
.216
71.5
1559
.911
11.6
1018
.216
Sp
ain
14.5
279
.88
51.6
157.
912
13.0
15
Sw
eden
7.2
781
.47
77.1
117
.85
5.1
8
UK
4.5
1082
.26
67.6
6-
5.0
6
US
3.3
1383
.43
70.5
413
.08
4.8
5
EU
6.65
78.3
60.1
13.8
7.6
OE
CD
80.5
59.3
14.9
6.5
2001
= a
2000
= b
1999
= c
1998
= d
1997
= e
1996
= f
1995
= g
1994
= h
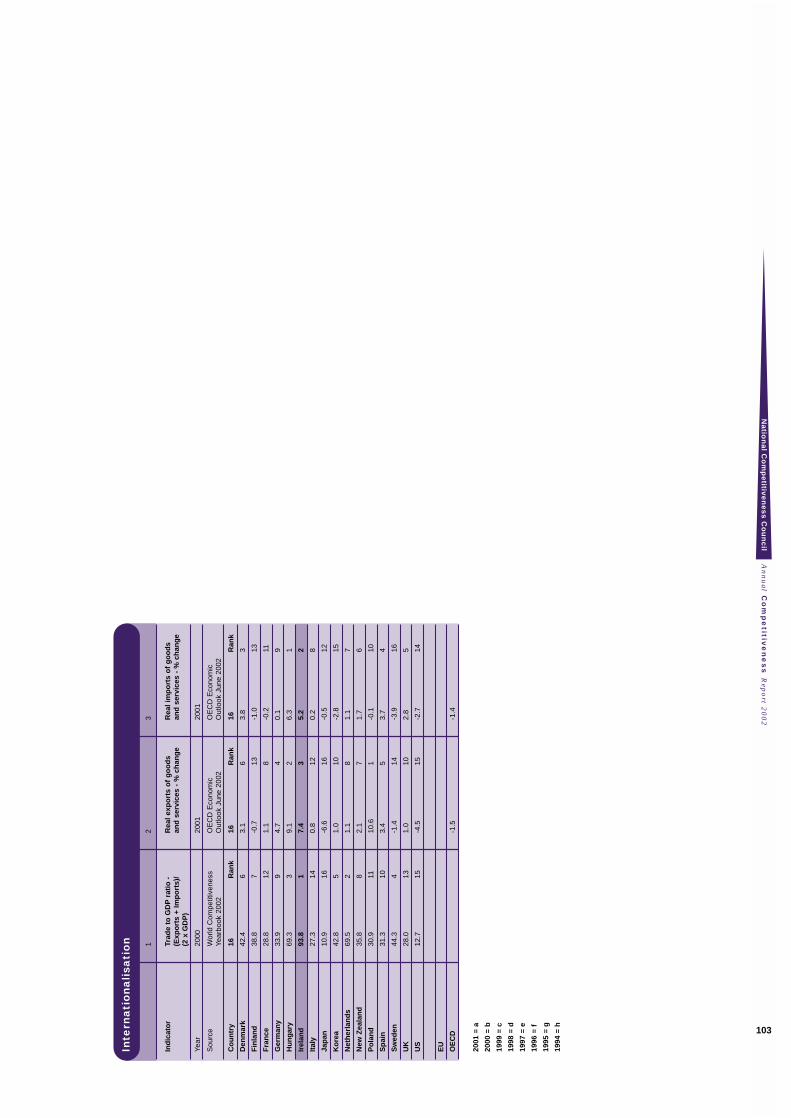
An
nu
al C
om
pe
titive
ne
ss R
epo
rt 20
02
Na
tion
al C
om
pe
titive
ne
ss
Co
un
cil
103
Inte
rna
tio
na
lisa
tio
n 12
3
Ind
icat
or
Trad
e to
GD
Pra
tio
-
Rea
l exp
ort
s o
f g
oo
ds
Rea
l im
po
rts
of
go
od
s (E
xpo
rts
+ Im
po
rts)
/an
d s
ervi
ces
- %
ch
ang
ean
d s
ervi
ces
- %
ch
ang
e(2
x G
DP
)
Year
2000
2001
2001
Sou
rce
Wor
ld C
ompe
titiv
enes
s O
EC
D E
cono
mic
O
EC
D E
cono
mic
Ye
arbo
ok 2
002
Out
look
Jun
e 20
02
Out
look
Jun
e 20
02
Co
un
try
16R
ank
16R
ank
16R
ank
Den
mar
k42
.46
3.1
63.
83
Fin
lan
d38
.87
-0.7
13-1
.013
Fra
nce
28.8
121.
18
-0.2
11
Ger
man
y33
.99
4.7
40.
19
Hu
ng
ary
69.3
39.
12
6.3
1
Irel
and
93.8
17.
43
5.2
2
Ital
y27
.314
0.8
120.
28
Jap
an10
.916
-6.6
16-0
.512
Ko
rea
42.8
51.
010
-2.8
15
Net
her
lan
ds
69.5
21.
18
1.1
7
New
Zea
lan
d35
.88
2.1
71.
76
Po
lan
d30
.911
10.6
1-0
.110
Sp
ain
31.3
103.
45
3.7
4
Sw
eden
44.3
4-1
.414
-3.9
16
UK
28.0
131.
010
2.8
5
US
12.7
15-4
.515
-2.7
14
EU
OE
CD
-1.5
-1.4
2001
= a
2000
= b
1999
= c
1998
= d
1997
= e
1996
= f
1995
= g
1994
= h
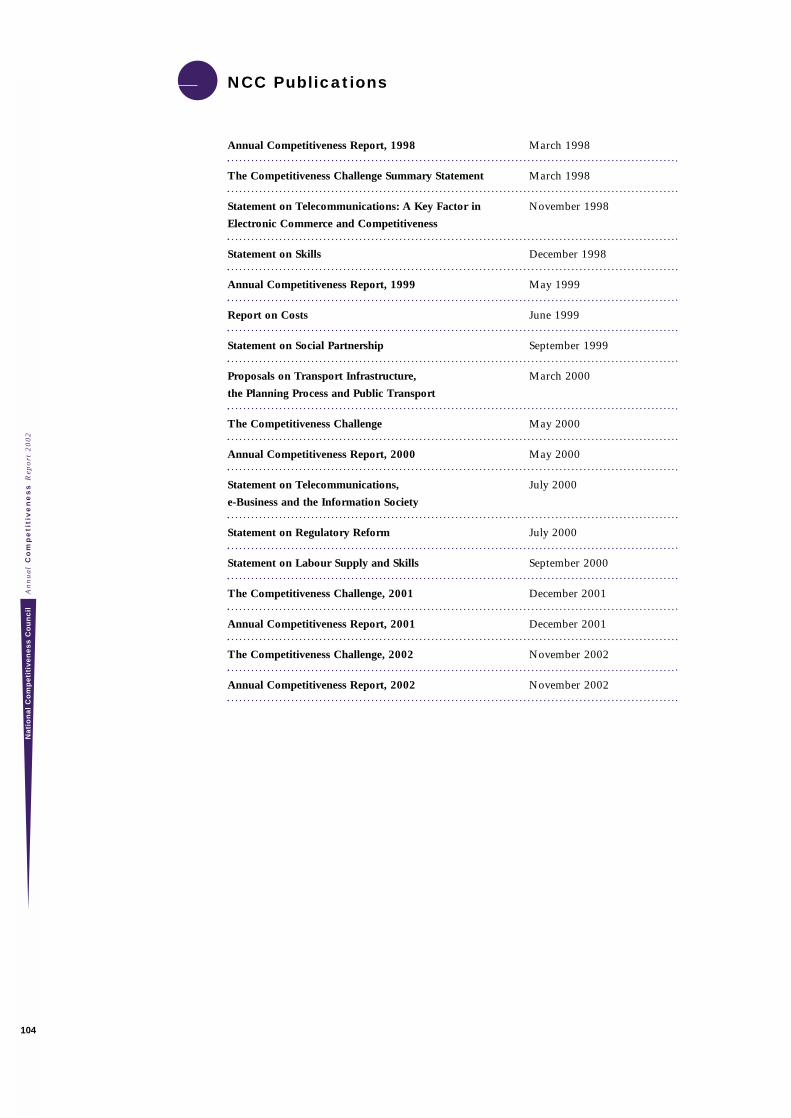
Annual Competitiveness Report, 1998 March 1998
The Competitiveness Challenge Summary Statement March 1998
Statement on Telecommunications: A Key Factor in November 1998
Electronic Commerce and Competitiveness
Statement on Skills December 1998
Annual Competitiveness Report, 1999 May 1999
Report on Costs June 1999
Statement on Social Partnership September 1999
Proposals on Transport Infrastructure, March 2000
the Planning Process and Public Transport
The Competitiveness Challenge May 2000
Annual Competitiveness Report, 2000 May 2000
Statement on Telecommunications, July 2000
e-Business and the Information Society
Statement on Regulatory Reform July 2000
Statement on Labour Supply and Skills September 2000
The Competitiveness Challenge, 2001 December 2001
Annual Competitiveness Report, 2001 December 2001
The Competitiveness Challenge, 2002 November 2002
Annual Competitiveness Report, 2002 November 2002
NCC Publications
An
nu
al
Co
mp
eti
tiv
en
es
s R
epo
rt 2
00
2N
ati
on
al
Co
mp
eti
tiv
en
es
s C
ou
nc
il
104