Annual Class Size Study - Minnesota Legislature Class Size Study A Report of Class Size Patterns...
46
Annual Class Size Study A Report of Class Size Patterns 2014-2015 School Year March 2015 Metro ECSU 2 Pine Tree Drive, Suite 101 Arden Hills, Minnesota 55112 612-638-1500 www.metroecsu.org This document is made available electronically by the Minnesota Legislative Reference Library as part of an ongoing digital archiving project. http://www.leg.state.mn.us/lrl/lrl.asp
Transcript of Annual Class Size Study - Minnesota Legislature Class Size Study A Report of Class Size Patterns...

Annual Class Size Study
A Report of Class Size Patterns
2014-2015 School Year
March 2015
Metro ECSU 2 Pine Tree Drive, Suite 101 Arden Hills, Minnesota 55112
612-638-1500
www.metroecsu.org
This document is made available electronically by the Minnesota Legislative Reference Library as part of an ongoing digital archiving project. http://www.leg.state.mn.us/lrl/lrl.asp

FOREWARD
The Metro ECSU 2014-2015 Class Size Study reports data describing both regional and local norms. We hope that the information contained in this report will be useful to decision makers and interested citizens served by Metro ECSU. Though this data was carefully collected, we wish to caution readers from making assumptions about a district’s staffing pattern based on class size statistics alone. New this year, a trend analysis of the last five school years was included in the study. Questions or comments about this report should be directed to Julie Schaal at [email protected] or 612-638-1540. Julie Frame Executive Director, Metro ECSU Cathy Macdonald Director of Operations, Metro ECSU Julie Schaal Class Size Study Coordinator, Metro ECSU

TABLE OF CONTENTS
Introduction …………………………………………………………….………….. 1 Glossary …………………………………………………………………………… 3 List of Tables ……………………………………………………………………… 5 Reports with Tables ……….………………….…………………………………… 6
A. Regionwide Class Size Statistics & Data Observations: Trends………….. 7
B. Regionwide Class Size Statistics……………………...…………………… 11
C. Elementary Class Size Statistics & Data Observations…………………..... 16
D. Junior Secondary Class Size Statistics & Data Observations……………… 21
E. Senior Secondary Class Size Statistics & Data Observations……………… 28 Appendix …………………………………………………………………………... 35 A. List of Participating Districts ………………………………………………. 36
B. Memo to District Contacts: Directions for the Annual Class Size Study ….. 37
C. Data Collection Formats (data was collected electronically in Excel) ……... 41

INTRODUCTION
This report describes class size statistics for thirty-six school districts in the metro Twin Cities area submitting data to Metro ECSU. To enable the reader to interpret this report accurately, it is necessary to describe the report briefly in terms of data collection and reporting procedures.
Sources of Data
The method of collecting class size information was an electronic format. All metro area Superintendents were sent an invitation to authorize participation and appoint a staff member to be in direct contact with Metro ECSU staff for the study. District contacts received the “Memo to District Contacts: Directions for the Annual Class Size Study” (page 37-40) and three Excel spreadsheet formats (pages 41-43), one for each school type (elementary, junior secondary and senior secondary). The designated contact person appointed by the Superintendent in each district was responsible for collecting data from each building in the district, aggregating the data in each Excel file, and returning the data to the Metro ECSU for data processing and analysis. More details about this process are available in the memo which is located in the Appendix of this document.
Organization of the Report For an overview, please refer to the Table of Contents at the beginning of the study. The Class Size Study contains a glossary (page 3-4) which should be read prior to viewing the tables. The study contains an introduction, a middle section with tables and results and a summary section. The “Reports with Tables” section consists of statistical highlights for metro schools aggregated as “regionwide” data and by school type—elementary, junior secondary and senior secondary. The highlights represent regional norms for all class size categories and are calculated by aggregating local data plus reports focusing on elementary, junior secondary and senior secondary programs. Data were reported in some cases excluding special education students, and, in others, including special education students. It should also be noted that consistent grade groupings have not been used for each district. (Of special note here is the fact that grades 5 and 6 may be included with elementary or junior secondary data depending upon local district configuration.)
Limitations The following considerations should be taken into account when reviewing data in the Annual Class Size Study: Class size data included in this report are based on fall student counts submitted as of
October 1, 2014.
At the junior and senior secondary levels, no attempt has been made to include all subjects offered by all schools; only subject areas that are most typically offered at the secondary level have been included.
1

It is tempting to interpret inter-district comparisons in terms of relationships which suggest cause and effect. The reader should be careful in making such comparisons. Class size data among school districts will be different due to many factors, including educational philosophy, school facility design, school district organizations, economic stability, school district size, management methods, and utilization of specialists or paraprofessionals in conjunction with professional staff. Although the descriptions contained within the tables of this report demonstrate normative comparisons, the data reported simply describe what exists, not why differences exist among the districts.
2
GLOSSARY OF TERMS 1. Average (Mean) Class Size Average (Mean) Class Size represents the class size which equals the arithmetic average of class sizes reported. The average is the total of reported class sizes divided by the number of classes reported. Averages are reported to the nearest one hundredth. 2. Class Size Class Size refers to the number of students in a group or class organized for the purpose of instruction. 3. Class Size Range Class Size Range represents the maximum and minimum class sizes reported for a given grade or subject area. 4. Class Types Class types counted for this study differ for each school type. Class types for each are as follows:
Elementary Junior Secondary Senior Secondary Kindergarten Art Art Grade 1 Business Ed/Marketing Business Ed/Marketing Grade 2 Family & Consumer Science Family & Consumer Science Grade 3 Health Education Health Education Grade 4 Interdisciplinary Courses Language Arts/English Grade 5 Language Arts/English Math Grade 6 Math Music Special Education Music Physical Education Combo or Ungraded Physical Education Science Science Social Studies Social Studies Special Education Special Education Technology Ed/Computer Science Technology Ed/Computer Science Work Experience Program World Languages World Languages
5. Elementary This grouping may include the following grades: K, 1, 2, 3, 4, 5 and 6. Combination grades/ungraded (elementary) and special education classes may also be included. Depending on individual district grade organization, “elementary” may not include grades 5 or 6. 6. Grade Group Grade groups include the school types—elementary, junior secondary and senior secondary, but also part of and combinations of those school type groups. For example, some of the data is reported for a combination of junior and senior secondary as one grade group. 7. Junior Secondary This grouping includes students in middle schools, junior high schools, or the first part of an eight-year secondary program (i.e., grades 5-12).
3

8. Participating Districts School districts in the metro Twin Cities area that submitted data for the current year of the study. These districts may or may not be members of Metro ECSU. 9. School Type School types for this study are Elementary, Junior Secondary, or Senior Secondary. 10. Senior Secondary This grouping includes students at the senior high school level or in the second part of an eight-year secondary program (i.e., grades 5-12).
4
LIST OF TABLES
Table Page
1 Elementary Regionwide Class Size Trends…………………………………… 8 2 Jr. Secondary Regionwide Class Size Trends…………………..……………... 9 3 Sr. Secondary Regionwide Class Size Trends………………………………… 10 4 Class Size Regionwide by Class Type………………………………………… 12 5 Class Size Regionwide by Grade Group (Excluding Special Education)…….. 13 6 Class Size Regionwide by Grade Group (Including Special Education)……… 13 7 Average Class Size by Grade Group (Excluding Special Education)………… 14 8 Average Class Size by Grade Group (Including Special Education)…………. 15 9 Elementary Average Class Size by Class Type……………………………….. 17
10 Elementary Maximum/Minimum Class Size by Class Type………………….. 19
11 Jr. Secondary Average Class Size by Class Type…………………………….. 22
12 Jr. Secondary Maximum/Minimum Class Size by Class Type……………….. 25
13 Sr. Secondary Average Class Size by Class Type…………………………….. 29
14 Sr. Secondary Maximum/Minimum Class Size by Class Type……………….. 32
5

REPORTS WITH TABLES
6

A. REGIONWIDE CLASS SIZE STATISTICS & DATA OBSERVATIONS: TRENDS
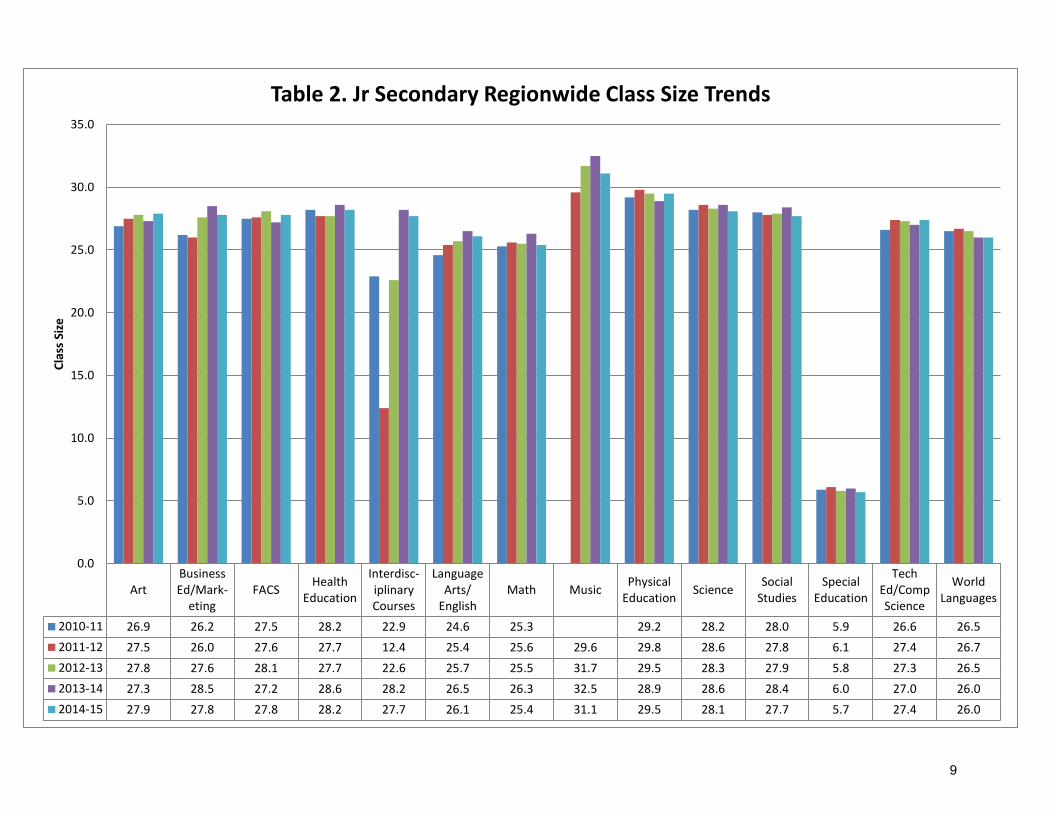
New this year, the regionwide class size averages by class type from the last five years were included in the study. The graphs include data from the 2010-11 school year through the 2014-15 school year.
Table 1 (page 8) reports the average Elementary class sizes for each year by class type. The Elementary regionwide class size trends consistently show that the average class size increases by grade level. When comparing last school year (2013-14) to this school year (2014-15), all Elementary class sizes decreased except for Special Education.
Table 2 (page 9) reports the average Jr. Secondary class sizes for each year by class type. The Jr. Secondary regionwide class size trends show that the core subjects of Math, Science, Social Studies, and Language Arts/English are consistently smaller than those same subjects at the Sr. Secondary level. The data also show that of the core subjects, Science classes have consistently had the highest class sizes at the Jr. Secondary level. When comparing last school year (2013-14) to this school year (2014-15), all Jr. Secondary core subjects decreased in class size.
Table 3 (page 10) reports the average Sr. Secondary class sizes for each year by class type. The Sr. Secondary regonwide class size trends show that the core subjects of Math, Science, Social Studies, and Language Arts/English are consistently higher than those same subjects at the Jr. Secondary level. The data also show that of the core subjects, Social Studies classes have consistently had the highest class sizes at the Sr. Secondary level. When comparing last school year (2013-14) to this school year (2014-15), Math, Social Studies, and Language Arts/English classes increased in class size while Science classes decreased.
7

Kindergarten 1st Grade 2nd Grade 3rd Grade 4th Grade 5th Grade 6th Grade Combo orUngraded Special Ed
2010-11 21.1 22.6 23.5 24.7 26.4 26.9 26.0 26.9 6.92011-12 20.8 22.7 23.9 25.2 26.0 27.0 27.0 26.4 5.12012-13 21.5 22.6 23.6 24.8 26.2 26.6 25.8 26.8 5.52013-14 21.5 22.6 23.5 24.5 26.0 26.7 27.0 25.6 5.02014-15 21.2 22.2 23.4 24.3 25.5 26.3 26.7 25.1 5.6
0.0
5.0
10.0
15.0
20.0
25.0
30.0
Table 1. Elementary Regionwide Class Size Trends
8
ArtBusinessEd/Mark-
etingFACS Health
Education
Interdisc-iplinaryCourses
LanguageArts/
EnglishMath Music Physical
Education Science SocialStudies
SpecialEducation
TechEd/CompScience
WorldLanguages
2010-11 26.9 26.2 27.5 28.2 22.9 24.6 25.3 29.2 28.2 28.0 5.9 26.6 26.52011-12 27.5 26.0 27.6 27.7 12.4 25.4 25.6 29.6 29.8 28.6 27.8 6.1 27.4 26.72012-13 27.8 27.6 28.1 27.7 22.6 25.7 25.5 31.7 29.5 28.3 27.9 5.8 27.3 26.52013-14 27.3 28.5 27.2 28.6 28.2 26.5 26.3 32.5 28.9 28.6 28.4 6.0 27.0 26.02014-15 27.9 27.8 27.8 28.2 27.7 26.1 25.4 31.1 29.5 28.1 27.7 5.7 27.4 26.0
0.0
5.0
10.0
15.0
20.0
25.0
30.0
35.0
Clas
s Si
ze
Table 2. Jr Secondary Regionwide Class Size Trends
9

ArtBusinessEd/Mark-
etingFACS Health
Education
LanguageArts/
EnglishMath Music Physical
Education Science SocialStudies
SpecialEducation
TechEd/CompScience
Work ExpProgram
WorldLanguages
2010-11 26.8 27.2 27.3 30.1 27.0 27.8 30.7 28.4 29.7 7.3 23.3 13.4 26.72011-12 26.9 26.4 27.0 29.8 27.2 27.5 36.2 29.5 28.0 29.8 7.6 24.0 11.8 26.82012-13 25.7 26.5 26.7 30.3 27.0 27.4 36.9 29.6 28.2 29.4 6.7 22.9 10.7 26.62013-14 26.4 27.3 26.2 30.5 27.3 27.2 38.0 30.0 28.2 29.2 7.4 22.7 13.8 26.22014-15 26.3 26.1 26.3 28.1 27.4 27.7 37.6 29.7 27.9 29.3 6.7 23.3 11.0 26.1
0.0
5.0
10.0
15.0
20.0
25.0
30.0
35.0
40.0
Clas
s Si
ze
Table 3. Sr Secondary Regionwide Class Size Trends
10

B. REGIONWIDE CLASS SIZE STATISTICS
Averages and class size ranges for specific school types and selected subject areas for the participating districts as a whole are reported in Table 4 (page 12). Summary data for the entire region appears in Table 5 and Table 6 (page 13). Special education, which typically has smaller class sizes, was excluded from Table 5. Average class size data by selected grade groupings (i.e., Elementary, Junior Secondary, Senior Secondary, Junior and Senior Secondary combined, and for all K - 12) for class sizes excluding special education and including special education are shown in Table 7 (page 14) and Table 8 (page 15) respectively. Individual district data are available in these tables by district number (see key on page 36).
11

Avg. Min. Max.Class Type
Table 4. Class Size Regionwide by Class Type
Elementary
Kindergarten 21.2 13 28Grade 1 22.2 13 29Grade 2 23.4 13 31Grade 3 24.3 16 33Grade 4 25.5 15 35Grade 5 26.3 16 36Grade 6 26.7 20 34
Combo or Ungraded 25.0 16 31Special Education 5.6 1 14
Avg. Min. Max.Class TypeJr Secondary
Art 27.9 6 40Business Ed/Marketing 27.8 19 37
Family & Consumer Science 27.8 9 37Health Education 28.2 4 42
Interdisciplinary Courses 27.7 12 39Language Arts/English 26.1 3 39
Math 25.4 1 42Music 31.1 1 113
Physical Education 29.5 6 44Science 28.1 6 41
Social Studies 27.7 2 41Special Education 5.7 1 38
Technology Ed/Computer Science 27.4 7 36World Languages 26.0 2 41
Avg. Min. Max.Class TypeSr Secondary
Art 26.3 2 42Business Ed/Marketing 26.1 1 40
Family & Consumer Science 26.3 1 40Health Education 28.1 1 44
Language Arts/English 27.4 3 41Math 27.7 2 44
Music 37.6 1 211Physical Education 29.7 1 47
Science 27.9 4 56Social Studies 29.3 5 49
Special Education 6.7 1 37Technology Ed/Computer Science 23.3 1 39
Work Experience Program 11.0 1 37World Languages 26.1 1 42
12

Table 5. Class Size Regionwide by Grade Group (Excluding Special Education)
Avg. Min. Max. Elementary 23.8 13 36 Jr Secondary 27.5 1 113 Sr Secondary 27.8 1 211
Table 6. Class Size Regionwide by Grade Group (Including Special Education)
Avg. Min. Max. Elementary 23.5 1 36 Jr. Secondary 25.0 1 113 Sr. Secondary 25.1 1 211
13

Table 7. Average Class Size by Grade Group (Excluding Special Education)
Avg.Dist.
Elementary
271 21.25276 21.56277 21.61721 22.30200 22.36720 22.4213 22.45284 22.45717 22.48624 22.51716 22.7215 22.90719 23.08281 23.10197 23.13278 23.55623 23.60270 23.62282 23.62283 23.96831 24.04622 24.15625 24.23138 24.44192 24.5611 24.69834 24.776 24.8114 24.84273 24.93110 24.93280 24.9712 25.04194 25.10832 25.25272 25.30
23.76Reg wide
Jr Secondary
Dist. Avg.271 23.53280 23.57284 25.27625 25.34717 25.56720 26.20832 26.33622 26.346 26.38
197 26.43270 26.48281 26.53138 27.01273 27.03276 27.26283 27.49719 27.6813 27.78831 27.90624 28.10623 28.10716 28.54277 28.58282 28.6515 28.89278 28.92110 29.05192 29.26200 29.50272 29.73194 30.18721 30.2511 30.49834 30.8012 32.4614 32.65
Reg wide 27.50
Sr Secondary
Dist. Avg.716 23.03717 23.06138 23.686 24.63
110 24.86720 24.91624 24.99284 26.10271 26.12278 26.37276 26.41832 26.52277 26.65282 26.70625 26.74281 26.91831 27.23283 27.33280 27.43721 27.71200 27.88622 28.7112 28.80272 28.95273 28.9913 29.04197 29.17719 29.32623 29.4514 29.74270 30.20192 30.53834 31.2511 31.38194 31.53
Reg wide 27.82
Jr & Sr Secondary
Dist. Avg.717 24.02138 24.67271 24.69716 24.916 25.32
280 25.51284 25.57720 25.63625 26.11832 26.42624 26.46281 26.71276 26.80110 27.09283 27.41282 27.50277 27.50278 27.53622 27.54197 27.62270 27.63273 27.63831 27.6413 28.46719 28.55200 28.72721 28.82623 28.8415 28.89272 29.31192 29.8912 30.4414 30.8311 30.89194 30.92834 31.11
Reg wide 27.66
Dist. Avg.
K-12
717 23.92271 24.24716 24.56138 24.63720 25.07284 25.146 25.23
280 25.41625 25.82624 25.90276 26.03281 26.23832 26.31110 26.82270 26.93283 26.95277 26.98831 26.98197 27.09282 27.09278 27.09622 27.1315 27.19273 27.3313 27.39623 27.55719 27.79721 27.92200 28.12272 28.49192 28.74834 29.5812 29.6711 29.82194 30.1614 30.37
Reg wide 27.07
14
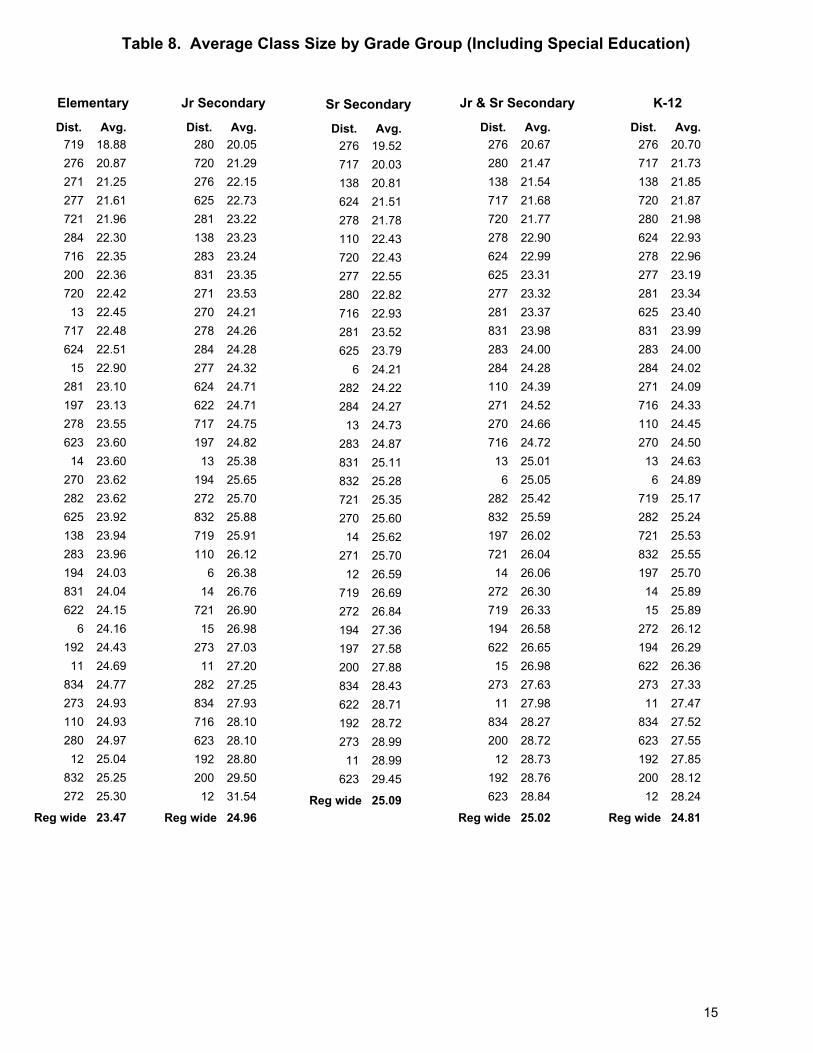
Table 8. Average Class Size by Grade Group (Including Special Education)
Avg.Dist.
Elementary
719 18.88276 20.87271 21.25277 21.61721 21.96284 22.30716 22.35200 22.36720 22.4213 22.45717 22.48624 22.5115 22.90281 23.10197 23.13278 23.55623 23.6014 23.60270 23.62282 23.62625 23.92138 23.94283 23.96194 24.03831 24.04622 24.156 24.16
192 24.4311 24.69834 24.77273 24.93110 24.93280 24.9712 25.04832 25.25272 25.30
23.47Reg wide
Jr Secondary
Dist. Avg.280 20.05720 21.29276 22.15625 22.73281 23.22138 23.23283 23.24831 23.35271 23.53270 24.21278 24.26284 24.28277 24.32624 24.71622 24.71717 24.75197 24.8213 25.38194 25.65272 25.70832 25.88719 25.91110 26.126 26.3814 26.76721 26.9015 26.98273 27.0311 27.20282 27.25834 27.93716 28.10623 28.10192 28.80200 29.5012 31.54
Reg wide 24.96
Sr Secondary
Dist. Avg.276 19.52717 20.03138 20.81624 21.51278 21.78110 22.43720 22.43277 22.55280 22.82716 22.93281 23.52625 23.796 24.21
282 24.22284 24.2713 24.73283 24.87831 25.11832 25.28721 25.35270 25.6014 25.62271 25.7012 26.59719 26.69272 26.84194 27.36197 27.58200 27.88834 28.43622 28.71192 28.72273 28.9911 28.99623 29.45
Reg wide 25.09
Jr & Sr Secondary
Dist. Avg.276 20.67280 21.47138 21.54717 21.68720 21.77278 22.90624 22.99625 23.31277 23.32281 23.37831 23.98283 24.00284 24.28110 24.39271 24.52270 24.66716 24.7213 25.016 25.05
282 25.42832 25.59197 26.02721 26.0414 26.06272 26.30719 26.33194 26.58622 26.6515 26.98273 27.6311 27.98834 28.27200 28.7212 28.73192 28.76623 28.84
Reg wide 25.02
Dist. Avg.
K-12
276 20.70717 21.73138 21.85720 21.87280 21.98624 22.93278 22.96277 23.19281 23.34625 23.40831 23.99283 24.00284 24.02271 24.09716 24.33110 24.45270 24.5013 24.636 24.89
719 25.17282 25.24721 25.53832 25.55197 25.7014 25.8915 25.89272 26.12194 26.29622 26.36273 27.3311 27.47834 27.52623 27.55192 27.85200 28.1212 28.24
Reg wide 24.81
15

C. ELEMENTARY CLASS SIZE STATISTICS & DATA OBSERVATIONS
Elementary class size data are reported for each participating district for grades K, 1, 2, 3, 4, 5, 6, multi-age groups/combination grades, and Special Education. Table 9 (pages 17-18) reports the average class sizes for each school district. Districts are ranked from low to high according to the average calculated. Table 10 (pages 19-20) reports class size maximums and minimums for each school district. Districts are ranked from low to high based upon the maximum class size, not the difference between the maximum and minimum class sizes. Individual districts that did not submit data required for these tables were excluded from that portion of a table(s). Highest average class sizes generally increased with grade level. For the most part, class size ranges were not as variable as those for Secondary data.
16

Table 9. Elementary Average Class Size by Class Type
Avg.Dist.
Kindergarten
13 18.25282 18.67721 18.80716 18.8615 19.00200 19.00719 19.48271 19.61276 19.87278 19.88720 20.3911 20.42277 20.43284 20.53832 20.56624 20.59623 20.64622 20.97831 21.0012 21.23272 21.43138 21.7514 21.80281 21.83834 21.88194 22.00273 22.00197 22.21717 22.50192 22.646 22.67
625 22.81270 23.29280 23.76110 23.91283 24.19
21.22Reg wide
Avg.Dist.
Grade 1
716 19.17271 19.46284 20.19276 20.29720 20.62721 20.86831 21.00624 21.35278 21.40282 21.40277 21.57834 21.65281 21.7015 21.8813 21.9211 21.96719 22.20138 22.22623 22.30192 22.33622 22.55197 22.61194 22.61283 22.88200 22.93272 23.156 23.17
280 23.29717 23.3312 23.39625 23.42270 23.71273 24.1814 25.00110 25.27832 25.88
22.21Reg wide
Avg.Dist.
Grade 2
276 20.38271 20.78831 21.1013 21.25717 21.33277 21.63284 21.63716 21.6715 21.73720 21.77721 22.15623 22.23138 22.67197 22.71200 22.71282 22.80624 22.86719 23.00281 23.12278 23.506 23.58
283 23.88834 23.95192 24.04270 24.05273 24.09625 24.19622 24.32110 24.42194 24.6614 24.7811 25.07272 25.23280 25.3112 25.68832 27.50
23.41Reg wide
Avg.Dist.
Grade 3
276 21.1713 21.42717 21.4315 21.87277 22.13271 22.26270 22.53720 22.54284 22.70282 23.00721 23.08281 23.26278 23.38624 23.54622 23.70719 23.73200 23.79283 23.87623 24.15625 24.58197 24.67273 24.77138 25.00272 25.04832 25.11110 25.256 25.27
834 25.35831 25.35192 25.5714 25.6712 25.71280 26.27194 26.29716 26.4011 27.03
24.33Reg wide
Avg.Dist.
Grade 4
277 22.13271 22.74624 23.19270 23.33283 23.60721 23.83276 23.84197 23.87717 24.00200 24.08281 24.39716 24.60278 24.67720 24.67719 24.94625 25.15284 25.36138 25.75280 25.77832 25.78110 25.82831 25.906 26.09
622 26.20623 26.2313 26.3012 26.47273 26.55194 26.5711 27.09192 27.17834 27.2415 27.5414 28.00272 28.36282 29.25
25.48Reg wide
17
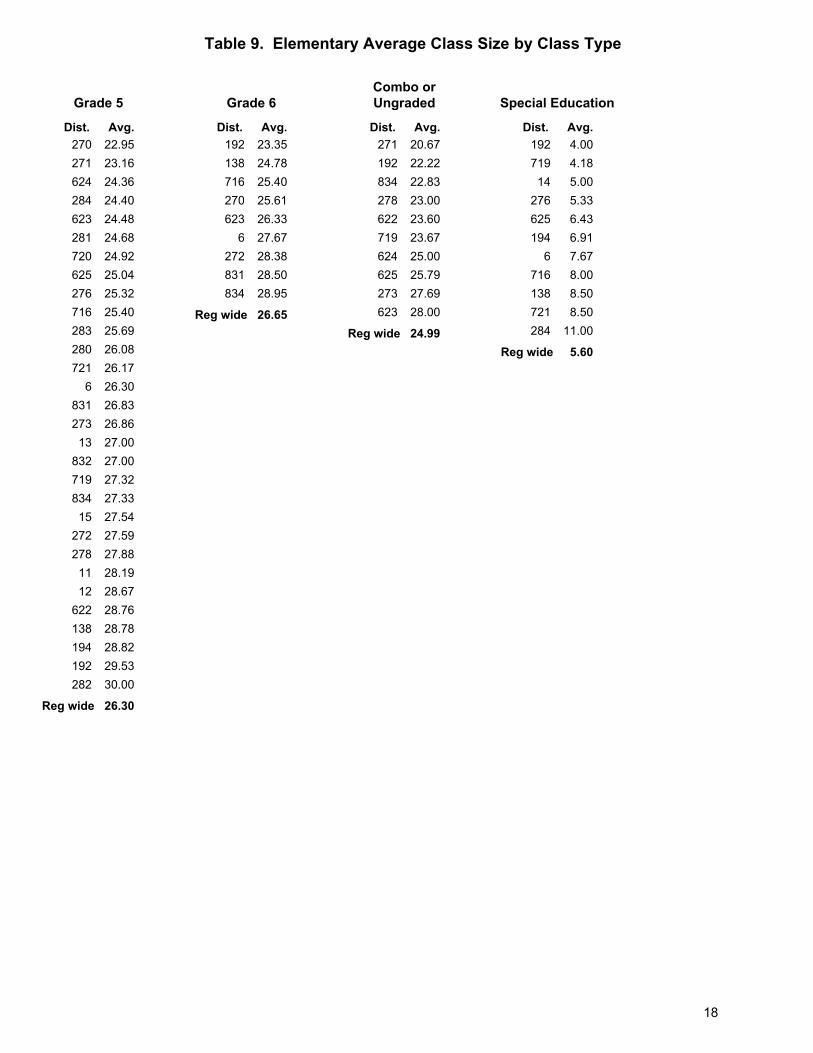
Table 9. Elementary Average Class Size by Class Type
Avg.Dist.
Grade 5
270 22.95271 23.16624 24.36284 24.40623 24.48281 24.68720 24.92625 25.04276 25.32716 25.40283 25.69280 26.08721 26.176 26.30
831 26.83273 26.8613 27.00832 27.00719 27.32834 27.3315 27.54272 27.59278 27.8811 28.1912 28.67622 28.76138 28.78194 28.82192 29.53282 30.00
26.30Reg wide
Avg.Dist.
Grade 6
192 23.35138 24.78716 25.40270 25.61623 26.336 27.67
272 28.38831 28.50834 28.95
26.65Reg wide
Avg.Dist.
Combo orUngraded
271 20.67192 22.22834 22.83278 23.00622 23.60719 23.67624 25.00625 25.79273 27.69623 28.00
24.99Reg wide
Avg.Dist.
Special Education
192 4.00719 4.1814 5.00276 5.33625 6.43194 6.916 7.67
716 8.00138 8.50721 8.50284 11.00
5.60Reg wide
18

Table 10. Elementary Maximum/Minimum Class Size by Class Type
MaxDist.
Kindergarten
Min282 20 15716 20 1515 21 17200 21 16278 21 19721 21 14832 21 2013 22 14138 22 21284 22 18720 22 18276 23 16717 23 2211 24 1512 24 15194 24 17272 24 19277 24 17622 24 17624 24 15719 24 15110 25 2314 25 18197 25 20271 25 15273 25 20281 25 196 25 20623 25 17834 25 18192 26 20283 26 22625 26 13831 26 16270 27 19280 28 19
28Reg wide 13
MaxDist.
Grade 1
Min716 20 19278 22 21282 22 21138 23 21720 23 17721 23 1913 24 2015 24 19276 24 16277 24 19284 24 19717 24 22197 25 19200 25 22281 25 17283 25 206 25 22624 25 18719 25 18834 25 1611 26 17110 26 2412 26 20192 26 17194 26 19271 26 15280 26 21831 26 14270 27 18272 27 18622 27 19623 27 15832 27 2514 28 23273 28 22625 29 13
29Reg wide 13
MaxDist.
Grade 2
Min277 22 21716 22 21717 22 2013 23 19282 23 22721 23 21138 24 21278 24 23720 24 19110 25 2415 25 19276 25 13284 25 19719 25 19831 25 1514 26 22192 26 21197 26 20283 26 206 26 21200 27 21271 27 16273 27 21281 27 20624 27 1912 28 23270 28 18622 28 22623 28 17625 28 15832 28 2611 29 19194 30 21272 30 21834 30 19280 31 20
31Reg wide 13
MaxDist.
Grade 3
Min277 23 21717 23 2013 24 1615 24 20278 24 22282 24 22276 25 16284 25 21720 25 18110 26 24138 26 24200 26 21721 26 20832 26 24271 27 19273 27 22281 27 17624 27 20716 27 2614 28 23270 28 19272 28 236 28 23719 28 20197 29 19283 29 21622 29 20623 29 17834 29 2112 30 19192 30 2111 31 21194 31 21280 31 21625 31 16831 33 17
33Reg wide 16
MaxDist.
Grade 4
Min277 23 21717 24 24716 25 24197 26 19271 26 19278 26 23110 27 24200 27 22283 27 20624 27 15719 27 22832 27 25138 28 24270 28 15281 28 20284 28 236 28 24720 28 22721 28 21192 29 25273 29 25276 29 17280 29 2212 30 1813 30 2014 30 26282 30 29623 30 1915 31 25194 31 23272 31 25831 31 1711 34 20625 34 15834 34 23622 35 20
35Reg wide 15
19

Table 10. Elementary Maximum/Minimum Class Size by Class Type
MaxDist.
Grade 5
Min716 26 25270 27 18284 27 22832 27 27281 28 226 28 25624 28 19278 29 26280 29 24720 29 23721 29 23273 30 24276 30 16283 30 21623 30 16625 30 17719 30 25272 31 24282 31 2812 32 25138 32 2715 32 22271 32 17831 32 2011 33 2213 33 23194 33 22834 33 19192 35 27622 36 22
36Reg wide 16
MaxDist.
Grade 6
Min138 26 23192 26 21716 27 25270 28 236 31 23623 31 20272 32 24831 34 24834 34 21
34Reg wide 20
MaxDist.
Combo or Ungraded
Min271 21 20278 24 22834 24 21624 25 25719 27 20192 28 17623 28 28622 29 20273 30 26625 31 16
31Reg wide 16
MaxDist.
Special Education
Min192 4 4276 6 514 7 36 8 7625 8 5716 8 8721 9 8194 10 4719 11 1138 14 3284 14 5
14Reg wide 1
20

D. JUNIOR SECONDARY CLASS SIZE STATISTICS & DATA OBSERVATIONS
Junior secondary class size data are reported for each participating district in selected subject areas (see page 3 in the Glossary of Terms for a list). Table 11 (page 22-24) reports the average class sizes for each school district. Districts are ranked from low to high according to the average calculated. Table 12 (pages 25-27) reports class size maximums and minimums for each school district. Districts are ranked from low to high based upon the maximum class size, not the difference between the maximum and minimum class sizes. Individual districts that did not submit data required for these tables were excluded from that portion of a table(s). Highest average class sizes regionwide were for Health Education, Music, Physical Education, and Science. Class size ranges showed wide variability.
21

Table 11. Jr Secondary Average Class Size by Class Type
Avg.Dist.
Art
138 20.00717 22.91110 23.50282 25.20273 25.32624 25.5015 26.00284 26.00271 26.04720 26.06716 26.17834 26.67197 26.70270 26.78831 26.88832 26.9213 26.94623 27.00278 27.13276 27.27625 27.44277 27.50283 27.90721 28.22200 28.25192 28.306 28.75
281 29.08280 29.33272 29.40719 29.60194 30.7111 30.73622 31.1412 32.0014 33.45
27.92Reg wide
Avg.Dist.
BusinessEd/Marketing
625 27.05831 27.20719 32.00
27.78Reg wide
Avg.Dist.
Family &Consumer
Science
194 17.50831 21.29197 22.50832 24.09717 24.20720 24.20625 25.29282 25.50624 25.86623 26.09270 26.15277 26.41271 26.42273 26.96192 27.14716 27.30281 28.07284 28.29110 28.50200 28.75719 28.8712 29.22276 30.20622 30.21272 30.6011 31.0015 32.00
27.81Reg wide
Avg.Dist.
Health Education
138 20.00717 20.33280 24.50719 25.00271 25.90284 26.46624 26.82832 26.83273 27.16625 27.41276 27.50623 27.64720 27.88831 28.00272 28.60622 28.64270 28.70192 28.92281 29.29200 29.50834 29.75721 29.86110 30.2513 31.71716 32.3315 32.4012 32.9014 36.33
28.16Reg wide
Avg.Dist.
InterdisciplinaryCourses
271 26.83277 27.89278 29.1314 32.29
27.70Reg wide
22

Table 11. Jr Secondary Average Class Size by Class Type
Avg.Dist.
LanguageArts/English
280 20.08271 20.67622 21.90197 22.636 22.82
281 23.18720 23.22270 24.48625 24.94284 25.22138 25.3313 25.68717 26.08273 26.09831 26.98832 27.0315 27.08200 27.16278 27.25282 27.27623 27.50719 27.51283 27.63272 28.29276 28.41624 28.57192 28.79110 28.98721 29.12716 29.38194 29.4011 29.78277 30.1114 31.2812 31.49834 32.32
26.07Reg wide
Avg.Dist.
Math
271 19.9313 20.08280 20.64625 22.26622 22.806 23.05
717 23.08832 23.97720 24.17284 24.50197 24.90623 24.97281 25.23270 25.34138 25.50283 25.64716 25.70721 25.82719 25.93273 26.04194 26.32276 26.4015 26.85200 26.98192 27.03278 27.08272 27.64831 27.98282 28.20834 28.2011 28.57624 29.07110 29.10277 29.3914 31.1112 31.58
25.41Reg wide
Avg.Dist.
Music
284 20.23281 25.00832 25.76622 26.22276 26.24625 26.30277 26.84271 26.85283 27.816 28.00
719 28.97623 29.17110 29.36834 30.55270 31.27831 32.0511 32.53624 32.77273 33.12138 33.50197 34.22272 34.89192 35.75716 36.0013 38.9015 39.04200 39.96282 40.6714 42.82280 43.13720 43.4612 48.94194 49.28717 50.67278 70.83721 96.00
31.05Reg wide
Avg.Dist.
PhysicalEducation
717 23.16832 25.77271 25.87273 26.51276 27.26625 27.29720 27.33197 27.42283 27.73270 28.00192 28.08624 28.24719 28.38282 28.42716 29.33721 29.36284 29.49194 29.63280 29.72272 29.73138 29.756 30.06
622 30.24277 30.2815 30.34200 30.68834 30.69623 31.39281 31.5211 31.7513 31.9312 32.00831 32.15110 32.27278 36.3914 36.67
29.46Reg wide
Avg.Dist.
Science
280 22.15271 24.00717 24.82625 26.05720 26.14284 26.14197 26.286 26.94
716 27.17270 27.29281 27.36273 27.3715 27.42832 27.67719 27.69278 28.13276 28.15831 28.19283 28.39282 28.4713 28.73622 28.81110 28.97200 29.02623 29.15192 29.26624 29.28721 29.74138 29.94272 30.8211 30.93277 31.25194 31.30834 32.2412 32.7314 32.76
28.13Reg wide
23

Table 11. Jr Secondary Average Class Size by Class Type
Avg.Dist.
Social Studies
271 21.93280 22.47717 23.62622 24.62284 24.90720 26.24197 26.5615 26.58832 27.00273 27.02625 27.02281 27.21719 27.59282 27.60283 27.63278 27.67276 27.77270 28.00623 28.00831 28.42624 28.45716 28.6313 28.68200 28.88110 28.93721 29.04192 29.116 29.12
138 29.75194 29.90272 30.2611 30.64277 30.8812 31.36834 32.1414 33.00
27.69Reg wide
Avg.Dist.
Special Education
276 2.94277 3.26278 3.68197 3.89282 4.00831 4.06624 4.19720 4.3214 4.34110 4.86272 5.00284 5.16719 5.64194 5.64138 5.68192 5.83717 5.86280 6.17281 6.17270 6.25721 6.26832 6.33625 6.3815 6.6113 6.6811 6.75834 7.00283 7.35622 8.31716 12.5012 14.38
5.67Reg wide
Avg.Dist.
TechnologyEd/Computer
Science
625 21.61138 22.38716 24.00717 24.09110 25.00273 25.0012 25.08831 25.22624 25.30270 25.74197 26.00721 26.13277 26.22720 26.31276 26.336 26.59
832 26.71192 26.91284 27.26200 27.50282 27.60271 27.79278 28.2515 28.2814 28.62281 28.68719 28.69280 28.83283 28.95194 29.75623 30.10622 30.4511 30.49272 30.8013 31.83
27.39Reg wide
Avg.Dist.
World Languages
717 14.00138 20.00278 21.31720 22.11197 24.14282 24.29270 24.39624 24.41276 24.75280 25.00625 25.10831 25.30273 25.41284 25.456 25.86
271 25.9213 26.25283 26.3214 27.00721 27.25832 27.56272 27.67281 27.71623 27.72110 27.82719 28.68622 28.82716 29.00834 30.0011 30.15192 30.5812 31.27
25.97Reg wide
24

Table 12. Jr Secondary Maximum/Minimum Class Size by Class Type
MaxDist.
Art
Min138 21 1915 28 24717 28 21832 29 24834 29 24110 30 14282 30 20716 30 23273 31 15721 31 24200 32 22270 32 15272 32 27283 32 21284 32 15192 33 14194 33 28197 33 10276 33 19278 33 20623 33 19719 33 26720 33 18271 34 18277 34 18280 34 19281 34 1913 35 136 35 25624 35 6831 35 1511 36 2212 36 29622 37 24625 38 814 40 22
40Reg wide 6
MaxDist.
BusinessEd/Marketing
Min719 33 28831 33 19625 37 19
37Reg wide 19
MaxDist.
Family & ConsumerScience
Min194 21 15282 26 25197 28 17717 28 22831 28 9832 29 20272 31 30273 31 16277 31 19281 31 24192 32 15200 32 26270 32 16719 32 25720 32 1315 33 30271 33 20276 33 25284 33 23716 33 21623 34 1511 35 21110 35 27624 35 10625 35 1612 37 22622 37 12
37Reg wide 9
MaxDist.
Health Education
Min138 21 19717 24 18831 29 26719 31 17832 31 2013 32 30272 32 24273 32 18284 32 20624 32 4720 32 25200 33 27280 33 17281 33 22623 33 17721 33 27110 34 1515 34 29192 34 19270 34 23276 34 16716 34 3112 35 29271 35 17622 35 16834 35 2314 42 31625 42 12
42Reg wide 4
MaxDist.
InterdisciplinaryCourses
Min278 31 2714 35 27277 36 17271 39 12
39Reg wide 12
25
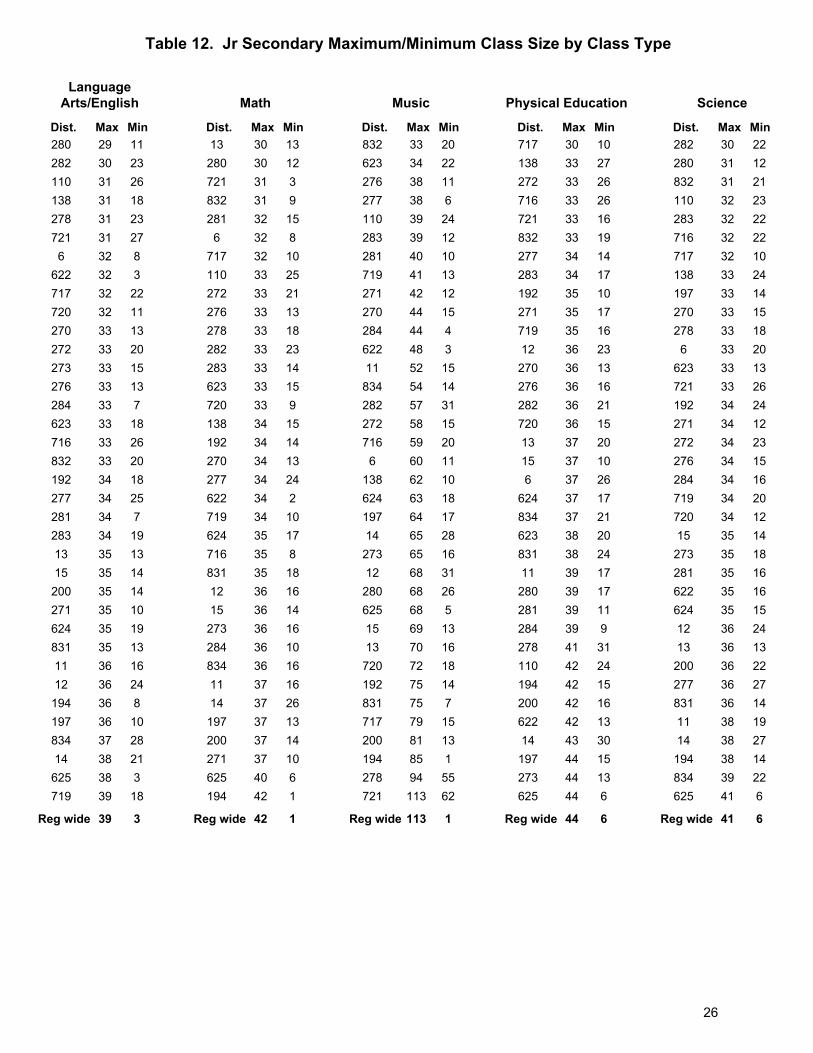
Table 12. Jr Secondary Maximum/Minimum Class Size by Class Type
MaxDist.
LanguageArts/English
Min280 29 11282 30 23110 31 26138 31 18278 31 23721 31 276 32 8622 32 3717 32 22720 32 11270 33 13272 33 20273 33 15276 33 13284 33 7623 33 18716 33 26832 33 20192 34 18277 34 25281 34 7283 34 1913 35 1315 35 14200 35 14271 35 10624 35 19831 35 1311 36 1612 36 24194 36 8197 36 10834 37 2814 38 21625 38 3719 39 18
39Reg wide 3
MaxDist.
Math
Min13 30 13280 30 12721 31 3832 31 9281 32 156 32 8717 32 10110 33 25272 33 21276 33 13278 33 18282 33 23283 33 14623 33 15720 33 9138 34 15192 34 14270 34 13277 34 24622 34 2719 34 10624 35 17716 35 8831 35 1812 36 1615 36 14273 36 16284 36 10834 36 1611 37 1614 37 26197 37 13200 37 14271 37 10625 40 6194 42 1
42Reg wide 1
MaxDist.
Music
Min832 33 20623 34 22276 38 11277 38 6110 39 24283 39 12281 40 10719 41 13271 42 12270 44 15284 44 4622 48 311 52 15834 54 14282 57 31272 58 15716 59 206 60 11138 62 10624 63 18197 64 1714 65 28273 65 1612 68 31280 68 26625 68 515 69 1313 70 16720 72 18192 75 14831 75 7717 79 15200 81 13194 85 1278 94 55721 113 62
113Reg wide 1
MaxDist.
Physical Education
Min717 30 10138 33 27272 33 26716 33 26721 33 16832 33 19277 34 14283 34 17192 35 10271 35 17719 35 1612 36 23270 36 13276 36 16282 36 21720 36 1513 37 2015 37 106 37 26624 37 17834 37 21623 38 20831 38 2411 39 17280 39 17281 39 11284 39 9278 41 31110 42 24194 42 15200 42 16622 42 1314 43 30197 44 15273 44 13625 44 6
44Reg wide 6
MaxDist.
Science
Min282 30 22280 31 12832 31 21110 32 23283 32 22716 32 22717 32 10138 33 24197 33 14270 33 15278 33 186 33 20623 33 13721 33 26192 34 24271 34 12272 34 23276 34 15284 34 16719 34 20720 34 1215 35 14273 35 18281 35 16622 35 16624 35 1512 36 2413 36 13200 36 22277 36 27831 36 1411 38 1914 38 27194 38 14834 39 22625 41 6
41Reg wide 6
26
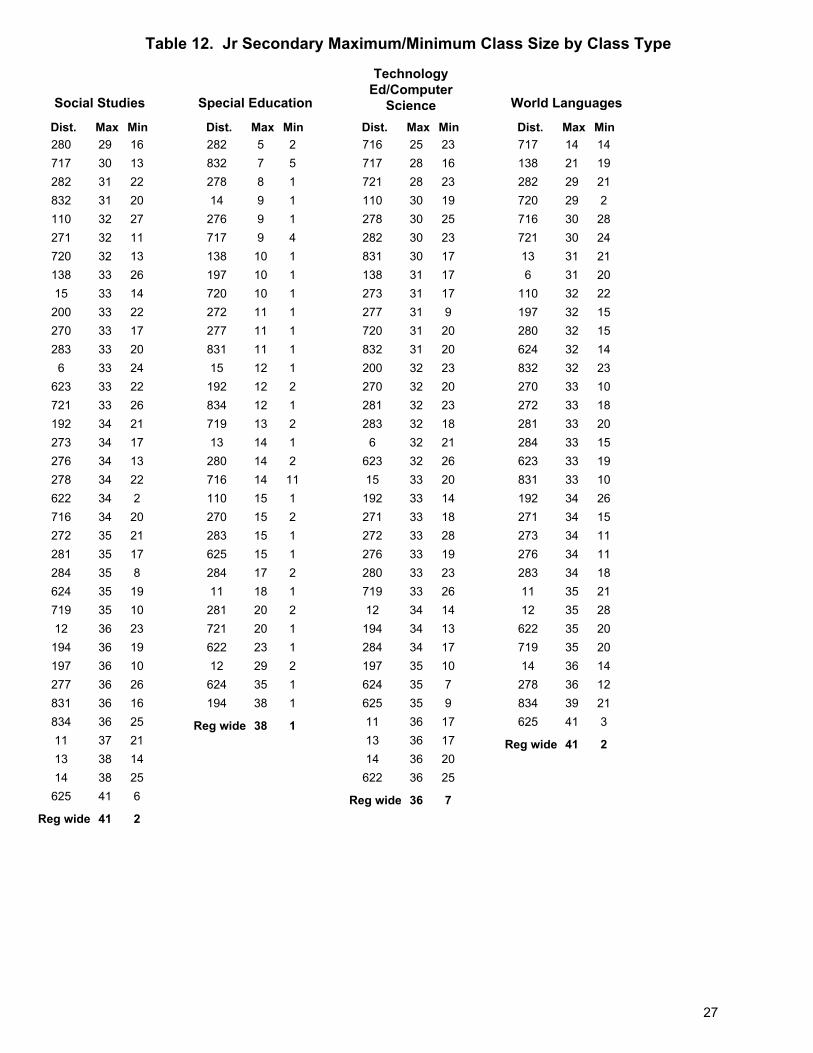
Table 12. Jr Secondary Maximum/Minimum Class Size by Class Type
MaxDist.
Social Studies
Min280 29 16717 30 13282 31 22832 31 20110 32 27271 32 11720 32 13138 33 2615 33 14200 33 22270 33 17283 33 206 33 24623 33 22721 33 26192 34 21273 34 17276 34 13278 34 22622 34 2716 34 20272 35 21281 35 17284 35 8624 35 19719 35 1012 36 23194 36 19197 36 10277 36 26831 36 16834 36 2511 37 2113 38 1414 38 25625 41 6
41Reg wide 2
MaxDist.
Special Education
Min282 5 2832 7 5278 8 114 9 1276 9 1717 9 4138 10 1197 10 1720 10 1272 11 1277 11 1831 11 115 12 1192 12 2834 12 1719 13 213 14 1280 14 2716 14 11110 15 1270 15 2283 15 1625 15 1284 17 211 18 1281 20 2721 20 1622 23 112 29 2624 35 1194 38 1
38Reg wide 1
MaxDist.
TechnologyEd/Computer
ScienceMin
716 25 23717 28 16721 28 23110 30 19278 30 25282 30 23831 30 17138 31 17273 31 17277 31 9720 31 20832 31 20200 32 23270 32 20281 32 23283 32 186 32 21623 32 2615 33 20192 33 14271 33 18272 33 28276 33 19280 33 23719 33 2612 34 14194 34 13284 34 17197 35 10624 35 7625 35 911 36 1713 36 1714 36 20622 36 25
36Reg wide 7
MaxDist.
World Languages
Min717 14 14138 21 19282 29 21720 29 2716 30 28721 30 2413 31 216 31 20110 32 22197 32 15280 32 15624 32 14832 32 23270 33 10272 33 18281 33 20284 33 15623 33 19831 33 10192 34 26271 34 15273 34 11276 34 11283 34 1811 35 2112 35 28622 35 20719 35 2014 36 14278 36 12834 39 21625 41 3
41Reg wide 2
27

E. SENIOR SECONDARY CLASS SIZE STATISTICS & DATA OBSERVATIONS
Senior secondary class size data are reported for each participating district in selected subject areas (see page 3 in the Glossary of Terms for a list). Table 13 (pages 29-31) reports the average class sizes for each school district. Districts are ranked from low to high according to the average calculated. Table 14 (pages 32-34) reports class size maximums and minimums for each school district. Districts are ranked from low to high based upon the maximum class size, not the difference between the maximum and minimum class sizes. Individual districts that did not submit data required for these tables were excluded from that portion of a table(s). Highest average class sizes regionwide were for Health Education, Music, Physical Education, and Social Studies. Class size ranges showed wide variability.
28

Table 13. Sr Secondary Average Class Size by Class Type
Avg.Dist.
Art
717 21.38200 21.93716 22.50831 22.67110 22.78720 22.876 22.93
138 23.50721 24.20832 24.33284 24.42282 24.56271 24.94277 24.94625 25.01281 25.38283 25.50273 25.60270 25.67278 25.67194 25.8813 26.20276 26.43719 27.18622 27.21623 27.75624 28.06272 28.13197 29.5714 30.1312 30.17280 30.1711 30.30834 31.14192 31.31
26.29Reg wide
Avg.Dist.
BusinessEd/Marketing
6 14.50716 17.83717 19.00280 19.20194 21.95720 22.00284 22.72200 23.25624 23.43832 23.50276 23.56281 23.70192 24.57271 24.60625 25.89622 26.04278 26.3112 26.33138 26.50721 26.88283 27.25277 27.67719 27.67623 28.43110 28.50273 28.75272 28.89831 29.7011 30.5314 31.00197 31.3313 32.20270 32.50
26.08Reg wide
Avg.Dist.
Family &Consumer
Science
717 19.40831 19.64720 20.67282 21.00716 21.20832 21.75271 21.816 22.20
110 23.17281 23.58622 23.59138 24.33625 25.83624 26.25276 26.30272 26.33280 26.50270 26.67197 26.70200 27.67719 27.89721 28.6712 28.75194 28.82273 29.5014 29.6711 29.77623 29.92284 29.93192 31.10
26.28Reg wide
Avg.Dist.
Health Education
138 12.00716 15.50624 21.44110 23.00277 24.08284 26.29273 26.50721 26.63717 27.20281 27.63272 27.83832 27.83194 28.57622 28.71625 28.94278 29.00271 29.20282 29.67623 30.5012 31.29720 31.67270 31.83192 32.25719 32.36200 32.91197 33.40283 33.50280 34.50831 36.0013 37.00834 38.00
28.15Reg wide
Avg.Dist.
LanguageArts/English
717 22.11138 22.83720 23.75284 23.886 24.16
276 24.90277 25.00716 25.13624 25.23110 25.76271 25.86625 25.91282 26.04280 26.34278 26.53281 26.65283 26.7212 26.77200 26.84832 27.00273 27.50270 27.59272 27.64721 28.2214 28.76197 29.43831 29.50622 29.63719 29.6613 29.88192 29.95834 30.44623 30.71194 31.9211 32.70
27.39Reg wide
29

Table 13. Sr Secondary Average Class Size by Class Type
Avg.Dist.
Math
716 19.706 21.87
717 22.29138 23.15110 23.22720 23.95278 24.16282 24.72831 24.93271 25.54832 26.03624 26.92277 26.93284 26.96197 27.12276 27.22625 27.42281 27.43280 27.71270 27.83721 28.0312 28.4213 28.58283 28.67719 28.72200 28.79272 29.09192 29.3314 29.42623 29.57622 29.6311 30.12273 30.12834 31.57194 32.78
27.73Reg wide
Avg.Dist.
Music
6 19.71622 25.8614 27.60625 28.02721 28.07281 28.57831 29.75280 30.20138 30.56283 33.17271 34.33284 34.72110 35.38624 37.56197 38.20276 38.21832 38.33278 39.6413 41.25834 41.33277 42.33200 43.91270 43.94719 45.00282 45.20192 47.27720 47.8611 47.93272 50.47716 51.80194 52.60717 53.13273 53.3112 56.70
37.60Reg wide
Avg.Dist.
PhysicalEducation
716 18.00194 21.97624 22.40717 23.85284 25.25110 26.25720 26.56282 27.25270 27.40832 27.50138 27.756 27.95
271 28.21273 28.3612 28.80276 29.04721 29.08283 29.20719 29.21200 29.95831 30.00622 30.22278 30.29272 30.41281 31.62280 31.69623 31.75625 32.0914 32.15277 32.6211 33.12834 34.44192 34.53197 35.2913 38.14
29.69Reg wide
Avg.Dist.
Science
717 22.33720 23.76716 24.53138 24.77110 24.91278 25.03832 25.89283 25.92276 26.09280 26.23624 26.44284 26.536 26.85
625 26.8612 26.92271 26.93281 26.94721 26.95282 27.00200 27.09272 27.66831 27.97277 28.07197 28.24623 28.40273 28.74719 29.28192 29.82834 29.9314 29.96622 30.0413 31.3111 31.73270 31.79194 33.68
27.94Reg wide
Avg.Dist.
Social Studies
110 22.89717 23.68716 25.45138 26.00271 26.27720 26.54284 26.64277 26.716 27.08
276 27.54832 27.56283 27.63278 27.68624 27.92200 27.94273 28.23282 28.33721 28.88625 29.01281 29.18272 29.47280 29.94831 29.9413 30.36719 30.4612 30.51622 30.56270 30.80623 31.04834 31.39192 31.60197 31.9111 32.6314 32.76194 34.13
29.30Reg wide
30

Table 13. Sr Secondary Average Class Size by Class Type
Avg.Dist.
Special Education
276 2.71270 2.73278 2.75282 4.22277 4.506 5.40
831 5.52717 5.64624 5.70110 5.85832 5.93194 6.29138 6.35283 6.40720 6.68284 6.86721 7.03197 7.24272 7.43625 7.5214 7.65719 7.73281 7.9711 8.11280 8.18192 8.35716 9.0012 9.5313 11.00834 11.63271 12.60
6.71Reg wide
Avg.Dist.
TechnologyEd/Computer
Science
716 13.56717 15.08138 15.15270 16.50194 18.63281 19.06625 20.80278 21.20271 21.82624 23.17622 23.21284 23.36277 23.38280 23.63720 23.65721 23.75276 24.33200 24.39197 24.55719 25.6013 25.82192 26.00282 26.00623 26.72272 26.85110 27.50283 27.6714 28.2712 28.336 30.0011 30.06
23.33Reg wide
Avg.Dist.
Work ExperienceProgram
624 3.9212 4.80834 5.40276 5.50138 9.0013 9.38721 10.00272 10.57284 12.0011 12.87719 13.75716 16.57192 20.40831 21.25110 24.00
10.98Reg wide
Avg.Dist.
World Languages
277 22.06717 22.65281 23.03278 23.52282 23.94138 24.05624 24.16831 24.17110 24.46625 24.596 24.63
284 24.65720 24.70271 24.78832 24.96273 25.26276 25.47623 25.54280 25.7814 25.85622 25.94200 26.30272 26.33283 26.37197 26.58192 27.48270 27.79719 27.79716 28.0013 28.91194 29.1012 29.25721 30.2311 30.91834 33.28
26.15Reg wide
31

Table 14. Sr Secondary Maximum/Minimum Class Size by Class Type
MaxDist.
Art
Min716 24 21721 29 14110 30 7138 30 11272 31 22276 31 14282 31 9284 31 11717 31 12720 31 14200 32 8270 32 11832 32 14271 33 14278 33 15280 33 28283 33 11622 33 12277 34 126 34 1812 35 1713 35 10197 35 23831 35 414 36 20623 36 16624 36 17719 36 16834 36 2011 37 13192 37 14273 37 13281 38 10194 40 2625 42 4
42Reg wide 2
MaxDist.
BusinessEd/Marketing
Min6 22 7717 28 13832 28 14110 29 28271 29 15280 29 8200 30 13716 30 7720 30 6276 31 18192 32 16278 32 14284 32 14624 32 13719 32 22721 32 512 33 17138 33 12273 33 24831 33 2614 34 26272 34 14623 34 20197 35 28281 35 5283 35 13622 35 1313 36 28270 36 21625 36 3194 38 111 40 19277 40 10
40Reg wide 1
MaxDist.
Family & ConsumerScience
Min717 24 12282 27 17720 28 11832 28 13138 29 15276 29 18110 30 16197 30 21280 30 23281 30 196 30 12200 31 25622 31 8272 32 13623 32 26716 32 6719 32 21831 32 1271 33 13273 33 21284 33 27721 33 2014 35 20270 35 1612 37 19192 37 21624 38 8625 39 511 40 17194 40 13
40Reg wide 1
MaxDist.
Health Education
Min138 12 12716 20 11273 28 25110 29 15832 30 24278 32 24282 32 27717 32 22272 33 2112 34 21277 34 15284 34 23624 34 7720 34 26721 34 13280 35 34281 35 9283 35 32623 35 23719 35 23270 36 25271 36 20831 36 36192 37 29197 37 2713 38 36200 38 28622 39 9834 39 37194 41 1625 44 9
44Reg wide 1
MaxDist.
LanguageArts/English
Min276 29 1312 30 19138 31 5284 32 9720 32 5271 33 11272 33 17716 33 15832 33 17273 34 12277 34 136 34 7717 34 9278 35 14280 35 11281 35 9197 36 21200 36 12270 36 11282 36 15624 36 9831 36 2114 37 18192 37 19622 37 16623 37 14719 37 14834 37 18283 38 1013 39 1911 40 22721 40 10110 41 3194 41 8625 41 3
41Reg wide 3
32
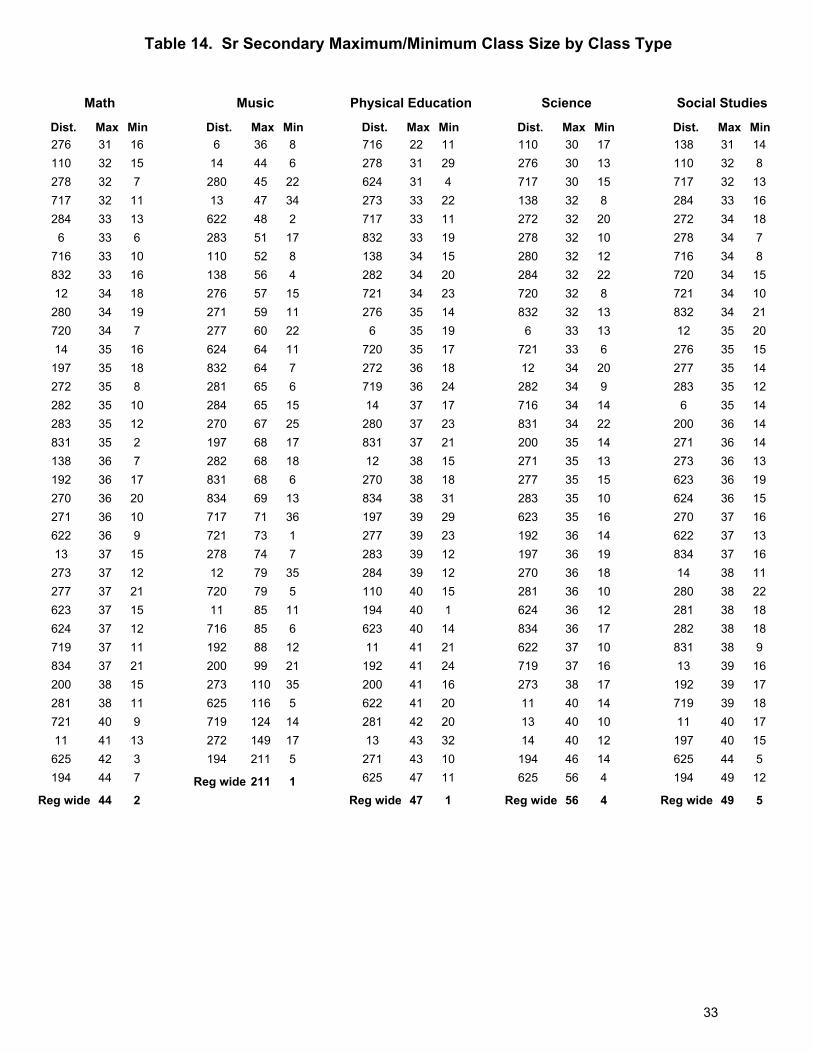
Table 14. Sr Secondary Maximum/Minimum Class Size by Class Type
MaxDist.
Math
Min276 31 16110 32 15278 32 7717 32 11284 33 136 33 6716 33 10832 33 1612 34 18280 34 19720 34 714 35 16197 35 18272 35 8282 35 10283 35 12831 35 2138 36 7192 36 17270 36 20271 36 10622 36 913 37 15273 37 12277 37 21623 37 15624 37 12719 37 11834 37 21200 38 15281 38 11721 40 911 41 13625 42 3194 44 7
44Reg wide 2
MaxDist.
Music
Min6 36 814 44 6280 45 2213 47 34622 48 2283 51 17110 52 8138 56 4276 57 15271 59 11277 60 22624 64 11832 64 7281 65 6284 65 15270 67 25197 68 17282 68 18831 68 6834 69 13717 71 36721 73 1278 74 712 79 35720 79 511 85 11716 85 6192 88 12200 99 21273 110 35625 116 5719 124 14272 149 17194 211 5
211Reg wide 1
MaxDist.
Physical Education
Min716 22 11278 31 29624 31 4273 33 22717 33 11832 33 19138 34 15282 34 20721 34 23276 35 146 35 19720 35 17272 36 18719 36 2414 37 17280 37 23831 37 2112 38 15270 38 18834 38 31197 39 29277 39 23283 39 12284 39 12110 40 15194 40 1623 40 1411 41 21192 41 24200 41 16622 41 20281 42 2013 43 32271 43 10625 47 11
47Reg wide 1
MaxDist.
Science
Min110 30 17276 30 13717 30 15138 32 8272 32 20278 32 10280 32 12284 32 22720 32 8832 32 136 33 13721 33 612 34 20282 34 9716 34 14831 34 22200 35 14271 35 13277 35 15283 35 10623 35 16192 36 14197 36 19270 36 18281 36 10624 36 12834 36 17622 37 10719 37 16273 38 1711 40 1413 40 1014 40 12194 46 14625 56 4
56Reg wide 4
MaxDist.
Social Studies
Min138 31 14110 32 8717 32 13284 33 16272 34 18278 34 7716 34 8720 34 15721 34 10832 34 2112 35 20276 35 15277 35 14283 35 126 35 14200 36 14271 36 14273 36 13623 36 19624 36 15270 37 16622 37 13834 37 1614 38 11280 38 22281 38 18282 38 18831 38 913 39 16192 39 17719 39 1811 40 17197 40 15625 44 5194 49 12
49Reg wide 5
33

Table 14. Sr Secondary Maximum/Minimum Class Size by Class Type
MaxDist.
Special Education
Min282 6 3277 8 1278 8 1270 9 16 9 3716 9 9276 10 1138 12 1192 13 4194 13 1197 13 1832 13 1720 15 1831 15 1110 16 1283 16 2272 17 3717 17 114 18 1280 18 3284 18 111 19 1721 19 1625 20 112 22 213 22 3271 23 10281 28 1719 28 1834 34 1624 37 1
37Reg wide 1
MaxDist.
TechnologyEd/Computer
ScienceMin
716 23 7278 25 16717 25 5138 26 2110 28 27277 28 14721 28 16719 29 19194 30 1280 30 15284 30 9192 31 9197 31 15200 31 15270 31 6281 31 5271 32 10272 32 20282 32 176 32 28622 32 14720 32 1413 33 15623 33 10276 34 12283 34 21624 34 1312 35 2114 35 2311 37 14625 39 3
39Reg wide 1
MaxDist.
Work ExperienceProgram
Min276 7 4834 8 212 9 2138 9 9624 9 1284 12 12721 14 613 21 1716 22 8110 24 24831 24 20272 25 5719 31 311 32 1192 37 10
37Reg wide 1
MaxDist.
World Languages
Min110 29 19278 31 6282 31 7276 32 11717 32 12720 32 17832 32 1814 33 14284 33 12277 34 106 34 17138 35 11272 35 8273 35 10280 35 10716 35 1013 36 14200 36 16270 36 20623 36 9624 36 6719 36 19831 36 112 37 18192 37 12197 37 13721 37 21281 38 5283 38 10622 38 11271 39 1211 40 13194 40 1834 40 19625 42 5
42Reg wide 1
34

APPENDIX
35

36 PARTICIPATING DISTRICTS
Alphabetical Listing District Number Listing 11 Anoka-Hennepin 6 South St. Paul 716 Belle Plaine 11 Anoka-Hennepin 271 Bloomington 12 Centennial 12 Centennial 13 Columbia Heights 13 Columbia Heights 14 Fridley 272 Eden Prairie 15 St. Francis 273 Edina 110 Waconia 192 Farmington 138 North Branch 831 Forest Lake 192 Farmington 14 Fridley 194 Lakeville 200 Hastings 197 West St. Paul 270 Hopkins 200 Hastings 717 Jordan 270 Hopkins 194 Lakeville 271 Bloomington 832 Mahtomedi 272 Eden Prairie 276 Minnetonka 273 Edina 721 New Prague 276 Minnetonka 138 North Branch 277 Westonka 622 North St. Paul-Maplewood-Oakdale 278 Orono 278 Orono 280 Richfield 719 Prior Lake-Savage 281 Robbinsdale 280 Richfield 282 St. Anthony-New Brighton 281 Robbinsdale 283 St. Louis Park 623 Roseville 284 Wayzata 720 Shakopee 622 North St. Paul-Maplewood-Oakdale 6 South St. Paul 623 Roseville 282 St. Anthony-New Brighton 624 White Bear Lake 15 St. Francis 625 St. Paul 283 St. Louis Park 716 Belle Plaine 625 St. Paul 717 Jordan 834 Stillwater 719 Prior Lake-Savage 110 Waconia 720 Shakopee 284 Wayzata 721 New Prague 197 West St. Paul 831 Forest Lake 277 Westonka 832 Mahtomedi 624 White Bear Lake 834 Stillwater
36

DATE: October 13, 2014 TO: Class Size Study District Contact Persons FROM: Julie Schaal, Class Size Study Coordinator
Cathy Macdonald, Metro ECSU Director of Operations RE: Directions for the Annual Class Size Study 2014-15 Metro ECSU is again collecting school district data for the 7-county metro area Class Size Study. This study will give districts a point of comparison for class size across the metro area for the 2014-2015 school year. Metro ECSU would greatly appreciate your help in collecting the data for this study. All districts that submit data will receive a copy of the Metro ECSU Class Size Study when it is released. Class Size Reported as of October 1, 2014: Class size data should reflect class sizes as of October 1, 2014. Please do not update your data to reflect changes made after October 1. It is important that all districts report data from the same time period. Reporting Format: Please find enclosed three different Excel spreadsheets for data reporting. Each file is designed for one school level as follows.
• Elementary (K – 6) • Junior Secondary, Middle School, or First Part of Six-Year Secondary • Senior Secondary or Second Part of Six-Year Secondary
Each entry in Excel consists of: District Number, Class Type (elementary grades or secondary subjects), Number of Classes and Class Size. These are called fields. Each file contains a data entry sample and a list of acceptable values for the Class Type field. Note that the Class Type field has a pop-up list of values from which to choose (click on the up/down arrows); you do not have to type them. If your school does not have a particular Class Type, do not list the Class Type or enter any data. For example, if your junior secondary school does not offer world languages, skip world languages. Example: Suppose St. Paul Public Schools (district 625) had the following English classes in a middle school: one class of 18, four classes of 22, and twelve classes of 24.
• Use the Junior Secondary Excel Spreadsheet. • Enter three lines of data, as follows.
District Class Type # Classes Class Size 625 English 1 18 625 English 4 22 625 English 12 24
Metro ECSU 2 Pine Tree Drive, Suite 101
Arden Hills, MN 55112
www.metroecsu.org 612-638-1500
37

Mode of Collection: If data is compiled at the district level (as is often the case in smaller districts), use one of each of the three Excel files to record the data. If data is collected from a number of building level contacts, please distribute the appropriate Excel file(s) to each school. Also include a copy of this memo. Instruct building contacts to respond in a timely fashion—we suggest that you give them a due date of November 14, 2014. Data is due to Metro ECSU by November 21, 2014. Once the data from each building is collected, please aggregate the data for the district into your three different Excel files (elementary, jr. secondary and sr. secondary). Please send only the three district aggregate data files (along with any comments) to Metro ECSU. Aggregate the data by copying the individual buildings’ data into your three Excel files. For example, when you receive files from junior secondary schools, proceed as follows.
1. Open your empty district Jr Secondary file. 2. Open the first building’s Jr Secondary file. 3. Review the building contact’s data entry and make corrections if necessary. 4. Select all of the data entered in columns A-D (not including the titles in row A). 5. Switch to your district Jr Secondary file. 6. Click in the first empty cell in column A and paste in the data that you just copied. 7. Open the next building’s Jr Secondary file. 8. Repeat steps 3-7 until you have copied all of the Jr Secondary files into the district file. 9. Save your district Jr Secondary file.
Do not commingle elementary, junior secondary or senior secondary data. Keep each type of data in its respective Excel file. DEADLINE: Submit your data to Metro ECSU by November 21, 2014. Make sure that you include your contact information in the space provided in the Excel files so that we know who to contact with questions about the data. If you do not submit your data by November 21, we cannot guarantee that it will be included in the study. All districts that submit data will receive a copy of the Metro ECSU Class Size Study when it is released in February. If you have any questions, please contact Julie Schaal, Class Size Study Coordinator, at [email protected] or 612-638-1540. Thank you for your cooperation and assistance.
38

Guidance for Special Cases Submitting Data for the Metro ECSU Class Size Study
What is NOT in this Study The Metro ECSU Class Size Study does not attempt to include all possible class types. Rather, it is a snapshot of class size types most frequently offered at each grade level across the metro Twin Cities public schools. Examples of Class Types not collected in this study are given below:
• Alternative Learning Programs • ELL Classes • Independent Reading Classes • College Readiness Classes (e.g. AVID) • Independent Study
Please do not include data for these classes and others not listed in the Excel files because they are currently beyond the scope of this study. Class Type Options Provide class size information for the Class Types listed in the drop down menu only. Metro ECSU does not attempt to include all possible Class Types. Do not include any extra classes at the Elementary level such as Gym, Art or Music. If your school does not have a particular Class Type, do not list the Class Type or enter any data. For example, if your junior secondary school does not offer world languages, skip world languages. Combo or Ungraded (elementary) Include classes that combine grade levels (combo) or arrange classes by student achievement level (ungraded). Interdisciplinary (secondary level) Include classes that combine 2 or more subject areas (class types) at the secondary level. This is for entire courses, not just units of study. Multiple Teachers per Group
In situations where there are two or more certified teachers assigned to a section or group of students, this should be reported as if there were multiple sections of the class with one teacher each. It would be assumed that teachers share essentially equal student “loads.” Examples:
• 2 certified teachers/41 students: Report as 1 class of 20 and 1 class of 21 • 4 certified teachers/101 students: Report as 3 classes of 25 and 1 class of 26 • 4 certified teachers + 1 half-time teacher/104 students: Report as 4 classes of 23 and 1 class
of 12 (allows for the half-time person to have half the # of students) 4n + .5n = 104 n = # students for full time teacher Keep in mind some rounding may be needed to maintain # students (n) as whole numbers.
39
Special Education (all levels) Special education students should be counted with the general education class to which they are assigned. Students in special education classes are counted separately if they are comprised only of special education students who spend the majority of their time in that class. Additional Considerations If circumstances exist which make the reporting of your school’s/district’s data in this format not comparable to other reported data, please attach a “Comment” sheet to explain the circumstances. If you have any questions, please contact Julie Schaal, Class Size Study Coordinator, at [email protected] or 612-638-1540. Thank you for your cooperation and assistance.
JS 10/13/14
40

District Nbr Class Type
Nbr Classes
Class Size Class Type Values
K1 District Nbr Class Type Nbr Classes Class Size2 625 K 2 173 625 1 1 194 625 1 2 215 625 2 2 206 625 2 1 21
Combo or Ungraded 625 2 1 23Special Education 625 3 1 23
625 3 3 22625 4 2 28625 5 1 26625 6 1 29625 Combo or Ungraded 1 18625 Special Education 2 8
Please enter your contact informationContact Person NamePositionSchool (or District Office)PhoneEmail
Elementary Example Table
Etc.
41

District Nbr Class Type
Nbr Classes
Class Size
Class Type Values
ArtBusiness Ed/Marketing District Nbr Class Type Nbr Classes Class SizeFamily & Consumer Science 625 Art 2 18Health Education 625 Language Arts/English 2 17Interdisciplinary Courses 625 Language Arts/English 1 25Language Arts/English 625 World Languages 1 29Math 625 Family & Consumer Science 2 20Music 625 Family & Consumer Science 1 23Physical Education 625 Technology Ed/Computer Science 1 24Science 625 Interdisciplinary Courses 2 28Social Studies 625 Math 1 29Special Education 625 Math 4 25Technology Ed/Computer Science 625 Physical Education 2 30World Languages 625 Science 1 27
625 Science 3 28625 Social Studies 2 21625 Social Studies 3 24625 Special Education 1 11625 Special Education 3 10625 Business Ed/Marketing 1 21Etc.
Please enter your contact informationContact Person NamePositionSchool (or District Office)PhoneEmail
Jr Secondary Example Table
42

District Nbr Class Type
Nbr Classes
Class Size
Class Type Values
ArtBusiness Ed/Marketing District Nbr Class Type Nbr Classes Class SizeFamily & Consumer Science 625 Art 2 18Health Education 625 Business Ed/Marketing 2 17Language Arts/English 625 Business Ed/Marketing 1 19Math 625 Language Arts/English 2 20Music 625 Language Arts/English 2 24Physical Education 625 Language Arts/English 1 25Science 625 Family & Consumer Science 2 28Social Studies 625 Family & Consumer Science 1 24Special Education 625 Technology Ed/Computer Science 1 26Technology Ed/Computer Science 625 Technology Ed/Computer Science 3 25Work Experience Program 625 Math 2 30World Languages 625 Physical Education 4 28
625 Science 2 21625 Social Studies 1 21625 Social Studies 3 24625 Special Education 4 10625 Work Experience Program 4 25625 World Languages 2 16
Contact Person NamePositionSchool (or District Office)PhoneEmail
Sr Secondary Example Table
Etc.
Please enter your contact information
43