Annual Budget - leegov.com Budgets/Budget Book...Elections prepare budgets for their general funds...
182
Annual Budget
Transcript of Annual Budget - leegov.com Budgets/Budget Book...Elections prepare budgets for their general funds...

Annual Budget

2

TABLE OF CONTENTS
SECTION A - INTRODUCTION ..................................................................................................................................... 3
SECTION B - BUDGET SUMMARY ............................................................................................................................ 19
SECTION C – FINANCIAL POLICY ............................................................................................................................. 69
SECTION D - SERVICES BY ORGANIZATION .......................................................................................................... 75
SECTION E – CAPITAL IMPROVEMENT PROGRAM / LONG-TERM DEBT ............................................................. 99
SECTION F - BUDGET BY FUNCTION..................................................................................................................... 133
SECTION G - APPENDICES .................................................................................................................................... 171
3

4
Adopted Budget Fiscal Year 2017-2018
LEE COUNTY COMMISSION
JOHN E. MANNING, District One
CECIL PENDERGRASS, District Two
LARRY KIKER, District Three
BRIAN HAMMAN, District Four
FRANKLIN MANN, District Five
COUNTY ADMINISTRATION
ROGER DESJARLAIS, County Manager
CHRISTINE BRADY, Assistant County Manager
DAVE HARNER, Assistant County Manager
DOUG MEURER, Assistant County Manager
GLEN SALYER, Assistant County Manager
PETE WINTON, Assistant County Manager/ CFO
FY2017-18 Budget Book
Prepared by Office of Management and Budget
5

LEE COUNTY BOARD OF COUNTY COMMISSIONERS
County Manager
Roger Desjarlais
Hearing Examiner
Donna Marie Collins
County Attorney
Richard Wesch
Office of
Communications
Betsy Clayton
Assistant County Manager/CFO
Pete Winton
Assistant County Manager
Christine Brady
Human & Veteran
Services
Human Resources
Public Safety
Procurement
Assistant County Manager
Dave HarnerAssistant County Manager
Glen Salyer
Technology Services
(CIO)
Library System
Office of Mgmt & Budget
County Lands
Assistant County Manager
Douglas Meurer
Transportation
Community
Development
Fleet Management
Public Utilities
Solid Waste
Utilities
Economic
Development
Parks & Recreation
Animal Services
Transit
(LeeTran)
Natural Resources
Facilities Construction
& Management
Sports Development
Organizational
Performance
Visitor & Convention
Bureau
Risk Management
Updated
October 2017
Legislative /
Intergovernmental
Talent
Development
6

PHONE
NUMBER
PHONE
NUMBERJohn Manning, District One 239-533-2224 County Attorney Richard Wm. Wesch 239-533-2236
Cecil Pendergrass, District Two 239-533-2227 Hearing Examiner Donna Marie Collins 239-533-8100
Larry Kiker, District Three 239-533-2223
Brian Hamman, District Four 239-533-2226
Frank Mann, District Five 239-533-2225
DIRECTORPHONE
NUMBERDIRECTOR
PHONE
NUMBER
Roger J. Desjarlais 239-533-2221 Christine Brady 239-533-2221
Communications Betsy Clayton 239-533-2221 Human Resources Vacant 239-533-2245
Human Services Roger Mercado 239-533-7930
Pete Winton 239-533-2221 Library System Mindi Simon 239-533-4830
County Lands Glen Salyer, Interim 239-533-2221 Procurement Mary Tucker 239-533-5450
Budget Vacant 239-533-2221 Public Safety (Interim) Ben Abes, Lee Mayfield 239-533-3911
Risk Management Mike Figueroa 239-533-2221 Technology Services Andrew Hunter 239-533-2210
Veterans Services Roger Mercado 239-533-7930
Doug Meurer 239-533-2221
Community Development Dave Loveland 239-533-8585 Dave Harner 239-533-2221
Fleet Services Brad Wright, Interim 239-533-5339 Animal Services Mack Young 239-533-7387
Solid Waste Keith Howard 239-533-8000 Facilities Construction & Design Ehab Guirguis 239-533-8505
Utilities Pam Keyes 239-533-8845 LeeTran (Transit) Steve Myers 239-533-8726
Transportation Randy Cerchie 239-533-8580 Natural Resources Roland Ottolini 239-533-8109
Parks & Recreation Jesse Lavender 239-533-7275
Glen Salyer 239-533-2221 Sports Development Jeff Mielke 239-533-5273
Economic Development Pamela Johnson 239-338-3161
Visitor & Convention Bureau Tamara Pigott 239-338-3500
PHONE
NUMBER
239-533-5000
239-533-8683
239-533-6100
239-533-6000
239-277-5020 239-949-6262
239-334-1102 239-574-0401
239-477-1000 239-321-7000
239-533-9197 239-472-3700
239-533-2911 239-765-0202
239-533-1000 239-390-8000
DIRECTORY
County Commissioners
State Attorney
Tax Collector
District 21 Medical Examiner
School District
Sheriff
Public Defender
Clerk of Circuit Court
Supervisor of Elections
Property Appraiser
City of Cape Coral
City of Fort Myers
City of Sanibel
OFFICE
PHONE
NUMBER
OFFICE
County Manager
Chief Financial Officer
Village of Estero
OTHER PUBLIC OFFICES
TOWNS & CITIES
Twentieth Judicial Circuit
Town of Ft. Myers Beach
City of Bonita Springs
Assistant County Manager
Assistant County Manager
Assistant County Manager
Assistant County Manager
7
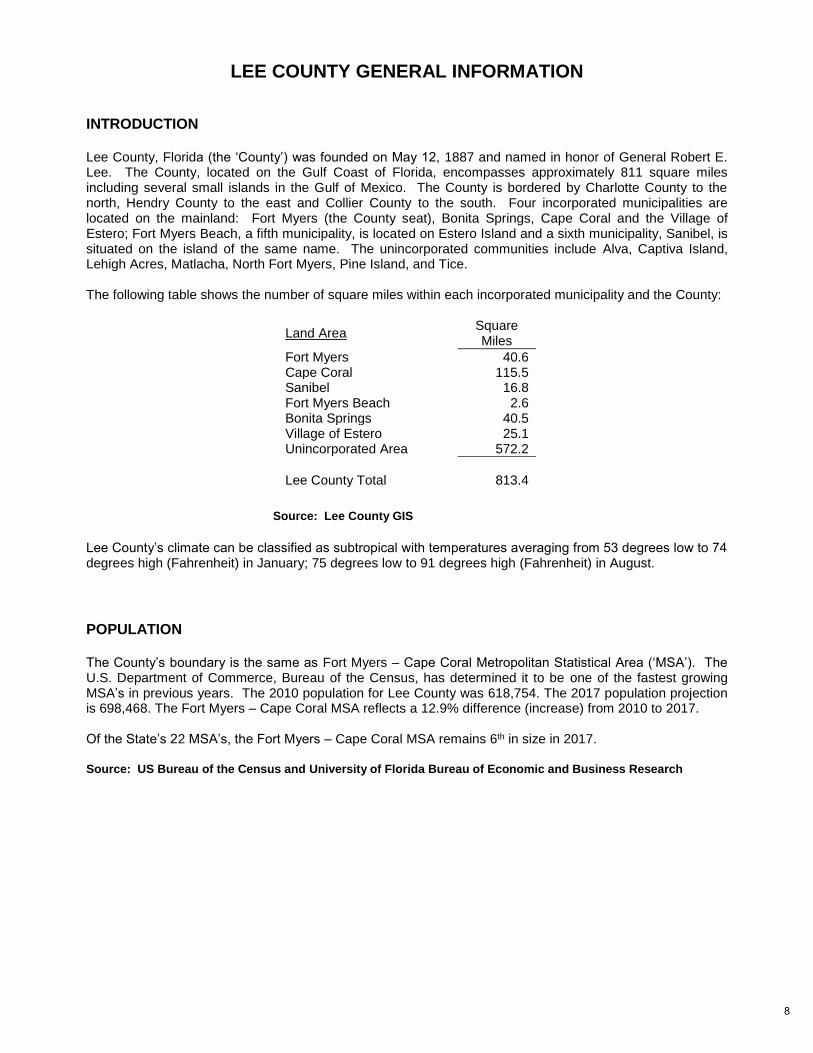
LEE COUNTY GENERAL INFORMATION
INTRODUCTION Lee County, Florida (the ‘County’) was founded on May 12, 1887 and named in honor of General Robert E. Lee. The County, located on the Gulf Coast of Florida, encompasses approximately 811 square miles including several small islands in the Gulf of Mexico. The County is bordered by Charlotte County to the north, Hendry County to the east and Collier County to the south. Four incorporated municipalities are located on the mainland: Fort Myers (the County seat), Bonita Springs, Cape Coral and the Village of Estero; Fort Myers Beach, a fifth municipality, is located on Estero Island and a sixth municipality, Sanibel, is situated on the island of the same name. The unincorporated communities include Alva, Captiva Island, Lehigh Acres, Matlacha, North Fort Myers, Pine Island, and Tice. The following table shows the number of square miles within each incorporated municipality and the County:
Land Area Square Miles
Fort Myers 40.6 Cape Coral 115.5 Sanibel 16.8 Fort Myers Beach 2.6 Bonita Springs 40.5 Village of Estero 25.1 Unincorporated Area 572.2
Lee County Total 813.4
Source: Lee County GIS
Lee County’s climate can be classified as subtropical with temperatures averaging from 53 degrees low to 74 degrees high (Fahrenheit) in January; 75 degrees low to 91 degrees high (Fahrenheit) in August.
POPULATION The County’s boundary is the same as Fort Myers – Cape Coral Metropolitan Statistical Area (‘MSA’). The U.S. Department of Commerce, Bureau of the Census, has determined it to be one of the fastest growing MSA’s in previous years. The 2010 population for Lee County was 618,754. The 2017 population projection is 698,468. The Fort Myers – Cape Coral MSA reflects a 12.9% difference (increase) from 2010 to 2017. Of the State’s 22 MSA’s, the Fort Myers – Cape Coral MSA remains 6th in size in 2017.
Source: US Bureau of the Census and University of Florida Bureau of Economic and Business Research
8

LEE COUNTY GOVERNMENT
Lee County, Florida, is a political subdivision of the State of Florida governed by the State Constitution and general laws of the State of Florida. It became a Charter County upon the enactment of its County Charter approved by the voters on November 5th, 1996 and effective as of January 1st, 1997. The five-member Board of County Commissioners (the ‘Board’) is the legislative and governing body of the County. Each County Commissioner is elected at large for a four-year-term of office, and each Commissioner represents and resides in one of the five Commission Districts. The Board elects a Chairman who serves as its presiding officer. The County Manager, County Attorney and the Hearing Examiner report to the County Commissioners. The County Manager is the chief executive officer of the County and is appointed by and serves under contract to the Board. This official is responsible to the Board for administration and operations of County Administration, and 24 operating departments, divisions and offices: Animal Services, Communications, Community Development, County Lands, Economic Development, Facilities Construction & Management, Fleet Management, Human Resources, Human Services, Library System, Management and Budget, Natural Resources, Parks & Recreation, Procurement, Public Safety, Risk Management, Solid Waste, Sports Development, Technology Services, Transit (LeeTran), Transportation, Utilities, Veteran Services, and the Visitor and Convention Bureau. The County Manager is responsible to the Board for the execution of all Board policies. The Clerk of the Circuit Court is ex-officio Clerk of the board and auditor, recorder and custodian of all County funds. The Clerk administers the County’s fiscal activities on behalf of the Board. The Clerk of the Circuit Court, the Property Appraiser, the Sheriff, the Supervisor of Elections and the Tax Collector are separate, elected constitutional offices in the State of Florida. The budgets of the Property Appraiser and the Tax Collector are submitted directly to the State of Florida Department of Revenue for approval. The Clerk of Circuit Court (to the extent of the function as ex-officio Clerk to the Board and amounts above the fee structure as Clerk to the Circuit and County Courts), Sheriff, and Supervisor of Elections prepare budgets for their general funds which are submitted to and approved by the Board.
9
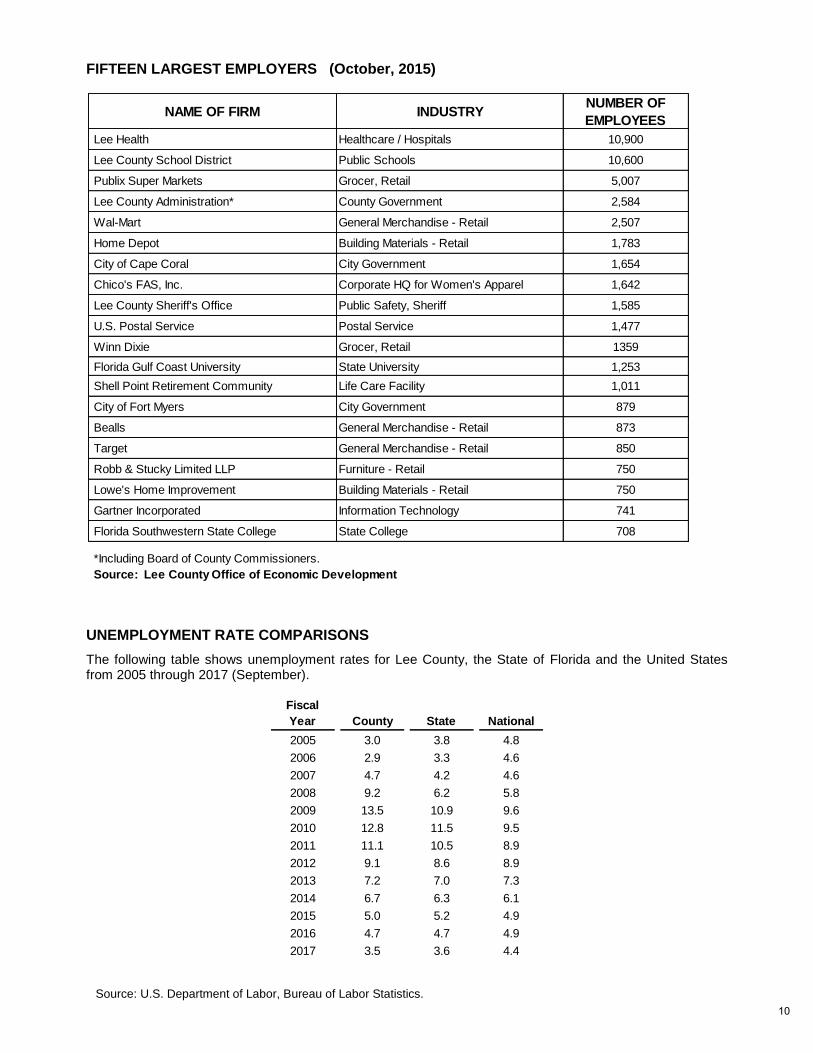
FIFTEEN LARGEST EMPLOYERS (October, 2015)
UNEMPLOYMENT RATE COMPARISONS
The following table shows unemployment rates for Lee County, the State of Florida and the United States from 2005 through 2017 (September).
Source: U.S. Department of Labor, Bureau of Labor Statistics.
NAME OF FIRM INDUSTRYNUMBER OF
EMPLOYEES
Lee Health Healthcare / Hospitals 10,900
Lee County School District Public Schools 10,600
Publix Super Markets Grocer, Retail 5,007
Lee County Administration* County Government 2,584
Wal-Mart General Merchandise - Retail 2,507
Home Depot Building Materials - Retail 1,783
City of Cape Coral City Government 1,654
Chico's FAS, Inc. Corporate HQ for Women's Apparel 1,642
Lee County Sheriff's Office Public Safety, Sheriff 1,585
U.S. Postal Service Postal Service 1,477
Winn Dixie Grocer, Retail 1359
Florida Gulf Coast University State University 1,253
Shell Point Retirement Community Life Care Facility 1,011
City of Fort Myers City Government 879
Bealls General Merchandise - Retail 873
Target General Merchandise - Retail 850
Robb & Stucky Limited LLP Furniture - Retail 750
Lowe's Home Improvement Building Materials - Retail 750
Gartner Incorporated Information Technology 741
Florida Southwestern State College State College 708
*Including Board of County Commissioners.
Source: Lee County Office of Economic Development
Fiscal
Year County State National
2005 3.0 3.8 4.8
2006 2.9 3.3 4.6
2007 4.7 4.2 4.6
2008 9.2 6.2 5.8
2009 13.5 10.9 9.6
2010 12.8 11.5 9.5
2011 11.1 10.5 8.9
2012 9.1 8.6 8.9
2013 7.2 7.0 7.3
2014 6.7 6.3 6.1
2015 5.0 5.2 4.9
2016 4.7 4.7 4.9
2017 3.5 3.6 4.4
10
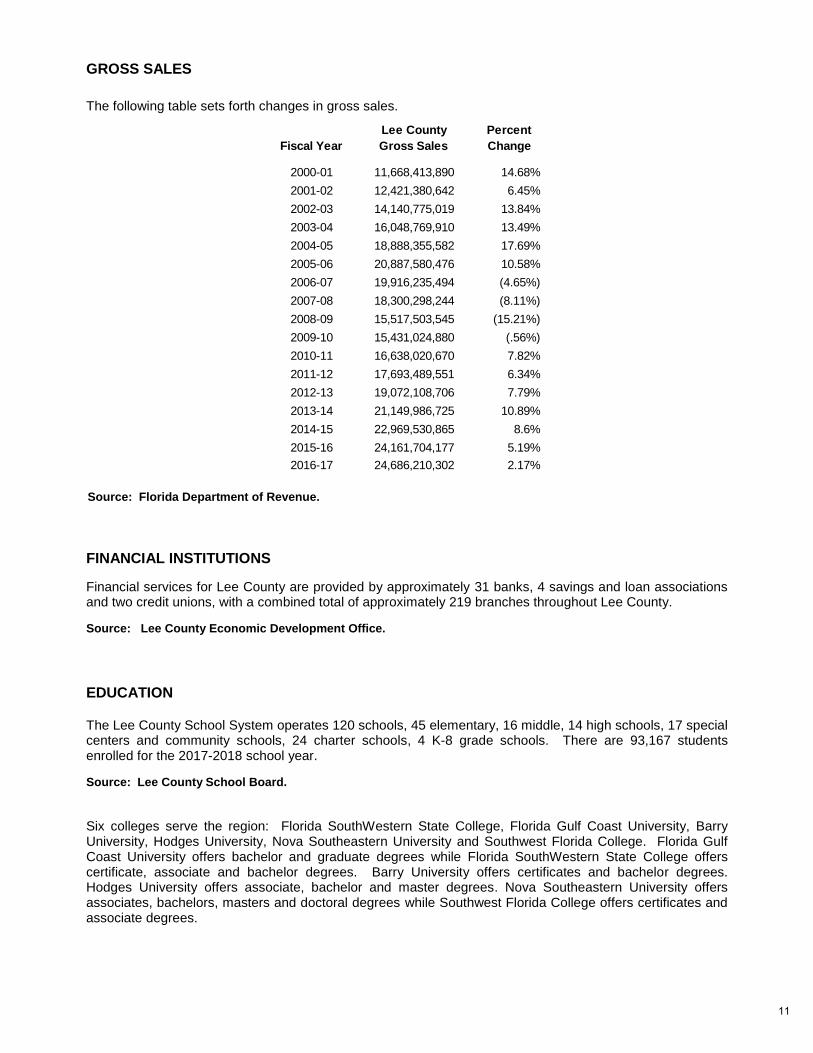
GROSS SALES
The following table sets forth changes in gross sales.
Source: Florida Department of Revenue.
FINANCIAL INSTITUTIONS
Financial services for Lee County are provided by approximately 31 banks, 4 savings and loan associations and two credit unions, with a combined total of approximately 219 branches throughout Lee County.
Source: Lee County Economic Development Office.
EDUCATION
The Lee County School System operates 120 schools, 45 elementary, 16 middle, 14 high schools, 17 special centers and community schools, 24 charter schools, 4 K-8 grade schools. There are 93,167 students enrolled for the 2017-2018 school year. Source: Lee County School Board.
Six colleges serve the region: Florida SouthWestern State College, Florida Gulf Coast University, Barry University, Hodges University, Nova Southeastern University and Southwest Florida College. Florida Gulf Coast University offers bachelor and graduate degrees while Florida SouthWestern State College offers certificate, associate and bachelor degrees. Barry University offers certificates and bachelor degrees. Hodges University offers associate, bachelor and master degrees. Nova Southeastern University offers associates, bachelors, masters and doctoral degrees while Southwest Florida College offers certificates and associate degrees.
Fiscal Year
Lee County
Gross Sales
Percent
Change
2000-01 11,668,413,890 14.68%
2001-02 12,421,380,642 6.45%
2002-03 14,140,775,019 13.84%
2003-04 16,048,769,910 13.49%
2004-05 18,888,355,582 17.69%
2005-06 20,887,580,476 10.58%
2006-07 19,916,235,494 (4.65%)
2007-08 18,300,298,244 (8.11%)
2008-09 15,517,503,545 (15.21%)
2009-10 15,431,024,880 (.56%)
2010-11 16,638,020,670 7.82%
2011-12 17,693,489,551 6.34%
2012-13 19,072,108,706 7.79%
2013-14 21,149,986,725 10.89%
2014-15 22,969,530,865 8.6%
2015-16 24,161,704,177 5.19%
2016-17 24,686,210,302 2.17%
11

TRANSPORTATION
Highways Interstate 75 is presently the principal north-south highway running from the Canadian border at Sault Ste. Marie, Michigan to Miami, Florida, on the east coast of Florida. In Lee County, Interstate 75 is presently being expanded from four to six lanes in both directions. Completion of the $17.3 million project is expected in the fall of 2015. U.S. Highway 41, also a north-south highway, is a limited-access four-lane road for most of the distance between Bradenton to the north and Naples to the south, connecting the Fort Myers Standard Metropolitan Statistical Area (SMSA) with Tampa to the north and Miami via the route of the Tamiami Trail. State Road 80 connects with U.S. Highway 27 in the central part of the State, providing additional access to the Orlando/Central Florida area and the east coast from Palm Beach, north.
Bus Service Greyhound Bus Lines with a terminal in Fort Myers offers daily scheduled service for nationwide thru-line and charter service. Local bus service is provided by Lee Tran, a transit system operated by the County.
Truck Line Approximately thirty (30) interstate and intrastate truck lines serve Lee County. Source: Business Development Corporation.
Rail Transportation Rail transportation, for both freight and passenger excursions, is provided by Seminole Gulf Railway. The rail line is approximately ninety miles long and connects Lee County with the national rail system in Arcadia. Seminole Gulf provides connecting truck distribution services to off-rail system accounts.
Source: Seminole Gulf Railway.
Airports There are two airports in the County: The Southwest Florida International Airport and Page Field General Aviation Airport. The Page Field General Aviation Airport is situated on a 670-acre site in Fort Myers. On September 9, 2005 the new Southwest Florida Midfield Terminal (RSW) opened. The Midfield Terminal Complex, (located on the opposite side of the runway from the former facility which had been in operation since 1983) includes a three-story terminal building with 28 aircraft gates on three concourses; a 3,800 space parking structure and 9,800 public surface parking spaces; a 12,000-foot parallel taxiway and connecting taxiways to the new aircraft parking apron access roads, including a two-level terminal circulation roadway system; an airline cargo building and expanded rental car facilities. The area is designated a Foreign Trade Zone and is centrally located between the cities of Tampa and Miami with easy access via Interstate 75. The former airport terminal was demolished and the area is being developed for airport related uses. On August 31, 2011, a new general aviation terminal opened on the west side of Page Field. The 22,613 square-foot terminal building included first-class services and amenities for passengers and crews, executive conference room, seminar facility, easy access from runways with anew parallel taxiway, a new 24,000 square-foot itinerant aircraft hanger and 600,000 square-feet of ramp space with exclusive business aircraft parking. Page Field also has Foreign Trade Zone designation.
12

WATER TRANSPORTATION Florida’s fifth largest deep-water port is located at Boca Grande on Charlotte Harbor in the northeast section of the County. The port is 32 feet deep and approximately 200 feet in width. The Okeechobee Waterway provides a navigable link between the Gulf of Mexico and the Atlantic Ocean via the Caloosahatchee River, Lake Okeechobee and the St. Lucie Canal.
HEALTH CARE FACILITIES
There are several health care facilities in Lee County under the Lee Health. Lee Health includes HealthPark Medical Center, Gulf Coast Medical Center, Lee Memorial Hospital, Cape Coral Hospital, Golisano Children’s Hospital of Southwest Florida and the Rehabilitation Hospital.
Source: Economic Development Office of Lee County
RECREATION FACILITIES There are numerous parks in Lee County as well as a Nature Center and Children’s Museum. Also included are the “Ding” Darling Wildlife Sanctuary, country clubs, auditoriums, Thomas Edison’s and Henry Ford’s homes. All are open to the public. Included among the 101 county park facilities in the area are the following:
Source: Lee County Parks and Recreation.
PUBLIC LODGING As of October 2015, there were 193 licensed accounts for hotels and motels. Figures from October, 2015 revealed that there were 28,182 room nights available per day among hotels, motels, condominiums, interval owners, mobile homes, private residences, RV Parks and units marked through rental agents.
Source: Lee County Tourist Development Tax Audit Department
COMMUNICATION
There are 20 newspapers and 15 magazines servicing the Lee County area as well as 50 radio stations and 8 television broadcast facilities, and telephone service is provided by Century Link and numerous cellular service companies. Cable television is provided by Xfinity.
Source: Lee County Office of Economic Development
Regional parks (including 12 beach parks and 4 sports complexes) 35
Community parks (including 12 recreation centers or community centers) 32
Large boat ramps 7
School shared park sites 17
Pools 9
Civic Center 1
Total 101
13

USER’S GUIDE
FORMAT OF BUDGET DOCUMENT
The annual budget has been prepared using a core services approach as adopted by the Board of County Commissioners during the FY94-95 budget year. The format of this budget document goes beyond that of a public information document. The budget process is designed to generate discussion regarding policy issues, service delivery, and performance issues by the Board of County Commissioners and management during the preparation, review, and subsequent adoption of the County budget. Services by Organization, is the focal point of the budget review process and is described below, along with the other components of the budget. As an aid to using this document, an explanation of the data format and headings has been included within the appropriate pages of each section. Due to the manner in which a detailed document is used (generally
for reference), some of the descriptions are repeated in each section.
BUDGET MESSAGE (page 17)
The budget message summarizes the major issues facing Lee County from both budgetary and managerial perspectives.
BUDGET SUMMARY INFORMATION (page 19)
In addition to comparisons between the FY16-17 and FY17-18 budgets, this section contains charts and graphs illustrating property tax revenues, expenditures, and Lee County demography.
FINANCIAL POLICIES (page 69)
This section contains the County's revenue, appropriation, and general budget policies which are the framework upon which the budget is built.
SERVICES BY ORGANIZATION (page 75)
Each area is comprised of: 1) an expenditure history by division for Actual FY15-16, Unaudited Actual FY16-17, and Adopted Budget for FY17-18 and; 2) service information by division. The purpose of this section is to provide a brief description of services provided by Lee County Government.
CAPITAL IMPROVEMENT PROGRAM (page 99)
The Capital Improvement Program represents a five-year plan designed to meet the capital improvement needs of Lee County. Capital improvements include major infrastructure facilities such as roads, bridges, parks, libraries, utilities, and general governmental facilities. This section of the budget document provides information regarding the planning process which led to the development of the Capital Improvement Program. Revenue sources which fund capital construction are
presented, along with capital project expenditures by department.
14
BUDGET BY FUNCTION (page 133)
This section provides a three-year comparative history to show the county budget by function. Function identifies areas of expenditure as related to the principal purpose for which expenditures are made. Functions are categorized in a uniform manner throughout the State of Florida based on the State Chart of Accounts (SCOA). The SCOA defines classifications and categories by which all revenues and expenditures are to be delineated.
The pages following the Budget by Function detail the activities within functional categories.
APPENDICES (page 171)
This section provides an explanation of fund structure and budgetary accounting policy, the budget calendar, and the glossary.
15

16

17

18

BUDGET SUMMARY
TABLE OF CONTENTS
PROGRAM BUDGET SUMMARY TOTAL COMPARISON ......................................................................................... 20
BUDGET SUMMARY ................................................................................................................................................... 21
ACTUAL/ESTIMATED/ADOPTED BUDGET SUMMARY COMPARISON................................................................... 22
REVENUES & EXPENDITURES DISCUSSION .......................................................................................................... 23
LEE COUNTY POPULATION 2006 THROUGH 2017 ................................................................................................. 28
LEE COUNTY POPULATION PROFILE ...................................................................................................................... 29
REVENUES BY CATEGORY ALL SOURCES ............................................................................................................ 30
EXPENDITURES BY FUNCTION ALL USES .............................................................................................................. 32
EXPENDITURES BY FUND GROUP ALL USES ........................................................................................................ 34
EXPENDITURES PER CAPITA FY07-08 THROUGH FY17-18 .................................................................................. 35
GENERAL FUND REVENUE BY CATEGORY ............................................................................................................ 36
GENERAL FUND EXPENDITURES BY CATEGORY ................................................................................................. 37
OPERATING EXPENSES............................................................................................................................................ 38
OPERATING BUDGETS BY DEPARTMENTS UNDER THE BOARD OF COUNTY COMMISSIONERS .................. 39
OPERATING BUDGETS FOR COURTS AND CONSTITUTIONAL OFFICERS ......................................................... 40
DEBT SERVICE ........................................................................................................................................................... 42
TAXABLE PROPERTY VALUES FY90-91 THROUGH FY17-18 ................................................................................. 44
TAXABLE PROPERTY VALUE INCREASES/DECREASES ....................................................................................... 45
FY17-18 DISTRIBUTION OF TAXABLE VALUE IN CITIES AND UNINCORPORATED LEE COUNTY .................... 46
PROPERTY TAX RATES FY08-09 THROUGH FY17-18 ............................................................................................ 47
MAJOR PROPERTY TAX REVENUES FY12-13 THROUGH FY17-18 ....................................................................... 48
ELEVEN-YEAR AD VALOREM MILLAGE SUMMARY ................................................................................................ 49
FY17-18 PROPERTY TAXES DISTRIBUTION BY CATEGORY ................................................................................. 51
COMPARATIVE SAMPLE OF TAX BILLS ................................................................................................................... 52
STATE SHARED REVENUES FY10-11 THROUGH FY17-18 .................................................................................... 54
LEE COUNTY GAS TAX REVENUES FY10-11 THROUGH FY17-18 ........................................................................ 55
FY16-17 GRANTS ADMINISTERED THROUGH COUNTY DEPARTMENTS ............................................................ 58
ACTIVE FEDERAL GRANTS IN FY15-16 FOR LEE COUNTY ................................................................................... 59
LEE COUNTY EMPLOYEES PER 10,000 RESIDENTS FY08-09 THROUGH FY17-18 ............................................. 60
POSITION SUMMARY BY DEPARTMENT ................................................................................................................. 61
MAJOR MAINTENANCE PROGRAM FY17-18 THROUGH FY21-22 ......................................................................... 62
19

(FY16-17 Adopted Budget to FY17-18 Adopted Budget)
PROGRAM BUDGET SUMMARY TOTAL COMPARISON
The Legally Adopted Budget is the amount adopted by budget resolution as the Board of County
Commissioners' budget. The total includes budget transfers from one fund to another and
payments from one county department to another for services received.
$ 435,619,059 $ 456,137,828 241,006,403 248,706,146
OPERATING BUDGETS:
BoCC Operating DepartmentsConstitutional Officers and Courts
Total Operating Budget
4.71% 3.19%
Adopted Budget (Decrease)Increase or
Percent2016- 2017 2017- 2018
Adopted Budget
$ 676,625,462 $ 704,843,974 4.17%
CAPITAL BUDGET:Capital Projects
Total Operating & Capital Budgets
$ 205,252,250 $ 178,856,772(12.86%)
$ 918,698,761 $ 925,597,066 0.75%
OTHER:Internal TransfersDebt ServiceInsurance
$ 294,342,613 $ 307,203,614 4.37% 74,425,875 64,576,652(13.23%) 84,219,286 85,621,528 1.66%
Non-Departmental
Major Maintenance
Special Districts
Total Other
20,123,339 2.71%
41,896,320
4,175,674 5,098,453 22.10%
$ 477,286,787 1.23% $ 483,173,440
Total Operating, Capital & Other:
RESERVES:
Total Budget
$ 1,395,985,548 0.92% $ 1,408,770,506
$ 668,680,757 $ 742,705,356 11.07%
$ 2,064,666,305 4.20% $ 2,151,475,862
13.78% 36,821,049
20,673,193
Total Capital Budget $ 242,073,299 $ 220,753,092(8.81%)
The $704.8 million operating component of the proposed FY17-18 budget is a 4.17% increase from the prior year.
This reflects an increase in County department operations funding of 4.71%, which includes a 3% cost of living
pay adjustment. Significant increases include $4.7 million for Solid Waste (new positions and contract increases
due to increased volumes), $3.3 million for Transportation/Tolls (materials and contract increases), $2.6 million for
Utilities (materials, contracts and vehicles), $2.4 million for Parks (Conservation 20/20 management), and $1.6
million for Public Safety (new positions and an on-call pool). Constitutional Officers and Courts increased by
3.19%. Significant increases include $8 million for law enforcement (Sheriff's Office).
New capital projects for FY17-18 are $125 million, $55.9 million of which is Utilities projects and $41.2 million is
Transportation projects. Carryover projects from FY16-17 make up the balance of the $178.9 million. The major
carryovers are for projects that bridge several years including the Bonita Springs and North Fort Myers community
libraries, road projects (Burnt Store, Homestead, Alico) and Utilities projects (Three Oaks Wastewater Treatment
Plant, and the Advanced Metering System). Major Maintenance (projects costing over $25,000) increased 13.78%
primarily due to the planned reroofing of the Justice Center and renovations for the Court System.
Transfers increased 4.37%. Transfers between funds represent an expense to the sending fund and a revenue to
the receiving fund. The increase primarily is due to transfers from the General Fund for Water Quality and
Transportation projects, transfers of surplus tolls for transportation projects and transfers between Utilities funds to
pay for debt and capital projects. Debt Service decreased 13.23% primarily due planned reduction of principal
payments. Non-Departmental increased 2.71% due to increases in Medicaid and tax increment payments to city
Community Redevelopment districts. Special Districts (MSTBUs) increased 22.1% due to increased installation of
Lehigh Acres streetlights and funds to re-dredge Northeast Hurricane Bay
Reserves increased 11.07% due to increases in the reserves for future capital projects (five-year Capital
Improvement Plan) for Transportation and Utilities projects. Included in the reserves are Growth Increment
Funding revenues and excess reserves dedicated to Water Quality and Transportation projects.
20

$ 284,596,710
0
Ad Valorem Taxes
Other Taxes
License & Permits
Intergovernmental Revenues
Charges for Services
Fines & Forfeitures
Miscellaneous Revenues
Court Related Revenues
Non-Revenues
Less 5% Anticipated Revenues
Total Current Revenues
CURRENT REVENUES:
ESTIMATED REVENUES FUND
18,200,500
FUND BALANCE APPROPRIATED
226,793,678
$ 100,922,991
63,422,042
30,403,369
156,000
14,114,023
15,791,449
(3,000,000)
0
$ 100,436,655
$ 423,684,093
$ 524,120,748
APPROPRIATED EXPENDITURES
CURRENT EXPENDITURES:
General Government Services
Transportation
Public Safety
Physical Environment
Economic Environment
Human Services
Culture/Recreation
Court Related Services
Non-Expenditure Disbursements
Total Current Expenditures
RESERVES
Total Estimated Revenues
Total Appropriated Expenditures
3,490,548
0
15,057,277
18,321,439
4,147,031
45,578,154
$ 106,050,478
3,759,152
$ 418,070,270
$ 524,120,748
$ 67,918,628
48,825,000
15,668,773
21,274,807
14,358,143
1,347,700
4,969,204
3,994,000
36,128,282
(1,584,391)
$ 105,663,537
FUNDS
$ 212,900,146
$ 318,563,683
$ 12,816,727
16,472,721
5,908,354
33,165,254
27,076,586
5,793,207
41,304,500
16,727,714
55,759,709
$ 103,538,911
$ 215,024,772
$ 318,563,683
$ 0
0
0
0
0
0
21,950
0
25,983,157
0
$ 21,229,405
$ 15,744,553
0
0
0
0
0
6,029,114
0
3,497,446
$ 21,963,399
FUNDS
$ 47,234,512
$ 25,271,113
$ 26,005,107
$ 47,234,512
FUNDS FUNDS
$ 0
360,000
21,663,518
3,589,019
125,300
0
1,304,212
0
42,477,787
0
$ 211,391,855
$ 7,715,337
0
243,265,269
53,627,463
0
0
0
0
197,737,356
$ 308,126,119
$ 20,735,500
0
9,035,000
65,548,323
784,386
0
17,556,812
0
4,630,949
$ 162,620,721
$ 280,911,691
$ 118,290,970
$ 69,519,836
$ 280,911,691
$ 2,107,179
0
2,328,752
14,272,336
240,122,223
1,200,000
1,858,044
0
250,522,119
(2,201,892)
$ 313,816,828
$ 824,025,589
$ 515,899,470
$ 510,208,761
$ 824,025,589
FUNDS
$ 0
0
0
0
94,538,277
450,000
3,088,788
0
4,689,000
0
$ 53,853,574
$ 113,549,736
2,656,489
0
0
0
0
0
0
0
$ 40,405,728
$ 102,766,065
$ 156,619,639
$ 116,213,911
$ 156,619,639
FUNDS
$ 0
0
0
0
0
0
0
0
0
0
$ 0
$ 0
0
0
0
0
0
0
0
0
$ 0
$ 0
$ 0
$ 0
$ 0
TOTALGENERAL
SPECIAL
REVENUE
DEBT
SERVICE
CAPITAL
PROJECTS ENTERPRISEINTERNAL
SERVICE
TRUST &
AGENCY
$ 354,622,517
$ 2,151,475,862
$ 1,345,084,008
$ 1,408,770,506
$ 2,151,475,862
379,547,312
70,488,518
25,356,221
36,558,025
102,558,204
3,153,700
$ 806,391,854
(6,786,283)
375,591,794
3,994,000
$ 271,484,844
245,922,888
261,699,171
152,341,040
31,620,124
20,850,484
83,211,865
20,874,745
307,203,614
$ 742,705,356
LEE COUNTY - FISCAL YEAR 2017-2018
BUDGET SUMMARY
Debt Service 0 0 0 0 13,554,045 7,686 0 13,561,731
21

ACTUAL/ESTIMATED/ADOPTED BUDGET SUMMARY COMPARISON
FY15-16
ACTUAL
FY16-17
UNAUDITED
ACTUALFY17-18
ADOPTED
% CHANGE
ESTIMATED
TO ADOPTED
236,355,767 300,865,876 271,484,844
309,497,418Ad ValoremOther TaxesLicenses & PermitsIntergovernmentalCharges for ServicesFines & ForfeituresMiscellaneousCourt CostInternal ServicesNon-RevenuesLess 5% AnticipatedFund Balance
Total Revenues
346,193,479 354,622,517
General Government ServicesPublic SafetyPhysical EnvironmentTransportationEconomic EnvironmentHuman ServicesCulture / RecreationCourt RelatedNon-Expenditures
Reserves
Total Expenditures
69,673,821 41,856,613
89,952,936 70,488,518 42,429,793 36,558,025
108,662,787 133,488,136 102,558,204 370,524,919 434,864,826 379,547,312
3,732,338 3,237,702 3,153,700 27,598,593 31,341,947 25,356,221
3,906,916 4,756,746 3,994,000 0 0 0
508,943,697 459,203,814 375,591,794 0 0 (6,786,283)
998,118,884 1,024,903,360 806,391,854
2,442,515,986 2,570,372,739 2,151,475,862
229,489,951 277,503,382 245,922,888 213,700,795 336,215,069 261,699,171 100,601,644 209,192,886 152,341,040
27,378,697 39,144,647 31,620,124 21,061,049 24,311,588 20,850,484 70,923,684 115,072,002 83,211,865
6,213,973 7,832,384 20,874,745 497,069,591 432,821,797 307,203,614
1,024,903,360 806,391,854 742,705,356
2.43%(21.64%)(13.84%)(23.17%)(12.72%)
(2.59%)(19.10%)(16.04%)
(18.21%)
(178.68%)
(16.30%)
(9.77%)(11.38%)(22.16%)(27.18%)(19.22%)(14.24%)(27.69%) 166.52%(29.02%)
(7.90%)
(16.30%)
REVENUES
EXPENDITURES
$
$
$
$
$
$
$
$
$
$
$
$ 2,442,515,986 2,570,372,739 2,151,475,862
Debt Service 14,817,475 21,021,235 13,561,731 (35.49%)
22

REVENUES & EXPENDITURES DISCUSSION
REVENUES are divided into the following categories:
Taxes
Included are charges levied by the local unit of government. Specific types of taxes include ad valorem (real and personal property), and sales and use taxes (imposed upon sale or consumption of goods and services levied locally). The most well known sales and use taxes include tourist development taxes, one-cent voted gas tax (Lee County’s 9th cent voted), five and six cent local option gas taxes, insurance premium taxes, and fire and casualty insurance premium taxes. Franchise fees are also included in this category. These fees are levied on a corporation or individual by the local government in return for granting a privilege or permitting the use of public property subject to regulations. The most well known franchise fees are for electricity, water, sewer, and solid waste. County derived franchise fees are in the area of solid waste and telecommunications. Prior to FY01-02, the County collected cable franchise fees. These fees were eliminated in 2001 as part of a state bill that combined various types of taxes and fees into a state tax and local option tax on communications services. This tax is paid on all communication services (i.e. telephone, cable, satellite, etc.) by the customer and remitted through the vendor directly to the State Department of Revenue (DOR). DOR allocates the funds to cities and counties.
Licenses and Permits
These revenues are derived from the issuance of local licenses and permits. Within this category are professional and occupational licenses, building permits and any other licenses and permits (e.g., building, roofing, plumbing permits; occupational license fees).
Intergovernmental Revenues
Included are all revenues received from federal, state, and other local governmental sources in the form of grants, shared revenues, and payments in lieu of taxes. The state shared revenues that are of most importance to county government are revenue sharing, mobile home licenses, alcoholic beverage licenses, racing tax, local government half-cent sales tax, constitutional gas tax, and County gas tax (Lee County’s seven-cent pour over gas tax).
Charges for Services
These revenues include all charges for current services such as recording of legal documents, zoning fees, county officer fees (fees remitted to the county from officers whose operations are budgeted by the Board of County Commissioners), county court fees, circuit court fees, boat fees, ambulance fees, garbage/solid waste, water and sewer fees, parks, transportation, and recreation fees.
Fines and Forfeitures
This group of revenues includes monies received from fines and penalties imposed for the commission of statutory offenses, violation of lawful administrative rules and regulations and for neglect of official duty. Some examples include court fines, library fines, and non-criminal traffic fines.
23
REVENUES & EXPENDITURES DISCUSSION (continued) Miscellaneous Revenues
Monies in this category are primarily interest earnings. Types of interest earnings include monies on investments, contracts and notes, interest earnings of the Clerk of Court, Tax Collector, Sheriff, Property Appraiser, Supervisor of Elections, and interest earnings from Trustee accounts. Also included are sale of surplus material, settlements, rents, and auction proceeds for public property.
Court Costs
Revenues from Court Costs are generated from a variety of sources. These include but are not limited to Public Defender Liens, Probation Supervisory Fees and additional court costs.
Non-Revenues
Non-revenues are categories of monies that are not generated by traditional activities such as taxes, fees for services, or intergovernmental transfers (such as sales tax) from State to County. Included are incoming interfund transfers, bond and commercial paper proceeds, insurance premiums and unspent budgets and excess fees from Constitutional Officers which must, by State law, be returned to the County.
Less 5% Anticipated Revenues
Florida Statutes 129.01 requires “budgeted receipts must include 95 percent of all receipts reasonably anticipated from all sources. Ad valorem budget is shown at 95% of estimates projected by the Tax Collector.
EXPENDITURES are divided into the following categories:
General Government Services
The costs of providing representation of the citizenry by the governing body (Board of County Commissioners) as well as executive management and administration of the affairs of local government (County Manager's Office) are included in this category. Also included in this category are the financial and administrative costs of government (budgeting, accounting, auditing-external and internal, property appraisal, tax collecting, personnel, purchasing, telephones, data processing, pension administration, grants management, and any other support services).
In addition, General Government includes legal services (County Attorney), comprehensive planning (county planning department), Hearing Examiner, costs of providing a court system (Clerk of the Circuit Court and County Court, State Attorney, Public Defender, Law Library, Court Administrator, Grand Jury and Bailiff), Court Reporting, Supervisor of Elections, and Public Resources.
Public Safety
Security of persons and property is the major focus of this category. Included are law enforcement (Sheriff and Division of Public Safety), fire control (dependent fire districts), county jail, protective inspections (building and zoning inspections), emergency and disaster relief services (emergency operations, emergency medical services, and emergency communications system), ambulance and rescue services, and medical examiner. Also included are Animal Services programs.
24
REVENUES & EXPENDITURES DISCUSSION (continued)
Physical Environment
Costs of services provided to achieve a satisfactory living environment are assigned to this group. Categories include electric, water services, garbage/solid waste control, recycling, sewer services, hazardous waste, conservation and resource management, flood control, extension services, and other physical environmental needs.
Transportation
Costs incurred for the safe and adequate flow of vehicles, travelers, and pedestrians are included. Specific subcategories include roads, bridges, traffic engineering, and transit systems (Lee Tran).
Economic Environment
Costs of providing services to develop and improve the economic conditions of the community are allocated to this category. Included are Economic Development, Visitor and Convention Bureau, Veterans’ Services, Sports Authority, and neighborhood improvements. Not included are welfare functions which are included in Human Services.
Human Services
Costs of providing services for care, treatment, and control of human illness and injury are included. Expenditures in this function include mental health, physical health, welfare programs, retardation, and interrelated programs such as the provision of health care for indigent persons. Specific health care activities related to the County include the Health Department, family services and community agency support.
Culture and Recreation
Costs incurred in providing and maintaining cultural and recreational facilities and activities for citizens and visitors are included in this function. Separate categories include all library costs, recreational programs, public parks and preservation lands.
Court Related Expenditures
This category accounts for costs of providing court services including general administration, Circuit Court and County Court Services. Included programs are Support to Public Defender, State Attorney, budget transfers for Court Services, budget transfers for Clerk of Courts, and State Attorney Judicial.
Non-Expenditure Disbursements
Included in this category are transfers and reserves. Interfund transfers represent amounts transferred from one fund to another to assist in financing the services of the recipient fund. Transfers do not constitute additional revenues or expenditures of the governmental unit, but reflect the movement of cash from one fund to another.
25

REVENUES & EXPENDITURES DISCUSSION (continued)
REVENUE ASSUMPTIONS Methods to project the revenues suggested in the budget vary depending upon the type of revenue examined. However, the most common method used is Trend Analysis and especially a year-to- date approach. Examination of a variety of revenue sources including gas taxes and sales taxes on a monthly basis have revealed consistent patterns in the monthly collections. These have been good indicators of revenue collections during the course of a year and help to set a basis for future projections. Expert Judgment is a projection methodology that relies upon individual department directors and financial managers to make projections for the revenues that affect their operations. For gas taxes the State of Florida, through its revenue estimating conferences, provides projected annual growth in gas taxes over a multi-year period that is used as a guide in making projections. Projection of sales tax depends upon changes in inflation and population projections. The state provides a consistent monthly distribution of revenue sharing with a June “true up”. Population growth has usually resulted in an increase of the monthly allocation and annual collections. Property tax revenues are projected assuming a change in taxable value. The taxable value is divided by 1000 to determine a value per mill and reduced by 5% in accordance with Florida Statutes before it is multiplied by a millage rate. Existing millage rates from the previous year are initially used for budget preparation until the end of July when the Board of County Commissioners determines a rate which can only either remain static or be lowered prior to the October deadline for adoption of the budget. Licenses and Permits are evaluated based upon previous permit activity, any changes in fees, and the probability of continued levels of activity. Tourist taxes are projected based upon changes in inventory, previous years’ collection patterns and consultation with the Lee County Visitors and Convention Bureau (VCB). The tourist tax percentage rate was increased from 3% to 5% in January, 2006. VCB monitors activity among properties and contracts with a research organization to provide monthly statistical data
26

27
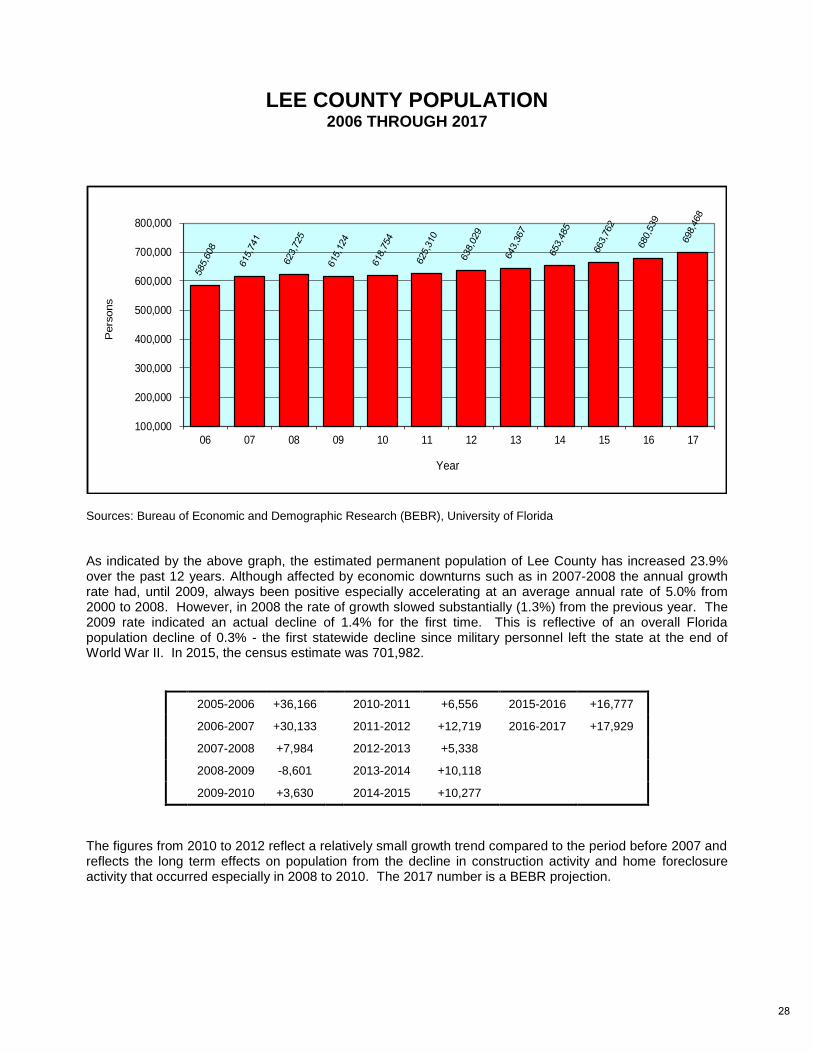
LEE COUNTY POPULATION 2006 THROUGH 2017
Sources: Bureau of Economic and Demographic Research (BEBR), University of Florida
As indicated by the above graph, the estimated permanent population of Lee County has increased 23.9% over the past 12 years. Although affected by economic downturns such as in 2007-2008 the annual growth rate had, until 2009, always been positive especially accelerating at an average annual rate of 5.0% from 2000 to 2008. However, in 2008 the rate of growth slowed substantially (1.3%) from the previous year. The 2009 rate indicated an actual decline of 1.4% for the first time. This is reflective of an overall Florida population decline of 0.3% - the first statewide decline since military personnel left the state at the end of World War II. In 2015, the census estimate was 701,982.
2005-2006 +36,166 2010-2011 +6,556 2015-2016 +16,777
2006-2007 +30,133 2011-2012 +12,719 2016-2017 +17,929
2007-2008 +7,984 2012-2013 +5,338
2008-2009 -8,601 2013-2014 +10,118
2009-2010 +3,630 2014-2015 +10,277
The figures from 2010 to 2012 reflect a relatively small growth trend compared to the period before 2007 and reflects the long term effects on population from the decline in construction activity and home foreclosure activity that occurred especially in 2008 to 2010. The 2017 number is a BEBR projection.
100,000
200,000
300,000
400,000
500,000
600,000
700,000
800,000
06 07 08 09 10 11 12 13 14 15 16 17
Pers
ons
Year
28

LEE COUNTY POPULATION PROFILE
Source: United States Census Bureau
UNINCORPORATED AND INCORPORATED POPULATION
Source: BEBR, University of Florida (2017) Note: The Countywide figures do not necessarily reflect those population estimates that are ultimately used for revenue-sharing purposes.
0
100,000
200,000
300,000
400,000
500,000
600,000
700,000
11-12 12-13 13-14 14-15 15-16 16-17
Pe
rso
ns
Year
65+
55-64
35-54
20-34
5-19
0-4
0
100,000
200,000
300,000
400,000
500,000
600,000
700,000
07 08 09 10 11 12 13 14 15 16 17
Pe
rs
on
s
Year
Fort Myers Beach
Sanibel
Estero
Bonita Springs
Fort Myers
Cape Coral
Unincorporated
29

REVENUES BY CATEGORY
ALL SOURCES
0% 10% 20% 30% 40% 50% 60% 70% 80% 90% 100%
Charges For Services
IntergovernmentalRevenues
Licenses & Permits
Other Revenues
Other Taxes
Property Taxes
Fis
ca
l Y
ea
r
Percent
Historical Perspective Including FY17-18 (Excludes Transfers and Reserves)
2017-2018
2016-2017
2015-2016
2014-2015
2013-2014
2012-2013
2011-2012
7.6%
Intergovernmental
5.2%
OtherTaxes
2.2%
Licenses andPermits
30.7%
OtherRevenues
26.2%
PropertyTaxes
28.1%
Charges for Services
Percentage Distribution for FY17-18
Note: Pie chart percentages may not equal 100% due to rounding of figures.
Property Taxes
Other Taxes
Intergovernmental
Interfund Transfers
Charges for Services
Fines & Forfeitures
$354,622,517
70,488,518
102,558,204
$ 307,203,614
379,547,312
3,153,700
$2,151,475,862
806,391,854Fund Balance
Less 5% Anticipated
Total Current Revenues
FY17-18 ADOPTED
$1,351,870,291
(6,786,283)
Constitutional Transfers and Misc Revenues 87,921,919
30,215,019Licenses and Permits
4,967,111Interest Earnings
6,343,006Impact Fees
Court and Related Services
855,371Rent & Royalties
3,994,000
TOTAL ALL REVENUES
414,438,721
62.5%
37.5%
100.00%
REVENUE TYPE
Other Revenues:
30

REVENUES BY CATEGORY (continued)
Property Taxes account for 26.2% of the current revenues budgeted for FY17-18. The General
Fund includes Capital Improvement projects and Conservation 2020. The other major property tax
levies are for the Unincorporated MSTU Fund, the Library Fund and the All Hazards Protection
Fund. In addition, there are other small taxing districts such as street lighting districts, special
improvement districts and fire districts.
Charges for Services are revenues received by the County for services provided. This revenue
includes Water and Sewer Charges, Solid Waste Fees, Development and Zoning Fees, Bridge
Tolls, and Ambulance Fees. Charges for Services make up 28.1% of current revenues.
Intergovernmental Revenues consist of state and federal grants and shared revenues. This
revenue source accounts for 7.6% of the current revenues budgeted.
The Other Taxes revenue source consists of gas taxes, the tourist tax, the communications
services tax, and solid waste collections. These revenues are 5.2% of the total current revenues.
Licenses and Permits are 2.2% of current revenues and consist primarily of building and permit
fees.
Other Revenues are comprised of a number of different revenue sources. The two largest are
transfers and can include bond proceeds. Transfers represent dollars moved from one fund to
another. A transfer out of one fund is reflected as an expense, while a transfer into a fund appears
as revenue. Bond proceeds represent revenues received from new debt and refunding of existing
debt to achieve cost savings through lower interest rates. Miscellaneous Revenues include
donations and contributions, and internal allocations. Impact Fees are classified under Licenses
and Permits, but has been separated out to illustrate here. Court Related Services are Charges
for Service, but also has been separated out here.
31

EXPENDITURES BY FUNCTION
ALL USES
Historical Perspective Including FY17-18 (Excludes Transfers and Reserves)
0% 10% 20% 30% 40% 50% 60% 70% 80% 90% 100%
Court Services
Culture/Recreation
Economic Environment
Gen GovernmentServices
Human Services
Physical Environment
Public Safety
Transportation
Debt Service
Fis
ca
l Y
ea
r
Percent
2017-2018
2016-2017
2015-2016
2014-2015
2013-2014
2012-2013
2011-2012
24.6%General Government Services
22.3%Public Safety
7.6%Culture/Recreation
1.9%Human Services
1.2%Debt Service
2.9%Economic Environment
1.9%Court Services
23.8%Physical Environment
13.8%Tranportation
Percentage Distribution for FY17-18 (Excludes Transfers and Reserves)
2017 - 2018
$ 271,484,844General Government
Public Safety 245,922,888
Physical Environment 261,699,171
152,341,040Transportation
Economic Environment 31,620,124
Human Services 20,850,484
83,211,865Culture & Recreation
TRANSFERS AND RESERVES 1,049,908,970
Court Services 20,874,745
Subtotal $ 1,101,566,892
EXPENDITURE FUNCTION ADOPTED
51.2%
TOTAL EXPENDITURES $ 2,151,475,862
48.8%
100.0%
Note: Pie chart percentages may not equal 100% due to rounding of figures.
Debt Service 13,561,731
32

EXPENDITURES BY FUNCTION ALL USES (continued)
The graph illustrates the historical pattern of expenditures since FY11-12. All local governments
are required to classify expenditures by function according to the Florida Uniform Accounting
System. In addition, a pie chart describes the various categories and percentages into which the
FY17-18 expenditures are divided. Transfers and Reserves are excluded from both charts.
Referring to the three largest functions in FY17-18, General Government Services is the largest
at 24.6%, followed by Physical Environment at 23.8% and Public Safety at 22.3%.
Public Safety provides: Sheriff’s Law Enforcement and Corrections, Medical Examiner and
Emergency Medical Services and represents 22.3%.
Economic Environment includes Visitor and Convention Bureau (VCB), Community Development
Block Grants (CDBG) and Economic Development and represents 2.9% of the total budget.
Human Services, including social service support and grant-related programs, represents 1.9%
of the total budget.
Culture/Recreation includes Parks and Recreation and the Lee County Library system, and
represents 7.6% of the total budget.
Court Services represents 1.9% of total expenses and includes, Guardian Ad Litem Office, the
Office of Criminal Conflict Civil Regional Counsel, Administrative Office of the Courts, Public
Defender’s Office and the State Attorney’s Office.
Non-expenditure disbursements are Reserves of $742,705,356 and Interfund Transfers of
$307,203,614 for a total of $1,049,908,970 or 48.8% of total expenditures.
33
EXPENDITURES BY FUND GROUP
ALL USES
2.20%Debt Service
7.28%Internal Services
38.30%Enterprise
24.36%General Fund
13.06%Capital Projects
14.81%Special Revenue
Solid Waste 30.9%
Water/Sewer 48.9%
Bridges 15.4%
Transit 4.8%
ExpendituresPercent of
Enterprise
Expenditure
EnterpriseSolid WasteWater/SewerBridgesTransit
SubtotalGeneralCapital ProjectsSpecial RevenueDebt ServiceInternal Service FundsTrust and Agency
TOTAL
254,972,971 402,619,544 126,603,576
39,829,498
824,025,589 524,120,748 280,911,691 318,563,683
47,234,512 156,619,639
0
2,151,475,862
$
$
$
Note: Pie chart percentages may not equal 100% due to rounding of figures.
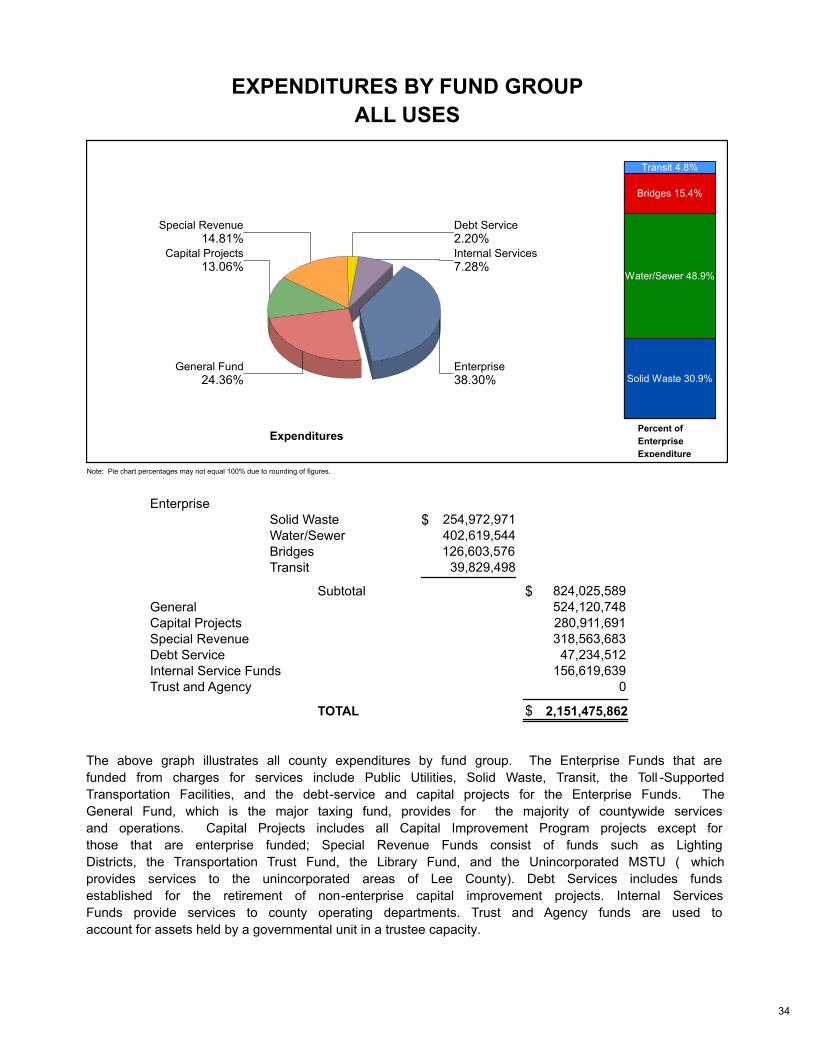
The above graph illustrates all county expenditures by fund group. The Enterprise Funds that are
funded from charges for services include Public Utilities, Solid Waste, Transit, the Toll -Supported
Transportation Facilities, and the debt-service and capital projects for the Enterprise Funds. The
General Fund, which is the major taxing fund, provides for the majority of countywide services
and operations. Capital Projects includes all Capital Improvement Program projects except for
those that are enterprise funded; Special Revenue Funds consist of funds such as Lighting
Districts, the Transportation Trust Fund, the Library Fund, and the Unincorporated MSTU ( which
provides services to the unincorporated areas of Lee County). Debt Services includes funds
established for the retirement of non-enterprise capital improvement projects. Internal Services
Funds provide services to county operating departments. Trust and Agency funds are used to
account for assets held by a governmental unit in a trustee capacity.
34

EXPENDITURES PER CAPITA
FY07-08 THROUGH FY17-18
Expenditures per capita are illustrated for operating and capital expenditures only. Expenditures per capita are as follows:
Total per capita expenditures reflect a slight increase from FY16-17 to FY17-18.
Expenditures per capita for capital projects: Most of the increases that occurred during much of the period in the chart reflect the receipt of bond proceeds or other funds that were eventually spent during a project’s construction. The spend down of existing funds and reduction in new capital funds led to a decline in per capita expenses that began in FY08-09 and continued through FY12-13. A gradual increase that began in FY13-14 was followed by decreases in FY14/15 through FY16-17. There was a slight increase in FY17-18. Expenditures per capita for operating expenditures have reflected a trend of increasing costs associated with the maintenance of completed capital projects and costs of county services. Operating per capita expenditures have increased annually until FY08-09. FY08-09 was the first decline in per capita expenditures over the previous year. That trend continued until FY13-14 with FY14-15 reflecting a slight decline and minor increases in FY15-16 through FY17-18.
0
500
1000
1500
2000
2500
07-08 08-09 09-10 10-11 11-12 12-13 13-14 14-15 15-16 16-17 17-18
Dolla
rs P
er
Capita
Fiscal Year
OPERATING CAPITAL
07-08 08-09 09-10 10-11 11-12 12-13 13-14 14-15 15-16 16-17 17-18
Operating $ 1,118 $ 1,078 $ 1,000 $ 1,005 $ 962 $ 946 $ 934 $ 918 $ 989 $ 994 $ 1,009
Capital 818 725 572 467 413 348 564 455 408 356 316
TOTAL $ 1,936 $ 1,803 $ 1,572 $ 1,472 $ 1,375 $ 1,294 $ 1,498 $ 1,373 $ 1,397 $ 1,350 $ 1,325
35
GENERAL FUND
REVENUE BY CATEGORY
Actual
FY16-17
19.1%Fund Balance
54.0%Property Taxes
12.0%Intergovernmental
5.7%
Misc. Revs. & Transfers
9.2%Charges for Services
0.0%
Fines And Forfeitures
0 0 0 0
186,791,109 219,275,056 233,681,163 251,043,539
60,393,078 63,221,389 68,971,944 70,196,667
35,894,650 24,773,285 29,991,167 26,748,557
37,708,699 46,467,117 48,146,182 48,731,739
148,515 410,397 350,968 300,110
Property Taxes
Other Taxes
Intergovernmental
Misc Revs & Transfers
Charges for Services
Fines & Forfeitures
284,596,710 265,473,082
0 0
68,327,610 63,422,042
32,806,514 29,905,472
48,427,417 48,603,869
240,191 156,000
Current Revenues 320,936,051 415,274,814 426,684,093 397,020,612 381,141,424 354,147,244
145,222,257 109,546,720 121,106,355 134,598,117 100,436,655 131,121,299Fund Balance
Less 5% Anticipated
TOTAL
Actual Actual ActualUnaudited
Actual Adopted
FY15-16 FY17-18FY14-15FY13-14FY12-13
524,120,748 531,618,729 502,247,779 463,693,964 466,158,308 546,396,113
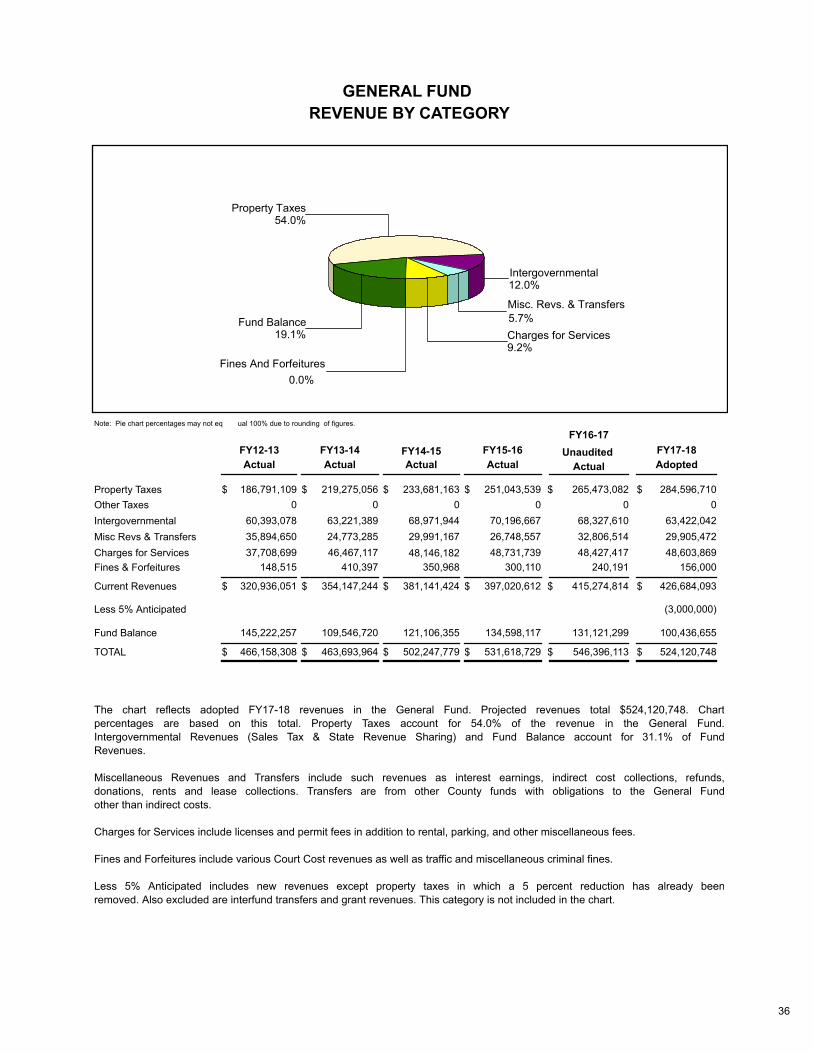
The chart reflects adopted FY17-18 revenues in the General Fund. Projected revenues total $524,120,748. Chart
percentages are based on this total. Property Taxes account for 54.0% of the revenue in the General Fund.
Intergovernmental Revenues (Sales Tax & State Revenue Sharing) and Fund Balance account for 31.1% of Fund
Revenues.
Miscellaneous Revenues and Transfers include such revenues as interest earnings, indirect cost collections, refunds,
donations, rents and lease collections. Transfers are from other County funds with obligations to the General Fund
other than indirect costs.
Charges for Services include licenses and permit fees in addition to rental, parking, and other miscellaneous fees.
Fines and Forfeitures include various Court Cost revenues as well as traffic and miscellaneous criminal fines.
Less 5% Anticipated includes new revenues except property taxes in which a 5 percent reduction has already been
removed. Also excluded are interfund transfers and grant revenues. This category is not included in the chart.
(3,000,000)
$
$
$ $
$
$ $
$
$
$
$
$
$
$
$
$
$
$
Note: Pie chart percentages may not eq ual 100% due to rounding of figures.
36

GENERAL FUND
EXPENDITURES BY CATEGORY
20.2%
Reserves
7.6%
Transfers 22.1%
CountyDepartments
2.9%
Non-Departmental
43.8%
ConstOfficers and
Courts1.1%
Debt ServiceTransfers
2.4%
MajorMaintenance
County Departments
Non-Departmental
Const Officers and Courts
Debt Service Transfers
Reserves
Transfers
TOTAL
$ 100,756,055
13,555,786
186,436,614
12,381,742
0
21,983,601
$335,113,798
$ 98,331,363
10,055,295
194,162,461
12,319,524
0
18,381,402
$ 333,250,045
$ 99,931,585
14,290,357
202,016,245
12,308,215
0
28,766,723
$ 357,313,125
$ 105,411,841
13,444,828
217,851,579
12,430,590
0
41,170,476
$ 390,309,314
$ 110,107,127
20,306,506
223,488,736
11,991,903
0
52,952,143
$ 426,073,956 $ 524,120,748
15,081,670
$ 115,576,908
229,456,173
5,834,166
106,050,478
39,743,988
Unaudited
ActualActual Actual Actual Actual Adopted
12,377,365Major Maintenance
FY13-14 FY14-15 FY15-16
FY16-17
FY17-18FY12-13
7,227,541 0 0 0 0
The chart indicates the majority of General Fund expenditures are for the direct provision of government services.
Non-Departmental generally refers to expenses of a countywide nature, such as financial services or auditing expenses that
are not related to solely one department.
The Clerk of the Courts, Property Appraiser, Tax Collector, Supervisor of Elections, and Sheriff are elected Constitutional
Officers. The budget for Courts includes Court Services, State Attorney, Public Defender, and Medical Examiner.
Debt Service Transfers are transfers to other funds for debt service payments. Transfers include interfund transfers such as
subsidies for Transit.
Reserves refer to unallocated funds. The actual years are audited and, therefore, not reflective of estimated or adopted
reserves. Reserves are reflected as an expense but expenditures are not paid from Reserves accounts.
37
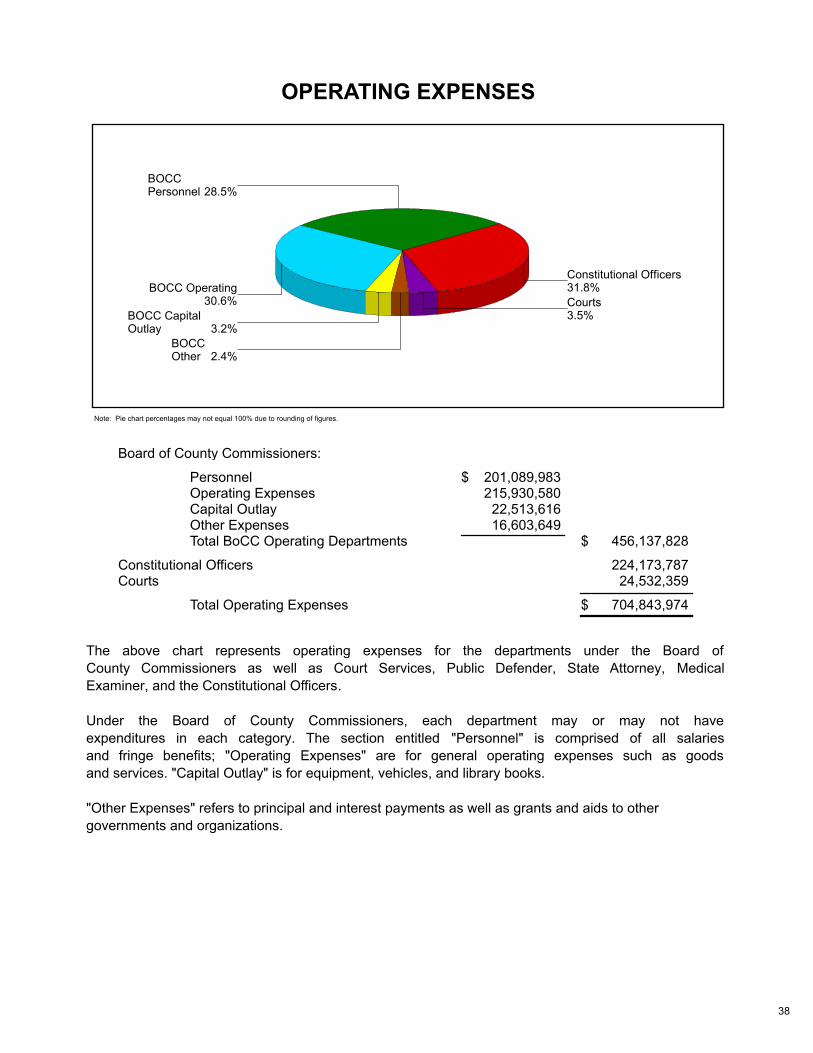
OPERATING EXPENSES
28.5%BOCCPersonnel
31.8%Constitutional Officers
3.5%Courts
2.4%BOCCOther
3.2%BOCC CapitalOutlay
30.6%BOCC Operating
Note: Pie chart percentages may not equal 100% due to rounding of figures.
Board of County Commissioners:
Personnel 201,089,983 215,930,580
22,513,616 16,603,649
456,137,828
224,173,787 24,532,359
704,843,974
Operating ExpensesCapital OutlayOther ExpensesTotal BoCC Operating Departments
Constitutional OfficersCourts
Total Operating Expenses
$
$
$
The above chart represents operating expenses for the departments under the Board of
County Commissioners as well as Court Services, Public Defender, State Attorney, Medical
Examiner, and the Constitutional Officers.
Under the Board of County Commissioners, each department may or may not have
expenditures in each category. The section entitled "Personnel" is comprised of all salaries
and fringe benefits; "Operating Expenses" are for general operating expenses such as goods
and services. "Capital Outlay" is for equipment, vehicles, and library books.
"Other Expenses" refers to principal and interest payments as well as grants and aids to other
governments and organizations.
38

OPERATING BUDGETS BY DEPARTMENTS
UNDER THE BOARD OF COUNTY COMMISSIONERS
ACTUAL
DEPARTMENTS
UNAUDITED
ACTUALACTUALACTUAL ACTUAL
ADOPTED
BUDGET
FY12-13 FY13-14 FY14-15 FY15-16 FY16-17 FY17-18
Public Safety
Library
Parks and Recreation
Transit
Economic Development
Human Services
Lee County Utilities
Transportation
Construction & Design
Solid Waste
County Commission
Hearing Examiner
County Administration
County Attorney
Visitor & Convention Bureau
Community Development
Procurement Management
Animal Services
Natural Resources
Fleet Management
Information Technology
Public Resources
Internal Services
Human Resources
County Lands
Office of Sustainability
Sports Development
TOTAL $ 418,313,697 $ 426,288,087 $ 456,137,828 $ 392,921,562 $ 399,648,713 $ 382,797,905
GIS Operations
Facilities Management
5,609,651 5,401,176 5,030,608 4,715,246 4,598,371 4,533,510
18,410,222 17,136,583 15,115,261 14,255,791 13,481,421 14,317,442
0 1,807,358 1,797,387 2,132,274 0 0
2,608,978 2,114,768 2,480,422 3,442,646 5,808,783 4,756,665
2,861,074 2,625,215 2,815,458 2,963,935 3,005,634 3,240,854
1,475,748 1,407,490 1,380,608 1,304,503 1,218,777 1,408,100
1,196,956 1,003,389 1,042,172 926,038 830,505 933,090
1,219,361 995,745 915,728 1,163,909 1,081,634 1,369,982
11,931,752 12,006,986 11,869,246 14,649,958 14,882,193 15,650,142
9,185,768 8,511,820 9,763,974 11,070,325 9,272,383 12,881,871
674,010 565,811 605,186 684,130 762,568 1,005,762
646,775 702,573 727,212 742,727 761,248 795,458
1,983,776 1,931,619 1,919,895 2,250,593 2,315,726 2,882,318
25,517,838 25,165,362 22,552,830 23,111,528 24,657,915 23,253,492
11,883,139 11,774,599 11,642,922 11,936,036 13,914,130 13,489,750
1,636,727 1,581,150 619,637 683,111 851,140 987,790
24,147,519 25,054,945 25,378,120 26,239,032 26,245,700 27,798,503
4,755,734 4,773,638 4,916,057 5,097,816 5,266,815 5,869,426
273,389 302,745 518,485 0 0 0 27,236,798
787,838
29,736,502
732,324
30,910,895
744,254
30,473,389
1,129,934
32,227,331
1,574,790
35,207,334
1,874,531
45,440,132
63,024,782
736,669
35,852,783
37,513,546
51,508,657
14,062,285
1,349,206 1,298,902 1,130,104 0 0 0 43,625,543 45,241,809 49,450,806 49,371,325 51,194,057
60,402,595 65,039,795 70,241,438 71,270,470 76,054,747
1,015,734 1,003,082 1,187,053 1,085,432 1,252,843
21,876,677 22,686,282 30,041,916 25,004,646 27,856,709
37,077,094 36,720,348 37,667,053 38,616,902 43,140,675
51,202,104 51,953,821 53,785,214 54,556,117 58,659,805
15,711,267 17,356,042 17,705,615 18,805,958 20,222,537
39

UNAUDITED
ACTUAL
FY16-17 FY17-18FY15-16FY14-15FY13-14FY11-12FY10-11
ACTUALACTUALACTUALACTUAL ACTUAL
FY12-13
ACTUALADOPTED
BUDGET
OPERATING BUDGETS FOR COURTS AND CONSTITUTIONAL
OFFICERS
$ 13,991,397
1,468,210
$ 1,192,831
2,117,656
3,342,990
$ 22,113,084
$ 14,323,192
1,467,976
$ 1,365,659
2,003,306
3,627,280
$ 22,787,413
$ 15,723,948
1,556,723
$ 1,425,933
2,168,141
3,657,614
$ 24,532,359
COURTS
Court Services
Board Support
Public Defender
State Attorney
Medical Examiner
TOTAL COURTS
CONSTITUTIONAL OFFICERS
Tax Collector
Board Support
Clerk to Board
Board Support
TOTAL
Property Appraiser
Board Support
TOTAL
Supervisor of Elections
Board Support
TOTAL
$ 16,314,426
1,416,140
$ 17,730,567
$ 9,187,541
939,315
$ 10,126,856
$ 7,864,459
2,194,393
$ 10,058,853
$ 8,962,450
667,710
$ 9,630,160
$ 17,246,893 $ 15,102,576
1,315,401 1,358,157
$ 18,562,294 $ 16,460,733
$ 9,844,096 $ 8,990,410
947,404 945,434
$ 10,791,500 $ 9,935,844
$ 7,785,224 $ 7,731,683
2,230,319 2,041,158
$ 10,015,542 $ 9,772,841
$ 8,016,447 $ 8,245,941
564,144 457,785
$ 8,580,591 $ 8,703,726
$ 15,107,423
1,576,851
$ 794,448
1,548,732
2,437,800
$ 21,465,254
$ 14,755,533
1,433,896
$ 16,189,428
$ 9,611,035
986,024
$ 10,597,059
$ 8,601,584
2,517,075
$ 11,118,659
$ 4,968,138
759,726
$ 5,727,864
TOTAL
TOTAL
$ 16,684,274 $ 15,459,607 $ 15,791,168 $ 17,280,671
$ 14,891,535
1,548,792
$ 16,440,327
$ 853,676
1,516,602
2,483,454
$ 21,294,059
$ 14,130,593
1,317,169
$ 15,447,761
$ 8,448,868
947,098
$ 9,395,965
$ 7,943,635
2,374,996
$ 10,318,631
$ 6,420,458
717,087
$ 7,137,545
$ 14,004,207
1,490,212
$ 15,494,419
2,516,595
$ 898,475
1,572,208
$ 20,481,697
$ 13,866,745
1,367,725
$ 15,234,470
$ 8,371,665
964,989
$ 9,336,654
$ 7,754,726
2,220,618
$ 9,975,343
$ 6,227,658
677,127
$ 6,904,785
$ 13,138,222
1,435,499
$ 14,573,721
2,674,177
$ 974,696
1,597,770
$ 19,820,365
$ 14,604,821
1,386,832
$ 15,991,653
$ 8,456,399
1,023,958
$ 9,480,358
$ 7,834,157
2,277,446
$ 10,111,602
$ 7,184,647
786,177
$ 7,970,824
$ 13,986,642
1,491,337
$ 15,477,979
3,038,683
$ 997,896
1,776,989
$ 21,291,547
$ 15,457,366
1,441,303
$ 16,898,669
$ 8,774,041
1,043,920
$ 9,817,961
$ 7,841,409
2,202,188
$ 10,043,597
$ 6,756,022
818,276
$ 7,574,298
Excess Funds Returned $(9,514,157)$(8,560,279)$(8,421,167)$(6,918,788)$(7,042,431)$(7,605,759)$(8,249,544)
Excess Funds Returned $(1,234,443)
Excess Funds Returned
Excess Funds Returned
$(622,054)
$(35,156)
$(891,640)
$(73,175)
$(1,131,575)
$(443,761)
$(380,563)
$(825,041)
$(580,380)
$(525,456)
$(723,460)
$(1,297,811)
$(200,092)
$(1,109,490)
$(1,856,369)
$(346,767)
$(1,055,977) $(1,655,861)
$(527,711)
$(1,229,461)
40
UNAUDITED
ACTUAL
FY16-17 FY17-18FY15-16FY14-15FY13-14FY11-12FY10-11
ACTUALACTUALACTUALACTUAL ACTUAL
FY12-13
ACTUALADOPTED
BUDGET
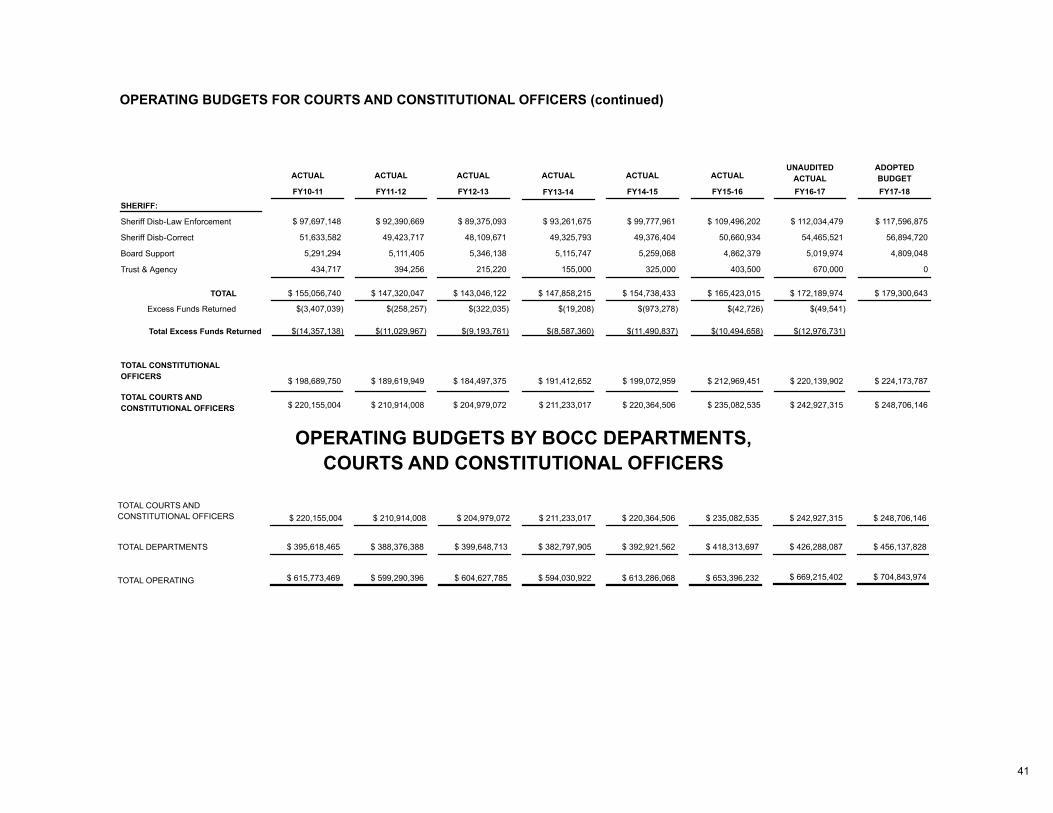
OPERATING BUDGETS FOR COURTS AND CONSTITUTIONAL OFFICERS (continued)
SHERIFF:
Sheriff Disb-Law Enforcement
Sheriff Disb-Correct
Board Support
Trust & Agency
TOTAL
TOTAL CONSTITUTIONAL
OFFICERS
TOTAL COURTS AND
CONSTITUTIONAL OFFICERS
$ 97,697,148
51,633,582
5,291,294
434,717
$ 155,056,740
$ 198,689,750
$ 220,155,004
$ 109,496,202
50,660,934
4,862,379
403,500
$ 165,423,015
$ 212,969,451
$ 235,082,535
$ 112,034,479 $ 117,596,875
54,465,521 56,894,720
5,019,974 4,809,048
670,000 0
$ 172,189,974 $ 179,300,643
$ 220,139,902
$ 242,927,315
$ 224,173,787
$ 248,706,146
49,423,717
$ 92,390,669
5,111,405
$ 189,619,949
$ 210,914,008
$ 147,320,047
394,256
49,376,404
$ 99,777,961
5,259,068
$ 154,738,433
325,000
$ 199,072,959
$ 220,364,506
49,325,793
$ 93,261,675
5,115,747
$ 147,858,215
155,000
$ 191,412,652
$ 211,233,017
$ 184,497,375
$ 204,979,072
$ 89,375,093
48,109,671
5,346,138
215,220
$ 143,046,122
OPERATING BUDGETS BY BOCC DEPARTMENTS,
COURTS AND CONSTITUTIONAL OFFICERS
$ 395,618,465
TOTAL COURTS AND
CONSTITUTIONAL OFFICERS
TOTAL DEPARTMENTS
TOTAL OPERATING
$ 220,155,004
$ 615,773,469
$ 388,376,388 $ 399,648,713 $ 382,797,905 $ 392,921,562 $ 418,313,697
$ 210,914,008 $ 204,979,072 $ 211,233,017 $ 220,364,506 $ 235,082,535 $ 242,927,315 $ 248,706,146
$ 704,843,974 $ 669,215,402
$ 426,288,087 $ 456,137,828
$ 599,290,396 $ 604,627,785 $ 594,030,922 $ 613,286,068 $ 653,396,232
Excess Funds Returned $(3,407,039) $(258,257) $(322,035) $(973,278) $(42,726) $(49,541)$(19,208)
Total Excess Funds Returned $(14,357,138) $(11,029,967) $(9,193,761) $(8,587,360) $(11,490,837) $(10,494,658) $(12,976,731)
41
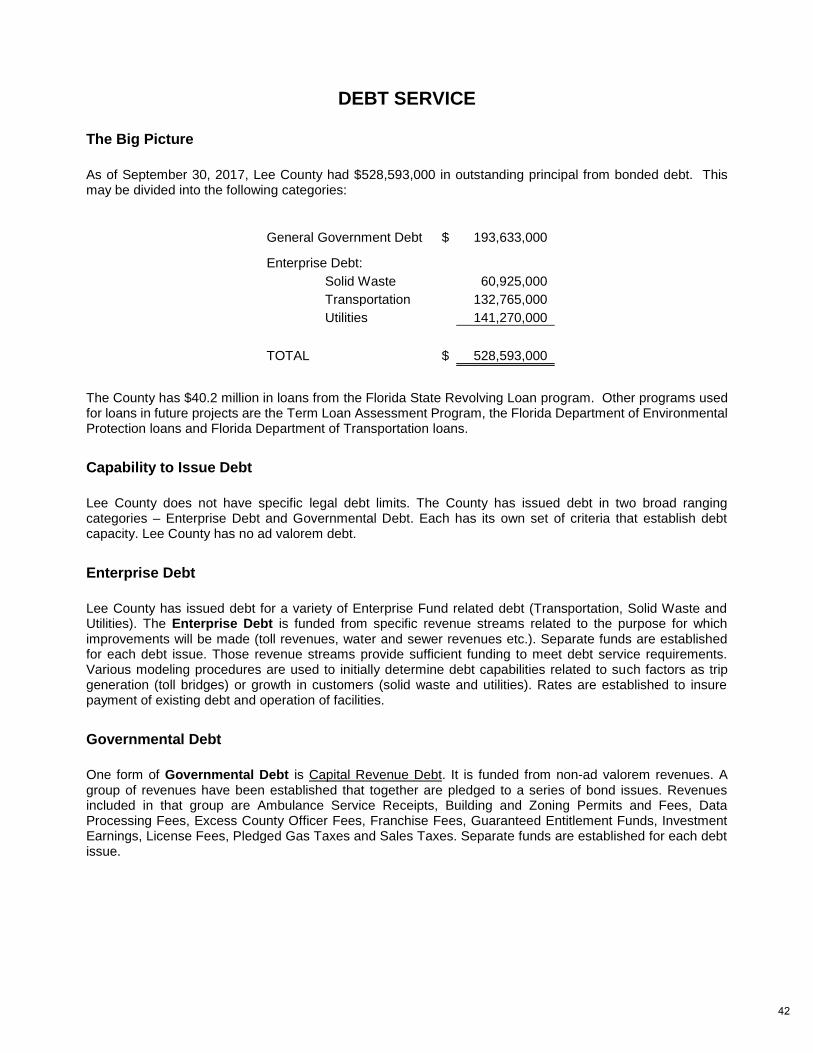
DEBT SERVICE
The Big Picture
As of September 30, 2017, Lee County had $528,593,000 in outstanding principal from bonded debt. This may be divided into the following categories:
General Government Debt $ 193,633,000
Enterprise Debt:
Solid Waste 60,925,000
Transportation 132,765,000
Utilities 141,270,000
TOTAL $ 528,593,000
The County has $40.2 million in loans from the Florida State Revolving Loan program. Other programs used for loans in future projects are the Term Loan Assessment Program, the Florida Department of Environmental Protection loans and Florida Department of Transportation loans.
Capability to Issue Debt
Lee County does not have specific legal debt limits. The County has issued debt in two broad ranging categories – Enterprise Debt and Governmental Debt. Each has its own set of criteria that establish debt capacity. Lee County has no ad valorem debt.
Enterprise Debt
Lee County has issued debt for a variety of Enterprise Fund related debt (Transportation, Solid Waste and Utilities). The Enterprise Debt is funded from specific revenue streams related to the purpose for which improvements will be made (toll revenues, water and sewer revenues etc.). Separate funds are established for each debt issue. Those revenue streams provide sufficient funding to meet debt service requirements. Various modeling procedures are used to initially determine debt capabilities related to such factors as trip generation (toll bridges) or growth in customers (solid waste and utilities). Rates are established to insure payment of existing debt and operation of facilities.
Governmental Debt
One form of Governmental Debt is Capital Revenue Debt. It is funded from non-ad valorem revenues. A group of revenues have been established that together are pledged to a series of bond issues. Revenues included in that group are Ambulance Service Receipts, Building and Zoning Permits and Fees, Data Processing Fees, Excess County Officer Fees, Franchise Fees, Guaranteed Entitlement Funds, Investment Earnings, License Fees, Pledged Gas Taxes and Sales Taxes. Separate funds are established for each debt issue.
42

DEBT SERVICE (continued) The County is required by Resolution to set up and appropriate in its annual budget (for expenditure in each of the fiscal years during which any bonds are outstanding and unpaid) sufficient pledged revenues to pay the principal and interest on any outstanding bonds. The County may issue additional bonds on parity with these bonds as long as it can meet an “additional bonds test” as specified by bond insurance. Therefore, all of the debt obligations are annually programmed into the budget at the same time as other needs are being funded. This insures that debt obligations do not unexpectedly result in a reduction in current or future operations. Another type of Governmental Debt is Special Assessments for specific improvements. These usually are issued through Municipal Service Benefit Units (MSBUs) that are attributed to and paid for by residents in specific areas.
Debt Activity Since September 30, 2017
Lee County Utiltiies has two new projects under the State of Florida Revolving Loan program: Three Oaks Oxidation and Advanced Metering Information Systems that upon completion will be added to the outstanding debt financing program.
43
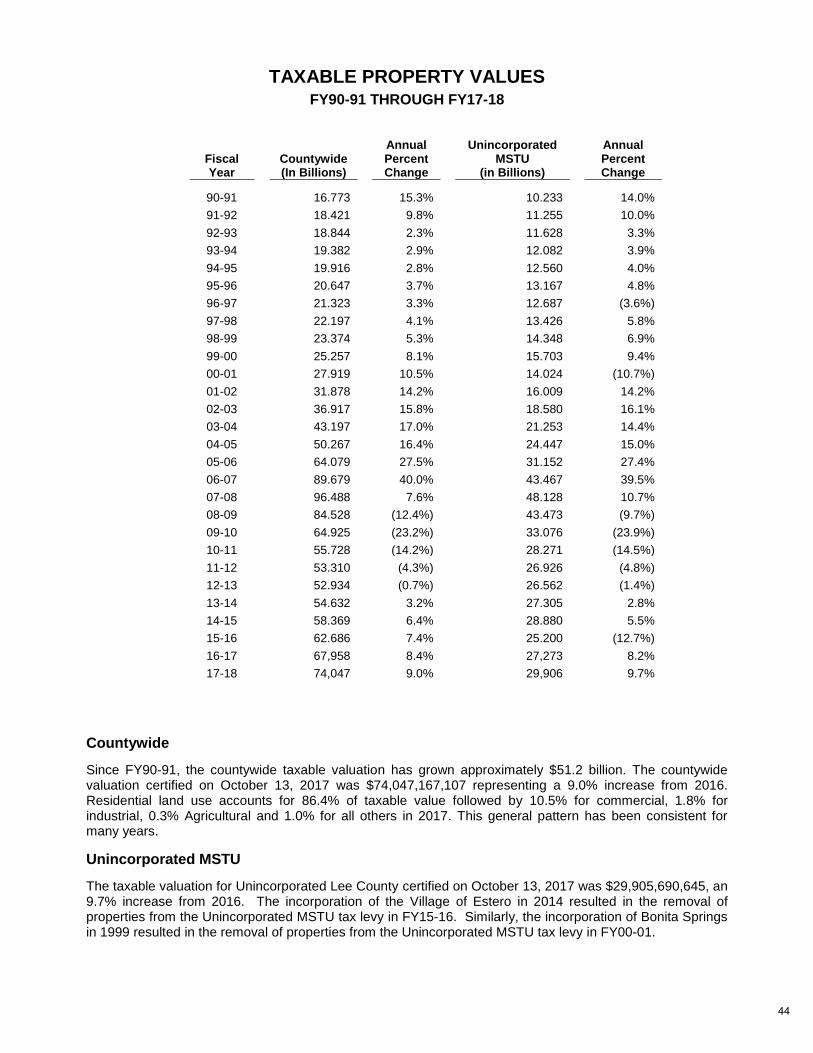
TAXABLE PROPERTY VALUES FY90-91 THROUGH FY17-18
Fiscal Year
Countywide (In Billions)
Annual Percent Change
Unincorporated MSTU
(in Billions)
Annual Percent Change
90-91
16.773
15.3%
10.233
14.0%
91-92
18.421
9.8%
11.255
10.0%
92-93
18.844
2.3%
11.628
3.3%
93-94
19.382
2.9%
12.082
3.9%
94-95
19.916
2.8%
12.560
4.0%
95-96
20.647
3.7%
13.167
4.8%
96-97
21.323
3.3%
12.687
(3.6%)
97-98
22.197
4.1%
13.426
5.8%
98-99
23.374
5.3%
14.348
6.9%
99-00
25.257
8.1%
15.703
9.4%
00-01
27.919
10.5%
14.024
(10.7%)
01-02
31.878
14.2%
16.009
14.2%
02-03
36.917
15.8%
18.580
16.1%
03-04
43.197
17.0%
21.253
14.4%
04-05
50.267
16.4%
24.447
15.0%
05-06
64.079
27.5%
31.152
27.4%
06-07
89.679
40.0%
43.467
39.5%
07-08
96.488
7.6%
48.128
10.7%
08-09
84.528
(12.4%)
43.473
(9.7%)
09-10
64.925
(23.2%)
33.076
(23.9%)
10-11
55.728
(14.2%)
28.271
(14.5%)
11-12
53.310
(4.3%)
26.926
(4.8%)
12-13
52.934
(0.7%)
26.562
(1.4%)
13-14
54.632
3.2%
27.305
2.8%
14-15
58.369
6.4%
28.880
5.5%
15-16 62.686 7.4% 25.200 (12.7%)
16-17 67,958 8.4% 27,273 8.2%
17-18 74,047 9.0% 29,906 9.7%
Countywide
Since FY90-91, the countywide taxable valuation has grown approximately $51.2 billion. The countywide valuation certified on October 13, 2017 was $74,047,167,107 representing a 9.0% increase from 2016. Residential land use accounts for 86.4% of taxable value followed by 10.5% for commercial, 1.8% for industrial, 0.3% Agricultural and 1.0% for all others in 2017. This general pattern has been consistent for many years.
Unincorporated MSTU
The taxable valuation for Unincorporated Lee County certified on October 13, 2017 was $29,905,690,645, an 9.7% increase from 2016. The incorporation of the Village of Estero in 2014 resulted in the removal of properties from the Unincorporated MSTU tax levy in FY15-16. Similarly, the incorporation of Bonita Springs in 1999 resulted in the removal of properties from the Unincorporated MSTU tax levy in FY00-01.
44

TAXABLE PROPERTY VALUE INCREASES/DECREASES
“New” taxable value includes primarily new construction. Existing taxable value reflects changes in the market value of existing property. The Countywide figures for 2017-2018 reflect a five straight years of an increase in taxable value after decreases for five consecutive years. There was a net “new” taxable value of $1,754.3 million and an increase in existing taxable value of $4,334.9 million for a total valuation increase of $6,089.2 million. The reductions in the Unincorporated MSTU in 1996-1997, 2000-2001 and 2015-2016 were the result of the incorporations of Fort Myers Beach, Bonita Springs and Estero respectively.
From To
Net "New"
Taxable
Existing
Taxable
Total
Increase/
(Decrease)
Net "New"
Taxable
Existing
Taxable
Total
Increase/
(Decrease)
1990 1991 439.1 1,791.0 2,230.1 251.2 1,002.4 1,253.6
1991 1992 622.0 1,026.0 1,648.0 414.7 607.3 1,022.0
1992 1993 402.0 22.0 424.0 344.3 28.7 373.0
1993 1994 434.0 104.0 538.0 332.8 121.2 454.0
1994 1995 523.8 10.2 534.0 425.2 52.8 478.0
1995 1996 643.9 87.1 731.0 479.6 127.4 607.0
1996 1997 597.9 78.1 676.0 448.9 (928.9) (480.0)
1997 1998 659.4 214.3 873.7 505.4 233.3 738.7
1998 1999 829.4 347.5 1,176.9 664.3 258.2 922.5
1999 2000 982.0 901.4 1,883.4 763.9 590.9 1,354.8
2000 2001 1,170.0 1,491.9 2,661.9 688.3 (2,367.0) (1,678.7)
2001 2002 1,463.6 2,494.8 3,958.4 803.2 1,181.8 1,985.0
2002 2003 1,820.8 3,218.1 5,038.9 1,218.5 1,352.0 2,570.5
2003 2004 1,991.9 4,288.1 6,280.0 966.1 1,706.9 2,673.0
2004 2005 2,411.3 4,658.6 7,069.9 1,255.0 1,939.4 3,194.4
2005 2006 3,068.1 10,743.9 13,812.0 1,680.7 5,024.3 6,705.0
2006 2007 3,898.8 21,701.2 25,600.0 2,223.0 10,092.0 12,315.0
2007 2008 6,647.9 161.1 6,809.0 3,572.9 1,088.1 4,661.0
2008 2009 4,503.0 (16,463.0) (11,960.0) 2,464.6 (7,119.5) (4,654.9)
2009 2010 1,274.0 (20,877.0) (19,603.0) 582.5 (10,979.5) (10,397.0)
2010 2011 599.9 (9,796.0) (9,196.1) 272.0 (5,077.0) (4,805.0)
2011 2012 371.6 (2,790.0) (2,418.4) 163.0 (1,507.8) (1,344.8)
2012 2013 382.2 (757.2) (375.0) 148.6 (512.6) (364.0)
2013 2014 530.5 1,166.8 1,697.3 225.4 517.6 743.0
2014 2015 815.9 2,922.0 3,737.9 299.6 1,275.5 1,575.1
2015 2016 1,098.8 3,246.7 4,345.5 (4,970.6) 1,291.8 (3,678.8)
2016 2017 1,557.4 3,714.5 5,271.9 509.6 1,562.9 2,072.5
2017 2018 1,754.3 4,334.9 6,089.2 625.9 2,006.3 2,632.2
$41,493.5 $18,041.0 $59,534.5 $17,358.6 $3,568.5 $20,927.1Total:
Countywide(in millions)
Unincorporated MSTU(in millions)
45

FY17-18 DISTRIBUTION OF TAXABLE VALUE IN CITIES AND
UNINCORPORATED LEE COUNTY
Note: Pie chart percentages may not total to 100% due to the rounding of data.
The chart displays the distribution of the 2017 taxable value (FY17-18) among the cities and Unincorporated Lee County. Following are the actual taxable values as certified by the Property Appraiser on October 13, 2017:
Following is a summary of taxable value changes among the cities and Unincorporated Lee County comparing FY15-16 to FY16-17 and FY16-17 to FY17-18 with the percentage change:
Unincorporated Lee County
43.2%
Fort Myers 8.1%
Cape Coral 18.9%
Fort Myers Beach 4.6%
Bonita Springs 13.2%
Sanibel7.0%
Estero 9.0%
Unincorporated Lee County $ 2,632,213,269
Fort Myers 635,735,633
Cape Coral 1,148,962,606
Fort Myers Beach 194,903,250
Bonita Springs 806,369,767
Sanibel 296,985,268
Estero 373,966,386
TOTAL $ 6,089,136,179
FY15-16 to FY16-17
Unincorporated Lee County $ 2,072,482,917 39.4%
Fort Myers 504,099,323 9.6%
Cape Coral 924,863,861 17.6%
Fort Myers Beach 238,908,476 4.5%
Bonita Springs 844,767,762 16.1%
Sanibel 237,986,285 4.5%
Estero 432,914,250 8.2%
TOTAL $ 5,256,022,874 100.0%
FY16-17 to FY17-18
Unincorporated Lee County $ 2,632,213,269 43.2%
Fort Myers 635,735,633 10.4%
Cape Coral 1,148,962,606 18.9%
Fort Myers Beach 194,903,250 3.2%
Bonita Springs 806,369,767 13.2%
Sanibel 296,985,268 4.9%
Estero 373,966,386 6.1%
TOTAL $ 6,089,136,179 100.0%
46

PROPERTY TAX RATES FY08-09 THROUGH FY17-18
*Capital Improvement millage added into the General Fund in FY07-08. Conservation 2020 millage added to General Fund in FY13-14.
4.0
4.0
4.0
4.1
4.1
4.1
4.1
4.1
4.2
08-09 09-10 10-11 11-12 12-13 13-14 14-15 15-16 16-17 17-18
Mil
lag
e R
ate
(P
er
$1000 T
ax
ab
le V
alu
e)
Fiscal Year
Countywide Millage Rate
0.0
0.1
0.2
0.3
0.4
0.5
0.6
0.7
0.8
0.9
08-09 09-10 10-11 11-12 12-13 13-14 14-15 15-16 16-17 17-18
Milla
ge
Rate
(P
er
$1000 T
axab
le V
alu
e)
Fiscal Year
Unincorporated MSTU Library All Hazards
FY08-09 FY09-10 FY10-11 FY11-12 FY12-13 FY13-14 FY14-15 FY15-16 FY16-17 FY17-18
ACTUAL ACTUAL ACTUAL ACTUAL ACTUAL ACTUAL ACTUAL ACTUAL ACTUAL ACTUAL
Countywide
General Fund 3.6506 3.6506 3.6506 3.6506 3.6506 4.1506 4.1506 4.1506 4.0506 4.0506
Capital Improvement 0.0000* 0.0000* 0.0000* 0.0000* 0.0000* 0.0000* 0.0000* 0.0000* 0.0000* 0.0000*
Conservation 2020 0.5000 0.5000 0.5000 0.5000 0.5000 0.0000* 0.0000* 0.0000* 0.0000* 0.0000*
COUNTYWIDE TOTAL 4.1506 4.1506 4.1506 4.1506 4.1506 4.1506 4.1506 4.1506 4.0506 4.0506
Unincorporated MSTU 0.8398 0.8398 0.8398 0.8398 0.8398 0.8398 0.8398 0.8398 0.8398 0.8398
Library 0.2844 0.2844 0.3383 0.3541 0.3541 0.5956 0.5956 0.5956 0.5956 0.5956
All Hazards Protection 0.0693 0.0693 0.0693 0.0693 0.0693 0.0693 0.0693 0.0693 0.0693 0.0693
47
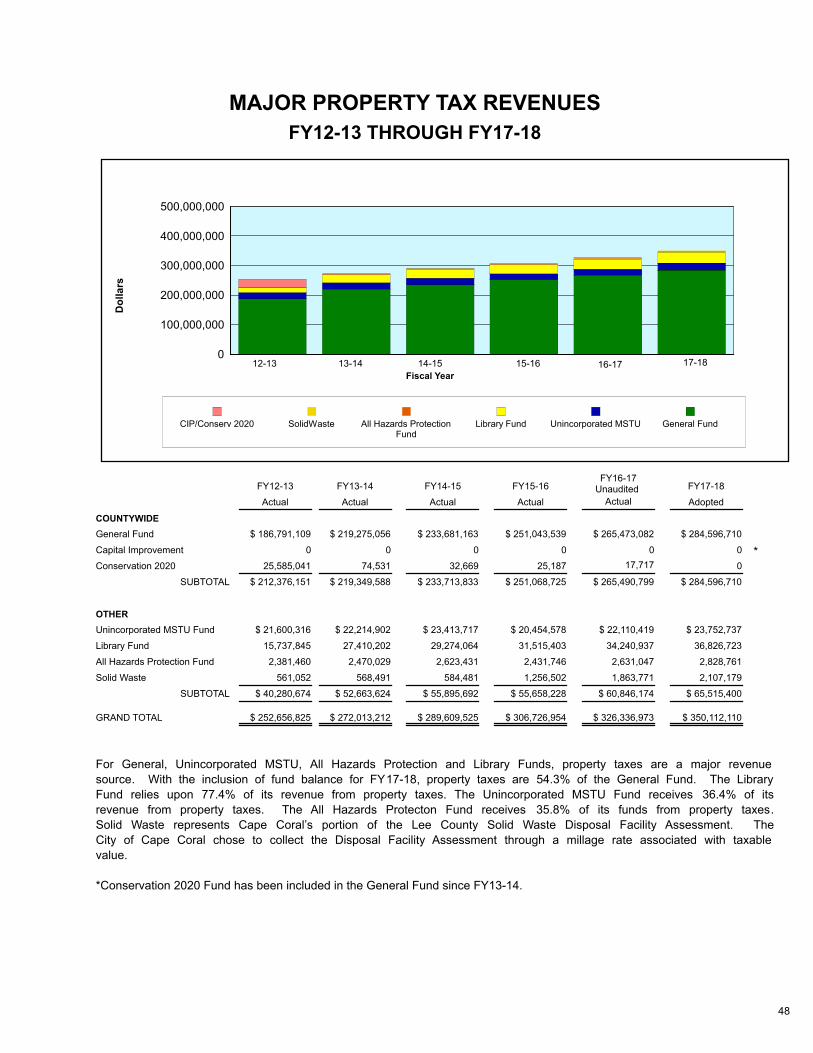
FY12-13 THROUGH FY17-18
MAJOR PROPERTY TAX REVENUES
0
100,000,000
200,000,000
300,000,000
400,000,000
500,000,000
CIP/Conserv 2020 SolidWaste All Hazards ProtectionFund
Library Fund Unincorporated MSTU General Fund
17-1816-1715-1614-1513-1412-13
Do
llars
Fiscal Year
Actual Actual Actual Actual
Unaudited
Actual Adopted
FY12-13 FY13-14 FY14-15 FY15-16 FY17-18FY16-17
COUNTYWIDE
General Fund
Capital Improvement
Conservation 2020
SUBTOTAL
OTHER
Unincorporated MSTU Fund
Library Fund
All Hazards Protection Fund
Solid Waste
SUBTOTAL
GRAND TOTAL
$ 219,275,056 $ 233,681,163 $ 251,043,539 $ 265,473,082 $ 284,596,710$ 186,791,109
0 0 0 0 0 0
25,585,041 74,531 32,669 25,187 0
$ 212,376,151 $ 219,349,588 $ 233,713,833 $ 251,068,725 $ 284,596,710$ 265,490,799
$ 21,600,316 $ 22,214,902 $ 23,413,717 $ 20,454,578 $ 22,110,419 $ 23,752,737
15,737,845 27,410,202 29,274,064 31,515,403 34,240,937 36,826,723
2,381,460 2,470,029 2,623,431 2,431,746 2,631,047 2,828,761
561,052 568,491 584,481 1,256,502 2,107,179 1,863,771
$ 40,280,674
$ 252,656,825 $ 272,013,212
$ 52,663,624
$ 289,609,525
$ 55,895,692
$ 306,726,954
$ 55,658,228 $ 65,515,400
$ 350,112,110$ 326,336,973
$ 60,846,174
17,717
*
For General, Unincorporated MSTU, All Hazards Protection and Library Funds, property taxes are a major revenue
source. With the inclusion of fund balance for FY17-18, property taxes are 54.3% of the General Fund. The Library
Fund relies upon 77.4% of its revenue from property taxes. The Unincorporated MSTU Fund receives 36.4% of its
revenue from property taxes. The All Hazards Protecton Fund receives 35.8% of its funds from property taxes.
Solid Waste represents Cape Coral’s portion of the Lee County Solid Waste Disposal Facility Assessment. The
City of Cape Coral chose to collect the Disposal Facility Assessment through a millage rate associated with taxable
value.
*Conservation 2020 Fund has been included in the General Fund since FY13-14.
48

ELEVEN-YEAR AD VALOREM MILLAGE SUMMARY
Taxing Authority FY07-08 FY08-09 FY09-10 FY10-11 FY11-12 FY12-13 FY13-14 FY14-15 FY15-16 FY16-17 FY17-18
Countywide Millages: Millage Millage Millage Millage Millage Millage Millage Millage Millage Millage Millage
General 3.6506 3.6506 3.6506 3.6506 3.6506 3.6506 4.1506 4.1506 4.1506 4.0506 4.0506
Capital Outlay 0.0000 0.0000 0.0000 0.0000 0.0000 0.0000 0.0000 0.0000 0.0000 0.0000 0.0000
Conservation 2020 0.5000 0.5000 0.5000 0.5000 0.5000 0.5000 0.0000 0.0000 0.0000 0.0000 0.0000
TOTAL COUNTYWIDE 4.1506 4.1506 4.1506 4.1506 4.1506 4.1506 4.1506 4.1506 4.1506 4.0506 4.0506
Misc. Non-Countywide Millages:
Library 0.3792 0.2844 0.2844 0.3383 0.3541 0.3541 0.5956 0.5956 0.5956 0.5956 0.5956
Unincorporated Area MSTU 0.8398 0.8398 0.8398 0.8398 0.8398 0.8398 0.8398 0.8398 0.8398 0.8398 0.8398
All Hazards Protection 0.0693 0.0693 0.0693 0.0693 0.0693 0.0693 0.0693 0.0693 0.0693 0.0693 0.0693
TOTAL MISC. NON-COUNTYWIDE 1.2883 1.1935 1.1935 1.2474 1.2632 1.2632 1.5047 1.5047 1.5047 1.5047 1.5047
Sewer & Solid Waste Districts & MSTU's:
Gasparilla Solid Waste MSTU 0.0422 0.0000 0.0000 0.0000 0.0000 0.0000 0.0000 0.0000 0.0000 0.0000 0.0000
Cape Coral Solid Waste MSTU 0.1157 0.1001 0.2086 0.2029 0.1292 0.0646 0.0616 0.0585 0.1170 0.1602 0.1681
Winkler Safe Neighborhood MSTU 1.7617 1.7617 2.0000 0.0000 0.0000 0.0000 0.0000 0.0000 0.0000 0.0000 0.0000
NE Hurricane Bay MSTU 0.5604 0.5604 0.7601 0.8290 0.7969 0.8911 0.7105 0.5043 0.4570 0.4151 0.2793
Upper Captiva MSTU 0.7302 0.7302 0.6374 0.0000 0.0000 0.0000 0.0000 0.0000 0.0000 0.0000 0.0000
Fire Protection Dist. MSTU's:
Burnt Store 0.9554 0.9554 1.5947 1.9027 2.0212 2.0212 2.2824 2.1212 2.0214 2.8588 3.0000
Maravilla 3.0000 3.0000 3.0000 4.0000 4.0000 4.7000 4.5000 4.5000 4.0000 4.0000 3.9000
Useppa 1.6724 1.6724 2.6595 2.3000 2.3000 2.5109 3.1380 2.8806 2.7931 2.6424 2.7029
Lighting & Special Improvement Districts:
Alabama Groves SLD 0.2616 0.1880 0.6946 1.0150 1.2243 0.8313 0.9393 0.9684 0.8592 0.9033 0.7107
Bayshore Estates SLD 0.8587 0.8377 1.1699 2.3144 2.3002 2.3818 2.1532 2.0933 2.1912 2.1910 1.7662
Billy Creek Commerce Center SLD 0.1116 0.1116 0.2259 0.2637 0.2632 0.3184 0.2965 0.3143 0.3371 0.3930 0.3461
Birkdale SLD 0.1512 0.1512 0.2920 0.5513 0.5204 0.5542 0.4805 0.3973 0.4335 0.3723 0.3059
Charleston Park SLD 0.2873 0.2873 2.7300 1.9095 2.0635 2.3119 1.8876 1.9068 1.8746 2.0675 1.9506
Cypress Lake SLD 0.2456 0.2236 0.3220 0.4799 0.4671 0.4820 0.4746 0.5712 0.4995 0.5000 0.4526
Daughtrey's Creek SLD 0.3460 0.3460 0.6297 0.7928 0.7491 0.8604 0.7811 0.7850 0.8124 0.8641 0.8381
49

Taxing Authority FY07-08 FY08-09 FY09-10 FY10-11 FY11-12 FY12-13 FY13-14 FY14-15 FY15-16 FY 16-17 FY 17-18
Countywide Millages: Millage Millage Millage Millage Millage Millage Millage Millage Millage Millage Millage
Lighting & Special Improvement Districts:
Flamingo Bay SLD 0.2217 0.1913 0.2668 0.4788 0.5301 0.4544 0.4552 0.4132 0.4428 0.3986 0.3686
Fort Myers Shores SLD 0.1317 0.0250 0.0490 0.2770 0.3269 0.3085 0.3404 0.2952 0.3220 0.3216 0.2187
Fort Myers Villas SLD 0.1217 0.1217 0.3994 0.3658 0.4580 0.3898 0.3083 0.3238 0.3392 0.3889 0.2028
Gasparilla Island SLD 0.0422 0.0000 0.0000 0.0000 0.0000 0.0000 0.0000 0.0000 0.0000 0.0000 0.0000
Harlem Heights SLD 0.2904 0.2904 0.4295 0.5507 0.5546 0.6333 0.7490 1.0361 1.0301 1.2291 1.1779
Heiman/Apollo SLD 0.3546 0.3546 1.9025 2.8607 3.8449 3.1139 3.3952 2.9251 2.5194 2.6325 2.1891
Hendry Creek SLD 0.2265 0.2265 0.2351 0.2926 0.3180 0.3058 0.4034 0.3572 0.3854 0.4162 0.3625
Iona Gardens SLD 0.2796 0.2796 0.6501 0.7549 0.7594 0.7834 0.7747 0.8292 0.8059 0.8595 0.7164
Lehigh Acres SLD 0.0557 0.0557 0.1845 0.3934 0.4171 0.4212 0.4588 0.6103 0.3921 0.7455 0.7455
Lochmoor Village SLD 0.3304 0.3304 0.8452 0.9335 0.9249 0.8762 0.7433 0.7888 0.7856 0.7628 0.6188
McGregor Isles Dredging 0.0000 0.0000 0.0000 0.0000 0.0000 0.0000 0.3705 0.3705 0.3614 0.3995 0.3860
MidMetro Industrial Park Spec Improvemt 0.0397 0.0142 0.1232 0.2476 0.3226 0.1799 0.0938 0.3632 0.2287 0.2388 0.3870
Mobile Haven SLD 0.4748 0.4748 0.7150 0.7478 0.8766 0.7848 0.8876 0.8125 0.8638 0.8598 0.6809
Morse Shores SLD 0.1772 0.1772 0.3437 0.6610 0.5526 0.5742 0.5905 0.5127 0.4953 0.4923 0.5036
North Fort Myers SLD 0.0552 0.0552 0.0152 0.1061 0.1341 0.2801 0.2370 0.2171 0.1569 0.1958 0.1820
Page Park SLD 0.1671 0.1671 0.3466 0.5794 0.4375 0.5069 0.4950 0.6345 0.4814 0.4606 0.7967
Palmetto Point Light MSTU 0.2541 0.2541 0.1457 0.2089 0.2484 0.2252 0.2057 0.4385 0.2788 0.1456 0.3622
Palm Beach Blvd S1 PHI MSTU 0.1920 0.0397 0.0000 0.0000 0.0000 0.0000 0.0000 0.0000 0.0000 0.0000 0.0000
Palm Beach Blvd S1 PH3 MSTU 0.1511 0.0397 0.0000 0.0000 0.0000 0.0000 0.0000 0.0000 0.0000 0.0000 0.0000
Palm Beach SIU MSTU 0.0000 0.0000 0.0000 0.0000 0.0090 0.0088 0.0076 0.0000 0.0000 0.0000 0.0000
Palmona Park SLD 0.5292 0.0982 0.7797 0.9903 1.7499 1.7499 1.5457 1.6583 1.6259 1.7499 1.6263
Pine Manor SLD 0.2330 0.0559 0.4206 1.4948 1.7887 1.2755 1.0210 0.9987 1.0762 0.9046 0.8075
Port Edison SLD 0.2056 0.2056 0.5687 0.7013 0.7740 0.6784 0.5123 0.5565 0.6409 0.5595 0.4693
Riverdale Shores Improvement 1.4981 1.4981 1.1951 1.9669 1.3367 0.6371 0.6137 0.7301 0.2017 0.7270 1.0043
Russell Park SLD 0.2517 0.1858 0.4785 0.8860 0.9927 1.0571 1.0647 1.0834 0.9735 0.9268 0.8430
San Carlos Island SLD 0.0245 0.0245 0.0351 0.0411 0.0605 0.0661 0.0575 0.0635 0.0549 0.0650 0.0572
San Carlos Special Improvement 0.1801 0.1801 0.3725 0.4211 0.4613 0.5241 0.2772 0.2510 0.2025 0.2678 0.2678
Skyline SLD 0.0751 0.0647 0.1367 0.1766 0.2070 0.1846 0.2074 0.1650 0.1975 0.1498 0.1335
St. Jude Harbor 0.0767 0.0767 0.2582 0.2852 0.3126 0.3119 0.2979 0.2520 0.3236 0.2835 0.2524
Tanglewood Spec Improvement 0.7137 0.1347 0.6121 0.5999 0.8910 0.8159 0.7364 0.5850 0.8673 1.0000 1.0000
Town & River Spec Improvement 0.2231 0.2231 0.2878 0.2412 0.2175 0.2073 0.3717 0.3266 0.2947 0.3899 0.2781
Trailwinds SLD 0.1719 0.1719 0.4536 0.8197 0.7524 0.6556 0.8991 0.8562 0.7371 0.7399 0.6912
Tropic Isles SLD 0.3249 0.3249 1.6372 1.6049 1.3085 1.0446 1.0190 0.9424 0.9783 0.8111 0.6315
Villa Palms SLD 0.2441 0.2441 0.8701 0.7980 0.8766 0.7765 0.8260 0.8101 0.8392 0.8866 0.7526
Villa Pines SLD 0.1960 0.1734 0.2248 0.2223 0.2582 0.2880 0.3253 0.3160 0.3003 0.2907 0.2708
Waterway Estates SLD 0.1626 0.1508 0.3772 0.5322 0.5584 0.4638 0.3959 0.3968 0.4368 0.3066 0.3068
Waterway Shores SLD 0.2987 0.2987 0.9312 0.8349 1.2276 1.1898 0.9499 1.0473 1.0249 0.9227 0.7651
Whiskey Creek Spec Improvement 0.7534 0.6915 1.0000 0.9989 0.9727 0.9802 0.9662 0.9773 0.9999 0.9999 0.9999
50

FY17-18 PROPERTY TAXES
DISTRIBUTION BY CATEGORY
Fiscal Year 2017-2018 Total Property Tax is $1,274,117,195 2017 Tax Roll – Excluding Non Ad-Valorem Assessments
Source: Lee County Property Appraiser – Tax Roll Certified October 13, 2017
The pie chart indicates that the Lee County School Board is the largest governmental jurisdiction to receive property taxes (44.3%). The Lee County Commission (28.8%) includes those tax revenues deposited to the General, Library, All Hazards Protection and Unincorporated MSTU Funds. The further subdividing of the 28.8% among the BoCC and Constitutional Officers assumes that all expenditures are assigned to property tax revenues after subtracting revenues generated by those departments. Based upon that assumption, the Board of County Commissioners would expect to receive 9.8%, Courts 1.4% and the Constitutional Officers other than the Sheriff would be allocated 3.5% from property taxes. The Lee County Sheriff would receive 14.1%. The remaining categories are listed below:
Cities include millage and debt service from Cape Coral, Fort Myers, Bonita Springs, Sanibel, the Town of Fort Myers Beach, and the Village of Estero.
MSTUs include all Municipal Service Taxing Units including lighting, sewer, and improvement districts.
Independent Special Districts includes all Independent Fire Districts, Fort Myers Beach Library as well as the Lee County Hyacinth Control, Mosquito Control, West Coast Inland Waterway (WCIND), and South Florida Water Management District taxing units.
Not included in these totals or in the chart is $115,094,127 in Non-Ad Valorem assessments. Among this group are assessments in Bay Creek, County Line Drainage, East County Water Control District, East Mulloch Creek Drainage, San Carlos Estates Drainage and the Lee County Solid Waste Assessment ($42,019,535). Also not included are penalties of $491,360. Those penalties accrue as a result of late payment of personal property taxes which are due on April 1st. The grand total including property taxes, penalties, adjustments and non ad-valorem assessments is $1,389,700,779.
Lee County School Bd
44.3%
Independent Special Districts
14.0%
Cities13.0%
Lee County Other
Constitutionals3.8%
Lee County BOCC8.6%
Lee County Sheriff14.4%
Courts1.4% MSTU's
0.5%
51

COMPARATIVE SAMPLE OF TAX BILLS
FOR A $275,000 HOME IN FORT MYERS, CAPE CORAL, SANIBEL, BONITA
SPRINGS, THE TOWN OF FORT MYERS BEACH, THE VILLAGE OF ESTERO AND UNINCORPORATED LEE COUNTY
DESCRIPTION: $275,000 JUST VALUE OF HOME
($ 50,000) HOMESTEAD EXEMPTION $225,000 TAXABLE VALUE LESS HOMESTEAD EXEMPTION
2017 PROPERTY TAXES (FY17-18)
School Districts and Cape Coral Solid Waste MSTU calculate with a $25,000 exemption, not $50,000.
Hyacinth Control and Mosquito Control calculate at full value. There are no exemptions.
17-18
MILLAGE FT CAPE BONITA FT MYERS VILLAGE UNINCORP
RATE MYERS CORAL SANIBEL SPRINGS BEACH OF ESTERO LEE CNTY
LEE COUNTY COMMISSION
LEE COUNTY GENERAL REVENUE 4.0506 911 911 911 911 911 911 911
LEE COUNTY LIBRARY 0.5956 134 134 0 134 0 134 134
LEE COUNTY UNINCORPORATED MSTU 0.8398 0 0 0 0 0 0 189
LEE COUNTY ALL HAZARDS 0.0693 0 16 0 0 0 0 16
SCHOOL DISTRICT - LEE COUNTY
PUBLIC SCHOOL - STATE LAW * 4.4310 1,108 1,108 1,108 1,108 1,108 1,108 1,108
PUBLIC SCHOOL - LOCAL BOARD * 2.2480 562 562 562 562 562 562 562
CITIES
CITY OF FORT MYERS 8.6500 1,946 0 0 0 0 0 0
CITY OF CAPE CORAL 6.7500 0 1,519 0 0 0 0 0
CAPE CORAL SOLID WASTE MSTU * 0.1681 0 42 0 0 0 0 0
CITY OF SANIBEL 1.9139 0 0 431 0 0 0 0
SANIBEL - SEWER VOTED DEBT SERVICE 0.1813 0 0 41 0 0 0 0SANIBEL - LAND ACQUISITION DEBT SERVICE 0.0690 0 0 16 0 0 0 0SANIBEL - REC CENTR VOTED DEBT SERVICE 0.1155 0 0 26 0 0 0 0
CITY OF BONITA SPRINGS 0.8173 0 0 0 184 0 0 0
TOWN OF FORT MYERS BEACH 0.8700 0 0 0 0 196 0 0
VILLAGE OF ESTERO 0.7798 0 0 0 0 0 175 0
INDEPENDENT SPECIAL DISTRICTS
WEST COAST INLAND WATERWAY 0.0394 9 9 9 9 9 9 9
(WCIND)
SOUTH FLORIDA WATER 0.1275 29 29 29 29 29 29 29
MANAGEMENT DISTRICT (LEVY)
SOUTH FLORIDA WATER MGT 0.0441 10 10 10 10 10 10 10
(EVERGLADES RESTOR)
SOUTH FLORIDA WATER MGT 0.1384 31 31 31 31 31 31 31
(OKEECHOBEE BASIN)
LEE CTY HYACINTH CONTROL ** 0.0248 7 7 7 7 7 7 7
LEE CTY MOSQUITO CONTROL ** 0.2800 77 77 77 77 77 77 77
TOTAL $4,824 $4,454 $3,257 $3,061 $2,939 $3,053 $3,082
PERCENTAGE SUMMARY
LEE COUNTY COMMISSION 22% 24% 28% 34% 31% 34% 41%
SCHOOL DISTRICT OF LEE COUNTY 35% 37% 51% 55% 57% 55% 54%
CITIES 40% 35% 16% 6% 7% 6% 0%
INDEPENDENT SPECIAL DISTRICTS 3% 4% 5% 5% 6% 5% 5%
TOTAL 100% 100% 100% 100% 100% 100% 100%
52

COMPARATIVE SAMPLE OF TAX BILLS (continued)
These charts illustrate sample tax bills in Fort Myers, Cape Coral, Sanibel, Bonita Springs, the Town of Fort Myers Beach, the Village of Estero and Unincorporated Lee County for a home with $225,000 of taxable value after homestead exemption for tax bills BASED UPON THE ADOPTED MILLAGE RATES. The percentage distribution shows that within the cities of Lee County, the taxes that relate to county services amount to approximately 22% of the total tax bill for Fort Myers, 24% for Cape Coral, 28% for Sanibel, 34% for Bonita Springs, 31% for the Town of Fort Myers Beach and 34% for the Village of Estero. The School District of Lee County is the single jurisdiction with the largest allocation - with allocations ranging from 35% in Fort Myers to 57% in the Town of Fort Myers Beach. In the tax bill representing Unincorporated Lee County, the allocation related to the School District is 54%. The Unincorporated MSTU is a tax that provides funds for operations that normally would be the responsibility of city governments. Included are development review, environmental sciences, zoning, codes and building services, construction licensing, building and zoning inspections, plan review, community parks, domestic animal services, hearing examiner and funding for road, bridge and traffic maintenance and operations. The Lee County Hyacinth Control and Mosquito Control Districts are not subject to the homestead exemption. These districts were established by the Florida Legislature and at that time it was determined that the services that these districts provide benefit all properties without discrimination. The bill comparisons represent "generic" tax comparisons and do not take into account individual MSTUs, geographical independent and dependent special districts, or drainage districts. These “other" districts include lighting, fire and special improvement districts. The data is based upon 2017 Property Tax information certified by the Property Appraiser on October 13, 2017. Beginning in FY06-07, the City of Sanibel was no longer assessed a Lee County Library millage after having established an independent library district. Sanibel joined the Town of Fort Myers Beach in having independent library districts.
53

FY10-11 THROUGH FY17-18
STATE SHARED REVENUES
$ 33,544,826
$ 36,129,946
$ 38,654,071 $ 42,131,369 $ 45,163,659 $ 46,441,231 Sales Tax
State Rev Sharing 11,437,371 12,174,383 12,820,628 13,807,249 14,641,807 15,380,245
$ 44,982,197 $ 48,304,329 $ 51,474,699 $ 55,938,618 $ 59,805,466 $ 61,821,476 $ 63,591,794 $ 66,200,000 TOTAL
State shared revenues are comprised of Sales Tax Revenue and State Revenue Sharing. Both of these
revenues are used in Lee County to support day-to-day operating expenses and debt service.
Sales Tax
The apportionment factor for all eligible counties is composed of three equally weighted portions: ( 1)
each eligible county’s percentage of the total population of all eligible counties in the state; (2) each
eligible county’s percentage of the total population of the state residing in unincorporated areas of all
eligible counties; and (3) each eligible county’s percentage of total sales tax collections in all eligible
counties during the preceding year.
State Revenue Sharing
The State Revenue Sharing Program for counties involves the distribution of state shared cigarette tax
and State sales tax. Each county was given a set amount monthly based upon a formula distribution and
then “trued up” each June to reflect actual state collections in the sources that affect the revenue
sharing. The State apportionment factor is calculated using a formula equally weighted among county
population, unincorporated county population and county sales tax collections. The General Fund
receives 100% of collections.
0
10,000,000
20,000,000
30,000,000
40,000,000
50,000,000
60,000,000
70,000,000
State Revenue Sharing Sales Tax
Fiscal Year
Do
lla
rs
Actual Actual Actual Actual Actual ActualUnaudited
Actual Adopted
FY10-11 FY17-18FY11-12 FY12-13 FY13-14 FY14-15 FY15-16
FY16-17
17-1816-1715-1614-1513-1412-1311-1210-11
16,241,617
$ 47,350,177
16,200,000
$ 50,000,000 $ 36,129,946
54

LEE COUNTY GAS TAX REVENUES
FY10-11 THROUGH FY17-18
0
5,000,000
10,000,000
15,000,000
20,000,000
25,000,000
30,000,000
35,000,000
10-11 11-12 12-13 13-14 14-15 15-16 16-17 17-18
Do
llars
Fiscal Year
Seventh Cent Ninth Cent Constitutional
Five-Cent Local Option Six-Cent Local Option
FY10-11
Actual
FY11-12
Actual
FY12-13
Actual
FY13-14
Actual
FY14-15
Actual
FY15-16
Actual
FY16-17
Adopted
FY17-18
Adopted
Seventh Cent $2,289,279 $2,357,848 $2,393,180 $2,458,537 $2,610,839 $2,782,166 $2,715,272 $2,951,322
Ninth Cent 2,931,172 2,914,997 3,059,332 3,161,526 3,438,654 3,634,098 3,576,200 3,855,051
Constitutional 5,240,184 5,445,520 5,420,374 5,699,910 5,955,200 6,295,244 6,193,408 6,677,995
Five-Cent Local Option 6,006,403 6,027,262 6,356,088 6,616,170 7,096,415 7,115,734 7,380,271 7,601,679
Six-Cent Local Option 8,094,668 8,173,756 8,576,486 8,838,458 9,621,784 9,653,807 10,006,655 10,206,788
TOTAL $24,561,706 $24,919,383 $25,805,460 $26,774,601 $28,722,892 $29,481,049 $29,871,806 $31,292,835 Some data provided in the following discussion occurred prior to the period in the chart but is included for historical perspective. The Seventh Cent Gas Tax is received by the County and used to fund operations of the Department of Transportation. The Ninth Cent Gas Tax is used for transportation capital projects. The Constitutional Gas Tax is used for construction of roads and bridges and transportation operations.
55

LEE COUNTY GAS TAX REVENUES (continued) The Five-Cent Local Option Gas Tax collection began in January, 1994 and is currently being collected and shared locally between the County and municipalities based upon interlocal agreements. Lee County's portion is distributed between capital projects and toward various debt service obligations. The Five-Cent Local Option Gas Tax can only be used for capital improvements related to the County's Comprehensive Plan. Beginning in FY96-97 the Town of Fort Myers Beach, in FY00-01 the City of Bonita Springs and in FY15-16 the Village of Estero, all began receiving an allocation out of Lee County's portion. The Six-Cent Local Option Gas Tax is currently being collected and shared locally between municipalities based upon interlocal agreements; a portion of this tax supports transit (LeeTran). Similar to the Five-Cent Local Option described above, beginning in FY96-97 the Town of Fort Myers Beach, in FY00-01 the City of Bonita Springs and in FY15-16 the Village of Estero, all began receiving an allocation out of Lee County's portion. All gas taxes are collected for counties by the Florida Department of Revenue, which distributes collections monthly in accordance with the following formulas calculated annually:
Constitutional (2 cents ) Lee County 100%
Seventh Cent (1 cent) Lee County 90%
10%
100%
Ninth Cent (1 cent ) Lee County 100%
Local Option (11 cents ) Allocation
5-Cent & 6-Cent
(From 1984 to1989, Cape Coral 24.95%
only 4 cents was allocated) Sanibel 5.00%
Fort Myers 14.00%
Fort Myers Beach 1.17%
Bonita Springs 4.54%
Village of Estero 2.54%
Lee County 47.80%
100.00%
(Effective FY17-18)
(After State Deductions for Dealer Costs)
State (Collection Fees,Admin Costs, 8% Service Charge)
56

SUMMARY OF GAS TAXES LEVIED BY ALL GOVERNMENTAL LEVELS
GOVERNMENTAL LEVEL DESCRIPTION AMOUNT AUTHORIZATION
Federal 18.4 Cents Current Rate For Gasoline (includes 15.44 cents for
Highway Trust Fund and 2.86 cents for Mass Transit; and
0.1 cents for leaking underground storage tanks).
State Department of Transportation 13.3 Cents Chapter 206.41(1)(g) and Chapter 206.87(1)(g) diesel
State Comprehensive Enhanced 7.3 Cents Chapter 206.41 (1)(f) and Transportation System
(SCETS) Chapter 206.87 (1)(d) diesel
State Shared With Local Jurisdictions .
County Only (4 Cents) County (Seventh Cent) 1.0 Cents Chapter 206.60 F.S.
Voted (Ninth Cent) 1.0 Cents Chapter 336.021 F.S.
Constitutional (5th and 6th Cent) 2.0 Cents Chapter 206.41 and 206.47 F.S.
City Only (1 Cent) City (Eighth Cent) 1.0 Cents Chapter 206.605 F.S.
County and City Shared (11 Cents) Local Option (10-15 Cents) 6.0 Cents Chapter 336.025 F.S.
Local Option (16-20 Cents) 5.0 Cents Chapter 336.025(1)(b) F.S.
TOTAL 55.0 Cents
The County solely receives or shares in 15 cents per gallon of gasoline.
This chart indicates that 55 cents per gallon is levied for taxes at various governmental levels.
57

FY16-17 GRANTS
ADMINISTERED THROUGH
COUNTY DEPARTMENTS
Note: Pie chart percentages may not equal 100% due to rounding of figures.
Total: $139,527,281
Lee County receives grant funds from State and Federal agencies. These grant funds enable
Lee County to provide services to the community in areas such as emergency medical
assistance, programs for the elderly, transportation, environmental education and recreational
opportunities. The departments of Lee County government shown in the graph above
administered 93 active (including multi-year) grants in FY16-17 totaling $139,527,281. Grants
totaling $93,401,202 came from 6 Federal agencies, and grants totaling $46,125,779 came from
8 State agencies. The charts shown on the following page identify the percentages of grant
funding originating from each of these Federal and State agencies.
The chart above identifies the percentage of grants received by departments of Lee County.
Included in the chart are Public Works (Natural Resources and Utilities) and Other (Court
Administration, Clerk of Courts, Elections, Medical Examiner, Library, and Parks and Recreation).
Human Services33.7%
Parks10.9%
Public Works7.0%
Transit28.4%
Sheriff1.0%
Dept of Transportation
11.4%
Community Development
4.8%
Public Safety0.8%
Library1.0%
Other Depts0.9%
58
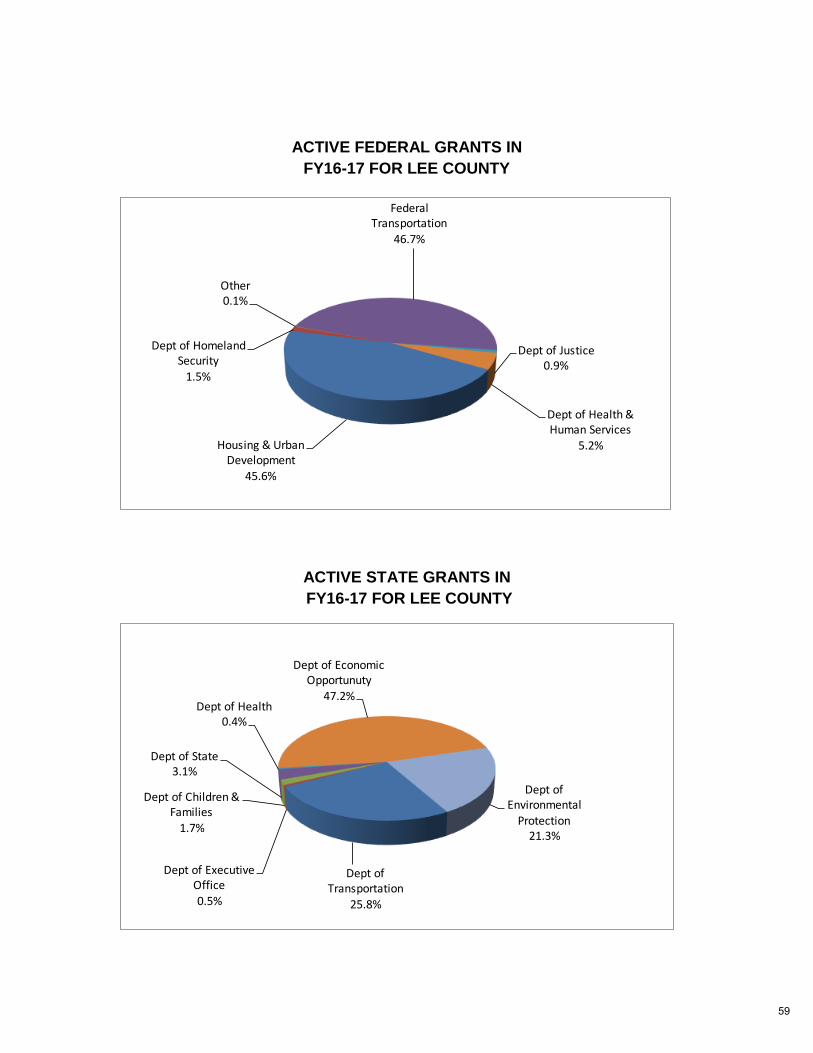
ACTIVE FEDERAL GRANTS IN
FY16-17 FOR LEE COUNTY
ACTIVE STATE GRANTS IN
FY16-17 FOR LEE COUNTY
Housing & Urban Development
45.6%
Dept of Homeland Security
1.5%
Other0.1%
Federal Transportation
46.7%
Dept of Justice0.9%
Dept of Health & Human Services
5.2%
Dept of Transportation
25.8%
Dept of Executive Office0.5%
Dept of Children & Families
1.7%
Dept of State3.1%
Dept of Health0.4%
Dept of Economic Opportunuty
47.2%
Dept of Environmental
Protection21.3%
59
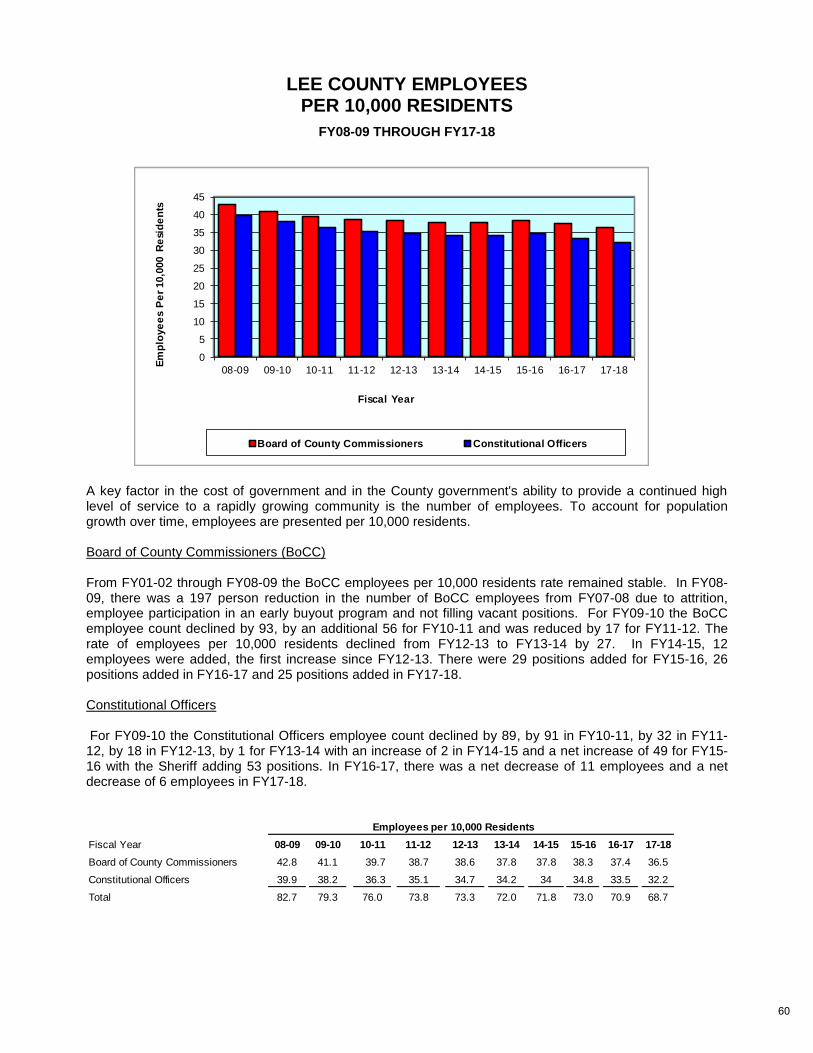
LEE COUNTY EMPLOYEES PER 10,000 RESIDENTS
FY08-09 THROUGH FY17-18
A key factor in the cost of government and in the County government's ability to provide a continued high level of service to a rapidly growing community is the number of employees. To account for population growth over time, employees are presented per 10,000 residents. Board of County Commissioners (BoCC) From FY01-02 through FY08-09 the BoCC employees per 10,000 residents rate remained stable. In FY08-09, there was a 197 person reduction in the number of BoCC employees from FY07-08 due to attrition, employee participation in an early buyout program and not filling vacant positions. For FY09-10 the BoCC employee count declined by 93, by an additional 56 for FY10-11 and was reduced by 17 for FY11-12. The rate of employees per 10,000 residents declined from FY12-13 to FY13-14 by 27. In FY14-15, 12 employees were added, the first increase since FY12-13. There were 29 positions added for FY15-16, 26 positions added in FY16-17 and 25 positions added in FY17-18. Constitutional Officers For FY09-10 the Constitutional Officers employee count declined by 89, by 91 in FY10-11, by 32 in FY11-12, by 18 in FY12-13, by 1 for FY13-14 with an increase of 2 in FY14-15 and a net increase of 49 for FY15-16 with the Sheriff adding 53 positions. In FY16-17, there was a net decrease of 11 employees and a net decrease of 6 employees in FY17-18.
0
5
10
15
20
25
30
35
40
45
08-09 09-10 10-11 11-12 12-13 13-14 14-15 15-16 16-17 17-18
Em
plo
ye
es
Pe
r 10,0
00 R
esi
de
nts
Fiscal Year
Board of County Commissioners Constitutional Officers
Fiscal Year 08-09 09-10 10-11 11-12 12-13 13-14 14-15 15-16 16-17 17-18
Board of County Commissioners 42.8 41.1 39.7 38.7 38.6 37.8 37.8 38.3 37.4 36.5
Constitutional Officers 39.9 38.2 36.3 35.1 34.7 34.2 34 34.8 33.5 32.2
Total 82.7 79.3 76.0 73.8 73.3 72.0 71.8 73.0 70.9 68.7
Employees per 10,000 Residents
60

FISCAL YEAR 16-17 17-18 17-18 17-18 17-18 17-18 17-18
Department ADOPTED ADDED TRANSFERS DELETED
UNDER
FUNDED
TOTAL
FUNDED PROPOSED
Animal Services 57 1 58 58
Community Development 145 1 (1) 145 146
Construction & Design 0 0 0
County Administration 29 1 2 32 32
County Attorney 22 (1) 21 22
County Commissioners 11 11 11
County Lands 10 1 11 11
Economic Development 9 (1) 8 8
Environmental Policy Mgmt 0 0 0
Facilities 140 (5) 135 135
Fleet Management 32 (1) 31 31
GIS 5 5 5
Hearing Examiner 5 5 5
Human Resources 28 (1) 27 28
Human Services 58 1 (1) 58 59
Internal Services 11 11 11
Library 254 (1) 253 253
Natural Resources 49 (1) (1) 47 48
Parks & Recreation 252 2 254 254
Public Resources 0 0 0
Public Safety 383 9 (1) 391 391
Procurement 15 2 1 18 18
Office of Sustainability 0 0 0
Solid Waste 105 7 112 112
Sports Development 4 4 4
Technology Services 5 3 8 8
Transit 267 1 (1) 267 268
Transportation 323 (1) 322 322
Utilities 274 4 278 278
Visitor & Convention Bureau 33 33 33
GRAND TOTAL 2,526 25 0 0 (6) 2,545 2,551
POSITION SUMMARY BY DEPARTMENT
61

MAJOR MAINTENANCE PROGRAM
The Major Maintenance Program projects are classified as operating expenses rather than capital
expenses, because the work consists of repairs and renovations to existing assets. The Major
Maintenance Program also includes funding to other entities as pass through for
maintenance/renovations. Major maintenance projects are a minimum of $25,000, with the exception of
pass through funding. Projects funded with grant dollars from South Florida Water Management District
(SFWMD), West Coast Inland Navigational District (WCIND), and state and federal agencies are
considered pass through funding.
Attached is a complete listing of the Major Maintenance Program approved by the Board of County
Commissioners.
62

PROJECT TITLE Funding
All Project
Cost prior
to FY 16/17
FY 16-17
Original
Budget
CURRENT
BUDGET
FY 16-17
Spent as of Feb
2017
FY 17-18
Proposed
Budget
FY 18-19
Proposed
Budget
FY 19/20
Proposed
Budget
FY 20/21
Proposed
Budget
FY21/22
Proposed
Budget
Five Year
Project
Total
COMMUNITY DEV
Environmental Mitigation 40400700100 GF 179,751 58,334 106,508 14,587 58,334 58,334 58,334 58,334 66,667 300,003
Environmental Mitigation 40400730700 GT 881,795 58,333 117,657 16,638 58,333 58,333 58,333 58,333 66,667 299,999
Environmental Mitigation 40400748730 E 163,944 58,333 108,106 9,293 58,333 58,333 58,333 58,333 66,666 299,998
TOTAL 1,225,491 175,000 332,271 40,518 175,000 175,000 175,000 175,000 200,000 900,000
COUNTY LANDS TOTAL
County Held Tax Certificates 40882800100 GF 71,397 50,000 50,000 50,000 50,000 50,000 50,000 50,000 250,000
Cty Owned Real Prop Assessment 40882900100 GF 1,477,065 220,000 220,000 215,677 260,000 260,000 260,000 260,000 260,000 1,300,000
TOTAL 1,548,463 270,000 270,000 215,677 310,000 310,000 310,000 310,000 310,000 1,550,000
DOT
ADA Plan Implementation 40607930700 GT 355,971 250,000 394,029 62,746 250,000 250,000 250,000 250,000 250,000 1,250,000
Master Bridge Project 40571430700 GT 7,876,765 436,995 436,995 0 554,460 555,000 580,000 620,000 590,000 2,899,460
Master Signal Project 40671330700 GT 8,610,712 1,500,000 1,878,846 70,963 1,500,000 1,500,000 1,500,000 1,500,000 1,500,000 7,500,000
Midpoint/LeeWay Facil Painting 40676142133/35 ST 950,000 950,000
Overhead Sign Structures Eval 40894430700 GT 130,000 260,000 130,000 130,000 130,000 130,000 130,000 650,000
Road Resurface Rebuild Program 40468330700 GT 41,768,982 4,000,000 7,368,776 2,263,039 4,000,000 4,000,000 4,000,000 4,000,000 4,000,000 20,000,000
Road Resurface/Rebuild Program-Del Prado 40095130700 GT 1,150,000 1,150,000 1,150,000 1,150,000 4,600,000
Lehigh Rd Resurface Rebld Prg 44671530700 GIF 5,000,000 5,000,000 5,000,000 5,000,000 5,000,000 25,000,000
Roadway Beautification 44602430700 GIF 100,000 100,000 100,000 100,000 100,000 100,000 100,000 500,000
Roadway Lighting Upgrade 40608030700 GT 450,000 450,000 69 450,000 450,000 450,000 450,000 450,000 2,250,000
Signal Network 40671430700 GT 120,000 120,000 63,859 120,000 120,000 120,000 120,000 120,000 600,000
Signal Maintenance Upgrades 40667030700 GT 1,034,659 350,000 522,431 73,304 350,000 350,000 350,000 350,000 350,000 1,750,000
Sign Replacement Program 40676330700 GT 100,000 150,000 150,000 0 150,000 150,000 150,000 150,000 150,000 750,000
Traffic Signal Technolgy 40095030700 GT 250,000 250,000 250,000 250,000 250,000 1,250,000
TOTAL 59,747,088 7,486,995 11,681,077 2,533,979 14,954,460 14,005,000 14,030,000 14,070,000 12,890,000 69,949,460
NATURAL RESOURCES
Blind Pass Eco Zone 40309130101 Tour 2,357,079 1,150,000 1,439,519 28,302 50,000 50,000 50,000 100,000 1,000,000 1,250,000
Bonita Beach Renourishment 40303900100 GF 1,077,642 0 48,958 1,287 15,538 15,538
Bonita Beach Renourishment 40303930101 Tour 1,229,971 0 62,000 1,611 19,462 225,000 2,500,000 2,744,462
Captiva Renourishment 40306130101 Tour 7,081,375 0 18,626 0 6,500,000 6,500,000
CW Boat Ramp Repair 40864200100 GF 65,055 10,000 20,000 0 10,000 10,000 10,000 10,000 10,000 50,000
CW Boat Ramp Repairs 40864230104 Boat 52,930 50,000 51,680 1,950 50,000 50,000 50,000 50,000 50,000 250,000
CW Boating Improvement Program 40320730104 Boat 200,000 200,000 200,000 200,000 200,000 200,000 200,000 1,000,000
Gasparilla Isl Bch Restoration 40302330101 Tour 5,322,522 100,000 100,000 0 100,000 65,000 65,000 65,000 65,000 360,000
Lovers Key Bch Restoration 40302430101 Tour 594,656 16,000 315,750 0 16,000 500,000 516,000
Maintenance Dredging 40854400100 GF 131,598 30,000 30,000 0 30,000 30,000 30,000 30,000 30,000 150,000
Surface Water Management Plan 40098315500 MSTU 1,000,424 250,000 293,417 53,163 550,000 250,000 250,000 250,000 250,000 1,550,000
Uninc LC Clean & Snag Program 40855815500 MSTU 1,200,111 280,000 411,684 119,594 280,000 280,000 280,000 280,000 280,000 1,400,000
Uninc LC Filter Marsh & BMP 40313315500 MSTU 1,140,387 400,000 479,127 56,291 400,000 400,000 400,000 400,000 400,000 2,000,000
Uninc LC Neighbor Imp Prg 40851415500 MSTU 1,065,674 250,000 293,803 49,790 250,000 250,000 250,000 250,000 250,000 1,250,000
TOTAL 22,319,423 2,736,000 3,764,564 311,989 1,920,000 1,585,000 1,620,000 8,376,000 5,535,000 19,036,000
MAJOR MAINTENANCE FY 17/18 - FY 21/22
63

PROJECT TITLE Funding
All Project
Cost prior
to FY 16/17
FY 16-17
Original
Budget
CURRENT
BUDGET
FY 16-17
Spent as of Feb
2017
FY 17-18
Proposed
Budget
FY 18-19
Proposed
Budget
FY 19/20
Proposed
Budget
FY 20/21
Proposed
Budget
FY21/22
Proposed
Budget
Five Year
Project
Total
PARKS & REC
County Wide Park Improvements 40214100100 GF 2,020,800 700,000 700,000 76,207 850,000 850,000 900,000 900,000 950,000 4,450,000
N. Ft. Myers Park Improvements 40164100100 GF 100,000 100,000
Parks Restrooms Upgrades 40160200100 GF 160,000 90,000 250,000
Pool Improvements 40167400100 GF 1,034,937 50,000 50,000 45,860 150,000 50,000 150,000 50,000 150,000 550,000
Pool Maintenance & Repairs 40182300100 GF 432,931 40,000 40,000 20,334 40,000 40,000 40,000 40,000 40,000 200,000
Replacement Parking Machines 40183400100 GF 362,055 20,000 20,000 0 20,000 20,000 70,000 70,000 70,000 250,000
Stadium R & R - JetBlue Park 40159930102 Tour 331,380 125,000 125,978 35,840 125,000 125,000 125,000 125,000 125,000 625,000
Stadium R & R -Hammond Stadium 40173430102 Tour 309,860 120,000 269,431 602 120,000 120,000 120,000 120,000 120,000 600,000
Stadiums Maint & Improvements 40212200100 GF 587,038 56,100 121,334 0 33,750 433,400 30,100 39,800 56,100 593,150
Stadiums Maint & Improvements 40212230102 Tour 6,013,243 750,500 823,537 115,541 1,601,310 688,278 1,121,250 608,000 699,500 4,718,338
Stadiums Maint & Improvements 40212230111 Tour 361,642 150,000 290,970 49,587 150,000 150,000 300,000
Veterans Skateboard Park 40215500100 GF 0 0 250,000 250,000
TOTAL 19,583,414 2,311,600 2,838,346 343,971 3,340,060 2,576,678 2,716,350 2,042,800 2,210,600 12,886,488
SOLID WASTE
R&R - Asphalt Repairs 40094540120 E 115,000 115,000 115,000 115,000 115,000 575,000
C&D Facility Improvements 40094640120 E 175,000 175,000
R&R - C&D Facility 40094240120 E 92,500 92,500 92,500 92,500 92,500 462,500
R&R - Church Road 40094440120 E 100,000 100,000
R&R - Compost Equipment 40094340120 E 88,000 80,000 80,000 80,000 80,000 408,000
R&R - Lndfl Leachate Sys Main 40094140120 E 38,000 38,000 38,000 38,000 38,000 190,000
R&R - Recycling Equipment 40094040120 E 80,000 45,000 45,000 170,000
R&R - Recycling Facility 40093940120 E 768,476 1,476,483 54,781 90,000 35,000 35,000 35,000 35,000 230,000
TOTAL 768,476 - 1,476,483 54,781 678,500 460,500 405,500 405,500 360,500 2,310,500
UTILITIES
Plant Demolitions 40711548730 E 250,000 1,000,000 1,500,000 2,750,000
Wastewater Coll Rehab & Replac 40730948720 E 3,346,515 500,000 762,414 176,651 700,000 700,000 700,000 700,000 700,000 3,500,000
Water Dist Rehab & Replacement 40744348720 E 2,575,639 350,000 350,000 38,031 350,000 350,000 350,000 350,000 350,000 1,750,000
Water Treat. Plant Rehab/Repla 40760348720 E 2,970,056 439,100 439,100 17,500 416,500 405,100 412,000 560,000 510,000 2,303,600
Well Rehab & Replacement 40761648720 E 623,471 902,000 902,000 13,950 875,000 200,000 200,000 200,000 200,000 1,675,000
WWTP Rehab & Replacement 40731748720 E 2,692,996 574,000 795,897 252,631 573,000 689,500 725,000 947,500 675,000 3,610,000
TOTAL 12,208,676 2,765,100 3,249,411 498,764 2,914,500 2,594,600 3,387,000 4,257,500 2,435,000 15,588,600
64

PROJECT TITLE Funding
All Project
Cost prior
to FY 16/17
FY 16-17
Original
Budget
CURRENT
BUDGET
FY 16-17
Spent as of Feb
2017
FY 17-18
Proposed
Budget
FY 18-19
Proposed
Budget
FY 19/20
Proposed
Budget
FY 20/21
Proposed
Budget
FY21/22
Proposed
Budget
Five Year
Project
Total
FACILITIES
Admin Bldg & SIte Renovations 40890800100 GF 25,750 26,523 52,273
Admin Bldg Fresh Air Unit 40896200100 GF 80,000 80,000
Admin Building Duct Repl 40896400100 GF 50,000 50,000
Admin East Chiller Replacement 40886600100 GF 149,236 200,000 200,000
Buckingham Comm Pk Lights 40215100100 GF 150,000 300,000 450,000
CD/PW Chiller Plt Pump Rep 40160100100 GF 150,000 150,000
Civic Center Maintenance 40893300100 GF 100,000 200,000 99,054 103,000 106,090 109,273 112,551 115,928 546,842
Cnty/City Annex Seal Ext Windo 40891500100 GF 75,000 75,000
CW ADA Compliance 40883913841 S 152,277 13,432 22,536 750 8,000 8,000 8,000 8,000 8,000 40,000
CW Asphalt Parking Lots 40867300100 GF 1,009,079 301,800 351,221 55,882 250,000 257,500 265,225 273,182 281,377 1,327,284
CW Asphalt Parking Lots -Libraries 40867314800 L 133,262 75,000 75,000 2,345 25,000 53,026 30,457 118,220 28,138 254,841
CW Boardwalk Repair 40182500100 GF 681,640 130,000 130,000 23,984 90,000 100,000 103,000 106,090 109,273 508,363
CW Building Maintenance 40870000100 GF 5,397,637 600,000 855,649 138,952 700,000 721,000 750,000 772,500 795,675 3,739,175
CW Canvass Awnings Replace 40891600100 GF 27,762 60,000 60,000 16 61,800 63,654 65,564 67,531 69,556 328,105
CW Electrical Improvements 40886100100 GF 239,509 115,000 145,098 11,898 186,310 110,000 103,000 106,090 109,272 614,672
CW Electrical Imps - Libraries 40886114800 L 2,000 17,060 52,122 27,185 2,251 100,618
CW Elevator Upgrade/Maint 40879600100 GF 659,063 40,000 62,492 10,475 41,200 42,436 43,709 45,020 46,370 218,735
CW Exterior Paint/Recoat 40896800100 GF 1,128,168 169,654 178,805 9,151 243,471 226,120 216,314 288,764 269,322 1,243,991
CW Exterior Paint/Recoat - Libraries 40896814800 L 94,291 16,497 16,497 38,760 66,756 48,013 156,494 37,589 347,612
CW Fire Alarm Sys & Pumps 40886200100 GF 169,777 250,000 345,167 107,554 257,500 260,000 267,800 270,000 278,100 1,333,400
CW Fire Alarm Sys & Pumps - Libraries 40886214800 L 75,000 77,250 79,568 81,955 84,413 398,186
CW Flooring Replacement 40874300100 GF 1,697,645 600,000 744,468 124,705 648,500 780,045 945,636 1,223,276 550,000 4,147,457
CW Flooring Replacement - Libraries 40874314800 L 294,005 28,000 103,000 105,300 197,609 30,927 156,255 111,592 601,683
CW Fuel Facilities 40866100100 GF 1,375,696 4,879 1,878 40,000 41,200 42,436 43,709 45,020 212,365
CW Generator Maint & Repl 40870800100 GF 1,094,997 300,000 400,579 250,000 100,000 350,000
CW HVAC Replacement & Control 40897100100 GF 836,725 246,000 272,400 50,672 109,000 263,159 231,250 426,450 176,350 1,206,209
CW HVAC Replacement & Control - Libraries 40897114800 L 366,406 336,000 479,549 1,132 308,000 150,300 230,000 35,450 289,000 1,012,750
CW Indoor Air QC & Remedation 40867500100 GF 339,694 70,000 105,235 34,672 72,100 74,263 76,491 78,786 86,945 388,585
CW Irrigation & Plumbing 40879400100 GF 1,399,960 160,000 160,000 26,524 300,000 247,000 454,350 177,067 570,171 1,748,588
CW Irrigation & Plumbing - Libraries 40879414800 L 1,584 7,000 7,000 7,000 20,513 5,788 6,078 6,381 45,760
CW LED Lighting Upgrades 40896000100 GF 50,000 51,500 53,045 100,000 103,000 357,545
CW Library Misc Main - Libraries 40892614800 L 26,899 50,000 73,101 4,936 50,000 51,500 53,045 54,636 56,274 265,455
CW Modular Furniture/Panels 40863900100 GF 599,159 100,000 100,000 709 50,000 51,500 53,045 54,636 56,275 265,456
CW Reroofing Projects/Repl 40860300100 GF 3,658,275 150,000 330,872 96,697 427,400 360,000 266,400 173,500 160,500 1,387,800
CW Reroofing Projects/Repl - Libraries 40860314800 L 127,486 60,000 60,000 15,450 15,913 16,390 33,881 17,387 99,021
Downtown Jail Plumbing 40893400100 GF 22,500 100,000 168,430 71,184 103,000 106,090 109,273 112,551 115,927 546,841
Downtown Parking Lots Lighting 40163800100 GF 60,000 60,000
Human Services Air Handlr Repl 40895000100 GF 200,000 200,000
Jail Chiller Replacements 40894900100 GF 700,000 700,000
Jail Sprung HVAC Replacement 40894800100 GF 580,000 580,000
Jail Sprung Units Reskin 40891800100 GF 655,000 655,000
Justice Ctr Air Handler Units 40865500100 GF 938,307 100,000 100,000 3,147 103,000 110,000 100,000 50,000 51,500 414,500
Justice Ctr BAS Energy Upgrade 40871200100 GF 512,877 75,000 76,716 77,250 79,568 81,955 84,413 86,945 410,131
Justice Ctr Central Ice Tanks 40894700100 GF 300,000 300,000
Justice Ctr Chillers Repl 40890100100 GF 500,000 500,000
Justice Ctr Proper Roof Replac 40892100100 GF 150,000 150,000 1,950,000 1,950,000
CW Building Renovations 40896300100 GF 21,935,584 0 2,344,531 338,571 2,950,000 2,000,000 2,400,000 500,000 7,850,000
65

PROJECT TITLE Funding
All Project
Cost prior
to FY 16/17
FY 16-17
Original
Budget
CURRENT
BUDGET
FY 16-17
Spent as of Feb
2017
FY 17-18
Proposed
Budget
FY 18-19
Proposed
Budget
FY 19/20
Proposed
Budget
FY 20/21
Proposed
Budget
FY21/22
Proposed
Budget
Five Year
Project
Total
FACILITIES Continued
Justice Ctr Security 40894100100 GF 75,000 225,000 1,875 77,250 79,568 81,955 84,413 86,945 410,131
Lakes Park Piling Replacement 40215000100 GF 500,000 500,000
Melvin Morgan Cplx HVAC Rep 40164000100 GF 150,000 154,500 159,135 163,909 627,544
Minor Remodeling Projects 40860700100 GF 2,332,936 150,000 244,607 7,815 154,500 159,135 163,909 168,826 173,891 820,261
Old Courthouse Air Hndlr Units 40894600100 GF 50,000 50,000
Old Courthouse Window Repair 40875600100 GF 119,587 25,000 45,000 27,000 30,000 57,000
Parking Lot Toll Eq Repl 40894500100 GF 35,000 35,000 70,000
Sheriff Buildings Improvements 40894200100 GF 4,045,541 700,000 1,060,542 28,355 835,000 587,000 599,360 912,091 655,204 3,588,655
TOTAL 51,567,565 5,353,383 9,698,374 1,252,932 11,259,791 9,207,005 8,596,435 8,560,032 6,814,571 44,437,834
Technology Services
Information Tech Office Consolidation 40323051500 0 400,000 372,908 0 372,908
TOTAL 0 0 400,000 0 372,908 0 0 0 0 372,908
GRAND TOTAL 168,968,596 21,098,078 33,710,526 5,252,610 35,925,219 30,913,783 31,240,285 38,196,832 30,755,671 167,031,790
66

67

68

FINANCIAL POLICY
TABLE OF CONTENTS
GENERAL BUDGET POLICY ................................................................................................................................................. 70
REVENUE POLICY ................................................................................................................................................................ 71
APPROPRIATION POLICY .................................................................................................................................................... 72
FUND TYPES ......................................................................................................................................................................... 73
69

GENERAL BUDGET POLICY
1. The operating budget authorizing expenditure of County money will be adopted annually by the Board at the fund level.
2. The budget must be balanced. This means that the budgeted expenditures and reserves of each fund
will equal the sum of projected fund balance at the beginning of the fiscal year, plus all revenues which reasonably can be expected to be received during the fiscal year (budgeted at 95%, in accordance with State Statutes).
3. A reserve for cash balance will be budgeted in any fund which requires monies to be carried forward
into the following year to support operations until sufficient current revenues are received, but in no case will exceed the projected cash needs for 90 days of operations, or 20% of the fund budget, whichever is greater.
4. Transfers to reserve accounts may be made during the fiscal year by the County Manager or the CFO,
if allocations to expenditure accounts are determined to be unneeded. 5. Transfers among expenditure or revenue accounts may be made during the fiscal year by the County
Manager, the CFO, or Department Directors if reallocations within a fund are determined to be needed. No transfers will be made without Board authority which have an impact on capital improvement projects. Any transfer affecting the total allocations of Constitutional Officers may not be made without Board approval.
6. Transfers from reserves can be made with County Manager approval up to $25,000. Transfers from
reserves of more than $25,000 require approval of the Board. Changes in the adopted total budget of a fund will be made only with Board approval of a budget amendment resolution.
7. Budget Services will prepare a periodic analysis of financial condition as well as a Debt Service
Manual to provide information on the County's debt program. 8. For purposes of budget preparation, in the event policies or stated desires of the Board regarding
appropriations or service levels prove to be incompatible with forecasted revenues or revenue policies, these conflicts will be resolved in favor of the revenue policy.
9. The Capital Improvement Budget, showing estimated annualized costs of capital projects, will be
updated on an annual basis. Potential projects are subject to evaluation in accordance with CIP Administrative Code AC-3-9 to determine eligibility for Board of County Commissioners consideration. Potential projects are prioritized according to necessity of the project and reviewed for the operating impact of the project.
10. The Long Range Plan of the Operating Budget is a five-year projection of revenues and expenses for
the millage funds.
70
REVENUE POLICY
1. The use of County ad valorem tax revenues will be limited to the General, Unincorporated MSTU, Library, Capital Improvement/Conservation 2020, and All Hazards Protection funds unless required in other funds by bond indenture agreements, or by the terms of municipal service taxing or benefit units.
2. The use of gas tax revenues will be limited to the Transportation Trust and Transportation Projects
Funds and transit operations unless required in other funds by bond indenture agreements. 3. The use of sales tax revenues will be limited to the General and Unincorporated MSTU funds, unless
required in other funds by bond indenture agreements.
4. Pursuant to Ordinance 09-01, as amended, Tourist Development Tax proceeds will be appropriated as follows:
53.6% for tourist advertising and promotion for Lee County;
20.0% for stadium debt service/sports development;
26.4% for beach related improvements. 5. The use of revenues which have been pledged to bondholders will conform, in every respect, to bond
covenants which commit those revenues. 6. Budget Services will maintain a Revenue Manual to provide information about revenue sources
available to support County expenditures. 7. Periodic cost studies of County services for which user fees are imposed will be prepared, and
proposed fee adjustments will be presented for Board consideration. Fee revenues will be anticipated, for purposes of budget preparation, using fee schedules which have been adopted by the Board.
8. County staff will continue to aggressively pursue cost effective grant funding opportunities. 9. Ad valorem taxes will be anticipated for purposes of operating budget preparation at:
95% of the projected taxable value of current assessments; and,
95% of the projected taxable value resulting from new construction. 10. Millages for debt service will be established at the amounts which will generate sufficient revenue to
make all required payments.
11. The County will allocate countywide revenues to the General, Capital Improvement, and Conservation Land/Acquisition fund uses.
12. All revenues which are reasonably expected to be unexpended and unencumbered at the end of the
fiscal year will be anticipated as "Fund Balance" and budgeted accordingly for the following fiscal year.
71
APPROPRIATION POLICY
1. Fund appropriations of the Board will be allocated to departments, divisions, programs, projects, grants, and line item object codes as deemed appropriate by the County Manager, CFO, or Department Directors to facilitate managerial control and reporting of financial operations.
2. Each year the County, in conjunction with an independent consultant, will prepare an indirect cost
allocation plan which conforms to federal guidelines for grant reimbursement of administrative costs, and will bill and collect indirect cost charges where appropriate.
3. Each year the County will prepare a comprehensive five-year Capital Improvement Program identifying
public facilities by service type and geographic area, which will eliminate existing deficiencies, replace inadequate facilities, and address infrastructure needs caused by new growth.
4. The annual budget will include sufficient appropriations to fund capital projects approved by the Board
of County Commissioners for the purpose of completing the first year of the five-year Capital Improvement Program. Operating budget implications of these capital projects will also be identified and budgeted accordingly.
72

FUND TYPES
GOVERNMENTAL FUNDS
General Fund
The General Fund is the general operating fund of the Board of County Commissioners and supports activities of a countywide benefit. It is used to account for most of the budgets of elected officials and general County operating departments.
Special Revenue Funds
Special Revenue Funds are used to account for the proceeds of specific revenue sources that are legally restricted for specified purposes. Examples of special revenue funds are:
Special Assessment Funds Special Assessment Funds are used to account for the financing of public improvements or services deemed to benefit the properties against which they are levied.
MSTU (Municipal Services Taxing Unit) Fund A MSTU is a special unit authorized by the State Constitution Article VII and the Florida Statutes 125.01. The MSTU is a legal and financial mechanism for providing specific services and/or improvements to a defined geographical area. The MSTU is a dependent special district with the Board of County Commissioners acting as the Governing Body.
Transportation Trust Fund The Transportation Trust Fund provides for transportation services such as road and bridge maintenance, and engineering and design services for transportation-related capital projects.
Debt Service Funds
Debt Service Funds are used to account for the accumulation of resources for, and the payment of, general long-term debt principal, interest and related debt service costs.
Capital Project Funds
Capital Project Funds account for financial resources to be used for the acquisition and construction of major capital facilities (other than those financed by Proprietary Funds, Special Assessment Funds, Trust Funds and Special Revenue Funds).
Permanent Fund Permanent Funds account for resources that are legally restricted to the extent that only earnings and not principal may be used for government purposes.
73
FUND TYPES (continued)
PROPRIETARY FUNDS
There are two types of proprietary funds:
Enterprise Funds Enterprise Funds are used to account for operations: (a) that are financed and operated in a manner similar to private business enterprise - where the intent of the governing body is that the costs (expenses, including depreciation) of providing goods or services to the general public on a continuing basis be financed or recovered primarily through user charges; or (b) where the governing body has decided that periodic determination of revenues earned, expenses incurred, and/or net income is appropriate for capital maintenance, public policy, management control, accountability, or other purposes.
Internal Service Funds The County uses self-supporting Internal Service Funds to provide self-insurance, data processing, vehicle maintenance, and telephone/radio services to County departments on a cost reimbursement basis.
FIDUCIARY FUNDS
Trust and Agency Funds
Trust and Agency Funds account for assets held in trust (a) for members and beneficiaries of defined benefit pension plans or other employee benefit plans; (b) for reporting of governmental external investment pools and (c) where earned interest and principal benefit individuals, private organizations or other government.
74

SERVICES BY ORGANIZATION
TABLE OF CONTENTS
SERVICES BY ORGANIZATION ................................................................................................................................. 76
BOARD OF COUNTY COMMISSIONERS .................................................................................................................. 77
COUNTY MANAGER ................................................................................................................................................... 79
ASSISTANT COUNTY MANAGER .............................................................................................................................. 80
ASSISTANT COUNTY MANAGER/CHIEF FINANCIAL OFFICER .............................................................................. 84
ASSISTANT COUNTY MANAGER .............................................................................................................................. 86
ASSISTANT COUNTY MANAGER .............................................................................................................................. 90
ASSISTANT TO THE COUNTY MANAGER ................................................................................................................ 94
COURTS AND CONSTITUTIONAL OFFICERS .......................................................................................................... 96
75

SERVICES BY ORGANIZATION
The Lee County Government organization includes several areas of service, each designated into one or more divisions. This section presents the budget by division. Some divisions are independent of any departmental structure. A division may be further divided into one or more programs. Each area falls into one of the following three categories: Legislative/Administrative, Service Delivery, and Support Services. Legislative/Administrative departments report to the Board of County Commissioners; Service Delivery and Support Services departments report to one of the five Assistant County Managers. The areas under the Legislative/Administrative category include: the Board of County Commissioners, County Administration, County Attorney, and Hearing Examiner. Service Delivery Departments include: Community Development, Human Services, Veterans Services, Public Safety, Animal Services, Library, Parks & Recreation, Transit, Economic Development, Utilities, Solid Waste, Natural Resources, Visitor & Convention Bureau and Transportation. Support Services includes Technology Services, Fiscal Internal Services, Procurement Management, GIS, Fleet Management, County Lands, Office of Management and Budget, Facilities Construction and Management, Human Resources, and Sports Development. The latter part of this section is comprised of Court-Related services and Constitutional Officers' budgets. Constitutional Officers are county elected officials who do not report to the Board of County Commissioners, but receive operating funds from the County. A brief service description is provided for each area with a budgetary summary of all the divisions and programs in that area. The budget information provides FY15-16 actual expenses, FY16-17 unaudited actuals, and FY17-18 adopted budget by division.
76

County Commissioners
LEE COUNTY - FLORIDA2017 - 2018
ACTUAL2015 - 2016
UNAUDITED
ACTUAL
2016 - 2017ADOPTED2017 - 2018
DEPARTMENT/DIVISION/PROGRAM
County Commissioners
$ 1,407,494 $ 1,408,100 $ 1,475,748 Board of County Commissioners
$ 1,407,494 $ 1,408,100 $ 1,475,748 Total
County Manager
$ 2,396,116 $ 2,872,689 $ 2,566,700 County Manager
$ 0 $ 1 $ 363,336 Cty Admin Communications
$ 2,396,116 $ 2,872,690 $ 2,930,036 Total
County Attorney
$ 2,961,520 $ 3,005,634 $ 3,238,404 Legal Counsel
$ 2,416 $ 0 $ 2,450 Special Master Process
$ 2,963,936 $ 3,005,634 $ 3,240,854 Total
Hearing Examiner
$ 742,727 $ 761,248 $ 795,458 Hearing Examiner
$ 742,727 $ 761,248 $ 795,458 Total
$ 7,510,273 $ 8,047,672 $ 8,442,096GRAND TOTAL
EXPENDITURES BY FUND TYPE
$ 6,765,130 $ 7,286,424 $ 7,644,188General Fund
$ 745,143 $ 761,248 $ 797,908Special Revenue Fund
GRAND TOTAL $ 7,510,273 $ 8,047,672 $ 8,442,096
77

78
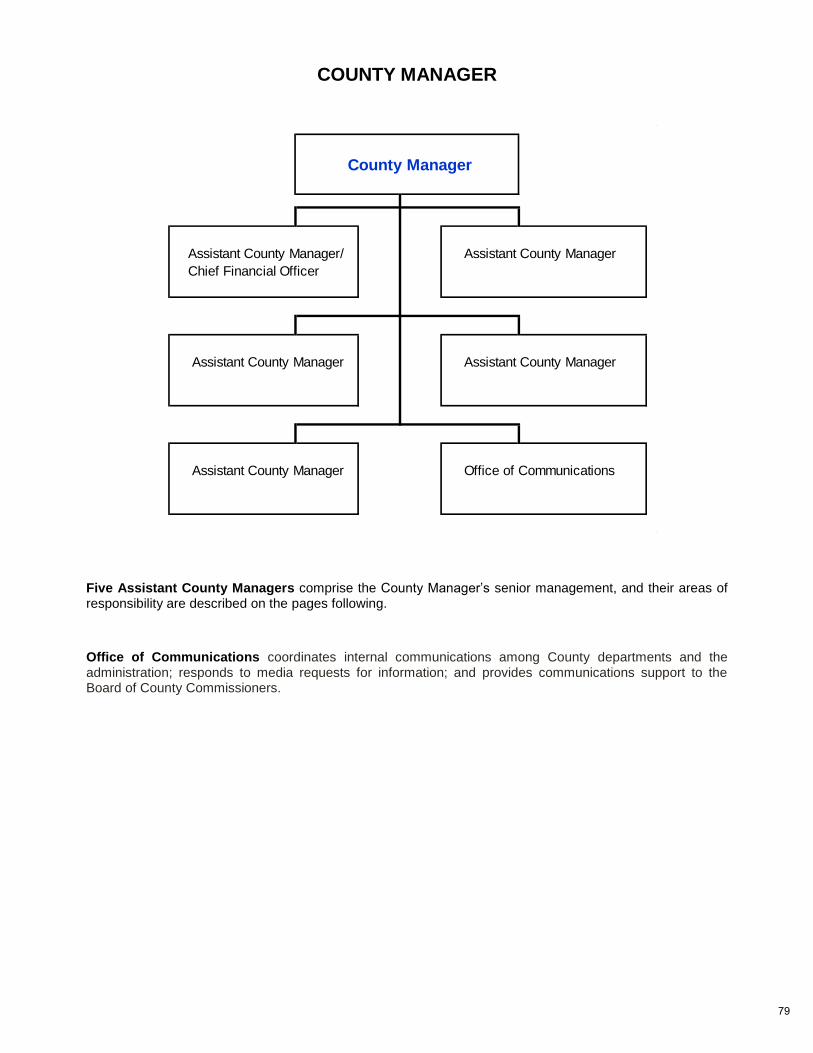
COUNTY MANAGER
Five Assistant County Managers comprise the County Manager’s senior management, and their areas of responsibility are described on the pages following.
Office of Communications coordinates internal communications among County departments and the administration; responds to media requests for information; and provides communications support to the Board of County Commissioners.
Assistant County Manager/ Assistant County Manager
Chief Financial Officer
Assistant County Manager Assistant County Manager
Assistant County Manager Office of Communications
County Manager
79
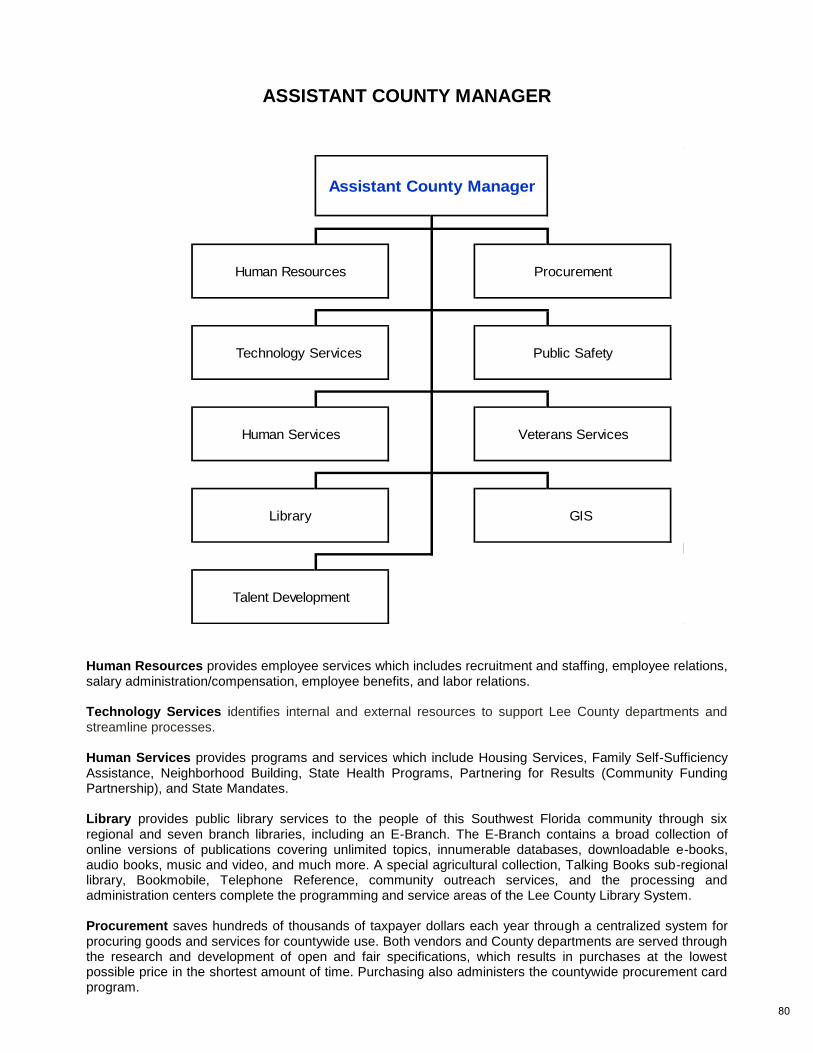
ASSISTANT COUNTY MANAGER
Human Resources provides employee services which includes recruitment and staffing, employee relations, salary administration/compensation, employee benefits, and labor relations. Technology Services identifies internal and external resources to support Lee County departments and streamline processes. Human Services provides programs and services which include Housing Services, Family Self-Sufficiency Assistance, Neighborhood Building, State Health Programs, Partnering for Results (Community Funding Partnership), and State Mandates. Library provides public library services to the people of this Southwest Florida community through six regional and seven branch libraries, including an E-Branch. The E-Branch contains a broad collection of online versions of publications covering unlimited topics, innumerable databases, downloadable e-books, audio books, music and video, and much more. A special agricultural collection, Talking Books sub-regional library, Bookmobile, Telephone Reference, community outreach services, and the processing and administration centers complete the programming and service areas of the Lee County Library System. Procurement saves hundreds of thousands of taxpayer dollars each year through a centralized system for procuring goods and services for countywide use. Both vendors and County departments are served through the research and development of open and fair specifications, which results in purchases at the lowest possible price in the shortest amount of time. Purchasing also administers the countywide procurement card program.
Talent Development
Assistant County Manager
Human Resources
Technology Services
Human Services
Library
Procurement
Public Safety
GIS
Veterans Services
80

ASSISTANT COUNTY MANAGER (continued) Public Safety provides services to citizens and visitors of Lee County including emergency medical services, emergency management services, government communications, emergency dispatch and emergency telephone system (E-911). Veterans Services counsels, advises, and assists Lee County veterans and their dependents with obtaining benefits, and acts as a liaison between Lee County government, the media, and the general public on veteran-related matters. GIS provides interactive maps and apps to look up Lee County services and information such as commissioner districts, waste pick-up days and flood zone, provides access to land records, reports about property, infrastructure, flood ways, special districts, zoning and other regulatory boundaries.
Talent Development is an internal department that serves Lee County employees through learning and development opportunities. Employee development strengthens the service provided both internally and to the public.
81

Assistant County Manager
LEE COUNTY - FLORIDA2017 - 2018
ACTUAL2015 - 2016
UNAUDITED
ACTUAL
2016 - 2017ADOPTED2017 - 2018
DEPARTMENT/DIVISION/PROGRAM
County Manager
$ 0 $ 26 $ 370,339 Cty Adm Talent Development
$ 197,078 $ 0 $ 0 Veterans Services
$ 197,078 $ 26 $ 370,339 Total
Human Services
$ 352,379 $ 365,642 $ 553,236 Human Svcs Fiscal Mgmt.
$ 306,482 $ 354,866 $ 479,466 Neighborhood Bldg Program
$ 738,271 $ 674,671 $ 766,989 Human Srvcs Admin/Clerical
$ 0 $ 256,574 $ 314,953 Veterans Services
$ 3,765,399 $ 5,284,948 $ 4,803,264 Neighborhood Improvements
$ 221,516 $ 309,806 $ 110,000 Administration & Housing Asst
$ 1,692,864 $ 1,596,047 $ 834,751 Housing Services/General
$ 4,180 $ 410 $ 150,000 Homeowner Assistance
$ 5,194,772 $ 5,239,222 $ 5,482,451 State Mandated Programs
$ 214,177 $ 403,365 $ 137,500 State Health Programs
$ 1,517,457 $ 1,665,824 $ 2,096,475 Family Services Unit Program
$ 2,158,817 $ 1,590,348 $ 30,800 Supportive Housing Program
$ 371,364 $ 300,851 $ 146,378 Non Grant Donations
$ 4,299,771 $ 4,344,519 $ 5,061,363 Partnering For Results
$ 20,837,449 $ 22,387,093 $ 20,967,626 Total
State Health Programs
$ 2,274,085 $ 2,270,826 $ 2,285,866 State Health Programs
$ 2,274,085 $ 2,270,826 $ 2,285,866 Total
Procurement Management
$ 1,129,931 $ 1,574,789 $ 1,874,531 Procurement Management
$ 1,129,931 $ 1,574,789 $ 1,874,531 Total
Technology Services
$ 3,605,518 $ 3,715,215 $ 3,714,952 Telephones
$ 7,895,412 $ 9,593,723 $ 9,258,208 Data Processing
$ 435,104 $ 605,192 $ 516,590 Public Resources
$ 11,936,034 $ 13,914,130 $ 13,489,750 Total
Human Resources
$ 2,150,661 $ 2,249,359 $ 2,882,318 Human Resources
$ 99,933 $ 66,368 $ 0 Human Resources - Training
$ 2,250,594 $ 2,315,727 $ 2,882,318 Total
Public Safety
$ 22,188 $ 22,188 $ 22,619 Fire Protection
$ 592,642 $ 535,358 $ 143,241 Emergency Mgmt Operations
$ 1,659,599 $ 1,792,112 $ 1,819,215 All Hazards Protections
$ 34,248,348 $ 35,836,001 $ 37,018,846 Emergency Response
82

ASSISTANT COUNTY MANAGER (continued)
ACTUAL2015 - 2016
UNAUDITED
ACTUAL
2016 - 2017ADOPTED2017 - 2018
DEPARTMENT/DIVISION/PROGRAM
$ 3,182,004 $ 3,509,607 $ 3,635,264 Emergency Dispatching
$ 4,398,719 $ 2,275,350 $ 2,860,313 E911 Implementation
$ 2,672,287 $ 2,471,816 $ 2,656,489 Govt Communications Network
$ 2,675,023 $ 2,928,900 $ 3,038,070 Pub Safety-Logistics
$ 49,450,810 $ 49,371,332 $ 51,194,057 Total
Library
$ 26,239,034 $ 26,245,706 $ 27,798,503 Library Services
$ 26,239,034 $ 26,245,706 $ 27,798,503 Total
GIS Operations
$ 684,129 $ 762,567 $ 1,005,762 GIS Operations
$ 684,129 $ 762,567 $ 1,005,762 Total
$ 114,999,144 $ 118,842,196 $ 121,868,752GRAND TOTAL
EXPENDITURES BY FUND TYPE
$ 62,937,961 $ 65,991,053 $ 68,163,291General Fund
$ 36,669,785 $ 34,792,170 $ 36,203,084Special Revenue Fund
$ 338,181 $ 1,432,308 $ 784,386Capital Project Fund
$ 0 $ 0 $ 0Enterprise Fund
$ 15,053,217 $ 16,626,665 $ 16,717,991Internal Service Fund
GRAND TOTAL $ 114,999,144 $ 118,842,196 $ 121,868,752
83

ASSISTANT COUNTY MANAGER / CHIEF FINANCIAL OFFICER
Office of Management and Budget prepares and implements the County budget, develops forecasts, financial plans, fiscal reporting, management studies, grants management, and debt management.
County Lands provides real estate services to all County departments, including real estate acquisition, disposition and real estate inventory control.
Risk Management administers the County’s self-insurance program for worker’s compensation, general liability, automobile liability and property damage claims.
Office of Mgmt and Budget County Lands
Risk Management
Assistant County Manager /
Chief Financial Officer
84
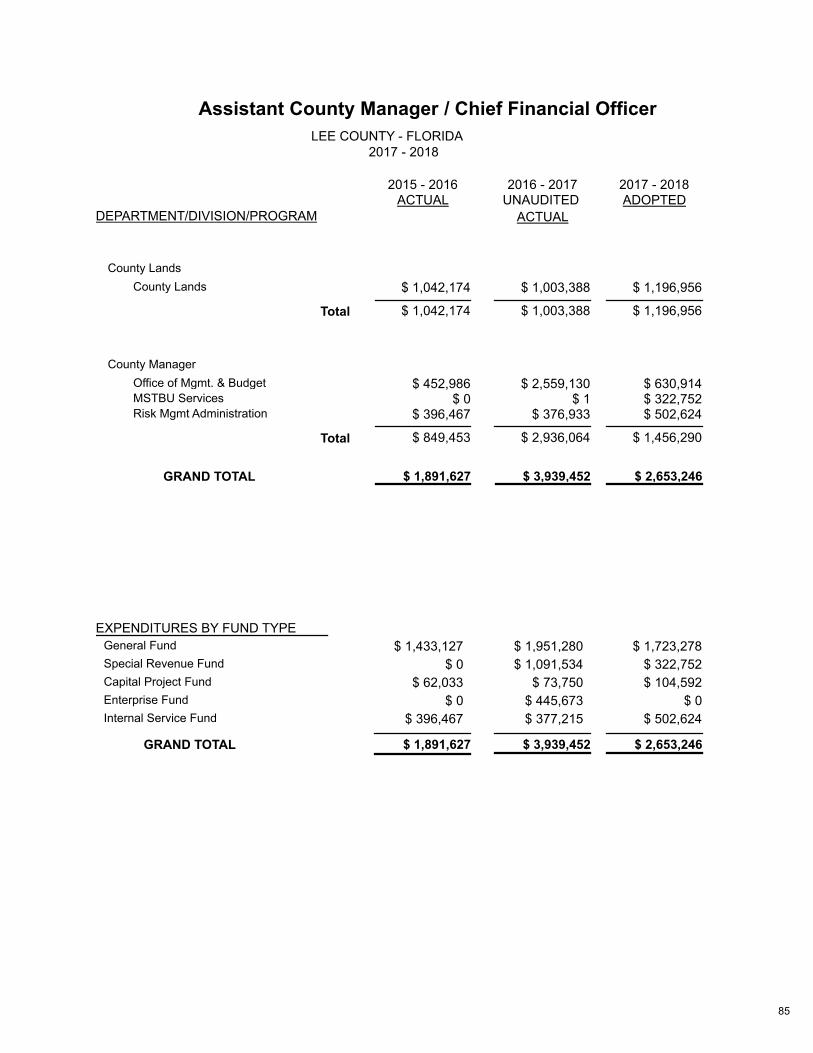
Assistant County Manager / Chief Financial Officer
LEE COUNTY - FLORIDA2017 - 2018
ACTUAL2015 - 2016
UNAUDITED
ACTUAL
2016 - 2017ADOPTED2017 - 2018
DEPARTMENT/DIVISION/PROGRAM
County Lands
$ 1,042,174 $ 1,003,388 $ 1,196,956County Lands
Total $ 1,042,174 $ 1,003,388 $ 1,196,956
County Manager
$ 452,986 $ 2,559,130 $ 630,914Office of Mgmt. & Budget
$ 0 $ 1 $ 322,752MSTBU Services
$ 396,467 $ 376,933 $ 502,624Risk Mgmt Administration
Total $ 849,453 $ 2,936,064 $ 1,456,290
$ 1,891,627 $ 3,939,452 $ 2,653,246GRAND TOTAL
EXPENDITURES BY FUND TYPE
General Fund $ 1,433,127 $ 1,951,280 $ 1,723,278
Special Revenue Fund $ 0 $ 1,091,534 $ 322,752
Capital Project Fund $ 62,033 $ 73,750 $ 104,592
Enterprise Fund $ 0 $ 445,673 $ 0
Internal Service Fund $ 396,467 $ 377,215 $ 502,624
GRAND TOTAL $ 1,891,627 $ 3,939,452 $ 2,653,246
85

ASSISTANT COUNTY MANAGER
Assistant County Manager
Community Development Solid Waste
Fleet Management Utilities
Department of Transportation
Community Development oversees planning, zoning, development and building services, environmental review, building inspection, and code enforcement for the unincorporated areas of Lee County.
Fleet Management provides cradle to grave services for County owned equipment, vehicle maintenance and repair, fuel management and disaster management plan, acquisition and disposal. Transportation maintains responsibility for all of the County’s transportation-related activities which include repair and maintenance of roads, signs, bridges, and canals; operation of three toll facilities and related bridges; engineering and management of transportation capital projects. Solid Waste provides a self-supported enterprise operation responsible for the mandatory countywide garbage collection program, the Waste-to-Energy facility and Transfer Station, the Compost Production facility, the Materials Recycling facility, the Construction & Demolition Debris Recycling facility, Lee/Hendry Landfill, Hendry County Transfer Stations and the household chemical waste collection system. Utilities provides a self-supported enterprise operation responsible for customer services and operation and management of water well fields, six water treatment facilities, eight wastewater treatment facilities and associated collection and distribution systems, including reclaimed water distribution systems.
86

Assistant County Manager
LEE COUNTY - FLORIDA2017 - 2018
ACTUAL2015 - 2016
UNAUDITED
ACTUAL
2016 - 2017ADOPTED2017 - 2018
DEPARTMENT/DIVISION/PROGRAM
Rezoning and DRI
$ 1,113,817 $ 1,173,335 $ 1,099,054 Rezoning & DRI's
$ 1,113,817 $ 1,173,335 $ 1,099,054 Total
Planning
$ 1,194,869 $ 1,240,253 $ 1,464,631 DCD - Planning
$ 0 $ 0 $ 50,000 Transfer Development Rights
$ 0 $ 509,343 $ 415,090 DOT Eng. - Planning
$ 1,134,597 $ 2,021,072 $ 2,082,328 Administration & Housing Asst
$ 2,329,466 $ 3,770,668 $ 4,012,049 Total
Environmental Sciences
$ 322,281 $ 0 $ 0 DCD Plan Env Svcs
$ 322,281 $ 0 $ 0 Total
Developmental Services
$ 1,339,811 $ 1,558,452 $ 1,673,971 Development Review
$ 326,609 $ 308,346 $ 266,814 Zoning Review
$ 1,537,399 $ 1,489,142 $ 1,853,222 Permit Issuance
$ 3,201,544 $ 3,599,388 $ 4,160,651 Building Inspections
$ 2,191,071 $ 2,245,091 $ 2,447,861 Code Enforcement
$ 1,333,965 $ 1,578,459 $ 1,578,937 Plans Review
$ 9,930,399 $ 10,778,878 $ 11,981,456 Total
Admin & Support
$ 1,419,303 $ 1,413,695 $ 1,317,663 DCD Admin & Support
$ 1,419,303 $ 1,413,695 $ 1,317,663 Total
PW/DCD Internal Services
$ 683,112 $ 851,140 $ 987,790 Internal Services Fiscal
$ 683,112 $ 851,140 $ 987,790 Total
Solid Waste
$ 521,816 $ 530,108 $ 361,311 Right of Way Cleanup
$ 25,323,445 $ 25,706,585 $ 26,528,218 Solid Waste Operations
$ 2,229,672 $ 2,421,599 $ 2,448,260 Recycling
$ 35,488,784 $ 35,856,354 $ 37,613,689 Disposal Facilities
$ 0 $ 0 $ 3,040 Solid Waste Control
$ 1,039,177 $ 1,091,637 $ 1,122,777 Hendry Co. Transfer Stations
$ 5,638,546 $ 5,676,178 $ 4,916,287 Lee/Hendry Landfill
$ 0 $(11,977) $ 3,061,165 Solid Waste Fleet
$ 70,241,440 $ 71,270,484 $ 76,054,747 Total
Utilities
$ 19,904 $ 20,515 $ 0 LCU - WW Treat - Waterway Est
$ 1,834,089 $ 1,977,902 $ 2,054,835 LCU - WW Treat Fiesta Village
$ 42,490 $ 0 $ 0 LCU Water Prod Waterway Est
87

ASSISTANT COUNTY MANAGER (continued)
ACTUAL2015 - 2016
UNAUDITED
ACTUAL
2016 - 2017ADOPTED2017 - 2018
DEPARTMENT/DIVISION/PROGRAM
$ 2,616,354 $ 2,760,257 $ 2,912,615 LCU Water Prod Green Meadows
$ 1,668,919 $ 1,647,264 $ 1,714,097 Water Prod - Pine Woods
$ 10,269 $ 0 $ 0 WW Treatment - San Carlos
$ 1,624,638 $ 1,644,659 $ 1,590,555 WW Treatment - Three Oaks
$ 1,469,101 $ 1,483,468 $ 1,534,571 Water Production - Olga
$ 3,804,669 $ 3,996,555 $ 4,013,831 Water Distribution
$ 8,072,819 $ 7,633,371 $ 8,500,000 LCU - CFM WW Treatmnt Cntrct
$ 4,917,918 $ 4,969,042 $ 5,664,359 Wastewater Collection
$ 2,161,340 $ 2,189,190 $ 2,421,172 LCU - System Maintenance
$ 19,490 $ 21,095 $ 17,200 LCU - Highpoint WWTP
$ 1,848,578 $ 1,927,155 $ 1,881,816 LCU - WW Treatment FMB
$ 616,634 $ 573,115 $ 542,282 LCU - WWTP Pine Island
$ 956,097 $ 1,022,596 $ 984,656 LCU - Gateway WWTP
$ 383,701 $ 348,630 $ 375,456 LCU - Sewer Operations
$ 2,355,104 $ 2,331,203 $ 2,386,676 LCU - Instrum/Electrical Maint
$ 393,787 $ 366,178 $ 445,268 LCU - Water Operations
$ 1,629,899 $ 1,248,862 $ 1,610,759 LCU - Admin
$ 2,526,332 $ 2,871,665 $ 3,441,838 Utilities Engineering
$ 2,360,854 $ 2,231,069 $ 2,599,165 Water Meter Service
$ 3,124,496 $ 3,817,736 $ 4,192,489 LCU - Customer Services
$ 3,305,124 $ 3,382,966 $ 3,426,607 Water Production - Corkscrew
$ 528,302 $ 579,755 $ 622,859 LCU - Detar Support Svcs
$ 15 $ 84,264 $ 250,000 Water/Sewer General
$ 2,184,758 $ 2,463,937 $ 2,213,940 Utilities-Water Prod-North Lee
$ 594,590 $ 564,138 $ 652,303 Locates Inspections
$ 122,972 $ 51,927 $ 10,842 Industrial Pretreatment
$ 608,788 $ 621,882 $ 642,614 Utilities - Fiscal
$ 1,983,176 $ 1,725,731 $ 1,957,000 LCU - FGUA WW Interlocal NFM
$ 53,785,207 $ 54,556,127 $ 58,659,805 Total
DOT - Operations
$ 2,039,197 $ 2,120,965 $ 2,019,476 Canal Maintenance
$ 3,898,368 $ 3,802,952 $ 4,399,742 Landscape Maintenance
$ 10,470,752 $ 10,624,333 $ 11,141,265 Roadway Maintenance
$ 1,393,612 $ 1,388,101 $ 1,639,731 Bridge Maintenance
$ 17,801,929 $ 17,936,351 $ 19,200,214 Total
DOT - Traffic
$ 2,768,883 $ 2,630,824 $ 2,866,526 Traffic - Signs & Markings
$ 4,624,978 $ 5,364,673 $ 5,762,431 Traffic - Signal Systems
$ 7,393,861 $ 7,995,497 $ 8,628,957 Total
Toll Facilities
$ 14,506 $ 101,059 $ 500,000 Toll Facilities R&R
$ 8,997,494 $ 9,276,234 $ 11,315,214 Toll Bridge Operations
$ 9,012,000 $ 9,377,293 $ 11,815,214 Total
88
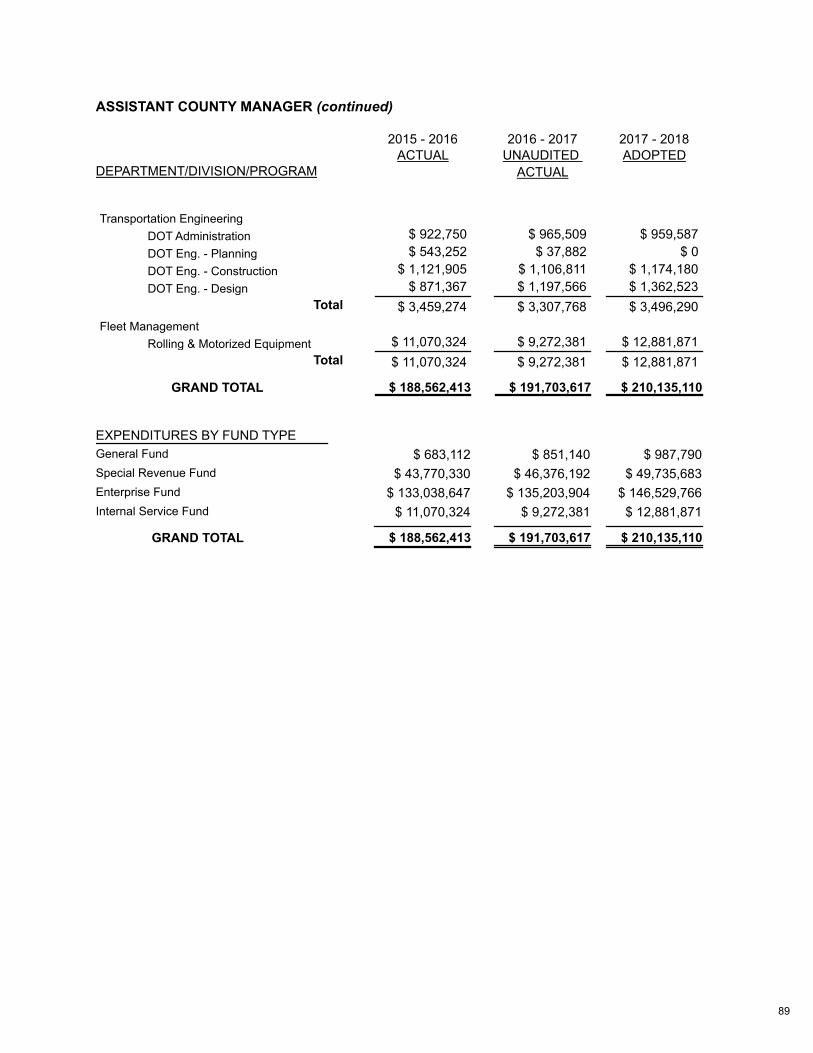
ASSISTANT COUNTY MANAGER (continued)
ACTUAL2015 - 2016
UNAUDITED
ACTUAL
2016 - 2017ADOPTED2017 - 2018
DEPARTMENT/DIVISION/PROGRAM
Transportation Engineering
$ 922,750 $ 965,509 $ 959,587 DOT Administration
$ 543,252 $ 37,882 $ 0 DOT Eng. - Planning
$ 1,121,905 $ 1,106,811 $ 1,174,180 DOT Eng. - Construction
$ 871,367 $ 1,197,566 $ 1,362,523 DOT Eng. - Design
$ 3,459,274 $ 3,307,768 $ 3,496,290 Total
Fleet Management
$ 11,070,324 $ 9,272,381 $ 12,881,871 Rolling & Motorized Equipment
$ 11,070,324 $ 9,272,381 $ 12,881,871 Total
$ 188,562,413 $ 191,703,617 $ 210,135,110GRAND TOTAL
EXPENDITURES BY FUND TYPE
$ 683,112 $ 851,140 $ 987,790General Fund
$ 43,770,330 $ 46,376,192 $ 49,735,683Special Revenue Fund
$ 133,038,647 $ 135,203,904 $ 146,529,766Enterprise Fund
$ 11,070,324 $ 9,272,381 $ 12,881,871Internal Service Fund
GRAND TOTAL $ 188,562,413 $ 191,703,617 $ 210,135,110
89

ASSISTANT COUNTY MANAGER
Facilities Construction and Management provides engineering, design, planning, project management, and inspections for County and Constitutional construction projects. It also provides remodeling services, interior-space management and design, modular furniture design and installation, building maintenance and repair services, record storage, and leased property administration and service contract administration for County and Constitutional departments. The division works closely with neighborhood groups in obtaining above core level services through the creation and management of municipal services taxing and benefit units (MST/BU). Natural Resources provides for management and protection of the County’s natural resources through well permitting, water conservation, water quality monitoring, flood protection, beach preservation, waterway/marine resources, chemical waste management and pollutant storage tank programs. Animal Services provides comprehensive animal control services through education, enforcement of laws and ordinances, community complaint resolution, and programs and services that include lost and found pets, adoptions, low-cost spay/neuter assistance and sheltering of stray and abused animals. Animal Services is dedicated to providing proactive programs and services aimed at preventing overpopulation in Lee County. Sports Development works to attract sporting events and activities that will provide economic impact to the Lee County community. It also acts as a clearinghouse to local, national and international sports entities, assisting with the marketing and promotion of events that target the Lee County area as a potential host site.
Assistant County Manager
Facilities Construction & Mgmt Natural Resources
Animal Services Sports Development
Parks and Recreation Transit (LeeTran)
90
ASSISTANT COUNTY MANAGER (continued) Parks & Recreation services include programming and maintenance of park and recreational facilities including regional, community, and neighborhood parks, recreation and community centers, pools, boat ramps, professional sports complexes (Hammond Stadium home of the Minnesota Twins Spring Training and JetBlue Park home of the Boston Red Sox Spring Training), and over 25,000 acres of Conservation lands. Extension Services partnering with the University of Florida provides education and training focused on the issues and needs of Lee County in the areas of horticulture, sustainable agriculture, natural resources, Florida Yards and Neighborhoods, 4-H youth development, family and consumer sciences and marine sciences. Transit oversees LeeTran (the County's transit system) which provides fixed route bus transportation services for citizens and visitors of Lee County, administers an employer van pool program and provides paratransit services in compliance with the Americans with Disabilities Act.
91

Assistant County Manager
LEE COUNTY - FLORIDA2017 - 2018
ACTUAL2015 - 2016
UNAUDITED
ACTUAL
2016 - 2017ADOPTED2017 - 2018
DEPARTMENT/DIVISION/PROGRAM
Parks & Recreation
$ 23,141,634 $ 24,678,016 $ 26,703,605 Parks & Recreation Operations
$ 122,466 $ 214,124 $ 0 Florida Community Trust
$ 7,209,297 $ 7,335,200 $ 8,503,729 Sports Complexes
$ 30,473,397 $ 32,227,340 $ 35,207,334 Total
Transit
$ 30,041,926 $ 24,977,514 $ 24,351,467 Fixed Route Service
$ 0 $ 27,137 $ 3,505,242 Transportation
$ 30,041,926 $ 25,004,651 $ 27,856,709 Total
Sports Development
$ 1,187,056 $ 1,085,432 $ 1,252,843 Economic Development
$ 1,187,056 $ 1,085,432 $ 1,252,843 Total
Natural Resources
$ 647,910 $ 627,748 $ 726,938 Marine Svcs / Marine Sciences
$ 9,600 $ 6,040 $ 15,000 Manatee Conservation
$ 728,594 $ 714,973 $ 844,541 Ground Water Mgmt
$ 1,410,859 $ 1,502,889 $ 1,642,054 Environmental Lab
$ 197,546 $ 230,955 $ 247,015 Pollutant Storage Tanks
$ 1,528,359 $ 1,562,130 $ 1,646,224 Surface Water Mgmt
$ 574,955 $ 622,083 $ 747,654 Small Quantity Generator
$ 5,097,823 $ 5,266,818 $ 5,869,426 Total
Facilities Construction Mgmt.
$ 14,442,715 $ 14,598,205 $ 15,650,142 Facilities Services
$ 207,251 $ 283,995 $ 0 MSTBU Services
$ 14,649,966 $ 14,882,200 $ 15,650,142 Total
Animal Services
$ 2,317,778 $ 2,587,929 $ 2,637,043 Animal Svcs-Shelter Operations
$ 1,518,754 $ 1,536,561 $ 1,628,800 Animal Srvcs -Field Operations
$ 1,194,074 $ 1,276,689 $ 1,343,808 Animal Svcs- Spay & Neuter
$ 5,030,606 $ 5,401,179 $ 5,609,651 Total
$ 86,480,774 $ 83,867,620 $ 91,446,105GRAND TOTAL
92

ASSISTANT COUNTY MANAGER (continued)
ACTUAL2015 - 2016
UNAUDITED
ACTUAL
2016 - 2017ADOPTED2017 - 2018
DEPARTMENT/DIVISION/PROGRAM
EXPENDITURES BY FUND TYPE
$ 32,428,600 $ 32,949,639 $ 35,688,379General Fund
$ 20,495,334 $ 20,999,859 $ 22,150,859Special Revenue Fund
$ 3,514,914 $ 4,913,471 $ 5,750,158Capital Project Fund
$ 30,041,926 $ 25,004,651 $ 27,856,709Enterprise Fund
GRAND TOTAL $ 86,480,774 $ 83,867,620 $ 91,446,105
93
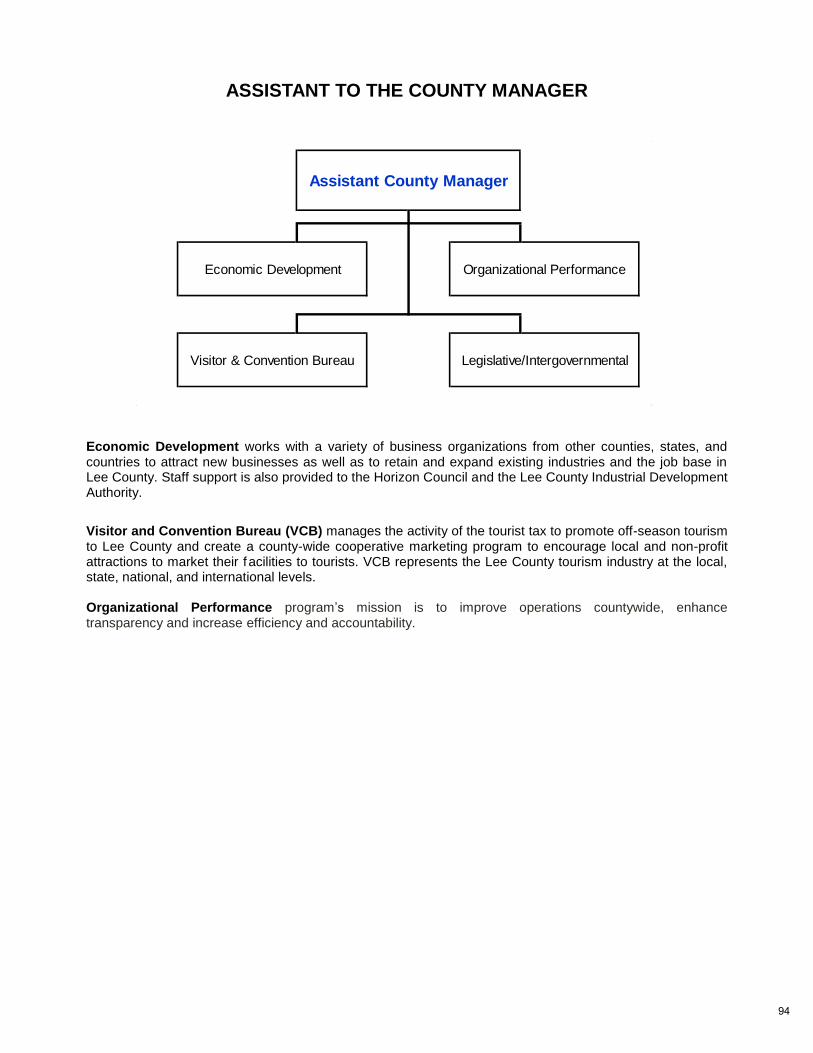
ASSISTANT TO THE COUNTY MANAGER
Economic Development works with a variety of business organizations from other counties, states, and countries to attract new businesses as well as to retain and expand existing industries and the job base in Lee County. Staff support is also provided to the Horizon Council and the Lee County Industrial Development Authority.
Visitor and Convention Bureau (VCB) manages the activity of the tourist tax to promote off-season tourism to Lee County and create a county-wide cooperative marketing program to encourage local and non-profit attractions to market their f acilities to tourists. VCB represents the Lee County tourism industry at the local, state, national, and international levels. Organizational Performance program’s mission is to improve operations countywide, enhance transparency and increase efficiency and accountability.
Assistant County Manager
Economic Development Organizational Performance
Visitor & Convention Bureau Legislative/Intergovernmental
94
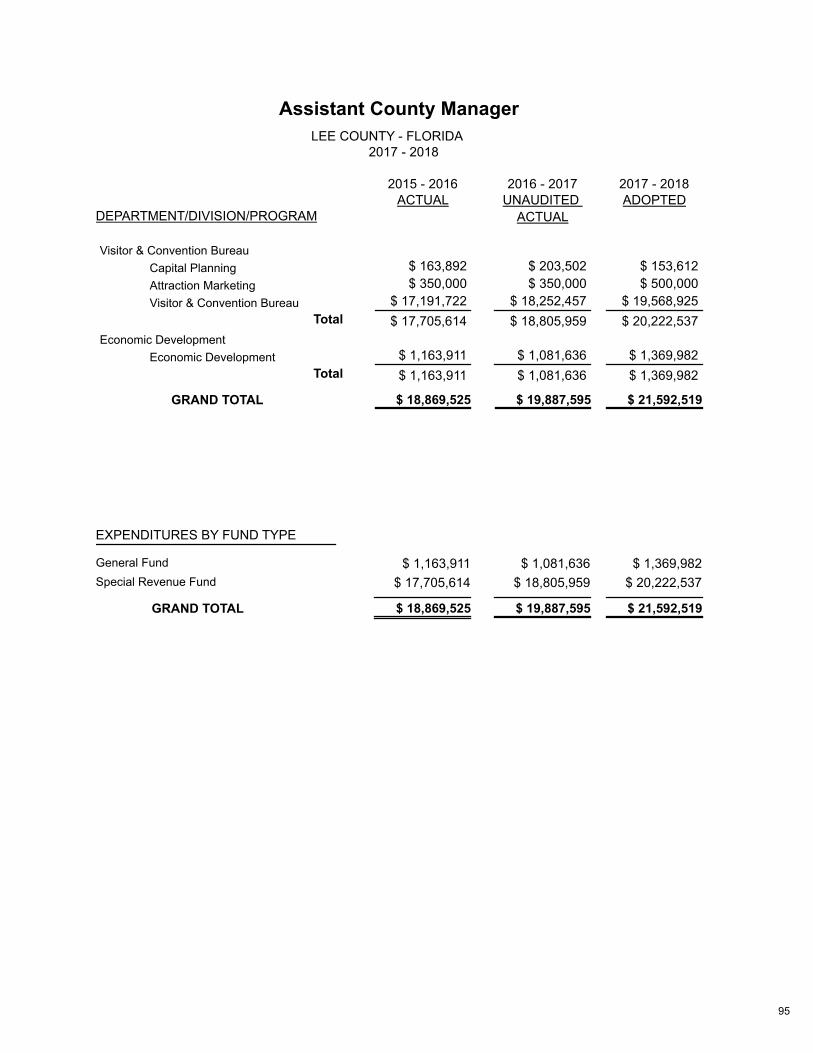
Assistant County Manager
LEE COUNTY - FLORIDA2017 - 2018
ACTUAL2015 - 2016
UNAUDITED
ACTUAL
2016 - 2017ADOPTED2017 - 2018
DEPARTMENT/DIVISION/PROGRAM
Visitor & Convention Bureau
$ 163,892 $ 203,502 $ 153,612 Capital Planning
$ 350,000 $ 350,000 $ 500,000 Attraction Marketing
$ 17,191,722 $ 18,252,457 $ 19,568,925 Visitor & Convention Bureau
$ 17,705,614 $ 18,805,959 $ 20,222,537 Total
Economic Development
$ 1,163,911 $ 1,081,636 $ 1,369,982 Economic Development
$ 1,163,911 $ 1,081,636 $ 1,369,982 Total
$ 18,869,525 $ 19,887,595 $ 21,592,519GRAND TOTAL
EXPENDITURES BY FUND TYPE
$ 1,163,911 $ 1,081,636 $ 1,369,982General Fund
$ 17,705,614 $ 18,805,959 $ 20,222,537Special Revenue Fund
GRAND TOTAL $ 18,869,525 $ 19,887,595 $ 21,592,519
95
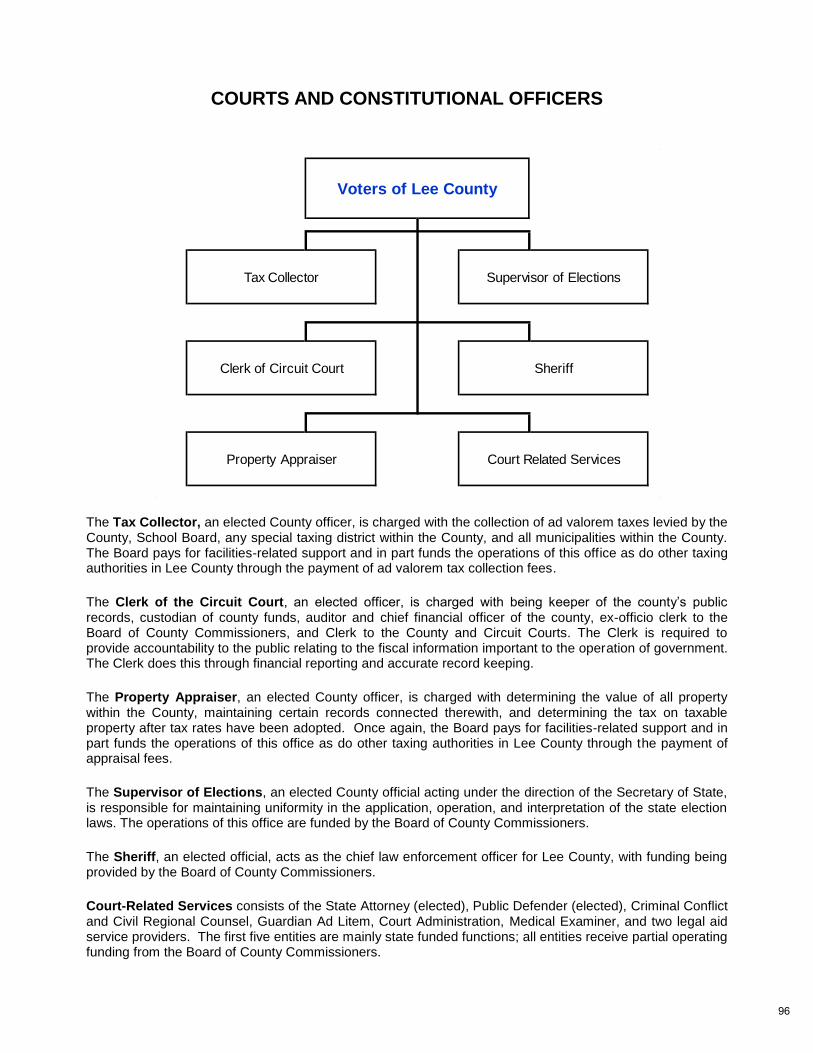
COURTS AND CONSTITUTIONAL OFFICERS
The Tax Collector, an elected County officer, is charged with the collection of ad valorem taxes levied by the County, School Board, any special taxing district within the County, and all municipalities within the County. The Board pays for facilities-related support and in part funds the operations of this office as do other taxing authorities in Lee County through the payment of ad valorem tax collection fees.
The Clerk of the Circuit Court, an elected officer, is charged with being keeper of the county’s public records, custodian of county funds, auditor and chief financial officer of the county, ex-officio clerk to the Board of County Commissioners, and Clerk to the County and Circuit Courts. The Clerk is required to provide accountability to the public relating to the fiscal information important to the operation of government. The Clerk does this through financial reporting and accurate record keeping.
The Property Appraiser, an elected County officer, is charged with determining the value of all property within the County, maintaining certain records connected therewith, and determining the tax on taxable property after tax rates have been adopted. Once again, the Board pays for facilities-related support and in part funds the operations of this office as do other taxing authorities in Lee County through the payment of appraisal fees.
The Supervisor of Elections, an elected County official acting under the direction of the Secretary of State, is responsible for maintaining uniformity in the application, operation, and interpretation of the state election laws. The operations of this office are funded by the Board of County Commissioners.
The Sheriff, an elected official, acts as the chief law enforcement officer for Lee County, with funding being provided by the Board of County Commissioners.
Court-Related Services consists of the State Attorney (elected), Public Defender (elected), Criminal Conflict and Civil Regional Counsel, Guardian Ad Litem, Court Administration, Medical Examiner, and two legal aid service providers. The first five entities are mainly state funded functions; all entities receive partial operating funding from the Board of County Commissioners.
Voters of Lee County
Tax Collector Supervisor of Elections
Clerk of Circuit Court Sheriff
Property Appraiser Court Related Services
96

Courts and Constitutional OfficersLEE COUNTY - FLORIDA
2017 - 2018
ACTUAL2015 - 2016
UNAUDITED
ACTUAL
2016 - 2017ADOPTED2017 - 2018
DEPARTMENT/DIVISION/PROGRAM
Tax Collector
$ 1,416,141 $ 1,315,401 $ 1,358,157 Support to Tax Collector$ 16,314,426 $ 17,246,894 $ 15,102,576 Tax Collect. Fund Collect Fees
$ 17,730,567 $ 18,562,295 $ 16,460,733 Total
Clerk to the Board
$ 939,313 $ 947,403 $ 945,434 Support to Clerk to Board$ 7,998,197 $ 8,654,759 $ 8,990,410 Finance & Internal Audit$ 1,189,344 $ 1,189,337 $ 0 VCB - Audit
$ 10,126,854 $ 10,791,499 $ 9,935,844 Total
Property Appraiser
$ 2,194,395 $ 2,230,319 $ 2,041,158 Support to Property Appraiser$ 7,864,459 $ 7,785,226 $ 7,731,683 Prop Appr. Fund Collect Fees
$ 10,058,854 $ 10,015,545 $ 9,772,841 Total
Supervisor of Elections
$ 667,711 $ 564,145 $ 457,785 Support to Supervisor of Elect$ 8,962,450 $ 8,016,447 $ 8,245,941 Supervisor of Elections
$ 9,630,161 $ 8,580,592 $ 8,703,726 Total
Sheriff
$ 102,256,263 $ 102,615,371 $ 108,013,824 Sheriff Disbursement$ 4,862,381 $ 5,023,223 $ 4,809,048 Support to Sheriff
$ 407,432 $ 670,000 $ 0 Law Enforcement Trust$ 50,660,934 $ 54,465,521 $ 56,894,720 Sheriff - Jail Disbursement
$ 8,941,248 $ 9,565,393 $ 9,583,051 Sheriff - Court Support
$ 167,128,258 $ 172,339,508 $ 179,300,643 Total
Court Related Programs
$ 1,074,260 $ 1,109,111 $ 1,293,584 Court Administration$ 1,468,210 $ 1,480,002 $ 1,556,723 Court Admin - Support$ 2,223,207 $ 2,314,776 $ 2,404,083 Pretrial Services
$ 137,458 $ 136,156 $ 143,971 Mediation Ordinance$ 925,236 $ 1,013,370 $ 1,081,453 Family Court Services$ 394,510 $ 392,388 $ 456,473 Domestic Violence
$ 0 $ 0 $ 1,000 Public Def Conflicts- Juvenile$ 3,430 $ 2,409 $ 5,009 Juvenile Arbitration
$ 133,619 $ 133,722 $ 139,802 Teen Court$ 233,444 $ 235,888 $ 241,488 Public Guardian
$ 1,228,586 $ 1,344,790 $ 1,348,574 Courthouse Security$ 1,168,216 $ 1,391,698 $ 1,880,651 CJIS$ 1,130,223 $ 1,176,509 $ 1,326,432 Court Technology
$ 196,982 $ 186,662 $ 233,222 Law library$ 1,974,656 $ 2,004,602 $ 2,066,569 Probation
$ 361,019 $ 350,595 $ 405,153 Courthouse Facilities
$ 12,653,056 $ 13,272,678 $ 14,584,187 Total
97

COURTS AND CONSTITUTIONAL OFFICERS (continued)
ACTUAL2015 - 2016
UNAUDITED
ACTUAL
2016 - 2017ADOPTED2017 - 2018
DEPARTMENT/DIVISION/PROGRAM
Public Defender
$ 1,192,829 $ 1,365,659 $ 1,425,933 Support to Public Defender
$ 1,192,829 $ 1,365,659 $ 1,425,933 Total
State Attorney
$ 2,117,655 $ 2,003,306 $ 2,168,141 State Attorney
$ 2,117,655 $ 2,003,306 $ 2,168,141 Total
Medical Examiner
$ 158,267 $ 167,329 $ 174,621 Support to Medical Examiner$ 3,184,724 $ 3,459,951 $ 3,482,993 Medical Examiner
$ 3,342,991 $ 3,627,280 $ 3,657,614 Total
Legal Aid & Juvenile Detention
$ 2,025,781 $ 1,682,694 $ 1,800,000 Juvi Predispo Detention$ 546,453 $ 554,650 $ 562,970 Legal Aid
$ 2,572,234 $ 2,237,344 $ 2,362,970 Total
Guardian Ad Litem
$ 234,322 $ 293,172 $ 333,514 Guardian Ad Litem
$ 234,322 $ 293,172 $ 333,514 Total
$ 236,787,781 $ 243,088,878 $ 248,706,146GRAND TOTAL
EXPENDITURES BY FUND TYPE
$ 217,851,579 $ 223,488,736 $ 229,456,173General Fund
$ 18,285,568 $ 18,923,539 $ 18,546,544Special Revenue Fund
$ 550 $ 355 $ 0Capital Project Fund
$ 650,084 $ 676,248 $ 703,429Enterprise Fund
GRAND TOTAL $ 236,787,781 $ 243,088,878 $ 248,706,146
98

CAPITAL IMPROVEMENT PROGRAM/LONG-TERM DEBT
TABLE OF CONTENTS
CAPITAL IMPROVEMENT PROGRAM DEFINED ........................................................................................................ 100
CAPITAL IMPROVEMENT BUDGET TIMELINE/SUMMARY ........................................................................................ 103
CIP REVENUE SOURCES ............................................................................................................................................ 105
FIVE YEAR CAPITAL IMPROVEMENT PROGRAM PROJECT LIST – LEE COUNTY, FLORIDA .......................... ..111
COMMUNITY PARK IMPACT FEE DISTRICTS .......................................................................................................... ..116
REGIONAL PARK IMPACT FEE DISTRICT ................................................................................................................ ..126
ROAD IMPACT FEE DISTRICTS ................................................................................................................................ ..128
99
CAPITAL IMPROVEMENT PROGRAM DEFINED
WHAT IS THE CAPITAL IMPROVEMENT PROGRAM?
Lee County's Capital Improvement Program (CIP) is a planning, budgetary, and prioritizing tool which reflects the County's infrastructure needs (via a list of capital projects) for a five-year time frame. The five years are balanced; i.e., revenues are identified to offset expenditures in accordance with state requirements. The program is designed to balance the need for public facilities as expressed by the Lee County Comprehensive Land Use Plan. A comprehensive plan is a written document that identifies the goals, objectives, principles, guidelines, polices, standards, and strategies for the growth and development of the community. The program consists of projects that also comply with Lee County's Administrative Code, "Criteria for Evaluating Proposed CIP Projects". . The CIP is updated on an annual basis. Amendments to the CIP may be made prior to the next annual CIP review period with approval of the Board of County Commissioners.
WHAT IS A CAPITAL PROJECT?
Capital Projects are major f ixed assets or infrastructure with long term value, such as buildings, roads, bridges, and parks. Proposed CIP project requests may originate from County departments, constitutional officers, and/or citizens. Funds budgeted for a specific project remain allocated until the project is completed. Additionally, project budgets are reviewed annually and, if needed, funding may be adjusted. Projects may be funded by current revenues or by debt financing, depending upon the availability of funds, the nature of the project, and the policies of the Board of County Commissioners.
WHAT IS THE LEE COUNTY COMPREHENSIVE PLAN?
Local governments in the State of Florida are required to adopt comprehensive plans pursuant to Chapter 163 of the Florida Statutes. The comprehensive plan is a source of authority for a wide range of official discretionary actions, including, but not limited to, the capital improvement program. Amendments to the Comprehensive plan may occur as frequently as may be permitted by applicable state statutes and in accordance with such administrative procedures adopted by the Board of County Commissioners. An evaluation and appraisal of the comprehensive plan must occur at least once every seven years.
The plan must address the following elements: Future Land Use Element Capital Improvements Element Traffic Circulation Element Conservation Element Mass Transit Element Coastal Management Element Sanitary Sewer, Solid Waste, Drainage, Housing Element Potable Water, and Natural Groundwater Ports, Aviation, and Related Aquifer Recharge Elements Facilities Element Intergovernmental Coordination Element
The Capital Improvements Element (CIE) provides a framework for planning, constructing, and financing public services and infrastructure with Lee County over a five-year period. This is achieved by examining the costs, priorities, and needs for service and facilities, the county’s fiscal capabilities, and legal requirements. The County’s Capital Improvement Program defines the budget and time frame for project implementation. The CIE must be reviewed on an annual basis.
100

CAPITAL IMPROVEMENT PROGRAM DEFINED (continued)
WHO IS RESPONSIBLE FOR MANAGEMENT OF CAPITAL PROJECTS?
Several major County agencies manage capital projects as follows: Department of Transportation, Department of Facilities Construction Management, Utilities, Solid Waste, and Natural Resources. The Department of Transportation (DOT) is responsible for construction improvements of County roads, bridges, signals, and intersections. In preparing the FY 17/18 – 21/22 Capital Improvement Program, DOT focused on maintaining the adopted level of service standards in the County's comprehensive plan and network continuity and hurricane evacuation issues. DOT referred to the Lee County Metropolitan Planning Organization’s *adopted 2020 Financially Feasible Transportation Plan (Map 3A of the County comprehensive plan) and its 2010 stage, the identification of existing and projected roadway conditions in the County’s annual Concurrency Management report, and internal traffic modeling and analysis to identify projects and set priorities. The completion of partially programmed projects and the programming and requests of other jurisdictions was also considered. The Department of Facilities Construction Management manages capital projects related to parks, libraries, public safety, and administrative facilities. In addition, this department frequently provides construction management assistance to Constitutional Officers and State Agencies including the Sheriff, Tax Collector, Property Appraiser, Clerk of Courts, State Attorney, Public Defender, and others. The County's Comprehensive Plan includes standards for specific acreage per capita for parks and provisions for library volumes per capita. Lee County Utilities prepares and manages capital requests based on system requirements for its sanitary sewer and potable water. Utilities capital projects may be developed with the intent of upgrading existing service or expanding utility service based on community needs. This department functions as an "enterprise" and funds its capital projects with revenues generated by providing water and sewer service. Lee County Solid Waste manages projects relating to landfills, resource recovery, material recovery, and hazardous waste. This section also functions as an "enterprise," wherein its capital projects are funded via user fees. Lee County Natural Resources manages capital projects that provide for flood protection, water quality enhancement, and water conservation. The EPA (Environmental Protection Agency) adopted legislation that heavily contributes to the composition of this division's CIP. The Lee County Stormwater Management Plan additionally provides direction for their program.
* The Metropolitan Planning Organization (MPO) is a transportation planning body established under the
State law which includes representatives from each local government. The MPO prepared a countywide priority list of transportation improvements known as the "2010 Financially Feasible Plan" and a "2020 Financially Feasible Transportation Plan."
County departments which were not previously listed may also generate capital project requests. These may be unique types of infrastructure, such as communication facilities, etc. These are developed and reviewed based on the specific factors which identify the need for the project and may be based on a structured planning process or on specific project requirements.
101
CAPITAL IMPROVEMENT PROGRAM DEFINED (continued)
CAPITAL PROJECT COSTS
Capital project costs include all expenditures related to land acquisition, planning, design, construction, project management, legal expenses, and mitigation of damages. Project management charges include not only the time expended by the managing department, but also the project management costs charged by other departments for landscaping, property acquisition, and contracts assistance. These costs are budgeted within each capital project as part of the total project cost. Projects which are grant funded are charged on an individual basis, as some grants will not reimburse project management costs. Departments estimate project costs but consider operating impacts as well, including start up and recurring costs. The startup costs refer to one-time initial costs to be funded from the operating budget at the time the facility comes on line. Recurring costs are those costs to be borne from the operating budget that cover annual personnel and operating expenses related to the facility.
102
CAPITAL IMPROVEMENT BUDGET TIMELINE
The Capital Improvement Program process begins each February with interaction between the coordinating departments - Budget Services and the Department of Planning - and other Lee County departments which maintain direct management responsibility for capital projects. Preliminary instructions for required data and proposed schedules are discussed and revised. Preliminary revenue estimates are disseminated to County staff. In March of each year, department managers, constitutional officers, and Lee County citizens identify initial proposed revisions to the CIP. These preliminary lists are then reviewed by Lee County Management and The Board of County Commissioners. The preliminary project business case requests include data that is used to determine the validity of the project to include in the program. Typically, there are not sufficient funds to provide for all of the projects that are identified. In balancing the five years of the CIP, projections of revenues from existing sources are compared to requested capital projects. If there are adequate revenues to fund all the requested projects, the program is balanced. If not, the projects are reviewed again to either be revised to reduce costs, postponed to a future time period, or eliminated from the program. Alternative financing, such as long term debt, may be proposed in order to provide sufficient revenues to fund requested capital projects. The current fiscal year funding for the recommended CIP is incorporated in the proposed budget and adopted at the public hearings held in September of each year. Once this review is completed, the revised project lists are reviewed by the County Management and then presented to the Board in an advertised workshop. The Board of County Commissioners approves the final CIP in September each year.
The overall CIP, with its five-year time frame, gives a fair indication of the foreseeable infrastructure needs of
the County. There may be bona fide reasons why a project is needed or desired in the immediate future, but it
may be deferred because resources are not realistically available. The CIP helps to structure this
decision-making by reviewing capital project requests as well as the operational impact from the
implementation of the program.
The Capital Improvement Program is dynamic, changing as identified projects require funding adjustments during the fiscal year and, sometimes, from year to year. Any revisions must be approved by the Board of County Commissioners. Each department maintains daily control of its projects, with overall monitoring of the CIP being the responsibility of the Budget Services staff. The approved Capital Improvement Program becomes the basis for information included in the Capital Improvement Element.
SUMMARY
The Capital Improvement Program (CIP) covers a five-year period and is updated annually in conjunction with the operating budget. The projects included in this program will enable the County to meet the needs of existing and future residents by providing a high level of service and enhanced quality of life. Funding levels for capital construction projects are based on the merits of a particular project together with the available funding from all financing sources. The Board of County Commissioners review the cash requirements for capital project financing annually.
103

104

CIP REVENUE SOURCES
The Capital Improvement Program budget includes a variety of revenues that are used both for the direct funding of projects and as a source of debt service to retire bonds. This section will describe each of the major revenue sources, with particular emphasis upon how funding is determined and for what purposes those monies are allocated.
CAPITAL IMPROVEMENT FUND (Non-Transportation & Non-Enterprise)
The Capital Improvement Fund maintains accounts for the County's non-transportation projects, but not for non-subsidized enterprise fund projects. Typical projects include parks, recreation centers, governmental offices, storm water improvements, and Constitutional Officer facilities. The primary sources of revenue for the Capital Improvement Fund are as follows:
Ad Valorem Taxes In FY17-18, the Board of County Commissioners approved a General Fund millage of 4.0506 which includes
funds for capital projects. Funds will be transferred each budget year as necessary to fund the Capital
Projects Fund.
Tourist Taxes Tourist Taxes are generated from a 5% charge on "room rates" at local hotels and motels. The tourist tax is to strengthen our local economy and advance tourism by investing the revenue in the following priority: 26.4% of the receipts shall be used for beach park facilities and beach related improvements is used for beach maintenance and improvements to County beach facilities to which there is public access; 20.0% is applied to debt service on the Sports Stadiums and to promote, maintain or operate convention centers, sports stadiums, sport arenas, coliseums, auditoriums or museums (per ordinance guidelines); and 53.6% used for tourist advertising and promotion for Lee County.
State Grants The County also receives grant funds from the State of Florida for specific programs or activities.
Private Grants The West Coast Inland Navigation District (WCIND) levies ad valorem taxes from the residents of Manatee,
Sarasota, Charlotte, and Lee Counties for the purpose of undertaking navigation projects to improve
waterways from lower Tampa Bay to the Collier County line. These funds are remitted as grants to Lee
County for specific projects. Types of projects funded are dredging, boat ramps, channel marker installation,
and regulatory signage placement.
Growth Increment Funding This is a policy adopted by the Board of County Commissioners to recognize existing revenues differently. The program identifies every real estate transaction that increases the taxable value under:
New Construction value
Existing Sales – reset of Save Our Homes Exemption
Takes the first year taxable increment ONY for these transactions and places those revenues in a dedicated infrastructure fund. This fund source provides for growth helping pay for growth.
105

CIP REVENUE SOURCES (continued)
BP Settlement
On July 2, 2015, the United States District Court for the Eastern District of Louisiana announced that settlement discussions led by a panel of neutrals had yielded an agreement in principle to resolve claims against BP by the United States, affected states and local government entities. Lee County will remain eligible to also receive funding pursuant to the RESTORE Act.
Fund Balance Fund balance represents unexpended monies from the prior fiscal year which may be allocated to projects.
Fund balance may be uncommitted (prior year reserves) or committed to provide funding for specific
projects.
TRANSPORTATION IMPROVEMENT FUND
The Transportation Improvement Fund is composed of revenues which are budgeted for transportation projects. These projects include road resurfacing/rebuilding, signal and intersection improvements, bridge repairs, and major road construction. The primary sources of revenue for the Transportation Improvement Fund are as follows:
Developer Donations Occasionally, developer donation agreements result from the development order process, typically for mitigating new construction impacts. Specific developer payments identified for roads are deposited in the Transportation Improvement Fund.
Local Option Gas Tax The Local Option Gas Tax represents both a six-cent tax and a five-cent tax on motor fuels. These monies are allocated between Lee County and the cities of Cape Coral, Fort Myers, Sanibel, Bonita Springs, Town of Fort Myers Beach, and the Village of Estero. The amounts the County and cities receive are net of the State's deduction for administrative and dealer collection fees.
In 1993, F.S. 336.025 was amended to allow for the imposition of up to 5 cents as an additional Local Option Gas Tax. In 1994, the Board of County Commissioners approved a five-cent tax with 50% allocated to capital projects, and 50% to the East/West Corridor (Midpoint Bridge approach). In 1995, the 50% for the East/West Corridor was dedicated to a $35,360,000 bond issue. Those funds were used to develop the approach roadways associated with the Midpoint Memorial Bridge. The entire five cents is pledged to this bond issue although only 50% of the revenues are anticipated for debt service.
106

CIP REVENUE SOURCES (continued)
Toll Monies The toll revenues collected on the Cape Coral, Midpoint Memorial, and Sanibel bridges are used to pay debt
service, operating and maintenance costs for these three bridges. Any surplus revenues from the Cape Coral
and Midpoint Memorial Bridges are used for land acquisition, design, and debt service for the westerly
extension and for other projects associated with the Midpoint corridor and Cape Coral Bridge.
Any remaining monies are moved to the Transportation Improvement Fund to provide for other countywide
transportation improvements.
IMPACT FEES
Impact fees are assessed in Lee County against new construction to provide for infrastructure required by new development. The County assesses impact fees for roads, community parks, regional parks, emergency medical services, and fire services. The emergency medical services impact fees are used to purchase capital equipment for the Lee County Emergency Medical Services Division and are not budgeted within the County's Capital Improvement Program. Impact fees were reduced to 20% in FY12-13 for a two year period, which caused a major reduction in impact fees estimates. On March 16, 2015 the Board set the impact fee collection at 45% for a three year period. The fire impact fees are assessed within 16 of the fire districts in the unincorporated areas of Lee County or areas which are served by fire districts which have entered into interlocal agreements with Lee County for the collection of fire impact fees. The fire impact fee revenues are distributed by the County to each of the fire control districts participating in the program. These impact fees may only be used for capital equipment or capital improvements. Fire Impact fees are not budgeted within Lee County’s Capital Improvement Program since they are not expended directly by the County.
Community Park Impact Fees Community Park Impact Fees are imposed upon developers for use in providing community parks to serve new growth. The monies are collected within five specific districts for the benefit of residents within each district. Community Park Impact Fees are collected only in the unincorporated areas of Lee County. The County also collects Community Park Impact Fees for the Town of Fort Myers Beach, City of Bonita Springs and the Village of Estero. These funds are submitted to the Town, City and Village on a quarterly basis. The fees are assessed on residential and hotel-motel room construction only. Fees are based on the type of dwelling, such as single-family residential, mobile home, or multi-family buildings. These fees may only be
used for new construction and not for maintenance operating expenses. FY17-18 Community Park Impact Fee revenue is anticipated to be $777,749, which excludes the City of Bonita Springs, Town of Fort Myers Beach and the Village of Estero.
Regional Park Impact Fees
Regional Park Impact Fees are also imposed upon developers to provide regional parks required by new growth. These are collected in one countywide district, with the exception of the City of Cape Coral. The County also collects Regional Park Impact Fees for the Town of Ft Myers Beach, City of Bonita Springs and the Village of Estero. These funds are submitted to the Town, City and Village on a quarterly basis. In FY17-18, Regional Park Impact Fee revenue is anticipated to be $968,644, which excludes the City of Bonita Springs, Town of Fort Myers Beach and Village of Estero.
107

CIP REVENUE SOURCES (continued)
Road Impact Fees Road Impact Fees are assessed upon new construction within Lee County to provide for transportation improvements required for new growth. These fees may only be used for new construction and not for maintenance operating expenses. Road Impact Fees are assessed upon residential, commercial, and industrial construction. There are five Road Impact Fee benefit districts in the unincorporated area of the County in which fees are collected. The County also collects Road Impact Fees for the Town of Fort Myers Beach, City of Bonita Springs and Village of Estero. These funds are submitted to the Town, City and Village on a quarterly basis. Only those transportation improvements which are required due to new growth may be funded with Road Impact Fees. Road Impact Fee revenue for FY17-18 is anticipated to be $4,414,113, which excludes the City of Bonita Springs, Town of Fort Myers Beach and the Village of Estero.
Impact Fee Credits
Developers may request that impact fee credits be given for developer construction of roads and parks or
contributions of land. Credits are applied in lieu of impact fee payments in accordance with Lee County
Impact Fee Ordinance.
PROPOSED BONDS
As a municipal government, Lee County may issue tax-exempt bonds to finance capital construction. A great variety of revenue sources may be used to repay these bonds. Outlined below are the initial methods of funding various departmental bonded projects. There are no plans to bond projects using ad valorem (general obligation bonds) in the FY17-18 Capital Improvement Program.
Non-Ad Valorem Bonds Certain types of projects such as parks and government buildings do not generate enough revenues to pay debt service. These projects would be funded utilizing a pledge of non-ad valorem revenues. These revenues would include sales tax, building and zoning permit fees, ambulance fees, and others.
Revenue Bonds There are projects within the Departments of Utilities, Solid Waste and Transportation which would be bond financed by pledging revenues generated from the operation of these facilities. These bonds would stipulate that revenues from the provision of water, sewer, solid waste services, and toll revenues would provide debt service on these bonds.
Gas Tax Bonds
The County receives various gas tax revenues from the State. The monies can be pledged to bond issues. The Voted (Ninth-Cent) Gas Tax, the County (Seventh Cent) Gas Tax, and the Constitutional Gas Tax are pledged as part of a Non-Ad Valorem associated with the Midpoint Memorial Bridge.
108
CIP REVENUE SOURCES (continued)
ALTERNATIVE FINANCING
State Revolving Fund
The County is currently participating in the Florida State Revolving Fund (SRF) Program for Water and Wastewater Projects through the Florida Department of Environmental Protection. This program makes low interest funds available for eligible water and wastewater projects via preconstruction and construction loans.
109
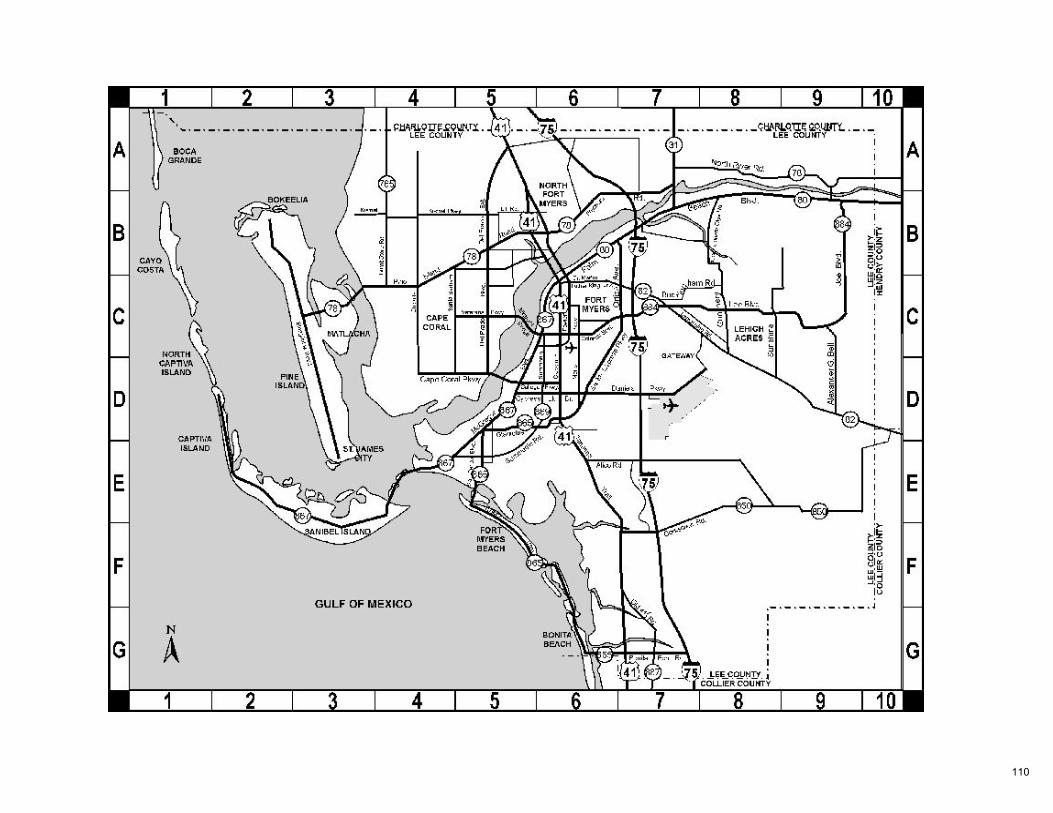
110

COMMUNITY DEVELOPMENT *Updated removal of Public Safety project.
Project TitleProject Account
Number
Funding
Code
All Project
Cost prior
to FY 16/17
FY 16-17
Original
Budget
CURRENT
BUDGET
FY 16-17
Spent as of
August 2017
Second
Carryover
Request
FY 17-18
Proposed
Budget
FY 18-19
Proposed
Budget
FY 19/20
Proposed
Budget
FY 20/21
Proposed
Budget
FY21/22
Proposed
Budget
Five Year
Project
Total
6-10 Year
ProposedProject Total
Corkscrew Rd Wildlife Overpass 20501013802 S 1,175,272 1,175,272 1,175,272
Wild Turkey Str Env Mitigation - General Fund 20500930100 A 133,910 133,910 267,820 401,730
Wild Turkey Str Env Mitigation - DOT 20500930700 GT 133,909 133,909 267,818 401,727
Wild Turkey Str Env Mitigation - Utilities 20500948730 E 133,909 133,909 267,818 401,727
COMMUNITY DEVELOPMENT TOTAL 1,175,272 401,728 1,577,000 803,456 2,380,456
LIBRARY
Project TitleProject Account
NumberCode
All Project
Cost prior
to FY 16/17
FY 16-17
Original
Budget
CURRENT
BUDGET
FY 16-17
Spent as of
August 2017
Second
Carryover
Request
FY 17-18
Proposed
Budget
FY 18-19
Proposed
Budget
FY 19/20
Proposed
Budget
FY 20/21
Proposed
Budget
FY21/22
Proposed
Budget
Five Year
Project
Total
6-10 Year
ProposedProject Total
20100634800 - Bonita Springs Library 20100634800 L 56,657 3,989,790 10,496,117 582,799 3,547,226 3,547,226 14,100,000
20100534800 - North Ft Myers Library 20100534800 L 322,128 3,989,790 10,869,395 524,306 1,308,477 1,308,477 12,500,000
LIBRARY TOTAL 378,785 7,979,580 21,365,512 4,855,703 4,855,703 26,600,000
PARKS & REC
Project TitleProject Account
NumberFund Code
All Project
Cost prior
to FY 16/17
FY 16-17
Original
Budget
CURRENT
BUDGET
FY 16-17
Spent as of
August 2017
Second
Carryover
Request
FY 17-18
Proposed
Budget
FY 18-19
Proposed
Budget
FY 19/20
Proposed
Budget
FY 20/21
Proposed
Budget
FY21/22
Proposed
Budget
Five Year
Project
Total
6-10 Year
ProposedProject Total
Wa-Ke Hatchee CP Lighting 20179738653 I 300,000 300,000 300,000
Matanzas Pass Bdwlk Expansion 20062930101 35,000 35,000
Lynn Hall Pk Bdwlk & Dune 20927130101 423,540 423,540
Lehigh Acres Greenways 20215438700 I 9,753 150,000 290,247 - 200,000 1,500,000 1,700,000 2,000,000
PARKS TOTAL 9,753 150,000 290,247 0 0 758,540 200,000 1,500,000 0 0 2,458,540 0 2,300,000
NATURAL RESOURCES
Project TitleProject Account
NumberFund Code
All Project
Cost prior
to FY 16/17
FY 16-17
Original
Budget
CURRENT
BUDGET
FY 16-17
Spent as of
August 2017
Second
Carryover
Request
FY 17-18
Proposed
Budget
FY 18-19
Proposed
Budget
FY 19/20
Proposed
Budget
FY 20/21
Proposed
Budget
FY21/22
Proposed
Budget
Five Year
Project
Total
6-10 Year
ProposedProject Total
Bob Janes Restoration Project NEW 20859930100 A 300,000 300,000 300,000
Caloosahatchee Canal L-3 Rehabilitation NEW 20860030100 A 200,000 300,000 500,000 500,000
Caloosahatchee TMDL Compl 20858830100 A 454,419 2,000,000 2,447,250 121,678 2,000,000 2,000,000 - 4,901,669
Deep Lagoon Hydro Presv Rest 20851730100 A 400,000 400,000 14,565 2,600,000 2,600,000 3,000,000
20857230100 A 33,073 166,926 28,665 850,000 850,000 1,049,999
22857230100 G 475,000 475,000 475,000
Lakes Pk Littoral Zone Pjt 20851830100 A 200,000 32,998 850,000 850,000 1,050,000
Nalle Grade Stormwater Park 20856730100/30150 A 400,001 3,000,000 3,000,000 3,400,001
Powell Ck/Old Brdg Pk Restortation NEW 20860130100 A 200,000 200,000 200,000
20855730100 A 200,000 50,000 50,000 250,000
22855730100 G 300,000 300,000 300,000
NATURAL RESOURCES TOTAL 887,493 2,400,000 3,414,176 197,905 6,550,000 3,250,000 1,325,000 11,125,000 0 15,426,669
CAPITAL IMPROVEMENT PROGRAM DETAILED REPORT
Fund Codes: A=Advalorem; D=Debt Finance; E=Enterprise; G=Grant; GT=Gas Tax; I=Impact Fees; L=Library Advalorem; T=TDC; S=Special;M=MSTBU; ST=Surplus Tolls; GIF=Growth Inc Funding; CON=Contribution;
Hendry Crk W Branch WQ Improv
Sunniland/9 Mile Run Drainage
111
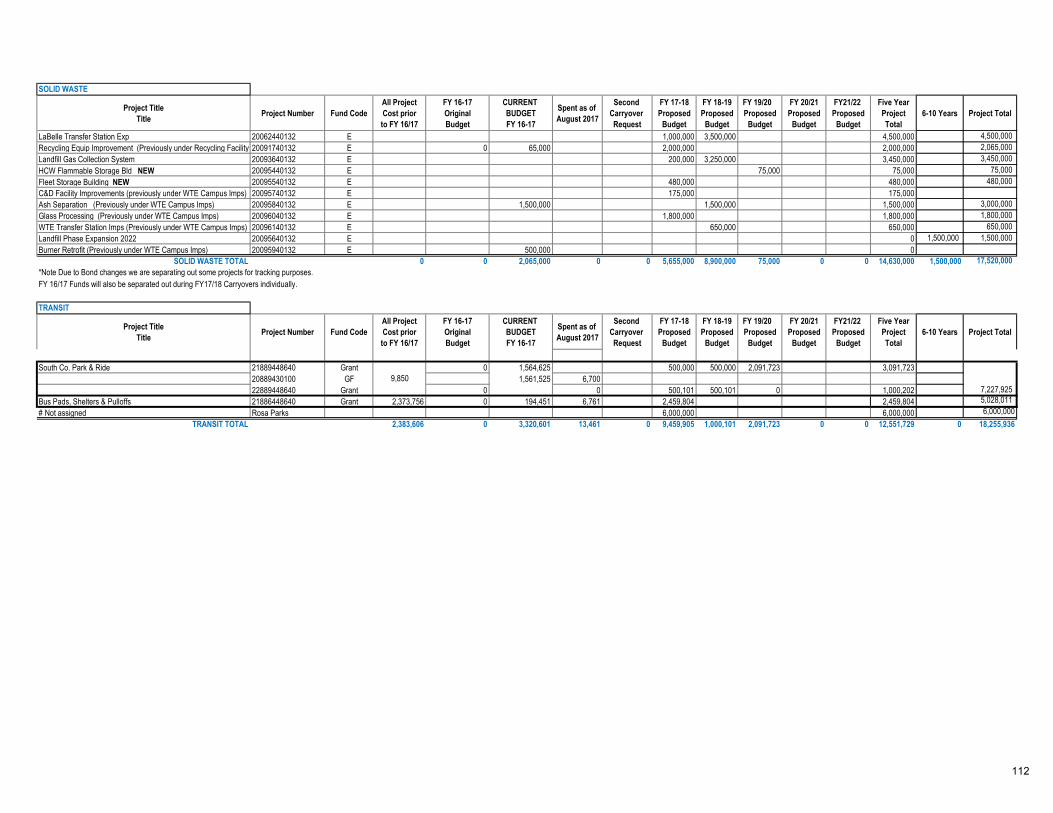
SOLID WASTE
Project Title
TitleProject Number Fund Code
All Project
Cost prior
to FY 16/17
FY 16-17
Original
Budget
CURRENT
BUDGET
FY 16-17
Spent as of
August 2017
Second
Carryover
Request
FY 17-18
Proposed
Budget
FY 18-19
Proposed
Budget
FY 19/20
Proposed
Budget
FY 20/21
Proposed
Budget
FY21/22
Proposed
Budget
Five Year
Project
Total
6-10 Years Project Total
LaBelle Transfer Station Exp 20062440132 E 1,000,000 3,500,000 4,500,000 4,500,000
Recycling Equip Improvement (Previously under Recycling Facility)20091740132 E 0 65,000 2,000,000 2,000,000 2,065,000
Landfill Gas Collection System 20093640132 E 200,000 3,250,000 3,450,000 3,450,000
HCW Flammable Storage Bld NEW 20095440132 E 75,000 75,000 75,000
Fleet Storage Building NEW 20095540132 E 480,000 480,000 480,000
C&D Facility Improvements (previously under WTE Campus Imps) 20095740132 E 175,000 175,000
Ash Separation (Previously under WTE Campus Imps) 20095840132 E 1,500,000 1,500,000 1,500,000 3,000,000
Glass Processing (Previously under WTE Campus Imps) 20096040132 E 1,800,000 1,800,000 1,800,000
WTE Transfer Station Imps (Previously under WTE Campus Imps) 20096140132 E 650,000 650,000 650,000
Landfill Phase Expansion 2022 20095640132 E 0 1,500,000 1,500,000
Burner Retrofit (Previously under WTE Campus Imps) 20095940132 E 500,000 0
SOLID WASTE TOTAL 0 0 2,065,000 0 0 5,655,000 8,900,000 75,000 0 0 14,630,000 1,500,000 17,520,000
*Note Due to Bond changes we are separating out some projects for tracking purposes.
FY 16/17 Funds will also be separated out during FY17/18 Carryovers individually.
TRANSIT
Project Title
TitleProject Number Fund Code
All Project
Cost prior
to FY 16/17
FY 16-17
Original
Budget
CURRENT
BUDGET
FY 16-17
Spent as of
August 2017
Second
Carryover
Request
FY 17-18
Proposed
Budget
FY 18-19
Proposed
Budget
FY 19/20
Proposed
Budget
FY 20/21
Proposed
Budget
FY21/22
Proposed
Budget
Five Year
Project
Total
6-10 Years Project Total
South Co. Park & Ride 21889448640 Grant 0 1,564,625 500,000 500,000 2,091,723 3,091,723
20889430100 GF 1,561,525 6,700
22889448640 Grant 0 0 500,101 500,101 0 1,000,202
Bus Pads, Shelters & Pulloffs 21886448640 Grant 2,373,756 0 194,451 6,761 2,459,804 2,459,804 5,028,011
# Not assigned Rosa Parks 6,000,000 6,000,000 6,000,000
TRANSIT TOTAL 2,383,606 0 3,320,601 13,461 0 9,459,905 1,000,101 2,091,723 0 0 12,551,729 0 18,255,936
7,227,925
9,850
112

DOT
Project TitleProject Account
NumberFund Code
All Project
Cost prior
to FY 16/17
FY 16-17
Original
Budget
CURRENT
BUDGET
FY 16-17
Spent as of
August 2017
Second
Carryover
Request
FY 17-18
Proposed
Budget
FY 18-19
Proposed
Budget
FY 19/20
Proposed
Budget
FY 20/21
Proposed
Budget
FY21/22
Proposed
Budget
Five Year
Project
Total
6-10 Year
ProposedProject Total
Alico Rd 4L-Ben Hill-Airport R 24507530700 GIF 1,707,504 14,800,000 13,177,657 161,198 -276,826 540,000 540,000 16,389,732
Alico Road Connector 20924538825 I 2,240,686 2,240,686 67,135,000 69,375,686
Prior Impact Fee I 18,923,777
20600238822 I 1,414,216 1,611,216 35,195 72,778 677,116 451,879 1,201,773 2,812,989
20600238823 I 57,794 97,669 44,504 747,929 349,390 1,202,789 1,620,780 3,920,888 4,018,557
20600238824 I 124,015 549,912 361,609 45,545 340,031 588,079 926,058 1,899,713 2,449,625
20600238825 I 38,032 218,680 256,712 256,712
20600230700 GT 1,739,618 2,187,668 218,447 1,506,966 3,264,324 868,165 5,639,455 7,827,123
20572430720 ST 8,500,000 319,987 21,210,820 21,210,820
State Grant G 25,000,000 25,000,000
20408830721 ST 8,412,070 8,412,070
24408830700 GIF 1,290,000 1,290,000
State Grant ST 657,754 3,500,180 4,157,934
Cape Coral Bdg WP Span Repl 20924830721 2,900,000 7,800,000 10,700,000 86,500,000 97,200,000
Colonial Blvd Alt Analysis 20924938823 I 350,000 350,000 350,000
20506730700 GT 3,564,000 17,705,689 6,330,385 17,295,000 11,718,034 29,013,034
20506730720 ST 9,000,000 9,000,000
State Grant G 2,651,966 2,651,966
20506738824 I 600,000 1,500,000 1,500,000
Gunnery Rd 8th St Imps 20924630700 GT 50,000 110,000 1,484,760 1,484,760 1,594,760
Hickory Bridge Replacement 20508330720 ST 3,800,000 3,800,000 34,800,000 38,600,000
Homestead 4L/Sunrise-Alabama 20/24506330700 GIF 3,881,894 23,138,808 370,140 690,000 690,000 32,871,935
20061130700 CONT 1,180,000 1,725,000 1,725,000
20061138822 I 930,000 39,325 1,725,000 1,725,000
Lee Blvd Traffic Signals 20063730700 GT 150,000 400,000 150,000 400,000 1,100,000 1,100,000
20502830700 GT 2,475 11,500,000 19,910,000 31,410,000
20502838822 I 1,250,000 1,500,000 2,750,000
N Airport Rd Extension West 20410030700 GT 449,024 4,540,977 6,247 200,000 200,000 5,190,001
20061338823 I 1,800,000 500,000 2,300,000
20061330700 GT 8,016,311 8,016,311
24061330700 GIF 1,001,000 519,000 1,520,000
25061330700 BP 550,000 3,632,689 4,182,689
Ortiz Ave MLK to Luckett 20407238823 I 9,205,887 599,794 36 555,000 555,000 17,939,000 28,299,681
Signal System ATMS Upgrade 20675930700 GT 3,641,785 750,000 882,258 462,142 750,000 750,000 750,000 750,000 750,000 3,750,000 8,274,043
20061430700 GT 200,000 300,000 700,000 1,200,000
24061430700 GT 37,500 37,500
20405330700 GT 5,579,388 5,579,388 38,217 15,710,000 15,710,000
20405338823 I 1,300,000 1,300,000
20405338824 I 7,200,000 7,200,000
24405330700 GIF 9,800,000 9,800,000 210 7,670,511 11,900,000 1,050,000 20,620,511
20581842133 ST 30,000 82,196 12,235 30,000 30,000 30,000 30,000 30,000 150,000
20581842135 ST 120,000 328,784 48,941 120,000 120,000 120,000 120,000 120,000 600,000
20061542133 ST 650,000 650,000 650,000 650,000
20061542135 ST 2,600,000 2,600,000 2,600,000 2,600,000
DOT TOTAL 72,278,635 48,789,031 116,068,074 14,012,479 -696,826 41,162,920 23,101,509 78,924,316 76,323,640 24,749,437 244,261,822 206,774,000 644,588,335
*Grants listed above have not been received.
Toll System Replacement 6,500,000
Three Oaks Extension North 7,047,727 67,257,626
Toll Interoperability 39,020 1,200,000
Ortiz 4L/Colonial - MLK 16,019,000
Sunshine Blvd/8th St SW Rounda 1,237,500
Kismet/Littleton Realignment 1,610,0005,060,000
Littleton Road 400,000 34,560,000
-420,000
54,679,338
Estero Blvd - Phase I 7,358,741 67,829,430
Burnt Store 4L/78-Van Buren 20,023,276 5,900,000 21,216,058 5,561,187
Bicycle/Pedestrain Facilities 18,923,777
Big Carlos Pass Bridge Replace ##########
113

UTILITIES
Project Title Project Number Fund Code
All Project
Cost prior
to FY 16/17
FY 16-17
Original
Budget
CURRENT
BUDGET
FY 16-17
Spent as of
August 2017
Second
Carryover
Request
FY 17-18
Proposed
Budget
FY 18-19
Proposed
Budget
FY 19/20
Proposed
Budget
FY 20/21
Proposed
Budget
FY21/22
Proposed
Budget
Five Year
Project
Total
6-10 Years Project Total
Alico Rd 4L WM Rel-Ben Hill to 20761448730 E 67,713 137,327 19,980 -7,520 3,750,000 3,750,000 3,947,520
Bayshore Rd WM (Samville N41) 20063248712 E 500,000 3,000,000 3,500,000 3,500,000
Ben Hill Griffin FM Improve S 20733448713 E 250,000 250,000 -250,000 275,000 275,000 5,445,000 5,995,000 5,995,000
Carriage Village WM Replacemen NEW 20064048730 E 187,000 1,224,168 1,411,168 1,411,168
Corkscrew ASR Pipe Replacement NEW 20064248730 E 1,369,662 1,369,662 1,369,662
Corkscrew Prod Well Panel Repl 20762248720 E 300,000 -300,000 363,000 2,389,200 2,752,200 2,752,200
Del Prado Water Main Replace 20760648720 E 200,000 1,500,000 1,700,000 1,700,000
DOT Proj Utility Relocations 20741648730 E 2,537,456 94,069 19,564 -5,822 100,000 100,000 2,725,703
Electrical Equip Upgrd&Repl 20742948730 E 3,789,208 374,000 765,645 339,168 -71,552 400,000 420,000 390,000 170,000 170,000 1,550,000 850,000 6,883,301
Estero Blvd Force Main Relocat 20732648730 E 3,448,264 1,760,000 13,882,632 3,561,695 3,520,000 3,520,000 7,040,000 24,370,896
Fiddlesticks Water Main Rep 20745848720 E 1,650,166 1,650,166 -1,370,000 2,366,045 2,300,000 4,666,045 4,946,211
Fiesta Village Swr Coll Sys Im 20729348713 E 37,512 950,000 950,000 -950,000 165,000 165,000 1,045,000 1,247,512
Fiesta Village WWTP Ctl Upg 20925048730 E 75,630 35,140 850,000 850,000 925,630
FIesta Village WWTP Deep Well 20925148730 E 1,980,000 7,590,000 9,570,000 9,570,000
Fiesta Village WWTP Filter Ctr 20745948730 E 1,370,000 1,370,000 1,370,000 1,370,000 2,740,000
Fiesta Village WWTP Rm Upgrd 20061648730 E 300,000 300,000 -300,000 330,000 110,000 4,757,500 5,197,500 5,197,500
Fiesta Village WWTP Sludge Hau 20745048730 E 1,350,000 1,350,000 -1,000,000 1,975,000 1,975,000 2,325,000
FMB Deep Injection Well #2 20061748730 E 1,650,000 6,600,000 8,250,000 8,250,000
FMB Main Switchgear Repl 20062648720 E 200,000 200,000 2,800,000 3,000,000
FMB WWTP EQ Tank Replacement 20061948720 E 480,000 8,200,000 8,680,000 8,680,000
Gateway WWTP Sludge Roof Rep 20062048730 E 150,000 150,000 -150,000 150,000 150,000 150,000
Gibson Circle WM Improvements NEW 20063948730 E 100,000 700,000 800,000 800,000
Green Meadows 2nd Deep Inj 20746148730 E 5,160,000 5,160,000 5,160,000
Hancock Brg WM Improvements 20746248730 E 120,000 120,000 745,000 745,000 865,000
Hurricane Bay Bg Scour Prot 20063448730 E 176,000 176,000 -176,000 176,000 1,175,000 1,351,000 1,351,000
Inflow & Infiltration Improv 20724748720 E 9,152,390 500,000 637,048 555,980 -17,556 500,000 500,000 500,000 500,000 500,000 2,500,000 2,500,000 14,771,882
Instrument. Upgrds & Imp 20743048730 E 1,851,615 110,000 125,027 85,749 140,000 120,000 140,000 120,000 140,000 660,000 640,000 3,276,642
LCU Generator Replace/Improve 20744448730 E 1,545,544 150,000 173,727 77,827 190,000 290,000 235,000 150,000 600,000 1,465,000 1,100,000 4,284,271
Mariana Ave WM Rep 20927248720 E 500,000 500,000 -500,000 500,000 500,000 500,000
Master Lift Sta 7716 Improve 20733548713 E 191 1,425,000 1,425,000 16,138 -1,050,000 2,040,000 2,040,000 2,415,191
Master Pump Station 6600 Upgrd NEW 20063848730 E 70,000 475,000 545,000 545,000
McGregor Blvd FM & WM Replacem 20745348720 E 850,380 130,897 500,000 500,000 1,481,277
McGregor-Tanglewood Force Main 20062148720 E 440,000 440,000 -440,000 484,000 3,190,000 3,674,000 3,674,000
New Post Rd WM Improvements 20746448720 E 430,000 430,000 55,699 775,000 2,075,000 2,850,000 3,280,000
NLC WTP Deep Injection Well Ba 20761848730 E 5,350,000 5,350,000 301,894 -3,576,626 6,850,000 6,850,000 8,623,374
20063348712 E 2,500,000 2,500,000 5,000,000
20063348730 E 25,000,000 25,000,000
20761948712 E 2,300,000 2,300,000
20761948730 E 475,000 10,600,000 11,075,000
20761948735 E 2,763 0 300,000 300,000
North Tamiami 24" WM 20063548712 E 800,000 4,800,000 5,600,000 5,600,000
North-South 30" WM-SR 80 20062848730 E 4,000,000 12,100,000 16,100,000 12,100,000 28,200,000
Olga WTP MCC Replacement 20926748720 E 9,967 159,248 159,248 250,000 250,000 419,215
Operations Bldg Replacement 20745448730 E 23,347 1,527,000 1,578,653 10,950 16,500,000 16,500,000 18,102,000
Orange Grove WM Pondella 20926848712 E 100,000 100,000 1,500,000 1,500,000 1,600,000
Page Park Wtrline Improv 20712748730 E 3,198,954 0 4,356,932 -3 -6,200 1,200,000 1,200,000 8,749,686
Pine Isl WWTP Deep Bed Sand 20746548730 E 100,000 100,000 650,000 750,000
Pine Ridge FM-FMB WWTP Gulf 20926948720 E 200,000 200,000 -200,000 220,000 220,000 1,686,300 2,126,300 2,126,300
NLC WTP Wellfield Expansion to 13,677,763
NLC WTP Expansion to 15 MGD 30,000,000
114

Utilities Continued
Pinewoods MF Wellfield Access NEW 20064348730 E 94,500 360,000 454,500 454,500
Pinewoods Odor Ctrl Scrubber 20062748730 E 200,000 200,000 200,000
Pinewoods WTP Degasifiers Rep 20062348720 E 759,000 759,000 759,000
Principia WM Improvement NEW 20064448720 E 80,000 460,000 540,000 540,000
Reclaim Water ASR 20/22-728448730 E/G 91,600 1,200,000 2,368,400 91,600 4,500,000 4,500,000 6,960,000
Remote Telemetry Replacement 20762348730 E 500,000 500,000 500,000 500,000 500,000 500,000 2,000,000 2,500,000
Reuse System & Site Improvemen 20745548730 E 138,280 1,000,000 1,000,000 -1,000,000 2,006,283 1,375,000 1,375,000 4,756,283 1,375,000 6,269,563
San Carlos Blvd Improvement 20716248712 E 270,000 270,000 1,800,000 2,070,000
SCADA Upgrades & Imp 20742448730 E 3,696,947 400,000 669,596 184,452 350,000 450,000 200,000 200,000 200,000 1,400,000 1,000,000 6,766,543
Secondary Containments-Chemica 20745648730 E 92,709 150,000 350,000 49,350 150,000 150,000 592,709
SFM Water Trans Line Improve 20718448730 E 329,960 200,000 2,000,000 2,200,000 2,529,960
Summerlin Road Water Sys Impro 20719448712 E 519,521 750,000 2,600,000 3,350,000 4,900,000 8,769,521
US 41 Water Main Improvement 20717048730 E 7,086,205 400,000 4,036,385 3,065,107 1,800,000 1,800,000 12,922,590
Wastewater System Improvements 20722948730 E 3,093,919 250,000 276,306 174,625 450,000 350,000 350,000 350,000 350,000 1,850,000 1,750,000 6,970,225
Wastewater Treatmnt Plt Improv 20713848730 E 4,694,293 416,500 490,852 95,240 401,500 437,500 387,500 362,500 287,500 1,876,500 837,500 7,899,145
Water System Improvements 20709448730 E 4,882,334 600,000 663,325 486,558 700,000 700,000 700,000 700,000 700,000 3,500,000 4,100,000 13,145,659
Water Trans-Ben Hill to Treeli 20719348712 E 2,316,253 6,960,000 6,960,000 9,276,253
Water Treatment Plt Improv 20726848730 E 6,186,350 187,500 280,539 68,492 312,500 262,500 187,500 307,500 587,500 1,657,500 1,657,500 9,781,889
Waterway Transmission Line 20718348712 E 254,123 150,000 1,100,000 1,250,000 1,504,123
Well Redevelop/Upgrd&Rebuild 20714948720 E 4,131,243 130,000 265,345 -264,345 430,000 330,000 130,000 130,000 130,000 1,150,000 650,000 5,932,243
Work Drive Industrial Pk WM Im 20762048720 E 600,000 -600,000 660,000 2,200,000 2,860,000 2,860,000
Wtr/Swr Line Reloc-3 Oaks 20742648730 E 500 50,000 300,000 350,000 350,500
20746748713 E 2,800,000 15,000,000 17,800,000
20746748730 E 15,800,000 15,800,000
64,029,543 24,416,166 48,678,749 9,454,451 (12,235,621) 55,855,045 37,373,368 51,143,745 98,359,500 21,635,000 264,366,658 39,755,000 404,594,329
Project Title Project Number Fund Code
All Project
Cost prior
to FY 16/17
FY 16-17
Original
Budget
CURRENT
BUDGET
FY 16-17
Spent as of
August 2017
Second
Carryover
Request
FY 17-18
Proposed
Budget
FY 18-19
Proposed
Budget
FY 19/20
Proposed
Budget
FY 20/21
Proposed
Budget
FY21/22
Proposed
Budget
Five Year
Project
Total
6-10 Years Project Total
GRAND TOTAL CIP 139,967,816 83,734,777 195,202,359 23,678,297 (12,932,447) 125,472,385 73,824,978 135,059,784 175,084,868 46,384,437 555,826,452 248,832,456 1,131,665,726
WWTP Capacity Inc for SE Co 33,600,000
UTILITIES TOTAL
115

116

FY 16/17 BUDGET
45% 6 mths/100%
6 mths plus 2% 100% plus 2% 100% plus 2% 100% plus 2% 100% plus 2%
Actual Current 5 YEAR
FY 15/16 FY 16/17 FY 17/18 FY 18/19 FY 19/20 FY 20/21 FY 21/22 TOTAL
COMMUNITY PARK DISRICTS
18621 - Ft Myers/Alva
18622 - North Ft Myers
18623 - Lehigh
18624 - South Fort Myers
18625 - Pine Island/Matlacha
18626- Sanibel/Captiva
18627 - Boca Grande
18628 - Estero
18629 - Gateway
18651 - North District 58,695 55,088 90,544 124,889 127,387 129,935 132,533 605,288
18652 - East District 177,153 83,949 137,959 187,228 190,973 194,792 198,688 909,639
18653 - South District 214,626 309,352 508,369 701,199 715,223 729,527 744,118 3,398,436
18654 - Gateway 42,922 25,553 40,377 55,692 56,806 57,942 59,101 269,918
18655 - Sanibel 500 500 510 520 531 541 2,602
TOTAL 493,397 474,442 777,749 1,069,518 1,090,908 1,112,727 1,134,981 5,185,883
Actual Current 5 YEAR
FY 15/16 FY 16/17 FY 17/18 FY 18/19 FY 19/20 FY 20/21 FY 21/22 TOTAL
REGIONAL PARK DISTRICT
18700 - County Wide 758,427 589,437 968,644 1,336,062 1,362,783 1,390,039 1,417,840 6,475,368
TOTAL 758,427 589,437 968,644 1,336,062 1,362,783 1,390,039 1,417,840 6,475,368
Actual Current 5 YEAR
FY 15/16 FY 16/17 FY 17/18 FY 18/19 FY 19/20 FY 20/21 FY 21/22 TOTAL
ROAD DISTRICTS
18821 - Boca Grande 0 1,000 1,122 1,144 1,167 1,191 1,214 5,839
18822 - North 645,226 591,237 971,603 1,340,142 1,366,945 1,394,284 1,422,169 6,495,143
18823 - Central 1,690,196 781,067 1,278,478 1,763,417 1,798,685 1,834,659 1,871,352 8,546,592
18824 - Southwest 1,335,180 948,549 1,558,785 2,150,048 2,193,049 2,236,910 2,281,648 10,420,440
18825 - Southeast 76,388 554,000 911,000 1,282,000 1,307,640 1,333,793 1,360,469 6,194,901
TOTAL 3,746,990 2,875,853 4,720,988 6,536,751 6,667,486 6,800,836 6,936,853 31,662,915
WORKING COPY OF IMPACT FEE PROJECTIONS REPORT
117
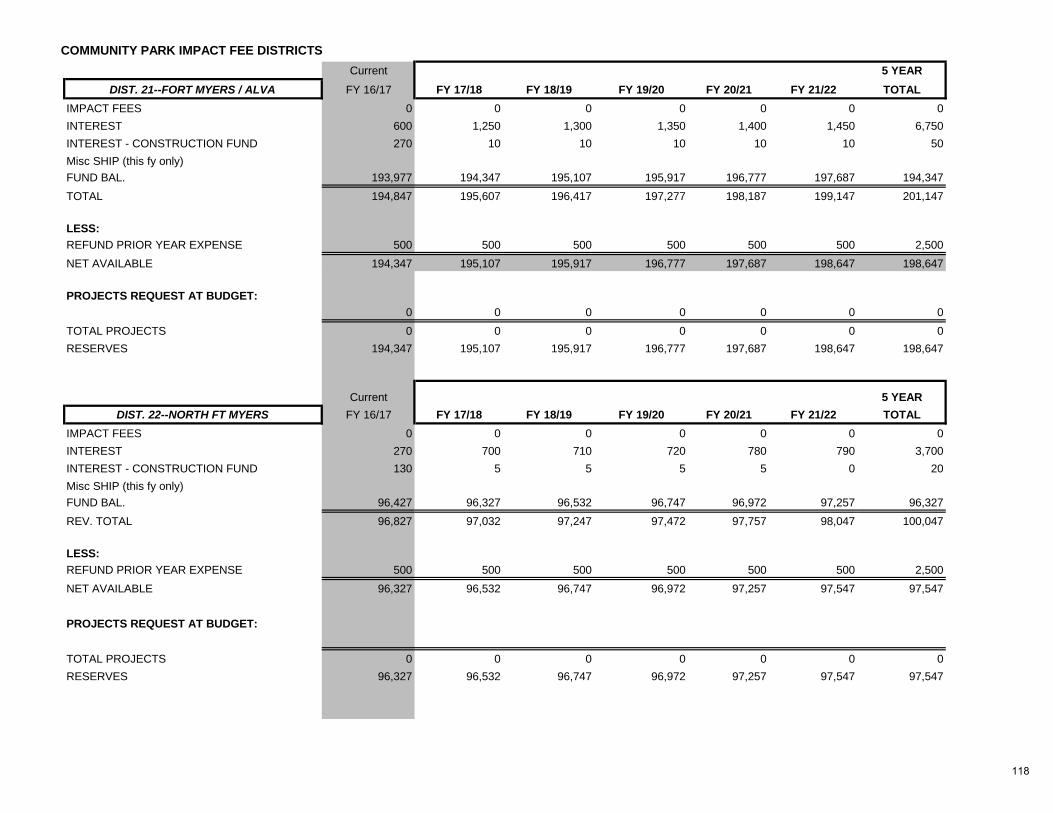
COMMUNITY PARK IMPACT FEE DISTRICTS
Current 5 YEAR
DIST. 21--FORT MYERS / ALVA FY 16/17 FY 17/18 FY 18/19 FY 19/20 FY 20/21 FY 21/22 TOTAL
IMPACT FEES 0 0 0 0 0 0 0
INTEREST 600 1,250 1,300 1,350 1,400 1,450 6,750
INTEREST - CONSTRUCTION FUND 270 10 10 10 10 10 50
Misc SHIP (this fy only)
FUND BAL. 193,977 194,347 195,107 195,917 196,777 197,687 194,347
TOTAL 194,847 195,607 196,417 197,277 198,187 199,147 201,147
LESS:
REFUND PRIOR YEAR EXPENSE 500 500 500 500 500 500 2,500
NET AVAILABLE 194,347 195,107 195,917 196,777 197,687 198,647 198,647
PROJECTS REQUEST AT BUDGET:
0 0 0 0 0 0 0
TOTAL PROJECTS 0 0 0 0 0 0 0
RESERVES 194,347 195,107 195,917 196,777 197,687 198,647 198,647
Current 5 YEAR
DIST. 22--NORTH FT MYERS FY 16/17 FY 17/18 FY 18/19 FY 19/20 FY 20/21 FY 21/22 TOTAL
IMPACT FEES 0 0 0 0 0 0 0
INTEREST 270 700 710 720 780 790 3,700
INTEREST - CONSTRUCTION FUND 130 5 5 5 5 0 20
Misc SHIP (this fy only)
FUND BAL. 96,427 96,327 96,532 96,747 96,972 97,257 96,327
REV. TOTAL 96,827 97,032 97,247 97,472 97,757 98,047 100,047
LESS:
REFUND PRIOR YEAR EXPENSE 500 500 500 500 500 500 2,500
NET AVAILABLE 96,327 96,532 96,747 96,972 97,257 97,547 97,547
PROJECTS REQUEST AT BUDGET:
TOTAL PROJECTS 0 0 0 0 0 0 0
RESERVES 96,327 96,532 96,747 96,972 97,257 97,547 97,547
118

COMMUNITY PARK IMPACT FEE DISTRICTS
Current 5 YEAR
DIST. 23--LEHIGH FY 16/17 FY 17/18 FY 18/19 FY 19/20 FY 20/21 FY 21/22 TOTAL
IMPACT FEES 0 0 0 0 0 0 0
INTEREST 8,000 8,000 8,200 8,400 8,500 8,600 41,700
INTEREST - CONSTRUCTION FUND 600 10 10 10 10 10 50
Misc SHIP (this fy only)
FUND BAL. 4,384,170 2,625,166 2,631,676 2,638,386 2,645,296 2,652,306 2,625,166
REV. TOTAL 4,392,770 2,633,176 2,639,886 2,646,796 2,653,806 2,660,916 2,666,916
LESS:
REFUND PRIOR YEAR EXPENSE 1,500 1,500 1,500 1,500 1,500 1,500 7,500
NET AVAILABLE 4,391,270 2,631,676 2,638,386 2,645,296 2,652,306 2,659,416 2,659,416
PROJECTS REQUEST AT BUDGET:
201865 Lehigh Acquisition & Park Imp 1,766,104 0 0 0 0 0 0
TOTAL EXPENDITURES 1,766,104 0 0 0 0 0 0
RESERVES 2,625,166 2,631,676 2,638,386 2,645,296 2,652,306 2,659,416 2,659,416
Current 5 YEAR
DIST. 24-SOUTH FT. MYERS FY 16/17 FY 17/18 FY 18/19 FY 19/20 FY 20/21 FY 21/22 TOTAL
IMPACT FEES 0 0 0 0 0 0 0
INTEREST 343 600 610 620 630 20 2,480
INTEREST - CONSTRUCTION FUND 40 10 10 10 10 10 50
Misc SHIP (this fy only)
FUND BAL. 148,005 94,032 94,142 94,262 94,392 94,532 94,032
REV. TOTAL 148,388 94,642 94,762 94,892 95,032 94,562 96,562
LESS:
REFUND PRIOR YEAR EXPENSE 500 500 500 500 500 500 2,500
NET AVAILABLE 147,888 94,142 94,262 94,392 94,532 94,062 94,062
PROJECTS REQUEST AT BUDGET:
201873 Wa-Kehatchee CP 0 0 0 0 90,000 90,000
202146 Brooks Park Master Plan Imps 53,856 0 0 0 0 0 0
TOTAL PROJECTS 53,856 0 0 0 0 90,000 90,000
RESERVES 94,032 94,142 94,262 94,392 94,532 4,062 4,062
119

COMMUNITY PARK IMPACT FEE DISTRICTS
Current 5 YEAR
DIST. 25--PINE ISLAND / MATLACHA FY 16/17 FY 17/18 FY 18/19 FY 19/20 FY 20/21 FY 21/22 TOTAL
IMPACT FEES 0 0 0 0 0 0 0
INTEREST 160 400 410 420 430 440 2,100
INTEREST - CONSTRUCTION FUND 30 0 0 0 0 0 0
Misc SHIP (this fy only)
FUND BAL. 52,946 32,939 33,139 33,349 33,569 33,799 32,939
REV. TOTAL 53,136 33,339 33,549 33,769 33,999 34,239 35,039
LESS:
REFUND PRIOR YEAR EXPENSE 200 200 200 200 200 200 1,000
NET AVAILABLE 52,936 33,139 33,349 33,569 33,799 34,039 34,039
PROJECTS REQUEST AT BUDGET:
201798 Phillips Park 19,997 0 0 0 0 0 0
TOTAL PROJECTS 19,997 0 0 0 0 0 0
RESERVES 32,939 33,139 33,349 33,569 33,799 34,039 34,039
Current 5 YEAR
DIST. 26--SANIBEL / CAPTIVA FY 16/17 FY 17/18 FY 18/19 FY 19/20 FY 20/21 FY 21/22 TOTAL
IMPACT FEES 0 0 0 0 0 0 0
INTEREST 20 50 55 60 65 70 300
INTEREST - CONSTRUCTION FUND 0 0 0 0 0 0 0
Misc SHIP (this fy only)
FUND BAL. 6,096 6,016 5,966 5,921 5,881 5,846 6,016
REV. TOTAL 6,116 6,066 6,021 5,981 5,946 5,916 6,316
LESS:
REFUND PRIOR YEAR EXPENSE 100 100 100 100 100 100 500
NET AVAILABLE 6,016 5,966 5,921 5,881 5,846 5,816 5,816
PROJECTS REQUEST AT BUDGET:
Playground Equipment 0 0 0 0 0 0
TOTAL PROJECTS 0 0 0 0 0 0 0
RESERVES 6,016 5,966 5,921 5,881 5,846 5,816 5,816
120
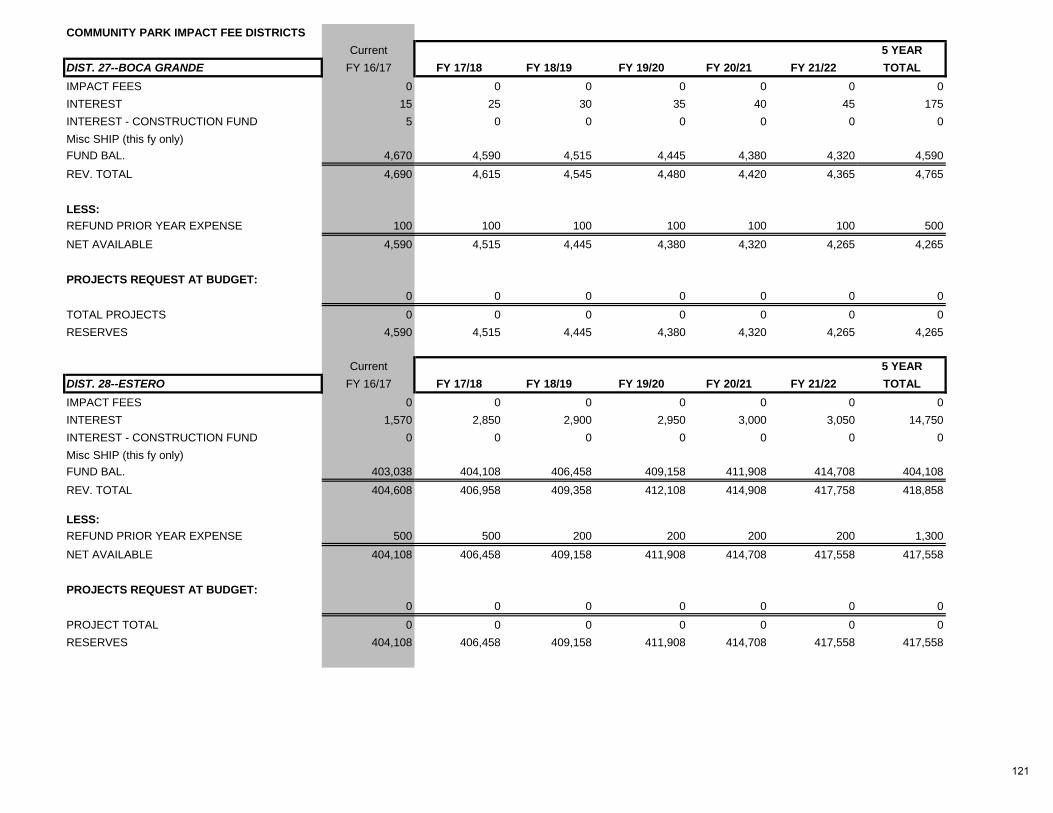
COMMUNITY PARK IMPACT FEE DISTRICTS
Current 5 YEAR
DIST. 27--BOCA GRANDE FY 16/17 FY 17/18 FY 18/19 FY 19/20 FY 20/21 FY 21/22 TOTAL
IMPACT FEES 0 0 0 0 0 0 0
INTEREST 15 25 30 35 40 45 175
INTEREST - CONSTRUCTION FUND 5 0 0 0 0 0 0
Misc SHIP (this fy only)
FUND BAL. 4,670 4,590 4,515 4,445 4,380 4,320 4,590
REV. TOTAL 4,690 4,615 4,545 4,480 4,420 4,365 4,765
LESS:
REFUND PRIOR YEAR EXPENSE 100 100 100 100 100 100 500
NET AVAILABLE 4,590 4,515 4,445 4,380 4,320 4,265 4,265
PROJECTS REQUEST AT BUDGET:
0 0 0 0 0 0 0
TOTAL PROJECTS 0 0 0 0 0 0 0
RESERVES 4,590 4,515 4,445 4,380 4,320 4,265 4,265
Current 5 YEAR
DIST. 28--ESTERO FY 16/17 FY 17/18 FY 18/19 FY 19/20 FY 20/21 FY 21/22 TOTAL
IMPACT FEES 0 0 0 0 0 0 0
INTEREST 1,570 2,850 2,900 2,950 3,000 3,050 14,750
INTEREST - CONSTRUCTION FUND 0 0 0 0 0 0 0
Misc SHIP (this fy only)
FUND BAL. 403,038 404,108 406,458 409,158 411,908 414,708 404,108
REV. TOTAL 404,608 406,958 409,358 412,108 414,908 417,758 418,858
LESS:
REFUND PRIOR YEAR EXPENSE 500 500 200 200 200 200 1,300
NET AVAILABLE 404,108 406,458 409,158 411,908 414,708 417,558 417,558
PROJECTS REQUEST AT BUDGET:
0 0 0 0 0 0 0
PROJECT TOTAL 0 0 0 0 0 0 0
RESERVES 404,108 406,458 409,158 411,908 414,708 417,558 417,558
121

COMMUNITY PARK IMPACT FEE DISTRICTS
Current 5 YEAR
DIST. 29--GATEWAY FY 16/17 FY 17/18 FY 18/19 FY 19/20 FY 20/21 FY 21/22 TOTAL
IMPACT FEES 0 0 0 0 0 0 0
INTEREST 500 950 1,000 1,200 1,300 1,400 5,850
INTEREST - CONSTRUCTION FUND 0 0 0 0 0 0
Misc SHIP (this fy only)
FUND BAL. 132,928 132,928 133,378 133,878 134,578 135,378 132,928
REV. TOTAL 133,428 133,878 134,378 135,078 135,878 136,778 138,778
LESS:
REFUND PRIOR YEAR EXPENSE 500 500 500 500 500 500 2,500
NET AVAILABLE 132,928 133,378 133,878 134,578 135,378 136,278 136,278
PROJECTS REQUEST AT BUDGET:
TOTAL PROJECTS 0 0 0 0 0 0 0
RESERVES 132,928 133,378 133,878 134,578 135,378 136,278 136,278
122
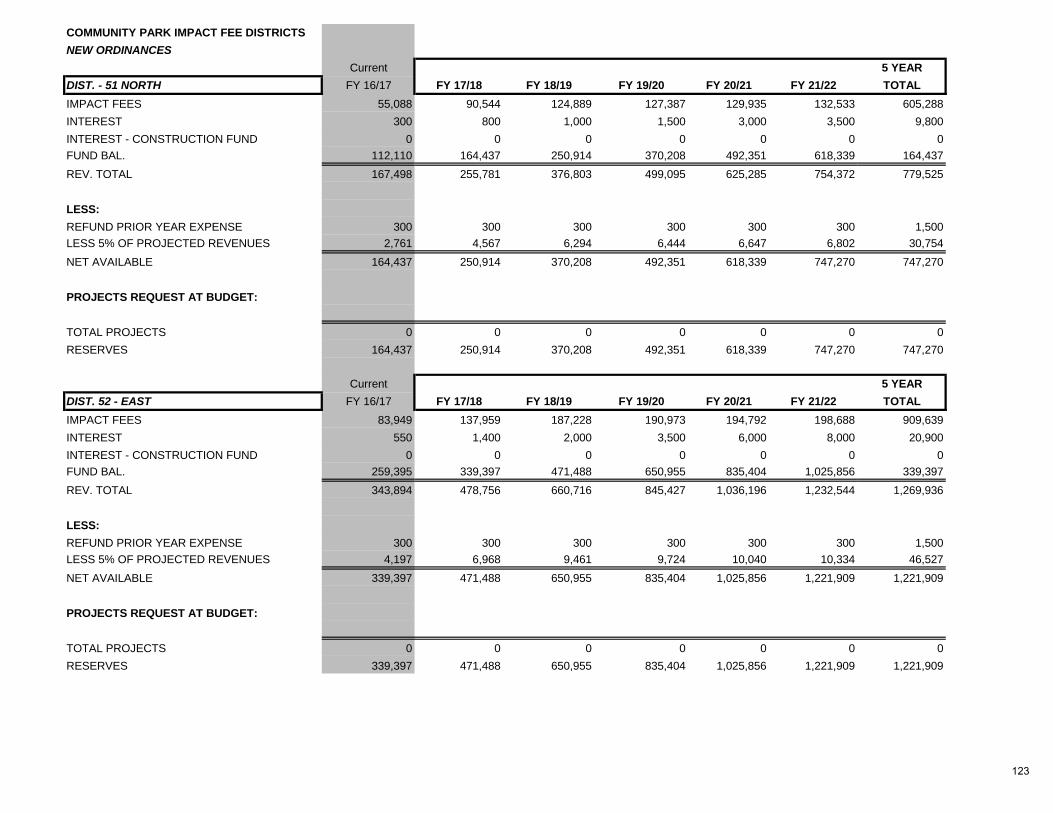
COMMUNITY PARK IMPACT FEE DISTRICTS
NEW ORDINANCES
Current 5 YEAR
DIST. - 51 NORTH FY 16/17 FY 17/18 FY 18/19 FY 19/20 FY 20/21 FY 21/22 TOTAL
IMPACT FEES 55,088 90,544 124,889 127,387 129,935 132,533 605,288
INTEREST 300 800 1,000 1,500 3,000 3,500 9,800
INTEREST - CONSTRUCTION FUND 0 0 0 0 0 0 0
FUND BAL. 112,110 164,437 250,914 370,208 492,351 618,339 164,437
REV. TOTAL 167,498 255,781 376,803 499,095 625,285 754,372 779,525
LESS:
REFUND PRIOR YEAR EXPENSE 300 300 300 300 300 300 1,500
LESS 5% OF PROJECTED REVENUES 2,761 4,567 6,294 6,444 6,647 6,802 30,754
NET AVAILABLE 164,437 250,914 370,208 492,351 618,339 747,270 747,270
PROJECTS REQUEST AT BUDGET:
TOTAL PROJECTS 0 0 0 0 0 0 0
RESERVES 164,437 250,914 370,208 492,351 618,339 747,270 747,270
Current 5 YEAR
DIST. 52 - EAST FY 16/17 FY 17/18 FY 18/19 FY 19/20 FY 20/21 FY 21/22 TOTAL
IMPACT FEES 83,949 137,959 187,228 190,973 194,792 198,688 909,639
INTEREST 550 1,400 2,000 3,500 6,000 8,000 20,900
INTEREST - CONSTRUCTION FUND 0 0 0 0 0 0 0
FUND BAL. 259,395 339,397 471,488 650,955 835,404 1,025,856 339,397
REV. TOTAL 343,894 478,756 660,716 845,427 1,036,196 1,232,544 1,269,936
LESS:
REFUND PRIOR YEAR EXPENSE 300 300 300 300 300 300 1,500
LESS 5% OF PROJECTED REVENUES 4,197 6,968 9,461 9,724 10,040 10,334 46,527
NET AVAILABLE 339,397 471,488 650,955 835,404 1,025,856 1,221,909 1,221,909
PROJECTS REQUEST AT BUDGET:
TOTAL PROJECTS 0 0 0 0 0 0 0
RESERVES 339,397 471,488 650,955 835,404 1,025,856 1,221,909 1,221,909
123

COMMUNITY PARK IMPACT FEE DISTRICTS
Current 5 YEAR
DIST. 53 - SOUTH FY 16/17 FY 17/18 FY 18/19 FY 19/20 FY 20/21 FY 21/22 TOTAL
IMPACT FEES 309,352 508,369 701,199 715,223 729,527 744,118 3,398,436
INTEREST 1,300 6,500 9,500 10,500 16,000 19,000 61,500
INTEREST - CONSTRUCTION FUND 0 0 0 0 0 0 0
FUND BAL. 515,732 810,417 1,299,243 1,974,107 2,663,243 3,371,194 810,417
REV. TOTAL 826,384 1,325,286 2,009,942 2,699,830 3,408,771 4,134,312 4,270,353
LESS:
REFUND PRIOR YEAR EXPENSE 500 300 300 300 300 300 1,500
LESS 5% OF PROJECTED REVENUES 15,467 25,743 35,535 36,286 37,276 38,156 172,997
NET AVAILABLE 810,417 1,299,243 1,974,107 2,663,243 3,371,194 4,095,857 4,095,857
PROJECTS REQUEST AT BUDGET:
2E+05 Wa-Kehatchee CP 210,000
TOTAL PROJECTS 0 0 0 0 0 0 0
RESERVES 810,417 1,299,243 1,974,107 2,663,243 3,371,194 4,095,857 4,095,857
Current 5 YEAR
DIST. 54 - GATEWAY FY 16/17 FY 17/18 FY 18/19 FY 19/20 FY 20/21 FY 21/22 TOTAL
IMPACT FEES 25,553 40,377 55,692 56,806 57,942 59,101 269,918
INTEREST 200 625 825 1,025 1,800 2,300 6,575
INTEREST - CONSTRUCTION FUND 0 0 0 0 0 0 0
FUND BAL. 67,912 92,088 130,740 184,131 238,770 295,225 92,088
REV. TOTAL 93,665 133,090 187,257 241,962 298,512 356,626 368,581
LESS:
REFUND PRIOR YEAR EXPENSE 300 300 300 300 300 300 1,500
LESS 5% OF PROJECTED REVENUES 1,277 2,050 2,826 2,892 2,987 3,070 13,825
NET AVAILABLE 92,088 130,740 184,131 238,770 295,225 353,256 353,256
PROJECTS REQUEST AT BUDGET:
TOTAL PROJECTS 0 0 0 0 0 0 0
RESERVES 92,088 130,740 184,131 238,770 295,225 353,256 353,256
124
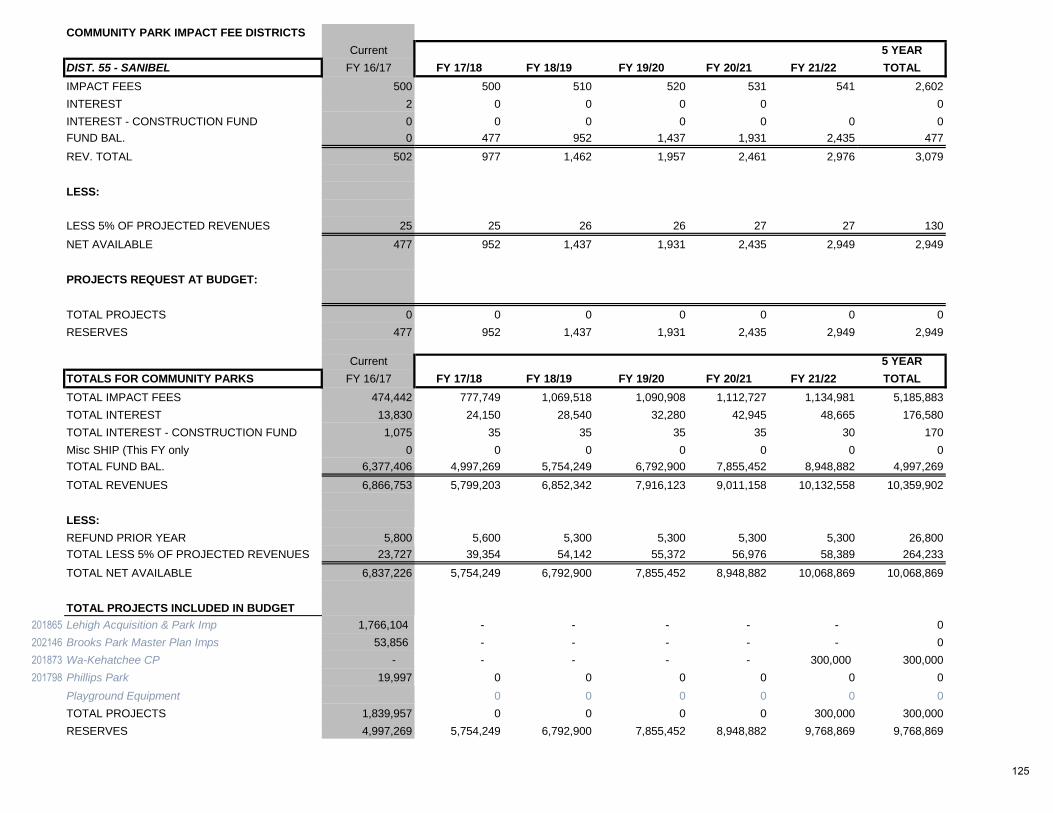
COMMUNITY PARK IMPACT FEE DISTRICTS
Current 5 YEAR
DIST. 55 - SANIBEL FY 16/17 FY 17/18 FY 18/19 FY 19/20 FY 20/21 FY 21/22 TOTAL
IMPACT FEES 500 500 510 520 531 541 2,602
INTEREST 2 0 0 0 0 0
INTEREST - CONSTRUCTION FUND 0 0 0 0 0 0 0
FUND BAL. 0 477 952 1,437 1,931 2,435 477
REV. TOTAL 502 977 1,462 1,957 2,461 2,976 3,079
LESS:
LESS 5% OF PROJECTED REVENUES 25 25 26 26 27 27 130
NET AVAILABLE 477 952 1,437 1,931 2,435 2,949 2,949
PROJECTS REQUEST AT BUDGET:
TOTAL PROJECTS 0 0 0 0 0 0 0
RESERVES 477 952 1,437 1,931 2,435 2,949 2,949
Current 5 YEAR
TOTALS FOR COMMUNITY PARKS FY 16/17 FY 17/18 FY 18/19 FY 19/20 FY 20/21 FY 21/22 TOTAL
TOTAL IMPACT FEES 474,442 777,749 1,069,518 1,090,908 1,112,727 1,134,981 5,185,883
TOTAL INTEREST 13,830 24,150 28,540 32,280 42,945 48,665 176,580
TOTAL INTEREST - CONSTRUCTION FUND 1,075 35 35 35 35 30 170
Misc SHIP (This FY only 0 0 0 0 0 0 0
TOTAL FUND BAL. 6,377,406 4,997,269 5,754,249 6,792,900 7,855,452 8,948,882 4,997,269
TOTAL REVENUES 6,866,753 5,799,203 6,852,342 7,916,123 9,011,158 10,132,558 10,359,902
LESS:
REFUND PRIOR YEAR 5,800 5,600 5,300 5,300 5,300 5,300 26,800
TOTAL LESS 5% OF PROJECTED REVENUES 23,727 39,354 54,142 55,372 56,976 58,389 264,233
TOTAL NET AVAILABLE 6,837,226 5,754,249 6,792,900 7,855,452 8,948,882 10,068,869 10,068,869
TOTAL PROJECTS INCLUDED IN BUDGET
201865 Lehigh Acquisition & Park Imp 1,766,104 - - - - - 0
202146 Brooks Park Master Plan Imps 53,856 - - - - - 0
201873 Wa-Kehatchee CP - - - - - 300,000 300,000
201798 Phillips Park 19,997 0 0 0 0 0 0
Playground Equipment 0 0 0 0 0 0
TOTAL PROJECTS 1,839,957 0 0 0 0 300,000 300,000
RESERVES 4,997,269 5,754,249 6,792,900 7,855,452 8,948,882 9,768,869 9,768,869
125

REGIONAL PARKS IMPACT FEE DISTRICT
Current 5 YEAR
COUNTYWIDE TOTAL FY 16/17 FY 17/18 FY 18/19 FY 19/20 FY 20/21 FY 21/22 TOTAL
IMPACT FEES 589,437 968,644 1,336,062 1,362,783 1,390,039 1,417,840 6,475,368
INTEREST 1,000 9,250 18,500 25,000 30,000 40,000 122,750
INTEREST - CONSTRUCTION FUND 40 0 0 0 0 0 0
Misc SHIP (This fy only) 0
FUND BAL. 2,135,990 1,896,410 2,724,104 3,478,466 4,866,049 6,285,888 1,896,410
REV. TOTAL 2,726,467 2,874,304 4,078,666 4,866,249 6,286,088 7,743,728 8,494,528
LESS:
REFUND PRIOR YEAR EXPENSES 500 200 200 200 200 200 1,000
LESS 5% OF PROJECTED REVENUES 0 0 0 0 0 0 0
NET AVAILABLE 2,725,967 2,874,104 4,078,466 4,866,049 6,285,888 7,743,528 8,493,528
PROJECTS REQUEST AT BUDGET:
202153 Caloosahatchee Pk Maint Bldg 497,310 0 0 0 0 0 0
209265 Lakes Park Botanic Garden 0
209266 Terry Park Maint Bldg 42,000
202154 Greenways 290,247 150,000 600,000 0 0 0 750,000
TOTAL PROJECTS 829,557 150,000 600,000 0 0 0 750,000
RESERVES 1,896,410 2,724,104 3,478,466 4,866,049 6,285,888 7,743,528 7,743,528
ROADS IMPACT FEE DISTRICT
Current 5 YEAR
DIST. 21--BOCA GRANDE FY 16/17 FY 17/18 FY 18/19 FY 19/20 FY 20/21 FY 21/22 TOTAL
IMPACT FEES 1,000 1,122 1,144 1,167 1,191 1,214 5,839
INTEREST 115 400 450 550 750 950 3,100
INTEREST - CONSTRUCTION FUND 100 0 0 0 0 0 0
Misc SHIP (This FY only) 0
FUND BAL. 168,484 37,422 38,668 39,983 41,414 43,058 37,422
REV. TOTAL 169,699 38,944 40,262 41,700 43,355 45,222 46,361
LESS:
REFUND PRIOR YEAR EXPENSES 0 200 200 200 200 200 1,000
LESS 5% OF PROJECTED REVENUES 59 76 80 86 97 108 447
NET AVAILABLE 169,640 38,668 39,983 41,414 43,058 44,914 44,914
PROJECTS:
206002 Bicycle/Pedestrain Facilities 132,218 0 0 0 0 0
TOTAL PROJECTS 132,218 0 0 0 0 0 0
RESERVES 37,422 38,668 39,983 41,414 43,058 44,914 44,914
126

Current 5 YEAR
DIST. 22--NORTH DISTRICT FY 16/17 FY 17/18 FY 18/19 FY 19/20 FY 20/21 FY 21/22 TOTAL
IMPACT FEES 591,237 971,603 1,340,142 1,366,945 1,394,284 1,422,169 6,495,143
INTEREST 4,000 9,000 9,000 9,000 12,000 18,000 57,000
INTEREST - CONSTRUCTION FUND 2,000 100 100 0 0 0 200
Misc SHIP (This FY only)
FUND BAL. 6,074,797 1,232,729 1,147,402 1,127,187 2,362,470 3,294,724 1,232,729
REV. TOTAL 6,672,034 2,213,432 2,496,644 2,503,132 3,768,754 4,734,893 7,785,072
LESS:
REFUND PRIOR YEAR EXPENSES 2,000 2,000 2,000 2,000 2,000 2,000 10,000
LESS 5% OF PROJECTED REVENUES 29,561 49,030 67,457 68,797 70,314 72,008 327,607
NET AVAILABLE 6,640,473 2,162,402 2,427,187 2,432,334 3,696,440 4,660,885 7,447,465
PROJECTS:
204088 Burnt Store 4L/78 Van Buren 2,866,528 1,300,000 1,300,000
205904 Matlacha Bridge Rep
200611 Kismet/Littleton Realignment 930,000 1,015,000 1,015,000
206002 Bicycle/Pedestrain Facilities 1,611,216 69,864 401,716 471,580
TOTAL PROJECTS 5,407,744 1,015,000 1,300,000 69,864 401,716 0 2,786,580
RESERVES 1,232,729 1,147,402 1,127,187 2,362,470 3,294,724 4,660,885 4,660,885
127

ROADS IMPACT FEE DISTRICT
Current 5 YEAR
DIST. 23--CENTRAL DISTRICT FY 16/17 FY 17/18 FY 18/19 FY 19/20 FY 20/21 FY 21/22 TOTAL
IMPACT FEES 781,067 1,278,478 1,763,417 1,798,685 1,834,659 1,871,352 8,546,592
INTEREST 4,000 9,000 9,000 12,000 9,000 14,000 53,000
INTEREST - CONSTRUCTION FUND 10,000 350 350 350 200 0 1,250
Misc SHIP (This FY only) 0
City of FT Myers Rev Palomino Lane 0
FUND BAL. 11,513,517 2,447,645 1,170,899 2,201,919 1,581,831 2,902,111 2,447,645
REV. TOTAL 12,308,584 3,735,473 2,943,666 4,012,955 3,425,690 4,787,464 11,048,487
LESS:
REFUND PRIOR YEAR EXPENSES 500 200 200 200 200 200 1,000
LESS 5% OF PROJECTED REVENUES 39,053 64,374 88,621 90,534 92,183 94,268 429,980
NET AVAILABLE 12,269,031 3,670,899 2,854,845 3,922,220 3,333,307 4,692,996 10,617,507
PROJECTS:
209249 Colonial Alternatives Analysis 0 350,000 0 0 0 0 350,000
204072 Ortiz Ave MLK to Luckett 599,794 0 0 0 0 0 0
204100 North Airport Rd Ext West 845,977 0 0 0 0 0 0
204604 Six Mile Cypress Pkwy 4 laning 0 0 0 0 0 0 0
205056 Ortiz Ave/SR 80 Luckett 3,134,703 0 0 0 0 0 0
205063 Homestead 4L/Sunrise-Alabama 5,161,233 0 0 0 0 0 0
205081 Palomino Lane Imp 39,804 0 0 0 0 0
200613 Ortiz 4L/Colonial -MLK 0 1,800,000 0 0 0 0 1,800,000
204053 Three Oaks Extension North 1,300,000 0 0 1,300,000
206002 Bicycle/Pedestrain Facilities 39,875 350,000 652,926 1,040,389 431,196 0 2,474,511
TOTAL PROJECTS 9,821,386 2,500,000 652,926 2,340,389 431,196 0 5,924,511
RESERVES 2,447,645 1,170,899 2,201,919 1,581,831 2,902,111 4,692,996 4,692,996
128

ROADS IMPACT FEE DISTRICT
Current 5 YEAR
DIST. 24--SOUTHWEST DISTRICT FY 16/17 FY 17/18 FY 18/19 FY 19/20 FY 20/21 FY 21/22 TOTAL
IMPACT FEES 948,549 1,558,785 2,150,048 2,193,049 2,236,910 2,281,648 10,420,440
INTEREST 8,000 17,000 25,000 35,000 6,000 9,000 92,000
INTEREST - CONSTRUCTION FUND 500 500 0 0 0 0 500
Misc SHIP (This FY only) 0 0
FUND BAL. 3,795,969 3,555,179 4,531,264 6,662,945 1,690,794 3,607,147 3,555,179
REV. TOTAL 4,753,018 5,131,464 6,706,312 8,890,994 3,933,704 5,897,795 14,068,119
LESS:
REFUND PRIOR YEAR EXPENSES 500 200 200 200 200 200 1,000
LESS 5% OF PROJECTED REVENUES 47,427 0
NET AVAILABLE 4,705,091 5,131,264 6,706,112 8,890,794 3,933,504 5,897,595 14,067,119
PROJECTS:
205067 Estero Blvd. - Phase I 600,000 600,000 600,000
204053 Three Oaks Extension North 0 0 0 7,200,000 0 0 7,200,000
206002 Bicycle/Pedestrain Facilities 549,912 43,167 326,357 369,524
TOTAL PROJECTS 1,149,912 600,000 43,167 7,200,000 326,357 0 8,169,524
RESERVES 3,555,179 4,531,264 6,662,945 1,690,794 3,607,147 5,897,595 5,897,595
129
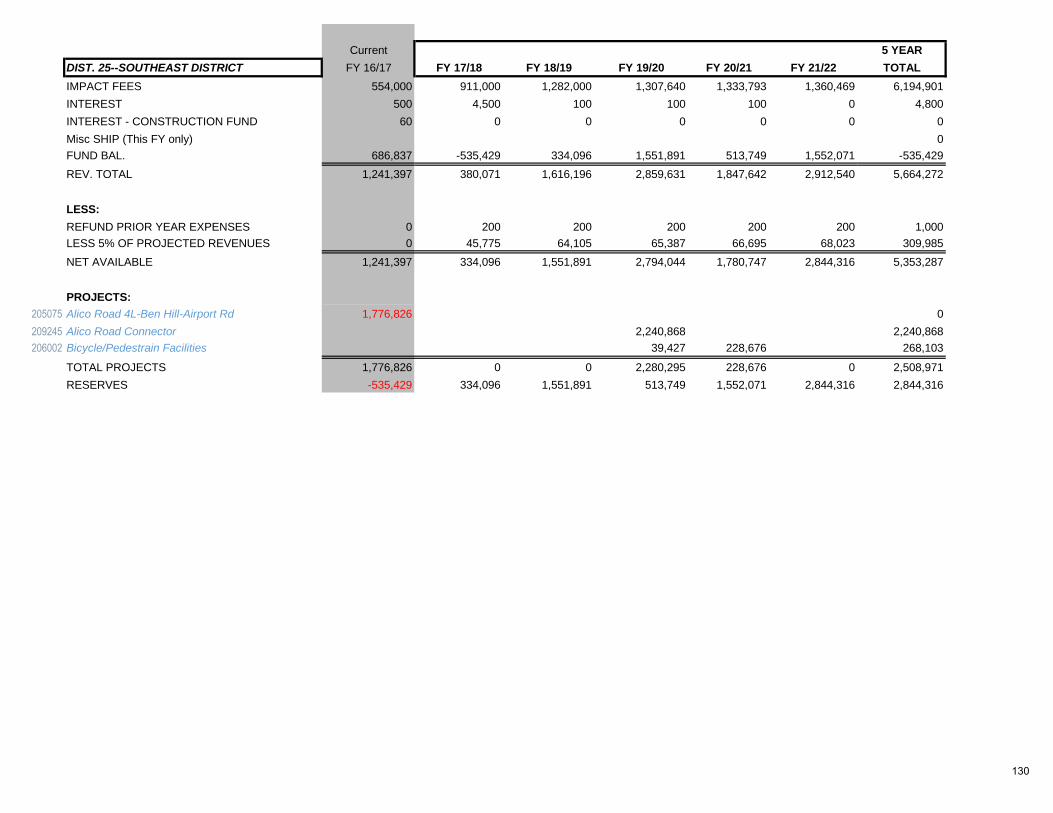
Current 5 YEAR
DIST. 25--SOUTHEAST DISTRICT FY 16/17 FY 17/18 FY 18/19 FY 19/20 FY 20/21 FY 21/22 TOTAL
IMPACT FEES 554,000 911,000 1,282,000 1,307,640 1,333,793 1,360,469 6,194,901
INTEREST 500 4,500 100 100 100 0 4,800
INTEREST - CONSTRUCTION FUND 60 0 0 0 0 0 0
Misc SHIP (This FY only) 0
FUND BAL. 686,837 -535,429 334,096 1,551,891 513,749 1,552,071 -535,429
REV. TOTAL 1,241,397 380,071 1,616,196 2,859,631 1,847,642 2,912,540 5,664,272
LESS:
REFUND PRIOR YEAR EXPENSES 0 200 200 200 200 200 1,000
LESS 5% OF PROJECTED REVENUES 0 45,775 64,105 65,387 66,695 68,023 309,985
NET AVAILABLE 1,241,397 334,096 1,551,891 2,794,044 1,780,747 2,844,316 5,353,287
PROJECTS:
205075 Alico Road 4L-Ben Hill-Airport Rd 1,776,826 0
209245 Alico Road Connector 2,240,868 2,240,868
206002 Bicycle/Pedestrain Facilities 39,427 228,676 268,103
TOTAL PROJECTS 1,776,826 0 0 2,280,295 228,676 0 2,508,971
RESERVES -535,429 334,096 1,551,891 513,749 1,552,071 2,844,316 2,844,316
130

Current 5 YEAR
TOTAL ROAD IMPACT FEE DISTRICT FY 16/17 FY 17/18 FY 18/19 FY 19/20 FY 20/21 FY 21/22 TOTAL
IMPACT FEES 2,875,853 4,720,988 6,536,751 6,667,486 6,800,836 6,936,853 31,662,915
INTEREST 16,615 39,900 43,550 56,650 27,850 41,950 209,900
INTEREST - CONSTRUCTION FUND 12,660 950 450 350 200 0 1,950
Misc SHIP (This FY only) 0 0 0 0 0 0 0
FUND BAL. 22,239,604 6,737,546 7,222,329 11,583,925 6,190,259 11,399,111 6,737,546
CONTRIBUTION 0 0 0 0 0 0 0
REV. TOTAL 25,144,732 11,499,384 13,803,080 18,308,411 13,019,145 18,377,914 38,612,311
LESS:
REFUND PRIOR YEAR EXPENSES 500 200 200 200 200 200 1,000
LESS 5% OF PROJECTED REVENUES 116,100 159,255 220,263 224,804 229,289 234,408 1,068,019
NET AVAILABLE 25,028,132 11,339,929 13,582,618 18,083,407 12,789,656 18,143,306 37,543,292
PROJECTS:
206002 Bicycle/Pedestrian Facilities 21 132,218 0 0 0 0 0 0
200611 Kismet/Littleton Realignment 930,000 1,015,000 0 0 0 0 1,015,000
204072 Ortiz Ave MLK to Luckett 599,794 0 0 0 0 0 0
204088 Burnt Store 4L/Van Buren 2,866,528 0 1,300,000 0 0 0 1,300,000
204604 Six Mile Cypress Pkwy 4 Laning 0 0 0 0 0 0 0
205056 Ortiz Ave/SR 80 Luckett 3,134,703 0 0 0 0 0 0
205081 Palomino Lane Imp 39,804 0 0 0 0 0 0
206002 Bicycle/Pedestrian Facilities 22 1,611,216 0 0 69,864 401,716 0 471,580
200613 Ortiz 4L/Colonial -MLK 0 1,800,000 0 0 0 0 1,800,000
204100 North Airport Rd Ext West 845,977 0 0 0 0 0 0
205063 Homestead 4L/Sunrise-Alabama 5,161,233 0 0 0 0 0 0
206002 Bicycle/Pedestrian Facilities 23 39,875 350,000 652,926 1,040,389 431,196 0 2,474,511
209249 Colonial Alternatives Analysis 0 350,000 0 0 0 0 350,000
204053 Three Oaks Extension North 0 0 0 8,500,000 0 0 8,500,000
205067 Estero Blvd - Phase I 600,000 600,000 600,000
206002 Bicycle/Pedestrian Facilities 24 549,912 43,167 326,357 369,524
205075 Alico Rd 4L-Ben Hill-Airport Rd 1,776,826 0 0 0 0 0 0
209245 Alico Road Connector 0 0 0 2,240,868 0 0 2,240,868
206002 Bicycle/Pedestrian Facilities 25 0 0 0 39,427 228,676 0 268,103
TOTAL PROJECTS 18,288,086 4,115,000 1,996,093 11,890,548 1,387,945 0 19,389,586
RESERVES 6,737,546 7,222,329 11,583,925 6,190,259 11,399,111 18,140,706 18,140,706
131

132

COUNTY BUDGET BY FUNCTION
TABLE OF CONTENTS
COUNTY BUDGET BY FUNCTION ............................................................................................................................. 134
GENERAL GOVERNMENT SERVICES ...................................................................................................................... 136
PUBLIC SAFETY ......................................................................................................................................................... 140
PHYSICAL ENVIRONMENT ........................................................................................................................................ 144
TRANSPORTATION .................................................................................................................................................... 148
ECONOMIC ENVIRONMENT ...................................................................................................................................... 152
HUMAN SERVICES ..................................................................................................................................................... 156
CULTURE & RECREATION ........................................................................................................................................ 160
NON-EXPENDITURE DISBURSEMENTS ................................................................................................................... 164
COURT-RELATED EXPENDITURES .......................................................................................................................... 168
BUDGET BY FUNCTION
This section provides a three-year comparative history to show the County budget by function. Functions are categorized in a uniform manner throughout the State of Florida based on the State Chart of Accounts (SCOA). The SCOA defines classifications and categories by which all revenues and expenditures are to be delineated. The following pages display expenditure classifications as related to the principal purpose for which expenditures are made. The column headings are Actual, displaying the most recent year’s final audited expense totals; Unaudited Actual, displaying expenses at the time the book was assembled, and Adopted, displaying the adopted budget. The first table, County Budget by Function, clearly shows the disparity between actual and budget. The primary difference between the totals of the actual columns and the budget column is that reserves are budgeted but do not show in actual because reserves that are used are transferred with BoCC approval to the expense area within one of the other categories shown. This is shown specifically in “Other Uses” and further in the section in the table Non-Expenditure Disbursements. On the lower portion of the table pages, the revenue sources that support the function are shown, and are categorized by fund type.
133

COUNTY BUDGET BY FUNCTION
LEE COUNTY - FLORIDA2017 - 2018
ACTUAL2015 - 2016
UNAUDITED2016 - 2017
ADOPTED2017 - 2018
FUNCTION
ACTUAL BUDGET
$ 229,275,054 $ 256,790,192 $ 271,484,844General Government
$ 229,489,951 $ 235,855,882 $ 245,922,888Public Safety
$ 213,700,795 $ 240,187,613 $ 261,699,171Physical Environment
$ 100,689,742 $ 106,989,574 $ 152,341,040Transportation
$ 27,378,697 $ 30,796,750 $ 31,620,124Economic Environment
$ 21,061,049 $ 21,216,134 $ 20,850,484Human Services
$ 70,923,684 $ 72,098,053 $ 83,211,865Culture & Recreation
$ 484,513,468 $ 336,349,151 $ 1,049,908,970Other Uses
$ 14,817,475 $ 14,245,273 $ 13,561,731Other Non-Operating
$ 6,213,973 $ 6,308,673 $ 6,849,534Court-Related Expenditures
$ 2,223,207 $ 2,314,776 $ 2,404,083Circuit Court- Criminal
$ 1,457,204 $ 1,541,914 $ 1,681,897Circuit Court - Family
$ 2,397,152 $ 2,111,997 $ 2,279,325Circuit Court - Juvenile
$ 233,444 $ 235,888 $ 241,488Circuit Court - Probate
$ 4,270,460 $ 4,654,309 $ 5,351,849Courts General Operations
$ 1,974,656 $ 2,004,602 $ 2,066,569County Courts - Criminal
$ 1,410,620,011 $ 1,333,700,781 $ 2,151,475,862GRAND TOTAL
FUNCTION BY FUND TYPE
ACTUAL UNAUDITED ADOPTEDACTUAL BUDGET
$ 401,906,081 $ 426,078,001 $ 524,120,748General Fund
$ 199,640,662 $ 217,842,336 $ 318,563,683Special Revenue Fund
$ 28,109,065 $ 36,864,659 $ 47,234,512Debt Service Fund
$ 46,232,034 $ 80,775,616 $ 280,911,691Capital Project Fund
$ 631,225,163 $ 454,772,107 $ 824,025,589Enterprise Fund
$ 103,507,006 $ 117,368,062 $ 156,619,639Internal Service Fund
GRAND TOTAL $ 1,410,620,011 $ 1,333,700,781 $ 2,151,475,862
134
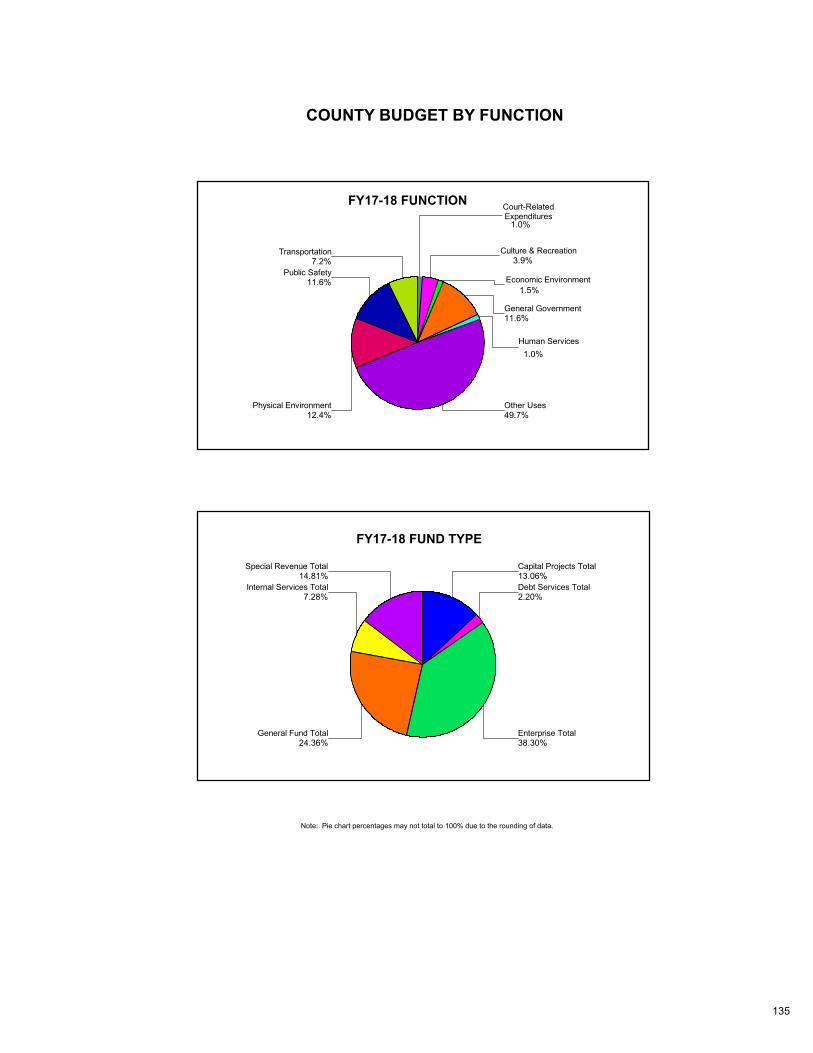
COUNTY BUDGET BY FUNCTION
1.0%
Court-RelatedExpenditures
3.9%Culture & Recreation
1.5%Economic Environment
11.6%General Government
1.0%
Human Services
49.7%Other Uses
12.4%Physical Environment
11.6%Public Safety
7.2%Transportation
FY17-18 FUNCTION
13.06%Capital Projects Total
2.20%Debt Services Total
38.30%Enterprise Total
24.36%General Fund Total
7.28%Internal Services Total
14.81%Special Revenue Total
FY17-18 FUND TYPE
Note: Pie chart percentages may not total to 100% due to the rounding of data.
135

GENERAL GOVERNMENT SERVICESLEE COUNTY - FLORIDA
2017 - 2018
ACTUAL2015 - 2016
UNAUDITED2016 - 2017
ADOPTED2017 - 2018
DEPARTMENT/DIVISION/PROGRAM
ACTUAL BUDGET
$ 1,407,494 $ 1,408,100 $ 1,475,748Legislative
$ 2,963,936 $ 3,005,634 $ 3,240,854Legal Counsel
$ 29,599,392 $ 30,888,179 $ 31,992,383Executive
$ 123,237,369 $ 134,596,034 $ 133,534,521Financial & Administrative
$ 3,970,778 $ 3,972,040 $ 4,287,656Comprehensive Planning
$ 8,579,541 $ 10,356,290 $ 10,263,970Non-Court Information Systems
$ 16,984,736 $ 25,703,086 $ 15,744,553Debt Service Payments
$ 42,531,808 $ 46,860,829 $ 70,945,159Other General Gov't Services
$ 229,275,054 $ 256,790,192 $ 271,484,844GRAND TOTAL
EXPENDITURES BY FUND TYPE
ACTUAL UNAUDITED ADOPTEDACTUAL BUDGET
$ 92,986,660 $ 99,764,891 $ 100,922,991General Fund
$ 11,824,945 $ 13,078,087 $ 12,816,727Special Revenue Fund
$ 16,984,736 $ 25,703,086 $ 15,744,553Debt Service Fund
$ 4,595,674 $ 5,759,475 $ 20,735,500Capital Project Fund
$ 3,268,517 $ 4,254,087 $ 7,715,337Enterprise Fund
$ 99,614,522 $ 108,230,566 $ 113,549,736Internal Service Fund
GRAND TOTAL $ 229,275,054 $ 256,790,192 $ 271,484,844
136

GENERAL GOVERNMENT SERVICES
26.1%
Other GeneralGov't Services
5.8%
Debt ServicePayments
3.8%
Non-CourtInformation Systems
1.6%
ComprehensivePlanning
11.8%Executive
49.2%
Financial &Administrative
1.2%Legal Counsel
0.5%Legislative
FY17-18 ACTIVITY
7.6%Capital Projects
5.8%Debt Services
2.8%Enterprise
37.2%General Fund
41.8%Internal Services
4.7%Special Revenue
FY17-18 FUND TYPE
Note: Pie chart percentages may not total to 100% due to the rounding of data.
137

GENERAL GOVERNMENT SERVICES
Under the State Uniform Accounting System Chart of Accounts, this function accounts for a major class of services provided by the legislative and administrative branches of local government for the benefit of the public and the governmental body as a whole.
Legislative These costs cover citizenry representation by the governing body. The Board of County Commissioners' district budgets represent all expenditures for this classification.
Legal Counsel This activity represents expenditures for the County Attorney's Office.
Executive These monies include the provision of executive management and administration of the local unit of government. These costs include the County Manager’s Office, Clerk of Courts, Hearing Examiner, and any separate director's office budget.
Financial and Administrative The purpose of this activity is to account for the cost of providing financial and administrative services to the local government such as Budget Services, Procurement Management, Human Resources, Information Technology Group, Property Appraiser, Tax Collector, and the Board of County Commissioners' support programs for each of the Constitutional Officers.
Comprehensive Planning Services covered include the following programs: Planning, Zoning Information, Development Services and Review,
Rezoning and DRI's and Land Development Assistance. Non-Court Information Systems All personnel, contractual and operating costs associated with the County’s hardware, software, network and other information systems services.
Debt Service Payments For the payment of general long-term debt principal, interest, and other debt services costs including payments on
bonds, to banks and other financing sources. Other General Government Services These are general government services that are not classified within other activity classifications. This classification includes County Lands, Vehicle Maintenance, Technology Oversight, Facilities Projects and miscellaneous non-
departmental expenditures.
138

139

PUBLIC SAFETYLEE COUNTY - FLORIDA
2017 - 2018
ACTUAL2015 - 2016
UNAUDITED2016 - 2017
ADOPTED2017 - 2018
DEPARTMENT/DIVISION/PROGRAM
ACTUAL BUDGET
$ 116,467,324 $ 117,873,987 $ 122,405,923Law Enforcement
$ 999,492 $ 1,319,524 $ 1,485,708Fire Control
$ 37,430,352 $ 39,345,608 $ 40,654,110Ambulance & Rescue Services
$ 2,009,179 $ 2,156,960 $ 1,962,456Emergency & Disaster Relief
$ 3,342,991 $ 3,627,280 $ 3,657,614Medical Examiner
$ 9,989,091 $ 7,846,576 $ 8,554,872Other Public Safety
$ 8,590,588 $ 9,220,426 $ 10,307,485Protective Inspections
$ 50,660,934 $ 54,465,521 $ 56,894,720Detention and/or Correction
$ 229,489,951 $ 235,855,882 $ 245,922,888GRAND TOTAL
EXPENDITURES BY FUND TYPE
ACTUAL UNAUDITED ADOPTEDACTUAL BUDGET
$ 210,669,355 $ 218,006,106 $ 226,793,678General Fund
$ 16,148,309 $ 15,377,960 $ 16,472,721Special Revenue Fund
$ 2,672,287 $ 2,471,816 $ 2,656,489Internal Service Fund
GRAND TOTAL $ 229,489,951 $ 235,855,882 $ 245,922,888
140

PUBLIC SAFETY
23.1%
Detention and/orCorrection
0.8%
Emergency & DisasterRelief
0.6%Fire Control
49.8%Law Enforcement
1.5%Medical Examiner
3.5%Other Public Safety
4.2%Protective Inspections
16.5%
Ambulance & RescueServices
FY17-18 ACTIVITY
92.2%General Fund
6.7%Special Revenue
1.1%Internal Services
FY17-18 FUND TYPE
Note: Pie chart percentages may not total to 100% due to the rounding of data.
141

PUBLIC SAFETY
This functional category accounts for services provided by local government for the safety and security of persons and property.
Law Enforcement
This activity reflects the cost of providing police services for the local government's jurisdiction. For Lee County, this represents the operation of the Sheriff's Department, excluding the Jail.
Fire Control
Throughout the unincorporated areas of Lee County, there are numerous fire control districts that operate independently of the county. However, there are three small fire districts that are under the jurisdiction of the Board of County Commissioners. The county has contracts with an independent agency, the cities of Fort Myers and Cape Coral to provide fire control services in these three areas. The County also contracts with the Florida Dept. of Agriculture for wildfire protection. The expenses in this activity reflect the cost of these contracts.
Ambulance and Rescue Services
Services consist of providing advance life support, pre-hospital emergency and primary health care via ambulance and helicopter. Emergency Dispatching services is included in this activity.
Emergency and Disaster Relief Services
Expenditures within this activity provide for defense against and relief for civil, military, hazardous materials, and natural disasters. All Hazards Protections is included in this activity.
Medical Examiner
This activity provides for payments made to the Medical Examiner pursuant to Florida Statutes for pathology services for law enforcement, courts, and legal purposes.
Other Public Safety Programs
The E-911 Implementation Program, Governmental Communications Network and Logistics are the expenditures within the county budget that fall into this classification.
Protective Inspections
Services consist of providing inspection services relevant to the issuance of a license, permit, or certificate, where such inspections are primarily for purposes of public safety. This activity includes expenses associated with codes and building services within Development Services.
Detention and/or Correction
This activity identifies the cost of confinement of prisoners, sentenced or otherwise, and rehabilitation of offenders. Programs within this activity include the Sheriff's operation of the jail.
142

143
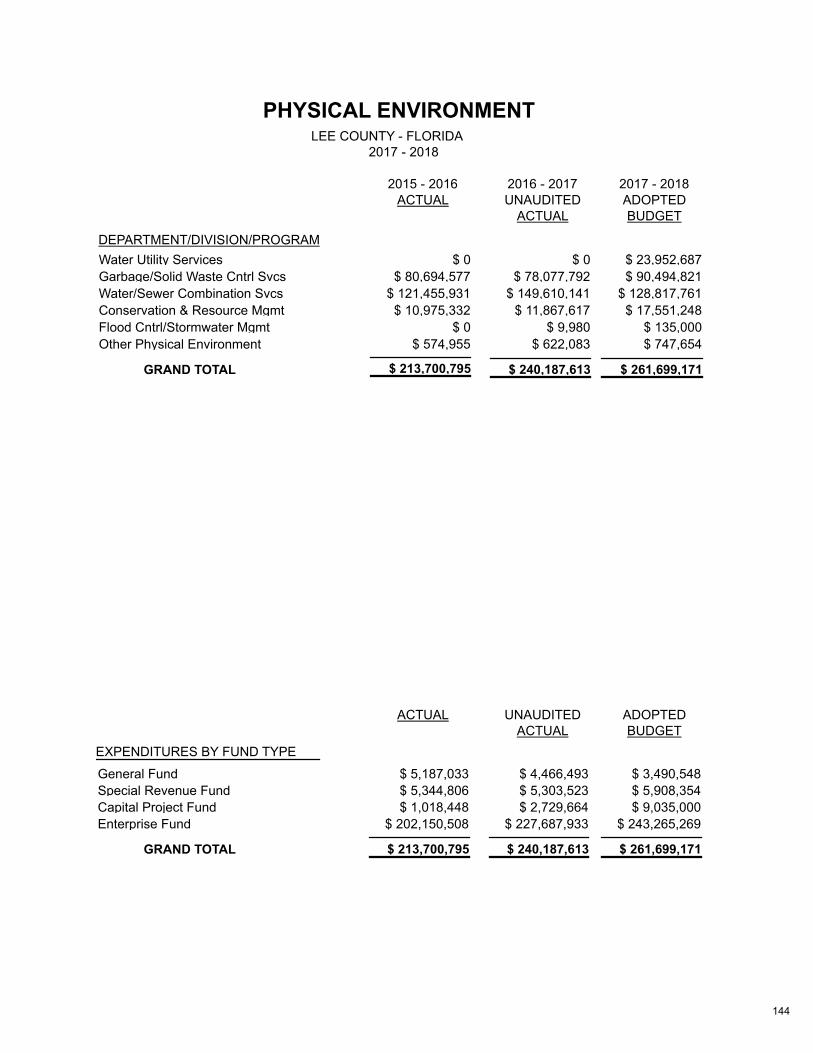
PHYSICAL ENVIRONMENTLEE COUNTY - FLORIDA
2017 - 2018
ACTUAL2015 - 2016
UNAUDITED2016 - 2017
ADOPTED2017 - 2018
DEPARTMENT/DIVISION/PROGRAM
ACTUAL BUDGET
$ 0 $ 0 $ 23,952,687Water Utility Services
$ 80,694,577 $ 78,077,792 $ 90,494,821Garbage/Solid Waste Cntrl Svcs
$ 121,455,931 $ 149,610,141 $ 128,817,761Water/Sewer Combination Svcs
$ 10,975,332 $ 11,867,617 $ 17,551,248Conservation & Resource Mgmt
$ 0 $ 9,980 $ 135,000Flood Cntrl/Stormwater Mgmt
$ 574,955 $ 622,083 $ 747,654Other Physical Environment
$ 213,700,795 $ 240,187,613 $ 261,699,171GRAND TOTAL
EXPENDITURES BY FUND TYPE
ACTUAL UNAUDITED ADOPTEDACTUAL BUDGET
$ 5,187,033 $ 4,466,493 $ 3,490,548General Fund
$ 5,344,806 $ 5,303,523 $ 5,908,354Special Revenue Fund
$ 1,018,448 $ 2,729,664 $ 9,035,000Capital Project Fund
$ 202,150,508 $ 227,687,933 $ 243,265,269Enterprise Fund
GRAND TOTAL $ 213,700,795 $ 240,187,613 $ 261,699,171
144

PHYSICAL ENVIRONMENT
34.58%
Garbage/Solid WasteCntrl Svcs
0.29%
OtherPhysical
Environment
49.22%
Water/SewerCombination Svcs
9.15%Water Utility Services
6.71%
Conservation& Resource
Mgmt
0.05%
Flood Cntrl/StormwaterMgmt
FY17-18 ACTIVITY
3.45%Capital Projects
92.96%Enterprise
1.33%General Fund
2.26%
Special Revenue
FY17-18 FUND TYPE
Note: Pie chart percentages may not total to 100% due to the rounding of data.
145

PHYSICAL ENVIRONMENT
This functional category accounts for services where the primary purpose is to achieve a satisfactory living environment by controlling and utilizing elements of the environment.
Water Utility Services
This activity identifies the costs associated with providing safe, potable water to the citizens of Lee County.
Garbage/Solid Waste Control Services
This activity includes the Solid Waste Department, which provides for proper collection and safe environmental disposal of garbage and solid waste and includes recycling, household hazardous waste, and right-of-way cleanup.
Water-Sewer Combination Services
This activity accounts for all the expenses associated with providing sanitary sewer services and the operation of the water and sewer systems under the control of Lee County Utilities. Additional services are the collection, treatment, and disposal of all liquid waste. Also included is administrative support and capital projects.
Conservation and Resource Management
Under this classification, expenditures include: Extension Services, Surface and Ground Water Management, Environmental Laboratory, Canal and Pipe/Ditch Maintenance, Marine Services and Pollutant Storage Tanks.
Flood Control/Stormwater Management
This activity includes the costs of construction, maintenance and operation of flood control programs and facilities.
Other Physical Environment Programs
This activity reflects the Small Quantity (pollutant) Generator Program.
146

147

TRANSPORTATIONLEE COUNTY - FLORIDA
2017 - 2018
ACTUAL2015 - 2016
UNAUDITED2016 - 2017
ADOPTED2017 - 2018
DEPARTMENT/DIVISION/PROGRAM
ACTUAL BUDGET
$ 69,280,305 $ 81,395,729 $ 124,484,331Road & Street Facilities
$ 31,409,437 $ 25,593,845 $ 27,856,709Transit Systems
$ 100,689,742 $ 106,989,574 $ 152,341,040GRAND TOTAL
EXPENDITURES BY FUND TYPE
ACTUAL UNAUDITED ADOPTEDACTUAL BUDGET
$ 82,796 $ 67,922 $ 0General Fund
$ 27,877,451 $ 28,951,241 $ 33,165,254Special Revenue Fund
$ 23,288,498 $ 33,459,532 $ 65,548,323Capital Project Fund
$ 49,440,997 $ 44,510,879 $ 53,627,463Enterprise Fund
GRAND TOTAL $ 100,689,742 $ 106,989,574 $ 152,341,040
148

TRANSPORTATION
81.7%
Road & StreetFacilities
18.3%
Transit Systems
FY17-18 ACTIVITY
43.0%
CapitalProjects
35.2%Enterprise
21.8%Special Revenue
FY17-18 FUND TYPE
Note: Pie chart percentages may not total to 100% due to the rounding of data.
149
TRANSPORTATION This functional area accounts for the cost of services provided by the local government for the safe and efficient flow of vehicles, bicycles, and pedestrians.
Road and Street Facilities
This activity identifies the cost of construction, maintenance and operation of road and toll bridge facilities, as well as ancillary facilities such as bridges, sidewalks, traffic control devices, streetlights, rights-of-way, shoulders, landscaping and other facilities incidental to the proper movement of traffic along roads and streets.
Transit Systems
This activity accounts for the expenditures associated with the Lee Tran bus system.
150

151

ECONOMIC ENVIRONMENTLEE COUNTY - FLORIDA
2017 - 2018
ACTUAL2015 - 2016
UNAUDITED2016 - 2017
ADOPTED2017 - 2018
DEPARTMENT/DIVISION/PROGRAM
ACTUAL BUDGET
$ 20,056,581 $ 20,973,027 $ 22,845,362Industry Development
$ 197,078 $ 256,574 $ 314,953Veterans Services
$ 6,818,556 $ 9,212,283 $ 7,980,343Housing & Urban Development
$ 306,482 $ 354,866 $ 479,466Other Economic Environments
$ 27,378,697 $ 30,796,750 $ 31,620,124GRAND TOTAL
EXPENDITURES BY FUND TYPE
ACTUAL UNAUDITED ADOPTEDACTUAL BUDGET
$ 4,923,408 $ 4,696,078 $ 3,759,152General Fund
$ 22,117,108 $ 24,668,364 $ 27,076,586Special Revenue Fund
$ 338,181 $ 1,432,308 $ 784,386Capital Project Fund
GRAND TOTAL $ 27,378,697 $ 30,796,750 $ 31,620,124
152

ECONOMIC ENVIRONMENT
25.2%
Housing & UrbanDevelopment
72.2%
Industry Development
1.5%
Other EconomicEnvironments
1.0%
Veterans Services
FY17-18 ACTIVITY
2.5%
Capital Project Fund
11.9%
General Fund
85.6%
Special Revenue
FY17-18 FUND TYPE
Note: Pie chart percentages may not total to 100% due to the rounding of data.
153
ECONOMIC ENVIRONMENT
This functional category accounts for providing services that develop and improve the economic condition of the community and its citizens.
Industry and Development
These expenditures represent the costs incurred in promoting and encouraging industry development and tourism that will directly or indirectly benefit the community. Included are the Visitor and Convention Bureau, the Division of Economic Development, and the Sports Authority.
Veterans Services
This activity accounts for the Veterans Services program which provides counseling and assistance to eligible veterans and their dependents.
Housing and Urban Development
This activity accounts for expenditures associated with providing public housing and other urban development projects. It consists of the Housing Services Program, the Neighborhood Stabilization Program, and related housing programs.
Other Economic Environments
This activity includes the Neighborhood Building program relating to economic redevelopment in depressed areas of the County.
154

155
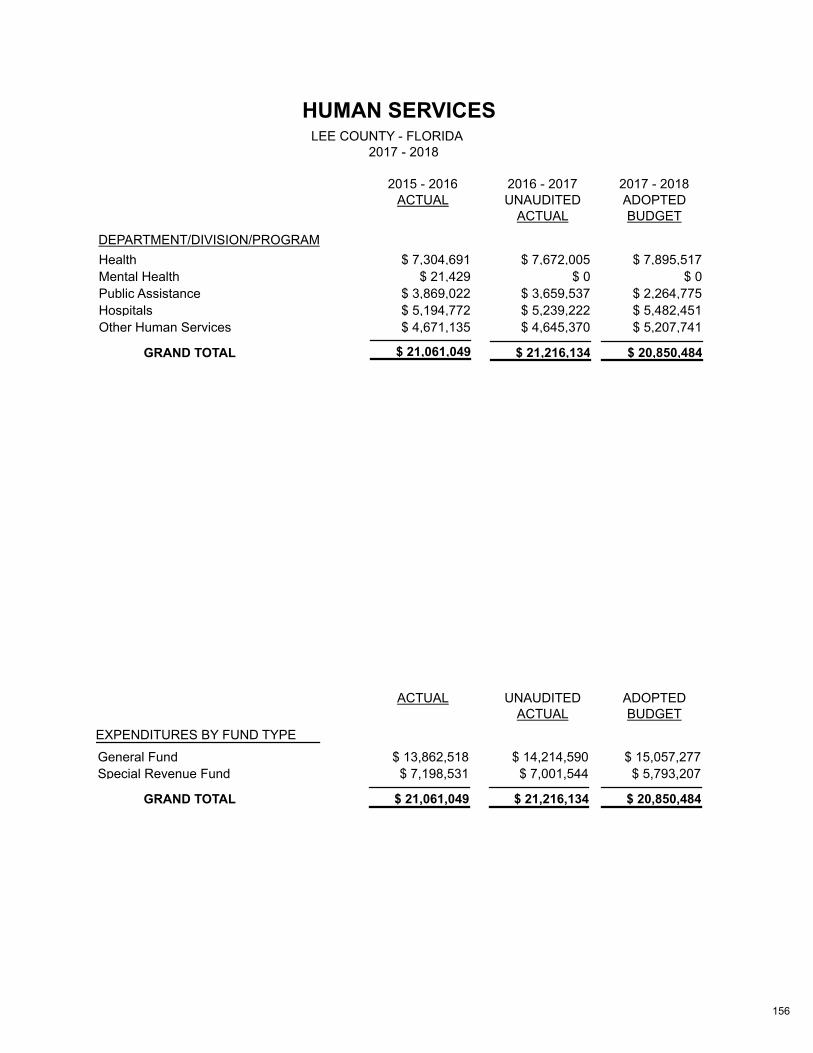
HUMAN SERVICESLEE COUNTY - FLORIDA
2017 - 2018
ACTUAL2015 - 2016
UNAUDITED2016 - 2017
ADOPTED2017 - 2018
DEPARTMENT/DIVISION/PROGRAM
ACTUAL BUDGET
$ 7,304,691 $ 7,672,005 $ 7,895,517Health
$ 21,429 $ 0 $ 0Mental Health
$ 3,869,022 $ 3,659,537 $ 2,264,775Public Assistance
$ 5,194,772 $ 5,239,222 $ 5,482,451Hospitals
$ 4,671,135 $ 4,645,370 $ 5,207,741Other Human Services
$ 21,061,049 $ 21,216,134 $ 20,850,484GRAND TOTAL
EXPENDITURES BY FUND TYPE
ACTUAL UNAUDITED ADOPTEDACTUAL BUDGET
$ 13,862,518 $ 14,214,590 $ 15,057,277General Fund
$ 7,198,531 $ 7,001,544 $ 5,793,207Special Revenue Fund
GRAND TOTAL $ 21,061,049 $ 21,216,134 $ 20,850,484
156
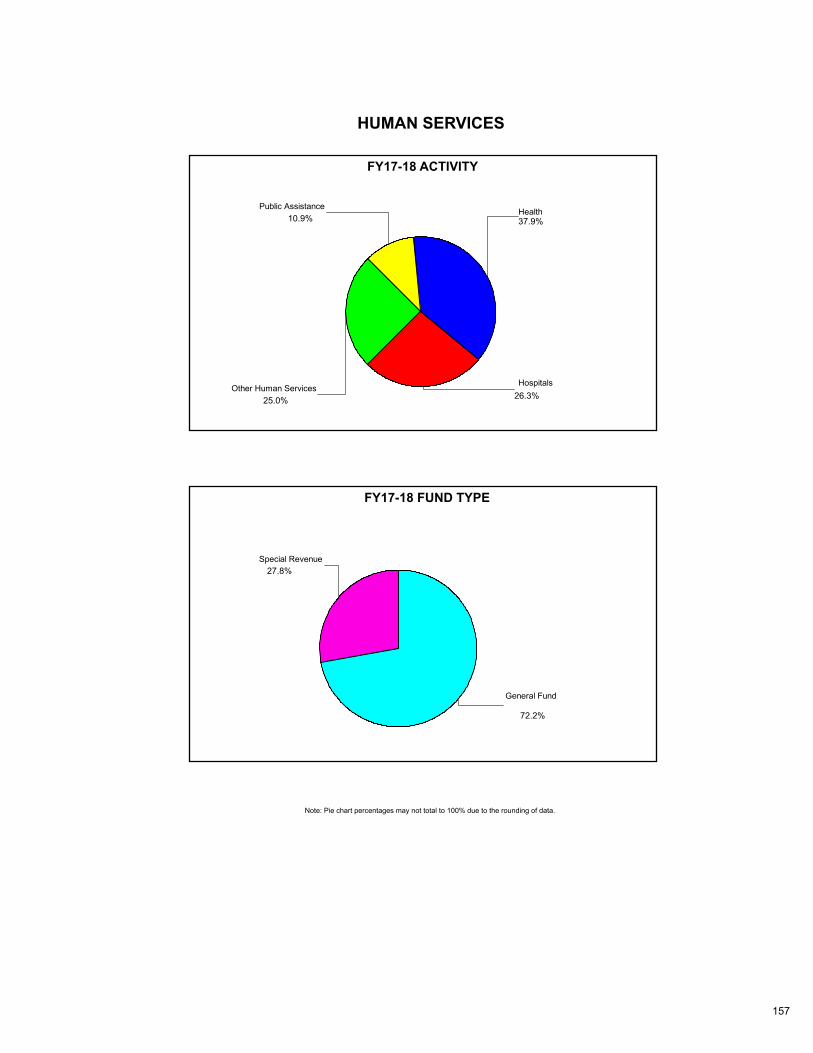
HUMAN SERVICES
37.9%Health
26.3%
Hospitals
25.0%
Other Human Services
10.9%
Public Assistance
FY17-18 ACTIVITY
72.2%
General Fund
27.8%
Special Revenue
FY17-18 FUND TYPE
Note: Pie chart percentages may not total to 100% due to the rounding of data.
157

HUMAN SERVICES
This functional category reflects the cost of providing services for the health and welfare of individual citizens and the community as a whole.
Health
These expenditures reflect the cost of providing nursing, dental care, diagnostic, rehabilitation, and other services for the care and treatment of the sick; and for the control and prevention of disease. Expenditures for this activity represent the Health Department. Also included are expenditures for Animal Services.
Mental Health
These expenditures reflect the cost of diagnosis and treatment of mental illnesses by the community, and the
provision of mental health services for public use.
Public Assistance
This activity represents the cost of providing economic assistance to the economically disadvantaged of the community. Included in this activity are the Family Self Sufficiency Services and Supportive Housing programs.
Hospitals
The expenditures in this activity are for state mandated medical assistance provided to eligible economically disadvantaged patients.
Other Human Services
This activity accounts for the funding that goes toward the Partnering for Results Program, whereby the county contracts for services with local agencies meeting special population human service needs within Lee County.
158

159

CULTURE AND RECREATIONLEE COUNTY - FLORIDA
2017 - 2018
ACTUAL2015 - 2016
UNAUDITED2016 - 2017
ADOPTED2017 - 2018
DEPARTMENT/DIVISION/PROGRAM
ACTUAL BUDGET
$ 0 $ 63,967 $ 0Financial & Administrative
$ 43,833,030 $ 44,130,921 $ 49,931,149Parks & Recreations
$ 27,090,654 $ 27,903,165 $ 33,280,716Libraries
$ 70,923,684 $ 72,098,053 $ 83,211,865GRAND TOTAL
EXPENDITURES BY FUND TYPE
ACTUAL UNAUDITED ADOPTEDACTUAL BUDGET
$ 16,888,920 $ 16,092,688 $ 18,321,439General Fund
$ 38,669,475 $ 38,632,475 $ 41,304,500Special Revenue Fund
$ 5,070,885 $ 5,140,985 $ 6,029,114Debt Service Fund
$ 10,294,404 $ 12,231,905 $ 17,556,812Capital Project Fund
GRAND TOTAL $ 70,923,684 $ 72,098,053 $ 83,211,865
160

CULTURE AND RECREATION
40.0%Libraries
60.0%Parks & Recreation
FY17-18 ACTIVITY
49.6%Special Revenue
21.1%
CapitalProjects
7.2%
Debt Services
22.0%
GeneralFund
FY17-18 FUND TYPE
Note: Pie chart percentages may not total to 100% due to the rounding of data.
161

CULTURE AND RECREATION
These expenditures are to provide and maintain cultural and recreational facilities and activities for the benefit of citizens and visitors.
Parks and Recreation
This activity includes expenditures for Parks and Recreation programs and parks capital improvement projects.
Libraries
The Lee County Library system services the entire county, excluding the independent library at Fort Myers Beach and the library in the City of Sanibel. This activity accounts for the operating and capital project expenditures associated with the Library system. The Library system is supported by its own dedicated millage.
Other Culture and Recreation
This activity reflected some operating expenditures within Facilities Construction and Management.
162

163
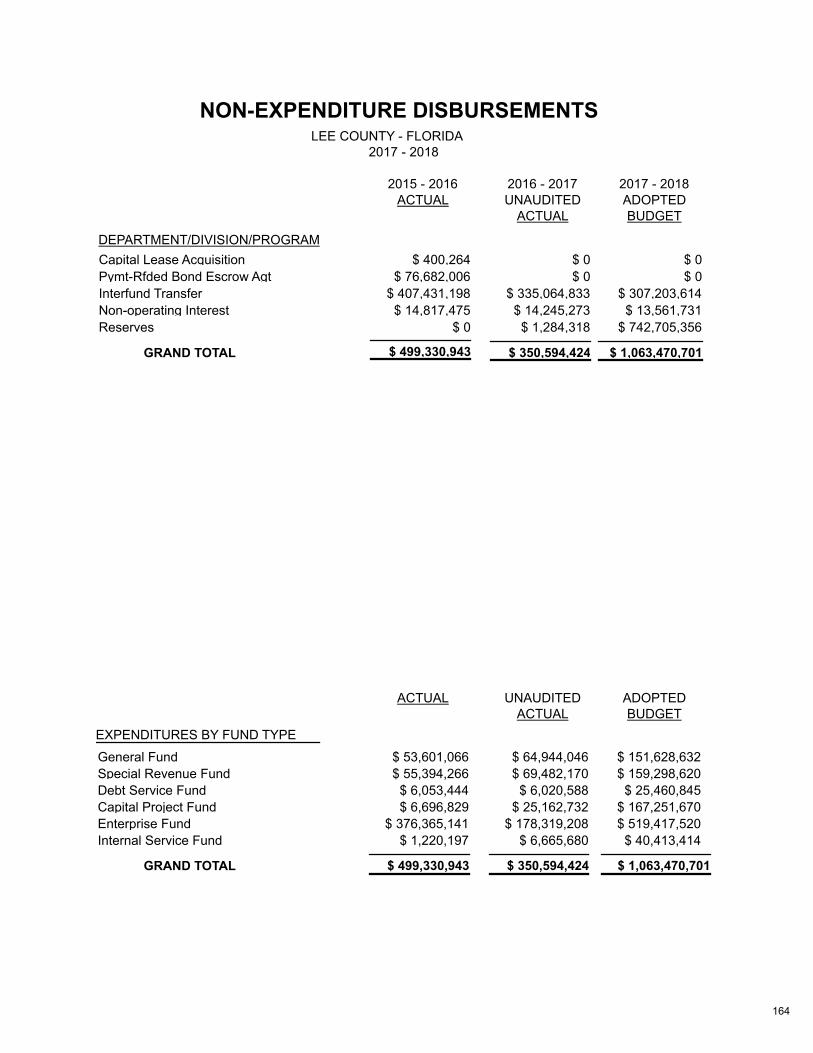
NON-EXPENDITURE DISBURSEMENTSLEE COUNTY - FLORIDA
2017 - 2018
ACTUAL2015 - 2016
UNAUDITED2016 - 2017
ADOPTED2017 - 2018
DEPARTMENT/DIVISION/PROGRAM
ACTUAL BUDGET
$ 400,264 $ 0 $ 0Capital Lease Acquisition
$ 76,682,006 $ 0 $ 0Pymt-Rfded Bond Escrow Agt
$ 407,431,198 $ 335,064,833 $ 307,203,614Interfund Transfer
$ 14,817,475 $ 14,245,273 $ 13,561,731Non-operating Interest
$ 0 $ 1,284,318 $ 742,705,356Reserves
$ 499,330,943 $ 350,594,424 $ 1,063,470,701GRAND TOTAL
EXPENDITURES BY FUND TYPE
ACTUAL UNAUDITED ADOPTEDACTUAL BUDGET
$ 53,601,066 $ 64,944,046 $ 151,628,632General Fund
$ 55,394,266 $ 69,482,170 $ 159,298,620Special Revenue Fund
$ 6,053,444 $ 6,020,588 $ 25,460,845Debt Service Fund
$ 6,696,829 $ 25,162,732 $ 167,251,670Capital Project Fund
$ 376,365,141 $ 178,319,208 $ 519,417,520Enterprise Fund
$ 1,220,197 $ 6,665,680 $ 40,413,414Internal Service Fund
GRAND TOTAL $ 499,330,943 $ 350,594,424 $ 1,063,470,701
164

NON-EXPENDITURE DISBURSEMENTS
1.3%
Non-operatingInterest
28.9%
InterfundTransfer
69.8%Reserves
FY17-18 ACTIVITY
15.7%
Capital Projects
2.4%
Debt Service
48.8%Enterprise
14.3%General Fund
3.8%
Internal Services
15.0%Special Revenue
FY17-18 FUND TYPE
Note: Pie chart percentages may not total to 100% due to the rounding of data.
165

NON-EXPENDITURE DISBURSEMENTS
This is a basic account category to provide for disbursements of accounting expenditures.
Capital Lease Acquisitions This activity accounts for equipment acquired through capital lease financing.
Payment Refunded Bond Escrow Agent This is a pass-through payment to the escrow agent involved with project financing. It is a one-time occurrence per financing.
Interfund Transfers
This category represents amounts transferred from one fund to another to assist in financing the services of the recipient fund. Transfers do not constitute additional revenues or expenditures of the governmental unit but reflect the movement of cash from one fund to another. Thus, they are budgeted and accounted for separately from other revenues and expenditures.
Non-operating Interest This is debt service interest expense paid only from proprietary funds.
Reserves
This category encompasses all fund reserve accounts which includes ending Fund Balance.
166

167
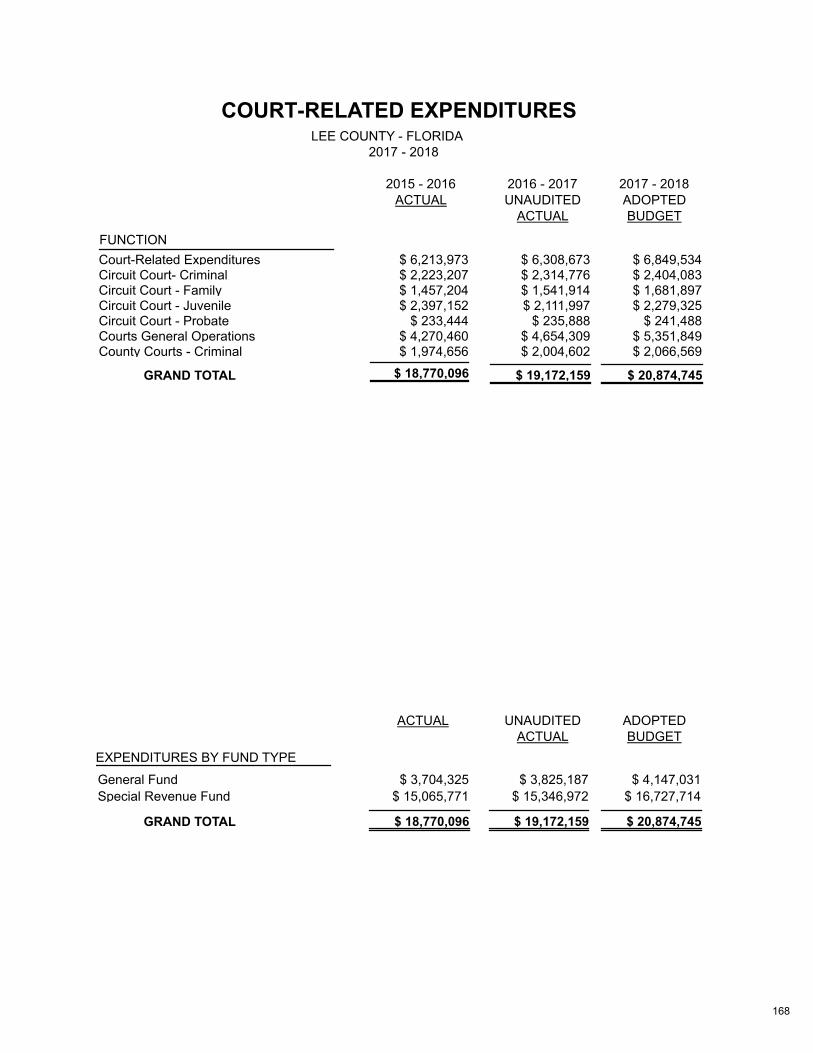
COURT-RELATED EXPENDITURESLEE COUNTY - FLORIDA
2017 - 2018
ACTUAL2015 - 2016
UNAUDITED2016 - 2017
ADOPTED2017 - 2018
FUNCTION
ACTUAL BUDGET
$ 6,213,973 $ 6,308,673 $ 6,849,534Court-Related Expenditures$ 2,223,207 $ 2,314,776 $ 2,404,083Circuit Court- Criminal$ 1,457,204 $ 1,541,914 $ 1,681,897Circuit Court - Family$ 2,397,152 $ 2,111,997 $ 2,279,325Circuit Court - Juvenile
$ 233,444 $ 235,888 $ 241,488Circuit Court - Probate$ 4,270,460 $ 4,654,309 $ 5,351,849Courts General Operations$ 1,974,656 $ 2,004,602 $ 2,066,569County Courts - Criminal
$ 18,770,096 $ 19,172,159 $ 20,874,745GRAND TOTAL
EXPENDITURES BY FUND TYPE
ACTUAL UNAUDITED ADOPTEDACTUAL BUDGET
$ 3,704,325 $ 3,825,187 $ 4,147,031General Fund
$ 15,065,771 $ 15,346,972 $ 16,727,714Special Revenue Fund
GRAND TOTAL $ 18,770,096 $ 19,172,159 $ 20,874,745
168

COURT-RELATED EXPENDITURES
This category accounts for costs of providing court services including general administration, Circuit Court and County Court services. Included programs are Support to Public Defender, State Attorney, Court Administration, Legal Aid, Guardian Ad Litem and Juvenile Predisposition Detention.
169

COURT RELATED EXPENDITURES
1.2%Circuit Court - Probate
11.8%Circuit Court - Criminal
10.2%County Courts Criminal
31.7%
Court RelatedExpenditures
26.3%
Courts GeneralOperations
8.3%Circuit Court - Family
10.5%Circuit Court - Juvenile
FY17-18 FUNCTION
19.9%General Fund
80.1%Special Revenue
FY17-18 FUND TYPE
Note: Pie chart percentages may not total to 100% due to the rounding of data.
170

APPENDICES
TABLE OF CONTENTS
FUND STRUCTURE AND BUDGETARY ACCOUNTY POLICY .....................................................................................172
BUDGET PREPARATION, ADOPTION, AND AMENDMENT .........................................................................................176 GLOSSARY .....................................................................................................................................................................179
171
FUND STRUCTURE AND BUDGETARY ACCOUNTING POLICY
The budget is prepared in a manner that allows it to be viewed from a variety of perspectives: by organization, program, and funding source. Each fund is a separate budgetary and accounting entity which is self balancing and freestanding for the purpose of maintaining records for a set of financial resources which are segregated for a particular purpose. While the budget may be reviewed from several perspectives, the fund is the basic legal and accounting framework of the budget. Lee County organizes its funds into the basic fund groups recognized under generally accepted accounting principles (GAAP). The basic fund groups are: Governmental Funds - which consist of the General Fund, Special Revenue Funds, Debt Service Funds, and Capital Project Funds; the Proprietary Funds which consist of Enterprise Funds and Internal Service Funds; and Trust and Agency Funds.
Permanent funds account for resources that are legally restricted to the extent that only earnings and not principal may be used for government purposes.
Major Governmental Operating Funds of Lee County
Lee County has four major governmental funds for operating its non-proprietary functions: the General Fund, Unincorporated Area MSTU Fund, Library Fund, and Transportation Trust Fund. The General Fund provides for countywide functions, such as administration, courts, sheriff, constitutional officers, various human services, and Parks and Recreation regional parks operations. This fund receives unrestricted countywide revenues and levies ad valorem taxes on a countywide basis. The other three major operating funds are Special Revenue Funds. The Unincorporated Area MSTU Fund levies an ad valorem tax that covers the county outside the boundaries of the cities of Sanibel, Fort Myers, Cape Coral, Bonita Springs, the Town of Fort Myers Beach and the Village of Estero. This fund receives unrestricted revenues deemed to be non-countywide in nature. The Unincorporated Area MSTU provides for Community Development activities, Domestic Animal Services, Hearing Examiner, Parks and Recreation community parks operations, and partial funding for road and bridge maintenance. The Library Fund levies an ad valorem tax that pays for the operations and capital construction of the county library system. The tax is countywide, with the exception of the Town of Ft. Myers Beach and the City of Sanibel, which have independently governed library districts. The Transportation Trust Fund provides road and bridge maintenance services. It receives gasoline tax revenue and other revenues in support of countywide services as well as a transfer from the Unincorporated Area MSTU Fund for support of its non-countywide services.
172
FUND STRUCTURE AND BUDGETARY ACCOUNTING POLICY (continued)
Other Special Revenue Funds
There are numerous street lighting and special improvement districts that provide street lighting and maintenance services to neighborhoods. These districts are established on the basis of petitions from the residents of the neighborhood. In most cases, these districts levy an ad valorem tax that applies to that particular neighborhood; in other uses, a special assessment is applied. The special improvement district funds of Lee County are also used for a variety of construction projects that benefit specific properties: road improvements, drainage improvements, erosion projects, and water line extensions. These district funds are used to bring roads and drainage up to county standards, and may enable the facilities to be accepted into normal County maintenance programs. Fire protection in the County is provided through independently governed fire districts and the municipalities. The County funds three dependent fire protection MSTUs, which provide fire protection to those unincorporated areas of the County which are not part of an independent special district and are not located within the boundaries of an incorporated municipality. A separate ad valorem tax is levied on those residents. Major state and federal grant programs, such as the State Housing Initiatives Partnership (SHIP) Program, Supportive Housing Assistance, and the Community Development Block Grant (CDBG) are accounted for through separate special revenue funds. Lee County Tourist Development Tax revenue is administered through a special revenue fund and carries out tourism and convention related promotional activities. The complex structure of special revenue funds enables the County to provide a wide range of specialized services and achieve a greater degree of equity in its use of revenues and application of ad valorem taxes.
Debt Service Funds
In addition to numerous special improvement district debt funds, the county has governmental debt service subfunds that account for revenues pledged to the payment of general government and enterprise long-term debt. Long-term debt is paid from: 1. Pledges of various non-ad valorem revenue sources. Non-ad valorem revenues are pledged to bond
funds and certificates of participation. 2. The Tourist Development Tax and stadium lease and rental fees are pledged to the Hammond
Stadium and JetBlue Park bond funds. Naming rights revenues were pledged to the JetBlue Park bond funds.
3. In the area of transportation, Local Option Gas Taxes are pledged to bond funds and bank loans. 4. Toll revenues from bridges and user fees from Utilities and Solid Waste are pledged to several bond
issues. Special improvement districts debt is funded through special assessments on property.
173

FUND STRUCTURE AND BUDGETARY ACCOUNTING POLICY (continued)
Capital Project Funds
Both transportation and other non-enterprise capital projects of all types are funded from this revenue source (in many instances additionally supplemented from other funding sources.) The Transportation Capital Improvement Fund is dedicated to transportation projects and receives the majority of funding from gasoline taxes and surplus bridge tolls from the Sanibel Causeway, Cape Coral, and Midpoint bridges. Transfers from the General Fund are in place to provide full or partial funding for capital projects such as a new governmental building, and transfers from the Unincorporated MSTU Fund are in place to provide full or partial funding for capital projects such as drainage control projects. Other capital projects funds are used to account for the proceeds of bond issues and are discontinued upon project completion and disbursement of any remaining bond proceeds. Capital projects relating to the self-supporting enterprise funds are accounted for in those enterprise funds.
Enterprise Funds
The County has enterprise funds for water and sewer services, solid waste disposal (landfill and resource recovery), transportation facilities (relating to toll collecting for the Sanibel Causeway and the Cape Coral and Midpoint Memorial bridges) and the transit system. The services are operated on a self-supporting basis, except for the transit system, which receives less than half of its revenues from fees and charges and is mostly funded from an operating subsidy from the General Fund and federal and state transportation grants.
Intergovernmental Service Funds
The County uses self-supporting intergovernmental service funds to provide data processing, communications, vehicle maintenance services, and insurance to County departments on a user fee basis.
Budgetary Accounting
The accounts of the County are organized on the basis of funds, each of which is considered a separate accounting entity. The operations of each fund are accounted for with a separate set of self-balancing accounts that comprise its assets, liabilities, fund equity or retained earnings, revenues, and expenditures or expenses, as appropriate. Government resources are allocated to and accounted for in individual funds based upon the purpose for which they are to be spent and the means by which spending activities are controlled. Basis of accounting refers to when revenues and expenditures, or expenses, are recognized in the accounts and reported in the financial statements. Basis of accounting relates to the timing of the measurements made regardless of the measurement focus applied. Governmental fund financial statements are prepared on the modified accrual basis using the current financial resources measurement focus. Under the modified accrual basis, revenues are recognized when they become measurable and available as net current assets. The County considers all revenues available if they are collected within sixty days after year-end. Primary revenues, such as property taxes, special assessments, inter-governmental revenues, charges for services, sales and franchise taxes, rents, and interest are treated as accruable under the modified accrual basis and so have been recognized as revenues. Expenditures reported in governmental fund financial statements are generally recognized under the modified accrual basis of accounting when the related fund liability is incurred. An exception to this general rule includes principal and interest on general long-term debt, which is recognized when due.
174

FUND STRUCTURE AND BUDGETARY ACCOUNTING POLICY (continued)
Proprietary funds record both operating and non-operating revenues and expenses. Operating revenues are those that are obtained from the operations of the proprietary fund that include user fees, tolls, rental and franchise fees, and concessions. Non-operating revenues are not related to the operations of the proprietary fund and include taxes, interest earnings, grants, and passenger facility charges. Operating expenses represent the cost of operations, which includes depreciation. Non-operating expenses are not related to operations such as interest expense and excess fees. When both restricted and unrestricted resources are available, restricted resources will be used first for incurred expenses, and then unrestricted as needed.
Budgets and Budgetary Accounting
Budgets have been adopted by the Board of County Commissioners (Board) for all Board funds except for agency and permanent funds. The budgets of the Property Appraiser and the Tax Collector are approved by the Florida Department of Revenue. The Clerk of Circuit Court, Sheriff, and Supervisor of Elections prepare budgets for their general funds, which are submitted to and approved by the Board. No budget is prepared for the Property Appraiser’s special revenue fund and the Sheriff’s special revenue and internal service funds. Capital projects costs are budgeted in the year they are anticipated to be obligated. In subsequent years, the unused budget is reappropriated until the project is completed. Proprietary funds are budgeted on a basis consistent with Generally Accepted Accounting Principles (GAAP), except that capital and debt related transactions are based upon cash receipts and disbursements. Estimated beginning fund balances are considered in the budgetary process. Differences between estimated beginning fund balances and actual fund balances, if material, are submitted to the Board as budget amendments as part of the fund balance adjustments and budget carryover process. The annual budgets serve as the legal authorization for expenditures. Expenditures cannot legally exceed the total amount budgeted for each fund. The Board must approve all budget amendments which change the legally adopted total appropriation for a fund or the amount of a Constitutional Officer’s draw. Authority to transfer budget within a fund is delegated to the County Manager or Budget Director. If, during the fiscal year, additional revenues become available for appropriation in excess of those estimated in the budget, the Board may make supplemental appropriations by resolution for the year up to the amount of such excess. During the fiscal year the Board, in accordance with Florida Statutes, approves various supplemental appropriations. Appropriations lapse at fiscal year-end.
175

BUDGET PREPARATION, ADOPTION AND AMENDMENT
Florida Statutes Chapters 129 and 200 govern the budget process and the levy of ad valorem taxes. The Statutes address the budget timetable from the point of initial presentation of a proposed budget and taxable value to the governing body. The timetable, public advertising requirements, and the two required public hearings to adopt the budget and to levy ad valorem taxes are statutory requirements. Additionally, State Comptroller Regulations dictate a uniform accounting structure that must be embodied in the budget and financial reporting.
The final budget document reflects the final outcome of the budget preparation cycle. A timeline and outline of Lee County's process is presented below.
February - Preliminary Budget Preparatory Steps
Preliminary revenue projections are analyzed and introduced to help set priorities, give direction and set the tone for budget preparation. Expense projections are calculated for personnel and some operational costs as starting points for budget preparation. Assumptions, such as property valuations, millage rates, the consumer price index, pay for performance levels and insurance rates are determined, and a target percentage for growth (or contraction) is calculated based on the assumptions made. Management Analysts then work with departments and project the impact in each area to determine budgeting strategies before budget input.
March – Proposed Budget Development
The budget preparation system becomes available for departments to input current year projections and proposed budgets. Departments, Constitutional Officers, and Court related service entities are requested at this time to develop proposed year budgets and project year end expenditures and revenue activity totals for the current year.
April - May – County Manager Review
After proposed year budget requests are developed by departments, they are analyzed by the Office of Budget & Management, tentative recommendations are presented to the County Manager and senior management for consideration and discussion. The County Manager reviews all capital and operating budgets, meets with department directors and fiscal personnel to discuss their budget, then determines the finalized set of recommendations to be presented to the Board of County Commissioners (BoCC) for consideration at the annual June Board of County Commissioners Budget Workshops.
176

BUDGET PREPARATION ADOPTION AND AMENDMENT (continued)
June– Balancing Funds and BoCC Workshops
Funds are balanced by the Management Analysts in order to present a balanced budget to the Board of County Commissioners. Analysts will review interfund transfers, fund balance and reserves as well as review estimated and proposed year revenues and expenditures in completing the fund balancing process. (Interfund transfers are a mechanism to move funds from a fund where revenues are collected to another fund where a related expenditure is expensed. For instance, the movement of toll collection revenue to a fund for bridge debt service expense.) One or more Board budget workshops are held to discuss current issues and the proposed budgets. In recent years, these workshops have begun as early as January and extended to late August. The County Manager submits an issues memorandum along with the proposed budget to the Board of County Commissioners in advance of the Board budget workshops. Estimated assessed property values are received from the Property Appraiser on June 1. These valuations provide the early basis to estimate ad valorem revenues based on various millage rates.
July 1 - Assessment Data
Preliminary assessed property values, which are the basis for setting millage rates culminating in ad valorem taxes, are received from the Property Appraiser (an elected official) for all Lee County taxing districts and dependent districts.
August - Board Establishes Tentative Millage Rate
The Lee County Board of County Commissioners establishes a tentative millage rate for all Lee County ad valorem taxing districts and dependent taxing districts for the new fiscal year. The Board of County Commissioners must certify the proposed ad valorem millage levies within thirty-five (35) days of presentation of preliminary assessed values, and sets public hearing dates.
August - Property Appraiser Mails Truth-in-Millage (TRIM) Notices
The Property Appraiser mails TRIM notices to all property owners within fifty-five (55) days after July 1st. This notifies each taxpayer of the proposed tax rates, the relationship to the prior year's rates, the proposed total taxes for the parcel based on the proposed rates, and the valuation of each parcel of property.
September - Public Hearings
Two hearings are required per Florida Statutes. The first public hearing must be scheduled between sixty-five (65) and eighty (80) days after BoCC receipt of the preliminary assessed property values from the County Property Appraiser. Tentative budgets and millage rates are adopted at th is f i r s t public hearing.
The second public hearing must be held within two to five days after advertisement in the newspaper. The advertisement must be published within 15 days of the first public hearing and display a summary of the budget, all millage rates, and tax increase percentages over the rolled back millage rate. The final budget and millage levies are adopted at the second public hearing.
October/November - Final Budget Preparation
The final budget document is produced reflecting final program service information and dollars. The final document is made available on the County’s website for review by the media, taxpayers and public interest groups. Users may print their own copy or access the County website at all libraries and print select pages or the entire budget document at their expense.
177

BUDGET PREPARATION ADOPTION AND AMENDMENT (continued)
Five-Year Capital Improvement Program
A five-year Capital Improvement Program (CIP) budget is updated annually at the same time as the annual budget preparation for the balance of the county’s budget. Proposed funding sources are shown for each project. Revenue estimates for capital funding sources are projected for the five years of the program. Management Analysts review capital improvement projects submitted by Departments. Projects are prioritized based on certain criteria, such as core level of service, health and safety issues, and funds available. Budgetary impacts of the projects on operations are also reviewed. After proposed project requests are analyzed by Budget Services staff, a proposed update of the five-year Capital Improvement Program is presented for consideration at the annual County Manager Review. The County Manager may direct revisions to the update at that time. The proposed update is subsequently presented to the Board of County Commissioners at the June Board Budget Workshop for consideration and discussion. When the total county budget is formally adopted in September, the final update of the Five Year Capital Improvement Program is produced. (See Capital Improvement Section E.) The first year of the five year adopted CIP is included as part of the budget total.
Budget Amendment Policy
Florida law provides general guidelines regarding how local government budget amendment policy must operate. These guidelines require all increases of total fund appropriations and transfers from appropriated reserves be adopted by Board action. Florida law allows complete flexibility in modifying proprietary fund budgets during the year at regular public Board meetings. Appropriation of additional unanticipated revenue is also allowed by law at public Board meetings in all fund categories for many types of revenue. The law allows appropriation increases of any nature to occur through a supplemental budget process requiring advertised public hearings. Lee County's budget amendment policy allows the maximum flexibility under Florida law. Budget amendments or transfers not requiring an increase in a fund total or division total are granted within guidelines to various levels of management. All changes in elected officials' budgets must go to the Board of County Commissioners for approval. Formal legal appropriation by the Board is at the fund level in order to allow the degree of flexibility provided by the Board's policy.
178

GLOSSARY
AD VALOREM TAXES - A tax (commonly referred to as property taxes) levied in proportion to the value of the property against which it is levied.
AGGREGATE MILLAGE RATE - A rate obtained by dividing the sum of all anticipated ad valorem taxes levied by the governing body (Board of County Commissioners for County Government) by the taxable value of the county or municipality. The aggregate millage expresses an average tax rate.
APPROPRIATION - A legal authorization granted by a legislative body to create expenditures and to incur obligations for specific purposes. An appropriation is usually limited in amount and as to the time it may be expended.
ASSESSED VALUATION - A valuation set upon real estate or other property by a government as a basis for levying taxes. Taxable valuation is calculated from an assessed valuation. Assessed value is required to approach 100% of market value in Florida. BUDGET - A plan of financial operation embodying an estimate of proposed expenditures for a given period, and the proposed means of financing. Used without any modifier, the term usually indicates a financial plan for a single fiscal year. The "budget" is the proposed and tentative financial plan until it has been approved by the governing body, at which time it becomes the adopted budget. The budget, once adopted, is the legal authorization to expend county funds during the fiscal year. The budget may be amended during the fiscal year by the governing body and/or management, in accordance with procedures specified by law and/or administrative rules and regulations. BUDGET MESSAGE - A general discussion of the proposed budget as presented in writing to the legislative body. CAPITAL OUTLAY - Expenditures which result in the acquisition of, or addition to, fixed assets. CAPITAL IMPROVEMENT PROGRAM (CIP) - A plan for capital expenditures to be incurred each year over a fixed period of years to meet capital needs arising from the long-term work program. It sets forth each project or other contemplated expenditure in which the government is to have a part and specifies the full resources estimated to be available to finance the projected expenditures. COUNTY CORE SERVICE - A service that cost-effectively enhances the health, safety, and welfare of the general population, is not redundant to services provided by other government entities or the private sector; is equitably apportioned among the general population rather than to special sectors or groups, and is universally accessible to the general population. DEPENDENT SPECIAL DISTRICT - A special district whose governing body or whose budget is established by the governing body of the County or municipality to which it is dependent.
DEPRECIATION - (1) Expiration in the service life of fixed assets, other than wasting assets attributable to wear and tear, deterioration, action of the physical elements, inadequacy, and obsolescence; (2) the portion of the cost of a fixed asset other than a wasting asset which is charged as an expense during a particular period. In accounting for depreciation, the cost of a fixed asset, less any salvage value, is pro-rated over the estimated service life of such an asset, and each period is charged with a portion of such cost. Through this process, the entire cost of the asset is ultimately charged off as an expense.
ENHANCEMENT - An improvement to a programmatic service level. EXPENDITURES - Decreases in net financial resources. Expenditures include current operating expenses which require the current or future use of net current assets, debt service, and capital outlays.
179
GLOSSARY (continued)
EXPENSES - Decreases in net total assets. Expenses represent the total cost of operations during a period regardless of the timing of related expenditures. FISCAL YEAR - A 12-month period to which the annual operating budget applies, and at the end of which, a government determines its financial position and the results of its operations. Lee County's fiscal year begins October 1st and ends September 30th of the following year. FIXED ASSETS - Assets of a long-term character which are intended to continue to be held or used, such as land, buildings, improvements other than buildings, machinery, and equipment. FUNCTIONS - Expenditure classification according to the principal purposes for which expenditures are made. Examples are public safety, public health, public welfare, etc. FUND - A fiscal and accounting entity with a self-balancing set of accounts recording cash and other financial resources, together with all related liabilities and residual equities or balances, and changes therein, which are segregated for the purpose of carrying on specific activities or attaining certain objectives in accordance with special regulations, restrictions, or limitations. FUND BALANCE - A term used to express the equity (assets minus liabilities) of governmental fund types and trust funds. GENERALLY ACCEPTED ACCOUNTING PRINCIPLES (GAAP) - Uniform minimum standards and guidelines for financial accounting and reporting. They govern the form and content of the basic financial statements of an entity. GAAP encompass the conventions, rules, and procedures necessary to define accounting practices. They include not only broad guidelines of general application, but also detailed practices and procedures. GAAP provides a standard by which to measure financial presentations. The primary authoritative statement on the application of GAAP to state and local governments are Governmental Accounting Standards Board (GASB) pronouncements. Every government should prepare and publish financial statements in conformity with GAAP. INTERGOVERNMENTAL REVENUE - Revenue collected by one government and distributed (usually through some predetermined formula) to another level of government(s). LEGALLY ADOPTED BUDGET - The total of the budgets of each County fund, including budgeted transactions between funds. MAJOR MAINTENANCE – A program for major maintenance expenses of county facilities and pass-thru funding to other entities for major maintenance/renovations (such as Tourist Development Council projects). These expenses are repairs and are not capitalized as a fixed asset. MILLAGE RATE - A rate expressed in thousands. As used with ad valorem (property) taxes, the rate expresses the dollars of tax per one thousand dollars of taxable value. One mill produces one dollar of taxes on each $1,000 of assessed property valuation. MODIFIED ACCRUAL BASIS - The accrual basis of accounting adapted to the governmental fund type Spending Measurement Focus. Under it, revenues are recognized when they become both "measurable" and "available to finance expenditures of the current period". The County considers all revenues available, if collected within 60 days after year-end. Expenditures are recognized when the related fund liability is incurred except for, but not limited to: (1) inventories of materials and supplies which may be considered expenditures either when purchased or when used; (2) prepaid insurance and similar items which need not be reported; (3) accumulated unpaid vacation, sick pay, and other employee benefit amounts which need not be recognized in the current period, but for which larger-than-normal accumulations must be disclosed in the notes to the financial statements; (4) principal and interest on long-term debt which are generally recognized when due. All governmental funds are accounted for using the modified accrual basis of accounting.
180

GLOSSARY (continued)
MUNICIPAL SERVICES BENEFIT UNIT (MSBU) - An MSBU is a special district created to provide for projects and/or services to a specifically defined area of the County and financed by a special assessment to only those citizens receiving the benefits of those projects or services. MUNICIPAL SERVICES TAXING UNIT (MSTU) - A special district authorized by the State Constitution,
Article VII, and the Florida Statutes §125.01. The MSTU is a legal and financial mechanism for providing specific services and/or improvements to a defined geographic area. An MSTU may levy ad valorem taxes without a referendum. An MSTU may also use assessments, service charges or other revenue to provide resources. The MSTU is one type of dependent special district. NON-AD VALOREM REVENUES – A group of revenues that includes ambulance service receipts, building and zoning permits and fees, data processing fees, excess county officer fees, revenue sharing’s guaranteed entitlement portion, investment earnings, license fees, certain gasoline taxes, sales taxes and state tax. These revenues are pledged against six capital revenue bond issues which do not have their own revenue sources.
OBJECTIVE - A simply stated, readily measurable statement of aim or expected accomplishment within the fiscal year. A good statement of objectives should state a specific standard of performance for a given program:
An operational objective focuses on service delivery.
A managerial objective focuses on those aspects of management that help staff achieve operational objectives; i.e., staff training, work plan development, etc.
OPERATING TRANSFERS - Legally authorized transfers between object codes as needed to balance specific line items. ORDINANCE – A statute or regulation enacted at the local government level. PROGRAM BUDGET - A budget organized by programs. A program used in this application is a grouping of related activities, projects, and services which are similar in purpose. The expenditure focus of a program budget is related to the nature of work and services performed. RESERVE FOR CONTINGENCIES - An amount set aside, consistent with statutory authority, that can subsequently be appropriated to meet unexpected needs. RETAINED EARNINGS - An equity account reflecting the accumulated earnings of an Enterprise or Internal Service Fund. REVENUE BONDS – Bonds that finance capital projects within the Departments of Utilities, Solid Waste and Transportation which are financed by pledged revenues generated from the operation of those facilities.
REVENUES - (1) For governmental fund types, revenues are increases in net current assets from other than expenditure refunds and residual equity transfers. (2) For proprietary fund types revenues are increases in net total assets from other than expense refunds, capital contributions, and residual equity transfers. (see Revenues and Expenditures Discussion in Section B). ROLLED-BACK RATE - The millage rate which would generate the same ad valorem tax (property tax) revenue as was generated the previous year, excluding changes in taxable valuation resulting from new construction, annexation or de-annexation. If the proposed aggregate millage rate exceeds the aggregate rolled-back rate, then by law, the advertisement for the public hearings to adopt the millage must state the percentage by which the rolled-back rate exceeds the percentage of the proposed tax increase. The rolled-back rate is used in the same manner for individual millage levies.
181

GLOSSARY (continued) SERVICE LEVEL - Service(s) or product(s) which comprise actual (or expected, depending on whether one is describing a current or future service level) output of a given program. Focus is on results, not measures of workload (e.g., for a Sheriff's Department - number of assaults investigated is a workload measure, while number of assault cases cleared is a service level). STATUTE - A state-written law enacted by the state legislature. TAX INCREMENT FINANCING (TIF) - Tax increment revenues are all new property tax revenues generated by new developments or assessments which increase the existing tax base within the designated redevelopment area.
TAX RATE - The amount of tax stated in terms of a unit of the tax base; for example, 5 mills equals 5 dollars per thousand dollars of taxable value.
TAXES - Compulsory charges levied by a government for the purpose of financing services performed for the common benefit. This term does not include specific charges made against particular persons or property for current or permanent benefits, such as special assessments. Neither does the term include charges for services rendered only to those paying such charges as, for example, sewer service charges. TAXABLE VALUATION - The value used for computing the ad valorem taxes (property taxes) levied against property. The taxable value is the assessed value less any exemptions allowed by law. The most common exemption is the $25,000 homestead exemption allowed if the owner uses the property as the principal residence. Additional homestead exemption up to $25,000 may apply if the assessed value of the property exceeds $50,000 (This additional homestead exemption does not apply to school districts and other assessments for special benefits). There are also exemptions for disability, seniors, government-owned, and non-profit-owned property. TRANSFERS IN/OUT - Amounts transferred from one fund to another to assist in financing the services of the recipient fund. Transfers do not constitute revenues or expenditures of the governmental unit, but only of the individual funds. Thus, they are budgeted and accounted for separately from other revenues and expenditures. TRIM NOTICE - "Truth In Millage", a tentative tax notice sent to all property owners in August, to provide information reflecting tentatively-adopted millage rates. Final millage rates cannot exceed tentatively-adopted millage rates. UNINCORPORATED AREA - That portion of the County, which is not within the boundaries of any municipality.
182
![REPUBLIC OF GHANA THE COMPOSITE BUDGET OF THE …€¦ · DORMAA CENTRAL MUNICIPAL ASSEMBLY FOR THE 2015 FISCAL YEAR [DCMA BUDGET 2015] ... Composite budgets which integrated budgets](https://static.fdocuments.us/doc/165x107/5f8a34cf6a73f4703d570074/republic-of-ghana-the-composite-budget-of-the-dormaa-central-municipal-assembly.jpg)