Annual and CSR Report 2017 - Amazon S3
84
Annual and CSR Report 2017
Transcript of Annual and CSR Report 2017 - Amazon S3

Annual and CSR Report 2017

2 Annual report 2017 Group Finances 2017 MMG AS Finances 2017 CSR report 2017
Facts 2017
Møller Mobility Group had solid growth and achieved a healthy profit in 2017. At the same time, the leading auto group in the Nordic countries had a year marked by change with a view to further strengthen our position in a rapidly changing car market.
“A solid financial status and strong market positions mean that we are able to take a leadership role in the enormous upheavals that the car industry is undergoing,” says CEO Terje Male.
The Group, formerly known as MøllerGruppen, achieved another new sales record in 2017. Last year’s revenue amounted to NOK 28.3 billion, an increase of just over 7% from 2016. Over the past five years, the Group’s revenue has increased by over 50%. There was sales growth in all of the Group’s business areas last year.
Profit before tax amounted to NOK 1.1 billion, which is the
second best result in the Group’s history, and only marginally below the record result for 2016. Møller’s import business, which operates in Norway and the Baltics, saw a positive development in earnings in 2017. The dealer operations in Sweden and the Baltics also delivered a strong improvement in profits last year. In the Norwegian dealership business, by contrast, profits were down compared with the previous year, primarily as a result of lower margins and higher costs than previously in the Norwegian retail market. ŠKODA was voted Importer of the Year in Norway (source: BilNytt’s customer satisfaction survey).
Contents
ANNUAL REPORT 2017
CEO Terje Male: The future is here 05
Our strategy: We are preparing for a transport revolution 06
Our value chain 08
Report from Harald A. Møller 10
Report from Møller Bil AS 12
Report from Volkswagen Møller Bilfinans 14
Our sustainable social mission 17
Presentation of Møller Medvind 22
Chairman of the Board Harald Møller:
Creating value for future generations 25
Key figures 2017–2013 26
Board of Directors’ Report 27
MØLLER MOBILITY GROUP CONSOLIDATED
FINANCIAL STATEMENTS 33
MØLLER MOBILITY GROUP FINANCIAL STATEMENTS 52
Auditor’s Report 63
CSR REPORT 2017
Environment 68
Mobility 72
Employees 73
Society 78
GRI report 80
0
5000
10000
15000
20000
25000
30000
0
200
400
600
800
1000
1200
2010 2011 2012 2013 2014 2015 2016 2017
Operating revenue
Profit before tax

3 Annual report 2017 Group Finances 2017 MMG AS Finances 2017 CSR report 2017
Møller Mobility Group is a family-owned group involved in the import, sale, s ervicing and financing of Volkswagen, Audi and Škoda cars. The company is represented in Norway, Sweden, Estonia, Latvia and Lithuania.
Møller Mobility Group
Car ImportsHarald A. Møller AS is Norway’s largest car importer. The company is responsible for importing, distributing and servicing Volkswagen, Audi and Škoda cars in Norway and has now also relaunched SEAT. More than one in every four new cars sold in Norway has been imported by Harald A. Møller AS. Møller Baltic Import SE imports Volkswagen into Estonia, Latvia and Lithuania, and Audi into Latvia and Lithuania.
Car DealersMøller Mobility Group has a total of 67 car dealers in Norway, Sweden, Estonia, Latvia and Lithuania. Møller Bil Norge is Norway’s largest car dealer chain and has 42 dealers and 11 specialised repair workshops throughout the country. Møller Bil Sverige is Sweden’s second largest Volkswagen, Audi, Škoda and Seat dealer group and has a total of 12 sales outlets in central Sweden. Møller Auto Baltic has 13 sales outlets in Estonia, Latvia and Lithuania.
Financial ServicesVolkswagen Møller Bilfinans AS is jointly owned by Møller Mobility Group (49%) and Volkswagen Financial Services AG (51%). The company offers loans, leasing and insurance linked to the respective brands’ sales of new and used cars. A fully integrated part of the Volks wagen, Audi and Škoda value chain in Norway, Volkswagen Møller Bilfinans is Norway’s largest leasing company and is especially dominant on the private car leasing market.
Key figures for 2017
4,345> Employees in Norway, Sweden, Estonia,
Latvia and Lithuania
28.3> Turnover for the year
(NOK billions)
60,568> Cars imported. All brands in all our
markets – a decrease of 1% compared with 2016
Møller Mobility Group
Car ImportsCar Dealers Car Finance
“Our goal is to be best and largest”

5 Annual report 2017 Group Finances 2017 MMG AS Finances 2017 CSR report 2017
The future is here
2017 was a busy year. Important events included implementation of our new strategy plan “The Race”, the start of a major investment programme in digital services, the launch of the Hyre car sharing service, the establishment of MobilityLab, and the announcement that we are going to relaunch SEAT in Norway. Not only did we pass 1.5 million imported cars for the Group as a whole in 2017, we also changed our name to Møller Mobility Group, in preparation for our future customers’ needs.
Terje Male Group CEO Møller Mobility Group
We have chosen a new name for a new era. The automotive industry is undergoing massive changes. We believe that digitalisation, urbanisation, sustainability and customers’ needs for smart mobility solutions will drive the development of products and services. We are facing a transport revolution. The new name signals our vision for the future, while emphasising our roots in the Møller family. In addition, we now have a name that reflects our international footing.
We are a big company. In addition to being the leading auto group in the Nordic countries and the Baltics and one of the largest automotive businesses in northern Europe, we are also Norway’s 23rd largest company, measured by sales revenue, according to Kapital’s ranking for 2016. Møller Mobility Group as a whole is also one of the largest companies in Norway measured by other parameters, such as number of employees, number of apprenticeships, etc.
With size comes responsibility, and we work hard every day to keep moving forwards. We need to adapt, stay hungry and evolve. Møller Mobility Group had solid growth and achieved a healthy profit in 2017. At the same time, the leading auto group in the Nordic countries had a year marked by change with a view to further strengthen our position in a rapidly changing car market. In order to increase our ability to change rapidly, we have now combined our entire car dealership division under a single common management team. Møller Mobility Group’s car dealer operations currently consist of 67 dealerships and more than 3,700 employees in Norway, Sweden and the Baltics.
A solid financial status and strong market positions mean that we are able to take a leadership role in the enormous upheavals that the car industry is undergoing.
Møller Mobility Group still enjoys a very strong overall market position in Norway.
More than every fourth new passenger car and almost every third new commercial vehicle in the Norwegian market was supplied by Møller Mobility Group in 2017. In the Baltics too, our market share is stable. We intend to maintain our leading position in chargeable cars, and our range in Norway will be expanded with the relaunch of SEAT in the Norwegian market.
The Group is in the midst of an extensive digitalisation process, with a view to creating new and better solutions for our customers, cars and dealers. This spring, the Group’s new car sharing service, Hyre, will also be launched, paving the way for more efficient use of the fleet, as users will have the option of renting their own car to others or using other people’s private car. Møller Mobility Group is preparing to replace more than 30% of our current revenues with earnings from new mobility services by 2030. Through our leading position, we have the leverage to change the way cars are used in Norway, making it more ecofriendly and more efficient. With Hyre, we believe we have managed to combine the best of two worlds and create a winning team consisting of Møller Mobility Group’s car brands and market expertise and brilliant entrepreneurs that make things happen.

6 Annual report 2017 Group Finances 2017 MMG AS Finances 2017 CSR report 2017
There is broad consensus that the automotive industry is facing massive changes; indeed some people predict that the industry will see bigger changes in the next 5–10 years than we have experienced in the past 50.
We are preparing for a transport revolution
For over 80 years, Møller Mobility Group has helped meet people’s mobility needs. Historically, our business model has been based on car ownership, with an increasing proportion of financing in recent years. Today we are at a crossroads where technology, the sharing economy, regulations and changed customer preferences are driving the development away from the private ownership model and towards new servicebased mobility concepts.
We are already seeing that the cars are becoming electric and connected to the internet and that technology can perform more and more of the driver’s tasks, in a development towards autonomous cars. Each of these developments in isolation will have a significant impact on the value chain, as we know it today. However, when we consider the impact of the technological changes and new business models together, we find we are on the brink of a transport revolution. An electric selfdriving car shared by multiple users on a platform (the transportation as a service
“TaaS” model) has the potential to reduce the cost of owning a car by 80–90% in urban areas. This may sound like a distant dream, but technology companies like Uber are aiming to launch this model within five years. Then the automotive industry will meet its new “Netflix competitor”, where customers can subscribe to one or more mobility services.
Large revenues from new mobility servicesUber’s market valuation further confirms the potential behind this vision of the future. At the time of writing, Uber was valued at roughly the same as General Motors. Møller Mobility Group is preparing to replace more than 30% of our current revenues with earnings from new mobility services by 2030. A key issue we are currently working on is what the future value chain will look like and what role we will play. It is pertinent to draw parallels to the developments in the aviation industry when trying to forecast the automotive industry’s development towards mobility services. The
aircraft industry has undergone a shift towards specialised business models where you have one company operating the aircraft, one company that maintains the aircraft, and one or more parties that finance the aircraft. In addition, the revenue flow has shifted from the journey itself to services sold during the journey. In this vision of the future, car dealers can be a natural operating and maintenance partner for fleet cars. Cars are a physical product that require space and infrastructure, and we believe that dealers will play an important role in the future as long as we are able to adapt.
Strategy towards 2020We have called our strategy towards 2020 “The Race”. It is our response to the rapid, comprehensive developments in the industry. The strategy contains elements of both defence and attack and outlines how we will reduce risks and costs, identify possible new revenue streams, create and launch new mobility services, and establish a strong digital presence. With the sudden, dramatic changes we are seeing in the automotive industry, it is important that we take the right steps at the right time.
Good relationship with Volkswagen AGThe Volkswagen importer contract was signed in 1948, and we have worked closely with the group ever since. In its new strategy, the Volkswagen group has stated clearly that it is aiming to become a worldleading provider of sustainable mobility. The new strategy is called “TOGETHER – Strategy 2025, where half of the business will be as we know it today, while the other half will focus on new areas. Thus, our strategy is also in synch with the factory’s plans.
Håvard AndersenHead of Strategy and Business Development

7 Annual report 2017 Group Finances 2017 MMG AS Finances 2017 CSR report 2017Samfunnsrapport 2017
Volkswagen Group has launched the automotive industry’s most ambitious electrification initiative with “Roadmap E”, whereby the Group’s brands will launch 80 electric models by 2025. Some 50 will be fully electric and 30 will be chargeable hybrids.
The Roadmap E electrification initiative also entails that Volkswagen will have an electric version of all the models in its entire portfolio by 2030, i.e. at least one electric version of the approximately 300 models that the group manufactures, making Volkswagen the first major automaker to set a date for electrification of its entire range of models.
Exponential technological developmentsTechnological developments in the automotive industry are nothing new. It is primarily the accelerating rate of development that will challenge our ability to remain a leading player in the industry. This is evidenced by, for example, the fact that the average life span of companies has fallen drastically, from 90 years in 1935 to 18 years today. Human brains are programmed to expect linear development, while new technology services are developing at an exponential rate. We therefore have a tendency to overestimate the impact in the short term, but seriously underestimate longterm consequences. Møller Mobility Group’s strategy for the future will therefore reflect the fact that we must be a proactive service provider of smart mobility solutions as well as physical products. We also need to prepare ourselves for a necessary change in tempo. Our future competitors are not those we know today. They are unknown.
This is THE RACE
Reduce risk and cost
Add new revenues
Create new mobility service
Establish strong digital presence
8 Annual report 2017 Group Finances 2017 MMG AS Finances 2017 CSR report 2017
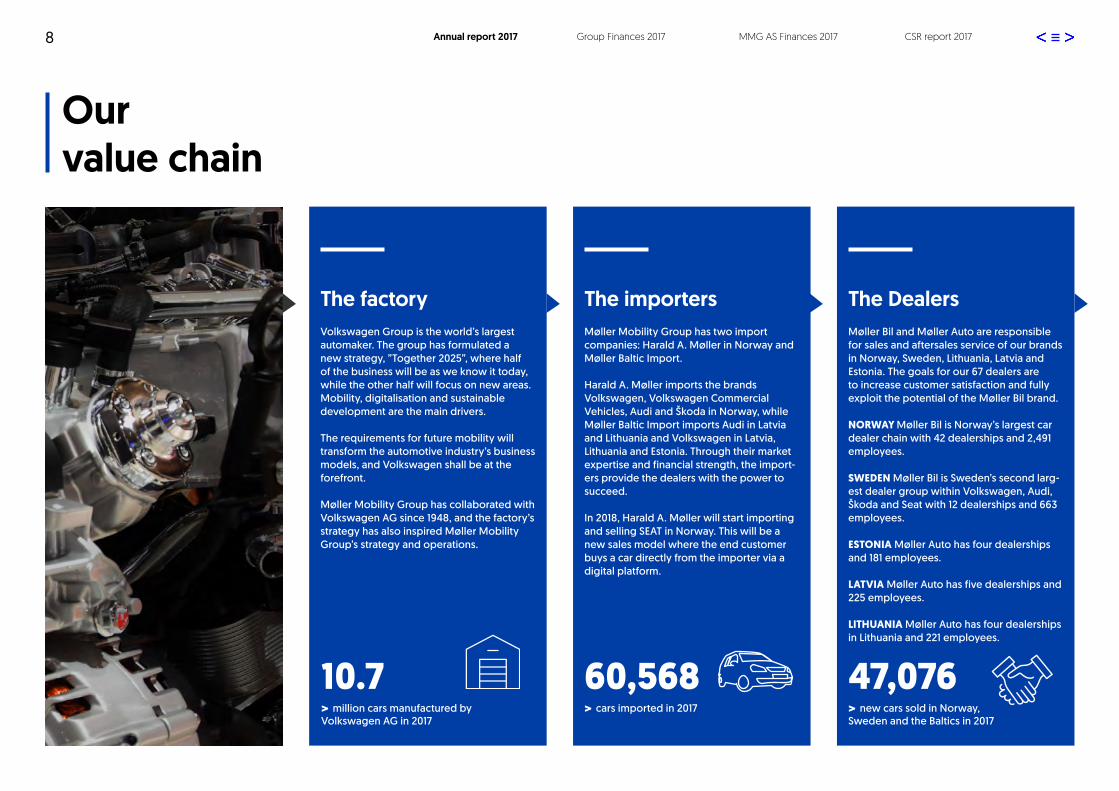
The factoryVolkswagen Group is the world’s largest automaker. The group has formulated a new strategy, ”Together 2025”, where half of the business will be as we know it today, while the other half will focus on new areas. Mobility, digitalisation and sustainable development are the main drivers.
The requirements for future mobility will transform the automotive industry’s business models, and Volkswagen shall be at the forefront.
Møller Mobility Group has collaborated with Volkswagen AG since 1948, and the factory’s strategy has also inspired Møller Mobility Group’s strategy and operations.
The importersMøller Mobility Group has two import companies: Harald A. Møller in Norway and Møller Baltic Import.
Harald A. Møller imports the brands Volkswagen, Volkswagen Commercial Vehicles, Audi and Škoda in Norway, while Møller Baltic Import imports Audi in Latvia and Lithuania and Volkswagen in Latvia, Lithuania and Estonia. Through their market expertise and financial strength, the import-ers provide the dealers with the power to succeed.
In 2018, Harald A. Møller will start importing and selling SEAT in Norway. This will be a new sales model where the end customer buys a car directly from the importer via a digital platform.
The DealersMøller Bil and Møller Auto are responsible for sales and aftersales service of our brands in Norway, Sweden, Lithuania, Latvia and Estonia. The goals for our 67 dealers are to increase customer satisfaction and fully exploit the potential of the Møller Bil brand.
NORWAY Møller Bil is Norway’s largest car dealer chain with 42 dealerships and 2,491 employees.
SWEDEN Møller Bil is Sweden’s second larg-est dealer group within Volkswagen, Audi, Škoda and Seat with 12 dealerships and 663 employees.
ESTONIA Møller Auto has four dealerships and 181 employees.
LATVIA Møller Auto has five dealerships and 225 employees.
LITHUANIA Møller Auto has four dealerships in Lithuania and 221 employees.
10.7> million cars manufactured by Volkswagen AG in 2017
60,568> cars imported in 2017
47,076> new cars sold in Norway, Sweden and the Baltics in 2017
Our value chain

9 Annual report 2017 Group Finances 2017 MMG AS Finances 2017 CSR report 2017
Financial servicesVolkswagen Møller Bilfinans contributes to the dealers’ success by offering competitive financing products.
Our customersMøller Mobility Group has more than 500,000 customer encounters each year. Our customers are our most important investment, meaning all Møller Mobility Group employees must create the best customer experiences every single day. Our core values translated into practice are an important foundation for creating positive experiences – for the customer and Møller Mobility Group alike.
We shall always strive to provide our cus-tomers with the very best solutions, and it is important for us to address the customers’ requirements for future mobility.
30,000> cars insured
750,000> customers in 2017
30,000> cars financed
10 Annual report 2017 Group Finances 2017 MMG AS Finances 2017 CSR report 2017
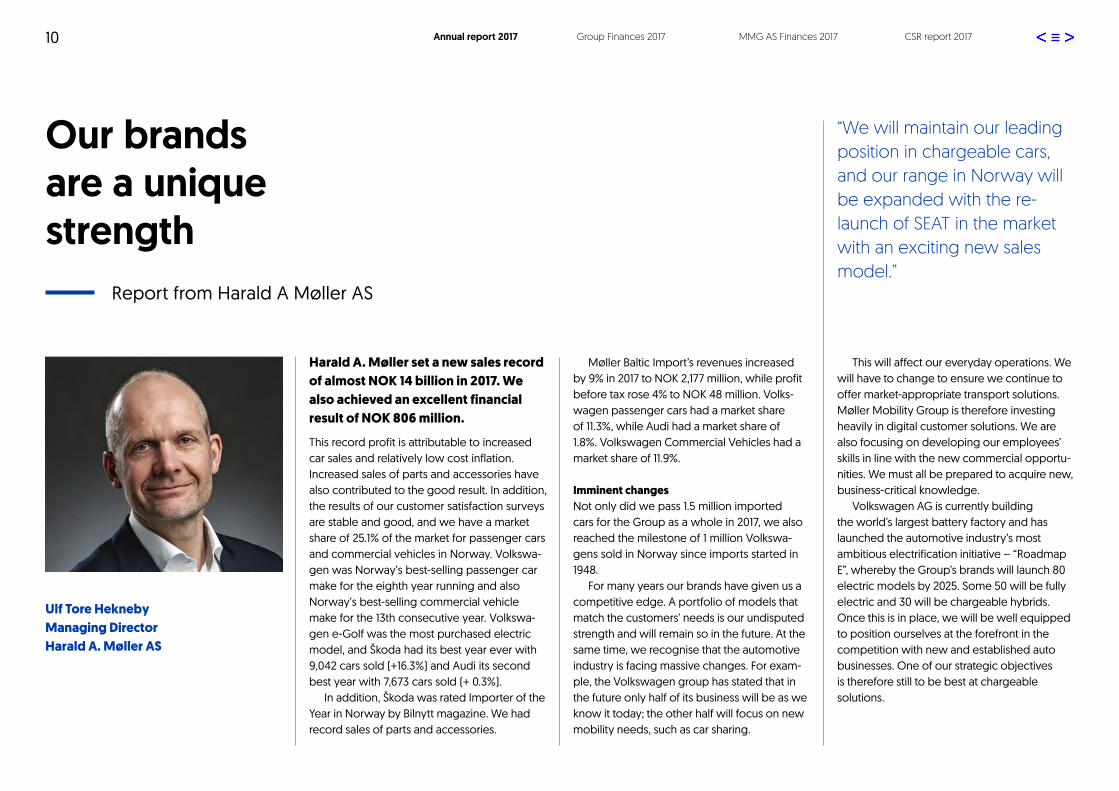
Our brands are a unique strength
Harald A. Møller set a new sales record of almost NOK 14 billion in 2017. We also achieved an excellent financial result of NOK 806 million.
This record profit is attributable to increased car sales and relatively low cost inflation. Increased sales of parts and accessories have also contributed to the good result. In addition, the results of our customer satisfaction surveys are stable and good, and we have a market share of 25.1% of the market for passenger cars and commercial vehicles in Norway. Volkswagen was Norway’s bestselling passenger car make for the eighth year running and also Norway’s bestselling commercial vehicle make for the 13th consecutive year. Volkswagen eGolf was the most purchased electric model, and Škoda had its best year ever with 9,042 cars sold (+16.3%) and Audi its second best year with 7,673 cars sold (+ 0.3%).
In addition, Škoda was rated Importer of the Year in Norway by Bilnytt magazine. We had record sales of parts and accessories.
Møller Baltic Import’s revenues increased by 9% in 2017 to NOK 2,177 million, while profit before tax rose 4% to NOK 48 million. Volkswagen passenger cars had a market share of 11.3%, while Audi had a market share of 1.8%. Volkswagen Commercial Vehicles had a market share of 11.9%.
Imminent changesNot only did we pass 1.5 million imported cars for the Group as a whole in 2017, we also reached the milestone of 1 million Volkswagens sold in Norway since imports started in 1948.
For many years our brands have given us a competitive edge. A portfolio of models that match the customers’ needs is our undisputed strength and will remain so in the future. At the same time, we recognise that the automotive industry is facing massive changes. For example, the Volkswagen group has stated that in the future only half of its business will be as we know it today; the other half will focus on new mobility needs, such as car sharing.
This will affect our everyday operations. We will have to change to ensure we continue to offer marketappropriate transport solutions. Møller Mobility Group is therefore investing heavily in digital customer solutions. We are also focusing on developing our employees’ skills in line with the new commercial opportunities. We must all be prepared to acquire new, businesscritical knowledge.
Volkswagen AG is currently building the world’s largest battery factory and has launched the automotive industry’s most ambitious electrification initiative – “Roadmap E”, whereby the Group’s brands will launch 80 electric models by 2025. Some 50 will be fully electric and 30 will be chargeable hybrids. Once this is in place, we will be well equipped to position ourselves at the forefront in the competition with new and established auto businesses. One of our strategic objectives is therefore still to be best at chargeable solutions.
“We will maintain our leading position in chargeable cars, and our range in Norway will be expanded with the relaunch of SEAT in the market with an exciting new sales model.”
Ulf Tore Hekneby Managing DirectorHarald A. Møller AS
Report from Harald A Møller AS

11 Annual report 2017 Group Finances 2017 MMG AS Finances 2017
Harald A. Møller is Norway’s largest car importer
> New sales record of over NOK 14 billion> Steady, good customer satisfaction survey
scores> Total market share in Norway of 25.1%
NOK 14 billion
11

12 Annual report 2017 Group Finances 2017 MMG AS Finances 2017 CSR report 2017
The dealers are geared up for change
2017 was an eventful year for Møller Bil. Many changes have been imple-mented, including the strategy programme The RACE and a compre-hensive restructuring.
The dealers in Norway, faced with strong demand for electric powertrains and an imbalanced used car situation, have been most affected. At the same time, 2017 was a very good year for Møller Bil, with revenue growth in all regions and record sales totalling NOK 21.7 billion. Møller Bil in Sweden delivered a recordhigh profit of NOK 100 million, as did Møller Auto Baltic, with a profit of NOK 41 million. By contrast, the Norwegian dealership chain had falling profits, due to squeezed margins on new and used cars. Measures have been implemented to cut costs and improve efficiency, along with a dedicated usedcar programme and a topline focus on tightening up the value chain. We sold 47,076 new cars (+ 1.3%) and 30,068 used cars (6.3%) in 2017 and achieved record sales of parts and workshop services. We opened the Škoda Digital Concept Store in Oslo, opened a new Volkswagen
showroom in Horten, and signed an agreement to build a new Audi outlet in Gothenburg (scheduled to open in summer 2019). In connection with the merging of the dealership operations into a single unit, many managers in Møller Bil have been given new tasks.
Short and long termGoing forwards, it will be important to strike a balance between measures that will yield improvements in the short term and those that have a more longterm effect. This will be an important management task both at the local level in the individual dealerships and for the central management of Møller Bil. We must keep our customers satisfied, ensure sound operations and constantly deliver results, at the same time as we must look ahead to the future, manage risks and invest in digital solutions. Change is always challenging, because it requires that we speed up and slow down at the same time. The situation varies from region to region, but the main priorities for Møller Bil as a whole will be to:• Fight for the volumes and turn earnings per
formance in Norway
• Reduce fixed costs• Increase turnover rates and gross earnings
on used cars• Avoid guarantee fines and ensure good
operations at the workshops• Increase revenues in the aftersales market• Continue the digitalisation of the customer
journey, aftersales service process and sales process
The customer always comes first in Møller Bil. We are currently working on establishing an even stronger interaction between the customers, digital solutions and Møller Bil in the sales and service processes going forwards. Although digital solutions simplify our everyday lives in many ways, the human communication between us and the customer remains fundamental to our success.
Møller Mobility Group’s major investments in digital customer solutions require enterprising employees with expertise in line with the new commercial opportunities. Digital knowledge will therefore become increasingly important.
“The car industry is undergoing major changes, but we are in a good position to win The RACE.”
Petter HellmanManaging DirectorMøller Bil AS
Report from Møller Bil AS

13 Annual report 2017 Group Finances 2017 MMG AS Finances 2017 CSR report 2017
Møller Bil 2017
> Cars sold 47,076 new / 30,068 used> Turnover of NOK 21.7 billion
47,076 new30,068 used
13

14 Annual report 2017 Group Finances 2017 MMG AS Finances 2017 CSR report 2017
Car financing is an important part of the success
Volkswagen Møller Bilfinans is Nor-way’s largest car leasing company with almost 25% of the car leasing market.
The company had its best year ever with a profit before tax of NOK 282 million (nonrecurring effect in 2016 of NOK 95 million). In 2018 the company intends to grow further. Volkswagen Møller Bilfinans is a fully integrated and important part of the Volkswagen, Audi and Škoda value chain in Norway. With more than 30,000 vehicles financed in 2017 and more than 30,000 vehicles insured, Volkswagen Møller Bilfinans is very much part of the success that Volkswagen, Audi and Škoda enjoy.
Volkswagen Møller Bilfinans is especially dominant on the private car leasing market. There is a clear trend in society away from owning and towards leasing. This trend applies to both private individuals and large companies that prefer to let professional
partners manage their entire fleet with all the associated costs. This is the crux of car administration.
Great place to workVolkswagen Møller Bilfinans was ranked the 14th best place to work in the category for companies with 50–199 employees. Through a comprehensive analysis of the corporate culture and a survey among the employees, focusing on credibility, respect, fairness, pride and camaraderie, Great Place to Work ranks the best businesses within four categories: more than 500 employees, 200–499 employees, 50–199 employees and 20–50 employees.
“Mobility, digitalisation and sustainable solutions are the industry’s main drivers going forwards – in addition to conventional car sales.”
Vidar EriksenManaging DirectorVolkswagen Møller Bilfinans
Report from Volkswagen Møller Bilfinans

15 Annual report 2017 Group Finances 2017 MMG AS Finances 2017 CSR report 2017
Volkswagen Møller Bilfinans in 2017
> Volkswagen Møller Bilfinans is Norway’s largest car leasing company with almost 25% of the car leasing market.
> 75,272 contracts in the portfolio> A total of over 30,000 new contracts were
signed and over 30,000 cars were insured in 2017
Almost 25% of the car leasing market
15

“Binding corporate social responsibility in four areas”

MILJØ EMPLOYEES
MOBILITY
ENVIRONMENT
SOCIETY
Our sustainable social mission
In autumn 2016 the holding company Aars and Møller Mobility Group conducted a stakeholder and materiality analysis, with the purpose of defining a strategic framework for our social mission.
Paul Hegna Vice President Corporate Communication and CSR
One of the initiatives that has emerged from the new strategy is the establishment of the company Møller Medvind in spring 2017. The company is our first major venture with the purpose of tackling one of the greatest challenges in society: young people under the age of 30 who have fallen outside the labour market. We are very proud of Møller Medvind, and the goal is to employ a significant number of people trained by Møller Medvind to work on the preparation of used cars in Oslo, which is an important part of our core business.
Our ambition is that our social mission becomes an integrated part of how we conduct longterm, profitable business in all our operations. At the same time, we have a responsibility to contribute to sustainable development. This is why we have chosen to call our CSR work our “sustainable social mission”.
We have defined three clear ambitions for our social mission:
• Be recognised for our role in contributing to a greener everyday life for everyone
• Take a central position within smart urban MOBILITY solutions and urban concepts
• Be known as an enterprising company that cares about its EMPLOYEES and SOCIETY in general
Møller Mobility Group’s operations shall help promote human rights, good labour practices and environmental standards, and zero tolerance for corruption. A key tool in this work is our Code of Conduct, which explains our basic ethical principles and guidelines, indirectly linked to selected sustainable development goals in the UN’s 2030 target. In the longer term, our ambition is to incorporate our sustainable development goals into our business strategy.
“Our ambition is that our social mission becomes an integral part of how we conduct longterm, profitable business in all our operations.”
17 Annual report 2017 Group Finances 2017 MMG AS Finances 2017 CSR report 2017

18 Annual report 2017 Group Finances 2017 MMG AS Finances 2017 CSR report 2017Samfunnsrapport 2017MMG selskapsregnskap 2017MMG konsernregnskap 2017 Årsrapport 2017
In 2017 the share of electric vehicles reached an alltime high of 20.8% (27.5% in December 2017). Hybrid technology is also on the rise, and the share of chargeable hybrids has risen from 0.1% in 2012 to 18.4% in 2017. By contrast, the share of diesel cars has fallen from 75.7% in 2011 to 30.8% in 2016 and 23.1% in 2017, and the share of petrol cars has fallen from 29.0% in 2016 to 24.7% in 2017. A growing number of customers are choosing cars with a new powertrain, and sales of chargeable cars accounted for just under 40% of new car sales in Norway in 2017, compared with 29% in 2016, making Norway the world leader in electric vehicles.
Volkswagen eGolf is the bestselling electric car with a market share of 20.1%.
CO2 emissions in Norway in 2017:• All passenger cars 82 g/km ( 11 g/km)• Petrol cars (all, including petrolelectric
hybrids) 94 g/km ( 6 g/km)• Diesel cars (all, including dieselelectric
hybrids) 126 g/km ( 3 g/km)
• CO2 emissions for our brands:• Volkswagen 65 g CO2/km (76 g)• Audi 96 g CO2/km (100 g)• ŠKODA 130 g CO2/km (124 g)
Volkswagen Group has launched the automotive industry’s most ambitious electrification initiative with “Roadmap E”, whereby the Group’s brands will launch 80 electric models by 2025. Some 50 will be fully electric and 30 will be chargeable hybrids. The initiative entails that Volkswagen will have an electric version of all the models in its entire portfolio by 2030 at the latest.
Volkswagen AG is also building the world’s largest battery factory, at the same time as the vehicle charging infrastructure in Europe and the USA is being expanded massively. In Europe, the vehicle charging network is being built with 350 kW ultrafast charging stations, which will ensure that batteries can be charged in a short period of time. Construction of charging stations began in 2017, and the goal is to have 400 electric vehi
cle charging stations in Europe by 2020. In Norway, charging stations are being built in collaboration with Circle K.
Møller Mobility Group wants to be a valued resource on automotive and environmental issues, enable our customers to make good environ-mental choices, and be a market leader in chargeable cars.
Environment
“We believe that in 2025 all new passenger cars sold by the Group will be emissionsfree.”Terje Male, CEO
> Sales of chargeable vehicles Over half of all sales of Volkswagen pas-senger cars were chargeable in 2017.
> Zero emissions by 2025 Møller Mobility Group’s ambition is that all new passenger cars sold by the Group will be emissions-free by 2025.
> Active buildings Møller Bil has now implemented active energy monitoring at all dealerships, in Norway, Sweden and the Baltics. There is energy monitoring in 56 buildings in Norway, 17 buildings in Sweden and 14 buildings in the Baltics.
The UN’s sustainable development goals are a global plan of action for social development and a basis for prioritising efforts over the next 15 years. There are a total of 17 goals with a number of underlying targets. Volkswagen AG has committed to these goals. Four goals are particularly relevant for Møller Mobility Group.
The UN’s sustainable develop-ment goal 13: ”Take urgent action to combat climate change and its impacts.”
18

19 Annual report 2017 Group Finances 2017 MMG AS Finances 2017 CSR report 2017Samfunnsrapport 2017
Norway has ratified the international Paris Agreement on climate change, thereby committing to making necessary, forwardlooking changes in the transport sector in order to reduce greenhouse gas emissions. In a nutshell, we must make much smarter use of what we have than we do today. Therefore, new, energyefficient mobility solutions are also part of our social mission.
In addition, the automotive industry is currently at a complex intersection of technological change, urbanisation, digitalisation and a sharing economy, and customers are increasingly demanding smart mobility solutions. It is therefore no surprise that mobility has been incorporated into Volkswagen AG’s and our own strategy.
Volkswagen Group is the world’s largest automaker. The group has formulated a new strategy “TOGETHER 2025”, which outlines a proactive focus on new mobility solutions – across all the brands. The Volkswagen group itself states that this marks the start of the biggest change process in the company’s
history, with a focus on changing the group’s core business and tapping potential new revenue streams. The Volkswagen group has also established the company MOIA to develop mobility services.
In our strategy, we set a course to take a key position within urban smart mobility solutions and urban concepts. Møller Mobility Group is preparing to replace more than 30% of our current revenues with earnings from new mobility services by 2030. To this end, in 2017 we have changed our name from MøllerGruppen to Møller Mobility Group, launched the car sharing service Hyre, and established MobilityLab.
We know that transport needs will increase significantly towards 2030, and everything indicates that there will still be significant carbased transport. However, there is a great deal of uncertainty about the future ownership models, and we have therefore established MobilityLab to gain insight into and build up knowledge about smart urban mobility, to ensure we are well positioned to be
able to identify and respond to commercial opportunities, and to increase our credibility and market position in mobility. This is a major investment for us, and we are pleased to be joining forces with solid strategic partners such as the Norwegian Institute of Transport Economics (TØI) and the City of Oslo, Telenor, If, NSB, Circle K and Posten in this venture.
We have also launched a car sharing service “Hyre”, whereby customers can easily share their car with others when they are not using it themselves, thanks to a digital key. This car sharing service represents the first of several initiatives that Møller Mobility Group is going to launch in the coming years. Increasing urbanisation and environmental awareness will result in changes in our transportation needs. Mobility solutions are therefore a strategic priority for us. With car sharing and other sharing services on the rise, it is only natural for us to be a leading supplier of these services too.
Our goal for the future is to be a proactive provider of smart mobility services as well as physical products. Climate change is an important driver behind this decision.
Mobility
UN sustainable development goal 9: ”Build resilient infrastructure, promote inclusive and sustaina-ble industrialisation, and foster innovation.”
“Møller Mobility Group is preparing to replace more than 30% of our current revenues with earnings from new mobility services by 2030. Mobility solutions have therefore become a strategic priority for us.”
19

20 Annual report 2017 Group Finances 2017 MMG AS Finances 2017 CSR report 2017Samfunnsrapport 2017
Employees
Møller Mobility Group wants to be known as an enterprising company that cares about its employees and people in general.
It is important for us to invest in our employees, ensure that they have the right skills and expertise and are given challenging tasks. Working for Møller Mobility Group is demanding, engaging and fun. At yearend 2017, the Group had a total of 4,345 employees – an increase of 71 from the previous year. There were 663 employees in Sweden, a total of 694 in the three Baltic States, and 2,988 in Norway. In other words, we are still growing.
Møller Mobility Group’s core values are the cornerstones of the Group’s corporate culture and provide important guidelines for managers and employees on how to treat one another and our customers. Møller Mobility Group has also drawn up a Code of Conduct, which clarifies our basic ethical principles and provides guidelines. We maintain a continuous focus on this work, which was followed up in autumn 2017 through an internal Questback survey, carried out by Deloitte. In 2018, all employees in Møller Mobility Group will work on this through our new “Most important day of the year” initiative.
Our Group has many operational units that to a great extent have to be run as independent profit centres, and developing our managers and recruiting new ones is therefore a highpriority area. Møller Mobility Group has focused on developing its own managers for almost 30 years. Internal recruitment and the transfer of competence between the companies, especially between importers and dealers, are important cornerstones for the company’s growth and development.
In 2017 we have conducted a Manager Programme (no. 20) for 19 middle managers in Norway. This has been held over a period of eight months with a total of five sessions. At the same time, we completed a manager development programme for 10 middle managers in the Baltic States and started a new Manager Candidate Programme (no. 18) for 22 participants in autumn 2017. The senior management team (TLP) met twice in 2017, focusing on strategic challenges and learning, with content from external speakers.
The era we are entering requires restructur
ing to ensure we are best equipped to raise the competence of the entire organisation. In this context, technical and nontechnical training are now going to be merged into a single training department, called The Harald A. Competence Centre. The new department will be located in the premises of our current training academy, the Servicing School in Skedsmo, which has been responsible for all technical training on all models of Audi, Škoda, Volkswagen passenger cars and Volkswagen commercial vehicles that are imported into Norway. Technical training has also been provided for our customer advisers and sales staff. Once SEAT is back, this make will also be included in the training.
By combining all the resources that work with teaching and training in Harald A. Møller, we will be in an even better position to develop the area in relation to the changes ahead. The merger will also enable a concerted focus on digital education and development of new learning methods for more professional development out in the chains.
UN sustainable development goal 3, target 3.6: ”By 2020, halve the number of global deaths and injuries from road traffic accidents.”
“The era we are entering requires a restructuring to ensure we are best equipped to raise the competence.”
20

21 Annual report 2017 Group Finances 2017 MMG AS Finances 2017 CSR report 2017
Society
We will be a leader in terms of diversity, creating an inclusive work-place, developing our employees and giving them opportunities.
We believe that the best way to help our fellow human beings is to give them work in our businesses. This has been done at many dealerships previously, but after the good experience from the vocational training at the vehicle preparation plant in Bekkelaget that started in autumn 2016, this is now going to be done more systematically. Candidates recruited through the Norwegian Labour and Welfare Administration (NAV) take a programme consisting of both practical vocational training and more theoretical education in relevant subjects, with the aim of getting young people outside the employment market into work, either with us or elsewhere. The trainees work on the technical or cosmetic preparation of cars. This autumn, three people who took this programme have been offered permanent employment with us.
We established Møller Medvind in 2017. Møller Medvind will create permanent, profitable workplaces for this target group and at the same time develop employees for work in other parts of the Group. The aim is to
hire a significant number of new employees in 2018.
“Møller Medvind is first and foremost a result of the owners’ community involvement,” says Kai Robert Solheim, General Manager of Møller Medvind.
Based on the fact that we have workplaces and NAV has job seekers, Møller Medvind and NAV Oslo entered into a unique new form of collaboration on the qualification and distribution of young job seekers in autumn 2017. A secondary aim of the collaboration agreement is to provide a framework for more sustainable and targeted collaboration between NAV and the private sector – locally and throughout Norway. A similar agreement was entered into with NAV Akershus in February 2018 for candidates for Møller Logistics in Skedsmo.
“People love to criticise NAV, but the individuals I met were incredibly dedicated and willing to go the extra mile. We have established a unique partnership,” continues Kai Robert Solheim.
“It’s as if I have been given a second chance at life. The future looks bright with Møller Medvind.”Anas, vehicle preparer at Møller Bil Logistikk
“It feels like someone has reached out to me, and I really want to make the most of this chance. If I am offered the opportunity to continue working at Møller Bil, I’ll definitely say yes.”Michael, Møller Bil Logistikk
UN sustainable development goal 12: ”Ensure sustainable consump-tion and production patterns.”
FACTSCollaboration agreement between Møller Medvind and NAV Oslo on the qualification and distribution of job seekers:• The aim of the collaboration is to get people
who have fallen outside the labour market into work in an inclusive environment. It is a goal that in the long term the participants will function and be productive in the workplace without the need for special support schemes.
• The idea is that, after a qualifying period of up to 9 (12) months), participants from the project will enter a permanent employment relation-ship in Møller Medvind. However, they will also be qualified for employment in other compa-nies in Møller Mobility Group and elsewhere.
• A secondary aim of the collaboration agree-ment is to provide a framework for more sus-tainable and targeted collaboration between NAV and the private sector – locally and throughout Norway.
21

22 Annual report 2017 Group Finances 2017 MMG AS Finances 2017 CSR report 201722
Møller Medvind was established in 2017 in the wake of a successful practical vocational training scheme at Møller Mobility Group’s new car preparation and finishing facility in Oslo. The company is our first major, own scheme in this area. In partnership with NAV Oslo, Møller Medvind has great ambitions.
“Møller Medvind will shortly start preparing up to 6,000 cars a year in Oslo, and we expect to hire a significant number of employees over the next few years,” says the owner and general manager of Møller Signatur, Mari Schage Førde, which takes care of all the family’s commitments linked to the company’s social mission.
“We hope Møller Medvind will help solve one of the greatest challenges in society today: young people under the age of 30 who are outside the labour market,” she adds.
Certificate of competenceDuring the course of 2018, Møller Medvind will build capacity and competence in the preparation and finishing of used cars in Oslo. This is an area where we need many new employees. Møller Medvind will train and educate candidates so that we are continuously building the capacity and competencies we need.
“We are also going to develop a certificate of competence in the preparation of used cars for people who wish to take a ‘learning candidate’ programme. In addition, our new employees will also receive training in other subjects related to the preparation and finishing of cars. In this way, we will create attractive workers who can also be employed elsewhere in our operations or at other companies,” Mari explains.
Mari Schage FørdeOwner and general manager of Møller Signatur
Møller Medvind:New chance for young job seekers
From philanthropy to projects relevant to the businessHistorically, businesses’ corporate social responsibility has evolved from simply providing financial support for chosen causes to actively developing projects and initiatives that are closely linked to the business – ideally as an integrated part of the company.
“This is also our ambition. Although we have just started, we are already experiencing great enthusiasm for Møller Medvind internally within Møller Mobility Group and also from the outside world. We are particularly pleased by the good collaboration we have enjoyed with NAV, which has been crucial for the project. Everybody has been very helpful and great fun to work with,” concludes Mari Schage Førde.
Møller Medvind: Young people who have fallen outside the labour market are a major challenge in society. Møller Medvind wants to provide unemployed young people under the age of 30 with a second chance. The ambition is to create permanent, profitable workplaces for this target group.
“Møller Medvind will train and educate candidates so that we are continuously building the capacity and competencies we need.”

“I got a second chance”
Møller Mobility Group’s car facility at the port in Bekkelaget in Oslo is Norway’s largest pas-senger car and commercial vehicle reception plant. Every fourth new passenger car sold on the Norwegian market is prepared in the huge hall. The activity level is very high.
The hall has also provided life-changing activity for many young people who had fallen outside the labour market. For many years Møller has taken in young people who needed a fresh start. Preparing and checking new cars is real work and an ideal challenge for learning about working life. The facility has been a new starting point for cars and young people.
“I was unemployed for a long time, and not having a job to go to was a big problem. Through the vocational training at Bekke-
laget, I got a second chance and was offered a permanent job as a cosmetic vehicle preparer before the end of the programme. This gave me an enormous boost, and I now feel like I too am contributing,” says Zishan Najeeb, 29, from Oslo.
He and others can now look forward to getting many new, well trained colleagues as a result of Møller Medvind’s ambitions. Møller Medvind will train and educate unemployed young people at Møller Logistics at Bekke-laget and Skedsmo, and at Alnabru in Oslo.
“I got a second chance. And I got a steady job. It means everything.”zizhan najeeb, permanently employed cosmetic vehicle preparer at bekkelaget
“This is exactly what NAV needs”
Based on the fact that we have workplaces and NAV has job seekers, in autumn 2017 Møller Medvind and NAV Oslo entered into a unique new form of collaboration on the qualification and distribution of young job seekers. In January 2018, a corresponding collaboration agreement was signed with NAV Akershus.
”This is an excellent template for NAV’s market initiatives,” says county director Hege Farnes Hildrum. ”By entering into a partnership with a serious player like Møller Medvind, we increase the opportunities for transitioning to permanent employment for many people who struggle to get a job. I am particularly pleased that they are so eager to offer successful candidates a permanent
position. In addition, we know that this is an employer that is highly capable of providing vocational training and ensuring inclusion. This is very important for both our users and us here at NAV.”
”It is a goal that this collaboration can provide a framework for targeted collabora-tion between NAV and businesses through-out the whole of Norway,” says Hege Farnes Hildrum, Director of NAV Oslo.
”It is important for us to collaborate with businesses that motivate unemployed young people to learn something new in a safe environment.”hege farnes hildrum, director nav oslo
“We have resources and we have visions. We want to create our future by running profitable businesses”
24

Creating value for future generations
For more than 80 years, the Møller family has played a central role in social developments in Norway within our areas. We started with a single car dealer and workshop in Strømmen outside Oslo. Today, the family’s ownership and activities are gathered in the family-owned holding company Aars.
Harald MøllerChairman of the Board and owner of Møller Mobility Group and the holding company Aars
These days we have operations and employees in Norway, Sweden and the Baltics. However, our core business is still cars. In addition, we own, operate and develop business properties, and we invest and get involved in companies that we believe can benefit from our active ownership. But the journey does not stop here.
For generations we have created value in the form of satisfied customers, experience, knowledge and capital. Value is created by clever, diligent people, in interaction with the local community. These are values and assets we have created for the benefit of future generations. We recognise and embrace the responsibilities that this entails.
We have resources and we have visions. We want to create our future by running profitable businesses, meeting new customer needs and at the same time helping solve some of the challenges facing society. We also share a coresponsibility for climate
change and want to find solutions that work. We believe in setting clear ambitions and acting to realise them.
Population growth will lead to further urbanisation, resulting in new needs for construction, transport and movement. We are particularly well positioned to develop mobility solutions and buildings that will characterise tomorrow’s environmentally friendly, smart cities. Mobility is our past and will be an important part of our future.
Our ambition is to contribute to flow. We want people to be able to move safely and efficiently, without harming the environment. We also believe in the free flow of thoughts and ideas without prejudice between people of all kinds. We want to create more jobs – but we also want to create jobs for more people by providing opportunities to people who have fallen outside the employment market.
We are a family that values solidarity highly.
We are proud of our heritage and dream of creating visible results, ideally in partnership with others. When we succeed, we create value for our successors and for the community we all are part of.
“We are particularly well positioned to develop mobility solutions and buildings that will characterise tomorrow’s environmentally friendly, smart cities.”
CSR report 2017MMG AS Finances 201725 Group Finances 2017 Annual report 2017

MMG AS Finances 2017
26.04.2018 10:49
KEY FIGURES
(Amounts in NOK millions) 2017 2016 2015 2014 2013
28 273 26 387 24 131 20 601 18 842ProfitOperating profit 1 038 1 069 1 033 606 636EBITDA 1 1 389 1 408 1 301 934 848Profit before tax 1 121 1 180 1 103 671 701Profit for the year 861 912 824 511 511CapitalEquity at 31 Dec. 3 225 2 934 2 624 2 324 2 373Total assets at 31 Dec 8 050 7 267 6 484 5 507 5 346Equity ratio 40,1 40,4 40,5 42,2 44,4ProfitabilityReturn on equity in % 2 28,0 32,8 33,3 21,8 22,4Return on total assets in % 3 14,6 17,2 18,4 12,4 14,2Number of employeesNumber of employees 4 345 4 274 4 107 3 926 3 771Total payrolland personnel costs 2 812 2 616 2 457 2 310 1 998
1) Including results in assosiated companies 2) Return on equity: profit for the year as a percentage of average equity3) Return on total assets: the result before tax plus financial costs as a percentage of average total assets.
Key figures Møller Mobility Group 2017–2013
26 Annual report 2017 Group Finances 2017 MMG AS Finances 2017 CSR report 2017

27 MMG AS Finances 2017 CSR report 2017Group Finances 201727
Board of directors’ report 2017
THE NATURE, SCOPE AND LOCATION OF THE GROUPDuring the 2017 financial year, Møller Gruppen changed its name to Møller Mobility Group. The name change comes in the wake of a strategic process where the management and the Board have together staked out the future direction for the Group. One of the pillars of the new strategy is the owners’ ambition to meet new customer needs, while at the same time addressing societal challenges linked to mobility and the environment, among others. At the same time, it has been important that the strategy reflects and supports the Volkswagen Group’s ambition to become a worldleading provider of sustainable mobility.
The Group’s core business is still the import, sale, servicing, financing and repair of the brands Volkswagen, Volkswagen Commercial Vehicles, Audi and Škoda. The business is located in Norway, Sweden, Estonia, Latvia and Lithuania. Møller Mobility Group’s strategy is to grow with the Volkswagen Group’s brands, and its goal is to create value for its customers, employees, shareholders and partners. Ever since Harald Aars Møller started his own car company in 1936, the core values – Honest and Trustworthy, Clear, Proactive, and Openminded and Caring – have played a central role.
Møller Mobility Group is owned by Aars AS. Aars AS is a holding company focusing on
asset management and allocation of capital to its subsidiaries. Aars AS also owns Møller Eiendom, which owns a large percentage of Møller Mobility Group’s car facilities. Møller Mobility Group rents the premises on longterm contracts.
Møller Mobility Group is managed through a shared corporate management consisting of the business areas Car Imports, Car Dealers, and Car Finance. Each business area is cultivated with an emphasis on independent responsibility and authority within the agreed framework of strategies and targets, to achieve longterm value development. Where appropriate, common functions are used to safeguard economies of scale across the business areas.
Car ImportsFrom 2017 Car Imports in Norway and the Baltics have been combined under joint management. Harald A. Møller AS is Norway’s largest car importer with a total market share of over 25% in recent years. The four brands – Volkswagen passenger cars, Volkswagen Commercial Vehicles, Audi and Škoda – all have very strong positions in the Norwegian market. In 2018, Harald A. Møller is starting import and sale of Seat in Norway. This will be a new sales model where the end customer buys a car directly from the importer via a digital platform.
Harald A. Møller AS is the chain leader
for all the car brands and is also in charge of logistics for vehicles, parts and accessories for all dealers in Norway. Until 31 December 2016, IT operations were also part of Harald A. Møller, but to highlight and increase the focus on IT as a corporate function for all markets, IT operations were spun off into a separate company owned directly by Møller Mobility Group AS with effect from 1 January 2017.
Møller Baltic Import imports Volkswagen passenger cars and Volkswagen Commercial Vehicles to all three Baltic countries and Audi to Latvia and Lithuania. The importer is based in Riga and is the largest car importer in the Baltic States.
Car DealersThe car dealers were previously organised in three separate business areas: Norway, Sweden and Baltics. From 2017, these have been merged into a single business area and into the legal company Møller Bil AS, with joint management and programme functions for used cars, the aftersales market, marketing and property across the markets. Møller Bil is now subdivided into five regions: Oslo, Western Norway, Central Norway, Sweden and the Baltics. The dealers are engaged in sales of new and used cars and operation of mechanical workshops and repair workshops. The dealers operate as independent units, but work is coordinated and experiences are shared where appropriate – also across
national borders. Møller Bil’s new organisational structure enables this in a good way.
In Norway, Møller Bil AS owns a significant part of the Norwegian dealer network. With 42 dealers and 11 specialised body & paint workshops spread across the country, Møller Bil is Norway’s largest car dealer chain. Møller Bil covers around 60% of the Norwegian market for Volkswagen and Audi, with a primary focus on the largest cities. Škoda has a market share of around 45%. In terms of management, the dealerships in Norway have been organised into three regions: Western Norway, Central Norway and Greater Oslo.
The Group’s dealers in Sweden are also organised as a chain under the name Møller Bil. The chain consists of 12 dealers in Mälardalen, with a shared administration in Uppsala. Møller Bil Sverige accounts for about 10% of the Swedish importer’s sales.
The dealers in the Baltics are organised in the same way as in Norway and Sweden under the name Møller Auto Baltic. The chain has shared management for the three countries, located in Riga. Møller Auto consists of 13 dealers who are largely located in the three capitals: Riga, Tallinn and Vilnius.
Car FinanceCar Finance operates in Norway and is run by the company Volkswagen Møller Bilfinans AS. This is a jointly controlled company with Volkswagen Financial Services AG. The
Annual report 2017

company offers loans, leasing and insurance linked to the respective brands’ sales of new and used cars.
MACRO-ECONOMICS AND FRAMEWORK CONDITIONSThe macroeconomic developments have been positive in all the Group’s markets in 2017. GDP growth was good in the Baltics and Sweden, but somewhat lower in Norway. Unemployment has decreased in all the markets. This, combined with low interest rates, has contributed to very strong car sales in Norway and Sweden and a considerable increase in sales in the Baltic region.
Norway has Europe’s most favourable tax system for electric cars. The government has indicated that this will continue for a few more years. There are also a number of tax discounts for chargeable hybrids. A very large number of electric cars have been sold thanks to the tax system in Norway, and sales of chargeable hybrids are also rising. Sales of chargeable cars increased from 44,885 in 2016 to 62,258 in 2017, accounting for 39% of the total market. Volkswagen passenger cars and Audi have a strong position in this segment with a total market share of 26%.
By 2022, Volkswagen AG will invest over EUR 34 billion in electric cars and technology development related to autonomous vehicles, digitalisation and mobility solutions. Volkswagen AG has launched the automotive indus
try’s most ambitious electrification initiative with ”Roadmap E”, whereby the Group’s brands will launch 80 electric models by 2025. Some 50 will be fully electric and 30 will be chargeable hybrids. Mobility, digitalisation and sustainable solutions are the industry’s main drivers going forwards – in addition to conventional car sales. The fact that the factory is among the first to head in a new direction means Møller Mobility Group is well equipped to meet the changes.
The diesel scandalThe upgrading of the cars affected by the Volkswagen diesel scandal continued in full throughout 2017, and by the end of the year 77% of all the affected cars in Norway and about 60% of the affected cars in the Baltics had been upgraded. The upgrades are being carried out as guarantee work with normal coverage. The cars have retained all their technical data in accordance with their type approvals. The situation has not had any negative financial consequences for the Group in 2017. Volumes and market shares have also remained at at least the same level as before the issue became known. Internal customer surveys in connection with upgrades show that the customers are happy with the handling of the case. The upgrades will continue through 2018.
The car marketThe car market in Norway was even stronger
in 2017 than in 2016, which was also a good year. Some 158,650 new passenger cars were registered in Norway in 2017, an increase of 2.6% compared with 2016. The total number of commercial vehicles under 3.5 tonnes ended up at 35,838 vehicles, down marginally from 2016.
Sales of new cars in Sweden achieved a new record high of 379,255 vehicles, an increase of just under 2%. The market for commercial vehicles grew by 7% to 55,382 vehicles. There was considerable growth in the car market in the three Baltic countries too in 2017, with sales of 78,771 cars, which is a 13% increase from 2016.
Annual financial statementsThe consolidated profit before tax for 2017 amounted to NOK 1,121 million, compared with NOK 1,180 million in 2016. This is the second best result in the Group’s history. The profit for 2017 is affected by a positive nonrecurring effect of NOK 12 million (gains from the sale of property in Orkdal), while the profit for 2016 included a positive nonrecurring effect of NOK 35 million (due to the change in the method for provisions for losses in Volkswagen Møller Bilfinans). Adjusted for these nonrecurring effects, the profit for the year was NOK 36 million lower than for 2016.
Consolidated operating revenue totalled NOK 28.3 billion in 2017, up from NOK 26.4 billion in 2016. Consistently good market
performance, a very high total market for new cars in Norway and Sweden, and continued good growth in the total market in the Baltics contributed to record sales. Contract intake in Norway, Sweden and the Baltics has shown a very positive trend in 2017. However, the number of registered cars was somewhat lower. This is mainly due to the backlog in deliveries of certain models, especially Volkswagen eGolf.
Overall, the pretax profit was very good, but slightly weaker than in 2016. The Group delivered record results from car imports in Norway and the Baltics, as well as in dealership operations in Sweden. The car dealers in the Baltics also delivered profit growth, while the dealerships in Norway had a reduction in earnings due to lower margins on used cars and increased costs. Sales of cars financed by leasing continued to increase in 2017. Nevertheless, the share of the profit from Volks wagen Møller Bilfinans was slightly lower than in 2016; however, this is attributable to a positive nonrecurring effect in 2016, and the underlying profit is better than the previous year. Other group companies had higher costs in 2017 compared with 2016. The increase in costs is primarily related to the investments in digital services, mobility concepts, strategy implementation and the change of name.
Net cash flow from operations rose by NOK 1 billion and amounted to NOK 1,787
28 MMG AS Finances 2017 CSR report 2017Group Finances 201728 Annual report 2017

million, compared with NOK 785 million in 2016. Cash flow from operations is significantly higher than in 2016 due to a reduction in working capital. Working capital was reduced by NOK 456 million in 2017, as a result of a reduction in the stock of new and used cars, a reduction in accounts receivable, and an increase in accounts payable. In 2016 working capital increased similarly by NOK 547 million.
The Board is satisfied with the results and market performances the Group delivered in 2017.
Investments, liquidity and financingThe Group’s investments amounted to NOK 330 million in 2017, compared with NOK 306 million in 2016. The largest investments are in digital solutions and upgrading and development of the Group’s IT systems. Møller Bil Horten moved into new premises in 2017, and minor upgrades have been made at several other facilities, both to increase capacity and to adapt to new standards from the manufacturers.
Liquidity and the financing situation are still very good. Møller Mobility Group issued a new fiveyear bond of NOK 400 million in March 2017 and at the same time bought back NOK 200 million from the bond that will mature in October 2019. The Group is thus financed by two bonds, each with a net value of NOK 400 million, that mature in 2019 and 2022 respectively, and a syndicated loan of
NOK 1 billion, due in 2021. The bonds ensure the Group good, longterm financing, and at the same time the Group gains an alternative source of financing to bank financing. The bonds are listed on the Nordic ABM exchange to ensure liquidity for investors. The syndicated loan is a framework agreement with flexible elements to finance the ongoing fluctuations in working capital. The sharp reduction in working capital in 2017 has led to a major decrease in net interestbearing liabilities from NOK 953 million at the close of 2016 to NOK 105 million at yearend 2017.
At 31 December 2017, the Group’s share capital amounted to NOK 3,225 million, corresponding to 40% of the total capital. This gives Møller Mobility Group a very strong financial position.
The Group’s dealers have obligations totalling NOK 7,063 million linked to the future repurchase of cars from financing companies. This is an increase of 6% from 2016, due to the shift towards sales of privateleasing contracts in the Norwegian and Swedish markets. The Group is exposed to marketbased risk in that the market price for cars could fall below the guaranteed repurchase value. Provisions have been made for estimated losses in the portfolio. Overall, earnings are good on the sale of used repurchase cars, and the Board is of the opinion that this risk is under satisfactory control based on the current financial position and market conditions.
When importing cars and parts, the transaction currency used is the euro, except for imports of Škoda, where payment is made in Norwegian kroner. Prices in euro are regulated according to currency agreements with the factory, which involve most of the risk being covered by the factory. Møller Mobility Group bears the transaction risk during the credit period, as well as a longterm strategic risk associated with the eurozone’s competitiveness. Currency spot and forward contracts and options are used to reduce the settlement risk. The Group’s investments in Sweden and the Baltic States are also subject to currency fluctuations. This risk is reduced by the businesses being funded in local currency. Equity is not hedged beyond the expected oneyear dividend, which is secured by currency forward contracts until payment.
THE BUSINESS AREASCar ImportsThe business area Car Imports consists of Harald A. Møller AS, which imports Volkswagen, Audi, Škoda, Seat and Volkswagen Commercial Vehicles in Norway, and Møller Baltic Import, which imports Volkswagen and Audi in Estonia, Latvia and Lithuania.
Harald A. Møller had total operating revenues of NOK 14,070 million. This is a new record and an increase of 5% from 2016. Profit before tax amounted to NOK 806 million in 2017, compared with NOK 712 million in 2016.
The improvement is attributable to increased car sales and relatively low cost inflation. Increased sales of parts and accessories have also contributed to the good result. This year’s profit is the best in the company’s history. Harald A. Møller AS retained its position as Norway’s largest car importer, and our car brands had a total market share of 25.1% of the Norwegian car and commercial vehicle market, compared with 27.4% in 2016.
Volkswagen passenger cars continues to have good market shares, due to strong sales of chargeable cars. Contract intake was very high, but a shortage of vehicles meant the market share ended up lower than in previous years. Volkswagen was the most sold brand for the 12th consecutive year, and Volkswagen Golf was the most popular car model for the 11th year running in 2017. Škoda had an excellent year, achieving a market share of 5.7%, which is 14% higher than in 2016. This is a strong performance, considering Škoda does not have any chargeable models. Audi managed to retain its position, despite fierce competition in the premium segment, and its market declined slightly from 5.0% to 4.8%. Audi is expecting an improvement when the fully electric etron comes on to the market towards the end of 2018. Over 3,000 people had preordered this car at the end of 2017. Volkswagen Commercial Vehicles showed good progress in 2017 and increased its market share from 28.6% in 2016 to 30.0% in 2017.
29 MMG AS Finances 2017 CSR report 2017Group Finances 201729 Annual report 2017

Sales of parts and accessories rose by 1.8%, compared with 2016.
Møller Baltic Import’s revenues increased by 9% in 2017 to NOK 2,177 million, while profit before tax rose 4% to NOK 48 million. The margins on new cars are still low due to strong price competition. Volkswagen passenger cars had a market share of 11.3%, while Audi has a market share of 1.8%. Volkswagen Commercial Vehicles had a market share of 11.9%. The market shares are down slightly from 2016, apart from Volkswagen, which is marginally better. Estonia in particular still has great potential for improvement in terms of both Volkswagen passenger cars and Commercial Vehicles.
Car DealersMøller Bil, with subsidiaries in Norway, Sweden and the Baltics, achieved a combined profit before tax of NOK 362 million in 2017, compared with NOK 455 million in 2016. The decline in profits is due to weaker margins on used cars and increased costs. The Norwegian dealership chain’s profit before tax amounted to NOK 299 million, compared with NOK 417 million in 2016. This is not satisfactory, and measures have been implemented to reduce costs and strengthen profits on used cars. The Swedish car dealers achieved a recordhigh profit before tax of NOK 100 million, compared with NOK 71 million in 2016. The market for new cars in Sweden is very strong, and our
dealers have performed well in this market. Like in Norway, there is increased pressure on the margins on used cars, while the aftersales market is doing better than last year. The dealerships in the Baltics also achieved their bestever pretax profit of NOK 41 million, compared with NOK 25 million in 2016. Sales revenue is increasing in all areas, and cost control is good. Contract intake has been very good in 2017, and the order backlog is just over 25% higher than at the end of 2016.
Car FinanceVolkswagen Møller Bilfinans achieved a profit before tax of NOK 282 million, compared with NOK 344 million in 2016. Excluding the nonrecurring effect in 2016 of the change in the method for provisions for losses, which amounted to NOK 95 million, there has been a clear improvement in the profit. The Group’s share of 49% after tax amounted to NOK 117 million, compared with NOK 126 million in 2016. Losses remain low, and although the interest margin is falling slightly, increased volumes resulted in a higher profit.
The high volume of new car sales has led to significantly greater demand for financing services. The degree of financing is slightly higher as a result of strong growth in private leasing. The total assets under management increased by a further 24% to NOK 17,548 million at 31 December 2017.
PERSONNEL, WORKING ENVIRONMENT, THE ENVIRONMENT AND CORPORATE SOCIAL RESPONSIBILITYAt yearend 2017, Møller Mobility Group had 4,345 employees, an increase of 71 from the year before. There were 663 employees in Sweden, a total of 694 in the three Baltic States and 2,988 in Norway.
The proportion of women in Norway at yearend 2017 was around 16%. The Group has increased the proportion of women in senior positions in 2017, and at the beginning of 2018 there were two women in the corporate management, one female brand manager, one female importer in the Baltics, and six female general managers at car dealers. We want to further increase this number, which is reflected by the fact that we always encourage women to take part in our internal management programmes.
The company’s working environment is considered to be good. In 2017, total sickness absence was 3.3%, compared with 3.0% in 2016. Longterm absence is stable. There were no occupational accidents in the company in 2017. Occupational health and safety and the working environment are monitored on an ongoing basis, in collaboration with the occupational health service.
Møller Mobility Group is a member of the UN Global Compact. This is described in more detail in our Corporate Social Responsibility Report, which covers personnel, the working
environment, the external environment and corporate social responsibility. For a more detailed description of these areas, please see the CSR Report.
MØLLER MOBILITY GROUP ASThe parent company, Møller Mobility Group AS, is in a solid financial position. The financial statements for 2017 have been prepared on the assumption that the parent company and the Group are going concerns, and the Board confirms that the basis for this assumption exists. It is the Board’s opinion that the annual financial statements and accompanying notes provide comprehensive information about the company’s operations and financial position at 31 December 2017. There have been no events following the end of the year that would affect an assessment of the company. In 2017, Møller Mobility Group AS had a profit after tax of NOK 589 million, which the Board proposes be allocated as follows:
Dividends and group contributions NOK 200 millionTransferred to other equity NOK 389 millionTotal allocated NOK 589 million
In addition to this, an additional dividend was distributed in 2017 totalling NOK 400 million. The company had a book equity of NOK 1,933 million. The company had 26 employees at 31 December 2017. The working environment is
30 MMG AS Finances 2017 CSR report 2017Group Finances 201730 Annual report 2017

good, and the company does not pollute the external environment. The company’s head office is in Oslo.
PROSPECTS FOR 2018 AND BEYONDThe outlook for the Norwegian economy is largely positive for 2018, with continued low unemployment, low interest rates and opti-mism among consumers. These are important prerequisites for a continued strong total market for new cars in Norway. At the same time, the turn in sales in Norway away from fossil-fuel cars and towards chargeable cars is continuing, and the ability of manufacturers to deliver both fully electric cars and chargeable hybrids continues to affect the development in the overall market in the short term. The change in the method for measuring vehicle emissions from NEDC (New European Test
Cycle) to the new World Harmonised Light Vehicles Test Procedure. (WLTP) will also affect both car sales and the delivery situation for car manufacturers in 2018. These changes are already noticeable in the market, and the total market for cars in Norway has decreased by 16% in mid-March 2018, compared with the same period in 2017. The Group expects this to improve during the year, but overall, Møller Mobility Group expects a slight decline in the total market, with sales of 150,000 passenger cars and 35,000 vans in Norway in 2018. The record high market in Sweden is expected to decline slightly in 2018 to a market of approx-imately 360,000 passenger cars. In the Baltics, moderate further growth from the current levels is still expected.
There has been a surge in online trade in a wide range of industries in the last few years. It
is still very limited in the car industry. However, there is no doubt that technological devel-opments and the customers’ expectations will result in the car industry also being more strongly affected by this trend in the next few years. In 2018 Møller Mobility Group will con-tinue its efforts to develop digital solutions for sales of cars and customer communication.
The emerging sharing economy and new purchasing and consumption patterns will have a huge impact on our value chain, but will also pave the way for new opportunities. Møller Mobility Group developed the car sharing service HYRE in 2017 and will further develop and launch it in 2018, at the same time as we will continue the work to identify our place in a future car sharing and mobility solution. This will be an important focus area in the coming period.
The Board is moderately optimistic about the car markets in our geographical areas. There is greatest uncertainty related to devel-opments in Norway and Sweden, given that the markets here are at record-high levels, with continued uncertainty about future growth.
In general, the Board is of the opinion that uncertainty about important framework conditions outside the company’s control will continue. This applies to the general economic situation, but also to some extent to the car manufacturer’s arrangements and the authorities’ influence through laws, taxes and duties, especially with respect to the tax regime for cars in Norway.
The Board of Møller Mobility Group ASOslo, 26 April 2018
Harald A. Møller Øyvind Schage Førde Jon Morten Møller Jacob Schram Chairman of the Board Board member Board member Board member
Kristin Solheim Genton Jan Tellef Thorleifsson Terje MaleBoard member Board member CEO
31 MMG AS Finances 2017 CSR report 2017Group Finances 201731 Annual report 2017
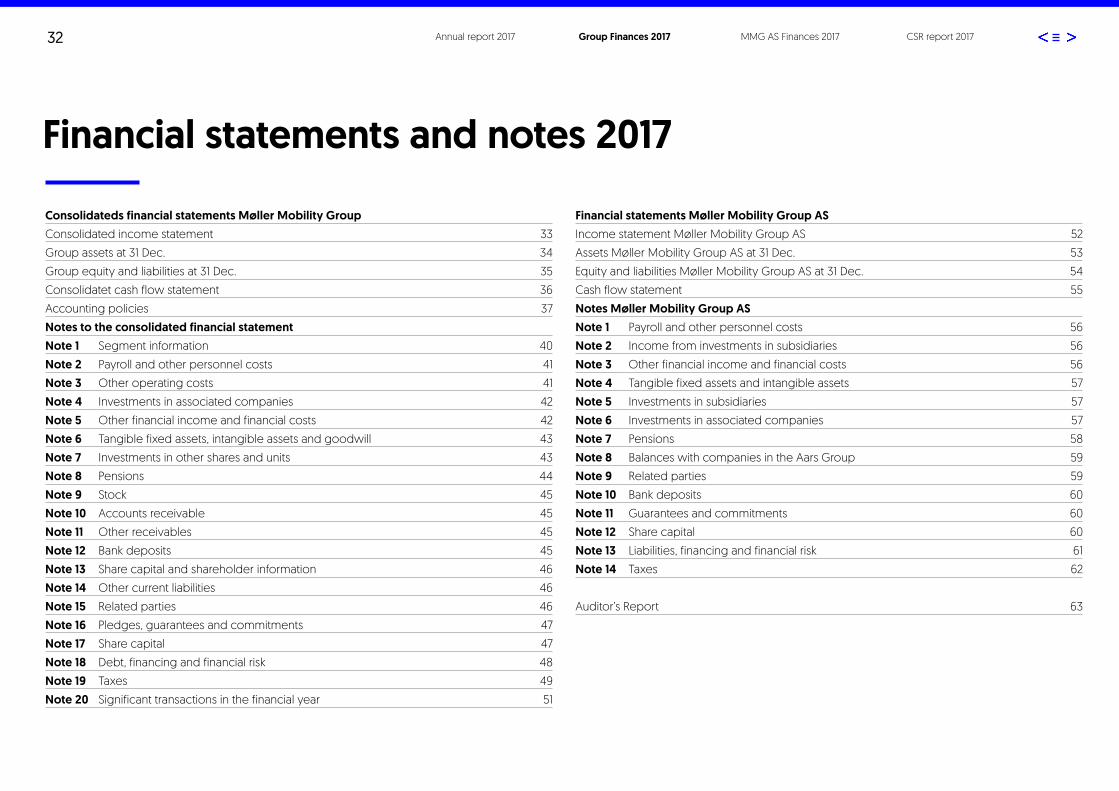
Consolidateds financial statements Møller Mobility Group Consolidated income statement 33
Group assets at 31 Dec. 34
Group equity and liabilities at 31 Dec. 35
Consolidatet cash flow statement 36
Accounting policies 37
Notes to the consolidated financial statementNote 1 Segment information 40
Note 2 Payroll and other personnel costs 41
Note 3 Other operating costs 41
Note 4 Investments in associated companies 42
Note 5 Other financial income and financial costs 42
Note 6 Tangible fixed assets, intangible assets and goodwill 43
Note 7 Investments in other shares and units 43
Note 8 Pensions 44
Note 9 Stock 45
Note 10 Accounts receivable 45
Note 11 Other receivables 45
Note 12 Bank deposits 45
Note 13 Share capital and shareholder information 46
Note 14 Other current liabilities 46
Note 15 Related parties 46
Note 16 Pledges, guarantees and commitments 47
Note 17 Share capital 47
Note 18 Debt, financing and financial risk 48
Note 19 Taxes 49
Note 20 Significant transactions in the financial year 51
Financial statements Møller Mobility Group AS Income statement Møller Mobility Group AS 52
Assets Møller Mobility Group AS at 31 Dec. 53
Equity and liabilities Møller Mobility Group AS at 31 Dec. 54
Cash flow statement 55
Notes Møller Mobility Group ASNote 1 Payroll and other personnel costs 56
Note 2 Income from investments in subsidiaries 56
Note 3 Other financial income and financial costs 56
Note 4 Tangible fixed assets and intangible assets 57
Note 5 Investments in subsidiaries 57
Note 6 Investments in associated companies 57
Note 7 Pensions 58
Note 8 Balances with companies in the Aars Group 59
Note 9 Related parties 59
Note 10 Bank deposits 60
Note 11 Guarantees and commitments 60
Note 12 Share capital 60
Note 13 Liabilities, financing and financial risk 61
Note 14 Taxes 62
Auditor’s Report 63
Financial statements and notes 2017
32 Annual report 2017 Group Finances 2017 MMG AS Finances 2017 CSR report 2017

33 Annual report 2017 Group Finances 2017 MMG AS Finances 2017 CSR report 2017
Consolidated income statementCONSOLIDATED INCOME STATEMENT
(Amounts in NOK millions) Note 2017 2016OPERATING REVENUESales revenue 27 871 25 953Other operating revenue 402 434Total operating revenue 1 28 273 26 387
OPERATING COSTSCost of goods 22 225 20 706Payroll and other personnel costs 2 2 812 2 616Depreciation and write-downs 6 234 213Other operating costs 3 1 964 1 783Total operating costs 27 235 25 318OPERATING PROFIT 1 038 1 069
FINANCIAL ITEMSIncome from investments in associated companies 4 117 126Other financial income 5 40 50Other financial costs 5 (75) (65)Total financial items 83 111
PROFIT BEFORE TAX 1 121 1 180
Taxes 19 260 268NET PROFIT 861 912
Majority 852 897Minorities 9 15

34 Annual report 2017 Group Finances 2017 MMG AS Finances 2017 CSR report 2017
Group assetsGROUP ASSETS AT 31 DEC.
(Amounts in NOK millions) Note 2017 2016ASSETSDeferred tax asset 19 243 238Intangible assets 6 276 221Goodwill 6 33 38Total intangible assets 552 496
Tangible fixed assets 6 628 624
Investments in associated companies 4 888 758Investments in shares 7 2 2Other receivables 11 13 14Total financial fixed assets 903 774
TOTAL FIXED ASSETS 2 083 1 894
Stock 9 3 335 3 546
Accounts receivable 10 1 345 1 439Other receivables 11 513 356Total receivables 1 858 1 795
Cash and cash equivalents 12 774 32
TOTAL CURRENT ASSETS 5 966 5 373
TOTAL ASSETS 8 050 7 267

35 Annual report 2017 Group Finances 2017 MMG AS Finances 2017 CSR report 2017
Group equity and liabilitiesGROUP EQUITY AND LIABILITIES AT 31 DEC.
(Amounts in NOK millions) Note 2017 2016EQUITYShare capital 13 48 48Other equity 3 122 2 833Minorities' interest 56 53TOTAL EQUITY 17 3 225 2 934
LIABILITIESDeferred tax 19 33 24Pension liabilities 8 54 51Other provisions and contingent liabilities 25 12Total provisions for liabilities 112 87
Liabilities to financial institutions 797 597Other non-current liabilities 17 16Total non-current liabilities 16, 18 815 613
Liabilities to financial institutions 18 64 372Accounts payable 756 613Tax payable 19 238 293Public duties payable 950 795Dividends and group contributions 213 173Other current liabilities 14 1 678 1 387Total current liabilities 3 898 3 633
TOTAL LIABILITIES 4 825 4 333
TOTAL EQUITY AND LIABILITIES 8 050 7 267
Oslo, 26 March 2015The Board of Directors of MøllerGruppen AS
...........................................Harald Møller
Chairman of the Board
...........................................Øyvind Schage Førde
Board member
...........................................Jon Morten Møller
Board member
..........................................Jacob SchramBoard member
..........................................Kristin Solheim Genton
Board member
...........................................Jan Tellef Thorleifsson
Board member
.........................................Pål Syversen
CEO
Oslo, 26 April 2018The Board of Directors of Møller Mobility Group AS
...........................................Harald Møller
Chairman of the Board
...........................................Øyvind Schage Førde
Board member
..........................................Jacob SchramBoard member
..........................................Kristin Solheim Genton
Board member
...........................................Jan Tellef Thorleifsson
Board member
.........................................Terje Male
CEO
The Board of Directors of Møller Mobility Group AS
Oslo, 26. april 2018
Harald A. MøllerChairman of the Board
Øyvind Schage FørdeBoard member
Jon Morten MøllerBoard member
Jacob SchramBoard member
Kristin Solheim GentonBoard member
Jan Tellef ThorleifssonBoard member
Terje MaleCEO

36 Annual report 2017 Group Finances 2017 MMG AS Finances 2017 CSR report 2017
Consolidatet cash flow statementCONSOLIDATED CASH FLOW STATEMENT
(Amounts in NOK millions) Note 2017 2016CASH FLOW FROM OPERATIONSProfit before tax 1 121 1 180Depreciation and write-downs 6 234 213Gains from sale of fixed assets / companies (22) (6)Tax payable (323) (273)Own financing 1 010 1 114Change in stock 208 (450)Change in accounts receivable and payables 248 (97)Change in other items 321 218NET CASH FLOW FROM OPERATIONS 1 787 785
CASH FLOW FROM INVESTMENTSInvestments in tangible and intangible assets (377) (306)Sale of business assets (sales sum) 49 43Payments in connection with purchase of shares in subsidiaries and businesses - (45)Capital paid to AC (74) -Proceeds from sale of shares in associated companies 4 5 -Proceeds from sale of shares in subsidiaries 33 -Proceeds and payments associated with financial fixed assets (2) 19NET CASH FLOW FROM INVESTMENTS (366) (289)
CASH FLOW FROM FINANCINGNew loans 202 300Repayment of loans (300) (27)Dividends paid (573) (751)NET CASH FLOW FROM FINANCING (671) (478)
Change in cash and cash equivalents during year 750 18 Cash reserve at 1 Jan. (40) (58)Cash reserve at 31 Dec. 710 (40)
Specification of cash reserve at 31 Dec.Means of payment 12 774 32Overdraft / current market loans 18 (64) (72)Cash reserve at 31 Dec. 710 (40)
CONSOLIDATED CASH FLOW STATEMENT
(Amounts in NOK millions) Note 2017 2016CASH FLOW FROM OPERATIONSProfit before tax 1 121 1 180Depreciation and write-downs 6 234 213Gains from sale of fixed assets / companies (22) (6)Tax payable (323) (273)Own financing 1 010 1 114Change in stock 208 (450)Change in accounts receivable and payables 248 (97)Change in other items 321 218NET CASH FLOW FROM OPERATIONS 1 787 785
CASH FLOW FROM INVESTMENTSInvestments in tangible and intangible assets (377) (306)Sale of business assets (sales sum) 49 43Payments in connection with purchase of shares in subsidiaries and businesses - (45)Capital paid to AC (74) -Proceeds from sale of shares in associated companies 4 5 -Proceeds from sale of shares in subsidiaries 33 -Proceeds and payments associated with financial fixed assets (2) 19NET CASH FLOW FROM INVESTMENTS (366) (289)
CASH FLOW FROM FINANCINGNew loans 202 300Repayment of loans (300) (27)Dividends paid (573) (751)NET CASH FLOW FROM FINANCING (671) (478)
Change in cash and cash equivalents during year 750 18 Cash reserve at 1 Jan. (40) (58)Cash reserve at 31 Dec. 710 (40)
Specification of cash reserve at 31 Dec.Means of payment 12 774 32Overdraft / current market loans 18 (64) (72)Cash reserve at 31 Dec. 710 (40)

37 Annual report 2017 Group Finances 2017 MMG AS Finances 2017 CSR report 2017
The consolidated financial statements present financial information about the Group as a whole when group companies are treated as a single accounting unit. The companies that Møller Mobility Group has a controlling influence over are consolidated. The consolidated financial statements include the parent company Møller Mobility Group AS and the companies listed in note 5 to Møller Mobility Group AS’s accounts, and their subsidiaries. Subsidiaries are consolidated from the moment control is transferred to the Group (acquisition date), and consolidation ceases when control of the subsidiary ceases.
Elimination of internal transactions All transactions and balances between group companies are eliminated. Stock and other business assets are adjusted for unrealised internal profit.
Elimination of shares in subsidiaries Shares in subsidiaries are consolidated using the acquisition method. The cost price of the shares in the individual subsidiary is eliminated against the subsidiary’s equity on the acquisition date. The subsequent increase or decrease in value is added to the assets and liabilities on the balance sheet as increased / reduced value associated with and accounted for during the asset’s remaining lifetime.
Increased / reduced values that cannot be attributed to specific assets or liabilities are recognised as goodwill / badwill on the balance sheet and depreciated / recognised as income over their financial lifetime.
In the case of acquisitions of subsidiaries with a minority, 100% of identifiable assets and liabilities are recognised on the balance sheet, while for goodwill only the majority share is recognised.
Disposal of subsidiaries Where the Group reduces its stake to 50% or lower, profit/ (loss) is recorded as though the entire company had been sold. This means that the remaining stake is measured at fair value.
Conversion of foreign subsidiaries Balance sheet items in foreign subsidiaries are translated using the closing rate, while earnings are translated using the weighted average exchange rate. Translation differences relating to foreign subsidiaries are charged to equity.
Minority interests Minority interests are extracted as separate items in the income statement and on the balance sheet. In the income statement the minorities’ share of the result after tax is calculated and shown.
Minority interests on the balance sheet
represent the minorities’ share of the companies’ equity, taking into account the minorities’ share of increased / reduced values and internal profits.
Associated companies and joint ventures Shares in companies in which the Group holds between 20% and 50%, and over which the Group has significant influence and where the investment is long term in nature are consolidated in accordance with the equity method in the consolidated financial statements. This means the Group’s share of the net profit after tax and depreciation of any increased values are recognised under financial items and added to the carrying amount of the share. Internal sales of the business assets of associated companies are corrected for unrealised internal profit.
Stakes in joint ventures are treated according to the same policy. In the company accounts, associated companies are accounted for using the cost method. The investment is valued at the lower of cost and fair value.
Individual stakes in smaller companies with limited value and profit are treated as ordinary share investments, which are assessed at the lower of cost price and fair value.
ACCRUALS, CLASSIFICATION AND MEASURE-MENT POLICIES Fundamental accounting policies The financial statements have been prepared in accordance with the Norwegian Accounting Act and generally accepted accounting policies based on the fundamental principles of historical cost, comparability, going concern, congruence and prudence. Transactions are recognised at the value of the remuneration on the transaction date. Income is recognised when earned, and costs are matched with earned income.
Classification of assets and liabilities Goods, current receivables and current liabilities include items due for payment within one year of their acquisition, and items related to goods circulation. The current portion of noncurrent liabilities due within one year is classified as noncurrent liabilities. Other items are classified as noncurrent assets or non current liabilities.
Estimates Estimates are used to measure income, costs, balance sheet items and other liabilities for which there are no market values. This applies to the measurement of warranty liabilities, obsolete stock, pensions, and goodwill, other longterm provisions and deferred losses on repurchase liabilities. Future events may lead
Accounting policies

38 Annual report 2017 Group Finances 2017 MMG AS Finances 2017 CSR report 2017
to changes in the estimates. Estimates and underlying conditions are assessed continually. Changes to accounting estimates are recognised in the period the change occurs.
Income recognition The Group sells products and services, which are recognised on delivery. For sales of new cars with repurchase agreements, the sale is recognised on delivery. Subsequent repurchases and sales of repurchased cars are recognised as separate transactions. Total repurchase liabilities are detailed in note 15.
For sales of new cars, vehicle import duty to the State comprises a significant amount. This is not shown as revenue, but is only included as current liabilities in the financial statements. The proportion of sales revenue related to future aftersales contracts is recognised as unearned income upon the sale and is recognised as income as the services are provided.
Tangible and intangible fixed assets Tangible fixed assets and intangible assets on the balance sheet are stated at cost less ordinary depreciation. Ordinary depreciation and amortisation in the income statement is on a straightline basis and is based on estimates of the financial and technical lifespan.
On indication that the carrying amount of a fixed asset is higher than its fair value, a test for impairment will be conducted. The test is conducted for the lowest level of the fixed
assets that have independent cash flow. If the carrying amount is higher than both the value and the recoverable amount (present value of continued use or ownership), the asset is written down to the higher of sales value and recoverable amount. Writedowns are reversed if the basis for the writedown no longer exists.
Lease agreements that are not recognised (operational leasing) are presented in the financial statements as an operational cost and the annual leasing amount is presented in note 6. Leased assets are recognised on the balance sheet if the lease transfers substantially all the risks and rewards incidental to ownership of the assets.
Shares and units Shares in subsidiaries of a strategic nature and other longterm investments are classified as fixed assets and recognised at the lower of cost price and fair value. Dividends from subsidiaries are recognised in the same year as the company sells them. Dividends from other companies are recognised as income when the dividends are paid.
Shortterm investments are classified as current assets and are measured at the lower of cost price and fair value.
Stock Stocks of cars are assessed at the lower of cost price and assumed retail price after sales costs. An individual assessment is made of each car.
Parts and equipment are recognised at average procurement cost (in accordance with the FIFO principle). Writedowns are made for obsolescence.
Accounts receivable and other receivables Accounts receivable and other receivables are recognised on the balance sheet at their nominal rate after the deduction of confirmed and expected losses.
Other financial investments Shortterm financial investments are recognised at market value.
Taxes Taxes consist of tax payable and changes to deferred tax. Tax payable is fixed based on the year’s taxable result. Deferred tax on the balance sheet is calculated based on temporary differences between taxable and accounting values and tax losses carried forward. Deferred tax assets where future use is uncertain are not recorded. Deferred tax and deferred tax assets are presented net on the balance sheet when there is a basis for offsetting. If the tax rate has changed since the previous year, the new tax rate is used to calculate deferred tax.
Deferred tax and deferred tax assets on acquisitions are calculated based on the difference between fair value and book value in acquired companies for identifiable assets and liabilities. Deferred tax is not calculated on goodwill and increased value of properties
upon acquisition. Deferred tax on temporary differences associated with investments in subsidiaries is included, unless the temporary difference is unlikely to be reversed in the immediate future.
Pensions The Norwegian companies have a definedcontribution group pension scheme, which is covered by insurance companies.
In addition, the Norwegian companies have a few unfunded pension liabilities, which are charged directly to operations and calculated by an actuary. Most of the Norwegian companies are covered by the contractual early retirement scheme (the “AFP” scheme) through the Norwegian Federation of Trade Unions (LO) and the Confederation of Norwegian Enterprise (NHO). Although this is a definedbenefit scheme, there is no direct allocation of assets and liabilities for each individual company. The scheme is therefore treated as a definedcontribution plan for accounting purposes where premiums are charged as a cost as they are incurred.
The Swedish companies have group pension schemes (definedbenefit and definedcontribution schemes), which are governed by collective agreements. The companies in Lithuania, Latvia and Estonia do not have pension plans.
The accounting for pensions has now changed from following the Norwegian Accounting Standard (NRS 6) to accounting

39 Annual report 2017 Group Finances 2017 MMG AS Finances 2017 CSR report 2017
in accordance with IAS 19. This means that on the transition date actuarial gains and/or losses were set to zero and charged to equity. In accordance with the new policy, the year’s actuarial gains and/or losses were charged to equity.
Definedcontribution pensions are calculated on an ongoing basis in the financial statements, with the Group contributing a certain percentage share of the employee’s salary to the insurance company. The contributions are invested in funds, and employees can choose between various savings profiles. Apart from this, the Group has no other liabilities to its employees in this scheme.
Financial instruments When hedging future interest costs, where the hedging instruments are intended to protect the Group from variations in future cash flows, the hedging instrument is not recorded in the balance sheet as long as the hedging is considered effective. Gains or losses are recorded at net in line with the result for the hedged item. For interest rate swap agreements where the hedging is not considered effective, the hedging instrument is recorded at market value in the balance sheet. Changes in market value are recorded in the income statement as they arise.
For currency forward contracts, the intention of which is to hedge assets and liabilities, where the hedge is considered to be effective, both the hedging instrument and
the hedged item are evaluated at fair value, and gains and losses are recognised. When hedging net investments in foreign currency and where the hedge is considered effective, the currency forward contract is evaluated at fair value. Changes to fair value are charged directly to equity.
Foreign currency Monetary items denominated in foreign currencies are measured at the balance sheet date, and related foreign exchange gains/(losses) are recognised as financial items. This applies to cash and cash equivalents, receivables and liabilities. For noncash items, the price at the transaction date is used as a basis for the acquisition cost and is not translated later. This applies mainly to stock and tangible fixed assets. The sale and purchase of goods and services in foreign currencies is calculated at the exchange rate on the date of the transaction.
The Group uses Norwegian kroner (NOK) as its presentation currency. The Group is exposed to changes in currency in SEK and EUR. Within the Group loans are granted in SEK and EUR.
Warranty allocations The Group incurs warranty liabilities through sales of new cars in accordance with the warranties provided by the various manufacturers and regulations in the individual country. The manufacturers normally provide warranties according to applicable guidelines,
but importers and dealers provide warranties in addition to these in accordance with local laws and any goodwill payment. Warranty periods vary from one to 12 years.
With the sale of used cars, the dealer generally handles the warranty liabilities, in addition to the remaining manufacturer’s warranty.
Ongoing provisions and assessments are made for future liabilities.
Contingent liabilities Contingent liabilities are not recognised in the financial statements. Contingent liabilities are recognised when it is more than 50% likely that a liability will be incurred and the liability can be measured reliably.
Repurchase agreements The Group has a portfolio of sold new cars with guaranteed repurchase prices. The repurchase prices vary from 50–70% depending on the rental period, mileage and model of car. The agreements are not recognised on the balance sheet. The liabilities are continuously assessed, and provisions are made for any anticipated losses.
Cash flow statement The indirect method is used when preparing the cash flow statement. Liquid assets include cash, cash equivalents, financial investments (money market funds) and bank overdrafts.
LONG-TERM PARTNERSHIP CONTRACTS Volkswagen AG, Audi AG, and Škoda auto-mobilava as (companies in the Volkswagen group) Harald A. Møller AS’s contracts with Volkswagen, Volkswagen Commercial Vehicles, Škoda and Audi have an average notice period of two years.
The contracts with Audi and Volkswagen in the Baltic States have an average notice period of two years. The Volkswagen contract applies to Estonia, Latvia and Lithuania, while the Audi contract applies to Latvia and Lithuania.
Volkswagen Financial Services AG (company in the Volkswagen Group) In 2009, Volkswagen Financial Services AG and Møller Mobility Group AS set up the company Volkswagen Møller Bilfinans AS to sell car financing products in Norway. Volkswagen Financial Services AG owns 51% and Møller Mobility Group AS 49% of the company. The current shareholders have preferential rights if shares are put up for sale.
Volkswagen Møller Bilfinans AS is treated as an associated company and incorporated using the equity method.

40 Annual report 2017 Group Finances 2017 MMG AS Finances 2017 CSR report 2017
NotesNOTES TO THE CONSOLIDATED FINANCIAL STATEMENTS
All figures are in NOK millions.
Note 1 - Segment information
The business consists of the following business areas: Car Imports (Norway and Baltics), Car Dealers (Norway, Sweden and Baltics) and Car Finance (Norway).The note on the segments for 2016 has been restated to match the new management structure.
The business areas report the following key figures:2017
Car Imports Car Dealers Car Finance Other companies Eliminations Group
Operating revenue 16 247 21 784 - 318 (10 076) 28 273Operating profit/(loss) 858 391 - (126) (85) 1 038Depreciation and write-downs 22 123 - 87 2 234Income from investments in associated companies - - 117 - - 117EBITDA 881 514 117 (39) (83) 1 389Other financial results (4) (29) - (1) - (34)Profit/(loss) before tax 854 362 117 (127) (85) 1 121
Assets 3 094 5 028 518 3 880 (4 471) 8 050
Norway Baltics Oslo West-Norway Mid-Norway Sweden BalticsOperating revenue 14 070 2 177 6 550 5 003 3 683 4 158 2 332EBITDA 831 50 163 151 94 124 52Profit/(loss) before tax 806 48 122 106 71 100 41Assets 2 777 317 1 465 1 087 902 707 535
2016
Car Imports Car Dealers Car Finance Other companies Eliminations Group
Operating revenue 15 455 20 490 - 69 (9 627) 26 387Operating profit/(loss) 759 480 - (64) (106) 1 069Depreciation and write-downs 83 126 - 6 (1) 213Income from investments in associated companies - - 126 - - 126EBITDA 842 606 126 (59) (107) 1 408Other financial results (1) (25) - 11 - (15)Profit/(loss) before tax 758 455 126 (54) (106) 1 180
Assets 2 872 5 211 401 2 749 (3 967) 7 267* Includes the effect of a change in the method for provisions for losses in VWMBF of NOK 35 million.
Norway Baltics Oslo West-Norway Mid-Norway Sweden BalticsOperating revenue 13 457 1 998 6 356 4 672 3 371 4 012 2 041EBITDA 794 48 227 176 121 96 37Profit/(loss) before tax 712 46 181 135 100 71 25Assets 2 553 319 1 534 1 170 961 621 499
Car DealersCar Imports
Car Imports Car Dealers

41 Annual report 2017 Group Finances 2017 MMG AS Finances 2017 CSR report 2017
NOTES TO THE CONSOLIDATED FINANCIAL STATEMENTS
All figures are in NOK millions.
Note 1 - Segment information
The business consists of the following business areas: Car Imports (Norway and Baltics), Car Dealers (Norway, Sweden and Baltics) and Car Finance (Norway).The note on the segments for 2016 has been restated to match the new management structure.
The business areas report the following key figures:2017
Car Imports Car Dealers Car Finance Other companies Eliminations Group
Operating revenue 16 247 21 784 - 318 (10 076) 28 273Operating profit/(loss) 858 391 - (126) (85) 1 038Depreciation and write-downs 22 123 - 87 2 234Income from investments in associated companies - - 117 - - 117EBITDA 881 514 117 (39) (83) 1 389Other financial results (4) (29) - (1) - (34)Profit/(loss) before tax 854 362 117 (127) (85) 1 121
Assets 3 094 5 028 518 3 880 (4 471) 8 050
Norway Baltics Oslo West-Norway Mid-Norway Sweden BalticsOperating revenue 14 070 2 177 6 550 5 003 3 683 4 158 2 332EBITDA 831 50 163 151 94 124 52Profit/(loss) before tax 806 48 122 106 71 100 41Assets 2 777 317 1 465 1 087 902 707 535
2016
Car Imports Car Dealers Car Finance Other companies Eliminations Group
Operating revenue 15 455 20 490 - 69 (9 627) 26 387Operating profit/(loss) 759 480 - (64) (106) 1 069Depreciation and write-downs 83 126 - 6 (1) 213Income from investments in associated companies - - 126 - - 126EBITDA 842 606 126 (59) (107) 1 408Other financial results (1) (25) - 11 - (15)Profit/(loss) before tax 758 455 126 (54) (106) 1 180
Assets 2 872 5 211 401 2 749 (3 967) 7 267* Includes the effect of a change in the method for provisions for losses in VWMBF of NOK 35 million.
Norway Baltics Oslo West-Norway Mid-Norway Sweden BalticsOperating revenue 13 457 1 998 6 356 4 672 3 371 4 012 2 041EBITDA 794 48 227 176 121 96 37Profit/(loss) before tax 712 46 181 135 100 71 25Assets 2 553 319 1 534 1 170 961 621 499
Car DealersCar Imports
Car Imports Car Dealers
Note 2 - Payroll and other personnel costs
2017 2016Salaries 2 197 2 044Employer's NI contributions 345 334Pension costs 157 138Other personnel costs 114 100Total payroll and other personnel costs 2 812 2 616
Average number of employees 4 296 4 191Loans to employees 29 30
2017 2016Salaries, bonuses, pension costs and other remuneration for the CEO 7 8Board fees 2 2Total remuneration of senior executives 9 10
Loans to employees are mainly interest-bearing car loans where the companies have security in a car. The interest rate on these loans is 2.5%. In the event of sale, liquidation or other reorganisation, general managers in the Group are entitled to salary for one year, under certain terms.
2017 2016Audit fees and audit-related services 4 4Tax, fees and other consultancy services 1 1Total auditor's fees (excl. VAT) 5 5
Note 3 - Other operating costs
2017 2016Operating costs (rent, electricity, maintenance, car costs, etc.) 949 880Sales costs (advertising, warranties, etc.) 758 705Administration costs (IT services, fees, travel expenses, gifts, bad debts) 257 199Total other operating costs 1 964 1 783
Note 4 - Investments in associated companies
Voting Equity Carrying Internal Additions Share of profit Carryingrights/ in company amount profit disposals after tax amount
Company name stake 31.12.17 01.01.17 2017 31.12.17Volkswagen Møller Bilfinans AS 49 % 2 373 753 (56) 74 117 888UAB Baltic Auto, Lithuania 35 % 5 - (5) - -Total 758 (56) 69 117 888
Investments in associated companies are incorporated in accordance with the equity method. The stake in UAB Baltic Auto was sold in 2017.
Note 5 - Other financial income and financial costs
2017 2016Interest income 5 4Currency gains 34 44Other financial income 2 2Total other financial income 40 50
Interest costs 23 22Currency losses 42 36Other financial costs 10 7Total other financial costs 75 65
At 31 December 2017 the CEO and board members own 0.34% and 0.44% stakes, respectively, in Møller MI AS. Møller MI AS is an investment company where senior executives have the opportunity to invest. The CEO is the CEO of Møller Mobility Group AS and is employed and paid by the parent company. Bonus schemes have been established here where the size of the payment depends on the results achieved for the year, combined with other qualitative assessment criteria, and where the bonus is considered to be part of the normal remuneration for this type of position. Two executives are entitled to two years' salary in the event of major reorganisations.
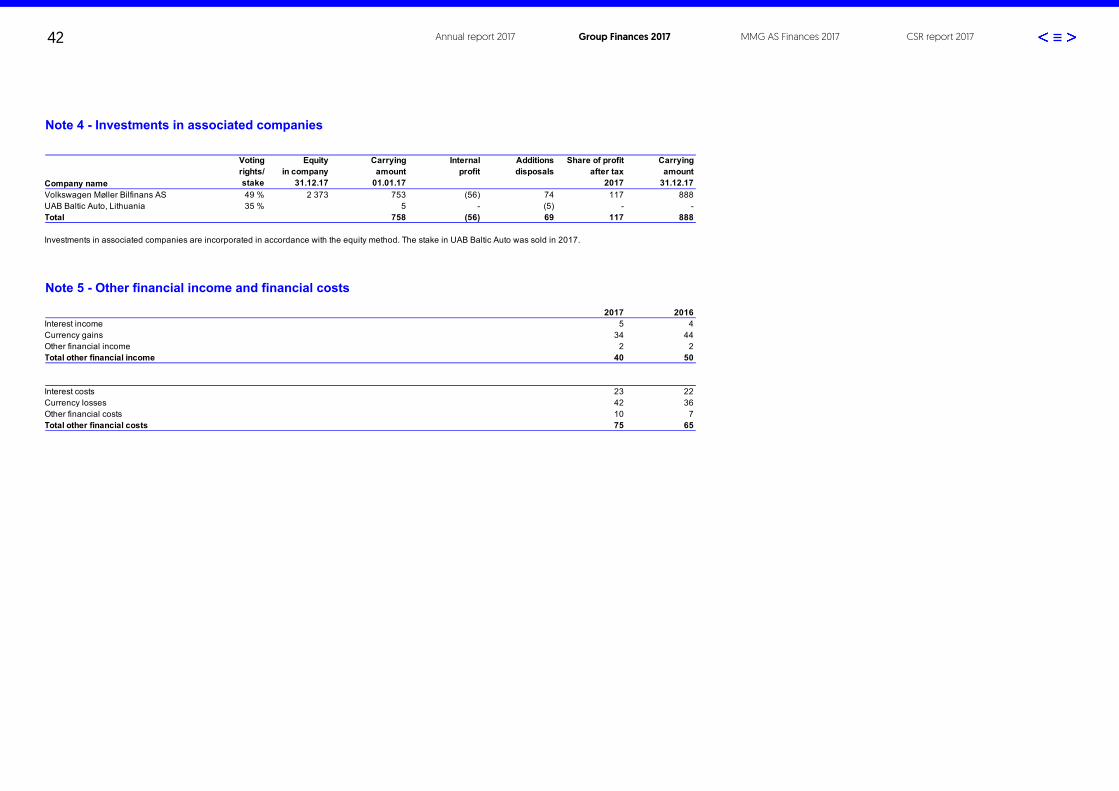
42 Annual report 2017 Group Finances 2017 MMG AS Finances 2017 CSR report 2017
Note 2 - Payroll and other personnel costs
2017 2016Salaries 2 197 2 044Employer's NI contributions 345 334Pension costs 157 138Other personnel costs 114 100Total payroll and other personnel costs 2 812 2 616
Average number of employees 4 296 4 191Loans to employees 29 30
2017 2016Salaries, bonuses, pension costs and other remuneration for the CEO 7 8Board fees 2 2Total remuneration of senior executives 9 10
Loans to employees are mainly interest-bearing car loans where the companies have security in a car. The interest rate on these loans is 2.5%. In the event of sale, liquidation or other reorganisation, general managers in the Group are entitled to salary for one year, under certain terms.
2017 2016Audit fees and audit-related services 4 4Tax, fees and other consultancy services 1 1Total auditor's fees (excl. VAT) 5 5
Note 3 - Other operating costs
2017 2016Operating costs (rent, electricity, maintenance, car costs, etc.) 949 880Sales costs (advertising, warranties, etc.) 758 705Administration costs (IT services, fees, travel expenses, gifts, bad debts) 257 199Total other operating costs 1 964 1 783
Note 4 - Investments in associated companies
Voting Equity Carrying Internal Additions Share of profit Carryingrights/ in company amount profit disposals after tax amount
Company name stake 31.12.17 01.01.17 2017 31.12.17Volkswagen Møller Bilfinans AS 49 % 2 373 753 (56) 74 117 888UAB Baltic Auto, Lithuania 35 % 5 - (5) - -Total 758 (56) 69 117 888
Investments in associated companies are incorporated in accordance with the equity method. The stake in UAB Baltic Auto was sold in 2017.
Note 5 - Other financial income and financial costs
2017 2016Interest income 5 4Currency gains 34 44Other financial income 2 2Total other financial income 40 50
Interest costs 23 22Currency losses 42 36Other financial costs 10 7Total other financial costs 75 65
At 31 December 2017 the CEO and board members own 0.34% and 0.44% stakes, respectively, in Møller MI AS. Møller MI AS is an investment company where senior executives have the opportunity to invest. The CEO is the CEO of Møller Mobility Group AS and is employed and paid by the parent company. Bonus schemes have been established here where the size of the payment depends on the results achieved for the year, combined with other qualitative assessment criteria, and where the bonus is considered to be part of the normal remuneration for this type of position. Two executives are entitled to two years' salary in the event of major reorganisations.

43 Annual report 2017 Group Finances 2017 MMG AS Finances 2017 CSR report 2017
Note 6 - Tangible fixed assets, intangible assets and goodwill
Machinery and Vehicles Buildings Intangible Goodwill* Totalfixtures assets
Acquisition cost at 1 Jan. 977 112 424 458 183 2 154Disposals in connection with sale of companies (2) - (17) - - (19)Additions 84 93 54 146 2 379Disposals (86) (69) (41) (38) (86) (319)Currency translation difference 14 - 1 1 6 22Acquisition cost at 31 Dec. 988 136 422 566 106 2 218Accumulated depreciation at 1 Jan. 656 19 213 237 145 1 270Disposals in connection with sale of companies (1) - (1) - - (2)Year's depreciation and write-downs 90 27 29 80 8 234Disposals (84) (25) (15) (27) (86) (237)Currency translation difference 9 - 1 - 5 15Depreciated at 31 Dec. 670 21 227 290 73 1 281Carrying amount at 31 Dec. 318 116 194 276 33 937* Goodwill in connection with acquisition of new companies, and goodwill in company financial statements.
Straight-line depreciation plan 3-7 years 3-7 years 20-50 years 3-10 years 5-10 years
Annual rental of off balance sheet business assets 25 344 369
Duration of rental of business assets 1-5 years 1-5 years 1-15 years
Specification of goodwill in connection with acquisitions:Business unit Acquisition Depreciation Acquisition Accumulated Carrying Year's
date period cost* depreciation* amount* depreciationCar Dealers Norway 2016 10 years 4 - 4 -Car Dealers Sweden 2014 10 years 23 5 18 2
2011 10 years 32 21 11 3Car Dealers Sweden 2008 10 years 40 40 0 1Car Dealers Sweden 2007 10 years 7 7 0 2Total goodwill in connection with acquisitions 106 73 33 8* Incl. currency translation difference
Note 7 - Investments in other shares and units
Car Dealers Baltics
Some subsidiaries in Møller Mobility Group have a number of minor equity investments with holdings of 20-35%, such as repair and lacquer workshops and the tyre hotel. These are not treated as associated companies since they have limited value and small profits. At 31 December 2017 these investments had a total carrying amount of NOK 2 million.
Depreciation time on goodwill that represents strategic investments is normally over 10 years. These are investments where Møller Mobility Group has a long-term perspective and that are within the Group's core business. Other items are depreciated over 5 years. Intangible assets of NOK 276 million concern software and development costs for IT systems.

44 Annual report 2017 Group Finances 2017 MMG AS Finances 2017 CSR report 2017
Note 8 - Pensions
2017 2016Interest cost of pension liabilities 3 1Year's pension costs for funded and unfunded pensions 3 1Defined-contribution pension 107 94Defined-benefit pension not calculated by an actuary 46 43Total pension costs 157 138
Carrying amount pension obligations calculated by an actuary Calculated pension liabilities at 1 Jan. 2017 (51) (57)The year's pension costs (3) (1)The year's pension payments 2 2Currency translation difference (2) 4Pension liabilities (54) (51)
Number of people covered by all pension plans 3 500 3 305
Financial assumptions Sweden NorwayReturn on pension assets - 0,0 %Discount rate 3,8 % 2,3 %Annual salary growth / annual G adjustment 2,0 % 0,0 %
The actuarial assumptions relating to demographic factors are the normal assumptions used by the insurance industry, adapted to the Group's age structure and retirement. All pension liabilities include the employers' National Insurance contribution.
The Norwegian and Swedish companies in the Group have secured collective pension agreements. The companies in the three Baltic states do not have pension plans. In Norway we have an ongoing defined-contribution scheme. The defined-contribution plan is charged as a cost on an ongoing basis in the financial statements as the Group pays an amount of savings to the insurance company based on the individual employee's salary. The scheme has been adapted to comply with the new Act on occupational pensions, and the threshold between the lower and the higher savings rate is 7.1 x the National Insurance basic amount ("G"). In addition to saving for a retirement pension, disability pension and surviving children's pension are also covered. These payments do not have a paid-up policy element, meaning there is no future liability related to disability and children's pensions beyond the current premium payments.
The Group is a member of the contractual early retirement scheme (the "AFP" scheme) through the Norwegian Federation of Trade Unions (LO) and the Confederation of Norwegian Enterprise (NHO). The AFP scheme provides a life-long supplement to the standard pension. Employees can choose to start drawing on the AFP pension scheme from the age of 62. The new pension scheme is a defined-benefit, multi-employer pension plan funded by premiums that are determined as a percentage of the individual's salary. There is no reliable measurement and allocation of liabilities and assets in the scheme. Therefore, in the financial statements the scheme is treated as a defined-contribution pension scheme where the premium payments are charged as a cost on an ongoing basis and no provisions are made in the financial statements. In 2016, premiums were paid into the new scheme for employees up to the age of 61 at a rate of 2.5% of the total salary payments between 1 G and 7.1 G.
Our Swedish companies have pension plans in accordance with a collective agreement. The scheme in Sweden is a combination of defined-benefit and defined-contribution plans based on job category, age and income. The defined-benefit plan is partially financed by means of premium payments, while the rest is financed through the accumulation of pension liabilities in the balance sheet. The pension liabilities related to the part of the scheme that is not insured are calculated by an actuary. These liabilities will be reduced in line with the ongoing pension payments. All future pension savings are now insured, but these amounts are not calculated by an actuary, as the scheme is such that assets and liabilities are not allocated directly to the individual company in the collective pension fund. Møller Mobility Group bases its accounting of defined-benefit pensions on IAS 19 (see the note on accounting policies). This entails that the year's actuarial gains and/or losses are charged to equity.

45 Annual report 2017 Group Finances 2017 MMG AS Finances 2017 CSR report 2017
Note 9 - Stock
2017 2016New cars 1 373 1 569Used cars and demonstration cars 1 688 1 715Parts and equipment 264 255Other stock 10 7Total stock 3 335 3 546
Note 10 - Accounts receivable
2017 2016Accounts receivable 1 345 1 449Provisions for bad debt (11) (10)Accounts receivable Aars Group 11 - Total accounts receivable 1 345 1 439
Note 11 - Other receivables
2017 2016Loans to employees 13 14Total non-current receivables 13 14
2017 2016Advances to suppliers 9 9Loans to employees 16 17Net VAT credit 3 3Other prepaid expenses 101 116Accrued income 181 124Other current receivables 202 87Total current receivables 513 356
Note 12 - Bank depositsThe Group has bank deposits totalling NOK 774 million. There are no restricted funds to cover tax owed. Tax deductions are secured bya bank guarantee (see note 16).
Note 13 - Share capital and shareholder information
Shareholders in Møller Mobility Group AS at 31 Dec. 2017 Number StakeA shares:Jan H. Møller 103 0,375 %B shares:Jan H. Møller 1 0,004 %Aars AS 24 778 90,102 %Møller MI AS 2 618 9,520 %Total 27 500 100,00 %
The share capital consists of 27,500 shares with a nominal value of NOK 1,734, in total NOK 48 million. There are two classes of share. All shares have equal voting rights. Aars AS votes for 82.3% of the shares directly and indirectly through Møller MI AS. Class A shares are guaranteed an annual dividendof NOK 5 million, collected from Møller Mobility Group AS and Møller Eiendom Holding AS.
Note 14 - Other current liabilities
2017 2016Provision for warranties and other liabilities 699 537Accrued costs and prepaid income 485 453Holiday pay and accrued salary 349 319Advances from customers 146 80Other current liabilities - 6Total other current liabilities 1 678 1 396

46 Annual report 2017 Group Finances 2017 MMG AS Finances 2017 CSR report 2017
Note 9 - Stock
2017 2016New cars 1 373 1 569Used cars and demonstration cars 1 688 1 715Parts and equipment 264 255Other stock 10 7Total stock 3 335 3 546
Note 10 - Accounts receivable
2017 2016Accounts receivable 1 345 1 449Provisions for bad debt (11) (10)Accounts receivable Aars Group 11 - Total accounts receivable 1 345 1 439
Note 11 - Other receivables
2017 2016Loans to employees 13 14Total non-current receivables 13 14
2017 2016Advances to suppliers 9 9Loans to employees 16 17Net VAT credit 3 3Other prepaid expenses 101 116Accrued income 181 124Other current receivables 202 87Total current receivables 513 356
Note 12 - Bank depositsThe Group has bank deposits totalling NOK 774 million. There are no restricted funds to cover tax owed. Tax deductions are secured bya bank guarantee (see note 16).
Note 13 - Share capital and shareholder information
Shareholders in Møller Mobility Group AS at 31 Dec. 2017 Number StakeA shares:Jan H. Møller 103 0,375 %B shares:Jan H. Møller 1 0,004 %Aars AS 24 778 90,102 %Møller MI AS 2 618 9,520 %Total 27 500 100,00 %
The share capital consists of 27,500 shares with a nominal value of NOK 1,734, in total NOK 48 million. There are two classes of share. All shares have equal voting rights. Aars AS votes for 82.3% of the shares directly and indirectly through Møller MI AS. Class A shares are guaranteed an annual dividendof NOK 5 million, collected from Møller Mobility Group AS and Møller Eiendom Holding AS.
Note 14 - Other current liabilities
2017 2016Provision for warranties and other liabilities 699 537Accrued costs and prepaid income 485 453Holiday pay and accrued salary 349 319Advances from customers 146 80Other current liabilities - 6Total other current liabilities 1 678 1 396
Note 15 - Related parties
Company Company relationship Transaction type 2017 2016Volkswagen Møller Bilfinans AS Associated company Sale of cars 4 227 3 392Total sales 4 227 3 392
Volkswagen Møller Bilfinans AS Associated company Purchase of cars 1 587 1 061Møller Eiendom Associated group Rent costs 187 165Total purchases 1 774 1 226
Volkswagen Møller Bilfinans AS Associated company Outstanding at 31 Dec. 150 128Aars AS Parent Outstanding at 31 Dec. 183 147
Note 16 - Pledges, guarantees and commitments
2017 2016Fixtures 45 42Accounts receivable and stock 458 532Total carrying amount of assets with encumbrances 503 574
Guarantees 2017 2016Repurchase agreements for cars 7 063 6 646Vehicle import duty, Customs Region Oslo and Akershus 135 135Withholding tax 115 111Employees 8 5
Note 17 - Share capital
2017 Majority Minorities TotalEquity at 1 Jan. 2017 2 880 53 2 934Profit/(loss) for the year 852 9 861Annual dividend (578) (6) (584)Group contributions (22) - (22)Currency translation differences this year, etc. 36 - 36Equity at 31 Dec. 2017 3 169 56 3 225* Includes an additional dividend of NOK 400 million
Accumulated translation differences at 31 December 2017 amounted to NOK 97 million.
2016 Majority Minorities TotalEquity at 1 Jan. 2016 2 580 44 2 624Profit/(loss) for the year 897 15 912Annual dividend* (548) (6) (554)Group contributions (7) - (7)Currency translation differences this year, etc. (40) - (40)Equity at 31 Dec. 2016 2 881 53 2 934* Includes an additional dividend of NOK 390 million
Møller Mobility Group AS has a committed credit facility totalling NOK 1,000 million. Subsidiaries that comprise more than 80% of the gross turnover and equity in the Group are guarantors. At 31 December 2017 no withdrawals had been made from this facility. In addition, Møller Mobility Group also has an overdraft facility of NOK 100 million for Norway and Sweden, which is secured through joint and several liability (group account scheme). At 31 December 2017 no withdrawals had been made from this facility either. The Group's company in Latvia has an overdraft facility of EUR 4 million, which is also secured by a guarantee from Møller Mobility Group. At 31 December 2017, EUR 3.5 million of this facility had been drawn. The companies in Latvia have an overdraft facility of EUR 9.5 million, on which EUR 3 million had been drawn at 31 December 2017.
The guarantees for employees concern shareholders in Møller MI AS who have loans in Nordea that amounted to NOK 8 million at 31 December 2017. The guarantee is secured by collateral in shares. The Group companies included in the joint registration of VAT have joint and several liability for any debt. At 31 December 2017 Møller Mobility Group AS owes NOK 513 million in VAT, via the joint registration registered in Aars AS.
In 2014 the Group's companies in Latvia were imposed a corporate fine totalling EUR 7 million because of alleged price-fixing. Møller Mobility Group strongly disagrees with the grounds for the fine and holds that the fine is disproportionate and discriminatory in relation to the alleged violations. The case has been brought before the Latvian courts, and the trial started in January 2016. A ruling is expected in 2018. No provisions have been made for this in the financial statements for 2017.

47 Annual report 2017 Group Finances 2017 MMG AS Finances 2017 CSR report 2017
Note 15 - Related parties
Company Company relationship Transaction type 2017 2016Volkswagen Møller Bilfinans AS Associated company Sale of cars 4 227 3 392Total sales 4 227 3 392
Volkswagen Møller Bilfinans AS Associated company Purchase of cars 1 587 1 061Møller Eiendom Associated group Rent costs 187 165Total purchases 1 774 1 226
Volkswagen Møller Bilfinans AS Associated company Outstanding at 31 Dec. 150 128Aars AS Parent Outstanding at 31 Dec. 183 147
Note 16 - Pledges, guarantees and commitments
2017 2016Fixtures 45 42Accounts receivable and stock 458 532Total carrying amount of assets with encumbrances 503 574
Guarantees 2017 2016Repurchase agreements for cars 7 063 6 646Vehicle import duty, Customs Region Oslo and Akershus 135 135Withholding tax 115 111Employees 8 5
Note 17 - Share capital
2017 Majority Minorities TotalEquity at 1 Jan. 2017 2 880 53 2 934Profit/(loss) for the year 852 9 861Annual dividend (578) (6) (584)Group contributions (22) - (22)Currency translation differences this year, etc. 36 - 36Equity at 31 Dec. 2017 3 169 56 3 225* Includes an additional dividend of NOK 400 million
Accumulated translation differences at 31 December 2017 amounted to NOK 97 million.
2016 Majority Minorities TotalEquity at 1 Jan. 2016 2 580 44 2 624Profit/(loss) for the year 897 15 912Annual dividend* (548) (6) (554)Group contributions (7) - (7)Currency translation differences this year, etc. (40) - (40)Equity at 31 Dec. 2016 2 881 53 2 934* Includes an additional dividend of NOK 390 million
Møller Mobility Group AS has a committed credit facility totalling NOK 1,000 million. Subsidiaries that comprise more than 80% of the gross turnover and equity in the Group are guarantors. At 31 December 2017 no withdrawals had been made from this facility. In addition, Møller Mobility Group also has an overdraft facility of NOK 100 million for Norway and Sweden, which is secured through joint and several liability (group account scheme). At 31 December 2017 no withdrawals had been made from this facility either. The Group's company in Latvia has an overdraft facility of EUR 4 million, which is also secured by a guarantee from Møller Mobility Group. At 31 December 2017, EUR 3.5 million of this facility had been drawn. The companies in Latvia have an overdraft facility of EUR 9.5 million, on which EUR 3 million had been drawn at 31 December 2017.
The guarantees for employees concern shareholders in Møller MI AS who have loans in Nordea that amounted to NOK 8 million at 31 December 2017. The guarantee is secured by collateral in shares. The Group companies included in the joint registration of VAT have joint and several liability for any debt. At 31 December 2017 Møller Mobility Group AS owes NOK 513 million in VAT, via the joint registration registered in Aars AS.
In 2014 the Group's companies in Latvia were imposed a corporate fine totalling EUR 7 million because of alleged price-fixing. Møller Mobility Group strongly disagrees with the grounds for the fine and holds that the fine is disproportionate and discriminatory in relation to the alleged violations. The case has been brought before the Latvian courts, and the trial started in January 2016. A ruling is expected in 2018. No provisions have been made for this in the financial statements for 2017.

48 Annual report 2017 Group Finances 2017 MMG AS Finances 2017 CSR report 2017
Note 18 - Debt, financing and financial risk
2017 2016Withdrawals from committed credit facilities - 300Overdraft 64 72Total current interest-bearing liabilities 64 372
Bond issue 800 600Arrangement costs (3) (3)Total bond issue 797 597Other long-term interest-bearing liabilities 17 16Total non-current interest-bearing liabilities 815 613
MaturityDue in less than 2 years 64 372Due in 2-5 years 815 613Total 878 985
Key figuresUnused committed credit facilities 1 168 860
Current liabilitiesMøller Mobility Group has a committed credit facility of NOK 1,000 million that runs to 2021. The credit facilities are not secured, but all significant companies in Møller Mobility Group are jointly and severally liable for the liabilities. Møller Mobility Group AS is the registered borrower. At 31 December 2017 no withdrawals had been made from this facility. There are requirements (covenants) concerning financial key figures in the contract, linked to equity and cash flow, which are fulfilled at the end of the year. These liabilities are classified as current liabilities since all withdrawals from the facility will be of a short-term nature. For further information, see note 16.
Non-current liabilitiesMøller Mobility Group has long-term financing through two bond issues of together NOK 1,000 million, of which NOK 200 million is owned by the company itself. These bonds will mature in November 2019 and March 2022. The bond issue is not secured, but is coordinated with the syndicated bank loan in terms of joint and several liability within the Group, and has the same equity ratio requirements.
Financial riskThe Group has companies involved in selling, financing and servicing cars. The Group's activities involve financial risk associated with currency, rates, credit and liquidity. The Group manages risk with the objective of ensuring predictable cash flows and sufficient liquidity to meet natural fluctuations in working capital.
Currency riskThe Group sells products in local currency. In Norway, the Group is exposed to short-term currency risk relating to imports of products in EUR. Car manufacturers bear significant long-term currency risk through agreements. Short-term currency risk is hedged in the spot and forwards market. The forward contracts are market-assessed (mark-to-market) and the value is recorded as foreign exchange gains at year-end. Unrealised exchange losses of NOK 2.4 million were recognised in the income statement at year-end.
In addition the Group has currency risk associated with the Swedish and Baltic companies. The risks are mitigated by having local external liabilities in the local currency. Møller Mobility Group does not generally hedge equity in foreign companies, but does strive to secure the expected dividend with a horizon of one year. Møller Mobility Group's total secured amount at year-end was SEK 42 million and EUR 3.6 million.Unrealised exchange losses amounted to NOK 2.2 million at year-end.
Interest rate riskMøller Mobility Group is largely financed through a long-term bond issue with a floating interest rate. This entails a risk related to developments in interest costs. This risk is partially hedged by a portion of the debt being swapped to fixed interest rates through interest rate swaps. At 31 December 2017 the Group had interest rate swap agreements of NOK 400 million with a fixed interest rate of 2.2% and a remaining term matching the underlying loans. The interest swap agreements hedge 50% of the interest costs related to the bond issue at year-end. The date for determining the liquid element in the hedging contract is adapted according to the rollover of the underlying loans. The agreements were signed with a view to running until maturity. In light of this, Møller Mobility Group has chosen to record the agreements as hedge agreements, which means that ongoing changes in market value are not recorded in the income statement. At the balance sheet date, the market value of the contract was positive in the amount of NOK 1.4 million.
Credit riskA significant part of the Group's turnover is cash-based. There will be a temporary credit risk associated with sales by importer companies to external dealers and in cases where cars or workshop services are sold on credit. The risks are hedged with tight credit procedures and close monitoring of outstanding accounts receivable. Historically, losses have been low.
Liquidity riskThe Group operates in a cyclical industry with relatively large fluctuations in working capital. There is therefore a risk associated with short-term access to liquidity. This is hedged by having flexible and committed framework financing of NOK 1,000 million where withdrawals are regulated according to need.
Buy back agreementsThe Group has risk associated with buy back agreements. Total buy back agreement liabilities were NOK 7 billion at 31 December 2017. The risk is associated with future market prices for used cars. The risk is hedged through certain procedures for entering contracts and returning cars. A continuous assessment of the liabilities is conducted, and provisions are made for any anticipated losses.
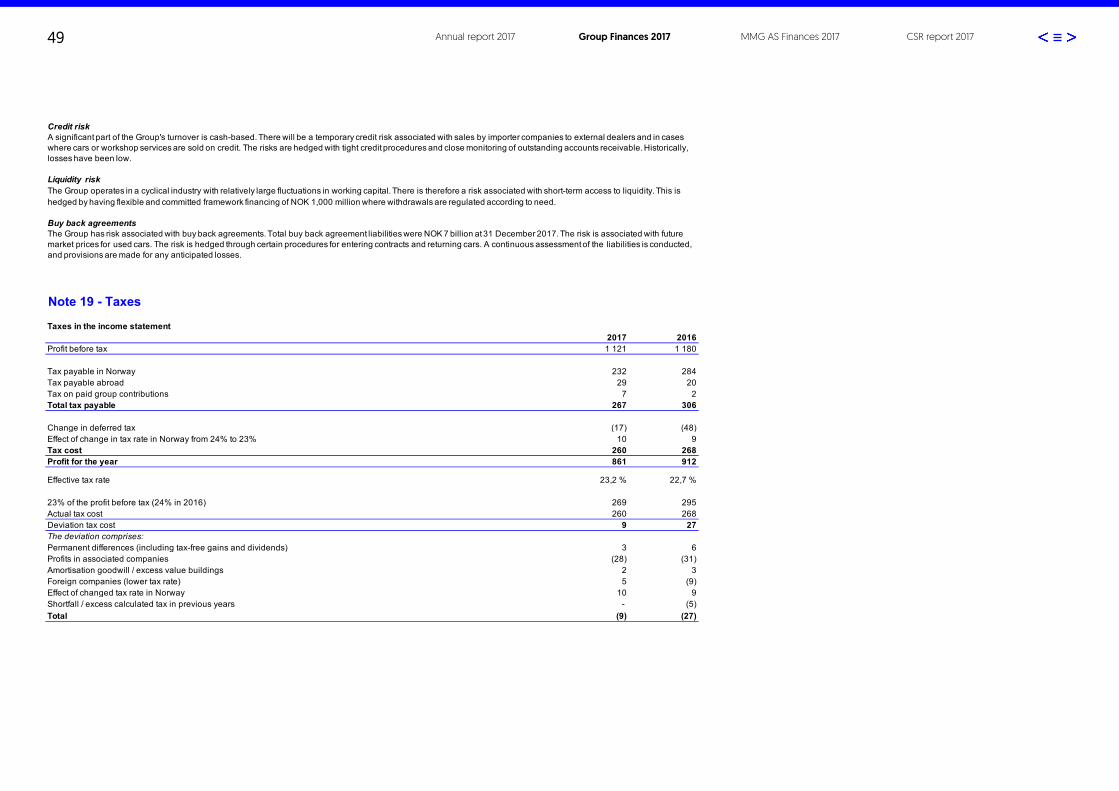
49 Annual report 2017 Group Finances 2017 MMG AS Finances 2017 CSR report 2017
Note 19 - Taxes
Taxes in the income statement 2017 2016
Profit before tax 1 121 1 180
Tax payable in Norway 232 284Tax payable abroad 29 20Tax on paid group contributions 7 2Total tax payable 267 306
Change in deferred tax (17) (48)Effect of change in tax rate in Norway from 24% to 23% 10 9Tax cost 260 268Profit for the year 861 912
Effective tax rate 23,2 % 22,7 %
23% of the profit before tax (24% in 2016) 269 295Actual tax cost 260 268Deviation tax cost 9 27The deviation comprises:Permanent differences (including tax-free gains and dividends) 3 6Profits in associated companies (28) (31)Amortisation goodwill / excess value buildings 2 3Foreign companies (lower tax rate) 5 (9)Effect of changed tax rate in Norway 10 9Shortfall / excess calculated tax in previous years - (5)Total (9) (27)
Tax on balance sheet
The calculation of deferred tax takes into account the following temporary differences: 2017 2016Accounts receivable and other receivables 6 6Stock 276 285Tangible fixed assets (74) (48)Current and non-current liabilities 739 691Pensions 16 15Deferred losses - 18Latent dividend tax – Estonia (61) (57)Total deferred tax 903 908
Norway 23% 240 223Sweden 22% (18) (11)Lithuania and Latvia 15% 1 13Estonia 20% (13) (11)Net deferred tax 210 214
Deferred tax asset on balance sheet 243 238Deferred tax liability on balance sheet (33) (24)Carrying amount net deferred tax 210 214Deferred tax is included on the balance sheet as net within the various tax groups.
Change in deferred tax on the balance sheet is arrived at as follows: Deferred tax at 1 Jan. 214 180Additions / disposals acquired / sold companies 1 1Deferred tax linked to internal profits in AC during the year* (13) (16)Year's recognised change in deferred tax 7 38Tax paid on dividends from Estonia 2 10Net deferred tax at 31 Dec. 210 213* Deferred tax linked to internal profits in AC (associated companies) is recognised on the balance sheet as part of the investment.
The tax payable on the balance sheet is arrived at as follows:Tax payable on the income statement 267 306Prepaid tax abroad (23) (11)Tax on paid group contributions (7) (2)Tax payable owed 238 293
The income tax rates in Norway, Sweden, Lithuania and Latvia in 2017 were 24%, 22%, 15% and 15%, respectively. From 2018, the tax rate in Norway will be 23%. Estonia does not have income tax; it has dividend tax. Latent tax has been allocated for dividends.
Note 18 - Debt, financing and financial risk
2017 2016Withdrawals from committed credit facilities - 300Overdraft 64 72Total current interest-bearing liabilities 64 372
Bond issue 800 600Arrangement costs (3) (3)Total bond issue 797 597Other long-term interest-bearing liabilities 17 16Total non-current interest-bearing liabilities 815 613
MaturityDue in less than 2 years 64 372Due in 2-5 years 815 613Total 878 985
Key figuresUnused committed credit facilities 1 168 860
Current liabilitiesMøller Mobility Group has a committed credit facility of NOK 1,000 million that runs to 2021. The credit facilities are not secured, but all significant companies in Møller Mobility Group are jointly and severally liable for the liabilities. Møller Mobility Group AS is the registered borrower. At 31 December 2017 no withdrawals had been made from this facility. There are requirements (covenants) concerning financial key figures in the contract, linked to equity and cash flow, which are fulfilled at the end of the year. These liabilities are classified as current liabilities since all withdrawals from the facility will be of a short-term nature. For further information, see note 16.
Non-current liabilitiesMøller Mobility Group has long-term financing through two bond issues of together NOK 1,000 million, of which NOK 200 million is owned by the company itself. These bonds will mature in November 2019 and March 2022. The bond issue is not secured, but is coordinated with the syndicated bank loan in terms of joint and several liability within the Group, and has the same equity ratio requirements.
Financial riskThe Group has companies involved in selling, financing and servicing cars. The Group's activities involve financial risk associated with currency, rates, credit and liquidity. The Group manages risk with the objective of ensuring predictable cash flows and sufficient liquidity to meet natural fluctuations in working capital.
Currency riskThe Group sells products in local currency. In Norway, the Group is exposed to short-term currency risk relating to imports of products in EUR. Car manufacturers bear significant long-term currency risk through agreements. Short-term currency risk is hedged in the spot and forwards market. The forward contracts are market-assessed (mark-to-market) and the value is recorded as foreign exchange gains at year-end. Unrealised exchange losses of NOK 2.4 million were recognised in the income statement at year-end.
In addition the Group has currency risk associated with the Swedish and Baltic companies. The risks are mitigated by having local external liabilities in the local currency. Møller Mobility Group does not generally hedge equity in foreign companies, but does strive to secure the expected dividend with a horizon of one year. Møller Mobility Group's total secured amount at year-end was SEK 42 million and EUR 3.6 million.Unrealised exchange losses amounted to NOK 2.2 million at year-end.
Interest rate riskMøller Mobility Group is largely financed through a long-term bond issue with a floating interest rate. This entails a risk related to developments in interest costs. This risk is partially hedged by a portion of the debt being swapped to fixed interest rates through interest rate swaps. At 31 December 2017 the Group had interest rate swap agreements of NOK 400 million with a fixed interest rate of 2.2% and a remaining term matching the underlying loans. The interest swap agreements hedge 50% of the interest costs related to the bond issue at year-end. The date for determining the liquid element in the hedging contract is adapted according to the rollover of the underlying loans. The agreements were signed with a view to running until maturity. In light of this, Møller Mobility Group has chosen to record the agreements as hedge agreements, which means that ongoing changes in market value are not recorded in the income statement. At the balance sheet date, the market value of the contract was positive in the amount of NOK 1.4 million.
Credit riskA significant part of the Group's turnover is cash-based. There will be a temporary credit risk associated with sales by importer companies to external dealers and in cases where cars or workshop services are sold on credit. The risks are hedged with tight credit procedures and close monitoring of outstanding accounts receivable. Historically, losses have been low.
Liquidity riskThe Group operates in a cyclical industry with relatively large fluctuations in working capital. There is therefore a risk associated with short-term access to liquidity. This is hedged by having flexible and committed framework financing of NOK 1,000 million where withdrawals are regulated according to need.
Buy back agreementsThe Group has risk associated with buy back agreements. Total buy back agreement liabilities were NOK 7 billion at 31 December 2017. The risk is associated with future market prices for used cars. The risk is hedged through certain procedures for entering contracts and returning cars. A continuous assessment of the liabilities is conducted, and provisions are made for any anticipated losses.

50 Annual report 2017 Group Finances 2017 MMG AS Finances 2017 CSR report 2017
Note 19 - Taxes
Taxes in the income statement 2017 2016
Profit before tax 1 121 1 180
Tax payable in Norway 232 284Tax payable abroad 29 20Tax on paid group contributions 7 2Total tax payable 267 306
Change in deferred tax (17) (48)Effect of change in tax rate in Norway from 24% to 23% 10 9Tax cost 260 268Profit for the year 861 912
Effective tax rate 23,2 % 22,7 %
23% of the profit before tax (24% in 2016) 269 295Actual tax cost 260 268Deviation tax cost 9 27The deviation comprises:Permanent differences (including tax-free gains and dividends) 3 6Profits in associated companies (28) (31)Amortisation goodwill / excess value buildings 2 3Foreign companies (lower tax rate) 5 (9)Effect of changed tax rate in Norway 10 9Shortfall / excess calculated tax in previous years - (5)Total (9) (27)
Tax on balance sheet
The calculation of deferred tax takes into account the following temporary differences: 2017 2016Accounts receivable and other receivables 6 6Stock 276 285Tangible fixed assets (74) (48)Current and non-current liabilities 739 691Pensions 16 15Deferred losses - 18Latent dividend tax – Estonia (61) (57)Total deferred tax 903 908
Norway 23% 240 223Sweden 22% (18) (11)Lithuania and Latvia 15% 1 13Estonia 20% (13) (11)Net deferred tax 210 214
Deferred tax asset on balance sheet 243 238Deferred tax liability on balance sheet (33) (24)Carrying amount net deferred tax 210 214Deferred tax is included on the balance sheet as net within the various tax groups.
Change in deferred tax on the balance sheet is arrived at as follows: Deferred tax at 1 Jan. 214 180Additions / disposals acquired / sold companies 1 1Deferred tax linked to internal profits in AC during the year* (13) (16)Year's recognised change in deferred tax 7 38Tax paid on dividends from Estonia 2 10Net deferred tax at 31 Dec. 210 213* Deferred tax linked to internal profits in AC (associated companies) is recognised on the balance sheet as part of the investment.
The tax payable on the balance sheet is arrived at as follows:Tax payable on the income statement 267 306Prepaid tax abroad (23) (11)Tax on paid group contributions (7) (2)Tax payable owed 238 293
The income tax rates in Norway, Sweden, Lithuania and Latvia in 2017 were 24%, 22%, 15% and 15%, respectively. From 2018, the tax rate in Norway will be 23%. Estonia does not have income tax; it has dividend tax. Latent tax has been allocated for dividends.

51 Annual report 2017 Group Finances 2017 MMG AS Finances 2017 CSR report 2017
Note 20 - Significant transactions in the financial year Transactions in 2017Møller Mobility Group has not had any significant transactions in 2017.
Transactions in 2016
This transaction had the following effect on the consolidated financial statements at 31 December 2016: Sales Added value Total
Cash 12 12 Accounts receivable 8 8 Business assets 37 17 54 Stock 34 34 Other assets 2 2 Accounts payable (12) (12)Other interest-free liabilities (17) (17)Interest-bearing liabilities (27) (27)Net identifiable assets 38 17 55
Goodwill 2 2Sales sum 38 19 57
Paid in cash 57Acquired cash 12Net cash out 45
On 20 October 2016 Møller Mobility Group bought 100% of the shares in Orkdal Bil AS and Orkdal Eiendom AS, and 52% of the shares in Bilsenteret Bjugn AS.
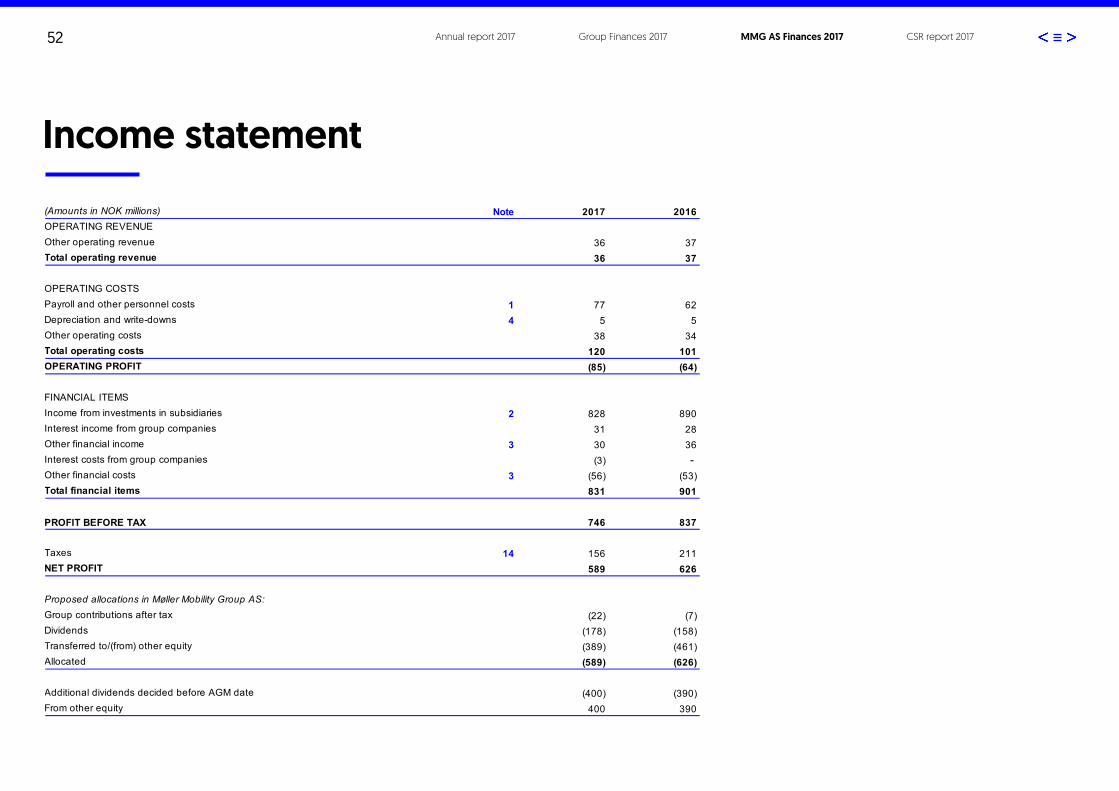
52 Annual report 2017 Group Finances 2017 MMG AS Finances 2017 CSR report 2017
Income statementINCOME STATEMENT MØLLER MOBILITY GROUP AS
(Amounts in NOK millions) Note 2017 2016OPERATING REVENUEOther operating revenue 36 37Total operating revenue 36 37
OPERATING COSTSPayroll and other personnel costs 1 77 62Depreciation and write-downs 4 5 5Other operating costs 38 34Total operating costs 120 101OPERATING PROFIT (85) (64)
FINANCIAL ITEMSIncome from investments in subsidiaries 2 828 890Interest income from group companies 31 28Other financial income 3 30 36Interest costs from group companies (3) - Other financial costs 3 (56) (53)Total financial items 831 901
PROFIT BEFORE TAX 746 837
Taxes 14 156 211NET PROFIT 589 626
Proposed allocations in Møller Mobility Group AS:Group contributions after tax (22) (7)Dividends (178) (158)Transferred to/(from) other equity (389) (461)Allocated (589) (626)
Additional dividends decided before AGM date (400) (390)From other equity 400 390

53 Annual report 2017 Group Finances 2017 MMG AS Finances 2017 CSR report 2017
AssetsMØLLERGRUPPEN AS' ASSETS AT 31 DEC.
(Amounts in NOK millions) Note 2017 2016ASSETSIntangible assets 4 11 13Total intangible assets 11 13
Tangible fixed assets 4 30 24
Investments in subsidiaries 5 598 558Investments in associated companies 6 644 571Investments in shares 1 1Group receivables 8 1 331 1 220Other receivables 5 6Total financial fixed assets 2 579 2 355
TOTAL FIXED ASSETS 2 620 2 391
Other receivables 7 7Group receivables 8 752 891Total receivables 760 898
Cash and cash equivalents 10 703 7
TOTAL CURRENT ASSETS 1 462 905
TOTAL ASSETS 4 083 3 296

54 Annual report 2017 Group Finances 2017 MMG AS Finances 2017 CSR report 2017
Equity and liabilitiesEQUITY AND LIABILITIES MØLLER MOBILITY GROUP AS AT 31 DEC
(Amounts in NOK millions) Note 2017 2016EQUITYShare capital 48 48Other paid-in equity 1 1Other equity 1 884 1 901TOTAL EQUITY 12 1 933 1 950
LIABILITIESPension liabilities 7 2 1Total provisions for liabilities 2 1
Bond loans 797 597Liabilities to group companies 8 907 20Other non-current liabilities 17 16Total non-current liabilities 1 721 632
Liabilities to financial institutions - 300Accounts payable 5 4Tax payable 14 141 205Public duties payable 3 4Dividends and group contributions 8 207 167Other current liabilities 29 24Liabilities to group companies 8 42 9Total current liabilities 426 713
TOTAL LIABILITIES 2 150 1 346
TOTAL EQUITY AND LIABILITIES 4 083 3 296
....................................Harald Møller
Chairman of the Board
....................................Jacob SchramBoard member
...........................................Øyvind Schage Førde
Board member
..........................................Kristin Solheim Genton
Board member
....................................Jon Morten Møller
Board member
....................................Jan Tellef Thorleifsson
Board member
...................................Terje Male
CEO
Oslo, 26 April 2018The Board of Directors of Møller Mobility Group AS
I styret i Møller Mobility Group ASOslo, 26. april 2018
Harald A. MøllerChairman of the Board
Øyvind Schage FørdeBoard member
Jon Morten MøllerBoard member
Jacob SchramBoard member
Kristin Solheim GentonBoard member
Jan Tellef ThorleifssonBoard member
Terje MaleCEO

55 Annual report 2017 Group Finances 2017 MMG AS Finances 2017 CSR report 2017
Cash flow statementCASH FLOW STATEMENT MØLLER MOBILITY GROUP AS
(Amounts in NOK millions) 2017 2016CASH FLOW FROM OPERATIONSOrdinary profit before tax 746 837Recognised dividends / group contributions 2 (828) (890)Gains from sale of fixed assets / companies 1 -Depreciation 4 5 5Taxes paid during the period (205) (1)Change in accounts receivable and payables 1 3Change in intra-group receivables / liabilities 759 (79)Change in other items - 14Net cash flow from operations 478 (111)
CASH FLOW FROM INVESTMENTSInvestment in tangible fixed assets (19) (14)Sales of tangible fixed assets 8 9Investments in subsidiaries (11) -Capital contributions in AC shares (74) -Received dividends / group contributions 986 631Net cash flow from investments 892 627
CASH FLOW FROM FINANCINGGroup contributions paid (17) (18)Annual dividend (158) (351)Additional dividends (400) (390)Payment / repayment of private long-term borrowings 1 4New / repayment of long-term debt (100) 298Net cash flow from financing (673) (457)
Net change in cash and cash equivalents during year 696 58Cash reserve at 1 Jan. 7 (52)Cash reserve at 31 Dec. 703 7
Specification of cash reserve at 31 Dec.Means of payment 10 703 7Cash reserve at 31 Dec. 703 7

56 Annual report 2017 Group Finances 2017 MMG AS Finances 2017 CSR report 2017
NOTES MØLLER MOBILITY GROUP AS
All figures are in NOK millions.
Note 1 - Payroll and other personnel costs
2017 2016Salaries 53 48Employer's NI contributions 8 7Pension costs 2 2Other personnel costs 12 5Total payroll and other personnel costs 77 62
Average number of employees 25 23Loans to employees 1 1
Loans to employees are mainly interest-bearing car loans where the company has security in a car. The interest rate on these loans is 2.5%. For information about the remuneration of senior executives, including the salary of the CEO of Møller Mobility Group, see note 2 to the consolidated financial statements.
Remuneration to the auditors in 2017 amounted to NOK 412,900 for auditing and NOK 603,060 for audit-related assistance. All amounts are stated exclusive of VAT.
Note 2 - Income from investments in subsidiaries
2017 2016Harald A. Møller AS 610 620Møller Bil AS 122 270SE Moller Baltic Import 47 - Møller Bil Holding AB 49 - Total income from investments in subsidiaries 828 890
Note 3 - Other financial income and financial costs
2017 2016Currency gains 28 34Other financial income 2 2Total other financial income 30 36
Currency losses 32 33Other financial costs 24 20Total other financial costs 56 53
Note 4 - Tangible fixed assets and intangible assets
Tangible Intangible Totalfixed assets* assets
Acquisition cost at 1 Jan. 26 16 42Additions 19 - 19Disposals (12) - (12)Acquisition cost at 31 Dec. 33 16 49Accumulated depreciation at 1 Jan. 2 3 5Year's depreciation and write-downs 3 2 5Disposals (2) - (2)Depreciated at 31 Dec. 3 5 8Carrying amount at 31 Dec. 30 11 41
Straight line depreciation plan 3-7 years 3-10 years* Cars, fixtures and furnishings
Notes

57 Annual report 2017 Group Finances 2017 MMG AS Finances 2017 CSR report 2017
NOTES MØLLER MOBILITY GROUP AS
All figures are in NOK millions.
Note 1 - Payroll and other personnel costs
2017 2016Salaries 53 48Employer's NI contributions 8 7Pension costs 2 2Other personnel costs 12 5Total payroll and other personnel costs 77 62
Average number of employees 25 23Loans to employees 1 1
Loans to employees are mainly interest-bearing car loans where the company has security in a car. The interest rate on these loans is 2.5%. For information about the remuneration of senior executives, including the salary of the CEO of Møller Mobility Group, see note 2 to the consolidated financial statements.
Remuneration to the auditors in 2017 amounted to NOK 412,900 for auditing and NOK 603,060 for audit-related assistance. All amounts are stated exclusive of VAT.
Note 2 - Income from investments in subsidiaries
2017 2016Harald A. Møller AS 610 620Møller Bil AS 122 270SE Moller Baltic Import 47 - Møller Bil Holding AB 49 - Total income from investments in subsidiaries 828 890
Note 3 - Other financial income and financial costs
2017 2016Currency gains 28 34Other financial income 2 2Total other financial income 30 36
Currency losses 32 33Other financial costs 24 20Total other financial costs 56 53
Note 4 - Tangible fixed assets and intangible assets
Tangible Intangible Totalfixed assets* assets
Acquisition cost at 1 Jan. 26 16 42Additions 19 - 19Disposals (12) - (12)Acquisition cost at 31 Dec. 33 16 49Accumulated depreciation at 1 Jan. 2 3 5Year's depreciation and write-downs 3 2 5Disposals (2) - (2)Depreciated at 31 Dec. 3 5 8Carrying amount at 31 Dec. 30 11 41
Straight line depreciation plan 3-7 years 3-10 years* Cars, fixtures and furnishings
Note 5 - Investments in subsidiariesBusiness Stake/ Equity Carrying
office voting 31.12.2017 amountCompany name rightsHarald A. Møller AS Oslo 100 % 431 653 330Møller Bil AS Oslo 100 % 503 197 109Møller IT AS Oslo 100 % 108 (30) 51Möller Bil Holding AB Oslo 100 % 112 (6) 87Møller Synergi AS Oslo 100 % 4 - 9Møller Bil Klargjøring AS Oslo 100 % 11 1 12Total investments in subsidiaries 1 169 815 598* Includes dividends received / group contributions from subsidiaries totalling NOK 192 million.
The above table only shows shares owned directly by Møller Mobility Group AS. In total, the Group consists of 41 companies directly and indirectly ownedby Møller Mobility Group AS.
Note 6 - Investments in associated companies
Voting Equity Profit/(loss) Carryingrights/ in company after tax amount
Company name stake 31.12.2017 2017 31.12.2017Volkswagen Møller Bilfinans AS, Oslo 49,0 % 2 373 117 644Total investments in associated companies 2 373 117 644
The share of the profit/(loss) is not incorporated into the company financial statements; it is only incorporated into the consolidated financial statements of Møller Mobility Group.
Note 7 - Pensions
Pension costs 2017 2016Defined-contribution pension 2 2Pension costs 2 2
Carrying amount net pension obligations Calculated pension liabilities (2) (1)Net carrying amount pension liabilities (2) (1)
Number of people covered by all pension plans 27 24
Financial assumptionsReturn on pension assets 0,0 % 0,0 %Discount rate 2,3 % 2,1 %Annual salary growth / annual G adjustment 0,0 % 2,3 %
All pension liabilities include the employers' National Insurance contribution.
Profit/(loss) for the year 2017
The company currently has a defined-contribution pension that has been adapted to comply with the new Act on occupational pensions. The defined-contribution pension is covered by the company through ongoing payments to an insurance company. The company has no further obligations beyond this.
The company is affiliated with the contractual early retirement scheme (the "AFP" scheme) through the Norwegian Federation of Trade Unions (LO) and the Confederation of Norwegian Enterprise (NHO). The new AFP scheme is a defined-benefit, multi-employer pension plan, and since the assets cannot be attributed to individual members, the scheme is treated as a defined-contribution pension scheme in the financial statements, and future obligations are not recognised on the balance sheet.The remaining pension liabilities in the balance sheet relate to a handful of unfunded pensions paid through operations.
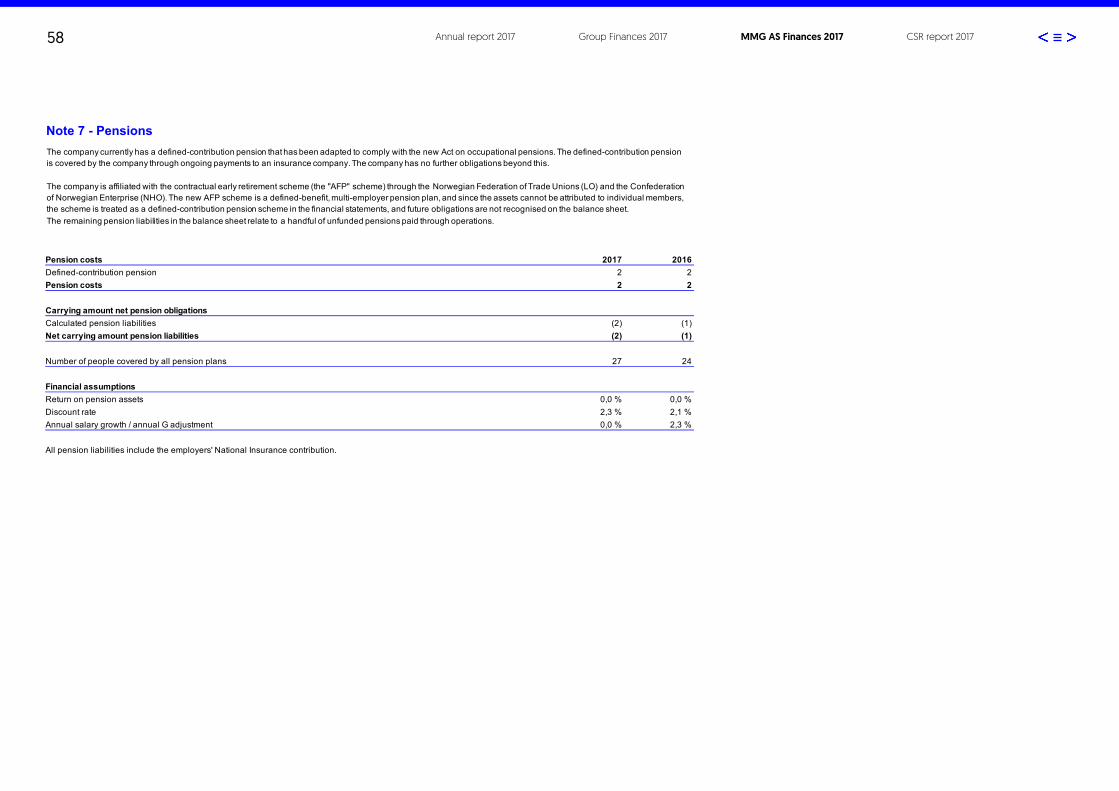
58 Annual report 2017 Group Finances 2017 MMG AS Finances 2017 CSR report 2017
Note 5 - Investments in subsidiariesBusiness Stake/ Equity Carrying
office voting 31.12.2017 amountCompany name rightsHarald A. Møller AS Oslo 100 % 431 653 330Møller Bil AS Oslo 100 % 503 197 109Møller IT AS Oslo 100 % 108 (30) 51Möller Bil Holding AB Oslo 100 % 112 (6) 87Møller Synergi AS Oslo 100 % 4 - 9Møller Bil Klargjøring AS Oslo 100 % 11 1 12Total investments in subsidiaries 1 169 815 598* Includes dividends received / group contributions from subsidiaries totalling NOK 192 million.
The above table only shows shares owned directly by Møller Mobility Group AS. In total, the Group consists of 41 companies directly and indirectly ownedby Møller Mobility Group AS.
Note 6 - Investments in associated companies
Voting Equity Profit/(loss) Carryingrights/ in company after tax amount
Company name stake 31.12.2017 2017 31.12.2017Volkswagen Møller Bilfinans AS, Oslo 49,0 % 2 373 117 644Total investments in associated companies 2 373 117 644
The share of the profit/(loss) is not incorporated into the company financial statements; it is only incorporated into the consolidated financial statements of Møller Mobility Group.
Note 7 - Pensions
Pension costs 2017 2016Defined-contribution pension 2 2Pension costs 2 2
Carrying amount net pension obligations Calculated pension liabilities (2) (1)Net carrying amount pension liabilities (2) (1)
Number of people covered by all pension plans 27 24
Financial assumptionsReturn on pension assets 0,0 % 0,0 %Discount rate 2,3 % 2,1 %Annual salary growth / annual G adjustment 0,0 % 2,3 %
All pension liabilities include the employers' National Insurance contribution.
Profit/(loss) for the year 2017
The company currently has a defined-contribution pension that has been adapted to comply with the new Act on occupational pensions. The defined-contribution pension is covered by the company through ongoing payments to an insurance company. The company has no further obligations beyond this.
The company is affiliated with the contractual early retirement scheme (the "AFP" scheme) through the Norwegian Federation of Trade Unions (LO) and the Confederation of Norwegian Enterprise (NHO). The new AFP scheme is a defined-benefit, multi-employer pension plan, and since the assets cannot be attributed to individual members, the scheme is treated as a defined-contribution pension scheme in the financial statements, and future obligations are not recognised on the balance sheet.The remaining pension liabilities in the balance sheet relate to a handful of unfunded pensions paid through operations.

59 Annual report 2017 Group Finances 2017 MMG AS Finances 2017 CSR report 2017
Note 8 - Balances with companies in the Aars Group
2017 2016Møller Bil Norge 1 179 1 099Harald A. Møller 14 - Møller Bil Sverige 126 113Moller Auto Baltic 12 9Total non-current receivables 1 331 1 220
The receivables consist of operating capital and loans to group companies (group account scheme). The receivables are long-term financing of subsidiaries and have no specified repayment structure. The items must, in their entirety, be regarded as continuing for more than one year after the closure of the financial year.
2017 2016Bank deposits in subsidiaries (group account scheme) 907 20Total non-current liabilities 907 20
2017 2016Receivables from group companies – dividends / group contributions 732 890Accounts receivable group 2 1Other receivables group 19 - Total current receivables 752 891
2017 2016Outstanding group contributions 29 9Dividends 178 158Total outstanding group contributions and dividends 207 167
Group contributions to group companies 38 8Accounts payable group 4 1Total current liabilities to group companies 42 9
Note 9 - Related parties
Company Company relationship Transaction type 2017 2016All subsidiaries Subsidiary Financial income 31 28All subsidiaries Subsidiary Sale of HR, IMS and administrative services 26 26Total sales 57 53
All subsidiaries Subsidiary Financial costs 3 -Møller Synergi AS Subsidiary Purchase of accounting services, etc. 1 1Harald A. Møller AS Subsidiary Purchase of IT, telephony, switchboard services 2 2Møller Bil AS Subsidiary Purchase of shares in subsidiaries 11 -Total purchases 5 1
Note 10 - Bank deposits
Møller Mobility Group AS has bank deposits totalling NOK 703 million. The company has provided guarantees for tax owed by the subsidiaries amounting to NOK 115 million.
Note 11 - Guarantees and commitments
Guarantees and commitments 2017 2016Vehicle import duty, Customs Region Oslo and Akershus 135 135Withholding tax 115 111Employees 8 5Subsidiaries of Møller Mobility Group AS in the Baltic States 133 124
The guarantees for employees concern shareholders in Møller MI AS who have loans in Nordea that amounted to NOK 8 million at 31 December 2017. The guarantee is secured by collateral in shares. Other guarantees concern the subsidiaries.

60 Annual report 2017 Group Finances 2017 MMG AS Finances 2017 CSR report 2017
Note 12 - Share capital
Share Other paid-in Other Totalcapital equity equity
Equity at 1 Jan. 2017 48 1 1 901 1 950Group contributions paid - - (22) (22)Additional dividends - - (400) (400)Profit/(loss) for the year - - 589 589Currency hedging of equity in foreign subsidiaries (6) (6)Allocated to dividend - - (178) (178)Equity at 31 Dec. 2017 48 1 1 884 1 933
Share Other paid-in Other Totalcapital equity equity
Equity at 1 Jan. 2016 48 1 1 830 1 879Group contributions paid - - (7) (7)Additional dividends - - (390) (390)Profit/(loss) for the year - - 626 626Allocated to dividend - - (158) (158)Equity at 31 Dec. 2016 48 1 1 901 1 950
For information about share capital and shareholder information, see note 13 to the consolidated financial statements.
Note 13 - Liabilities, financing and financial risk
Current liabilities 2017 2016Withdrawals from committed credit facilities - 300Total current interest-bearing liabilities 0 300
Non-current liabilitiesBond loans 800 600Arrangement costs (3) (3)Total bond issue 797 597Other long-term interest-bearing liabilities 17 16Debt to Møller Mobility Group 907 20Total non-current interest-bearing liabilities 1 721 632
MaturityDue in less than 2 years - 300Due in 2-5 years 1 721 632Total 1 721 932
Key figuresUnused committed credit facilities 1 168 860
Møller Mobility Group AS is Møller Mobility Group's internal bank.
Note 8 - Balances with companies in the Aars Group
2017 2016Møller Bil Norge 1 179 1 099Harald A. Møller 14 - Møller Bil Sverige 126 113Moller Auto Baltic 12 9Total non-current receivables 1 331 1 220
The receivables consist of operating capital and loans to group companies (group account scheme). The receivables are long-term financing of subsidiaries and have no specified repayment structure. The items must, in their entirety, be regarded as continuing for more than one year after the closure of the financial year.
2017 2016Bank deposits in subsidiaries (group account scheme) 907 20Total non-current liabilities 907 20
2017 2016Receivables from group companies – dividends / group contributions 732 890Accounts receivable group 2 1Other receivables group 19 - Total current receivables 752 891
2017 2016Outstanding group contributions 29 9Dividends 178 158Total outstanding group contributions and dividends 207 167
Group contributions to group companies 38 8Accounts payable group 4 1Total current liabilities to group companies 42 9
Note 9 - Related parties
Company Company relationship Transaction type 2017 2016All subsidiaries Subsidiary Financial income 31 28All subsidiaries Subsidiary Sale of HR, IMS and administrative services 26 26Total sales 57 53
All subsidiaries Subsidiary Financial costs 3 -Møller Synergi AS Subsidiary Purchase of accounting services, etc. 1 1Harald A. Møller AS Subsidiary Purchase of IT, telephony, switchboard services 2 2Møller Bil AS Subsidiary Purchase of shares in subsidiaries 11 -Total purchases 5 1
Note 10 - Bank deposits
Møller Mobility Group AS has bank deposits totalling NOK 703 million. The company has provided guarantees for tax owed by the subsidiaries amounting to NOK 115 million.
Note 11 - Guarantees and commitments
Guarantees and commitments 2017 2016Vehicle import duty, Customs Region Oslo and Akershus 135 135Withholding tax 115 111Employees 8 5Subsidiaries of Møller Mobility Group AS in the Baltic States 133 124
The guarantees for employees concern shareholders in Møller MI AS who have loans in Nordea that amounted to NOK 8 million at 31 December 2017. The guarantee is secured by collateral in shares. Other guarantees concern the subsidiaries.

61 Annual report 2017 Group Finances 2017 MMG AS Finances 2017 CSR report 2017
Note 12 - Share capital
Share Other paid-in Other Totalcapital equity equity
Equity at 1 Jan. 2017 48 1 1 901 1 950Group contributions paid - - (22) (22)Additional dividends - - (400) (400)Profit/(loss) for the year - - 589 589Currency hedging of equity in foreign subsidiaries (6) (6)Allocated to dividend - - (178) (178)Equity at 31 Dec. 2017 48 1 1 884 1 933
Share Other paid-in Other Totalcapital equity equity
Equity at 1 Jan. 2016 48 1 1 830 1 879Group contributions paid - - (7) (7)Additional dividends - - (390) (390)Profit/(loss) for the year - - 626 626Allocated to dividend - - (158) (158)Equity at 31 Dec. 2016 48 1 1 901 1 950
For information about share capital and shareholder information, see note 13 to the consolidated financial statements.
Note 13 - Liabilities, financing and financial risk
Current liabilities 2017 2016Withdrawals from committed credit facilities - 300Total current interest-bearing liabilities 0 300
Non-current liabilitiesBond loans 800 600Arrangement costs (3) (3)Total bond issue 797 597Other long-term interest-bearing liabilities 17 16Debt to Møller Mobility Group 907 20Total non-current interest-bearing liabilities 1 721 632
MaturityDue in less than 2 years - 300Due in 2-5 years 1 721 632Total 1 721 932
Key figuresUnused committed credit facilities 1 168 860
Møller Mobility Group AS is Møller Mobility Group's internal bank.

62 Annual report 2017 Group Finances 2017 MMG AS Finances 2017 CSR report 2017
Note 14 - Taxes
Taxes in the income statement 2017 2016
Profit before tax 746 837
Tax payable in Norway 150 207Corrections from previous years - 1Tax on paid group contributions 7 2Total tax payable 157 210
Change in deferred tax - 1Tax cost 157 211Profit for the year 589 626
Effective tax rate 21,0 % 25,2 %
24% of the profit before tax 179 209Actual tax cost 157 211Deviation tax cost 22 (2)The deviation comprises:Permanent differences (22) (2)Gains, losses, shares and dividends - - Total (22) (2)
Tax on balance sheetThe calculation of deferred tax takes into account the following temporary differences: 2017 2016Tangible fixed assets 4 4Unrealised exchange rate losses on forward contracts (5) (3)Amortised borrowing costs 3 -Pension (2) -Total deferred tax 0 1
Norway 23% - - Net deferred tax 0 0
Change in deferred tax on the balance sheet is arrived at as follows:Deferred tax at 1 Jan. - 1Year's change in deferred tax - (1)Net deferred tax at 31 Dec. 0 0
The tax payable on the balance sheet is arrived at as follows:Tax payable on the income statement 156 210Corrections from previous years - (1)Tax on paid group contributions (16) (4)Tax payable owed (141) (205)
In 2017, income tax was 24%. This has been changed to 23% with effect from 2018.

63 Annual report 2017 Group Finances 2017 CSR report 2017MMG AS Finances 2017
Auditor’s Report Independent Auditor's Report - Møller Mobility Group AS
(2)
Other information
Management is responsible for the other information. The other information comprises the Board of Directors’ report and statement on Corporate Social Responsibility and list of key statistics, but does not include the financial statements and our auditor's report thereon.
Our opinion on the financial statements does not cover the other information and we do not express any form of assurance conclusion thereon.
In connection with our audit of the financial statements, our responsibility is to read the other information and, in doing so, consider whether the other information is materially inconsistent with the financial statements or our knowledge obtained in the audit or otherwise appears to be materially misstated.
If, based on the work we have performed, we conclude that there is a material misstatement of this other information, we are required to report that fact. We have nothing to report in this regard.
Responsibilities of the Board of Directors and the Managing Director for the Financial Statements
The Board of Directors and the Managing Director (management) are responsible for the preparation in accordance with law and regulations, including fair presentation of the financial statements in accordance with the Norwegian Accounting Act and accounting standards and practices generally accepted in Norway, and for such internal control as management determines is necessary to enable the preparation of financial statements that are free from material misstatement, whether due to fraud or error.
In preparing the financial statements, management is responsible for assessing the Company’s and the Group’s ability to continue as a going concern, disclosing, as applicable, matters related to going concern. The financial statements use the going concern basis of accounting insofar as it is not likely that the enterprise will cease operations.
Auditor’s Responsibilities for the Audit of the Financial Statements
Our objectives are to obtain reasonable assurance about whether the financial statements as a whole are free from material misstatement, whether due to fraud or error, and to issue an auditor’s report that includes our opinion. Reasonable assurance is a high level of assurance, but is not a guarantee that an audit conducted in accordance with laws, regulations, and auditing standards and practices generally accepted in Norway, including ISAs will always detect a material misstatement when it exists. Misstatements can arise from fraud or error and are considered material if, individually or in aggregate, they could reasonably be expected to influence the economic decisions of users taken on the basis of these financial statements.
As part of an audit in accordance with laws, regulations, and auditing standards and practices generally accepted in Norway, including ISAs, we exercise professional judgment and maintain professional scepticism throughout the audit. We also:
• identify and assess the risks of material misstatement of the financial statements, whether due to fraud or error. We design and perform audit procedures responsive to those risks, and
PricewaterhouseCoopers AS, Postboks 748 Sentrum, NO-0106 Oslo T: 02316, org. no.: 987 009 713 MVA, www.pwc.no Statsautoriserte revisorer, medlemmer av Den norske Revisorforening og autorisert regnskapsførerselskap
To the General Meeting of Møller Mobility Group AS
Independent Auditor’s Report
Report on the Audit of the Financial Statements
Opinion
We have audited the financial statements of Møller Mobility Group AS showing a profit of mNOK 589 in the financial statements of the parent company and profit of mNOK 861 in the financial statements of the group. The financial statements comprise:
• The financial statements of the parent company, which comprise the balance sheet as at 31 December 2017, and the income statement and cash flow statement for the year then ended, and notes to the financial statements, including a summary of significant accounting policies, and
• The financial statements of the group, which comprise the balance sheet as at 31 December 2017, and the income statement and cash flow statement for the year then ended, and notes to the financial statements, including a summary of significant accounting policies.
In our opinion:
• The financial statements are prepared in accordance with the law and regulations.
• The accompanying financial statements give a true and fair view of the financial position of the parent company as at 31 December 2017, and its financial performance and its cash flows for the year then ended in accordance with the Norwegian Accounting Act and accounting standards and practices generally accepted in Norway.
• The accompanying financial statements give a true and fair view of the financial position of the group as at 31 December 2017, and its financial performance and its cash flows for the year then ended in accordance with the Norwegian Accounting Act and accounting standards and practices generally accepted in Norway.
Basis for Opinion
We conducted our audit in accordance with laws, regulations, and auditing standards and practices generally accepted in Norway, including International Standards on Auditing (ISAs). Our responsibilities under those standards are further described in the Auditor’s Responsibilities for the Audit of the Financial Statements section of our report. We are independent of the Company and the Group as required by laws and regulations, and we have fulfilled our other ethical responsibilities in accordance with these requirements. We believe that the audit evidence we have obtained is sufficient and appropriate to provide a basis for our opinion.

64 Annual report 2017 Group Finances 2017 CSR report 2017MMG AS Finances 2017
Independent Auditor's Report - Møller Mobility Group AS
(3)
obtain audit evidence that is sufficient and appropriate to provide a basis for our opinion. The risk of not detecting a material misstatement resulting from fraud is higher than for one resulting from error, as fraud may involve collusion, forgery, intentional omissions, misrepresentations, or the override of internal control.
• obtain an understanding of internal control relevant to the audit in order to design audit procedures that are appropriate in the circumstances, but not for the purpose of expressing an opinion on the effectiveness of the Company and the Group's internal control.
• evaluate the appropriateness of accounting policies used and the reasonableness of accounting estimates and related disclosures made by management.
• conclude on the appropriateness of management’s use of the going concern basis of accounting and, based on the audit evidence obtained, whether a material uncertainty exists related to events or conditions that may cast significant doubt on the Company or the Group’s ability to continue as a going concern. If we conclude that a material uncertainty exists, we are required to draw attention in our auditor’s report to the related disclosures in the financial statements or, if such disclosures are inadequate, to modify our opinion. Our conclusions are based on the audit evidence obtained up to the date of our auditor’s report. However, future events or conditions may cause the Company or the Group to cease to continue as a going concern.
• evaluate the overall presentation, structure and content of the financial statements, including the disclosures, and whether the financial statements represent the underlying transactions and events in a manner that achieves fair presentation.
• obtain sufficient appropriate audit evidence regarding the financial information of the entities or business activities within the Group to express an opinion on the consolidated financial statements. We are responsible for the direction, supervision and performance of the group audit. We remain solely responsible for our audit opinion.
We communicate with the Board of Directors regarding, among other matters, the planned scope and timing of the audit and significant audit findings, including any significant deficiencies in internal control that we identify during our audit.
Report on Other Legal and Regulatory Requirements
Opinion on the Board of Directors’ report
Based on our audit of the financial statements as described above, it is our opinion that the information presented in the Board of Directors’ report and in the statements on Corporate Social Responsibility concerning the financial statements, the going concern assumption, and the proposal for the allocation of the profit is consistent with the financial statements and complies with the law and regulations.
Opinion on Registration and Documentation
Based on our audit of the financial statements as described above, and control procedures we have considered necessary in accordance with the International Standard on Assurance Engagements (ISAE) 3000, Assurance Engagements Other than Audits or Reviews of Historical Financial Information, it is our opinion that management has fulfilled its duty to produce a proper and clearly
Independent Auditor's Report - Møller Mobility Group AS
(4)
set out registration and documentation of the Company and the Group’s accounting information in accordance with the law and bookkeeping standards and practices generally accepted in Norway.
Oslo, 26 April 2018 PricewaterhouseCoopers AS Thomas Fraurud State Authorised Public Accountant Note: This translation from Norwegian has been prepared for information purposes only.

CSR report 2017
65

66
MILJØ EMPLOYEES
MOBILITY
ENVIRONMENT
SOCIETY
Our sustainable social mission
In autumn 2016 the holding company Aars and Møller Mobility Group conducted a stakeholder and materiality analysis, with the purpose of defining a strategic framework for our social mission.
Paul Hegna Vice President Communication and CSR
The following social strategy focus area were defined as priorities:
• Møller Mobility Group’s core values and culture
• Energysmart mobility and associated infrastructure
• Equality, diversity, inclusion and development• Integration and measures for people who fall outside the labour market
These four areas were later reformulated into three concrete ambitions:• Be recognized for our contribution to one
greener society• Take a central role within smart urban MOBIL
ITY solutions and urban concepts• Be known as an enterprising company that
cares about its EMPLOYEES and SOCIETY in general
The four pillars: Society, Environment, Employees and Mobility form the basis of our social mission and have been translated into concrete, scheduled measures that together reflect our ambitions.
Our overarching ambition is that our social mission becomes an integral part of how we conduct longterm, profitable business in all our operations. At the same time, we have a responsibility to contribute to sustainable development. This is why we have chosen to call our CSR work our ”sustainable social mission”.
“Our overarching ambition is that our social mission becomes an integral part of how we conduct longterm, profitable business in all our operations”
Annual report 2017 Group Finances 2017 MMG AS Finances 2017 CSR report 2017

«Binding social responsibility with four perspectives»
67

Samfunnsrapport 201768
In only three years the market for electric cars and chargeable hybrids in Norway has grown from being a niche market to a very significant part of the new car market. Møller Mobility Group’s position in Norway has never been better. We are now the leading player in our market and are thus living up to our ambition.
Volkswagen Group has launched the automotive industry’s most ambitious electrification initiative with “Roadmap E”, whereby the Group’s brands will launch 80 electric models by 2025. Some 50 will be fully electric and 30 will be chargeable hybrids. The Roadmap E electrification initiative also entails that Volkswagen will have an electric version of all the models in its entire portfolio by 2030. It is therefore also our clear ambition to remain a leader in this area in the future.
Proportion of all registered new passen-ger cars that are chargeable (electric and plug-in hybrids): Almost 39% (29%)
Our brandsIn 2017 Volkswagen’s electric cars had a market share of 22.7%.
Volkswagen and Audi had a combined share of 25.9% of all sold chargeable hybrids.
Carbon emissionsIn 2017 newly registered passenger cars in Norway emitted an average of 82 g of CO2 per kilometre. This is 11 g lower than in 2016. Average CO2 emissions have been reduced by 41 g/km in the past five years and by 76 g/km in the past ten years. In 2017 the share of electric vehicle reached an alltime high of 20.8% (27.5% in December). (Source: Information Council for Road Traffic OFV).
Over half of all sales of Volkswagen passenger cars in 2017 were chargeable vehicles.
CO2 emissions our brands, passenger carsVolkswagen 65 g CO2/km (76 g) Audi 96 g CO2/km (100 g) ŠKODA 130 g CO2/km (124 g)
Møller Bil Klargjøring Møller Bil Klargjøring’s main task is to install equipment and technically and cosmetically prepare all the cars that arrive in the country. The company provides services to all 42
Møller Mobility Group wants to be a resource on automotive and environmental issues, enable customers to make good environmental choices, and be a market leader in chargeable cars.
Environment
Average CO2 emissions per kilometre driven
2240 2270 2401 2550
3785 3929 4107
Audi Volkswagen Skoda
50
100
150
200
201720162015201420132012201120102009200820072006
68

dealers in Møller Mobility Group, as well as on the basis of major customer agreements via Harald A. Møller. In 2009, Møller Bil Klargjøring invested in a new washing and finishing facility. Before this investment was made, around 180 litres of water were consumed per car. Water consumed per finished car is now 26 litres. In the same period, the consumption of chemicals has been reduced from an average of 1.9 litres per car to the current level of 0.8 litres. Møller Bil Klargjøring is also EcoLighthouse certified.
In 2017, Møller Bil Klargjøring prepared 27,500 vehicles, which constitutes an average of 120 vehicles per day with a lead time of two days.
Waste – car recovery – 2017The Norwegian car industry has developed an excellent tool for the collection and recovery of scrapped cars through Autoretur. Autoretur recycled 143,664 vehicles in 2017, and more than 97% of the vehicles’ weight is recovered through material or energy recovery and reuse of parts. It is the car importers who are
responsible for the collection and recovery of scrapped vehicles.
The Autoretur scheme is intended to ensure the proper recovery and recycling of scrapped cars. It is important to reduce CO2 and emissions of environmental toxins, and to increase the reuse of metals, which are a limited resource. The Autoretur scheme reduced Norway’s emissions by 220,000 tonnes of CO2 in 2016. This corresponds to roughly 1.5 billion vehicle kilometres, or roughly 98,000 cars’ annual emissions, assuming an annual driving distance of 15,000 kilometres (ref. Economics Norway’s environmental accounts). Autoretur also ensures that heavy metals such as lead, cadmium and mercury are properly treated.
In 2017, 141,153 vehicles were scrapped in Norway. A total of 180,884 tonnes of waste was treated. Of this, 145,030 tonnes underwent material recovery (80.7%), 19,876 tonnes underwent energy recovery (11.0%) and 9,924 tonnes were reused (5.5%). This means that 97.2% of the cars’ weight was recovered and only 2.8% was sent to waste disposal in 2017.
An average of approximately 914 kg of
metals are recovered from a single scrapped car. Autoretur’s environmental accounts for 2017 were not available until April 2018, after the deadline for this report. Autoretur is supervised by the Norwegian Environment Agency. (Source: Autoretur)
Waste management – Norway Møller Mobility Group has a waste management contract with Ragnsells. The figures show a total waste volume and source separation rate in line with 2016.
The result of 2017 collection of waste, scrap and recyclable resources:• Total volume of waste: 3,430
tonnes• Source separation rate: 78%
The largest fractions are:> Oil and fuel: 22%> Metals: 17%> Cardboard and paper: 15%> Wood: 5%> Plastic packaging: 4%
Waste management – SwedenSweden sorted more than 60% of all nonhazardous waste during the year, in line with the target. The total volume of nonhazardous waste was 605.44 tonnes in 2017. This business unit has reduced its emissions by 515.2 tonnes of CO2 through recycling. Some 92% of the permanent employees have completed an interactive environmental course that is tailored to individual companies and organisations.
Waste management – BalticsThe dealers in the Baltic States comply with the waste management and reporting requirements that apply in Lithuania, Estonia and Latvia. This means that all dealers have procedures for waste management and have also signed agreements with companies that utilise this waste. This also applies to hazardous waste such as batteries and tyres. No centralised form of reporting for this has been established in Møller Mobility Group yet.
69

Energy management in Møller Mobility GroupEnvironmental protection is firmly anchored in the Group, and considerable resources have been invested to reduce energy consumption and thus our environmental footprint. Active energy monitoring at all our sites seeks to deal with excessive energy consumption promptly. Measures are considered by local managers and operational personnel in collaboration with centrally contracted experts. In 2017 the scheme has been expanded so that the central experts can now access the central operations control systems in some buildings, enabling them to make adjustments more efficiently. The work in Norway has had good support from the Norwegian state’s energy fund Enova.
Monitoring shows that energy consumption is now more closely linked to the level of activity at the facilities. This is especially true of the repair centres, but there is also increasing energy use linked to the charging of electric vehicles. In the future, energy accounts must therefore take such considerations into greater account and allow reporting of such purposes. Møller Bil has active energy monitoring in 56
buildings in Norway, 17 buildings in Sweden and 14 buildings in the Baltics.
Energy saving in NorwayA fouryear energysaving project involving 51 premises in Norway was concluded on 31 December 2017. Investments totalling NOK 15.6 million have been recorded. We are waiting for support from Enova in the order of NOK 4.4 million, which will be deducted from this amount. The total decrease in energy consumption during the period was 8.6 million kWh, while the corresponding temperaturecorrected savings amounted to 4.6 million kWh. Overall, the project has thus yielded access to capital for the Group in the order of NOK 10 million, in addition to the environmental benefits.
A temperaturecorrected savings of 800,000 kWh has been registered for 2017, compared with the level in 2016. The change in energy consumption is very unevenly distributed among the premises. The total savings at facilities that have reduced their energy consumption has been calculated to
TEMPERATURE CORRECTED CONSUMPTION STATISTICS / CONSUMPTION PER SQUAREMETER (kWh/m2)
Norway 2013 2014 2015 2016 2017
Specific consumption temperature corrected 218 212 205 217 212
Endring 6 7 12 5
Sweden (e.g. Uppsala) 2013 2014 2015 2016 2017
Specific consumption temperature corrected 186 190 183 189 163
Change 4 8 7 26
Uppsala 417 379 382 469 442
39 3 86 27
The Baltics 2013 2014 2015 2016 2017
Specific consumption temperature corrected 278 272 248 251 217
Change 6 24 3 34
70
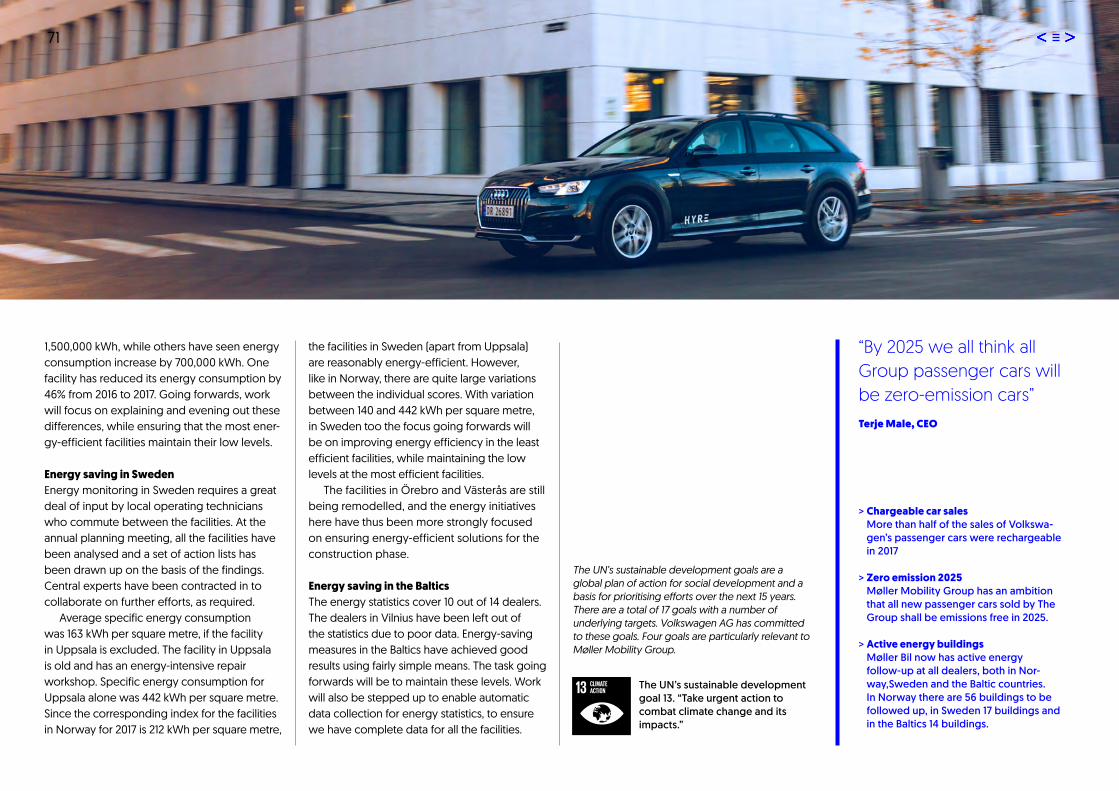
1,500,000 kWh, while others have seen energy consumption increase by 700,000 kWh. One facility has reduced its energy consumption by 46% from 2016 to 2017. Going forwards, work will focus on explaining and evening out these differences, while ensuring that the most energyefficient facilities maintain their low levels.
Energy saving in SwedenEnergy monitoring in Sweden requires a great deal of input by local operating technicians who commute between the facilities. At the annual planning meeting, all the facilities have been analysed and a set of action lists has been drawn up on the basis of the findings. Central experts have been contracted in to collaborate on further efforts, as required.
Average specific energy consumption was 163 kWh per square metre, if the facility in Uppsala is excluded. The facility in Uppsala is old and has an energyintensive repair workshop. Specific energy consumption for Uppsala alone was 442 kWh per square metre. Since the corresponding index for the facilities in Norway for 2017 is 212 kWh per square metre,
the facilities in Sweden (apart from Uppsala) are reasonably energyefficient. However, like in Norway, there are quite large variations between the individual scores. With variation between 140 and 442 kWh per square metre, in Sweden too the focus going forwards will be on improving energy efficiency in the least efficient facilities, while maintaining the low levels at the most efficient facilities.
The facilities in Örebro and Västerås are still being remodelled, and the energy initiatives here have thus been more strongly focused on ensuring energyefficient solutions for the construction phase.
Energy saving in the BalticsThe energy statistics cover 10 out of 14 dealers. The dealers in Vilnius have been left out of the statistics due to poor data. Energysaving measures in the Baltics have achieved good results using fairly simple means. The task going forwards will be to maintain these levels. Work will also be stepped up to enable automatic data collection for energy statistics, to ensure we have complete data for all the facilities.
The UN’s sustainable development goals are a global plan of action for social development and a basis for prioritising efforts over the next 15 years. There are a total of 17 goals with a number of underlying targets. Volkswagen AG has committed to these goals. Four goals are particularly relevant to Møller Mobility Group.
The UN’s sustainable development goal 13. “Take urgent action to combat climate change and its impacts.”
“By 2025 we all think all Group passenger cars will be zeroemission cars”Terje Male, CEO
> Chargeable car sales More than half of the sales of Volkswa-gen’s passenger cars were rechargeable in 2017
> Zero emission 2025 Møller Mobility Group has an ambition that all new passenger cars sold by The Group shall be emissions free in 2025.
> Active energy buildings Møller Bil now has active energy follow-up at all dealers, both in Nor-way,Sweden and the Baltic countries. In Norway there are 56 buildings to be followed up, in Sweden 17 buildings and in the Baltics 14 buildings.
71

Medarbeidere
MøllerGruppen er et familieeid konsern som er engasjert innen import, salg, service og finansiering av Volkswagen, Audi og ŠKODA. Selskapet er representert i Norge, Sverige og Baltikum.
72
Mobility has rapidly become an integral part of Volkswagen AG’s and our own strategy, and our goal is to take a key position within urban smart mobility solutions and urban concepts. Møller Mobility Group is preparing to replace more than 30% of our current revenues with earnings from new mobility services by 2030. Climate change is an important driver behind this decision. Norway has ratified the international Paris Agreement on climate change, thereby committing to making necessary, forwardlooking changes in the transport sector in order to reduce greenhouse gas emissions. In a nutshell, we must make much smarter use of what we have than we do today. Therefore, new, energyefficient mobility solutions are also part of our social mission.
Doing things on our own and with othersMøller Mobility Group is going to make major investments in new mobility services in order both to learn and to position ourselves to develop tomorrow’s mobility solutions. We are going to launch our own services, but even though we have knowledge and expertise
that will be important to come up with the best solutions for the future, it is unrealistic to expect to find all the solutions ourselves. Together with our owners in Aars and the people at StartupLab, we have therefore taken the initiative to establish MobilityLab. MobilityLab is a collaboration involving a number of other major players, including Cirkle K, Telenor, Posten, If, NSB, the Norwegian Institute of Transport Economics (TØI) and the City of Oslo.
The aim of the project is to foster more technology companies with a capacity for growth that contribute to solutions to the major transport challenges in the future, related to the movement of both goods and people, in addition to creating new jobs in Norway and new mobility solutions that can yield major socioeconomic benefits. MobilityLab aims to be an important arena for our success in this area.
Car sharingWe have also launched a car sharing service “Hyre”, whereby customers can easily share their car with others when they are not using it
themselves, thanks to a digital key. Through a mobile application, Hyre provides a safe, easy way to rent a car with automatic settlement of toll road charges and fuel consumption. We have already piloted Hyre in certain parts of Oslo and will market and roll out the service more broadly once we have gained experience and learned from the users’ feedback. This car sharing service represents the first of several initiatives that Møller Mobility Group is going to launch in the coming years. Hyre currently has approximately 100 cars in the capital.
Strong commitment from the factoryVolkswagen Group is the world’s largest automaker. The group has formulated a new strategy, “Together 2025”, where half of the business will be as we know it today, while the other half will focus on new areas. The Volkswagen Group itself states that this marks the start of the biggest change process in the company’s history, with a focus on changing the group’s core business and tapping potential new revenue streams. The Volkswagen Group has also established the company MOIA to develop mobility services.
In 2017 we changed our name to Møller Mobility Group – a well thought-out name. The idea behind the name “Møller Mobility Group” is rooted in the strategy that in the future we must be a proactive service provider of smart mobility solutions as well as physical products.
Mobility
UN sustainable development goal 9. “Build resilient infra-structure, promote inclusive and sustainable industriali-sation, and foster innovation.”
“Møller Mobility Group is preparing to replace more than 30% of our current revenues with earnings from new mobility services by 2030.”
72

73 Samfunnsrapport 2017
Employees
Møller Mobility Group maintains a continuous, systematic focus on the working environment, monitoring employee satisfaction, the opportuni-ties they have to use their skills, and how they are followed up.
At yearend 2017, the Group had a total of 4,345 employees – an increase of 71 from the previous year. There were 663 employees in Sweden, a total of 694 in the three Baltic States, and 2,988 in Norway.
Values and cultureMøller Mobility Group’s core values are the cornerstones of the Group’s corporate culture and provide important guidelines for managers and employees on how to treat one another and our customers. The ethical principles upon which the core values are based have provided the platform for our growth and work ever since the company was founded. Our employees are deeply imbued with our core values, and there is a constant focus on this in Sweden, Estonia, Lithuania, Latvia and Norway.
Ever since the company was founded by Harald A. Møller in 1936, our core values have been a cornerstone of the company. After all these years, these values are still just as relevant and important to us. Ultimately it is about living up to founder Harald A. Møller’s
eternally relevant motto: “Stick to the straight and narrow road”.
Code of conductThe work on the new Code of Conduct and new whistleblowing channel in 2016, involving all the employees in our five countries, was followed up in autumn 2017 through an internal Questback survey, carried out by Deloitte. The Questback survey showed good results in respect of familiarity with the Code of Conduct, the management’s compliance with the core values, familiarity with the whistleblowing channel, etc. However, the survey also revealed that some employees were afraid to report unacceptable matters and that some employees had experienced bullying or other forms of harassment.
The management has taken these results very seriously, and there have been thorough discussions in key management teams to agree on a plan for tackling these negative findings. A plan has now been drawn up and approved for work on this in 2018.
Independently of the Code of Conduct, it
Distribution men, women & average age:
Country Total no. of employees
Men % Average age
Women % Average age
Norway 2,988 2,536 85 % 38,5 452 15 % 40.2
Sweden 663 574 86.5 % – 89 13.5 % –
Estonia 181 152 84 % – 29 161 % –
Lithuania 221 191 86.5 % – 30 13.5 % –
Latvia 292 226 77.4 % – 66 22.6 % –
73

was decided to initiate a survey of the situation in Møller Norway in the wake of the worldwide #metoo movement. The head office at Frysja has the highest proportion of female employees, and all 153 received an email on the subject and were encouraged to share their experiences with the health and safety adviser.
129 women responded (eight of the women who did not respond were on maternity leave.)
• 120 women responded “not me” • 9 responded “#metoo”
The feedback showed that the women who have felt they had been subjected to unwanted sexual behaviour have either sorted the matter out on their own or received help from the HR department. The survey also found that there was more unwanted sexual behaviour ten or more years ago. Although no instructions were issued centrally, several of the major dealers have also followed up on the #metoo movement.
WhistleblowingIn 2017, twentyodd unacceptable circumstances with varying degrees of severity were reported. When a matter is reported, our internal whistleblowing unit starts processing the matter immediately and at the latest within three working days. It is a priority for us that noone should be afraid to report anything untoward in Møller Mobility Group. If a matter is reported nonanonymously, the whistleblower gets feedback on the case and is informed on an ongoing basis about the treatment of the matter.
Given the results of the Questback survey in autumn 2017, which also showed that some people did not trust the whistleblowing channel, there is a chance that there are perhaps more instances of improper conduct than were reported. Work will therefore be undertaken in 2018 to assure all our employees that it is 100% safe to report something via the whistleblowing channel. This will be included as part of the planned work relating to the Code of Conduct and the core values, at the same time as it is clearly the responsibility of
the management in all the business areas to encourage the employees to report anything untoward.
Health and safetySystematic work on occupational health, safety and the working environment is a governmental requirement. The purpose of this work is to make sure that the working methods used at all levels in Møller Mobility Group ensure that health, safety and the working environment are systematically assessed and taken into account in the planning, preparation and execution of work. In this way, health and safety work also functions as a tool to improve the Group’s results by preventing injuries and sickness absence and improving the quality of the work that is done.
Møller Mobility Group works specifically and systematically to reduce both shortterm and longterm sickness absence and to avoid injuries. It is important to emphasise the positive aspects of the company’s health and safety work – a good working environment benefits all the employees.
In 2017 a total of 29 incidents and minor accidents were reported by Møller Bil and Harald A. Møller AS. They were distributed evenly throughout the year, and no dealer stands out. Damage to property and materials is reported locally and discussed in the Working Environment Committee. No major damage to property or materials has been reported.
Møller Mobility Group has established a body of procedures that forms a practical health and safety tool in the daytoday work of managers, safety representatives, working environment committees and, of course, all other employees. The various procedures describe the responsibilities of each employee and how individuals with a managerial responsibility for health and safety should proceed.
Preventive health protectionAll our companies in Norway have an occupational health service (OHS) agreement, and our highrisk groups – mechanics, technicians, painters and panel beaters – are offered a targeted health check every third year. In
74

Oslo, Arsana AS provides occupational health services for all the risk groups in the region. In addition to Arsana, Møller Mobility Group has a special inhouse health and safety adviser in the Group’s HR Department who is available to all the companies in Norway.
In 2017, 117 employees in highrisk positions in Oslo and Akershus have undergone a targeted health checkup. People found to have physiological symptoms within a defined range are referred to a specialist. No jobrelated issues within this range were detected in 2017.
Follow-up of sickness absenceThe occupational health service has worked on an individual, departmental and organisational level to help the companies with various challenges linked to sickness absence. The inhouse health and safety adviser has attached importance to close collaboration with employees’ doctors, the Norwegian Labour and Welfare Administration (NAV) and treatment institutions, as well as taking part in dialogue meetings arranged by the employer and NAV.
Health and safety courses • The inhouse health and safety adviser has
held five health and safety courses for managers at various dealerships. In addition, all the apprentices have taken health and safety courses – a total of seven courses.
• Thirteen first aid courses have been held for a total of 494 employees.
Company democracyMøller Bil’s Norwegian works council (SU) held three meetings during the year and the group committee (KU) one meeting. The cooperation between the trade union representatives and the management is characterised by openness and a shared vision in the vast majority of areas, and is therefore considered fruitful and useful by both parties. At a time when staff cuts are on the cards, it is especially important that the trade union representatives are well informed and consulted.
Several Møller Mobility Group representatives have participated in works council meetings to provide briefings on measures that are being worked on centrally in Møller
Development in sickness absence 2015–2017 (%) 2015 2016 2017
0
1%
2%
3%
4%
5%
6%
Møller Bil in the BalticsMøller Bil in SwedenHarald A. MøllerMøller Bil in Norway
7575

Mobility Group and on Møller Mobility Group’s strategy.
In Sweden, the employer’s duty to provide information and the trade unions’ right to negotiate are regulated by legislation such as the law regarding employee participation in the labour market. The duty to provide information means that Møller Bil Sverige has to keep the three trade unions with which the company has collective agreements continuously informed. The information provided should be about the financial and productionrelated development of the company and HR policy guidelines. The purpose is to provide employees with an opportunity to assess the current situation and future prospects.
No formal collaboration with employee representatives has been established in the Baltic States. National regulations and practices here differ greatly from Norway and Sweden.
Manager developmentOur Group has many operational units that to
a great extent have to be run as independent profit centres, and developing our managers and recruiting new ones is therefore a highpriority area.
Møller Mobility Group has focused on developing its own managers for almost 30 years. Internal recruitment and the transfer of competence between the companies, especially between importers and dealers, are important cornerstones for the company’s growth and development.
In 2017 we have conducted a Manager Programme (no. 20) for 19 middle managers in Norway. This has been held over a period of eight months with a total of five sessions. At the same time, we have completed a manager development programme for 10 middle managers in the Baltic States and started a new Manager Candidate Programme (no. 18) for 22 participants in autumn 2017. The senior management team (TLP) met twice in 2017, focusing on strategic challenges and learning, with content from external speakers.
Courses and training provided by the importer Harald A. Møller AS
Year TMD (Training Man Day)
2012 6.608
2013 5.122
2014 5.385
2015 5.652
2016 6.517
2017 4.725
TMD = Training ManDay (for example: 10 participants on courses for two days equals 20 TMD).
76

Courses and training – non-technical trainingIn 2017 the following numbers of employees achieved certification: 115 customer advisers (workshop and bodywork), 27 parts staff, 29 guarantee coordinators, 27 aftersales market managers and parts managers, a total of 80 sales staff, all brands, 37 used car sales staff and a total of 13 sales managers, all brands.
Technical trainingIn 2017 the Servicing School provided 4,725 training mandays (TMD), compared with 6,517 TMD in 2016.
Technical and nontechnical training are now going to be merged into a single training department, called The Harald A. Competence Centre. The new department will be located in the premises of our current training academy, the Servicing School in Skedsmo, which has been responsible for all technical training on all models of Audi, Škoda, Volkswagen passenger cars and Volkswagen commercial vehicles that are imported into Norway. Technical training has also been
provided for our customer advisers and sales staff. Once SEAT is back, this brand will also be included in the training.
Great place to workVolkswagen Møller Bilfinans was ranked the 14th best place to work in the category for companies with 50–199 employees. Through a comprehensive analysis of the corporate culture and a survey among the employees, focusing on credibility, respect, fairness, pride and camaraderie, Great Place to Work ranks the best businesses within four categories: more than 500 employees, 200–499 employees, 50–199 employees and 20–50 employees.
Møller Bil SkolenMøller Mobility Group companies invest in the talent of the future. The Møller Bil School is an accredited training office where pupils from upper secondary schools sign an apprenticeship contract that normally lasts for 24 months. During this time, the apprentice has to combine the theory he or she has learned at school with the practical knowledge necessary
to take their apprenticeship examination and thereby become a skilled craftsperson. The Møller Bil School follows an accredited curriculum for an automotive technical education as a car mechanic, motor vehicle body repair technician, painter and spare parts adviser. At the Møller Bil School, we guarantee that the pupils will work using the latest techniques and equipment that are used to service and diagnose cars that are technical leaders in areas such as safety, the environment, etc. The Møller Bil School had 170 apprentices at yearend 2017 (admitted in 2016 and 2017). The best students are offered a fulltime job in Møller Bil once they have passed their apprentice examination.
UN sustainable development goal 3, target 3.6: “By 2020, halve the number of global deaths and injuries from road traffic acci-dents.”
77
“The era we are entering requires restructuring to ensure we are best equipped to raise the competence of the entire organisation.

78
Medarbeidere
MøllerGruppen er et familieeid konsern som er engasjert innen import, salg, service og finansiering av Volkswagen, Audi og ŠKODA. Selskapet er representert i Norge, Sverige og Baltikum.
78
Society
We will be leaders in diversity, creating an inclusive workplace, develop staff and give them opportunities.
Historically, businesses’ corporate social responsibility has evolved from simply providing financial support for chosen causes to actively developing projects and initiatives that are closely linked to the business – ideally as an integrated part of the company. This is also our ambition. We are in the process of working out the concrete details of many exciting projects, signalling that we are changing the way in which we execute our social mission.
We believe that the best way to help our fellow human beings is to give them work in our businesses. This has been done at many dealerships previously, but after the good experience from the vocational training at the vehicle preparation plant in Bekkelaget in autumn 2016 and 2017, this is now going to be done more systematically. Candidates recruited through NAV take a programme consisting of both practical vocational training and more theoretical education in relevant subjects, with the aim of getting people outside the employment market into work, either with us or elsewhere. The trainees work on the technical or cosmetic preparation of
cars. This autumn, three people who took this programme have been offered permanent employment with us.
Møller Medvind – our first major own schemeBuilding on the good results from other schemes, Møller Medvind (“Møller Tailwind”) was established in spring 2017. We are confident in our ability to run this scheme, because creating workplaces is part of our core business. At the same time, we can help resolve one of the greatest challenges in society: young people under the age of 30 who are outside the labour market. Møller Medvind will create permanent, profitable workplaces for this target group, and at the same time develop employees for work in other parts of the group.
The aim is to hire a significant number of new employees in 2018. For example, in 2018 Møller Medvind will build capacity and competence for the preparation of used cars in Oslo. We expect to prepare up to 6,000 used cars a year in the future, entailing a need for
many new employees. Møller Medvind will train young people so that we can continuously build the capacity and competencies we need in this area. We are also going to develop a certificate of competence in the preparation of used cars for people who wish to take a “learning candidate” programme. In addition, our new employees will also receive training in other subjects related to the preparation of cars. In this way, we will create attractive workers who can also be employed elsewhere in our business or at other companies.
Based on the fact that we have workplaces and NAV has job seekers, Møller Medvind and NAV Oslo entered into a unique new form of collaboration on the qualification and distribution of young job seekers in autumn 2017. A secondary aim of the collaboration agreement is to provide a framework for more sustainable and targeted collaboration between NAV and the private sector – locally and throughout Norway. A similar agreement was entered into with NAV Akershus in February 2018 for candidates for Møller Logistics in Skedsmo.
EXTERNAL PARTNERSLønn som fortjentIn 2017 we bought 3,500 car books / children’s activity books and 1,000 books for the Red Cross’s “Ferie for alle” holiday scheme from the Church City Mission’s “Lønn som fortjent” work scheme. The activity book for children in cars is handed out at some of our dealerships.
Ferie for alleThe Red Cross’s “Ferie for alle” (Holiday for everyone) scheme gives children and parents in a difficult financial situation the chance to have a week’s holiday during the school holidays at one of the Red Cross’s activity centres. In 2017 one Møller Mobility Group employee took part in a holiday under this scheme. The Group has supported this project since 2007. The contract expired at yearend 2017.
MentorMENTOR is a pilot project for young people aged 13–19 years who want someone to inspire and guide them. The project was started in 2015 and is being run by the Red
78

Cross. Møller Mobility Group supports the project financially, has members on the steering committee, and provides mentors from among its own employees. During the period, we had six mentors in the project that will end next year. The final group will finish in October 2018. The pilot project has met all the goals set for it, according to a halfway evaluation conducted by the Red Cross. The project is also now on its way to other parts of the country.
SOS-barnebyerMøller Mobility Group is the main partner and supports SOS Children’s Villages’ activities in the Baltic States. This collaboration is a natural extension of our core values and our desire to be a socially responsible and engaged company in Estonia, Latvia and Lithuania. Now the partnership in the Baltic States is more locally anchored and is tied more closely to the core operations. This has generated greater enthusiasm for the scheme and higher use.
The Møller Bil children and young people’s fund (Sweden)The purpose of this fund is to support local initiatives that help improve living conditions, prevent loneliness and bullying, and give children and young people the opportunity to do things with other children. The Children and Young People’s Fund supports up to 12 projects a year with a grant of up to SEK 100,000 each. The fund shall contribute to better everyday life in the communities where we operate (started in 2015), and the scheme is now well known locally. In 2017, 30 applications were received, of which nine received support from the fund.
Christian RadichMøller Mobility Group has supported the ship and Norwegian maritime heritage since 2000. This fullrigged ship is used on 17 May for Constitution Day celebrations for Møller employees, and reduced rates are offered on selected cruises. The current agreement expires in 2019.
“It’s as if I am born again. The future looks very bright with Møller Medvind.”Anas, car preparer, Møller Bil Logistikk
“It feels like someone has stretched out a hand and I really want to use this opportunity. If I’m asked to continue in Møller Bil, I will certainly axcept “Michael, Møller Bil Logistikk
UN sustainable development goal 12. “Ensure sustainable consumption and production patterns.”
79

80
Møller Mobility Group has reported on its sustainability performance in 2017 on the basis of the Global Reporting Initiative (GRI) template. The GRI indicators that the Group reports on, in whole or in part, are presented in the GRI index below with reference to where more detailed information about the specific indicator can be found. This report has not been externally verified.
This year’s report is largely based on GRI G4, but Møller Mobility Group has also five new indicators, adapted to the Group’s operations.
GENERAL INFORMATION
GRI indicator Description Møller Mobility Group’s reporting Partial reporting
Strategy and analysis
G41 Statement from the CEO p. 5
Organisational profile
G43 Name of the organisation p. 3
G44 Primary products, and/or services p. 3, 8 and 9
G45 Location of the organisation's headquarters Frysjaveien 31, NO0884 Oslo, Norway
G46 Number of countries where the organisation operates p. 3, 8 and 9
G47 Nature of ownership and legal form p. 27
G48 Markets served (geographic breakdown, sectors served and types of customers / beneficiaries) p. 3, 89
G49 Scale of the organisation p. 3
G410 Total number of employees by employment type, employment contract, and region, broken down by gender See also the financial statements for 2017 Partially reported
G411 Percentage of total employees covered by collective bargaining agreements p. 73
G412 Description of the organisation's supply chain Not reported
G413 Significant changes during the reporting period regarding size, structure, ownership, etc. p. 8
G414 Description of whether and how the precautionary approach or principle is addressed by the organisation None
G415 Externally developed economic, environmental and social charters, principles, or other initiatives to which the organisation subscribes or which it endorses
p. 70
G416 Memberships of associations and national or international advocacy organisations in which the organisation holds a position on the governance body, participates in projects or committees, or provides substantive funding
p. 7879
Identified material aspects and boundaries
G417 List of all entities included in the organisation's consolidated financial p. 3
GRI index
Annual report 2017 Group Finances 2017 MMG AS Finances 2017 CSR report 2017

81
G418 statements or equivalent documents See also the financial statements for 2017 Partially reported
G419 Description of process for defining the report content and the aspect boundaries and implementation of the reporting principles for defining report content
p. 66
G420 List of all the material aspects identified in the process for defining report content p. 66
G421 Report on the aspect boundary within the organisation All material aspects concern the entire group and the companies under our control
G422 Any restatements of information provided in previous reports None
G423 Significant changes from previous reporting periods in the scope and aspect boundaries or measurement methods applied in the report
None
Stakeholder engagement
G424 Stakeholder groups engaged by the organisation p. 66
G425 Description of the basis for identification and selection of stakeholders with whom to engage p. 66 Partially reported
G426 Approach to stakeholder engagement, including frequency of engagement by type and by stakeholder group p. 66 Partially reported
G427 Key topics and concerns that have been raised through stakeholder engagement and the company’s response p. 66 Partially reported
Report profile
G428 Reporting period 2017
G429 Date of most recent previous report (if any) April 2017
G430 Reporting cycle (annual, biennial, etc.) Annual
G431 Contact point for questions regarding the report or its contents p. [email protected]
G432 The ‘in accordance' option the organisation has chosen and GRI content index for the chosen option p. 80 Partially reported
G433 Policy and current practice with regard to seeking external assurance for the report p. 80
Governance
G434 The governance structure of the organisation, including committees of the highest governance body responsible for decisionmaking on economic, environmental and social impacts
p. 17Paul Hegna, Vice President Communication and CSR, has the ultimate responsibility. Performance is reported to the Board twice a year.
Ethics and integrity
G456 The organisation's values, principles, standards and norms of behaviour p. 73, and the Group's website www.moller.no
Annual report 2017 Group Finances 2017 MMG AS Finances 2017 CSR report 2017
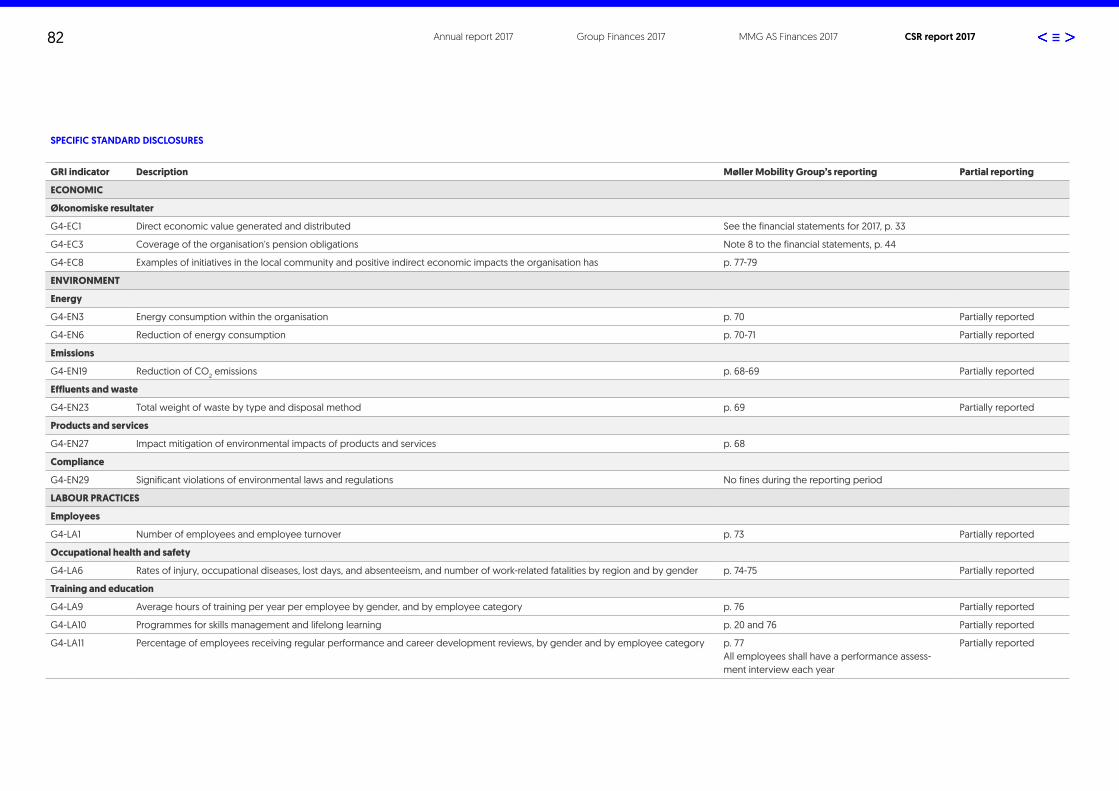
82
SPECIFIC STANDARD DISCLOSURES
GRI indicator Description Møller Mobility Group’s reporting Partial reporting
ECONOMIC
Økonomiske resultater
G4EC1 Direct economic value generated and distributed See the financial statements for 2017, p. 33
G4EC3 Coverage of the organisation's pension obligations Note 8 to the financial statements, p. 44
G4EC8 Examples of initiatives in the local community and positive indirect economic impacts the organisation has p. 7779
ENVIRONMENT
Energy
G4EN3 Energy consumption within the organisation p. 70 Partially reported
G4EN6 Reduction of energy consumption p. 7071 Partially reported
Emissions
G4EN19 Reduction of CO2 emissions p. 6869 Partially reported
Effluents and waste
G4EN23 Total weight of waste by type and disposal method p. 69 Partially reported
Products and services
G4EN27 Impact mitigation of environmental impacts of products and services p. 68
Compliance
G4EN29 Significant violations of environmental laws and regulations No fines during the reporting period
LABOUR PRACTICES
Employees
G4LA1 Number of employees and employee turnover p. 73 Partially reported
Occupational health and safety
G4LA6 Rates of injury, occupational diseases, lost days, and absenteeism, and number of workrelated fatalities by region and by gender p. 7475 Partially reported
Training and education
G4LA9 Average hours of training per year per employee by gender, and by employee category p. 76 Partially reported
G4LA10 Programmes for skills management and lifelong learning p. 20 and 76 Partially reported
G4LA11 Percentage of employees receiving regular performance and career development reviews, by gender and by employee category p. 77 All employees shall have a performance assessment interview each year
Partially reported
Annual report 2017 Group Finances 2017 MMG AS Finances 2017 CSR report 2017

83
SOCIETY
Anti-corruption
G4SO4 Communication and training on anticorruption policies and procedures p. 73 Partially reported
G4SO5 Confirmed incidents of corruption None
G4SO7 Any violations of anticompetitive, antitrust and monopoly legislation, etc. None
G4SO8 Compliance with anticorruption and competition laws No incidents in the reporting period
Grievance mechanisms for impacts on society
G4SO11 Number of grievances about impacts on society filed, addressed, and resolved through formal grievancemechanisms
p. 74 Partially reported
PRODUCT RESPONSIBILITY
Product and service labelling
G4PR5 Results of surveys measuring customer satisfaction p. 10, 11 Partially reported
G4PR7 Incidents of noncompliance with regulations and voluntary codes concerning marketing communications No incidents in the reporting period
MØLLER MOBILITY GROUP – OWN INDICATORS
MMG 1 Proportion of all registered new cars that are chargeable (electric and hybrids) p. 68
MMG 2 Proportion of electric cars p. 68
MMG 3 Number of vehicle charging stations p. 18
MMG 4 Water consumption per finished car p. 69
MMG 5 Chemical consumption per finished car p. 69
Annual report 2017 Group Finances 2017 MMG AS Finances 2017 CSR report 2017

84 Samfunnsrapport 201784
Company Country Org. nr.
Møller Mobility Group AS (parent company) NO 984 599 730
Møller Synergi AS NO 974 784 556
Møller IT AS NO 918 320 547
Harald A. Møller AS NO 943 733 988
Moller Baltic Import SE LV 40103176283
Møller Bil AS (holding company) NO 986 130 861
Møller Bil Øst AS NO 917 805 717
Møller Bil Vest AS NO 928 481 638
Møller Bil Molde AS NO 915 555 292
Møller Bil Jessheim AS NO 983 054 412
Møller Bil Bergen AS NO 834 083 922
Møller Bil Ensjø AS NO 980 173 569
Møller Bil Follo AS NO 912 174 786
Møller Bil Oppland AS NO 919 781 491
Møller Bil Haugesund AS NO 944 904 069
Møller Bil Hedmark AS NO 976 951 336
Møller Bil Romerike AS NO 964 995 923
Møller Bil Sør-Rogaland AS NO 933 625 583
Møller Bil Trøndelag AS NO 834 874 482
Møller Bil Vestfold AS NO 946 967 874
Møller Bil Ålesund AS NO 921 494 866
Møller BilPartner AS NO 968 222 678
Møller Bil Klargjøring AS NO 968 237 403
AutoArena AS NO 974 480 581
Company Country Org. nr.
Orkdal Bil Eiendom AS NO 813 865 262
SIA Moller Auto Latvia LV 40003055104
SIA Moller Auto Krasta LV 40003570184
SIA Moller Auto Ventspils LV 41203010445
SIA Moller Auto LV 40103847187
UAB Moller Auto LT 110430994
UAB Moller Auto Keturi Ziedai LT 224234070
UAB Moller Auto Alytus LT 149655665
Moller Auto Tallinn OÜ EE 10195513
Moller Auto Pärnu OÜ EE 10931969
Moller Auto Viru OÜ EE 11131478
Møller Bil Holding AB (holding company) SE 556719-8212
Møller Bil Sverige AB SE 556298-7510
Volkswagen Møller BilFinans AS (Associated company) NO 992 873 183
Companies in Møller Mobility Group as of 31.12.2017