Annual Activity Report - European Commission · 2014 Annual Activity Report Directorate-General for...
108
2014 Annual Activity Report Directorate-General for Mobility and Transport Ref. Ares(2015)1425985 - 31/03/2015
Transcript of Annual Activity Report - European Commission · 2014 Annual Activity Report Directorate-General for...

2014
Annual Activity Report
Directorate-General for Mobility and Transport
Ref. Ares(2015)1425985 - 31/03/2015

2 move_aar_2014_final
Foreword
Introductory message by the Director General
This Annual Activity Report covers the activities of the Commission's Director-General for Mobility and Transport (DG MOVE) for 2014.
The purpose of this report is to give an outline of the operations of the DG and to help in understanding the different challenges that are faced.
Part 1 provides an overview of the policy achievements of the DG for 2014 and tries to give a flavour of the wide range of activities going on in the DG. Parts 2-4 give information on the management of the allocated resources as well as on the internal organisation of the DG.
For more information on the activities of DG MOVE, please visit our website: http://ec.europa.eu/transport/index_en.htm
João Aguiar Machado
Director-General of DG MOVE
3 move_aar_2014_final
TABLE OF CONTENTS
INTRODUCTION 4
THE DG IN BRIEF ................................................................................................................................................................4 THE YEAR IN BRIEF ..............................................................................................................................................................4
EXECUTIVE SUMMARY 5
KEY PERFORMANCE INDICATORS............................................................................................................................................5 KEY CONCLUSIONS ON RESOURCE MANAGEMENT AND INTERNAL CONTROL EFFECTIVENESS (EXECUTIVE SUMMARY ON PART 2 AND 3)......13 INFORMATION TO THE COMMISSIONER .................................................................................................................................14
1. POLICY ACHIEVEMENTS 15
1.1 ACHIEVEMENT OF GENERAL AND SPECIFIC OBJECTIVES ..........................................................................................15 1.1.1 DG MOVE GENERAL OBJECTIVES AND IMPACT INDICATORS .................................................................................18 1.1.2 SPECIFIC OBJECTIVES FOR ABB ACTIVITY "EUROPEAN TRANSPORT POLICY" ..............................................................23 1.1.2.1 INFRASTRUCTURE POLICY – CEF TRANSPORT ......................................................................................................42 1.1.3 SPECIFIC OBJECTIVES FOR ABB ACTIVITY "HORIZON 2020 – RESEARCH AND INNOVATION RELATED TO TRANSPORT..........51 1.2 EXAMPLE OF EU-ADDED VALUE AND RESULTS/IMPACTS OF PROJECTS OR PROGRAMME FINANCED.................................59 1.3 ECONOMY AND EFFICIENCY OF SPENDING AND NON-SPENDING ACTIVITIES. ...............................................................60 1.3.1 EXAMPLE 1..................................................................................................................................................61 1.3.2 EXAMPLE 2..................................................................................................................................................61
2. MANAGEMENT OF RESOURCES 62
2.1 MANAGEMENT OF HUMAN AND FINANCIAL RESOURCES BY DG MOVE ...................................................................65 2.1.1 RESEARCH FRAMEWORK PROGRAMMES............................................................................................................66 2.1.2 FRAUD PREVENTION AND DETECTION ................................................................................................................77 2.2 BUDGET IMPLEMENTATION TASKS ENTRUSTED TO OTHER DGS AND ENTITIES. ...........................................................78 2.2.1 CROSS-SUB-DELEGATIONS ..............................................................................................................................79 2.2.2 CO-DELEGATIONS .........................................................................................................................................80 2.2.3 EXECUTIVE AGENCY : INEA ............................................................................................................................80 2.2.4 FINANCIAL INSTRUMENTS ............................................................................................................................... 83 2.2.5 PPPS (JOINT UNDERTAKINGS, EX-ART 185 INITIATIVES ART. 208 & 209): SESAR JU AND S2R JU.............................87 2.2.6 DECENTRALISED AGENCIES (DAS): EASA, EMSA, ERA.......................................................................................90 2.3 ASSESSMENT OF AUDIT RESULTS AND FOLLOW UP OF AUDIT RECOMMENDATIONS ......................................................93 2.3.1 INTERNAL AUDIT SERVICE (IAS) .......................................................................................................................93 2.3.2 SHARED INTERNAL AUDIT CAPABILITY (SIAC).....................................................................................................93 2.3.3 EUROPEAN COURT OF AUDITORS (ECA)............................................................................................................94 2.3.4 OVERALL CONCLUSION...................................................................................................................................97
3. ASSESSMENT OF THE EFFECTIVENESS OF THE INTERNAL CONTROL SYSTEMS 98
3.1 SOURCE AND METHODOLOGY FOR THE ASSESSMENT ............................................................................................98 3.2 EXCEPTIONS AND NON-COMPLIANCE EVENTS ......................................................................................................98 3.3 PRIORITISED ICS ...........................................................................................................................................99 3.4 GENERAL RISK ENVIRONMENT........................................................................................................................100 3.5 CONCLUSION ON THE EFFECTIVENESS OF THE ENTIRE CONTROL SYSTEM ..................................................................100
4. MANAGEMENT ASSURANCE 101
4.1 REVIEW OF THE ELEMENTS SUPPORTING ASSURANCE..........................................................................................101 4.2 OVERALL CONCLUSION ON ASSURANCE AND RESERVATIONS.................................................................................102 4.2.1 FP7 RESERVATION ......................................................................................................................................102 4.2.2 WEIGHTED AVERAGE ERROR RATE AND CORRECTIVE CAPACITY .............................................................................105 4.2.3 OVERALL CONCLUSION ................................................................................................................................106
DECLARATION OF ASSURANCE 107

4 move_aar_2014_final
INTRODUCTION
The DG in brief Under the political guidance of the College of Commissioners, in particular Vice-President Maroš Šefčovič and Ms Violeta Bulc, Commissioner responsible for Transport, the Directorate-General for Mobility and Transport (DG MOVE) is in charge of developing transport policies for the European Union1. Its remit is to ensure efficient and sustainable mobility within a single European transport area, to serve Europe's citizens and economy.
The Commission priority areas set out in President Juncker's Political Guidelines which are of particular relevance for DG MOVE are notably jobs, growth and investment, a connected digital single market, energy union and climate change policy, a deeper and fairer internal market and a stronger global actor.
DG MOVE strives to fulfil its mission by contributing towards the completion of the European internal market in the area of transport; by promoting EU transport policy interests on the world stage; by facilitating the construction of Europe's transport infrastructure network; and by promoting innovation and roll-out of sustainable transport technologies particularly for integrated traffic management systems and low-carbon transport.
DG MOVE develops strategic policies for the transport sector; it monitors the implementation of existing EU law and makes new legislative proposals; it encourages the exchange of best practices. Its work is accompanied by financial support programmes, particularly for research and innovation projects and for co-financing investments in transport infrastructure. The DG promotes policies internationally and provides information to the public as well as to stakeholders.
DG Mobility and Transport is assisted in its work by the expert input from several European Agencies and two Joint Undertakings, which it oversees: the European Aviation Safety Agency (EASA), the European Maritime Safety Agency (EMSA), the European Railway Agency (ERA), Innovation and Networks Executive Agency (INEA), and the SESAR (Single European Sky ATM Research) Joint Undertaking and the Shift2Rail Joint Undertaking (which was set up in 2014). DG MOVE has also built a strong partnership with EUROCONTROL and is represented in the Management Board of the Fuel Cells and Hydrogen Joint Undertaking. (DG MOVE not being anymore a parent DG of the latter since 2014).
The year in brief In this section are mentioned major internal or external events, including organisational, which had an impact on DG MOVE. For 2014 it can be noted that on 1. November 2014 Ms Violeta Bulc became Commissioner responsible for Transport, replacing former Vice-President Kallas. On 1 May 2014 Mr João Aguiar Machado replaced Mr Matthias Ruete as Director-General of DG MOVE.
1 Until 1 November 2014 former Vice-President Kallas was responsible for transport.

5 move_aar_2014_final
EXECUTIVE SUMMARY The Annual Activity Report is a management report of the Director-General of DG MOVE to the College of Commissioners. It is the main instrument of management accountability within the Commission and constitutes the basis on which the Commission takes its responsibility for the management of resources by reference to the objectives set in the management plan and the efficiency and effectiveness of internal control systems, including an overall assessment of the costs and benefits of controls.
The executive summary has four subsections:
• Five Key Performance Indicators for policies and management
• Policy highlights of the year (executive summary of part 1)
• Key conclusions on the effectiveness of internal control and financial management (executive summary on part 2 and 3)
• Information to the Commissioner
Key Performance Indicators
To measure the progress made by the EU towards effective, sustainable, safe and secure transport and the contribution of EU transport policy to this, reporting on a number of indicators included in DG MOVE's Management Plan 2014 are presented in the following sections of the Annual Activity Report under each general and/or specific objective. The reporting on the indicators in AAR 2014 therefore "mirrors" the ones presented in the MP 2014. The below five key performance indicators (KPIs) selected in the MP 2014 were given special attention in 20142.
It is important to note that the implementation of the Management Plan (and in particular achieving objectives and seeing improvements in the indicators) does not only depend on the Commission. It is for the European Parliament and Council to decide on the Commission's proposals and then primarily for the Member States to implement them. In addition, there are often measures that will contribute to the actions that are outside the scope of EU competence. Finally, external factors, such as energy price fluctuations or the general economic situation, can have a significant influence.
2 In the Management Plan 2015, the transposition rate in transport legislation replaces the labour productivity of the transport sector as a key performance indicator, while the other indicators remain unchanged compared to Management Plan 2014. The reporting in the Annual Activity Report 2014 is based on the indicators presented in the Management Plan 2014.
6 move_aar_2014_final
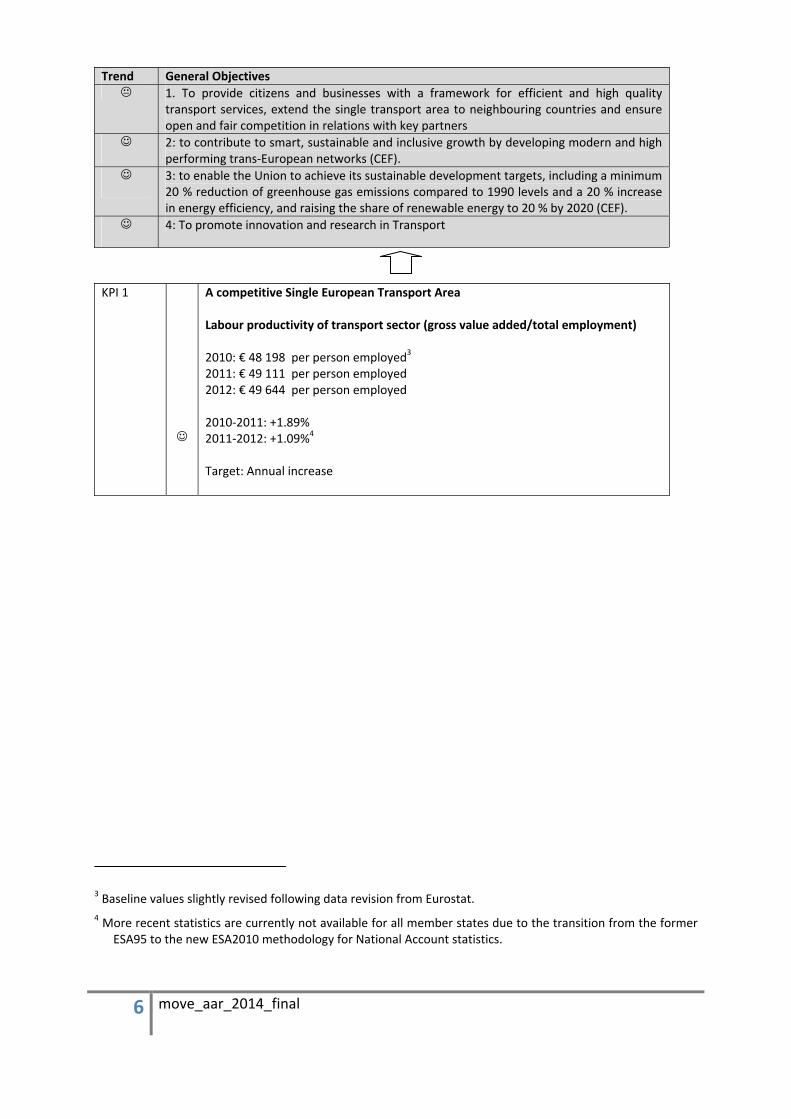
Trend General Objectives 1. To provide citizens and businesses with a framework for efficient and high quality
transport services, extend the single transport area to neighbouring countries and ensure open and fair competition in relations with key partners
☺ 2: to contribute to smart, sustainable and inclusive growth by developing modern and high performing trans-European networks (CEF).
☺ 3: to enable the Union to achieve its sustainable development targets, including a minimum 20 % reduction of greenhouse gas emissions compared to 1990 levels and a 20 % increase in energy efficiency, and raising the share of renewable energy to 20 % by 2020 (CEF).
☺ 4: To promote innovation and research in Transport
KPI 1
☺
A competitive Single European Transport Area Labour productivity of transport sector (gross value added/total employment) 2010: € 48 198 per person employed3 2011: € 49 111 per person employed 2012: € 49 644 per person employed 2010-2011: +1.89% 2011-2012: +1.09%4 Target: Annual increase
3 Baseline values slightly revised following data revision from Eurostat. 4 More recent statistics are currently not available for all member states due to the transition from the former
ESA95 to the new ESA2010 methodology for National Account statistics.
7 move_aar_2014_final
KPI 2
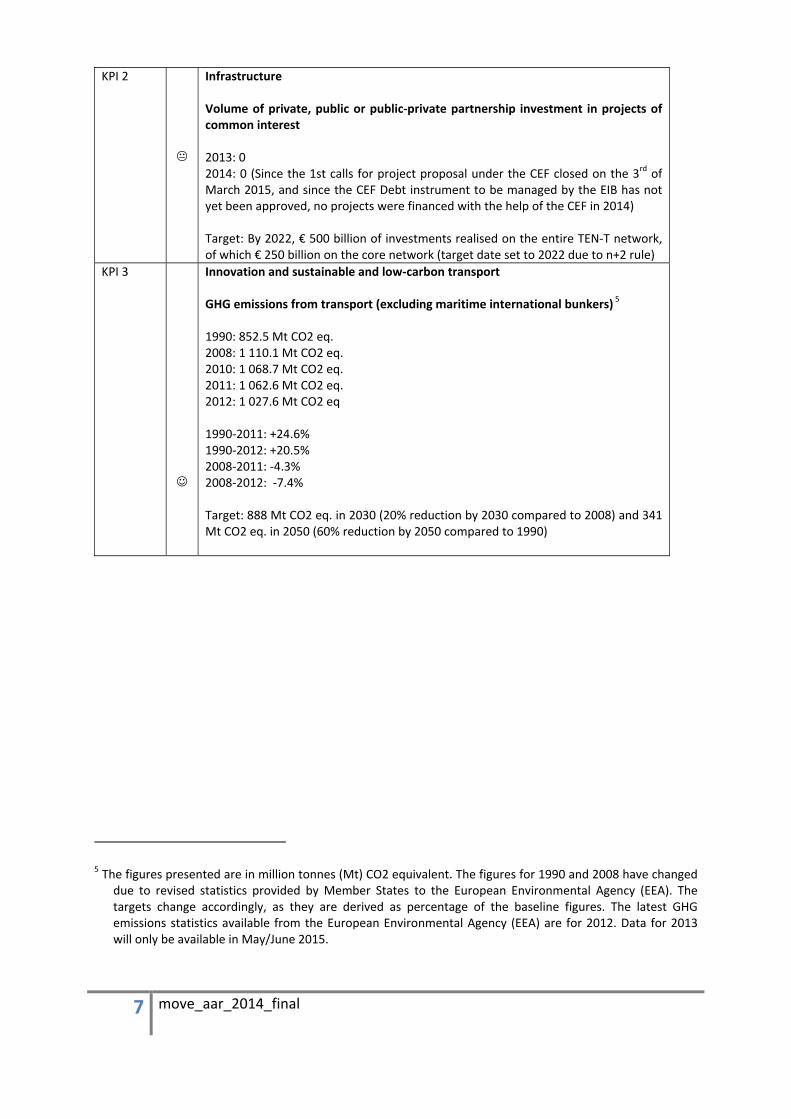
Infrastructure Volume of private, public or public-private partnership investment in projects of common interest 2013: 0 2014: 0 (Since the 1st calls for project proposal under the CEF closed on the 3rd of March 2015, and since the CEF Debt instrument to be managed by the EIB has not yet been approved, no projects were financed with the help of the CEF in 2014) Target: By 2022, € 500 billion of investments realised on the entire TEN-T network, of which € 250 billion on the core network (target date set to 2022 due to n+2 rule)
KPI 3 ☺
Innovation and sustainable and low-carbon transport GHG emissions from transport (excluding maritime international bunkers) 5 1990: 852.5 Mt CO2 eq. 2008: 1 110.1 Mt CO2 eq. 2010: 1 068.7 Mt CO2 eq. 2011: 1 062.6 Mt CO2 eq. 2012: 1 027.6 Mt CO2 eq 1990-2011: +24.6% 1990-2012: +20.5% 2008-2011: -4.3% 2008-2012: -7.4% Target: 888 Mt CO2 eq. in 2030 (20% reduction by 2030 compared to 2008) and 341 Mt CO2 eq. in 2050 (60% reduction by 2050 compared to 1990)
5 The figures presented are in million tonnes (Mt) CO2 equivalent. The figures for 1990 and 2008 have changed due to revised statistics provided by Member States to the European Environmental Agency (EEA). The targets change accordingly, as they are derived as percentage of the baseline figures. The latest GHG emissions statistics available from the European Environmental Agency (EEA) are for 2012. Data for 2013 will only be available in May/June 2015.

8 move_aar_2014_final
KPI 4
☺
Safe and secure transport:
Fatalities in road transport accidents6
Target: Max. 15 750 by 2020 (EU28), i.e. 50% reduction from 2010
KPI 5
Indicator linked to the internal control objectives % of payments made by the contractual deadline7
Target: 100% (annual target)
Note: The table shows five key performance indicators (KPIs) selected in DG MOVE'S Management Plan 2014. These indicators are also shown among the indicators presented under each general and/or specific objective in part 1 of the AAR below. KPIs 1-4 illustrate the achievement of some of the most important general policy objectives for DG MOVE. The presentation in the table has been adapted accordingly to clarify the link between
6 Figures for 2014 are based on estimations and subject to revisions. Figures for fatalities in road transport accidents in 2013 (tentatively indicated as 25500 at the beginning of 2014) were corrected to 26000 at the end of 2014
7 The indicator on payments made by the contractual deadline is based on the on data provided in table 6 of annex 3 to the respective AARs 2011 to 2014.

9 move_aar_2014_final
the objectives and the indicators selected. KPI 5, as required by the instructions for the Annual Activity Report, is linked to the internal control objectives. It should be noted that, in line with the instructions, some changes were made in DG MOVE'S Management Plan 2014 to the selection of KPIs, e.g. to reflect the adoption of the new spending programmes for the period 2014-2020. The indicator used in AAR 2013 showing evolution in consumer prices in transport compared to overall consumer prices is in theory a good indicator for the competitiveness of the internal market. However, as the indicator is also strongly influenced by external factors such as energy price fluctuations, it was replaced in Management Plan 2014 by the above indicator for labour productivity of the transport sector.
The indicators illustrate the progress made towards achieving a more competitive and productive Single European Transport Area, better road safety and the reduction of GHG emission from transport in recent years.
Progress has also been made in modernising Europe's transport infrastructure under the trans-European Transport network (TEN-T) programme8, even if this is not yet visible in the indicator for the new Connecting Europe Facility (CEF). For the CEF 2014 was dedicated to the preparation of the Work Programmes and calls for proposals, which were launched in September 2014, and to the negotiations of a delegation agreement with the EIB for the implementation of the CEF Debt financial instruments. Since the 1st calls for project proposal under the CEF closed 3 March 2015, and since the CEF Debt instrument to be managed by the EIB has not yet been approved, no projects were financed with the help of the CEF in 2014. In 2015, the projects will start receiving financing from the Connecting Europe Facility;
The evolution of KPI 5 shows that DG MOVE remains consistent as regards the percentage of payments paid within the legal time limits set up by the Financial Regulation.
Further efforts are needed in particular to achieve the long term targets set in the White Paper for modernising Europe's transport infrastructure, decarbonising transport and reducing fatalities in road transport accidents in an efficient Single European Transport area.
Continued focus shall therefore be given to how investments in transport infrastructure co-financed by the Connecting Europe Facility and additional private funds mobilised by the use of innovative financial instruments can contribute effectively to the € 315 billion investment plan of the Union, presented by President Juncker in November 2014, as part of the Commission's jobs, growth and investment initiative. Further decarbonisation of transport, improved energy efficiency and stronger efforts on research, innovation and competitiveness are key elements of the contribution of transport to the Energy Union package, adopted by the Commission on 25.2.2015 (COM(2015) 80 final). The Commission's priority initiative for a Connected Digital Single Market will also promote the use of ICT and enhance data availability in transport. The aim is to facilitate the development of a new generation of safer vehicles connected to each other and to transport infrastructure.
Further information on all our policies and more is available on our website:
8 The progress on certain projects can also be assessed on the basis of the Annual Reports by the European Coordinators (see http://ec.europa.eu/transport/themes/infrastructure/ten-t-policy/priority-projects/annual-reports_en.htm)

10 move_aar_2014_final
http://ec.europa.eu/dgs/transport/index_en.htm.
Additional performance indicators on transport in the European Union can be found in the EU Transport Scoreboard:
http://ec.europa.eu/transport/facts-fundings/scoreboard/index_en.htm
11 move_aar_2014_final
Policy highlights of the year (executive summary of part 1)
The transport sector is a key element of the Europe 2020 strategy for generating growth and jobs. Adequate infrastructure, intelligent transport systems, measures to improve the environmental performance of the transport sector and the promotion of new technologies, inter alia through increased research, developments and demonstration, are important instruments to this effect. These policies therefore contribute to the 20/20/20 targets for GHG emissions, renewable energy and energy efficiency and the targets of 3% of GDP in R&D.
DG MOVE's activities in 2014 continued to focus on implementing the Commission's strategy for the transport area set out in the White Paper on the Future of Transport in March 20119.
The overall strategic objectives were formalised in four different "general objectives" in DG MOVE's Management Plan 2014. One general objective is linked to the completion of a competitive, sustainable and safe and secure Single European Transport Area, two general objectives are linked to the implementation of transport infrastructure policy and its financing under the Connecting Europe Facility and the last general objective is linked to research and innovation activities in the transport area under Horizon 2020. In order to address these objectives and challenges, the Commission took forward several important policy initiatives in 2014.
In 2014 the Commission has continued its work for the development of the single European transport area. The Council and Parliament has been examining throughout 2014 several policy initiatives proposed by the Commission earlier such as the Forth Railway Package, Single European Sky (SES II +), Airports Package and Air Passenger rights. Unfortunately, for aviation proposals the discussions in the Council have been locked in stalemate due to external factors (disagreement between the UK and Spain on Gibraltar).
On Port's Policy the Commission has continued the legislative negotiations of the Action Plan "Ports: an engine for growth" and in inland waterway transport the Naiades II proposal. These proposals, adopted by the Commission in 2013, aim to enhance the investment climate and boost the environmental and innovation profile of the sectors.
With an aim to improve air safety, the regulation on occurrence reporting in civil aviation was adopted. Also, the EU Aviation safety list has been updated twice in 2014.
Equally important proposals that should enhance road safety have been adopted. The Roadworthiness package consists of three directives dealing with periodic roadworthiness tests, registration documents and technical roadside inspections. Furthermore, in this domain, the Commission adopted the implementing directive on compulsory use of safety
9 White Paper "Roadmap to a Single European Transport Area – Towards a competitive and resource efficient transport system" (COM(2011) 144 final of 28.03.2011).

12 move_aar_2014_final
belts and child restraint systems in vehicles.
On Air security, legal acts on strengthening the detection capability in respect of cabin baggage screening were negotiated. Also, the Commission adopted the legislation on the use of explosive trace detection, a long awaited mean for enhancing explosive detection capacity of airports.
A new regulation on noise-related operating restrictions at Union airports was adopted in 2014.
In international fora on road transport the Commission participated in negotiations to amend AETR (European agreement concerning the Work of crews of vehicles engaged in International Road transport) to allow the EU to become a Party to the Agreement and thus better ensure the application of the EU social rules in road transport in the neighbouring countries. The Commission is also working on enlarging the scope of the Interbus agreement to cover the international regular carriage of passengers by coach and bus.
Highlights in international cooperation transport were the Association Agreements signed with Ukraine, Georgia and the Republic of Moldova. Regional cooperation was pursued in the framework of the Eastern Partnership, the EuroMed dialogue, ASEAN countries and Western Balkan countries. As for the Northern Dimension Partnership on Transport and Logistics (NDPTL), it has been locked in stalemate due to the events in Ukraine. DG MOVE continued to be involved in bilateral dialogues and negotiations in the area of transport with key partners, such as the US, Brazil, Canada, India and Gulf countries.
The Commission was also involved in ICAO (International Civil Aviation Organisation) where further progress was made towards establishing open and fair competition in international air transport, particularly, a vision on the liberalisation of international air transport and a set of core principles for consumer protection were recommended for adoption (both proposals were based upon the European model).
In the international maritime domain, the EU actively participated in IMO (International Maritime Organisation), particularly the EU prepared several submissions on passenger ship safety.
Under the Connecting Europe Facility (CEF) the year 2014 focussed on activities launching the implementation of the new Regulation on Union Guidelines for the development of the trans-European transport network. In this respect draft corridor work plans were prepared and submitted to the Member states.
In line with the new priorities of the Commission, DG MOVE has provided the required input and material support to conceive and draft the proposal for a Regulation establishing the European Fund for Strategic Investments (EFSI) launched under the initiative of President Juncker.
Furthermore, the Commission and INEA launched on 11 September 2014 the 1st CEF-transport calls for proposals, accounting for an amount of almost € 12 billion.
Important actions were taken to promote research and innovation activities in the
13 move_aar_2014_final
transport area under Horizon 2020. In 2014 DG MOVE (together with RTD) launched the first transport related calls of Horizon 2020.
On innovation, the Commission is setting up the Shift 2 Rail Joint undertaking – a new public-private partnership under Horizon 2020 for a coordinated approach on rail research and innovation. The aim is to avoid fragmentation of research and innovation efforts, thus avoiding costly overlaps and duplication, and to ensure a significantly higher leverage effect of EU funds by making EU funding conditional to firm financial commitments from the rail industry.
Moreover, in 2014 Council adopted the extension of the SESAR Joint Undertaking (SJU) until 2024. Under Horizon 2020 the EU will contribute € 585 million to this joint undertaking with an aim to improve European and global air traffic management system. The Second Mid-Term Evaluation of the SJU underlines its effectiveness and European added value in avoiding duplication and lack of coordination of Air Traffic Management Research & Development in the EU10.
To promote low-carbon transport, the Directive on the deployment of alternative fuels infrastructure was adopted by the European Parliament and the Council in 2014. The co-legislators also reached an agreement on the amendments to the Maximum Weights and Dimensions directive, which paves the way for new more aerodynamic (hence greener) and safer vehicles to be placed on the market.
The legislative proposal for the deployment of the interoperable EU-wide eCall in the public safety answering points was adopted by the Parliament and Council. Equally, the Commission has proposed specifications on provisions of EU-wide real-time traffic information services by a delegated regulation. In general, the Commission has continued its work on ITS Directive implementation.
In 2014, the Commission launched the URBAN mobility package implementation and worked actively on promoting the CIVITAS initiative and the Smart cities and innovation partnership.
The key performance indicators presented above illustrate the progress made towards achieving a more competitive and productive Single European Transport Area, better road safety and the reduction of GHG emission from transport in recent years. Progress has also been made in modernising Europe's transport infrastructure under the trans-European Transport network (TEN-T) programme and promoting research and innovation activities related to transport under Horizon 2020. The results achieved contribute to improving the life of European citizens and the economic framework conditions for businesses and to the Europe 2020 strategy objectives for generating growth and jobs.
10 For further details see section 1.1.3 below and annex 9.
14 move_aar_2014_final
Part 1 of the annual activity report below further evaluates the implementation of the Management Plan 2014, in particular the progress made towards meeting transport policy's general and specific objectives. The main achievements for each are summarised below for each specific objective linked to the three operational ABB areas under the responsibility of DG MOVE.
As evidenced by the information presented the policy activities as well as the two spending programmes (financing of transport infrastructure under the Connecting Europe Facility and research and innovation activities related to transport under Horizon 2020) managed by DG MOVE are on course to meet their multiannual objectives and generally achieved the annual performance indicators or outputs and milestones in the reporting year.
Key conclusions on resource management and internal control effectiveness (executive summary on part 2 and 3)
In accordance with the governance statement of the European Commission, the staff of DG MOVE conducts its operations in compliance with the applicable laws and regulations, working in an open and transparent manner and meeting the expected high level of professional and ethical standards.
The Commission has adopted a set of internal control standards, based on international good practice, aimed to ensure the achievement of policy and operational objectives. As required by the Financial Regulation, the Director-General has put in place the organisational structure and the internal control systems suited to the achievement of the policy and control objectives, in accordance with the standards and having due regard to the risks associated with the environment in which it operates.
DG MOVE has assessed the effectiveness of its key internal control systems during the reporting year and has concluded that the internal control standards are effectively implemented, with improvements needed notably for ICS 12 (Information and communication), prioritised in 2015.
Furthermore, in the course of 2014, DG MOVE took measures to further improve the efficiency of its internal control systems in the relation to ICS 3 (Staff Allocation and Mobility) and ICS 14 (Evaluation of Activities) as reported in Part 3.
In addition, DG MOVE has systematically examined the available control results and indicators, including those aimed to supervise entities to which it has entrusted budget implementation tasks, as well as the observations and recommendations issued by internal auditors and the European Court of Auditors. These elements have been assessed to determine their impact on the management's assurance as regards the achievement of control objectives. Please refer to Part 2 for further details.
In conclusion, management has reasonable assurance that, overall, suitable controls are in place and working as intended; risks are being appropriately monitored and mitigated; and necessary improvements and reinforcements are being implemented. The Director General,

15 move_aar_2014_final
in his capacity as Authorising Officer by Delegation has signed the Declaration of Assurance albeit qualified by a reservation concerning FP7.
Information to the Commissioner
The main elements of this report and assurance declaration have been brought to the attention of Commissioner Violeta Bulc, responsible for Transport.
16 move_aar_2014_final
1. POLICY ACHIEVEMENTS
1.1 Achievement of general and specific objectives
DG MOVE policies aim to provide European citizens and businesses with competitive, sustainable, secure and safe transport services. The transport sector is a key element of the Europe 2020 strategy. Adequate infrastructure, intelligent transport systems, measures to improve the environmental performance of the transport sector and the promotion of new technologies, inter alia through increased research, developments and demonstration, are important instruments to this effect. These policies therefore contribute to the 2020 Strategy, in particular for reaching the 20/20/20 targets for GHG emissions, renewable energy and energy efficiency and the targets of 3% of GDP in R&D.
Acknowledging the importance of reducing greenhouse gas emissions and of risks related to fossil fuel dependency in transport, the 2030 climate and energy policy framework reiterates the need for examining instruments and measures for a comprehensive and technology neutral approach for the promotion of emissions reduction and energy efficiency in transport, for electric transportation and for renewable energy sources in transport also after 2020.
DG MOVE breaks down these overall objectives into four different "general objectives". One general objective is linked to the completion of a competitive Single European Transport Area, two general objectives are linked to the implementation of the Connecting Europe Facility and the last general objective is linked to research and innovation activities in the transport area under Horizon 2020. In turn each of the "general objectives" is broken down into a number of more "specific objectives".
Completion of a competitive Single European Transport Area
General objective:
• General objective 1: To provide citizens and businesses with a framework for efficient and high quality transport services, extend the single transport area to neighbouring countries and ensure open and fair competition in relations with key partners
Specific objectives:
• Specific objective 1: To make the European transport market more competitive, including in the global transport business
• Specific objective 2: To promote safe and secure transport • Specific objective 3: To promote quality transport services and fair working
conditions • Specific objective 4: To promote multi-modality and modal shift

17 move_aar_2014_final
Connecting Europe Facility (CEF)
General objectives:
• General objective 2: to contribute to smart, sustainable and inclusive growth by developing modern and high performing trans-European networks.
• General objective 3: to enable the Union to achieve its sustainable development targets, including a minimum 20 % reduction of greenhouse gas emissions compared to 1990 levels and a 20 % increase in energy efficiency, and raising the share of renewable energy to 20 % by 2020.
Specific objectives:
• Specific objective 5: to enable more performing transport infrastructure by removing bottlenecks, enhancing rail interoperability, bridging missing links and improving cross-border sections.
• Specific objective 6: to ensure sustainable and efficient transport systems in the long run
• Specific objective 7: to optimise the integration and interconnection of transport modes and enhancing the interoperability of transport services
• Specific objective 8: to create an environment more conducive to private and public investments
Research and innovation activities in the transport area under Horizon 2020
General objective:
• General objective 4: To promote innovation and research in Transport
Specific objectives:
• Specific objective 9: To promote innovation for resource efficient transport that respects the environment
• Specific objective 10: To innovate towards better mobility, with more safety and security and less congestion,
Within Part 1 of the Annual Activity Report, information is provided on the progress towards the achievement of the policy objectives established in DG MOVE's Management Plan 2014, on the basis of available information at the moment of reporting. The structure used for the reporting in the Annual Activity Report therefore "mirrors" the structure of the Management Plan in order to facilitate comparison. The information covers important outputs delivered by DG MOVE during 2014, as well as mid-term results and long-term impacts whose achievement may be influenced by factors beyond the control of the DG and the Commission.

18 move_aar_2014_final
It is important to note that the implementation of the Management Plan (and in particular achieving objectives and seeing improvements in the indicators) does not only depend on the Commission. It is for the European Parliament and Council to decide on the Commission's proposals and then primarily for the Member States to implement them. In addition, there are often measures that will contribute to the actions that are outside the scope of EU competence. In particular obtaining authorisations to negotiate depends on Council decisions and the success of negotiations with international partners depends on the willingness of both sides to achieve compromise solutions. Finally, external factors, such as energy price fluctuations or the general economic situation, can have a significant influence. No major changes of objectives, indicators and targets established in the Management Plan 2014 have been made. When an indicator has been discontinued this is specified in more details in the sections below.
DG MOVE's selected "impact indicators" for each general objective are presented in the tables in section 1.1.1 below.
In the subsequent sections "result indicators" measuring progress towards achieving the specific objectives are presented. The specific objectives are grouped by the operational activity areas of DG MOVE, also called "Activity-Based Budgeting" (ABB) activities. In 2014 these ABB activities were section 1.1.2. European Transport Policy, which also includes under 1.1.2.1 Transport infrastructure policy financed under the Connecting Europe Facility (CEF), and section 1.1.3 Research and innovation related to transport under the framework programme Horizon 2020.
Along with the ABB activities and indicators, information on the achievement of the most significant outputs (i.e. the policy proposals, documents and decisions adopted) planned for 2014 is also given.

19 move_aar_2014_final
1.1.1 DG MOVE General Objectives and Impact Indicators General objective 1: To provide citizens and businesses with a framework for efficient and high quality transport services, extend the single transport area to neighbouring countries and ensure open and fair competition in relations with key partners
⌧Spending programme
⌧ Non-spending
Impact indicator Baseline (year) Current situation
Milestones Target in MP 2014
KPI:
Labour productivity of the transport sector (Gross value added divided by total employment, Source: Eurostat) (A3)
€ 48 198 per person employed (2010) 11
(EU 28)
2011: € 49 111 per person employed 2012: € 49 644 per person employed12 2010-2011: +1.89% 2011-2012: +1.09%
Annual increase
KPI:
Number of fatalities in road transport accidents (Source: CARE) (C4)
31 500 (2010)
(EU28 )
2011: 30 700
2012: 28 200
2013: 26 000
2014: 25 700
Halving road casualties by 2020:
Max 15 750 (EU 28) by 202013
By 2050, move close to zero fatalities in road transport
Satisfaction with airline/ railway / local transport services (Source: Market Performance Indicators SANCO) (A3)
Airline services: 77.7
Railway services: 70.8
Urban transport: 76.2 (2010)
Airline services:
2011: 78.8
2012: 79.5
2013: 79.4
Railway services:
2011: 69.9
2012: 71
2013: 72.7
Urban transport:
2011: 76
2012: 75.2
2013: 75.5
Fully satisfied European consumers of transport services by 2020 (as close as possible to 100) 14
11 Baseline values slightly revised following data revision from Eurostat. 12 More recent statistics are currently not available for all member states due to the transition from the former
ESA95 to the new ESA2010 methodology for National Account statistics. 13 New strategic guidelines for road safety (2011-2020) have set up a new target for the decade, i.e. 50% of
reduction of road fatalities by 2020. 14 The target was revised to a target of an annual increase in the 2015 Management Plan based on the current
development.
20 move_aar_2014_final
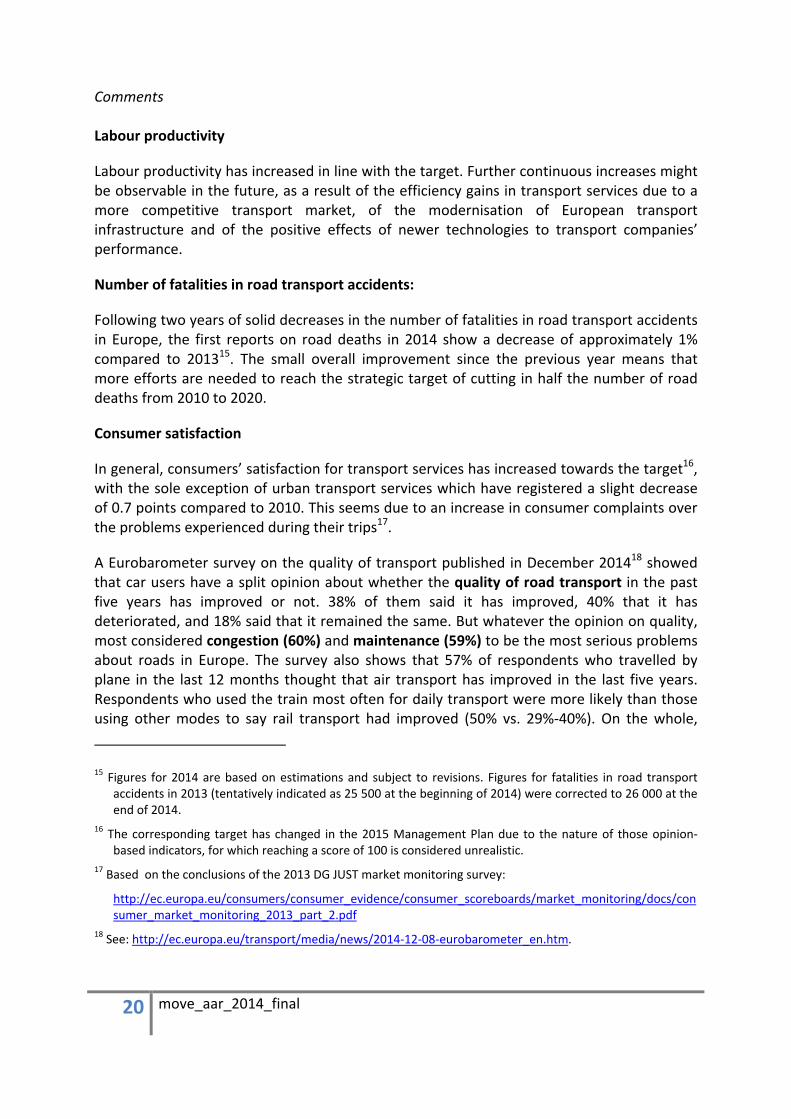
Comments Labour productivity
Labour productivity has increased in line with the target. Further continuous increases might be observable in the future, as a result of the efficiency gains in transport services due to a more competitive transport market, of the modernisation of European transport infrastructure and of the positive effects of newer technologies to transport companies’ performance.
Number of fatalities in road transport accidents:
Following two years of solid decreases in the number of fatalities in road transport accidents in Europe, the first reports on road deaths in 2014 show a decrease of approximately 1% compared to 201315. The small overall improvement since the previous year means that more efforts are needed to reach the strategic target of cutting in half the number of road deaths from 2010 to 2020.
Consumer satisfaction
In general, consumers’ satisfaction for transport services has increased towards the target16, with the sole exception of urban transport services which have registered a slight decrease of 0.7 points compared to 2010. This seems due to an increase in consumer complaints over the problems experienced during their trips17.
A Eurobarometer survey on the quality of transport published in December 201418 showed that car users have a split opinion about whether the quality of road transport in the past five years has improved or not. 38% of them said it has improved, 40% that it has deteriorated, and 18% said that it remained the same. But whatever the opinion on quality, most considered congestion (60%) and maintenance (59%) to be the most serious problems about roads in Europe. The survey also shows that 57% of respondents who travelled by plane in the last 12 months thought that air transport has improved in the last five years. Respondents who used the train most often for daily transport were more likely than those using other modes to say rail transport had improved (50% vs. 29%-40%). On the whole,
15 Figures for 2014 are based on estimations and subject to revisions. Figures for fatalities in road transport accidents in 2013 (tentatively indicated as 25 500 at the beginning of 2014) were corrected to 26 000 at the end of 2014.
16 The corresponding target has changed in the 2015 Management Plan due to the nature of those opinion-based indicators, for which reaching a score of 100 is considered unrealistic.
17 Based on the conclusions of the 2013 DG JUST market monitoring survey:
http://ec.europa.eu/consumers/consumer_evidence/consumer_scoreboards/market_monitoring/docs/consumer_market_monitoring_2013_part_2.pdf
18 See: http://ec.europa.eu/transport/media/news/2014-12-08-eurobarometer_en.htm.
21 move_aar_2014_final
respondents were slightly more likely to be positive about the quality of rail transport in the last five years, with 34% saying it had improved and 27% saying it had deteriorated.
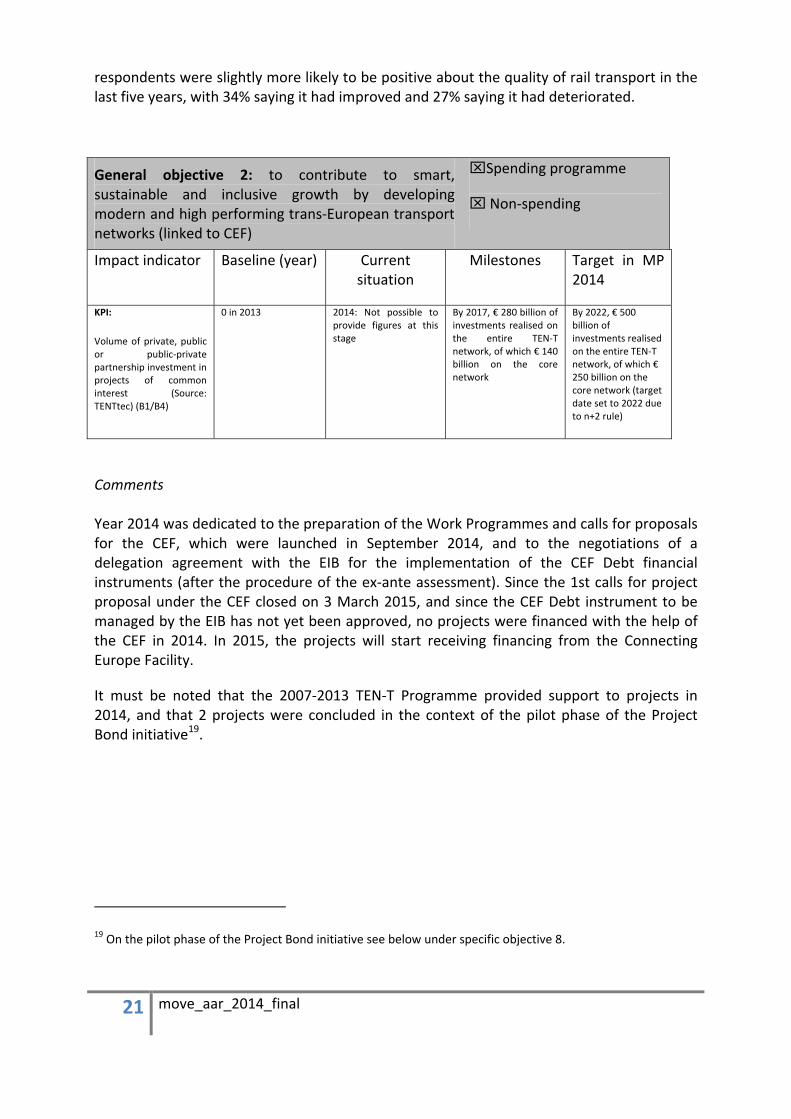
General objective 2: to contribute to smart, sustainable and inclusive growth by developing modern and high performing trans-European transport networks (linked to CEF)
⌧Spending programme
⌧ Non-spending
Impact indicator Baseline (year) Current situation
Milestones Target in MP 2014
KPI:
Volume of private, public or public-private partnership investment in projects of common interest (Source: TENTtec) (B1/B4)
0 in 2013 2014: Not possible to provide figures at this stage
By 2017, € 280 billion of investments realised on the entire TEN-T network, of which € 140 billion on the core network
By 2022, € 500 billion of investments realised on the entire TEN-T network, of which € 250 billion on the core network (target date set to 2022 due to n+2 rule)
Comments Year 2014 was dedicated to the preparation of the Work Programmes and calls for proposals for the CEF, which were launched in September 2014, and to the negotiations of a delegation agreement with the EIB for the implementation of the CEF Debt financial instruments (after the procedure of the ex-ante assessment). Since the 1st calls for project proposal under the CEF closed on 3 March 2015, and since the CEF Debt instrument to be managed by the EIB has not yet been approved, no projects were financed with the help of the CEF in 2014. In 2015, the projects will start receiving financing from the Connecting Europe Facility.
It must be noted that the 2007-2013 TEN-T Programme provided support to projects in 2014, and that 2 projects were concluded in the context of the pilot phase of the Project Bond initiative19.
19 On the pilot phase of the Project Bond initiative see below under specific objective 8.
22 move_aar_2014_final
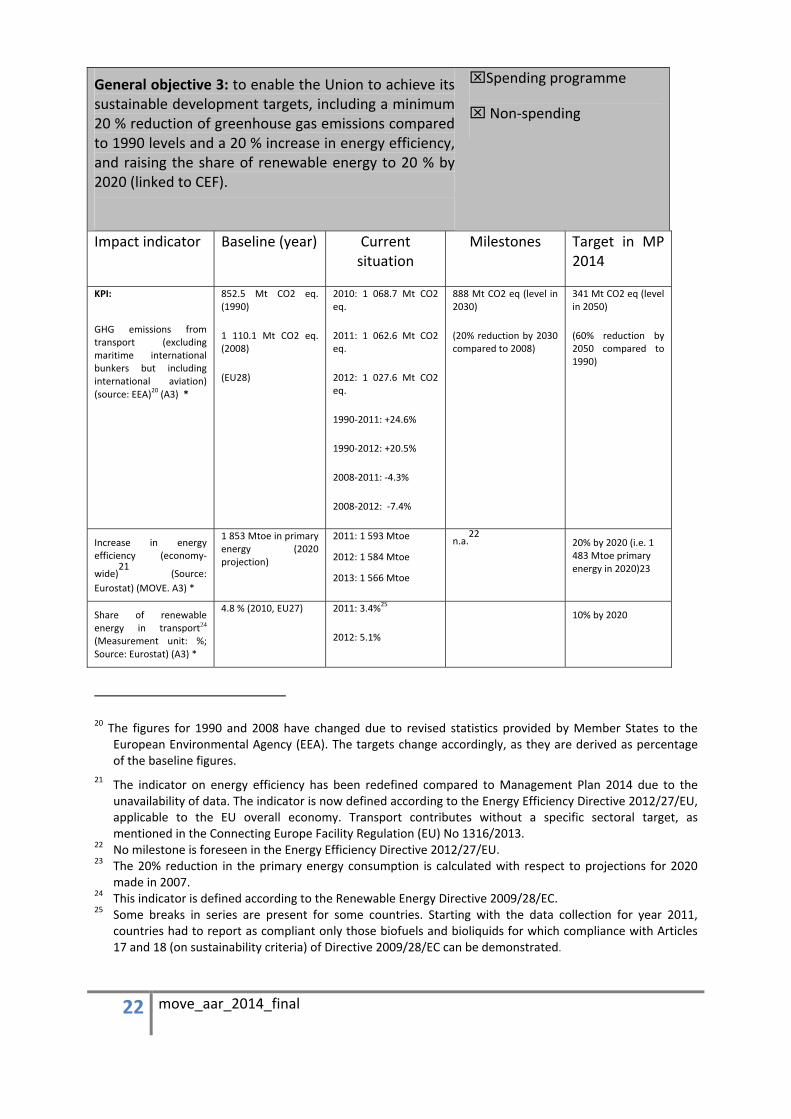
General objective 3: to enable the Union to achieve its sustainable development targets, including a minimum 20 % reduction of greenhouse gas emissions compared to 1990 levels and a 20 % increase in energy efficiency, and raising the share of renewable energy to 20 % by 2020 (linked to CEF).
⌧Spending programme
⌧ Non-spending
Impact indicator Baseline (year) Current situation
Milestones Target in MP 2014
KPI:
GHG emissions from transport (excluding maritime international bunkers but including international aviation) (source: EEA)20 (A3) *
852.5 Mt CO2 eq. (1990)
1 110.1 Mt CO2 eq. (2008)
(EU28)
2010: 1 068.7 Mt CO2 eq.
2011: 1 062.6 Mt CO2 eq.
2012: 1 027.6 Mt CO2 eq.
1990-2011: +24.6%
1990-2012: +20.5%
2008-2011: -4.3%
2008-2012: -7.4%
888 Mt CO2 eq (level in 2030)
(20% reduction by 2030 compared to 2008)
341 Mt CO2 eq (level in 2050)
(60% reduction by 2050 compared to 1990)
Increase in energy efficiency (economy-
wide)21
(Source: Eurostat) (MOVE. A3) *
1 853 Mtoe in primary energy (2020 projection)
2011: 1 593 Mtoe
2012: 1 584 Mtoe
2013: 1 566 Mtoe
n.a.22 20% by 2020 (i.e. 1
483 Mtoe primary energy in 2020)23
Share of renewable energy in transport24 (Measurement unit: %; Source: Eurostat) (A3) *
4.8 % (2010, EU27) 2011: 3.4%25
2012: 5.1% 10% by 2020
20 The figures for 1990 and 2008 have changed due to revised statistics provided by Member States to the European Environmental Agency (EEA). The targets change accordingly, as they are derived as percentage of the baseline figures.
21 The indicator on energy efficiency has been redefined compared to Management Plan 2014 due to the unavailability of data. The indicator is now defined according to the Energy Efficiency Directive 2012/27/EU, applicable to the EU overall economy. Transport contributes without a specific sectoral target, as mentioned in the Connecting Europe Facility Regulation (EU) No 1316/2013.
22 No milestone is foreseen in the Energy Efficiency Directive 2012/27/EU. 23 The 20% reduction in the primary energy consumption is calculated with respect to projections for 2020
made in 2007. 24 This indicator is defined according to the Renewable Energy Directive 2009/28/EC. 25 Some breaks in series are present for some countries. Starting with the data collection for year 2011,
countries had to report as compliant only those biofuels and bioliquids for which compliance with Articles 17 and 18 (on sustainability criteria) of Directive 2009/28/EC can be demonstrated.
23 move_aar_2014_final
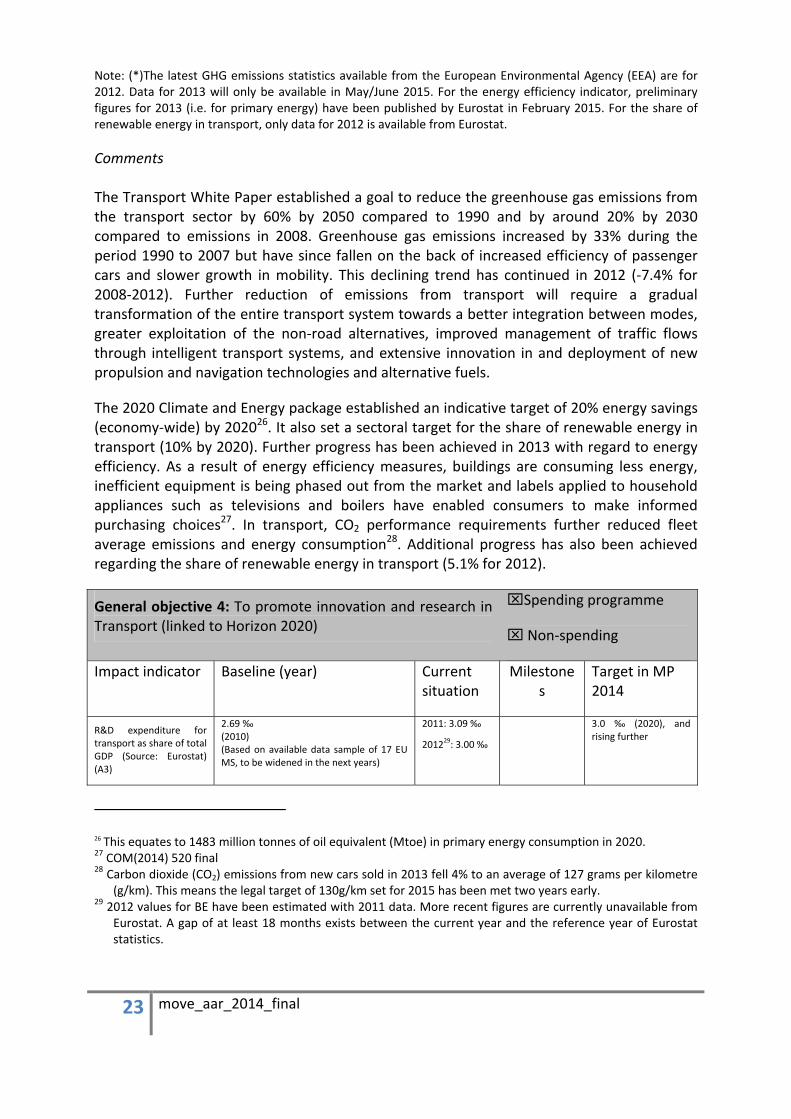
Note: (*)The latest GHG emissions statistics available from the European Environmental Agency (EEA) are for 2012. Data for 2013 will only be available in May/June 2015. For the energy efficiency indicator, preliminary figures for 2013 (i.e. for primary energy) have been published by Eurostat in February 2015. For the share of renewable energy in transport, only data for 2012 is available from Eurostat.
Comments The Transport White Paper established a goal to reduce the greenhouse gas emissions from the transport sector by 60% by 2050 compared to 1990 and by around 20% by 2030 compared to emissions in 2008. Greenhouse gas emissions increased by 33% during the period 1990 to 2007 but have since fallen on the back of increased efficiency of passenger cars and slower growth in mobility. This declining trend has continued in 2012 (-7.4% for 2008-2012). Further reduction of emissions from transport will require a gradual transformation of the entire transport system towards a better integration between modes, greater exploitation of the non-road alternatives, improved management of traffic flows through intelligent transport systems, and extensive innovation in and deployment of new propulsion and navigation technologies and alternative fuels.
The 2020 Climate and Energy package established an indicative target of 20% energy savings (economy-wide) by 202026. It also set a sectoral target for the share of renewable energy in transport (10% by 2020). Further progress has been achieved in 2013 with regard to energy efficiency. As a result of energy efficiency measures, buildings are consuming less energy, inefficient equipment is being phased out from the market and labels applied to household appliances such as televisions and boilers have enabled consumers to make informed purchasing choices27. In transport, CO2 performance requirements further reduced fleet average emissions and energy consumption28. Additional progress has also been achieved regarding the share of renewable energy in transport (5.1% for 2012).
General objective 4: To promote innovation and research in Transport (linked to Horizon 2020)
⌧Spending programme
⌧ Non-spending
Impact indicator Baseline (year) Current situation
Milestones
Target in MP 2014
R&D expenditure for transport as share of total GDP (Source: Eurostat) (A3)
2.69 ‰ (2010) (Based on available data sample of 17 EU MS, to be widened in the next years)
2011: 3.09 ‰
201229: 3.00 ‰ 3.0 ‰ (2020), and
rising further
26 This equates to 1483 million tonnes of oil equivalent (Mtoe) in primary energy consumption in 2020. 27 COM(2014) 520 final 28 Carbon dioxide (CO2) emissions from new cars sold in 2013 fell 4% to an average of 127 grams per kilometre
(g/km). This means the legal target of 130g/km set for 2015 has been met two years early. 29 2012 values for BE have been estimated with 2011 data. More recent figures are currently unavailable from
Eurostat. A gap of at least 18 months exists between the current year and the reference year of Eurostat statistics.
24 move_aar_2014_final
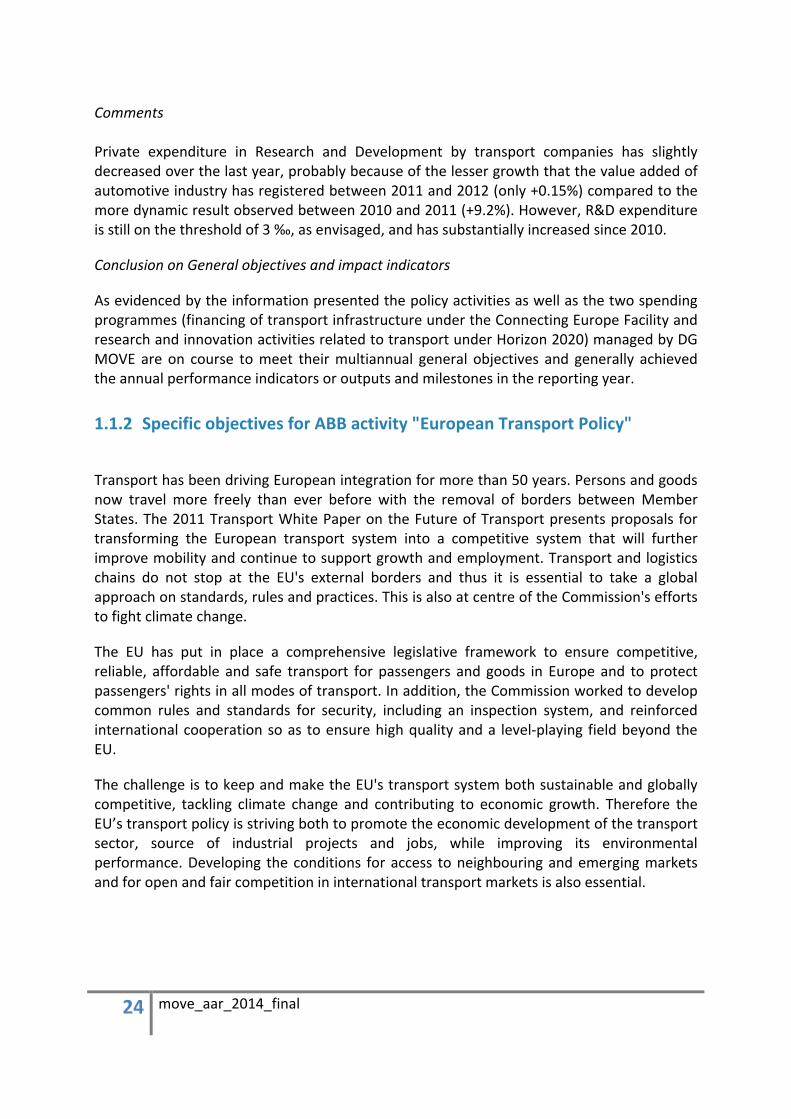
Comments Private expenditure in Research and Development by transport companies has slightly decreased over the last year, probably because of the lesser growth that the value added of automotive industry has registered between 2011 and 2012 (only +0.15%) compared to the more dynamic result observed between 2010 and 2011 (+9.2%). However, R&D expenditure is still on the threshold of 3 ‰, as envisaged, and has substantially increased since 2010.
Conclusion on General objectives and impact indicators
As evidenced by the information presented the policy activities as well as the two spending programmes (financing of transport infrastructure under the Connecting Europe Facility and research and innovation activities related to transport under Horizon 2020) managed by DG MOVE are on course to meet their multiannual general objectives and generally achieved the annual performance indicators or outputs and milestones in the reporting year.
1.1.2 Specific objectives for ABB activity "European Transport Policy"
Transport has been driving European integration for more than 50 years. Persons and goods now travel more freely than ever before with the removal of borders between Member States. The 2011 Transport White Paper on the Future of Transport presents proposals for transforming the European transport system into a competitive system that will further improve mobility and continue to support growth and employment. Transport and logistics chains do not stop at the EU's external borders and thus it is essential to take a global approach on standards, rules and practices. This is also at centre of the Commission's efforts to fight climate change.
The EU has put in place a comprehensive legislative framework to ensure competitive, reliable, affordable and safe transport for passengers and goods in Europe and to protect passengers' rights in all modes of transport. In addition, the Commission worked to develop common rules and standards for security, including an inspection system, and reinforced international cooperation so as to ensure high quality and a level-playing field beyond the EU.
The challenge is to keep and make the EU's transport system both sustainable and globally competitive, tackling climate change and contributing to economic growth. Therefore the EU’s transport policy is striving both to promote the economic development of the transport sector, source of industrial projects and jobs, while improving its environmental performance. Developing the conditions for access to neighbouring and emerging markets and for open and fair competition in international transport markets is also essential.

25 move_aar_2014_final
The work of the three European Agencies30 that work on safety is also covered by this ABB activity. Their work contributes to harmonising technical rules and safety and checking their implementation.
Implementation of activities in the area of European Transport Policy is generally progressing according to plan. More detailed information on individual initiatives can be found below under each specific objective.
Relevant general objective(s): General objective 1
Specific objective 1: To make the internal transport market more competitive, including in the global transport business
⌧Spending programme
⌧ Non-spending
Result indicator Baseline (year) Current situation
Milestone Target in MP 2014
Share of rail freight market held by new entrants (cumulative) (measurement unit: market share (%) tonnes/km; Source: Rail Market Monitoring Scheme Report) (MOVE.B2)
10% in 2004 31/12/2012: 27% reached (for all Member States)
31/12/2013: Estimated 32% of the total EU Rail freight market 31
More than 27% by 2015 (27% reached by 2012)
(Target set by DG MOVE based on results obtained in 2012)
Number of harmonised administrative single windows for maritime transport in the 23 Member States with seaports (source: Member States expert group) (MOVE.D1)
0 in 2013 (Implementation will only be done starting from 1/6/2015)
0 in 2014 (Implementation will only be done starting from 1/6/2015)
23 Member States by 2015
Performance of the core TEN-T ports (labour productivity, quality, modal share of hinterland) (MOVE.B3)
Baseline to be defined by the project PORTOPIA, March 2014
Methodological difficulties and reluctance of ports to provide data delay the establishment of this indicator, including baseline.
By 2030 Modal share: 30% by rail or Inland Waterway Transport (IWT) Productivity and quality equivalent the one of the ports of the Northern range
Number of rail freight corridors with a single management structure
6 rail freight corridors operational by November 2013
31/12/2014: 6 rail freight corridors
9 corridors in total by 2015
30 The European Maritime Safety Agency, the European Aviation Safety Agency and the European Railways Agency.
31 New entrants in this context includes incumbents of one MS operating on the market of another MS.
26 move_aar_2014_final
(MOVE.B2) operational – 3 additional should be operational by November 2015
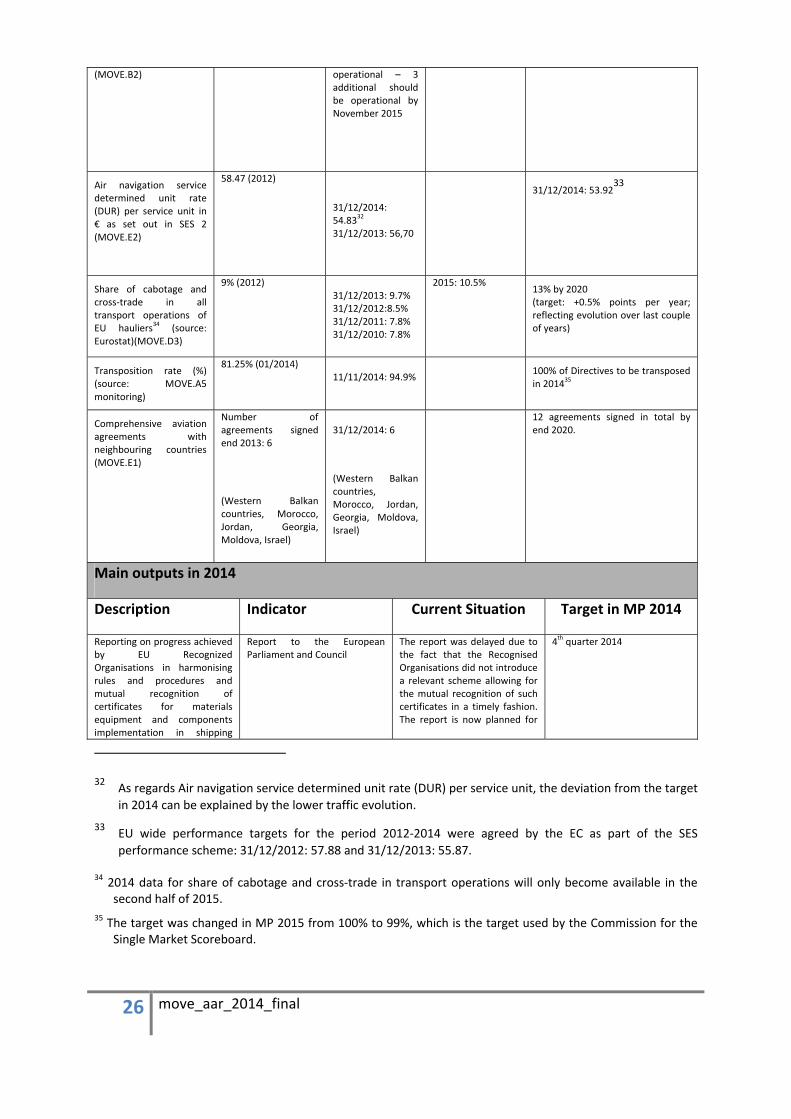
Air navigation service determined unit rate (DUR) per service unit in € as set out in SES 2 (MOVE.E2)
58.47 (2012)
31/12/2014: 54.8332 31/12/2013: 56,70
31/12/2014: 53.9233
Share of cabotage and cross-trade in all transport operations of EU hauliers34 (source: Eurostat)(MOVE.D3)
9% (2012) 31/12/2013: 9.7% 31/12/2012:8.5% 31/12/2011: 7.8% 31/12/2010: 7.8%
2015: 10.5% 13% by 2020 (target: +0.5% points per year; reflecting evolution over last couple of years)
Transposition rate (%) (source: MOVE.A5 monitoring)
81.25% (01/2014) 11/11/2014: 94.9% 100% of Directives to be transposed
in 201435
Comprehensive aviation agreements with neighbouring countries (MOVE.E1)
Number of agreements signed end 2013: 6
(Western Balkan countries, Morocco, Jordan, Georgia, Moldova, Israel)
31/12/2014: 6
(Western Balkan countries, Morocco, Jordan, Georgia, Moldova, Israel)
12 agreements signed in total by end 2020.
Main outputs in 2014
Description Indicator Current Situation Target in MP 2014
Reporting on progress achieved by EU Recognized Organisations in harmonising rules and procedures and mutual recognition of certificates for materials equipment and components implementation in shipping
Report to the European Parliament and Council
The report was delayed due to the fact that the Recognised Organisations did not introduce a relevant scheme allowing for the mutual recognition of such certificates in a timely fashion. The report is now planned for
4th quarter 2014
32 As regards Air navigation service determined unit rate (DUR) per service unit, the deviation from the target in 2014 can be explained by the lower traffic evolution.
33 EU wide performance targets for the period 2012-2014 were agreed by the EC as part of the SES performance scheme: 31/12/2012: 57.88 and 31/12/2013: 55.87.
34 2014 data for share of cabotage and cross-trade in transport operations will only become available in the second half of 2015.
35 The target was changed in MP 2015 from 100% to 99%, which is the target used by the Commission for the Single Market Scoreboard.

27 move_aar_2014_final
(according to article 10.2 of Regulation (EC) 391/2009). (MOVE.D2)
2nd quarter 2015
Review of EU rules concerning access to the EU road haulage market and access to the occupation (likely roll-over from 2013) (MOVE.D3)
Adoption of a Commission proposal
The initiative will be proposed in a different form as part of the 2016 road package.
4th quarter 2014
Mandate to start negotiations for a road transport agreement between EU and third countries (roll-over from 2013) (MOVE.D3)
Finalisation of the economic impact study
COM proposal for a mandate
Economic impact study has been finalised. The political opportunity of concluding road transport agreements with third countries is currently being reassessed.
July 2014
4th quarter 2014
Communication on reduction of noise generated by railway freight wagons in use in the EU (Rail freight noise reduction) (MOVE.B2)
Adoption of the Communication
To be adopted in Q1 or Q2 2015; delay due to a postponement of the IA procedure because of the new Commission
4th quarter 2014
Harmonised computerised information and reservation system for rail transport (CIRSRT) (MOVE.B2)
Establishment of the new TAP TSI governance structure
In order to finalise this output, the governance structure of the TAP TSI must be operational. It is expected to be completed in Q1 2015. An interpretative note will be finalised in Q2 2015..
4th quarter 2014
Completing the Single European Rail Area (MOVE.B2)
State of negotiation with EP and Council of the 4th Railway Package
Market pillar: discussions on-going in Council. Possible general approach in 2015. (Negotiations in Council on the market pillar began only in the second half of 2014).
Technical pillar: Trilogues with EP and Council on-going. Possible adoption in 2015 (loss of 6 months due to EP elections).
Slower progress in the EP and in the Council than anticipated due to political considerations.
Possible adoption of the technical pillar in 2014. Adoption of the rest expected in 2015.
Council and EP negotiation of proposal for Regulation amending Council Regulation (EC) No 718/1999. The purpose is to facilitate the use of the inland waterway reserve fund (MOVE.B3)
Negotiation in Council and EP Adopted in May 2014
(Regulation (EU) No 546/2014 of the European Parliament and of the Council of 15 May 2014 amending Council Regulation (EC) No 718/1999 on a Community-fleet capacity policy to promote inland waterway transport)
Adoption end of 2014
Establishment of market observation services for inland waterway transport (MOVE.B3)
Availability of new market observation services
Market observation report published in September 2014:
http://www.ccr-zkr.org/files/documents/om/om14_en.pdf
October 2014: publication of new services
Discussions with the inland navigation sector to identify
Number of suitable measures Five measures identified Two measures identified
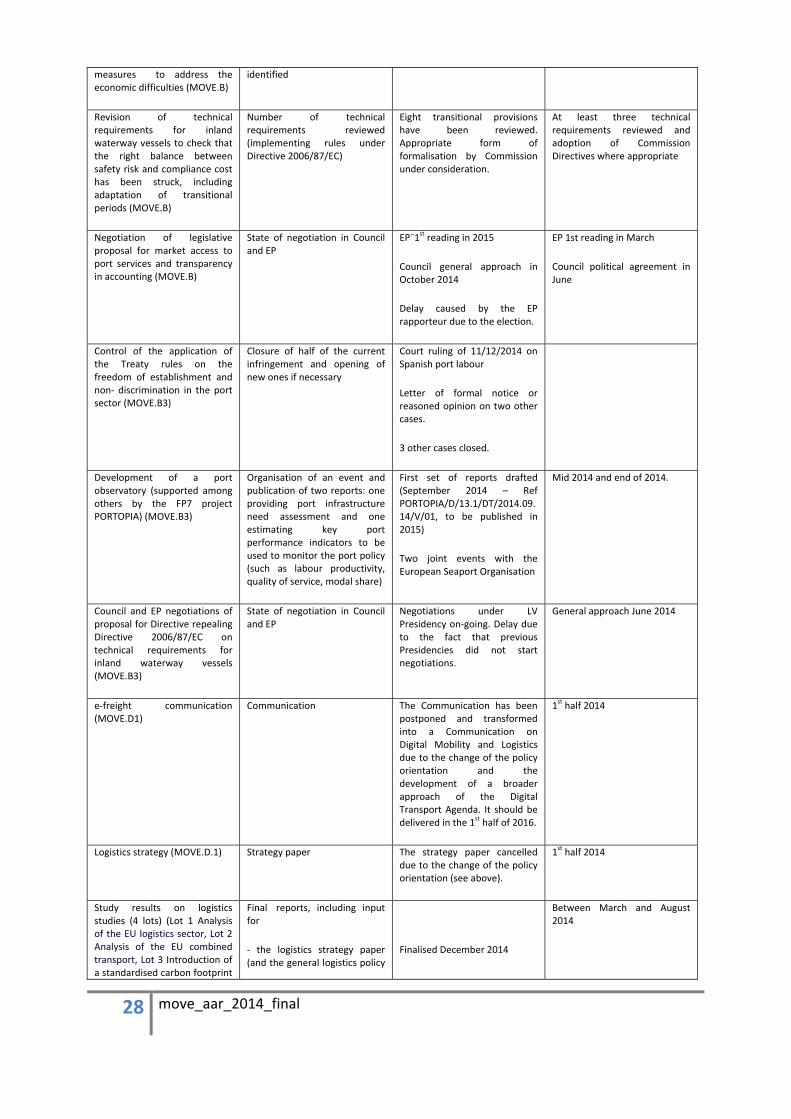
28 move_aar_2014_final
measures to address the economic difficulties (MOVE.B)
identified
Revision of technical requirements for inland waterway vessels to check that the right balance between safety risk and compliance cost has been struck, including adaptation of transitional periods (MOVE.B)
Number of technical requirements reviewed (implementing rules under Directive 2006/87/EC)
Eight transitional provisions have been reviewed. Appropriate form of formalisation by Commission under consideration.
At least three technical requirements reviewed and adoption of Commission Directives where appropriate
Negotiation of legislative proposal for market access to port services and transparency in accounting (MOVE.B)
State of negotiation in Council and EP
EP¨1st reading in 2015
Council general approach in October 2014
Delay caused by the EP rapporteur due to the election.
EP 1st reading in March
Council political agreement in June
Control of the application of the Treaty rules on the freedom of establishment and non- discrimination in the port sector (MOVE.B3)
Closure of half of the current infringement and opening of new ones if necessary
Court ruling of 11/12/2014 on Spanish port labour
Letter of formal notice or reasoned opinion on two other cases.
3 other cases closed.
Development of a port observatory (supported among others by the FP7 project PORTOPIA) (MOVE.B3)
Organisation of an event and publication of two reports: one providing port infrastructure need assessment and one estimating key port performance indicators to be used to monitor the port policy (such as labour productivity, quality of service, modal share)
First set of reports drafted (September 2014 – Ref PORTOPIA/D/13.1/DT/2014.09.14/V/01, to be published in 2015)
Two joint events with the European Seaport Organisation
Mid 2014 and end of 2014.
Council and EP negotiations of proposal for Directive repealing Directive 2006/87/EC on technical requirements for inland waterway vessels (MOVE.B3)
State of negotiation in Council and EP
Negotiations under LV Presidency on-going. Delay due to the fact that previous Presidencies did not start negotiations.
General approach June 2014
e-freight communication (MOVE.D1)
Communication The Communication has been postponed and transformed into a Communication on Digital Mobility and Logistics due to the change of the policy orientation and the development of a broader approach of the Digital Transport Agenda. It should be delivered in the 1st half of 2016.
1st half 2014
Logistics strategy (MOVE.D.1) Strategy paper The strategy paper cancelled due to the change of the policy orientation (see above).
1st half 2014
Study results on logistics studies (4 lots) (Lot 1 Analysis of the EU logistics sector, Lot 2 Analysis of the EU combined transport, Lot 3 Introduction of a standardised carbon footprint
Final reports, including input for
- the logistics strategy paper (and the general logistics policy
Finalised December 2014
Between March and August 2014

29 move_aar_2014_final
methodology, lot 4 Ex-ante analysis of the follow-up of the Marco Polo programme in the Multi-annual Financial Framework 2014-2020) (MOVE.D1)
orientation),
- the REFIT evaluation exercise and the possible revision of Directive 92/106/EEC on combined transport,
- the harmonisation of carbon footprint measurement, and
- the definition of the follow-up of the Marco Polo programme in the TEN-T / CEF context.
Finalised January 2015
Finalised February 2015 On-going: delays on the side of the contractor. New target date: June 2015
REFIT evaluation for Combined Transport Directive (92/106/EEC) (MOVE.D1)
Evaluation report Postponed to mid-2015 December 2014
Commission Initiative to establish a common framework for granting PEC's (MOVE.D1)
Presentation of Commission initiative
The cancellation of this initiative has been proposed in February 2015.
November 2014
Study results on LNG study (4 lots) (Lot1, Analysis and evaluation of identified gaps and of the remaining aspects for completing an EU-wide
framework for marine LNG distribution, bunkering and use.
- Lot 2: Creating awareness on LNG risks and opportunities.
- Lot 3: Analysis of the LNG market development in the EU.
-Lot 4: Explore financing opportunities, assess and develop financial mechanisms beyond the EU financial) (MOVE.D1)
Progress report autumn 2014 By the end of 2014 contracts for all lots were signed.
Final reports are expected in mid-2015.
Final report including a communication concept and policy proposals to complete the framework for LNG for shipping
New performance schemes (MOVE.E)
Commission decision setting EU wide performance targets
Commission decision adopting performance plans
Commission decision was adopted on 11 March 2014
Commission Decision stating consistency / in-consistency of national/FAB targets with Union-wide performance targets will be adopted on 2 March 2015.
June 2014
December 2014
Further development of SES2+ initiative (MOVE.E)
First reading in EP Trilogue to take place in 2015 (following the General Approach adopted by the Council in December 2014)
First quarter 2014
Transport Community Treaty (MOVE.E)
Postponed to end 2015 Signature by end 2014
Air transport agreements with neighbouring countries and key partners(MOVE.E)
Finalise agreements with 2-3 countries
Air transport agreement with Ukraine should be signed in 2015 (subject to resolution of the Gibraltar issue and agreements with Azerbaijan, Armenia and Tunisia could be
By end 2014

30 move_aar_2014_final
finalised in 2016.
Bilateral transport dialogues in all sectors (MOVE.E)
Participate in High level dialogues with strategic partners
Only Japan took place in 2014.
China and Turkey are likely to take place in 2015.
China, Japan and Singapore
Revision of regulation 868 in order to improve protection against subsidisation and unfair pricing practices causing injury to EU air carriers in the supply of air services from non EU countries (MOVE.E)
Adoption of a Commission proposal
Revision of regulation 868 now foreseen end 2015 as part of the Aviation Package.
End 2014
Comments Transposition rate:
On the transposition rate, the figure for 2004 (94.92%) is closer to normal than that of the previous (reference) year (81.25%). The relatively low rate in 2013 is due to the fact that the transposition deadline for most Directives taken into account for 2013 was the last quarter 2013 and Member States usually notify national measures with a slight delay.
DG MOVE monitors transposition and implementation of existing EU law in the Member States and takes the appropriate action to address incorrect transposition and practical implementation at national level.
2016 Road Package:
For political opportunity reasons, initiatives related to road transport are being grouped together and will be presented in a road package in 2016. The case for specific road transport agreements with third countries has to be assessed carefully. Pursuing a wider approach (i.e. horizontal agreements covering several economic sectors) may prove more fruitful.
PECs:
In 2014 DG MOVE carried out an impact assessment of different options to provide a EU framework for the granting of Pilotage Exemption Certificates (PECs) by Member States. The study showed that a hard legislation would not be an optimal solution due to the importance of local conditions on the granting of PECs. General obligations stemming from the EU Treaty would be enough to address potential cases where PECs are granted according to possibly discriminatory national criteria.
e-Freight:
The policy framework for e-Freight was re-oriented due to the development of a broader approach of the Digital Transport Agenda, covering a number of sectorial policies. The Communication on “e-Freight – Connecting stakeholders for an efficient access and use of information in freight transport across all modes” has been therefore postponed and

31 move_aar_2014_final
transformed into a Communication on Digital Mobility and Logistics with a new target date of the first half of 2016.
Logistics studies:
As regards the logistics studies, the discrepancies between the achieved and planned value of indicators result mainly from the additional efforts needed for execution of the tasks. For lot 4 this was also combined with some delays lying on the side of the contractor. The finalised studies delivered qualitative and quantitative data to serve as an input for further development of the policies in the domain of the logistics and multimodal transport. In principle this concerns the revision of the policy framework for combined transport and the related Council Directive 92/106/EEC, and the development of a policy on carbon footprint assessment and certification. Furthermore, preliminary results of the study running under the lot 4 contributed to the establishment of a specific priority for the support of the freight transport services under the 2014 CEF Transport call for proposals.
Relevant general objective(s): General objective 1
Specific objective 2: To promote safe and secure transport
⌧Spending programme
⌧ Non-spending
Result indicator Baseline (year) Current situation
Milestone Target in MP 2014
Number of accidents in EU waters (or involving EU flagged vessels) (Source EMSA) (MOVE.D2)
(2012)36 Very Serious Casualties 2012 - 51, 2013 - 38 (to 31.10.2013)
Fatalities 2012 – 82 2013 – 46 (to 31.10.2013).
Very Serious Casualties
31/12/2014: 80 31/12/2013: 98
Fatalities
31/12/2014: 110 31/12/2013: 89
Less than 50 very serious casualties per year.
Less than 30 fatalities per year
(by 2015)
Number of fatalities in road transport accidents (Source: CARE) (MOVE.C4)
31500 (2010)
(EU28 )
2011: 30 700
2012: 28 200
2013: 26 000
2014: 25 700
Max 15 750 (EU 28) by 2020
36 Source: European Maritime Casualty Information Platform (EMCIP), however data should be treated with caution as the Commission/EMSA has identified problems with late and under-reporting. Increases in the figures for very serious accidents and fatalities therefore reflect improvements in Member States' reporting rather than a worsening safety situation

32 move_aar_2014_final
Aviation safety:
a. Rate of Fatal aviation accidents per 10 Million flights (10 year moving average)
b. Number of fatal accidents to EU commercial air transport (source : EASA Annual safety Review(MOVE.E3)
a. 2012 : EU – 2
Asia – 4.8
North America – 2.1
b. 2012 : 1
a.
2013:37 EU – 1.8 (EASA MS)
Asia – 6.3
North America – 1.9
2014:38
EU – 1.7 (EASA MS)
Asia – 11.1
North America – 0.9
b.
2013: 0
2014: 1
a. To match, or be, the lowest world rate by 2020
b. Maximum of 1.0 by 2020
Reported total number of rail accidents, including level crossing accidents (source : Railway Safety Performance report of the European Railway Agency; the number of accidents is one of the Common Safety Indicators that have to be reported to the Agency by the Member States, as required by Annex I to the Railway Safety Directive) (MOVE B2)
2 068 accidents in 2012 with a total of
1 133 fatalities
2013: 1 982 accidents in 2013 with a total of 1130 fatalities
2014: no data available
(According to Article 18 of Directive 2004/49/EC, NSA publishes an annual report concerning the activities of the preceding year and sends it to ERA by 30 September.
Actually some reports arrive at ERA even later. Usually ERA publishes a report on Railway safety in February /March of the following year with all data aggregated.
Therefore, data on 2014 will be available in February /March 2016.)
Reduction by 10 % of number of rail accidents and by 12 % of number of fatalities (by 2014 in comparison with figures for 2012)
(Target set by DG MOVE on the basis of figures from previous years)
Compliance with Community legislation: aviation security inspection results
83% (2012) 2013: 80% 2014: 80.7%39
At least 85% compliance with main provisions for aviation security confirmed through EU
37 Source: EASA Annual Safety Review 2013 38 Source: Data delivered by EASA, to be published in the upcoming EASA Annual Safety Review 2014, still
subject to validation. Therefore the final 2014 figures may slightly vary. 39 Results show a stable and relatively high rate of compliance with core aviation security rules.
33 move_aar_2014_final
(MOVE.A2) inspections (annual target)
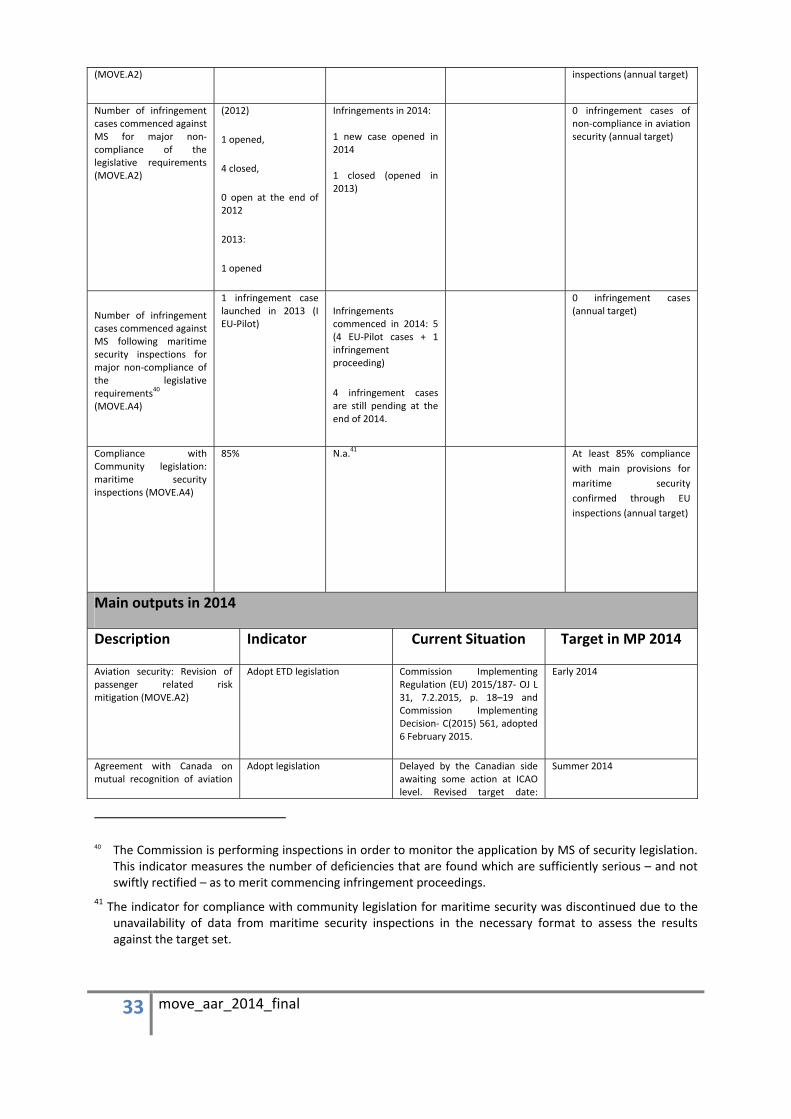
Number of infringement cases commenced against MS for major non-compliance of the legislative requirements (MOVE.A2)
(2012)
1 opened,
4 closed,
0 open at the end of 2012
2013:
1 opened
Infringements in 2014: 1 new case opened in 2014 1 closed (opened in 2013)
0 infringement cases of non-compliance in aviation security (annual target)
Number of infringement cases commenced against MS following maritime security inspections for major non-compliance of the legislative requirements40 (MOVE.A4)
1 infringement case launched in 2013 (I EU-Pilot)
Infringements commenced in 2014: 5 (4 EU-Pilot cases + 1 infringement proceeding)
4 infringement cases are still pending at the end of 2014.
0 infringement cases (annual target)
Compliance with Community legislation: maritime security inspections (MOVE.A4)
85%
N.a.41
At least 85% compliance with main provisions for maritime security confirmed through EU inspections (annual target)
Main outputs in 2014
Description Indicator Current Situation Target in MP 2014
Aviation security: Revision of passenger related risk mitigation (MOVE.A2)
Adopt ETD legislation Commission Implementing Regulation (EU) 2015/187- OJ L 31, 7.2.2015, p. 18–19 and Commission Implementing Decision- C(2015) 561, adopted 6 February 2015.
Early 2014
Agreement with Canada on mutual recognition of aviation
Adopt legislation Delayed by the Canadian side awaiting some action at ICAO level. Revised target date:
Summer 2014
40 The Commission is performing inspections in order to monitor the application by MS of security legislation. This indicator measures the number of deficiencies that are found which are sufficiently serious – and not swiftly rectified – as to merit commencing infringement proceedings.
41 The indicator for compliance with community legislation for maritime security was discontinued due to the unavailability of data from maritime security inspections in the necessary format to assess the results against the target set.

34 move_aar_2014_final
security controls (MOVE.A2) September 2015.
Revision of the aviation security and customs legislation to align the status of Authorised Economic Operator and Regulated Agent (RA) and Known Consignor (KC) (together with DG TAXUD) (MOVE.A2)
Adopt legislation Commission Implementing Decision-C(2014)4054, adopted 20.6.2014.
Spring 2014
Proposal for a Directive on standards and conformity assessment of aviation security equipment (together with DG ENTR) (MOVE.A2)
Adopt legislative proposal Delayed due to reattribution from ENTR to HOME, DG HOME preparing impact assessment. Revised target date: 2016
Autumn 2014
Number of aviation security inspections planned in 2014 (MOVE.A2)
35 inspections 34 inspections (38 including follow-up inspections)
Accomplished by end 2014
Number of maritime security inspections planned in 2014 (MOVE.A4)
25 inspections planned 27 inspections conducted Accomplished by end 2014
Implementation of Directive 2006/126 on driving licences (MOVE.C4)
Complete transposition check and launch infringement procedures as necessary
Transposition check completed early 2014. Shortcomings identified and questions addressed to all Member States through EUPILOT by third quarter 2014.
3rd quarter 2014
Improve safety in road infrastructures (MOVE.C4)
Complete study on road infrastructure safe management
Study postponed to 2015 (the contract for the study was extended to complement and complete the data collection as well as to host the stakeholders conference on a different date)
3rd quarter 2014
Implementation of Directive 2011/82 on cross-border enforcement of traffic offences (MOVE.C4)
Complete transposition check and launch infringement procedures as necessary
The directive was annulled in May 2014; in the meantime notification of the transposition measures was checked. On that basis, 3 reasoned opinions were launched (BG, CY and SI) for non-communication of the transposition measures – the cases are still open.
4th quarter 2014
Regular updates of the list of banned air carriers (MOVE.E)
Improvement of the aviation safety in the EU
Updated twice in 2014: Commission implementing regulation No 368/2014, and Commission implementing regulation No 1318/2014, 11 December 2014
Every three - four months
Alignment of 216/2008 with the SES II Regulations (MOVE.E)
Clarification of roles between EASA , COM and Eurocontrol leading to improvement of aviation safety
Partial general approach reached in the Council in the 4th quarter 2014, however the articles on the EASA governance were moved to the broader revision of 216/2008 (see below).
4th Q of 2014
Legislative initiative: A new era for aviation Opening the aviation market to Remotely Piloted Aircraft
Ensure that remotely piloted aircraft systems (drones) can safely and securely fly in the European skies in non-
Commission Communication COM(2014)207 was adopted on
Mid-2014
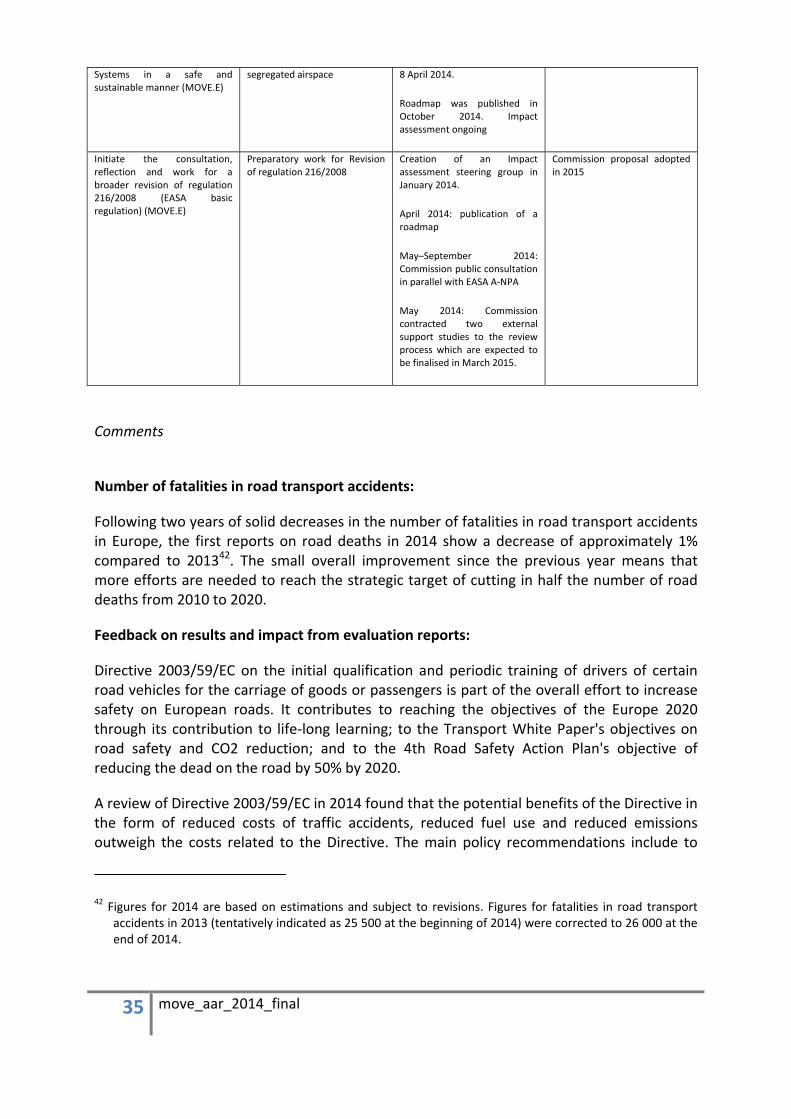
35 move_aar_2014_final
Systems in a safe and sustainable manner (MOVE.E)
segregated airspace 8 April 2014.
Roadmap was published in October 2014. Impact assessment ongoing
Initiate the consultation, reflection and work for a broader revision of regulation 216/2008 (EASA basic regulation) (MOVE.E)
Preparatory work for Revision of regulation 216/2008
Creation of an Impact assessment steering group in January 2014.
April 2014: publication of a roadmap
May–September 2014: Commission public consultation in parallel with EASA A-NPA
May 2014: Commission contracted two external support studies to the review process which are expected to be finalised in March 2015.
Commission proposal adopted in 2015
Comments
Number of fatalities in road transport accidents:
Following two years of solid decreases in the number of fatalities in road transport accidents in Europe, the first reports on road deaths in 2014 show a decrease of approximately 1% compared to 201342. The small overall improvement since the previous year means that more efforts are needed to reach the strategic target of cutting in half the number of road deaths from 2010 to 2020.
Feedback on results and impact from evaluation reports:
Directive 2003/59/EC on the initial qualification and periodic training of drivers of certain road vehicles for the carriage of goods or passengers is part of the overall effort to increase safety on European roads. It contributes to reaching the objectives of the Europe 2020 through its contribution to life-long learning; to the Transport White Paper's objectives on road safety and CO2 reduction; and to the 4th Road Safety Action Plan's objective of reducing the dead on the road by 50% by 2020.
A review of Directive 2003/59/EC in 2014 found that the potential benefits of the Directive in the form of reduced costs of traffic accidents, reduced fuel use and reduced emissions outweigh the costs related to the Directive. The main policy recommendations include to
42 Figures for 2014 are based on estimations and subject to revisions. Figures for fatalities in road transport accidents in 2013 (tentatively indicated as 25 500 at the beginning of 2014) were corrected to 26 000 at the end of 2014.
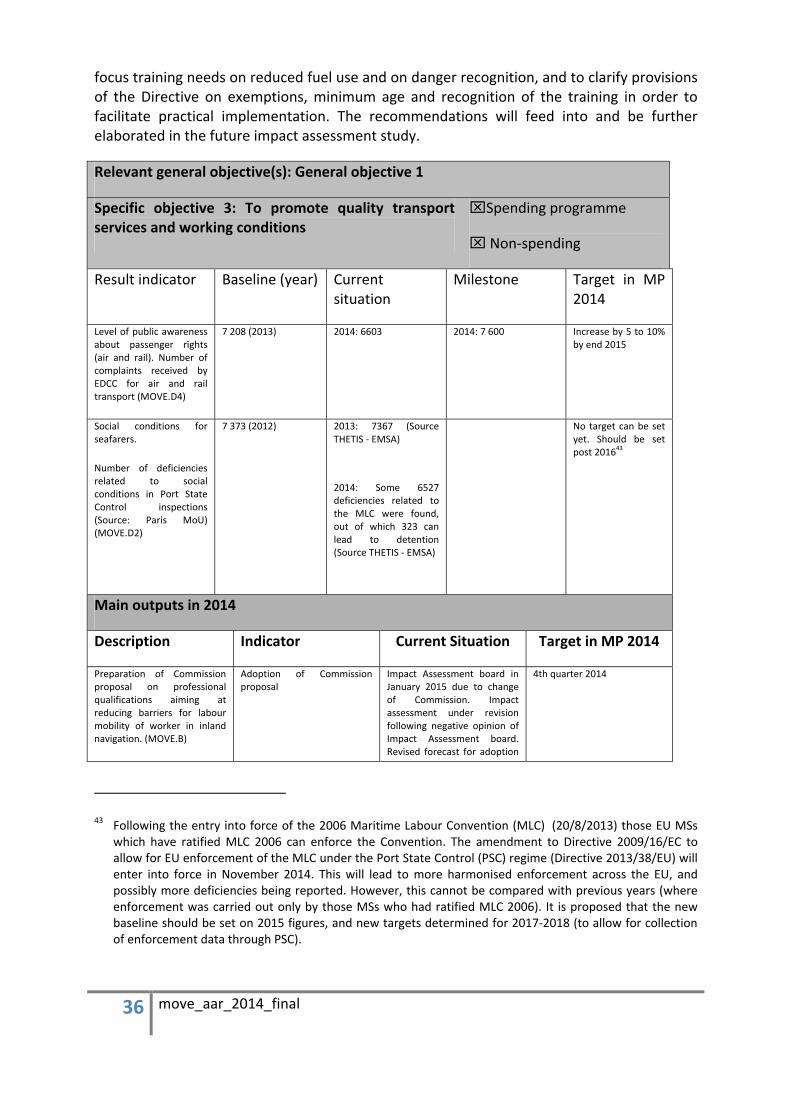
36 move_aar_2014_final
focus training needs on reduced fuel use and on danger recognition, and to clarify provisions of the Directive on exemptions, minimum age and recognition of the training in order to facilitate practical implementation. The recommendations will feed into and be further elaborated in the future impact assessment study.
Relevant general objective(s): General objective 1
Specific objective 3: To promote quality transport services and working conditions
⌧Spending programme
⌧ Non-spending
Result indicator Baseline (year) Current situation
Milestone Target in MP 2014
Level of public awareness about passenger rights (air and rail). Number of complaints received by EDCC for air and rail transport (MOVE.D4)
7 208 (2013) 2014: 6603 2014: 7 600 Increase by 5 to 10% by end 2015
Social conditions for seafarers.
Number of deficiencies related to social conditions in Port State Control inspections (Source: Paris MoU) (MOVE.D2)
7 373 (2012) 2013: 7367 (Source THETIS - EMSA)
2014: Some 6527 deficiencies related to the MLC were found, out of which 323 can lead to detention (Source THETIS - EMSA)
No target can be set yet. Should be set post 201643
Main outputs in 2014
Description Indicator Current Situation Target in MP 2014
Preparation of Commission proposal on professional qualifications aiming at reducing barriers for labour mobility of worker in inland navigation. (MOVE.B)
Adoption of Commission proposal
Impact Assessment board in January 2015 due to change of Commission. Impact assessment under revision following negative opinion of Impact Assessment board. Revised forecast for adoption
4th quarter 2014
43 Following the entry into force of the 2006 Maritime Labour Convention (MLC) (20/8/2013) those EU MSs which have ratified MLC 2006 can enforce the Convention. The amendment to Directive 2009/16/EC to allow for EU enforcement of the MLC under the Port State Control (PSC) regime (Directive 2013/38/EU) will enter into force in November 2014. This will lead to more harmonised enforcement across the EU, and possibly more deficiencies being reported. However, this cannot be compared with previous years (where enforcement was carried out only by those MSs who had ratified MLC 2006). It is proposed that the new baseline should be set on 2015 figures, and new targets determined for 2017-2018 (to allow for collection of enforcement data through PSC).
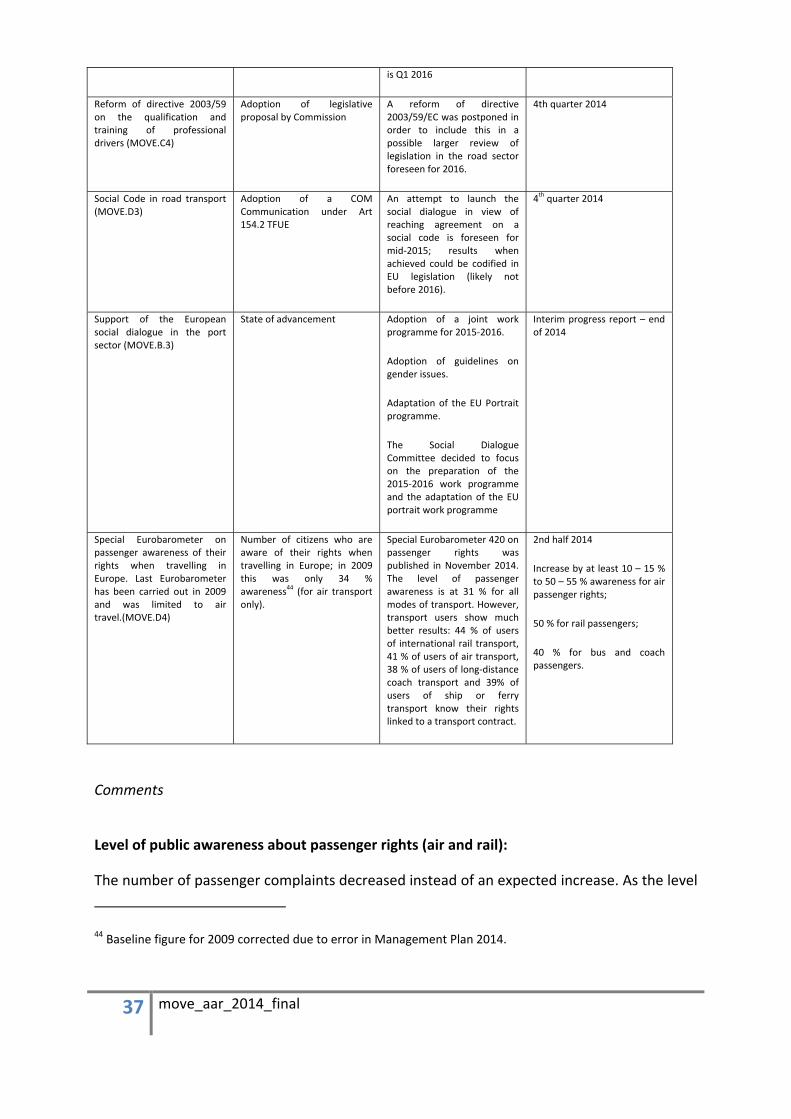
37 move_aar_2014_final
is Q1 2016
Reform of directive 2003/59 on the qualification and training of professional drivers (MOVE.C4)
Adoption of legislative proposal by Commission
A reform of directive 2003/59/EC was postponed in order to include this in a possible larger review of legislation in the road sector foreseen for 2016.
4th quarter 2014
Social Code in road transport (MOVE.D3)
Adoption of a COM Communication under Art 154.2 TFUE
An attempt to launch the social dialogue in view of reaching agreement on a social code is foreseen for mid-2015; results when achieved could be codified in EU legislation (likely not before 2016).
4th quarter 2014
Support of the European social dialogue in the port sector (MOVE.B.3)
State of advancement Adoption of a joint work programme for 2015-2016.
Adoption of guidelines on gender issues.
Adaptation of the EU Portrait programme.
The Social Dialogue Committee decided to focus on the preparation of the 2015-2016 work programme and the adaptation of the EU portrait work programme
Interim progress report – end of 2014
Special Eurobarometer on passenger awareness of their rights when travelling in Europe. Last Eurobarometer has been carried out in 2009 and was limited to air travel.(MOVE.D4)
Number of citizens who are aware of their rights when travelling in Europe; in 2009 this was only 34 % awareness44 (for air transport only).
Special Eurobarometer 420 on passenger rights was published in November 2014. The level of passenger awareness is at 31 % for all modes of transport. However, transport users show much better results: 44 % of users of international rail transport, 41 % of users of air transport, 38 % of users of long-distance coach transport and 39% of users of ship or ferry transport know their rights linked to a transport contract.
2nd half 2014
Increase by at least 10 – 15 % to 50 – 55 % awareness for air passenger rights;
50 % for rail passengers;
40 % for bus and coach passengers.
Comments
Level of public awareness about passenger rights (air and rail):
The number of passenger complaints decreased instead of an expected increase. As the level
44 Baseline figure for 2009 corrected due to error in Management Plan 2014.

38 move_aar_2014_final
of awareness in air transport, measured by the Eurobarometer survey (see below) increases slightly (from 34% to 41%),this decrease in complaints could be explained by better application of EU passenger rights legislation notably by air carriers as well as by increased and more effective enforcement activities of national authorities45.
Eurobarometer:
For the first time a Eurobarometer survey covers all modes of transport. The 2005 and 2009 surveys only covered air transport.
The level of passengers' awareness of their rights remains low. In fact, 31% of passengers are aware of their rights while 59% are not. These percentages are slightly lower compared with the 2009 survey on air passenger rights which would seem to mean that there is no improvement in awareness over the years. The level of awareness is still very low for waterborne and coach because the two regulations are very recent. However, the level of awareness of users of air transport (41 %) has increased but less than anticipated and the level of awareness in international rail transport (44 %), although less high than anticipated, is not negligible.
A number of further awareness raising activities in the framework of a specific communication campaign for all modes of transport are being carried out until the end of 2015. At the same time, reflections on the Commission actions after 2015 to continue raising passenger awareness about their rights are being undertaken.
Social Code in road transport:
Encouraging and supporting the dialogue between social partners in view of reaching an agreement on a social code for mobile road transport workers is one of the core initiatives announced in the 2011 transport policy White Paper (COM(2011)144). The change of the Commission in late 2014 provided some political momentum which may be used to make progress in this field.
Feedback on results and impact from evaluation reports:
Evaluation of the framework of relevant directives related to the initiative on recognition and modernisation of professional qualifications in inland Navigation
The subject of this evaluation are Directive 91/672/EEC on the reciprocal recognition of national boat masters' certificates for the carriage of goods and passengers by inland waterway and Directive 96/50/EC on the harmonization of the conditions for obtaining national boat masters' certificates for the carriage of goods and passengers by inland waterway
45 See Commission staff working document on complaint handling and enforcement by Member States of the air passenger rights regulations http://ec.europa.eu/transport/themes/passengers/air/doc/swd(2014)156.pdf

39 move_aar_2014_final
Both directives have contributed to free navigation on inland waterways in Europe. The minimum requirements and the topics on professional knowledge required to obtain a boatmaster certificate, contributed to improved safety. The process of reciprocal recognition of the boatmasters’ certificates has facilitated the access to European waterways, thus leading to better labour mobility. The two directives have also contributed, to a lesser extent, to the policy of integrating inland waterways into the transport system in Europe.
Relevant general objective(s): General objective 1
Specific objective 4: To promote greater use of low-carbon transport modes and promote multi-modality
⌧Spending programme
⌧ Non-spending
Result indicator Baseline (year) Current situation
Milestone Target in MP 2014
Affordability of low carbon modes of transport (rail, waterborne, bus and coaches) compared to fuel prices (as defined in Harmonised Index of Consumer prices for different transport modes Eurostat – index
number 2005=100). 46
(MOVE.A3)
(2010)
- Rail services 123.87
- Road services 120.91
- Air services
112.17
- Waterborne services
128.85
- Combined passenger transport 119.48
- Fuel and Lubricants for personal transport
120.25
Rail services
2011: 128.54
2012: 134.22
2013: 138.05
2014: 141.07
Road services
2011: 125.69
2012: 130.77
2013: 133.88
2014: 136.31
Air services
2011: 120.34
2012: 126.16
2013: 131.29
2014: 132.35
Waterborne services
2011: 140.32
2012: 144.47
2013: 144.57
2014: 148.72 Combined passenger transport
Rail, bus and coaches and waterborne transportation should become more affordable to the consumers when compared to fuel prices.
46 2014 data is provisional.
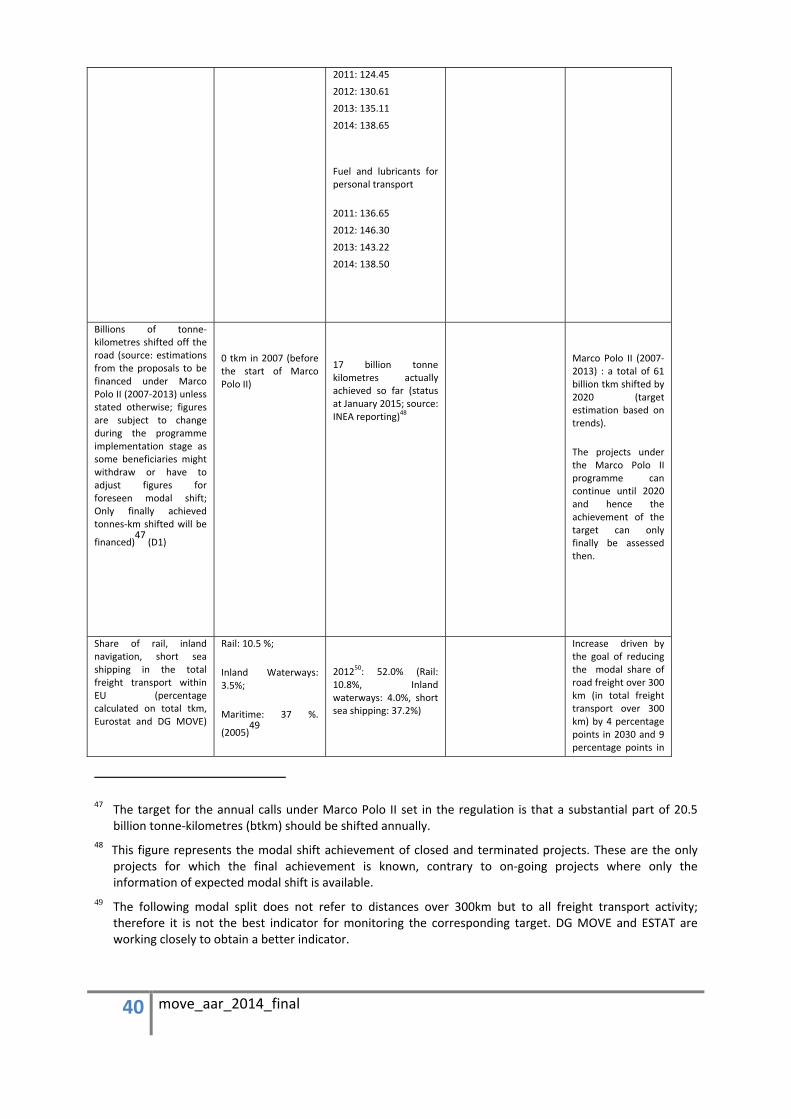
40 move_aar_2014_final
2011: 124.45
2012: 130.61
2013: 135.11
2014: 138.65
Fuel and lubricants for personal transport
2011: 136.65
2012: 146.30
2013: 143.22
2014: 138.50
Billions of tonne-kilometres shifted off the road (source: estimations from the proposals to be financed under Marco Polo II (2007-2013) unless stated otherwise; figures are subject to change during the programme implementation stage as some beneficiaries might withdraw or have to adjust figures for foreseen modal shift; Only finally achieved tonnes-km shifted will be
financed)47
(D1)
0 tkm in 2007 (before the start of Marco Polo II)
17 billion tonne kilometres actually achieved so far (status at January 2015; source: INEA reporting)48
Marco Polo II (2007-2013) : a total of 61 billion tkm shifted by 2020 (target estimation based on trends).
The projects under the Marco Polo II programme can continue until 2020 and hence the achievement of the target can only finally be assessed then.
Share of rail, inland navigation, short sea shipping in the total freight transport within EU (percentage calculated on total tkm, Eurostat and DG MOVE)
Rail: 10.5 %;
Inland Waterways: 3.5%;
Maritime: 37 %.
(2005)49
201250: 52.0% (Rail: 10.8%, Inland waterways: 4.0%, short sea shipping: 37.2%)
Increase driven by the goal of reducing the modal share of road freight over 300 km (in total freight transport over 300 km) by 4 percentage points in 2030 and 9 percentage points in
47 The target for the annual calls under Marco Polo II set in the regulation is that a substantial part of 20.5 billion tonne-kilometres (btkm) should be shifted annually.
48 This figure represents the modal shift achievement of closed and terminated projects. These are the only projects for which the final achievement is known, contrary to on-going projects where only the information of expected modal shift is available.
49 The following modal split does not refer to distances over 300km but to all freight transport activity; therefore it is not the best indicator for monitoring the corresponding target. DG MOVE and ESTAT are working closely to obtain a better indicator.
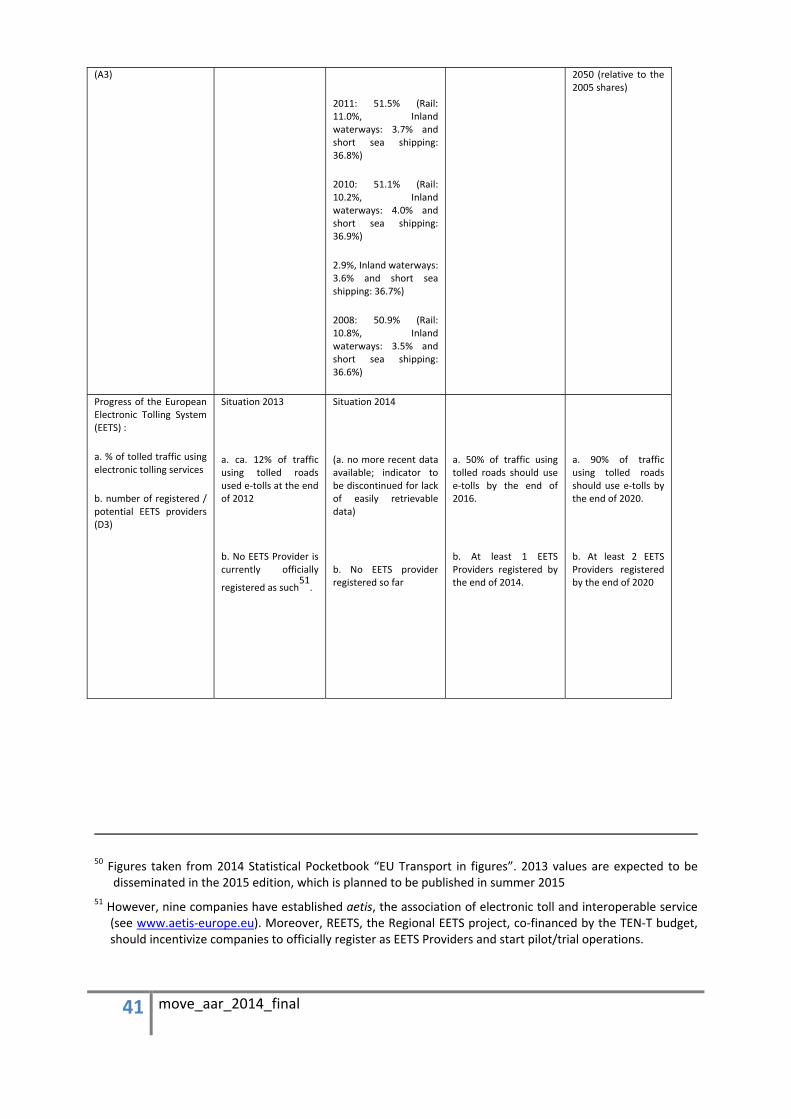
41 move_aar_2014_final
(A3)
2011: 51.5% (Rail: 11.0%, Inland waterways: 3.7% and short sea shipping: 36.8%)
2010: 51.1% (Rail: 10.2%, Inland waterways: 4.0% and short sea shipping: 36.9%)
2.9%, Inland waterways: 3.6% and short sea shipping: 36.7%)
2008: 50.9% (Rail: 10.8%, Inland waterways: 3.5% and short sea shipping: 36.6%)
2050 (relative to the 2005 shares)
Progress of the European Electronic Tolling System (EETS) :
a. % of tolled traffic using electronic tolling services
b. number of registered / potential EETS providers (D3)
Situation 2013
a. ca. 12% of traffic using tolled roads used e-tolls at the end of 2012
b. No EETS Provider is currently officially
registered as such51
.
Situation 2014
(a. no more recent data available; indicator to be discontinued for lack of easily retrievable data)
b. No EETS provider registered so far
a. 50% of traffic using tolled roads should use e-tolls by the end of 2016.
b. At least 1 EETS Providers registered by the end of 2014.
a. 90% of traffic using tolled roads should use e-tolls by the end of 2020.
b. At least 2 EETS Providers registered by the end of 2020
50 Figures taken from 2014 Statistical Pocketbook “EU Transport in figures”. 2013 values are expected to be disseminated in the 2015 edition, which is planned to be published in summer 2015
51 However, nine companies have established aetis, the association of electronic toll and interoperable service (see www.aetis-europe.eu). Moreover, REETS, the Regional EETS project, co-financed by the TEN-T budget, should incentivize companies to officially register as EETS Providers and start pilot/trial operations.

42 move_aar_2014_final
Main outputs in 2014
Description Indicator Current situation Target in MP 2014
Prepare rules to allow the use of LNG-powered vessels (MOVE.B)
New rules finalised (Commission implementing rules under Directive 2006/87/EC and revision of the AND rules)
Due to the complexity of the issues to be addressed, finalisation at technical expert level foreseen to be finalised in 2015. Adoption now foreseen end of 2015/beginning of 2016
Finalisation in 2014
(adoption in 2015)
Clean Power for Transport Package development and implementation (MOVE.C1)
Adoption by EP and Council of a Directive on alternative fuels infrastructure
Directive adopted on 22 October 2014 – COM/ 2014/94
3rd Quarter 2014
Note: For further initiatives to promote low-carbon transport and multi-modality, see initiatives under the Connecting Europe Facility (CEF) and research and innovation initiatives in the transport area under Horizon 2020 below.
Comments The evolution of prices between passenger transport services and fuel prices has been favourable to low carbon modes of transport until 2012. Then fuel prices fell by 2.1% in 2013 and by 3.3% in 2014, due to the recent downward trends in oil prices, while transport services prices have kept increasing, therefore showing some low carbon modes less appealing as regards price. The decrease of fuel prices is due to the recent global market circumstances.
The estimated global result of Marco Polo II (2007-2013), based on the trends, is 61 billion tkm. The programme is not continued beyond 2013. Instead, a new scheme supporting sustainable and efficient freight transport services forms a specific priority under the 2014 CEF Transport call for proposals.
With a view on freight transport, the share of rail, inland navigation and short sea shipping performances in the total freight transport activity has risen to 52% in 2012, compared to 50.9% in 2005, thus indicating a possible trend towards a shift from road to rail and waterborne transport.
EETS:
The Commission is investigating possible reasons for the observed delays in finding an EETS provider willing to register as such. This investigation may end up in a legislative proposal amending the EETS-related legal acts. This could be part of the 2016 road package.
Clean Power for Transport Package:
The Directive 2014/94/EU was adopted on 22 October 2014. It sets minimum requirements for the build-up of alternative fuels infrastructure with common standards and user information. It provides the long-awaited legal certainty for companies to start investing, and the possibility for economies of scale. Now Member States should establish national policy frameworks (by November 2016) outlining their targets and objectives, and
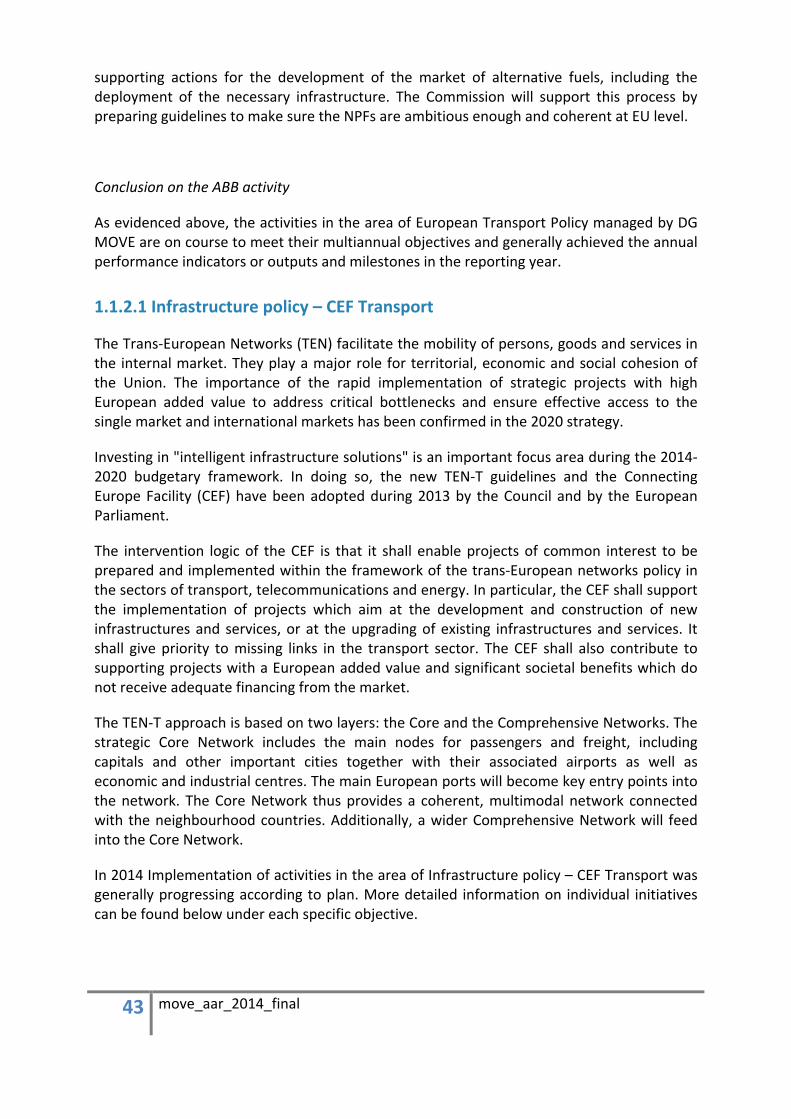
43 move_aar_2014_final
supporting actions for the development of the market of alternative fuels, including the deployment of the necessary infrastructure. The Commission will support this process by preparing guidelines to make sure the NPFs are ambitious enough and coherent at EU level.
Conclusion on the ABB activity
As evidenced above, the activities in the area of European Transport Policy managed by DG MOVE are on course to meet their multiannual objectives and generally achieved the annual performance indicators or outputs and milestones in the reporting year.
1.1.2.1 Infrastructure policy – CEF Transport
The Trans-European Networks (TEN) facilitate the mobility of persons, goods and services in the internal market. They play a major role for territorial, economic and social cohesion of the Union. The importance of the rapid implementation of strategic projects with high European added value to address critical bottlenecks and ensure effective access to the single market and international markets has been confirmed in the 2020 strategy.
Investing in "intelligent infrastructure solutions" is an important focus area during the 2014-2020 budgetary framework. In doing so, the new TEN-T guidelines and the Connecting Europe Facility (CEF) have been adopted during 2013 by the Council and by the European Parliament.
The intervention logic of the CEF is that it shall enable projects of common interest to be prepared and implemented within the framework of the trans-European networks policy in the sectors of transport, telecommunications and energy. In particular, the CEF shall support the implementation of projects which aim at the development and construction of new infrastructures and services, or at the upgrading of existing infrastructures and services. It shall give priority to missing links in the transport sector. The CEF shall also contribute to supporting projects with a European added value and significant societal benefits which do not receive adequate financing from the market.
The TEN-T approach is based on two layers: the Core and the Comprehensive Networks. The strategic Core Network includes the main nodes for passengers and freight, including capitals and other important cities together with their associated airports as well as economic and industrial centres. The main European ports will become key entry points into the network. The Core Network thus provides a coherent, multimodal network connected with the neighbourhood countries. Additionally, a wider Comprehensive Network will feed into the Core Network.
In 2014 Implementation of activities in the area of Infrastructure policy – CEF Transport was generally progressing according to plan. More detailed information on individual initiatives can be found below under each specific objective.

44 move_aar_2014_final
Relevant general objective(s): General objective 2 and 3 (CEF general objectives)
Specific objective 5: Removing bottlenecks, enhancing rail interoperability, bridging missing links and, in particular, improving cross-border sections
⌧Spending programme
⌧ Non-spending
Result indicator Baseline (year) Current situation
Milestone Target in MP 2014
Setting up of core network corridors structures with designation of Coordinators, creation of Corridor Forums and approval of work plans (MOVE B1)
2013 (no corridor existing)
2014: 9 core network corridors have been set up
9 core network corridors by end of 2014
Number of new or improved cross-border connections* (MOVE B)
0 in 2013 2014: 0 6 by 2017
14 by 2020 (including the 6 by 2017)
36 by 2030 (including the 14 by 2020)
Number of removed bottlenecks and sections of increased capacity for all modes on core network corridors which have received funding from the CEF
(source:TENTec) (B1)
0 in 2013 2014: 0
5 by 2017 13 by 2020
Length of inland waterway network by class * (MOVE B)
2014: 95.2% of inland waterways reaching class IV standards
Whole TEN-T inland waterways reaching class IV standards or higher by 2030, except where allowed by Regulation
Length of the railway network in the EU-28 upgraded following the requirements set out in Article 39(2) of the TEN-T regulation* (MOVE B)
2014: Reliability of available data under assessment, first reporting will be postponed to 2015
Whole core network complying with the requirements by 2030
Main outputs in 2014
Description Indicator Current situation Target in MP 2014
Analysis of all 9 core network corridors
Establishment of work plan 9 work plans have been sent out to MS to 22/12/2014.
9 work plans end of 2014
Analysis of all 9 core network corridors
Establishment of a Corridor Forum for each corridor
9 corridor fora set up in 2014 9 by the end of 2014

45 move_aar_2014_final
Analysis of all 9 core network corridors
Data collection on technical parameters of the infrastructure for all corridors
Study for each corridor has been finalised in 2014
Full coverage of all 9 corridors, all transport modes
Corridor support functions in TENtec
Number of corridors supported.
All 9 core network corridor have been supported by TENtec in 2014
Support corridor forums by mid-2014, Systematic corridor monitoring by end 2014.
Innovation support functions in TENtec
Coverage of core/comprehensive TEN-T network.
Monitoring of core and comprehensive network coverage in TENtec public portal (incl. new mobile platform) available in 2014.
Monitoring of core network coverage by mid-2014 in TENtec public portal (incl. new mobile platform). Comprehensive network by end 2014.
Note: indicators marked with * will be assessed in the framework of the work plans for the core network corridors. At that time, a reliable baseline scenario and precise targets can be defined. The figures presented above correspond to the financial statement accompanying the Commission proposals of 2011.
Note: The CEF Regulation includes the following additional indicator for this specific objective "The number of kilometres of railway line adapted to the European nominal gauge standard and fitted with ERTMS". However, this indicator is presented under specific objective 10 as DG MOVE considers that it is more closely linked to that particular objective.
Comments
Year 2014 was dedicated to the preparation of the Work Programmes and calls for proposals for the CEF, which were launched in September 2014, and to the negotiations of a delegation agreement with the EIB for the implementation of the CEF Debt financial instruments (after the procedure of the ex-ante assessment). Since the 1st calls for project proposal under the CEF closed 3 March 2015, and since the CEF Debt instrument to be managed by the EIB has not yet been approved, no projects were financed with the help of the CEF in 2014. In 2015, the projects will start receiving financing from the Connecting Europe Facility.
Feedback on results and impact from evaluation reports:
The 2004 revised TEN-T guidelines introduced the concept of European Coordinators, responsible for facilitating the coordinated implementation of Priority Projects. The ultimate policy objective of the TEN-T programme is the establishment of a single, multimodal network covering both traditional ground-based structures and equipment to enable safe and efficient traffic flows, by integrating the land, sea and air transport infrastructure components. Coordinators have an important role to play, to unblock obstacles to progress, report to the Commission and European Parliament, as well as interact and promote coordination across stakeholders including Member States, regional and local authorities, European institutions and infrastructure managers. In order to coordinate the implementation of the core network corridors under the new TEN-T Regulation adopted in 2013, the European Commission nominated a European Coordinator for each of the nine core network corridors. It also nominated European Coordinators for two horizontal priorities: the European Rail Traffic Management System (ERTMS) and Motorways of the Sea.
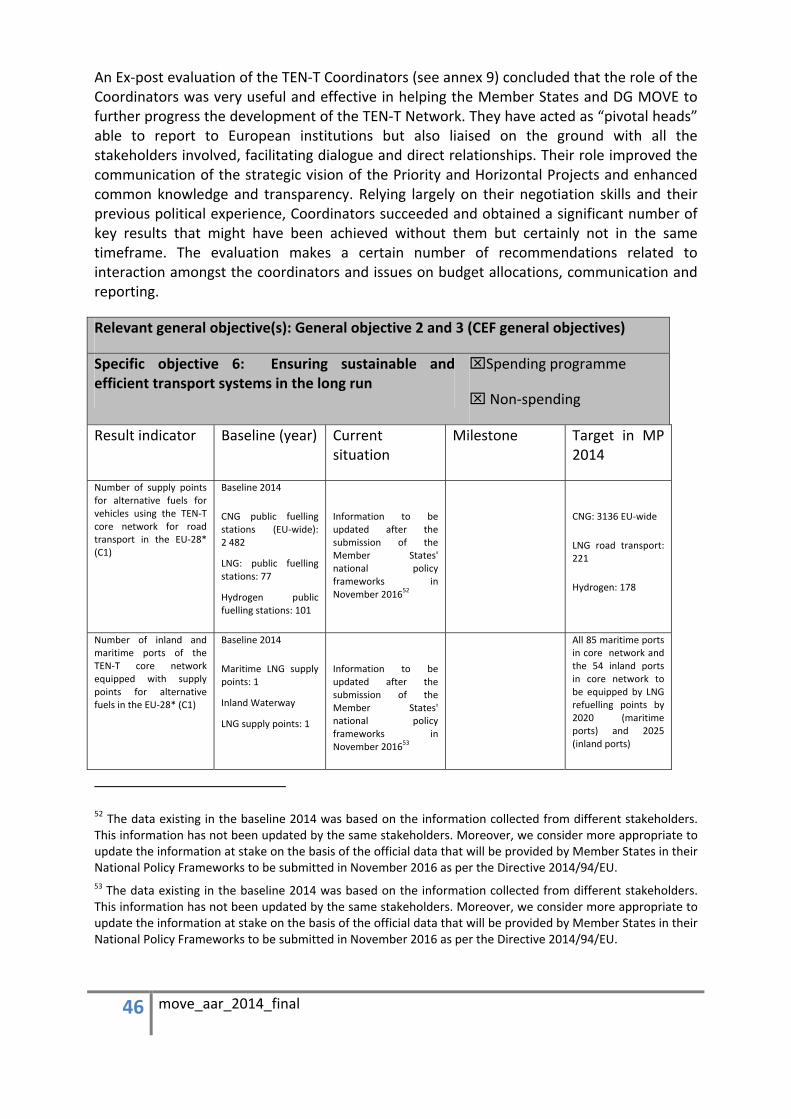
46 move_aar_2014_final
An Ex-post evaluation of the TEN-T Coordinators (see annex 9) concluded that the role of the Coordinators was very useful and effective in helping the Member States and DG MOVE to further progress the development of the TEN-T Network. They have acted as “pivotal heads” able to report to European institutions but also liaised on the ground with all the stakeholders involved, facilitating dialogue and direct relationships. Their role improved the communication of the strategic vision of the Priority and Horizontal Projects and enhanced common knowledge and transparency. Relying largely on their negotiation skills and their previous political experience, Coordinators succeeded and obtained a significant number of key results that might have been achieved without them but certainly not in the same timeframe. The evaluation makes a certain number of recommendations related to interaction amongst the coordinators and issues on budget allocations, communication and reporting.
Relevant general objective(s): General objective 2 and 3 (CEF general objectives)
Specific objective 6: Ensuring sustainable and efficient transport systems in the long run
⌧Spending programme
⌧ Non-spending
Result indicator Baseline (year) Current situation
Milestone Target in MP 2014
Number of supply points for alternative fuels for vehicles using the TEN-T core network for road transport in the EU-28* (C1)
Baseline 2014
CNG public fuelling stations (EU-wide): 2 482
LNG: public fuelling stations: 77
Hydrogen public fuelling stations: 101
Information to be updated after the submission of the Member States' national policy frameworks in November 201652
CNG: 3136 EU-wide
LNG road transport: 221
Hydrogen: 178
Number of inland and maritime ports of the TEN-T core network equipped with supply points for alternative fuels in the EU-28* (C1)
Baseline 2014
Maritime LNG supply points: 1
Inland Waterway
LNG supply points: 1
Information to be updated after the submission of the Member States' national policy frameworks in November 201653
All 85 maritime ports in core network and the 54 inland ports in core network to be equipped by LNG refuelling points by 2020 (maritime ports) and 2025 (inland ports)
52 The data existing in the baseline 2014 was based on the information collected from different stakeholders. This information has not been updated by the same stakeholders. Moreover, we consider more appropriate to update the information at stake on the basis of the official data that will be provided by Member States in their National Policy Frameworks to be submitted in November 2016 as per the Directive 2014/94/EU. 53 The data existing in the baseline 2014 was based on the information collected from different stakeholders. This information has not been updated by the same stakeholders. Moreover, we consider more appropriate to update the information at stake on the basis of the official data that will be provided by Member States in their National Policy Frameworks to be submitted in November 2016 as per the Directive 2014/94/EU.
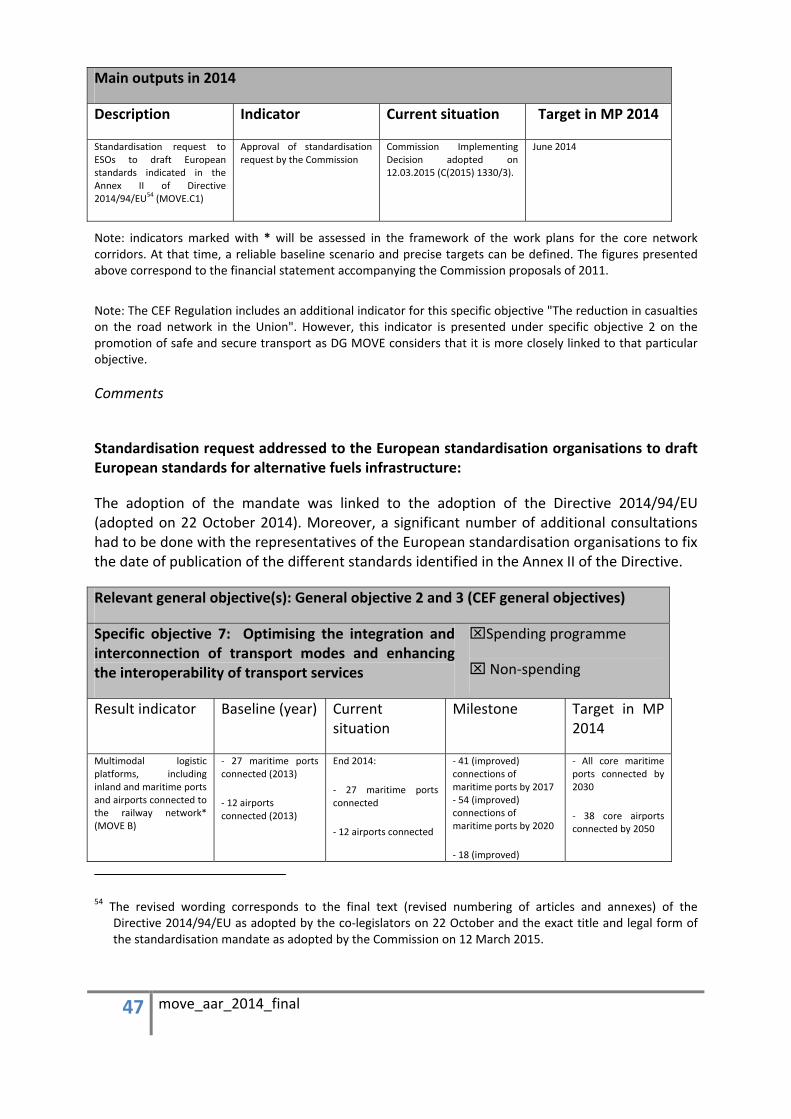
47 move_aar_2014_final
Main outputs in 2014
Description Indicator Current situation Target in MP 2014
Standardisation request to ESOs to draft European standards indicated in the Annex II of Directive 2014/94/EU54 (MOVE.C1)
Approval of standardisation request by the Commission
Commission Implementing Decision adopted on 12.03.2015 (C(2015) 1330/3).
June 2014
Note: indicators marked with * will be assessed in the framework of the work plans for the core network corridors. At that time, a reliable baseline scenario and precise targets can be defined. The figures presented above correspond to the financial statement accompanying the Commission proposals of 2011.
Note: The CEF Regulation includes an additional indicator for this specific objective "The reduction in casualties on the road network in the Union". However, this indicator is presented under specific objective 2 on the promotion of safe and secure transport as DG MOVE considers that it is more closely linked to that particular objective.
Comments
Standardisation request addressed to the European standardisation organisations to draft European standards for alternative fuels infrastructure:
The adoption of the mandate was linked to the adoption of the Directive 2014/94/EU (adopted on 22 October 2014). Moreover, a significant number of additional consultations had to be done with the representatives of the European standardisation organisations to fix the date of publication of the different standards identified in the Annex II of the Directive.
Relevant general objective(s): General objective 2 and 3 (CEF general objectives)
Specific objective 7: Optimising the integration and interconnection of transport modes and enhancing the interoperability of transport services
⌧Spending programme
⌧ Non-spending
Result indicator Baseline (year) Current situation
Milestone Target in MP 2014
Multimodal logistic platforms, including inland and maritime ports and airports connected to the railway network* (MOVE B)
- 27 maritime ports connected (2013)
- 12 airports connected (2013)
End 2014:
- 27 maritime ports connected
- 12 airports connected
- 41 (improved) connections of maritime ports by 2017 - 54 (improved) connections of maritime ports by 2020
- 18 (improved)
- All core maritime ports connected by 2030
- 38 core airports connected by 2050
54 The revised wording corresponds to the final text (revised numbering of articles and annexes) of the Directive 2014/94/EU as adopted by the co-legislators on 22 October and the exact title and legal form of the standardisation mandate as adopted by the Commission on 12 March 2015.

48 move_aar_2014_final
connections of airports by 2017
- 24 (improved) connections of airports by 2020
Improved rail-road terminals* (MOVE B)
End 2014: Reporting figures are not robust at this stage. Discussions have started to get an automated process in place in 2015. Requests to MS have not given any results. 6 MS have not replied at all
*
Number of improved or new connections between ports through Motorways of the Sea* (MOVE B)
End 2014: Reporting figures are not robust at this stage. Discussions have started to get an automated process in place in 2015. Requests to MS have not given any results. 6 MS have not replied at all
*
Main outputs in 2014
Description Indicator Current situation Target in MP 2014
Analysis of all 9 core network corridors
Establishment of work plan 9 work plans have been sent out to MS to 22/12/2014.
9 work plans end of 2014
Analysis of all 9 core network corridors
Establishment of a Corridor Forum for each corridor
9 corridor fora set up in 2014 9 by the end of 2014
Analysis of all 9 core network corridors
Data collection on technical parameters of the infrastructure for all corridors
Study for each corridor has been finalised in 2014
Full coverage of all 9 corridors, all transport modes
Corridor support functions in TENtec
Number of corridors supported.
All 9 core network corridor have been supported by TENtec in 2014
Support corridor forums by mid-2014, Systematic corridor monitoring by end 2014.
Innovation support functions in TENtec
Coverage of core/comprehensive TEN-T network.
Monitoring of core and comprehensive network coverage in TENtec public portal (incl. new mobile platform) available in 2014.
Monitoring of core network coverage by mid-2014 in TENtec public portal (incl. new mobile platform). Comprehensive network by end 2014.
Note: indicators marked with * will be assessed in the framework of the work plans for the core network corridors. At that time, a reliable baseline scenario and precise targets can be defined. The figures presented above correspond to the financial statement accompanying the Commission proposals of 2011.
Note: The CEF Regulation includes the following additional indicator for this specific objective "The number of kilometres of inland waterways fitted with RIS" and "The level of deployment for the SESAR system, VTMIS and ITS for the road sector". However, these indicators are presented included under specific objective 9 as DG MOVE considers that they are more closely linked to that particular objective.

49 move_aar_2014_final
Comments
N.a.
Relevant general objective(s): General objective 2 and 3 (CEF general objectives)
Specific objective 8: To create an environment more conducive to private and public investments notably through the financial instruments under the CEF regulation
⌧Spending programme
⌧ Non-spending
Result indicator Baseline (year) Current situation
Milestone Target in MP 2014
Volume of private investment in projects of common interest achieved through the financial instruments under the CEF regulation (B4)
0 in 2013 End 2014: 0 By 2017, EUR 8 bn of private investment in projects of common interest
By 2022, EUR 23 bn of private investment in projects of common interest (target date set to 2022 due to n+2 rule)
Increase in the external cost charging (compared to today's infrastructure charging) (D3)
0 in 2013 Germany introduced external cost charges to internalise the cost of air pollution as of 1 January 2015.
By 2015, have at least 1 HGV tolling scheme charging for external costs on top of the recovery of infrastructure costs
By 2020, all non-concession distance based-HGV tolling schemes include an external cost component on top of the recovery of infrastructure costs
Number of engagements of private entities in TEN-T innovative projects (market-sided innovation, Art 39). (MOVE.B)
0 in 2013 End 2014: n.a. (indicator discontinued due to lack of easily retrievable data)
Increase of no. of engagements of 10 per year (in case of multiple projects, multiple entity counting permitted).
70 engagements by end 2020
Investment by private entities in TEN-T innovative projects (market-sided innovation, Art 39). (MOVE.B)
0 in 2013 End 2014: n.a. (indicator discontinued due to lack of easily retrievable data)
By end 2015 € 200 million; annual increase 100 million thereafter.
Total 7 year investment of € 700 million by end 2020.
Main outputs in 2014
Description Indicator Current situation Target in MP 2014
Fair and efficient road pricing (MOVE.D3)
Adoption of a COM proposal revising Directive 1999/62/EC
Likely to be part of the 2016 road package
4th quarter 2014
Implementation of the new framework for the roll-out of financial instruments under the CEF (MOVE.B4)
New cooperation agreement with the EIB for implementation of financial instruments under the CEF
The cooperation agreement was ready to be signed in December but has not yet been approved
1st quarter 2014
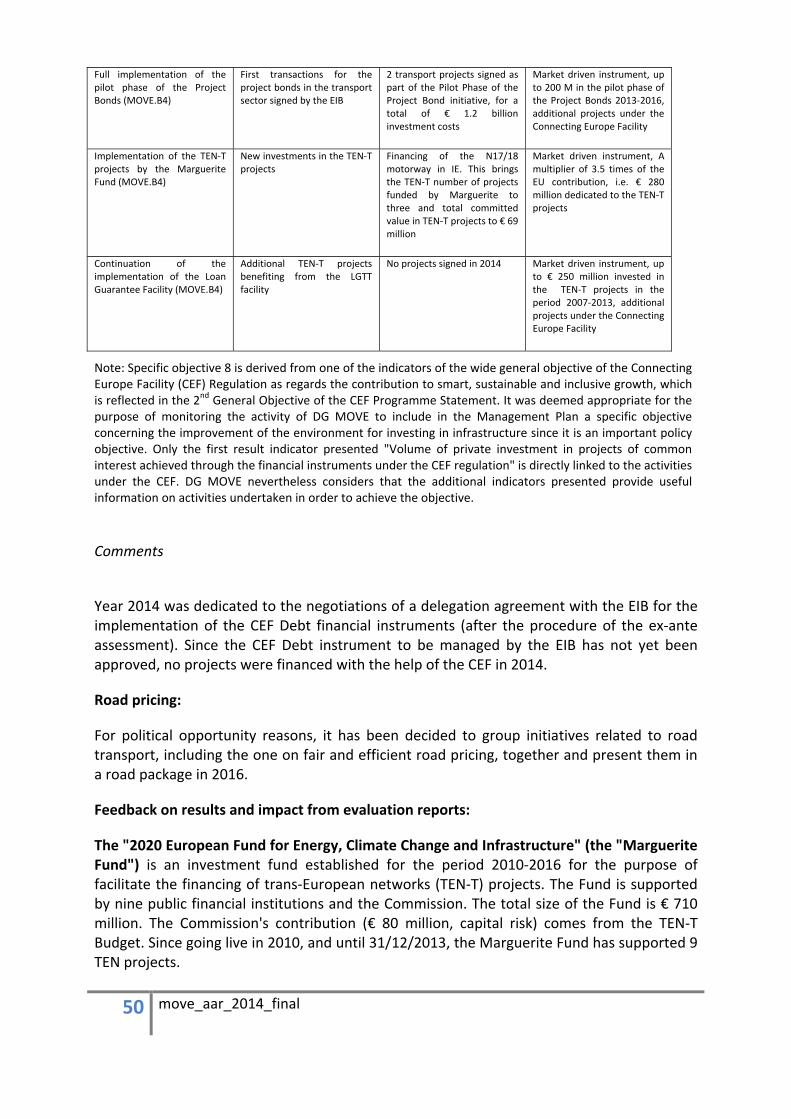
50 move_aar_2014_final
Full implementation of the pilot phase of the Project Bonds (MOVE.B4)
First transactions for the project bonds in the transport sector signed by the EIB
2 transport projects signed as part of the Pilot Phase of the Project Bond initiative, for a total of € 1.2 billion investment costs
Market driven instrument, up to 200 M in the pilot phase of the Project Bonds 2013-2016, additional projects under the Connecting Europe Facility
Implementation of the TEN-T projects by the Marguerite Fund (MOVE.B4)
New investments in the TEN-T projects
Financing of the N17/18 motorway in IE. This brings the TEN-T number of projects funded by Marguerite to three and total committed value in TEN-T projects to € 69 million
Market driven instrument, A multiplier of 3.5 times of the EU contribution, i.e. € 280 million dedicated to the TEN-T projects
Continuation of the implementation of the Loan Guarantee Facility (MOVE.B4)
Additional TEN-T projects benefiting from the LGTT facility
No projects signed in 2014 Market driven instrument, up to € 250 million invested in the TEN-T projects in the period 2007-2013, additional projects under the Connecting Europe Facility
Note: Specific objective 8 is derived from one of the indicators of the wide general objective of the Connecting Europe Facility (CEF) Regulation as regards the contribution to smart, sustainable and inclusive growth, which is reflected in the 2nd General Objective of the CEF Programme Statement. It was deemed appropriate for the purpose of monitoring the activity of DG MOVE to include in the Management Plan a specific objective concerning the improvement of the environment for investing in infrastructure since it is an important policy objective. Only the first result indicator presented "Volume of private investment in projects of common interest achieved through the financial instruments under the CEF regulation" is directly linked to the activities under the CEF. DG MOVE nevertheless considers that the additional indicators presented provide useful information on activities undertaken in order to achieve the objective.
Comments
Year 2014 was dedicated to the negotiations of a delegation agreement with the EIB for the implementation of the CEF Debt financial instruments (after the procedure of the ex-ante assessment). Since the CEF Debt instrument to be managed by the EIB has not yet been approved, no projects were financed with the help of the CEF in 2014.
Road pricing:
For political opportunity reasons, it has been decided to group initiatives related to road transport, including the one on fair and efficient road pricing, together and present them in a road package in 2016.
Feedback on results and impact from evaluation reports:
The "2020 European Fund for Energy, Climate Change and Infrastructure" (the "Marguerite Fund") is an investment fund established for the period 2010-2016 for the purpose of facilitate the financing of trans-European networks (TEN-T) projects. The Fund is supported by nine public financial institutions and the Commission. The total size of the Fund is € 710 million. The Commission's contribution (€ 80 million, capital risk) comes from the TEN-T Budget. Since going live in 2010, and until 31/12/2013, the Marguerite Fund has supported 9 TEN projects.

51 move_aar_2014_final
An ad-hoc audit of the Marguerite Fund in 2014 (see annex 9) concluded that the fund had been satisfactory in terms of effectiveness and efficiency. In terms of EU Added Value the audit considers performance as partially unsatisfactory given the significant difficulties in financing TEN-T projects. Nevertheless, the fact that Marguerite is the sole case of cooperation between the EU and national public financial institutions for providing a capital investment fund on a pan-European basis represents a high added value by itself. The ad-hoc audit found that the activity of the Marguerite Fund had been additional with respect to both other private sources of capital and other existing EU instruments. The results have been an important input for the Commission's ex-ante evaluation of the approach for financial instruments under the Connecting Europe Facility for the period 2014-2020.
The "Loan guarantee instrument for the trans-European transport network projects" (LGTT) is a financial instrument created to support Public-Private Partnerships (PPPs) carrying out TEN-T projects. The legal basis of LGTT is Regulation (EU) 680/2007. The instrument was established by means of a cooperation agreement between the Commission and the European Investment Bank (EIB). The capital contribution of the Commission to LGTT is € 250 million. LGTT has been utilised in seven traffic revenue-risk TEN-T PPP transactions in France, Germany, Portugal, Spain and United Kingdom in the port, road and rail sectors, involving a total capital investment of more than € 12 billion.
An ex-post evaluation of LGTT in 2014 (see annex 9) found that LGTT has had a positive impact on the projects it has supported; to date, none of the projects have used or drawn the guarantee provided by the LGTT. The parties involved (public authorities, projects' promoters), appreciate the support provided by the LGTT. However, the LGTT nevertheless did not achieve its objectives, as it served to support only a small number of projects because of two main reasons: a) the economic crisis, which had severe negative effects on the pipeline of projects and b) the narrow scope of LGTT, focused exclusively on mitigating traffic revenue risks. The main recommendations are to reconsider the scope of future financial instruments and improve transparency and understanding of financial instruments.
EPEC (The European Public-Private Partnership (PPP) Expertise Centre) was established in 2008 as a joint initiative between the Commission and the EIB. Its mandate was to support the public sector capacity to implement the public private partnership (PPPs) projects and programmes, improve PPP planning and implementation and spreading best practices in the Member States, including dissemination of information and know-how on the PPPs. Since 2010 the initiative was financed as a direct grant from the trans-European transport network (TEN-T) and Cohesion funds. The TEN-T grant was managed by the TEN-T Executive Agency
An ex-post evaluation of EPEC in 2014 (see annex 9) found that EPEC has contributed to raise awareness and spread best practices to its Members at the central level (Ministries), dealing with planning framework / and implementation of the public private procurements, but that dissemination practices of EPEC have been largely insufficient to reach out towards wider circle of regional, local administration and procuring authorities dealing with implementation of the PPPs. In the light of the findings of the evaluation, the Commission decided to discontinue its co-sponsoring of EPEC. New approaches for providing technical assistance to PPP deals supporting TEN-T projects, including the possible re-orientation of EPEC will be discussed with the EIB.
52 move_aar_2014_final
Evidence from across the EU indicates that transport infrastructure in general, and road infrastructure in particular, is degrading because of decades of delayed or foregone investments in maintenance. Road charging could provide a stable flow of revenues to sustainably manage the infrastructure over its lifetime. An evaluation of the implementation and effects of EU infrastructure charging policy since 1995 in 2014 (see annex 9) analyses the experience with respect to road user charging policies in the Member States. It notably found that a shift from vignettes to electronic tolls should be encourage in order to ensure better recovery of infrastructure costs and that action at EU level is required in order to improve consistency and compatibility of pricing systems across Europe and to avoid discriminatory practices.
Conclusion on the ABB activity
As evidenced above, the grant component of the transport part of the Connecting Europe Facility within this ABB activity under the responsibility of DG MOVE is on course to meet its multiannual objectives, thanks to the adoption of multi-annual and annual work programmes allocating close to € 12 billion in funding to calls for proposals for projects on the TEN-T Network. However, since 2014 has been a year of preparation for the large Calls for proposals (Info Days, contacts with Member States and project promoters, reinforcement of the executive agency INEA), the annual performance and output indicators as well as milestones have not shown significant progress in 2014.
As evidenced above, the financial instruments component of the transport part of the Connecting Europe Facility within this ABB activity under the responsibility of DG MOVE is on course to meet its multiannual objectives, thanks to the negotiation of a delegation agreement with the European Investment Bank, and the continuous successful implementation of the instruments under the 2007-13 MFF (Project Bonds Initiative Pilot Phase). However, since 2014 has been a year of negotiation and the delegation agreement has not yet entered into force, the annual performance and output indicators as well as milestones have not shown significant progress in 2014.
1.1.3 Specific objectives for ABB activity "Horizon 2020 – Research and innovation related to transport
The White Paper on Transport identifies four priority areas as essential to developing the EU transport system into a competitive and resource efficient transport system and to reach its ultimate objective of cutting carbon emissions in transport by 60% by 2050. Innovation is one of them. Transport activities under Horizon 2020 are aimed at increasing the effectiveness of research and innovation in responding to key societal challenges by supporting piloting, demonstration, test-beds, and support for public procurement, pre-normative research and standard setting, and market uptake of innovations. The activities thus support directly the competiveness of the EU's transport and logistics system and technologies as well as providing highly qualified jobs for EU companies active in global markets for transport solutions. Horizon 2020 is in particular focussing on innovation and the
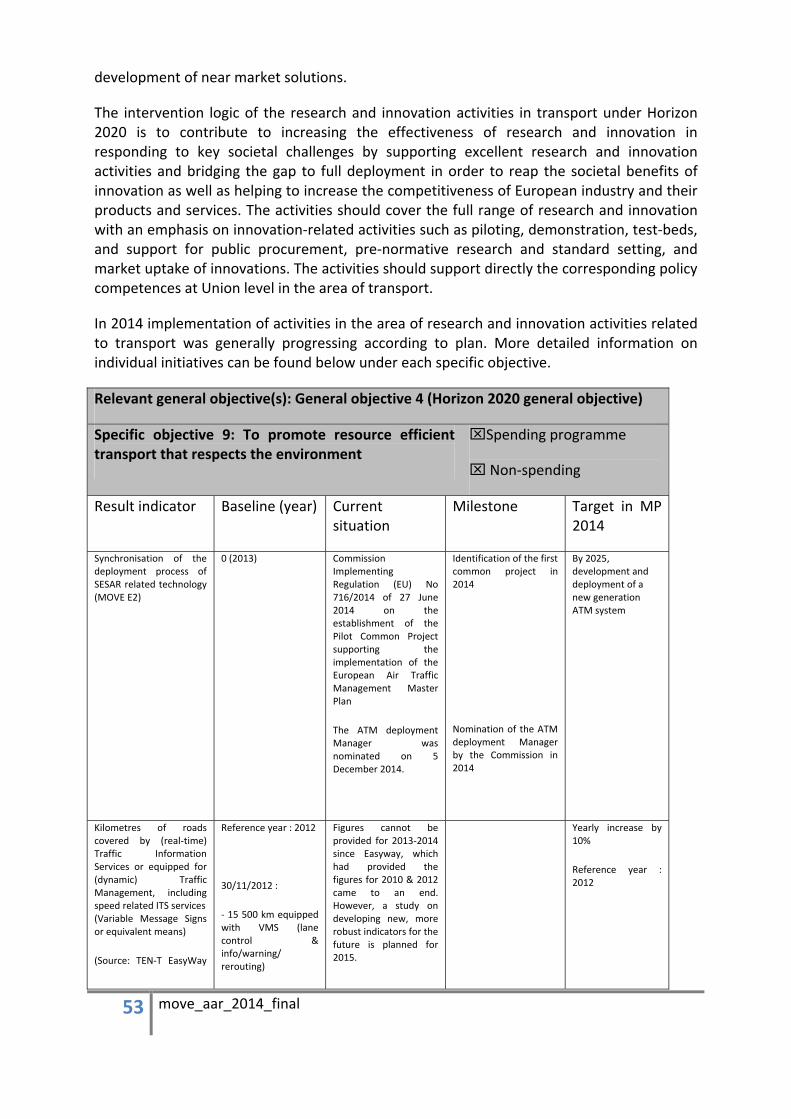
53 move_aar_2014_final
development of near market solutions.
The intervention logic of the research and innovation activities in transport under Horizon 2020 is to contribute to increasing the effectiveness of research and innovation in responding to key societal challenges by supporting excellent research and innovation activities and bridging the gap to full deployment in order to reap the societal benefits of innovation as well as helping to increase the competitiveness of European industry and their products and services. The activities should cover the full range of research and innovation with an emphasis on innovation-related activities such as piloting, demonstration, test-beds, and support for public procurement, pre-normative research and standard setting, and market uptake of innovations. The activities should support directly the corresponding policy competences at Union level in the area of transport.
In 2014 implementation of activities in the area of research and innovation activities related to transport was generally progressing according to plan. More detailed information on individual initiatives can be found below under each specific objective.
Relevant general objective(s): General objective 4 (Horizon 2020 general objective)
Specific objective 9: To promote resource efficient transport that respects the environment
⌧Spending programme
⌧ Non-spending
Result indicator Baseline (year) Current situation
Milestone Target in MP 2014
Synchronisation of the deployment process of SESAR related technology (MOVE E2)
0 (2013) Commission Implementing Regulation (EU) No 716/2014 of 27 June 2014 on the establishment of the Pilot Common Project supporting the implementation of the European Air Traffic Management Master Plan
The ATM deployment Manager was nominated on 5 December 2014.
Identification of the first common project in 2014
Nomination of the ATM deployment Manager by the Commission in 2014
By 2025, development and deployment of a new generation ATM system
Kilometres of roads covered by (real-time) Traffic Information Services or equipped for (dynamic) Traffic Management, including speed related ITS services (Variable Message Signs or equivalent means)
(Source: TEN-T EasyWay
Reference year : 2012
30/11/2012 :
- 15 500 km equipped with VMS (lane control & info/warning/ rerouting)
Figures cannot be provided for 2013-2014 since Easyway, which had provided the figures for 2010 & 2012 came to an end. However, a study on developing new, more robust indicators for the future is planned for 2015.
Yearly increase by 10%
Reference year : 2012
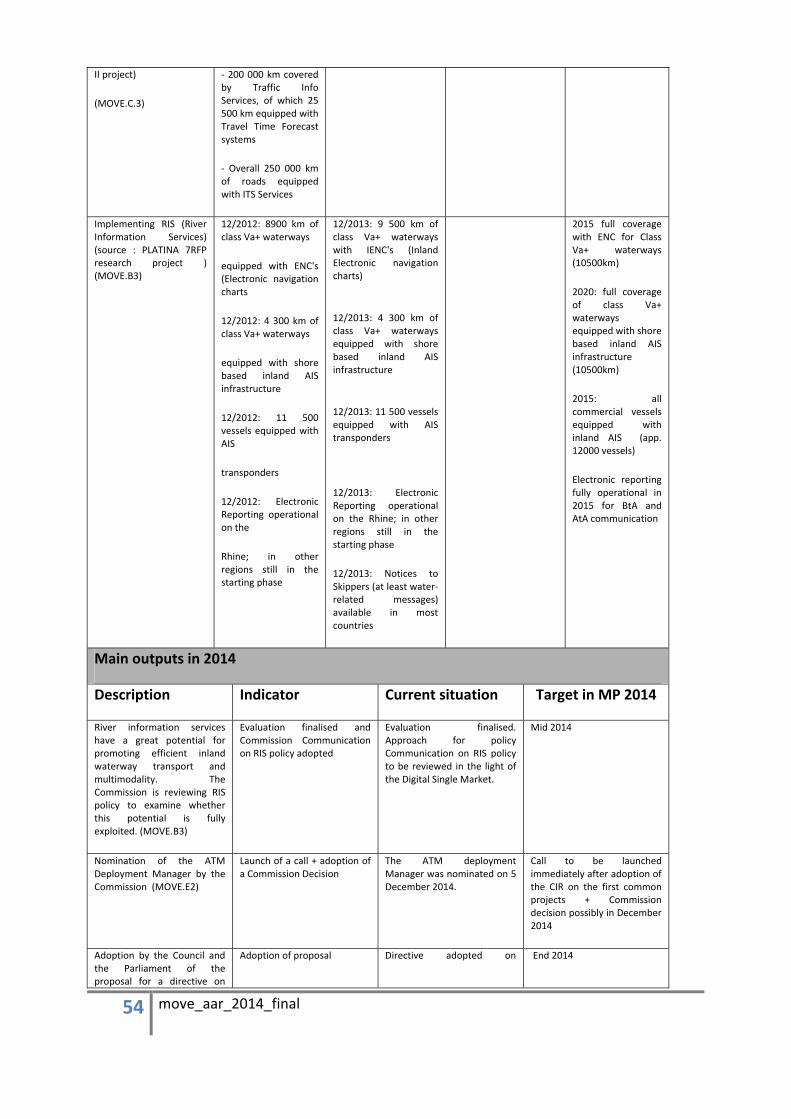
54 move_aar_2014_final
II project)
(MOVE.C.3)
- 200 000 km covered by Traffic Info Services, of which 25 500 km equipped with Travel Time Forecast systems
- Overall 250 000 km of roads equipped with ITS Services
Implementing RIS (River Information Services) (source : PLATINA 7RFP research project ) (MOVE.B3)
12/2012: 8900 km of class Va+ waterways
equipped with ENC's (Electronic navigation charts
12/2012: 4 300 km of class Va+ waterways
equipped with shore based inland AIS infrastructure
12/2012: 11 500 vessels equipped with AIS
transponders
12/2012: Electronic Reporting operational on the
Rhine; in other regions still in the starting phase
12/2013: 9 500 km of class Va+ waterways with IENC's (Inland Electronic navigation charts)
12/2013: 4 300 km of class Va+ waterways equipped with shore based inland AIS infrastructure
12/2013: 11 500 vessels equipped with AIS transponders
12/2013: Electronic Reporting operational on the Rhine; in other regions still in the starting phase
12/2013: Notices to Skippers (at least water-related messages) available in most countries
2015 full coverage with ENC for Class Va+ waterways (10500km)
2020: full coverage of class Va+ waterways equipped with shore based inland AIS infrastructure (10500km)
2015: all commercial vessels equipped with inland AIS (app. 12000 vessels)
Electronic reporting fully operational in 2015 for BtA and AtA communication
Main outputs in 2014
Description Indicator Current situation Target in MP 2014
River information services have a great potential for promoting efficient inland waterway transport and multimodality. The Commission is reviewing RIS policy to examine whether this potential is fully exploited. (MOVE.B3)
Evaluation finalised and Commission Communication on RIS policy adopted
Evaluation finalised. Approach for policy Communication on RIS policy to be reviewed in the light of the Digital Single Market.
Mid 2014
Nomination of the ATM Deployment Manager by the Commission (MOVE.E2)
Launch of a call + adoption of a Commission Decision
The ATM deployment Manager was nominated on 5 December 2014.
Call to be launched immediately after adoption of the CIR on the first common projects + Commission decision possibly in December 2014
Adoption by the Council and the Parliament of the proposal for a directive on
Adoption of proposal Directive adopted on End 2014
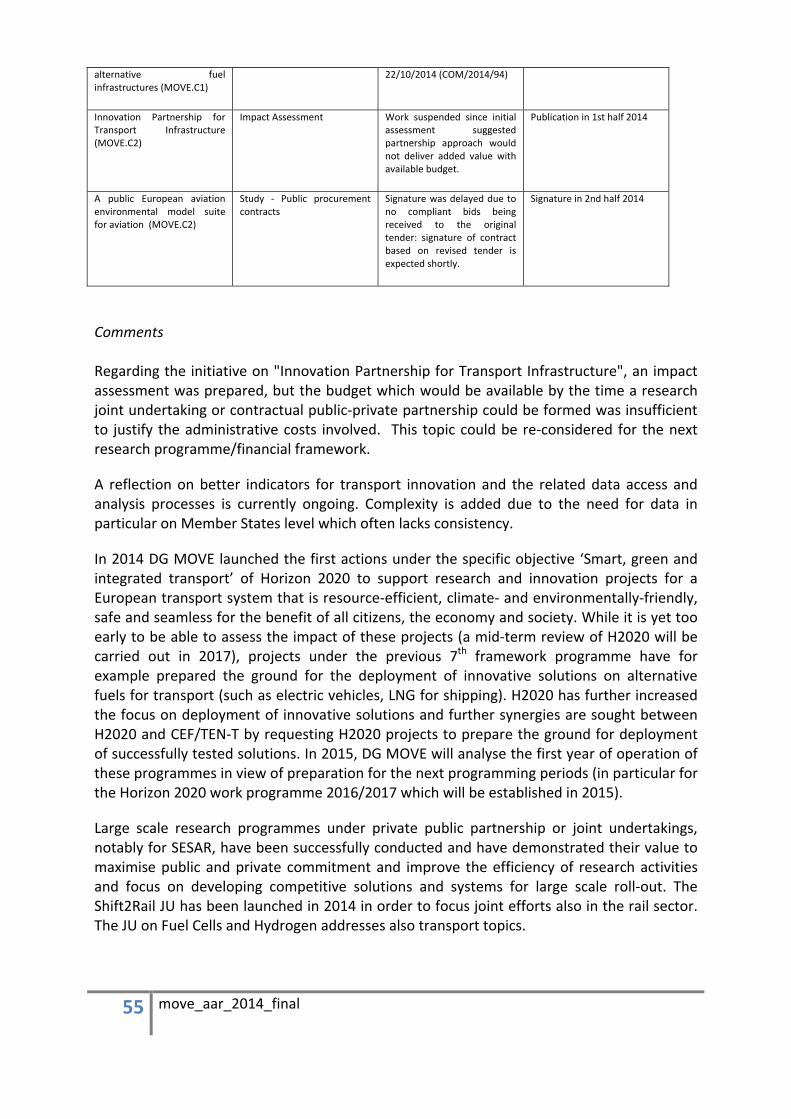
55 move_aar_2014_final
alternative fuel infrastructures (MOVE.C1)
22/10/2014 (COM/2014/94)
Innovation Partnership for Transport Infrastructure (MOVE.C2)
Impact Assessment Work suspended since initial assessment suggested partnership approach would not deliver added value with available budget.
Publication in 1st half 2014
A public European aviation environmental model suite for aviation (MOVE.C2)
Study - Public procurement contracts
Signature was delayed due to no compliant bids being received to the original tender: signature of contract based on revised tender is expected shortly.
Signature in 2nd half 2014
Comments Regarding the initiative on "Innovation Partnership for Transport Infrastructure", an impact assessment was prepared, but the budget which would be available by the time a research joint undertaking or contractual public-private partnership could be formed was insufficient to justify the administrative costs involved. This topic could be re-considered for the next research programme/financial framework.
A reflection on better indicators for transport innovation and the related data access and analysis processes is currently ongoing. Complexity is added due to the need for data in particular on Member States level which often lacks consistency.
In 2014 DG MOVE launched the first actions under the specific objective ‘Smart, green and integrated transport’ of Horizon 2020 to support research and innovation projects for a European transport system that is resource-efficient, climate- and environmentally-friendly, safe and seamless for the benefit of all citizens, the economy and society. While it is yet too early to be able to assess the impact of these projects (a mid-term review of H2020 will be carried out in 2017), projects under the previous 7th framework programme have for example prepared the ground for the deployment of innovative solutions on alternative fuels for transport (such as electric vehicles, LNG for shipping). H2020 has further increased the focus on deployment of innovative solutions and further synergies are sought between H2020 and CEF/TEN-T by requesting H2020 projects to prepare the ground for deployment of successfully tested solutions. In 2015, DG MOVE will analyse the first year of operation of these programmes in view of preparation for the next programming periods (in particular for the Horizon 2020 work programme 2016/2017 which will be established in 2015).
Large scale research programmes under private public partnership or joint undertakings, notably for SESAR, have been successfully conducted and have demonstrated their value to maximise public and private commitment and improve the efficiency of research activities and focus on developing competitive solutions and systems for large scale roll-out. The Shift2Rail JU has been launched in 2014 in order to focus joint efforts also in the rail sector. The JU on Fuel Cells and Hydrogen addresses also transport topics.

56 move_aar_2014_final
Easyway:
The ITS Deployment Guidelines (from EasyWay II) have been adopted as planned (by MS partners) and published online http://www.easyway-its.eu/deployment-guidelines/ (publicly available for implementation).
Feedback on results and impact from evaluation reports:
The Second mid-term evaluation of the SESAR Joint Undertaking (SJU) 2010-2012 (see annex 9) concluded that the SJU operated effectively, thus contributing to the objectives of the SESAR Project and to the Single European Sky (SES) policy objectives. The SJU's work programme supported the preparation for deployment and was aligned with the European ATM Master Plan.
The evaluation confirmed that the SJU has set up an appropriate management structure and procedures needed to effectively manage 336 research projects. SJU has achieved most of its mid-term objectives of its work programme, improving delivery rate during the reference period from approximately 60% in 2010 to 82% by the end of 2012.
The European PPP structure of the SJU allowed it to strike a proper balance between enhancing cooperation among its members and retaining the advantages of a competitive and innovative environment. The SJU added value by avoiding duplication and lack of coordination in the European ATM research and development sector and achieved economies of scale. The overall added value of the SJU will be fully measurable once SESAR solutions are implemented. The external assessors recommended that the SJU continue its efforts to improve the rate of completion of its annual, stated goals.
The independent assessment nevertheless recommended that the SJU and DG MOVE identify and address the specific information needs of the EU Member States. The independent assessment will be complemented by an internal evaluation of the SJU's contribution to the overall SESAR project and will be submitted to the Council and European Parliament.
The River Information Service (RIS) Directive (2005/44/EC) aims at harmonising market conditions in the sector of Inland Waterways. It contributes to the objectives of optimising the integration and interconnection of transport modes and enhancing the interoperability of transport services and promoting innovation for resource-efficient transport that respects the environment.
In 2013, following a legal obligation (art. 12), the Commission launched an evaluation of the RIS policy for the period 2006-2011 (see annex 9). The evaluation report concluded that RIS has been a driver for development in the IWT industry: many public and private parties collaborated to define and implement standards and roll out the key RIS technologies. Major progress was achieved in the implementation of RIS technologies and RIS services, such as fairway information and traffic information services. However, applications focussing on optimising logistics processes and modal integration are missing or not yet functioning. The implementation of some of the key technologies and their usage rate is still in progress. In
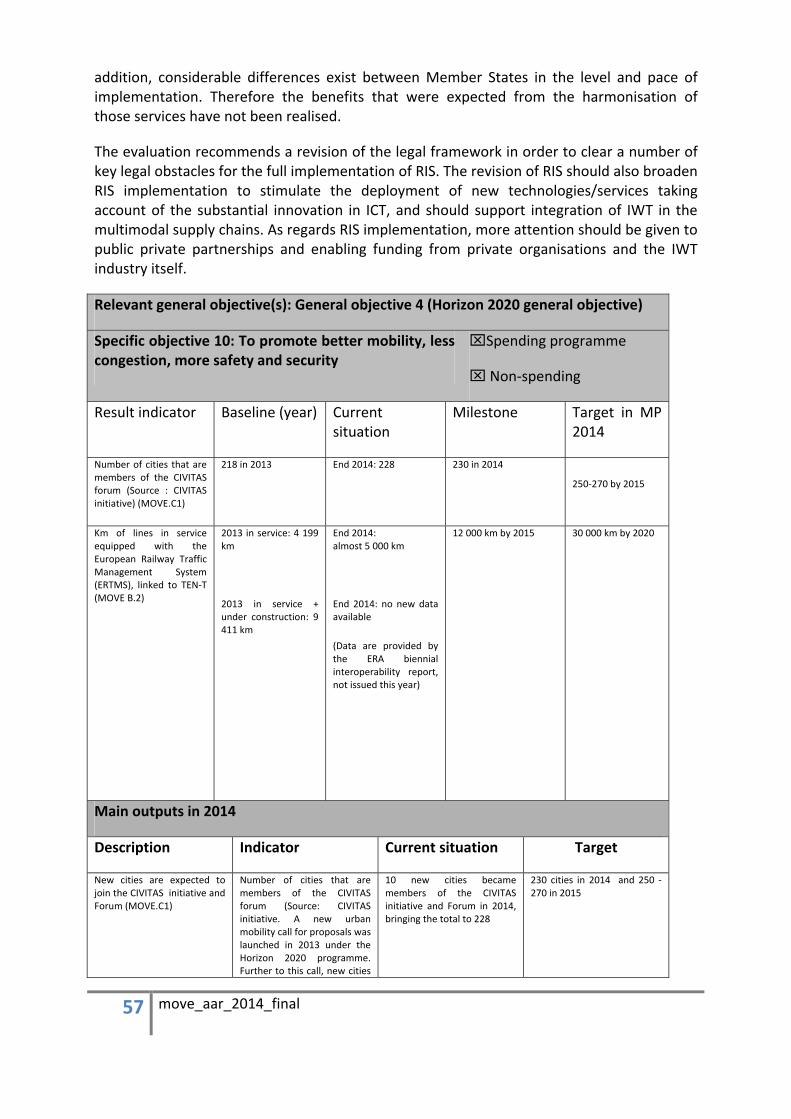
57 move_aar_2014_final
addition, considerable differences exist between Member States in the level and pace of implementation. Therefore the benefits that were expected from the harmonisation of those services have not been realised.
The evaluation recommends a revision of the legal framework in order to clear a number of key legal obstacles for the full implementation of RIS. The revision of RIS should also broaden RIS implementation to stimulate the deployment of new technologies/services taking account of the substantial innovation in ICT, and should support integration of IWT in the multimodal supply chains. As regards RIS implementation, more attention should be given to public private partnerships and enabling funding from private organisations and the IWT industry itself.
Relevant general objective(s): General objective 4 (Horizon 2020 general objective)
Specific objective 10: To promote better mobility, less congestion, more safety and security
⌧Spending programme
⌧ Non-spending
Result indicator Baseline (year) Current situation
Milestone Target in MP 2014
Number of cities that are members of the CIVITAS forum (Source : CIVITAS initiative) (MOVE.C1)
218 in 2013
End 2014: 228
230 in 2014 250-270 by 2015
Km of lines in service equipped with the European Railway Traffic Management System (ERTMS), linked to TEN-T (MOVE B.2)
2013 in service: 4 199 km
2013 in service + under construction: 9 411 km
End 2014: almost 5 000 km
End 2014: no new data available
(Data are provided by the ERA biennial interoperability report, not issued this year)
12 000 km by 2015
30 000 km by 2020
Main outputs in 2014
Description Indicator Current situation Target
New cities are expected to join the CIVITAS initiative and Forum (MOVE.C1)
Number of cities that are members of the CIVITAS forum (Source: CIVITAS initiative. A new urban mobility call for proposals was launched in 2013 under the Horizon 2020 programme. Further to this call, new cities
10 new cities became members of the CIVITAS initiative and Forum in 2014, bringing the total to 228
230 cities in 2014 and 250 -270 in 2015
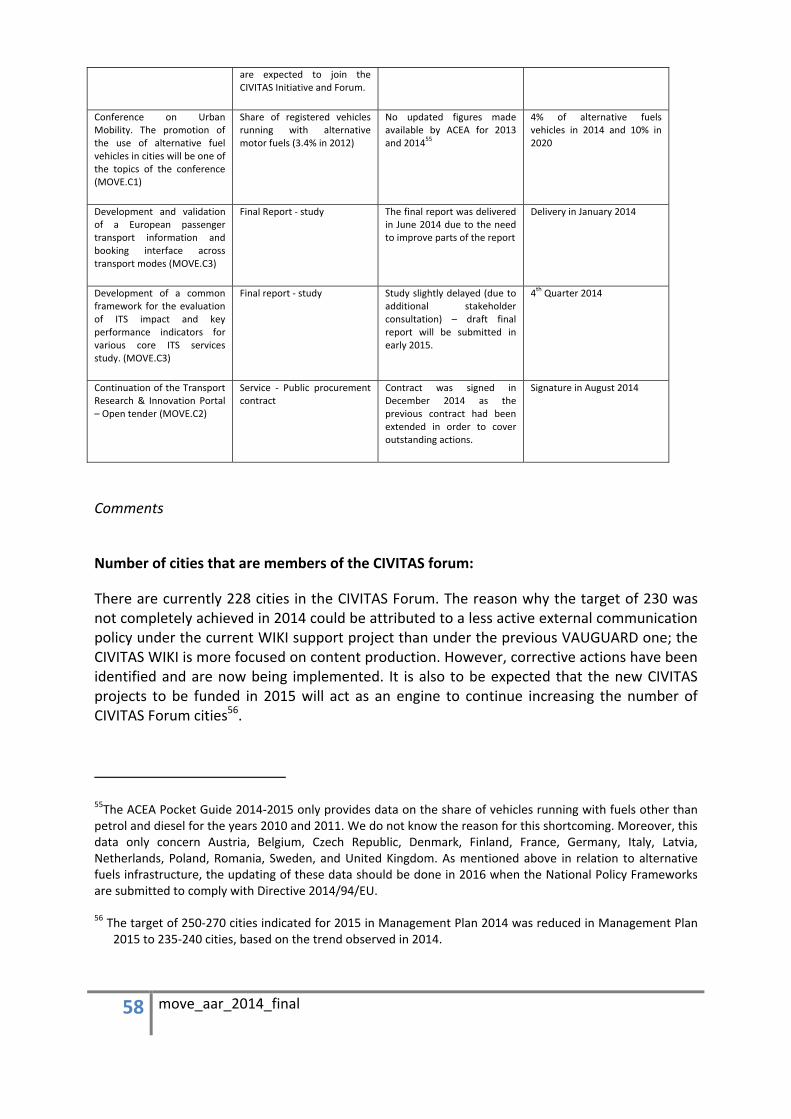
58 move_aar_2014_final
are expected to join the CIVITAS Initiative and Forum.
Conference on Urban Mobility. The promotion of the use of alternative fuel vehicles in cities will be one of the topics of the conference (MOVE.C1)
Share of registered vehicles running with alternative motor fuels (3.4% in 2012)
No updated figures made available by ACEA for 2013 and 201455
4% of alternative fuels vehicles in 2014 and 10% in 2020
Development and validation of a European passenger transport information and booking interface across transport modes (MOVE.C3)
Final Report - study The final report was delivered in June 2014 due to the need to improve parts of the report
Delivery in January 2014
Development of a common framework for the evaluation of ITS impact and key performance indicators for various core ITS services study. (MOVE.C3)
Final report - study Study slightly delayed (due to additional stakeholder consultation) – draft final report will be submitted in early 2015.
4th Quarter 2014
Continuation of the Transport Research & Innovation Portal – Open tender (MOVE.C2)
Service - Public procurement contract
Contract was signed in December 2014 as the previous contract had been extended in order to cover outstanding actions.
Signature in August 2014
Comments
Number of cities that are members of the CIVITAS forum:
There are currently 228 cities in the CIVITAS Forum. The reason why the target of 230 was not completely achieved in 2014 could be attributed to a less active external communication policy under the current WIKI support project than under the previous VAUGUARD one; the CIVITAS WIKI is more focused on content production. However, corrective actions have been identified and are now being implemented. It is also to be expected that the new CIVITAS projects to be funded in 2015 will act as an engine to continue increasing the number of CIVITAS Forum cities56.
55The ACEA Pocket Guide 2014-2015 only provides data on the share of vehicles running with fuels other than petrol and diesel for the years 2010 and 2011. We do not know the reason for this shortcoming. Moreover, this data only concern Austria, Belgium, Czech Republic, Denmark, Finland, France, Germany, Italy, Latvia, Netherlands, Poland, Romania, Sweden, and United Kingdom. As mentioned above in relation to alternative fuels infrastructure, the updating of these data should be done in 2016 when the National Policy Frameworks are submitted to comply with Directive 2014/94/EU.
56 The target of 250-270 cities indicated for 2015 in Management Plan 2014 was reduced in Management Plan 2015 to 235-240 cities, based on the trend observed in 2014.
59 move_aar_2014_final
Study on "Development and validation of a European passenger transport information and booking interface across transport modes":
The study on "Development and validation of a European passenger transport information and booking interface across transport modes" has established the technological basis and confirmed the availability of the required technologies. Additional challenges are planned to be addressed in the next H2020 work programme with a view to establishing "mobility as a service".
Regarding "Continuation of the Transport Research & Innovation Portal", the previous contract has delivered in overviews and public brochures of EU R&I results and outlooks for future research needs for all transport areas. This is the starting point for the continuation project, which will in particular review and analyse in depth up to 6 specific cross-cutting transport areas with a view to developing a solid basis for policy action in order to progress cross-cutting and multimodal elements of the future European transport system.
For Horizon 2020 see also general comments above under Specific Objective 9.
Conclusion on the ABB activity
As evidenced above, the research and innovation activities related to transport under Horizon 2020 managed by DG MOVE under this ABB activity are on course to meet the multiannual objectives and generally achieved the annual performance indicators or outputs and milestones in the reporting year. In particular the increasing focus on impact of R&I projects introduced by Horizon 2020 as well as the links with deployment programmes such as CEF will further enhance the added-value of the actions under objective 4 for the development and implementation of a single European transport system that provides adequate mobility services for citizens and world-class logistics support for European businesses in the internal European and the global markets. Work is ongoing on improving and amending performance indicators in order to better capture the impact of transport research and innovation for citizens and businesses.
60 move_aar_2014_final
1.2 Example of EU-added value and results/impacts of projects or programme financed
The TEN-T programme plays a vital role in financing transport infrastructure by granting support to selected European projects in all transport modes and in every EU Member State.
While preparing the work plans for the years ahead under the new Connecting Europe Facility 2014-2020, the Commission and European Coordinators continued their steady work to support the implementation of major projects (namely the "priority projects" defined under the previous TEN-T Guidelines). This involved both coordination (non-financial) action as well as the granting of significant financial support from the TEN-T budget (the last tranches of the 2007 – 2013 budget).
The strategic projects under the TEN-T programme provide strong EU added value by contributing to closing the gaps between Member States' transport networks, removing bottlenecks that still hamper the smooth functioning of the internal market and overcoming technical barriers such as incompatible standards for railway traffic.
Some key results achieved on large investment projects were:
• Brenner base tunnel project: the start of construction of the € 380 million access tunnel Tulfes – Pfons in Austria and the final preparation of the Eisack underpath in Italy; to date, for the whole project (covering both access tunnels and the base tunnel itself), 34 km of tunnel have been excavated.
• Lyon – Torino base tunnel project: excavation works on the 7 km long "La Maddalena" access tunnel in Italy have started and reached about 2 km of length so far. France has decided to extend the base tunnel access at "Saint – Martin - La Porte"). At political level, the ratification of the 2012 intergovernmental agreement has been completed; it notably concerns the setting-up of the new project promoter and the cost distribution between France and Italy.
• Rail Baltic project: Railways and governments of the States concerned have created a joint undertaking (based in Riga), which is mandated to set up a company for building the new railway line.
Under the Pilot phase of the Project Bonds Initiative (PBI), two new TEN-T transactions were supported by means of financial instruments:
• the extension of the A7 Bordesholm-Hamburg motorway in Germany (total cost around € 657 million). The project, part of the trans-European transport network, is the longest motorway in Germany and one of most important North-South links between Scandinavia and central Europe. The project helps adapt the motorway to

61 move_aar_2014_final
increasing traffic and maintain it as an efficient and attractive transport link57.
• and the new A11 motorway to transfer traffic between Zeebrugge, Ghent and Antwerp in Belgium (construction cost € 657.5 million). Once complete the A11 will provide a direct motorway connection between the port of Zeebrugge and the European motorway network. The A11 is both the first transport project and the first greenfield PPP in Europe to benefit from the Project Bond Initiative58
Those 2014 PBI transactions have had a strong catalytic effect in promoting capital market financing and in widening access to institutional funding.
Strategic infrastructure projects, like the examples presented, are vital for Europe to re-boost its economy and to generate new jobs. The implementation of these projects plays a major role for territorial, economic and social cohesion of the Union. Further concrete examples of EU added value and results and impact of TEN-T projects can be found in the web-site of the Innovation and Network Executive Agency (INEA).59
1.3 Economy and efficiency of spending and non-spending activities.
According to the financial regulation (art 30), the principle of economy required that the resources used by the institution in the pursuit of its activities shall be made available in due time, in appropriate quantity and quality and the best price. The principle of efficiency concerns the best relationship between resources employed and results achieved.
The respect of these principles is continuously pursued through the implementation of internal procedures and predefined practices. These procedures ensure that activities are executed in an efficient manner (e.g. the different workflows contribute to the efficient cooperation between staff, units, etc…) and according to the principle of economy (e.g. the procurement rules ensure procurement in optimal conditions).
DG MOVE is continuously fine-tuning its internal arrangements in order to improve the efficiency and economy of its operations. The following two initiatives show how these principles are implemented in DG MOVE:
57 Detailed information on the financial transaction can be found at the EIB web-site: http://www.eib.org/infocentre/press/releases/all/2014/2014-182-a7-extension-first-financing-operation-in-germany-with-eu-project-bonds.htm
58 http://www.eib.org/infocentre/press/releases/all/2014/2014-066-eib-backs-a11-belgian-motorway-link.htm 59 http://inea.ec.europa.eu/en/ten-t/ten-t_implementation_successes/project_implementation_successes.htm
62 move_aar_2014_final
1.3.1 Example 1
The launching in 2014 of the new governance structure based on the provisions of the new TEN-T Guidelines and of the Connecting Europe Facility (CEF) Regulations significantly enhances economy and efficiency of the Union's action to develop the trans-European transport network.
The CEF corridor approach, with European Coordinators facilitating and stimulating action of all partners involved, will not only boost the implementation of major projects. Building on the new multi-modal network approach, it will enable a more efficient use of resources – both financial resources and infrastructure capacity.
By promoting inter-modality, interoperability, innovative and "intelligent" equipment, by integrating urban areas and by setting binding standards (for example on safety), it creates the genuine infrastructure basis for an efficient and sustainable transport system overall. This vastly broadens the role of EU coordination and promises to boost efficiency and economy in an unprecedented way.
The elaboration of corridor work plans in 2014, providing the basis for corridor strategic development until 2030 is a key milestone for improving economy and efficiency of TEN-T / CEF spending and non-spending activities.
1.3.2 Example 2
DG MOVE is continuously working on rationalising activities related to IT and similar functions. In 2014 this includes:
• The transfer of the TENtec team to SRD and INEA has been realised during the spring of 2014 in order to allow for synergies between the DGs MOVE, ENER and CNECT, as well as INEA. The data warehouse and related activities remain available between all above mentioned parties within SRD4. The family of modules related to the handling of projects has been located in INEA.
• The specific website on the passenger rights campaign "Your passenger rights at hand" was discontinued and replaced by a completely new one integrated in "Your Europe Portal" managed by DG GROW. This has contributed to the rationalisation of the Commission's presence on the web and induced economy of resources and more efficiency of spending activities.
63 move_aar_2014_final
2. MANAGEMENT OF RESOURCES Assurance is an objective examination of evidence for the purpose of providing an assessment of the effectiveness of risk management, control and governance processes. This examination is carried out by management, who monitors the functioning of the internal control systems on a continuous basis, and by internal and external auditors. Its results are explicitly documented and reported to the Director-General. The reports produced are:
- the reports submitted by DG MOVE's Directors;
- the reports from Authorising Officers in other Directorates-General managing budget appropriations in cross-delegation;
- the result of the Commission supervision on the activities of the entrusted entities;
- the contribution of the Internal Control Coordinator (ICC), including the results of internal control monitoring at the Directorate-General level;
- the reports of the ex-post audit function;
- the opinion and the observations of the Shared Internal Audit Capability (SIAC);
- the observations and the recommendations reported by the Internal Audit Service (IAS);
- the observations and the recommendations reported by the European Court of Auditors (ECA).
This section reports the control results and other relevant elements that support managements' assurance on the achievement of the internal control objectives60. It is structured in three separate sections: (1) the DG’s assessment of its own activities for the management of its resources; (2) the assessment of the activities carried out by other entities to which the DG has entrusted budget implementation tasks; and (3) the assessment of the results of internal and external audits, including the implementation of audit recommendations.
As shown in table 2.1 DG MOVE's programmes and activities are implemented under indirect management (55.49%) and direct management (44.51%)
60 Effectiveness, efficiency and economy of operations; reliability of reporting; safeguarding of assets and information; prevention, detection, correction and follow-up of fraud and irregularities; and adequate management of the risks relating to the legality and regularity of the underlying transactions, taking into account the multiannual character of programmes as well as the nature of the payments (FR Art 32).

64 move_aar_2014_final
Table 2.1 – Distribution of 2014 payments by management mode
Programmes/activities Amount in € million
Covered in AAR section
Management mode / % of total payments
Subsidy to EMSA 52.03 2.2
Subsidy to EASA 35.21 2.2
Subsidy to ERA 25.72 2.2
Other operational expenditure 19.28
Administrative expenditure (excl. subsidy to INEA)
12.92
Partly under 2.2 (cross-sub- and co-delegations)
Subsidy to INEA 13.43 2.2
Research FP7 11.54 2.161
Research FP6 0.95 2.162
SHIFT2RAIL JU 0.02 2.2
Direct 44.51%
TEN-T – SESAR JU 73.66 2.2
PBI 65.77 2.2
LGTT 50 2.2
Research FP7 – SESAR JU 21.0963 2.2
Marguerite Fund 2.80 2.2
Indirect 55.49%
Total 384.42
The administrative expenditure (including the subsidy to INEA) represents 6.86% and the operational expenditure 93.14% of the € 384.42 million paid by DG MOVE in 2014.
61 Only part related to grants 62 Only part related to grants 63 In order to be in line with the amount of payments reported in annex 3, this is the total amount before
deduction of the interests on prefinancing (€ 0.12 million) due to the Commission.
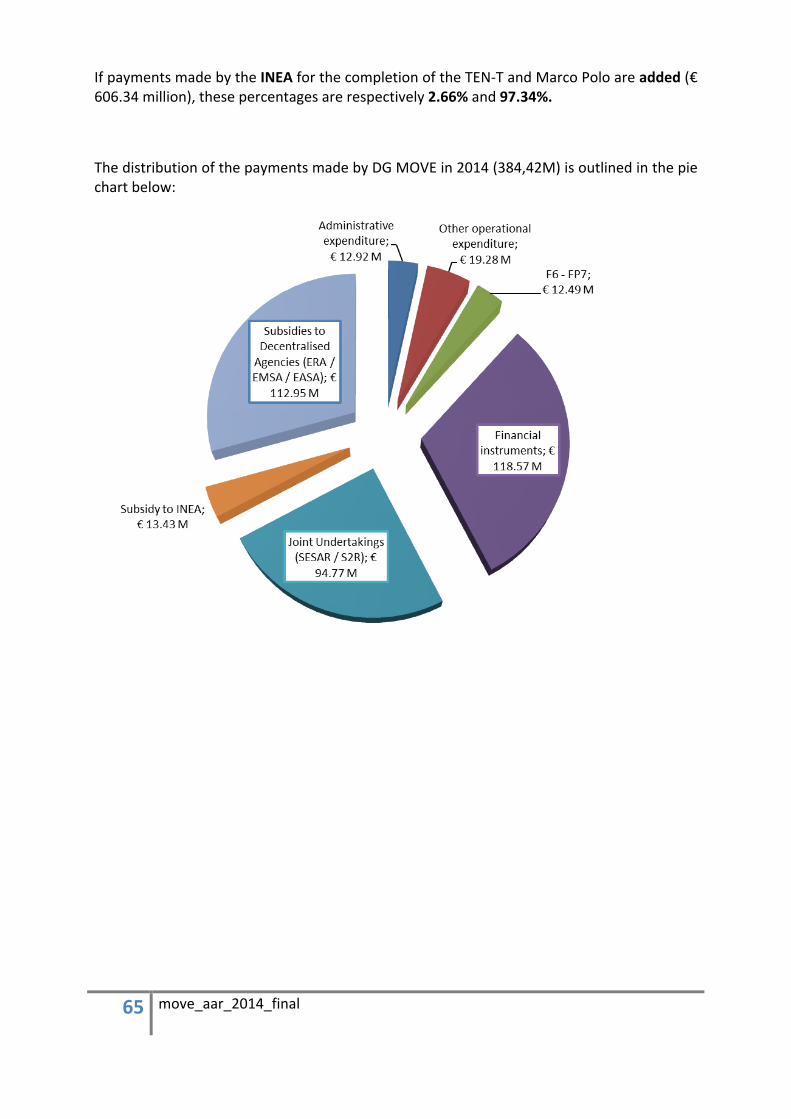
65 move_aar_2014_final
If payments made by the INEA for the completion of the TEN-T and Marco Polo are added (€ 606.34 million), these percentages are respectively 2.66% and 97.34%.
The distribution of the payments made by DG MOVE in 2014 (384,42M) is outlined in the pie chart below:
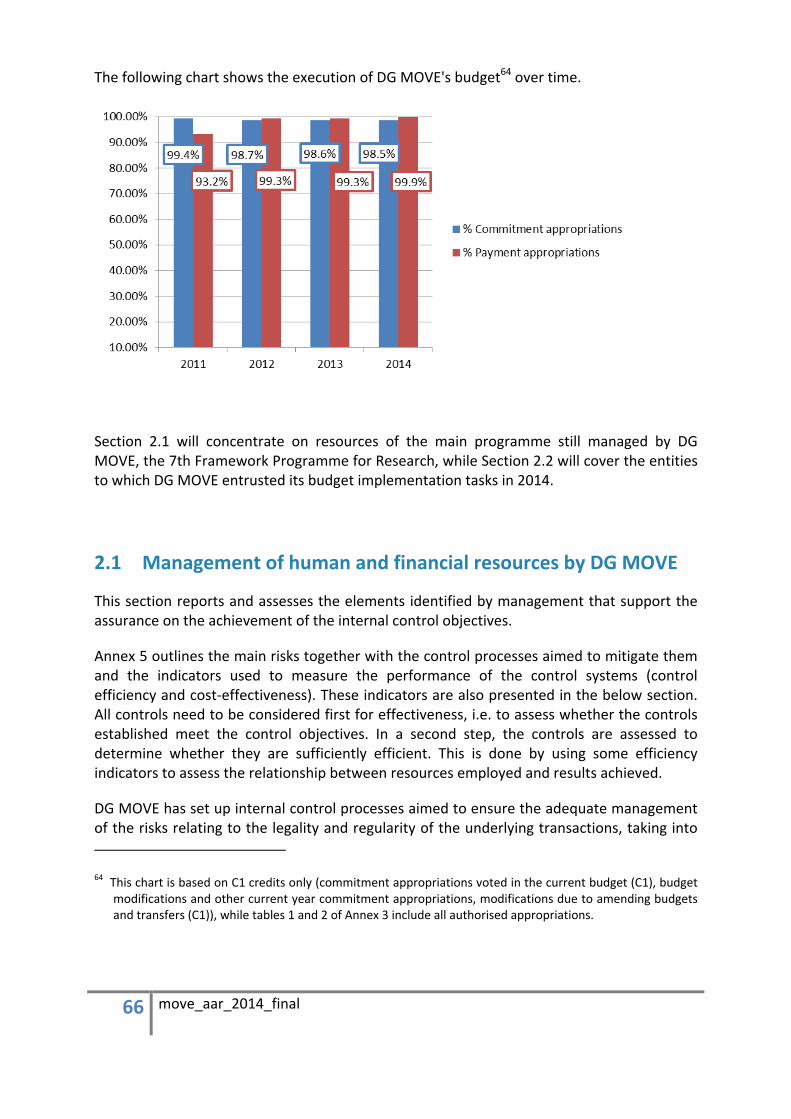
66 move_aar_2014_final
The following chart shows the execution of DG MOVE's budget64 over time.
Section 2.1 will concentrate on resources of the main programme still managed by DG MOVE, the 7th Framework Programme for Research, while Section 2.2 will cover the entities to which DG MOVE entrusted its budget implementation tasks in 2014.
2.1 Management of human and financial resources by DG MOVE
This section reports and assesses the elements identified by management that support the assurance on the achievement of the internal control objectives.
Annex 5 outlines the main risks together with the control processes aimed to mitigate them and the indicators used to measure the performance of the control systems (control efficiency and cost-effectiveness). These indicators are also presented in the below section. All controls need to be considered first for effectiveness, i.e. to assess whether the controls established meet the control objectives. In a second step, the controls are assessed to determine whether they are sufficiently efficient. This is done by using some efficiency indicators to assess the relationship between resources employed and results achieved.
DG MOVE has set up internal control processes aimed to ensure the adequate management of the risks relating to the legality and regularity of the underlying transactions, taking into
64 This chart is based on C1 credits only (commitment appropriations voted in the current budget (C1), budget modifications and other current year commitment appropriations, modifications due to amending budgets and transfers (C1)), while tables 1 and 2 of Annex 3 include all authorised appropriations.

67 move_aar_2014_final
account the multiannual character of programmes as well as the nature of the payments concerned.
2.1.1 Research Framework Programmes
The objective of transport research under FP7 is to develop safer, greener and smarter pan-European transport systems that will benefit all citizens, respect the environment, and increase the competitiveness of European industries in the global market.
FP7 payments represent around 8.5%65 of the total payments made in 2014 by DG MOVE.
In 2014, DG MOVE also managed financial operations under the Sixth Framework Programme (FP6) but, given their limited amounts (FP6 payments represent around 0.3%of the payments made by DG MOVE in 2014), and the fact that these are the residual payments for a programme that is about to be closed, these are not covered in the current AAR.
To give an indication of the relative weight of each of them, Table 2.2 shows the distribution of Research payments in 2014.
Table 2.2 - 2014: Research payments per Framework Programme (in €)
Framework Programme
Payments against cost statements
Administrative expenditure (including experts)
SESAR JU
Total % of
total
FP6 936 010.35 18 599.86 - 954 610.21 3%
FP7 11 055 453.56 479 752.86 21 089 110.87 32 624 317.29 97%
Total 11 991 463.91 498 352.72 21 089 110.87 33 578 927.50 100%
The control systems are divided into four distinct stages, each with specific control objectives. Key indicators have been defined for each stage.
However, this AAR will only focus on stages 3 and 4, as for the first two stages of the control system (call for proposals, their evaluation and the contracting phase) DG MOVE only manages funds received by cross-sub-delegation from DG RTD.
65 Including payments made to SESAR JU
68 move_aar_2014_final
1. Stage one: Call for an evaluation of proposals
Not applicable
2. Stage two: Contracting
Not applicable
3. Stage three: Monitoring the execution of projects
The third stage concerns the management of the project and the contract. This stage comprises the technical monitoring management of the contract over its lifetime, and also ex-ante checks of participants' cost claims. These ex-ante checks consist in the processing of transactions through Commission financial circuits to ensure that the transactions authorised are in compliance with the applicable rules.
In addition, every cost claim over € 375 000 must be accompanied by a certificate on the financial statement (CFS), given by a qualified auditor or a Certified Public Official. The Research family, as well as the European Court of Auditors, have identified that these certificates do not always identify all ineligible expenditure in the cost claim. To assess the impact of this weakness DG RTD carried out a study that showed that cost claims with a CFS had an average error rate 50% lower than those without. This shows that, while not perfect, these CFSs do have a significant positive effect.
The indicators reported in the 2014 AAR for FP7 relate exclusively to payments made from DG MOVE payment appropriations (06 03) as in 2014, DG MOVE did not receive any cross-sub-delegation from DG RTD.
The chart below shows the reductions made to the EU contribution claimed by grant beneficiaries. Ex-ante checks have prevented the payment of around € 2.6 million, representing 5.1% of the requested EU contribution. The main errors detected in cost claims concern inconsistencies between the information supplied by grant beneficiaries (amount of costs, methods of calculation, periods, etc.) and that included in the audit certificate when submitted, incomplete or missing audit certificates, arithmetical errors, audit certificates not provided by a qualified auditor, costs incurred outside the eligibility period, costs not covered by the legal basis.

69 move_aar_2014_final
Ex-ante checks: reductions to the requested EU contribution66 (€)
Another indicator related to the management of projects and contracts is the indicator 'Time-To-Pay’ (TTP), which is defined as the percentage of payments made within the binding deadlines, as shown in table 2.3.
Table 2.3 – Net average time to pay
Net average time to pay for FP7 grants % on time
39.63 days 88.9%
DG MOVE's average time to pay is well below the legal deadline of 90 days and has improved considerably since 2013 (66.9 days). However, the percentage of payments on time is slightly below the Commission's average (90.51 %), but in progress since 2013 (80%).
4. Stage four: Ex-post controls and recoveries
The fourth stage includes the ex-post audits as well as the recovery of any amounts found to have been paid in excess of the amount due.
The general control objective for FP7 has always been to ensure that the residual error rate does not exceed a cumulative level of 2%67 by the end of the programme implementation.
66 Audit results implementation and budget capping not included 67 Materiality is assessed for the Seventh Framework Programme (FP7) in accordance with Annex 4.
70 move_aar_2014_final
The key aim is to achieve a good balance between legality and regularity and the achievement of policy objectives, and between trust and control, rather than a concentration on one legality and regularity indicator.
As detailed ex-ante controls represent a considerable administrative burden on beneficiaries and the Commission, requiring the transfer of large amounts of information and its detailed checking, it has a seriously negative impact on the time to grant contracts and the time to pay beneficiaries. For this reason the Research family has decided to obtain most of its assurance from ex-post controls and has consequently defined and implemented a common control strategy, the key elements of which are the ex-post audit strategy and the recovery process.
a) Common audit strategy of the Research DGs
The main legality and regularity indicator is the error rate detected by ex-post audits. Because of its multi-annual nature, the effectiveness of the control strategy of the Research Directorates-General can only be fully measured and assessed in the final stages of the Framework Programme, once the ex-post control strategy has been fully implemented and systematic errors have been detected and corrected. Since 2007, the Research Directorates-General have adopted a common audit strategy intended to ensure the legality and regularity of expenditure on a multi-annual basis including detecting and correcting systematic errors. The audits examine only interim and final claims by beneficiaries. Since 2012, a Common Representative audit Sample (CRaS) has been introduced across the research family to reduce the audit burden on beneficiaries by reducing the number of repeat audits whilst continuing to provide a representative view of the implementation of FP7. The CRaS is intended to estimate the overall level of error in FP7, across all services involved in its management. It is complemented by 'risk-based' audits, audits selected according to one or more risk criteria. 2014 saw the creation of the Common Support Service, of which the Common Audit Service (CAS) is a key part. In 2014 the CAS undertook all audits for the DGs that fund research grants (amongst which DG MOVE). Different indicators are calculated to provide a comprehensive view of legality and regularity (more information provided in Annex 4):
• Representative Error Rate: derived solely from the results of audits on a representative sample of beneficiaries, extrapolated by a statistical method to the overall population (calculated for FP7 as a whole).
• Residual Error Rate: The residual error rate, on a multi-annual basis, is the extrapolated level of error remaining after corrections/recoveries undertaken by Commission services following the audits that have been made. To derive
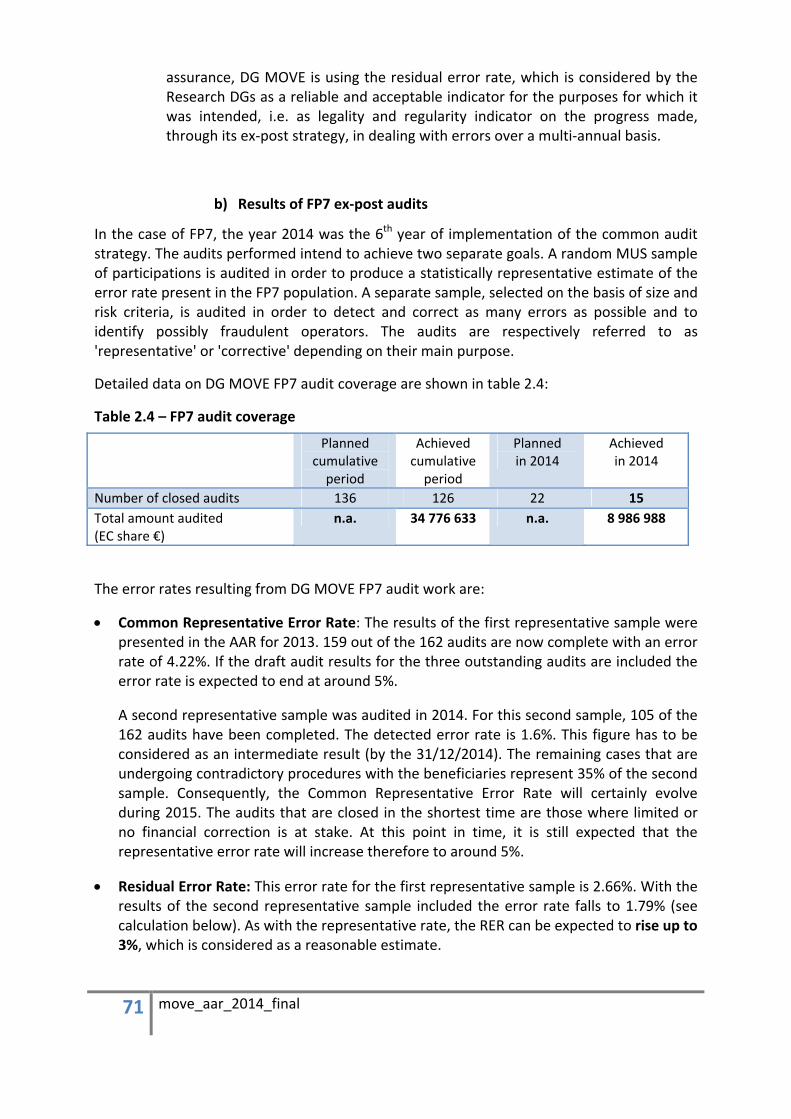
71 move_aar_2014_final
assurance, DG MOVE is using the residual error rate, which is considered by the Research DGs as a reliable and acceptable indicator for the purposes for which it was intended, i.e. as legality and regularity indicator on the progress made, through its ex-post strategy, in dealing with errors over a multi-annual basis.
b) Results of FP7 ex-post audits
In the case of FP7, the year 2014 was the 6th year of implementation of the common audit strategy. The audits performed intend to achieve two separate goals. A random MUS sample of participations is audited in order to produce a statistically representative estimate of the error rate present in the FP7 population. A separate sample, selected on the basis of size and risk criteria, is audited in order to detect and correct as many errors as possible and to identify possibly fraudulent operators. The audits are respectively referred to as 'representative' or 'corrective' depending on their main purpose.
Detailed data on DG MOVE FP7 audit coverage are shown in table 2.4:
Table 2.4 – FP7 audit coverage
Planned cumulative
period
Achieved cumulative
period
Planned in 2014
Achieved in 2014
Number of closed audits 136 126 22 15 Total amount audited (EC share €)
n.a. 34 776 633 n.a. 8 986 988
The error rates resulting from DG MOVE FP7 audit work are:
• Common Representative Error Rate: The results of the first representative sample were presented in the AAR for 2013. 159 out of the 162 audits are now complete with an error rate of 4.22%. If the draft audit results for the three outstanding audits are included the error rate is expected to end at around 5%.
A second representative sample was audited in 2014. For this second sample, 105 of the 162 audits have been completed. The detected error rate is 1.6%. This figure has to be considered as an intermediate result (by the 31/12/2014). The remaining cases that are undergoing contradictory procedures with the beneficiaries represent 35% of the second sample. Consequently, the Common Representative Error Rate will certainly evolve during 2015. The audits that are closed in the shortest time are those where limited or no financial correction is at stake. At this point in time, it is still expected that the representative error rate will increase therefore to around 5%.
• Residual Error Rate: This error rate for the first representative sample is 2.66%. With the results of the second representative sample included the error rate falls to 1.79% (see calculation below). As with the representative rate, the RER can be expected to rise up to 3%, which is considered as a reasonable estimate.
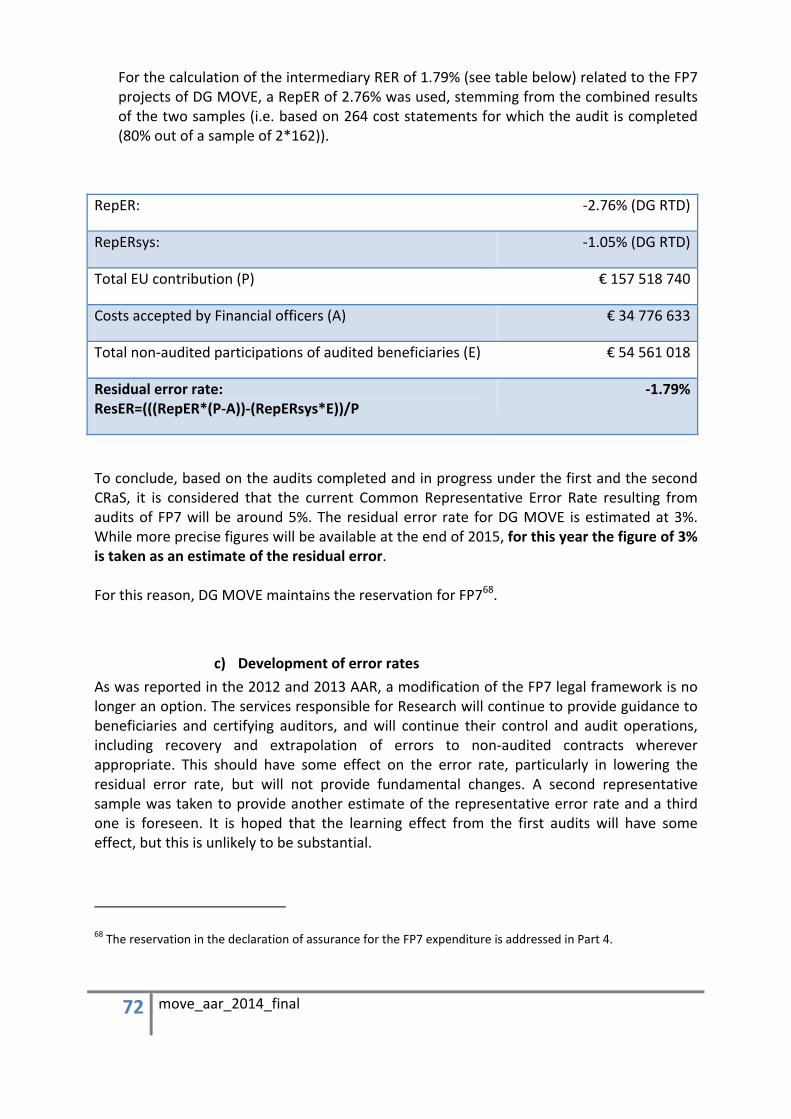
72 move_aar_2014_final
For the calculation of the intermediary RER of 1.79% (see table below) related to the FP7 projects of DG MOVE, a RepER of 2.76% was used, stemming from the combined results of the two samples (i.e. based on 264 cost statements for which the audit is completed (80% out of a sample of 2*162)).
RepER: -2.76% (DG RTD)
RepERsys: -1.05% (DG RTD)
Total EU contribution (P) € 157 518 740
Costs accepted by Financial officers (A) € 34 776 633
Total non-audited participations of audited beneficiaries (E) € 54 561 018
Residual error rate: ResER=(((RepER*(P-A))-(RepERsys*E))/P
-1.79%
To conclude, based on the audits completed and in progress under the first and the second CRaS, it is considered that the current Common Representative Error Rate resulting from audits of FP7 will be around 5%. The residual error rate for DG MOVE is estimated at 3%. While more precise figures will be available at the end of 2015, for this year the figure of 3% is taken as an estimate of the residual error. For this reason, DG MOVE maintains the reservation for FP768.
c) Development of error rates As was reported in the 2012 and 2013 AAR, a modification of the FP7 legal framework is no longer an option. The services responsible for Research will continue to provide guidance to beneficiaries and certifying auditors, and will continue their control and audit operations, including recovery and extrapolation of errors to non-audited contracts wherever appropriate. This should have some effect on the error rate, particularly in lowering the residual error rate, but will not provide fundamental changes. A second representative sample was taken to provide another estimate of the representative error rate and a third one is foreseen. It is hoped that the learning effect from the first audits will have some effect, but this is unlikely to be substantial.
68 The reservation in the declaration of assurance for the FP7 expenditure is addressed in Part 4.

73 move_aar_2014_final
Overall then, the representative error rate in FP7 audits can be expected to remain around 5%, with the residual error rate of 3% or a bit lower over the course of the programme.
d) Implementation of audit results
In total over the period 2010-2014, the results of the FP7 audits relate to 145 participations, out of which 6 were still in the contradictory procedure with the beneficiary (and will most likely be in favour of the Commission). From the remaining 139 participations for which the results have been implemented, 67 are in favour of the EC, 51 in favour of the beneficiary and 21 resulting in "zero" adjustments.
FP7 audit adjustments implementation progress (on a cumulative basis)
More details are provided in the table 2.5 below concerning the adjustments in favour of the Commission. By the end of 2014, the adjustments concern 73 participations, corresponding to € 1 404 370 in favour of the Commission (€ 188 994 for the year 2014). Out of the 73 participations with an audit adjustment in favour of the EC, 67 adjustments (92%) for € 1 212 269.75 have already been implemented and 6 were in the contradictory procedure with the beneficiary, as indicated above. 92% of the adjustments implemented were recovered through offsetting from subsequent payments (€ 1 119 056) and 8% through recovery orders. It has to be noted that it is not unexpected to have open cases at this stage as there might be 18 months before new declarations are received from beneficiaries.
Table 2.5 – Implementation of FP7 ex-post audit results in favour of the EC (2010-2014)
Results from external audits Adjustments in contradictory procedure
Adjustments implemented
Number Funding adjustment (€)
Number Funding adjustment (€)
Number Funding adjustment (€)
73 -1 404 369.57 6 -192 099.82 67 -1 212 269.75

74 move_aar_2014_final
For information, in 2014, DG MOVE did not waive any recovery orders related to ineligible costs identified during ex-post audits (Annex 3 – table 10).
e) Implementation of extrapolation
The extrapolation of audit findings to non-audited beneficiaries continues. These corrections stem from audits made by DG MOVE or other DGs in the research family were systematic errors were found.
As can be seen from the table 2.6, by the end of 2014, 56 such participations were found and the beneficiaries were asked to rectify the errors in DG MOVE projects and submit revised costs statements. On this basis, 29 participations were judged to be concerned by the systematic errors identified by DG MOVE or any of the other DGs. Systematic errors have been corrected for 10 participations, of which 2 in favour of the beneficiary. The implementation rate of FP7 recommendations was 66% at the end of 2014, in progress compared to 2013 (59%). It has to be noted that it is not unexpected to have open cases at this stage as there might be 18 months before new declarations are received from beneficiaries.
Table 2.6 – Implementation of extrapolation of FP7 audit results (2010-2014)
Implemented cases
In favour of EC In favour beneficiary
Number of participations with expected systematic errors
Number of participations without systematic errors
Number Value (€) Number Value (€)
Number of participations to be implemented69
56 27 8 -66 007.52 2 1 327.31 19
f) Liquidated damages
Liquidated damages are financial penalties that the beneficiary has to pay if they breach contractual obligations. This arises when they over claim contributions to funding in the research programmes. In these cases the beneficiary has to repay the overpaid amount plus the liquidated damages. The extent of the liquidated damages is proportionate to the overstated costs and the unjustified amount received by the beneficiary. In several cases,
69 Cases to be implemented are those for which the Commission has written to the beneficiaries requesting them to submit revised cost statements to correct the systematic issues detected

75 move_aar_2014_final
they do not result in a recovery order due to the application of the de minimis rule70.
Since its creation, DG MOVE has applied liquidated damages to beneficiaries who received unjustified EU contribution in the FP7, but the impact in terms of amount is very limited (€ 17 071).
g) Recovery of undue payments (Annex 3) For information, table 8 of Annex 3 displays the total amounts recovered by DG MOVE for undue payments made to beneficiaries. Note that these amounts include corrections implemented both before and after payments distinguishing between errors, irregularities and those notified to OLAF if applicable. In other words, the amounts in this table do not only include the recoveries issued following the implementation of audits and extrapolations but also other types of recoveries of undue payments.
5. Conclusion on control efficiency and cost-effectiveness
The principle of efficiency concerns the best relationship between resources employed and results achieved. The principle of economy requires that the resources used by the institution in the pursuit of its activities shall be made available in due time, in appropriate quantity and quality and at the best price. This section outlines the indicators used to monitor the efficiency of the control systems, including an overall assessment of the costs and benefits of controls.
In the 2013 AAR, an estimation of the costs per stage of the process was not possible. For the year 2014, the following efficiency indicators have been estimated for FP7 for stages 3 and 4 (as stages 1 and 2 are not applicable anymore for DG MOVE in 2014):
Number of FP7 running projects in 2014 27
Average project management costs71 / number of running FP7 projects € 21 708
Average number of FP7 running projects by FTE 6.6
The average project management costs per number of running projects can be considered as relatively high (even though there is no benchmark yet as this is the first year that this indicator is calculated), but can be justified by the fact that the ongoing projects can be quite complex, with a high number of beneficiaries and in need of a close supervision as they are in the final stages of implementation. DG MOVE was indeed managing 27 FP7 projects in
70 Liquidated damages will only be applied where the unjustified contribution exceeds 2% of the total contribution claimed for the given period.
71 Including overheads

76 move_aar_2014_final
2014, out of which only 8 have an end date beyond 31/12/2014.
Cost of controls (direct costs72 and overheads) in DG MOVE for FP7:
Stage 3 - Cost for monitoring the execution € 586 120
Stage 3 - Cost of controls / total amount paid 5.3%
Stage 4 - Cost for ex-post controls73 € 318 662
Stage 4 - Cost of control / value of grants audited 4.28%
Stages 3 and 4 - Overall cost of controls € 904 782
Stages 3 and 4 - Overall cost of controls/ total amount paid 8.18%
Overall, during the reporting year, it can be concluded that the controls carried out by DG MOVE for the monitoring of the projects (stage 3) were cost effective, as the estimated quantifiable benefits (the ex-ante controls led to a reduction of € 2.6 million of EU contribution) exceeded the costs. It has to be noted though that the benefits are necessarily affected by the limitation in the depth of ex-ante controls as part of the overall control framework.
In addition to the quantifiable benefits indicated above, there are also invaluable qualitative benefits stemming from stage 3, which provide an assurance that the project is running adequately and so will produce the research and innovation desired. The analysis of scientific deliverables can be valuable to ensure excellent science, and its appropriate feedback into policy considerations, even if it does not lead to a financial saving.
For stage 4 relating to ex-post controls and recoveries, the cost controls in 2014 surpassed the financial adjustments of € 0.19 million identified in 2014 (and mostly still to be implemented). Nevertheless, not only quantifiable benefits should be considered to assess the cost-effectiveness, but also non-quantifiable benefits.
Indeed, audits have a positive deterrent effect within the programme, as many beneficiaries will take extra care over the preparation of their cost claims knowing that audits may follow,
72 For the purpose of this exercise, no distinction has been made between officials and contractual agents. Hence, the costs indicated is the maximum one, based on the average staff costs as communicated in the circular note of DG BUDGET to RUF of 08/08/2013.
73 Including cost of externalised auditing

77 move_aar_2014_final
will ensure system improvements and a better compliance with regulatory provisions. The auditors can also avoid future errors by guidance to participants. These measures will lead to lower errors in cost claims and hence less recoveries from the Commission. In addition the experience of auditors on the ground has been important in many improvements proposed in the legislation and rules for Horizon 2020. For example, one of the drivers for a flat rate of indirect costs was the regular identification of errors in the use of real indirect costs, and the understanding of the complexities of real indirect costs for participants.
In any case, it can be concluded that the total benefits of controls for stages 3 and 4 clearly outweigh the overall costs of controls together. DG MOVE considers furthermore that the necessity of these controls is undeniable, as the totality of the appropriations would be at risk in case they would not be in place.
Moreover, the efficiency indicators listed for stages 3 and 4 also revealed that the DG allocated an appropriate quantity and quality of resources to ensure a fluent operation of the controls (e.g. time to pay, number of audit results and extrapolations implemented have improved compared to last year).
It is however difficult to reach a definitive conclusion in this AAR as of the relative efficiency of the controls, since it is necessary to analyse the evolution of these indicators over time or to compare it with a relevant benchmark.
Besides, for stage 4, it is not sure that a conclusion will be reached in the next AAR, as the resources allocated to ex-post audits in DG MOVE should further decrease in 2015 and as all new audits are the responsibility of the Common Audit Service. This trend is illustrated in table 2.7 below (all audits together).
Table 2.7 - Resources used in the Shared Resource Directorate DG MOVE / DG ENER for the audit function
2013 2014
Internal resources for ex-post audits 13.89 FTE 8.04 FTE Cost of externalised auditing (in €) 466 014 108 207 Average cost per audit 23 39274 19 273
To summarise, although it has not yet been possible to provide in depth conclusions on the relative efficiency of the controls (namely because of the absence of relevant benchmarks and past data), the efficiency and the effectiveness of the controls is definitely sustained thanks to the important quantitative and invaluable qualitative benefits, identified for each stage of the process and providing a positive impact on the assurance. The cost-effectiveness of the overall controls is also positive since the benefits for the Commission exceed the costs.
74 The amount calculated for 2013 did not include overheads
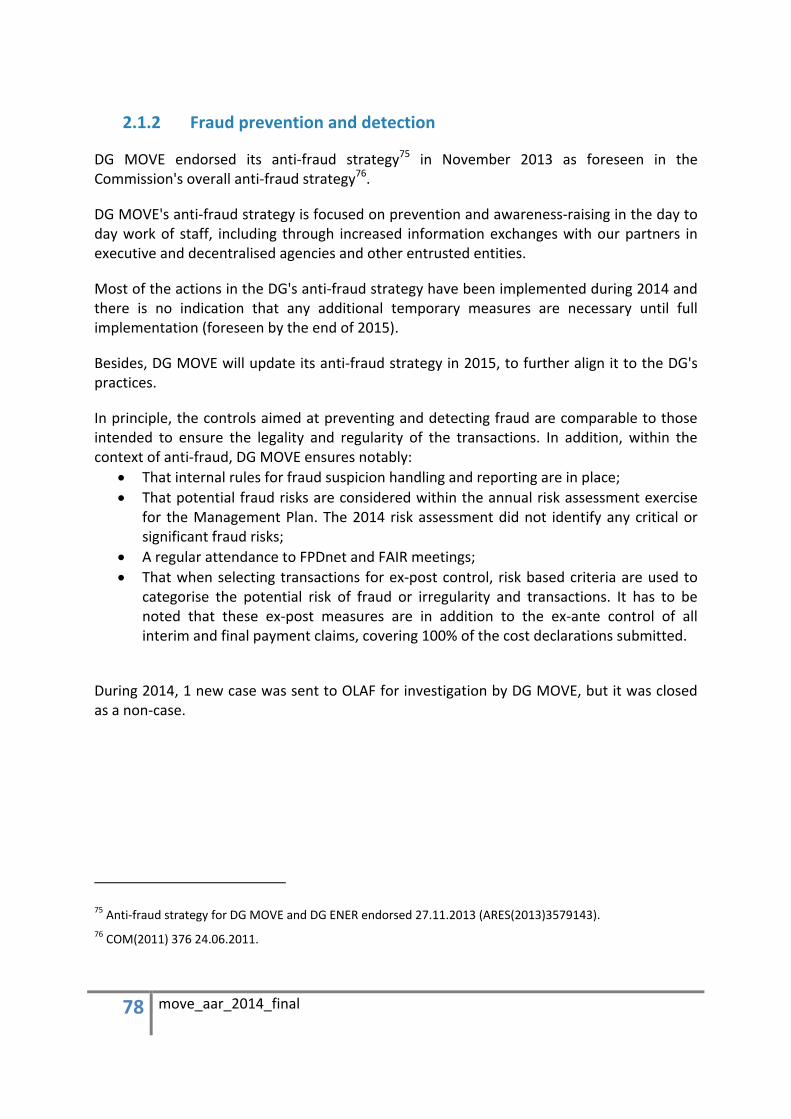
78 move_aar_2014_final
2.1.2 Fraud prevention and detection
DG MOVE endorsed its anti-fraud strategy75 in November 2013 as foreseen in the Commission's overall anti-fraud strategy76.
DG MOVE's anti-fraud strategy is focused on prevention and awareness-raising in the day to day work of staff, including through increased information exchanges with our partners in executive and decentralised agencies and other entrusted entities.
Most of the actions in the DG's anti-fraud strategy have been implemented during 2014 and there is no indication that any additional temporary measures are necessary until full implementation (foreseen by the end of 2015).
Besides, DG MOVE will update its anti-fraud strategy in 2015, to further align it to the DG's practices.
In principle, the controls aimed at preventing and detecting fraud are comparable to those intended to ensure the legality and regularity of the transactions. In addition, within the context of anti-fraud, DG MOVE ensures notably:
• That internal rules for fraud suspicion handling and reporting are in place; • That potential fraud risks are considered within the annual risk assessment exercise
for the Management Plan. The 2014 risk assessment did not identify any critical or significant fraud risks;
• A regular attendance to FPDnet and FAIR meetings; • That when selecting transactions for ex-post control, risk based criteria are used to
categorise the potential risk of fraud or irregularity and transactions. It has to be noted that these ex-post measures are in addition to the ex-ante control of all interim and final payment claims, covering 100% of the cost declarations submitted.
During 2014, 1 new case was sent to OLAF for investigation by DG MOVE, but it was closed as a non-case.
75 Anti-fraud strategy for DG MOVE and DG ENER endorsed 27.11.2013 (ARES(2013)3579143). 76 COM(2011) 376 24.06.2011.
79 move_aar_2014_final
Table 2.8 – Fraud prevention and detection - indicators
Indicator Latest known result Target
Number of files sent to OLAF for investigation in the year.
31.12.2014: 1 file sent to OLAF No target.
Number of penalty decisions77 adopted in the year and total amount of these decisions.
31.12.2014: 0 penalty decision. No target
Implementation of actions in the Commission's Anti-Fraud Strategy (CAFS) relevant for the DG.
31.12.2014: 1578 17 by end of 2014
2.2 Budget implementation tasks entrusted to other DGs and entities.
This section reports and assesses the elements that support the assurance on the achievement of the internal control objectives as regards the results of the DG’s supervisory controls on the budget implementation tasks carried out by other Commission DGs and entrusted entities distinct from the Commission.
As mentioned in "The DG in Brief", DG MOVE has entrusted parts of its budget of indirect management implementation by:
• Cross-delegations to other Commission services; • Co-delegations; • Executive Agency (INEA); • Joint Undertakings (SESAR JU, FCH JU and S2R JU) – also see Annex 6; • Decentralised Agencies (EASA, EMSA, ERA) – also see Annex 8.
For all these cases, the DG's supervision arrangements are based on the principle of controlling "with" the relevant entity. For details, please refer to Annex 5, section on indirect management.
DG MOVE also relies on financial instruments set up in "formerly joint management" with
77 As set out in Article 96 of the Financial Regulation and can include the exclusion of the candidate from EU funding and / or the payment of financial penalties.
78 The remaining actions concern the organisation of information sessions in relation to fraud prevention and detection as well as following up the endorsement of the anti-fraud strategies of the concerned entrusted entities.

80 move_aar_2014_final
the European Investment Bank for the financing of TEN-T projects (PBI and LGTT). Given the set-up and modalities of the cooperation agreement between the Commission and the EIB, the scope of supervision by DG MOVE is more limited (see also in the ICT in Annex 5). As to the "Marguerite fund" financial instrument, it is subject to the supervision arrangements under the cross-delegation to DG ECFIN.
Share of distribution of 2014 payments to entrusted entities (88.4% of the total payments):
In view of DG MOVE's residual responsibility as “parent DG” for the indirect management of the parts of its budget via the cross-delegated AODs, Executive Agencies and other entrusted entities mentioned below, it can be concluded that their regular supervision did not identify any major control weaknesses affecting the assurance. Overall DG MOVE considers that its supervision of the entrusted entities is effective and appropriate.
2.2.1 Cross-sub-delegations
As in previous years, DG MOVE has cross-sub-delegated a number of activities to different services within the Commission, in order to arrange the provision of certain operations more efficiently. Being a Commission service itself, the AOD of the cross-delegated service is required to implement the appropriations subject to the same rules, responsibilities and accountability arrangements as DG MOVE.
In 2014, DG MOVE gave cross-sub-delegations to DGs PMO, DIGIT, ECFIN for the following amounts and purposes:
81 move_aar_2014_final
- To PMO : € 5.57 million were committed to cover CEF expert’s missions and administrative expenditures related to the setting up of the S2R JU, of which € 0.43 million were paid.
- To DG DIGIT: € 1.2 million were committed and € 0.42 million paid for administrative CEF and research actions and for transport security. Also an amount of € 0.24 million of outstanding commitments from 2013 were fully paid in 2014.
- To DG ECFIN: € 51.48 million of commitment appropriations for the Marguerite Fund were still outstanding by end 2013, of which € 2.80 million were paid.
The cross-delegation agreement requires the AOD of above DGs to report on the use of these appropriations. In their reports, the AODs did not communicate any events, control results or issues which could have a material impact on assurance.
2.2.2 Co-delegations
The Commission may delegate powers concerning a given budget line to one or more authorising officers by delegation, i.e. various AODs are responsible for the same item of expenditure, but each one for a specific type of transaction. For MOVE, this is the case with PMO, HR, OP and DIGIT. Being Commission services themselves, these DGs are required to implement the appropriations subject to the same rules, responsibilities and accountability arrangements as DG MOVE.
In 2014, payments amounting to € 10.55 million were made through co-delegations.
2.2.3 Executive Agency : INEA
DG MOVE is one of four parent DGs (with ENER, CNECT and RTD) for the Innovation & Networks Executive Agency (INEA). INEA started its life as TEN-T Executive Agency (EA) in 2006 and was initially responsible for implementing the TEN-T Programme and the TEN-T projects from the 2000-2006 and 2007-2013 financial perspectives.
Thanks to a new mandate, approved on 23 December 201379, the Agency became the Innovation and Networks Executive Agency from 1 January 2014 and its lifetime has been extended to 31 December 2024.
With the new mandate, the Commission has delegated to INEA the task of executing the operational budget and performing tasks linked to the implementation of its delegated Union programmes in the field of transport, energy and telecommunications infrastructure (CEF) and in the field of transport and energy research and innovation (H2020). In addition,
79 Commission Implementing Decision 2013/801/EU

82 move_aar_2014_final
the Agency is also managing the legacies of the TEN-T and Marco Polo programmes.
As stated in the 2013 AAR, the cost-benefit analysis carried out in 201380 indicated that the extended delegation of the main EU infrastructure programmes in transport, energy and ICT to INEA would make it possible to implement these programmes efficiently and at a lower cost than in the Commission. It is estimated to deliver cost-savings in the order of € 54 million over the 2014-2020 period, compared to the in-house scenario. The Agency is well established to manage the extension as shown by its key performance indicators (average time to pay below the standard Commission payment deadlines; a rate of close to 100% of payments made on time; detected error rate below 2% for the last 4 years).
In 2014, DG MOVE contributed € 13.43 million to the Agency's running costs. INEA has justified the use of the subsidy and any unused appropriations will be recovered by the parent DGs.
Supervision arrangements
The Commission Decision establishing INEA and the Commission Decision delegating powers to INEA set out the governance and supervision arrangements. These are complemented by a specific Memorandum of Understanding (MoU) signed between the parent DGs and INEA, which govern the modalities and procedures of interaction between these entities. The MoU contains reporting and supervision provisions, which include amongst other:
• the membership of the Steering Committee (that ensures that the work of the Agency is in line with the Agency’s Annual Work Programme);
• the requirement for INEA to report regularly on the use of resources and performance of tasks (using the Key Performance Indicators agreed between INEA and the parent DGs);
• the preparation of the Agency's annual budget, in coordination with the parent DGs; • the definition of objectives and priorities in the Annual Work Programme of INEA
(approved by the Commission); • the establishment of security related procedures and processes, including Business
Continuity Planning, in consultation with its parent DGs; • the assessment of the activities carried out by the Agency through the Annual
Activity Reports.
In practice, the Steering Committee of INEA, chaired by the Director-General of DG MOVE, meets 4 times / year and oversees the running of the Agency. In particular, at each meeting the Director reports on key issues relevant to the work of the Agency, among which, on the performance of the Agency against the key performance indicators set out in the Agency’s Annual Work Programme and on the implementation of the administrative budget and any issue that could have a significant negative impact on his/her assurance.
80 Cost Benefit Analysis for the delegation of certain tasks regarding the implementation of Union Programmes 2014-2020 to the Executive Agencies

83 move_aar_2014_final
Meetings of the parent DGs with INEA on Horizon 2020 and CEF take place regularly, as well as regular meetings between INEA and the relevant unit in DG MOVE on CEF - transport. The latter also attends the Management meetings of INEA and vice-versa.
Furthermore, with regards to the human resources, as the management of these Executive Agencies are Commission staff on detachment, the parent DGs maintain a close contact with these seconded officials by associating them to the work and life of the parent DG.
The close contacts between DG MOVE and INEA are considered essential for the achievement of their respective goals and allow avoiding difficulties impacting on the good governance of INEA.
Supervision cost81 € 314 503
Overall supervision / amount delegated 2.34 %
The EA is also subject to audit by the Internal Audit Service of the Commission and by the European Court of Auditors and DG MOVE use their reports as an element of supervision.
In the DAS 2013, ECA found the annual accounts for the administrative expenditure of INEA (ex TEN-TEA) legal and regular in all material aspects and that they present fairly in all material respects the financial position of the Agency. The Court made two observations on internal controls and one observation related to a technical budgetary issue. The Agency has provided replies and justifications in relation to these observations.
ECA also selected 8 transactions for review in the field of Mobility and Transport, amongst which 6 from the TEN-T programme managed by the INEA Agency and 1 related to the Marco Polo programme (formerly managed by the EASME Agency). More details on the findings can be found in section 2.3.3.
The residual error rate for the TEN-T programme is below the materiality threshold of 2% and the Agency Director, in his capacity as AOD, has signed the declaration of assurance without reservations.
81 Including overheads

84 move_aar_2014_final
Conclusion
The regular supervision of INEA did not identify any particular events, issues or problems that could have a material impact on assurance or that would need to be included in this report. Overall DG MOVE considers that its supervision of the EAs is effective and appropriate.
2.2.4 Financial instruments
DG MOVE also uses innovative financial instruments for leveraging EU investment and attracting new sources of funding for TEN-T infrastructure projects:
a) Marguerite Fund
DG MOVE has given a cross-delegation to DG ECFIN to finance the "Marguerite Fund". It is an independent fund investing equity in energy, climate change and infrastructure (TEN-T) projects:
• Greenfield: new projects and facilities, with typical development risks largely mitigated (minimum of 65% of the Fund);
• Brownfield: replacement, modernisation and capacity enhancement of existing assets (maximum of 35% of the Fund).
It is managed by an external Management Board which makes drawdown requests for credits as required. DG ECFIN is responsible for monitoring the management of the fund and reports regularly to DG MOVE. In 2014, € 2.8 million were paid to the Marguerite Fund.
Governance and supervision arrangements:
The Fund is set up as a Luxembourg SICAV-SIF and its legal structure is a Limited Liability Company including both a Management Board, in charge of the overall management and administration of the Fund and encompassing the representatives of the core sponsors, and a Supervisory Board, which monitors the activities of the Management Board without interfering with the Fund’s investment strategy. The origination and appraisal of potential investments is carried out by the Fund’s Investment Adviser, Marguerite Adviser S.A., established specifically for the purpose of this Fund.
The Commission is represented in the Supervisory Board of the Fund, which establishes the Fund's investment strategy and, more precisely, its focus on TEN-T projects. The material terms and conditions for EU investment in the Marguerite Fund are established by Commission's Decision C (2010)941 of 25 February 2010. The regular reporting from the Fund to the Commission includes:
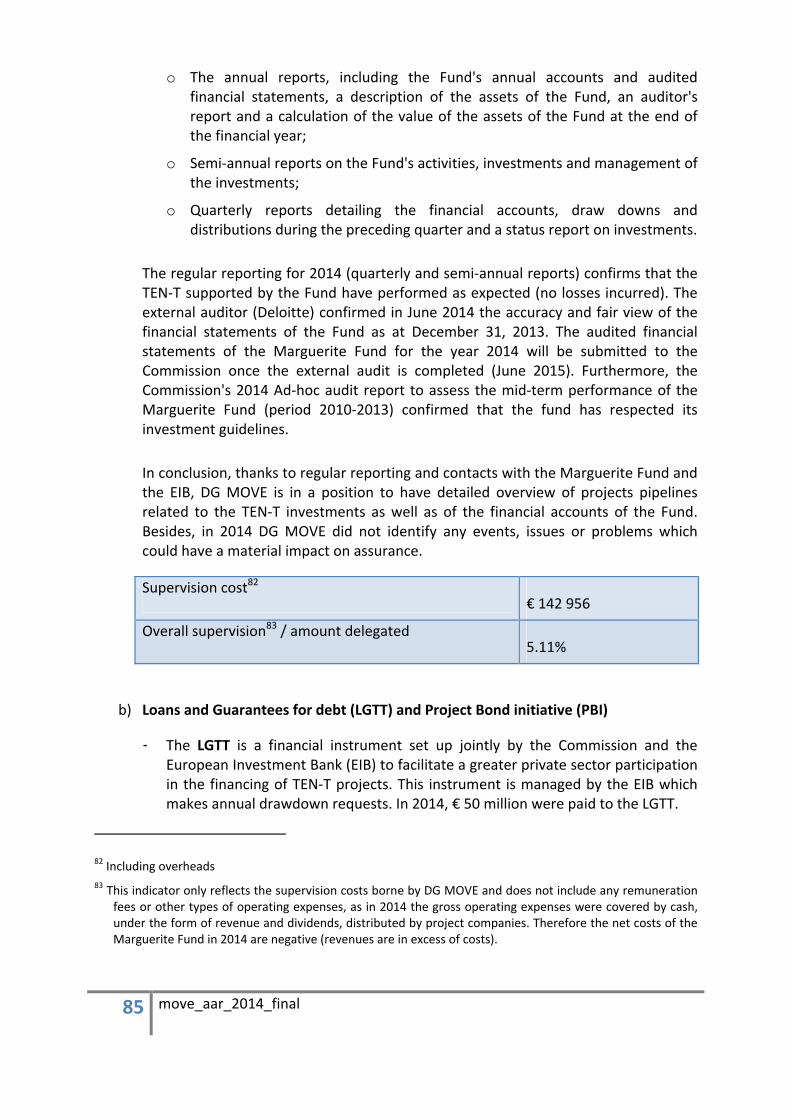
85 move_aar_2014_final
o The annual reports, including the Fund's annual accounts and audited financial statements, a description of the assets of the Fund, an auditor's report and a calculation of the value of the assets of the Fund at the end of the financial year;
o Semi-annual reports on the Fund's activities, investments and management of the investments;
o Quarterly reports detailing the financial accounts, draw downs and distributions during the preceding quarter and a status report on investments.
The regular reporting for 2014 (quarterly and semi-annual reports) confirms that the TEN-T supported by the Fund have performed as expected (no losses incurred). The external auditor (Deloitte) confirmed in June 2014 the accuracy and fair view of the financial statements of the Fund as at December 31, 2013. The audited financial statements of the Marguerite Fund for the year 2014 will be submitted to the Commission once the external audit is completed (June 2015). Furthermore, the Commission's 2014 Ad-hoc audit report to assess the mid-term performance of the Marguerite Fund (period 2010-2013) confirmed that the fund has respected its investment guidelines.
In conclusion, thanks to regular reporting and contacts with the Marguerite Fund and the EIB, DG MOVE is in a position to have detailed overview of projects pipelines related to the TEN-T investments as well as of the financial accounts of the Fund. Besides, in 2014 DG MOVE did not identify any events, issues or problems which could have a material impact on assurance.
Supervision cost82 € 142 956
Overall supervision83 / amount delegated 5.11%
b) Loans and Guarantees for debt (LGTT) and Project Bond initiative (PBI)
- The LGTT is a financial instrument set up jointly by the Commission and the European Investment Bank (EIB) to facilitate a greater private sector participation in the financing of TEN-T projects. This instrument is managed by the EIB which makes annual drawdown requests. In 2014, € 50 million were paid to the LGTT.
82 Including overheads 83 This indicator only reflects the supervision costs borne by DG MOVE and does not include any remuneration
fees or other types of operating expenses, as in 2014 the gross operating expenses were covered by cash, under the form of revenue and dividends, distributed by project companies. Therefore the net costs of the Marguerite Fund in 2014 are negative (revenues are in excess of costs).

86 move_aar_2014_final
In 2014, the Commission conducted an ex-post evaluation of the LGTT instrument. The overarching conclusion of that evaluation is that the LGTT has had a positive impact where it has been applied, but not sufficient effect to achieve its broader objectives. A key circumstance has been that LGTT instrument was designed in 2008, prior to the global financial and public debt crisis. In the period of application of the LGTT, both public authorities (project promoters) and private investors postponed or abandoned investment decisions and fewer (especially PPP) projects were developed. Since then, revenue based projects have become less common due to the reluctance of the private sector to take on traffic demand risk, making the market for the LGTT even smaller.
- The PBI is a joint initiative by the Commission and the EIB to stimulate capital market, including institutional investors, financing for large-scale infrastructure projects in transport (TEN-T), energy and information and communication technology. In 2014, € 65.77 million were paid for the pilot phase of the Project Bond Initiative.
The Project Bonds have been subject to an interim independent evaluation commissioned by the Commission. The evaluation has outlined that, despite the small number of projects signed to date, the instrument had a positive impact on infrastructure financing, raising the interest of institutional investors in European infrastructure investment. Initial investor feedback suggests that the project bond solution is a valuable complement to bank lending solutions and may help to narrow the infrastructure-financing gap.
The Project Bond facility is particularly suitable for projects that struggle to reach investment grade because of sovereign ratings constraints or specific project features (innovative construction technique or high demand risk for instance). The evaluation underlined the need to maintain the interest of investors by building a pipeline of mature projects over the long term.
The EIB and the Commission have made considerable efforts to promote the initiative and to outreach towards wider public via various bilateral meetings with the Member States, international events, conferences, and workshops. The EIB has identified a strong pipeline of projects for 2015 and beyond.
- Governance and supervision arrangements:
• Commission's participation in the governance and supervision of the financial instruments managed by the EIB (mechanism foreseen in the individual delegation agreements), as well as in the provisions of the FAFA agreement.
• Service Level Agreement with DG ECFIN for the supervision of technical reports and information regarding management aspects of the instruments (e.g. asset management, treasury guidelines). ECFIN acts as Asset Management Designated Service (AMDS) following the corresponding Cooperation Agreements. The AMDS annual meeting between DG MOVE and ECFIN to review the

87 move_aar_2014_final
overall implementation of the LGTT and PBI T-T instruments in 2014 was held on 8 December 2014.
• Regular teleconferences and exchanges of information with DG ECFIN and DG BUDG on the implementation of projects and management of assets entrusted to the EIB.
• General supervision of the implementation of the financial instruments in the context of FIIEG.
• Reception and analysis of monthly and quarterly operational reporting from the EIB.
It has to be noted that, to date, the EIB has not yet provided for 2014, neither the management declaration on the EU funds engaged in the current financial instruments, nor the operational reporting. The audited statements for LGTT and PBI were received in March though. The missing documents are expected to be received in the first half of 2015. However, despite the delay, and thanks to the regular reporting provided by the EIB and regular contacts with the EIB, ECFIN and DG BUDG, DG MOVE is in a position to have a detailed overview of the state of implementation of the TEN-T projects by means of the financial instruments.
The procedure will change anyway in the context of the entry into force of a new delegation agreement with the EIB (in 2015), which involves the merging of existing financial instruments and the adoption of new provisions in line with FAFA requirements. Work is indeed ongoing - under the auspices of DG ECFIN - for the conclusion of a new administrative agreement with the EIB for three sectors, transport, energy and CIT, in the field of the delegation of the EU contribution from the funds of the Connecting Europe Facility. The text of agreement is expected to be signed in the first quarter of 2015 and will take into account the main recommendations of the ex-post evaluation on LGTT carried out by DG MOVE (between Q2 2013 and Q1 2014).
Supervision cost € 285 912
Cost of remuneration fees84 paid to entrusted entity 4.5%
Overall supervision / amount delegated 4.79%
84 2014 was a particular year as regards the operating expenses paid for LGTT: according to the amended Agreement, the EC share of the risk related income is reduced by the amount of risk related net revenues recorded in the audited LGTT financial statements until 31 December 2013. LGTT recorded risk related net revenues from 2008 to 2013 amounting to € 2 340 million.

88 move_aar_2014_final
c) Conclusion
DG MOVE's supervision of these financial instruments did not identify particular issues that would need to be included in this report, which is the reason why DG MOVE considers that their supervision is effective and appropriate.
2.2.5 PPPs (Joint Undertakings, ex-Art 185 initiatives art. 208 & 209): SESAR JU and S2R JU85
DG MOVE is responsible for the SESAR JU (2014 contributions: € 73.66 million from the TEN-T budget and € 21.0986 million from the FP7 budget), a public-private partnership developing operational and technical improvements for the modernisation of the European and global air traffic management system.
Furthermore, in 2014, DG MOVE, in collaboration with DG RTD, has set up the Shift2Rail Joint Undertaking (S2R JU) with the aim of coordinating and implementing research and innovation activities in the rail sector.
DG MOVE plays a key role in the monitoring of the JUs and relies on the JUs to achieve their policy objectives. DG MOVE is a member of the Administrative Board (SESAR JU)/Governing Board (S2R JU).
Arrangements are in place to ensure that all key proposals to these Boards are properly assessed and the Commission position agreed. Each JU is required to produce an Annual Activity Report and the JU Director signs a declaration of assurance in line with the one used in the Commission. In addition regular reporting and extensive informal and formal contacts are also part of the interaction. The JUs are also required to inform the Commission without delay of any significant developments in the areas of risk management, control and audit.
The JUs are subject to audit by the Internal Audit Service of the Commission and by the European Court of Auditors and DG MOVE uses their reports as an element of the supervision of these bodies.
a) SESAR JU
In particular, concerning the governance and supervision arrangements related to SESAR, the Commission, represented by DG MOVE, supervises the SESAR JU through its main
85 As of 2014, DG MOVE is no more accountable for the expenditure related to the Fuel Cells and Hydrogen JU, for which DG RTD is responsible. However, DG MOVE is still a member of the Governing Board.
86 Taking into account the deduction of interests on pre-financing due to the Commission, the net contribution amounts to € 20.97 million
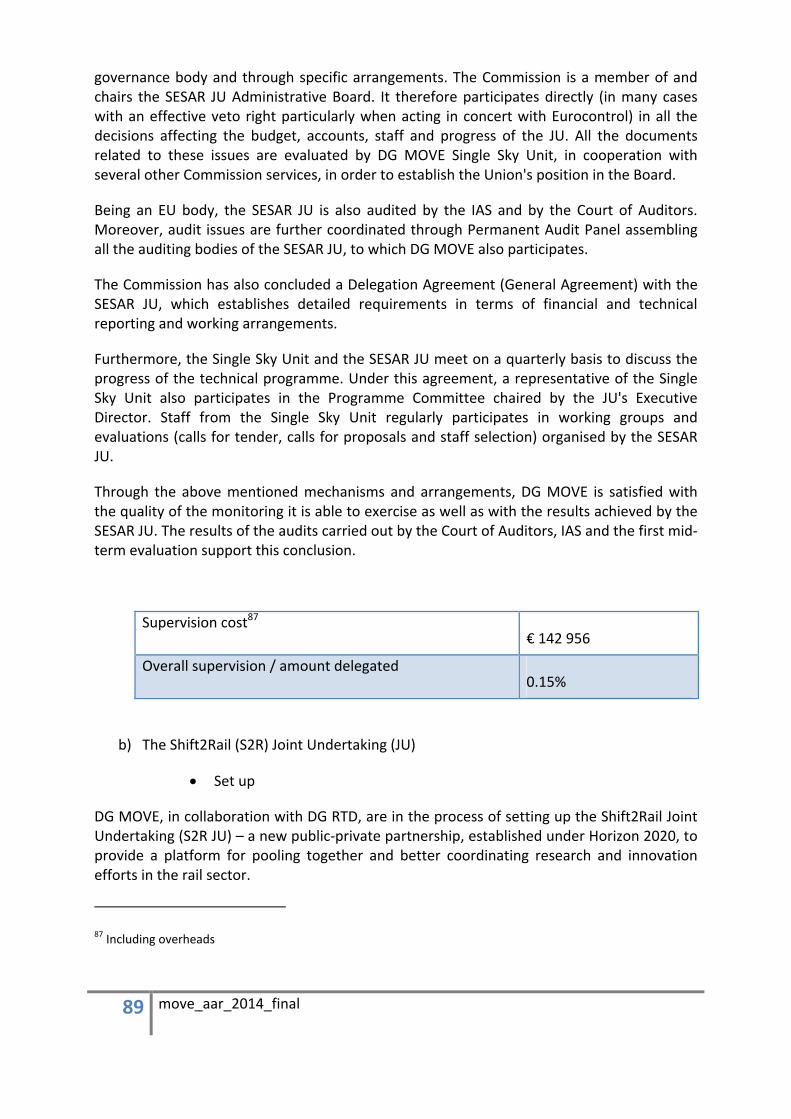
89 move_aar_2014_final
governance body and through specific arrangements. The Commission is a member of and chairs the SESAR JU Administrative Board. It therefore participates directly (in many cases with an effective veto right particularly when acting in concert with Eurocontrol) in all the decisions affecting the budget, accounts, staff and progress of the JU. All the documents related to these issues are evaluated by DG MOVE Single Sky Unit, in cooperation with several other Commission services, in order to establish the Union's position in the Board.
Being an EU body, the SESAR JU is also audited by the IAS and by the Court of Auditors. Moreover, audit issues are further coordinated through Permanent Audit Panel assembling all the auditing bodies of the SESAR JU, to which DG MOVE also participates.
The Commission has also concluded a Delegation Agreement (General Agreement) with the SESAR JU, which establishes detailed requirements in terms of financial and technical reporting and working arrangements.
Furthermore, the Single Sky Unit and the SESAR JU meet on a quarterly basis to discuss the progress of the technical programme. Under this agreement, a representative of the Single Sky Unit also participates in the Programme Committee chaired by the JU's Executive Director. Staff from the Single Sky Unit regularly participates in working groups and evaluations (calls for tender, calls for proposals and staff selection) organised by the SESAR JU.
Through the above mentioned mechanisms and arrangements, DG MOVE is satisfied with the quality of the monitoring it is able to exercise as well as with the results achieved by the SESAR JU. The results of the audits carried out by the Court of Auditors, IAS and the first mid-term evaluation support this conclusion.
Supervision cost87 € 142 956
Overall supervision / amount delegated 0.15%
b) The Shift2Rail (S2R) Joint Undertaking (JU)
• Set up
DG MOVE, in collaboration with DG RTD, are in the process of setting up the Shift2Rail Joint Undertaking (S2R JU) – a new public-private partnership, established under Horizon 2020, to provide a platform for pooling together and better coordinating research and innovation efforts in the rail sector.
87 Including overheads

90 move_aar_2014_final
The S2R JU was formally established on 7 July 2014 following the adoption by the Council of Regulation (EU) № 642-2014. Set-up activities are underway with a view to ensuring that the S2R JU can achieve operational and financial autonomy by mid-2015.
The overall duration of the delegation is foreseen until 31 December 2024.
The founding members of the S2R JU are the European Union plus eight major players from the rail industry having made a commitment of at least € 30 million to the S2R JU. Additional associated members are to be selected following an open call that was launched on 6 October 2014 (final selection foreseen before the summer).
In 2014, DG MOVE paid € 18 047 to cover administrative expenditure related to the setting up of the JU. No payment was made for the operational activities of the JU as these had not yet started in 2014.
• Objective
The core objective of the Joint Undertaking is to enable a faster and cheaper transition to a more attractive, competitive, efficient, integrated and sustainable European rail system, thereby supporting the achievement of the Single European Railway Area and the competitiveness of the rail sector as a whole.
By bringing together the coordination, programming and execution of rail-related research and innovation activities under the responsibility of a single, dedicated structure, the Joint Undertaking will ensure continuity and avoid fragmentation of research and innovation efforts, helping to avoid costly overlaps and duplication.
The Joint Undertaking will also ensure a significantly higher leverage effect of EU funds by making EU funding (of up to € 450 million between 2014-2020) conditional to firm financial commitments from the rail industry (of at least € 470 million between 2014-2020).
• Supervision arrangements
As an EU PPP body under Article 209 FR, the S2R Joint Undertaking will function under strict monitoring rules. Monitoring will be performed through the supervision of the Governing Board (in which the Commission holds 50% of voting rights) and via regular evaluations by external experts (every 3 years and at the end of the programme, under the supervision of the Commission). Operational and financial reporting provisions are clearly set out in the Statutes of the S2R JU (Article 20).
The JU will also be subject to audit by the Internal Audit Service of the Commission and by the European Court of Auditors
Three meetings of the S2R JU Governing Board were held in 2014. During these meetings, the core financial, administrative and legal documents (Rules of Procedures, Financial Rules, Budget and Staff plan, Organisation structure, etc.) were adopted.
In particular, a Commission Decision designating the Union's representatives to the Governing Board and the procedures for establishing the Commission's position in these
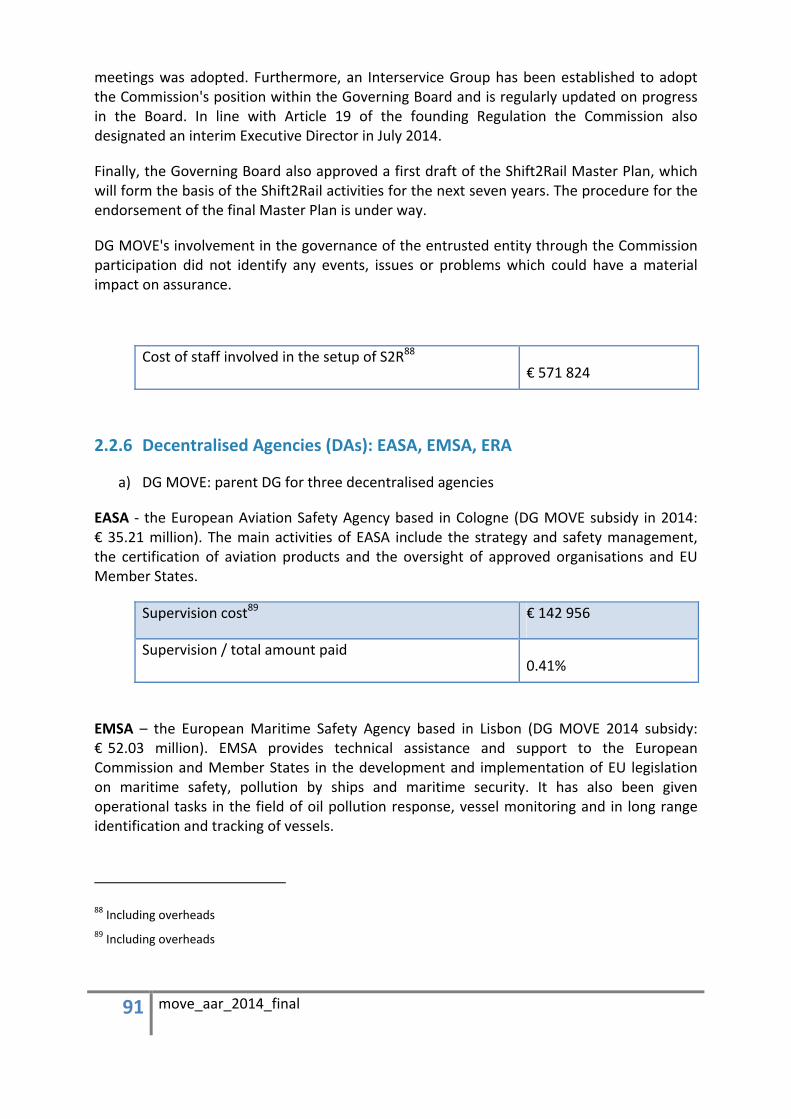
91 move_aar_2014_final
meetings was adopted. Furthermore, an Interservice Group has been established to adopt the Commission's position within the Governing Board and is regularly updated on progress in the Board. In line with Article 19 of the founding Regulation the Commission also designated an interim Executive Director in July 2014.
Finally, the Governing Board also approved a first draft of the Shift2Rail Master Plan, which will form the basis of the Shift2Rail activities for the next seven years. The procedure for the endorsement of the final Master Plan is under way.
DG MOVE's involvement in the governance of the entrusted entity through the Commission participation did not identify any events, issues or problems which could have a material impact on assurance.
Cost of staff involved in the setup of S2R88 € 571 824
2.2.6 Decentralised Agencies (DAs): EASA, EMSA, ERA
a) DG MOVE: parent DG for three decentralised agencies
EASA - the European Aviation Safety Agency based in Cologne (DG MOVE subsidy in 2014: € 35.21 million). The main activities of EASA include the strategy and safety management, the certification of aviation products and the oversight of approved organisations and EU Member States.
Supervision cost89 € 142 956
Supervision / total amount paid 0.41%
EMSA – the European Maritime Safety Agency based in Lisbon (DG MOVE 2014 subsidy: €°52.03 million). EMSA provides technical assistance and support to the European Commission and Member States in the development and implementation of EU legislation on maritime safety, pollution by ships and maritime security. It has also been given operational tasks in the field of oil pollution response, vessel monitoring and in long range identification and tracking of vessels.
88 Including overheads 89 Including overheads
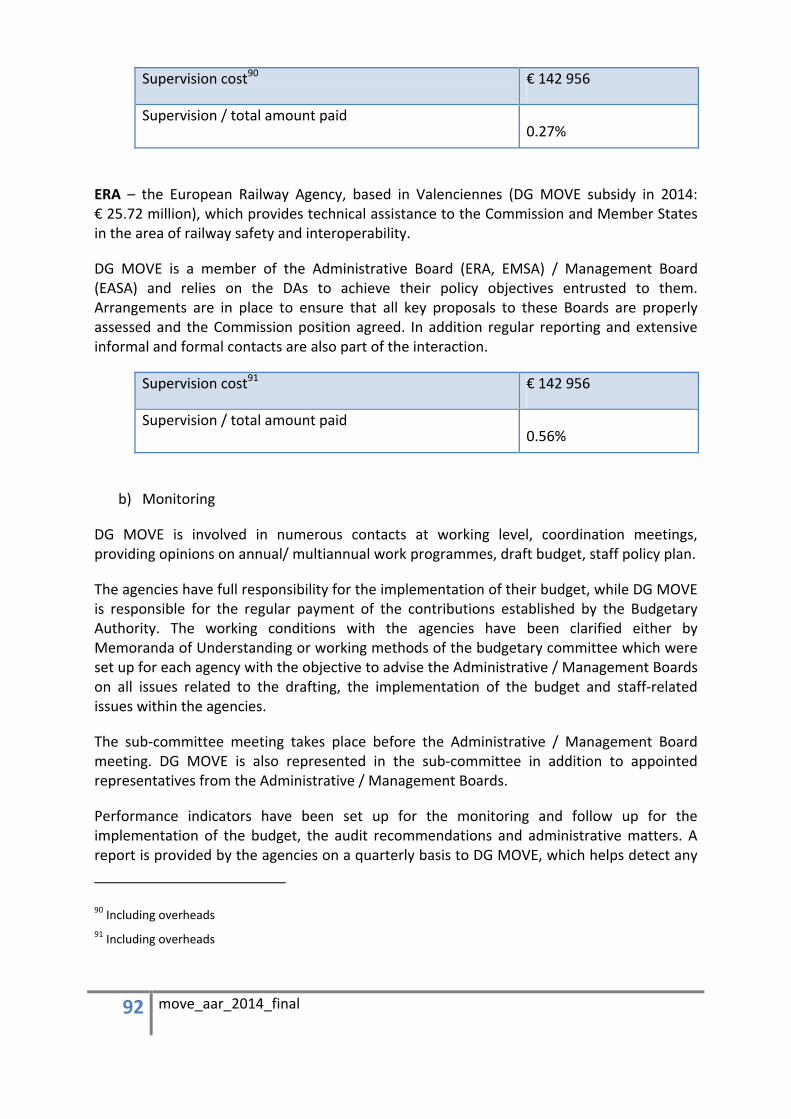
92 move_aar_2014_final
Supervision cost90 € 142 956
Supervision / total amount paid 0.27%
ERA – the European Railway Agency, based in Valenciennes (DG MOVE subsidy in 2014: € 25.72 million), which provides technical assistance to the Commission and Member States in the area of railway safety and interoperability.
DG MOVE is a member of the Administrative Board (ERA, EMSA) / Management Board (EASA) and relies on the DAs to achieve their policy objectives entrusted to them. Arrangements are in place to ensure that all key proposals to these Boards are properly assessed and the Commission position agreed. In addition regular reporting and extensive informal and formal contacts are also part of the interaction.
Supervision cost91 € 142 956
Supervision / total amount paid 0.56%
b) Monitoring
DG MOVE is involved in numerous contacts at working level, coordination meetings, providing opinions on annual/ multiannual work programmes, draft budget, staff policy plan.
The agencies have full responsibility for the implementation of their budget, while DG MOVE is responsible for the regular payment of the contributions established by the Budgetary Authority. The working conditions with the agencies have been clarified either by Memoranda of Understanding or working methods of the budgetary committee which were set up for each agency with the objective to advise the Administrative / Management Boards on all issues related to the drafting, the implementation of the budget and staff-related issues within the agencies.
The sub-committee meeting takes place before the Administrative / Management Board meeting. DG MOVE is also represented in the sub-committee in addition to appointed representatives from the Administrative / Management Boards.
Performance indicators have been set up for the monitoring and follow up for the implementation of the budget, the audit recommendations and administrative matters. A report is provided by the agencies on a quarterly basis to DG MOVE, which helps detect any
90 Including overheads 91 Including overheads

93 move_aar_2014_final
weaknesses. Additionally, after the closure of the financial year, the parent DG claims any surplus paid to the Agency on the basis of the budget outturn calculations provided to the Commission.
Finally, the Commission provides assistance to the agencies with regard to the application of the financial regulations, but also through the use of different Commission tools and services (ABAC, Medical Service, recruitment via EPSO, training, PMO).
c) Audit by the Court of Auditors:
In the DAS 2013, ECA found the annual accounts of EASA, EMSA, and ERA legal and regular in all material aspects and that they present fairly in all material respects the financial position of the Agencies.
The Court made a few observations relating notably to the legality and regularity of transactions, budgetary and financial management, internal controls as well as to other matters, such as the follow-up of previous years' observations.
In particular, the comment on the internal controls concerned ERA, for which the non-compliance with the internal control standard on business continuity was due to the fact that there were no approved IT Business Continuity and Disaster Recovery plans. In response to the Court's observation, ERA decided to implement adequate measures in order to assure the continuity of the IT services and systems that are horizontal to the Agency business and to elaborate a Business Continuity Plan and a Disaster Recovery Procedure. The plan has been adopted and published. The implementation will happen gradually over the year 2015 – and this will also include the formalisation of the Disaster Recovery Procedure.
Furthermore, still concerning ERA, ECA observed that the business continuity of the Agency could be put at risk because of the fixed-term employment contracts, which was a particularity of ERA. In the meantime, the issue of the term of the contracts was solved by the new rules adopted by ERA in agreement with the Commission and the Administrative Board. They should be in any case regarded as temporary, as the new ERA founding act will settle it definitively and align it with the new Staff Regulations.
Overall, the Agencies are taking ECA's observations into account in their continuous development of systems and procedures for controls and governance processes to achieve their objectives.
c) Conclusion
In conclusion, the regular supervision of the decentralised agencies did not identify particular issues that would need to be included in this report or that could have a material impact on the assurance. Overall DG MOVE considers that its supervision of the DAs is effective and appropriate.

94 move_aar_2014_final
2.3 Assessment of audit results and follow up of audit recommendations
This section reports and assesses the observations and conclusions reported by auditors which could have a material impact on the achievement of the internal control objectives, and therefore on assurance, together with any management measures taken in response to the audit recommendations.
2.3.1 Internal Audit service (IAS)
For DG MOVE, there was no new audit launched by the IAS in 2014 and there are no open recommendations left from previous years.
2.3.2 Shared Internal Audit Capability (SIAC)
During the period under review, the SIAC carried out 4 engagements related to DG MOVE, 2 audits and 2 reviews:
• An audit of ICS 5 on Objectives and Indicators, covering the design of the objectives and key performance indicators and the processes in place to monitor the achievement of the objectives. The audit contained 5 recommendations, including a very important recommendation resulting in a satisfactory opinion with qualification. The qualification is related to the coverage of the essential activities of DG MOVE by the current set of indicators to allow an improved assessment of the achievement of the objectives. The final audit report was issued in December 2014 and the action plan submitted early February 2015.
• An audit of the evaluation function, from the planning phase to the publication of the reports. The audit resulted in a satisfactory opinion.
• A review of the relation with ECFIN and the EIB and the operational aspects of financial instruments.
• A review of the management of the relations between DG MOVE and Eurocontrol.
Concerning the 2 reviews, SIAC found the reviewed processes generally adequate and effective and identified opportunities for improvement/evolution of the processes, which are being addressed by DG MOVE.
In addition, SIAC noted that the follow up of the recommendations had been achieved in a satisfactory manner.
In conclusion, as of 31st December 2014, all issued recommendations have been reviewed and closed except for the 5 recommendations stemming from the audit of the implementation of ICS 5, for which the action plan was received beginning of February 2015.

95 move_aar_2014_final
Moreover in its Annual audit opinion for 2014, the SIAC concluded that, based on the audit work carried out and on other elements available, the internal control systems in place in DG MOVE provide a reasonable assurance regarding the achievement of business objectives set up for the processes audited to the exception of the specific qualification resulting from the above mentioned audit. DG MOVE will undertake and finalise further actions to close the recommendations on the implementation of ICS 5 objectives and indicators in 2015.
Finally, as can be seen in the table below, management has accepted 100% of issued audit recommendations. As regards their implementation, all accepted very important and important recommendations were implemented within deadlines.
Table 2.9 – Internal audit indicators
Indicator Latest known result Target
% of "critical", "very important" and "important" accepted audit recommendations implemented within deadlines / number of accepted recommendations (SIAC)
31/12/2014: 100%
31/12/2013: 72.7%
>70%
% recommendations accepted by auditees / number of recommendations issued (SIAC)
31/12/2014: 100%
31/12/2013: 100%
>80%
Work programme implemented as percentage of annual planned Work Programme (SIAC)
31/12/2014: 100%
31/12/2013: 100%
>90%
2.3.3 European Court of Auditors (ECA)
Audit work 2014 - Statement of assurance (DAS) 2013
In the context of DAS 2013, the ECA assesses Mobility and Transport together with Energy and the Regional policy92. The ECA concluded for the whole chapter that the testing of transactions indicates that the most likely error present in the population is 6.8%, that the examined supervisory and control systems are partially effective93 and that the overall audit evidence indicates that accepted expenditure is affected by a material level of error. Given that Mobility and Transport payments represent 2.3% of the total of the whole chapter, the ECA's overall conclusions are not representative for DG MOVE.
92 Chapter 5 of the ECA's annual report 2013 (OJ C 398, vol. 57, 12.11.2014) 93 This assessment was made on Audit Authorities in the context of Regional and Urban Policy and
Employment, Social Affairs and Inclusion. It does not concern DG MOVE.
96 move_aar_2014_final
The ECA selected 8 transactions for review in the field of Mobility and Transport: 6 from the TEN-T programme managed by the INEA Agency, 1 concerned the Commission's contribution to the EMSA Agency and 1 related to the Marco Polo programme formerly managed by the EASME Agency before being taken over by the INEA Agency in 2014.
• The ECA considers that 5 out of the 6 payments from the TEN-T programme contained errors (mostly related to beneficiaries' compliance with public procurement rules). The findings of the ECA on which the Commission agreed are subject to a systematic follow-up by the Agency94. The ECA reviewed MOVE 2013 AAR and was of the opinion that DG MOVE should have issued, in its 2013 AAR, a reservation for the TEN-T programme in relation to non-compliance with EU and national public procurement rules.
The Commission's reply to point 5.6095 explained the justified considerations for not having a reservation, neither by DG MOVE nor by INEA itself: DG MOVE considers that it has followed the standing instructions for 2013 AARs: in the context of its supervisory responsibilities over the INEA Agency, DG MOVE took into account all the information at its disposal including the accepted ECA's observations and the assurance given by the Agency. The multi-annual residual error rate for finalised ex post controls for the 2007-2013 TEN-T programme was below the materiality threshold of 2%. Furthermore, throughout 2013, the INEA Agency continued to reinforce its ex-ante and ex-post controls, particularly in the field of public procurement.
• The review of the Commission's contribution to the EMSA Agency did not raise any audit observations.
• The ECA dropped its initially issued observations on the payment related to the Marco Polo programme, taking into account the facts and arguments put forward by the Commission.
The ECA did not sample any of DG MOVE's payments for research; however, their conclusion for the policy group Research and other Internal Policies, that the audit evidence indicates that accepted expenditure is affected by material error applies by analogy to such payments made by DG MOVE.
The ECA recommended that the Commission96:
(i) extend and intensify its communication campaign to raise awareness among
94 See INEA's 2014 AAR 95 Chapter 5 of the ECA's annual report 2013 (OJ C 398, vol. 57, 12.11.2014) 96 Chapter 5 of the ECA's annual report 2013 (OJ C 398, vol. 57, 12.11.2014, paragraph 8.36)

97 move_aar_2014_final
beneficiaries and independent auditors about the eligibility rules for research spending under FP7;
(ii) across the policy group, make its control activities more risk-driven, focusing checks on high-risk beneficiaries (for example entities with less experience of European funding) and reducing the burden of checks on less risky beneficiaries;
(iii) for the new 2014-2020 programmes for research and other internal policies, provide timely, consistent and clear guidance to beneficiaries and managing authorities in respect of the revised eligibility and control requirements.
The Commission accepted the Court's recommendations. The follow-up actions are described in details in DG RTD's AAR 2014.
Furthermore, the Court also performed an audit of the accounts of DG MOVE as at 31/12/2013. This included analysis of closure operations, substantive testing of invoices and pre-financings and analysis of cut-off data.
The Court issued three observations:
(i) one on the amount of the contingent liabilities as of 31/12/2013
The Commission partially agreed with the Court and corrective measures was taken.
(ii) one on the text related to the contribution to the LGTT
The Commission agreed with the Court's observations and corrective measures were implemented for the final accounts.
(iii) one on the classification of the EIB's Unitary Fund in the Commission's accounts
The Commission did not agree with the Court's observation and no corrective measures were taken.
Audit work 2014 - Special Reports
In 2014, DG MOVE was not the lead DG for any of the reports published by the Court. Follow-up of recommendations issued in previous years
DG MOVE has to implement one correction to errors detected by the ECA in its 2008 Annual Report, concerning weaknesses in tendering procedures in one TEN-T project. The contradictory procedure with the beneficiary is on-going.
98 move_aar_2014_final
In 2013, the ECA completed its performance audit and published the related Special Report for the Marco Polo programmes. The 4 accepted recommendations97 are currently being reviewed by DG MOVE in the context of new funding framework for the transport policies (CEF/TEN-T).
2.3.4 Overall conclusion
Overall, internal and external audit work contributes significantly to the continuing improvement in DG MOVE systems and operations. The IAS and SIAC make recommendations that are subject to a systematic follow up by the Directorate-General. After reviewing these cases, it is concluded that internal audit work does not reveal weaknesses that would require a reservation in this report.
The findings and recommendations of the ECA are similarly subject to a systematic follow-up. Action plans have been put in place and implemented.
97 (1)To make possible continuation of funding projects conditional upon a positive ex ante impact assessment;
(2) To assess the needs, limits and conditions for infrastructure and equipment support; (3)To tackle the phenomenon of deadweight;
(4)To ensure that adequate data are available to demonstrate the performance achieved by the funded actions.
99 move_aar_2014_final
3. ASSESSMENT OF THE EFFECTIVENESS OF THE INTERNAL CONTROL SYSTEMS The Commission has adopted a set of internal control standards, based on international good practice, aimed to ensure the achievement of policy and operational objectives. In addition, as regards financial management, compliance with these standards is a compulsory requirement.
DG MOVE has put in place the organisational structure and the internal control systems suited to the achievement of the policy and control objectives, in accordance with the standards and having due regard to the risks associated with the environment in which it operates.
3.1 Source and methodology for the assessment
DG MOVE's annual review of its implementation of the Internal Control Standards (ICS 15) was based on a number of monitoring measures and sources of information including:
• Progress with implementing the actions necessary to reach the requirements of the internal control standards prioritised for 2014 (ICS 3 and ICS 14);
• Reported instances of exceptions (none in 2014) and non-compliance events; • The results of SIAC, IAS and ECA audit work; • Progress with implementing actions stemming from audit recommendations; • The opinion of the internal control coordinator and staff working on internal control; • The opinion of a sample of staff members and middle-management in response to an
electronic survey (launched on 30/09/2014); • Information on internal control issues received through the AOSD's Management
Reports.
3.2 Exceptions and non-compliance events
The functioning of the internal control systems has been closely monitored throughout the year by the systematic registration of exceptions (none in 2014) and non-compliance events (under ICS 8).
The analysis of the 2014 register showed that the main areas of concern for DG MOVE are: • The missions; • The reimbursement of experts; • The signature of legal commitments without prior budgetary commitments; • The evaluation of tenders.
This analysis has enabled the internal control coordinator to report the state of internal control to the Director-General, who consequently issued a note in February 2015 to remind staff to pay attention to the rules and procedures in place in the concerned areas.
100 move_aar_2014_final
The impact of the errors leading to non-compliance events have been assessed as minor on the assurance of the authorising officer. In any case, further enhancing the effectiveness of the DG's control arrangements in place, by inter alia taking into account any control weaknesses reported and exceptions recorded, is an on-going effort in line with the principle of continuous improvement of management procedures.
3.3 Prioritised ICS
In its management plan for 2014, DG MOVE had foreseen measures to improve the effective implementation of ICS 3 (Staff Allocation and Mobility) and ICS 14 (Evaluation of Activities).
• ICS 3 was prioritised to ensure that the organisational structures and staff allocation are aligned with priorities and workload, in a context of increasing resource constraints and externalisation process. An action plan was implemented in 2014 with measures tackling this aspect (such as regular meetings with the Director General on vacant posts to check allocation of resources in line with political priorities and regular follow-up and verification of existence of job descriptions) as well as supporting staff mobility and integration of new staff members.
• ICS 14 was prioritised to ensure that evaluation studies allow for effective reporting on performance, both as concerns their timing and content (focus on results and impacts), in the context of a deepened performance framework. An action plan was implemented in 2014 resulting notably in organisation of workshops in DG MOVE on best practices to interlink evaluation and policy preparation and to on evaluation and new development. One action (concerning a training session on the implementation of the new evaluation guidelines) remains opened and will be completed in 2015.
In short, by the end of the 2014, all measures foreseen in the management plan - except one - for the 2 prioritised ICS were satisfactorily implemented. Full implementation is expected in the course of 2015, pending on the adoption of the new Evaluation Guidelines. For 2015, DG MOVE has decided to prioritise ICS 12 – Information and Communication. Successful communication is indeed an important tool to achieve objectives. It relies heavily on the consistency and focus of the message to be passed on, which in turn implies maintaining a degree of discipline and respecting certain rules and principles. The decision to prioritise ICS 12 was not only based on the staff survey, but also because the actions to be developed would be instructive, in particular with the agenda and priorities emphasised by the new Commission as well as the rapidly changing communications environment.
101 move_aar_2014_final
The following aspects of ICS 12 will be tackled: • DG MOVE internal communication strategy will be renewed and promoted
internally; • Raising awareness among the staff on the new organisational structure of the
Commission and its new ways of working, including the political priorities. Possible Lunch conference;
• Mission statement updated and communicated to staff; • Regular monitoring of the internal communication plan.
3.4 General risk environment
In 2014, DG MOVE had identified one critical risk and 3 significant risks. As the action plans for these risks have been fully implemented by the end of the year, they have not been carried over to 2015. DG MOVE will however continue to pay attention in addressing overpayments in personnel and indirect costs in research payments.
3.5 Conclusion on the effectiveness of the entire control system
It can be concluded from the above assessment as regards the overall state of the internal control system in DG MOVE that generally staff has the required knowledge and skills, while systems and procedures are in place to manage and mitigate the DG's exposure to key risks to the achievement of the DG's objectives. Moreover no instances of ineffective controls have exposed DG MOVE to its key risks.
Further enhancing the effectiveness of the DG's control arrangements in place is an on-going effort in line with the principle of continuous improvement of management procedures.
In conclusion, the internal control standards are - to the best of our knowledge - effectively implemented in DG MOVE, with improvements ongoing notably for ICS 3, 12 and 14.

102 move_aar_2014_final
4. MANAGEMENT ASSURANCE This section reviews the assessment of the elements reported in Parts 2 and 3 and draws conclusions supporting of the declaration of assurance and namely, whether it should be qualified with reservations.
4.1 Review of the elements supporting assurance
The information reported in Parts 2 and 3 stems from the results of management and auditor monitoring contained in the reports listed. These reports result from a systematic analysis of the evidence available and give a true and fair view. This approach provides sufficient guarantees as to the completeness and reliability of the information reported and results in an adequate coverage of the budget delegated to the Director-General of DG MOVE.
Management has reasonable assurance that overall suitable controls are in place and work as intended (taking into account also the multiannual character of the main programmes); risks are being mitigated and/or monitored thanks to the risk management process; improvements and reinforcements are being implemented.
DG MOVE developed its anti-fraud strategy end of 2013 and while the remaining actions will be implemented by the end of 2015, there is no indication that any additional temporary measures are necessary until full implementation. Furthermore, the risk assessment in 2014 did not identify any critical or significant fraud risks.
As to the results from internal and external audits during the reporting year, they give an overall positive feedback and did not include any critical findings. The residual risk from the audit recommendations remaining open is not considered to have a bearing on the declaration of assurance.
Furthermore, in relation to the internal control standards, DG MOVE has – by the end of the reporting year - fully implemented the measures for priority standards 3 and progressed on the actions defined for standards 14, with full implementation foreseen as soon as possible in 2015. Besides, following the assessment made by DG MOVE during the reporting year on the effectiveness of its internal control systems, the DG has identified areas for improvements, although in no case the weaknesses identified were leading to assurance-related concerns. DG MOVE decided to select ICS 12 as priority standard for 2015.
Overall the controls carried out by DG MOVE for the management of the budget, whether implemented directly or indirectly were effective, as can be concluded from the qualitative and quantitave benefits detailed in the previous sections. DG MOVE judges that the resources assigned to the activities described in this report have been used for their intended purpose and in accordance with the principles of sound financial management, and that the control procedures put in place give the necessary guarantees concerning the legality and regularity of the underlying transactions.
Finally, the reservation on FP7 expenditure on reimbursements against cost statements is
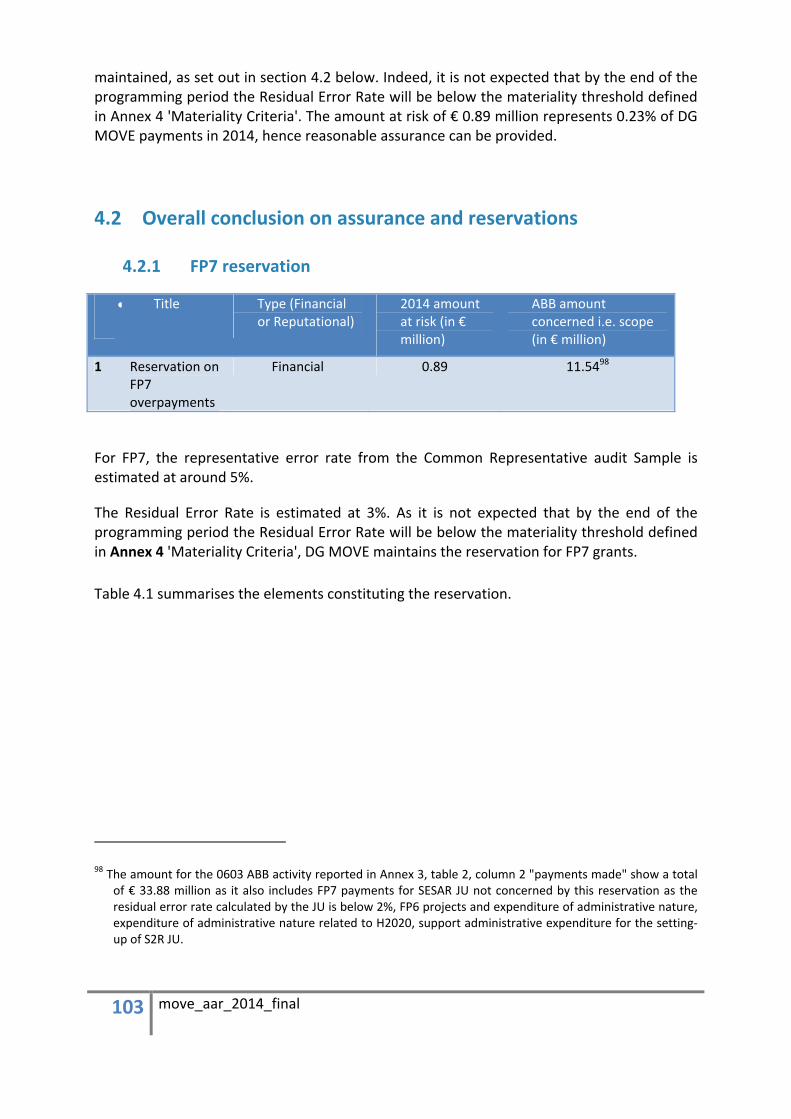
103 move_aar_2014_final
maintained, as set out in section 4.2 below. Indeed, it is not expected that by the end of the programming period the Residual Error Rate will be below the materiality threshold defined in Annex 4 'Materiality Criteria'. The amount at risk of € 0.89 million represents 0.23% of DG MOVE payments in 2014, hence reasonable assurance can be provided.
4.2 Overall conclusion on assurance and reservations
4.2.1 FP7 reservation
• Title Type (Financial or Reputational)
2014 amount at risk (in € million)
ABB amount concerned i.e. scope (in € million)
1 Reservation on FP7 overpayments
Financial 0.89 11.5498
For FP7, the representative error rate from the Common Representative audit Sample is estimated at around 5%.
The Residual Error Rate is estimated at 3%. As it is not expected that by the end of the programming period the Residual Error Rate will be below the materiality threshold defined in Annex 4 'Materiality Criteria', DG MOVE maintains the reservation for FP7 grants.
Table 4.1 summarises the elements constituting the reservation.
98 The amount for the 0603 ABB activity reported in Annex 3, table 2, column 2 "payments made" show a total of € 33.88 million as it also includes FP7 payments for SESAR JU not concerned by this reservation as the residual error rate calculated by the JU is below 2%, FP6 projects and expenditure of administrative nature, expenditure of administrative nature related to H2020, support administrative expenditure for the setting-up of S2R JU.
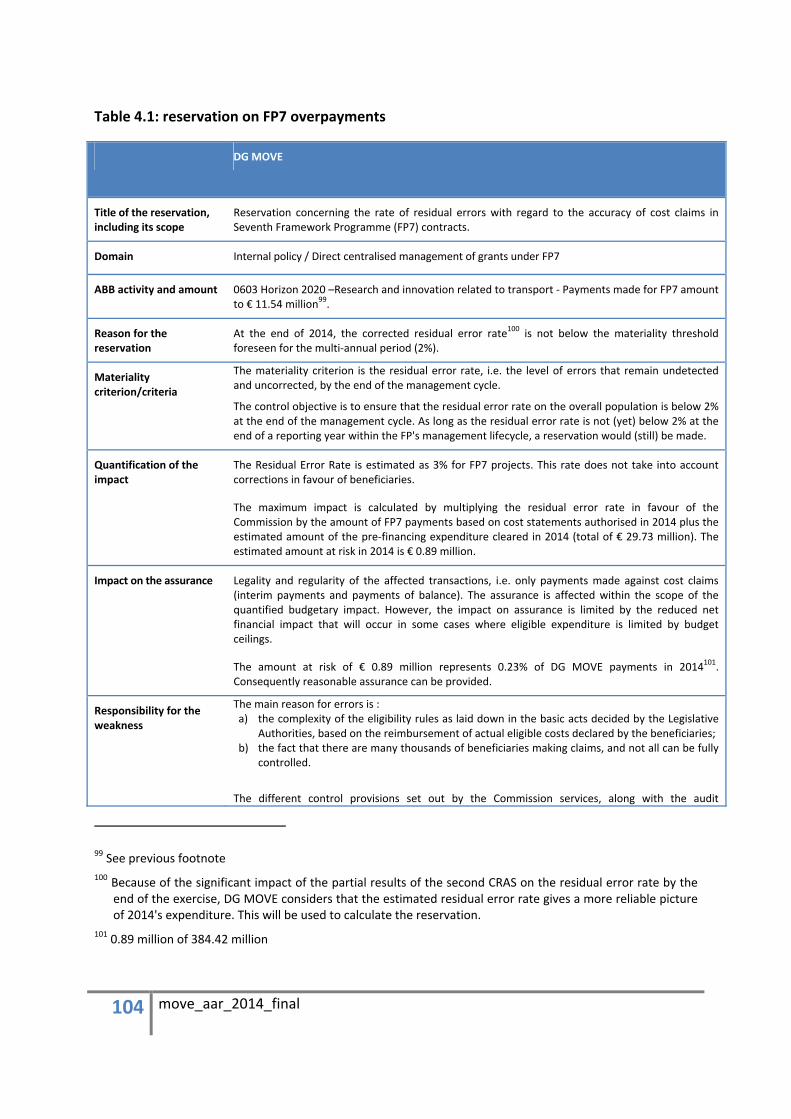
104 move_aar_2014_final
Table 4.1: reservation on FP7 overpayments
DG MOVE
Title of the reservation, including its scope
Reservation concerning the rate of residual errors with regard to the accuracy of cost claims in Seventh Framework Programme (FP7) contracts.
Domain Internal policy / Direct centralised management of grants under FP7
ABB activity and amount 0603 Horizon 2020 –Research and innovation related to transport - Payments made for FP7 amount to € 11.54 million99.
Reason for the reservation
At the end of 2014, the corrected residual error rate100 is not below the materiality threshold foreseen for the multi-annual period (2%).
Materiality criterion/criteria
The materiality criterion is the residual error rate, i.e. the level of errors that remain undetected and uncorrected, by the end of the management cycle.
The control objective is to ensure that the residual error rate on the overall population is below 2% at the end of the management cycle. As long as the residual error rate is not (yet) below 2% at the end of a reporting year within the FP's management lifecycle, a reservation would (still) be made.
Quantification of the impact
The Residual Error Rate is estimated as 3% for FP7 projects. This rate does not take into account corrections in favour of beneficiaries.
The maximum impact is calculated by multiplying the residual error rate in favour of the Commission by the amount of FP7 payments based on cost statements authorised in 2014 plus the estimated amount of the pre-financing expenditure cleared in 2014 (total of € 29.73 million). The estimated amount at risk in 2014 is € 0.89 million.
Impact on the assurance Legality and regularity of the affected transactions, i.e. only payments made against cost claims (interim payments and payments of balance). The assurance is affected within the scope of the quantified budgetary impact. However, the impact on assurance is limited by the reduced net financial impact that will occur in some cases where eligible expenditure is limited by budget ceilings.
The amount at risk of € 0.89 million represents 0.23% of DG MOVE payments in 2014101. Consequently reasonable assurance can be provided.
Responsibility for the weakness
The main reason for errors is : a) the complexity of the eligibility rules as laid down in the basic acts decided by the Legislative
Authorities, based on the reimbursement of actual eligible costs declared by the beneficiaries; b) the fact that there are many thousands of beneficiaries making claims, and not all can be fully
controlled.
The different control provisions set out by the Commission services, along with the audit
99 See previous footnote 100 Because of the significant impact of the partial results of the second CRAS on the residual error rate by the
end of the exercise, DG MOVE considers that the estimated residual error rate gives a more reliable picture of 2014's expenditure. This will be used to calculate the reservation.
101 0.89 million of 384.42 million
105 move_aar_2014_final
certificates on financial statements and ex-post audits, can mitigate these risks to a certain extent, but can never be carried out on 100% of the cost claims received.
Corrective action The possibilities to simplify the FP7 rules have been exhausted, although there is some evidence that the simplification measures introduced in 2011 have had a positive impact on error rate. The remaining scope to reduce errors will be addressed in particular through the following actions:
- continuing its on-going efforts to give guidance and feedback to the participants and certifying auditors to prevent errors occurring;
- continuing with its control and audit work in order to further reduce the FP7 residual error rate.
Action plan to address the reservation for FP7
The following framework conditions need to be borne in mind when considering remedial actions to further reduce the error rate under FP7. These were set out in more detail in the 2012 AAR and will continue to be applied:
a. Legal Framework
All the contracts have now been signed under FP7, so further modification of the legal framework for FP7 is no longer an option. Over the course of FP7, however, the Commission has attempted to simplify the system within the existing legal framework, for example the simplification measures adopted by the Commission on 24 January 2011 (Decision C (2011) 174).
Horizon 2020 includes a radical simplification of the legal framework for the Framework Programme for Research and Innovation (2014-2020), in order to meet the expectations of both stakeholders and legislative authorities.
b. Guidance to beneficiaries and certifying auditors
In 2009 DG MOVE started a campaign (information session) targeting its beneficiaries from FP6 and FP7. This campaign was stopped in 2011 as this type of action has now been decided at the level of the whole research DGs.
2014 saw the continuation of a communication campaign targeting beneficiaries and certifying auditors, based on a document setting out the 10 most common causes of error. Guidance was given to beneficiaries at a number of different events involving coordinators, participants and finance specialists, for FP7 but also for Horizon 2020 (around 750 participants in 11 specific events)
"Coordinators' day" events were organised twice with a total of 1 337 participants. They mainly aimed the presentation of the new framework programme H2020, but a section on "how to avoid errors", also covering FP7, was also included. This can have a positive impact on the ongoing FP7 cost claims, as some of the errors and most of the beneficiaries are common for the two programmes.
This is in addition to the possibilities that already exist for participants to ask for guidance –

106 move_aar_2014_final
for example the Research Enquiry Service and the National Contact Points.
c. Continued control and audit
An appropriate number of ex-post audits will be carried out based on cost-effectiveness considerations, as referred to above, together with the subsequent recovery actions to ensure a further reduction of the residual error rate. However, the audit campaign cannot be greatly extended without adversely affecting the other objectives of the research programme (attractiveness, reduction of administrative burden, widening, etc.)
Within these framework conditions and constraints, the remaining scope to reduce errors will be addressed by DG Research and Innovation through the following actions:
• Continuing its on-going efforts to give guidance and feedback to the participants and certifying auditors to prevent errors occurring;
• Continuing its control and audit work in order to further reduce the FP7 residual error rate
• a second representative audit sample has been defined for the research family (audits started in April 2014) in order to refine/update the representative error rate figures for FP7.
4.2.2 Weighted average error rate and corrective capacity
The below table shows that the overall risk relating to the legality and regularity of the underlying transactions has been assessed by calculating the weighted average error rate for the annual expenditure and the resulting amount at risk:
Table 4.2: Weighted average error rate and corrective capacity in DG MOVE
(2) Scope: payments made
(3) Average Error rate (4) Amount at risk (5) Average Recoveries and Corrections
(6) Corrective Capacity (i.e. Expected Recoveries and Corrections Related to the FY's payments)
(FY in M €) (%) (FY in M €) (%) (FY in M €)
ABB or other activity levelTotals as per table 2 of Annex 3
Detected error rate or equivalent
= (2) x (3)Source: DG BUDG (ABAC recovery context)
= (2) x (5)
Subsidies to Agencies 126.38 0.00% * 0.00Research (FP6, FP7) 12.49 3.00% 0.37Financial instruments 118.57 0.50% * 0.59Administrative expenditure 12.94 0.10% * 0.01SESAR JU 94.75 5.19% 4.92Other operational expenditure 19.28 0.50% * 0.10Overall € 384.42 M 1.56% € 5.99 M 3.20% € 12.30 M
* Estimation
DG MOVE
In view of the control results and all other relevant information available, the AOD's best estimation of the risks relating to the legality and regularity for the expenditure authorised
107 move_aar_2014_final
during the reporting year (€ 384.42 million is between 0% and 2%, which returns an average error rate of 1.56%, implying an amount at risk of € 6 million This portion of the expenditure will be subsequently subject to ex post controls and a sizeable proportion of the underlying error will be detected and corrected in successive years.
It is not possible to identify the specific errors and amounts which will be effectively corrected in the coming years, yet the implementation of these corrective controls since 2009 have resulted on average in recoveries and financial corrections representing 3.2% of the average payments over the same period. This percentage applied to this year's payments made (resulting in € 12.3 million) provides the best available indication of the corrective capacity of the ex-post controls systems implemented by the DG.
It has to be noted that the average error rate of 1.56% (3) is lower than the corrective capacity % (5) as the latter includes all types of recoveries due to irregularities and not only the corrections ensuing solely from the results of audits.
Taking into account the conclusions of the review of the elements supporting assurance and the expected corrective capacity of the controls to be implemented in subsequent years, it is possible to conclude that the internal controls systems implemented by DG MOVE provide sufficient assurance to adequately manage the risks relating to the legality and regularity of the underlying transactions, taking into account the multiannual character of programmes. Furthermore, it is also possible to conclude that the internal control systems provide sufficient assurance with regards to the achievement of the other internal control objectives.
4.2.3 Overall Conclusion
It is concluded from the information provided in Parts 2 and 3 and summarised in Sections 4.1 and 4.2 that the resources assigned to the activities described in this report have been used for their intended purpose and in accordance with the principles of sound financial management, and that the control procedures put in place give the necessary guarantees concerning the legality and regularity of the underlying transactions, with the exception of the expenditure related to the FP7 programme, for which the reservation is maintained.

108 move_aar_2014_final
DECLARATION OF ASSURANCE
I, the undersigned,
Director-General of DG MOVE
In my capacity as authorising officer by delegation
Declare that the information contained in this report gives a true and fair view102.
State that I have reasonable assurance that the resources assigned to the activities described in this report have been used for their intended purpose and in accordance with the principles of sound financial management, and that the control procedures put in place give the necessary guarantees concerning the legality and regularity of the underlying transactions.
This reasonable assurance is based on my own judgement and on the information at my disposal, such as the results of the self-assessment, ex-post controls, the work of the internal audit capability, the observations of the Internal Audit Service and the lessons learnt from the reports of the Court of Auditors for years prior to the year of this declaration.
Confirm that I am not aware of anything not reported here which could harm the interests of the institution.
However the following reservation should be noted:
The residual error rate observed by ex-post controls on grants given under the Seventh Research Framework Programme is higher than the control objective (2%).
Brussels, 31 March 2015
[Signed]
João Aguiar Machado
102 True and fair in this context means a reliable, complete and correct view on the state of affairs in the DG.