Annual Accident Report 2016 - European Commission · Annual Accident Report 2016-3 - 1 Introduction...
86
Annual Accident Report 2016
Transcript of Annual Accident Report 2016 - European Commission · Annual Accident Report 2016-3 - 1 Introduction...

Annual Accident Report 2016

Annual Accident Report 2016
- 2 -
CONTENTS
1 Introduction ________________________________________________________________________________ 3
1.1 The CARE Database ______________________________________________________________________ 3
1.2 Notes _________________________________________________________________________________ 4
2 Overview – major issues ______________________________________________________________________ 5
2.1 EU– Developments ______________________________________________________________________ 5
2.2 Interesting Details ______________________________________________________________________ 14
3 Time Series – last 10 years in detail ___________________________________________________________ 16
3.1 Time series related to mode of transport ___________________________________________________ 16
3.2 Time series related to age and gender _____________________________________________________ 27
4 Fatalities 2014 ____________________________________________________________________________ 42
4.1 People involved ________________________________________________________________________ 42 4.1.1 Age and gender ____________________________________________________________________ 42
4.2 Modes of transport _____________________________________________________________________ 45 4.2.1 Mode of transport by age ____________________________________________________________ 45 4.2.2 Mode of transport by type of area _____________________________________________________ 50
4.3 Accident characteristics _________________________________________________________________ 53 4.3.1 Various periods of time (month, day of week, hour of day) _________________________________ 53 4.3.2 Type of area/road __________________________________________________________________ 73 4.3.3 Type of junction ____________________________________________________________________ 75 4.3.4 Weather conditions _________________________________________________________________ 76
5 Glossary __________________________________________________________________________________ 78
6 List of tables ______________________________________________________________________________ 84
7 List of figures______________________________________________________________________________ 85

Annual Accident Report 2016
- 3 -
1 Introduction
1.1 The CARE Database Community database on Accidents on the Roads in Europe Road traffic accidents in the Member States of the European Union claim about 26.000 lives and leave more than 1,3 million people injured in 2014. Since 1984, a large number of measures to reduce road accidents have been taken at regional level. Along with these measures, the Council adopted a Decision on 30 November 1993 on the
creation of a Community database on road accidents (93/704/EC)1, the CARE project. It was commonly agreed that such a database at the Community level would make it possible to identify and quantify road safety problems, evaluate the efficiency of road safety measures, determine the relevance of Community actions and facilitate the exchange of experience in this field. After a pilot phase of about 3 years, the Council endorsed the “Report from the Commission on the progress with the project and its future prospects” (COM(97) 238 final). CARE is a Community database on road accidents resulting in death or injury (no statistics on damage-only accidents are kept). The major difference between CARE and most other existing international databases is the high level of disaggregation, i.e. CARE is based on detailed data of individual accidents as collected by the Member States. This structure allows for maximum flexibility and potential with regard to analysing the information contained in the system and opens up a whole set of new possibilities in the field of accident analysis. National data sets are integrated into the CARE database in their original national structure and definitions, with confidential data blanked out. However, transformation rules are implemented in the CARE database in order to increase data compatibility and thus enhance the functioning of the system. The process of improving “homogenisation” of accident data within CARE is underway. In the meantime, the inherent incompatibility of national accident data remains a source of possible misinterpretation when performing comparative analyses at international level. Therefore, on-line access to the CARE database is currently restricted to expert users. The summary statistical tables and figures contained here provide an overview of road accident data from 2005 to 2014. For some figures other sources than CARE have been used in order to give an overview of EU road accident data.
1 OJ No 329, 30.12.1993, p. 63.

Annual Accident Report 2016
- 4 -
1.2 Notes
1. Country abbreviations
Belgium BE Italy IT Romania RO
Bulgaria BG Cyprus CY Slovenia SI
Czech Republic CZ Latvia LV Slovakia SK
Denmark DK Lithuania LT Finland FI
Germany DE Luxembourg LU Sweden SE
Estonia EE Hungary HU United Kingdom UK
Ireland IE Malta MT
Greece EL Netherlands NL Iceland IS
Spain ES Austria AT Liechtenstein LI
France FR Poland PL Norway NO
Croatia HR Portugal PT Switzerland CH
2. Sources: CARE (Community database on road accidents) The glossary of definitions of variables used in this Report is in the appendix, the full glossary is available at: http://ec.europa.eu/transport/road_safety/pdf/statistics/cadas_glossary.pdf, 3. Data available in May 2016. 4. Data refer to 2014 and when not available the latest available data are used (2009 data for BG, 2010 data for MT, and 2013 data for IE, SI and SK). Totals and related average percentages for EU also include latest available data. 5. This 2016 edition of Annual Accident Report updates the previous versions produced within the EU co-funded research projects SafetyNet and DaCoTA under the name Annual Statistical Report. 6. Disclaimer This report has been produced by the National Technical University of Athens (NTUA), the Austrian Road Safety Board (KFV) and the European Union Road Federation (ERF) under a contract with the European Commission. Whilst every effort has been made to ensure that the matter presented in this report is relevant, accurate and up-to-date, the Partners cannot accept any liability for any error or omission, or reliance on part or all of the content in another context. Any information and views set out in this report are those of the author(s) and do not necessarily reflect the official opinion of the Commission. The Commission does not guarantee the accuracy of the data included in this study. Neither the Commission nor any person acting on the Commission’s behalf may be held responsible for the use that may be made of the information contained therein. 7. Please refer to this Report as follows: European Commission, Annual Accident Report. European Commission, Directorate General for Transport, June 2016.

Annual Accident Report 2016
- 5 -
2 Overview – major issues
2.1 EU– Developments
Figure 1: Annual number of fatalities, injury accidents and injured people in the EU, 2005-2014
Source: CARE (EU road accidents database) or national publications Last update: May 2016
Annual Accident Report 2016
- 6 -
Figure 2: Fatalities per million inhabitants in the EU, 2014 compared to 2005
Source: CARE (EU road accidents database) or national publications Last update: May 2016
Figure 3: Percentage change in number of fatalities and injury accidents by country, 2014 and 2005
Source: CARE (EU road accidents database) or national publications Last update: May 2016

Annual Accident Report 2016
- 7 -
Table 1: Annual number of injury accidents by country, 2005-2014
2005 2006 2007 2008 2009 2010 2011 2012 2013 2014
BE 49.307 49.171 43.239 42.115 41.944 40.569 42.119 38.057 35.632 41.481
BG 8.224 8.222 8.010 8.047 7.068 6.610 6.638 6.717 6.759 7.018
CZ 25.239 22.115 23.060 22.481 21.706 19.675 20.486 20.503 20.342 21.054
DK 5.413 5.403 5.549 5.020 4.174 3.498 3.525 3.124 2.985 2.881
DE 336.618 327.984 335.845 320.614 310.667 288.297 306.266 299.637 291.105 302.435
EE 2.341 2.585 2.449 1.868 1.506 1.347 1.508 1.383 1.382 1.436
IE 6.533 6.018 5.467 6.736 6.615 5.779 5.230 5.610 6.067 5.405
EL 16.914 16.190 15.499 15.083 14.789 15.032 13.849 12.398 12.109 11.752
ES 91.187 99.779 100.508 93.161 88.251 85.503 83.027 83.115 89.519 91.570
FR 84.525 80.309 81.272 74.487 72.315 67.288 65.024 60.437 56.812 58.191
HR 15.679 16.706 18.033 16.290 15.731 13.274 13.229 11.774 11.228 10.323
IT 240.011 238.124 230.871 218.963 215.430 212.997 205.638 188.228 181.660 177.031
CY 1.594 1.757 1.468 1.392 1.197 1.198 1.058 919 774 758
LV 9.310 8.986 9.865 8.894 3.160 3.193 3.386 3.358 3.489 3.728
LT 6.772 6.588 6.448 4.796 3.827 3.530 3.266 3.392 3.391 3.256
LU 775 805 954 927 869 787 962 1.019 949 908
HU 20.777 20.977 20.634 19.174 17.863 16.308 15.827 15.174 15.691 15.847
MT 848 894 942 764 636 577 348 - - -
NL 27.007 24.527 25.819 23.708 19.378 10.778 5.134 4.968 9.522 13.358
AT 40.896 39.884 41.096 39.173 37.925 35.348 35.129 40.831 38.502 37.957
PL 48.100 46.876 49.536 49.054 44.195 38.832 40.069 37.046 35.847 34.970
PT 37.066 35.680 35.311 33.613 35.484 35.426 32.541 29.867 30.339 30.604
RO 19.819 21.905 24.661 29.307 28.612 25.995 26.647 26.928 24.827 25.355
SI 10.509 11.620 11.640 9.165 8.717 7.659 7.257 6.857 6.568 6.168
SK 7.903 7.988 8.483 8.416 8.415 8.119 5.378 5.007 4.729 5.064
FI 7.020 6.740 6.657 6.881 6.414 6.072 6.408 5.725 5.334 5.324
SE 18.094 18.213 18.548 18.462 18.027 16.627 16.274 16.636 14.942 13.091
UK 203.712 194.789 188.105 176.814 169.805 160.080 157.068 151.346 144.480 152.407
EU 1.342.193 1.320.835 1.319.969 1.255.405 1.204.720 1.130.398 1.123.291 1.080.404 1.055.332 1.079.720
Yearly Change
-1,6% -0,1% -4,9% -4,0% -6,2% -0,6% -3,8% -2,3% 2,3%
IS 671 886 1.131 1.071 878 876 837 732 806 805
LI 435 448 420 402 358 366 327 405 468 0
NO 7.884 7.672 7.973 7.479 6.726 6.229 5.798 5.783 4.957 4.796
CH 21.333 21.151 21.550 20.400 20.171 19.296 18.678 17.847 17.216 17.574
Source: CARE (EU road accidents database) or national publications Last update: May 2016
Annual Accident Report 2016
- 8 -
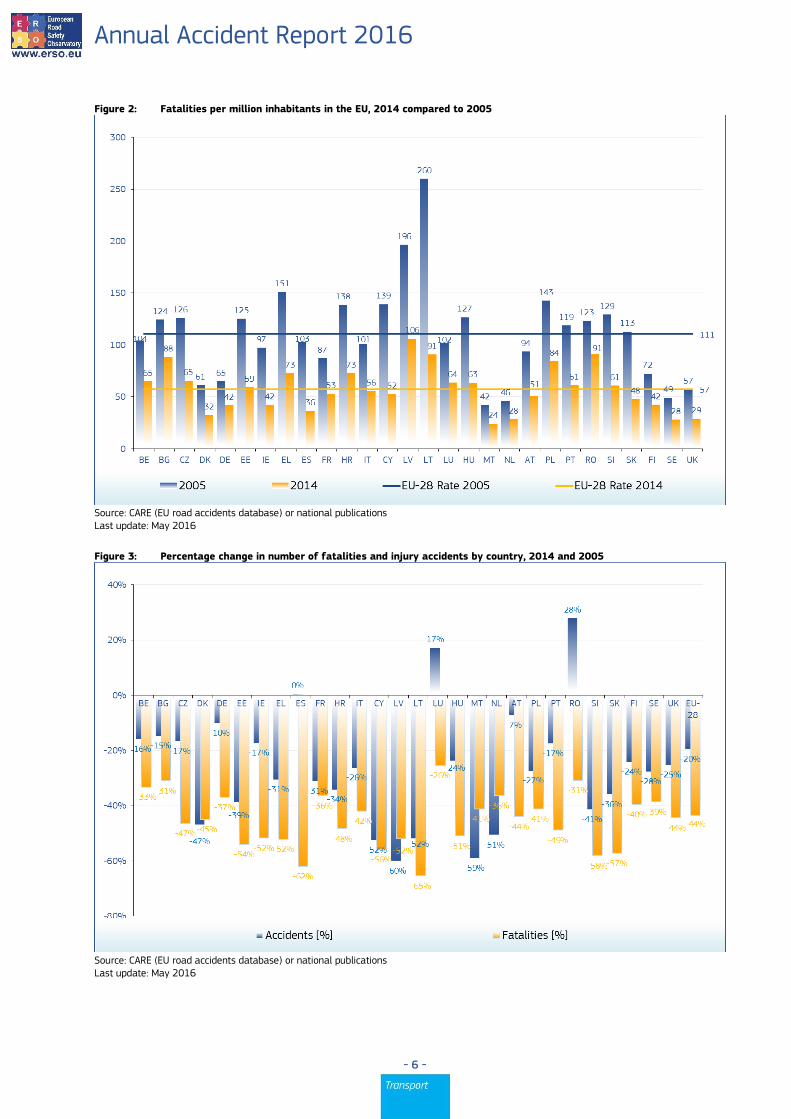
Figure 4: Annual number of injury accidents by country (part 1), 2005-2014
Source: CARE (EU road accidents database) or national publications Last update: May 2016
Figure 5: Annual number of injury accidents by country (part 2), 2005-2014
Source: CARE (EU road accidents database) or national publications Last update: May 2016

Annual Accident Report 2016
- 9 -
Figure 6: Annual number of injury accidents by country (part 3), 2005-2014
Source: CARE (EU road accidents database) or national publications Last update: May 2016
Figure 7: Annual number of injury accidents by country (part 4), 2005-2014
Source: CARE (EU road accidents database) or national publications Last update: May 2016

Annual Accident Report 2016
- 10 -
Table 2: Annual number of fatalities by country, 2005-2014
2005 2006 2007 2008 2009 2010 2011 2012 2013 2014
BE 1.089 1.069 1.071 944 944 840 862 770 723 727
BG 957 1.043 1.006 1.061 901 776 657 601 601 660
CZ 1.286 1.063 1.221 1.076 901 802 772 742 655 688
DK 331 306 406 406 303 255 220 167 191 182
DE 5.361 5.091 4.949 4.477 4.152 3.648 4.009 3.600 3.339 3.377
EE 170 204 196 132 98 79 101 87 81 78
IE 400 365 338 280 238 212 186 162 190 193
EL 1.658 1.657 1.612 1.555 1.456 1.258 1.141 988 879 793
ES 4.442 4.104 3.823 3.100 2.714 2.479 2.060 1.903 1.680 1.688
FR 5.318 4.709 4.620 4.275 4.273 3.992 3.963 3.653 3.268 3.384
HR 597 614 619 664 548 426 418 390 368 308
IT 5.818 5.669 5.131 4.725 4.237 4.114 3.860 3.753 3.401 3.381
CY 102 86 89 82 71 60 71 51 44 45
LV 442 407 419 316 254 218 179 177 179 212
LT 773 760 740 499 370 299 296 302 256 267
LU 47 43 46 35 48 32 33 34 45 35
HU 1.278 1.303 1.232 996 822 740 638 606 591 626
MT 17 11 14 15 21 15 21 9 18 10
NL 750 730 709 677 644 537 546 562 476 477
AT 768 730 691 679 633 552 523 531 455 430
PL 5.444 5.243 5.583 5.437 4.572 3.908 4.189 3.571 3.357 3.202
PT 1.247 969 974 885 840 937 891 718 637 638
RO 2.629 2.587 2.800 3.061 2.796 2.377 2.018 2.042 1.861 1.818
SI 258 262 293 214 171 138 141 130 125 108
SK 606 614 667 622 380 353 328 352 251 259
FI 379 336 380 344 279 272 292 255 258 229
SE 440 445 471 397 358 266 319 285 260 270
UK 3.336 3.298 3.059 2.645 2.337 1.905 1.960 1.802 1.770 1.854
EU 45.943 43.718 43.159 39.599 35.361 31.490 30.694 28.243 25.959 25.939
Yearly Change
-4,8% -1,3% -8,2% -10,7% -10,9% -2,5% -8,0% -8,1% -0,1%
IS 19 31 15 12 17 8 12 9 15 4
LI 2 0 0 1 1 0 2 1 2 -
NO 224 242 233 255 212 208 168 145 187 147
CH 409 370 384 357 349 327 320 339 269 243
Source: CARE (EU road accidents database) or national publications Last update: May 2016
Annual Accident Report 2016
- 11 -
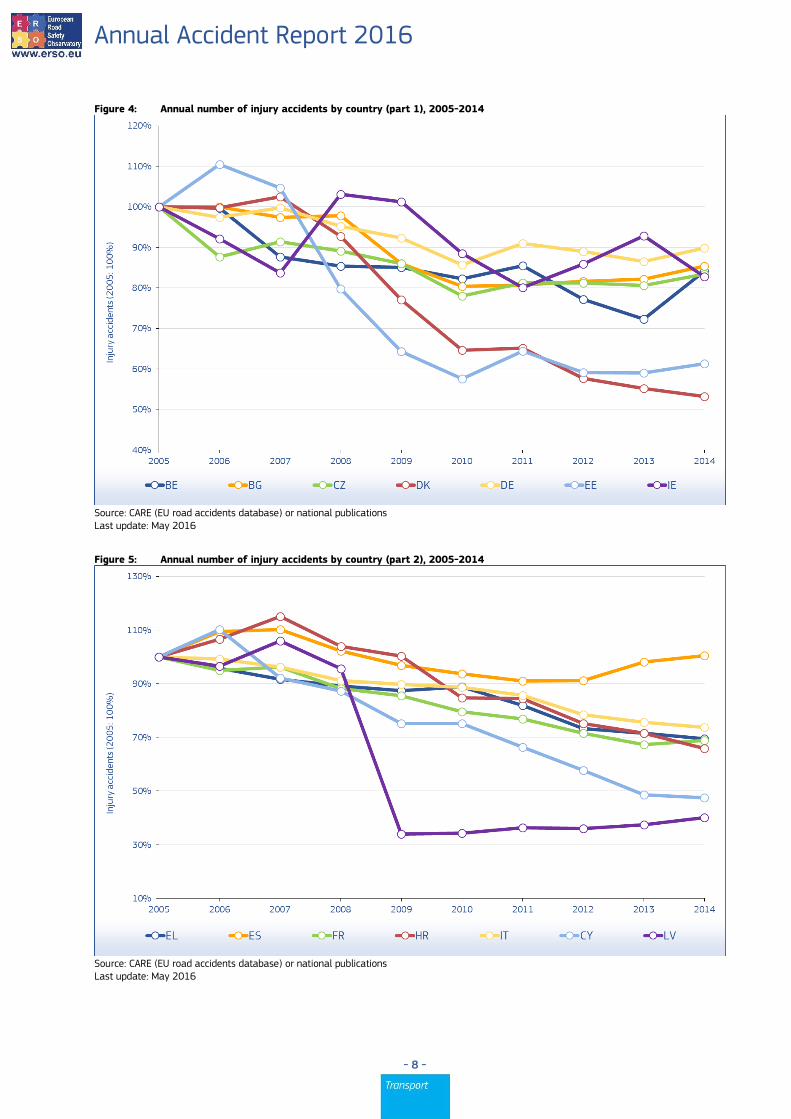
Figure 8: Annual number of fatalities by country (part 1), 2005-2014
Source: CARE (EU road accidents database) or national publications Last update: May 2016
Figure 9: Annual number of fatalities by country (part 2), 2005-2014
Source: CARE (EU road accidents database) or national publications Last update: May 2016

Annual Accident Report 2016
- 12 -
Figure 10: Annual number of fatalities by country (part 3), 2005-2014
Source: CARE (EU road accidents database) or national publications Last update: May 2016
Figure 11: Annual number of fatalities by country (part 4), 2005-2014
Source: CARE (EU road accidents database) or national publications Last update: May 2016

Annual Accident Report 2016
- 13 -
Table 3: Annual number of fatal accidents by country, 2005-2014
2005 2006 2007 2008 2009 2010 2011 2012 2013 2014
BE 997 1.001 1.006 869 884 786 799 720 676 685
BG - - - 937 748 - - - - -
CZ 1.150 957 1.111 983 846 742 713 687 606 623
DK 305 284 366 378 271 231 208 156 173 168
DE 4.984 4.717 4.609 4.117 3.867 3.387 3.724 3.375 3.131 3.187
EE 151 183 174 114 83 70 93 82 74 72
IE 361 321 309 254 220 185 172 152 179 -
EL 1.482 1.501 1.442 1.411 1.296 1.142 1.051 908 814 739
ES 3.377 3.119 2.957 2.384 2.117 1.953 1.816 1.709 1.488 1.512
FR 4.857 4.326 4.265 3.933 3.956 3.706 3.647 3.386 3.020 3.146
HR - - 548 585 493 402 385 355 328 284
IT 5.271 5.178 4.718 4.358 3.973 3.871 3.616 3.515 3.161 3.175
CY 94 81 88 79 64 56 67 51 41 44
LV 393 366 376 285 227 198 164 161 169 182
LT - - - - - - - - 230 243
LU 42 41 43 34 44 29 30 34 41 31
HU 1.139 1.173 1.107 891 752 649 563 541 540 573
MT 12 11 12 9 11 13 - - - -
NL 708 678 669 630 597 500 520 532 456 455
AT 712 664 644 629 576 515 492 501 435 411
PL 4.878 4.663 5.028 4.862 4.144 3.504 3.775 3.246 3.062 2.954
PT 988 786 765 721 673 857 826 667 585 603
RO 2.293 2.274 2.462 2.655 2.464 2.103 1.818 1.833 1.657 1.621
SI 230 233 263 200 154 127 129 122 116 -
SK 528 547 599 555 336 345 - - 262 -
FI 343 324 349 321 255 241 273 235 244 208
SE 406 404 426 355 336 249 292 258 247 254
UK 3.040 3.036 2.819 2.439 2.161 1.782 1.854 1.682 1.663 1.732
EU 40.456 38.583 38.322 35.218 31.778 28.621 28.363 26.161 24.159 24.220
Yearly Change
-4,6% -0,7% -8,1% -9,8% -9,9% -0,9% -7,8% -7,7% 0,3%
IS 16 28 15 12 15 7 12 9 14 3
LI - - - - - - - - - -
NO 202 226 209 237 186 190 158 139 170 135
CH 373 340 361 336 335 313 312 301 257 229
Source: CARE (EU road accidents database) or national publications Last update: May 2016
Annual Accident Report 2016
- 14 -
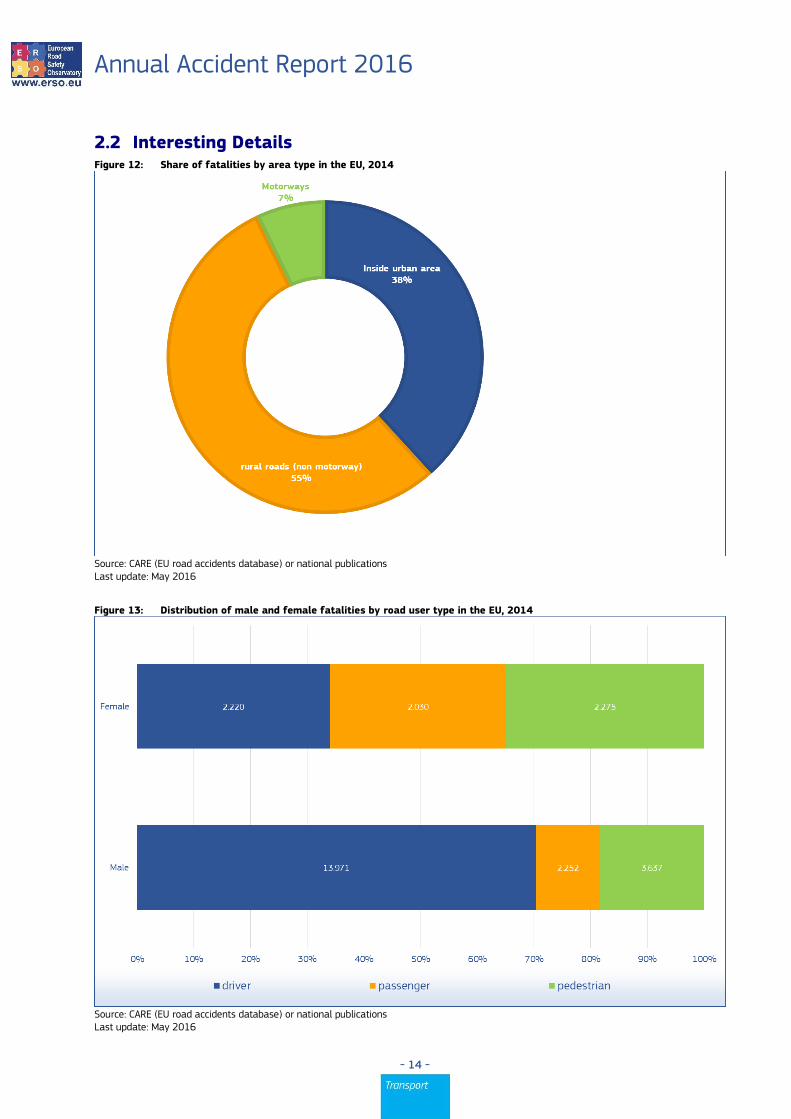
2.2 Interesting Details Figure 12: Share of fatalities by area type in the EU, 2014
Source: CARE (EU road accidents database) or national publications Last update: May 2016
Figure 13: Distribution of male and female fatalities by road user type in the EU, 2014
Source: CARE (EU road accidents database) or national publications Last update: May 2016

Annual Accident Report 2016
- 15 -
Figure 14: Distribution of fatalities by mode of transport in the EU, 2014
Source: CARE (EU road accidents database) or national publications Last update: May 2016
Annual Accident Report 2016
- 16 -
3 Time Series – last 10 years in detail
3.1 Time series related to mode of transport
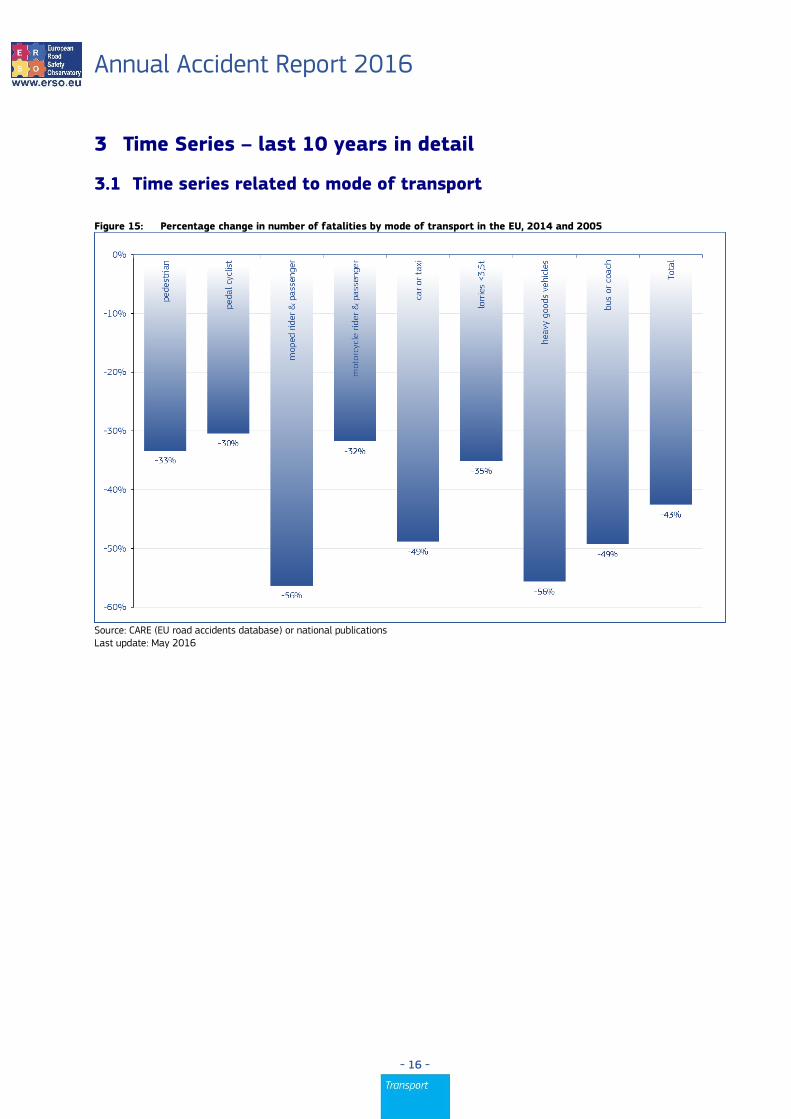
Figure 15: Percentage change in number of fatalities by mode of transport in the EU, 2014 and 2005
Source: CARE (EU road accidents database) or national publications Last update: May 2016

Annual Accident Report 2016
- 17 -
Table 4: Annual number of pedestrian fatalities by country, 2005-2014
2005 2006 2007 2008 2009 2010 2011 2012 2013 2014
BE 108 122 104 99 101 106 113 104 99 106
BG - - - 278 198 - - - - -
CZ 298 202 232 238 176 168 176 163 162 130
DK 44 60 68 58 52 44 33 31 34 22
DE 686 711 695 653 591 476 614 527 561 527
EE 50 64 38 41 23 14 26 29 23 26
IE 72 72 81 49 40 44 47 29 31 -
EL 234 267 255 248 202 179 223 170 151 125
ES 680 614 591 502 470 471 380 370 371 336
FR 635 535 561 548 496 485 519 489 465 499
HR 0 0 124 136 103 105 71 72 69 73
IT 786 758 627 646 667 621 589 576 551 578
CY 23 19 17 16 9 13 13 10 8 10
LV 174 153 158 105 82 79 60 62 70 71
LT - - - - - - - - 96 109
LU 2 10 7 6 12 1 6 6 5 3
HU 289 296 288 251 186 192 124 156 147 152
MT 6 4 3 1 - - - - - -
NL 83 66 86 56 63 62 65 64 51 50
AT 97 110 108 102 101 98 87 81 82 71
PL 1.756 1.802 1.951 1.882 1.467 1.236 1.408 1.157 1.140 1.116
PT 214 156 156 155 148 195 199 159 144 145
RO 978 1.034 1.113 1.067 1.015 868 747 728 726 697
SI 37 36 32 39 24 26 21 19 20 -
SK 174 214 217 204 113 126 - - 81 -
FI 45 49 48 53 30 35 41 29 34 36
SE 50 55 58 45 44 31 53 50 42 52
UK 699 697 663 591 524 415 466 429 405 464
EU 8.594 8.480 8.655 8.165 7.034 6.385 6.502 5.886 5.767 5.729
Yearly Change
-1,3% 2,1% -5,7% -13,9% -9,2% 1,8% -9,5% -2,0% -0,7%
IS 1 4 1 0 2 2 4 2 1 0
LI - - - - - - - - - -
NO 32 36 23 31 26 24 16 22 18 18
CH 69 76 79 59 60 75 69 75 69 43
Source: CARE (EU road accidents database) or national publications Last update: May 2016

Annual Accident Report 2016
- 18 -
Table 5: Annual number of pedal cyclist rider and passenger fatalities by country, 2005-2014
2005 2006 2007 2008 2009 2010 2011 2012 2013 2014
BE 71 92 90 86 89 70 70 69 73 76
BG - - - 35 29 - - - - -
CZ 115 110 116 93 84 80 63 78 74 68
DK 41 31 54 54 25 26 30 22 33 30
DE 575 486 425 456 462 381 399 406 354 396
EE 7 13 13 9 7 0 0 0 0 0
IE 10 9 15 13 7 5 9 8 5 -
EL 18 21 16 22 15 23 13 21 15 19
ES 82 72 90 59 57 67 48 74 70 75
FR 180 181 142 148 162 147 141 164 147 159
HR - - 28 47 29 28 28 21 23 19
IT 335 311 352 288 295 265 282 292 251 273
CY 1 2 3 6 2 2 2 1 2 1
LV 31 33 18 15 26 13 15 18 13 16
LT - - - - - - - - 18 19
LU 1 0 0 0 2 1 2 0 0 0
HU 152 153 158 109 103 92 85 84 68 98
MT 0 0 0 0 0 0 - - - -
NL 151 179 147 145 138 119 144 145 112 118
AT 47 48 37 62 39 32 42 52 52 45
PL 603 509 498 433 371 280 314 300 306 286
PT 48 40 34 42 29 33 45 32 29 35
RO 206 198 179 179 157 182 140 154 161 151
SI 19 15 17 17 18 17 16 12 16 -
SK 56 52 61 46 22 27 - - 21 -
FI 43 29 22 18 20 26 19 19 20 27
SE 38 26 33 30 20 21 21 28 14 33
UK 152 147 138 117 104 111 109 120 113 116
EU 3.062 2.838 2.739 2.547 2.329 2.095 2.111 2.188 2.019 2.131
Yearly Change
-7,3% -3,5% -7,0% -8,6% -10,0% 0,8% 3,6% -7,7% 5,5%
IS 0 0 0 0 0 0 0 0 0 0
LI - - - - - - - - - -
NO 7 8 7 10 9 5 12 12 10 12
CH 37 35 30 27 54 34 39 36 21 34
Source: CARE (EU road accidents database) or national publications Last update: May 2016

Annual Accident Report 2016
- 19 -
Table 6: Annual number of moped rider and passenger fatalities by country, 2005-2014
2005 2006 2007 2008 2009 2010 2011 2012 2013 2014
BE 30 36 26 32 25 22 20 15 13 17
BG - - - 9 5 - - - - -
CZ 8 3 3 2 9 7 7 7 6 8
DK 29 24 48 30 15 11 14 14 11 13
DE 107 107 100 110 99 74 70 93 73 87
EE 2 2 4 6 3 0 1 1 0 0
IE - - - - - - - - - -
EL 58 57 43 41 28 36 34 35 25 20
ES 312 303 233 181 156 99 73 67 56 54
FR 356 317 324 291 299 248 220 179 159 165
HR - - 20 27 15 15 10 16 14 11
IT 385 346 358 292 212 206 165 127 125 112
CY 9 5 8 8 4 3 3 3 0 4
LV 5 6 4 4 1 4 5 3 3 6
LT - - - - - - - - 4 1
LU 0 0 1 0 0 0 0 0 0 0
HU 40 42 31 26 23 19 31 25 24 17
MT - - - - - - - - - -
NL 56 63 60 51 47 32 36 40 41 32
AT 41 39 24 25 30 18 18 19 15 16
PL 53 57 59 87 68 83 87 82 62 71
PT 106 97 71 71 58 77 71 57 51 43
RO 20 45 81 150 122 114 87 99 39 30
SI 5 12 12 8 3 7 2 3 4 -
SK - - - - - - - - 10 -
FI 4 13 11 13 11 9 10 7 5 3
SE 8 15 14 11 11 8 11 8 3 8
UK 23 29 18 21 16 10 10 12 4 6
EU 1.700 1.661 1.575 1.510 1.274 1.121 1.004 931 752 743
Yearly Change
-2,3% -5,1% -4,2% -15,6% -12,0% -10,4% -7,3% -19,2% -1,2%
IS 0 0 0 0 0 0 1 0 0 0
LI - - - - - - - - - -
NO 4 3 7 5 2 0 4 4 3 2
CH 6 11 7 9 8 4 4 3 8 1
Source: CARE (EU road accidents database) or national publications Last update: May 2016
Annual Accident Report 2016
- 20 -
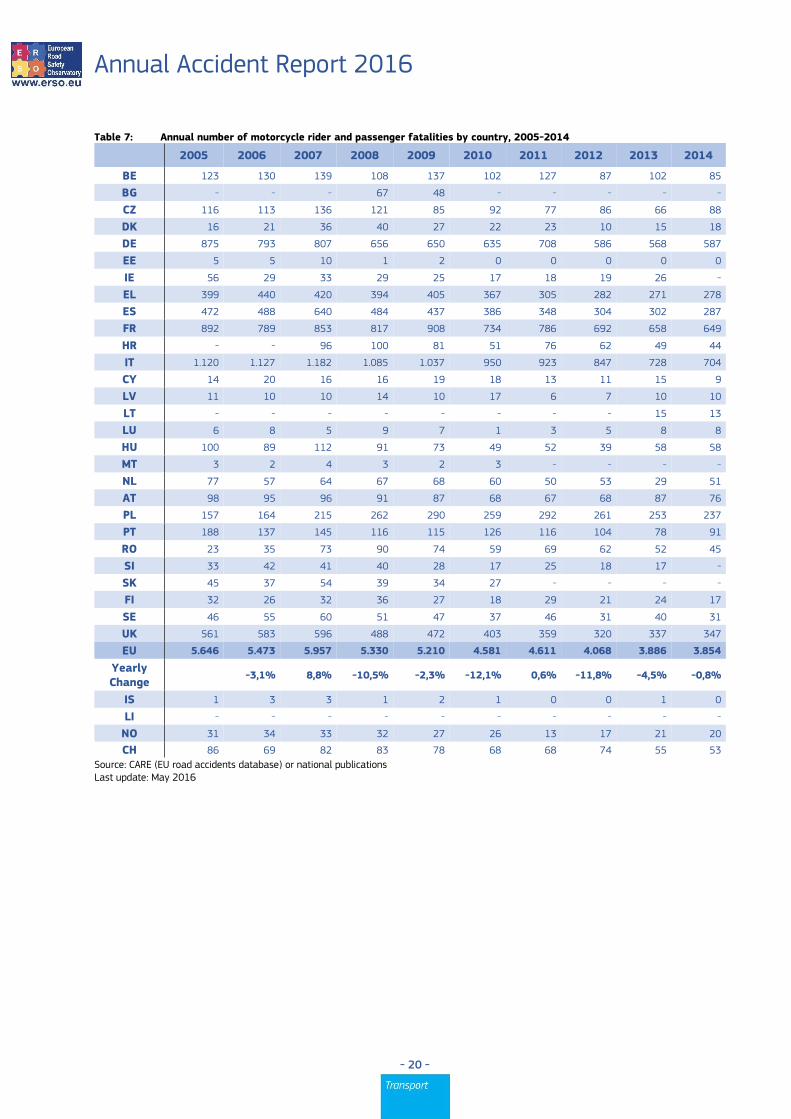
Table 7: Annual number of motorcycle rider and passenger fatalities by country, 2005-2014
2005 2006 2007 2008 2009 2010 2011 2012 2013 2014
BE 123 130 139 108 137 102 127 87 102 85
BG - - - 67 48 - - - - -
CZ 116 113 136 121 85 92 77 86 66 88
DK 16 21 36 40 27 22 23 10 15 18
DE 875 793 807 656 650 635 708 586 568 587
EE 5 5 10 1 2 0 0 0 0 0
IE 56 29 33 29 25 17 18 19 26 -
EL 399 440 420 394 405 367 305 282 271 278
ES 472 488 640 484 437 386 348 304 302 287
FR 892 789 853 817 908 734 786 692 658 649
HR - - 96 100 81 51 76 62 49 44
IT 1.120 1.127 1.182 1.085 1.037 950 923 847 728 704
CY 14 20 16 16 19 18 13 11 15 9
LV 11 10 10 14 10 17 6 7 10 10
LT - - - - - - - - 15 13
LU 6 8 5 9 7 1 3 5 8 8
HU 100 89 112 91 73 49 52 39 58 58
MT 3 2 4 3 2 3 - - - -
NL 77 57 64 67 68 60 50 53 29 51
AT 98 95 96 91 87 68 67 68 87 76
PL 157 164 215 262 290 259 292 261 253 237
PT 188 137 145 116 115 126 116 104 78 91
RO 23 35 73 90 74 59 69 62 52 45
SI 33 42 41 40 28 17 25 18 17 -
SK 45 37 54 39 34 27 - - - -
FI 32 26 32 36 27 18 29 21 24 17
SE 46 55 60 51 47 37 46 31 40 31
UK 561 583 596 488 472 403 359 320 337 347
EU 5.646 5.473 5.957 5.330 5.210 4.581 4.611 4.068 3.886 3.854
Yearly Change
-3,1% 8,8% -10,5% -2,3% -12,1% 0,6% -11,8% -4,5% -0,8%
IS 1 3 3 1 2 1 0 0 1 0
LI - - - - - - - - - -
NO 31 34 33 32 27 26 13 17 21 20
CH 86 69 82 83 78 68 68 74 55 53
Source: CARE (EU road accidents database) or national publications Last update: May 2016

Annual Accident Report 2016
- 21 -
Figure 16: Annual number of fatalities by mode of transport (drivers and passengers, vulnerable modes) in the EU, 2005-2014
Source: CARE (EU road accidents database) or national publications Last update: May 2016

Annual Accident Report 2016
- 22 -
Table 8: Annual number of car and taxi driver and passenger fatalities by country, 2005-2014
2005 2006 2007 2008 2009 2010 2011 2012 2013 2014
BE 624 589 550 479 464 443 457 383 340 379
BG - - - 623 570 - - - - -
CZ 679 567 661 573 497 403 404 368 308 347
DK 169 138 168 196 164 135 106 81 79 89
DE 2.833 2.683 2.625 2.368 2.110 1.840 1.986 1.791 1.588 1.579
EE 88 106 122 69 54 44 56 42 41 33
IE 222 226 171 160 146 129 95 89 107 -
EL 816 722 771 708 680 545 474 383 347 289
ES 2.389 2.096 1.824 1.494 1.260 1.194 977 871 716 722
FR 3.065 2.627 2.466 2.205 2.162 2.117 2.062 1.881 1.615 1.664
HR - - 309 303 284 205 215 186 195 141
IT 2.830 2.781 2.320 2.115 1.793 1.832 1.673 1.695 1.491 1.497
CY 45 32 37 26 24 19 31 18 16 15
LV 201 182 203 167 116 91 78 72 71 91
LT - - - - - - - - 108 118
LU 38 23 27 20 26 27 21 22 30 24
HU 620 630 555 448 386 330 268 253 254 256
MT 3 5 4 4 12 9 - - - -
NL 337 323 299 299 288 219 209 218 180 171
AT 432 384 378 367 325 291 289 282 194 191
PL 2.526 2.392 2.582 2.540 2.179 1.853 1.897 1.615 1.448 1.346
PT 495 375 417 358 301 367 331 255 214 223
RO 1.069 992 1.096 1.324 1.168 973 780 798 721 724
SI 107 96 126 82 59 44 46 53 40 -
SK 294 282 293 292 182 171 - - 148 -
FI 231 203 241 202 165 159 172 147 152 121
SE 273 261 279 234 219 151 159 142 144 122
UK 1.744 1.687 1.489 1.312 1.123 859 911 829 815 835
EU 23.170 21.442 20.744 19.076 16.865 15.128 14.532 13.309 11.941 11.851
Yearly Change
-7,5% -3,3% -8,0% -11,6% -10,3% -3,9% -8,4% -10,3% -0,8%
IS 15 20 11 10 9 4 7 6 11 3
LI - - - - - - - - - -
NO 130 141 138 151 127 127 102 73 105 72
CH 178 156 162 156 136 129 119 104 103 97
Source: CARE (EU road accidents database) or national publications Last update: May 2016

Annual Accident Report 2016
- 23 -
Table 9: Annual number of heavy goods vehicles >3,5t fatalities by country, 2005-2014
2005 2006 2007 2008 2009 2010 2011 2012 2013 2014
BE 16 16 25 25 20 13 15 17 13 14
BG - - - 28 33 - - - - -
CZ 26 22 21 18 20 27 23 25 19 23
DK 2 2 4 2 3 2 1 0 1 1
DE 97 113 131 91 79 87 88 154 148 72
EE 7 6 3 3 6 1 0 1 2 3
IE 4 2 7 4 4 2 0 2 2 -
EL 15 23 14 19 7 14 10 11 7 12
ES 141 132 90 85 69 71 73 50 43 48
FR 90 87 68 76 54 65 67 56 57 56
HR - - 17 21 17 4 2 2 2 4
IT 254 251 203 219 173 53 50 46 43 46
CY 0 0 0 0 0 0 - 1 2 0
LV 6 13 12 3 6 0 2 4 3 5
LT - - - - - - - - 6 4
LU 0 2 4 0 0 1 0 0 2 0
HU 15 28 15 22 12 11 10 15 13 14
MT 0 0 0 1 0 0 - - - -
NL 11 9 7 10 4 4 2 7 7 6
AT 11 15 11 3 9 7 6 4 6 9
PL 217 227 198 175 136 142 138 104 90 92
PT 31 18 25 17 29 12 14 16 18 8
RO 40 26 25 26 14 13 25 21 18 17
SI 3 2 4 0 0 1 1 0 1 -
SK 18 20 22 18 17 19 - - 6 -
FI 6 7 7 5 6 9 5 10 6 4
SE 6 7 6 5 3 5 4 2 5 5
UK 59 41 54 24 15 30 29 30 22 14
EU 1.126 1.121 1.008 906 741 632 624 623 575 499
Yearly Change
-0,5% -10,1% -10,1% -18,2% -14,8% -1,3% -0,1% -7,7% -13,2%
IS 0 0 0 1 1 1 0 0 0 0
LI - - - - - - - - - -
NO 11 8 5 9 9 8 8 2 11 7
CH 4 1 4 4 2 2 1 1 3 2
Source: CARE (EU road accidents database) or national publications Last update: May 2016

Annual Accident Report 2016
- 24 -
Table 10: Annual number of lorries <3,5t fatalities by country, 2005-2014
2005 2006 2007 2008 2009 2010 2011 2012 2013 2014
BE 44 34 49 40 43 35 29 29 34 27
BG - - - - - - - - - -
CZ 36 31 45 27 25 18 15 7 15 16
DK 23 24 24 22 16 14 10 6 17 9
DE 116 122 84 92 85 75 86 - - 71
EE 0 0 0 0 0 - - - - -
IE 18 16 25 16 13 8 17 10 12 -
EL 72 82 56 62 75 62 51 51 38 35
ES 244 262 234 189 170 116 99 98 69 111
FR 56 120 131 134 144 146 134 145 132 142
HR - - - - - 5 10 15 2 5
IT - - - - - 141 117 118 102 109
CY 9 4 4 8 12 5 4 4 1 4
LV 2 - - 2 5 0 2 4 5 6
LT - - - - - - - - 1 2
LU - - - - - - 1 1 0 0
HU 44 36 47 33 28 24 30 20 17 25
MT 5 0 0 0 0 0 - - - -
NL 20 21 35 31 24 22 18 16 15 7
AT 24 16 15 19 13 10 5 15 15 10
PL - - - - - - - - - -
PT 120 98 70 88 68 88 76 48 61 49
RO 116 124 105 114 87 73 64 72 61 67
SI 8 2 3 3 6 2 1 5 5 -
SK 9 3 2 2 1 1 - - 10 -
FI 12 3 12 9 10 9 9 11 9 10
SE 11 9 9 11 7 7 10 16 5 8
UK 57 55 63 47 40 37 35 34 39 34
EU 1.194 1.212 1.162 1.097 1.021 900 825 822 736 774
Yearly Change
1,6% -4,1% -5,7% -6,9% -11,8% -8,4% -0,4% -10,5% 5,3%
IS 1 2 0 0 1 0 0 1 1 1
LI - - - - - - - - - -
NO 6 11 10 7 5 9 5 9 9 1
CH 6 8 4 5 3 6 8 6 3 3
Source: CARE (EU road accidents database) or national publications Last update: May 2016

Annual Accident Report 2016
- 25 -
Table 11: Annual number of buses or coaches fatalities by country, 2005-2014
2005 2006 2007 2008 2009 2010 2011 2012 2013 2014
BE 0 0 4 2 1 1 2 9 5 4
BG - - - 5 5 - - - - -
CZ 0 10 2 0 3 1 4 2 2 3
DK 3 3 3 0 0 0 0 1 0 0
DE 9 12 24 10 11 32 10 3 11 13
EE 1 1 0 0 2 4 1 2 2 8
IE 5 3 1 0 1 1 0 1 0 -
EL 8 4 0 4 0 2 4 8 2 2
ES 26 37 15 28 21 5 4 3 11 26
FR 15 8 35 20 5 4 0 7 7 9
HR - - 6 17 0 0 0 8 1 0
IT 12 24 18 11 2 9 3 7 48 5
CY 0 2 0 0 0 0 0 0 0 0
LV 5 1 3 1 2 5 2 3 1 1
LT - - - - - - - - 1 0
LU 0 0 0 0 0 0 0 0 0 0
HU 4 14 14 3 3 12 30 3 6 1
MT 0 0 0 0 0 0 - - - -
NL 0 1 1 3 0 1 0 1 0 1
AT 2 8 4 2 2 8 0 2 0 1
PL 52 15 17 11 19 14 12 18 18 12
PT 2 1 15 1 6 0 1 2 11 2
RO 42 19 26 6 36 10 9 10 8 9
SI 1 0 0 0 1 0 0 0 0 -
SK 8 4 8 4 12 0 - - 2 -
FI 2 2 0 0 1 0 2 1 1 0
SE 1 10 6 1 0 2 2 2 1 2
UK 21 28 14 14 16 14 12 12 12 11
EU 231 219 222 144 149 131 104 113 155 117
Yearly Change
-5,1% 1,3% -35,0% 3,7% -12,6% -20,7% 9,3% 37,2% -24,7%
IS 0 1 0 0 0 0 0 0 0 0
LI - - - - - - - - - -
NO 1 0 5 1 1 4 4 2 5 7
CH 13 2 0 4 0 4 3 32 0 2
Source: CARE (EU road accidents database) or national publications Last update: May 2016
Annual Accident Report 2016
- 26 -
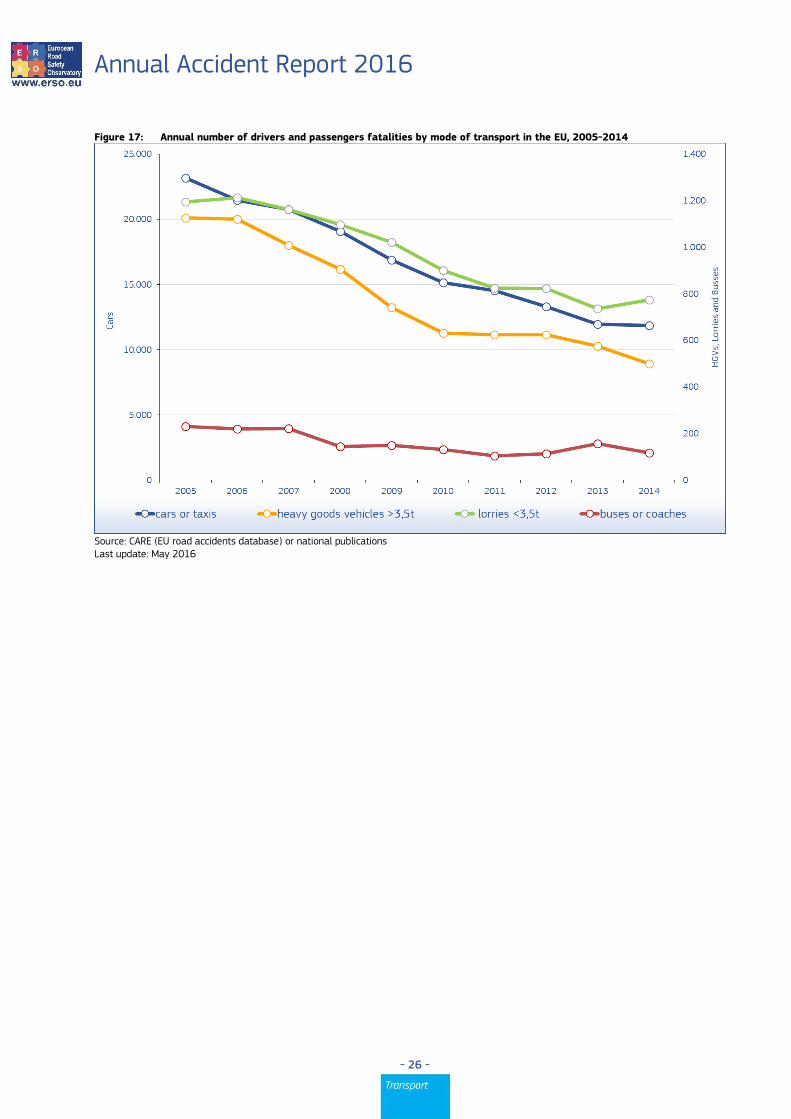
Figure 17: Annual number of drivers and passengers fatalities by mode of transport in the EU, 2005-2014
Source: CARE (EU road accidents database) or national publications Last update: May 2016
Annual Accident Report 2016
- 27 -
3.2 Time series related to age and gender
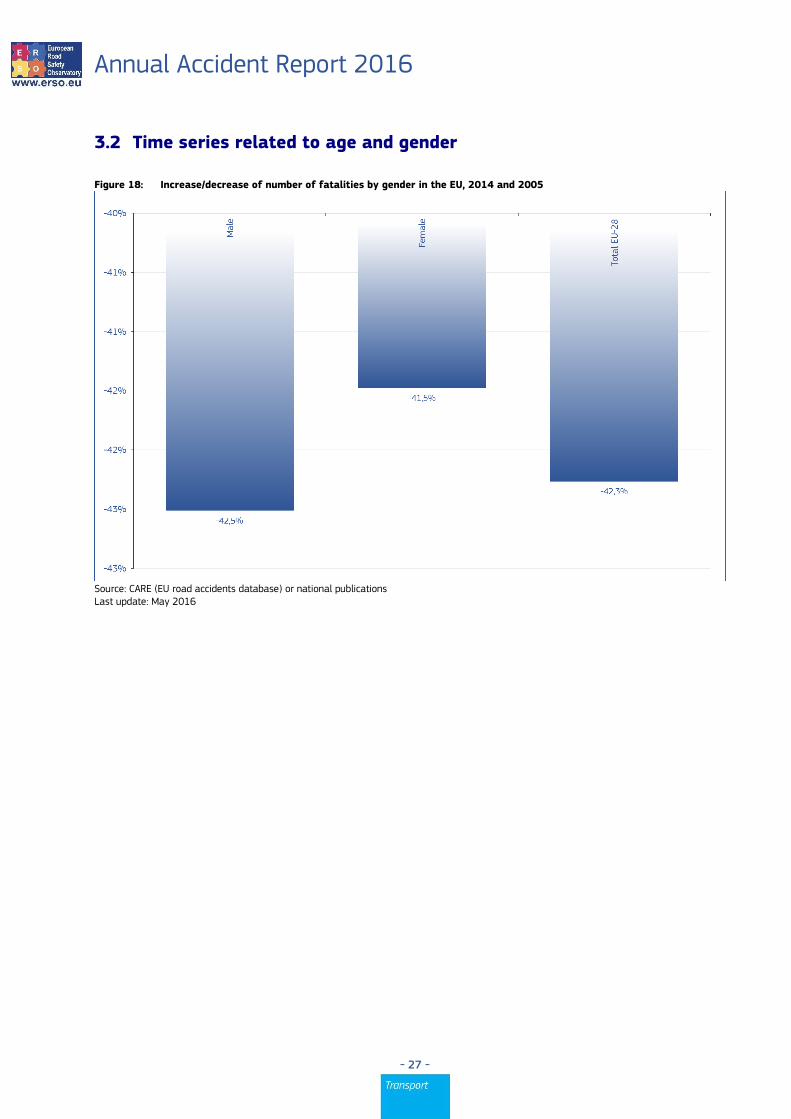
Figure 18: Increase/decrease of number of fatalities by gender in the EU, 2014 and 2005
Source: CARE (EU road accidents database) or national publications Last update: May 2016

Annual Accident Report 2016
- 28 -
Table 12: Annual number of fatalities by age group by country, 2005-2006
2005 2006
0-14 15-17 18-24 25-49 50-64 65+ 0-14 15-17 18-24 25-49 50-64 65+
BE 37 31 196 473 160 186 32 21 195 482 141 193
BG - - - - - - - - - - - -
CZ 41 31 223 520 264 202 32 18 183 432 215 173
DK 13 20 52 124 52 70 13 19 65 91 46 72
DE 159 224 1.076 1.930 804 1.162 136 173 1.011 1.824 791 1.154
EE 12 5 26 73 32 21 6 5 35 73 53 32
IE 9 26 110 139 47 56 15 18 95 133 36 66
EL 44 38 326 687 219 322 36 40 305 725 197 327
ES 120 138 733 1.967 688 719 109 131 601 1.952 591 671
FR 130 218 1.206 2.032 698 1.014 120 183 1.037 1.739 644 921
HR - - - - - - - - - - - -
IT 131 211 919 2.284 783 1.199 110 186 825 2.290 802 1.220
CY 5 4 32 37 12 12 1 3 25 34 5 18
LV 10 12 63 187 76 65 14 11 59 165 74 61
LT - - - - - - - - - - - -
LU 4 1 9 21 4 8 0 0 8 24 5 3
HU 34 26 159 557 286 206 42 24 134 565 307 216
MT 3 3 5 3 0 3 0 1 3 5 1 1
NL 31 33 122 261 115 188 37 33 112 233 105 209
AT 25 48 140 296 108 151 23 35 129 257 130 156
PL 167 148 933 2.100 1.030 931 151 150 895 1.959 1.054 888
PT 31 35 221 510 215 222 22 10 125 404 178 215
RO 152 56 294 1.061 573 491 145 55 293 1.035 555 504
SI 10 7 44 116 40 41 9 10 54 114 42 33
SK 19 18 83 261 144 77 13 8 100 263 131 95
FI 21 16 53 140 58 91 5 21 67 104 68 71
SE 10 19 67 153 84 104 16 24 75 142 93 95
UK 125 222 700 1.244 420 616 147 207 706 1.234 423 572
EU 1.416 1.645 8.155 17.938 7.233 8.518 1.307 1.441 7.501 17.040 7.007 8.327
Yearly Change
-8,4% -14,1% -8,7% -5,3% -3,2% -2,3%
IS 0 2 6 3 6 2 1 3 7 11 5 4
NO 4 16 46 83 33 42 9 14 39 76 39 65
CH 14 17 77 135 58 108 16 18 62 117 56 101
Source: CARE (EU road accidents database) or national publications Last update: May 2016
Annual Accident Report 2016
- 29 -
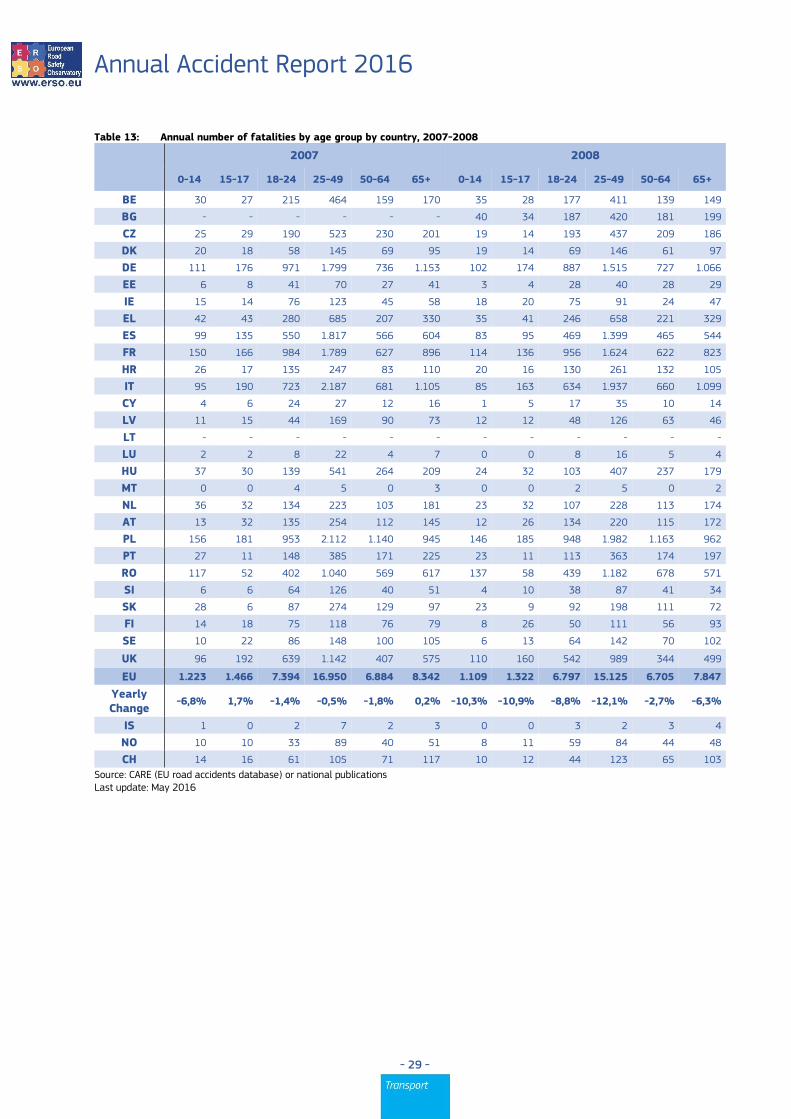
Table 13: Annual number of fatalities by age group by country, 2007-2008
2007 2008
0-14 15-17 18-24 25-49 50-64 65+ 0-14 15-17 18-24 25-49 50-64 65+
BE 30 27 215 464 159 170 35 28 177 411 139 149
BG - - - - - - 40 34 187 420 181 199
CZ 25 29 190 523 230 201 19 14 193 437 209 186
DK 20 18 58 145 69 95 19 14 69 146 61 97
DE 111 176 971 1.799 736 1.153 102 174 887 1.515 727 1.066
EE 6 8 41 70 27 41 3 4 28 40 28 29
IE 15 14 76 123 45 58 18 20 75 91 24 47
EL 42 43 280 685 207 330 35 41 246 658 221 329
ES 99 135 550 1.817 566 604 83 95 469 1.399 465 544
FR 150 166 984 1.789 627 896 114 136 956 1.624 622 823
HR 26 17 135 247 83 110 20 16 130 261 132 105
IT 95 190 723 2.187 681 1.105 85 163 634 1.937 660 1.099
CY 4 6 24 27 12 16 1 5 17 35 10 14
LV 11 15 44 169 90 73 12 12 48 126 63 46
LT - - - - - - - - - - - -
LU 2 2 8 22 4 7 0 0 8 16 5 4
HU 37 30 139 541 264 209 24 32 103 407 237 179
MT 0 0 4 5 0 3 0 0 2 5 0 2
NL 36 32 134 223 103 181 23 32 107 228 113 174
AT 13 32 135 254 112 145 12 26 134 220 115 172
PL 156 181 953 2.112 1.140 945 146 185 948 1.982 1.163 962
PT 27 11 148 385 171 225 23 11 113 363 174 197
RO 117 52 402 1.040 569 617 137 58 439 1.182 678 571
SI 6 6 64 126 40 51 4 10 38 87 41 34
SK 28 6 87 274 129 97 23 9 92 198 111 72
FI 14 18 75 118 76 79 8 26 50 111 56 93
SE 10 22 86 148 100 105 6 13 64 142 70 102
UK 96 192 639 1.142 407 575 110 160 542 989 344 499
EU 1.223 1.466 7.394 16.950 6.884 8.342 1.109 1.322 6.797 15.125 6.705 7.847
Yearly Change
-6,8% 1,7% -1,4% -0,5% -1,8% 0,2% -10,3% -10,9% -8,8% -12,1% -2,7% -6,3%
IS 1 0 2 7 2 3 0 0 3 2 3 4
NO 10 10 33 89 40 51 8 11 59 84 44 48
CH 14 16 61 105 71 117 10 12 44 123 65 103
Source: CARE (EU road accidents database) or national publications Last update: May 2016

Annual Accident Report 2016
- 30 -
Table 14: Annual number of fatalities by age group by country, 2009-2010
2009 2010
0-14 15-17 18-24 25-49 50-64 65+ 0-14 15-17 18-24 25-49 50-64 65+
BE 16 21 147 355 150 163 23 21 171 343 124 153
BG 30 33 157 368 155 158 - - - - - -
CZ 16 13 133 405 166 167 17 17 125 329 142 172
DK 10 17 53 121 41 61 9 8 42 81 48 67
DE 90 133 796 1.351 678 1.104 104 101 690 1.218 624 910
EE 4 2 21 39 13 18 1 2 10 24 25 17
IE 10 9 64 96 31 26 6 7 56 83 26 30
EL 43 37 242 617 211 275 30 39 186 521 190 268
ES 61 70 357 1.273 412 507 79 49 311 1.087 407 527
FR 122 189 901 1.653 612 796 130 161 831 1.513 592 765
HR 24 18 102 187 101 116 12 9 58 170 80 97
IT 71 121 579 1.596 669 1.111 70 121 547 1.573 645 1.064
CY 4 2 19 29 3 14 1 2 12 27 7 11
LV 7 4 31 115 48 35 9 2 35 75 53 36
LT - - - - - - - - - - - -
LU 6 0 10 12 11 9 0 0 10 13 6 3
HU 22 16 81 353 184 166 20 10 73 304 184 137
MT 1 0 2 5 2 5 1 0 4 7 1 0
NL 23 26 126 191 91 187 16 20 90 171 86 154
AT 15 29 99 229 102 159 10 27 102 178 95 140
PL 128 120 833 1.668 970 810 112 122 677 1.419 871 674
PT 23 19 109 331 150 205 18 7 88 378 168 277
RO 125 58 416 1.000 597 593 95 50 307 849 577 494
SI 2 4 30 61 35 39 2 4 19 54 29 30
SK 9 5 53 122 80 51 11 7 59 126 67 48
FI 6 23 51 84 46 69 7 13 48 93 47 64
SE 9 25 60 100 72 92 9 5 47 82 52 71
UK 69 126 467 913 330 432 42 93 362 701 330 377
EU 953 1.125 5.981 13.368 6.017 7.420 871 934 5.158 11.882 5.687 6.796
Yearly Change
-16,3% -17,5% -13,6% -13,1% -11,4% -5,7% -9,4% -20,5% -15,9% -12,5% -5,8% -9,2%
IS 0 1 1 8 4 3 0 0 3 1 2 2
NO 8 17 46 71 33 37 3 7 42 75 39 42
CH 21 5 68 97 68 90 8 12 36 105 65 101
Source: CARE (EU road accidents database) or national publications Last update: May 2016

Annual Accident Report 2016
- 31 -
Table 15: Annual number of fatalities by age group by country, 2011-2012
2011 2012
0-14 15-17 18-24 25-49 50-64 65+ 0-14 15-17 18-24 25-49 50-64 65+
BE 35 14 143 353 127 183 16 18 128 279 151 177
BG - - - - - - - - - - - -
CZ 12 16 129 309 160 141 15 17 96 311 144 157
DK 9 8 35 63 42 63 7 6 31 51 28 44
DE 86 116 737 1.302 723 1.044 73 113 611 1.144 665 994
EE 4 0 15 40 23 19 0 1 17 26 25 18
IE 7 10 39 76 17 37 2 7 35 61 20 36
EL 22 28 163 458 185 260 21 21 143 389 147 248
ES 43 29 234 880 368 486 53 32 175 783 337 506
FR 128 144 813 1.517 602 759 115 131 753 1.345 564 745
HR 14 14 81 174 61 74 8 10 48 150 98 79
IT 61 105 496 1.417 667 1.038 52 85 423 1.400 656 1.068
CY 1 1 14 36 7 12 0 2 10 23 7 9
LV 5 4 20 70 32 43 6 5 16 67 40 34
LT - - - - - - - - - - - -
LU 1 2 8 12 7 3 1 2 6 14 2 9
HU 12 8 73 227 172 146 20 11 42 237 170 121
MT - - - - - - - - - - - -
NL 18 19 86 152 83 188 24 13 76 171 91 187
AT 13 24 76 164 96 150 8 24 84 156 105 154
PL 102 106 718 1.580 950 703 90 87 585 1.327 823 653
PT 19 11 105 303 189 264 14 10 65 274 155 195
RO 83 36 251 723 468 453 90 52 231 740 470 457
SI 6 4 17 62 29 23 3 2 19 46 34 26
SK - - - - - - - - - - - -
FI 8 14 51 92 45 82 7 14 41 84 51 58
SE 10 9 57 96 56 91 7 10 41 107 49 71
UK 52 77 341 746 305 439 56 66 344 631 283 422
EU 800 843 4.963 11.448 5.693 6.959 732 785 4.267 10.396 5.396 6.754
Yearly Change
-8,9% -10,7% -3,9% -3,8% 0,1% 2,3% -9,3% -7,3% -16,3% -10,1% -5,5% -3,0%
IS 2 4 0 2 2 2 0 0 2 2 1 4
NO 7 6 27 57 34 37 4 6 20 60 27 28
CH 10 9 41 80 62 118 31 6 39 92 78 93
Source: CARE (EU road accidents database) or national publications Last update: May 2016

Annual Accident Report 2016
- 32 -
Table 16: Annual number of fatalities by age group by country, 2013-2014
2013 2014
0-14 15-17 18-24 25-49 50-64 65+ 0-14 15-17 18-24 25-49 50-64 65+
BE 18 8 119 318 108 151 10 22 117 255 137 178
BG - - - - - - - - - - - -
CZ 11 10 96 242 136 155 14 11 100 288 142 131
DK 13 6 25 56 38 53 6 3 22 61 32 58
DE 58 89 493 1.065 633 999 71 91 496 1.045 687 987
EE 3 2 8 32 17 19 1 2 13 27 19 16
IE 6 4 36 74 22 46 - - - - - -
EL 17 27 112 319 149 234 10 19 114 300 160 187
ES 46 20 145 643 329 479 37 23 130 648 358 479
FR 97 102 636 1.213 532 688 112 116 582 1.255 547 772
HR 10 10 58 132 83 75 8 5 36 111 67 81
IT 55 69 404 1.171 614 1.011 62 70 369 1.129 645 1.056
CY 1 0 18 12 5 8 0 2 12 16 4 11
LV 7 1 14 75 32 40 7 3 30 80 37 42
LT 7 4 41 95 56 52 15 9 33 97 63 49
LU 2 0 5 19 10 9 1 0 5 18 9 2
HU 7 14 50 227 156 135 11 7 59 229 163 155
MT - - - - - - - - - - - -
NL 8 14 81 126 80 164 19 17 69 136 62 173
AT 10 14 56 148 85 142 8 16 59 130 102 115
PL 91 83 551 1.194 786 647 80 71 499 1.117 735 692
PT 11 8 65 215 142 193 8 11 53 215 144 206
RO 76 40 220 704 397 422 91 37 177 624 468 420
SI 3 2 22 43 28 27 - - - - - -
SK 6 9 45 110 69 76 - - - - - -
FI 6 12 36 79 52 73 10 12 32 78 41 56
SE 4 7 40 77 56 76 7 7 25 78 54 99
UK 41 48 348 642 282 409 50 38 335 662 295 474
EU 645 636 3.885 9.406 5.053 6.541 681 633 3.608 9.134 5.205 6.697
Yearly Change
-13,5% -23,5% -9,8% -10,5% -6,8% -3,3% 5,3% -0,5% -7,7% -3,0% 2,9% 2,3%
IS 2 3 2 4 2 2 0 1 1 1 1 0
NO 4 6 29 60 44 44 4 4 18 48 25 47
CH 12 2 30 68 57 100 9 2 38 65 43 86
Source: CARE (EU road accidents database) or national publications Last update: May 2016

Annual Accident Report 2016
- 33 -
Table 17: Annual number of female fatalities by country, 2005-2014
2005 2006 2007 2008 2009 2010 2011 2012 2013 2014
BE 260 248 215 221 234 203 192 179 173 166
BG - - - 231 201 - - - - -
CZ 298 225 275 259 225 177 187 167 150 164
DK 80 87 105 107 91 85 59 45 65 43
DE 1.445 1.371 1.309 1.229 1.102 997 1.038 950 905 867
EE 42 50 45 34 26 24 27 23 27 27
IE 102 97 85 75 56 46 56 54 46 -
EL 355 290 338 304 250 245 221 182 187 146
ES 958 899 823 676 621 556 465 449 392 398
FR 1.314 1.155 1.118 1.013 1.041 953 939 923 763 843
HR - - - 157 141 102 84 69 84 64
IT 1.243 1.277 1.005 960 926 846 855 738 698 719
CY 19 15 14 17 12 10 13 14 9 13
LV 118 97 100 77 42 26 8 47 39 46
LT - - - - - - - - 61 75
LU 17 10 7 8 13 8 11 8 11 6
HU 308 293 314 237 207 181 169 163 159 167
MT 4 0 1 3 5 5 - - - -
NL 210 212 192 179 175 145 162 146 131 134
AT 195 190 161 170 155 143 138 153 113 115
PL 1.243 1.232 1.333 1.321 1.109 913 938 845 792 771
PT 233 182 188 209 173 203 216 152 135 134
RO 688 661 740 765 694 575 473 500 487 457
SI 71 42 59 36 39 34 28 33 31 -
SK 144 134 156 111 88 92 - - 72 -
FI 96 95 101 79 71 68 81 64 66 62
SE 113 112 127 111 92 67 78 67 65 79
UK 816 806 752 682 597 497 499 429 456 481
EU 10.821 10.230 10.012 9.331 8.447 7.463 7.296 6.739 6.323 6.332
Yearly Change
-5,5% -2,1% -6,8% -9,5% -11,6% -2,2% -7,6% -6,2% 0,1%
IS 6 11 2 2 3 4 4 2 8 2
NO 68 73 70 60 45 50 50 38 52 39
CH 88 90 82 90 80 83 80 90 78 56
Source: CARE (EU road accidents database) or national publications Last update: May 2016

Annual Accident Report 2016
- 34 -
Table 18: Annual number of male fatalities by country, 2005-2014
2005 2006 2007 2008 2009 2010 2011 2012 2013 2014
BE 823 818 850 717 705 629 659 589 549 557
BG - - - 788 700 - - - - -
CZ 988 838 946 817 659 607 574 560 492 508
DK 251 219 300 299 212 170 161 122 126 139
DE 3.913 3.717 3.638 3.247 3.050 2.651 2.971 2.650 2.433 2.509
EE 126 152 147 97 71 55 74 64 54 51
IE 286 262 250 199 182 161 130 108 142 -
EL 1.296 1.361 1.268 1.244 1.201 1.013 920 806 692 649
ES 3.446 3.192 2.985 2.412 2.087 1.917 1.589 1.447 1.279 1.289
FR 4.004 3.554 3.502 3.262 3.232 3.039 3.024 2.730 2.505 2.541
HR - - - 505 406 324 334 324 284 244
IT 4.575 4.392 4.126 3.765 3.311 3.268 3.005 3.015 2.703 2.662
CY 83 71 75 65 59 50 58 37 35 32
LV 324 309 317 239 166 121 109 128 137 166
LT - - - - - - - - 194 192
LU 30 33 38 27 35 24 22 26 34 29
HU 963 1.008 916 757 612 555 467 438 429 457
MT 13 11 11 6 10 8 - - - -
NL 540 518 517 498 469 392 384 416 345 342
AT 573 540 530 509 478 409 385 378 342 315
PL 4.175 3.993 4.241 4.099 3.456 2.977 3.243 2.725 2.563 2.431
PT 1.005 779 779 674 666 734 675 564 501 503
RO 1.941 1.926 2.060 2.300 2.102 1.802 1.545 1.542 1.374 1.361
SI 187 220 232 178 132 104 113 97 94 -
SK 462 480 505 495 296 279 - - 249 -
FI 283 241 279 265 208 204 211 191 192 167
SE 324 333 344 286 266 199 241 218 195 191
UK 2.520 2.492 2.307 1.962 1.740 1.408 1.461 1.373 1.314 1.373
EU 34.619 32.946 32.649 29.906 26.704 23.994 23.536 21.699 19.965 19.901
Yearly Change
-4,8% -0,9% -8,4% -10,7% -10,2% -1,9% -7,8% -8,0% -0,3%
IS 13 20 13 10 14 4 8 7 7 2
NO 156 169 163 195 167 158 118 107 135 108
CH 321 280 302 267 269 244 240 249 191 187
Source: CARE (EU road accidents database) or national publications Last update: May 2016

Annual Accident Report 2016
- 35 -
Figure 19: Annual distribution of fatalities by gender in the EU, 2005-2014
Source: CARE (EU road accidents database) or national publications Last update: May 2016

Annual Accident Report 2016
- 36 -
Table 19: Annual number of female fatalities as drivers by country, 2005-2014
2005 2006 2007 2008 2009 2010 2011 2012 2013 2014
BE 136 136 120 105 113 111 88 95 74 80
BG - - - 36 23 - - - - -
CZ 69 70 86 74 77 54 64 51 41 56
DK 38 38 56 58 45 43 32 23 27 18
DE 736 664 669 591 530 499 482 489 403 438
EE 8 13 11 11 5 9 2 6 7 8
IE 45 41 29 36 31 21 24 34 23 -
EL 65 53 64 64 44 60 52 33 44 35
ES 242 253 238 176 190 150 118 107 109 104
FR 586 527 507 451 473 435 423 433 337 383
HR - - - 37 34 24 24 14 18 15
IT 400 403 353 337 313 306 317 273 258 244
CY 5 3 3 6 0 0 5 6 3 3
LV 16 11 14 15 14 7 0 13 8 9
LT - - - - - - - - 12 11
LU 10 3 4 6 3 4 4 1 7 3
HU 88 94 86 62 59 45 47 48 57 51
MT 0 0 0 2 0 1 - - - -
NL 132 141 112 113 101 92 108 90 93 99
AT 96 96 69 81 63 58 60 76 49 61
PL 250 262 295 299 267 207 250 239 192 189
PT 67 44 46 63 46 46 52 34 35 37
RO 61 60 62 77 81 55 45 58 48 36
SI 26 15 24 13 10 16 11 16 16 -
SK 28 30 32 24 16 20 - - 18 -
FI 43 42 46 46 30 31 32 29 31 32
SE 51 52 55 55 41 36 33 31 33 35
UK 288 288 269 260 220 204 204 153 182 192
EU 3.571 3.424 3.335 3.110 2.841 2.569 2.533 2.406 2.149 2.220
Yearly Change
0 -4,1% -2,6% -6,8% -8,6% -9,6% -1,4% -5,0% -10,7% 3,3%
IS 3 5 1 2 0 1 2 1 4 0
NO 22 33 34 26 14 21 25 25 26 21
CH 35 37 34 32 42 30 33 27 27 21
Source: CARE (EU road accidents database) or national publications Last update: May 2016

Annual Accident Report 2016
- 37 -
Table 20: Annual number of male fatalities as drivers by country, 2005-2014
2005 2006 2007 2008 2009 2010 2011 2012 2013 2014
BE 671 668 711 586 588 484 533 466 442 430
BG - - - 421 413 - - - - -
CZ 642 569 666 555 466 440 388 402 345 392
DK 195 162 224 230 153 116 119 91 94 111
DE 3.115 2.924 2.848 2.527 2.408 2.085 2.344 2.108 1.906 1.983
EE 73 87 93 48 44 40 50 33 38 33
IE 184 160 155 134 125 91 81 67 101 -
EL 986 1.021 945 956 919 778 661 618 538 505
ES 2.486 2.308 2.180 1.750 1.500 1.360 1.170 1.056 906 939
FR 3.113 2.799 2.732 2.526 2.566 2.400 2.340 2.090 1.942 1.981
HR - - - 335 270 209 245 237 197 170
IT 3.495 3.345 3.292 2.962 2.621 2.546 2.373 2.349 2.050 2.047
CY 54 49 56 49 44 38 45 31 26 24
LV 147 161 162 115 92 64 58 72 73 79
LT - - - - - - - - 93 86
LU 24 24 24 21 24 21 18 20 28 24
HU 607 628 601 480 430 341 321 280 266 309
MT 5 6 8 6 8 6 - - - -
NL 433 417 406 417 387 317 315 341 289 283
AT 448 405 405 399 357 316 297 298 275 254
PL 2.216 2.030 2.144 2.070 1.898 1.648 1.692 1.517 1.373 1.356
PT 693 578 555 496 466 506 479 406 351 359
RO 879 848 937 1.152 974 872 764 763 672 657
SI 139 156 172 133 100 73 87 76 72 -
SK 259 236 289 258 162 150 - - 165 -
FI 217 191 217 182 153 159 166 160 150 129
SE 248 253 266 231 207 154 170 145 138 143
UK 1.714 1.665 1.550 1.333 1.163 974 981 917 896 920
EU 23.892 22.539 22.487 20.465 18.631 16.694 16.359 15.220 13.845 13.971
Yearly Change
-5,7% -0,2% -9,0% -9,0% -10,4% -2,0% -7,0% -9,0% 0,9%
IS 11 14 12 8 9 3 5 5 6 2
NO 118 133 123 147 122 123 93 77 110 81
CH 240 206 227 218 204 181 183 183 144 148
Source: CARE (EU road accidents database) or national publications Last update: May 2016

Annual Accident Report 2016
- 38 -
Table 21: Annual number of female fatalities as passengers by country, 2005-2014
2005 2006 2007 2008 2009 2010 2011 2012 2013 2014
BE 81 60 49 74 66 46 53 40 50 45
BG - - - 115 100 - - - - -
CZ 132 94 103 97 74 58 56 56 47 56
DK 28 20 23 24 22 24 12 7 23 13
DE 415 407 350 348 327 308 279 233 242 226
EE 18 12 18 8 11 10 14 6 8 4
IE 36 34 28 22 11 13 18 11 10 -
EL 197 142 171 141 135 119 100 81 78 76
ES 473 436 364 324 260 225 204 207 162 175
FR 462 403 374 322 356 306 314 280 245 239
HR - - - 66 66 38 32 30 38 19
IT 532 562 396 370 322 315 282 253 240 253
CY 6 7 8 5 6 4 1 3 2 3
LV 47 32 34 24 13 9 2 15 11 19
LT - - - - - - - - 14 20
LU 5 2 1 0 4 4 4 5 1 3
HU 127 108 126 85 70 76 71 64 51 64
MT 0 0 0 0 3 3 - - - -
NL 47 47 46 38 42 22 27 32 17 18
AT 57 49 56 45 53 33 39 44 28 21
PL 486 469 488 469 384 339 302 265 265 237
PT 103 76 92 95 79 80 85 52 53 42
RO 319 271 278 311 283 227 177 200 167 192
SI 25 17 19 12 19 8 12 9 7 -
SK 64 44 54 41 40 29 - - 23 -
FI 37 29 41 17 30 21 29 22 18 14
SE 41 38 46 31 30 20 20 11 17 23
UK 270 286 254 203 191 161 143 144 144 125
EU 4.203 3.840 3.614 3.300 3.011 2.612 2.422 2.210 2.064 2.030
Yearly Change
-8,6% -5,9% -8,7% -8,8% -13,2% -7,3% -8,7% -6,6% -1,6%
IS 2 3 1 0 2 2 0 0 3 2
NO 30 23 24 21 20 18 17 7 18 11
CH 22 20 12 27 13 18 13 26 13 16
Source: CARE (EU road accidents database) or national publications Last update: May 2016

Annual Accident Report 2016
- 39 -
Table 22: Annual number of male fatalities as passengers by country, 2005-2014
2005 2006 2007 2008 2009 2010 2011 2012 2013 2014
BE 88 79 81 72 69 85 64 63 57 51
BG - - - 180 167 - - - - -
CZ 145 128 134 112 97 70 81 62 52 47
DK 25 26 34 36 31 28 24 15 14 18
DE 406 383 385 357 296 280 290 243 227 202
EE 18 24 29 22 15 6 9 11 4 4
IE 51 54 43 34 31 38 16 21 23 0
EL 174 170 172 144 153 122 105 86 68 54
ES 534 484 441 343 289 269 184 158 128 134
FR 522 445 446 428 382 366 367 361 279 282
HR - - - 87 74 50 46 40 46 31
IT 605 601 463 410 314 326 299 302 302 259
CY 14 8 5 6 12 5 7 1 5 4
LV 58 50 50 57 29 16 12 13 15 34
LT - - - - - - - - 38 41
LU 6 4 9 2 5 2 1 2 4 2
HU 165 176 131 118 76 85 73 57 67 50
MT 6 1 1 0 0 1 - - - -
NL 55 59 59 53 50 44 29 33 26 22
AT 70 70 53 52 59 47 40 32 21 23
PL 722 673 704 711 555 473 533 393 386 304
PT 161 107 117 74 100 110 76 65 53 54
RO 390 374 409 458 443 353 285 293 248 236
SI 30 38 44 16 17 14 10 10 10 -
SK 81 90 69 79 53 46 - - 34 -
FI 37 25 28 46 36 26 24 15 25 18
SE 45 43 43 31 28 20 30 21 25 17
UK 365 362 323 257 239 151 166 159 143 153
EU 5.078 4.779 4.579 4.223 3.659 3.238 3.023 2.696 2.468 2.252
Yearly Change
-5,9% -4,2% -7,8% -13,4% -11,5% -6,6% -10,8% -8,5% -8,7%
IS 2 5 0 2 4 0 1 1 1 0
NO - - - - - - - - - -
CH 43 31 32 21 30 23 22 28 16 15
Source: CARE (EU road accidents database) or national publications Last update: May 2016
Annual Accident Report 2016
- 40 -
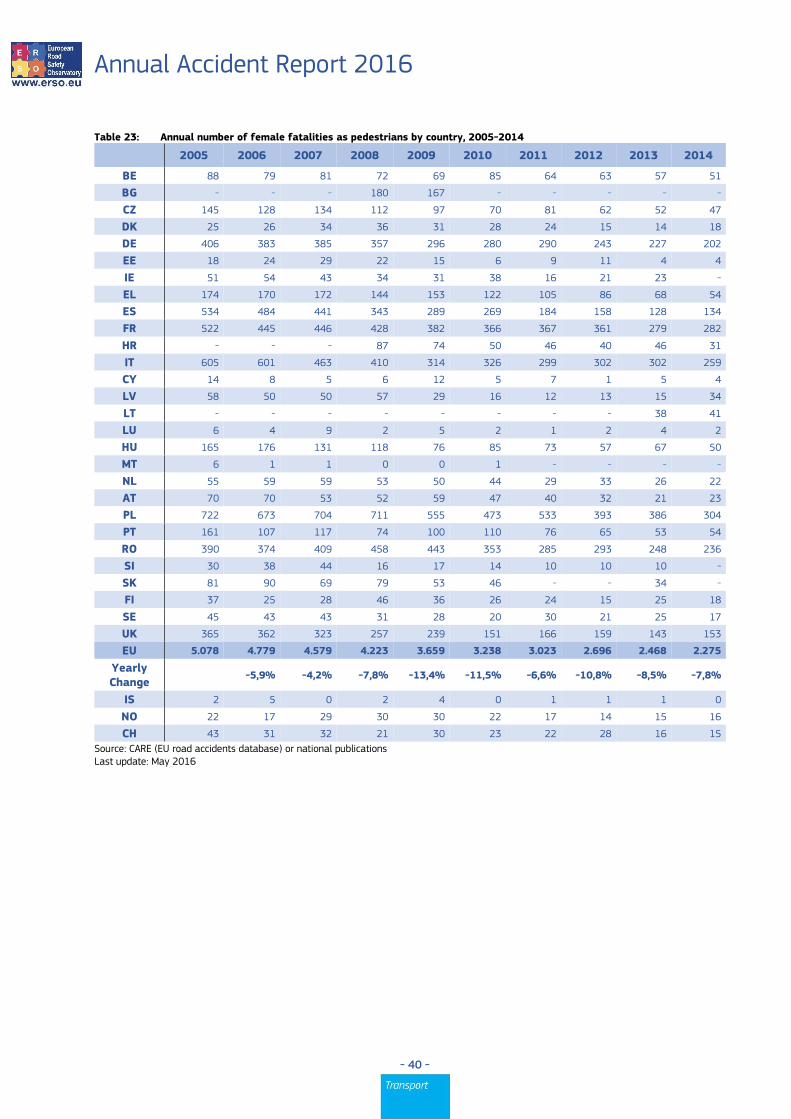
Table 23: Annual number of female fatalities as pedestrians by country, 2005-2014
2005 2006 2007 2008 2009 2010 2011 2012 2013 2014
BE 88 79 81 72 69 85 64 63 57 51
BG - - - 180 167 - - - - -
CZ 145 128 134 112 97 70 81 62 52 47
DK 25 26 34 36 31 28 24 15 14 18
DE 406 383 385 357 296 280 290 243 227 202
EE 18 24 29 22 15 6 9 11 4 4
IE 51 54 43 34 31 38 16 21 23 -
EL 174 170 172 144 153 122 105 86 68 54
ES 534 484 441 343 289 269 184 158 128 134
FR 522 445 446 428 382 366 367 361 279 282
HR - - - 87 74 50 46 40 46 31
IT 605 601 463 410 314 326 299 302 302 259
CY 14 8 5 6 12 5 7 1 5 4
LV 58 50 50 57 29 16 12 13 15 34
LT - - - - - - - - 38 41
LU 6 4 9 2 5 2 1 2 4 2
HU 165 176 131 118 76 85 73 57 67 50
MT 6 1 1 0 0 1 - - - -
NL 55 59 59 53 50 44 29 33 26 22
AT 70 70 53 52 59 47 40 32 21 23
PL 722 673 704 711 555 473 533 393 386 304
PT 161 107 117 74 100 110 76 65 53 54
RO 390 374 409 458 443 353 285 293 248 236
SI 30 38 44 16 17 14 10 10 10 -
SK 81 90 69 79 53 46 - - 34 -
FI 37 25 28 46 36 26 24 15 25 18
SE 45 43 43 31 28 20 30 21 25 17
UK 365 362 323 257 239 151 166 159 143 153
EU 5.078 4.779 4.579 4.223 3.659 3.238 3.023 2.696 2.468 2.275
Yearly Change
-5,9% -4,2% -7,8% -13,4% -11,5% -6,6% -10,8% -8,5% -7,8%
IS 2 5 0 2 4 0 1 1 1 0
NO 22 17 29 30 30 22 17 14 15 16
CH 43 31 32 21 30 23 22 28 16 15
Source: CARE (EU road accidents database) or national publications Last update: May 2016

Annual Accident Report 2016
- 41 -
Table 24: Annual number of male fatalities as pedestrians by country, 2005-2014
2005 2006 2007 2008 2009 2010 2011 2012 2013 2014
BE 64 70 57 58 48 58 62 60 49 65
BG - - - 187 120 - - - - -
CZ 201 141 146 150 95 97 105 96 95 69
DK 30 31 42 33 28 26 18 16 18 10
DE 392 410 405 363 346 286 337 299 300 324
EE 33 37 21 26 12 9 15 18 11 11
IE 51 48 52 31 26 32 33 20 18 -
EL 136 170 151 144 129 113 154 102 86 90
ES 426 400 363 319 298 288 234 233 246 216
FR 369 310 324 308 284 273 317 279 284 278
HR - - - 83 62 65 43 47 41 43
IT 475 446 371 393 376 396 333 364 351 356
CY 15 14 14 10 3 7 6 5 4 3
LV 119 98 105 67 45 41 39 43 49 53
LT - - - - - - - - 61 65
LU 0 5 5 4 6 1 3 4 2 3
HU 191 204 184 159 106 129 73 101 96 98
MT 2 4 2 0 2 1 - - - -
NL 52 42 52 28 31 31 39 40 30 34
AT 55 65 72 58 62 46 48 48 46 38
PL 1.237 1.290 1.393 1.318 1.003 856 1.018 815 804 771
PT 152 93 106 104 99 118 120 93 97 90
RO 670 704 713 690 685 575 496 486 454 468
SI 17 26 15 28 14 17 16 11 12 -
SK 122 154 147 158 81 83 - - 50 -
FI 29 25 34 37 19 19 21 16 17 20
SE 31 34 33 21 25 20 28 33 27 31
UK 441 465 434 372 338 283 314 297 275 300
EU 5.640 5.618 5.572 5.209 4.404 4.051 4.137 3.758 3.644 3.637
Yearly Change
-0,4% -0,8% -6,5% -15,5% -8,0% 2,1% -9,2% -3,0% -0,2%
IS 0 1 1 0 1 1 2 1 0 0
NO 16 19 11 18 15 13 8 16 10 11
CH 38 43 43 28 35 40 35 38 31 24
Source: CARE (EU road accidents database) or national publications Last update: May 2016

Annual Accident Report 2016
- 42 -
4 Fatalities 2014
4.1 People involved
4.1.1 Age and gender
Table 25: Number of total fatalities by age group by country, 2014
unknown 0-14 15-17 18-24 25-49 50-64 65+ Total
BE 8 10 22 117 255 137 178 727
BG 0 30 33 157 368 155 158 901
CZ 2 14 11 100 288 142 131 688
DK 0 6 3 22 61 32 58 182
DE 0 71 91 496 1.045 687 987 3.377
EE 0 1 2 13 27 19 16 78
IE 0 6 4 36 74 22 46 188
EL 5 10 19 114 300 160 187 795
ES 13 37 23 130 648 358 479 1.688
FR 0 112 116 582 1.255 547 772 3.384
HR 0 8 5 36 111 67 81 308
IT 50 62 70 369 1.129 645 1.056 3.381
CY 0 0 2 12 16 4 11 45
LV 13 7 3 30 80 37 42 212
LT 1 15 9 33 97 63 49 267
LU 0 1 0 5 18 9 2 35
HU 2 11 7 59 229 163 155 626
MT 0 1 0 4 7 1 0 13
NL 0 19 17 69 136 62 173 476
AT 0 8 16 59 130 102 115 430
PL 8 80 71 499 1.117 735 692 3.202
PT 1 8 11 53 215 144 206 638
RO 1 91 37 177 624 468 420 1.818
SI 0 3 2 22 43 28 27 125
SK 6 6 9 45 110 69 76 321
FI 0 10 12 32 78 41 56 229
SE 0 7 7 25 78 54 99 270
UK 0 50 38 335 662 295 474 1.854
EU 111 675 633 3.582 9.063 5.160 6.649 25.872
% 0,4% 2,6% 2,4% 13,8% 35,0% 19,9% 25,7% 100,0%
IS - - - - - - - -
NO 1 4 4 18 48 25 47 147
CH 0 9 2 38 65 43 86 243
Source: CARE (EU road accidents database) or national publications Last update: May 2016

Annual Accident Report 2016
- 43 -
Table 26: Number of female fatalities by age group by country, 2014
unknown 0-14 15-17 18-24 25-49 50-64 65+ Total
BE 2 3 8 16 42 36 59 166
BG 0 8 6 28 67 29 63 209
CZ 0 - 4 21 56 36 47 168
DK 0 2 2 5 9 6 19 45
DE 0 23 23 103 187 138 393 867
EE 0 0 2 2 8 6 9 27
IE 0 4 3 7 12 5 15 46
EL 1 3 0 31 44 30 37 146
ES 5 13 7 27 113 82 152 398
FR 0 39 31 109 223 139 302 843
HR 0 4 1 9 22 7 21 64
IT 16 31 11 73 193 115 280 719
CY 0 0 0 3 3 1 6 13
LV 2 5 2 4 14 6 13 46
LT 0 7 3 5 14 18 28 75
LU 0 1 0 0 2 1 2 6
HU 0 6 2 13 47 36 63 167
MT 0 1 0 2 2 0 0 6
NL 0 6 7 14 27 14 66 134
AT 0 2 4 9 30 21 49 115
PL 0 44 24 94 174 148 287 771
PT 0 3 3 11 28 28 61 134
RO 0 37 16 33 101 108 162 494
SI 0 1 0 8 7 7 8 32
SK 0 3 4 6 23 13 23 72
FI 0 5 2 5 21 11 18 62
SE 0 3 0 7 24 13 32 79
UK 0 22 16 68 117 62 196 481
EU 75 276 178 702 1.580 1.103 2.381 6.294
% 1,2% 4,4% 2,8% 11,2% 25,1% 17,5% 37,8% 100,0%
IS - - - - - - - -
NO 0 1 2 7 10 6 13 39
CH 0 5 1 3 9 6 32 56
Source: CARE (EU road accidents database) or national publications Last update: May 2016

Annual Accident Report 2016
- 44 -
Table 27: Number of male fatalities by age group by country, 2014
unknown 0-14 15-17 18-24 25-49 50-64 65+ Total
BE 4 6 14 101 213 101 118 557
BG 0 22 27 129 301 126 95 722
CZ 2 - 5 79 232 106 84 513
DK 0 4 1 17 52 26 39 139
DE 0 47 68 393 858 549 594 2.509
EE 0 1 0 11 19 13 7 51
IE 0 2 1 29 62 17 31 142
EL 4 7 19 83 256 130 150 649
ES 8 24 16 103 535 276 327 1.289
FR 0 73 85 473 1.032 408 470 2.541
HR 0 4 1 9 22 7 21 64
IT 34 31 59 296 936 530 776 2.662
CY 0 0 2 9 13 3 5 32
LV 11 2 1 26 66 31 29 166
LT 1 8 6 28 83 45 21 192
LU 0 0 0 5 16 8 0 29
HU 0 5 5 46 182 127 92 457
MT 0 0 0 2 5 1 0 8
NL 0 13 10 55 109 48 107 342
AT 0 6 12 50 100 81 66 315
PL 8 36 47 405 943 587 405 2.431
PT 1 5 8 42 187 116 144 503
RO 1 54 21 144 523 360 258 1.361
SI 0 2 2 14 36 21 19 96
SK 6 3 5 39 87 56 53 249
FI 0 5 10 27 57 30 38 167
SE 0 4 7 18 54 41 67 191
UK 0 28 22 267 545 233 278 1.373
EU 104 392 453 2.880 7.483 4.057 4.266 19.635
% 0,5% 2,0% 2,3% 14,7% 38,1% 20,7% 21,7% 100,0%
IS - - - - - - - -
NO 1 3 2 11 38 19 34 108
CH 0 4 1 35 56 37 54 187
Source: CARE (EU road accidents database) or national publications Last update: May 2016
Annual Accident Report 2016
- 45 -
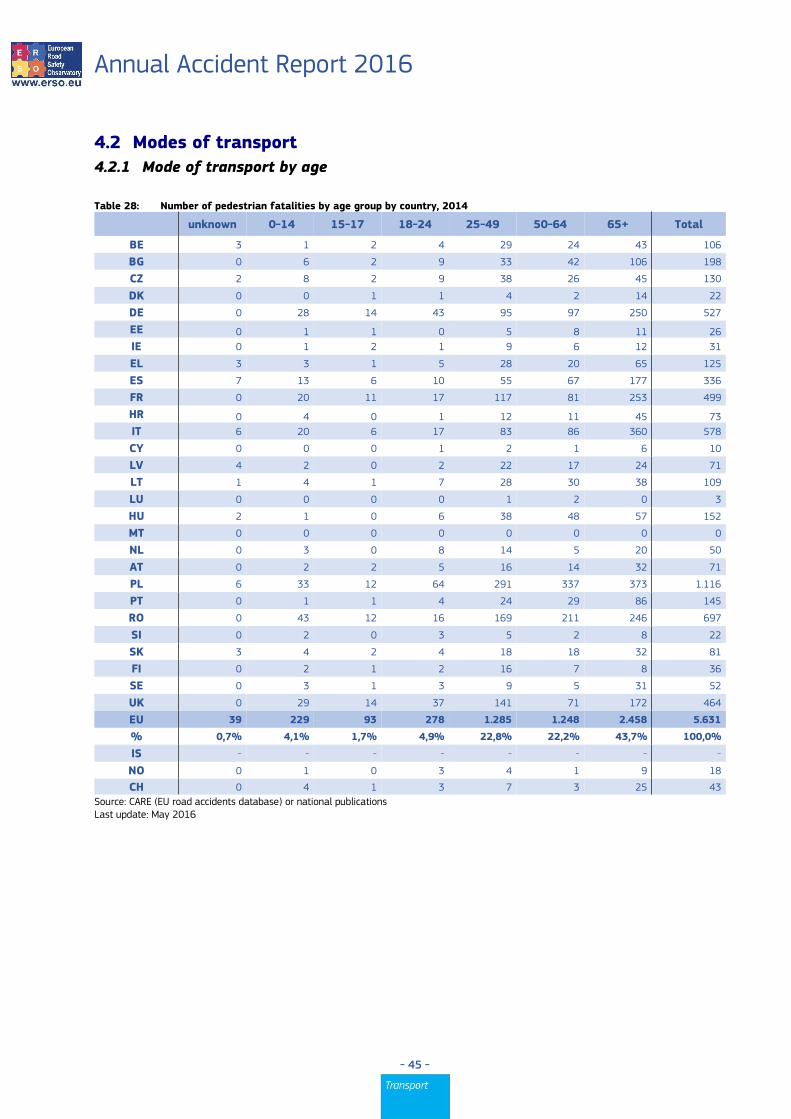
4.2 Modes of transport
4.2.1 Mode of transport by age
Table 28: Number of pedestrian fatalities by age group by country, 2014
unknown 0-14 15-17 18-24 25-49 50-64 65+ Total
BE 3 1 2 4 29 24 43 106
BG 0 6 2 9 33 42 106 198
CZ 2 8 2 9 38 26 45 130
DK 0 0 1 1 4 2 14 22
DE 0 28 14 43 95 97 250 527
EE 0 1 1 0 5 8 11 26
IE 0 1 2 1 9 6 12 31
EL 3 3 1 5 28 20 65 125
ES 7 13 6 10 55 67 177 336
FR 0 20 11 17 117 81 253 499
HR 0 4 0 1 12 11 45 73
IT 6 20 6 17 83 86 360 578
CY 0 0 0 1 2 1 6 10
LV 4 2 0 2 22 17 24 71
LT 1 4 1 7 28 30 38 109
LU 0 0 0 0 1 2 0 3
HU 2 1 0 6 38 48 57 152
MT 0 0 0 0 0 0 0 0
NL 0 3 0 8 14 5 20 50
AT 0 2 2 5 16 14 32 71
PL 6 33 12 64 291 337 373 1.116
PT 0 1 1 4 24 29 86 145
RO 0 43 12 16 169 211 246 697
SI 0 2 0 3 5 2 8 22
SK 3 4 2 4 18 18 32 81
FI 0 2 1 2 16 7 8 36
SE 0 3 1 3 9 5 31 52
UK 0 29 14 37 141 71 172 464
EU 39 229 93 278 1.285 1.248 2.458 5.631
% 0,7% 4,1% 1,7% 4,9% 22,8% 22,2% 43,7% 100,0%
IS - - - - - - - -
NO 0 1 0 3 4 1 9 18
CH 0 4 1 3 7 3 25 43
Source: CARE (EU road accidents database) or national publications Last update: May 2016

Annual Accident Report 2016
- 46 -
Table 29: Number of pedal cyclist fatalities by age group by country, 2014
unknown 0-14 15-17 18-24 25-49 50-64 65+ Total
BE 0 4 1 1 10 13 47 76
BG 0 1 0 1 7 8 12 29
CZ 0 1 1 4 13 23 26 68
DK 0 2 0 1 10 3 14 30
DE 0 12 14 15 55 74 226 396
EE 0 0 0 0 0 0 0 0
IE 0 0 0 0 2 0 3 5
EL 1 1 0 2 6 5 4 19
ES 1 1 1 4 22 19 26 75
FR 0 16 6 5 27 36 69 159
HR 0 0 0 1 7 5 6 19
IT 1 6 4 10 58 55 139 273
CY 0 0 0 1 0 0 0 1
LV 1 1 0 0 7 3 4 16
LT 0 3 1 2 4 5 4 19
LU 0 0 0 0 0 0 0 0
HU 0 1 0 2 21 42 32 98
MT 0 0 0 0 0 0 0 0
NL 0 13 5 5 20 12 63 118
AT 0 0 0 1 6 13 25 45
PL 1 8 7 10 49 92 119 286
PT 0 2 1 2 10 9 11 35
RO 0 8 4 2 41 52 44 151
SI 0 1 1 0 6 2 6 17
SK 0 1 1 0 3 6 10 21
FI 0 0 0 0 4 6 17 27
SE 0 0 2 1 4 10 16 33
UK 0 6 1 13 45 24 27 116
EU 6 88 50 82 430 512 944 2.113
% 0,3% 4,2% 2,4% 3,9% 20,4% 24,2% 44,7% 100,0%
IS - - - - - - - -
NO 0 1 0 1 1 4 5 12
CH 0 2 1 0 7 8 16 34
Source: CARE (EU road accidents database) or national publications Last update: May 2016

Annual Accident Report 2016
- 47 -
Table 30: Number of moped rider and passenger fatalities by age group by country, 2014
unknown 0-14 15-17 18-24 25-49 50-64 65+ Total
BE 0 0 5 3 3 4 2 17
BG 0 0 1 2 1 1 0 5
CZ 0 0 0 1 1 4 2 8
DK 0 0 0 0 2 5 6 13
DE 0 1 6 2 16 27 35 87
EE 0 0 0 0 0 0 0 0
IE 0 0 0 0 0 0 0 0
EL 0 0 2 2 5 4 7 20
ES 1 0 6 3 22 8 13 54
FR 0 8 45 43 37 25 7 173
HR 0 0 0 1 2 4 4 11
IT 2 1 24 15 24 22 24 112
CY 0 0 1 1 0 0 2 4
LV 0 0 0 2 0 1 3 6
LT 0 0 0 0 1 0 0 1
LU 0 0 0 0 0 0 0 0
HU 0 0 0 4 2 6 5 17
MT 0 0 0 0 0 0 0 0
NL 0 0 8 3 9 6 6 32
AT 0 0 6 3 3 1 3 16
PL 0 3 15 9 10 20 14 71
PT 0 0 1 1 9 17 15 43
RO 0 0 1 2 10 9 8 30
SI 0 0 0 2 1 1 0 4
SK 0 0 1 2 5 2 0 10
FI 0 0 2 0 1 0 0 3
SE 0 1 2 0 0 3 2 8
UK 0 0 1 2 1 2 0 6
EU 11 14 127 102 163 168 154 740
% 1,5% 1,9% 17,2% 13,8% 22,1% 22,7% 20,8% 100,0%
IS - - - - - - - -
NO 0 0 2 0 0 0 0 2
CH 0 0 0 0 0 0 1 1
Source: CARE (EU road accidents database) or national publications Last update: May 2016

Annual Accident Report 2016
- 48 -
Table 31: Number of motorcycle rider and passenger fatalities by age group by country, 2014
unknown 0-14 15-17 18-24 25-49 50-64 65+ Total
BE 0 0 2 13 45 22 3 85
BG 0 1 2 15 25 2 3 48
CZ 0 0 2 17 58 9 2 88
DK 0 0 0 2 10 6 0 18
DE 0 1 28 98 266 159 35 587
EE 0 0 0 0 0 0 0 0
IE 0 0 0 1 19 5 1 26
EL 1 2 12 59 140 42 22 278
ES 1 0 2 18 190 65 10 287
FR 0 2 10 105 396 110 26 651
HR 0 0 0 6 31 7 0 44
IT 4 3 18 98 381 164 36 704
CY 0 0 0 3 4 2 0 9
LV 2 0 0 4 4 0 0 10
LT 0 0 1 4 7 1 0 13
LU 0 0 0 1 4 3 0 8
HU 0 0 1 18 35 4 0 58
MT 0 0 0 0 3 0 0 3
NL 0 0 0 4 35 8 4 51
AT 0 0 2 10 39 21 4 76
PL 0 0 5 70 147 11 4 237
PT 0 0 3 2 69 15 2 91
RO 0 0 0 7 33 4 1 45
SI 0 0 1 3 7 3 3 17
SK 0 0 0 0 0 0 0 0
FI 0 1 4 0 8 4 0 17
SE 0 0 1 3 18 6 3 31
UK 0 0 3 69 183 76 16 347
EU 10 10 97 624 2.126 742 175 3.785
% 0,3% 0,3% 2,6% 16,5% 56,2% 19,6% 4,6% 100,0%
IS - - - - - - - -
NO 0 0 1 0 15 2 2 20
CH 0 0 0 11 25 12 5 53
Source: CARE (EU road accidents database) or national publications Last update: May 2016

Annual Accident Report 2016
- 49 -
Table 32: Number of car driver and passenger fatalities by age group by country, 2014
unknown 0-14 15-17 18-24 25-49 50-64 65+ Total
BE 4 3 9 84 145 56 78 379
BG 0 20 28 123 282 84 33 570
CZ 0 4 6 66 150 70 51 347
DK 0 4 2 17 27 16 23 89
DE 0 26 28 320 530 272 403 1.579
EE 0 0 0 12 13 5 3 33
IE 0 2 1 30 38 6 30 107
EL 0 4 3 41 107 70 64 289
ES 3 13 7 85 269 137 207 722
FR 0 63 38 381 582 227 373 1.664
HR 0 3 5 27 52 32 22 141
IT 20 32 17 217 500 263 448 1.497
CY 0 0 1 6 5 0 3 15
LV 4 4 3 21 38 13 8 91
LT 0 8 6 19 54 24 7 118
LU 0 1 0 4 13 4 2 24
HU 0 9 4 25 114 50 54 256
MT - 1 0 4 4 0 0 10
NL 0 2 1 43 49 22 54 171
AT 0 3 6 37 59 41 45 191
PL 0 35 30 333 547 236 165 1.346
PT 1 3 4 33 74 51 57 223
RO 1 39 19 133 297 151 84 724
SI 0 0 0 7 13 12 8 40
SK 0 1 5 37 61 32 12 148
FI 0 7 2 29 38 22 23 121
SE 0 2 1 16 39 23 41 122
UK 0 15 19 208 254 105 234 835
EU 34 301 240 2.319 4.289 1.987 2.507 11.678
% 0,3% 2,6% 2,1% 19,9% 36,7% 17,0% 21,5% 100,0%
IS - - - - - - - -
NO 1 0 0 14 21 11 25 72
CH 0 2 0 21 21 19 34 97
Source: CARE (EU road accidents database) or national publications Last update: May 2016
Annual Accident Report 2016
- 50 -
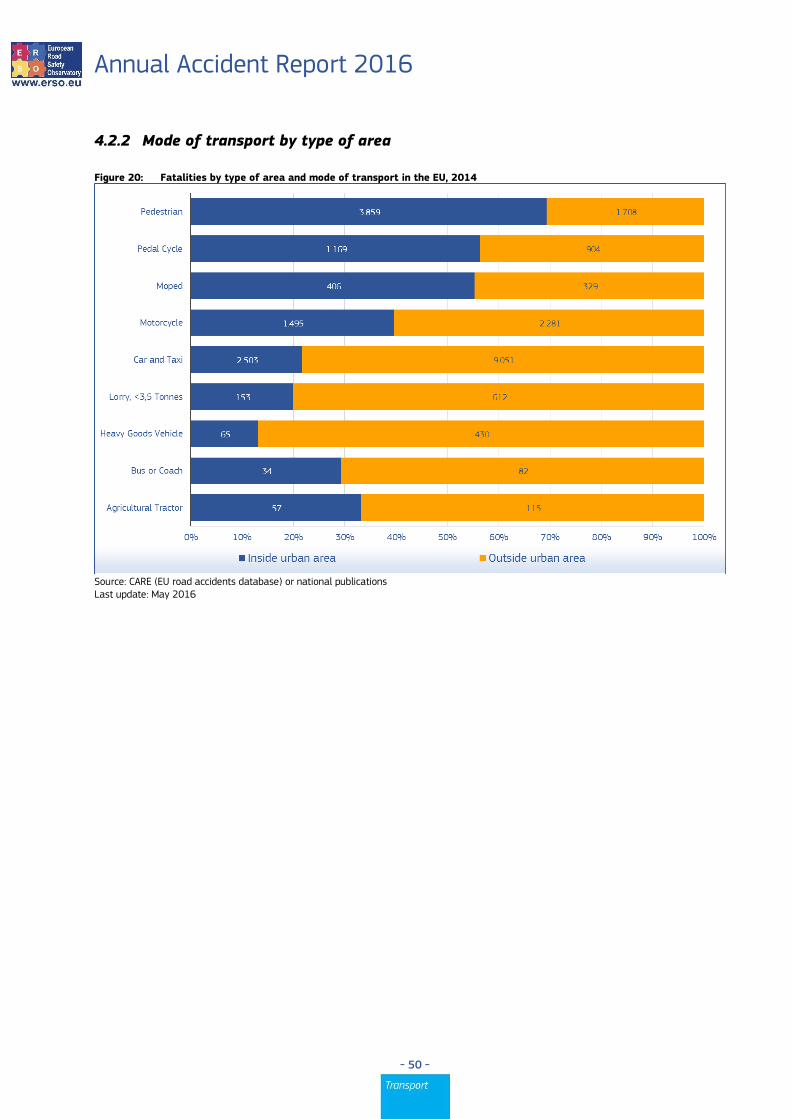
4.2.2 Mode of transport by type of area
Figure 20: Fatalities by type of area and mode of transport in the EU, 2014
Source: CARE (EU road accidents database) or national publications Last update: May 2016

Annual Accident Report 2016
- 51 -
Table 33: Number of fatalities by mode of transport and type of area by country (part 1), 2014
Agricultural
tractor Bus or coach Car + Taxi
Heavy goods vehicle
Lorry, under 3.5 tonnes
inside urban area
outside urban area
inside urban area
outside urban area
inside urban area
outside urban area
inside urban area
outside urban area
inside urban area
outside urban area
BE 0 0 1 2 62 212 1 13 3 19
BG 1 0 1 4 124 446 3 30 0 0
CZ 0 1 1 2 69 278 6 17 4 12
DK 0 0 0 0 6 83 0 1 0 9
DE 9 18 3 10 182 1.397 8 64 8 63
EE 0 0 2 6 4 29 1 2 - -
IE - - 0 0 16 91 0 2 2 10
EL 1 12 0 2 85 204 2 10 12 23
ES 1 12 3 23 71 651 2 46 6 105
FR 4 9 2 7 249 1.415 1 55 19 123
HR 3 5 0 0 73 68 1 3 5 0
IT 6 20 2 3 401 1.096 3 43 28 81
CY 0 0 0 0 10 5 0 - 3 1
LV 0 2 0 1 23 62 2 3 0 5
LT - - - - - - - - - -
LU 0 0 0 0 4 20 0 0 0 0
HU - - 1 0 58 198 5 9 3 22
MT 0 - 0 - 9 - 0 - 0 -
NL 1 0 0 1 19 128 0 6 0 7
AT 3 5 0 1 26 165 0 9 0 10
PL 7 12 1 11 381 965 20 72 0 0
PT 15 9 1 1 69 154 1 7 18 31
RO 2 1 7 2 311 413 7 10 31 36
SI 2 1 0 0 12 28 0 1 1 4
SK 1 0 0 2 48 100 1 5 2 8
FI 0 3 0 0 14 107 0 4 1 9
SE 0 0 0 2 10 110 0 5 1 7
UK 1 5 9 2 167 626 1 13 6 27
EU 57 115 34 82 2.503 9.051 65 430 153 612
% 33,1% 66,9% 29,3% 70,7% 21,7% 78,3% 13,1% 86,9% 20,0% 80,0%
IS - 0 0 0 0 3 0 0 0 1
NO 0 2 0 7 6 66 0 7 0 1
CH 1 4 0 2 16 81 1 1 1 2
Source: CARE (EU road accidents database) or national publications Last update: May 2016

Annual Accident Report 2016
- 52 -
Table 34: Number of fatalities by mode of transport and type of area by country (part 2), 2014
Moped Motor cycle Pedal cycle Pedestrian Total
inside urban area
outside urban area
inside urban area
outside urban area
inside urban area
outside urban area
inside urban area
outside urban area
inside urban area
outside urban area
Total
BE 9 6 22 44 30 37 58 24 186 357 543
BG 5 0 21 27 20 9 135 63 310 579 889
CZ 4 4 30 58 33 35 85 45 232 452 684
DK 8 5 6 12 14 16 12 10 46 136 182
DE 44 43 122 465 230 166 371 156 977 2.382 3.359
EE 0 - 0 - 0 - 12 14 19 51 70
IE - - 4 22 1 4 12 19 35 148 183
EL 16 4 182 96 9 10 93 32 400 393 793
ES 32 21 99 188 22 54 203 132 439 1.233 1.672
FR 77 88 219 430 70 89 342 157 983 2.373 3.356
HR 6 5 26 18 19 0 56 17 189 116 305
IT 74 38 359 345 158 115 468 110 1.499 1.851 3.350
CY 3 1 7 2 1 - 8 2 32 11 43
LV 4 2 5 4 6 10 29 38 69 127 196
LT - - - - - - 2 - 2 0 2
LU 0 0 3 5 0 0 - 1 7 26 33
HU 8 9 25 33 56 42 78 74 234 387 621
MT - - 3 - 0 - - 0 12 0 12
NL 12 17 14 34 67 31 26 22 139 246 385
AT 6 10 18 58 32 13 36 35 121 306 427
PL 33 38 127 110 148 138 735 381 1.452 1.727 3.179
PT 32 11 61 30 24 11 115 30 336 284 620
RO 21 9 29 16 121 30 571 126 1.100 643 1.743
SI 3 1 6 11 11 5 13 7 48 58 106
SK 2 8 0 0 9 12 61 20 124 155 279
FI 2 1 5 12 19 8 20 16 61 160 221
SE 3 4 6 24 18 7 28 21 66 180 246
UK 2 4 96 237 51 62 290 156 623 1.132 1.755
EU 406 329 1.495 2.281 1.169 904 3.859 1.708 9.741 15.513 25.254
% 55,3% 44,7% 39,6% 60,4% 56,4% 43,6% 69,3% 30,7% 38,6% 61,4% -
IS 0 0 0 0 0 0 0 0 0 0 4
NO 0 2 2 18 8 4 14 4 8 3 141
CH 1 0 15 38 22 12 33 10 10 17 240
Source: CARE (EU road accidents database) or national publications Last update: May 2016

Annual Accident Report 2016
- 53 -
4.3 Accident characteristics
4.3.1 Various periods of time (month, day of week, hour of day)
Figure 21: Number of fatalities by month in the EU, 2014
Source: CARE (EU road accidents database) or national publications Last update: May 2016
Annual Accident Report 2016
- 54 -
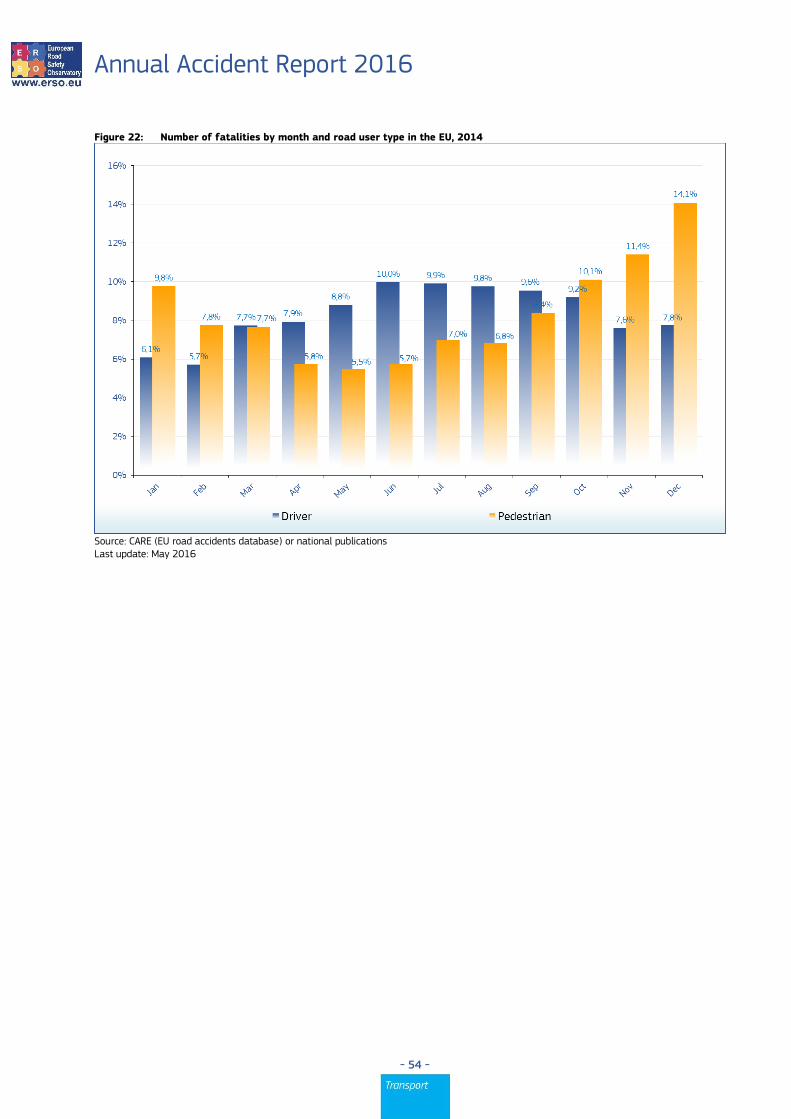
Figure 22: Number of fatalities by month and road user type in the EU, 2014
Source: CARE (EU road accidents database) or national publications Last update: May 2016

Annual Accident Report 2016
- 55 -
Table 35: Number of fatalities by month by country (January to June), 2014
January February March April May June
BE 53 49 77 55 63 73
BG 46 56 55 75 93 66
CZ 46 26 55 40 53 71
DK 17 12 8 17 12 11
DE 219 186 244 297 286 339
EE 10 4 5 8 5 1
IE 19 14 15 12 17 13
EL 54 51 50 56 67 70
ES 112 98 133 142 123 154
FR 235 225 261 254 260 311
HR 17 15 29 16 31 22
IT 247 203 270 256 273 331
CY 2 3 4 2 3 4
LV 8 16 19 10 14 11
LT 28 15 14 16 16 30
LU 3 1 1 2 2 2
HU 39 43 54 44 38 59
MT 3 1 1 2 0 2
NL 33 30 49 38 48 42
AT 36 36 41 36 39 50
PL 216 210 217 231 258 275
PT 49 42 52 37 53 46
RO 123 113 128 124 129 149
SI 7 6 11 7 12 13
SK 16 12 44 15 11 24
FI 17 14 13 12 16 24
SE 18 17 21 19 22 28
UK 136 118 138 146 132 170
EU 1.809 1.616 2.009 1.969 2.076 2.391
% 6,9% 6,2% 7,7% 7,5% 7,9% 9,1%
IS 2 0 1 0 0 0
NO 9 14 9 7 18 18
CH 16 8 17 26 26 23
Source: CARE (EU road accidents database) or national publications Last update: May 2016

Annual Accident Report 2016
- 56 -
Table 36: Number of fatalities by month by country (July to December), 2014
July August September October November December Total
BE 60 50 70 55 67 55 727
BG 100 97 78 106 71 58 901
CZ 78 70 77 58 53 61 688
DK 21 21 13 11 13 26 182
DE 341 283 327 292 262 301 3.377
EE 9 8 6 7 7 8 78
IE 18 19 17 13 15 16 188
EL 79 87 72 72 63 74 795
ES 153 156 163 144 158 155 1.688
FR 302 306 317 347 280 286 3.384
HR 44 28 26 34 26 20 308
IT 296 321 285 329 274 296 3.381
CY 10 3 2 3 5 4 45
LV 24 23 17 23 17 30 212
LT 27 16 21 24 24 36 267
LU 4 2 3 9 4 2 35
HU 45 63 41 60 57 83 626
MT 2 1 0 0 1 0 13
NL 45 36 43 40 35 37 476
AT 33 42 35 29 27 26 430
PL 275 293 312 323 272 320 3.202
PT 60 61 59 54 56 69 638
RO 154 180 167 180 200 171 1.818
SI 10 8 16 10 11 14 125
SK 41 40 31 31 26 30 321
FI 30 22 20 18 18 25 229
SE 27 25 32 15 16 30 270
UK 161 155 166 153 174 205 1.854
EU 2.449 2.416 2.416 2.440 2.232 2.438 26.258
% 9,3% 9,2% 9,2% 9,3% 8,5% 9,3% 100,0%
IS 0 1 0 0 0 0 4
NO 18 18 15 9 7 5 147
CH 25 23 19 24 22 14 243
Source: CARE (EU road accidents database) or national publications Last update: May 2016
Annual Accident Report 2016
- 57 -
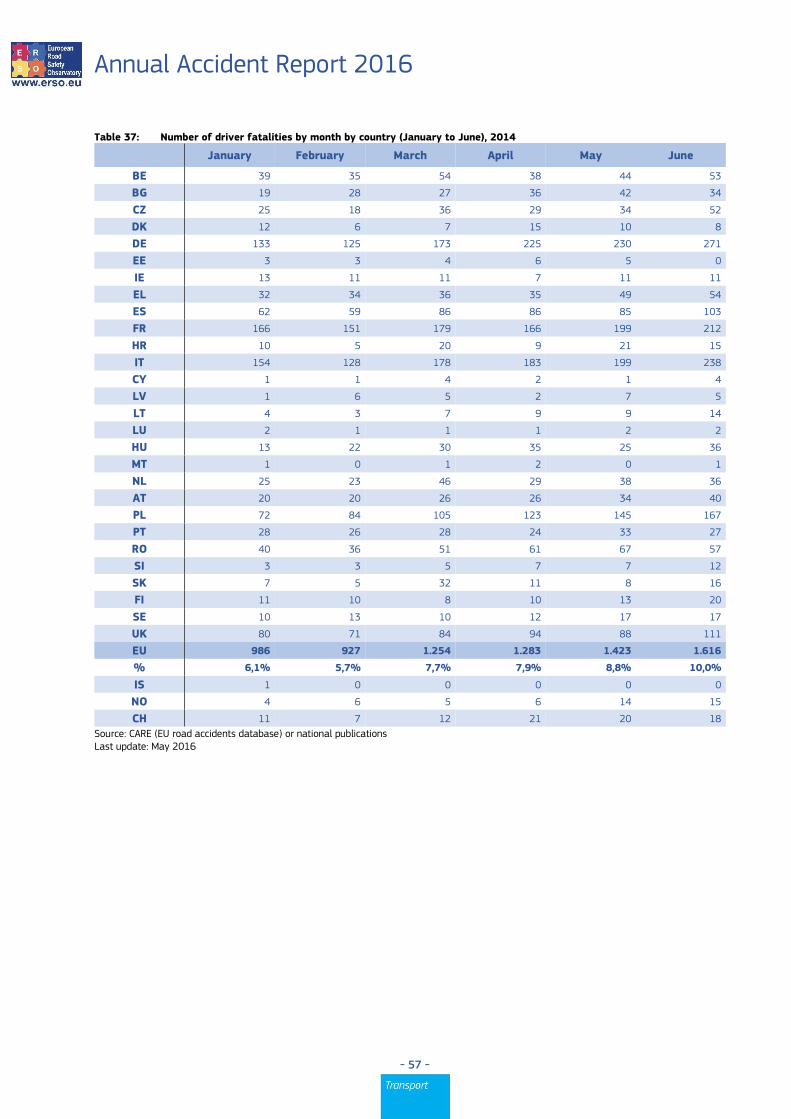
Table 37: Number of driver fatalities by month by country (January to June), 2014
January February March April May June
BE 39 35 54 38 44 53
BG 19 28 27 36 42 34
CZ 25 18 36 29 34 52
DK 12 6 7 15 10 8
DE 133 125 173 225 230 271
EE 3 3 4 6 5 0
IE 13 11 11 7 11 11
EL 32 34 36 35 49 54
ES 62 59 86 86 85 103
FR 166 151 179 166 199 212
HR 10 5 20 9 21 15
IT 154 128 178 183 199 238
CY 1 1 4 2 1 4
LV 1 6 5 2 7 5
LT 4 3 7 9 9 14
LU 2 1 1 1 2 2
HU 13 22 30 35 25 36
MT 1 0 1 2 0 1
NL 25 23 46 29 38 36
AT 20 20 26 26 34 40
PL 72 84 105 123 145 167
PT 28 26 28 24 33 27
RO 40 36 51 61 67 57
SI 3 3 5 7 7 12
SK 7 5 32 11 8 16
FI 11 10 8 10 13 20
SE 10 13 10 12 17 17
UK 80 71 84 94 88 111
EU 986 927 1.254 1.283 1.423 1.616
% 6,1% 5,7% 7,7% 7,9% 8,8% 10,0%
IS 1 0 0 0 0 0
NO 4 6 5 6 14 15
CH 11 7 12 21 20 18
Source: CARE (EU road accidents database) or national publications Last update: May 2016

Annual Accident Report 2016
- 58 -
Table 38: Number of driver fatalities by month by country (July to December), 2014
July August September October November December Total
BE 37 34 52 42 47 36 511
BG 45 53 35 52 40 25 436
CZ 55 50 51 38 29 34 451
DK 15 16 8 8 10 14 129
DE 265 225 243 205 165 161 2.421
EE 4 4 4 2 3 3 41
IE 11 10 12 8 8 11 124
EL 57 61 43 46 46 47 540
ES 98 96 105 94 79 90 1.043
FR 218 213 235 248 186 191 2.364
HR 23 25 17 19 11 10 185
IT 207 234 192 221 171 186 2.291
CY 6 0 2 2 3 1 27
LV 13 11 10 8 5 15 88
LT 13 10 7 7 6 8 97
LU 4 2 3 5 3 1 27
HU 29 40 24 33 36 37 360
MT 1 1 0 0 0 0 7
NL 37 27 36 31 29 25 382
AT 24 33 29 22 23 18 315
PL 173 157 164 144 109 102 1.545
PT 40 44 40 34 36 37 397
RO 62 62 62 77 67 51 693
SI 9 7 12 8 8 7 88
SK 21 25 16 15 14 13 183
FI 23 17 16 12 9 12 161
SE 21 19 22 14 7 16 178
UK 95 104 107 93 81 104 1.112
EU 1.606 1.580 1.547 1.488 1.231 1.255 16.196
% 9,9% 9,8% 9,6% 9,2% 7,6% 7,8% 100,0%
IS 0 1 0 0 0 0 2
NO 12 14 11 5 5 5 102
CH 16 16 13 16 12 7 169
Source: CARE (EU road accidents database) or national publications Last update: May 2016

Annual Accident Report 2016
- 59 -
Table 39: Number of passenger fatalities by month by country (January to June), 2014
January February March April May June
BE 3 8 9 11 11 14
BG 11 15 15 26 22 20
CZ 6 2 9 4 12 11
DK 3 4 1 0 1 2
DE 27 21 32 35 32 45
EE 1 0 1 0 0 0
IE 2 1 1 4 3 2
EL 11 7 5 11 10 11
ES 15 16 22 36 20 28
FR 21 29 41 53 38 69
HR 3 1 7 2 7 2
IT 34 28 48 48 49 48
CY 0 1 0 0 2 0
LV 0 4 10 2 4 3
LT 6 4 3 2 1 11
LU 0 0 0 1 0 0
HU 5 12 10 4 5 15
MT 1 1 0 0 0 1
NL 3 3 1 3 2 2
AT 5 5 6 3 3 6
PL 34 31 31 41 57 57
PT 5 6 9 6 10 10
RO 35 22 26 29 26 45
SI 0 1 3 0 0 1
SK 4 3 3 3 2 4
FI 3 2 2 0 1 3
SE 5 1 5 3 3 3
UK 18 16 15 26 17 31
EU 261 244 315 353 338 444
% 6,1% 5,7% 7,3% 8,2% 7,8% 10,3%
IS 1 0 1 0 0 0
NO 3 5 2 0 3 2
CH 1 0 2 4 3 2
Source: CARE (EU road accidents database) or national publications Last update: May 2016

Annual Accident Report 2016
- 60 -
Table 40: Number of passenger fatalities by month by country (July to December), 2014
July August September October November December Total
BE 12 8 8 2 5 5 96
BG 41 27 29 32 15 14 267
CZ 15 16 15 4 6 7 107
DK 3 3 3 2 0 9 31
DE 47 29 43 43 30 45 429
EE 3 2 0 0 0 1 8
IE 6 6 2 1 3 2 33
EL 13 14 14 11 7 16 130
ES 25 36 26 25 35 24 309
FR 52 56 33 45 32 52 521
HR 8 2 5 4 5 4 50
IT 46 47 43 50 41 30 512
CY 2 0 0 1 1 0 7
LV 6 8 2 7 5 2 53
LT 6 6 2 6 7 7 61
LU 0 0 0 3 1 0 5
HU 10 13 5 7 10 18 114
MT 0 0 0 0 1 0 4
NL 5 3 3 4 5 6 40
AT 2 8 2 3 0 1 44
PL 42 64 50 53 43 38 541
PT 8 7 11 9 2 13 96
RO 40 51 43 30 50 31 428
SI 0 1 3 1 3 4 17
SK 8 7 8 4 5 6 57
FI 6 0 0 4 5 6 32
SE 3 4 8 0 3 2 40
UK 32 23 28 19 26 27 278
EU 441 441 386 370 346 370 4.310
% 10,2% 10,2% 9,0% 8,6% 8,0% 8,6% 100,0%
IS 0 0 0 0 0 0 2
NO 6 3 3 0 0 0 27
CH 5 3 3 2 4 2 31
Source: CARE (EU road accidents database) or national publications Last update: May 2016

Annual Accident Report 2016
- 61 -
Table 41: Number of pedestrian fatalities by month by country (January to June), 2014
January February March April May June
BE 10 5 13 4 8 6
BG 16 13 13 13 29 12
CZ 15 6 10 7 7 8
DK 2 2 0 2 1 1
DE 59 40 39 37 24 23
EE 6 1 0 2 0 1
IE 4 2 3 1 3 0
EL 11 10 9 10 8 5
ES 34 23 25 19 17 23
FR 48 45 41 35 23 30
HR 4 9 2 5 3 5
IT 59 47 44 25 25 45
CY 1 1 0 0 0 0
LV 7 6 4 6 3 3
LT 18 8 4 5 6 5
LU 1 0 0 0 0 0
HU 21 9 14 5 8 8
MT 1 0 0 0 0 0
NL 5 4 2 6 8 2
AT 11 11 9 7 2 4
PL 110 95 81 67 56 51
PT 16 10 15 7 10 9
RO 48 55 51 34 36 47
SI 4 2 3 0 5 0
SK 5 4 9 1 1 4
FI 3 2 3 2 2 1
SE 3 3 6 4 2 8
UK 38 31 39 26 27 28
EU 560 444 439 330 314 329
% 9,8% 7,8% 7,7% 5,8% 5,5% 5,7%
IS 0 0 0 0 0 0
NO 2 3 2 1 1 1
CH 4 1 3 1 3 3
Source: CARE (EU road accidents database) or national publications Last update: May 2016

Annual Accident Report 2016
- 62 -
Table 42: Number of pedestrian fatalities by month by country (July to December), 2014
July August September October November December Total
BE 11 7 8 9 14 11 106
BG 14 17 14 22 16 19 198
CZ 8 4 11 16 18 20 130
DK 3 2 2 1 3 3 22
DE 29 29 41 44 67 95 527
EE 2 1 1 5 4 3 26
IE 1 3 3 4 4 3 31
EL 9 12 15 15 10 11 125
ES 30 23 32 25 43 40 336
FR 32 37 49 54 62 43 499
HR 13 1 4 11 10 6 73
IT 43 40 50 58 62 80 578
CY 1 3 0 0 1 3 10
LV 5 4 5 8 7 13 71
LT 8 0 12 11 11 21 109
LU 0 0 0 1 0 1 3
HU 6 10 12 20 11 28 152
MT 1 0 0 0 0 0 2
NL 3 6 4 4 1 5 50
AT 7 1 4 4 4 7 71
PL 60 72 98 126 120 180 1.116
PT 12 10 8 11 18 19 145
RO 52 67 62 73 83 89 697
SI 1 0 1 1 0 3 20
SK 12 8 7 12 7 11 81
FI 1 5 4 2 4 7 36
SE 3 2 2 1 6 12 52
UK 34 28 31 41 67 74 464
EU 401 392 480 579 653 807 5.730
% 7,0% 6,8% 8,4% 10,1% 11,4% 14,1% 100,0%
IS 0 0 0 0 0 0 0
NO 0 1 1 4 2 0 18
CH 4 4 3 6 6 5 43
Source: CARE (EU road accidents database) or national publications Last update: May 2016

Annual Accident Report 2016
- 63 -
Figure 23: Total number of fatalities by day of week and road user type in the EU, 2014
Source: CARE (EU road accidents database) or national publications Last update: May 2016
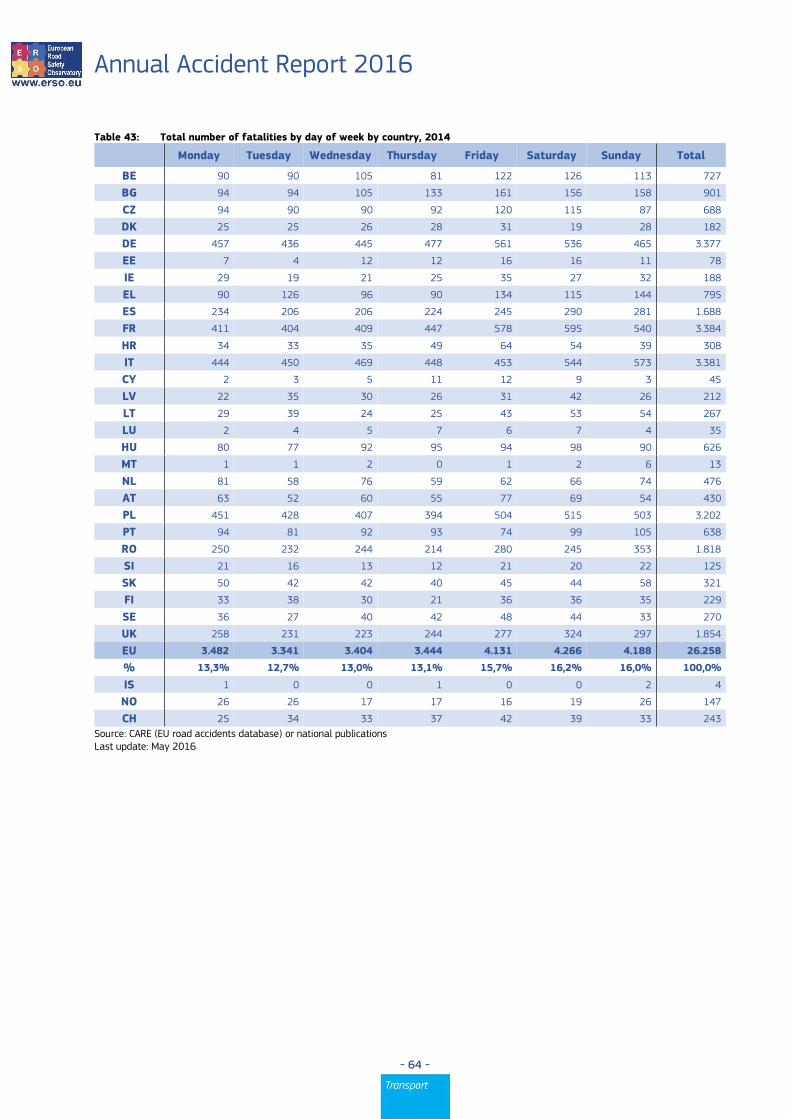
Annual Accident Report 2016
- 64 -
Table 43: Total number of fatalities by day of week by country, 2014
Monday Tuesday Wednesday Thursday Friday Saturday Sunday Total
BE 90 90 105 81 122 126 113 727
BG 94 94 105 133 161 156 158 901
CZ 94 90 90 92 120 115 87 688
DK 25 25 26 28 31 19 28 182
DE 457 436 445 477 561 536 465 3.377
EE 7 4 12 12 16 16 11 78
IE 29 19 21 25 35 27 32 188
EL 90 126 96 90 134 115 144 795
ES 234 206 206 224 245 290 281 1.688
FR 411 404 409 447 578 595 540 3.384
HR 34 33 35 49 64 54 39 308
IT 444 450 469 448 453 544 573 3.381
CY 2 3 5 11 12 9 3 45
LV 22 35 30 26 31 42 26 212
LT 29 39 24 25 43 53 54 267
LU 2 4 5 7 6 7 4 35
HU 80 77 92 95 94 98 90 626
MT 1 1 2 0 1 2 6 13
NL 81 58 76 59 62 66 74 476
AT 63 52 60 55 77 69 54 430
PL 451 428 407 394 504 515 503 3.202
PT 94 81 92 93 74 99 105 638
RO 250 232 244 214 280 245 353 1.818
SI 21 16 13 12 21 20 22 125
SK 50 42 42 40 45 44 58 321
FI 33 38 30 21 36 36 35 229
SE 36 27 40 42 48 44 33 270
UK 258 231 223 244 277 324 297 1.854
EU 3.482 3.341 3.404 3.444 4.131 4.266 4.188 26.258
% 13,3% 12,7% 13,0% 13,1% 15,7% 16,2% 16,0% 100,0%
IS 1 0 0 1 0 0 2 4
NO 26 26 17 17 16 19 26 147
CH 25 34 33 37 42 39 33 243
Source: CARE (EU road accidents database) or national publications Last update: May 2016

Annual Accident Report 2016
- 65 -
Table 44: Number of fatalities by day of week by country, 2014 (drivers)
Monday Tuesday Wednesday Thursday Friday Saturday Sunday Total
BE 61 64 75 54 90 88 79 511
BG 42 37 50 53 87 77 90 436
CZ 64 66 56 56 83 71 55 451
DK 16 17 17 24 23 12 20 129
DE 336 306 332 354 406 360 327 2.421
EE 4 0 6 4 10 10 7 41
IE 19 16 10 16 26 16 21 124
EL 55 88 70 67 90 84 86 540
ES 138 128 131 144 154 162 187 1.043
FR 307 283 288 312 394 398 382 2.364
HR 21 19 24 27 38 35 21 185
IT 303 311 311 307 295 380 384 2.291
CY 1 3 2 7 5 6 3 27
LV 6 14 14 15 10 17 12 88
LT 9 14 9 11 18 18 18 97
LU 2 4 4 6 4 5 2 27
HU 49 39 60 60 47 56 49 360
MT 1 1 1 0 1 1 2 7
NL 66 45 61 46 50 53 61 382
AT 48 42 44 36 54 48 43 315
PL 210 207 198 193 239 259 239 1.545
PT 60 52 59 54 41 63 68 397
RO 95 94 94 72 100 97 141 693
SI 16 13 11 8 12 13 15 88
SK 22 22 23 20 32 27 37 183
FI 23 27 22 18 23 25 23 161
SE 24 23 24 26 29 28 24 178
UK 147 143 129 144 174 184 191 1.112
EU 2.145 2.078 2.125 2.134 2.535 2.593 2.587 16.196
% 13,2% 12,8% 13,1% 13,2% 15,7% 16,0% 16,0% 100,0%
IS 0 0 0 1 0 0 1 2
NO 20 15 12 13 14 12 16 102
CH 15 23 24 26 27 28 26 169
Source: CARE (EU road accidents database) or national publications Last update: May 2016

Annual Accident Report 2016
- 66 -
Table 45: Number of fatalities by day of week by country, 2014 (passengers)
Monday Tuesday Wednesday Thursday Friday Saturday Sunday Total
BE 16 4 13 11 7 25 20 96
BG 31 30 29 29 50 58 40 267
CZ 14 11 9 17 12 25 19 107
DK 4 4 5 1 6 4 7 31
DE 42 39 44 57 65 106 76 429
EE 0 1 1 1 2 2 1 8
IE 7 1 3 3 5 8 6 33
EL 18 20 8 7 23 16 38 130
ES 41 35 31 35 36 77 53 309
FR 51 51 43 60 100 124 92 521
HR 6 5 1 9 12 7 10 50
IT 59 51 59 62 69 81 131 512
CY 0 0 1 3 1 2 0 7
LV 6 10 6 4 4 13 10 53
LT 4 5 2 6 5 18 21 61
LU 0 0 1 0 2 0 2 5
HU 9 12 15 16 14 19 29 114
MT 0 0 0 0 0 1 3 4
NL 7 0 12 4 5 7 5 40
AT 7 1 8 5 9 11 3 44
PL 66 70 61 59 80 99 106 541
PT 9 12 16 10 10 16 23 96
RO 51 44 53 34 75 62 109 428
SI 1 1 2 2 3 3 5 17
SK 9 8 8 7 5 8 12 57
FI 5 2 2 0 6 7 10 32
SE 2 2 5 6 9 9 7 40
UK 35 29 35 34 36 56 53 278
EU 500 448 473 482 651 864 891 4.310
% 11,6% 10,4% 11,0% 11,2% 15,1% 20,1% 20,7% 100,0%
IS 1 0 0 0 0 0 1 2
NO 4 9 2 2 1 3 6 27
CH 5 3 4 3 7 5 4 31
Source: CARE (EU road accidents database) or national publications Last update: May 2016

Annual Accident Report 2016
- 67 -
Table 46: Number of fatalities by day of week by country, 2014 (pedestrians)
Monday Tuesday Wednesday Thursday Friday Saturday Sunday Total
BE 12 20 12 15 22 12 13 106
BG 21 27 26 51 24 21 28 198
CZ 16 13 25 19 25 19 13 130
DK 5 4 4 3 2 3 1 22
DE 79 91 69 66 90 70 62 527
EE 3 3 4 7 4 3 2 26
IE 3 2 8 6 4 3 5 31
EL 17 18 18 16 21 15 20 125
ES 55 43 44 45 55 51 41 336
FR 53 70 78 75 84 73 66 499
HR 7 9 10 13 14 12 8 73
IT 82 88 99 79 89 83 58 578
CY 1 0 1 1 6 1 0 10
LV 10 11 10 7 17 12 4 71
LT 16 20 13 8 20 17 15 109
LU 0 0 0 1 0 2 0 3
HU 22 26 17 19 33 23 12 152
MT 0 0 1 0 0 0 1 2
NL 6 13 3 9 7 6 6 50
AT 8 9 8 14 14 10 8 71
PL 175 151 148 142 185 157 158 1.116
PT 25 17 17 29 23 20 14 145
RO 104 94 97 108 105 86 103 697
SI 4 2 0 2 6 4 2 20
SK 19 12 11 13 8 9 9 81
FI 5 9 6 3 7 4 2 36
SE 10 2 11 10 10 7 2 52
UK 76 59 59 66 67 84 53 464
EU 834 813 799 827 942 807 706 5.730
% 14,6% 14,2% 14,0% 14,4% 16,4% 14,1% 12,3% 100,0%
IS 0 0 0 0 0 0 0 0
NO 2 2 3 2 1 4 4 18
CH 5 8 5 8 8 6 3 43
Source: CARE (EU road accidents database) or national publications Last update: May 2016

Annual Accident Report 2016
- 68 -
Table 47: Number of fatalities by hour of day (00-08) by country, 2014
00 01 02 03 04 05 06 07 08
BE 21 30 24 24 22 28 25 23 25
BG 5 51 20 12 28 23 30 24 36
CZ 15 13 16 9 13 24 26 33 35
DK 6 3 1 4 2 5 4 7 9
DE 71 62 42 56 64 100 122 138 130
EE 0 1 1 3 2 2 1 1 2
IE 6 7 10 5 5 3 5 4 5
EL 26 13 18 15 34 32 28 34 32
ES 41 23 30 32 20 31 58 90 71
FR 95 73 79 60 76 96 126 136 151
HR 6 9 5 7 7 8 14 16 17
IT 90 108 61 83 66 74 71 112 119
CY 1 1 1 3 2 2 1 2 2
LV 12 6 2 4 5 2 5 6 18
LT 9 7 5 5 3 5 4 22 9
LU 0 1 2 0 1 0 2 0 2
HU 12 14 7 8 25 30 25 28 20
MT 0 0 0 2 2 0 1 1 0
NL 5 9 10 4 8 12 16 23 23
AT 5 10 7 10 11 10 14 20 17
PL 68 61 53 69 58 88 126 115 116
PT 9 9 14 14 8 9 16 41 37
RO 49 36 36 42 34 60 63 58 57
SI 1 1 3 5 5 4 7 3 3
SK 6 4 7 4 1 5 36 14 9
FI 6 8 9 3 5 5 7 7 5
SE 4 6 7 2 4 3 4 4 8
UK 49 50 42 32 37 50 45 72 69
EU 618 616 512 517 548 711 882 1.034 1.027
% 2,4% 2,3% 2,0% 2,0% 2,1% 2,7% 3,4% 3,9% 3,9%
IS 0 0 0 0 0 0 0 0 0
NO 6 2 5 2 0 4 4 5 13
CH 3 4 1 8 4 4 12 5 9
Source: CARE (EU road accidents database) or national publications Last update: May 2016

Annual Accident Report 2016
- 69 -
Table 48: Number of fatalities by hour of day (09-16) by country, 2014
09 10 11 12 13 14 15 16
BE 26 19 36 27 28 32 49 53
BG 30 44 40 27 31 39 57 58
CZ 24 26 28 36 28 41 52 44
DK 4 9 6 4 12 18 18 10
DE 132 165 172 194 215 245 235 251
EE 1 2 3 3 2 6 2 2
IE 4 5 9 9 9 16 9 11
EL 29 42 29 51 33 36 27 41
ES 69 76 87 102 110 71 77 97
FR 147 161 189 127 130 184 205 227
HR 9 12 10 15 16 13 12 19
IT 129 169 164 183 144 133 186 215
CY 1 3 4 2 0 2 3 0
LV 4 7 4 9 11 14 10 13
LT 6 7 6 11 5 17 14 11
LU 0 4 1 1 3 0 1 7
HU 30 26 34 27 28 31 43 44
MT 1 0 1 1 0 0 0 0
NL 15 20 31 22 29 32 38 32
AT 24 32 23 24 23 15 31 27
PL 83 122 131 144 145 168 165 219
PT 25 26 37 27 25 42 39 31
RO 67 56 72 77 94 86 91 111
SI 1 5 7 7 5 7 4 5
SK 11 14 18 12 13 19 10 29
FI 11 15 12 11 10 15 22 15
SE 14 14 18 21 21 21 23 22
UK 64 96 108 71 95 91 124 131
EU 961 1.177 1.280 1.245 1.265 1.394 1.547 1.725
% 3,7% 4,5% 4,9% 4,7% 4,8% 5,3% 5,9% 6,6%
IS 1 0 0 2 0 0 0 0
NO 3 7 9 5 9 14 10 6
CH 11 15 21 7 16 16 21 14
Source: CARE (EU road accidents database) or national publications Last update: May 2016

Annual Accident Report 2016
- 70 -
Table 49: Number of fatalities by hour of day (17-24) by country, 2014
17 18 19 20 21 22 23
Un-known
Total
BE 52 37 36 28 29 25 23 5 727
BG 58 72 47 45 45 46 33 0 901
CZ 44 52 26 26 26 21 23 7 688
DK 16 13 7 7 7 6 4 0 182
DE 257 201 150 120 95 88 72 0 3.377
EE 5 4 17 6 3 4 5 0 78
IE 13 10 10 8 14 6 5 0 188
EL 42 46 52 37 49 27 22 0 795
ES 78 115 105 103 83 72 47 0 1.688
FR 243 235 178 180 101 92 93 0 3.384
HR 14 28 17 15 23 8 8 0 308
IT 218 298 209 179 160 102 85 23 3.381
CY 3 1 2 2 3 3 1 0 45
LV 7 16 15 15 12 9 6 0 212
LT 24 19 28 19 16 7 8 0 267
LU 4 2 2 0 2 0 0 0 35
HU 46 47 34 32 19 11 5 0 626
MT 0 0 1 0 1 1 1 0 13
NL 33 20 26 17 18 17 16 0 476
AT 29 32 14 14 15 11 12 0 430
PL 228 245 215 208 138 144 93 0 3.202
PT 44 48 48 36 22 20 11 0 638
RO 144 130 130 113 93 66 53 0 1.818
SI 12 14 6 8 5 7 0 0 125
SK 18 23 23 12 9 14 10 0 321
FI 9 12 15 8 9 7 3 0 229
SE 13 12 11 4 9 6 10 9 270
UK 124 104 108 74 66 75 77 0 1.854
EU 1.778 1.836 1.532 1.316 1.072 895 726 44 26.258
% 6,8% 7,0% 5,8% 5,0% 4,1% 3,4% 2,8% 0,2% 100,0%
IS 1 0 0 0 0 0 0 0 4
NO 18 8 3 1 2 2 9 0 147
CH 24 10 17 1 8 5 7 0 243
Source: CARE (EU road accidents database) or national publications Last update: May 2016

Annual Accident Report 2016
- 71 -
Figure 24: Number of fatalities by hour of day in the EU, 2014
Source: CARE (EU road accidents database) or national publications Last update: May 2016
Figure 25: Distribution of fatalities by hour of day and road user type in the EU, 2014
Source: CARE (EU road accidents database) or national publications Last update: May 2016

Annual Accident Report 2016
- 72 -
Figure 26: Distribution of fatalities by hour of day and mode of transport in the EU, 2014
Source: CARE (EU road accidents database) or national publications Last update: May 2016

Annual Accident Report 2016
- 73 -
4.3.2 Type of area/road
Figure 27: Number of fatalities by type of area by country, 2014
Source: CARE (EU road accidents database) or national publications Last update: May 2016

Annual Accident Report 2016
- 74 -
Table 50: Number of fatalities by type of area and road by country, 2014
Inside urban area Outside urban area Total
motorway no motorway unknown
BE 188 105 420 14 727
BG 312 36 553 - 901
CZ 234 23 431 - 688
DK 46 14 122 - 182
DE 983 375 2.019 - 3.377
EE 22 - 56 - 78
IE 35 8 145 - 188
EL 401 56 338 - 795
ES 441 290 957 - 1.688
FR 993 220 2.171 - 3.384
HR 191 22 95 - 308
IT 1.505 287 1.589 - 3.381
CY 34 3 8 - 45
LV 69 - 143 - 212
LT - - - 267 267
LU 9 3 23 - 35
HU 237 27 362 - 626
MT 13 - 0 - 13
NL 158 57 205 56 476
AT 123 36 271 - 430
PL 1.466 56 1.680 - 3.202
PT 347 50 241 - 638
RO 1.146 21 651 - 1.818
SI 53 16 56 - 125
SK 157 16 148 - 321
FI 62 8 159 - 229
SE 67 31 158 14 270
UK 631 81 1.142 - 1.854
EU 9.923 1.841 14.143 351 26.258
% 37,8% 7,0% 53,9% 1,3% 100,0%
IS 0 - 4 - 4
NO 30 - 117 0 147
CH 93 12 138 - 243
Source: CARE (EU road accidents database) or national publications Last update: May 2016
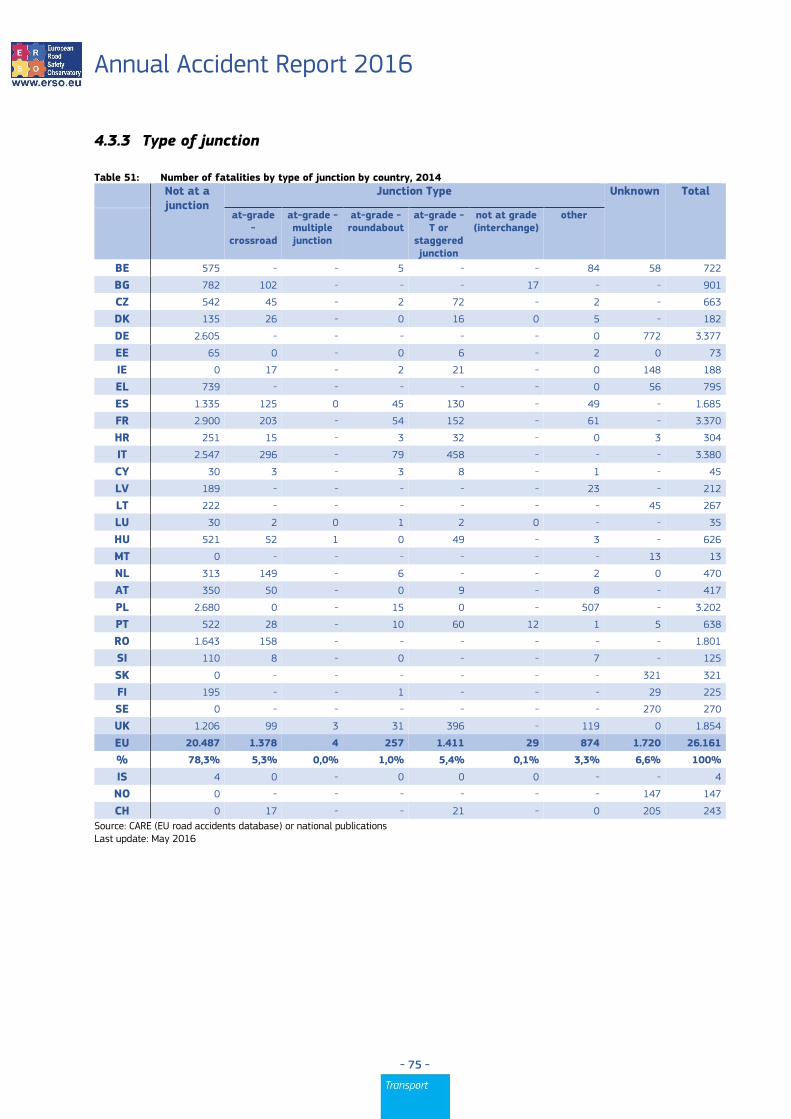
Annual Accident Report 2016
- 75 -
4.3.3 Type of junction
Table 51: Number of fatalities by type of junction by country, 2014
Not at a junction
Junction Type Unknown Total
at-grade -
crossroad
at-grade - multiple junction
at-grade - roundabout
at-grade - T or
staggered junction
not at grade (interchange)
other
BE 575 - - 5 - - 84 58 722
BG 782 102 - - - 17 - - 901
CZ 542 45 - 2 72 - 2 - 663
DK 135 26 - 0 16 0 5 - 182
DE 2.605 - - - - - 0 772 3.377
EE 65 0 - 0 6 - 2 0 73
IE 0 17 - 2 21 - 0 148 188
EL 739 - - - - - 0 56 795
ES 1.335 125 0 45 130 - 49 - 1.685
FR 2.900 203 - 54 152 - 61 - 3.370
HR 251 15 - 3 32 - 0 3 304
IT 2.547 296 - 79 458 - - - 3.380
CY 30 3 - 3 8 - 1 - 45
LV 189 - - - - - 23 - 212
LT 222 - - - - - - 45 267
LU 30 2 0 1 2 0 - - 35
HU 521 52 1 0 49 - 3 - 626
MT 0 - - - - - - 13 13
NL 313 149 - 6 - - 2 0 470
AT 350 50 - 0 9 - 8 - 417
PL 2.680 0 - 15 0 - 507 - 3.202
PT 522 28 - 10 60 12 1 5 638
RO 1.643 158 - - - - - - 1.801
SI 110 8 - 0 - - 7 - 125
SK 0 - - - - - - 321 321
FI 195 - - 1 - - - 29 225
SE 0 - - - - - - 270 270
UK 1.206 99 3 31 396 - 119 0 1.854
EU 20.487 1.378 4 257 1.411 29 874 1.720 26.161
% 78,3% 5,3% 0,0% 1,0% 5,4% 0,1% 3,3% 6,6% 100%
IS 4 0 - 0 0 0 - - 4
NO 0 - - - - - - 147 147
CH 0 17 - - 21 - 0 205 243
Source: CARE (EU road accidents database) or national publications Last update: May 2016

Annual Accident Report 2016
- 76 -
4.3.4 Weather conditions
Figure 28: Number of fatalities by weather conditions in the EU, 2014
Source: CARE (EU road accidents database) or national publications Last update: May 2016
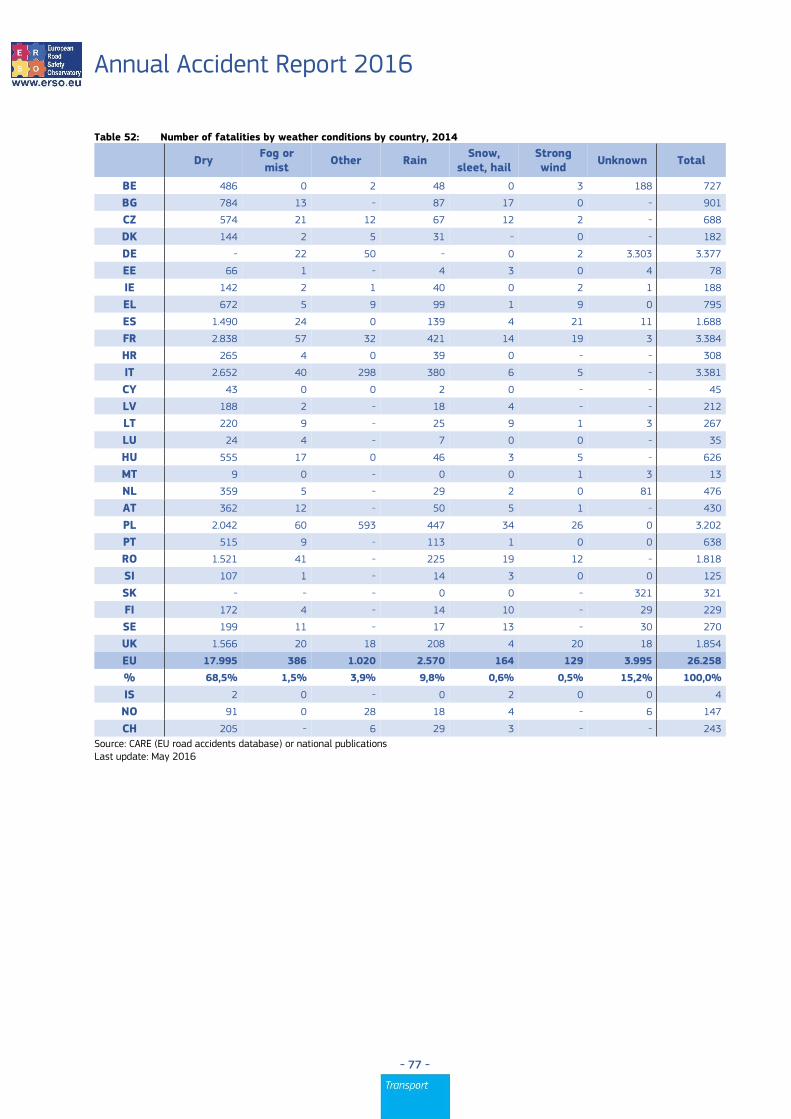
Annual Accident Report 2016
- 77 -
Table 52: Number of fatalities by weather conditions by country, 2014
Dry
Fog or mist
Other Rain Snow,
sleet, hail Strong wind
Unknown Total
BE 486 0 2 48 0 3 188 727
BG 784 13 - 87 17 0 - 901
CZ 574 21 12 67 12 2 - 688
DK 144 2 5 31 - 0 - 182
DE - 22 50 - 0 2 3.303 3.377
EE 66 1 - 4 3 0 4 78
IE 142 2 1 40 0 2 1 188
EL 672 5 9 99 1 9 0 795
ES 1.490 24 0 139 4 21 11 1.688
FR 2.838 57 32 421 14 19 3 3.384
HR 265 4 0 39 0 - - 308
IT 2.652 40 298 380 6 5 - 3.381
CY 43 0 0 2 0 - - 45
LV 188 2 - 18 4 - - 212
LT 220 9 - 25 9 1 3 267
LU 24 4 - 7 0 0 - 35
HU 555 17 0 46 3 5 - 626
MT 9 0 - 0 0 1 3 13
NL 359 5 - 29 2 0 81 476
AT 362 12 - 50 5 1 - 430
PL 2.042 60 593 447 34 26 0 3.202
PT 515 9 - 113 1 0 0 638
RO 1.521 41 - 225 19 12 - 1.818
SI 107 1 - 14 3 0 0 125
SK - - - 0 0 - 321 321
FI 172 4 - 14 10 - 29 229
SE 199 11 - 17 13 - 30 270
UK 1.566 20 18 208 4 20 18 1.854
EU 17.995 386 1.020 2.570 164 129 3.995 26.258
% 68,5% 1,5% 3,9% 9,8% 0,6% 0,5% 15,2% 100,0%
IS 2 0 - 0 2 0 0 4
NO 91 0 28 18 4 - 6 147
CH 205 - 6 29 3 - - 243
Source: CARE (EU road accidents database) or national publications Last update: May 2016

Annual Accident Report 2016
- 78 -
5 Glossary The CARE glossary provides short definitions for variables used in the Annual Statistical Report, and includes short definitions of CARE common values.
The glossary has two components: a) A definition of the common value b) The availability of the common value in the data file for each Member State.
ACCIDENT ACCIDENT
Definition: Occurs on a public road. Occurs on a private road to which the public has right of access (except BE, NL, PT). Involves at least one moving vehicle (except UK, PT). Involves at least one injured or killed person. Is reported by the police. Self reporting possible (BE, UK, EL, IT, IE). Self reporting not possible (DK, FI, NL, AT, PT). Confirmed suicides excluded (BE, UK, IE, NL, AT, DK, PT). Confirmed suicides included (ES, IT, LU).
Note: The variation in the groups of road and the coverage of the injury categories included in injury accidents, together with differences in the level of self reported accidents, will lead to significant variations in the number of injury accidents reported, and their reporting rate, between Member States.
FATAL ACCIDENT
Definition: Accident with at least one killed person regardless the injury severity of any other involved persons.
Note: See “killed” definition from Injury Severity defined in Person type item (Death within 30 days of a road accident [UN/ECE Geneva 1995 – Statistics of Road Traffic Accidents in Europe and North America], except AT [3 days before 1992], ES [24 hours in CARE; 24 hours before 1993 in publication], FR [6 days], EL [24 hours], IT [7 days], PT [24 hours]. Suicide not included [except DK, ES, FR]. Natural death not included [except LU, SE]).
Data availability: All countries
TIME TYPE ITEMS MONTH
Definition: Calendar month
Data availability: All countries (except DK)
HOUR
Definition: Period of 60 minutes. Rounded down to whole hours (except EL, ES, IT: rounded to nearest hour).
Note: Winter time is: - GMT from November to March (DE from 1996 onwards, GB, IE, NI, PT) - GMT +1 hour from October to March (BE, AT, DK prior to 1996, DK, ES, FR, IT, LU, NL, SE) - GMT +2 hours from October to March (EL, FI).
Summer time is one hour ahead of winter time: - GMT +1 hour from April to October (DK from 1996 onwards, GB, IE, NI, PT) - GMT +2 hours from April to September (AT, BE, DK prior to 1996, DK, ES, FR, IT, LU, NL, SE) - GMT +3 hours from April to September (EL, FI)

Annual Accident Report 2016
- 79 -
For PT, unknown hour coded as ‘12’ during daytime and ‘0’ during night time
Data availability: All countries (except DK)
DAY OF WEEK
Definition: 24 hour day within 7 day week.
Note: Data calculated by the CARE system from the date of accident, where data is not available in national files (AT from 1992 onwards, BE, FR prior to 1993, PT, SE).
Data availability: All countries.
ROAD USER TYPE DRIVER
Definition: Person driving or riding any motorised vehicle or pedal cycle. Person herding animals is not a driver (except BE, AT). Learner driver is a driver (except ES, PT). Learner driver is a driver during a driving test, but not in a driving lesson (DK). Driving instructor is not a driver (except ES, PT). Driving instructor is a driver during a driving lesson, but not during a driving test (DK).
Note: Uninjured drivers are included in the database (except GB, NI, NL: implicitly included in vehicle records only). Data on driving instructors and learner drivers collected separately from 1993 onwards (SE).
Data availability: All countries. PASSENGER
Definition: Person on or in a vehicle, who is not the driver. Includes person in the act of boarding or alighting from a vehicle (except DK). Learner driver is not a passenger (except ES, PT). Learner driver is a passenger during a driving lesson, but not during a driving test (DK). Driving instructor is a passenger (except ES, PT). Driving instructor is a passenger during a driving test, but not in a driving lesson (DK).
Note: Uninjured passengers not included in the database (except FR, IE, LU; ES, FI in some cases, AT).
Data availability: All countries. PEDESTRIAN
Definition: Person on foot. Person pushing or holding bicycle (except DK). Person pushing a pram or pushchair. Person leading or herding an animal (except DK, AT). Person riding a toy cycle on the footway (except AT). Person on roller skates, skateboard or skis (except AT). Does not include person in the act of boarding or alighting from a vehicle (except DK, ES).
Note: Uninjured pedestrians not included in the database (except BE, IE, LU, NL implicitly included in element records; DK, FR, FI, AT, SE if they caused the accident; ES not consistently).
Data availability: All countries.
TYPE OF INJURY INJURED
Definition: Injured with application of correcting coefficient as stated for the 'Killed at 30 days'. Injured in a road accident. Hospitalisation or medical treatment not necessarily required (except FR). Self declaration of injury (DK if slight; FI, GB, IT, IE, NI). Opinion of the police. Aggregation of the following. injury severities: SERIOUSLYINJUREDASREPORTED + SLIGHTLY INJURED + INJURED - 1 COEFFICIENT
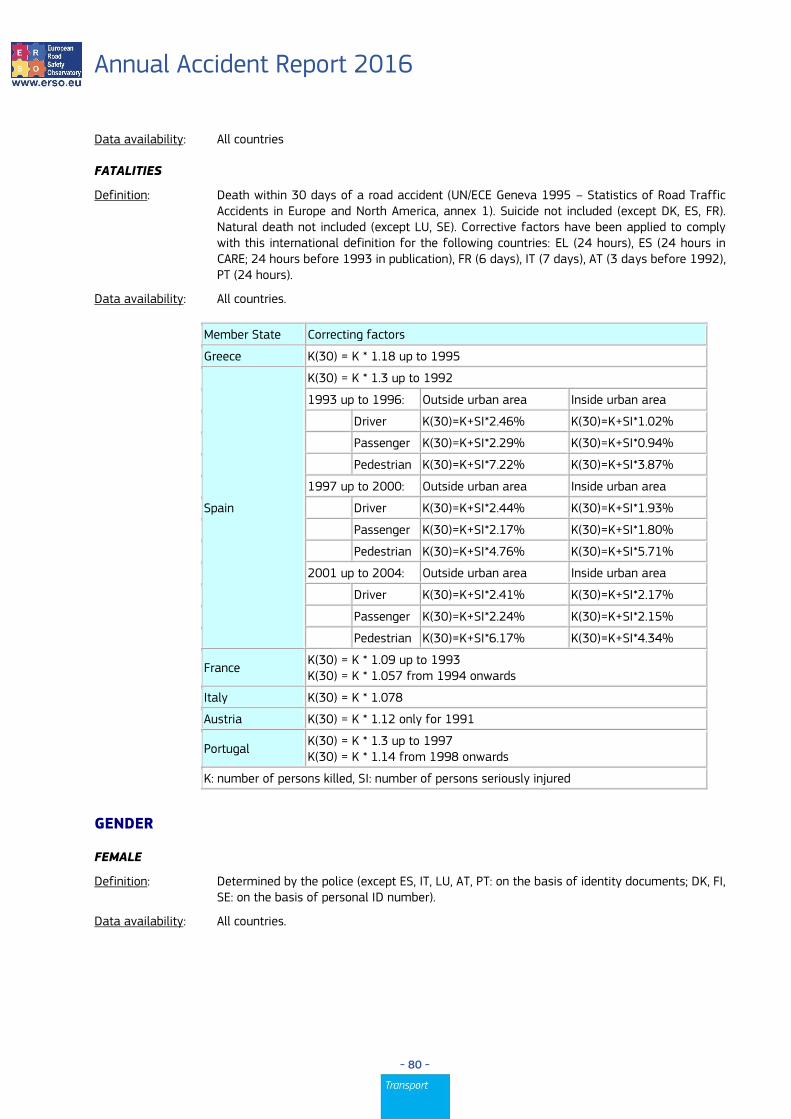
Annual Accident Report 2016
- 80 -
Data availability: All countries FATALITIES
Definition: Death within 30 days of a road accident (UN/ECE Geneva 1995 – Statistics of Road Traffic Accidents in Europe and North America, annex 1). Suicide not included (except DK, ES, FR). Natural death not included (except LU, SE). Corrective factors have been applied to comply with this international definition for the following countries: EL (24 hours), ES (24 hours in CARE; 24 hours before 1993 in publication), FR (6 days), IT (7 days), AT (3 days before 1992), PT (24 hours).
Data availability: All countries.
Member State Correcting factors
Greece K(30) = K * 1.18 up to 1995
Spain
K(30) = K * 1.3 up to 1992
1993 up to 1996: Outside urban area Inside urban area
Driver K(30)=K+SI*2.46% K(30)=K+SI*1.02%
Passenger K(30)=K+SI*2.29% K(30)=K+SI*0.94%
Pedestrian K(30)=K+SI*7.22% K(30)=K+SI*3.87%
1997 up to 2000: Outside urban area Inside urban area
Driver K(30)=K+SI*2.44% K(30)=K+SI*1.93%
Passenger K(30)=K+SI*2.17% K(30)=K+SI*1.80%
Pedestrian K(30)=K+SI*4.76% K(30)=K+SI*5.71%
2001 up to 2004: Outside urban area Inside urban area
Driver K(30)=K+SI*2.41% K(30)=K+SI*2.17%
Passenger K(30)=K+SI*2.24% K(30)=K+SI*2.15%
Pedestrian K(30)=K+SI*6.17% K(30)=K+SI*4.34%
France K(30) = K * 1.09 up to 1993 K(30) = K * 1.057 from 1994 onwards
Italy K(30) = K * 1.078
Austria K(30) = K * 1.12 only for 1991
Portugal K(30) = K * 1.3 up to 1997 K(30) = K * 1.14 from 1998 onwards
K: number of persons killed, SI: number of persons seriously injured
GENDER FEMALE
Definition: Determined by the police (except ES, IT, LU, AT, PT: on the basis of identity documents; DK, FI, SE: on the basis of personal ID number).
Data availability: All countries.

Annual Accident Report 2016
- 81 -
MALE
Definition: Determined by the police (except ES, IT, LU, AT, PT: on the basis of identity documents; DK, FI, SE: on the basis of personal ID number).
Data availability: All countries.
AGE AGE
Definition: Length of life of person. Rounded down to whole number of years (except EL, IT, NI: rounded to nearest year).
Note: Age 0 to 1 is exceptionally rounded up (FR, IT, IE, LU, NI, PT). Age over 99 only available for ES, FR (1993 on), NL.
Data availability: All countries.
AREA TYPE INSIDE URBAN AREA
Definition: Area inside urban area boundary signs (except IE, UK). Includes dual carriageways and national roads. Can include motorways (except DK, EL, IT). Opinion of the police (DK, SE).
Note: Data approximated from speed limit of 40 mph or less (IE, UK).
Data availability: All countries.
OUTSIDE URBAN AREA
Definition: Area outside urban area boundary signs. Opinion of the police (DK, SE). Includes motorways.
Note: Data approximated from speed limit of over 40 mph (IE, UK).
Data availability: All countries.
MOTORWAY
Definition: Public road with dual carriageways, and at least two lanes each way. Entrance and exit signposted. Road with grade separated interchanges. Road with a central barrier or central reservation. No crossing permitted. No stopping permitted unless in an emergency. Entry prohibited for pedestrians, animals, pedal cycles, mopeds, agricultural vehicles; learner drivers (BE, GB, EL, IE, NI, PT). Access restricted to motor vehicles (DK, FI, AT). Minimum speed between 50 km/h and 80 km/h (except FR, UK). Maximum speed between 100 km/h and 130 km/h (except DK recommended 130 km/h).
Data availability: All countries.
MODES OF TRANSPORT–VEHICLE GROUP AGRICULTURAL TRACTOR
Definition: Motor vehicle for agricultural use, with wheels or caterpillar tracks, with at least two axles. Driving licence required (DK, EL, ES, FI, GB, IT, IE, LU, AT; not in FR). Maximum speed 30 km/h or 40 km/h.
Data availability: All countries (except DK prior to 1997, AT, FR, GB, IE from 1996 onwards, LU).

Annual Accident Report 2016
- 82 -
Value included in another value: agricultural machine (FR), construction or agricultural machine (DK, AT prior to 1997),
agricultural or industrial tractor (LU), other motor vehicle (GB), other (IE from 1996 onwards). BUS OR COACH
Definition: Motor vehicle with at least four wheels, used for transporting people. Public or private use. Type D driving licence required (BE, GB, IE, NI). Includes bus, more than 8 and 16 seats, minibus, trolley-bus (except LU), scheduled bus, unscheduled bus, school bus.
Data availability: All countries.
CAR OR TAXI
Definition: Includes car, taxi. Motor vehicle with four wheels. Used to transport only or mainly people. Seating for no more than 8 passengers. Type B driving licence required. Includes taxi-bus (NL).
Data availability: All countries.
HEAVY GOODS VEHICLE
Definition: Includes road tractor, road tractor with semi trailer, lorry over 3,5 tonnes. Motor vehicle with at least four wheels, with a permissible gross vehicle weight of over 3.5 tonnes, used only for the transport of goods. With or without a trailer. Type C driving licence required. Includes lorry, over 3.5 tonnes ; road tractor ; road tractor with semi-trailer ; lorry with trailer ; tanker (except FI).
Note: Lorries cannot systematically be categorised as over 3.5 tonnes (DK, IT).
Data availability: All countries (except DE, IT).
LORRY, LESS THAN 3,5 TONNES
Definition: Motor vehicle with a permissible gross vehicle weight of less than 3.5 tonnes, used only for the transport of goods. Type B driving licence required.
Note: Lorries cannot systematically be categorised as less than 3.5 tonnes (DK, IT).
Data availability: All countries (except DK, IT, LU).
MOPED
Definition: Motor vehicle with two wheels, with an engine size of less than 50 cc. Design speed between 25 km/h and 50 km/h. One or two seats. Minimum age for driver between 14 and 18 (except IT). No driving licence required (ES, FR, FI, GB, IT, PT, SE). Unregistered vehicle (BE, DK, ES, FR, SE).
Data availability: All countries (except IE from 1996 onwards).
Value included in another value: Two wheeled motor vehicle (IE from 1996 onwards).
MOTORCYCLE
Definition: Motor vehicle with two or three wheels (not three wheeled in DK), with an engine size of more than 50 cc. With a trailer possible (except DK). With a sidecar possible. Registered vehicle (except PT). Type A driving licence required. Includes motor scooter (except FR).
Data availability: All countries (except IE from 1996 onwards).

Annual Accident Report 2016
- 83 -
Value included in another value: two wheeled motor vehicle (IE from 1996 onwards).
OTHER VEHICLE
Definition: Includes other non-motor vehicle, other motor vehicle.
PEDAL CYCLE
Definition: Vehicle with at least two wheels, without engine, moved by pedals or hand cranks. With or without a trailer. With or without passengers. Ridden in the carriageway. Ridden on the pavement (except DK, LU).
Data availability: All countries.
PEDESTRIAN
Definition: Wherever a person´s person class has been identified as being pedestrian, its vehicle type is “pedestrian”. This as opposed to older version of CARE where a pedestrian didn´t have a vehicle type.
Data availability: All countries.
JUNCTION TYPE JUNCTION
Definition: Road intersection with three or more arms. Not grade separated. Includes t junction, y junction, crossroad, level crossing (except DK, FI, GB, NI), roundabout (except FR), multiple junction.
Data availability: All countries (except EL).
CROSSROAD
Definition: Road intersection with four arms. Opinion of the police (DK, ES, FI; not AT).
Data availability: All countries (except BE, EL).
NOT AT A JUNCTION
Definition: Position on road more than 20m from a junction or roundabout (GB, IE, NI, NL, AT). Position on road more than 50m from a junction (FR). Opinion of the police (BE, DK, ES, FI, IT, LU, SE).
Data availability: All countries (except EL).
ROUNDABOUT
Definition: Circular highway. Includes sections of the road leading into it, within 20m (GB, IE, NI, AT). Opinion of the police (DK, ES, FR, IT).
Data availability: All countries (except BE, DK, EL, FI, LU, PT).
T OR Y JUNCTION
Definition: Road intersection with three arms. Includes t junction, y junction, staggered junction.
Data availability: All countries (except BE, EL, FI, IT, PT).
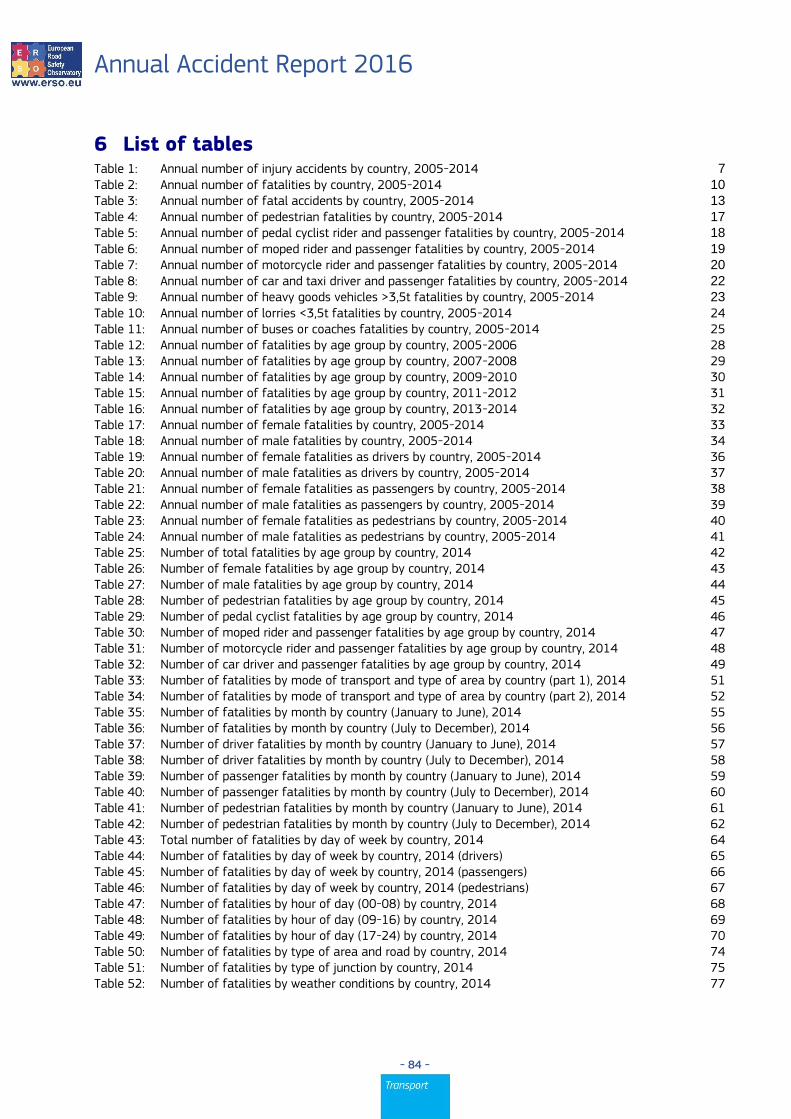
Annual Accident Report 2016
- 84 -
6 List of tables Table 1: Annual number of injury accidents by country, 2005-2014 7
Table 2: Annual number of fatalities by country, 2005-2014 10
Table 3: Annual number of fatal accidents by country, 2005-2014 13
Table 4: Annual number of pedestrian fatalities by country, 2005-2014 17
Table 5: Annual number of pedal cyclist rider and passenger fatalities by country, 2005-2014 18
Table 6: Annual number of moped rider and passenger fatalities by country, 2005-2014 19
Table 7: Annual number of motorcycle rider and passenger fatalities by country, 2005-2014 20
Table 8: Annual number of car and taxi driver and passenger fatalities by country, 2005-2014 22
Table 9: Annual number of heavy goods vehicles >3,5t fatalities by country, 2005-2014 23 Table 10: Annual number of lorries <3,5t fatalities by country, 2005-2014 24 Table 11: Annual number of buses or coaches fatalities by country, 2005-2014 25 Table 12: Annual number of fatalities by age group by country, 2005-2006 28 Table 13: Annual number of fatalities by age group by country, 2007-2008 29 Table 14: Annual number of fatalities by age group by country, 2009-2010 30 Table 15: Annual number of fatalities by age group by country, 2011-2012 31 Table 16: Annual number of fatalities by age group by country, 2013-2014 32 Table 17: Annual number of female fatalities by country, 2005-2014 33 Table 18: Annual number of male fatalities by country, 2005-2014 34 Table 19: Annual number of female fatalities as drivers by country, 2005-2014 36 Table 20: Annual number of male fatalities as drivers by country, 2005-2014 37 Table 21: Annual number of female fatalities as passengers by country, 2005-2014 38 Table 22: Annual number of male fatalities as passengers by country, 2005-2014 39 Table 23: Annual number of female fatalities as pedestrians by country, 2005-2014 40 Table 24: Annual number of male fatalities as pedestrians by country, 2005-2014 41 Table 25: Number of total fatalities by age group by country, 2014 42 Table 26: Number of female fatalities by age group by country, 2014 43 Table 27: Number of male fatalities by age group by country, 2014 44 Table 28: Number of pedestrian fatalities by age group by country, 2014 45 Table 29: Number of pedal cyclist fatalities by age group by country, 2014 46 Table 30: Number of moped rider and passenger fatalities by age group by country, 2014 47 Table 31: Number of motorcycle rider and passenger fatalities by age group by country, 2014 48 Table 32: Number of car driver and passenger fatalities by age group by country, 2014 49 Table 33: Number of fatalities by mode of transport and type of area by country (part 1), 2014 51 Table 34: Number of fatalities by mode of transport and type of area by country (part 2), 2014 52 Table 35: Number of fatalities by month by country (January to June), 2014 55 Table 36: Number of fatalities by month by country (July to December), 2014 56 Table 37: Number of driver fatalities by month by country (January to June), 2014 57 Table 38: Number of driver fatalities by month by country (July to December), 2014 58 Table 39: Number of passenger fatalities by month by country (January to June), 2014 59 Table 40: Number of passenger fatalities by month by country (July to December), 2014 60 Table 41: Number of pedestrian fatalities by month by country (January to June), 2014 61 Table 42: Number of pedestrian fatalities by month by country (July to December), 2014 62 Table 43: Total number of fatalities by day of week by country, 2014 64 Table 44: Number of fatalities by day of week by country, 2014 (drivers) 65 Table 45: Number of fatalities by day of week by country, 2014 (passengers) 66 Table 46: Number of fatalities by day of week by country, 2014 (pedestrians) 67 Table 47: Number of fatalities by hour of day (00-08) by country, 2014 68 Table 48: Number of fatalities by hour of day (09-16) by country, 2014 69 Table 49: Number of fatalities by hour of day (17-24) by country, 2014 70 Table 50: Number of fatalities by type of area and road by country, 2014 74 Table 51: Number of fatalities by type of junction by country, 2014 75 Table 52: Number of fatalities by weather conditions by country, 2014 77
Annual Accident Report 2016
- 85 -
7 List of figures Figure 1: Annual number of fatalities, injury accidents and injured people in the EU, 2005-2014 5 Figure 2: Fatalities per million inhabitants in the EU, 2014 compared to 2005 6 Figure 3: Percentage change in number of fatalities and injury accidents by country, 2014 and 2005 6 Figure 4: Annual number of injury accidents by country (part 1), 2005-2014 8 Figure 5: Annual number of injury accidents by country (part 2), 2005-2014 8 Figure 6: Annual number of injury accidents by country (part 3), 2005-2014 9 Figure 7: Annual number of injury accidents by country (part 4), 2005-2014 9 Figure 8: Annual number of fatalities by country (part 1), 2005-2014 11 Figure 9: Annual number of fatalities by country (part 2), 2005-2014 11 Figure 10: Annual number of fatalities by country (part 3), 2005-2014 12 Figure 11: Annual number of fatalities by country (part 4), 2005-2014 12 Figure 12: Share of fatalities by area type in the EU, 2014 14 Figure 13: Distribution of male and female fatalities by road user type in the EU, 2014 14 Figure 14: Distribution of fatalities by mode of transport in the EU, 2014 15 Figure 15: Percentage change in number of fatalities by mode of transport in the EU, 2014 and 2005 16 Figure 16: Annual number of fatalities by mode of transport (drivers and passengers, vulnerable modes)
in the EU, 2005-2014 21 Figure 17: Annual number of drivers and passengers fatalities by mode of transport in the EU, 2005-2014 26 Figure 18: Increase/decrease of number of fatalities by gender in the EU, 2014 and 2005 27 Figure 19: Annual distribution of fatalities by gender in the EU, 2005-2014 35 Figure 20: Fatalities by type of area and mode of transport in the EU, 2014 50 Figure 21: Number of fatalities by month in the EU, 2014 53 Figure 22: Number of fatalities by month and road user type in the EU, 2014 54 Figure 23: Total number of fatalities by day of week and road user type in the EU, 2014 63 Figure 24: Number of fatalities by hour of day in the EU, 2014 71 Figure 25: Distribution of fatalities by hour of day and road user type in the EU, 2014 71 Figure 26: Distribution of fatalities by hour of day and mode of transport in the EU, 2014 72 Figure 27: Number of fatalities by type of area by country, 2014 73 Figure 28: Number of fatalities by weather conditions in the EU, 2014 76

Annual Accident Report 2016
- 86 -