Announcements September 8, 2006. Population Biology Lecture Objectives: 1.Learn the population...
46
Announcements September 8, 2006
-
Upload
scott-jones -
Category
Documents
-
view
214 -
download
1
Transcript of Announcements September 8, 2006. Population Biology Lecture Objectives: 1.Learn the population...

Announcements
September 8, 2006

Population Biology
Lecture Objectives:
1. Learn the population characteristics that determine population growth rate
2. Understand why the number of individuals in a population may change over time.
3. Understand the different types of population growth curves
4. Understand the difference between K-selected and r-selected species

Population Characteristics
Population – All organisms of the same kind found within a specific geographic region
Populations can differ in:
*Birthrate
*Death rate
*Sex ratio
*Age distribution
*Density
*Population growth rate

Birthrate (Natality)
Birthrate (b)—Number of individuals added through reproduction over a particular time period.
- In many species, birthrate is influenced by the amount of food available
- Sexually reproducing species must also find mates
- In humans, expressed as # of babies/1000 individuals/year
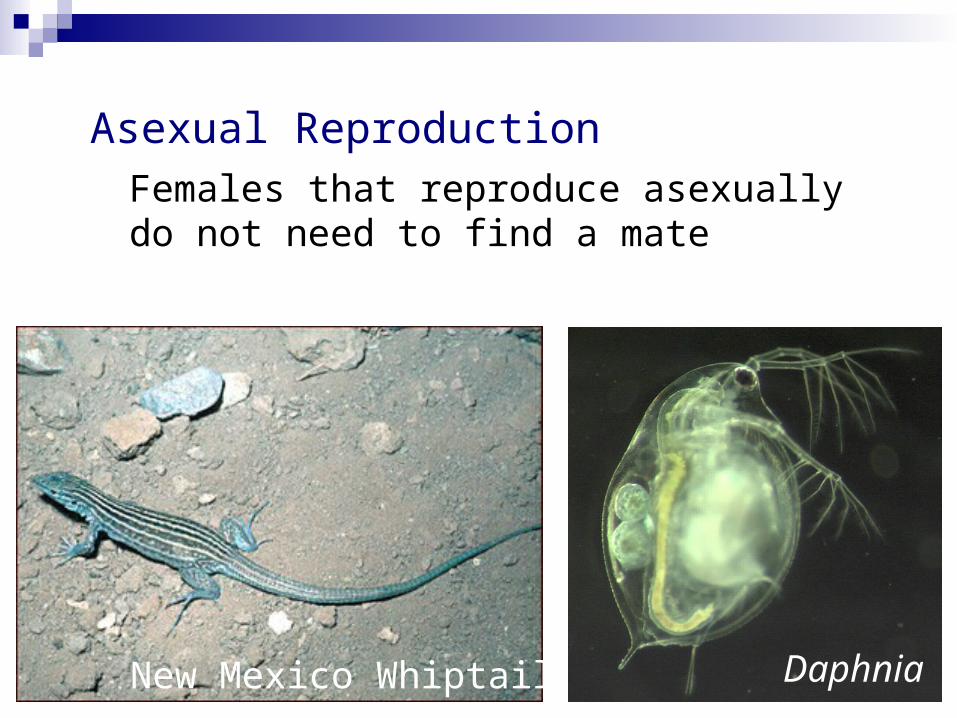
Asexual ReproductionFemales that reproduce asexually do not need to find a mate
New Mexico Whiptail Daphnia
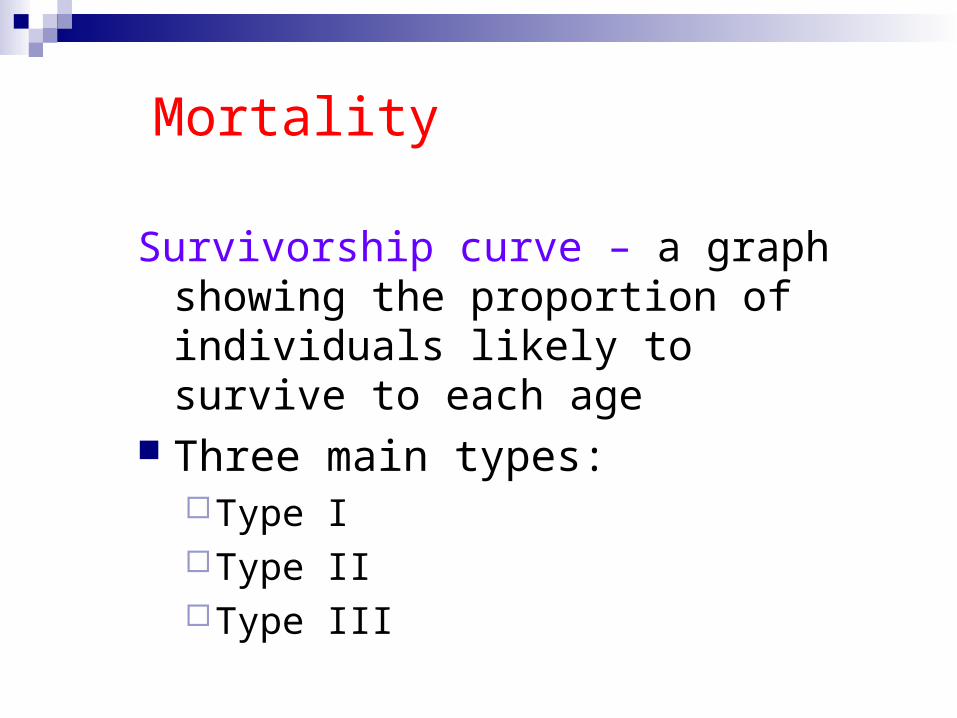
Mortality
Survivorship curve – a graph showing the proportion of individuals likely to survive to each age
Three main types:Type IType IIType III

Type I survivorship curveSurvival is high until old age
Examples:• Dall sheep• Humans in
developed countries

Type II survivorship curve
Mortality is spread evenly among all age groups
Example:•Many species of birds

Type III survivorship curve
Very high mortality among the young
Examples:• Plants• Animals
that produce many offspring

Survivorship curves (continued)
One major factor determining the shape of the survivorship curve is the degree of parental care
How long do parents care for the offspring after they are born?

Population growth rate
Population growth rate (r) – the rate at which the size of the population changes
r = b – d
Assumes no immigration or emigration—when this happens population growth rate is then more generally, (birth + immigration) – (death + emigration)

Population growth rate
If r is positive, birthrate is higher than the death rate and the population size increases
If r is zero, birthrate equals death rate and the population size stays the same
If r is negative, birthrate is less than the death rate and the population size gets smaller

r > 0(+)
r = 0
r < 0(-)
Example for a population of algae
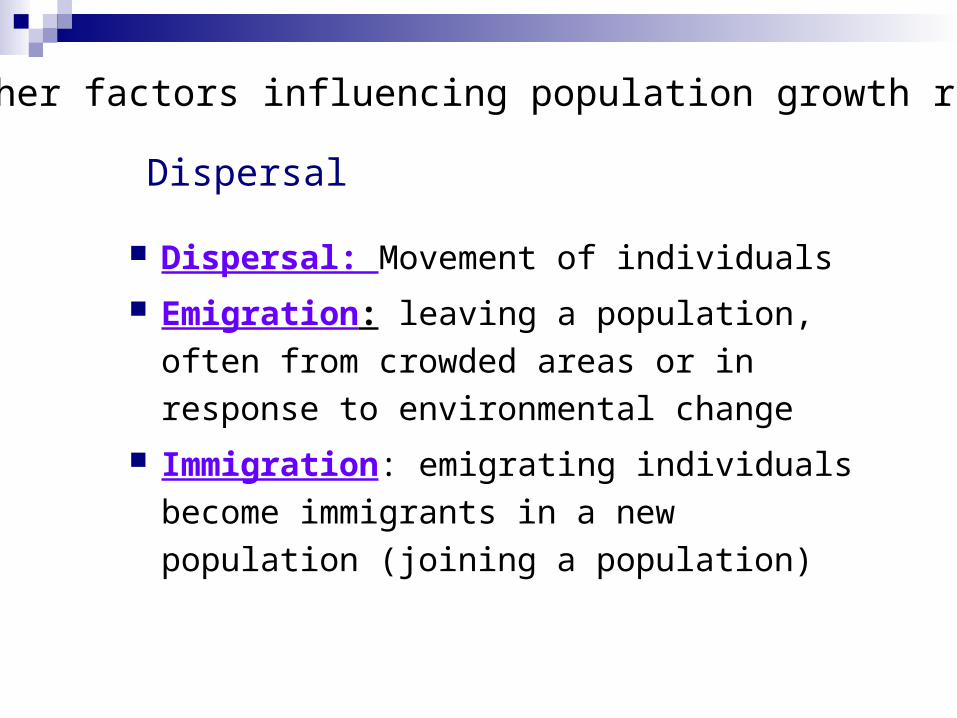
Dispersal: Movement of individuals
Emigration: leaving a population, often from crowded areas or in response to environmental change
Immigration: emigrating individuals become immigrants in a new population (joining a population)
Other factors influencing population growth rate
Dispersal

Other factors influencing population growth rate
Sex Ratio
Sex Ratio—Relative number of males and females in a population.
In many sexually reproducing species, with separate sexes, sex ratio is 1:1
In other species (e.g., asexuals, social insects) can have far more females than males

Other factors influencing population growth rate
Age Distribution (Age Structure)
Age Distribution—Number of individuals of each age in the population.
Greatly influences reproductive rate of a population.


Summary of factors influencing population growth rate
Birthrate Death rate
Sex Ratio Age distribution
Immigration Emigration
How many individuals are in a population at any given time?
How many individuals will be in the population one generation later?
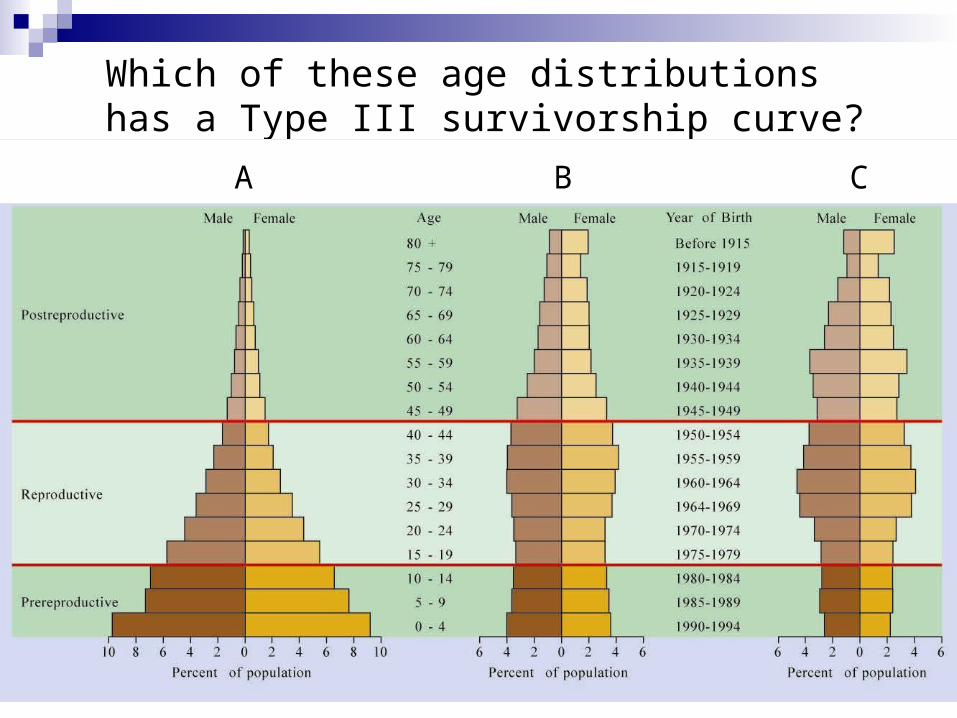
Which of these age distributions has a Type III survivorship curve?
A B C

Population Density (N)—Number of individuals per unit area.
High population density may lead to increased competition for resources, increased emigration, increased death rate
Population Density
Population 1
N = 4 flowers/m2 N = 12 flowers/m2
Population 2

Population Growth Curve Biotic Potential—Inherent reproductive
capacity. Generally, biotic potential is much above
replacement level. Natural tendency for increase.
When not limited, populations tend to grow exponentially
How to combine number of individuals (N) and population growth rate (r)?

Exponential Growth
Note: This equation is provided only to help. You do not need to memorize it. You will not be asked about the equation on a
test.
Change in number over time
rNdtdN =
Population growth rate
Number of individuals
The number of individuals in each generation is a multiple of the previous generation

Example of exponential growth
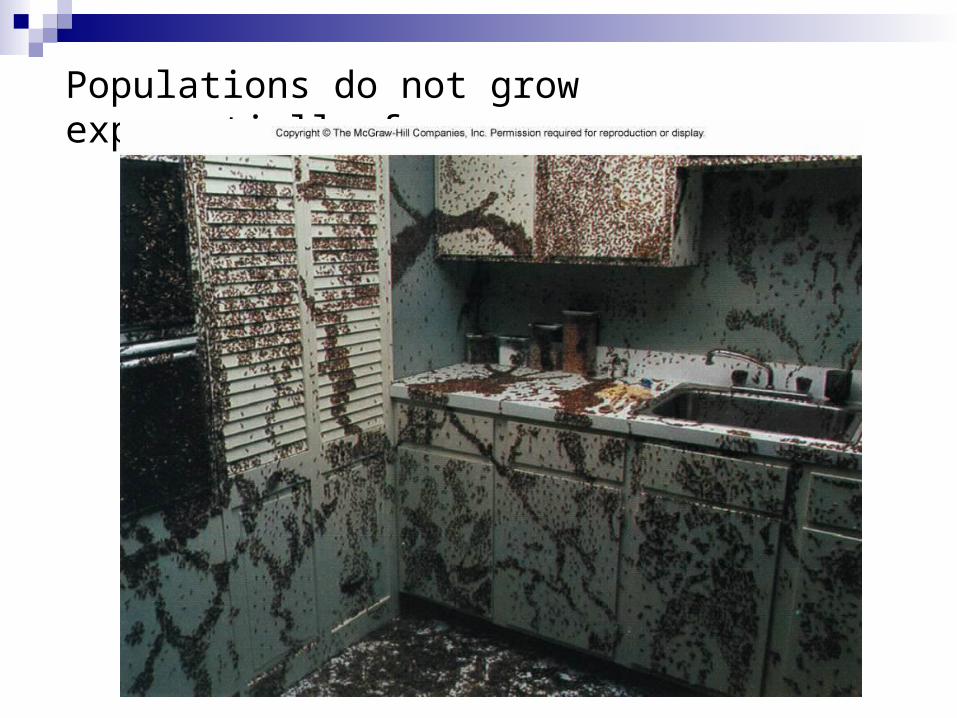
Populations do not grow exponentially forever

Population Growth Curve

Typical Growth Curve Lag Phase—First portion of the curve; slow
population growth. Exponential Growth Phase—More organisms
reproducing causing accelerated growth; continues as long as birth rate exceeds death rate.
Stable Equilibrium Phase—Death rate and birth rate equilibrate; population stops growing.

Carrying Capacity —Number of individuals of a species that can be indefinitely sustained in a given area.

Environmental Resistance
Environmental Resistance—Any factor (limiting factor) in the environment influencing carrying capacity. Four main factors:Raw material availabilityEnergy availabilityWaste accumulation and disposalOrganism interaction

Logistic Equation
⎟⎠⎞
⎜⎝⎛ −=
KN
rNdtdN
1
Note: This equation is provided only to help. You do not need to memorize it. You will not be asked about the
equation on a test.

Causes of population crashes
Population size can sometimes overshoot carrying capacity
Environmental resistance factors can change, lowering carry capacity
When population > carrying capacity,death rates > birth rates
Population crashes!!
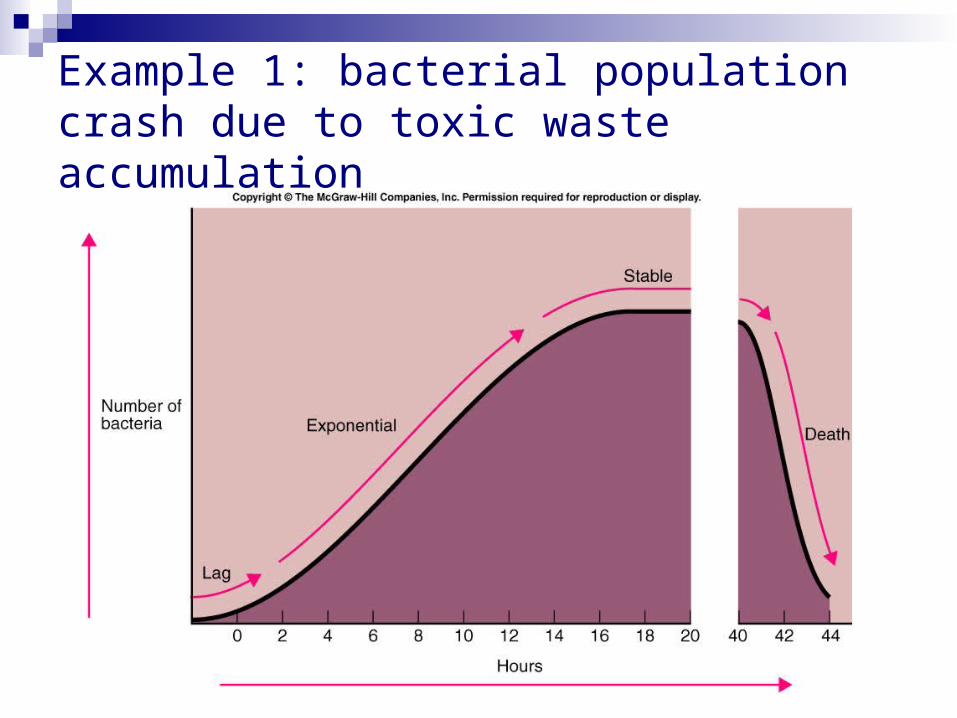
Example 1: bacterial population crash due to toxic waste accumulation

Example 2: Population cycling due to organism interaction
Hare population:birth rate limited by food availabilitydeath rate determined by predators, food
Lynx population:birth and death rate determined by food availability (hares)

Example 2: Population cycling due to organism interaction
Start: both have low population density Hares – high food, low predators = pop increase
over next generations Lynx – as hares increase, more food = pop
increase Hares – when high pop density, increased
competition for food and increased predation = low birth rate & high death rate = sharp pop decrease
Lynx – when high pop density and few hares, low food = low birth rate & high death rate = sharp pop decrease
Back to start

Population Cycles

Remember: Several factors influence population growth rate:
Birthrate Death rate
Sex Ratio Age Distribution
Immigration Emigration
But, there are also additional things about the individuals that influence how the population grows

Life history traits – characteristics of an individual that influence survival and reproduction
Age at maturity
11 - 20 years 3-6 years
Atlantic SalmonAfrican elephant
2 months
House Mouse

Life history traits – characteristics of an individual that influence survival and reproduction
Atlantic SalmonAfrican elephantHouse Mouse
1 calf every 3-8 years
1,500 to 8,000 eggs once
5-8 young every month
Number of offspring produced

Life history traits – characteristics of an individual that influence survival and reproduction
Atlantic SalmonAfrican elephantHouse Mouse
Number of reproductive events
~3 - 10 1~6-12

Life history traits – characteristics of an individual that influence survival and reproduction
Atlantic SalmonAfrican elephantHouse Mouse
Lifespan
60 - 70 years 3-6 years~2 years

How do the following life history traits affect the rate of reproduction?
Age at maturity
#offspring
# reprod. events
life span
2 mo many one long
2 yr few many short
2 mo many many long
2 yr many many long
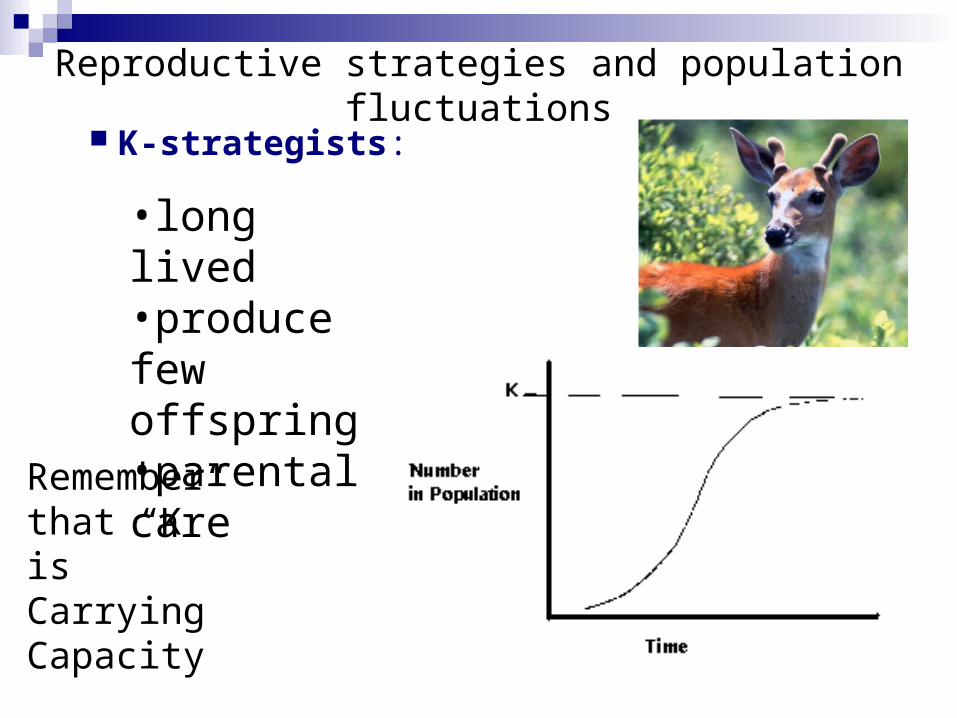
K-strategists:
Remember that “K” is Carrying Capacity
•long lived•produce few offspring•parental care
Reproductive strategies and population fluctuations

–controlled by density-dependent limiting factors
factors more severe as population increases
example: food
K-strategists:•stable populations at carrying capacity (K)•examples: humans, deer, lions
Reproductive strategies and population fluctuations
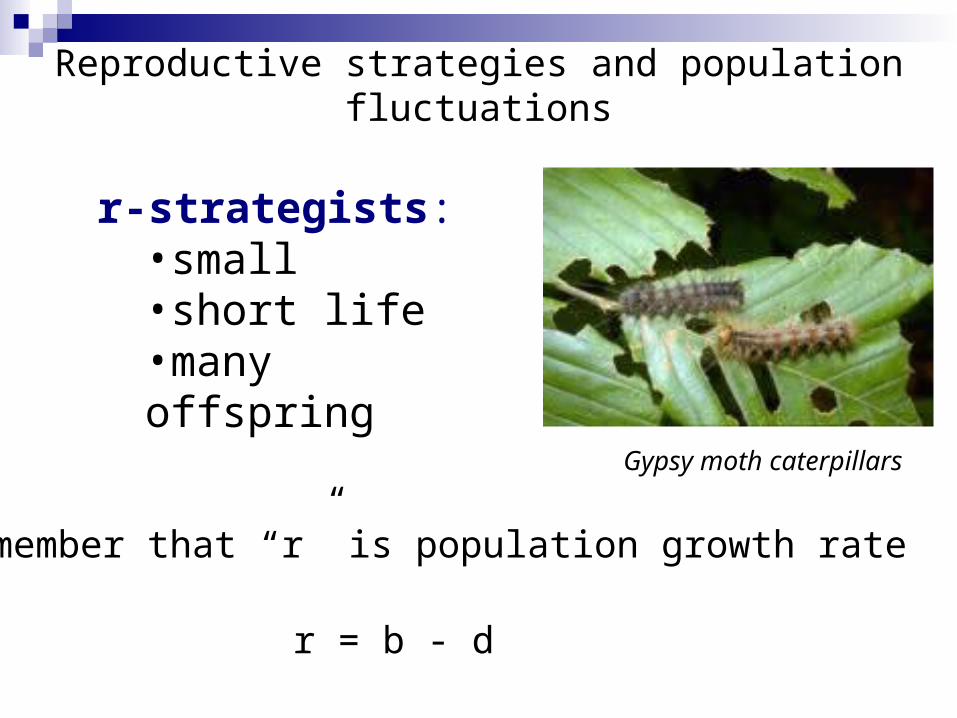
Gypsy moth caterpillars
Remember that “r” is population growth rate
r = b - d
r-strategists:•small•short life•many offspring
Reproductive strategies and population fluctuations
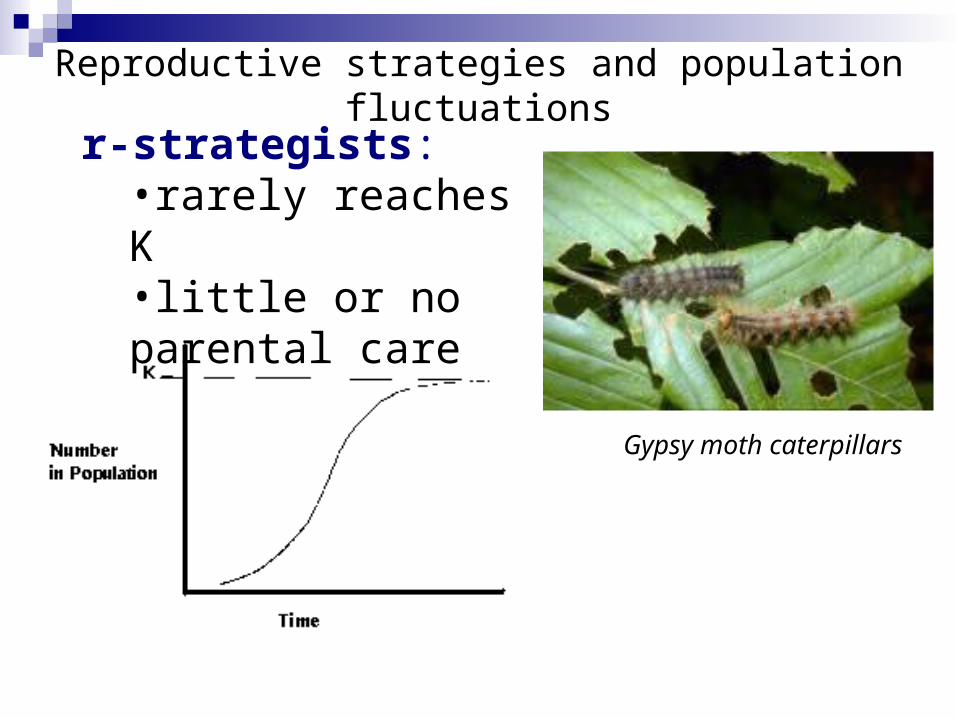
Gypsy moth caterpillars
r-strategists:•rarely reaches K•little or no parental care
Reproductive strategies and population fluctuations

Gypsy moth caterpillars
–good at using temporarily abundant resources
r-strategists:•controlled by density-independent limiting factors:
weather, pond drying
Reproductive strategies and population fluctuations

Points to know:
Understand the three types of survivorship curves.
What factors influence population growth rates?
What are some life history traits?
Know the difference between K- and r- strategists and what kind of limiting factors each has.