Annexure 14a - Geo Report
74
GCS (Pty) lt d. Johannesburg Durban Kimberley Directors: AC Johnstone (Managing) SE Scawt hon (Financial ) AH Barbour (Non-exec) V Cress wel l (Non-exec) Reg No: 2004/ 000765/ 07 Es t. 1987 63 Wessel Road Woodme ad 2191 PO Box 2597 Rivonia 2128 Sout h Afri ca Telephone: +27 (0)11 803 5726 Facsimile: +27 (0)11 803 5745 Web: www.gcs-sa.biz P PR R O OP PO OS S E ED D 2 2 0 0 0 0 / / 4 40 0 0 / / 8 8 0 00 M MW W C C O OA AL L-F FI I R R E ED D P PO OW WE ER R S S T TA AT TI I O ON N A AN ND D A AD DD DI I T TI I O ON NA AL L B BL LA AC CK K S S T TA AR R T T G GE EN NE E R R A AT TI I O ON N F FA AC C I I L LI I T TY Y A AT T W WA AL LV VI I S S B BA AY Y , N NA AM MI I B BI I A A S i t e S el ect i on Geology, hydrogeology, soil & hydrology Version – 5 17 November 2008 Ni nham S hand C ons ul t i ng S er vi ces 00085/000/000/08-198
-
Upload
ftriwahyudi -
Category
Documents
-
view
218 -
download
0
Transcript of Annexure 14a - Geo Report

7/29/2019 Annexure 14a - Geo Report
http://slidepdf.com/reader/full/annexure-14a-geo-report 1/74
GCS (Pty) lt d.
Johannesburg Durban Kimberley
Directors: AC Johnstone (Managing) SE Scawt hon (Financial ) AH Barbour (Non-exec) V Cresswel l (Non-exec)
Reg No: 2004/ 000765/ 07 Est. 1987
63 Wessel Road Woodme ad 2191 PO Box 2597 Rivonia 2128 Sout h Afri ca
Telephone: +27 (0)11 803 5726 Facsimile: +27 (0)11 803 5745 Web: www.gcs-sa.biz
PPRROOPPOOSSEEDD 220000 / / 440000 / / 880000 MMWW CCOOAALL--FFIIRREEDD PPOOWWEERR SSTTAATTIIOONN AANNDD AADDDDIITTIIOONNAALL BBLLAACCKK SSTTAARRTT GGEENNEERRAATTIIOONN FFAACCIILLIITTYY AATT WWAALLVVIISS
BBAAYY,, NNAAMMIIBBIIAA
Site Select ion
Geology, hydrogeology, soil & hydrology
Version – 5
17 November 2008
Ninham Shand Consult ing Services
00085/000/000/08-198
7/29/2019 Annexure 14a - Geo Report
http://slidepdf.com/reader/full/annexure-14a-geo-report 2/74
Ninham Shand Consult ing Services Proposed NamPower Coal-f ired Power St ati on
00085/ 000/ 000/ 08-198 Page 2
PPRROOPPOOSSEEDD 220000 / / 440000 / / 880000 MMWW CCOOAALL--FFIIRREEDD PPOOWWEERR SSTTAATTIIOONN AANNDD AADDDDIITTIIOONNAALL BBLLAACCKK SSTTAARRTT GGEENNEERRAATTIIOONN
FFAACCIILLIITTYY AATT WWAALLVVIISS BBAAYY,, NNAAMMIIBBIIAA
Site Selection: Geology, Hydrogeology, Soils and Hydrology
ReportVersion – 5
17 November 2008
00085/000/000/08-198
DOCUMENT ISSUE STATUS
Repor t Issue Final
Refer ence Number 00085/ 000/ 000/ 08-198
Title Sit e Select ion- Geology, hydr ogeology, soi l & hydrol ogy
Name Signature Date
Author Andrew Johnst one 14 October 2008
Document Reviewer Ashleigh Mckenzie 01 October 2008
Document Authorisation Andrew Johnst one 18 November 2008

7/29/2019 Annexure 14a - Geo Report
http://slidepdf.com/reader/full/annexure-14a-geo-report 3/74
Ninham Shand Consult ing Services Proposed NamPower Coal-f ired Power St ati on
00085/ 000/ 000/ 08-198 Page 3
Execut ive Summary
GCS (Pty) Ltd were appointed as a sub-consultant by Ninham Shand to investigate the
geological, soi ls, hydrogeological and hydrological aspects of t he site select ion pr ocess for a
proposed coal-f i red power stat ion near Walvis Bay, Namibia. To meet the increasing power
demands wi thi n Namibia, t he Namibi an Power Corporat i on (Pt y) LTD (NamPower) int ends t o
increase i ts power generat ing capacity in the Walvis Bay area by construct ing a mult ip le-
unit coal f i red power stat ion. The purpose of th is study is to provide environmental
boundaries for t he proposed sit es, i n response t o t he development proposal.
No f ie ldw ork was undertaken other t han a sit e visi t and conclusions of t h is report are based
on a desk study and experience in simil ar proj ects.
The fol lowing power generat ion components are being considered for the Walvis Bay area,
which would f eed in to t he Namib ian power gr id :
200, 400 or 800 MW Coal-f i r ed Power Plant ; and 100 MW black start faci l i t y
Coal stock yar d
Ash disposal facility
Black star t fac i l i t y
Four candidate sites were in i t ia l ly considered for the locat ion of the power stat ion. Data
used to assess the relevant cri teria was namely from site visi ts and desktop analysis of
avai lable infor mat ion. Relevant cri t eria were used to analyse each sit e in t erm s of i t s
suit abi l i t y for t he proposed proj ect (Refer t o Sect i on 3). Sit es A, B and D wer e al l ident i f ied
within the Sossus soi l category while Site C fal ls within the surf ic ia l deposits soi l prof i le.
Sit es A, B and D show no di st i nct geological feat ures and dept h t o bedrock at each of t hese
sites is not known. Sites A, B and D are also underlain by a primary aquifer with shal low
groundwater levels. Site C however, has an approximately 5m of sand above bedrock,
secondary aquifer and deeper groundwater levels. Site C was the preferred site from
geological, hydrogeological and soi ls perspect ive. Refer to Table i for a summary of the
assessment of t he alt ernat i ve sites.
The specif ic environmental and cumulat ive effects which the proposed power stat ion may
have at each t entat ive site have been assessed by considering exist ing inf ormat ion rel evant
to the area of invest igat ion ( i .e. geology, hydrogeology, soi ls and hydrology). The results
wer e presented using a rat ing syst em of t he issues. Wit hin t he mat rix, each issue is rat ed
numerical ly and scores added to give a percentage: the higher the percentage, the more

7/29/2019 Annexure 14a - Geo Report
http://slidepdf.com/reader/full/annexure-14a-geo-report 4/74
Ninham Shand Consult ing Services Proposed NamPower Coal-f ired Power St ati on
00085/ 000/ 000/ 08-198 Page 4
favourable the sit e. This mat rix was used to numerical l y evaluate t he four (4) proposed
sites in terms of founding condit ions, surface water and groundwater. The results of th is
rat ing indicate t hat Sit e C is t he most suit able sit e for t he proposed power stat ion.
The site select ion process ident i f ied two sites for more detai led analysis to determine
environment al boundaries for t he proposed power st at ion. The environment al boundaries
are discussed in detai ls in Chapter 6 together with recommendations for further
invest i gat ion to quant i fy t he boundaries.

7/29/2019 Annexure 14a - Geo Report
http://slidepdf.com/reader/full/annexure-14a-geo-report 5/74

7/29/2019 Annexure 14a - Geo Report
http://slidepdf.com/reader/full/annexure-14a-geo-report 6/74

7/29/2019 Annexure 14a - Geo Report
http://slidepdf.com/reader/full/annexure-14a-geo-report 7/74
Ninham Shand Consult ing Services Proposed NamPower Coal-f ired Power St ati on
00085/ 000/ 000/ 08-198 Page 7
5.1. MATRIX. . . . . . . . . . . . . . . . . . .. . . . . . . . . . . . . . . . . . . . . .. . . . . . . . . . . . . . . . . . . . . .. . . . . . . . . . . . . . . . . . . . . .. . . . . . . . . 565 .1 .1 . Numer i ca l Assessmen t o f s i tes . . . . . . . . . . . . . . . . . . . . . . . . . . . . . . . . . . . . . . . . . . . . . . . . . . . . . . . . . .56
5.2. COMPARATIVE ASSESSMENT . . . . . . . . . . . . . . . . . . . . . .. . . . . . . . . . . . . . . . . . . . . .. . . . . . . . . . . . . . . . . . . . . . .. . . . . . . 5 6
6. ENVIRONMENTAL BOUNDARIES FOR SITES B & C.. .. .. .. .. .. .. .. .. .. .. .. .. .. .. .. .. .. .. .. .. .. .. 60
6.1. SITE B . . . . . . . . . . . . . . . . . . . . . . . . . .. . . . . . . . . . . . . . . . . . . . . .. . . . . . . . . . . . . . . . . . . . . .. . . . . . . . . . . . . . . . . . . . . .. . 6 06 .1.1 . So i l s. . . . . . . . . . . . . . . . . . . . . . . . . . . . . . . . . . . . . . . . . . . . . . . . . . . . . . . . . . . . . . . . . . . . . . . . . . . . . . . . . . . . . . . . . . 60 6 .1.2 . Top ogra ph y . . . . . . . . . . . . . . . . . . . . . . . . . . . . . . . . . . . . . . . . . . . . . . . . . . . . . . . . . . . . . . . . . . . . . . . . . . . . . . . . . 60 6 .1 .3 . Ge o l o g y . . . . . . . . . . . . . . . . . . . . . . . . . . . . . . . . . . . . . . . . . . . . . . . . . . . . . . . . . . . . . . . . . . . . . . . . . . . . . . . . . . . . . 6 0 6 .1.4 . Hy dro ge ol o gy . . . . . . . . . . . . . . . . . . . . . . . . . . . . . . . . . . . . . . . . . . . . . . . . . . . . . . . . . . . . . . . . . . . . . . . . . . . . . . . 61 6 .1.5 . L an d Ca pa bi l i t y . . . . . . . . . . . . . . . . . . . . . . . . . . . . . . . . . . . . . . . . . . . . . . . . . . . . . . . . . . . . . . . . . . . . . . . . . . . . 61
6.2. SITE C . . . . . . . . . . . . . . .. . . . . . . . . . . . . . . . . . . . . .. . . . . . . . . . . . . . . . . . . . . .. . . . . . . . . . . . . . . . . . . . . .. . . . . . . . . . . . . 616 .2.1 . So i l s. . . . . . . . . . . . . . . . . . . . . . . . . . . . . . . . . . . . . . . . . . . . . . . . . . . . . . . . . . . . . . . . . . . . . . . . . . . . . . . . . . . . . . . . . . 61 6 .2.2 . Top ogra ph y . . . . . . . . . . . . . . . . . . . . . . . . . . . . . . . . . . . . . . . . . . . . . . . . . . . . . . . . . . . . . . . . . . . . . . . . . . . . . . . . . 62 6 .2 .3 . Ge o l o g y . . . . . . . . . . . . . . . . . . . . . . . . . . . . . . . . . . . . . . . . . . . . . . . . . . . . . . . . . . . . . . . . . . . . . . . . . . . . . . . . . . . . . 6 2 6 .2.4 . Hy dro ge ol o gy . . . . . . . . . . . . . . . . . . . . . . . . . . . . . . . . . . . . . . . . . . . . . . . . . . . . . . . . . . . . . . . . . . . . . . . . . . . . . . . 62 6 .2.5 . L an d Ca pa bi l i t y . . . . . . . . . . . . . . . . . . . . . . . . . . . . . . . . . . . . . . . . . . . . . . . . . . . . . . . . . . . . . . . . . . . . . . . . . . . . 62 6 .2.6 . Hy dro l ogy . . . . . . . . . . . . . . . . . . . . . . . . . . . . . . . . . . . . . . . . . . . . . . . . . . . . . . . . . . . . . . . . . . . . . . . . . . . . . . . . . . . 62
7. CONCLUSION ........ ......... ........ ........ ........ ......... ........ ........ ........ ......... ...... 64
7.1. ENVIRONMENTAL BOUNDARIES SITES B AND C . . . . . . . . . . . . . . . . . . . . . .. . . . . . . . . . . . . . . . . . . . . . .. . . . . . . . . . . 64
8. REFERENCES ......... ........ ........ ........ ........ ........ ......... ........ ........ ........ ....... 65
9. APPENDICES............ ........ ......... ........ ........ ........ ........ ........ ......... ........ .... 66
List of Figures
FIGURE 1-1: MAP OF NAMIBIA..................................................................................................... 10FIGURE 1-2: MAP OF WALVIS BAY, NAMIBIA ................................................................................ 11FIGURE 1-3: LOCATIONS OF PROPOSED SITE ALTERNATIVES (GOOGLE, 2008) .............................. 13
FIGURE 1-4: PROPOSED SITES FOR DETAILED ANALYSIS (GOOGLE, 2008)..................................... 14FIGURE 3-1: SKETCH MAP OF GEOLOGY OF WALVIS BAY AND SURROUNDINGS (WARD, 1989) ....... 26FIGURE 3-2: GENERAL GEOLOGY ................................................................................................ 27FIGURE 3-3: LOCATION SITE A.................................................................................................... 29FIGURE 3-4: VIEW NORTH-WEST (SITE A) .................................................................................... 29FIGURE 3-5: VIEW NORTH TO EAST (SITE A)................................................................................. 29FIGURE 3-6: LOCATION SITE B.................................................................................................... 30FIGURE 3-7: VIEW SOUTH (SITE B).............................................................................................. 30FIGURE 3-8: VIEW NORTH (SITE B) ............................................................................................. 30FIGURE 3-9: LOCATION SITE C ................................................................................................... 31FIGURE 3-10: VIEW EAST (SITE C).............................................................................................. 31FIGURE 3-11: VIEW NORTH (SITE C) ........................................................................................... 31FIGURE 3-12: GPS 5 (SITE C) .................................................................................................... 31
FIGURE 3-13: LOCATION SITE D.................................................................................................. 32FIGURE 3-14: VIEW WEST TO EAST (SITE D)................................................................................ 32FIGURE 3-15: VIEW EAST (SITE D) ............................................................................................. 32FIGURE 3-16: GPS 6 (SITE D) .................................................................................................... 32FIGURE 3-17: SOILS OF NAMIBIA................................................................................................. 34FIGURE 3-18: WALVIS BAY GROUNDWATER ABSTRACTION AREAS ................................................. 39FIGURE 4-1: PROCESS AND METHODOLOGY................................................................................ 45FIGURE 6-1: FARM BOUNDARIES SITE B & C............................................................................... 63

7/29/2019 Annexure 14a - Geo Report
http://slidepdf.com/reader/full/annexure-14a-geo-report 8/74
Ninham Shand Consult ing Services Proposed NamPower Coal-f ired Power St ati on
00085/ 000/ 000/ 08-198 Page 8
List of Tables
TABLE I: TABLE OF ASSESSMENT OF ALTERNATIVE SITES . . . . . . . . . . . . . . . . . . . .. . . . . . . . . . . . . . . . . . . . . .. . . . . . . . . . . . . . 5 TABLE 4-1: POTENTIAL FATAL FLAWS ASSOCIATED WITH THE SITE SELECTION. . . . . . . . . . . . . . . . . . . . . . . . . . . . . . . . . . 4 7 TABLE 5-1: SITE A . . . . . . . . . . . . . . . .. . . . . . . . . . . . . . . . . . . . . .. . . . . . . . . . . . . . . . . . . . . .. . . . . . . . . . . . . . . . . . . . . .. . . . . . . . . 51 TABLE 5-2: SITE B . . . . . . . . . . . . . . . .. . . . . . . . . . . . . . . . . . . . . .. . . . . . . . . . . . . . . . . . . . . .. . . . . . . . . . . . . . . . . . . . . .. . . . . . . . . 52 TABLE 5-3: SITE C . . . . .. . . . . . . . . . . . . . . . . . . . . .. . . . . . . . . . . . . . . . . . . . . .. . . . . . . . . . . . . . . . . . . . . .. . . . . . . . . . . . . . . . . . . . 54 TABLE 5-4: SITE D . . . . .. . . . . . . . . . . . . . . . . . . . . .. . . . . . . . . . . . . . . . . . . . . .. . . . . . . . . . . . . . . . . . . . . .. . . . . . . . . . . . . . . . . . . . 55 TABLE 5-5: NUMERICAL ASSESSMENT OF ALTERNATIVE SITES. . . . . . . . . . . . . . . . . . . . . . .. . . . . . . . . . . . . . . . . . . . . .. . . . 5 6 TABLE 5-6: TABLE OF ASSESSMENT OF ALTERNATIVE SITES . . . . . . . . . . . . . . . . . . . . . .. . . . . . . . . . . . . . . . . . . . . . .. . . . . . . 5 7 TABLE 5-7: PROPOSED POWER STATION ALTERNATIVES CONSIDERED. . . . . . . . . . . . . . . . . . . . . . . . . . . . . . . . . . . . . . . . . . . 5 8
List of Appendices
APPENDIX A: GEOLOGICAL MAPS (2314 AND 2214) . . . . . . . . . . . . . . . . . . . . . . .. . . . . . . . . . . . . . . . . . . . . . .. . . . . . . . . . . . 67APPENDIX B: MATRIX . . . . . . . . . . . . . . . . . . . . .. . . . . . . . . . . . . . . . . . . . . .. . . . . . . . . . . . . . . . . . . . . .. . . . . . . . . . . . . . . . . . . . . .. . 6 8

7/29/2019 Annexure 14a - Geo Report
http://slidepdf.com/reader/full/annexure-14a-geo-report 9/74
Ninham Shand Consult ing Services Proposed NamPower Coal-f ired Power St ati on
00085/ 000/ 000/ 08-198 Page 9
1. INTRODUCTION
1.1. Proj ect Outl ine
Namibia l ies adjacent to the At lant ic Ocean and in the southwest port ion of Afr ica. The
project area at Walvis Bay l ies on the west coast of Namibia and may be divided into four
main areas namely: the Walvis Bay Ramsar Site, the Kuiseb Delta, the Dune Belt Area and
the Walvis Bay Coastline. The area is under the Municipality of Walvis Bay’s (WBM),
j ur i sdi ct ion i s f lan ked t he col d, r i ch Sou t h At l an t ic Ocea n’ s co ast l ine on i t s w est er n,
seaward side. To the north and east, the Namib Desert ’s dunes and plains surround the
town. To the south are the Walvis Bay wet lands, l isted as a Ramsar Convent ion wet land in
1995, and t he adj oining Kuiseb River Delta. Refer t o Figure 1-1.

7/29/2019 Annexure 14a - Geo Report
http://slidepdf.com/reader/full/annexure-14a-geo-report 10/74
Ninham Shand Consult ing Services Proposed NamPower Coal-f ired Power St ati on
00085/ 000/ 000/ 08-198 Page 10
Figure 1-1: Map of Namibia

7/29/2019 Annexure 14a - Geo Report
http://slidepdf.com/reader/full/annexure-14a-geo-report 11/74
Ninham Shand Consult ing Services Proposed NamPower Coal-f ired Power St ati on
00085/ 000/ 000/ 08-198 Page 11
Figure 1-2: Map of Walvis Bay, Namibia
N

7/29/2019 Annexure 14a - Geo Report
http://slidepdf.com/reader/full/annexure-14a-geo-report 12/74
Ninham Shand Consult ing Services Proposed NamPower Coal-f ired Power St ati on
00085/ 000/ 000/ 08-198 Page 12
Walvis Bay (meaning 'Whale Bay') experiences a temperate year-round cl imate due to the
cold Benguela current. Tradit ional ly, the economy of Walvis Bay has been based on the
f ishing industry, which is st i l l the biggest employer. The 3,500-hectare salt f ie ld to the
south of Walvis Bay is one of the largest solar evaporat ion salt faci l i t ies in Afr ica. Walvis
Bay is l inked to Namib ia ’s ra i l , a i r and road network, making i ts por t we l l -s i tuated to
service landlocked countries in southern Afr ica. The town is l inked with the rest of Afr ica
via the Trans-Kalahari and Trans-Caprivi Highways. The Walvis Bay harbour is sheltered
fr om t he ocean by the Walvis Bay peninsula, result ing in a safe and secure harbour serving
t he west coast of Afr ica.
As a result of various industr ia l developments related to uranium explorat ion and mining,
the West Coast of Namibia is experiencing signif icant economic growth. To meet theincreasing power demands, t he Namibian Power Corporat ion (Pty) LTD (NamPower ) int ends
t o increase i t s power generat ing capacit y in t he Walvis Bay area.
NamPower curr ent l y owns thr ee power st at ions namely: Ruacana Hydro Power St at i on (240
MW), Van Eck Coal-fired Power Station (120MW) located in Windhoek and Paratus Diesel
Power St at i on (24MW) in Walvis Bay. The proposed coal-f i red power faci l i t y and black start
fac i l i ty is to be deve loped by an independent power producer and wi l l compr ise mul t ip le
units. Four areas have been ident i f ied for the locat ion of the proposed plant as i l lustrated
in F igure 1-3. Th is study w i l l i dent i fy t he most su i tab le si te f or t he power sta t ion in term s
of geology, hydrogeology, soi ls and hydrology cri t eria.

7/29/2019 Annexure 14a - Geo Report
http://slidepdf.com/reader/full/annexure-14a-geo-report 13/74

7/29/2019 Annexure 14a - Geo Report
http://slidepdf.com/reader/full/annexure-14a-geo-report 14/74
Ninham Shand Consult ing Servi ces Proposed NamPower Coal-f ire d Power St at ion
00085/ 000/ 000/ 08-198 Page 14
Figure 1-4: Proposed sites for detailed analysis (Google, 2008)

7/29/2019 Annexure 14a - Geo Report
http://slidepdf.com/reader/full/annexure-14a-geo-report 15/74
Ninham Shand Consult ing Services Proposed NamPower Coal-f ired Power St ati on
00085/ 000/ 000/ 08-198 Page 15
1.2. Project descript ion
Power generat ion at Walvis Bay wil l necessitate a combinat ion of fuel types and generat iontechnologies to ensure a stable power feed as there is unfortunately no natural fuel source
avai lable in the Walvis Bay area. The fol lowing components are being considered for the
Walvis Bay power stat i on, w hich woul d feed power t o the Namibian pow er grid as a whole:
200, 400 or 800 MW Coal-fired Power Plant,
Coal stock yard;
Ash disposal facility;
“ Black St art” – Heavy fuel generator s
The power generat ing unit is to be constructed on a site of approximately 20-40 hectares
(sub ject to in f rast ructure support requ i rements) . The four proposed s i te a l te rnat ives
include:
Sit e A: Locat ed in Port area – “ Harbour Sit e”
Sit e B: Located nort h of Walvis Bay on t he coast (Farm 39) – “ Coast al Sit e”
Sit e C: Locat ed east of Dune 7 in indust r ia l zone – “ Airport Sit e”
Sit e D: Locat ed east of Narravi l le, west of Dune 7 – “ Narravi l le Sit e”
Refer t o Figure 1-3 for a Google image i l lustr at ing posit ions of t he four si t es.
*(A decision was undert aken by the proj ect t eam t hat al l ash would be di sposed of at Sit eC)
1.2.1. Proj ect Appli cant
NamPower current ly owns three power plants, but intends construct ing a local power plant
as a base load source t o generate nat i onal power . Van Eck in Windhoek is current ly t he only
coal- f i r ed p lant i n Namib ia and is a major cont r ibut or to t he Namib ian gr id . The p lant
however, is old, ineff ic ient and the technology outdated. Ruacana power stat ion is a
hydroelect r i c p lant capable o f a maximum power output o f 240MW, but t he supp ly can be
as l i t t le as 80MW and t he supply of Ruacana is limited to run-of-river. Parat us Diesel Powe r
Station is a 24 MW station owned by NamPower and is also located in the Walvis Bay area.
Nampower has commit ted t o undertake the s i te select ion process pr ior t o t he pro ject be ing
awarded to an Independent Power Producer ( IPP).

7/29/2019 Annexure 14a - Geo Report
http://slidepdf.com/reader/full/annexure-14a-geo-report 16/74
Ninham Shand Consult ing Services Proposed NamPower Coal-f ired Power St ati on
00085/ 000/ 000/ 08-198 Page 16
1.3. Terms of Reference
GCS (Pty) Ltd was tasked to provide a detailed assessment of the most suitable sites as a
possible locat ion for t he proposed pow er stat ion based on geology, hydrogeology, soi ls and
hydrol ogy. Necessary f ocus areas are as fol low s:
• Ident i fy the feas ib i l i ty o f the a l ternat ives proposed in terms o f gener ic impacts
associated with the proposed type of development, in the context of the site specif ic
and local and r egional characteri st ics;
• Set l imi ts in term s of the im pacts t hat are acceptab le ;
• Ident i fy the constraints posed by the various alternat ives in terms of surface water,
groundwater, geology and soils and assess the significance of impacts on such resourcesto al low for an understanding of the implicat ions;
• Identify the significance of impacts related to the proposed alternatives in terms of the
visual, socio-economic and planning aspects, (as a concept, in light of t he lack of design
detail) to inform the detailed design in a later stage of the project;
• Two sites namely B and C were identified for more detailed analysis and to determine the
environmental boundaries for the proposed power station.
Mit igat ion m easures are necessary t o address negat ive im pacts at alt ernat i ve sit es and/ or
t o ensure t hat t he power stat ion responds t o t he environment al boundaries at Sit es B and C
(t hese measures wi l l f orm t he specif i cat ions for t he design of the pow er stat i on by the IPP).
1.3.1. Proj ect Scope
1.3.1.1. Geological and Soils
GCS undertook a desktop geological site investigation of the proposed sites considered for
t he power stat ion addressing the fol l owing:
Descript ion of the topography and geomorphology of the study area with respect to
average elevat ion above sea level, t opography;
Descript ion of the geology of the general Walvis Bay area and specif ical ly of the
selected sites. (This was based on avai lable information and f ie ld observat ions). The
output of th is component was a geological map of the study area, together with a
descript ion of the l i thology and strat igraphy;

7/29/2019 Annexure 14a - Geo Report
http://slidepdf.com/reader/full/annexure-14a-geo-report 17/74
Ninham Shand Consult ing Services Proposed NamPower Coal-f ired Power St ati on
00085/ 000/ 000/ 08-198 Page 17
Assessment of soil maps of the general Walvis Bay area and specifically of the areas
where t he pro j ect components (power sta t ion, ash dump) w i l l be located. The purpose
was to describe the physical and chemical characterist ics of the various soi l types,
determine the potent ia l impacts of the proposed project components on soi ls and torecommend mit igat ion measures;
Analysis of land capabil i ty: From the soi l map, the land capabil i ty of the soi l types in
terms of potent ia l agricultural uses.
1.3.1.2. Hydrogeological
A desktop hydrogeological invest igat ion of the groundwater condit ions of the proposed
alternat ive sites for th is project. The act iv i t ies involved in complet ing the hydrogeologicalst udy included:
Collect ion of exist ing hydrogeological information pertaining to the groundwater
characteri st ics of t he proposed sites;
Data capture, analysis, mapping int erpret at i on and ESEIA recommendat ions;
Elim inat ion of t he sit es wi t h associated fat al f l aws;
Ranking of t he candidate sit es;
Ident i f ica t ion o f the most pre ferred s i te for the estab l ishment o f the coa l - f i red power
stat ion.
1.3.1.3. Founding condit ions
The alter nat ive sites for t he new coal-f i red pow er stat i on were assessed based on the:
Available surface area (an area of approximately 20ha is required for the power stat ion
and a coal stockyard to capacitate a 30 day supply of coal, approximately 70ha for f ly
ash disposal);
Suitabi l i ty of founding condit ions (si tes must be geotechnical ly stable and suitable for
construct ion act iv i t ies).
The ident i f ied cri teria were appl ied to the site select ion process by considering exist ing
information relevant to the area of invest igat ion. The results have been presented using a
ra t ing system in t he form of a matr ix fo r the cr i te r ia . Wi th in the matr i x each cr i t e r ia was
rated numerical ly and the scores added to give a percentage: the higher the percentage,
the m ore favourab le the s i te .

7/29/2019 Annexure 14a - Geo Report
http://slidepdf.com/reader/full/annexure-14a-geo-report 18/74
Ninham Shand Consult ing Services Proposed NamPower Coal-f ired Power St ati on
00085/ 000/ 000/ 08-198 Page 18
This invest igat ion wil l inform part of the detai led Environmental and Socio- Economic
Impact Assessment (ESEIA) once the preferred sites undergo detailed environmental
invest igat ion.
1.3.1.4. Environment al Boundari es si t e B and C
The site select ion process ident i f ied two sites for more detai led analysis to determine
envi ronmenta l boundar ies for t he proposed power sta t ion. The pro ject cr i te r ia are :
1. A wet cooled power st at ion of 200, 400 and 800 MW at Sit e B and black st art faci l i t y
2. A dry cooled power stat ion of 200, 400 and 800 MW at Sit e C and black st art faci l i t y
3. All ash di sposal at Sit e C.
7/29/2019 Annexure 14a - Geo Report
http://slidepdf.com/reader/full/annexure-14a-geo-report 19/74
Ninham Shand Consult ing Services Proposed NamPower Coal-f ired Power St ati on
00085/ 000/ 000/ 08-198 Page 19
1.4. Report St ructure
The report has been compi led t o provide environment al boundaries for t he proposed sit es,
in response to t he development pr oposal. The report i s st ruct ures as fol l ows:
Chapter 1 – Introduct ion;
Chapter 1 prov ides a short in t roduct ion to the pro j ect , wh ich inc ludes the det a i ls o f t he
project appl icant and the scope of work which is covered in th is report .
Chapter 2 – Overview of t he Coal-f i r ed power stat ion;
Chapter 2 provides a more in depth descript ion of the proposed power stat ion, as well
as the objectives thereof, and a discussion on the advantages and disadvantages
associated with i t .
Chapt er 3 – Baseli ne Descri pt ion;
Chapter 3 provides a desktop descript ion of certain environmental condit ions and a
detai led descript ion of cri teria associated with the area in which the proposed project
is si t uated (soi ls, geology, hydrogeology, hydrology).
Chapter 4 – Site Selection Process;
Chapter 4 provides a descript ion of the methodology used in the site select ion process
for the proposed power stat ion.
Chapter 5 – Fat al f law and sit e select ion cri t eria analysis The site select ion process ident i f ied two sites for more detai led analysis to determine
environment al boundaries for t he proposed power stat i on.
A ranking matrix is used to compare the rat ings of the various sites. The outcomes of
the s i te select ion mat r ix and ind icates the pr e ferred cand idate si te for t he locat ion o f
the coa l - f i red power sta t ion.
Chapt er 6 – Envir onmen t al bound aries for Sit es B and C;
The site select ion process ident i f ied sites B and C for more detai led analysis to
determine the environmental boundaries for the proposed power stat ion.
Chapter 7 – Conclusion;
Chapter 7 concludes the report by ident i fy ing the preferred site and providing
recommendations.
Chapter 8 – References.
Chapter 8 detai ls al l r eference document s used in compil ing this report .

7/29/2019 Annexure 14a - Geo Report
http://slidepdf.com/reader/full/annexure-14a-geo-report 20/74
Ninham Shand Consult ing Services Proposed NamPower Coal-f ired Power St ati on
00085/ 000/ 000/ 08-198 22 October 2008 Page 20 of 74
2. PROPOSED NAMPOWER COAL- FIRED POWER STATION
2.1. Project descript ion
Walvis Bay (22°59'S, 14°31'E) is a large embayment on the central Namibian coastline.
Nampower proposes to construct a 200MW, 400MW or 800MW coal-fired plus black start
generat ing faci l i ty with associated coal stockyard, ash disposal faci l i ty and transport
systems (to del iver coal and potent ia l ly seawater to and from the plant) at a si te
designated for the pro j ect .
The plant wi l l use mult i- fuel led generator sets that wi l l produce approximately 100MW of
e lect r ic i t y fo r star t ing the power sta t ion in the b lack star t fac i l i t y . Storage fac i l i t i es wi l l be
provided on sit e for diesel and fuel o i l f or the black st art f aci l i t y. This faci l i t y may also be
used to boost em ergency generat ion capacity, i f requir ed. St orage t anks wi l l a lso be
required on sit e for de-mineral i zed and neutr al ized water and for various chemicals. The
number and volumes of tanks wil l be determined by technical requirements based on the
preferred alternat ive technologies selected.
The coal stockyard must be large enough to store coal for 30 days (approximately 100,000
t ons for a 400MW capacit y). Approximat ely 70 hect ares is required for disposal of f ly ash
fr om t he 400MW plant over about 40 years, i f convent ional dry stacking is undert aken. As
rehabil i tat ion of ash dumps in arid environments poses certain environmental constraints,
alt ernat i ves in t h is regard wil l be invest igated.
Water for cool ing of both the main cool ing system and auxi l iary cool ing system (for
removing heat from anci l lary equipment such as air compressors, oi l coolers and electr ical)
wi l l be pumped via pipel ine from t he At lant ic Ocean. Cooling processes at Sit e B wi l l be
conducted using sea water, whereas cool ing at Site C wil l be by means of radiators.
Alternat ives wil l be invest igated for the preferred cool ing system, and the provision of
water (avai labi l i ty of supply, storage provision, t reatment opt ions). I t wi l l a lso be necessary
to bui ld a pipel ine for both seawater and freshwater and an overhead power l ine to carry
e lect r ic i t y f rom t he power sta t ion. Conveyor routes may be requ ired f rom the sta t ion to
the ash disposal faci l i ty for t ransport of ash and from the coal stockyard to the power
sta t ion. Determi nat ion o f access to and f rom the si t e for a l l o f the above wi l l depend on
the site and technology alternat ives chosen. Ash disposal methods and locat ion for the
disposal faci l i ty are a major factor in terms of the potent ia l impact on ground and surface
water , a i r qual i t y , t ransport r outes, t reatment requ i red and v isua l impact .

7/29/2019 Annexure 14a - Geo Report
http://slidepdf.com/reader/full/annexure-14a-geo-report 21/74
Ninham Shand Consult ing Services Proposed NamPower Coal-f ired Power St ati on
_____________________________________________________________________
00085/ 000/ 000/ 08-198 Page 21
Coal wi l l be import ed and stored in t he coa l stockyard. I t is est i mated t hat 1 ,2 mi l l ion
tones per annum ( t / a) wi l l be requ ired in i t ia l ly fo r t he 400MW sta t ion, increasing to 2 ,4
mi l l ion t / a for the 800MW faci l i t y .
2.2. Coal-fi red power station obj ectives
The project object ives have been provided by NamPower and may be summarized as
fol lows:
1. Design and develop of plant and related i nfr ast ruct ure;
2. Construct a 200MW, 400MW or 800MW coal-f i red power stat ion with associated coal
stockyard and ash disposal facility;
3. Generat ion and t ransmi ssion of power;
4. Comply with legal requirements;
5. Create an area which can be effect ively managed in terms of operat ional procedures,
moni tor ing and rehabi l i t a t ion;
6. Minimise environmental impacts;
7. Zero discharge of surface process wat er t o the envir onment ;
8. Minimise seepage t o t he groundwater .
GCS (Pty) LTD wil l take specif ic object ives into considerat ion for the scope of th is report( i .e . numbers 4-8 o f t he coal - f i r ed power s ta t ion ob j ect ives) .

7/29/2019 Annexure 14a - Geo Report
http://slidepdf.com/reader/full/annexure-14a-geo-report 22/74
Ninham Shand Consult ing Services Proposed NamPower Coal-f ired Power St ati on
_____________________________________________________________________
00085/ 000/ 000/ 08-198 Page 22
3. BASELINE ENVIRONMENTAL DESCRIPTION
This sect ion suppl ies important environmental data, which wil l be used during the site
select ion process. The basel ine inform ati on must be used to ident i f y the environment al
boundaries to inform the design of the power stat ion by the IPP to ensure minimal negat ive
impacts.The factors taken into considerat ion include geology, topography, soi ls and
hydrogeology. Upon the el iminat ion of three (3) of the candidate sites and the
ident i f icat i on of t he prefer red site a detai l ed EIA and EMP wi l l be undert aken.
3.1. Geology
3.1.1. General Geology
According to Dr. Martin Falke’s report (Kuiseb Basin Water Resources Management Project,
July 2008), the Namib Desert is underlain by Precambrian bedrock consist ing of granites,
gneisses and schists. These are separated from younger Tertiary & Quaternary deposits by
the Namib unconformity surface formed during the Late Cretaceous erosional phase.
Outcrops of Precambrian rocks are found al l over the Central Namib Region. The oldest
Tertiary deposits (50 – 20 Ma) pertain to the cross-bedded, aeolian Tsondab Sandstone
Form ation, which underl ies most of t he Centr al Namib Desert south of t he Kuiseb River and
was deposit ed under ari d condit ions. The Tsondab Sandstone Form ation, a precursor of t he
present Namib Sand Sea, is generally 45 to 90 m thick, but reaches a thickness of over 200
m i n t he east ern part of t he Nami b Sand Sea.
In the area of t he Kuiseb Val ley t he Tsondab Sandstone Format ion is overla in unconform ably
by the wel l rounded quartz i te and ve in quartz grave ls o f the ter t ia ry Karpfenkl i f f
Conglomerate Formation (Ward 1984). These tert iary f luvial deposits are extensively
calcif ied, as the Tsondab Sandstone shows with an up to 5 m thick pedogenic calcrete
horizon on adjacent interf luves, represent ing a long period of landform stabi l i ty in a
semiarid cl imate. The geological sequence of the Namib Desert north of the Kuiseb r iver is
overlain by al luvial sediment s of t he Namib Group (Early Miocene) indicat i ng a wet t er, m ore
humid cl imate with sporadic high energy f low events. Extensive Calcrete formation
occurred at the end of the Miocene. The Late Tert iary deposits of the Sossus Sand
Formation indicate a return to arid condit ions. The Pleistocene sediments show a most ly
ar id c l imat e , w h ich a l ternates sporadica l ly wi t h short sl igh t ly w et t er per iods.
7/29/2019 Annexure 14a - Geo Report
http://slidepdf.com/reader/full/annexure-14a-geo-report 23/74
Ninham Shand Consult ing Services Proposed NamPower Coal-f ired Power St ati on
_____________________________________________________________________
00085/ 000/ 000/ 08-198 Page 23
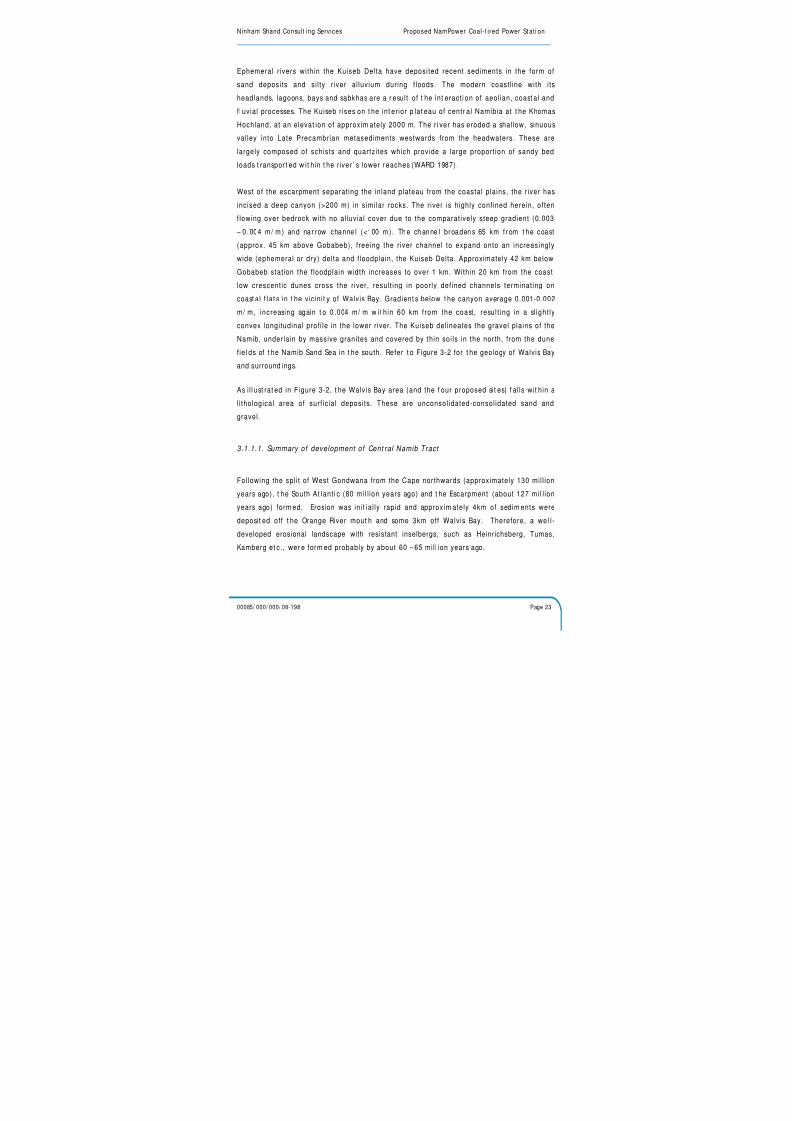
Ephemeral r ivers within the Kuiseb Delta have deposited recent sediments in the form of
sand deposits and si l ty r iver al luvium during f loods. The modern coast l ine with i ts
headlands, lagoons, bays and sabkhas are a r esult of t he int eract i on of aeol ian, coast al and
f l uvial processes. The Kuiseb r ises on t he int erior p lat eau of centr al Namibia at t he KhomasHochland, at an elevat ion of approxim ately 2000 m. The ri ver has eroded a shal low, sinuous
val ley into Late Precambrian metasediments westwards from the headwaters. These are
largely composed of schists and quartzi tes which provide a large proport ion of sandy bed
loads t ransport ed w it hin t he r iver ’ s lower r eaches (WARD 1987).
West of the escarpment separat ing the in land plateau from the coastal p lains, the r iver has
incised a deep canyon (>200 m) in similar rocks. The r iver is highly conf ined herein, of ten
f lowing over bedrock with no al luvial cover due to the comparat ively steep gradient (0.003
– 0 . 004 m / m ) an d na r row cha nne l (<100 m ). Th e ch an ne l broa den s 65 km f rom t he coast
(approx. 45 km above Gobabeb), f reeing the r iver channel to expand onto an increasingly
wide (ephemeral or dry) delta and f loodplain, the Kuiseb Delta. Approximately 42 km below
Gobabeb stat ion the f loodplain width increases to over 1 km. Within 20 km from the coast
low crescent ic dunes cross the r iver, result ing in poorly def ined channels terminat ing on
coast al f lat s in t he vicin it y of Walvis Bay. Gradient s below t he canyon average 0.001-0.002
m/ m, increasing again t o 0 .004 m/ m w i t h in 60 km f rom the coast , resu l t ing in a sl igh t ly
convex longitudinal prof i le in the lower r iver. The Kuiseb del ineates the gravel plains of the
Namib, underlain by massive granites and covered by thin soi ls in the north, f rom the dunef ie l ds of t he Namib Sand Sea in t he south. Refer t o Figure 3-2 for t he geology of Walvis Bay
and surround ings.
As i l l ust rat ed in Figure 3-2, t he Walvis Bay area (and the f our proposed sit es) f a l ls wit hin a
l i thological area of surf ic ia l deposits. These are unconsol idated-consol idated sand and
gravel.
3.1.1.1. Summary of development of Cent ral Namib Tract
Following the spl i t of West Gondwana from the Cape northwards (approximately 130 mil l ion
years ago), t he South At lant i c (80 mil l ion years ago) and t he Escarpment (about 127 mil l ion
years ago) form ed. Erosion was in it ia l ly rapid and approxim ately 4km of sedim ents were
deposit ed off t he Orange River mout h and some 3km off Walvis Bay. Therefore, a wel l-
developed erosional landscape with resistant inselbergs, such as Heinrichsberg, Tumas,
Kamberg et c. , wer e form ed probably by about 60 – 65 mil l ion years ago.

7/29/2019 Annexure 14a - Geo Report
http://slidepdf.com/reader/full/annexure-14a-geo-report 24/74
Ninham Shand Consult ing Services Proposed NamPower Coal-f ired Power St ati on
_____________________________________________________________________
00085/ 000/ 000/ 08-198 Page 24
Dunes accumulated on thi s early prot o-Nami b tr act. In some areas, e.g., Diep Rivier, t he
dune sand accumulat ion was in the order of 200m thi ck. These proto-Namib dunes wer e
deposited mainly by southerly to south-westerly winds, similar to the present wind regime.
Broad depressions also existed at th is t ime and were in- f i l led by sands derived from both
t he Escarpment and the early dunes. Pans wer e formed in t he early dune f ie ld duri ngwet t er periods. These deposit s have given r ise to the suite of surf ic i a l sediment s known as
the Tsondab Sandstone Formation.
The proto-Namib Desert phase was fol lowed by a period (about 15 mil l ion years ago) when
t he cl im ate was at least semi -arid wit h st rong seasonal run-off . I t was under these
condit ions that vast al luvial fans with braided streams were developed west of the
Escarpm ent . These coarse deposit s can be seen as high-l ying, gravel and conglom erat ic
t err aces fl anking the Sw akop, Khan, Kuiseb, Tsondab and Tsauchab River s. In the Kuiseb
Valley, t hese deposit s are cal led t he Karpf enkl i f f Conglomer ate Format ion. Calcareous soi ls
developed t owards t he end of t h is wet t er phase. This indicat es a period of landform
st abi l i t y for about 500 000 to 1 000 000 years when t he annual rainfal l was most l ikel y some
350-450mm . These soil s gave ri se to t he calcret e duricr ust s, some 5 – 7 mil l ion years old.
Following the calcrete formation, southern Afr ica experienced a general phase of up-
warping with the axis roughly coinciding with the present Escarpment. This upl i f t caused
the r ivers to cut deeply through the calcretes, conglomerates and sandstones into the
bedrock to give the spectacular canyons of t he present w est ward-dr aining r ivers. At about
t his t im e, dune sands of t he present m ain Nami b Sand Sea began to accumulat e. The dune
sands appear to be derived from sediment brought down by the Orange River and then
washed northwards by the long shore dri f t (associated with the south-south easterly to
south-south westerl y winds). South of Lüderit z the sands are funnel led onshore and then
blown nort h int o t he main Namib Sand Sea.
Today dunes encroach upon the Kuiseb River f rom t he south. The large l inear dunes
migrate at rates from 0 – 2m per year whereas the coastal crescent ic dunes, west of
Rooibank, migrat e northw ards at 1 – 10m per year. The lack of consist ent f looding in t he
Delt a sector as wel l as the high energy coastal south-sout h w est erly wi nds has enabled t he
dunes t o bui ld t he narrow belt bet ween Walvis Bay and the Swakop River. Refer t o Figure
3-1 for the sketch map of Walvis Bay and surrounding areas, i l lustrat ing the dune posit ions
and approx imate m ovement .

7/29/2019 Annexure 14a - Geo Report
http://slidepdf.com/reader/full/annexure-14a-geo-report 25/74
Ninham Shand Consult ing Services Proposed NamPower Coal-f ired Power St ati on
_____________________________________________________________________
00085/ 000/ 000/ 08-198 Page 25
3.1.2. St ruct ural Geology
According to the Geological Survey Map of Namibia (2214 &2314), Sites A, B, and D fall
under the Sossus Formation. There appears to be no visib le or ident i f ied fault ing or other
relevant geological structures within the immediate vicin ity of these sites. Site C is located
in the area of surf ic ia l deposits and outcropping of Salem Granite syntectectonics,
Homogenous Red Granite (post-tectonic) and doleri te dykes occur within the vicin ity of the
sit e. The geology of t he area of invest igat ion is dominat ed by t he Damara Sequence.
7/29/2019 Annexure 14a - Geo Report
http://slidepdf.com/reader/full/annexure-14a-geo-report 26/74
Ninham Shand Consult ing Services Proposed NamPower Coal-f ired Power St ati on
_____________________________________________________________________
00085/ 000/ 000/ 08-198 Page 26
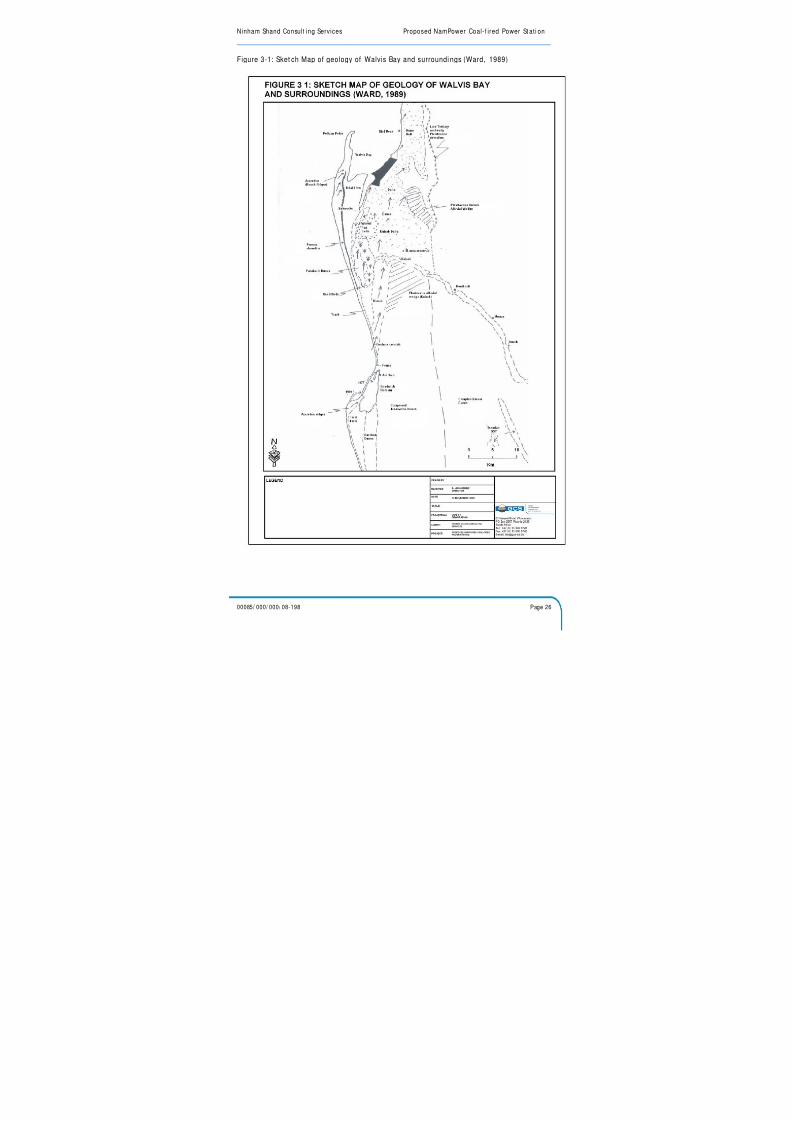
Figure 3-1: Sket ch Map of geology of Walvis Bay and surroundi ngs (Ward, 1989)

7/29/2019 Annexure 14a - Geo Report
http://slidepdf.com/reader/full/annexure-14a-geo-report 27/74
Ninham Shand Consult ing Services Proposed NamPower Coal-f i red Power St ati on
00085/ 000/ 000/ 08-198 Page 27
Figure 3-2: General geology
7/29/2019 Annexure 14a - Geo Report
http://slidepdf.com/reader/full/annexure-14a-geo-report 28/74
Ninham Shand Consult ing Services Proposed NamPower Coal-f ired Power St ati on
00085/ 000/ 000/ 08-198 Page 28
3.2. Topography and geomorphology
Walvis Bay is formed by the north-orientated sand pit known as Pel ican Point(approximately 7km long). To the south of Pel ican Point is a broad 2km wide sand f lat
which has many north-directed accret ionary r idges that have developed west of a
prominent “ beach r idge” . Extensive t ida l f la ts occur betw een the Lagoon and t he o lder
“ beach r idge” . The Lagoon, t idal f lat s and Second Lagoon are predom inant l y underlain by
quartoze sands. These sands contain magnet i te, garnet and subordinate clayey and si l ty
materia l. The f ine fract ion comprises mainly organical ly derived materia l and small
amounts of biot i t e r ich si l t s int roduced by t he Kuiseb River duri ng large f lood events.
Walvis Bay Lagoon is oriented SSW-NNE which closely co-insides with the prevailing coastal
wind direct ion. The west side of the Lagoon is demarcated by a straight margin. There is a
4km wide fan delta of the Kuiseb River in the Wortel Dorop area. The coarse-grained fan
delt a represents a deposit ional and not an erosional event and minor erosion is visib le only
on the NW side of the fan delta lobe. The well-developed f lood t idal delta comprises f ive
major, composite bars. The f lood Delta has formed in the northern end of the Walvis
Lagoon (Figure 3-1).
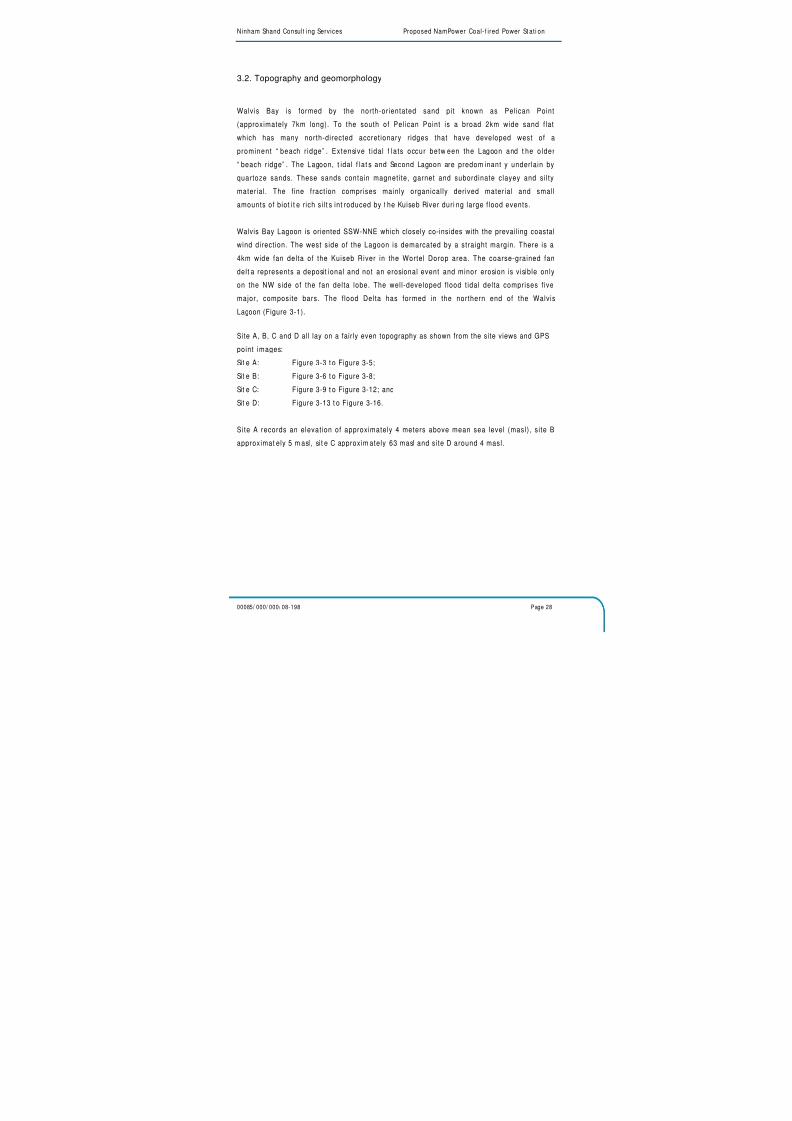
Site A, B, C and D all lay on a fairly even topography as shown from the site views and GPS
point images:
Sit e A: Figure 3-3 t o Figure 3-5;
Sit e B: Figure 3-6 t o Figure 3-8;
Sit e C: Figure 3-9 t o Figure 3-12; and
Sit e D: Figure 3-13 t o Figure 3-16.
Site A records an elevat ion of approximately 4 meters above mean sea level (masl), s i te B
approximat ely 5 m asl, si t e C approxim ately 63 masl and site D around 4 masl.
7/29/2019 Annexure 14a - Geo Report
http://slidepdf.com/reader/full/annexure-14a-geo-report 29/74
Ninham Shand Consult ing Services Proposed NamPower Coal-f ired Power St ati on
_____________________________________________________________________
00085/ 000/ 000/ 08-198 Page 29
Figure 3-3: Location Sit e A
Figure 3-4: View nor th-west (sit e A)
Figure 3-5: View nor th to east (sit e A)
SITE A

7/29/2019 Annexure 14a - Geo Report
http://slidepdf.com/reader/full/annexure-14a-geo-report 30/74
Ninham Shand Consult ing Services Proposed NamPower Coal-f ired Power St ati on
_____________________________________________________________________
00085/ 000/ 000/ 08-198 Page 30
Figure 3-6: Location sit e B
Figure 3-7: View South (site B)
Figure 3-8: View Nort h (sit e B)
SITE B

7/29/2019 Annexure 14a - Geo Report
http://slidepdf.com/reader/full/annexure-14a-geo-report 31/74
Ninham Shand Consult ing Services Proposed NamPower Coal-f ired Power St ati on
_____________________________________________________________________
00085/ 000/ 000/ 08-198 Page 31
Figure 3-9: Location Sit e C
Figure 3-10: View East (sit e C)
Figure 3-11: View Nort h (sit e C)
Figure 3-12: GPS 5 (sit e C)
SITE C

7/29/2019 Annexure 14a - Geo Report
http://slidepdf.com/reader/full/annexure-14a-geo-report 32/74
Ninham Shand Consult ing Services Proposed NamPower Coal-f ired Power St ati on
_____________________________________________________________________
00085/ 000/ 000/ 08-198 Page 32
Figure 3-13: Location sit e D
Figure 3-14: View West to east (site D)
Figure 3-15: View East (sit e D) View West (sit e D)
Figure 3-16: GPS 6 (sit e D)
SITE D

7/29/2019 Annexure 14a - Geo Report
http://slidepdf.com/reader/full/annexure-14a-geo-report 33/74
Ninham Shand Consult ing Services Proposed NamPower Coal-f ired Power St ati on
_____________________________________________________________________
00085/ 000/ 000/ 08-198 Page 33
3.3. Soils
Aeolian sediment at ion processes are act ive in t he Namib Desert wher e dunes and Hamada-
type vegetat ion prevai l . In the western Namib Desert , the breakdown of rock materia l is
caused by salt contained in the coastal fog and derived from the marine environment.
Tert iary and Quaternary deposits such as dunes and f lat sand plains dominate the Namib
Desert . According to t he Figure 3-17 the Walvis Bay st udy area fal l s wit hin the area
characterized by Leptosols, Acrisols, Ferrasols and Vert isols. The character ist ic f eatur es of
these soils include:
High sand stratum
Low nut r ient content
Low organic content
Alkal ine PH condit ions High sal in i t y levels
Walvis Bay is subj ect t o dri f t ing sand most of t he year and soi ls are very sal ine due to t heir
locat ion near t he sea. Wind is the single most im port ant physical agent in t he area aff ect i ng
wave act ion, t ransport of sediments and the shape and movement of surrounding sand
dunes. The w inds are characteri sed by high velocit y, h igh fr equency south t o south-w est erly
winds in summer and h igh ve loc i ty , low f requency east to north-wester ly winds in win ter .
Scarce rainfal l in the desert area makes the di lut ion of salt in the top-soi l minimal. The
prevai l ing wind direct ion in Walvis Bay is south-southwest, d isplacing sand in a northward
direct ion. This could impact alternat ive sites considered for the proposed power stat ion
should any sit e be in t he path of t he displaced sand and/ or mi grat ing dunes.

7/29/2019 Annexure 14a - Geo Report
http://slidepdf.com/reader/full/annexure-14a-geo-report 34/74

7/29/2019 Annexure 14a - Geo Report
http://slidepdf.com/reader/full/annexure-14a-geo-report 35/74
Ninham Shand Consult ing Services Proposed NamPower Coal-f ired Power St ati on
00085/ 000/ 000/ 08-198 Page 35
3.3.1. Coast al f lat s
The coastal f lats are composed of lagoonal deposits and Kuiseb fan delta deposits. An
example of th is is the reddish sand at the interface between the 'delta ' and the coastal
f l ats. The coarse sand in t he Wort el area south of Walvis Bay is a larger f an delt a. The l ow-
lying coast al f lat s harbour ext ensive r eed beds and large sand humm ocks for med by several
species of perennial w oody shrubs. Such veget at i on is si t uated t o t he nort h, east and sout h
of t he tow n of Walvis Bay.
3.3.2. The Kuiseb River and Kuiseb Delt a
There is considerable movement of sand over the ent ire area, especial ly in the western
sect ion, where large dunes migrate at 1-6 m per year. Wind erosion also causes extensive
f l aking of sol id i f ied si l t p lat es in the Kuiseb pans. This may affect t he alt ernat i ve sit es
proposed for the power stat ion. The prevai l ing wind direct ion and velocit ies need to
therefore be eva luated in depth t o determ ine the possib le e f f ects of th is “ sand migrat ion. ”
The Kuiseb River is an ephemeral r iver f lowing only after good rains in i ts headwater
regions, and not annually. I t is of importance to the Walvis Bay environment as i t provides
the water used by the town f rom i ts a l luv ia l aqu i fers . When the r iver does f low i t carr ies
large amounts of sediment s which are deposited as f low rat es decrease or as i t reaches t he
coast al f lat s. The Kuiseb River i s also picks up sand blown int o i t s bed f rom t he south and as
a result keeps t he wat er course free of m aj or sand deposit s.
The Kuiseb Delta is an area where the Kuiseb River f lows down a steepened gradient onto
the coastal f lats. A series of channels and palaeo-channels form an intr icate network of
f ine-grained f luvial deposits associated with numerous small aeol ian dunes South-east of
Walvis Bay. In recent f loods since 1985, the Kuiseb f low has ended in the white transverse
dunes on the western edge of the sand sea.
3.3.3. Sand dunes
The dunes surrounding Walvis Bay are mainly crescent ic forms. This crescent ic dune belt ,
predominant ly less than 20 km wide, includes transverse, barchan, barchanoid r idge and
some star dune types. The coastal crescent ic dunes move northward at rates of up to 10

7/29/2019 Annexure 14a - Geo Report
http://slidepdf.com/reader/full/annexure-14a-geo-report 36/74
Ninham Shand Consult ing Services Proposed NamPower Coal-f ired Power St ati on
_____________________________________________________________________
00085/ 000/ 000/ 08-198 Page 36
m/ yr. North o f the d i f fuse lower Ku iseb course, h igh l inear dunes extend northward t o the
Swakop River. The sand dunes surrounding Walvis Bay do not support extensive vegetation.
3.3.4. The Desert and dunes areas around Kuiseb River
The zone includes the sand dune and gravel plain areas north, east and south of the Kuiseb
River and Kuiseb Delta. The dunes and gravel plains between Walvis Bay and the Kuiseb
River, and south of the Kuiseb River include a variety of desert landscapes. Most
outstanding are the various types of sand dunes which take on mainly crescent-shaped
form s. The crescent i c dunes move nort hward at a rate of 10-20 m a year.
The gravel plains are less spectacular but const i tute a natural part of the desert landscape
around Walvis Bay as the windswept part of the desert . The gravel plains are r ich in stones
and minerals of a very high diversity. The gravel plains form an extremely sensit ive desert
pavement .
3.3.5. Salt pan
The extensive salt pans south of Walvis Bay have formed behind a beach ridge
approximately 2 masl. This natural western barrier forms the southern part of the large
sandpit known as Pel ican Point . The east ern boundary is form ed by parabol ic and hum mock
dunes, t he sand of w hich has been blown across the pan fr om t he beach.
3.3.6. Peli can Point
This zone is dominat ed by a long, sandy beach, exposed to strong wi nd- and w ave-act ion of
the Benguela current. Sand is trapped by the peninsula and remobil ized by wind into the
harbor and lagoon. Wave act ion moves approximately 2 mil l ion meters of sand per annum.
It is important to note the very narrow sect ion of the peninsula at Donkey Bay where a
breach could take place and the northern part of the Pel ican Point peninsula from the
mainland. The coast south of Donkey’ s Bay is growing west wards at a rate of 5-10m/ yr.

7/29/2019 Annexure 14a - Geo Report
http://slidepdf.com/reader/full/annexure-14a-geo-report 37/74
Ninham Shand Consult ing Services Proposed NamPower Coal-f ired Power St ati on
_____________________________________________________________________
00085/ 000/ 000/ 08-198 Page 37
3.4. Development
The urban sections of Walvis Bay and Swakopmund consume huge amounts of water and
energy for residents, tourism, trade and industr ia l purposes. In addit ion, the port of Walvis
Bay is the m ain port wi t h respect t o import / export , f ish ing indust ry and t ransport o f ore
fr om t he hinter land mini ng act iv i t ies both i n Erongo and other Namibi an regions.
Licenses for the extract ion of resources from the dune belt between Walvis Bay and
Swakopmund have been awarded to several companies. The area is heavi ly ut i l ized by
Namibia’s second and third largest towns both for recreat ional and tourist act iv i t ies.
Increasing urbanizat ion is envisaged in the area from Lover’s Hi l l in Walvis Bay to Mile 4
north of Swakopmund and the Dune belt wi l l serve as a recreat ional area for even more
people.
The salt works in Walvis Bay, Swakopmund and Cape Cross have long term concessions on
salt extract ion from seawater. The salt pans const i tute a huge wet land area. The modern,
deepwater port of Walvis Bay is the only port in the Erongo and Kunene regions with
signif icant t ransshipment act iv i ty and a key cargo transport node in Namibia. I t a lso hosts
t he country’ s main f ishing harbor and is operated by Namport .
3.5. Water Resources
3.5.1. Surf ace Water
Meeti ng wi t h: Guido von HagenhovePosit ion: Head of Surf ace hydrol ogyAddr ess: Privat e Bag 13193
WindhoekNamibia
Room: 209Tel: + 264 61 208 7257
The f lood prot ect i on berm w as const ruct ed aft er t he 1963 f loods when t he Kuiseb Riverrun through Walvis Bay.
The f l ood prot ect i on berm s was designed for 10 000m3 / sec .
Retur n period of f l ood is not know n.
Only 0.5-1m of t he berm is visib le but t h is is due t o the bui ldup of sand against t heberm.
The berm has alt ered t he Kuiseb River prof i le and the “ Prot ected” areas are new beingcovered wit h sand.
The vi l lage of Narravi l le is in or j ust above the 1:100 year f lood l ine.

7/29/2019 Annexure 14a - Geo Report
http://slidepdf.com/reader/full/annexure-14a-geo-report 38/74
Ninham Shand Consult ing Services Proposed NamPower Coal-f ired Power St ati on
_____________________________________________________________________
00085/ 000/ 000/ 08-198 Page 38
3.5.2. Groundwat er Resources
The Kuiseb River supplies water via abstraction areas, to Walvis Bay and surrounding areas
(Refer to Figure 3-18). As seen in the i l lustrat ion below, Walvis Bay is suppl ied with water
from the Kuiseb River via existing pipelines from Dorop South and Rooibank B, Rooibank A
and Swartbank abstraction areas.

7/29/2019 Annexure 14a - Geo Report
http://slidepdf.com/reader/full/annexure-14a-geo-report 39/74
Ninham Shand Consult ing Services Proposed NamPower Coal-f ired Power St ati on
00085/ 000/ 000/ 08-198 Page 39
Figure 3-18: Walvis Bay groundwater abstraction areas
7/29/2019 Annexure 14a - Geo Report
http://slidepdf.com/reader/full/annexure-14a-geo-report 40/74
Ninham Shand Consult ing Services Proposed NamPower Coal-f ired Power St ati on
00085/ 000/ 000/ 08-198 Page 40
3.5.3. Cat chment area
Walvis Bay l ies between the Swakop River in the north and the Namib Desert ’s sand dunes
and gravel plains to the east with i ts boundary extending to the Namib Naukluft Park. To
the south are the 12 600 hectare Walvis Bay wetlands (listed as a Ramsar Site) and the
adj oining delta of t he ephemeral Kuiseb River in t he south.
Walvis Bay fal ls wit hin t he Omaruru/ Swakop w ater basin m anagement areas. The Kuiseb
River f lows into t he delt a one or m ore t imes a decade wit h an average annual volume of 4.3
mil l ion m. The river has reached the sea only 15 t imes in the past 160 years. The southern
arm of the Kuiseb River channel is current ly blocked by a large barrier dune which could
break open ont o the salt f l ats or salt work s.
3.6. Groundwater
3.6.1. Groundwat er Compart ments
Namibia’s groundwater occurs in a wide range of rock types making groundwater
management a complex pr ocess. I t provides a buff er against drought in m any regions of t he
country, but is vulnerable to over-abstract ion and pol lut ion. According to the aquifer
formation map of Namibia, Walvis Bay is def ined by unconsol idated deposits in terms of i ts
hydrogeologica l rock t ype and fa l ls wi th in t he aqu i tard / aquic lude aqu i fer t ypes. Further in -
dept h hydrological inform ati on is required at t he proposed sit es (A, B, C and D).
General ly the Sites A, B, C and D (Refer to Figure 1-3 for si te locat ions) are underlain by
aquifers with l i t t le domest ic qual i ty groundwater potent ia l. The Damara Sequence (Site C)
hosts aquifers with very low permeabil i t ies. There appears to the Tsumas paleochanneldrains westw ard int o the int ert idal zone and day- l ight ing in the Sit e B area. Sit es A and D
are underlain by a pr im ary aquifer above the Damara Sequence which cont ains poor qual i t y
groundwater .
3.6.2. Main aquifer t ypes
According to KUELLS & HEIDBUECHEL (2006) the main aquifer types in the area are the
fo l lowing:

7/29/2019 Annexure 14a - Geo Report
http://slidepdf.com/reader/full/annexure-14a-geo-report 41/74
Ninham Shand Consult ing Services Proposed NamPower Coal-f ired Power St ati on
_____________________________________________________________________
00085/ 000/ 000/ 08-198 Page 41
Alluvium: Hydraul ic Conduct ivi t y 2.0 x 10⁻³ m/ s / Porosi t y 30 % / Layer
Thickn ess 30 m/ St orat ivi t y S=0.133 (at Rooibank) or S=0.06 to 0.08
(at Swart bank)
Palaeochannels: Hydraul ic Conduct ivi t y 1.0 x 10
-6
m/ s [BGR 1998/ Vol 7: 3. 1 x 10⁻⁶
m/ s] Porosit y 25 % / Layer Thickness variable/ St orat i v i t y
S=0.046 or 4.6 %
Sandstone: Hydraul ic Conduct ivi t y 3.0 x 10⁻⁶ m/ s / Porosi t y 7 % / Layer
Thickness variable
Basement : Hydraul ic Conduct ivi t y 1.55 x 10⁻⁸ m/ s / Porosi t y 0 .1 % / Layer
Thickness >200m
BGR (1998/ Vol 7) i dent i f i es t he t ransmissivi t ies, satur ated t hicknesses & hydraul ic
conduct ivi t ies ( including a mean overal l por osit y of n=0.15) as fol l ows:
Kuiseb River Sediments: 150 – 1600 m 2 / d / sat ur at ed t hi ckne ss 15 m / Hy drau l ic
Conductivity: 10 -4 - 10 -3 m / s
Palaeochannel Sediments: 6 m 2 / d
Tsondab Sandstone: 4 m 2 / d
Basement : 0.03 m 2 / d
According to AIN (1999) there are 2 al luvial aquifers (on top of each other) with dif feringwater qua l i t ies in the Kuiseb at Gobabeb . A f reshwat er aquif er is underlain by a denser and
more sal ine aquifer. In certain places the interface between the upper and lower
groundwater is sharp but in other places a zone of mixing is occurs. The thickness of the
fresh-water layer varies between 3 and 15 m and the water qual i ty is also not constant.
According t o AIN (1999), t he average al luvial wi dt h is 150 m, t he porosit y 35 % and t he
saturated thickness 10 m whereas BATE & WALKER (1991) give an average alluvial width of
307 m and a thickness of 10 m. According t o BGR (1995/ Vol D-I) t he amount of w ater
avai lable i n the palaeochannel aquifer is est im ated t o be about 340 Mm3 of w hich about 100
Mm 3 are brackish. A furt her 160 Mm 3 is in t he Tsondab Sandst one. This est imate of a total of
500 Mm 3 is based on assumed and m easured t hick nesses of sat urat ed sedime nt s of 15 – 30 m
and an eff ect ive por e volum e of 0. 04 – 0.05 (BGR 1995/ Vol D-I).

7/29/2019 Annexure 14a - Geo Report
http://slidepdf.com/reader/full/annexure-14a-geo-report 42/74
Ninham Shand Consult ing Services Proposed NamPower Coal-f ired Power St ati on
_____________________________________________________________________
00085/ 000/ 000/ 08-198 Page 42
3.6.3. Groundwat er levels and fl ow
According to findings of transmission loss measurements by KUELLS & HEIDBUECHEL (2006),
low water tab les appear in the upper part and very h igh water tab les in the lower part o f
the Lower Kuiseb Dune Area. In the Kuiseb South Sub-area the mean groundwater-table in
the dune val leys l ies in excess of 40 m below surface and approximately 100 m below
surface under the dunes. In the Coastal sub-area (mainly at the lowlands near sea level),
the groundwater-table is relat ively shal low over larger areas (1 to 3 m below the surface).
In addit ion to sea water int rusion, t he evaporat ion eff ect is also supposed to be pert inent i n
increasing the overal l sal in i t y.
The Kuiseb River delineates the gravel plains of the Namib and is underlain by massive
granites and covered by thi n soi ls in the nort h.
The Kuiseb Alluvial Aquifer is not continuous as basement rocks out-crop at several
locat ions on e i t her side o f t he r iver channel rest r ic t ing the la tera l ext ent o f the a l luv ium.
Such outcrops exist upstream of Gobabeb and approximately 5 km downstream near
Soetriv ier. In the vicin ity of Soetriv ier, geophysical surveying suggested that the depth to
fresh bedrock is very l imited. These lateral and vert ical restr ict ions to the al luvial channel
const i tute possible barriers to ground waterf low. The average al luvial width is 150 m, the
porosit y 35 % and t he sat urat ed t hickness 10 m accord ing t o AIN (1999) w hil e BATE &
WALKER (1991) give an average all uvial w idt h of 307 m and a th ickness of 10 m .
3.6.4. Groundwater quality
Resources in the upper part of the Kuiseb Basin are of lower qual i ty in the northern part
t han in the souther n part . The yield is also higher as quart zi t e represent s a bett er f r actured
aquifer. Groundwater qual i ty and yield decrease towards the west, downstream of the
Kuiseb River due to the reduct ion of rainfal l & recharge. The al luvium however representsan except ion as groundwater qual i t y is general ly bet t er in t he al luvial bodies (~600 uS/ cm
compared t o ~1500-2500 uS/ cm in t he rock).
3.6.5. Groundwater use
Kuiseb River groundwater resources support the water demand of Walvis Bay, whi lst water
derived from the al luvium of the Omaruru River is pumped from Henties Bay to a central
pump stat ion at Swakopmund for distr ibut ion to Swakopmund, Arandis, and the Rossing

7/29/2019 Annexure 14a - Geo Report
http://slidepdf.com/reader/full/annexure-14a-geo-report 43/74
Ninham Shand Consult ing Services Proposed NamPower Coal-f ired Power St ati on
_____________________________________________________________________
00085/ 000/ 000/ 08-198 Page 43
Uranium Mine. Approximat ely half of t he Erongo Region is covered by t he Namib Desert and
is therefore largely arid. Communal and commercial farming are conducted in the region
and are support ed by groundwater developed fr om di scret e borehole sources.
Walvis Bay obtains fresh water from the Central Namib Water Supply Scheme based atSwakopmund. This scheme is run by NamWater and draws groundwater from well f ie lds in
the Omaruru and Kuiseb Rivers. Namibia’s nat ional water suppl ier (NamWater) is extract ing
large quant i t ies of groundwater, mainly from the Kuiseb aquifers. A network of pipel ines,
reservoirs and roads run through the Delta. The balance between water extract ion and
recharge is being closely monitored by the Kuiseb Basin Management Committee (KBMC) in
t erm s of t he Water Resources Management Act 24 of 2004. The al luvial aquif er in t he lower
part of the Kuiseb River at Rooibank has been used since 1923 to supply water to Walvis
Bay. The al luvium is 15-20m thick and i ts relat ively high permeabil i ty al lows high pumping
rat es and quick recharge which is relat ed to r i ver f l ow.
According to DRFN (1994) water consumption from the Kuiseb River is as follows:
0.6 Mm 3 / a on 109 f ar ms (gr ou nd dam s & bor eho les, f or l i vest oc k (90 %) and dom est ic
purposes (10 %);
0.006 Mm 3 / a by 400 To pna ar com m una l f ar m ers in 10 vi l l ages f or l i ve st oc k (58 %) an d
dom est ic purp oses (42 %);
0.007 Mm 3 / a by t he Nam ib Resear ch Inst i t ut e at Gobab eb ( f or dom est ic pur pose s, 86 %
for gardening);
4.3 Mm 3 / a f or w at er sup pl y of Wa l vi s Bay ( f r om Rooiban k Aqui f er / 72 % f or dom est ic
purposes, i ndust r ia l use 28 %; 36 % of t he t own’ s ent i re w ater consumpt ion w ere used
for gardening);
2.9Mm 3 / a f or w at er sup ply of Sw ak op m un d ( f r om Sw ar t ban k Aqui f er / 96 % fo r dom est ic
purp oses, l ight industr ial use 4 %);
3.0 Mm 3 / a f or Rössing Ur an ium Mine an d t he t ow n of Ar an dis ( f r om a rese rvo i r in
Swakopmund, suppl ied by Kuiseb & Omaruru aquif ers).
The amount of water avai lable in the palaeochannel aquifer (the only exist ing aquifer) is
est i mated t o be about 340 mm 3 [VAN ZIJL & HUYSSEN 1967]), of which about 100 Mm 3 ar e
brackish. A further 160 mm 3 is in the Tsondab Sandst one. This est imate of a total of 500
Mm 3 is based on assumed and m easured t hickn esses of sat urat ed sedimen t s of 15 – 30 m and
an eff ect ive por e volum e of 0. 04 – 0.05 (BGR 1995/ Vol D-I).
The palaeo-channels are 20 to 65 km in l engt h and <0.5 t o 5 km in w idt h and are covered by
an average of 35 m of dune sand below the inter-dune val leys. They predominant ly contain
40 to 90 m (average 55 m) thick calcareous si l ty f ine sand and local ly medium to coarse-

7/29/2019 Annexure 14a - Geo Report
http://slidepdf.com/reader/full/annexure-14a-geo-report 44/74
Ninham Shand Consult ing Services Proposed NamPower Coal-f ired Power St ati on
_____________________________________________________________________
00085/ 000/ 000/ 08-198 Page 44
grained sand. The palaeo-channel has a saturated thickness of between 20 – 40 m which is
maintained by indirect recharge from the Kuiseb River, which totals 0.42 Mm 3 per annum
(BGR 1998/ Vol D-II).

7/29/2019 Annexure 14a - Geo Report
http://slidepdf.com/reader/full/annexure-14a-geo-report 45/74
Ninham Shand Consult ing Services Proposed NamPower Coal-f ired Power St ati on
_____________________________________________________________________
00085/ 000/ 000/ 08-198 Page 45
4. SITE SELECTION PROCESS
This process is a fundamental step in the planning of t he coal-f i red power stat i on. This
step has far reaching economic, environmental and publ ic acceptance implicat ions. Using
primari ly environmental and economic cri teria associated with a screening process, al l
candidate sit es must be ident i f ied to ensure the due considerat ion of alt ernat i ves. Al l the
candidate sites ident i f ied must be evaluated to determine most acceptable and best suited
sites for the proposed project. Each ident i f ied site was rated using a ranking matrix. This
matrix was used to determine the most and least favourable sites, f rom an environmental
perspect ive.
4.1. Site Selection Methodology
Early considerat ions in si te select ion were to ident i fy the size and general locat ions of the
alternat ive sites. GCS (Pty) LTD was not involved in select ing the candidate sites.
Consecut ive phases involved in the approach to select ion of the preferred sites are
i l l ust rat ed in Figure 4-1.
Figure 4-1: Process and Methodology
Identi fi cati on of CandidateSites
Site Selection Criteria
Fatal Flaw Analysis
Comparative AssessmentMatrix
Select Favourable Site
Detail ed analysis and environment al
boundaries Site B and C
Identi fi cati on of Fatal Flaws
Sit e select ion
process
A, B, C & D

7/29/2019 Annexure 14a - Geo Report
http://slidepdf.com/reader/full/annexure-14a-geo-report 46/74
Ninham Shand Consult ing Services Proposed NamPower Coal-f ired Power St ati on
_____________________________________________________________________
00085/ 000/ 000/ 08-198 Page 46
Candidate sites were ident i f ied by an independent company and GCS then undertook the
consecut i ve st eps as i l l ust rat ed in f igure 4.1. Geology, soi ls, hydrology and hydrogeology
for the four si tes were taken into considerat ion.
Specif ic cri teria were assigned a comparat ive numerical value depending on thefavourab i l i ty o f the si t e in term s o f the envi ronmenta l favourab i l i ty . The ant ic ipated
environmental and cumulat ive impacts have been assessed, by considering exist ing
infor mat ion relevant t o the area of invest igat ion. The result s have been presented using a
ra t ing system in the form of a rank ing matr ix . The cr i t e r ia descr ibed were found ing
condi t ions, sur face water and geohydro logy. Wi th in the matr ix each the cr i te r ia were
numerical ly rated and f inal ly the scores were added to give a percentage: the higher the
percentage, the more favourable the site would be. GCS (Pty) LTD provided a ranking
matr ix t ogether w i th a descr ip t ion o f fact ors taken in to considerat ion when ra t i ng the si te
(Appendix B). The final matrix provided by Ninham Shand Consulting Services, was a
compilat ion of rat ings from the various special ists ( including GCS) involved in the site
select ion processes.
The results of th is invest igat ion indicated suitable sites upon which a more detai led
invest i gat ion wil l be conducted. The det ai led sit e invest i gat ion should involve conceptual
designs and specialised environmental studies.
4.1.1. Candidat e Sit es
Four (4) si t es wer e considered f or t he coal-f i red pow er st at i on (Refer t o Figure 1-3);
Sit e A: Locat ed in Port area
Sit e B: Located nort h of Walvis Bay on t he coast (Farm 39)
Sit e C: Located east of Dune 7 in indust ri al zone
Sit e D: Locat ed east of Narravi l le, west of Dune 7
4.1.2. Identification of fatal flaws and fatal flaw analysis
I t is a requirement that no residue disposal si te be developed in an area with an inherent
fa ta l f law. The fo l lowing si tuat i ons may represent fa t a l f laws in that t hey may proh ib i t the
development of an environmental ly or publ ic ly acceptable ash disposal faci l i ty, except at
excessive cost ( Table 4-1) .

7/29/2019 Annexure 14a - Geo Report
http://slidepdf.com/reader/full/annexure-14a-geo-report 47/74
Ninham Shand Consult ing Services Proposed NamPower Coal-f ired Power St ati on
00085/ 000/ 000/ 08-198 Page 47
Table 4-1: Potent ial f atal f laws associated wi th the sit e select ion
Main
Environmental
criteria
Potent ial Fatal Flaw Descript ion
Unst able areasThese could include fault zones, seismic zonesand dolomitic areas where sinkholes and
subsidence are l ikel y.
Shallow bedrock
The occurrence of shal low bedrock wil l cause
di f f icul t ies wi th earthworks and wi l l develop
poor quali t y seepage and leakage. Areas wi t h
proper gravel / soi ls wi l l be m ore appropr iate for
development.
Geology
Dykes and f ault sThe occurrence of dykes and faults could serve
as preferred pathways for groundwater seepageand movement.
Topography and
drainage
Areas characterized by steep
gradients, where stabi l i ty of s lopes
could be problemat ic
It is essential that the area chosen wil l augment
the stabi l i ty of the new coal- f i red power
stat ion.
SoilsAreas characterized by shallow
bedrock
These may provide good founding condit ions but
pot ent ial ly seepage issues.
Land Capabil i t y Areas of prim e agricult ural land
The establ ishment of the coal - f i red power
stat ion should not increase the envi ronmental
impacts of the legacy sites in the area and
therefore should not impact on potent ia l
agr icul t ural land. Where pr ime agr icul tural land
is present , t hese areas should be avoid ed.
Land use
Areas in close proximity to land uses
which are incompat ib le wi th res idue
disposal
Land uses which are incompatible with residue
disposal would at t ract communi ty res istance
and would inc lude resident ia l areas, nature
reserves and cemet eries.
Areas below the 1:50 year f lood l ine
This el iminates wetlands, vlei ’s, pans and flood
plains, where water pol lut ion would resul t f rom
ash disposal.
Areas in close proximity to
signi f icant surface wat er bodiesThese woul d include w ater courses or dams.
Surf ace Water
Catchment areas for important water
resources
Al though al l s i tes ul t imately fa l l wi th in a
catchment area, the s ize and sensi t iv i ty of the
catchment may represent a fatal f law,
especial ly i f i t feeds a water r esource

7/29/2019 Annexure 14a - Geo Report
http://slidepdf.com/reader/full/annexure-14a-geo-report 48/74
Ninham Shand Consult ing Services Proposed NamPower Coal-f ired Power St ati on
_____________________________________________________________________
00085/ 000/ 000/ 08-198 Page 48
Main
Environmental
criteria
Potent ial Fatal Flaw Descript ion
Areas characterized by f lat
gradients, shal low or emergent
ground wat er
These include vlei ’s, pans and springs, where asuff ic ient unsaturated zone separat ing the
residue and the groundwater would not be
possible.
Areas of groundwater recharge
Areas of recharge on account of topography
and/ or highly perm eable soi ls should be
avoided.
Groundwater
Areas over ly ing or adjacent to
impor tant o r po tent ia l l y impor tant
aqui fers
Areas of recharge on account of topography
and/ or highly permeable soi ls into im portant
aquif ers should be avoided.
4.1.3. Sit e Select ion Cri t eria
The four alternat ive sites were evaluated in terms of geology, hydrogeology, soi ls and
hydrology before the pref erred sit e was ident i f ied. Suff ic ient candidate sit es wer e
ident i f ied to ensure t he due considerat ion o f potent ia l a l te rnat ives. In ident i fy ing cand idate
sit es, numerous economi c and environment al cri t eria were considered. These cri t eria
interrelate, as there are always economic implicat ions when candidate sites are sub-
opt imal in t erms o f env i ronmenta l and/ or pub l ic acceptance character is t ics.
The following criteria were used by GCS to assess the individual sites:
Founding Condit ions;
Surf ace water ;
Hydrogeology cri ter ia;
Hydrology.
4.1.3.1. Founding Condit ions
From an economic perspect ive, the developer wishes to minimise costs of obtaining,
developing and operating a site. Based on soils and geology, this may be achieved by
applying the fol lowing site select ion cri teria:

7/29/2019 Annexure 14a - Geo Report
http://slidepdf.com/reader/full/annexure-14a-geo-report 49/74
Ninham Shand Consult ing Services Proposed NamPower Coal-f ired Power St ati on
_____________________________________________________________________
00085/ 000/ 000/ 08-198 Page 49
Flat t est possible t opography-has a large eff ect on i n i t ia l eart hwork s volumes.
Best qual i t y on-sit e soi l . Low permeabil i t y clayey soi ls on sit e wi l l reduce the cost of
containm ent l iners and leachate contr ol syst ems;
Founding condit ions for t he power stat i on must be st able; Stable geological foundat ions. (Unstable geological foundat ions could result in
subsidence, seepage and associated fai l ure, a st able geological foundat i on is ther efore
preferred).
4.1.3.2. Geomorphology
From an environmental perspect ive, the r isks of impacts on the biot ic and abiot ic
envi ronment must be min im ized. Th is may be ach ieved by app ly ing the fo l lowing cr i t e r ia t o
choice of soils from a geology and hydrogeology perspective.
Least int erf erence wit h geomorphological processes. This facet is very import ant to
ensure that the coal-f i red power stat ion would not signif icant ly alter geomorphological
processes, especial ly t he dune m igrat ion;
Lowest per meabil i t y soi ls and lowest erosion capabil i t y. (Low permeabil i t y soi ls reduce
pol lu tant mi grat i on and are there fore favoured. Low erosion capabi l i t y reduces
sedimentary runof f and is there fore pre ferred);
Least im pact on land wit h prim e agricult ural or resident ia l land use. (I t is pref erred to
ut i l ise areas that are to a degree already disturbed and not establ ish the coal-f i red
power stat ion on prime agricultural land or in areas where there is a potent ia l for
expansion of towns and/ or set t lement s);
Least disturbance to prist ine or undisturbed soi ls. (The sensit iv i ty of the receiving
envi ronment . The development o f a si te in a d isturbed envi ronment would be
preferab le t o a development i n a pr ist i ne envi ronment) .
4.1.3.3. Hydrological Cri ter ia
From a hydrogeological perspect ive, the r isk of pol lut ion of surface and groundwater
resources must be minimized. This can be achieved by appl icat ion of the fol lowing cri teria
to t he se lect ion o f t he si t e :
• Least negat ive inf luence on valuable ground and surface water resources used for
abstract ion;

7/29/2019 Annexure 14a - Geo Report
http://slidepdf.com/reader/full/annexure-14a-geo-report 50/74
Ninham Shand Consult ing Services Proposed NamPower Coal-f ired Power St ati on
_____________________________________________________________________
00085/ 000/ 000/ 08-198 Page 50
• Furt hest dist ance fr om any ground or surf ace wat er resources. The greater th is
d istance, t he more su i tab le t he si te i s in t erms of a lower potent ia l f o r wat er po l lu t ion.
Examples of the pol lut ion r isks that power stat ions pose to groundwater are provided inSection 4.3.
4.1.4. Comparat ive Assessment
A comparat ive assessment was conducted based on the site select ion cri teria. The sites
were evaluated in terms of geology, soi ls, hydrology and hydrogeology. The ranking matrix
re- i te ra ted the outcome of the comparat ive assessment in terms o f ident i fy ing the
pref erred site base on the specif i c cri t eria.
4.2. Pollution sources from power stations
The possible sources of contaminat ion from power stat ion infrastructure, which may impact
on the groundwater , inc lude:
The coal st ockpi les: potent ia l acid generat ion area
The raw water dams: source o f ar t i f ic ia l recharge to the groundwater
The sewage plant and dams: irr igat ion of ef f luent may im pact on groundwater
Treated (de-i onized) wat er syst em: brine added t o f ly ash for deposit ion on ash dump
Recovery (d i r t y wat er) dams: overf low and i r r iga t ion may impact on groundwater
Bunker fue l o i l : o i l en ters wat er and requ ires t r eatment
Ash dump: source o f “ poor” qua l i ty ar t i f ic ia l recharge
Solid waste sit e: source of leachate or poor qual i t y wat er
5. FATAL FLAW AND SITE SELECTION CRITERIA ANALYSIS
The following tables summarize the possible advantages and disadvantages associated with
t he alt ernat ive sit es. An indicat ion on potent ia l fat al f law s is also provided.

7/29/2019 Annexure 14a - Geo Report
http://slidepdf.com/reader/full/annexure-14a-geo-report 51/74
Ninham Shand Consult ing Services Proposed NamPow ____________________________________________________________________________________________________________
00085/ 000/ 000/ 08-198
Table 5-1: Sit e A
Environmental
Aspect Potent ial advantages Possibl e disadvantages
Geology Poor foundi ng condit ions pot ent ial for
pi les to achieve requi red foundat ion
strengths.
The bedrock prof i le on the s i te is unknown at
this stage and this may have a negative effect
on the construction costs.
Pote
Topography Sit e f l at, but small . No signif i cant t opographical disadvant ages. Insuf
Soils Area already signif i cantl y disturb ed. This sit e compr ises unconsolidat ed deposits and
depth to bedr ock is unknown at t h is stage. Fal ls
wit hin t he Sossus Format ion.
May
Land Cover and
Use
The site is bounded by port activi t ies and
residenti al areas.
The land cover of the site comprises mostly of
unconsolidat ed deposits.
S i te
and
p lan
Surf ace Water No signif i cant advantages out of Kuiseb
f lood plain.
None Poss
Groundwater Aqui fer is not sui table for domest i c
development.
S i te A hosts a pr imary aqui fer wi th poor qual i ty
water, has high groundwater levels ±4m below
surface.
Due
is an
No signif i cant advantages. Migrat ing dunes posit ioned t o t he south -west of
the s i te.
Act iv
dune
Geomorphologic
processes
Due to the s i te locat ion (port area), the ash
would be t r ansported of f si te for disposal .
The
the s
sea,
asso

7/29/2019 Annexure 14a - Geo Report
http://slidepdf.com/reader/full/annexure-14a-geo-report 52/74
Ninham Shand Consult ing Services Proposed NamPow
______________________________________________________________________________________
00085/ 000/ 000/ 08-198
Table 5-2: Sit e B
Environmental
Aspect
Possibl e advantages Possible disadvantages
Geology No signif i cant advantages. The bedrock prof i le on t he sit e is unknown at t his
stage and this may have a negat i ve ef fect on the
construction costs.
The area is potential ly underlain by Tsumas
Paleochannel.
Fou
Topography No signi f icant topographical advantages. Area wi l l have to be f lat tened to accomm odate
infrastructure.
Non
Soils No signif i cant advantages. This sit e compr ises unconsolidat ed deposits and
depth to bedrock is unknown at this stage. Fal ls
wit hin t he Sossus Format ion.
Soil
fac
Land Cover and
Use
Land has no potent ia l for cul t i vat ion. The land cover of the si t e comprises most l y
unconsolidated deposits and the site is in close
proximi t y to t he sea.
The
t he
No signif i cant advantages.
Suff ic ient area is avai lable for pol lut ion
control inf rastructure.
The site is close proximity to the sea.
Occurrence of pans needs to be investigated
fur ther .
ImpSurf ace Water
Wet lands occur in area to t he east of t he road.

7/29/2019 Annexure 14a - Geo Report
http://slidepdf.com/reader/full/annexure-14a-geo-report 53/74
Ninham Shand Consult ing Services Proposed NamPow
______________________________________________________________________________________
00085/ 000/ 000/ 08-198
No signif i cant advantages. Sit e B host s a prim ary aquife r and due t o t he
shal low water table, there is a greater r isk of
contamination via the ash disposal faci l i t ies and
the coal stockpi le areas.
Due
is a
pro
pro
Groundwater
Groundwater is close to surface. The site
over lays groundwater movement towards the
coast, e i ther f rom the Tumas River underf low or
other sources. The movement of f reshwater into
the intert idal zone has impl icat ions for marine
organisms
Sufficient surface area is avai lable for
pol lut ion control inf rastructure
Impact on m arine ecology is a def in i te r isk due t o
the pr opinqui ty of the sea to Si te B.
None Migrat ing dunes are posit ioned t o t he south -west
of the site. These shift ing sands are exposed to
high veloci ty , h igh f requency south to south-wester ly winds in summer and high veloci ty , low
frequency east t o north-wester ly winds in winter.
Act
dun
Bar
Geomorphologic
Processes.
Due to the s i te locat ion, the ash would be
tr ansported of f si te for disposal .
The
the
the
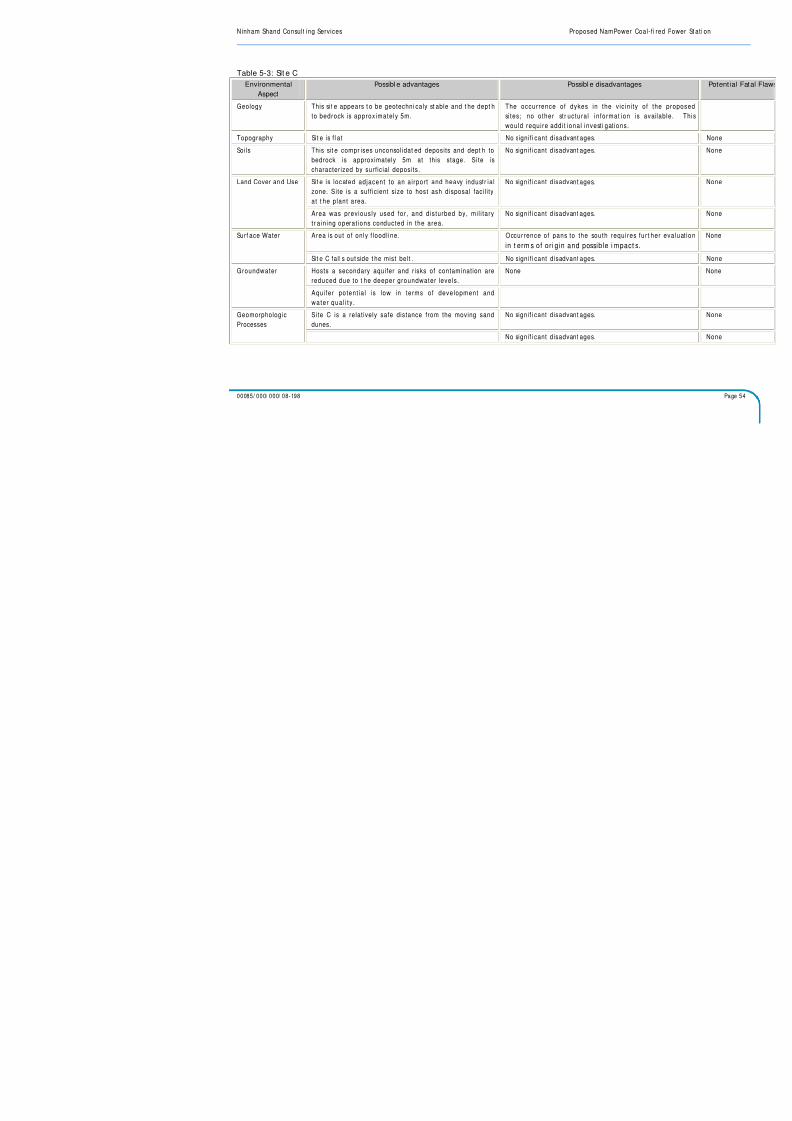
7/29/2019 Annexure 14a - Geo Report
http://slidepdf.com/reader/full/annexure-14a-geo-report 54/74
Ninham Shand Consult ing Services Proposed NamPow
______________________________________________________________________________________
00085/ 000/ 000/ 08-198
Table 5-3: Sit e C
Environmental
Aspect
Possibl e advantages Possibl e disadvant
Geology This sit e appears t o be geotechni caly st able and t he dept h
to bedrock is approximately 5m.
The occurrence of dykes in the v ic i
si tes; no other str uctural informat io
would requi re addi t ional invest i gat ions
Topography Sit e is f l at No signif i cant disadvant ages.
Soils This sit e compr ises unconsolidat ed deposits and dept h to
bedrock is approximately 5m at this stage. Site is
characterized by surficial deposits.
No signif i cant disadvant ages.
Si t e is located adjacent to an ai rport and heavy industr ia l
zone. Site is a suff icient size to host ash disposal faci l i ty
at t he plant area.
No signif i cant disadvant ages. Land Cover an d Use
Area was previously used for, and disturbed by, mi l i tary
tr aining operat ions conducted in the area.
No signif i cant disadvant ages.
Area is out of only f loodl ine. Occurrence of pans to the south requi
in t erm s of ori g in and possible i mpa
Surf ace Water
Sit e C fal l s out side t he mist belt . No signif i cant disadvant ages.
Hosts a secondary aquifer and risks of contamination are
reduced due to t he deeper groundwater levels.
None Groundwater
Aqui fer potent ia l is low in terms of development and
water qua l i t y .
Site C is a relatively safe distance from the moving sand
dunes.
No signif i cant disadvant ages. Geomorphologic
Processes
No signif i cant disadvant ages.

7/29/2019 Annexure 14a - Geo Report
http://slidepdf.com/reader/full/annexure-14a-geo-report 55/74
Ninham Shand Consult ing Services Proposed NamPow
______________________________________________________________________________________
00085/ 000/ 000/ 08-198
Table 5-4: Sit e D
Environmental
Aspect
Potent ial advantages Possible disadvantages
Geology No signif i cant advantages. The bedrock prof i le on t he sit e is unknown at t hisstage and this may have a negat ive ef fect on the
construction costs.
F
Topography Area is relat ively f l at No signif i cant disadvant ages. N
Soils No signif i cant advantages. This sit e compr ises unconsolidat ed deposits and
depth to bedrock is unknown at th is stage. Fal ls
wit hin t he Sossus Form ati on.
M
Land Cover and Use The area is sit uated east of Narravi l l e and
no signi f icant act iv i t ies may be af f ected in
this area.
None S
p
Surface Water V i l lage of Narravi l le is in/ or j ust above
the 1: 100 year f lood l ine.
None I
Groundwat er Sit e D host s a prim ary aquifer categori sed
wi th poor qual i ty water. This impl ies low
groundwater potent ia l .
None
Geomorphologic
Processes
No signif i cant advantages. Migrat ing dunes posit ioned t o t he nort h –east of
the s i te.
A
d
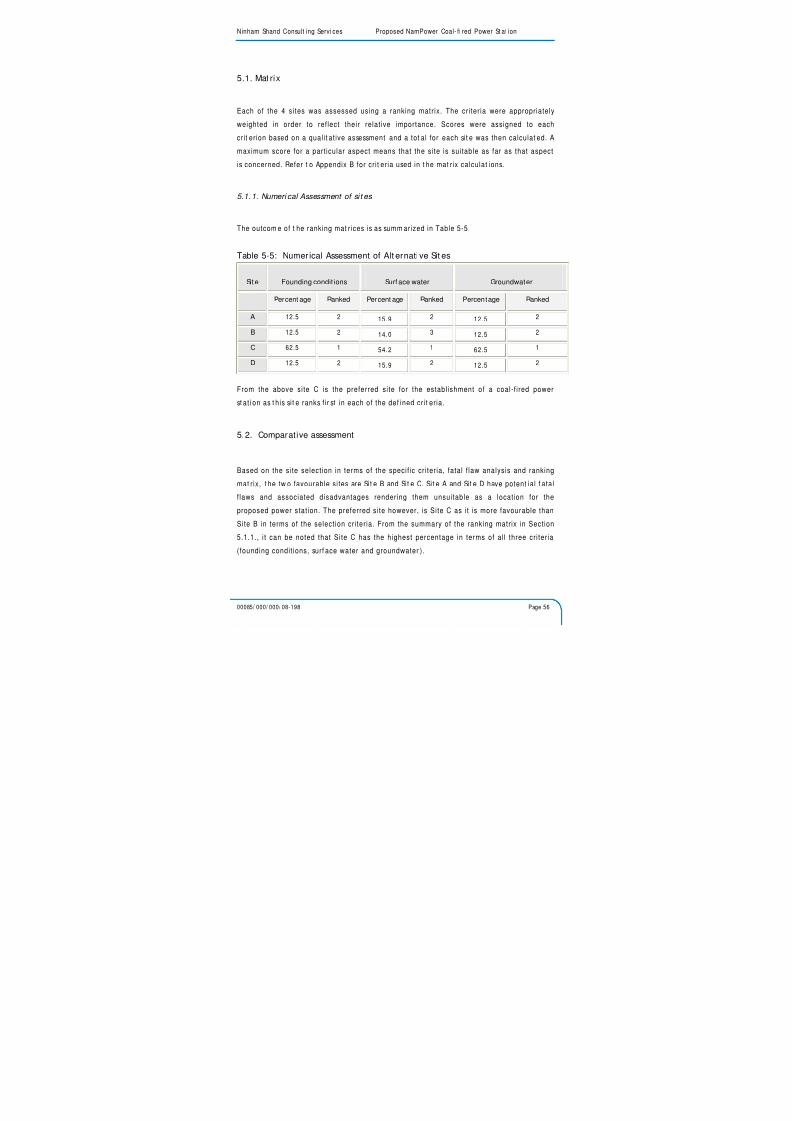
7/29/2019 Annexure 14a - Geo Report
http://slidepdf.com/reader/full/annexure-14a-geo-report 56/74
Ninham Shand Consult ing Servi ces Proposed NamPower Coal- fi red Power St at ion
00085/ 000/ 000/ 08-198 Page 56
5.1. Mat rix
Each of the 4 sites was assessed using a ranking matrix. The cri teria were appropriatelyweighted in order to ref lect their re lat ive importance. Scores were assigned to each
cri t erion based on a qual i t at ive assessment and a tot al for each sit e was then calculat ed. A
maximum score for a part icular aspect means that the site is suitable as far as that aspect
is concerned. Refer t o Appendix B for cri t eria used in t he mat rix calculat ions.
5.1.1. Numeri cal Assessment of si t es
The outcom e of t he ranking mat rices is as summ arized in Table 5-5.
Table 5-5: Numer ical Assessment of Alt ernati ve Sit es
Sit e Founding condit ions Surf ace water Groundwater
Percent age Ranked Percent age Ranked Percentage Ranked
A 12.5 2 15.9 2 12.5 2
B 12.5 2 14.0 3 12.5 2
C 62.5 1 54.2 1 62.5 1
D 12.5 2 15.9 2 12.5 2
From the above site C is the preferred site for the establ ishment of a coal-f i red power
st at i on as t his si t e ranks f ir st in each of the def ined cri t eria.
5.2. Comparative assessment
Based on the site select ion in terms of the specif ic cri teria, fatal f law analysis and ranking
mat rix, t he tw o favourable sites are Sit e B and Sit e C. Sit e A and Sit e D have potent ia l f atal
f laws and associated disadvantages rendering them unsuitable as a locat ion for the
proposed power stat ion. The preferred site however, is Site C as i t is more favourable than
Site B in terms of the select ion cri teria. From the summary of the ranking matrix in Sect ion
5.1.1., i t can be noted that Site C has the highest percentage in terms of al l three cri teria
(founding condit ions, surf ace water and groundwater ).

7/29/2019 Annexure 14a - Geo Report
http://slidepdf.com/reader/full/annexure-14a-geo-report 57/74
Ninham Shand Consult ing Services Proposed NamPower Coal-f ired
00085/ 000/ 000/ 08-198
Table 5-6: Table of assessment of alternative sites
Soil Topography Geology Hydrogeology Land C
S i t e
A
Disturbed. Fal lsunder the Sosuss
Format ion.
Fla t bu t l im i t edex tent .
Geology is unknown butdepth t o bedrock is
approximately 10m.
Hosts a pr imary aqui f er and due t othe shal low w ater t able, there is a
greater r isk of cont aminat ion v iat he ash disposal faci l i t ies and t hecoal stockpi l e areas.Water qua l i t y simi la r to t ha t o f t heharbor.
No land capa
S i t e
B
Falls under t heSosuss Formation.
Relat ively f lat butcosts involved wi thterrain preparat ion.
Unconsolidated depositswi t h an unknown depthto bedrock.
Hosts a pr imary aqui f er and due t othe shal low w ater t able, there is agreater r isk of cont aminat ion v iat he ash disposal faci l i t ies and t hecoal stockpi le areas. Water f romt he Tsumas Paleochannel seems t odrain westward and dayl ight in t hearea of Sit e B.
None
S i t e
C
Disturbed soils.This is a sandy ar ea,character i zed bysurficial depositsand is underl ain bygranite. This sitecomprises shallowbedrock and isgeotechnical lystable.
High landscapecharacter butsuf f i c ient area toaccommodateproposed powerst ati on, ash d isposalfac i l i t y and fu tureextensions.
The depth to bedrock isapproximately 5m.The occurrences of pansto t he south-west of Si t eC need t o be consideredin t erms of or ig in andpossible imp acts.
Host s a secondary aqui fer and ri sksof contaminat ion are reduced dueto deeper groundwat er levels.
None
S i t e
D
Disturbe d soi ls. Relat ively f l at. Unknown geology anddepth t o bedrock.
Hosts a pr imary aqui f er and due t othe shal low w ater t able, there is agreater r isk of cont aminat ion v iat he ash disposal faci l i t ies and t he
coal stockpi le.
None
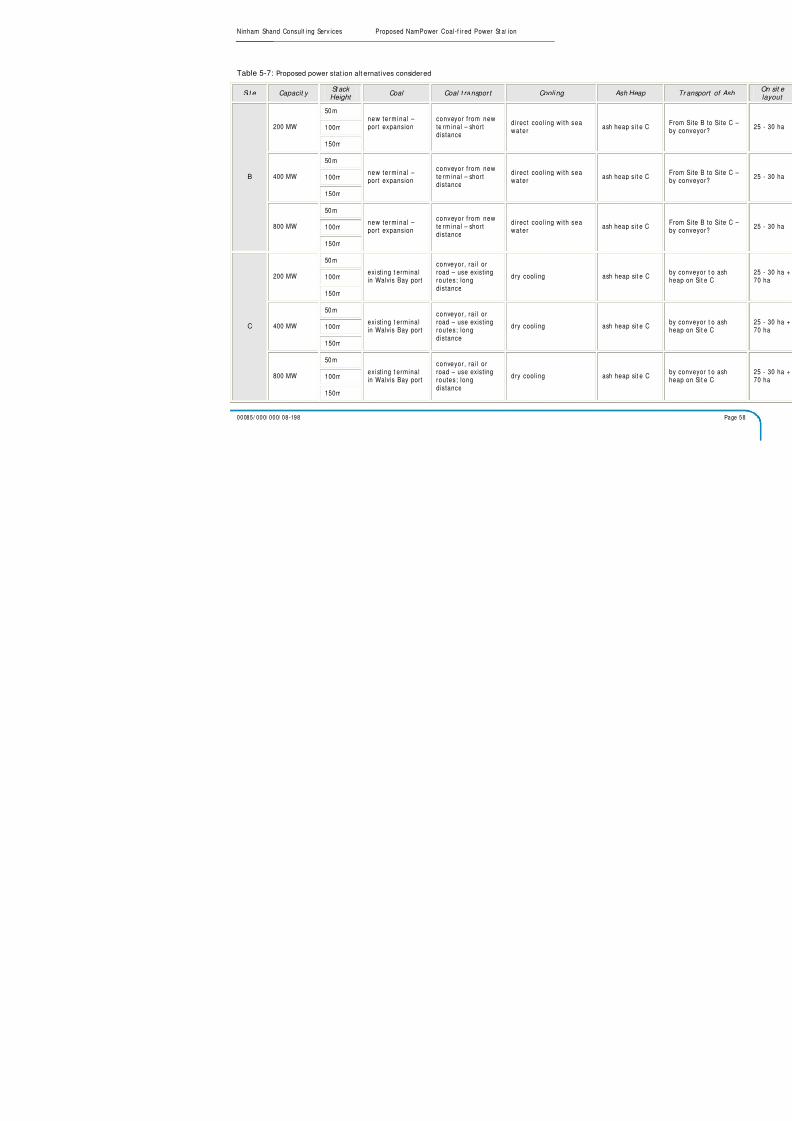
7/29/2019 Annexure 14a - Geo Report
http://slidepdf.com/reader/full/annexure-14a-geo-report 58/74
Ninham Shand Consult ing Serv ices Proposed NamPower Coal-f ir ed Power St at ion
00085/ 000/ 000/ 08-198
Table 5-7: Proposed power stat ion alt ernat ives considered
Si t e Capacit y St ack Height
Coal Coal t ranspor t Cooling Ash
50m
100m200 MW
150m
new termina l –port expansion
conveyor f rom newte rm inal – shortdistance
direct cool ing wi th seawater
ash hea
50m
100m400 MW
150m
new termina l –port expansion
conveyor f rom newte rm inal – shortdistance
direct cool ing wi th seawater
ash hea
50m
100m
B
800 MW
150m
new termina l –port expansion
conveyor f rom new
te rm inal – shortdistance
direct cool ing wi th seawater ash hea
50m
100m200 MW
150m
exist ing t erminalin Walvis Bay port
conveyor, ra i l orroad – use existingroutes; longdistance
dry cool ing ash hea
50m
100m400 MW
150m
exist ing t erminalin Walvis Bay port
conveyor, ra i l orroad – use existingroutes; long
distance
dry cool ing ash hea
50m
100m
C
800 MW
150m
exist ing t erminalin Walvis Bay port
conveyor, ra i l orroad – use existingroutes; longdistance
dry cool ing ash hea

7/29/2019 Annexure 14a - Geo Report
http://slidepdf.com/reader/full/annexure-14a-geo-report 59/74
Ninham Shand Consult ing Services Proposed
______________________________________________________________________________________
00085/ 000/ 000/ 08-198
Table 5-8: Assessment of suitability of the proposed alternatives
Soil Topography Geology Hydrogeolog
200 ¨ Requires f lat tening,dune migra t ion
Depth to bedrockrequires pi l ing
Shallow wat er levTsumas Paleocha
400 ¨ Requires f lat tening,dune migra t ion
Depth to bedrockrequires pi l ing
Shallow wat er levTsumas Paleocha
Sit e B
800 ¨ Requires f lat tening,dune migra t ion
Depth to bedrockrequires pi l ing
Shallow wat er levTsumas Paleocha
200 ¨ ¨ ¨ ¨
400 ¨ ¨ ¨ ¨ Sit e C
800 ¨ ¨ ¨ ¨
7/29/2019 Annexure 14a - Geo Report
http://slidepdf.com/reader/full/annexure-14a-geo-report 60/74
Ninham Shand Consult ing Services Proposed NamPower Coal-f ired Power St ati on
00085/ 000/ 000/ 08-198 Page 60
6. ENVIRONMENTAL BOUNDARIES FOR SITES B & C
On completion of the site selection process of sites A, B and C, GCS were requested to
deter mi ne the environment al boundaries for si tes B and C only. The sit e select ion process
ident i f ied site B and C for more detai led analysis to determine the environmental
boundaries for t he proposed power stat ion. The basel ine inform ation is used to ident i fy t he
environmental boundaries to inform the design of the power stat ion by the IPP to ensure
min imal negat ive im pact s.
6.1. Site B
•
It is proposed that a 200MW, 400MW or 800MW and a 100 MW black start facility beconst ruct ed on the sit e.
• Ash wi l l be disposed of at si te C
• The power stat i on wil l be w et cooled using sea wat er
6.1.1. Soil s
A detai l soi l i nvest igat ion needs to be undert aken to cl assif y t he soi ls and t o det erm ine soi l
chemica l character is t ics to determine impact on in f rast ructure (concrete and stee lfoundat ions).
In some areas t he soil s show signs of w et ness. This w il l have to be invest igate d and t he
sit e may have t o be raised above t his elevat ion.
6.1.2. Topography
The sit e is undulat ing and wil l have t o be f lat t ened to a level si t e.
Decisions wi l l have to be deter mined at w hat height above mean sea level the plant w i l l b e
constructed.
6.1.3. Geology
Dept h to bedrock is not known. Geot echnical invest igat ions wi l l have to be perform ed to
deter mi ne subsoi l condit ions and foundat ion requir ement s for t he proposed infrastruct ure.
7/29/2019 Annexure 14a - Geo Report
http://slidepdf.com/reader/full/annexure-14a-geo-report 61/74
Ninham Shand Consult ing Services Proposed NamPower Coal-f ired Power St ati on
00085/ 000/ 000/ 08-198 Page 61
The Tsumas Paleochannel w i l l have to be desiccat ed and t he plant located in such a manner
to take in cognizance of the paleochannel ( ie structure requir ing dif ferent founding
condit i ons wi l l have to be st rat egical ly placed).
6.1.4. Hydrogeology
The sit e hydrogeology is not know. Detai l ed hydrogeological invest igat ion of the sit e wi l l
be required t o develop a conceptual hydrogeological model in order t o evaluate im pacts.
They hydrogeology of the Tsumas Paleochannel wi l l require invest igat ion and
quant i f ica t ion. Aqu i fer parameter f or both t he pr imary aqu i fer (sand above bedrock) and
the Tsumas Paleochannel wi l l require quant i f icat ion (storage, transmissivi ty, water qual i ty
and groundwat er gradients).
Coal st ockpi le are may have to be l ined depending on the pot ent i a l environment al im pacts.
6.1.5. Land Capability
Land capabil i t ies can be classif ied as wilderness and potent ia l f or agricult ure is negl ig ible.
No clear surface wat er channels are evident on the site.
High water mark and leve l a t wh ich t he power p lant w i l l be const r ucted needs to be
determined.
6.2. Site C
• It is proposed that a 200MW, 400MW or 800MW and a 100 MW black start facility be
const ruct ed on the sit e.
• Ash wi l l be disposed of near t he sit e
• Power stat ion wil l be air cooled
6.2.1. Soil s
Det ai led soi ls invest igat ion needs to be undert aken for t he power plant and ash dump sit es.
Soi ls need to be cl assif i ed and chemical charact erist ics need to be d eter mined.
7/29/2019 Annexure 14a - Geo Report
http://slidepdf.com/reader/full/annexure-14a-geo-report 62/74
Ninham Shand Consult ing Services Proposed NamPower Coal-f ired Power St ati on
00085/ 000/ 000/ 08-198 Page 62
Soi l permeabi l i t y t ests need t o be comple ted t o determine i f l in ing wi l l be r equ ired be low
sources of pot ent i a l contam inat i on (ash dump and coal stockpi le).
6.2.2. Topography
Sit e is relat ively f lat . Sit e drainage needs t o be invest igated and drainage l ines
demarcated.
6.2.3. Geology
Sit e geology and founding condit i ons are not known. Det ai l geot echnical invest igat ion wil l
be required to determine founding condit ions.
Potent ia l l ocat ion of Tsumas Paleochannel needs to be conf irm ed.
6.2.4. Hydrogeology
Hydrogeological invest igat ion is requir ed for bot h the plant and ash dump. Factors such as
depth to water leve l , water qua l i ty , permeabi l i ty o f pr imary and secondary aqu i fer and
groundwater gradients have to be ident i f ied.
Only once these factors have been determined and detai ls regarding the contaminat ion
t hreat be det erm ined can recomm endations regarding l iner s be made.
6.2.5. Land Capability
Det ai led invest igat ion of soi ls wi l l det erm ine soi l st atus and potent ia l land capabil i t y.
6.2.6. Hydrology
Drainage channels and potent ia l f lood l i nes need to be det ermi ned.

7/29/2019 Annexure 14a - Geo Report
http://slidepdf.com/reader/full/annexure-14a-geo-report 63/74
Ninham Shand Consult ing Servi ces Proposed NamPower Coal-f ire d Power St at ion
00085/ 000/ 000/ 08-198 Page 63
Figure 6-1: Farm Boundaries Sit e B & C

7/29/2019 Annexure 14a - Geo Report
http://slidepdf.com/reader/full/annexure-14a-geo-report 64/74
Ninham Shand Consult ing Services Proposed NamPower Coal-f ired Power St ati on
00085/ 000/ 000/ 08-198 Page 64
7. CONCLUSION
A site select ion process was fol lowed in order to ident i fy the most suitable site for the new
coal-f i r ed power stat ion. Four (4) candidate sit es wer e ident i f ied based on avai lable area
and economical, environment al and social considerat ions.
The outcomes of the site select ion were that Site C is the preferred opt ion based on, but
not l im i t ed to , t he fo l low ing:
Site C has proved to be the top-ranking site for the proposed coal-f i red power stat ion
area. This document considered t he geological, hydrogeological and hydrological
aspects;
St abi l i t y r isks associated w it h Sit e C are l ow i n comparison to t he other si t es;
Site C al lows for potent ia l future expansion of the coal-f i red power stat ion;
In term s of t he hydrogeology sit e C is the m ost favourable.
The results of th is invest igat ion determined the most suitable site upon which a more
detai l ed invest igat ion wi l l be conducted. The detai l ed sit e invest i gat ion wi l l involve
conceptual designs and specialised environmental studies.
7.1. Environmental boundaries Sites B and C
I t is recomm ended that det ai led invest igat ions be undertaken on t he select ed sit e. These
investigations should be:
Det ai led hydr ogeological invest igat ion
Pedological invest igat ion
Details site survey
Geot echnical invest i gat i on
Hydrology (site C)

7/29/2019 Annexure 14a - Geo Report
http://slidepdf.com/reader/full/annexure-14a-geo-report 65/74
Ninham Shand Consult ing Services Proposed NamPower Coal-f ired Power St ati on
00085/ 000/ 000/ 08-198 Page 65
8. REFERENCES
Brow n, B. (1994): Dune St abi l isat ion: The w ay forw ard. Geological Survey of Nami bia. Ward, J.D. (1987): Modern analogues for aeol ian and f luvial deposits in the Cenezoic
succession of the Central Namib Desert: Field excursion organised by the South West
African Branch and Sediment ology division of t he Geological Society of South Afr ica, 28-
31 May 1987. Geological Survey of Nam ibi a.
Ward, J.D. (1989): Aspects of the geomorphology of Sandwich Harbour, Walvis Lagoon
and related coast: Field excursion Sandwich Harbour and Walvis Lagoon 16-18 June
1989.Geological Survey of Namibia.
Falke, M. (2008): Kuiseb Basin Water Resources Management Project- Development of a
wat er r esources plan for t he Kuiseb Basin and development of a pl anning procedure for
use by ot her b asins- Hydrogeology.
Christel i s, G. & St ruckm eier, W. (2001): Groundwater i n Nami bia- an explanat ion t o the
Hydrogeological Map.
Visual Resources Management Afri ca cc. ( 2008): proposed Nampow er Walv is Bay Powe r
St at ion, Namib ia. Photographic Survey.
Wearne, K. & Underhi l l , L. G. (2005): Walvis Bay Namibia: A key wet land for w aders
and other coastal birds in Southern Africa. Wader Study Group Bull. 107: 24–30.
Uushona, D. (2008): Biodiversity Report for the Municipal i ty of Walvis Bay. Report No.Draf t 1 .
Domi nguezl losa, R. & Kooit j ie, S. The Topnaar and environment al resources in t he low
valley and del t a of r iver Kuiseb- Namibia. Bast os Foundat ion.
Skov, H., Lauridsen, F. S., Hansen, I. S., Uushona, D. (2007): Strategic Environmental
Assessment (SEA) for the coastal areas of the Erongo and Kunene Regions. DHI – Water,
Environment, Health.

7/29/2019 Annexure 14a - Geo Report
http://slidepdf.com/reader/full/annexure-14a-geo-report 66/74
Ninham Shand Consult ing Services Proposed NamPower Coal-f ired Power St ati on
00085/ 000/ 000/ 08-198 Page 66
9. APPENDICES

7/29/2019 Annexure 14a - Geo Report
http://slidepdf.com/reader/full/annexure-14a-geo-report 67/74
Ninham Shand Consult ing Services Proposed NamPower Coal-f ired Power St ati on
00085/ 000/ 000/ 08-198 Page 67
Appendix A: Geological maps (2314 and 2214)

7/29/2019 Annexure 14a - Geo Report
http://slidepdf.com/reader/full/annexure-14a-geo-report 68/74
Ninham Shand Consult ing Services Proposed NamPower Coal-f ired Power St ati on
00085/ 000/ 000/ 08-198 Page 68
Appendix B: Matrix

7/29/2019 Annexure 14a - Geo Report
http://slidepdf.com/reader/full/annexure-14a-geo-report 69/74
Ninham Shand Consult ing Services Proposed NamPower Coal-f ired Power St ati on
00085/ 000/ 000/ 08-198 Page 69
NAMPOWER WALVIS BAY
T5. FOUNDING
CONDITIONSSite A Site B Site C Site D EIGEN
VECTORPRIORITY
Site A 1 1 1/5 1 0.67 12.5%
Site B 1 1 1/5 1 0.67 12.5%
Site C 5 5 1 5 3.34 62.5%
Site D 1 1 1/5 1 0.67 12.5%
5.35
Emax 4.00
CI 0.00
CR 0.00%
8.00 8.00 1.60 8.00
NAMPOWER WALVIS BAY
E3. SURFACE
WATER QUALITYSite A Site B Site C Site D
EIGEN
VECTORPRIORITY
Site A 1 1 1/3 1 0.76 15.9%
Site B 1 1 1/5 1 0.67 14.0%
Site C 3 5 1 3 2.59 54.2%
Site D 1 1 1/3 1 0.76 15.9%
4.78
Emax 4.04
CI 0.01
CR 1.46%
6.00 8.00 1.87 6.00

7/29/2019 Annexure 14a - Geo Report
http://slidepdf.com/reader/full/annexure-14a-geo-report 70/74
Ninham Shand Consult ing Services Proposed NamPower Coal-f ired Power St ati on
00085/ 000/ 000/ 08-198 Page 70
NAMPOWER WALVIS BAY
E4. SUB-SURFACE
WATER QUALITY
&
HYDROGEOLOGY
Site A Site B Site C Site D EIGENVECTOR
PRIORITY
Site A 1 1 1/5 1 0.67 12.5%
Site B 1 1 1/5 1 0.67 12.5%
Site C 5 5 1 5 3.34 62.5%
Site D 1 1 1/5 1 0.67 12.5%
5.35
Emax 4.00
CI 0.00
CR 0.00%
8.00 8.00 1.60 8.00

7/29/2019 Annexure 14a - Geo Report
http://slidepdf.com/reader/full/annexure-14a-geo-report 71/74
Ninham Shand Consult ing Services Proposed NamPower Coal-f ired Power St ati on
00085/ 000/ 000/ 08-198 Page 71
Scale of Relat ive Prefer ence for Pair wise Comparisons
Rating Defi nit ion Explanat ion
1 Equal pref erence Two opt i ons rat e equal ly
3 Weak preferenceExperience and j udgment sl ight l y favour
an opt ion
5Essent ial or st rong
preferenceExperience and j udgment str ongly f avour
an opt ion
7Demonstrated
preferenceSt rongly f avoured and dom inance
demonst r a ted in pract ice
9Absolute
preferenceEvidence favouring an opt i on is of t he
highest possible order
2, 4, 6, 8In termedia te
values
Reciprocals of t heabove
If K has one of t heabove rat ings
assigned to i t whencompared wi th L ,
t hen L has t hereciprocal valuewhen compared
w i t h K

7/29/2019 Annexure 14a - Geo Report
http://slidepdf.com/reader/full/annexure-14a-geo-report 72/74
Suite 11 Hillcrest Office Park 2 Old Main Road Hillcrest 3610 PO Box 819 Gillitts 3603 South Africa
Telephone: +27 (0)31 765 2088 Facsimile: +27 (0)31 765 8201 Web: www.gcs-sa.biz
GCS (Pty) Ltd.
Johannesburg Durban Kimberley
Directors: AC Johnstone (Managing) SE Scawthon (Financial) AH Barbour (Non-exec)* V Cresswell (Non-exec)*
Reg No: 2004/000765/07 Est. 1987
Date: 18 July 2008
GCS (Pty) LTD conducted a numerical assessment of the four proposed sites of the Walvis
Bay coal-f i red power stat ion project. Factors taken into considerat ion during the relat ive
preference rat ing of pair wise comparisons include founding condit ions, surface water and
groundwater. Scores were assigned for each criterion based on a qualitative assessment,
and were then added together t o provide a to ta l f o r each si te . A maximum score for a
part icular aspect means t hat t he sit e is ideal as far as that aspect is concerned.
Site A
Founding Condit ions
Site A is si tuated in a port area and has an extent of only 17ha which is unfortunately too
small and rules out the possibi l i ty of expansion. The ash dump associated with the coal-
f i red power p lant cannot be l ocated i n c lose prox imi t y t o t he port . Possib le dune migra t ion
may also affect act iv i t ies at the proposed Site A. With regard to the exist ing site
condit ions, the area comprises unconsol idated deposits and the depth to bedrock is
unknown at th i s st age. This may have negat ive im plicat ions for earthw orks and constr uct i on
act iv i t ies.
Sur face Water
Due to the close proximity of the Lagoon and resident ia l areas, surface water
contami nat ion m ay occur. Cont aminat ion of t he harbour is also possible.
Groundwater
Site A hosts a primary aquifer and due to the shal low water table, there is a greater r isk of
contami nat ion via t he ash disposal f aci l i t ies and t he coal st ockpi le areas.
Our Refer ence: 0085/ 000/ 000/ 08-198
Your Refer ence

7/29/2019 Annexure 14a - Geo Report
http://slidepdf.com/reader/full/annexure-14a-geo-report 73/74
Suite 11 Hillcrest Office Park 2 Old Main Road Hillcrest 3610 PO Box 819 Gillitts 3603 South Africa
Telephone: +27 (0)31 765 2088 Facsimile: +27 (0)31 765 8201 Web: www.gcs-sa.biz
GCS (Pty) Ltd.
Johannesburg Durban Kimberley
Directors: AC Johnstone (Managing) SE Scawthon (Financial) AH Barbour (Non-exec)* V Cresswell (Non-exec)*
Reg No: 2004/000765/07 Est. 1987
Site B
Founding Condit ions
Site B which is located north of Walvis Bay on the coast (Farm 39), comprises
unconsol idated deposits with an unknown depth to bedrock. Construct ion act iv i t ies may be
negat ively affected by this. The ash dump associated with the power stat ion cannot be
accommodated in close proximity to the sea. Site B may be affected by possible dune
migrat ion.
Surface water
Impact on m arine ecology is a def in i t e r isk due to t he propinquit y of t he sea to Sit e B. Pans
occur in t he northern v ic in i ty o f the s i te and t he possib le im pacts requ i re fur t her evaluat ion
should def in it e groundwater users be ident i f i ed in the area.
Groundwater
Site B hosts a primary aquifer and due to the shal low water table, there is a greater r isk of
contami nat ion via t he ash disposal f aci l i t ies and t he coal st ockpi le areas.
Site C
Founding Condit ions
Site C is located east of Dune 7 in the proposed heavy industr ia l zone adjacent to the
airport . The placement of cool ing towers and smoke stacks close to an airport are a r isk
which needs to be further evaluated. This si te comprises shal low bedrock with the depth to
bedrock approximating 5m and is geotechnical stable. This si te may accommodate the ash
dump near t he plant and is relat ively distant f rom t he moving dune areas.
Surface water
No init ia l hydrological problems are envisaged however, the occurrences of pans to the
south-w est of si te c need t o be considered in t erms of i t s orig in and possible i mpact s.

7/29/2019 Annexure 14a - Geo Report
http://slidepdf.com/reader/full/annexure-14a-geo-report 74/74
Suite 11 Hillcrest Office Park 2 Old Main Road Hillcrest 3610 PO Box 819 Gillitts 3603 South Africa
Telephone: +27 (0)31 765 2088 Facsimile: +27 (0)31 765 8201 Web: www.gcs-sa.biz
Groundwater
This site hosts a secondary aquifer and the r isks of contaminat ion are reduced due to the
deeper groundwater levels.
Site D
Founding Condit ions
Site D which is east of Narraville and West of Dune 7, hosts unconsolidated deposits and the
depth to bedrock is unknown. This may have negat ively impact construct ion act iv i t ies. Site
D cannot accommodate the ash dump in close proximity to the plant. Possible dune
migrat ion may affect Sit e D.
Surface water
Surface water contaminat ion is a possibi l i ty and the f looding potent ia l in the Kuiseb Delta
may be increased. The vi l lage of Narravi l le is in or j ust above the 1:100 year f lood l ine.
Groundwater
Site A hosts a primary aquifer and due to the shal low water table, there is a greater r isk of
contami nat ion via t he ash disposal f aci l i t ies and t he coal st ockpi le areas.