Annexes to the Study on Jobs and Job Creation in the ... to the Study on Jobs... · Annexes to the...
24
Annexes to the Study on Jobs and Job Creation in the European Cycling Sector Authors: Thomas Blondiau & Bruno Van Zeebroeck (Transport & Mobility Leuven) for the European Cyclists’ Federation Annex I: Country-level overview of employment for bicycle retail sector 1 Annex II: Country-level overview of employment for bicycle manufacturing 8 Annex III: Country-level overview of employment for bicycle infrastructure investment 10 Annex IV: Country-level overview of employment for bicycle tourism 12 Annex V: Country-level overview of employment for bicycle services 14 Annex VI: Country-level overview of employment in bicycle retail in growth scenario 16 Annex VII: Country-level overview of employment in bicycle industry in growth scenario 18 Annex VIII: Country-level overview of employment in bicycle infrastructure construction in growth scenario 20 Annex IX: Country-level overview of employment in bicycle tourism in growth scenario 22
-
Upload
truongminh -
Category
Documents
-
view
216 -
download
1
Transcript of Annexes to the Study on Jobs and Job Creation in the ... to the Study on Jobs... · Annexes to the...
Annexes to the Study on Jobs and Job
Creation in the European Cycling Sector
Authors: Thomas Blondiau & Bruno Van Zeebroeck (Transport & Mobility Leuven) for the European Cyclists’ Federation
Annex I: Country-level overview of employment for bicycle retail sector 1
Annex II: Country-level overview of employment for bicycle manufacturing 8
Annex III: Country-level overview of employment for bicycle infrastructure investment 10
Annex IV: Country-level overview of employment for bicycle tourism 12
Annex V: Country-level overview of employment for bicycle services 14
Annex VI: Country-level overview of employment in bicycle retail in growth scenario 16
Annex VII: Country-level overview of employment in bicycle industry in growth scenario 18
Annex VIII: Country-level overview of employment in bicycle infrastructure construction in growth scenario 20
Annex IX: Country-level overview of employment in bicycle tourism in growth scenario 22
1
Annex I: Country-level overview of employment for bicycle retail
sector
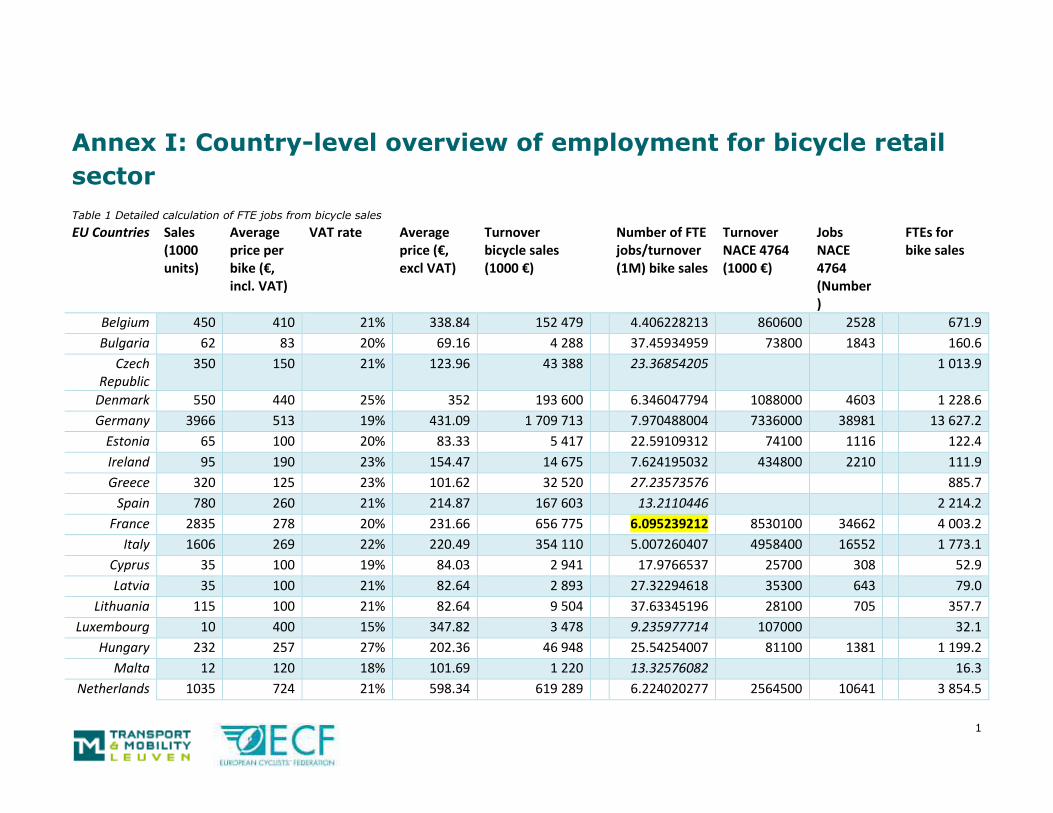
Table 1 Detailed calculation of FTE jobs from bicycle sales
EU Countries Sales (1000 units)
Average price per bike (€, incl. VAT)
VAT rate Average price (€, excl VAT)
Turnover bicycle sales (1000 €)
Number of FTE jobs/turnover (1M) bike sales
Turnover NACE 4764 (1000 €)
Jobs NACE 4764 (Number)
FTEs for bike sales
Belgium 450 410 21% 338.84 152 479 4.406228213 860600 2528 671.9
Bulgaria 62 83 20% 69.16 4 288 37.45934959 73800 1843 160.6
Czech Republic
350 150 21% 123.96 43 388 23.36854205 1 013.9
Denmark 550 440 25% 352 193 600 6.346047794 1088000 4603 1 228.6
Germany 3966 513 19% 431.09 1 709 713 7.970488004 7336000 38981 13 627.2
Estonia 65 100 20% 83.33 5 417 22.59109312 74100 1116 122.4
Ireland 95 190 23% 154.47 14 675 7.624195032 434800 2210 111.9
Greece 320 125 23% 101.62 32 520 27.23573576 885.7
Spain 780 260 21% 214.87 167 603 13.2110446 2 214.2
France 2835 278 20% 231.66 656 775 6.095239212 8530100 34662 4 003.2
Italy 1606 269 22% 220.49 354 110 5.007260407 4958400 16552 1 773.1
Cyprus 35 100 19% 84.03 2 941 17.9766537 25700 308 52.9
Latvia 35 100 21% 82.64 2 893 27.32294618 35300 643 79.0
Lithuania 115 100 21% 82.64 9 504 37.63345196 28100 705 357.7
Luxembourg 10 400 15% 347.82 3 478 9.235977714 107000 32.1
Hungary 232 257 27% 202.36 46 948 25.54254007 81100 1381 1 199.2
Malta 12 120 18% 101.69 1 220 13.32576082 16.3
Netherlands 1035 724 21% 598.34 619 289 6.224020277 2564500 10641 3 854.5

2
Austria 410 440 20% 366.66 150 333 7.512256571 1468600 7355 1 129.3
Poland 992 210 23% 170.73 169 366 12.96063118 627400 5421 2 195.1
Portugal 350 150 23% 121.95 42 683 11.51948693 608100 4670 491.7
Romania 380 120 24% 96.77 36 774 31.30705394 48200 1006 1 151.3
Slovenia 250 110 22% 90.16 22 541 32.80497373 169300 739.5
Slovakia 300 110 20% 91.66 27 500 18.19742489 139800 1696 500.4
Finland 330 310 24% 250 82 500 5.236525229 1046400 3653 432.0
Sweden 555 385 25% 308 170 940 5.714632665 2470500 9412 976.9
United Kingdom
3600 305 20% 254.16 915 000 12.76042068 6484700 55165 11 675.8
EU27 19 720 344.85 285.93 5 638 480 7.870534729 38 984 200 204 551 50 696.3
Source: Colibi market report
Colibi market report
VAT rates applied in EU
Calculation Calculation: Calculation Eurostat, SBS Eurostat, SBS
Calculation
Year data 2012 2012 2014 Sales*average price (excl. VAT)
2011 2011 Turnover*jobs/turnover
Adjustment factor:
We calibrated the FTE/turnover ratio using the 6.1 FTEs/1M turnover from the French ATOUT study.
o This means an adjustment of all NACE 4764 FTE/turnover ratios: *1.5.
3
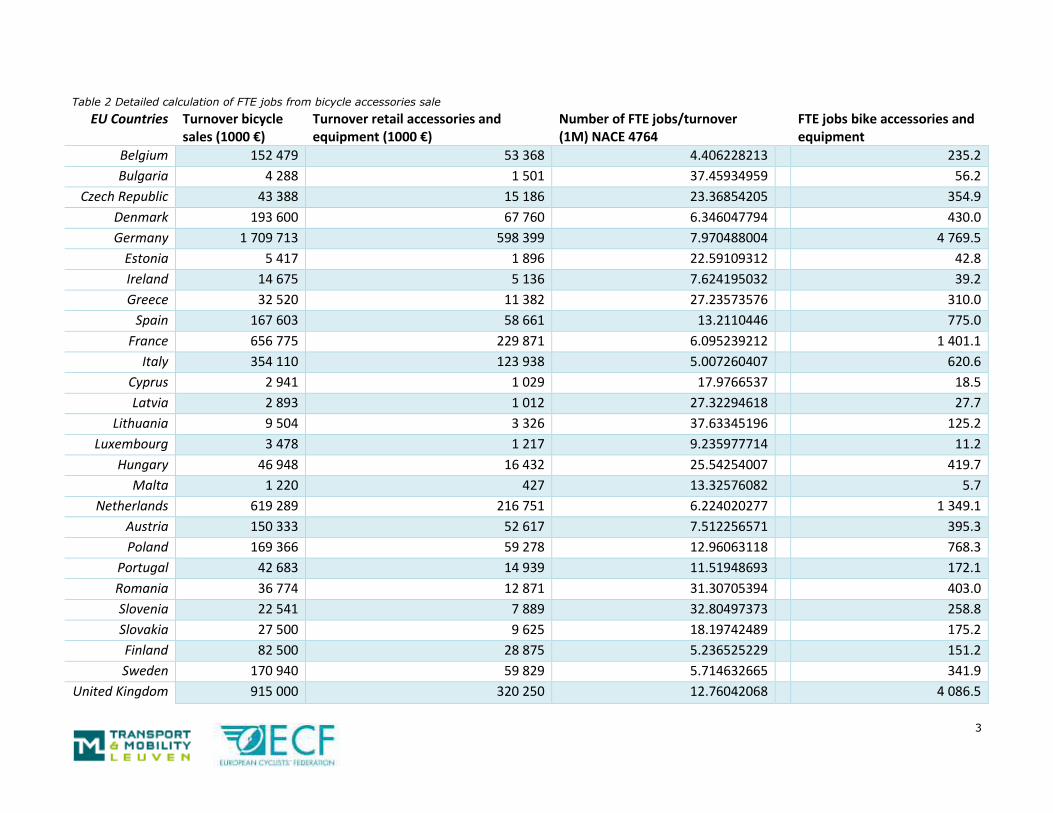
Table 2 Detailed calculation of FTE jobs from bicycle accessories sale
EU Countries Turnover bicycle sales (1000 €)
Turnover retail accessories and equipment (1000 €)
Number of FTE jobs/turnover (1M) NACE 4764
FTE jobs bike accessories and equipment
Belgium 152 479 53 368 4.406228213 235.2
Bulgaria 4 288 1 501 37.45934959 56.2
Czech Republic 43 388 15 186 23.36854205 354.9
Denmark 193 600 67 760 6.346047794 430.0
Germany 1 709 713 598 399 7.970488004 4 769.5
Estonia 5 417 1 896 22.59109312 42.8
Ireland 14 675 5 136 7.624195032 39.2
Greece 32 520 11 382 27.23573576 310.0
Spain 167 603 58 661 13.2110446 775.0
France 656 775 229 871 6.095239212 1 401.1
Italy 354 110 123 938 5.007260407 620.6
Cyprus 2 941 1 029 17.9766537 18.5
Latvia 2 893 1 012 27.32294618 27.7
Lithuania 9 504 3 326 37.63345196 125.2
Luxembourg 3 478 1 217 9.235977714 11.2
Hungary 46 948 16 432 25.54254007 419.7
Malta 1 220 427 13.32576082 5.7
Netherlands 619 289 216 751 6.224020277 1 349.1
Austria 150 333 52 617 7.512256571 395.3
Poland 169 366 59 278 12.96063118 768.3
Portugal 42 683 14 939 11.51948693 172.1
Romania 36 774 12 871 31.30705394 403.0
Slovenia 22 541 7 889 32.80497373 258.8
Slovakia 27 500 9 625 18.19742489 175.2
Finland 82 500 28 875 5.236525229 151.2
Sweden 170 940 59 829 5.714632665 341.9
United Kingdom 915 000 320 250 12.76042068 4 086.5

4
EU27 5 638 480 1 973 468 7.870534729 17 743.7
Source Colibi & own calculation
35%*turnover bicycle sales Eurostat SBS and own caluclations Calculation
Table 3 Detailed calculation of FTE jobs from bike repair
EU Countries
Turnover bicycle sales (1000 €)
Turnover bicycle repair (1000 €)
Number of FTE jobs/turnover (1M) NACE 9529
Turnover NACE 9529 (1000 €)
Jobs NACE 9529 (Number)
FTE jobs related to bicycle repair
Belgium 152 479 22 872 5.234375 76800 268 119.7
Bulgaria 4 288 643 121.4516129 3100 251 78.1
Czech Republic
43 388 6 508 16.09077654 104.7
Denmark 193 600 29 040 7.469635628 172900 861 216.9
Germany 1 709 713 256 457 13.38102137 552200 4926 3 431.7
Estonia 5 417 813 80.74553571 65.6
Ireland 14 675 2 201 23.17476732 51.0
Greece 32 520 4 878 52.77786974 257.5
Spain 167 603 25 140 21.51082682 540.8
France 656 775 98 516 7.330477175 676900 3308 722.2
Italy 354 110 53 116 8.87257117 442600 2618 471.3
Cyprus 2 941 441 8.333333333 900 5 3.7
Latvia 2 893 434 57.42857143 3500 134 24.9
Lithuania 9 504 1 426 104.0625 1600 111 148.4
Luxembourg 3 478 522 8.648624515 5600 4.5
Hungary 46 948 7 042 36.10778443 33400 804 254.3
Malta 1 220 183 16.02366925 2.9
Netherlands 619 289 92 893 6.352005314 590.1
Austria 150 333 22 550 11.62891986 57400 445 262.2
5
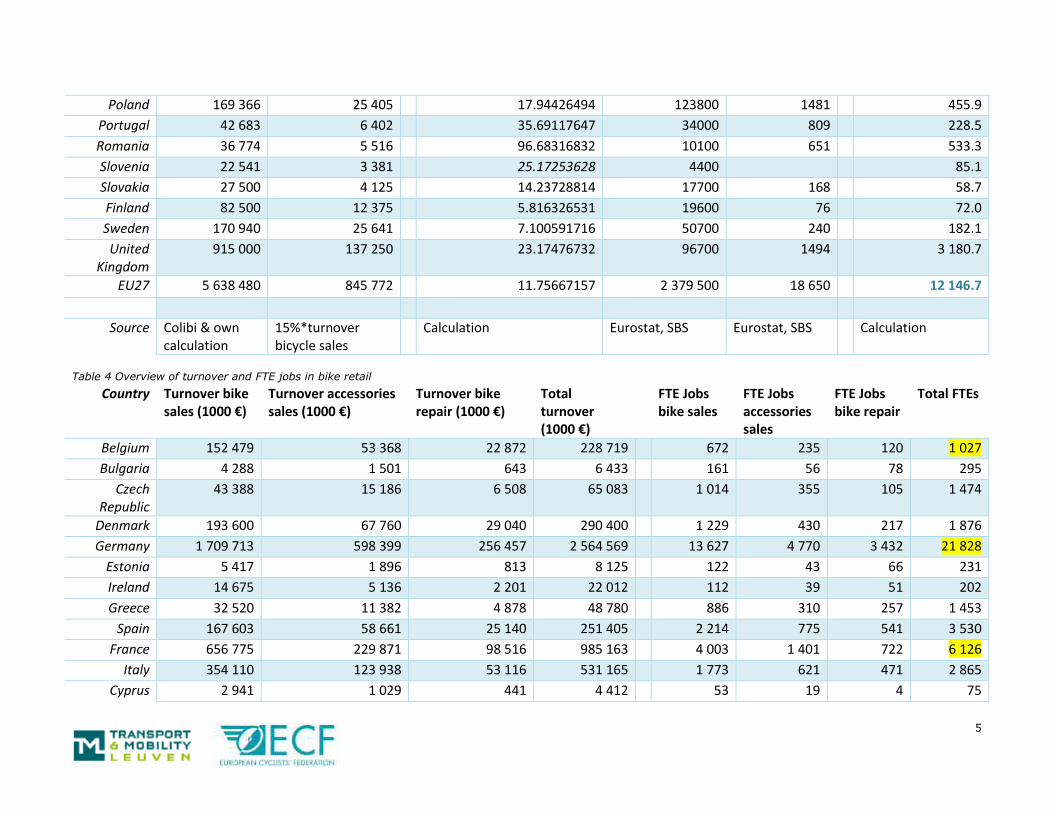
Poland 169 366 25 405 17.94426494 123800 1481 455.9
Portugal 42 683 6 402 35.69117647 34000 809 228.5
Romania 36 774 5 516 96.68316832 10100 651 533.3
Slovenia 22 541 3 381 25.17253628 4400 85.1
Slovakia 27 500 4 125 14.23728814 17700 168 58.7
Finland 82 500 12 375 5.816326531 19600 76 72.0
Sweden 170 940 25 641 7.100591716 50700 240 182.1
United Kingdom
915 000 137 250 23.17476732 96700 1494 3 180.7
EU27 5 638 480 845 772 11.75667157 2 379 500 18 650 12 146.7
Source Colibi & own calculation
15%*turnover bicycle sales
Calculation Eurostat, SBS Eurostat, SBS Calculation
Table 4 Overview of turnover and FTE jobs in bike retail
Country Turnover bike sales (1000 €)
Turnover accessories sales (1000 €)
Turnover bike repair (1000 €)
Total turnover (1000 €)
FTE Jobs bike sales
FTE Jobs accessories sales
FTE Jobs bike repair
Total FTEs
Belgium 152 479 53 368 22 872 228 719 672 235 120 1 027
Bulgaria 4 288 1 501 643 6 433 161 56 78 295
Czech Republic
43 388 15 186 6 508 65 083 1 014 355 105 1 474
Denmark 193 600 67 760 29 040 290 400 1 229 430 217 1 876
Germany 1 709 713 598 399 256 457 2 564 569 13 627 4 770 3 432 21 828
Estonia 5 417 1 896 813 8 125 122 43 66 231
Ireland 14 675 5 136 2 201 22 012 112 39 51 202
Greece 32 520 11 382 4 878 48 780 886 310 257 1 453
Spain 167 603 58 661 25 140 251 405 2 214 775 541 3 530
France 656 775 229 871 98 516 985 163 4 003 1 401 722 6 126
Italy 354 110 123 938 53 116 531 165 1 773 621 471 2 865
Cyprus 2 941 1 029 441 4 412 53 19 4 75
6
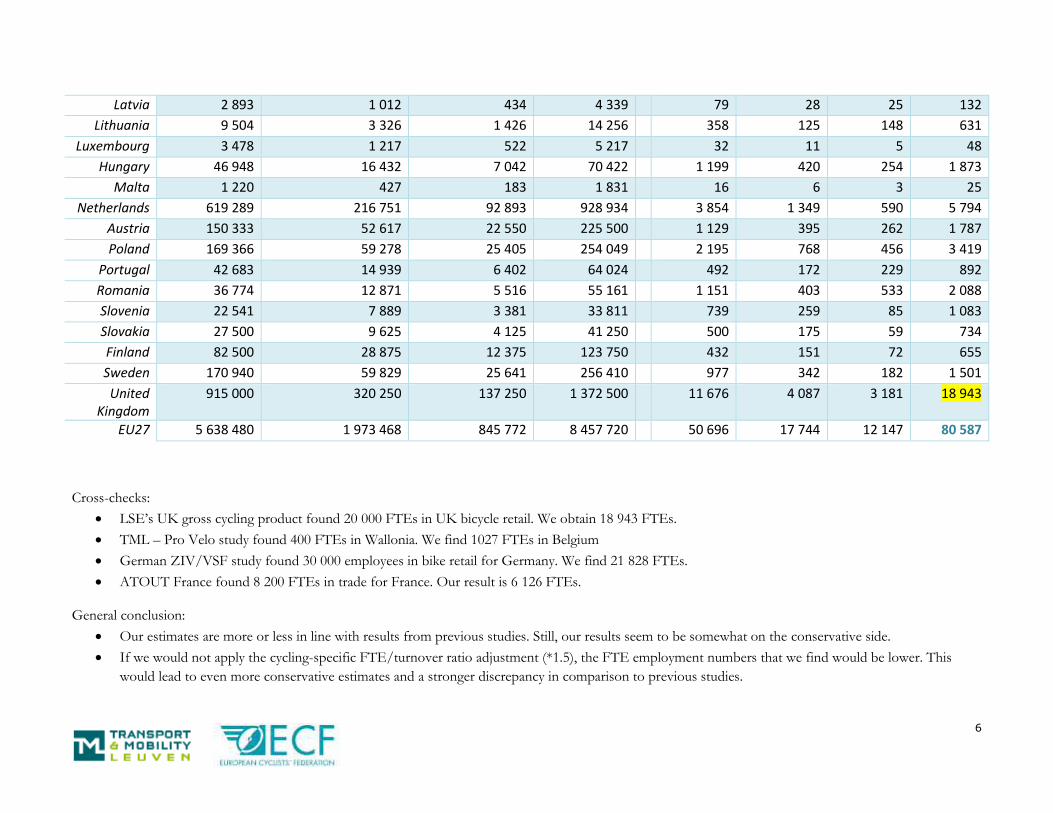
Latvia 2 893 1 012 434 4 339 79 28 25 132
Lithuania 9 504 3 326 1 426 14 256 358 125 148 631
Luxembourg 3 478 1 217 522 5 217 32 11 5 48
Hungary 46 948 16 432 7 042 70 422 1 199 420 254 1 873
Malta 1 220 427 183 1 831 16 6 3 25
Netherlands 619 289 216 751 92 893 928 934 3 854 1 349 590 5 794
Austria 150 333 52 617 22 550 225 500 1 129 395 262 1 787
Poland 169 366 59 278 25 405 254 049 2 195 768 456 3 419
Portugal 42 683 14 939 6 402 64 024 492 172 229 892
Romania 36 774 12 871 5 516 55 161 1 151 403 533 2 088
Slovenia 22 541 7 889 3 381 33 811 739 259 85 1 083
Slovakia 27 500 9 625 4 125 41 250 500 175 59 734
Finland 82 500 28 875 12 375 123 750 432 151 72 655
Sweden 170 940 59 829 25 641 256 410 977 342 182 1 501
United Kingdom
915 000 320 250 137 250 1 372 500 11 676 4 087 3 181 18 943
EU27 5 638 480 1 973 468 845 772 8 457 720 50 696 17 744 12 147 80 587
Cross-checks:
LSE’s UK gross cycling product found 20 000 FTEs in UK bicycle retail. We obtain 18 943 FTEs.
TML – Pro Velo study found 400 FTEs in Wallonia. We find 1027 FTEs in Belgium
German ZIV/VSF study found 30 000 employees in bike retail for Germany. We find 21 828 FTEs.
ATOUT France found 8 200 FTEs in trade for France. Our result is 6 126 FTEs.
General conclusion:
Our estimates are more or less in line with results from previous studies. Still, our results seem to be somewhat on the conservative side.
If we would not apply the cycling-specific FTE/turnover ratio adjustment (*1.5), the FTE employment numbers that we find would be lower. This
would lead to even more conservative estimates and a stronger discrepancy in comparison to previous studies.

7
8
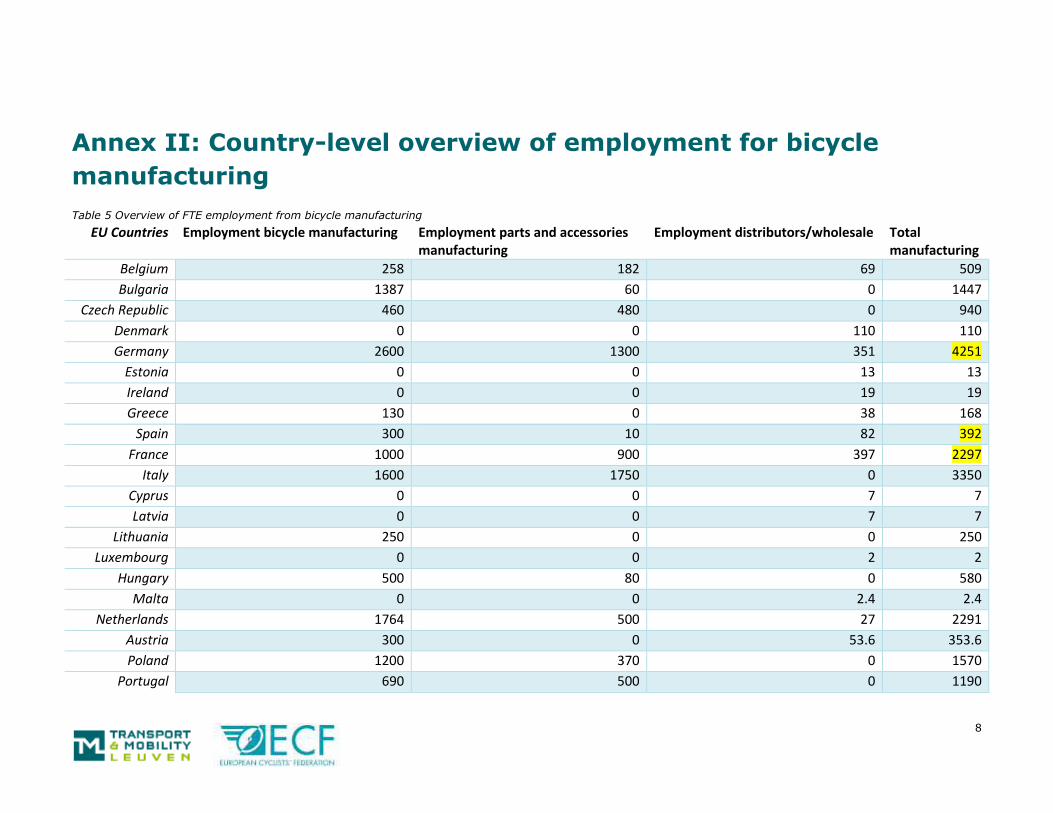
Annex II: Country-level overview of employment for bicycle
manufacturing
Table 5 Overview of FTE employment from bicycle manufacturing
EU Countries Employment bicycle manufacturing Employment parts and accessories manufacturing
Employment distributors/wholesale Total manufacturing
Belgium 258 182 69 509
Bulgaria 1387 60 0 1447
Czech Republic 460 480 0 940
Denmark 0 0 110 110
Germany 2600 1300 351 4251
Estonia 0 0 13 13
Ireland 0 0 19 19
Greece 130 0 38 168
Spain 300 10 82 392
France 1000 900 397 2297
Italy 1600 1750 0 3350
Cyprus 0 0 7 7
Latvia 0 0 7 7
Lithuania 250 0 0 250
Luxembourg 0 0 2 2
Hungary 500 80 0 580
Malta 0 0 2.4 2.4
Netherlands 1764 500 27 2291
Austria 300 0 53.6 353.6
Poland 1200 370 0 1570
Portugal 690 500 0 1190
9
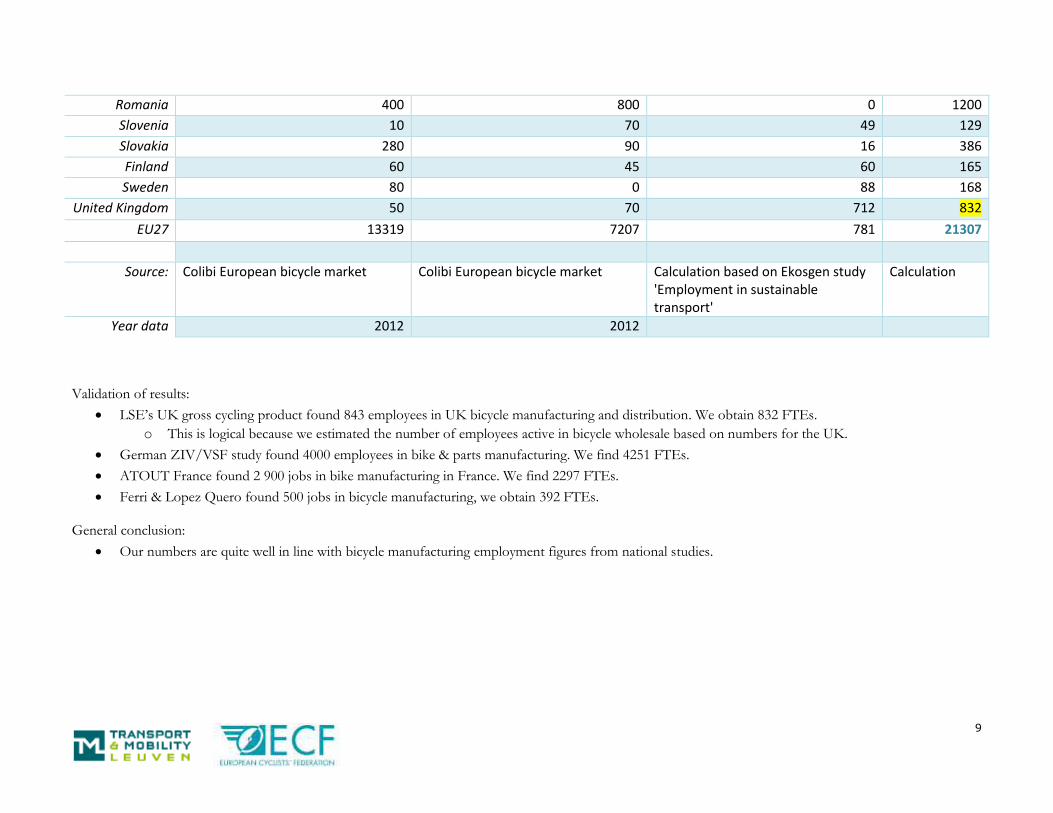
Romania 400 800 0 1200
Slovenia 10 70 49 129
Slovakia 280 90 16 386
Finland 60 45 60 165
Sweden 80 0 88 168
United Kingdom 50 70 712 832
EU27 13319 7207 781 21307
Source: Colibi European bicycle market Colibi European bicycle market Calculation based on Ekosgen study 'Employment in sustainable transport'
Calculation
Year data 2012 2012
Validation of results:
LSE’s UK gross cycling product found 843 employees in UK bicycle manufacturing and distribution. We obtain 832 FTEs.
o This is logical because we estimated the number of employees active in bicycle wholesale based on numbers for the UK.
German ZIV/VSF study found 4000 employees in bike & parts manufacturing. We find 4251 FTEs.
ATOUT France found 2 900 jobs in bike manufacturing in France. We find 2297 FTEs.
Ferri & Lopez Quero found 500 jobs in bicycle manufacturing, we obtain 392 FTEs.
General conclusion:
Our numbers are quite well in line with bicycle manufacturing employment figures from national studies.
10
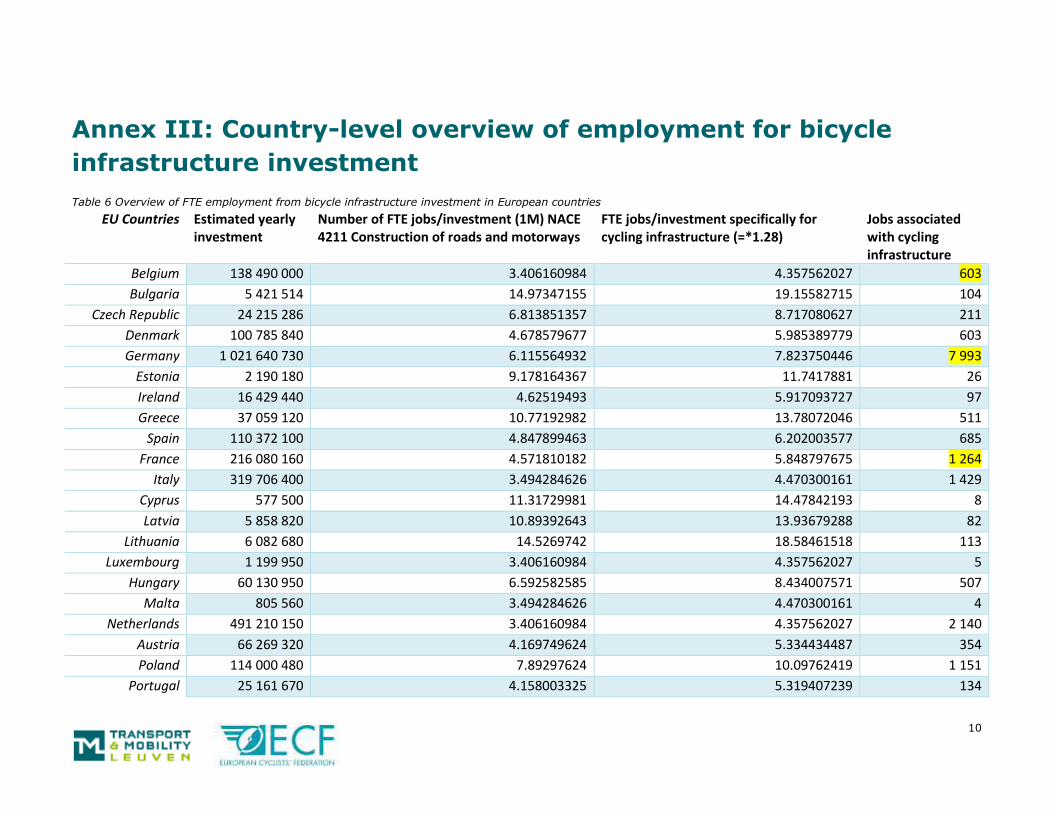
Annex III: Country-level overview of employment for bicycle
infrastructure investment
Table 6 Overview of FTE employment from bicycle infrastructure investment in European countries
EU Countries Estimated yearly investment
Number of FTE jobs/investment (1M) NACE 4211 Construction of roads and motorways
FTE jobs/investment specifically for cycling infrastructure (=*1.28)
Jobs associated with cycling infrastructure
Belgium 138 490 000 3.406160984 4.357562027 603
Bulgaria 5 421 514 14.97347155 19.15582715 104
Czech Republic 24 215 286 6.813851357 8.717080627 211
Denmark 100 785 840 4.678579677 5.985389779 603
Germany 1 021 640 730 6.115564932 7.823750446 7 993
Estonia 2 190 180 9.178164367 11.7417881 26
Ireland 16 429 440 4.62519493 5.917093727 97
Greece 37 059 120 10.77192982 13.78072046 511
Spain 110 372 100 4.847899463 6.202003577 685
France 216 080 160 4.571810182 5.848797675 1 264
Italy 319 706 400 3.494284626 4.470300161 1 429
Cyprus 577 500 11.31729981 14.47842193 8
Latvia 5 858 820 10.89392643 13.93679288 82
Lithuania 6 082 680 14.5269742 18.58461518 113
Luxembourg 1 199 950 3.406160984 4.357562027 5
Hungary 60 130 950 6.592582585 8.434007571 507
Malta 805 560 3.494284626 4.470300161 4
Netherlands 491 210 150 3.406160984 4.357562027 2 140
Austria 66 269 320 4.169749624 5.334434487 354
Poland 114 000 480 7.89297624 10.09762419 1 151
Portugal 25 161 670 4.158003325 5.319407239 134
11
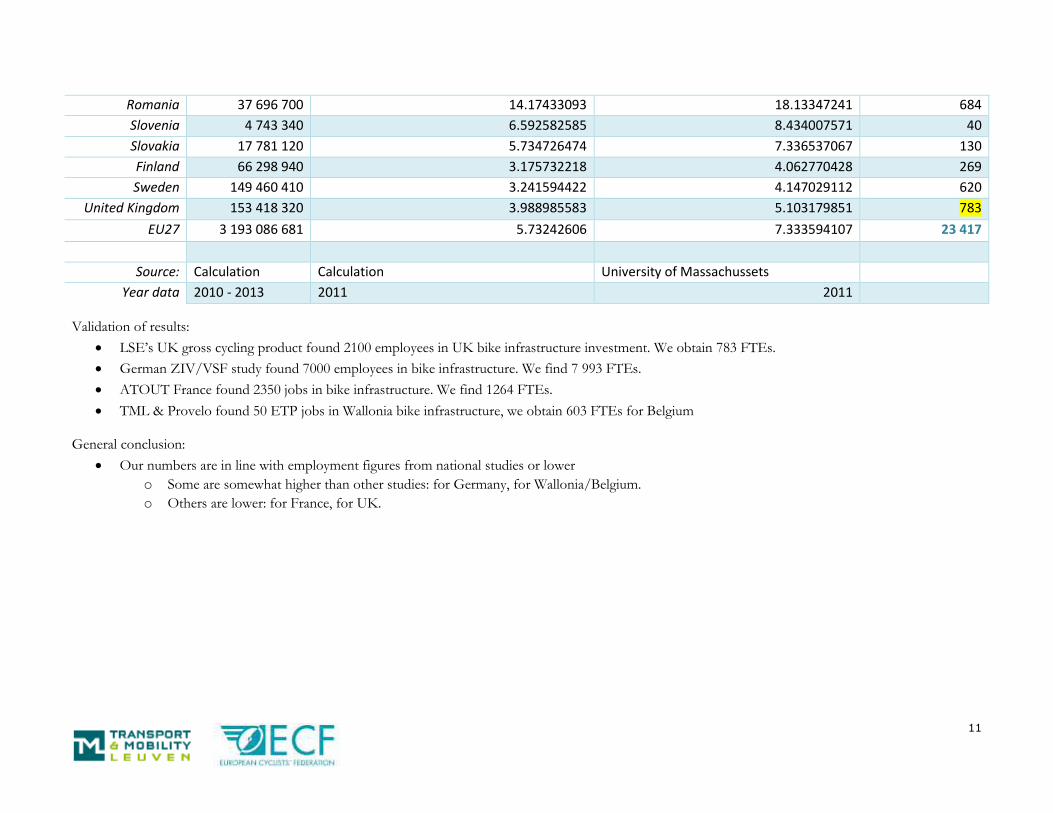
Romania 37 696 700 14.17433093 18.13347241 684
Slovenia 4 743 340 6.592582585 8.434007571 40
Slovakia 17 781 120 5.734726474 7.336537067 130
Finland 66 298 940 3.175732218 4.062770428 269
Sweden 149 460 410 3.241594422 4.147029112 620
United Kingdom 153 418 320 3.988985583 5.103179851 783
EU27 3 193 086 681 5.73242606 7.333594107 23 417
Source: Calculation Calculation University of Massachussets
Year data 2010 - 2013 2011 2011
Validation of results:
LSE’s UK gross cycling product found 2100 employees in UK bike infrastructure investment. We obtain 783 FTEs.
German ZIV/VSF study found 7000 employees in bike infrastructure. We find 7 993 FTEs.
ATOUT France found 2350 jobs in bike infrastructure. We find 1264 FTEs.
TML & Provelo found 50 ETP jobs in Wallonia bike infrastructure, we obtain 603 FTEs for Belgium
General conclusion:
Our numbers are in line with employment figures from national studies or lower
o Some are somewhat higher than other studies: for Germany, for Wallonia/Belgium.
o Others are lower: for France, for UK.
12
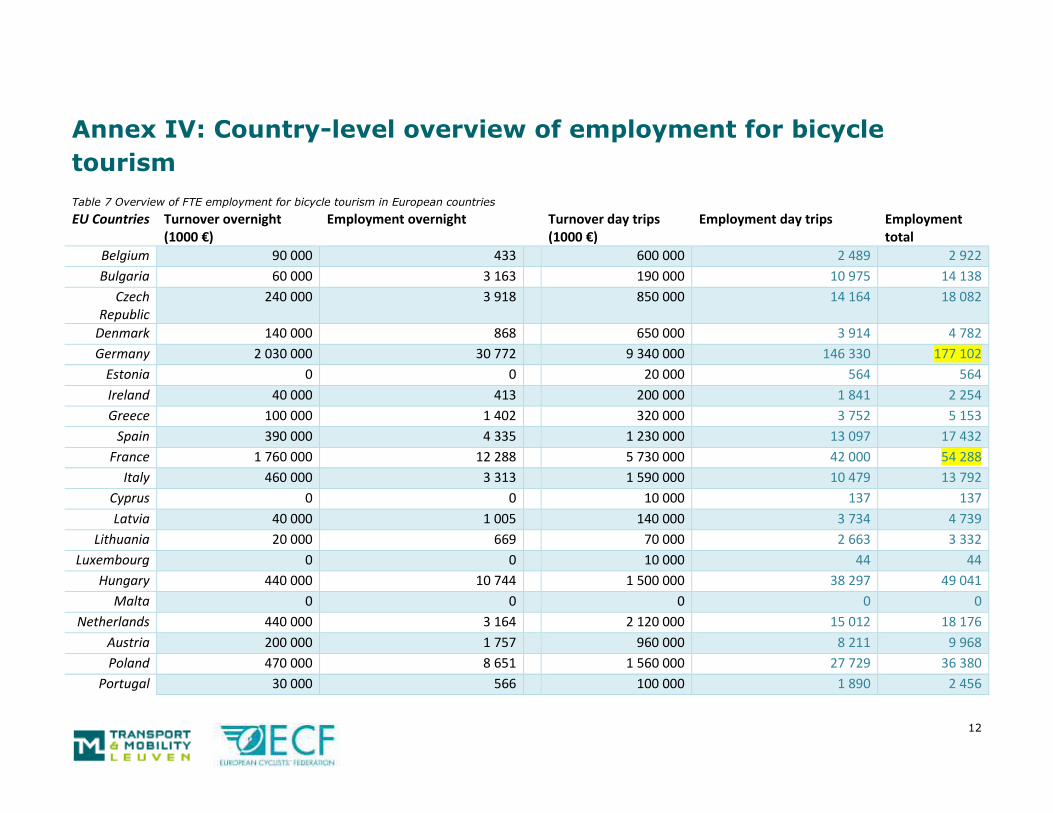
Annex IV: Country-level overview of employment for bicycle
tourism
Table 7 Overview of FTE employment for bicycle tourism in European countries
EU Countries Turnover overnight (1000 €)
Employment overnight Turnover day trips (1000 €)
Employment day trips Employment total
Belgium 90 000 433 600 000 2 489 2 922
Bulgaria 60 000 3 163 190 000 10 975 14 138
Czech Republic
240 000 3 918 850 000 14 164 18 082
Denmark 140 000 868 650 000 3 914 4 782
Germany 2 030 000 30 772 9 340 000 146 330 177 102
Estonia 0 0 20 000 564 564
Ireland 40 000 413 200 000 1 841 2 254
Greece 100 000 1 402 320 000 3 752 5 153
Spain 390 000 4 335 1 230 000 13 097 17 432
France 1 760 000 12 288 5 730 000 42 000 54 288
Italy 460 000 3 313 1 590 000 10 479 13 792
Cyprus 0 0 10 000 137 137
Latvia 40 000 1 005 140 000 3 734 4 739
Lithuania 20 000 669 70 000 2 663 3 332
Luxembourg 0 0 10 000 44 44
Hungary 440 000 10 744 1 500 000 38 297 49 041
Malta 0 0 0 0 0
Netherlands 440 000 3 164 2 120 000 15 012 18 176
Austria 200 000 1 757 960 000 8 211 9 968
Poland 470 000 8 651 1 560 000 27 729 36 380
Portugal 30 000 566 100 000 1 890 2 456
13
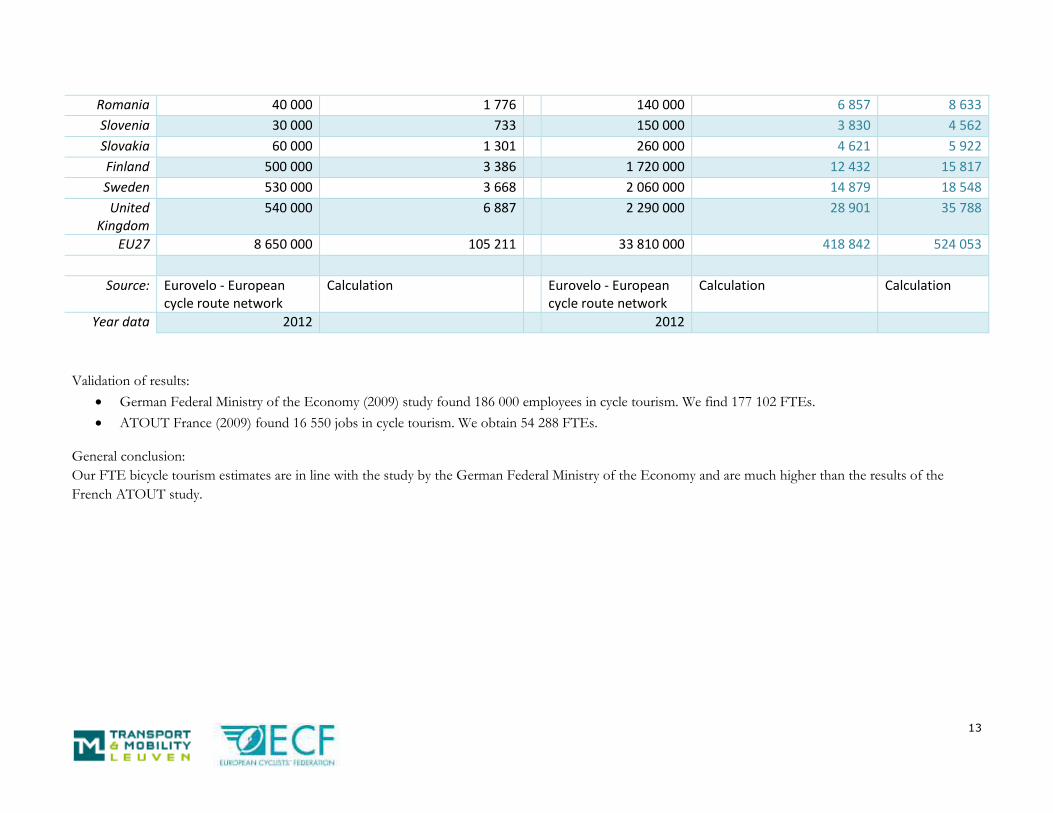
Romania 40 000 1 776 140 000 6 857 8 633
Slovenia 30 000 733 150 000 3 830 4 562
Slovakia 60 000 1 301 260 000 4 621 5 922
Finland 500 000 3 386 1 720 000 12 432 15 817
Sweden 530 000 3 668 2 060 000 14 879 18 548
United Kingdom
540 000 6 887 2 290 000 28 901 35 788
EU27 8 650 000 105 211 33 810 000 418 842 524 053
Source: Eurovelo - European cycle route network
Calculation Eurovelo - European cycle route network
Calculation Calculation
Year data 2012 2012
Validation of results:
German Federal Ministry of the Economy (2009) study found 186 000 employees in cycle tourism. We find 177 102 FTEs.
ATOUT France (2009) found 16 550 jobs in cycle tourism. We obtain 54 288 FTEs.
General conclusion:
Our FTE bicycle tourism estimates are in line with the study by the German Federal Ministry of the Economy and are much higher than the results of the
French ATOUT study.
14
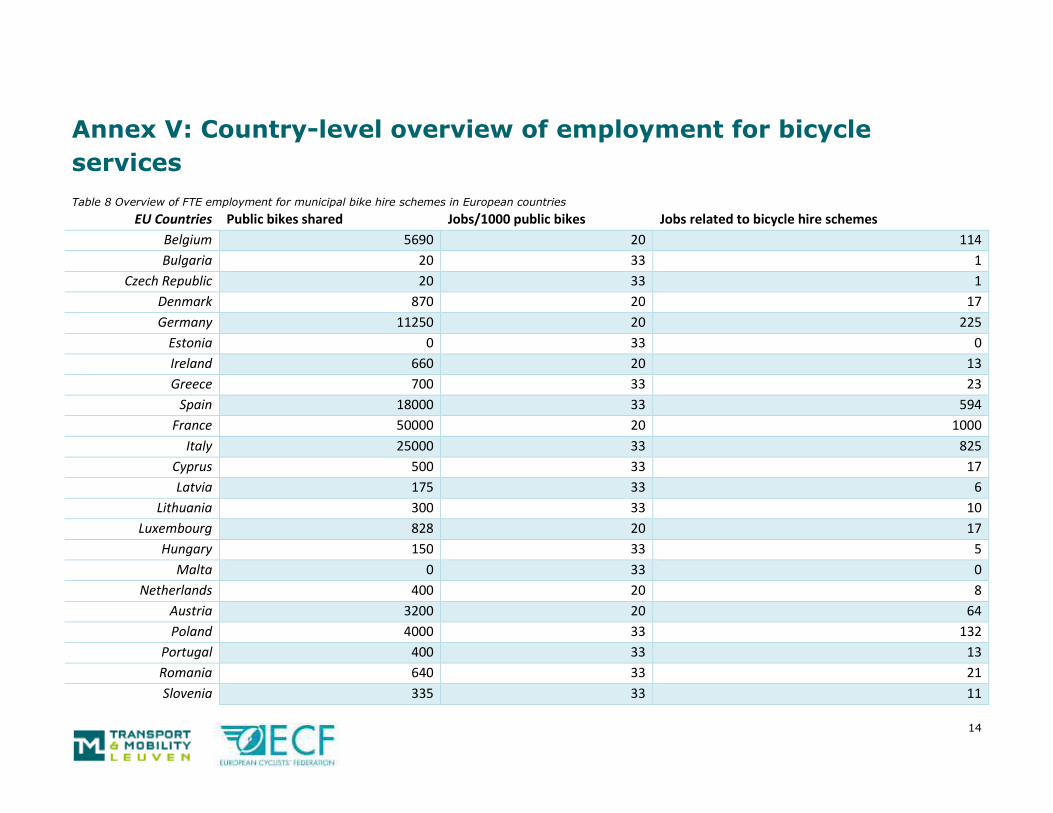
Annex V: Country-level overview of employment for bicycle
services
Table 8 Overview of FTE employment for municipal bike hire schemes in European countries
EU Countries Public bikes shared Jobs/1000 public bikes Jobs related to bicycle hire schemes
Belgium 5690 20 114
Bulgaria 20 33 1
Czech Republic 20 33 1
Denmark 870 20 17
Germany 11250 20 225
Estonia 0 33 0
Ireland 660 20 13
Greece 700 33 23
Spain 18000 33 594
France 50000 20 1000
Italy 25000 33 825
Cyprus 500 33 17
Latvia 175 33 6
Lithuania 300 33 10
Luxembourg 828 20 17
Hungary 150 33 5
Malta 0 33 0
Netherlands 400 20 8
Austria 3200 20 64
Poland 4000 33 132
Portugal 400 33 13
Romania 640 33 21
Slovenia 335 33 11
15
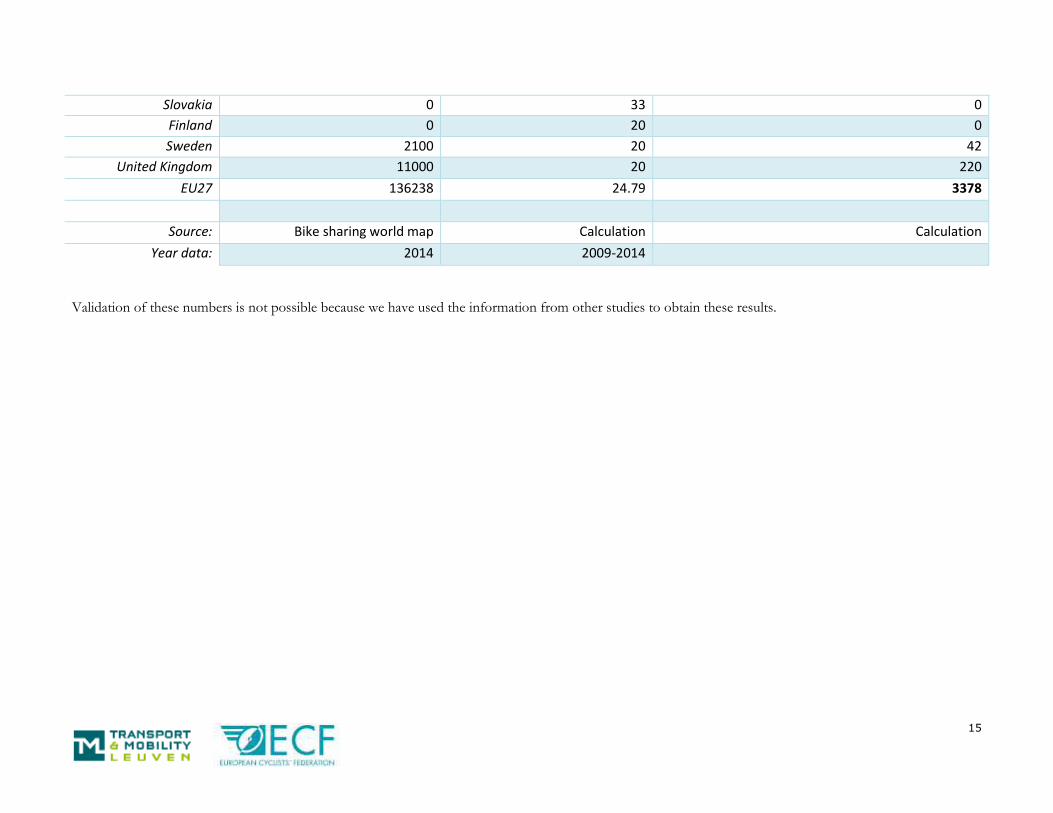
Slovakia 0 33 0
Finland 0 20 0
Sweden 2100 20 42
United Kingdom 11000 20 220
EU27 136238 24.79 3378
Source: Bike sharing world map Calculation Calculation
Year data: 2014 2009-2014
Validation of these numbers is not possible because we have used the information from other studies to obtain these results.

16
Annex VI: Country-level overview of employment in bicycle retail
in growth scenario
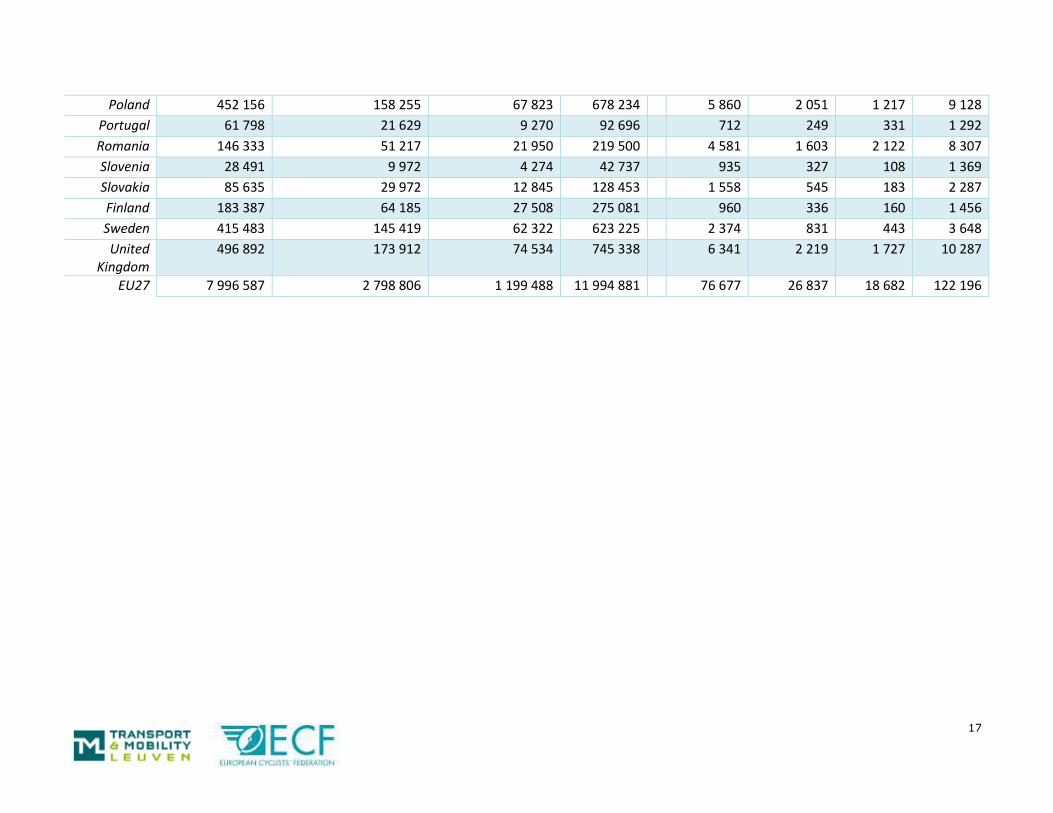
Table 9 Overview of FTE employment in bicycle retail sector, in bicycle growth scenario (doubling of modal share)
Country Turnover bike sales (1000 €)
Turnover accessories sales (1000 €)
Turnover bike repair (1000 €)
Total turnover (1000 €)
Jobs bike sales
Jobs accessories sales
Jobs bike repair
Total jobs
Belgium 333 569 116 749 50 035 500 354 1 470 514 262 2 246
Bulgaria 24 137 8 448 3 620 36 205 904 316 440 1 660
Czech Republic
123 315 43 160 18 497 184 973 2 882 1 009 298 4 188
Denmark 289 943 101 480 43 491 434 915 1 840 644 325 2 809
Germany 2 200 000 770 000 330 000 3 300 000 17 535 6 137 4 416 28 088
Estonia 13 407 4 692 2 011 20 111 303 106 162 571
Ireland 48 464 16 962 7 270 72 696 369 129 168 667
Greece 88 498 30 974 13 275 132 747 2 410 844 701 3 955
Spain 303 460 106 211 45 519 455 190 4 009 1 403 979 6 391
France 639 665 223 883 95 950 959 498 3 899 1 365 703 5 967
Italy 783 052 274 068 117 458 1 174 578 3 921 1 372 1 042 6 335
Cyprus 3 991 1 397 599 5 987 72 25 5 102
Latvia 26 479 9 268 3 972 39 719 723 253 228 1 205
Lithuania 24 389 8 536 3 658 36 584 918 321 381 1 620
Luxembourg 4 557 1 595 684 6 836 42 15 6 63
Hungary 219 426 76 799 32 914 329 139 5 605 1 962 1 188 8 755
Malta 2 067 724 310 3 101 28 10 5 42
Netherlands 831 687 291 090 124 753 1 247 531 5 176 1 812 792 7 781
Austria 166 306 58 207 24 946 249 459 1 249 437 290 1 977
17
Poland 452 156 158 255 67 823 678 234 5 860 2 051 1 217 9 128
Portugal 61 798 21 629 9 270 92 696 712 249 331 1 292
Romania 146 333 51 217 21 950 219 500 4 581 1 603 2 122 8 307
Slovenia 28 491 9 972 4 274 42 737 935 327 108 1 369
Slovakia 85 635 29 972 12 845 128 453 1 558 545 183 2 287
Finland 183 387 64 185 27 508 275 081 960 336 160 1 456
Sweden 415 483 145 419 62 322 623 225 2 374 831 443 3 648
United Kingdom
496 892 173 912 74 534 745 338 6 341 2 219 1 727 10 287
EU27 7 996 587 2 798 806 1 199 488 11 994 881 76 677 26 837 18 682 122 196
18
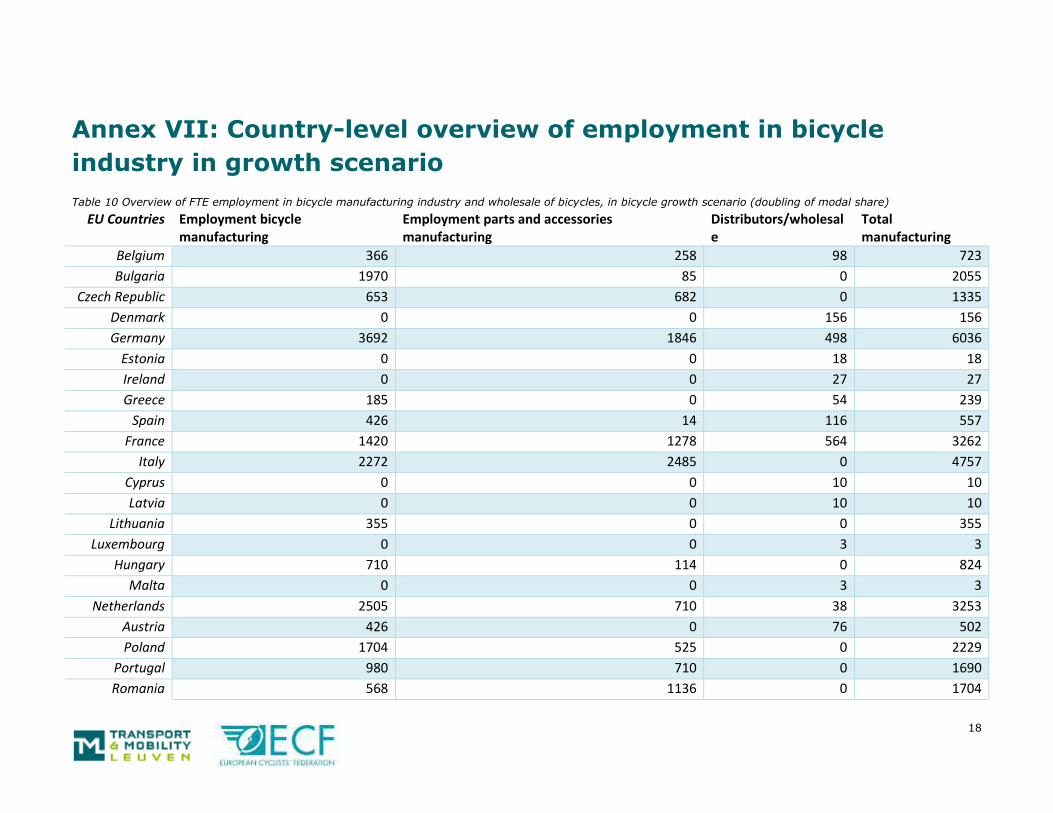
Annex VII: Country-level overview of employment in bicycle
industry in growth scenario
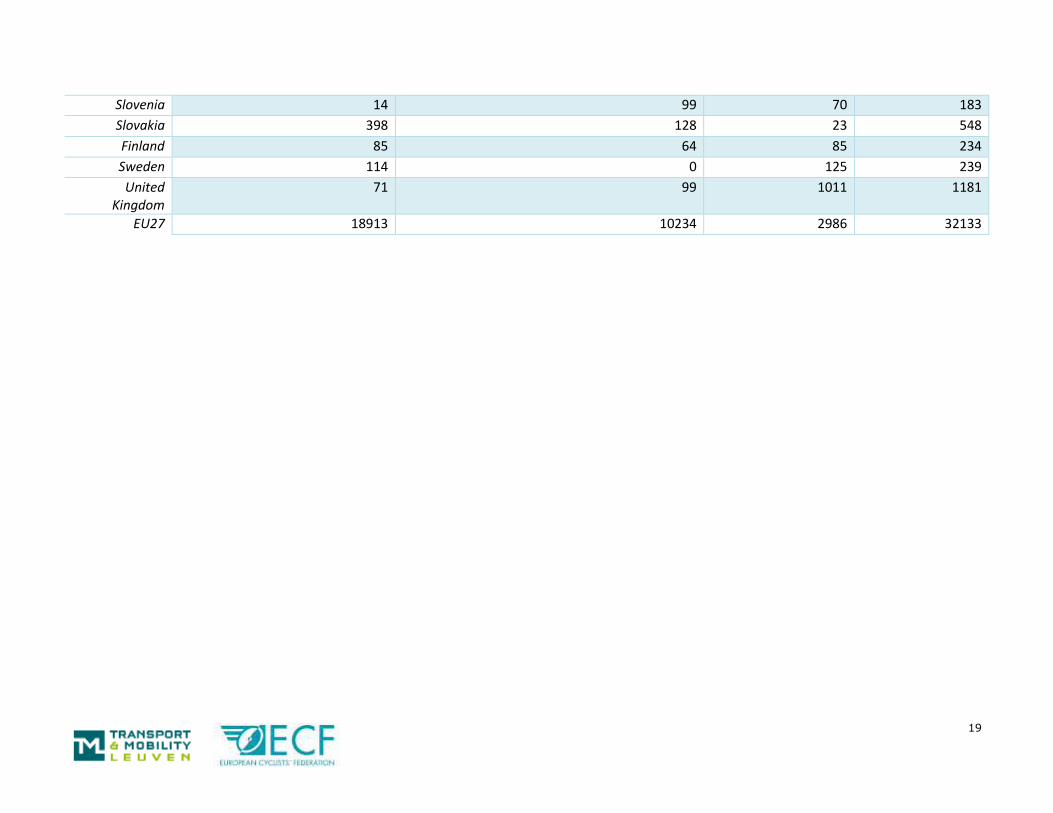
Table 10 Overview of FTE employment in bicycle manufacturing industry and wholesale of bicycles, in bicycle growth scenario (doubling of modal share)
EU Countries Employment bicycle manufacturing
Employment parts and accessories manufacturing
Distributors/wholesale
Total manufacturing
Belgium 366 258 98 723
Bulgaria 1970 85 0 2055
Czech Republic 653 682 0 1335
Denmark 0 0 156 156
Germany 3692 1846 498 6036
Estonia 0 0 18 18
Ireland 0 0 27 27
Greece 185 0 54 239
Spain 426 14 116 557
France 1420 1278 564 3262
Italy 2272 2485 0 4757
Cyprus 0 0 10 10
Latvia 0 0 10 10
Lithuania 355 0 0 355
Luxembourg 0 0 3 3
Hungary 710 114 0 824
Malta 0 0 3 3
Netherlands 2505 710 38 3253
Austria 426 0 76 502
Poland 1704 525 0 2229
Portugal 980 710 0 1690
Romania 568 1136 0 1704
19
Slovenia 14 99 70 183
Slovakia 398 128 23 548
Finland 85 64 85 234
Sweden 114 0 125 239
United Kingdom
71 99 1011 1181
EU27 18913 10234 2986 32133

20
Annex VIII: Country-level overview of employment in bicycle
infrastructure construction in growth scenario
Table 11 Overview of FTE employment from bicycle infrastructure investment in European countries, in bicycle growth scenario (doubling of modal share)
EU Countries Estimated yearly investment (1M €)
Number of FTE jobs/investment (1M) NACE 4211
FTE jobs/investment cycling specific (=*1.28)
Jobs associated with cycling infrastructure
Belgium 200.07 3.41 4.36 872
Bulgaria 18.04 14.97 19.16 346
Czech Republic
116.45 6.81 8.72 1 015
Denmark 129.09 4.68 5.99 773
Germany 1443.50 6.12 7.82 11 294
Estonia 10.63 9.18 11.74 125
Ireland 21.41 4.63 5.92 127
Greece 51.58 10.77 13.78 711
Spain 115.83 4.85 6.20 718
France 305.87 4.57 5.85 1 789
Italy 480.82 3.49 4.47 2 149
Cyprus 0.58 11.32 14.48 8
Latvia 24.95 10.89 13.94 348
Lithuania 23.92 14.53 18.58 445
Luxembourg 1.34 3.41 4.36 6
Hungary 228.44 6.59 8.43 1 927
Malta 0.72 3.49 4.47 3
Netherlands 448.77 3.41 4.36 1 956
Austria 104.36 4.17 5.33 557
Poland 536.85 7.89 10.10 5 421

21
Portugal 26.00 4.16 5.32 138
Romania 161.27 14.17 18.13 2 924
Slovenia 22.80 6.59 8.43 192
Slovakia 81.09 5.73 7.34 595
Finland 97.34 3.18 4.06 395
Sweden 203.08 3.24 4.15 842
United Kingdom
158.41 3.99 5.10 808
EU27 5013.22 5.73 7.33 36 765

22
Annex IX: Country-level overview of employment in bicycle
tourism in growth scenario
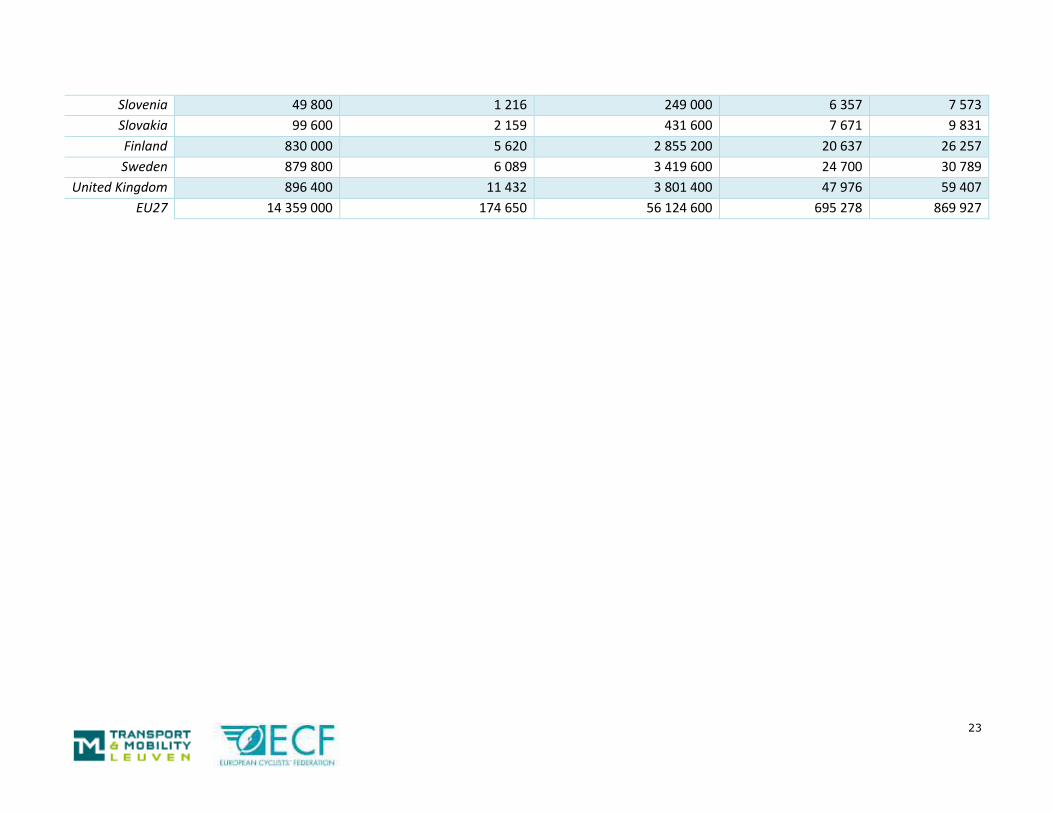
Table 12 Overview of FTE employment for bicycle tourism in European countries, in growth scenario (doubling of modal share)
EU Countries Turnover overnight trips FTE jobs overnight trips Turnover day trips FTE jobs day trips FTE jobs total
Belgium 149 400 719 996 000 4 131 4 851
Bulgaria 99 600 5 250 315 400 18 219 23 470
Czech Republic 398 400 6 503 1 411 000 23 513 30 016
Denmark 232 400 1 441 1 079 000 6 497 7 937
Germany 3 369 800 51 082 15 504 400 242 907 293 989
Estonia 0 0 33 200 937 937
Ireland 66 400 686 332 000 3 056 3 742
Greece 166 000 2 327 531 200 6 228 8 555
Spain 647 400 7 196 2 041 800 21 741 28 937
France 2 921 600 20 398 9 511 800 69 721 90 118
Italy 763 600 5 499 2 639 400 17 395 22 894
Cyprus 0 0 16 600 228 228
Latvia 66 400 1 668 232 400 6 198 7 866
Lithuania 33 200 1 110 116 200 4 421 5 531
Luxembourg 0 0 16 600 72 72
Hungary 730 400 17 836 2 490 000 63 573 81 409
Malta 0 0 0 0 0
Netherlands 730 400 5 253 3 519 200 24 919 30 172
Austria 332 000 2 916 1 593 600 13 631 16 547
Poland 780 200 14 361 2 589 600 46 030 60 391
Portugal 49 800 940 166 000 3 137 4 077
Romania 66 400 2 949 232 400 11 383 14 331
23
Slovenia 49 800 1 216 249 000 6 357 7 573
Slovakia 99 600 2 159 431 600 7 671 9 831
Finland 830 000 5 620 2 855 200 20 637 26 257
Sweden 879 800 6 089 3 419 600 24 700 30 789
United Kingdom 896 400 11 432 3 801 400 47 976 59 407
EU27 14 359 000 174 650 56 124 600 695 278 869 927